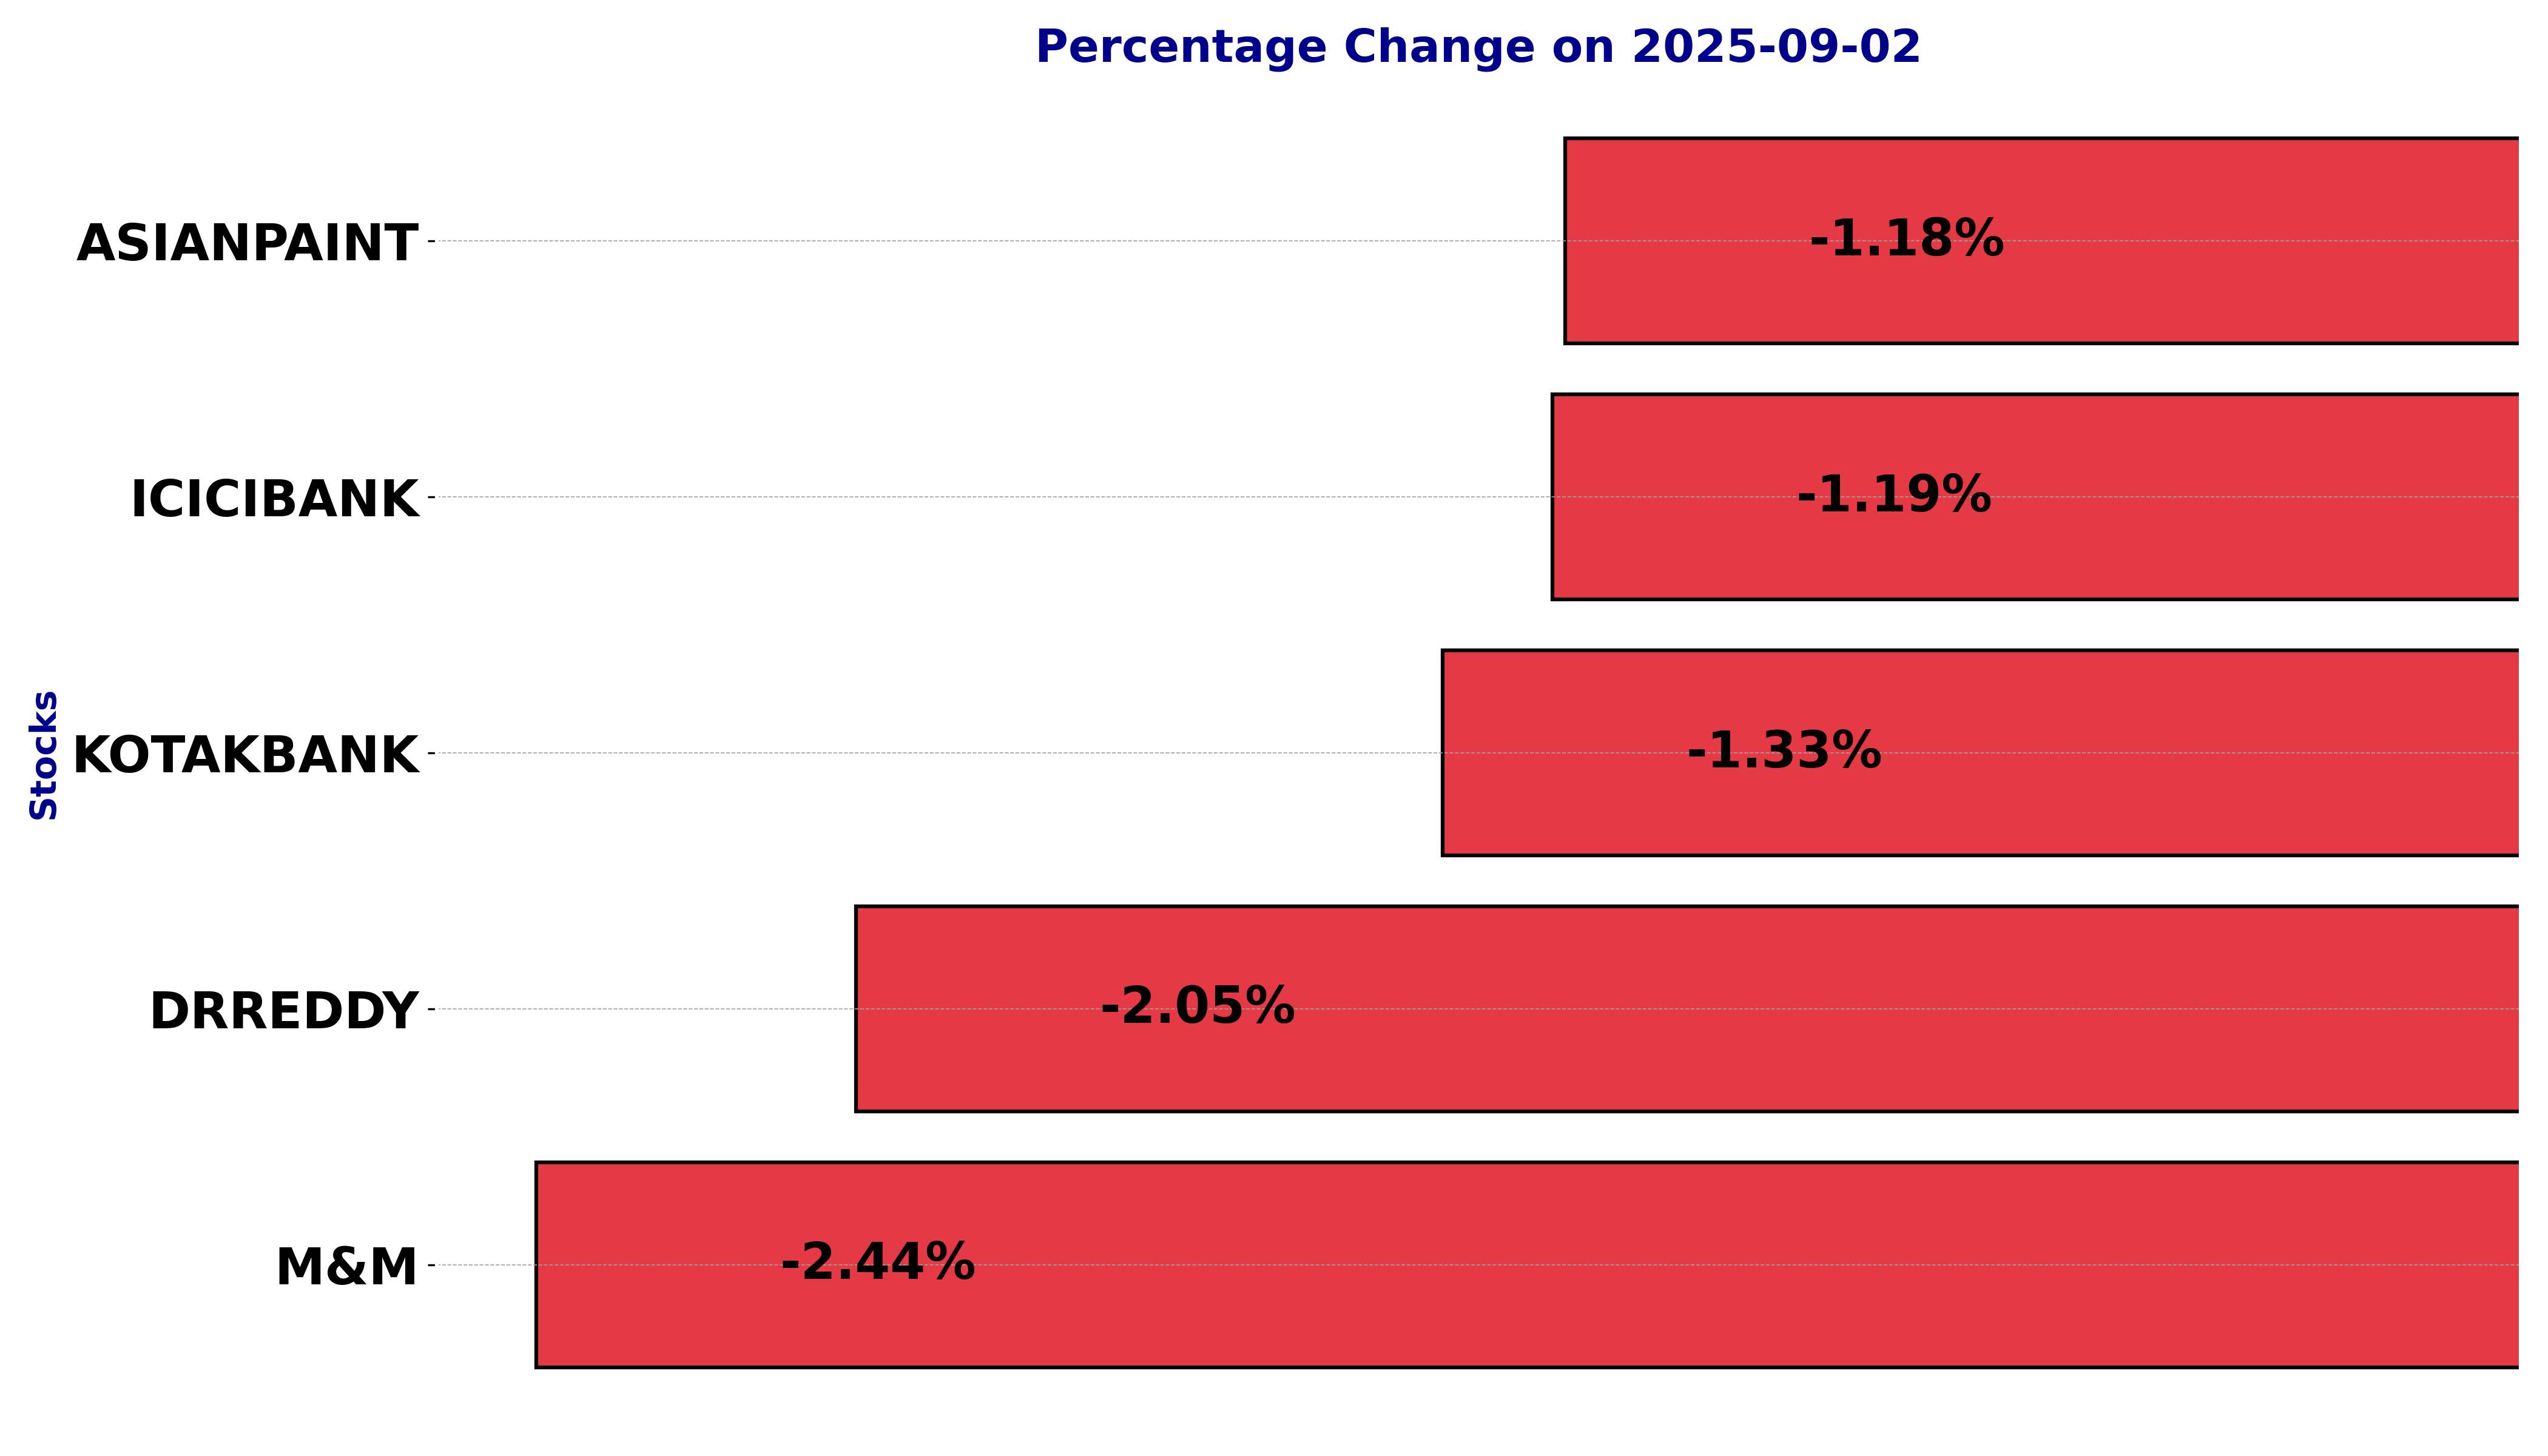
NSE Nifty 50: Top 5 stock losers of September 2, 2025
In this article, we will explore the technical indicators of some of the low-performing stocks on the Indian stock market, including ASIANPAINT, DRREDDY, ICICIBANK, KOTAKBANK, and M&M.
By looking at these stocks through the lens of key technical factors, we aim to better understand their price movements, trends, and potential future performance.
Analysis for Asian Paints - September 02, 2025
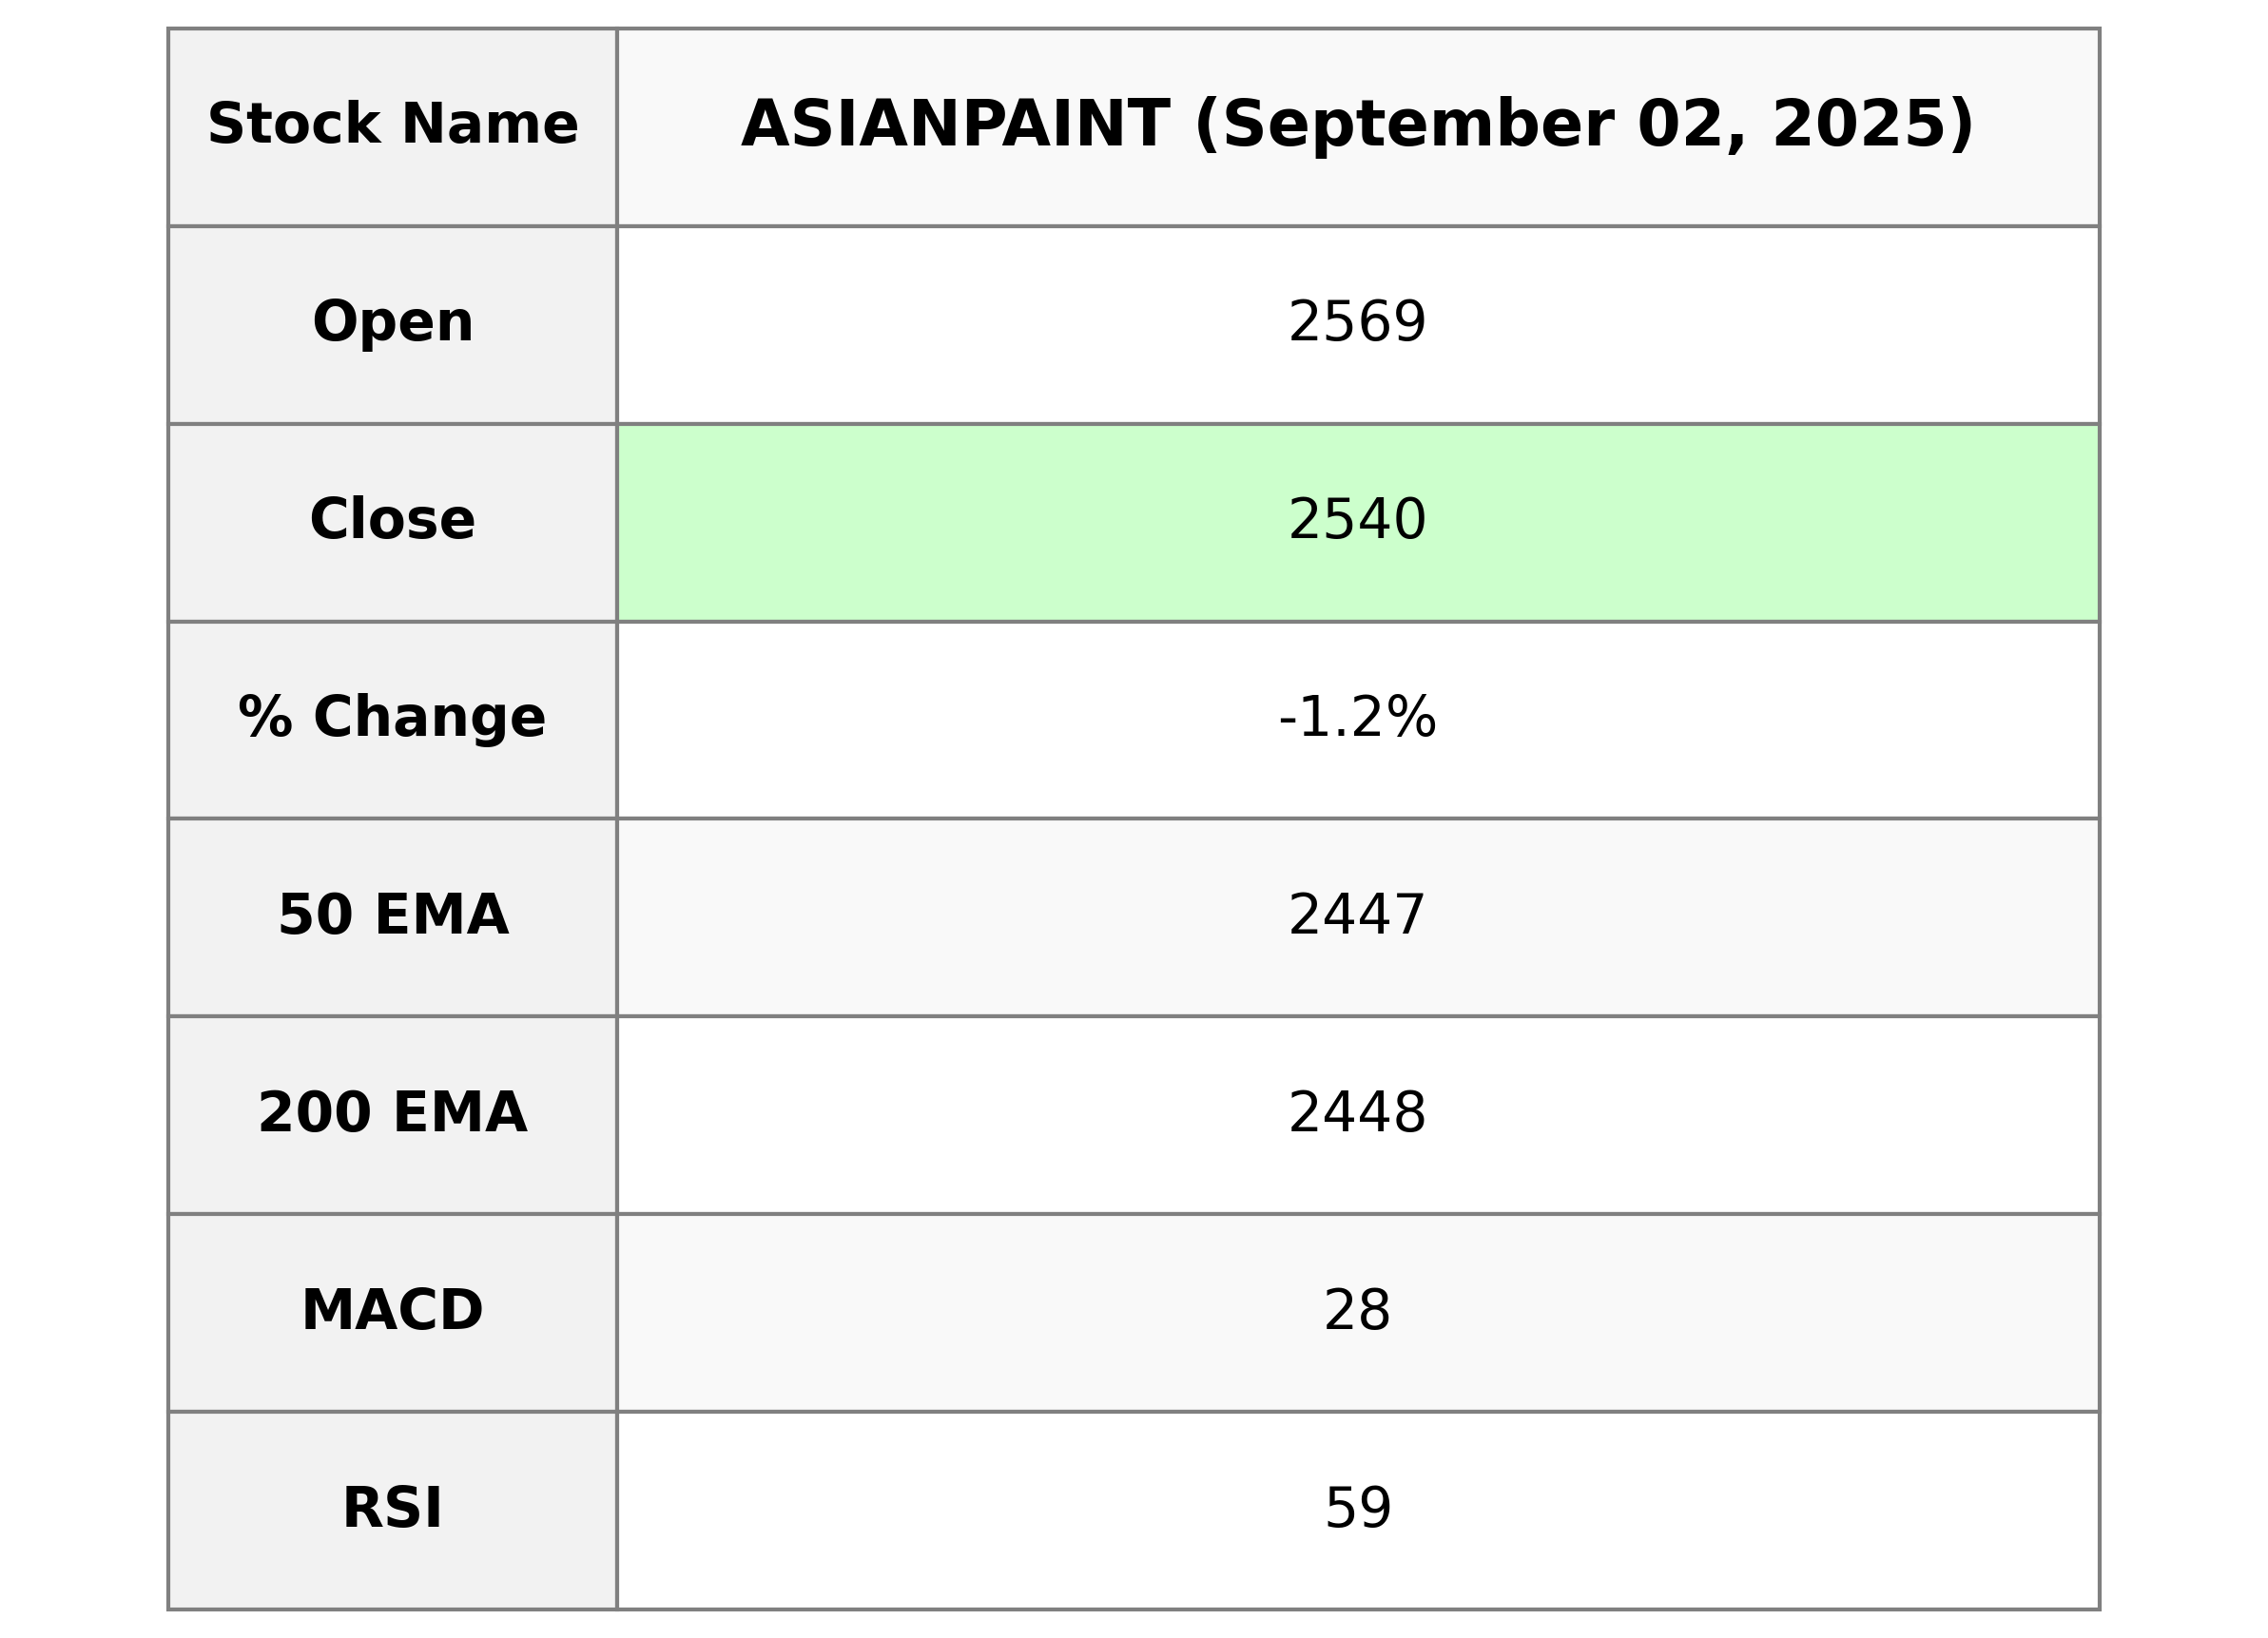
Asian Paints experienced a decline in performance with the stock closing at 2540.0, marking a -1.18% change from the previous close of 2570.20. Despite the downturn, the stock's Relative Strength Index (RSI) is at 58.52, indicating moderate momentum, while the company maintains a strong market capitalization of 2,435,603,496,960 INR in the Specialty Chemicals industry within the Basic Materials sector in India.
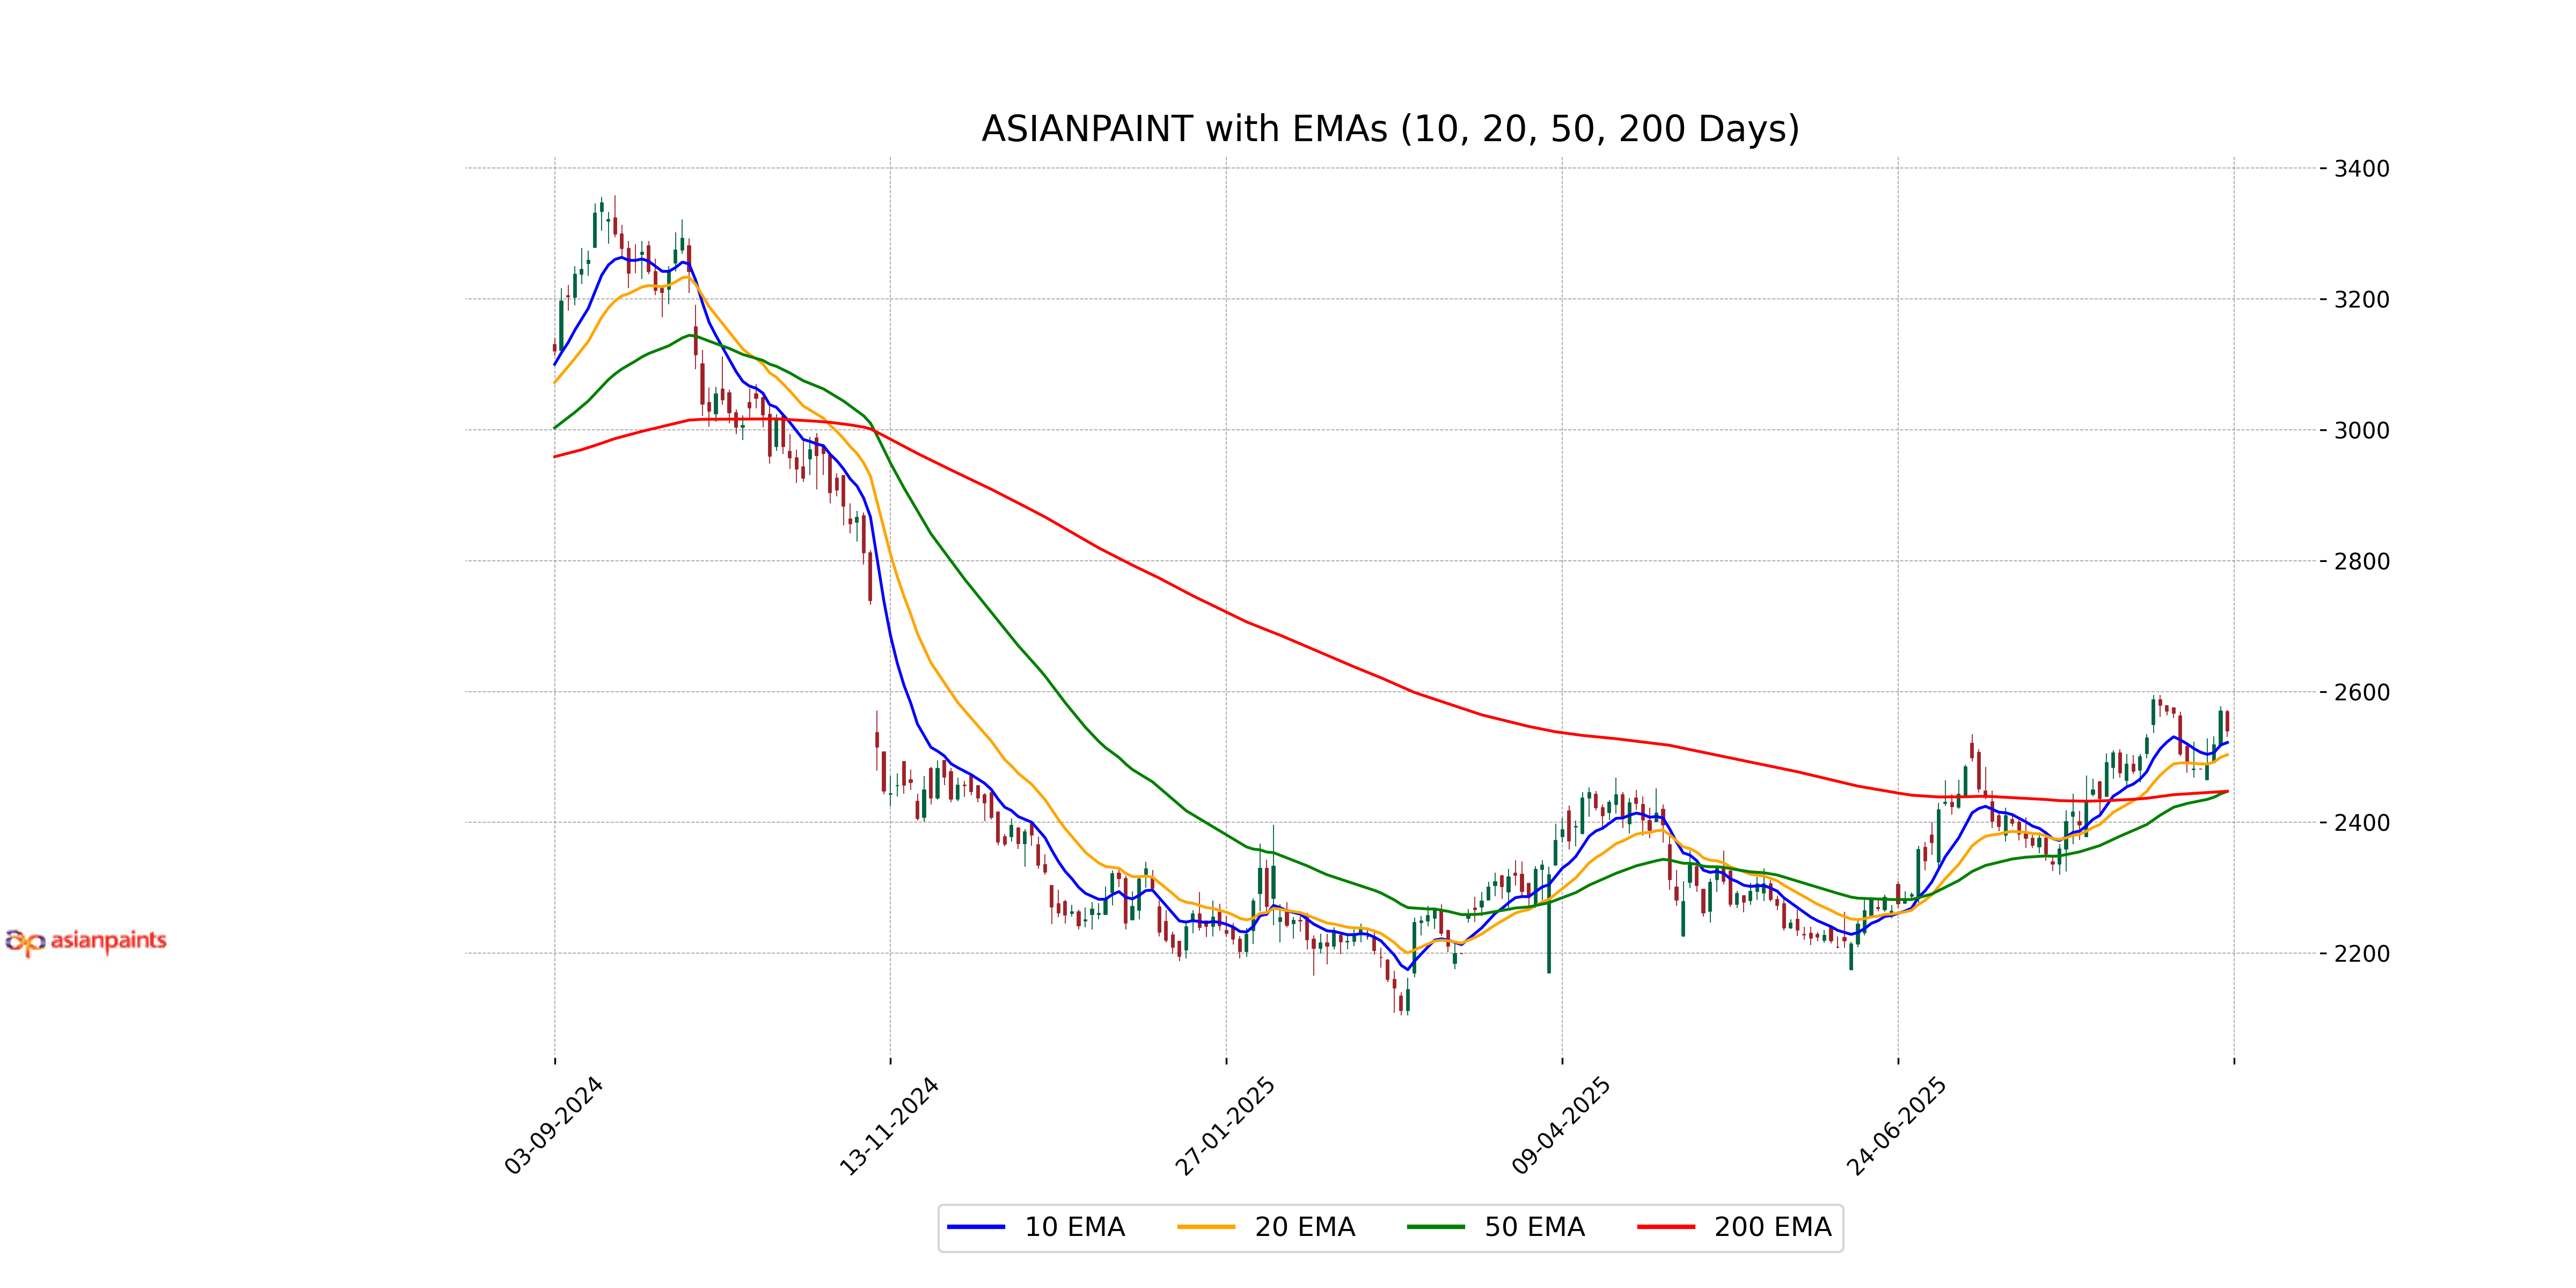
Relationship with Key Moving Averages
Asian Paints is trading below its previous close, with a current price of 2540.0. It is also above its 50-day EMA (2447.40) and 200-day EMA (2447.58) but slightly above its 10-day EMA (2522.14) and 20-day EMA (2503.38), indicating a short-term bullish momentum.
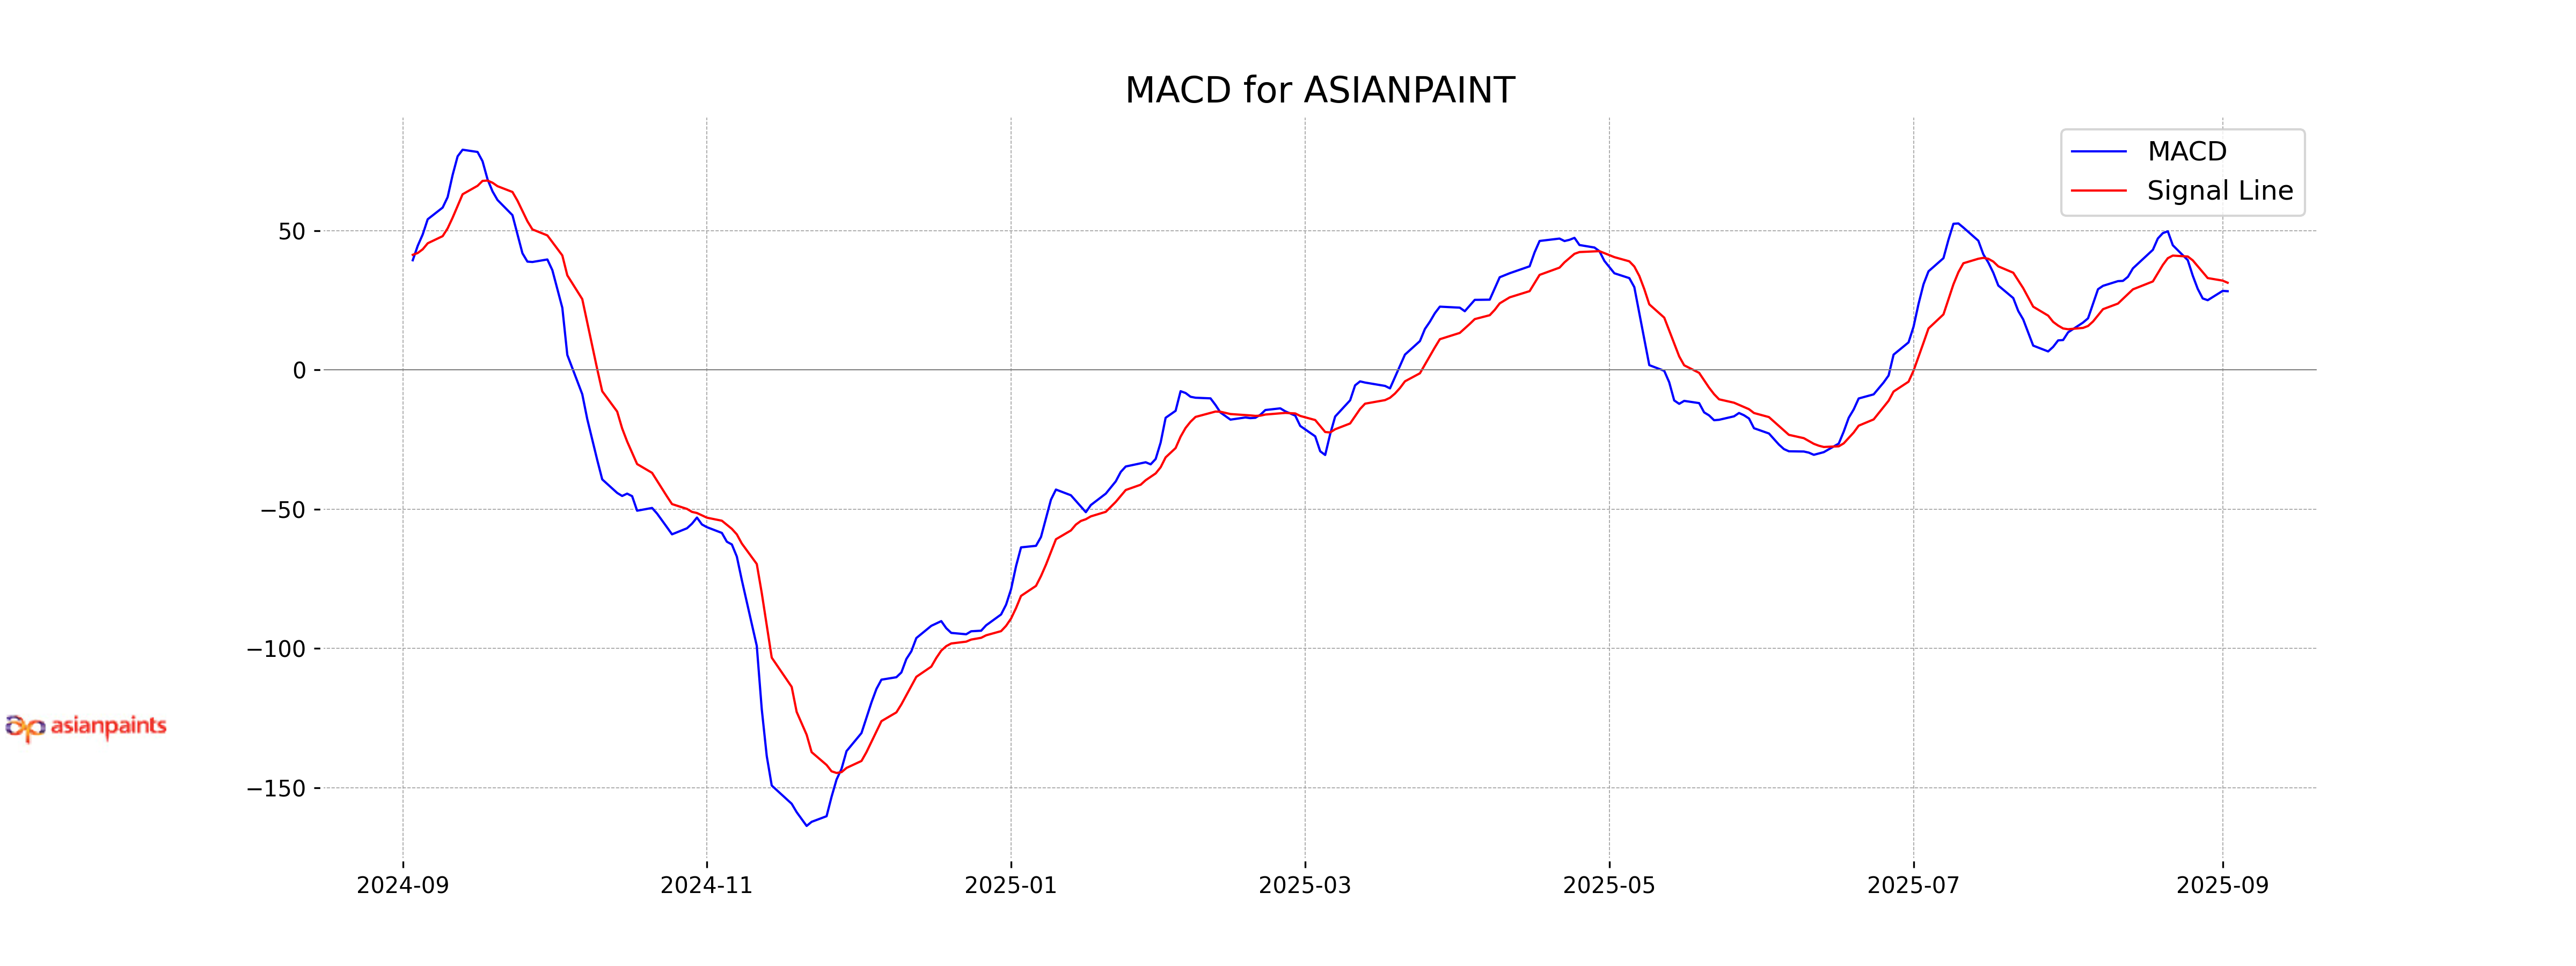
Moving Averages Trend (MACD)
Asian Paints MACD Analysis: The MACD for Asian Paints is currently at 28.23, which is below the MACD Signal line of 31.27. This indicates that the stock might be experiencing bearish momentum in the short term.
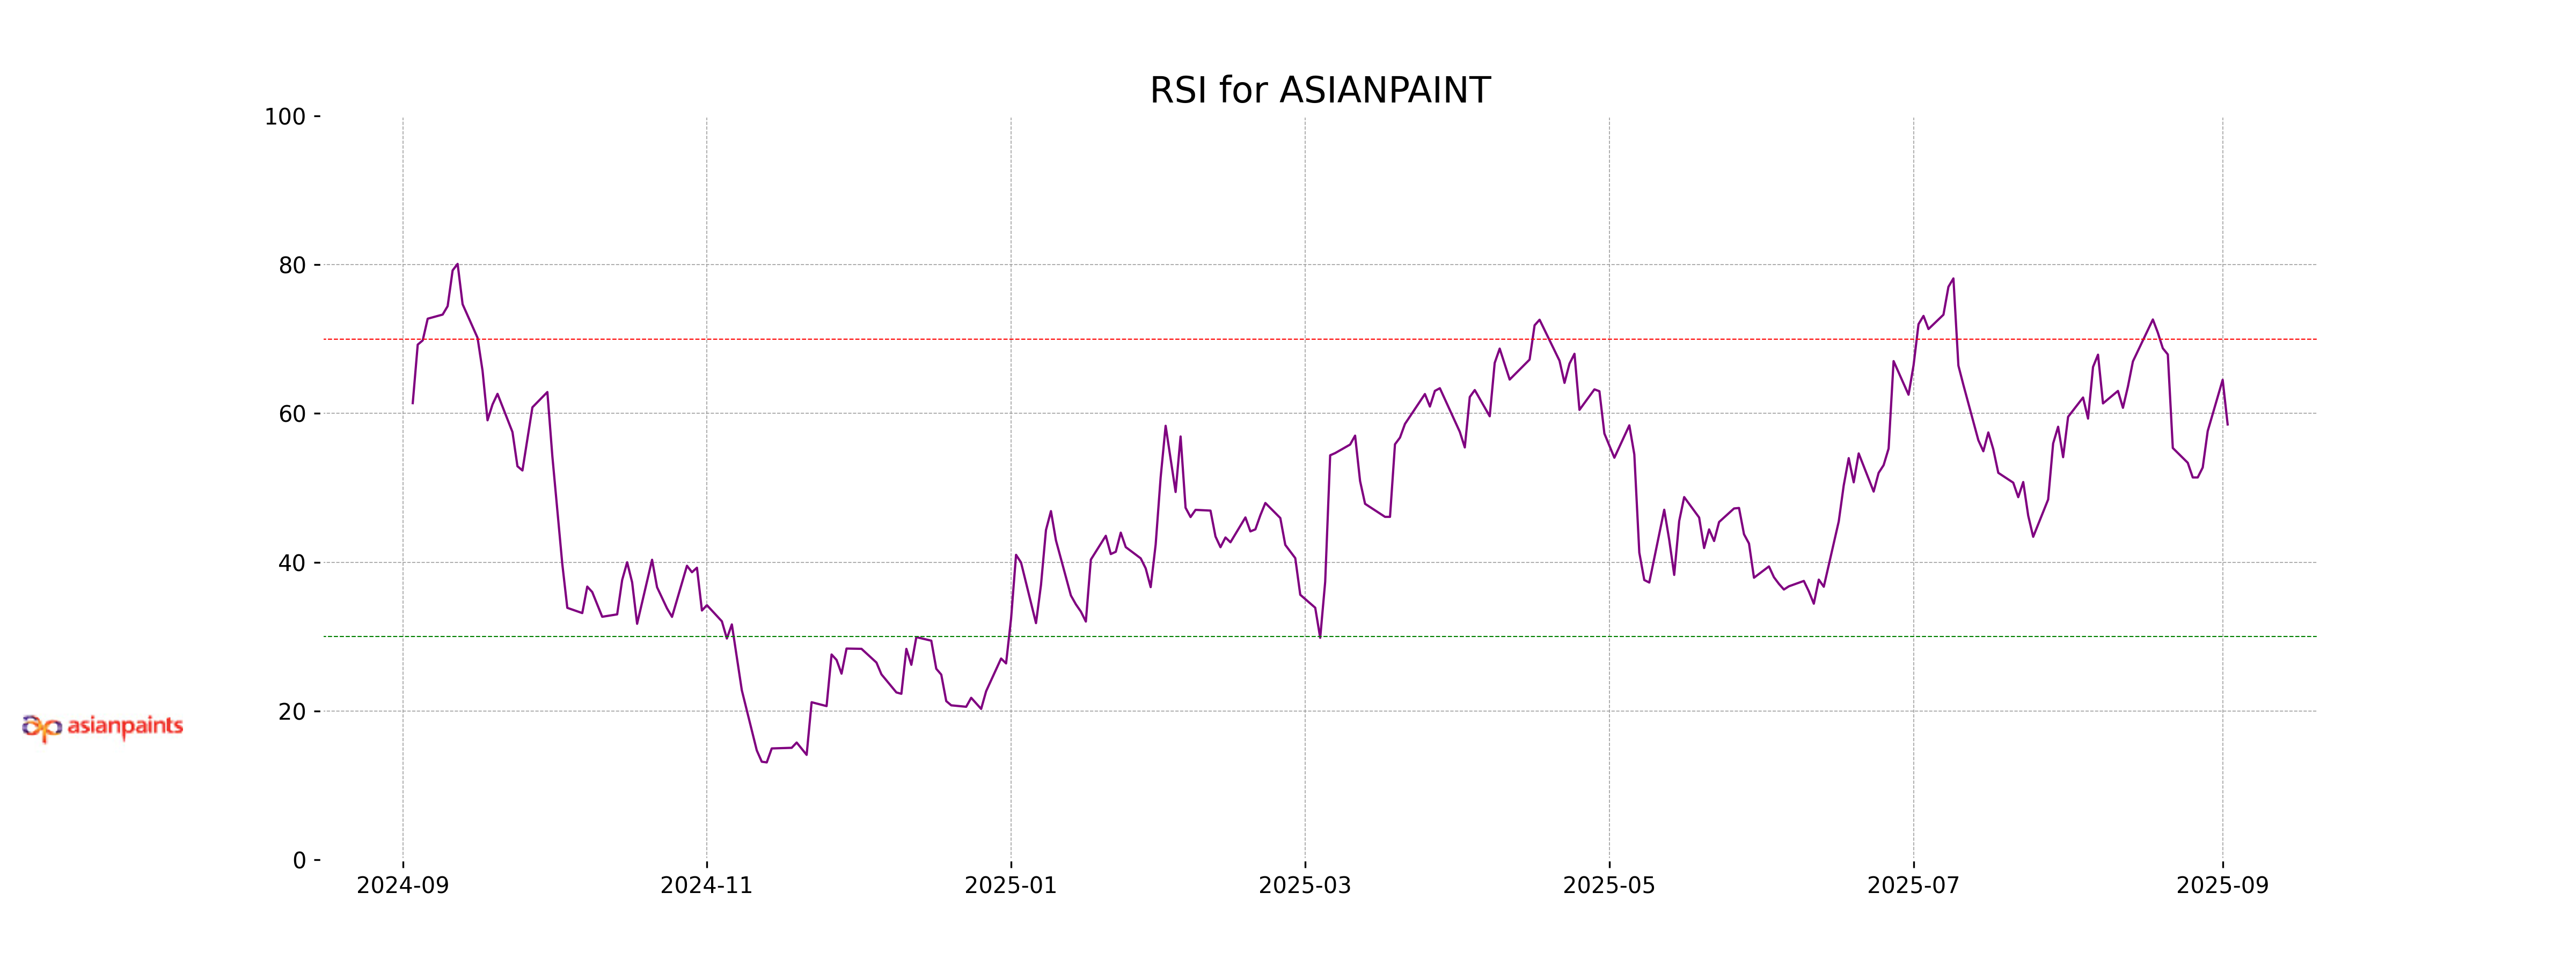
RSI Analysis
RSI Analysis for Asian Paints: The RSI for Asian Paints is 58.52, which is below the typical overbought threshold of 70. This suggests that the stock is neither overbought nor oversold in the current market, indicating a relatively balanced momentum.
Analysis for Dr Reddys Labs - September 02, 2025
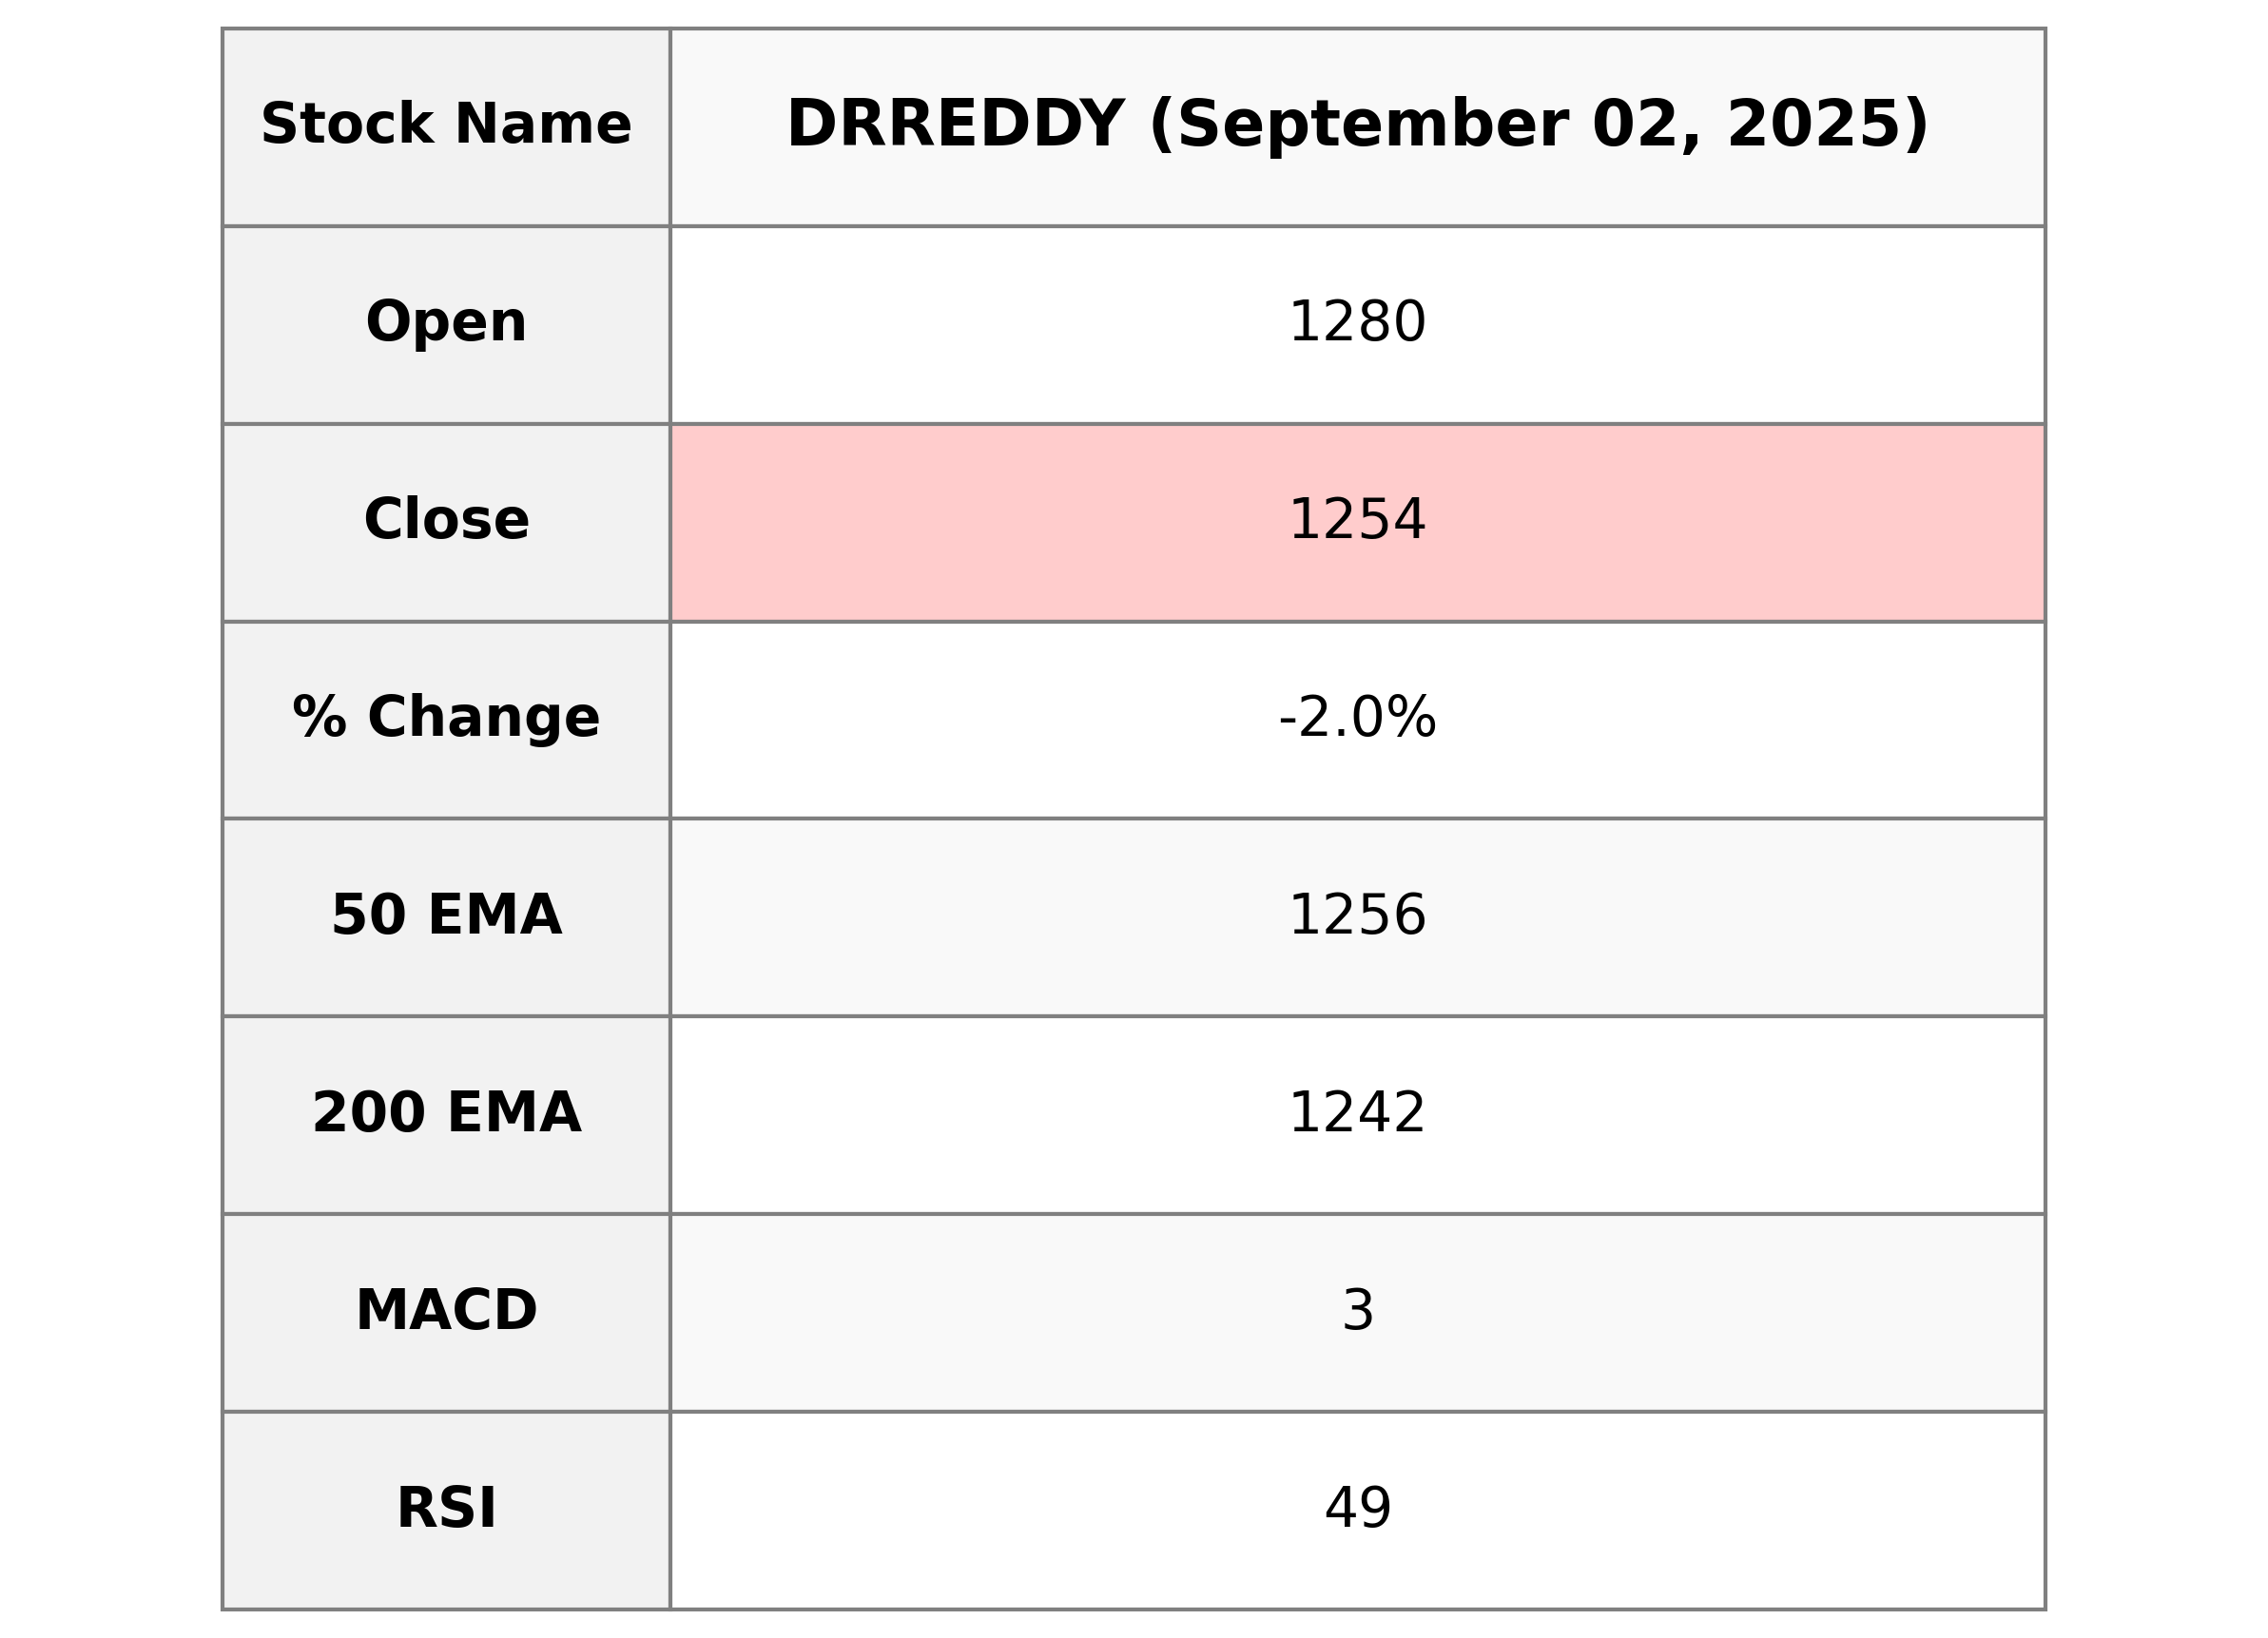
Dr Reddy's Laboratories performance shows that the stock closed at 1253.70 INR, down by 2.05% from its previous close. The company's market cap is over 1 trillion INR, with a PE ratio of 18.41, indicating its valuation against earnings. The stock is currently positioned below its 10 and 50 EMA, with an RSI of 48.65, suggesting a neutral trend but nearing oversold territory in the Healthcare sector, specifically within the Drug Manufacturers - Specialty & Generic industry in India.
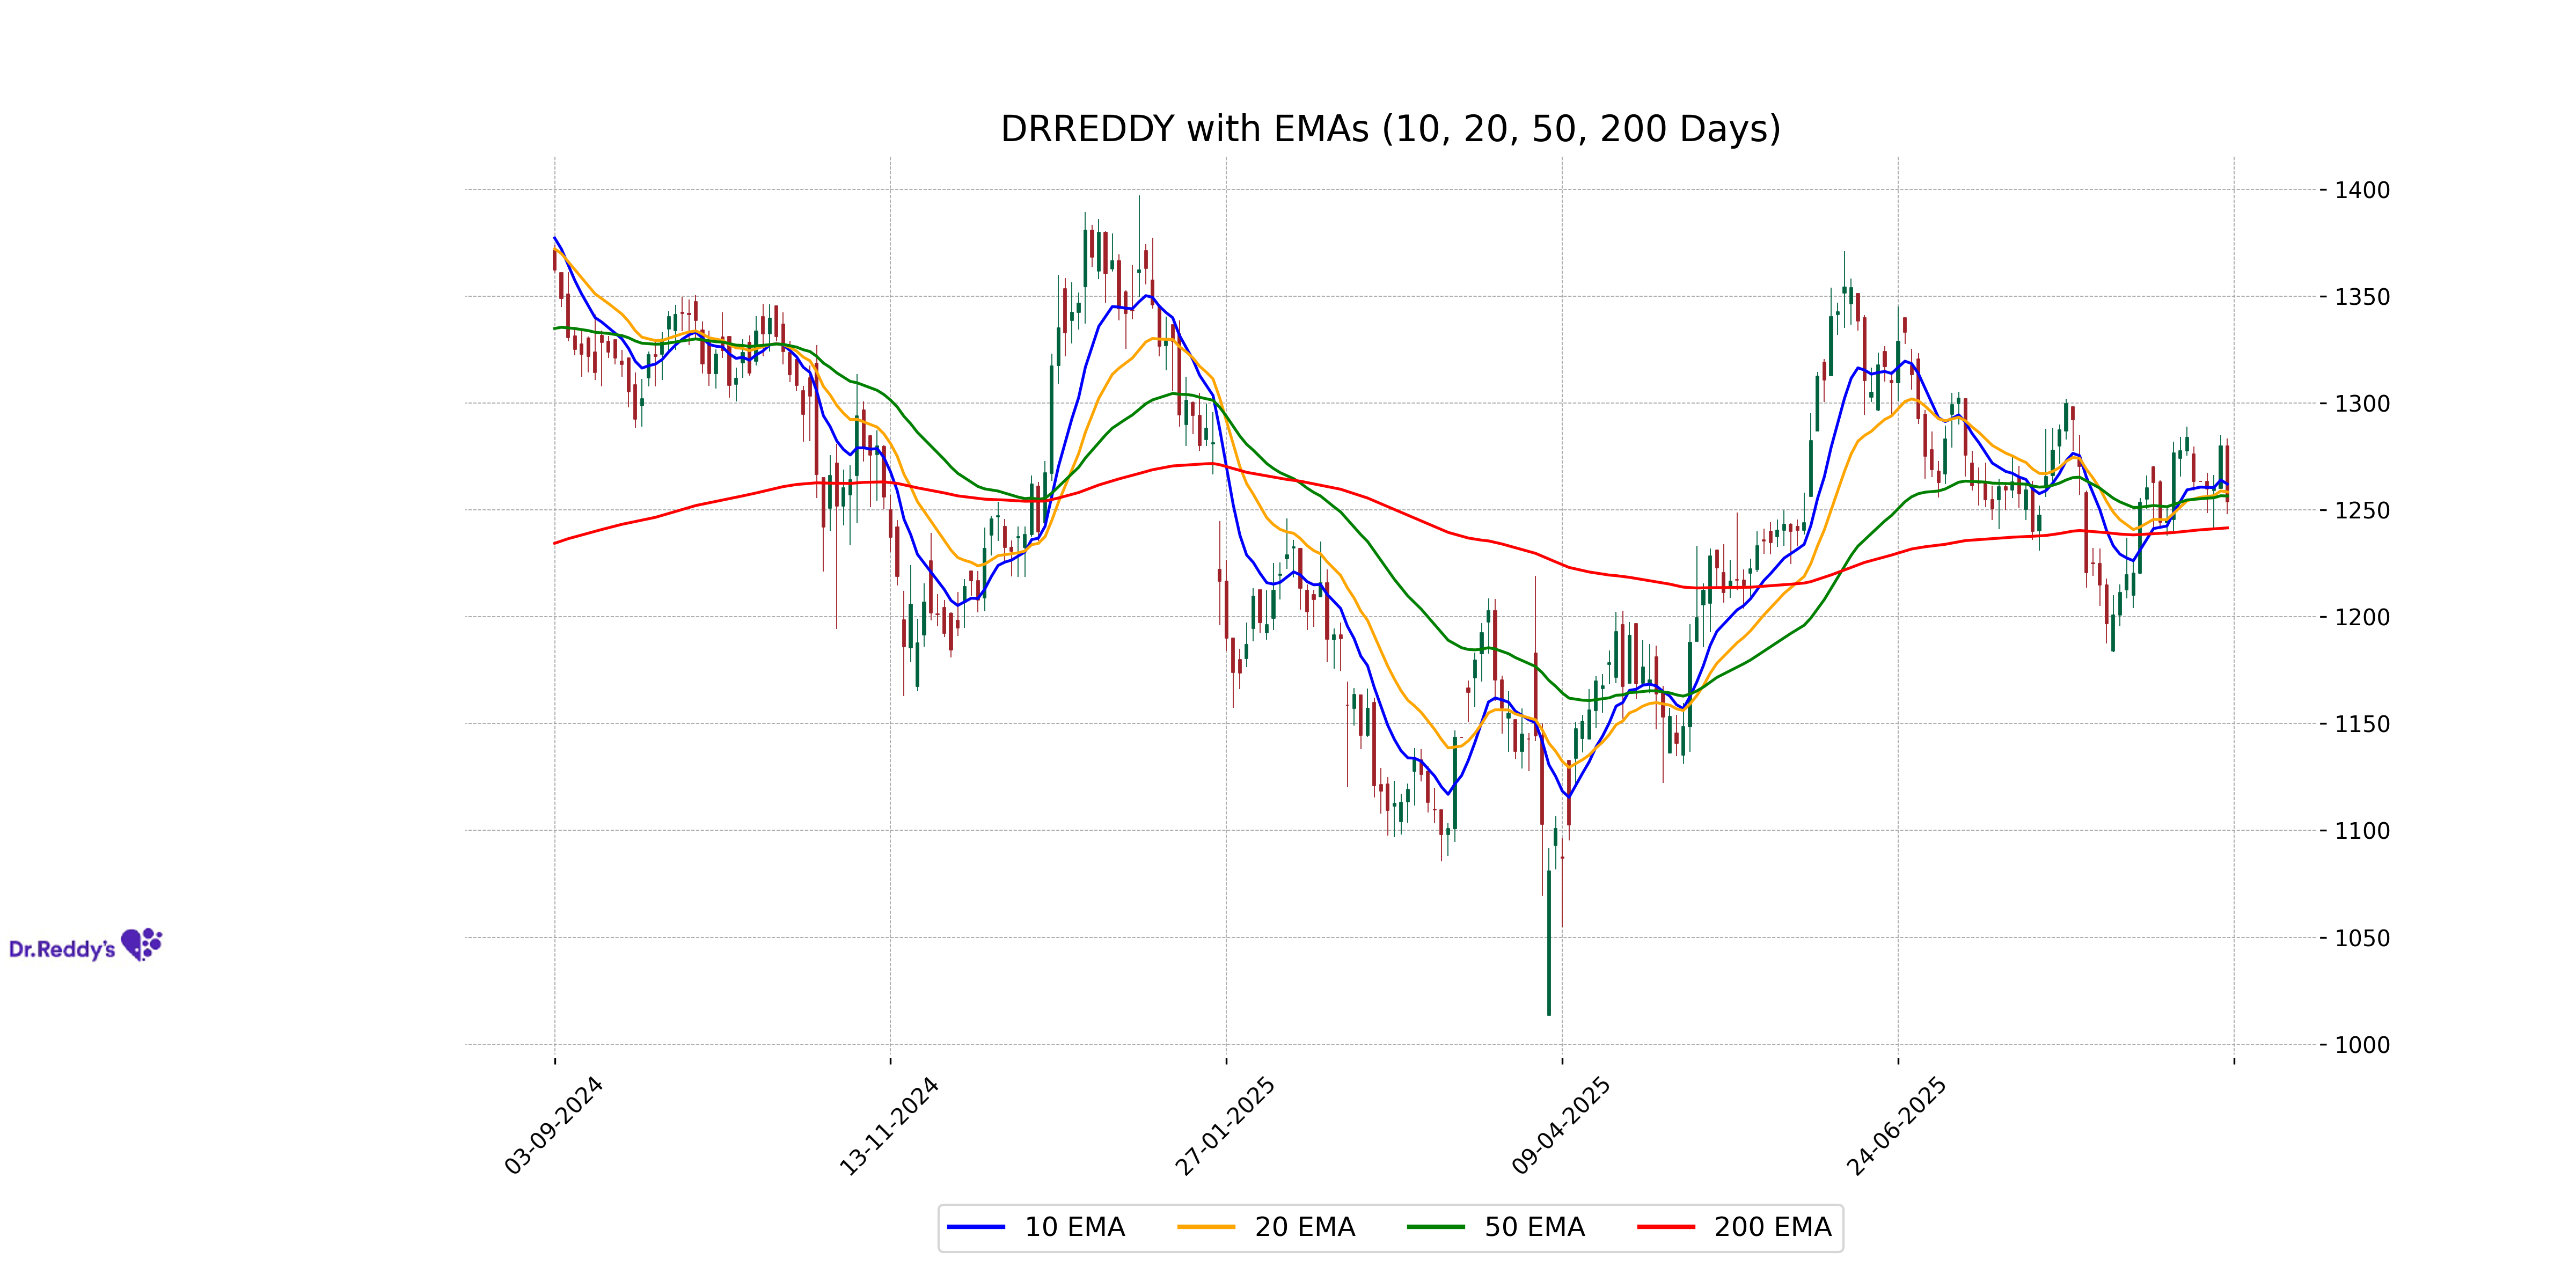
Relationship with Key Moving Averages
Dr Reddys Labs closed at 1253.70, which is below its 10 EMA of 1262.09, indicating a short-term weakness. However, it's slightly above its 50 EMA of 1256.48, and comfortably above its 200 EMA of 1241.55, suggesting it is still on a longer-term upward trend.
Moving Averages Trend (MACD)
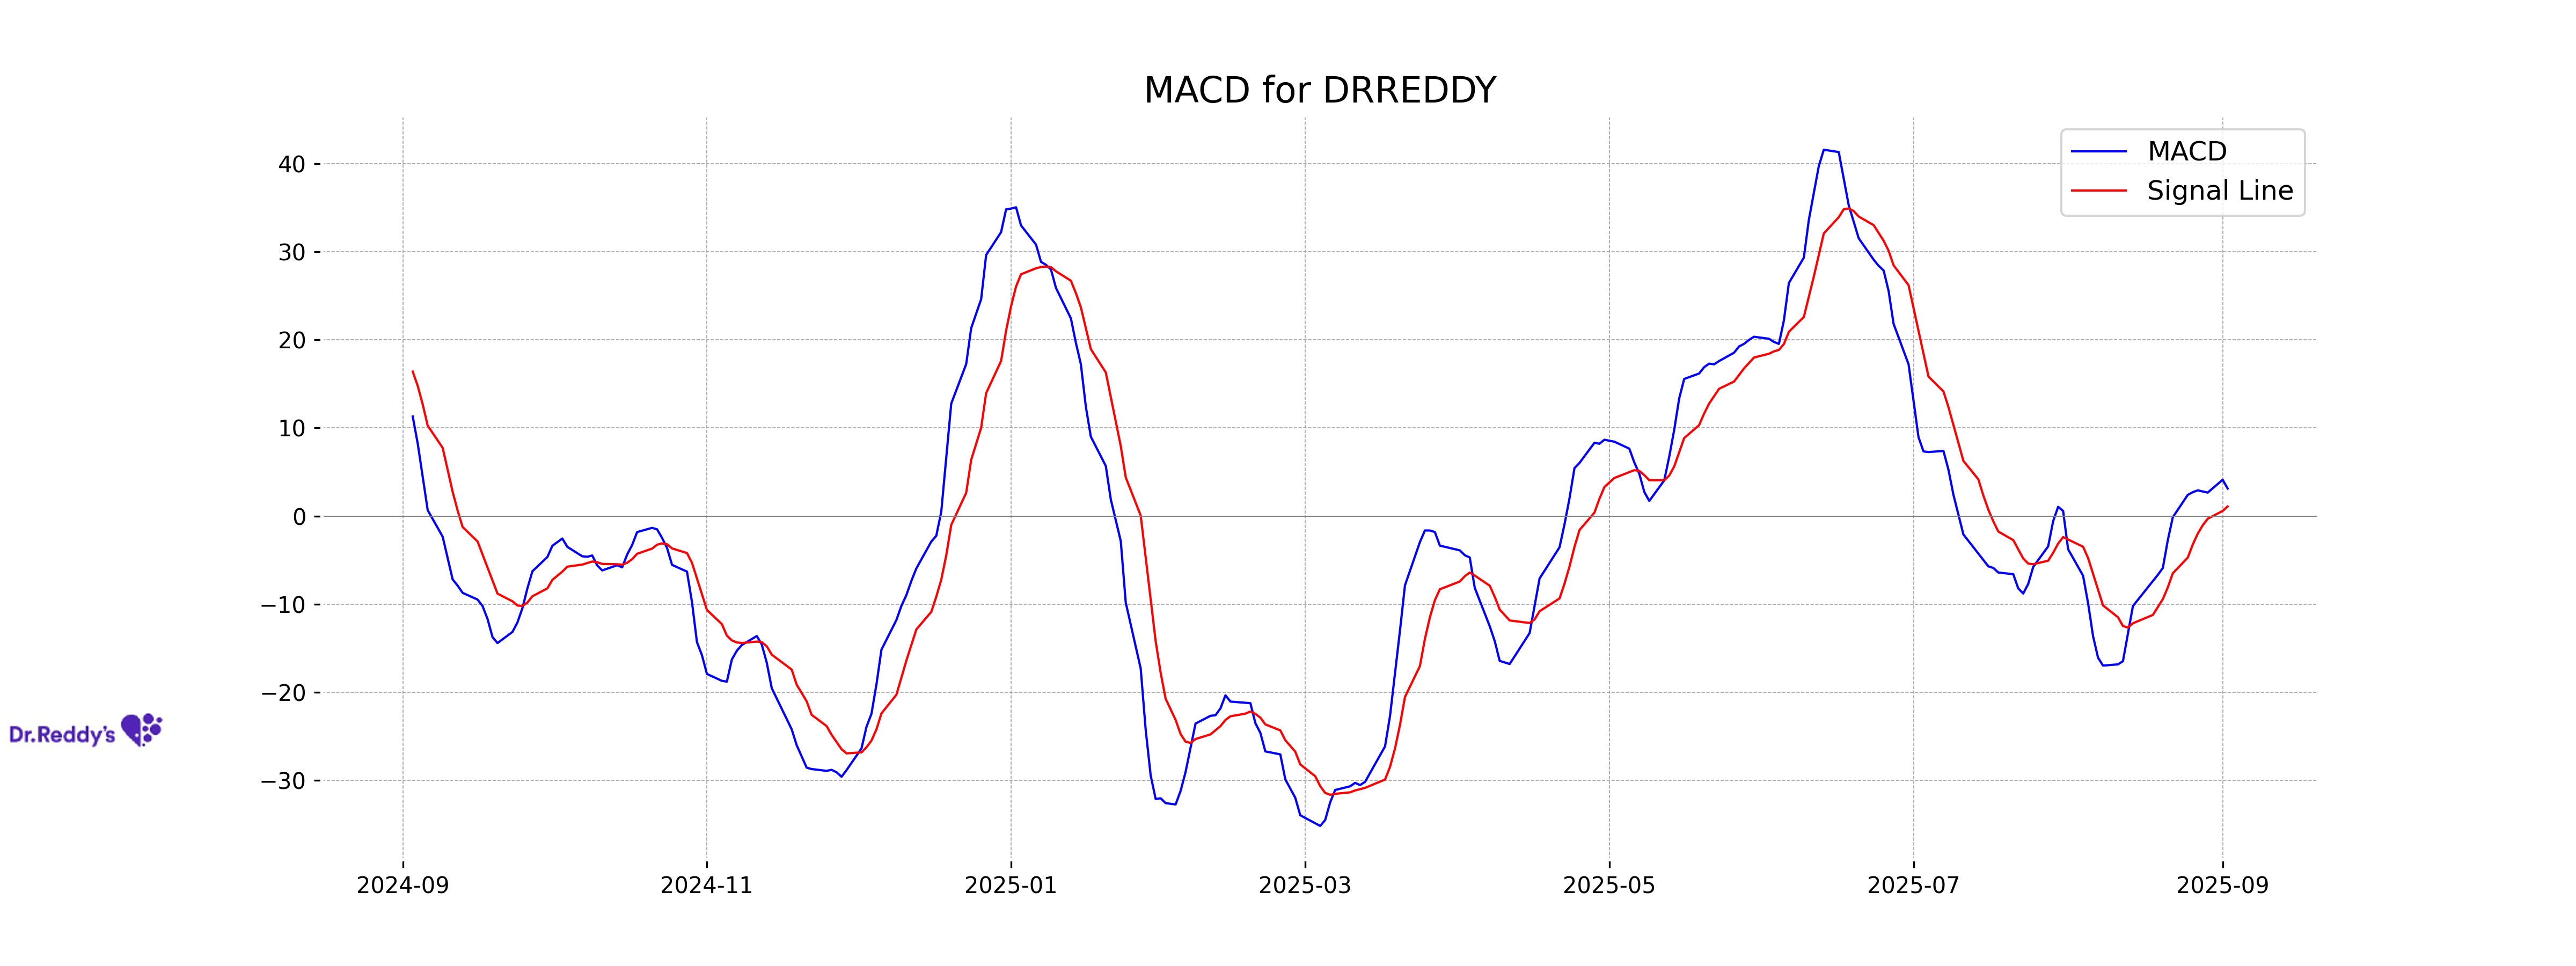
Dr Reddys Labs is experiencing a positive MACD as the MACD value (3.126) is greater than the MACD signal (1.091). This suggests a potential bullish trend as the stock's short-term momentum is stronger than its long-term momentum.
RSI Analysis
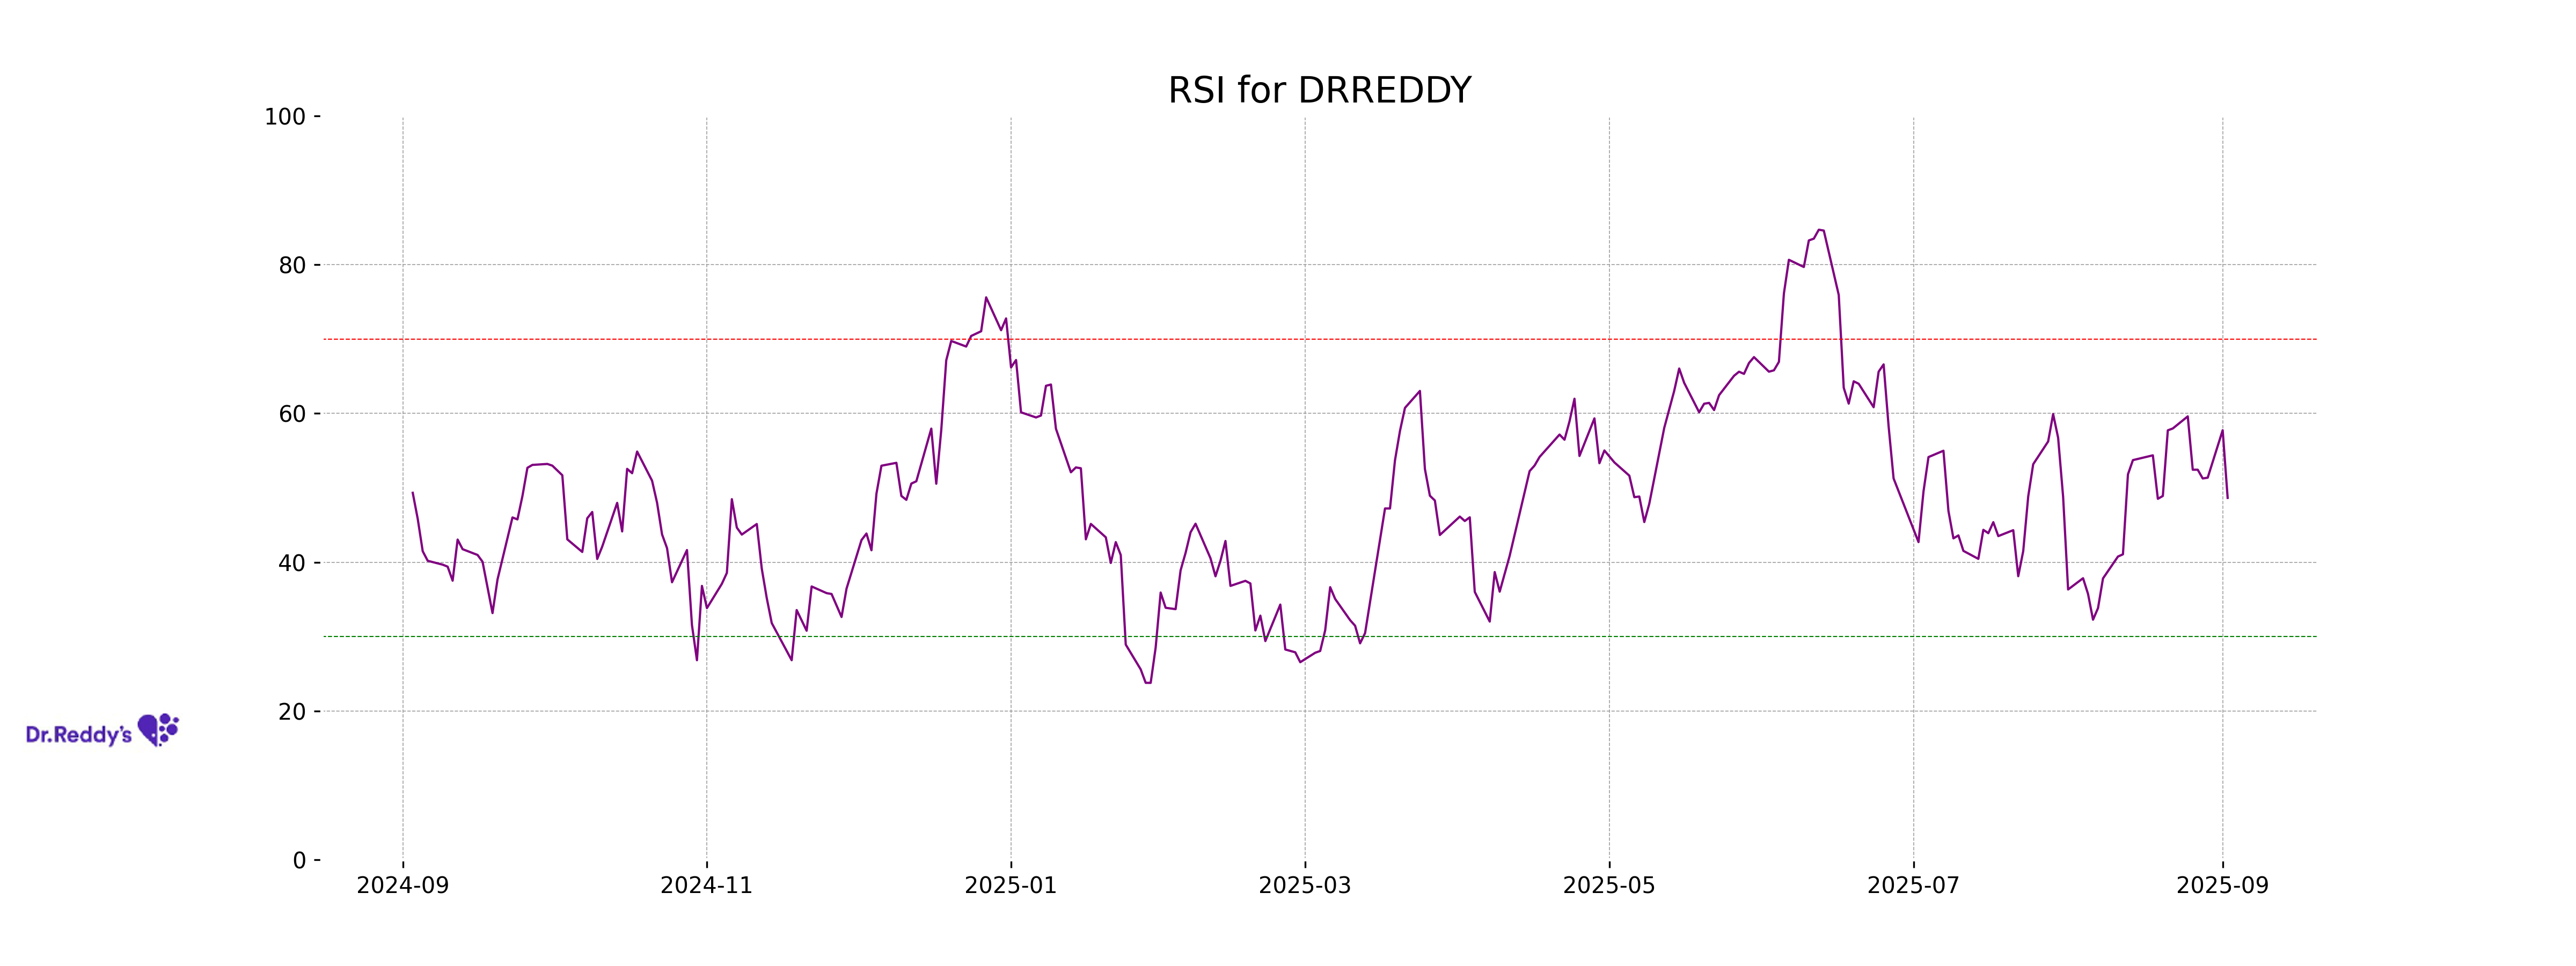
RSI Analysis for Dr Reddys Labs: The current RSI value is 48.65, which indicates a neutral market condition. This suggests that the stock is neither overbought nor oversold, reflecting a balanced demand and supply situation.
Analysis for ICICI Bank - September 02, 2025
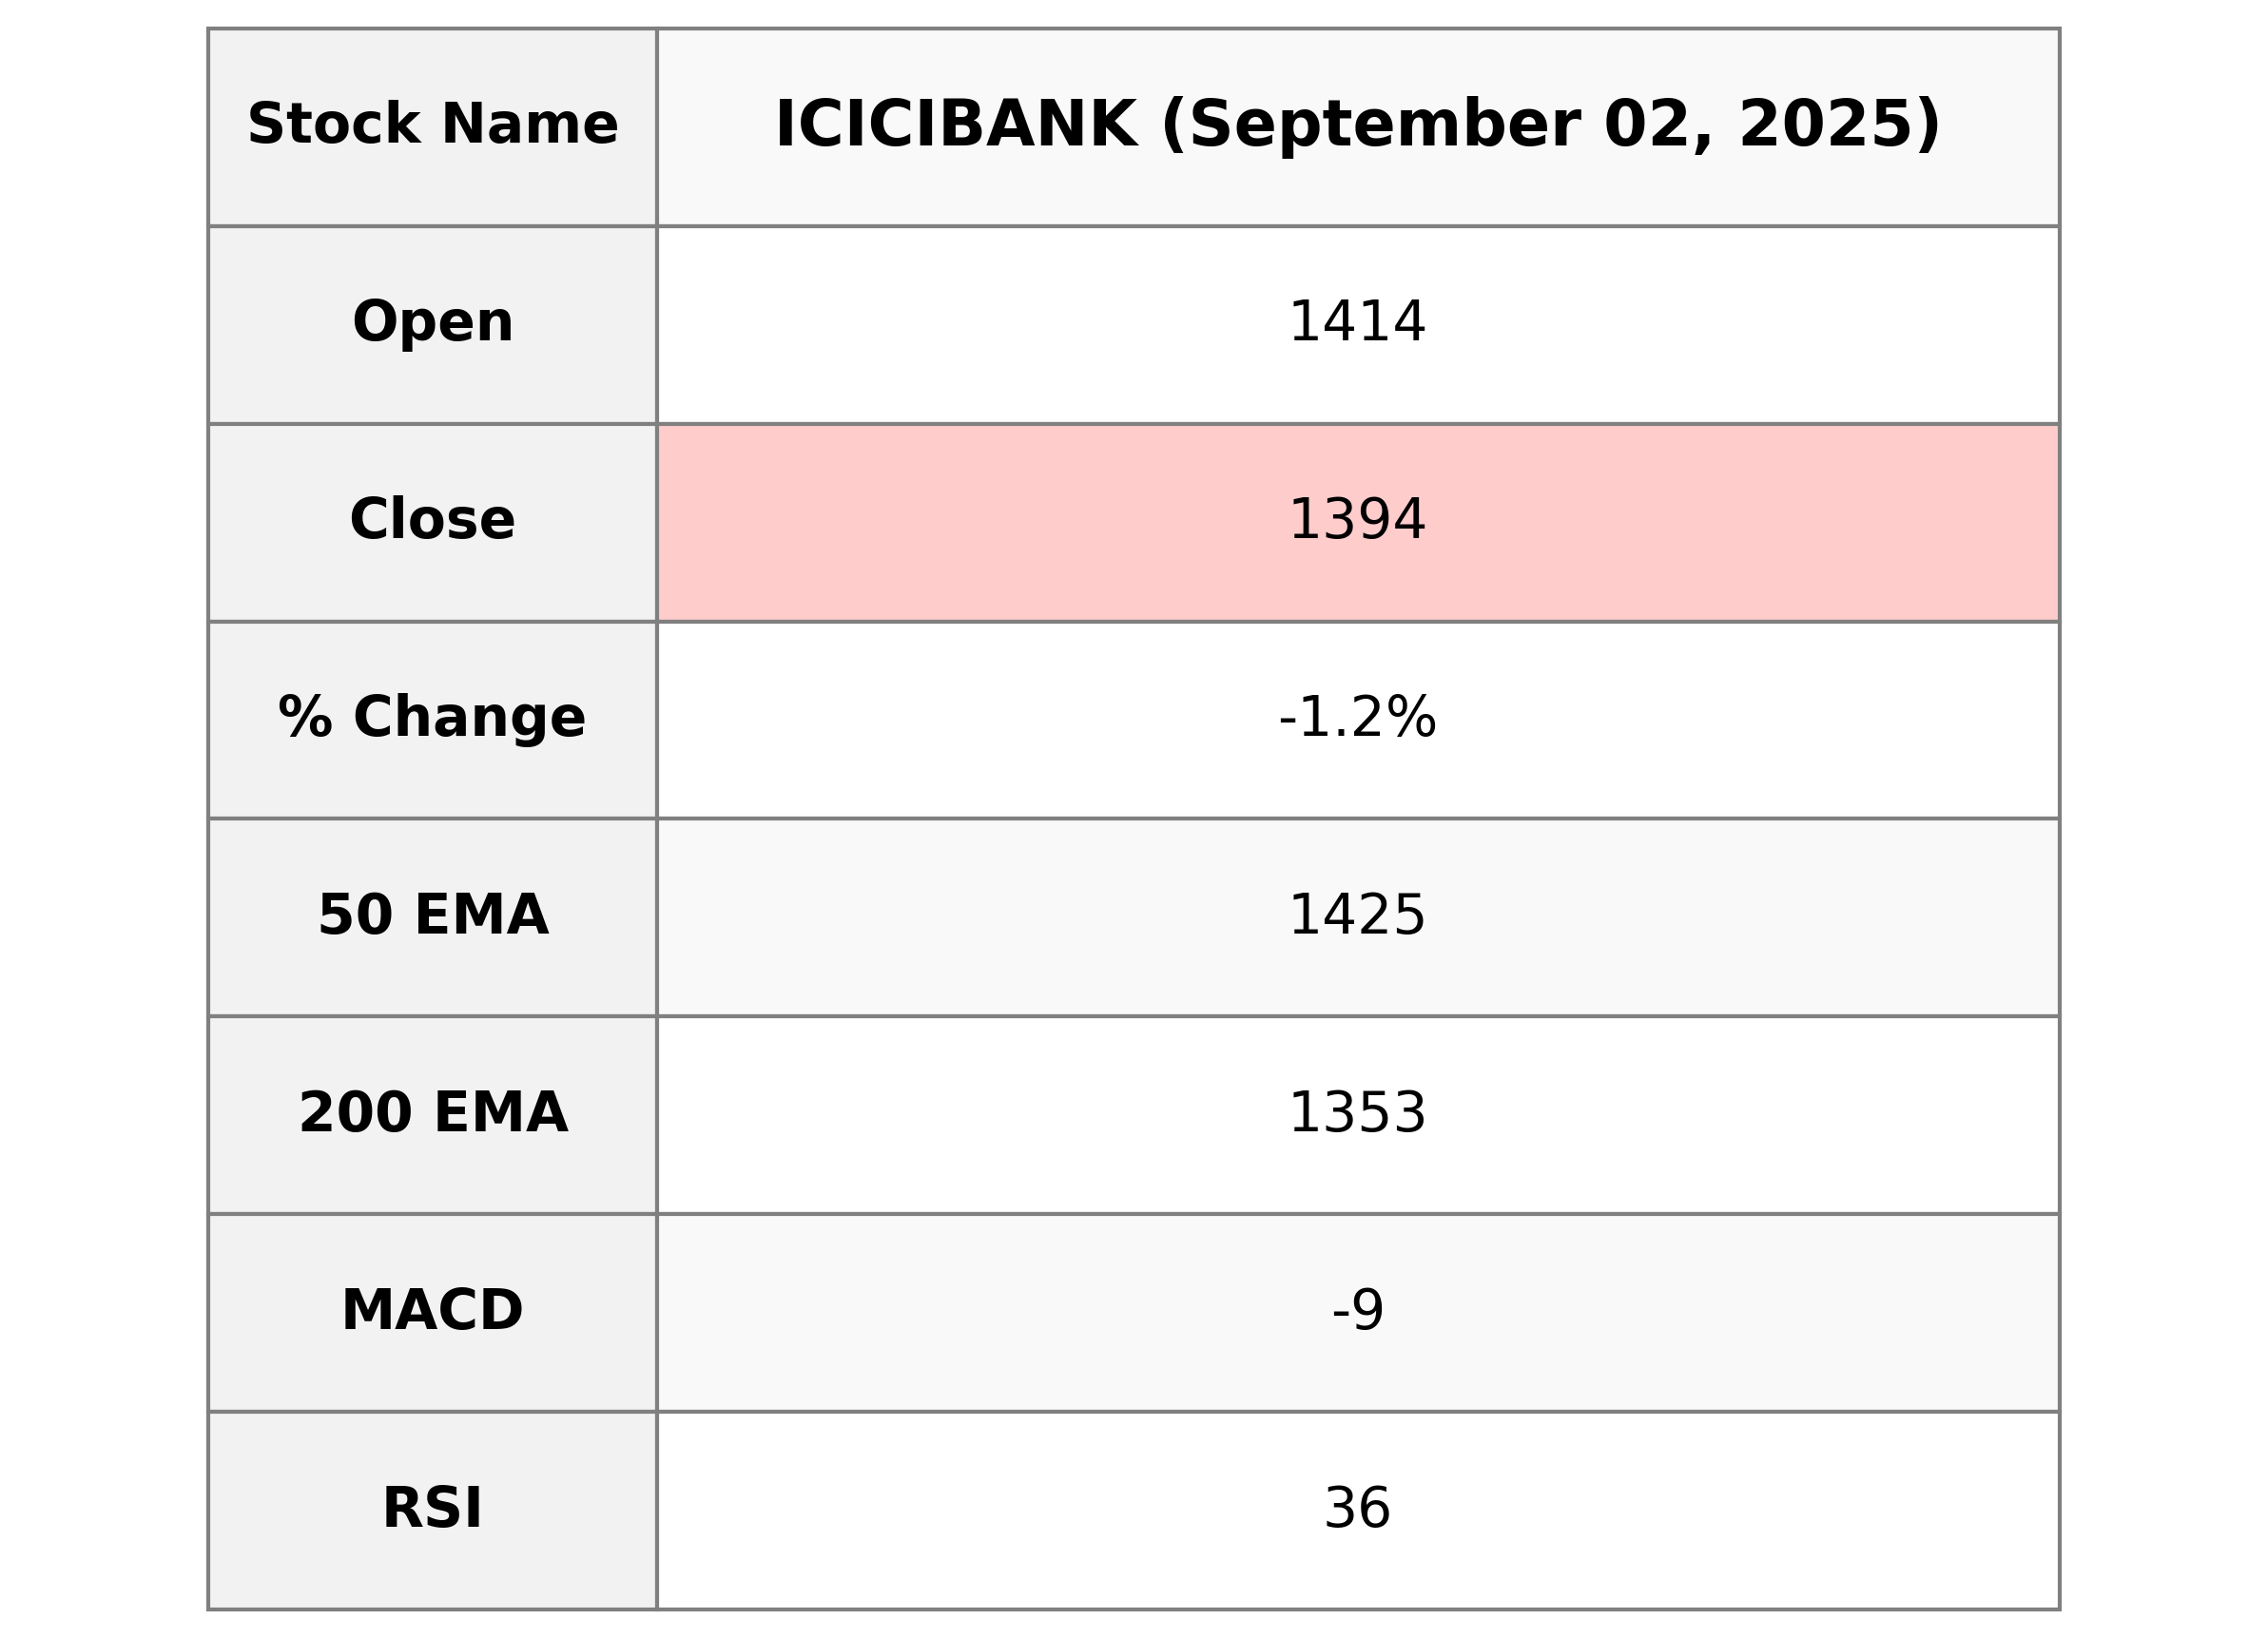
ICICI Bank experienced a decline in performance, with a closing stock price of 1394.20, which is a decrease of 1.19% compared to the previous close of 1411.0. The stock traded with a high volume of 7,162,468 and is currently below its 50-day EMA of 1425.36, indicating a possible bearish trend. The RSI is 35.76, suggesting that the stock is nearing oversold territory.
Relationship with Key Moving Averages
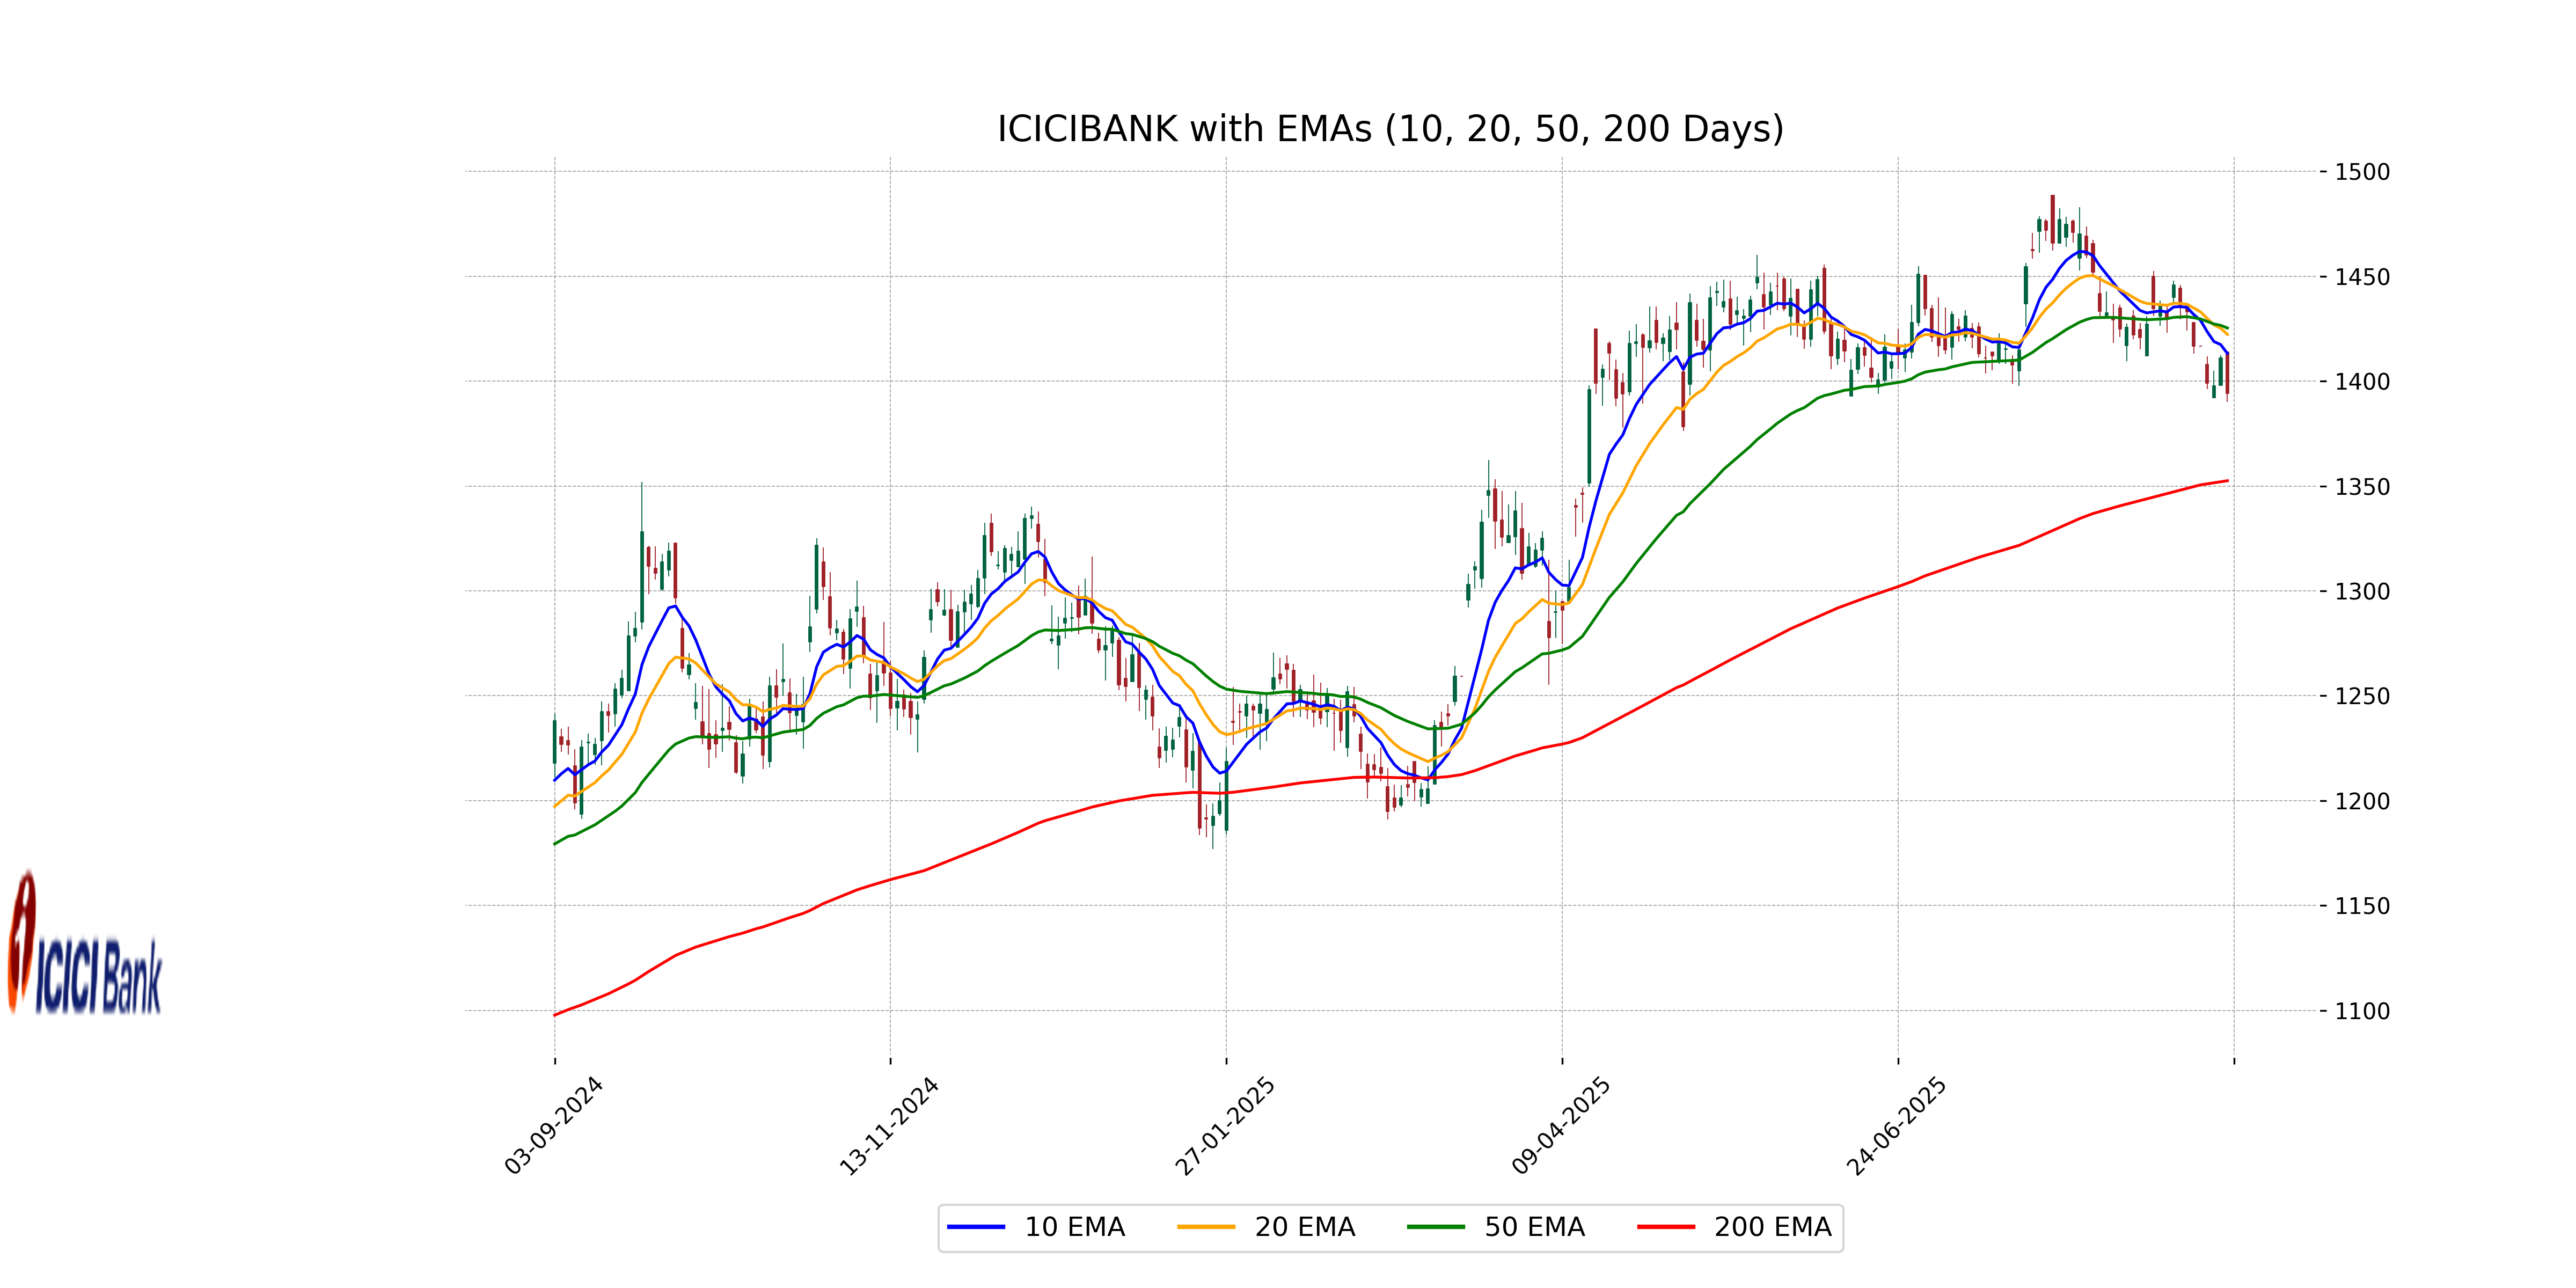
ICICI Bank closed below its 50 EMA (1425.36) and 10 EMA (1413.22), indicating a recent downtrend as its current price (1394.20) remains under these key moving averages. The stock is above its 200 EMA (1352.53), suggesting a longer-term bullish trend despite recent weakness.
Moving Averages Trend (MACD)
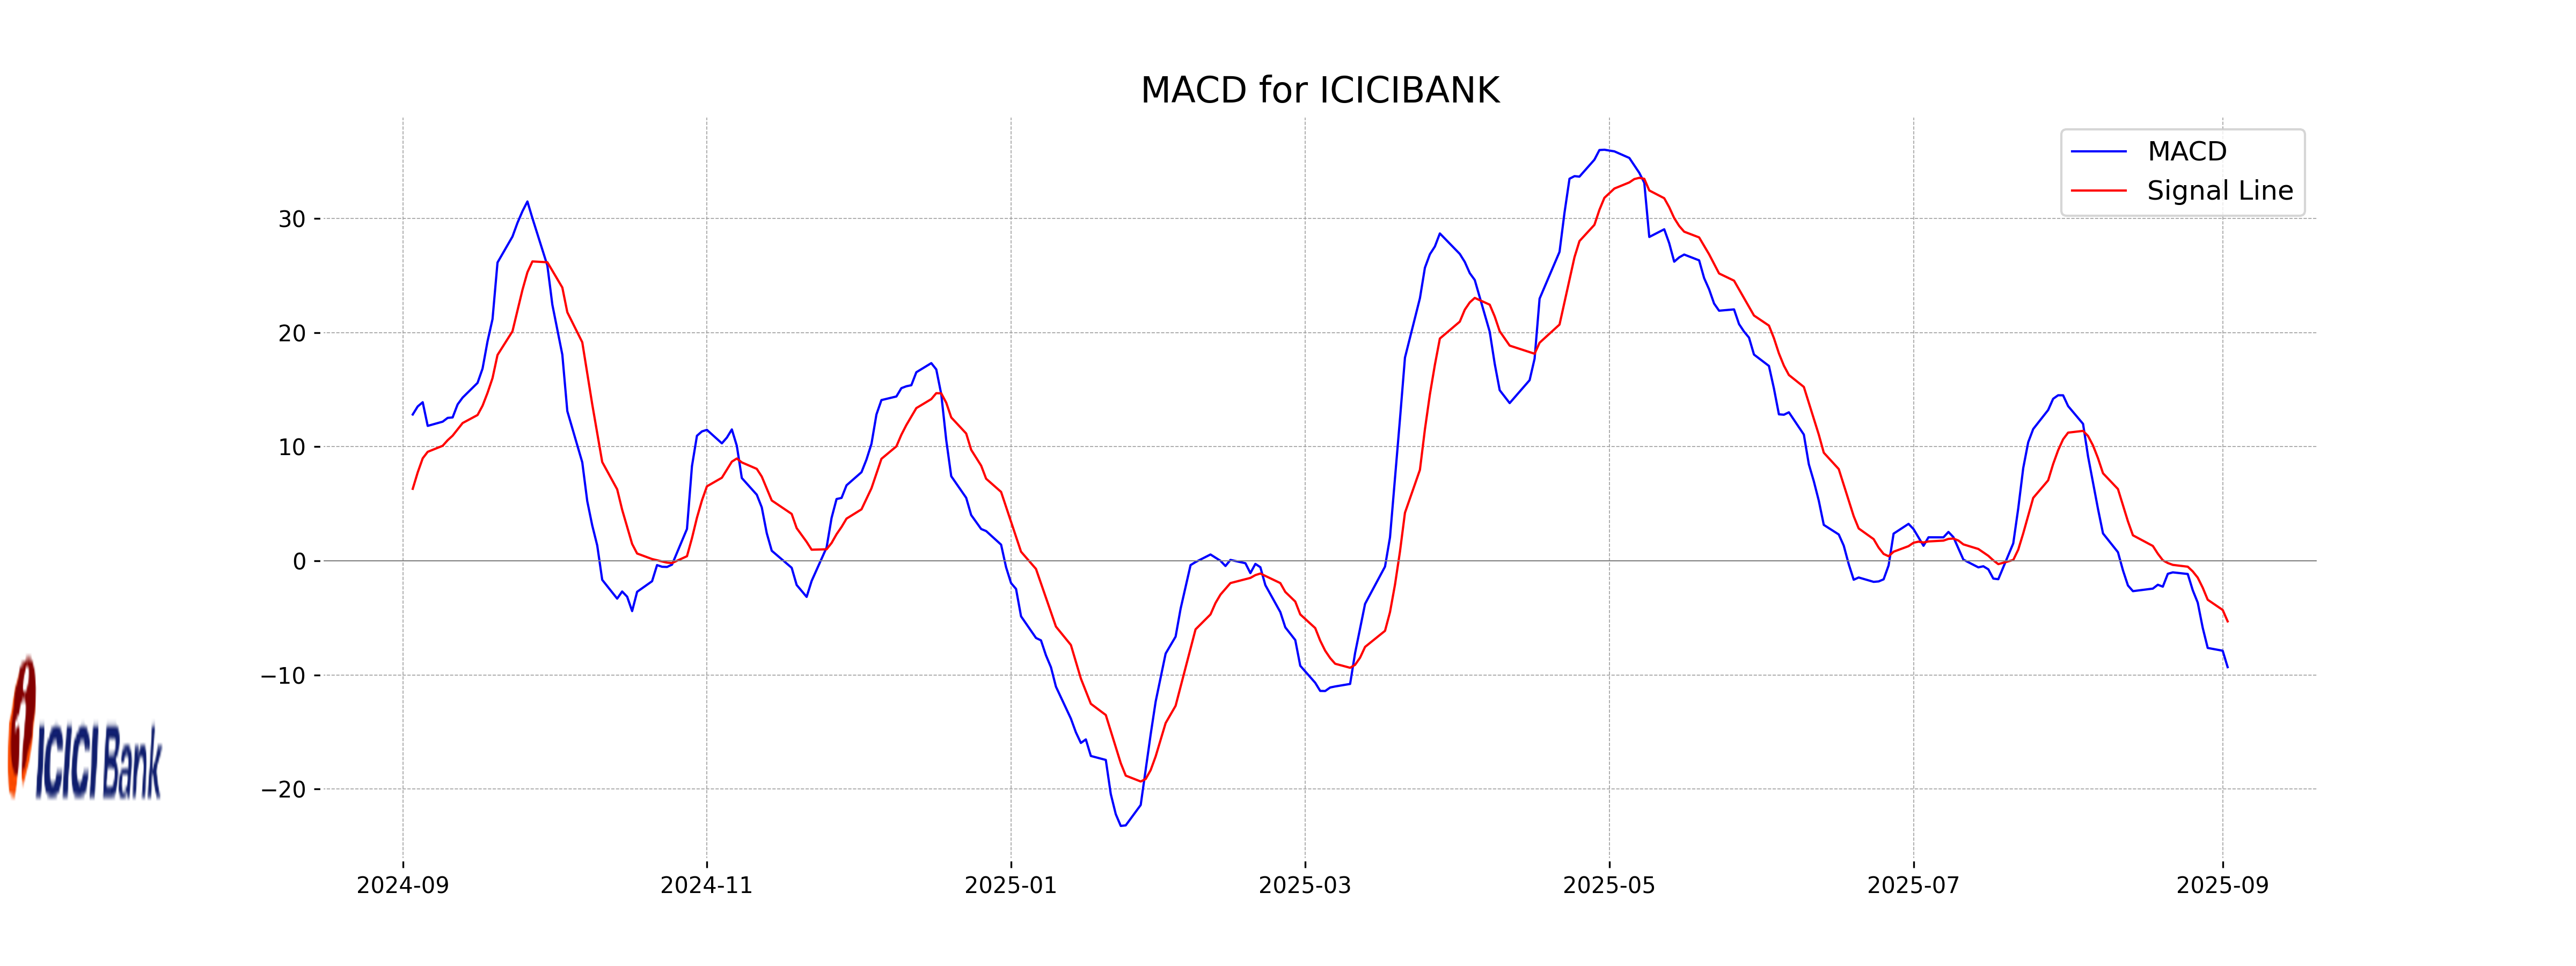
The MACD value for ICICI Bank stands at -9.31, with a signal line of -5.30, indicating a bearish trend. The current MACD being below the signal line suggests potential downward momentum. With the RSI at 35.76, the stock may also be approaching oversold territory.
RSI Analysis
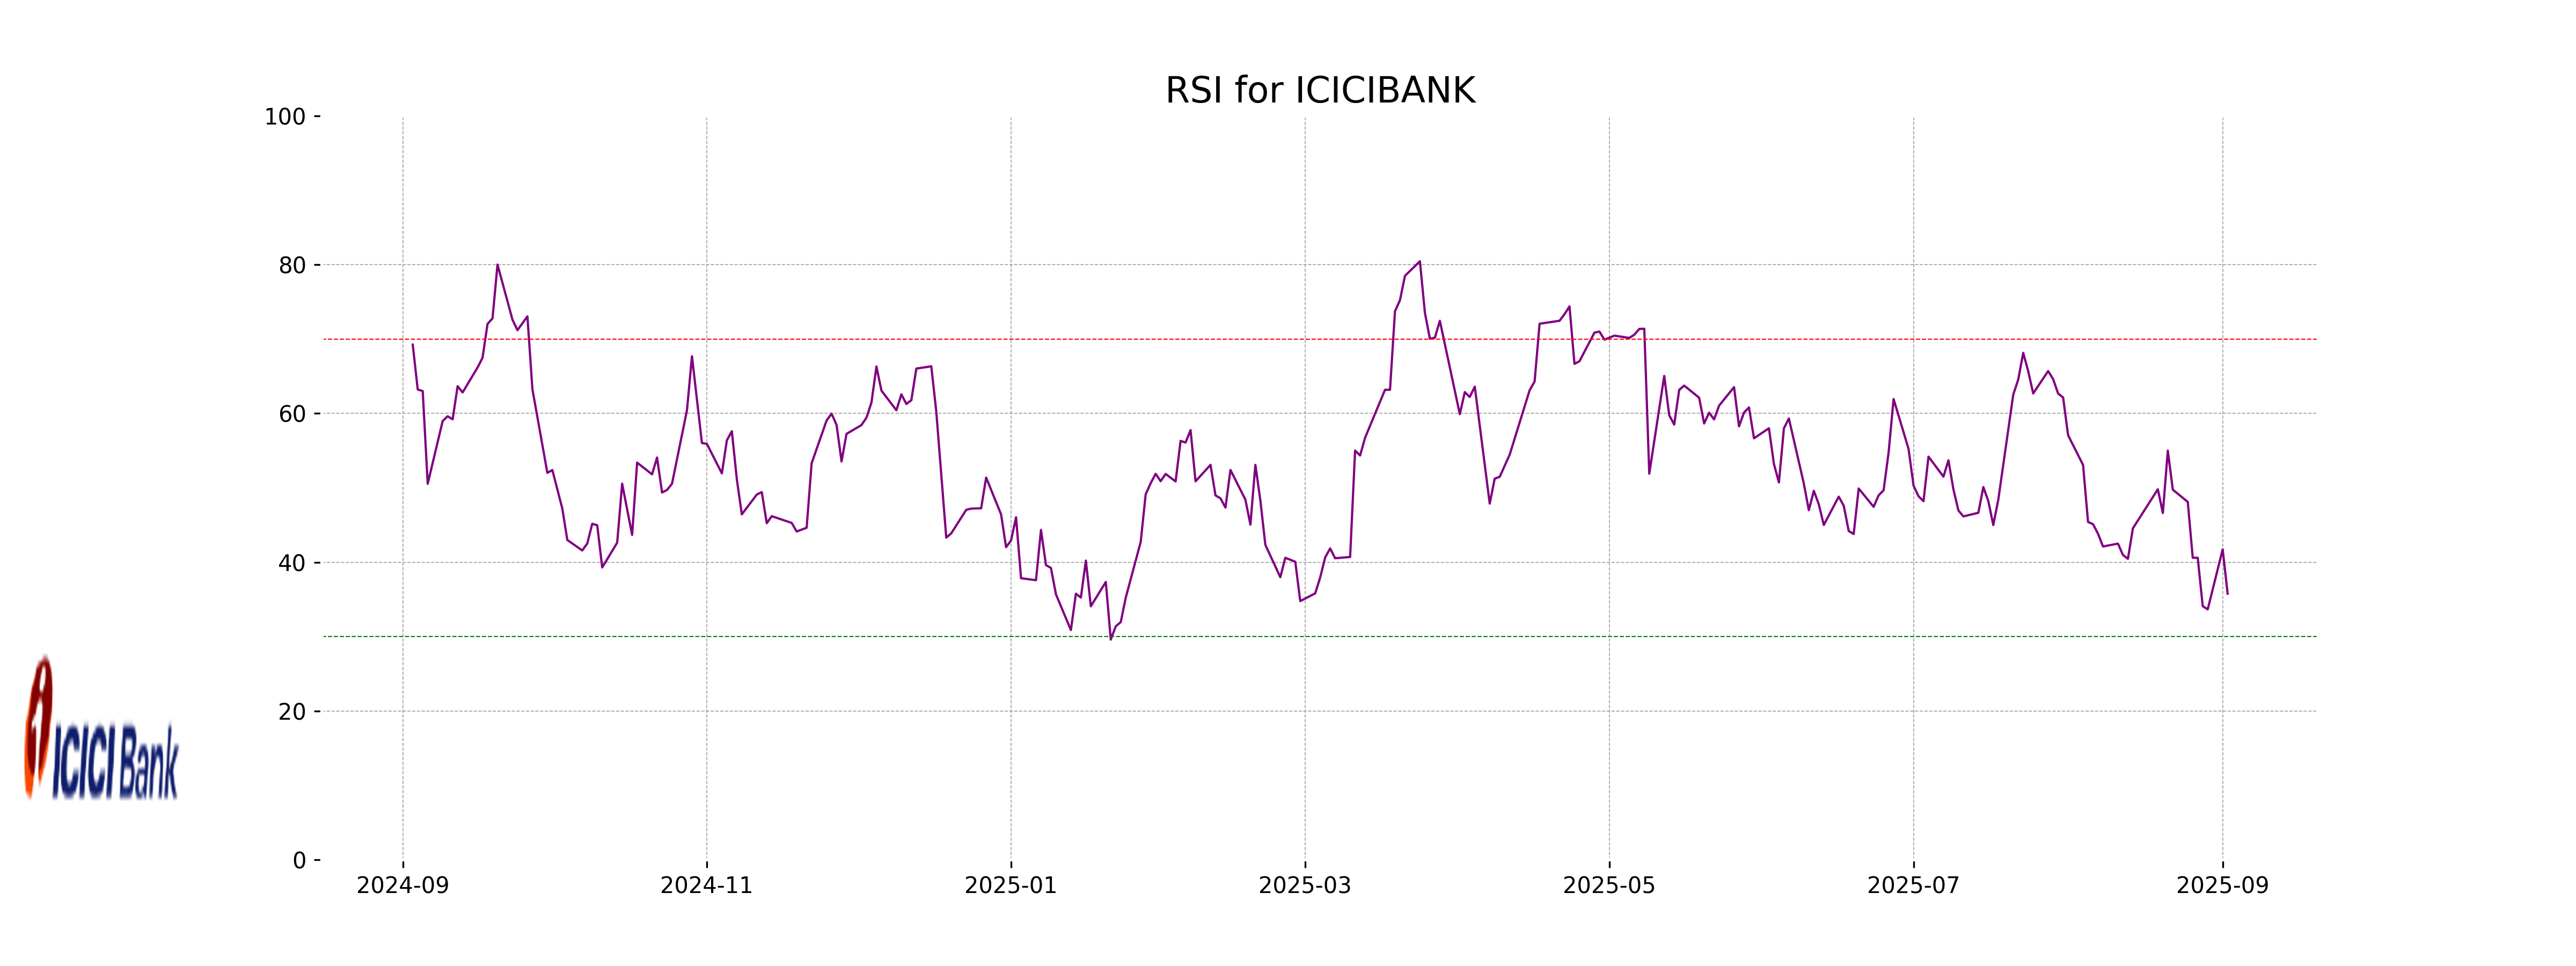
ICICI Bank RSI Analysis: The RSI (Relative Strength Index) for ICICI Bank is 35.76. This indicates that the stock is approaching the oversold territory, suggesting potential undervaluation and possible upward price movement if market conditions align favorably.
Analysis for Kotak Mahindra Bank - September 02, 2025
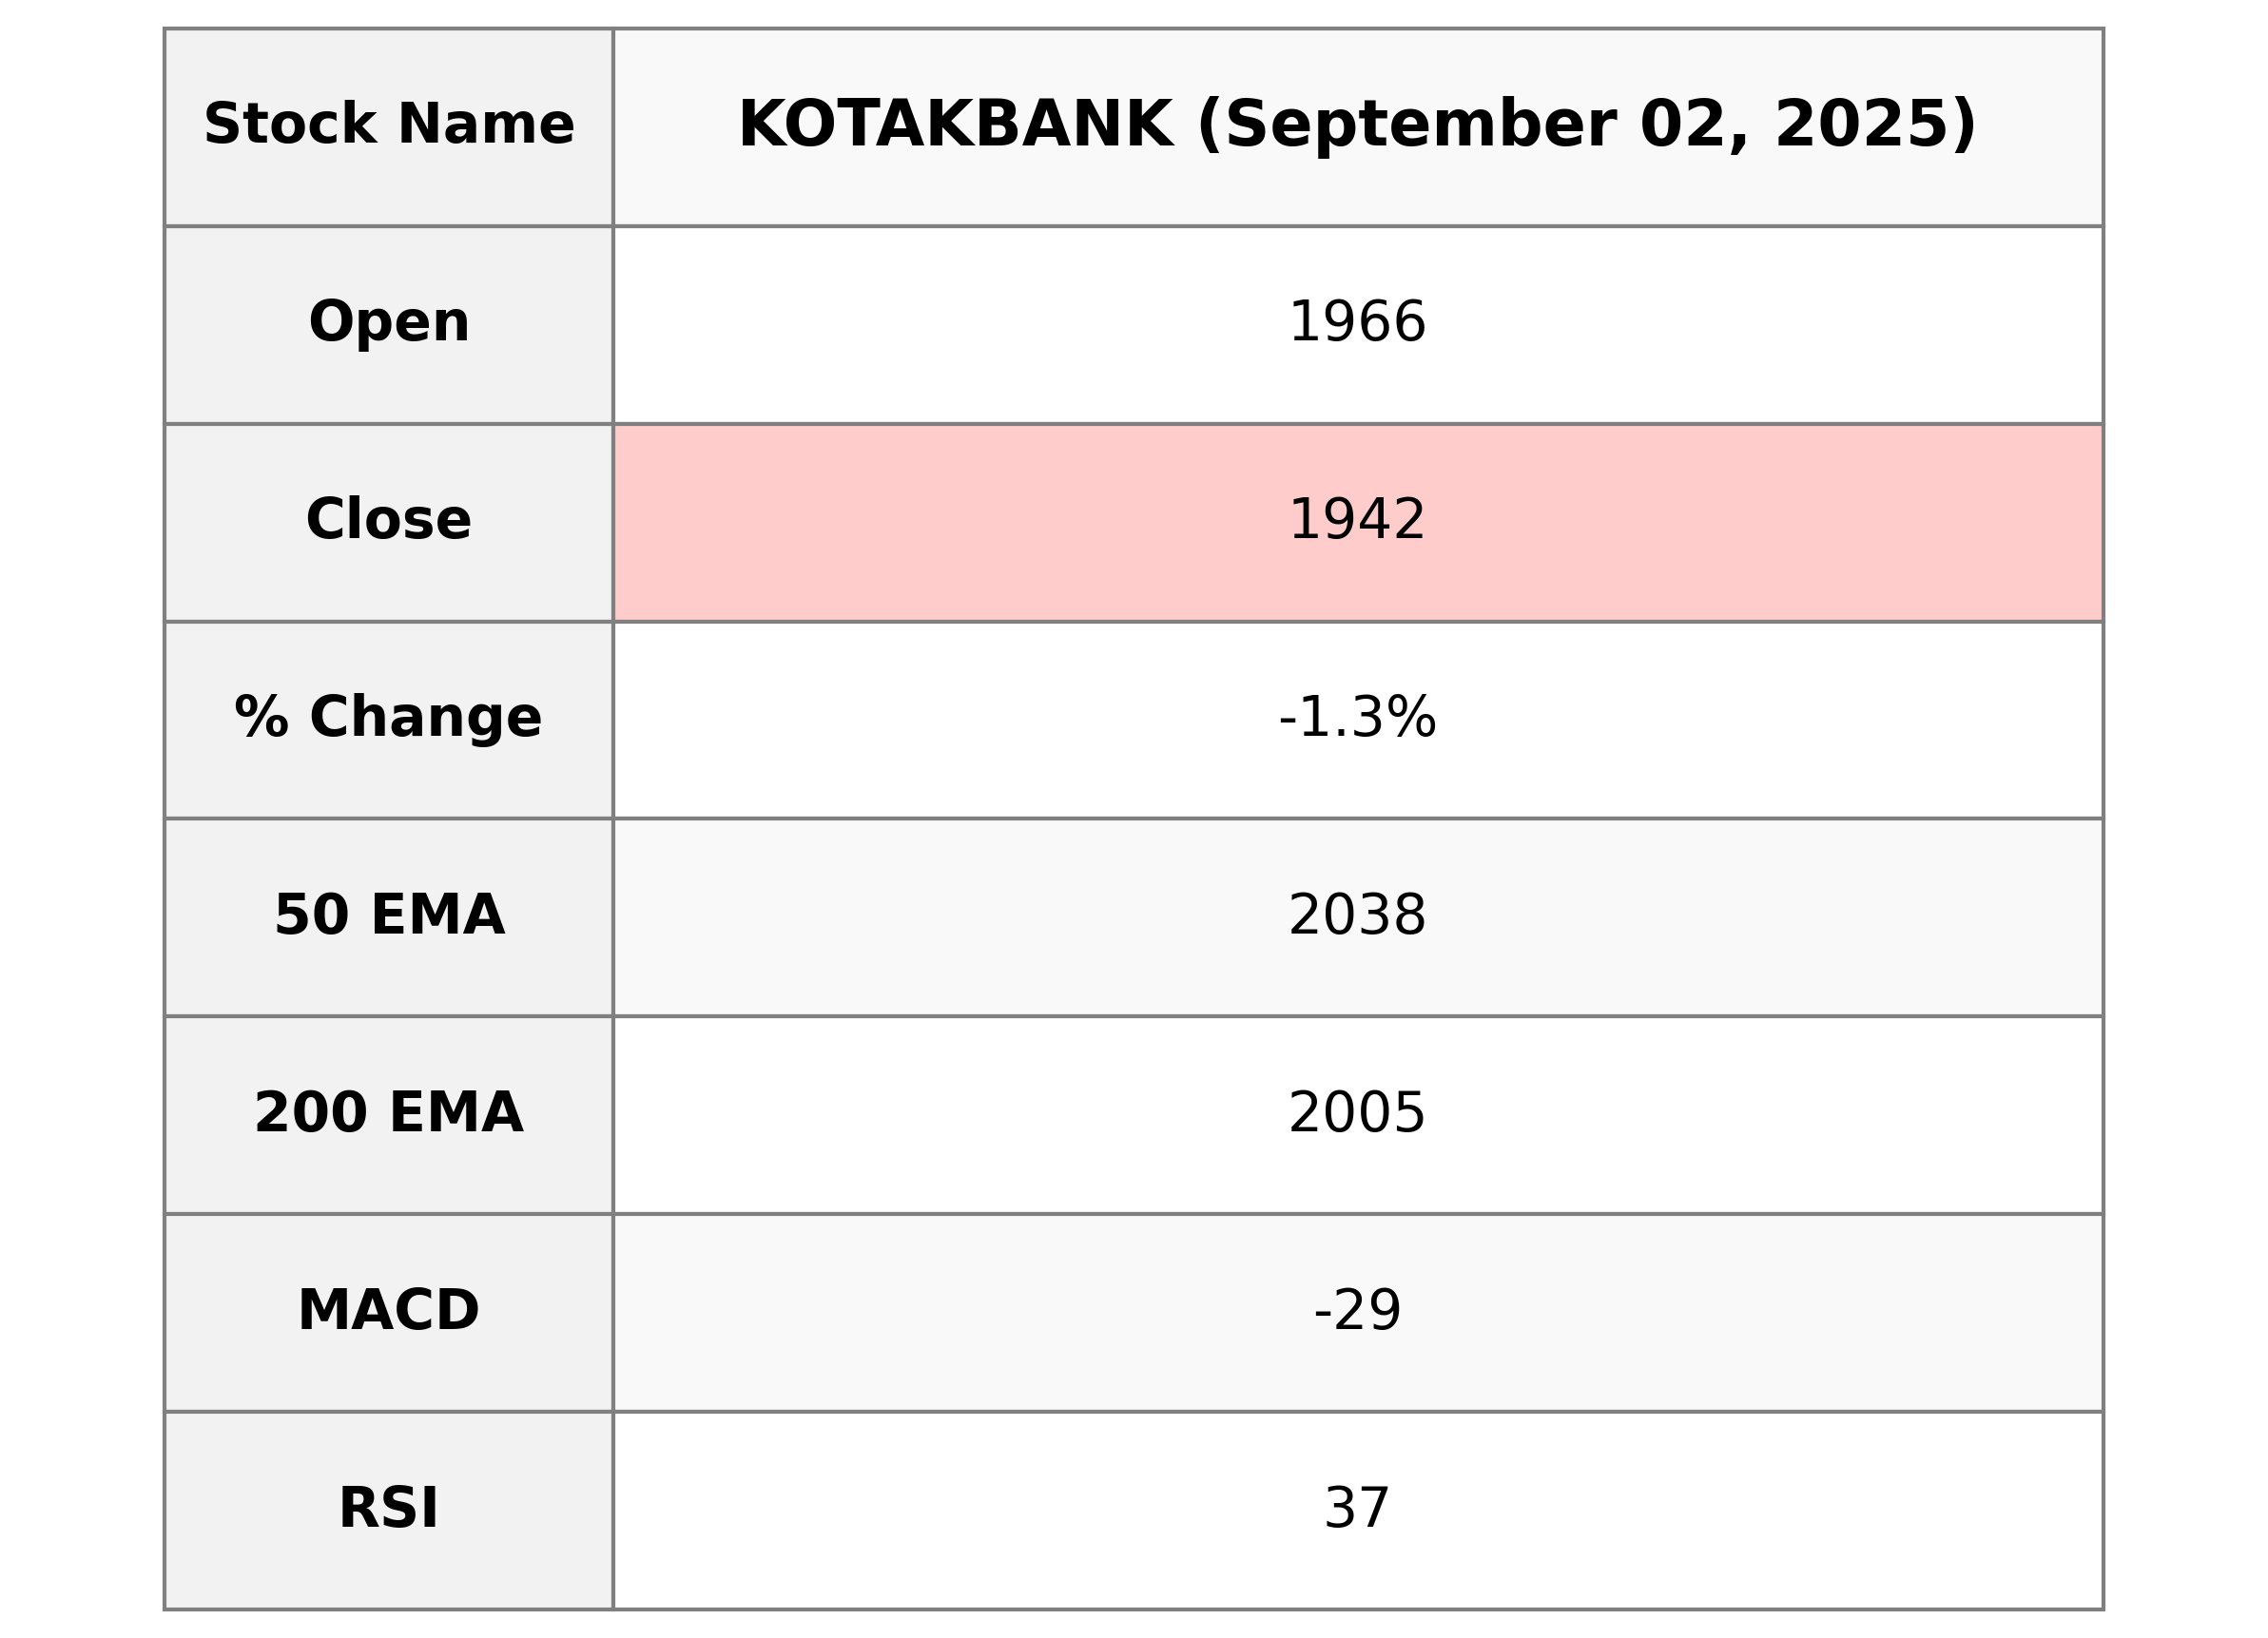
Kotak Mahindra Bank had a negative performance with a decrease of 1.33% in its stock price, closing at 1942.5 from a previous close of 1968.6. The stock showed significant volatility with a high of 1975.2 and a low of 1940.4, while trading a volume of 2,582,846 shares. The RSI indicates the stock may be nearing oversold territory at 36.64. As a major player in the financial services sector in India, the company's market cap stands at approximately 3.86 trillion INR.
Relationship with Key Moving Averages
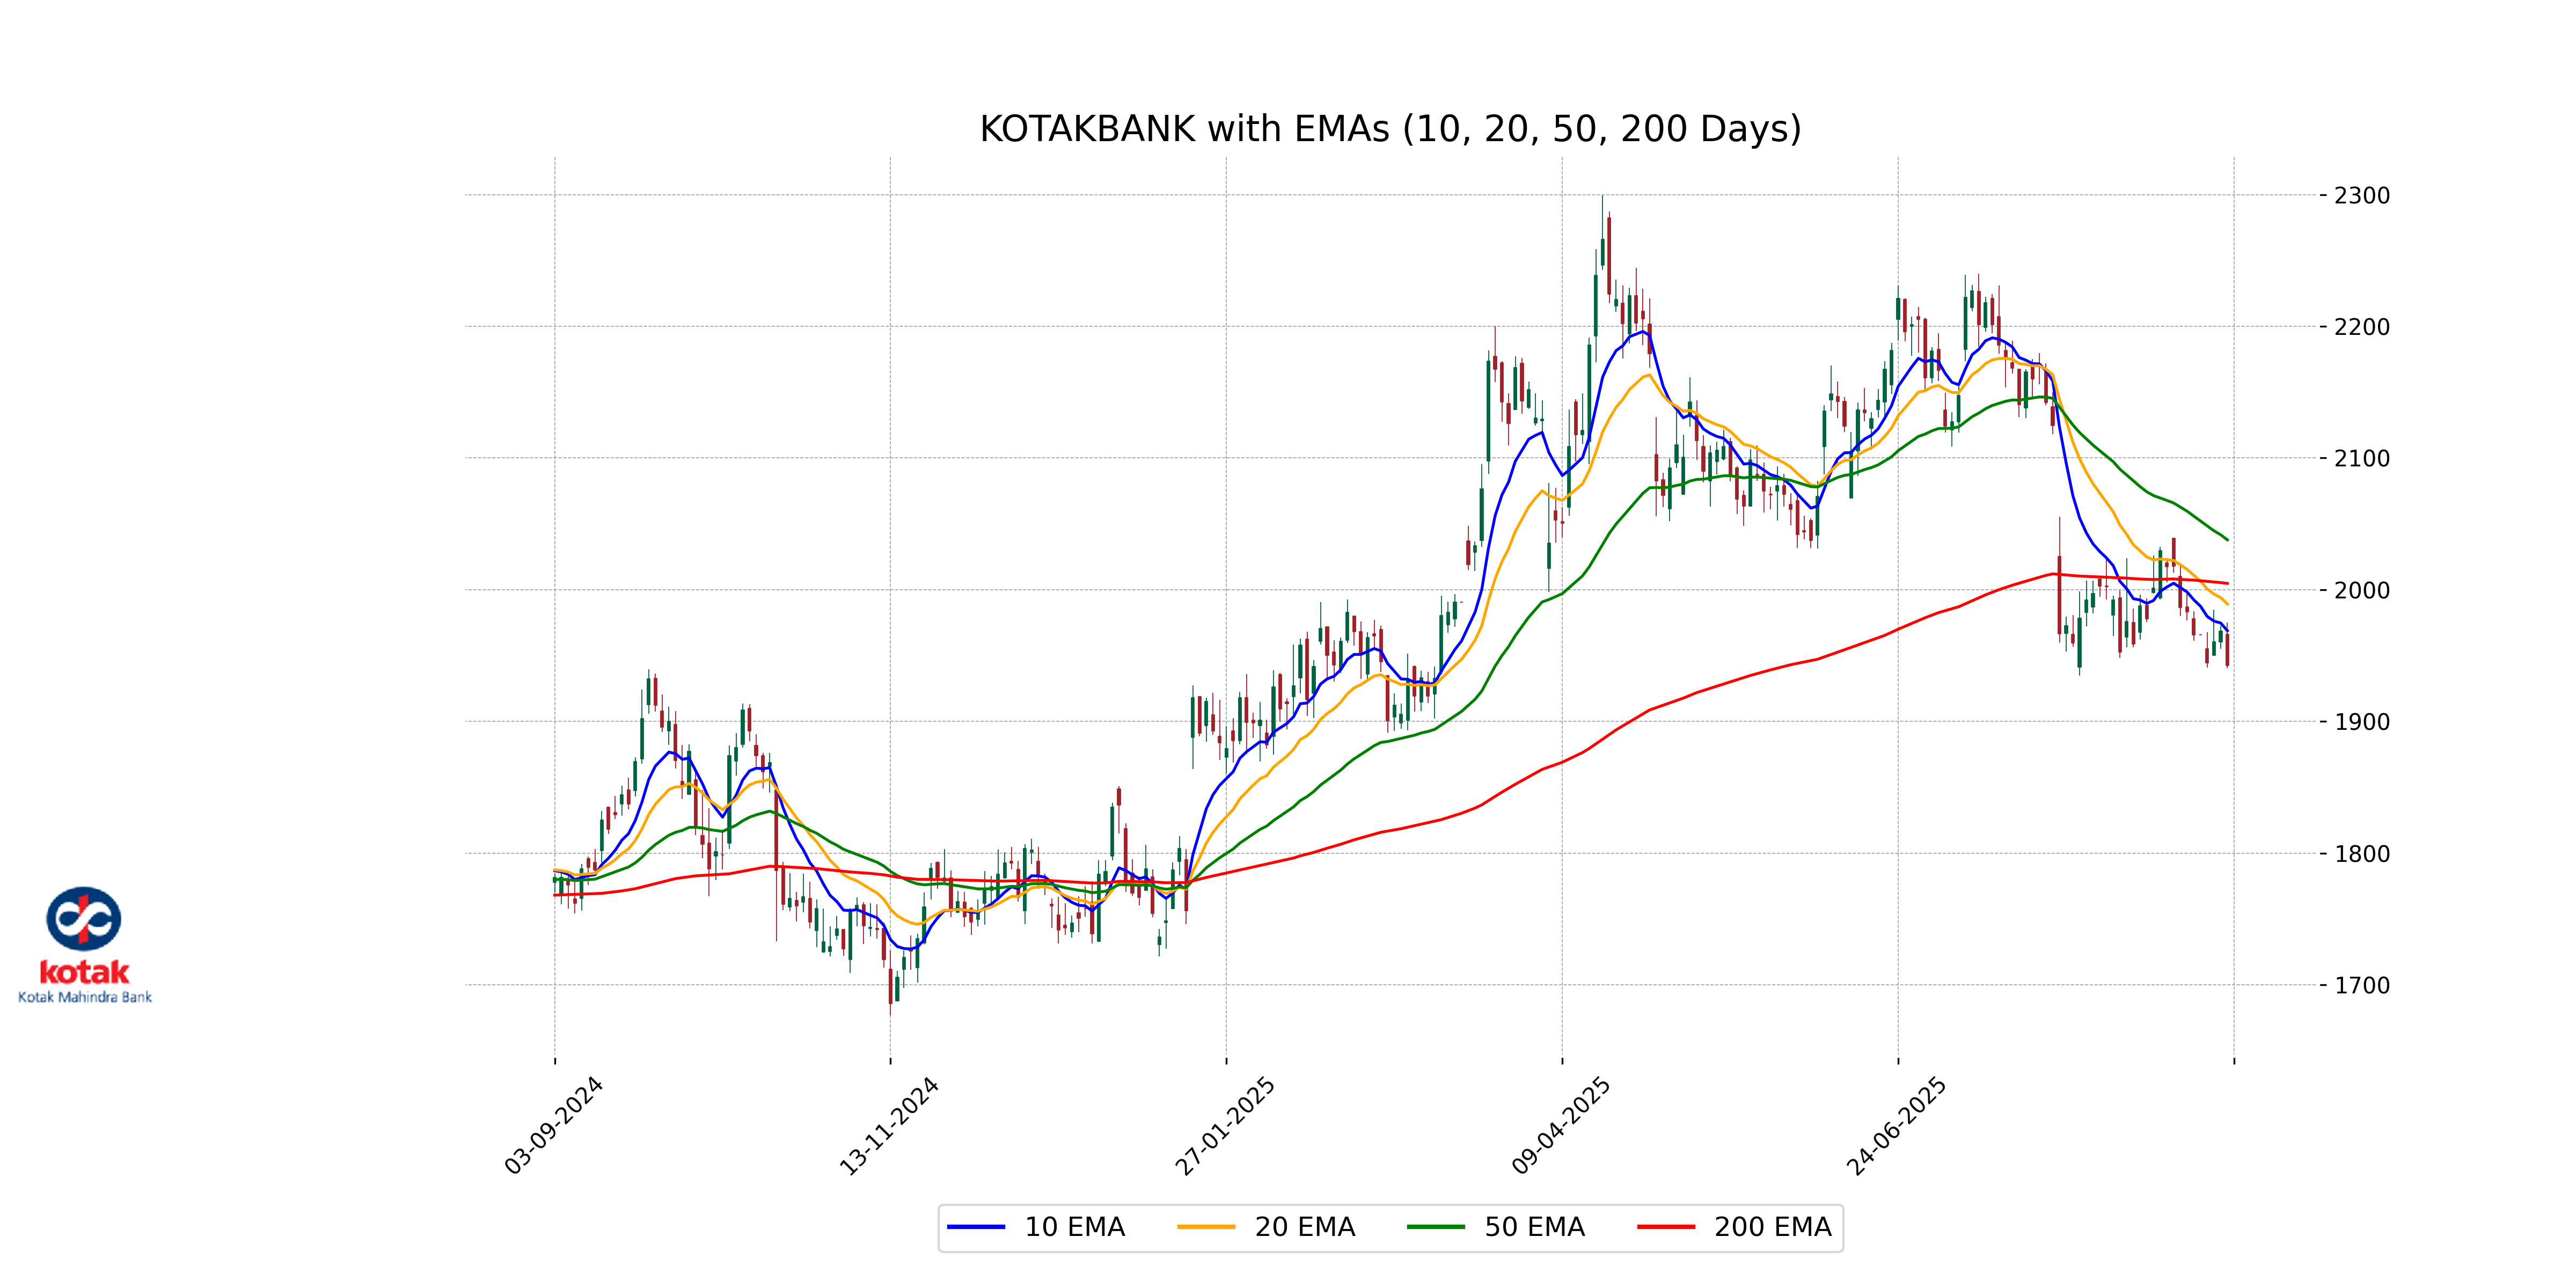
Kotak Mahindra Bank's closing price of 1942.5 is below the 10-day EMA of 1968.95, 20-day EMA of 1989.17, 50-day EMA of 2037.88, and the 200-day EMA of 2004.84, indicating a potential bearish trend. The stock's price movement suggests it is trading below significant moving averages.
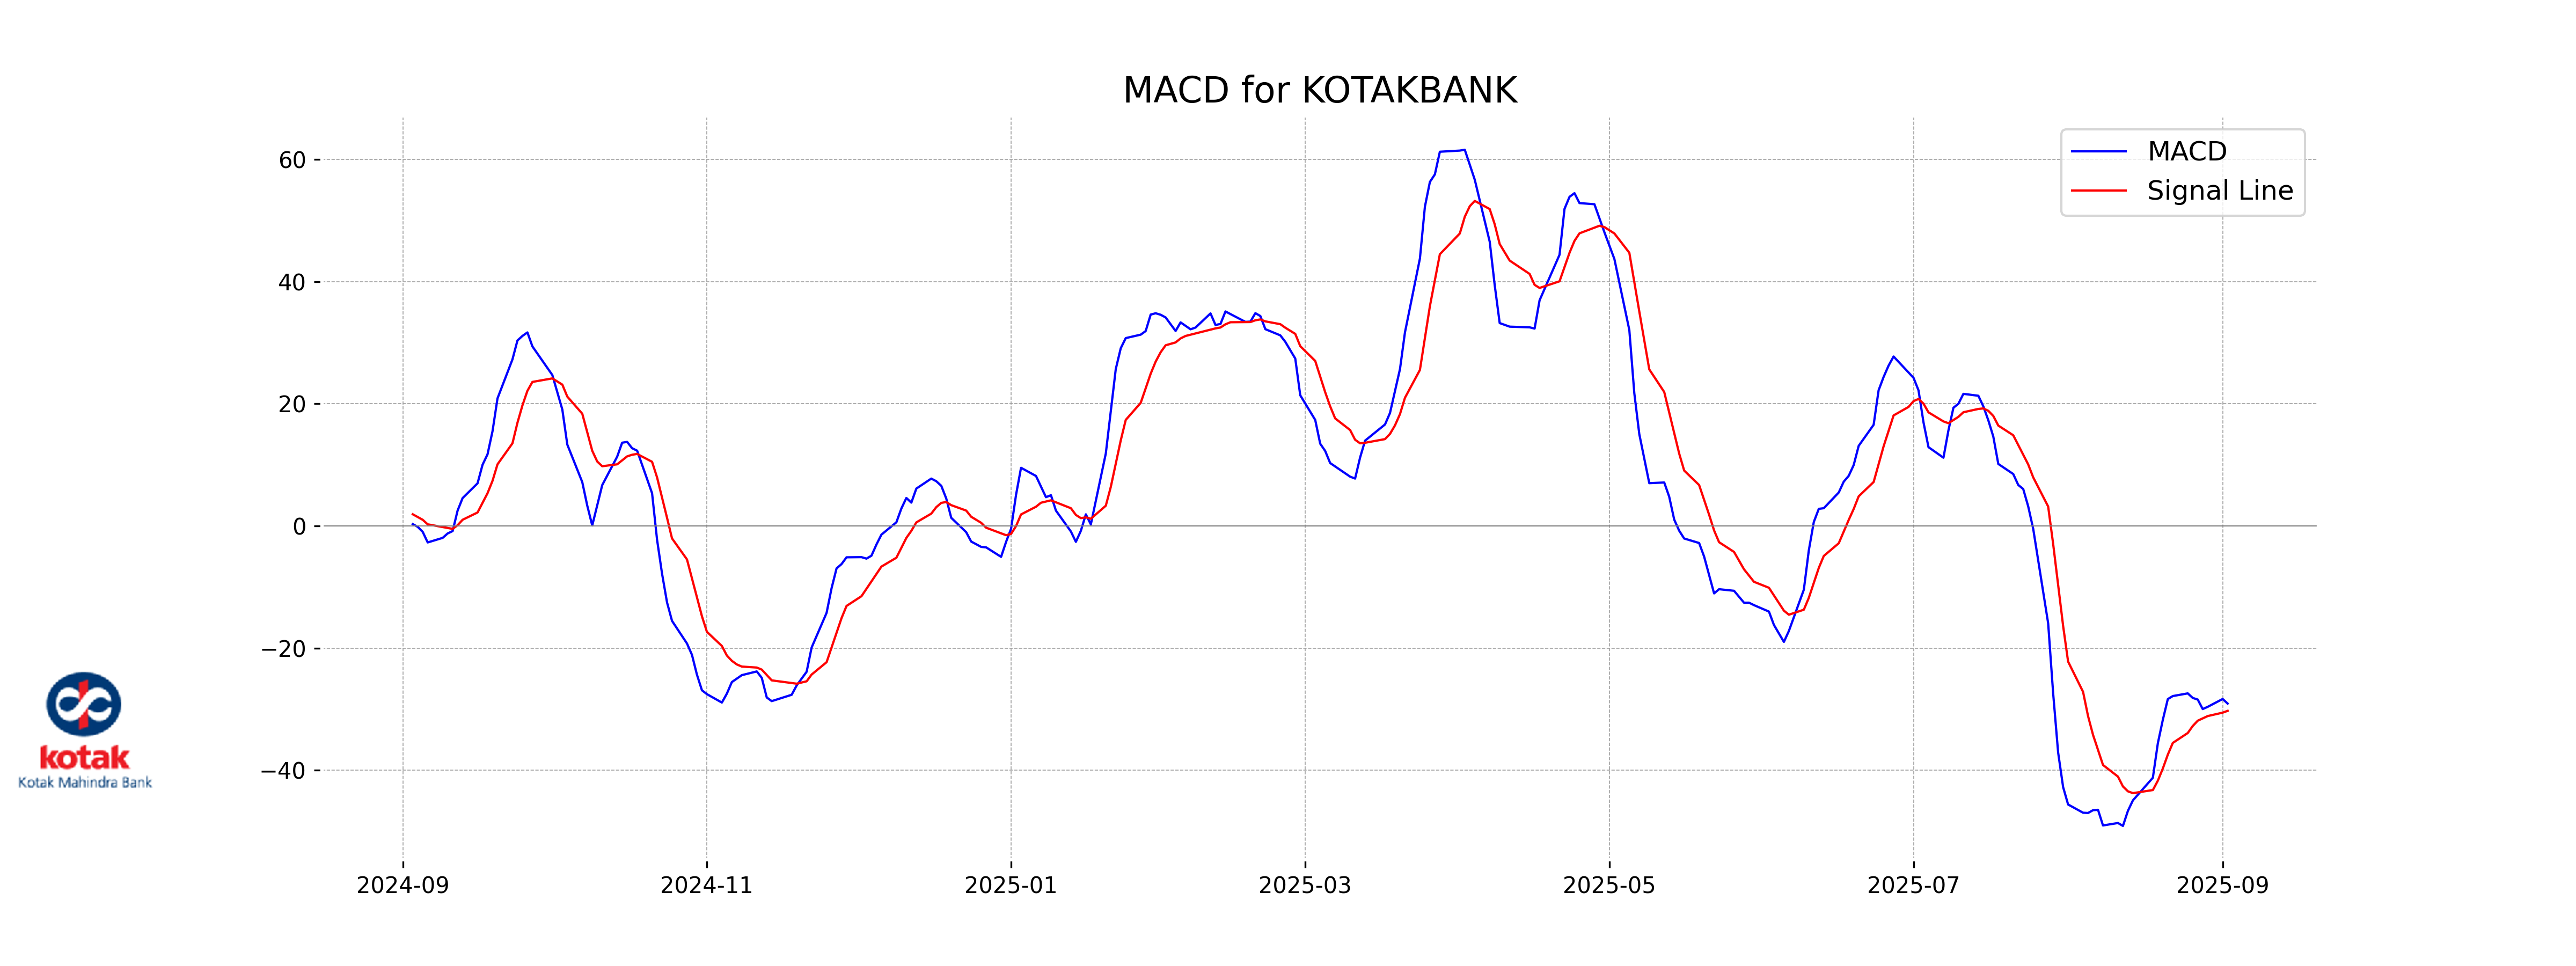
Moving Averages Trend (MACD)
Kotak Mahindra Bank MACD Analysis: The MACD for Kotak Mahindra Bank is currently at -29.08, with the MACD Signal at -30.27. This negative MACD value, along with it being below the signal line, indicates a bearish trend for the stock in the short term.
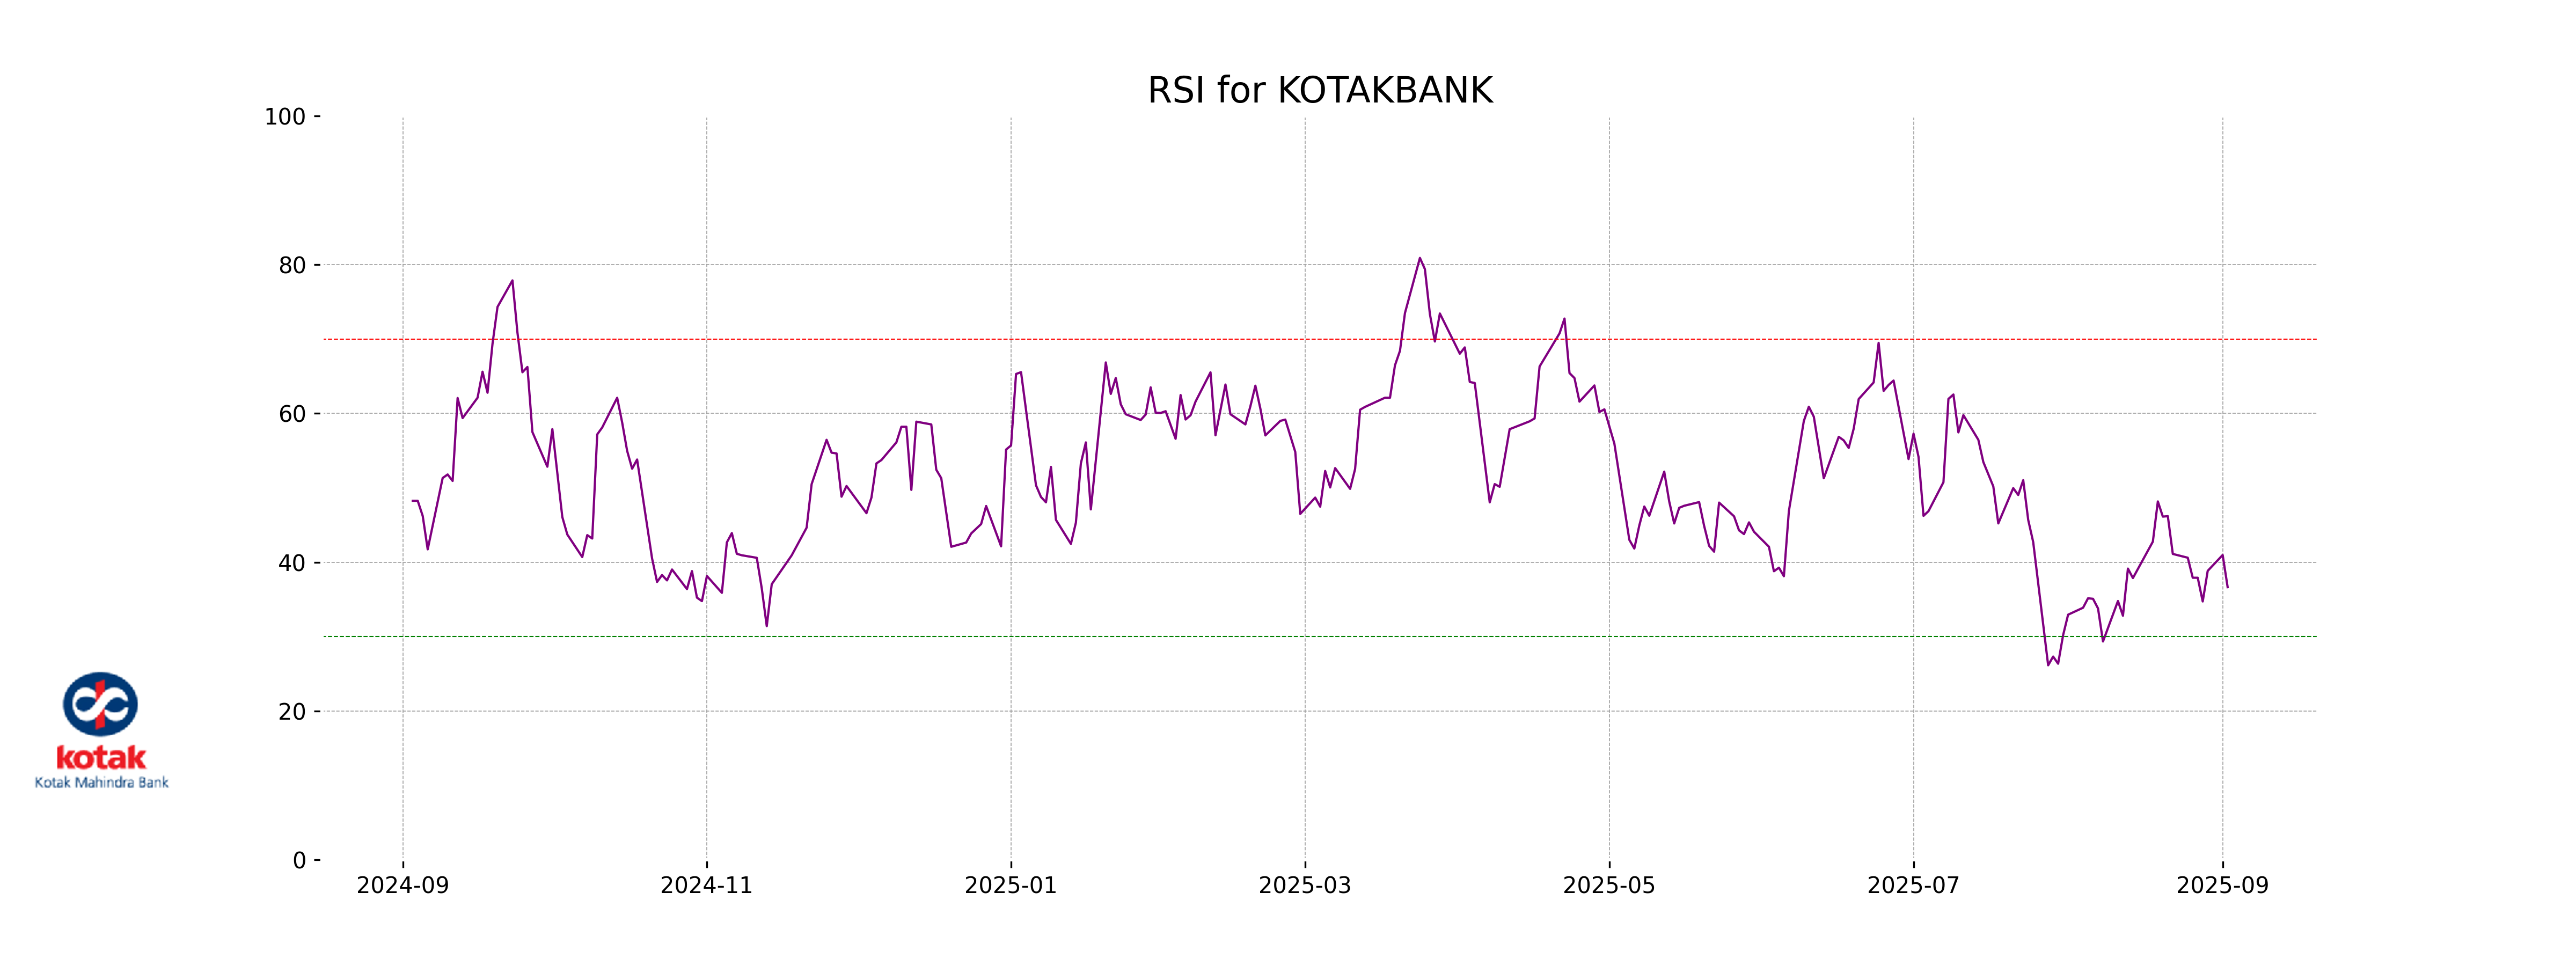
RSI Analysis
Kotak Mahindra Bank's RSI is 36.64, which indicates the stock is currently in the oversold territory. This suggests potential for a price correction or reversal if buying interest picks up.
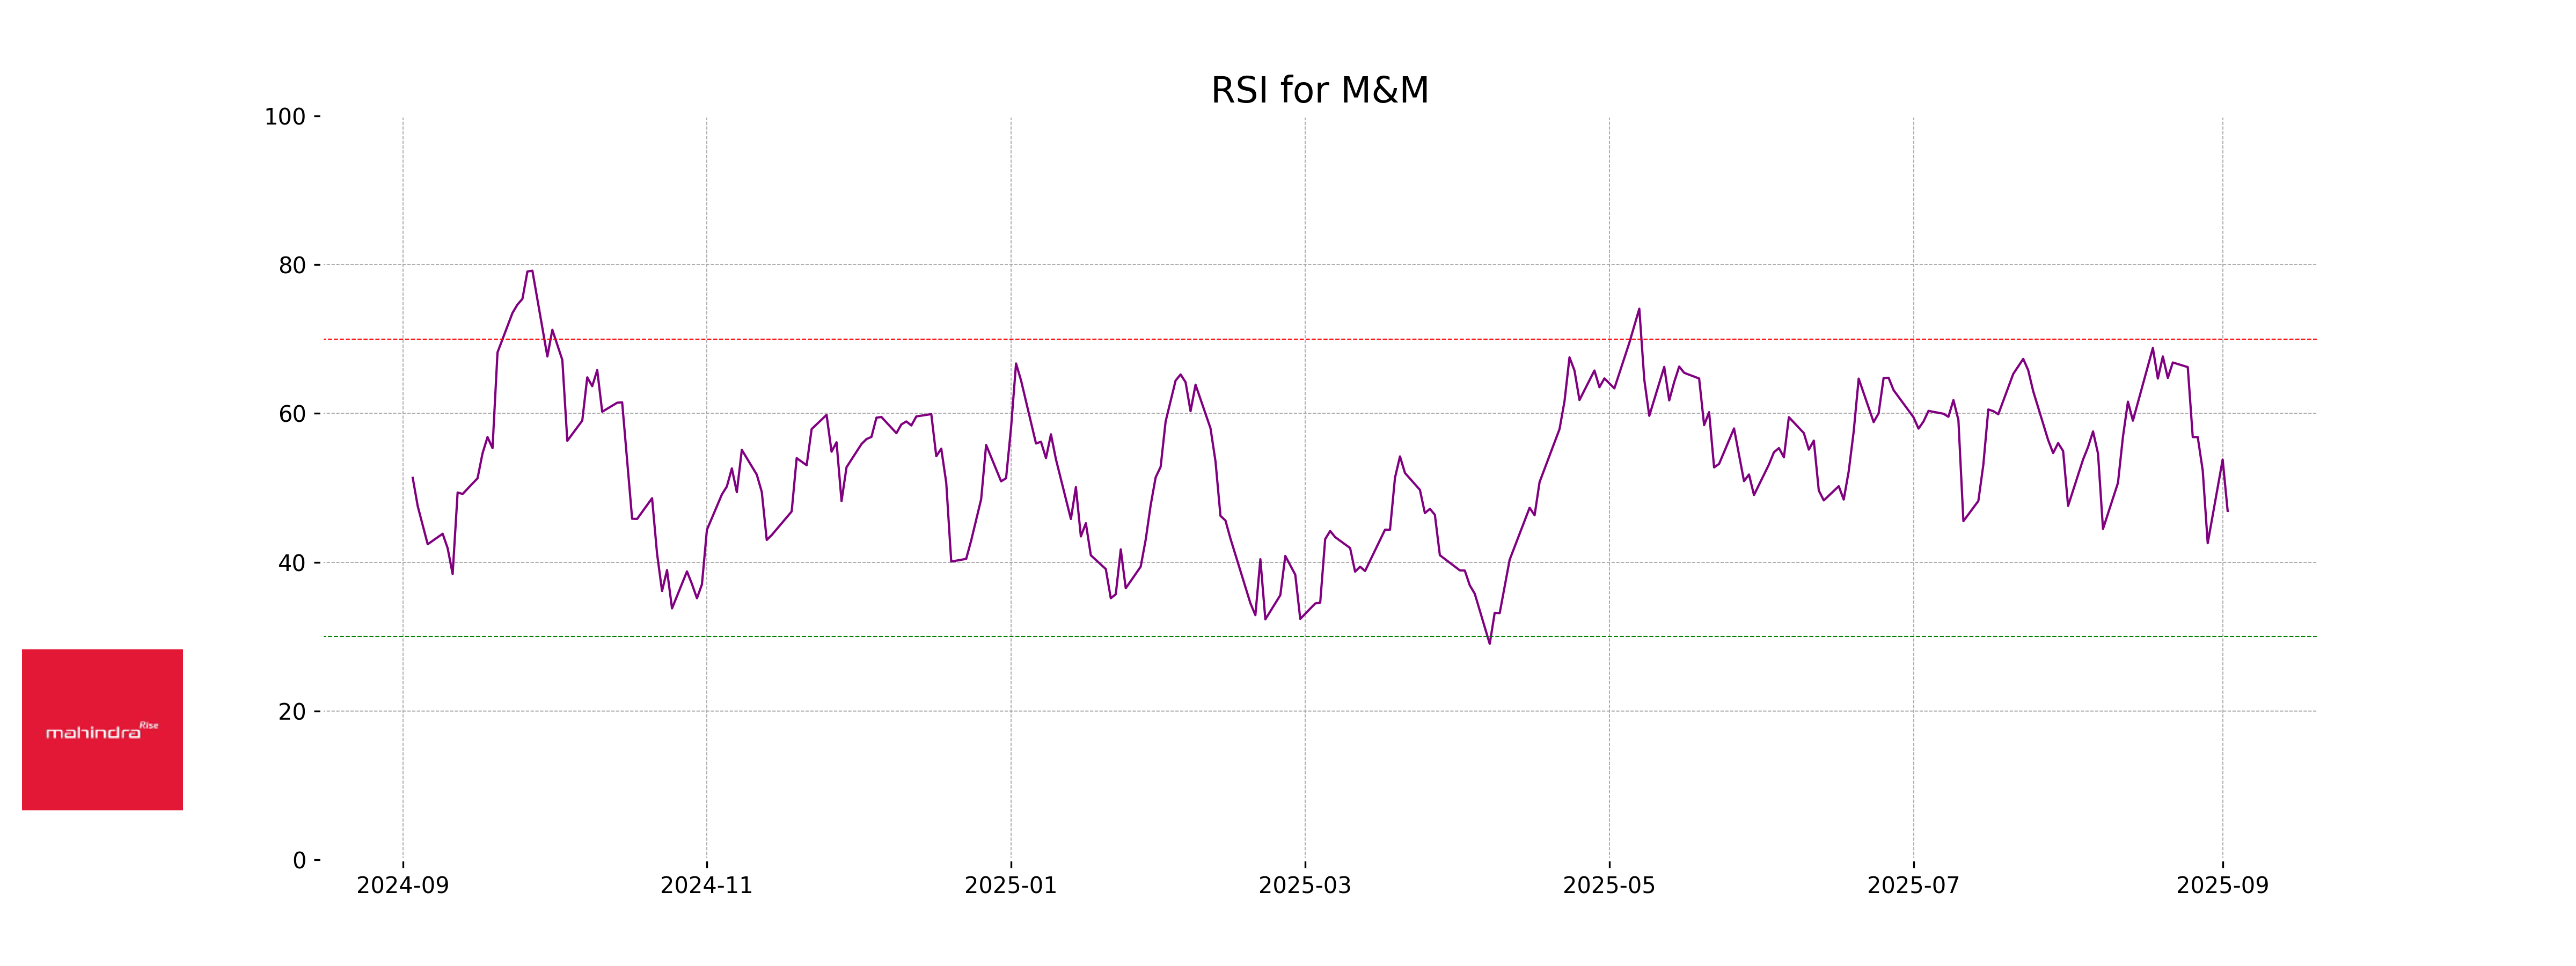
Analysis for Mahindra & Mahindra - September 02, 2025
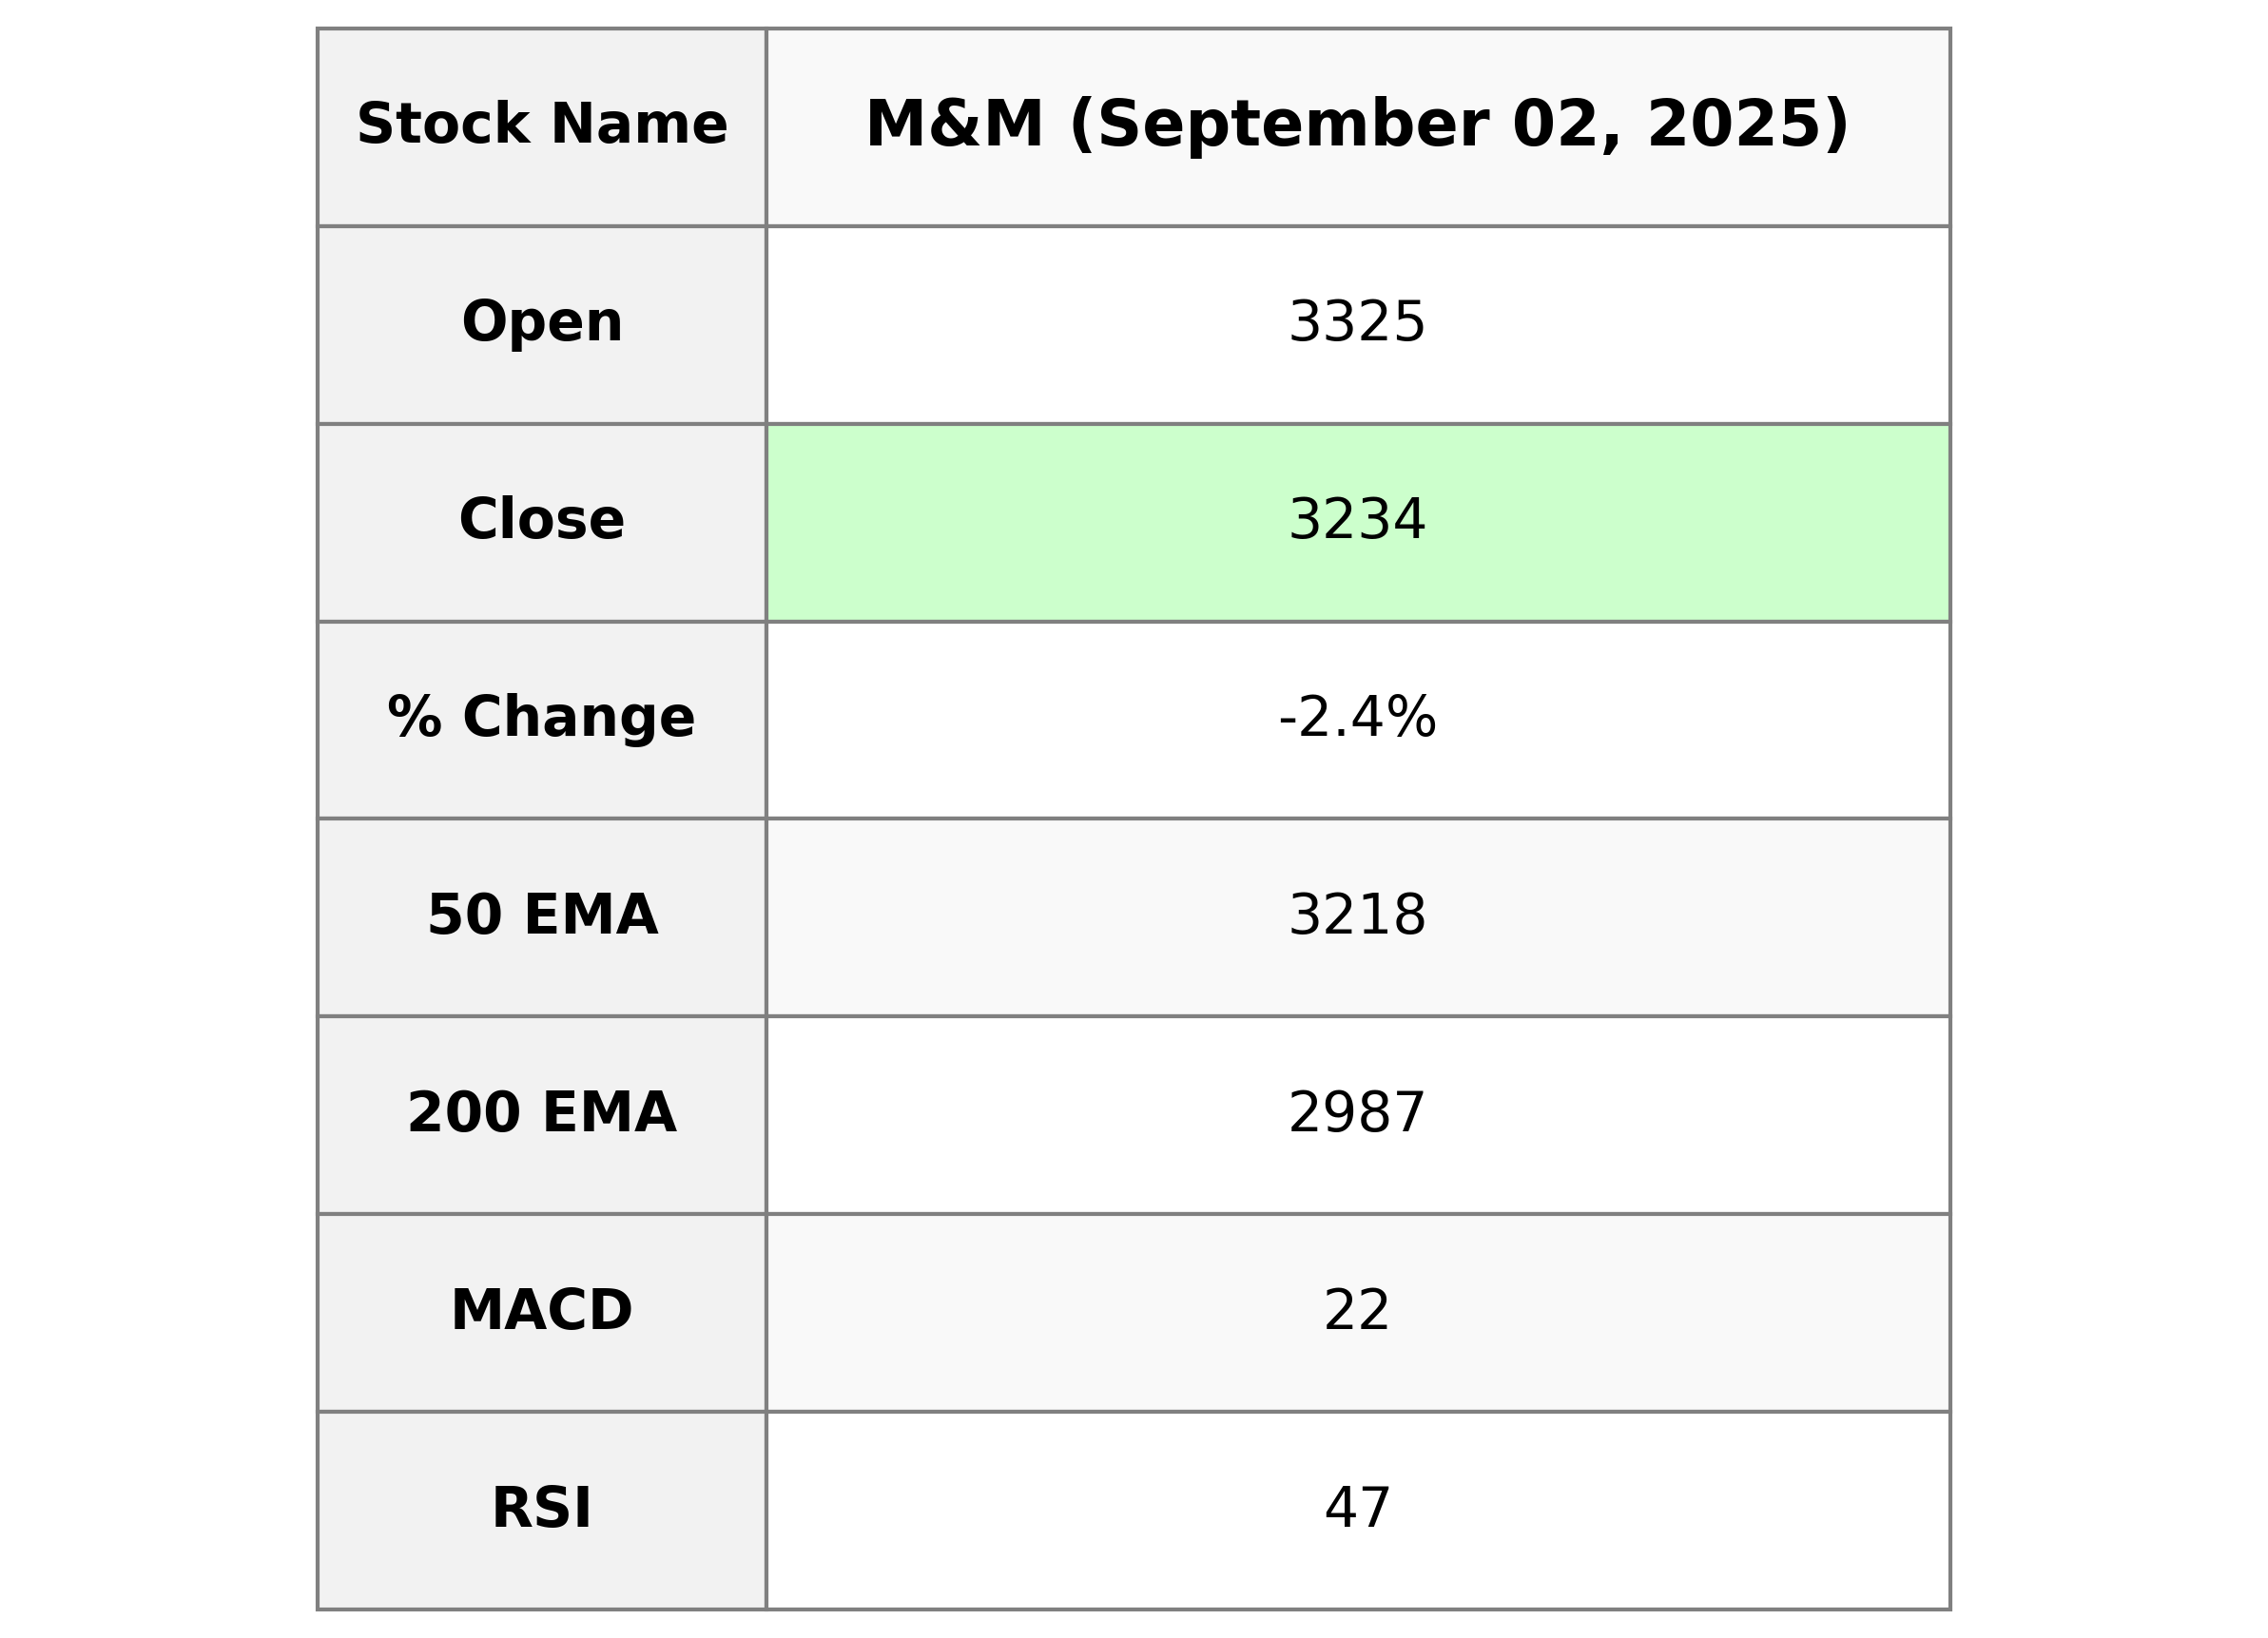
Mahindra & Mahindra Performance Overview: Mahindra & Mahindra experienced a decline of approximately 2.44% in its stock price, closing at 3234.5. The stock's trading volume was robust at 3,073,147, while its technical indicators, such as the 50-day EMA of 3218.33 and RSI of 46.90, suggest a mixed performance. The stock is valued with a PE Ratio of 26.51 in the Consumer Cyclical sector, specifically within the Auto Manufacturers industry in India.
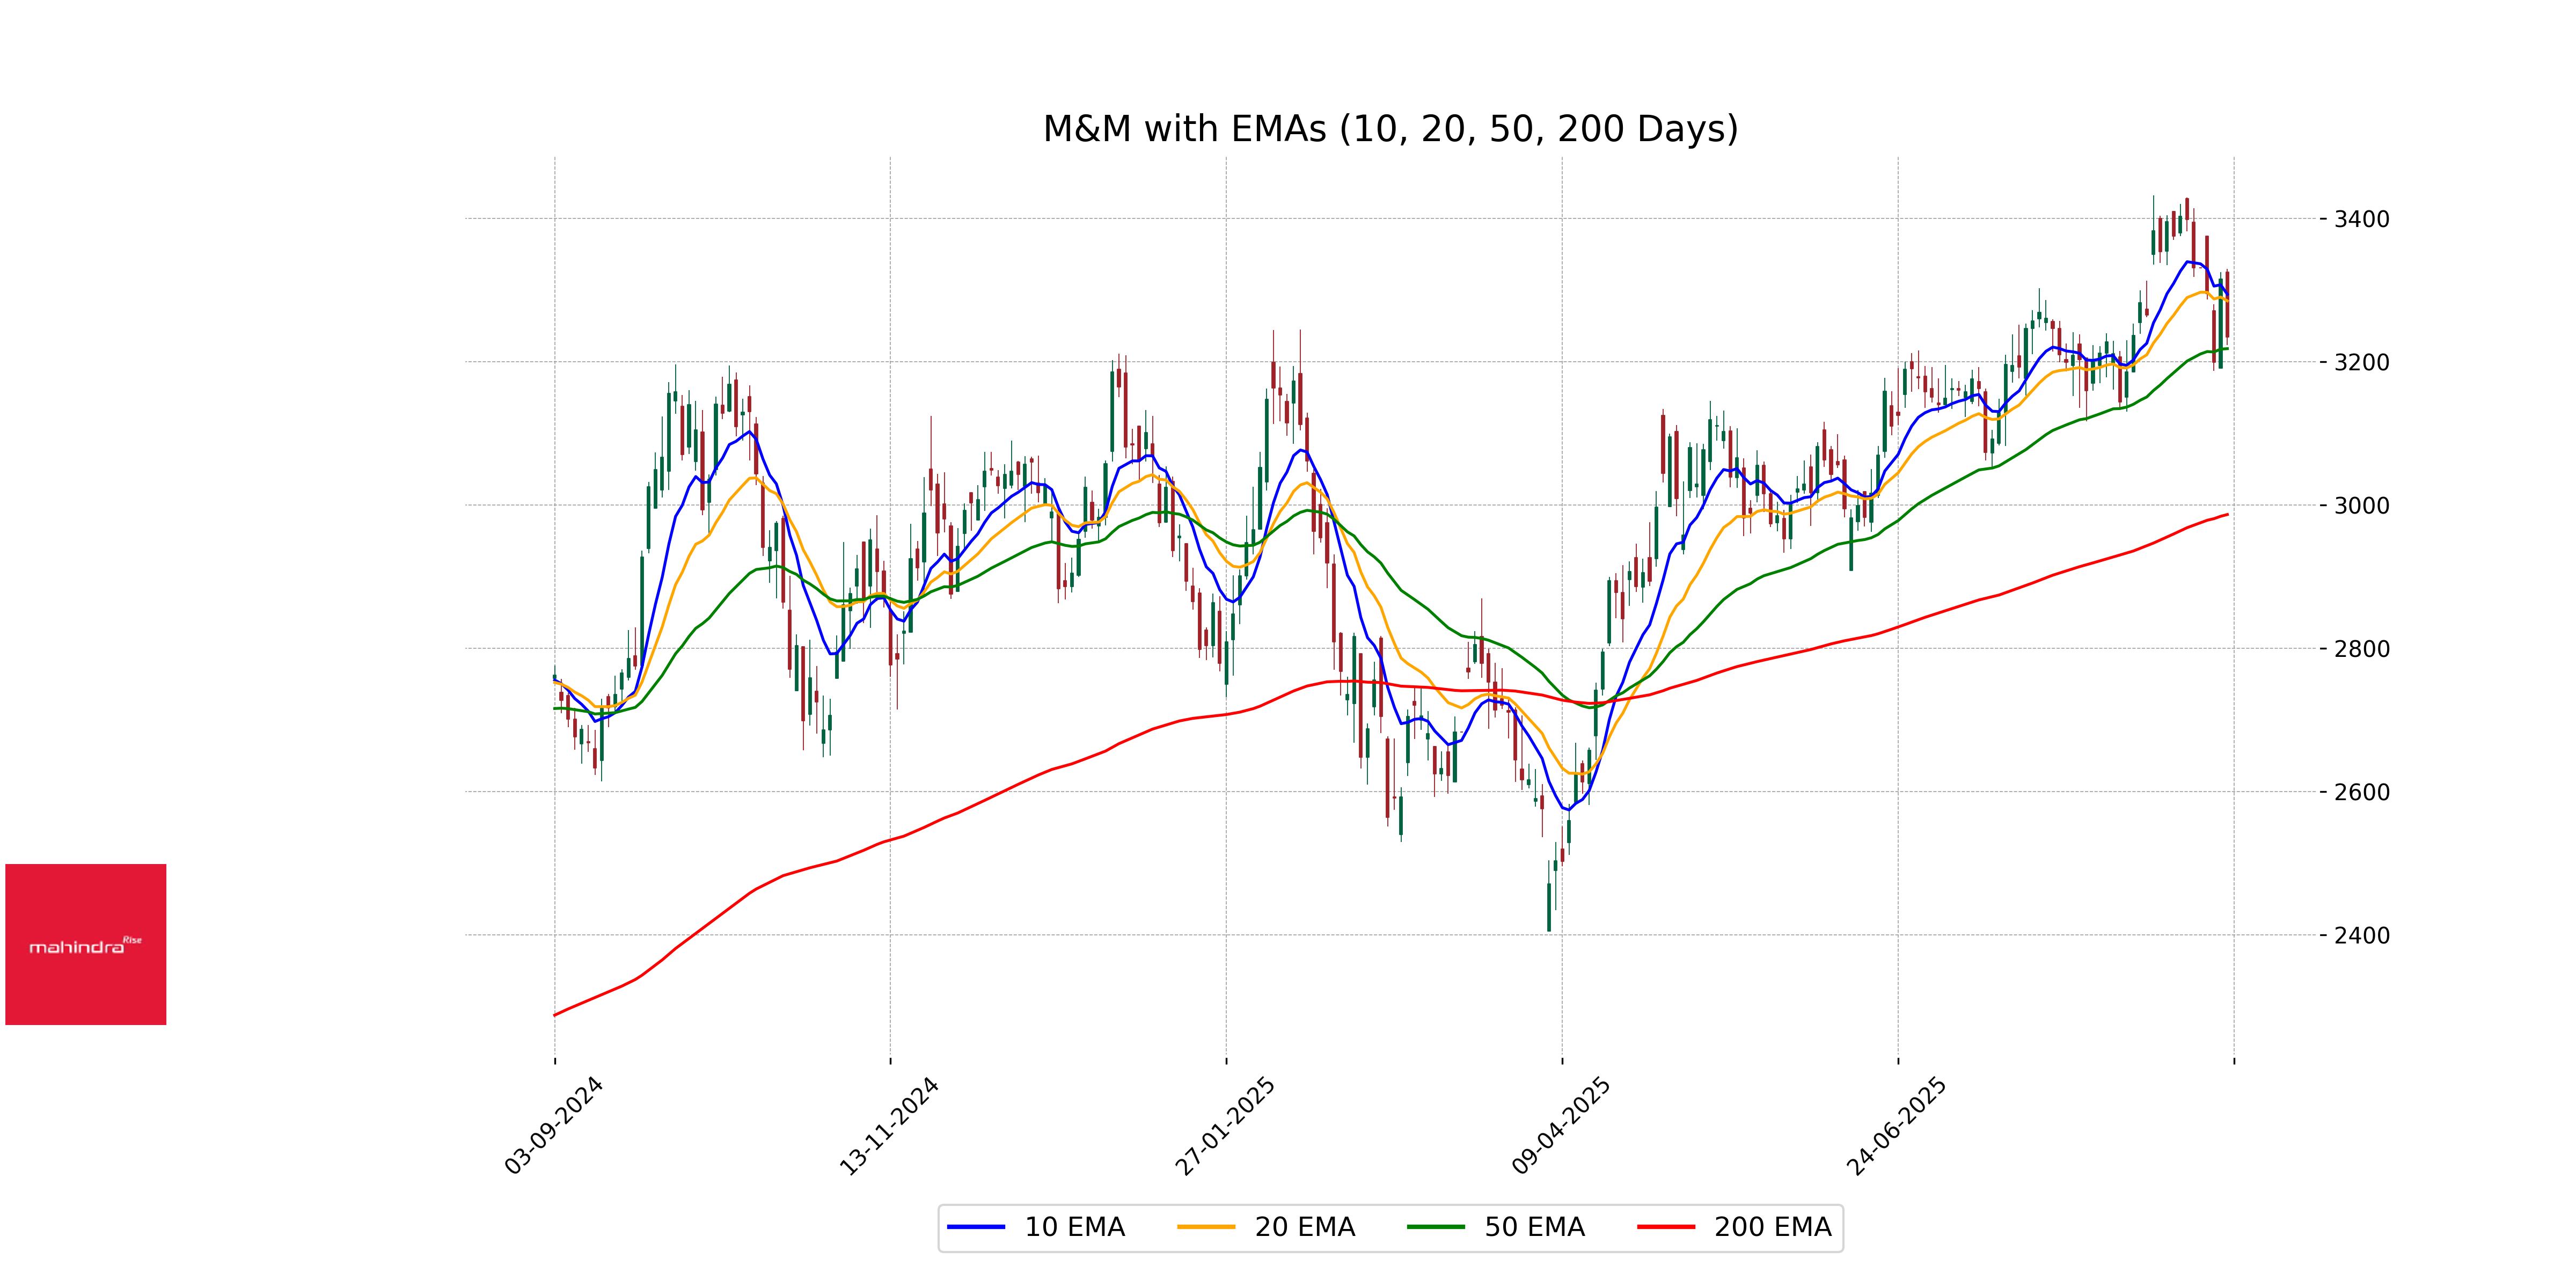
Relationship with Key Moving Averages
Mahindra & Mahindra's current stock price of 3234.5 is slightly above its 50-day EMA of 3218.33 and significantly above the 200-day EMA of 2986.85. However, it is below the 10-day EMA of 3294.14 and the 20-day EMA of 3284.98, suggesting recent downward momentum compared to its shorter-term averages.
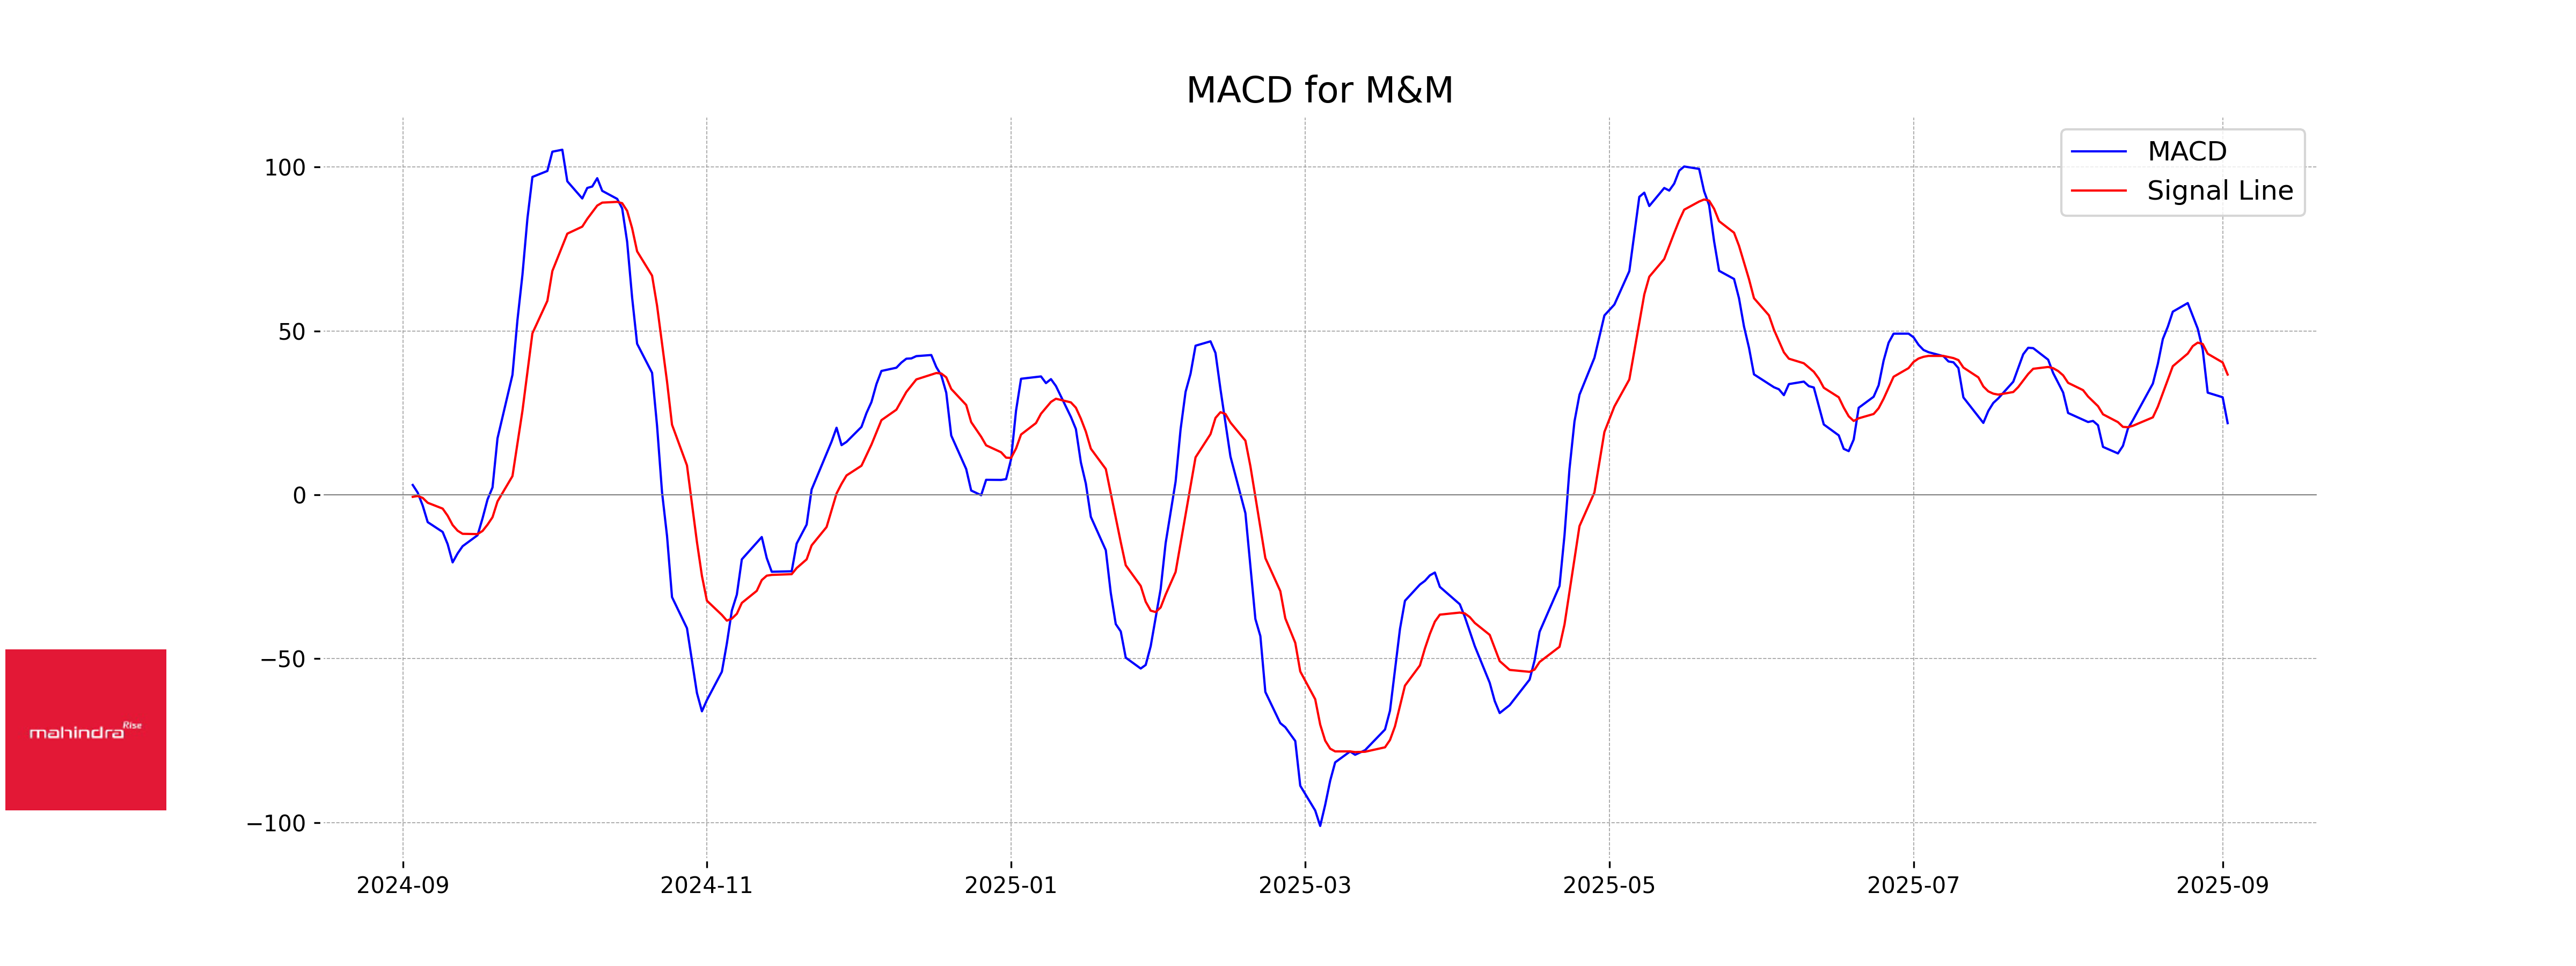
Moving Averages Trend (MACD)
### MACD Analysis for Mahindra & Mahindra The MACD value for Mahindra & Mahindra is 21.89, which is below the MACD signal line of 36.70. This suggests a bearish momentum as the MACD line is below the signal line, indicating a potential downward trend in the stock price. However, further analysis should consider additional indicators to confirm this trend.
RSI Analysis
Mahindra & Mahindra has an RSI of 46.90, indicating a neutral momentum as it lies neither in overbought nor oversold territory. Being close to the midpoint, it suggests that investors may be cautious, and the stock might need a catalyst to define a clearer trend direction.