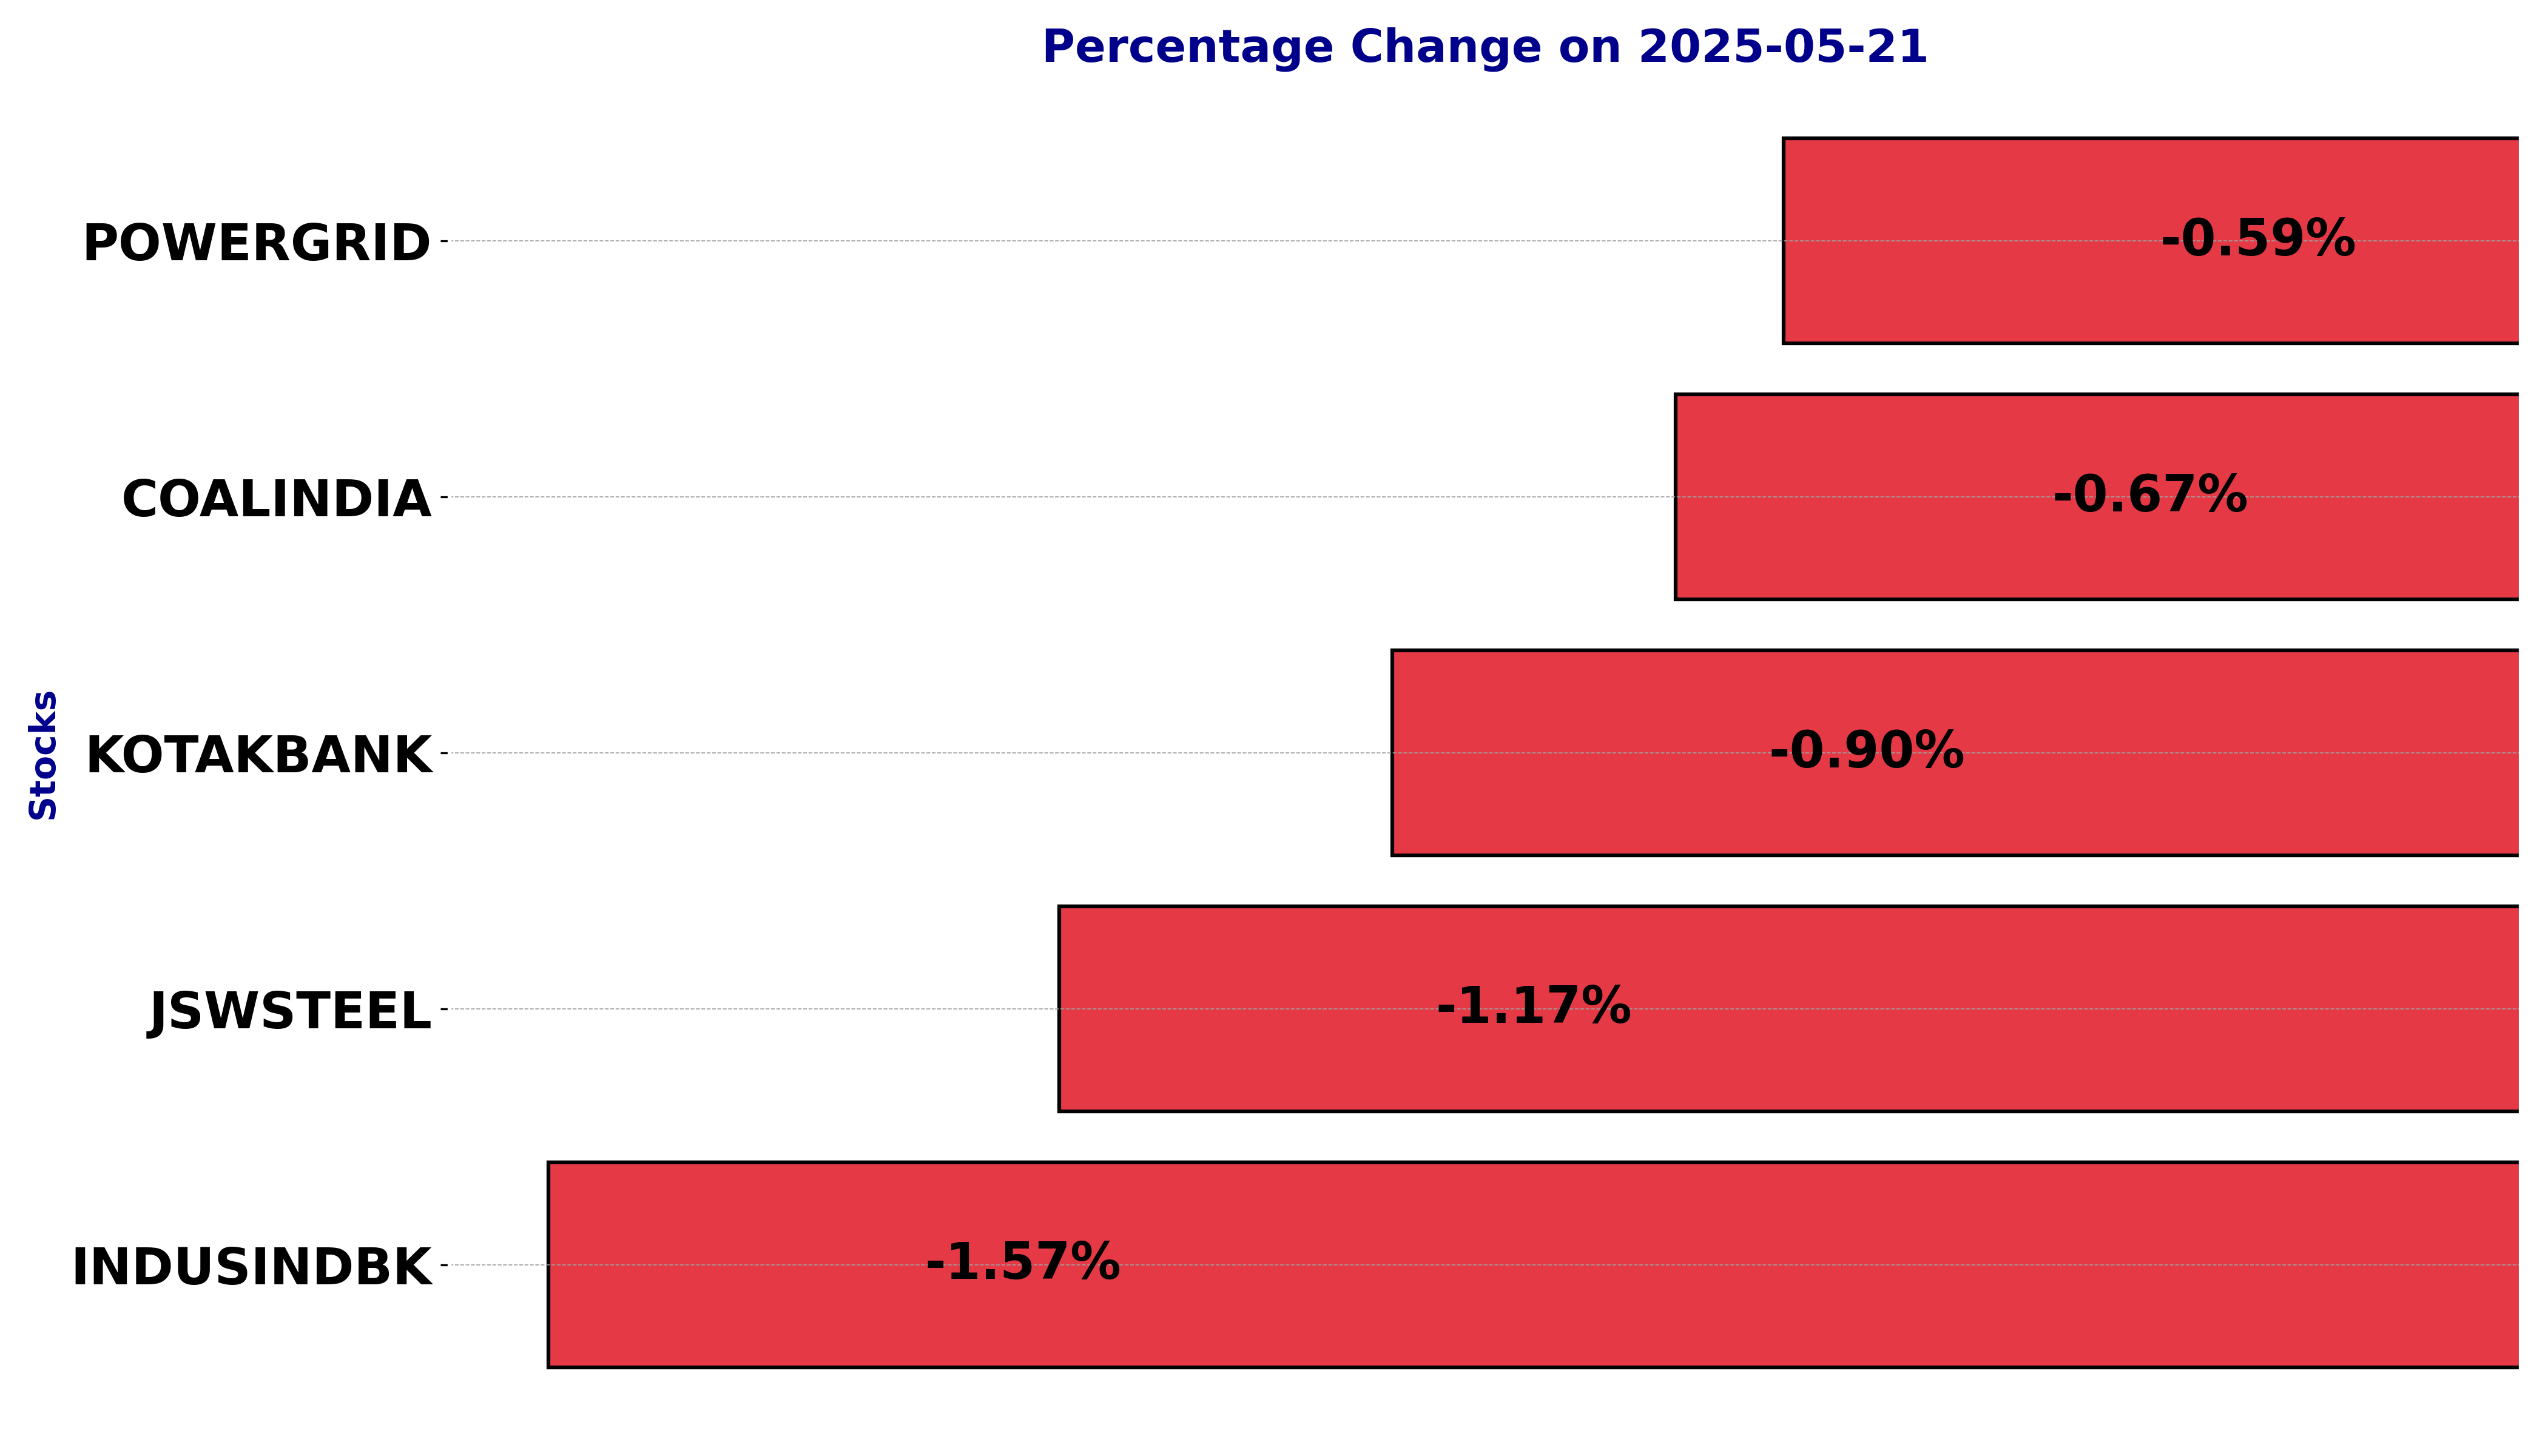
NSE Nifty 50: Top 5 stock losers of May 21, 2025
In this article, we will explore the technical indicators of some of the low-performing stocks on the Indian stock market, including COALINDIA, INDUSINDBK, JSWSTEEL, KOTAKBANK, and POWERGRID.
By looking at these stocks through the lens of key technical factors, we aim to better understand their price movements, trends, and potential future performance.
Analysis for Coal India - May 21, 2025
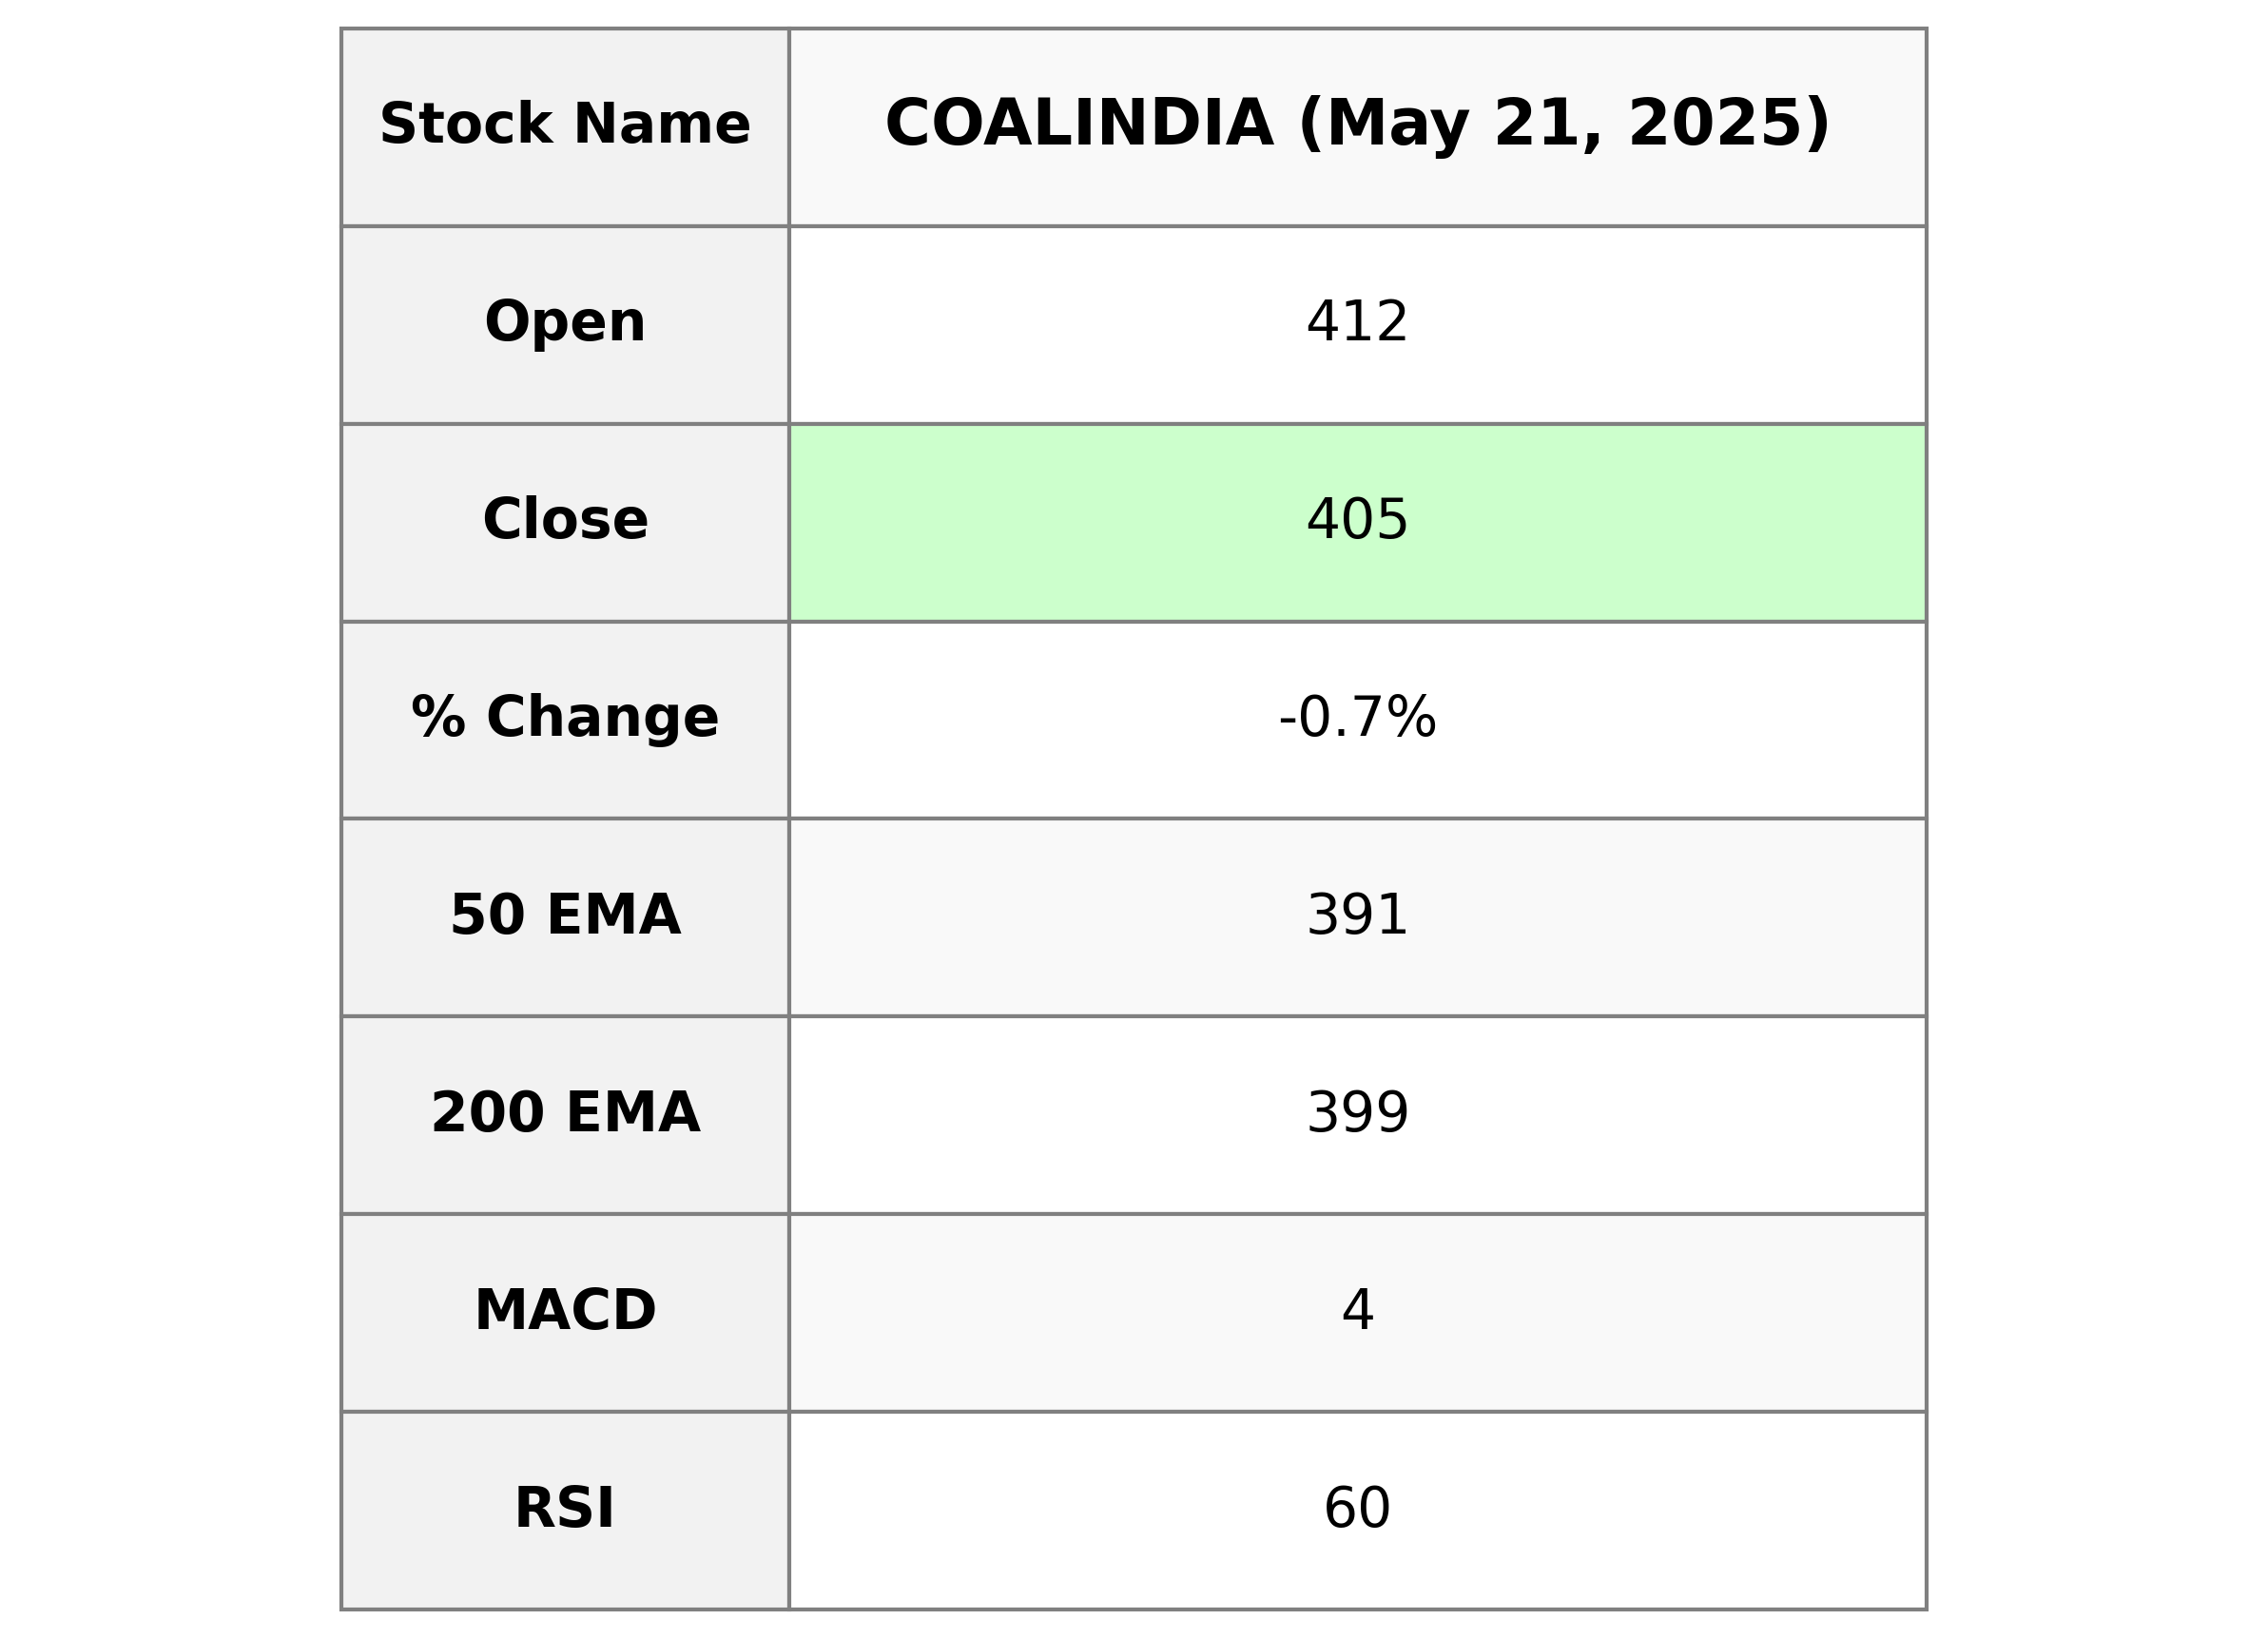
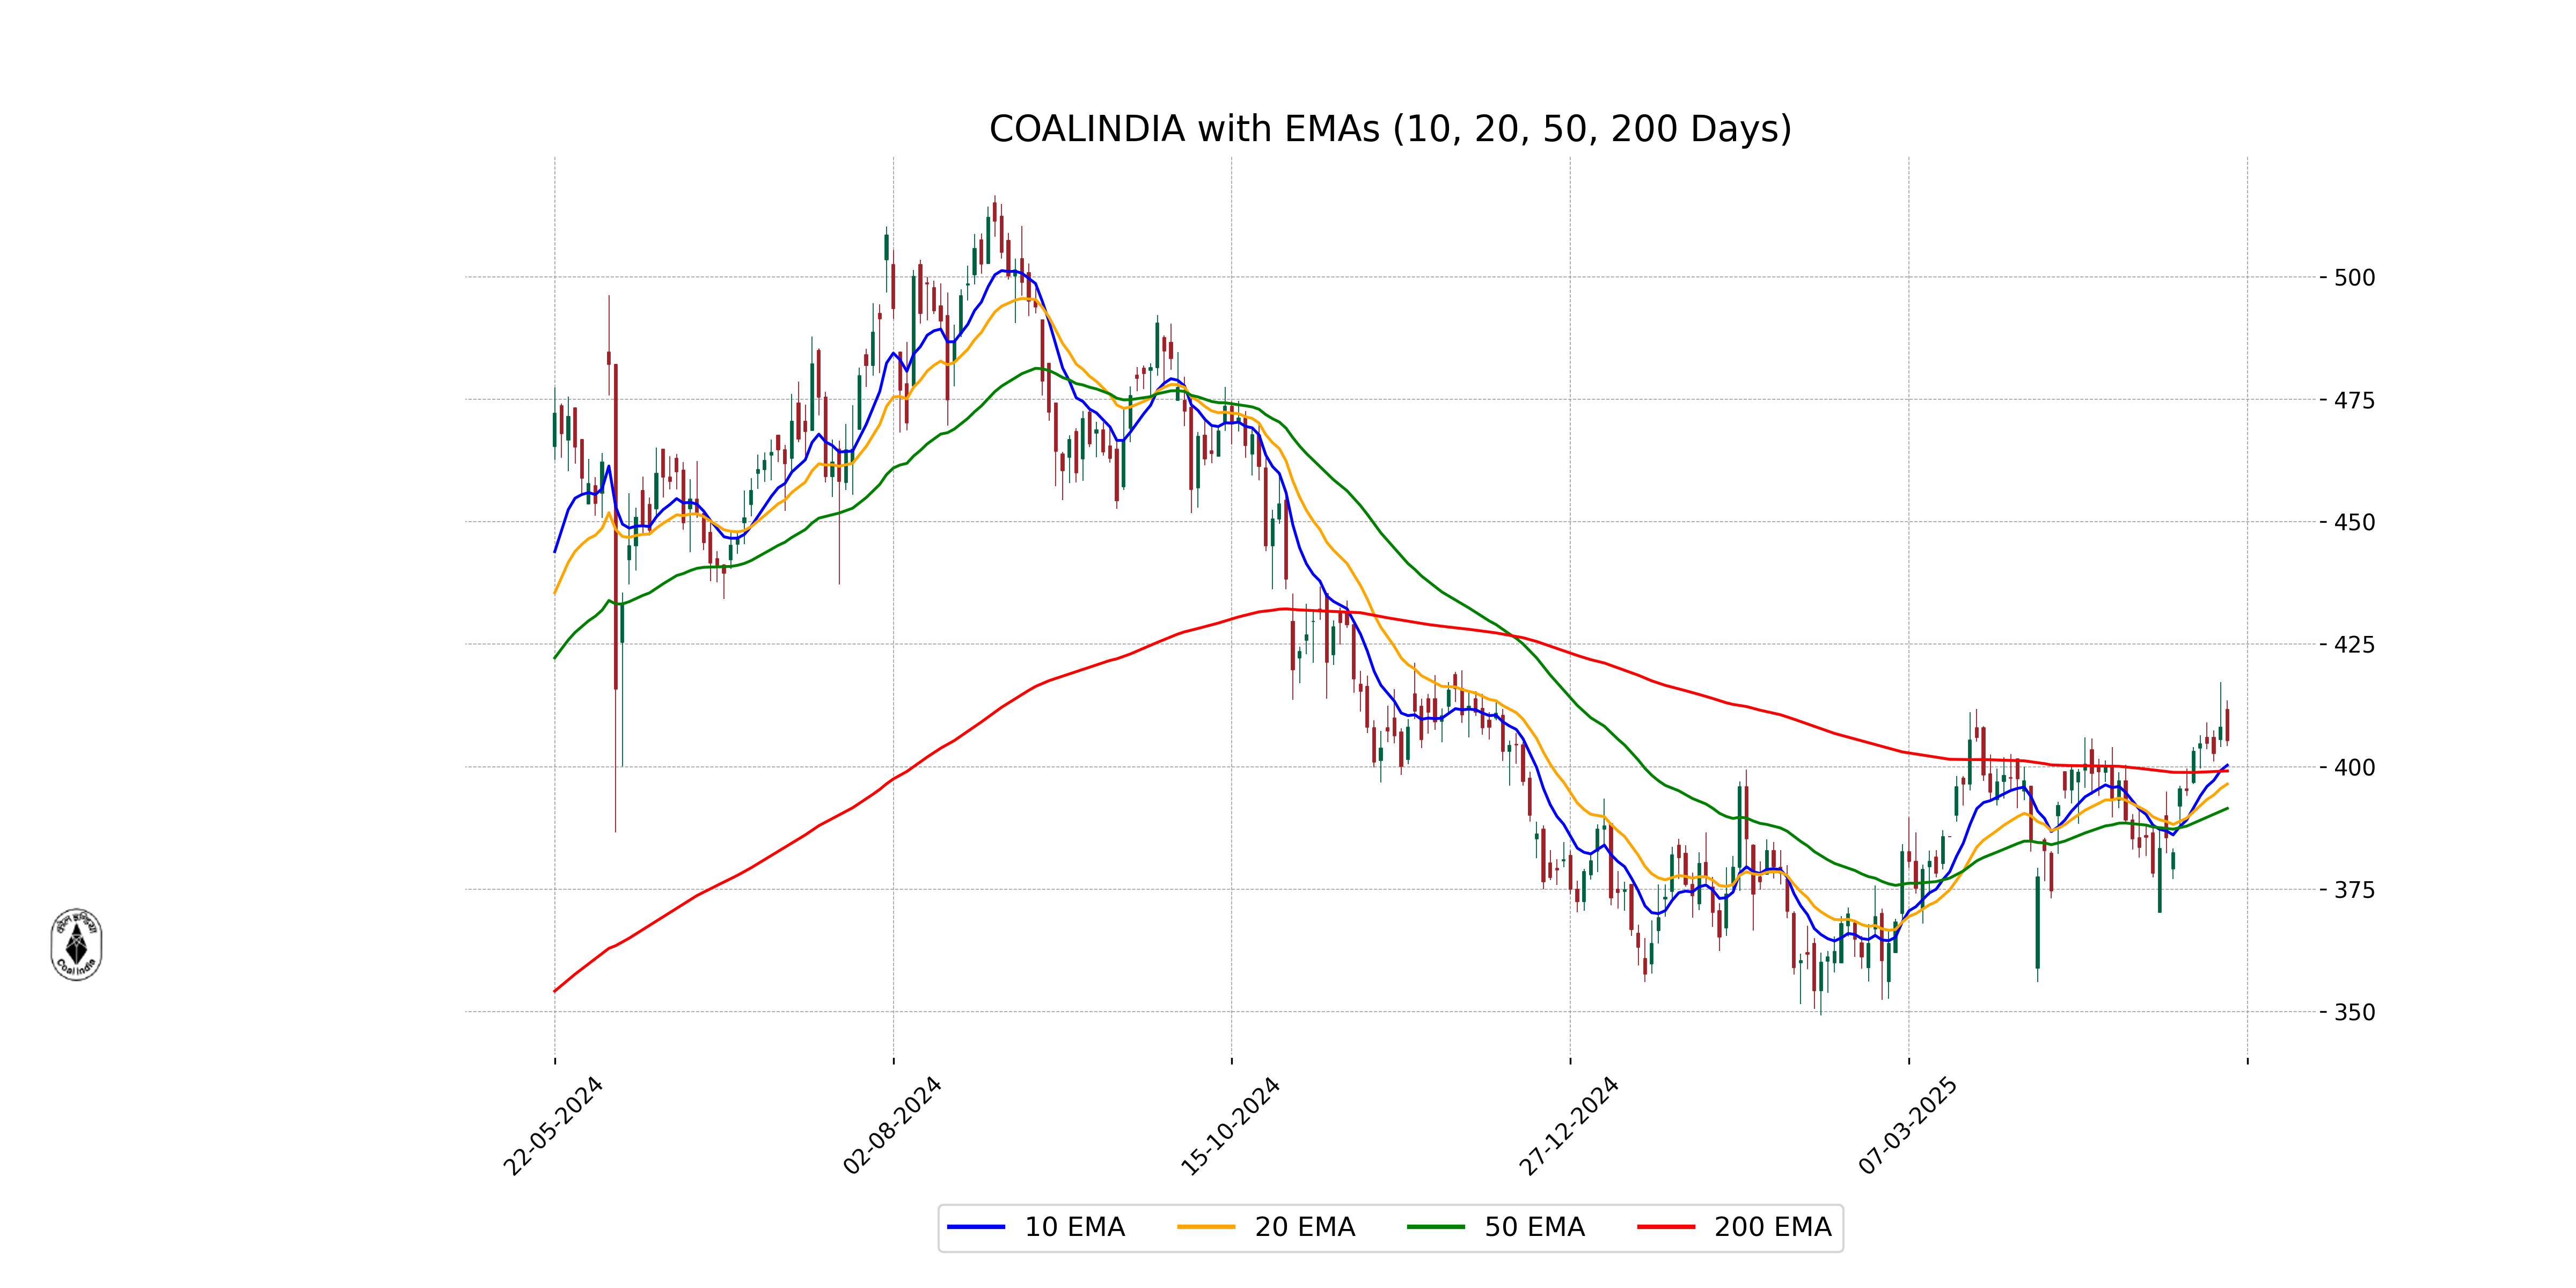
### Coal India Performance Overview Coal India, primarily operating in the thermal coal industry within the energy sector in India, closed at 405.35, reflecting a slight decrease of -0.67% compared to the previous close. Despite this minor dip, the company's strong fundamentals are evident in its solid PE Ratio of 7.06 and an impressive EPS of 57.38. With a market cap of over 2 trillion, Coal India's technical indicators like a slightly higher current 50-day EMA compared to the 200-day EMA suggest positive short-term momentum. Additionally, the RSI stands at 60.03, indicating a balanced momentum that is neither overbought nor oversold.
Relationship with Key Moving Averages
Coal India is trading near its 200-day EMA of 399.12 but has closed below it at 405.35. However, the stock is above its 50-day EMA of 391.48 and 10-day EMA of 400.31, indicating short-term bullish momentum.
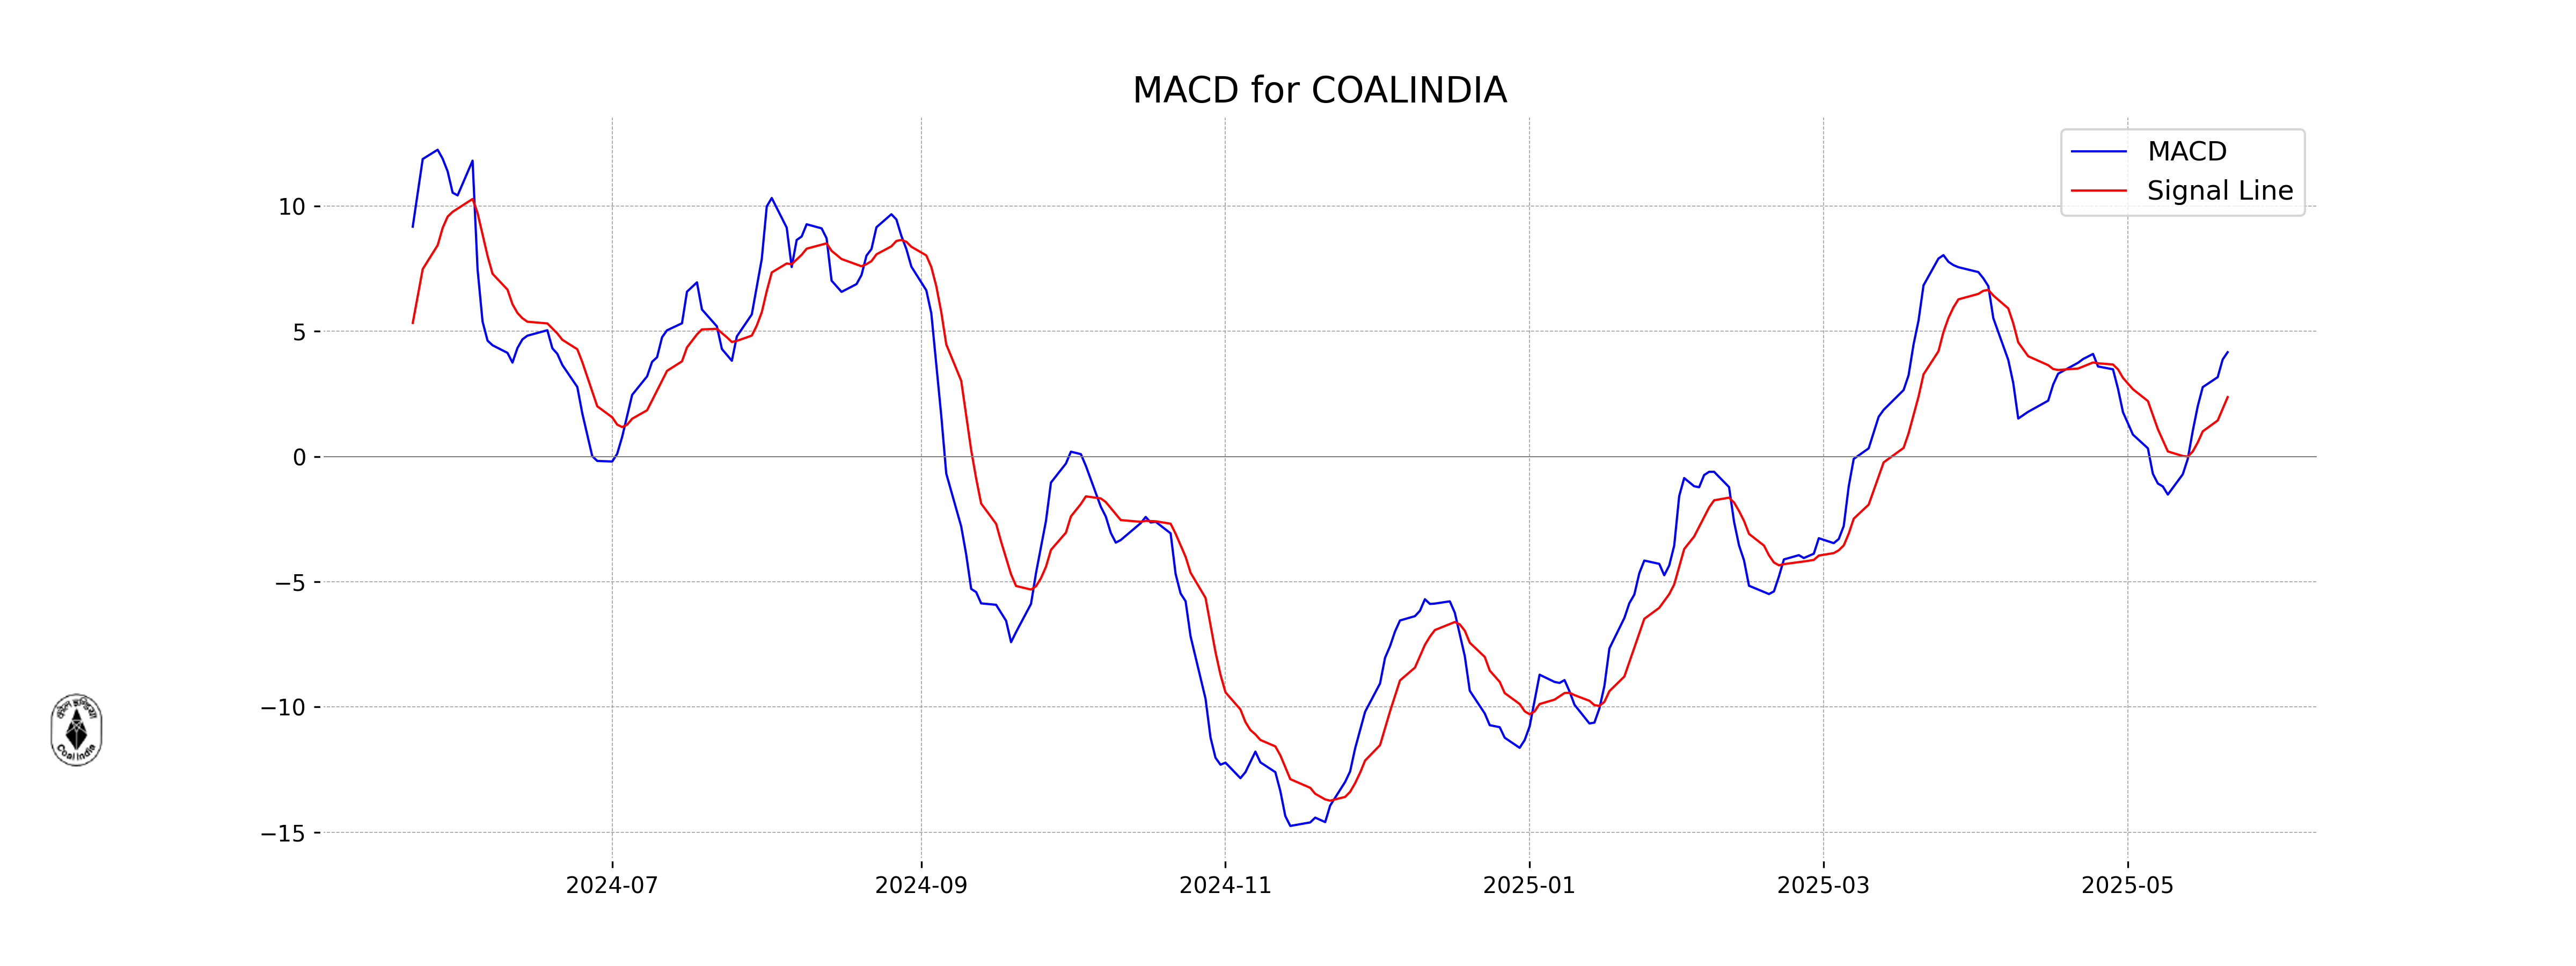
Moving Averages Trend (MACD)
Based on the provided data, Coal India's MACD is 4.16, which is above the MACD Signal of 2.37. This indicates a bullish trend, suggesting potential upward momentum in the stock price.
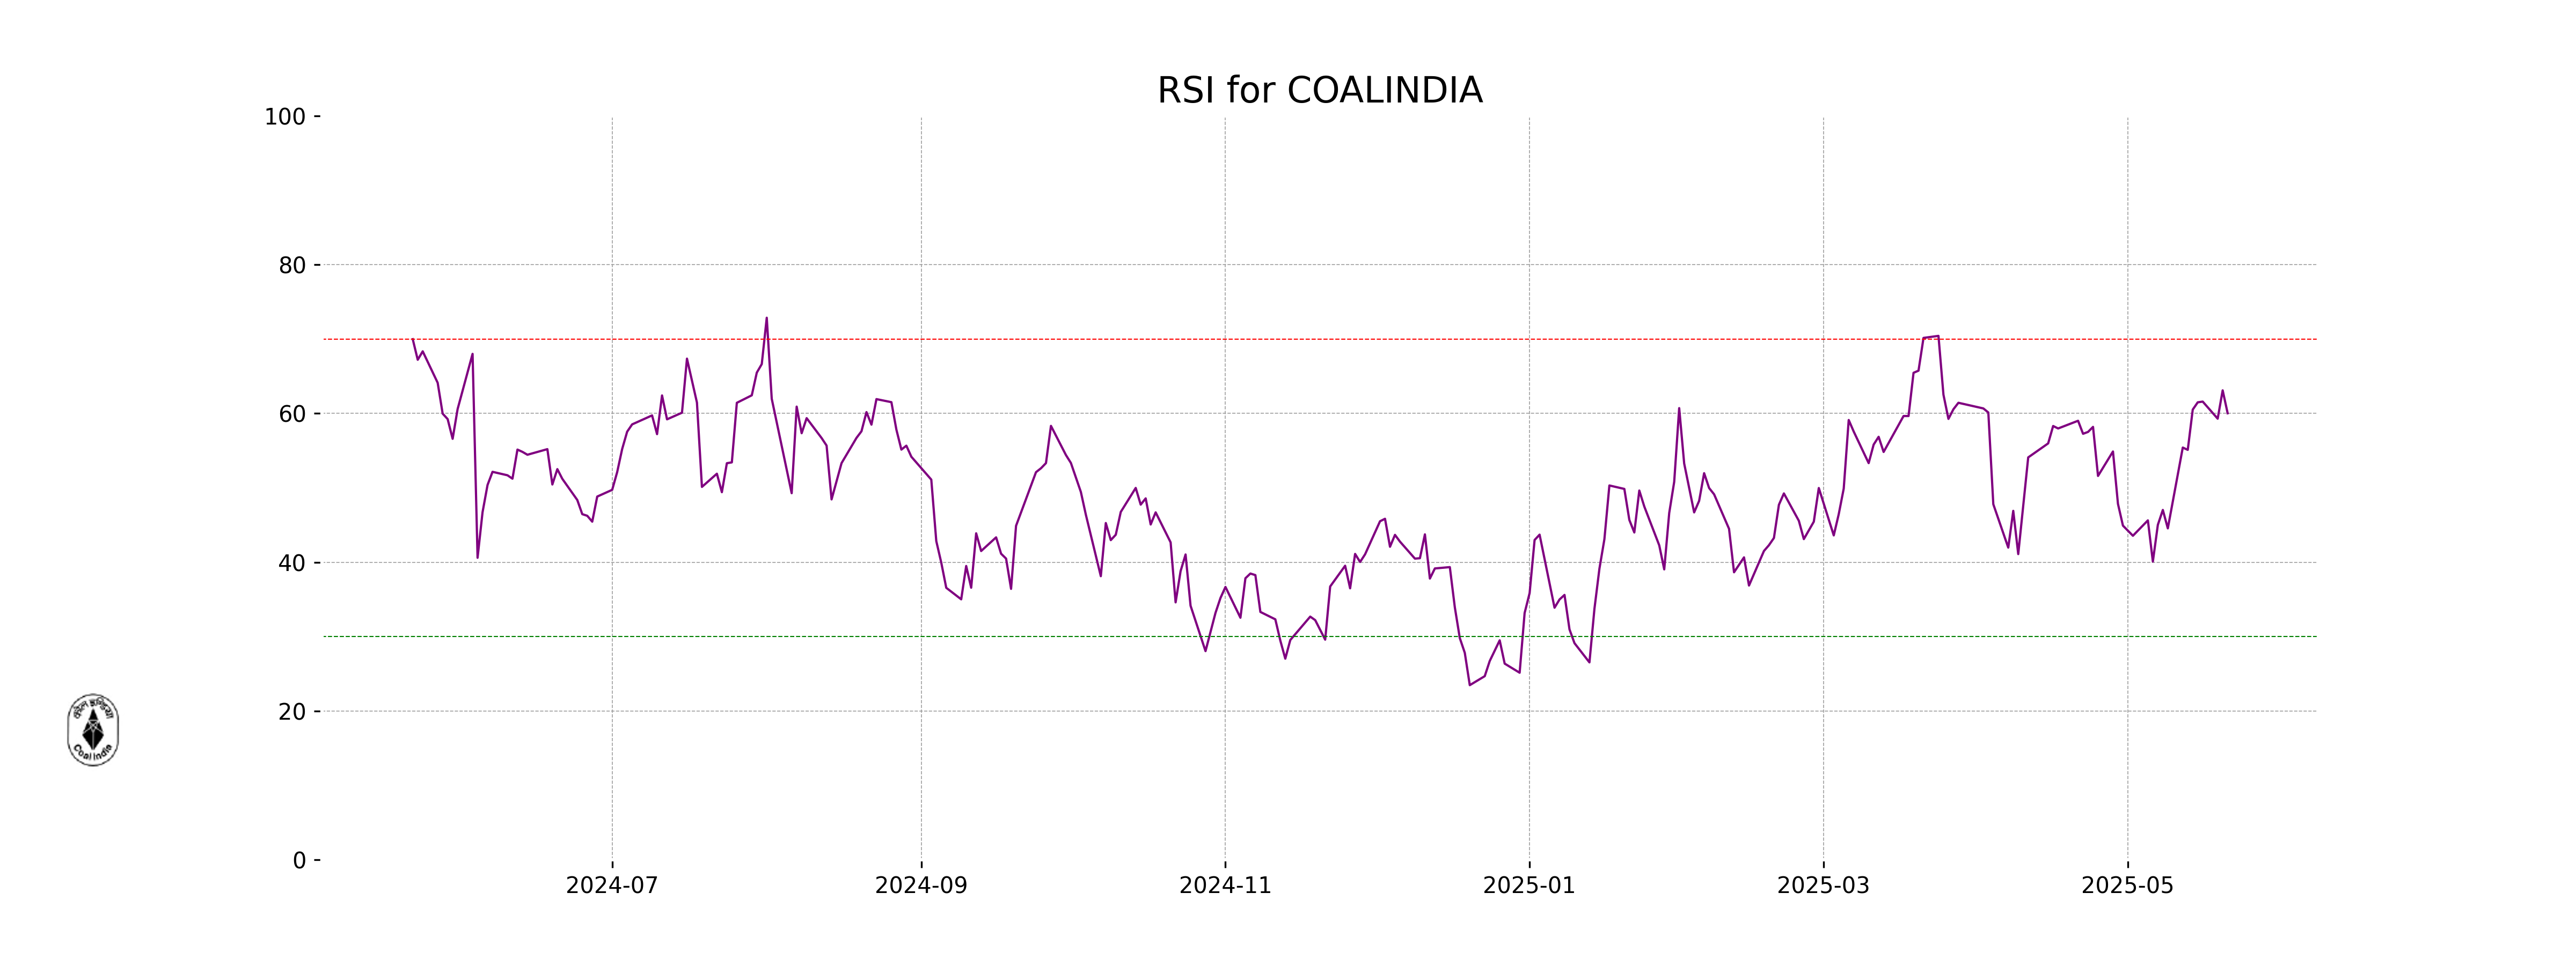
RSI Analysis
Coal India currently has an RSI value of 60.03, suggesting that the stock is in a neutral zone, not overbought nor oversold. This indicates a relatively balanced state in terms of recent price movements, providing no strong signals for imminent reversals.
Analysis for IndusInd Bank - May 21, 2025

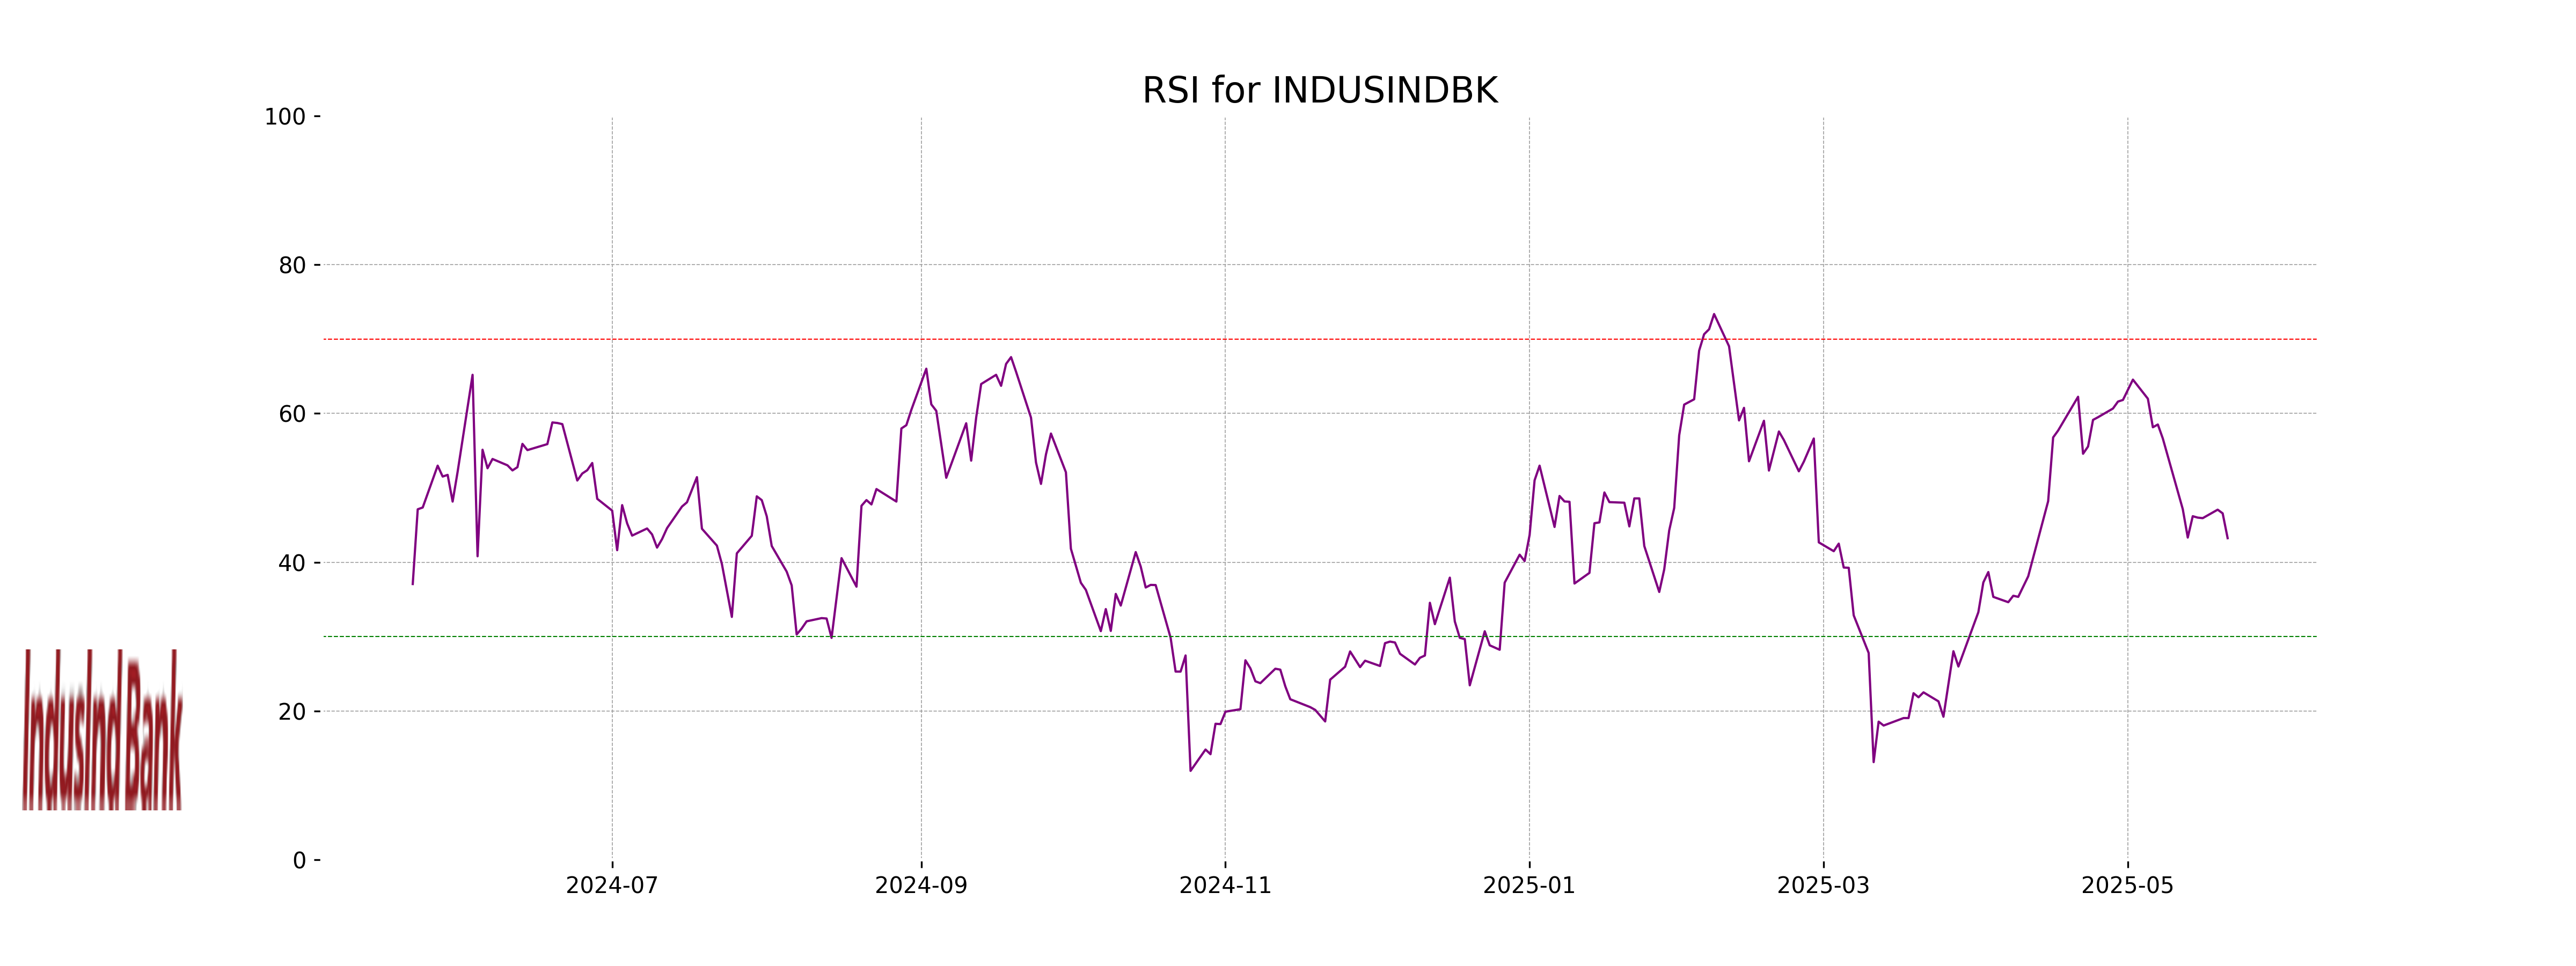
IndusInd Bank experienced a decline in its stock price, closing at 769.95, down from a previous close of 782.25, reflecting a percentage decrease of approximately 1.57%. The stock's performance shows a bearish trend, as indicated by its negative MACD and RSI of 43.2, suggesting possible continued weakness. The bank operates within the financial services sector, specifically in regional banking in India, with a market capitalization of approximately ₹599.83 billion and a PE ratio of 8.27, highlighting its valuation metrics.
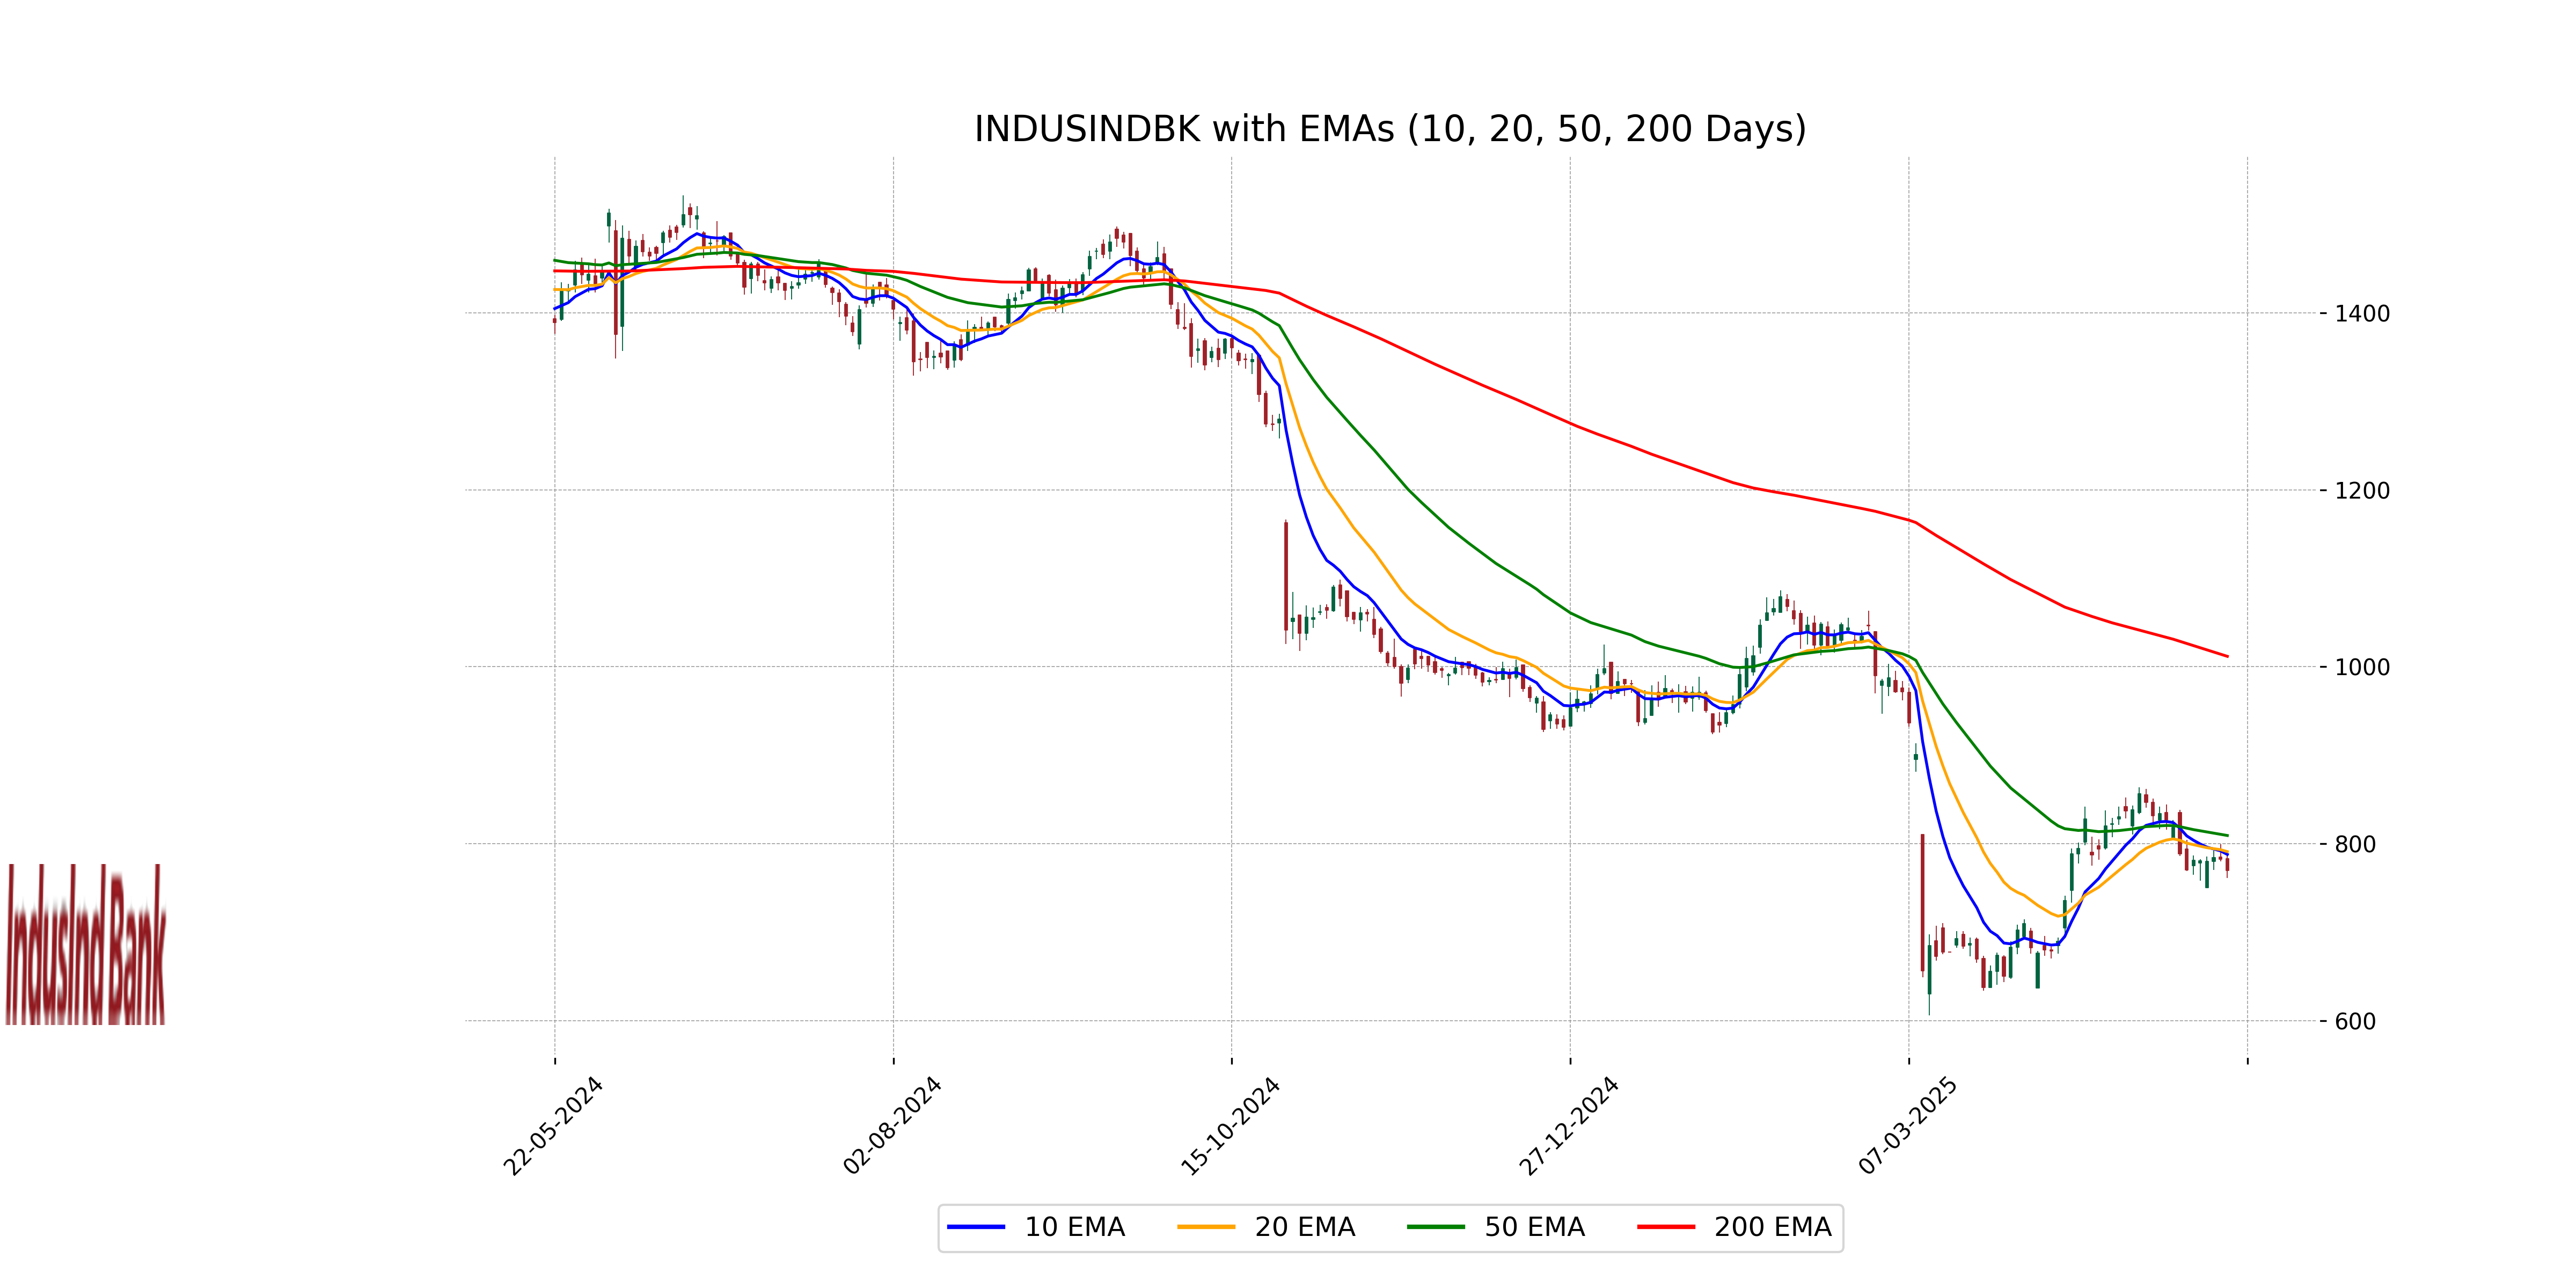
Relationship with Key Moving Averages
IndusInd Bank's current close price of 769.95 is below its 50 EMA of 809.21 and 200 EMA of 1011.83, indicating a bearish trend. Additionally, it is also below the 10 EMA of 787.79 and 20 EMA of 790.96, suggesting downwards pressure in the short term as well.
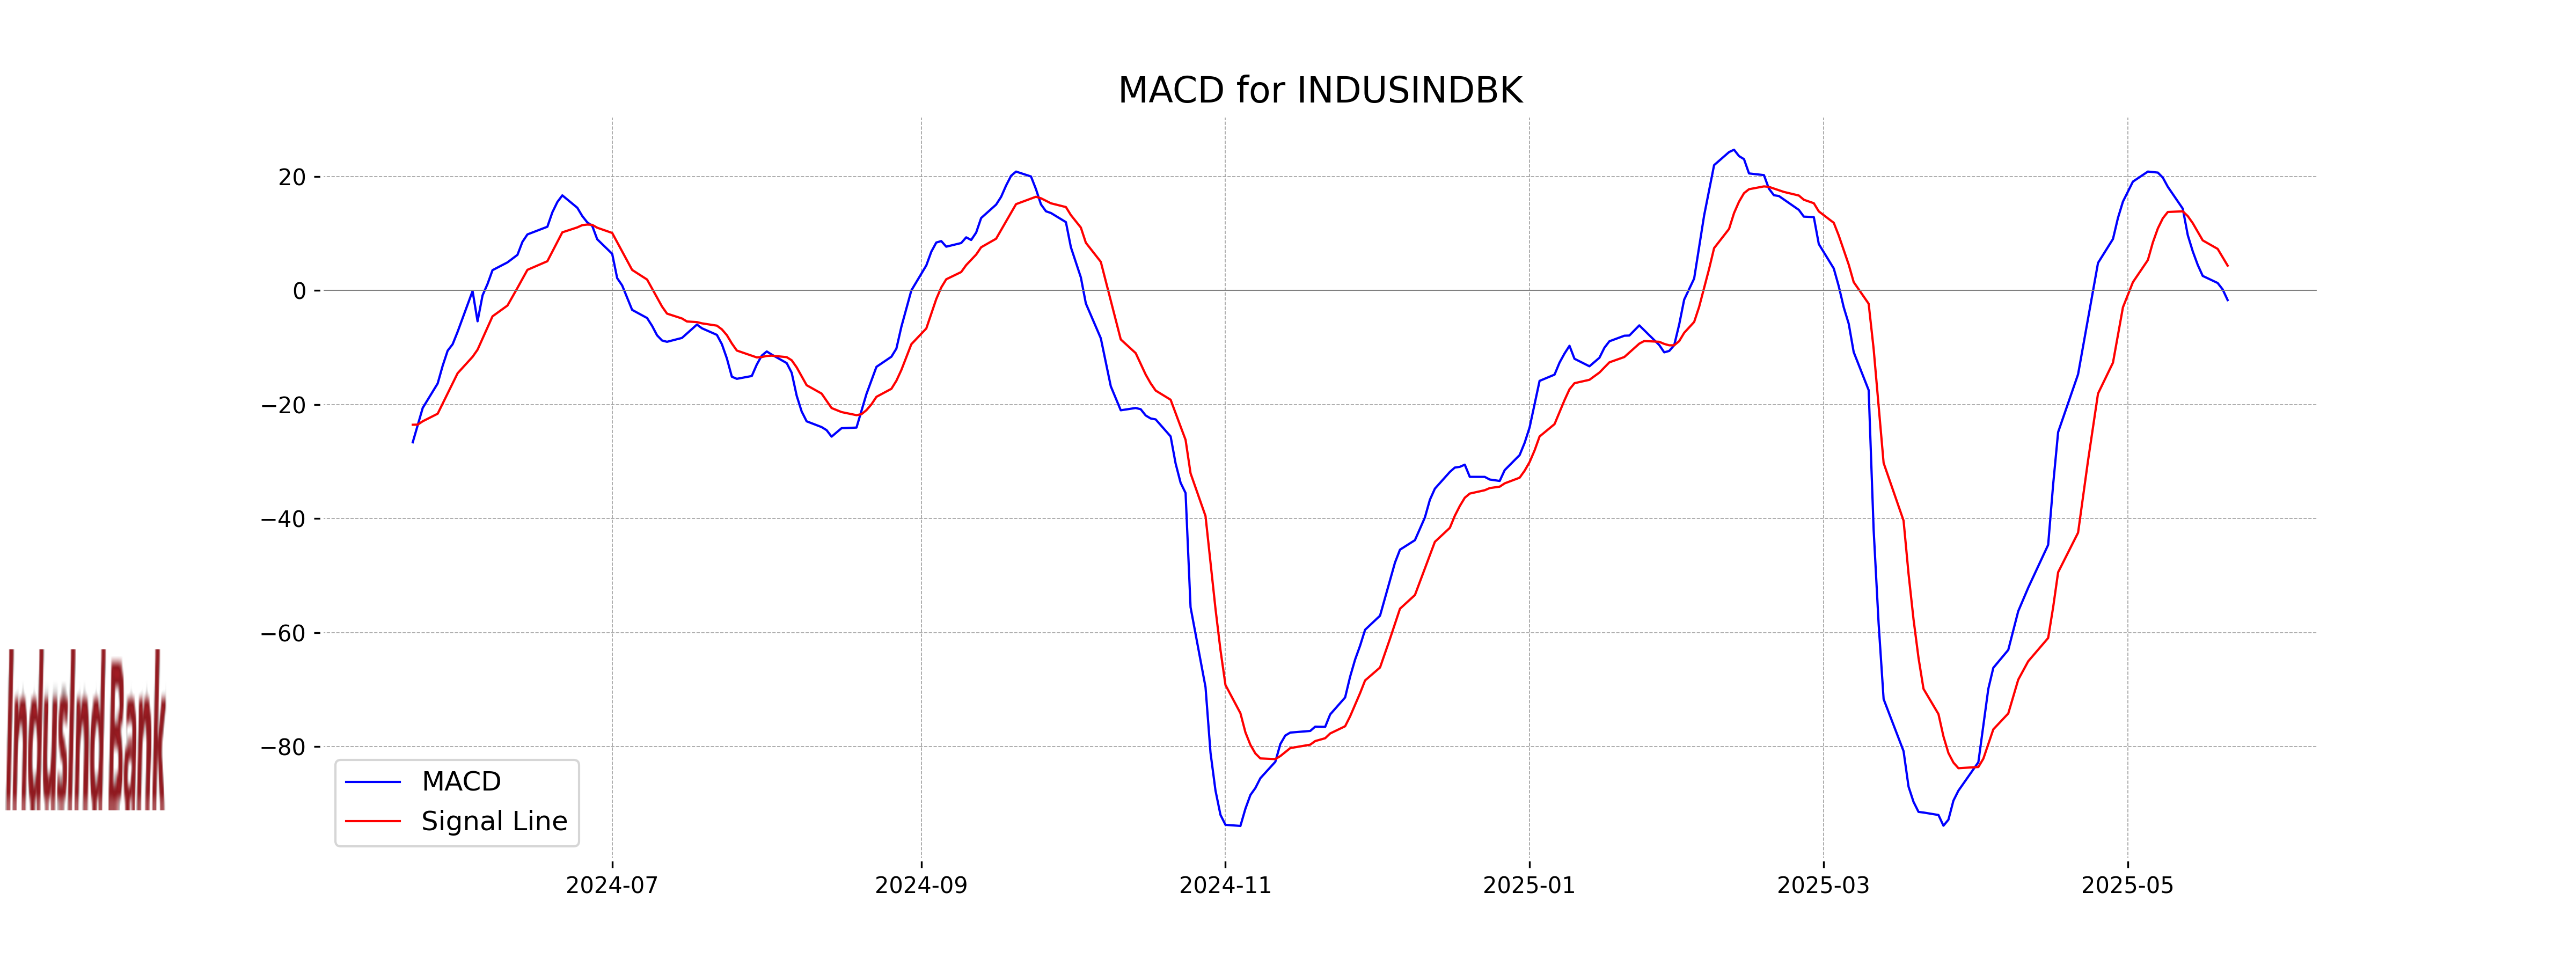
Moving Averages Trend (MACD)
The MACD for IndusInd Bank is negative at -1.68, while the MACD Signal is positive at 4.37, indicating a bearish trend as the MACD line is below the signal line. This situation suggests that the stock is experiencing downward momentum and could continue to underperform in the short term unless there is a reversal.
RSI Analysis
IndusInd Bank's current RSI (Relative Strength Index) of 43.23 indicates that the stock is in a neutral zone, suggesting that it is neither overbought nor oversold. This implies there might not be any immediate major buying or selling pressure on the stock.
Analysis for JSW Steel - May 21, 2025
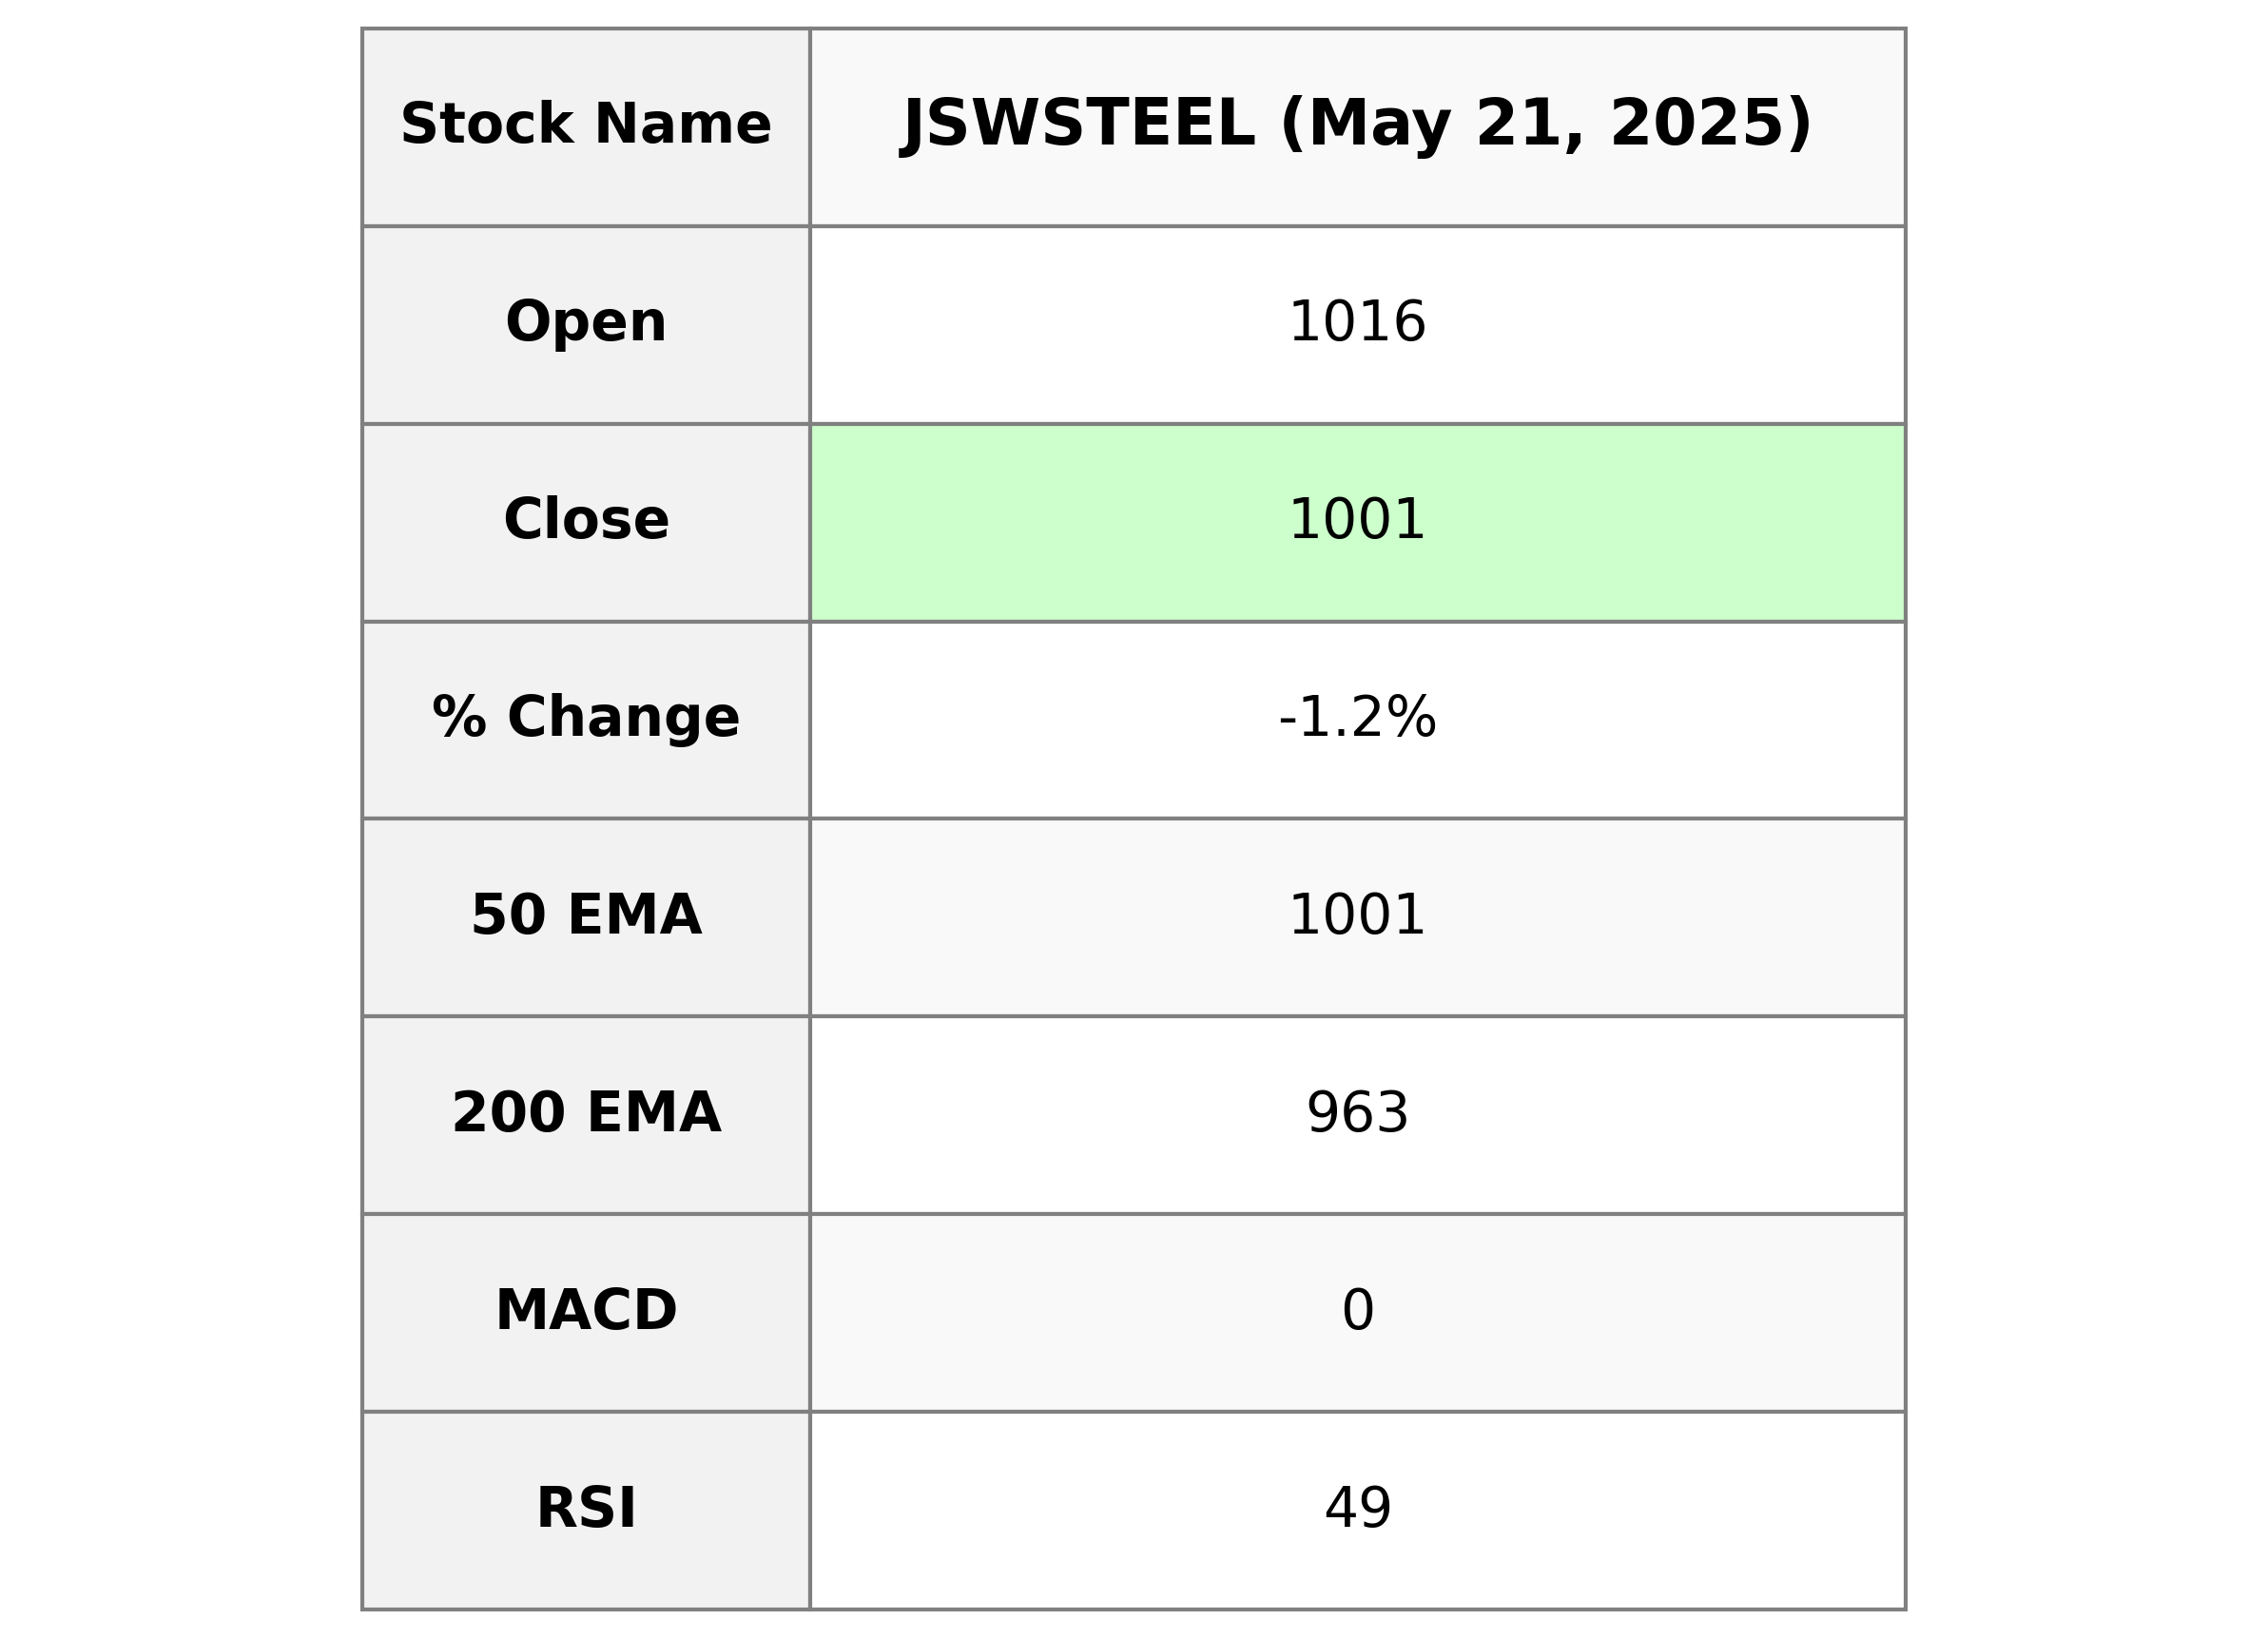
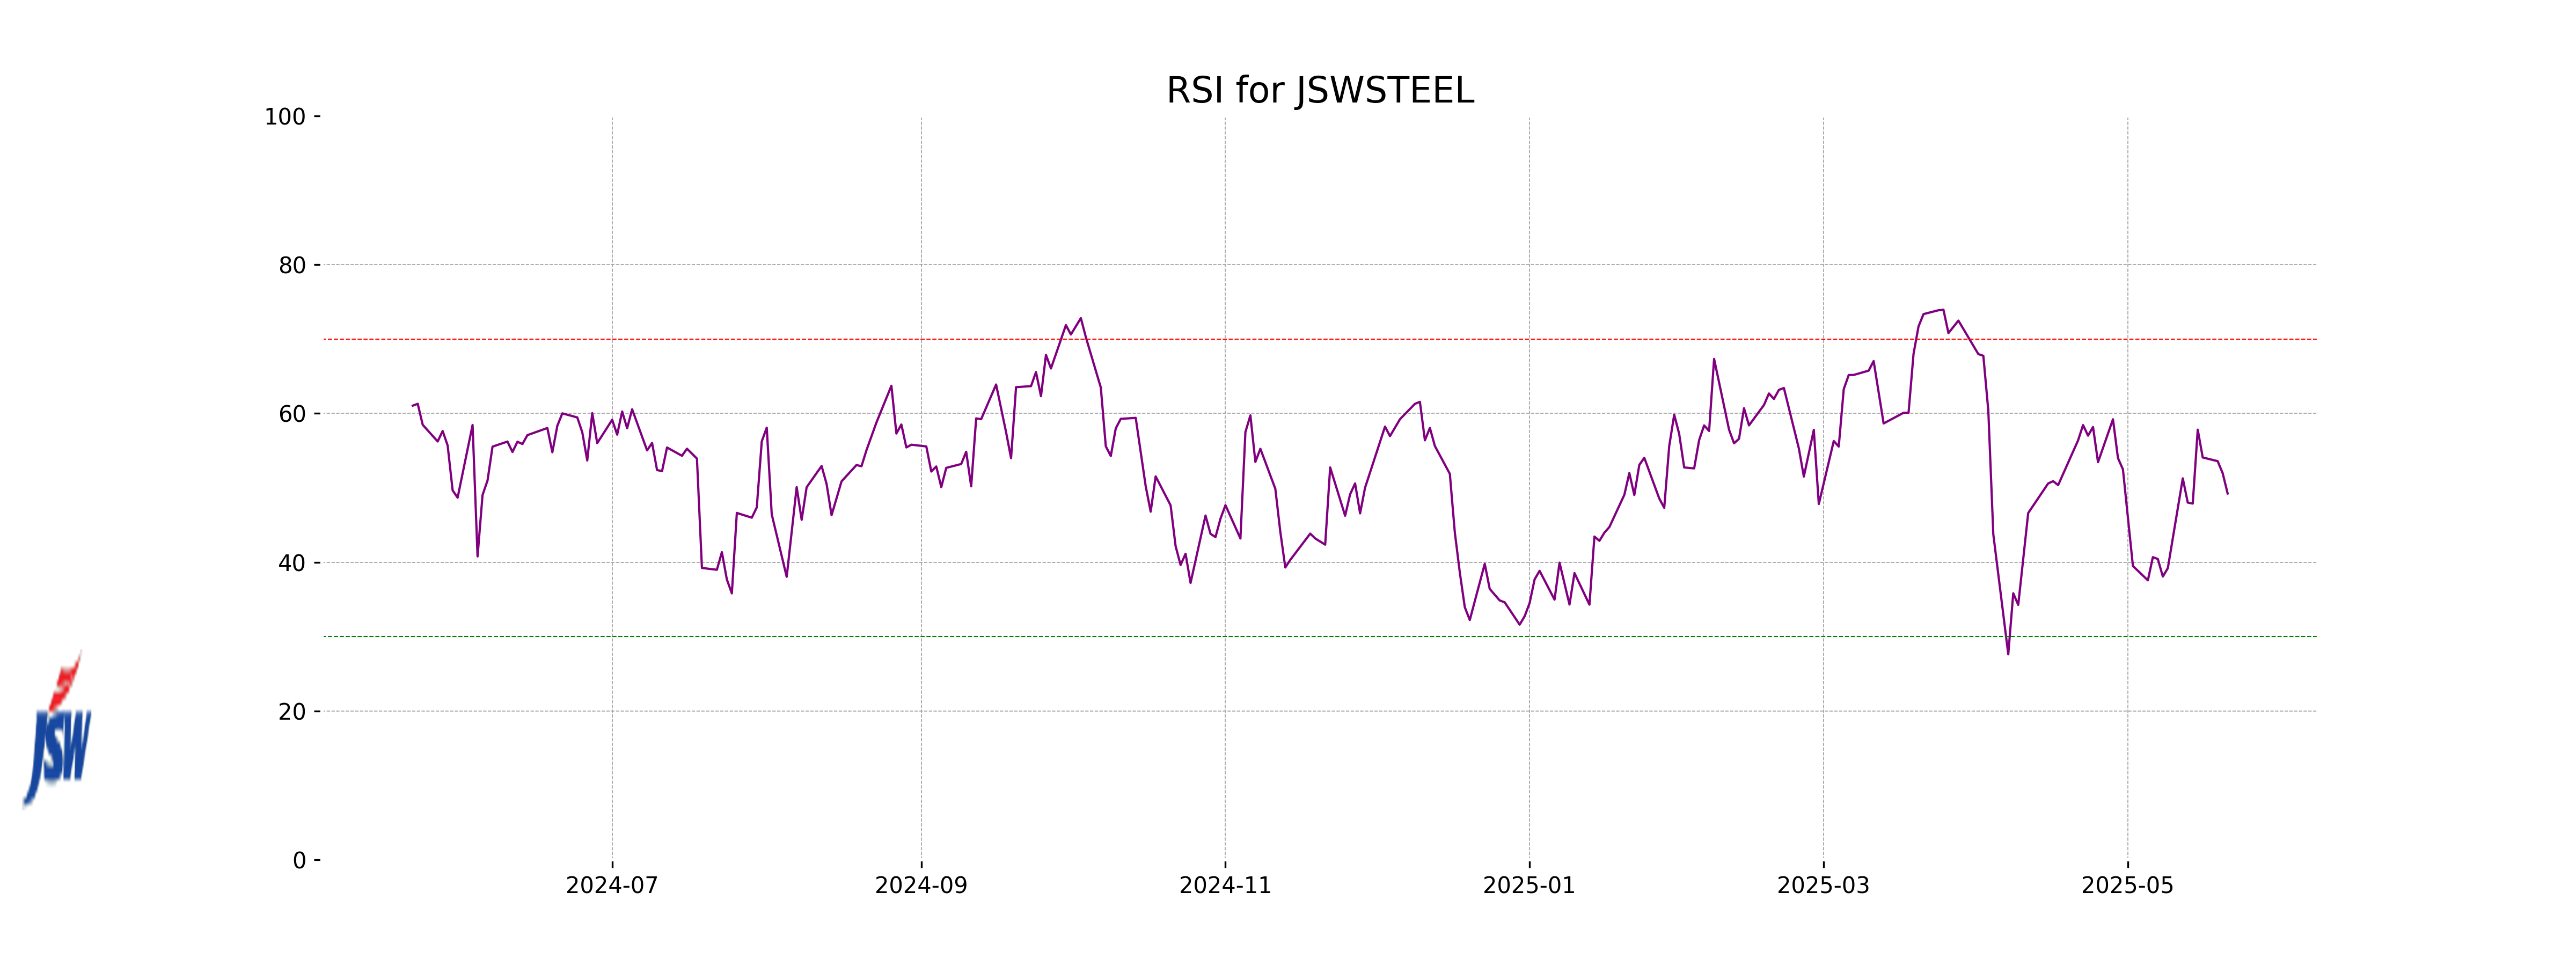
JSW Steel Performance: JSW Steel experienced a slight decline in its stock price with a close of 1000.90, translating to a 1.17% decrease compared to the previous close. The stock's performance exhibits a slight deviation below its 50 EMA and 10 EMA, with an RSI indicating a neutral momentum at 49.24. Despite the downturn, the MACD value suggests a potential inclination towards recovery.
Relationship with Key Moving Averages
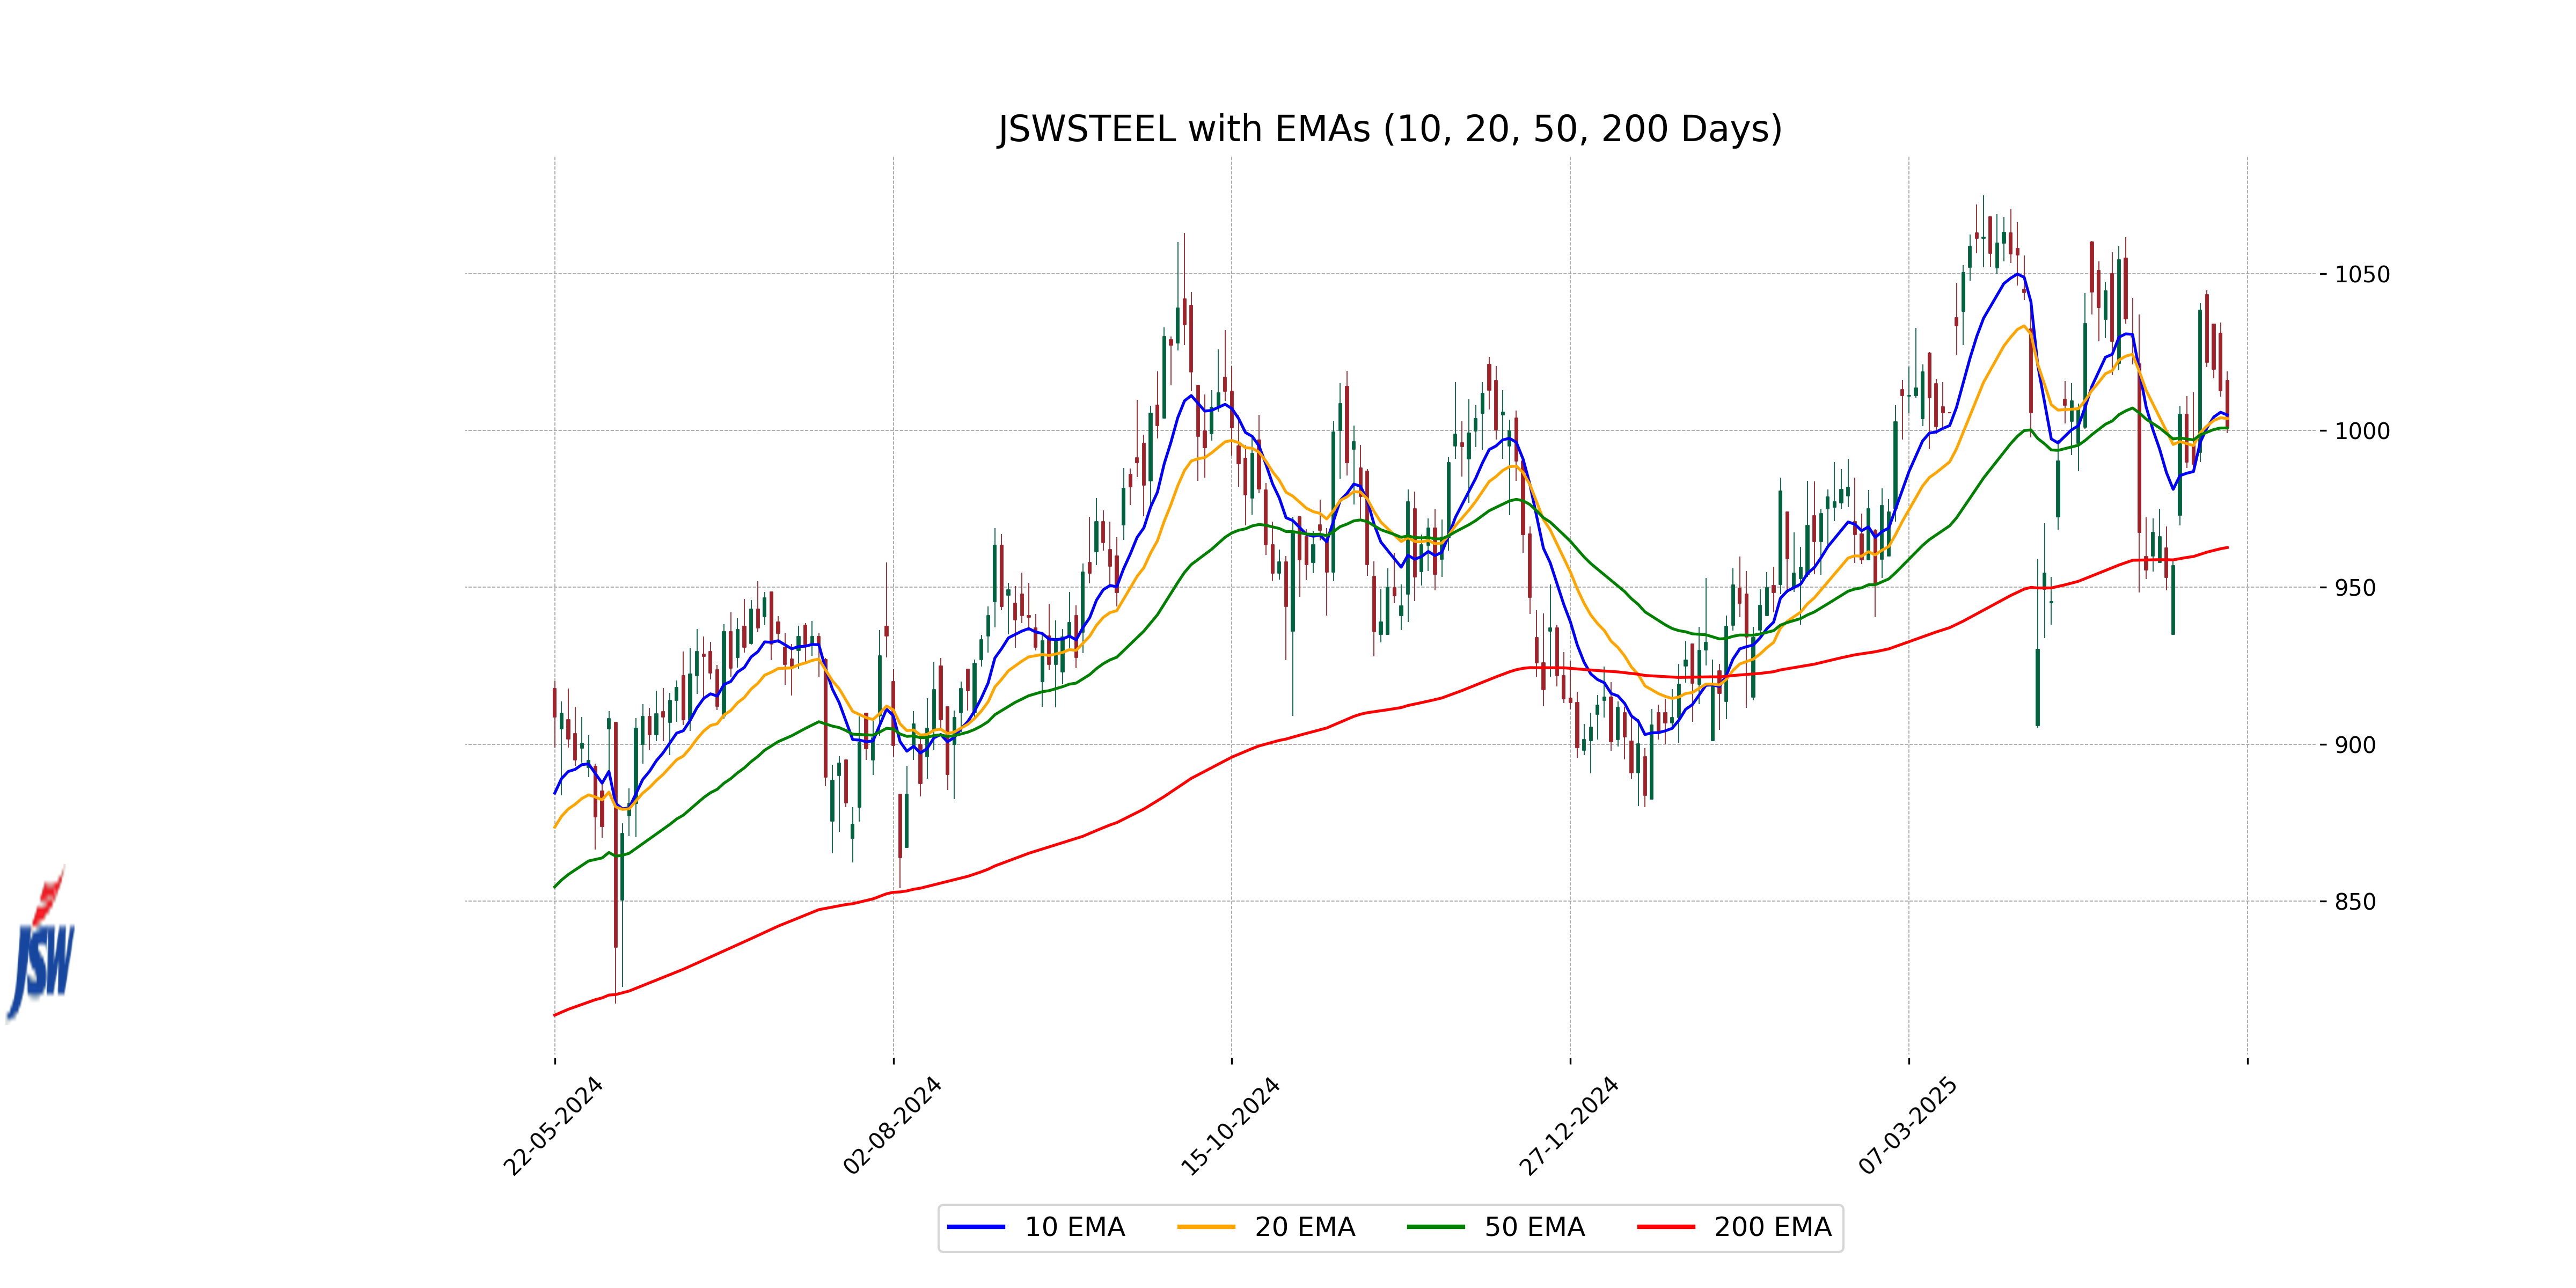
JSW Steel's current closing price is slightly above its 50 EMA but below its 10 EMA. It remains well above its 200 EMA, indicating a potential consolidation phase in the short term while maintaining a long-term upward trend.
Moving Averages Trend (MACD)
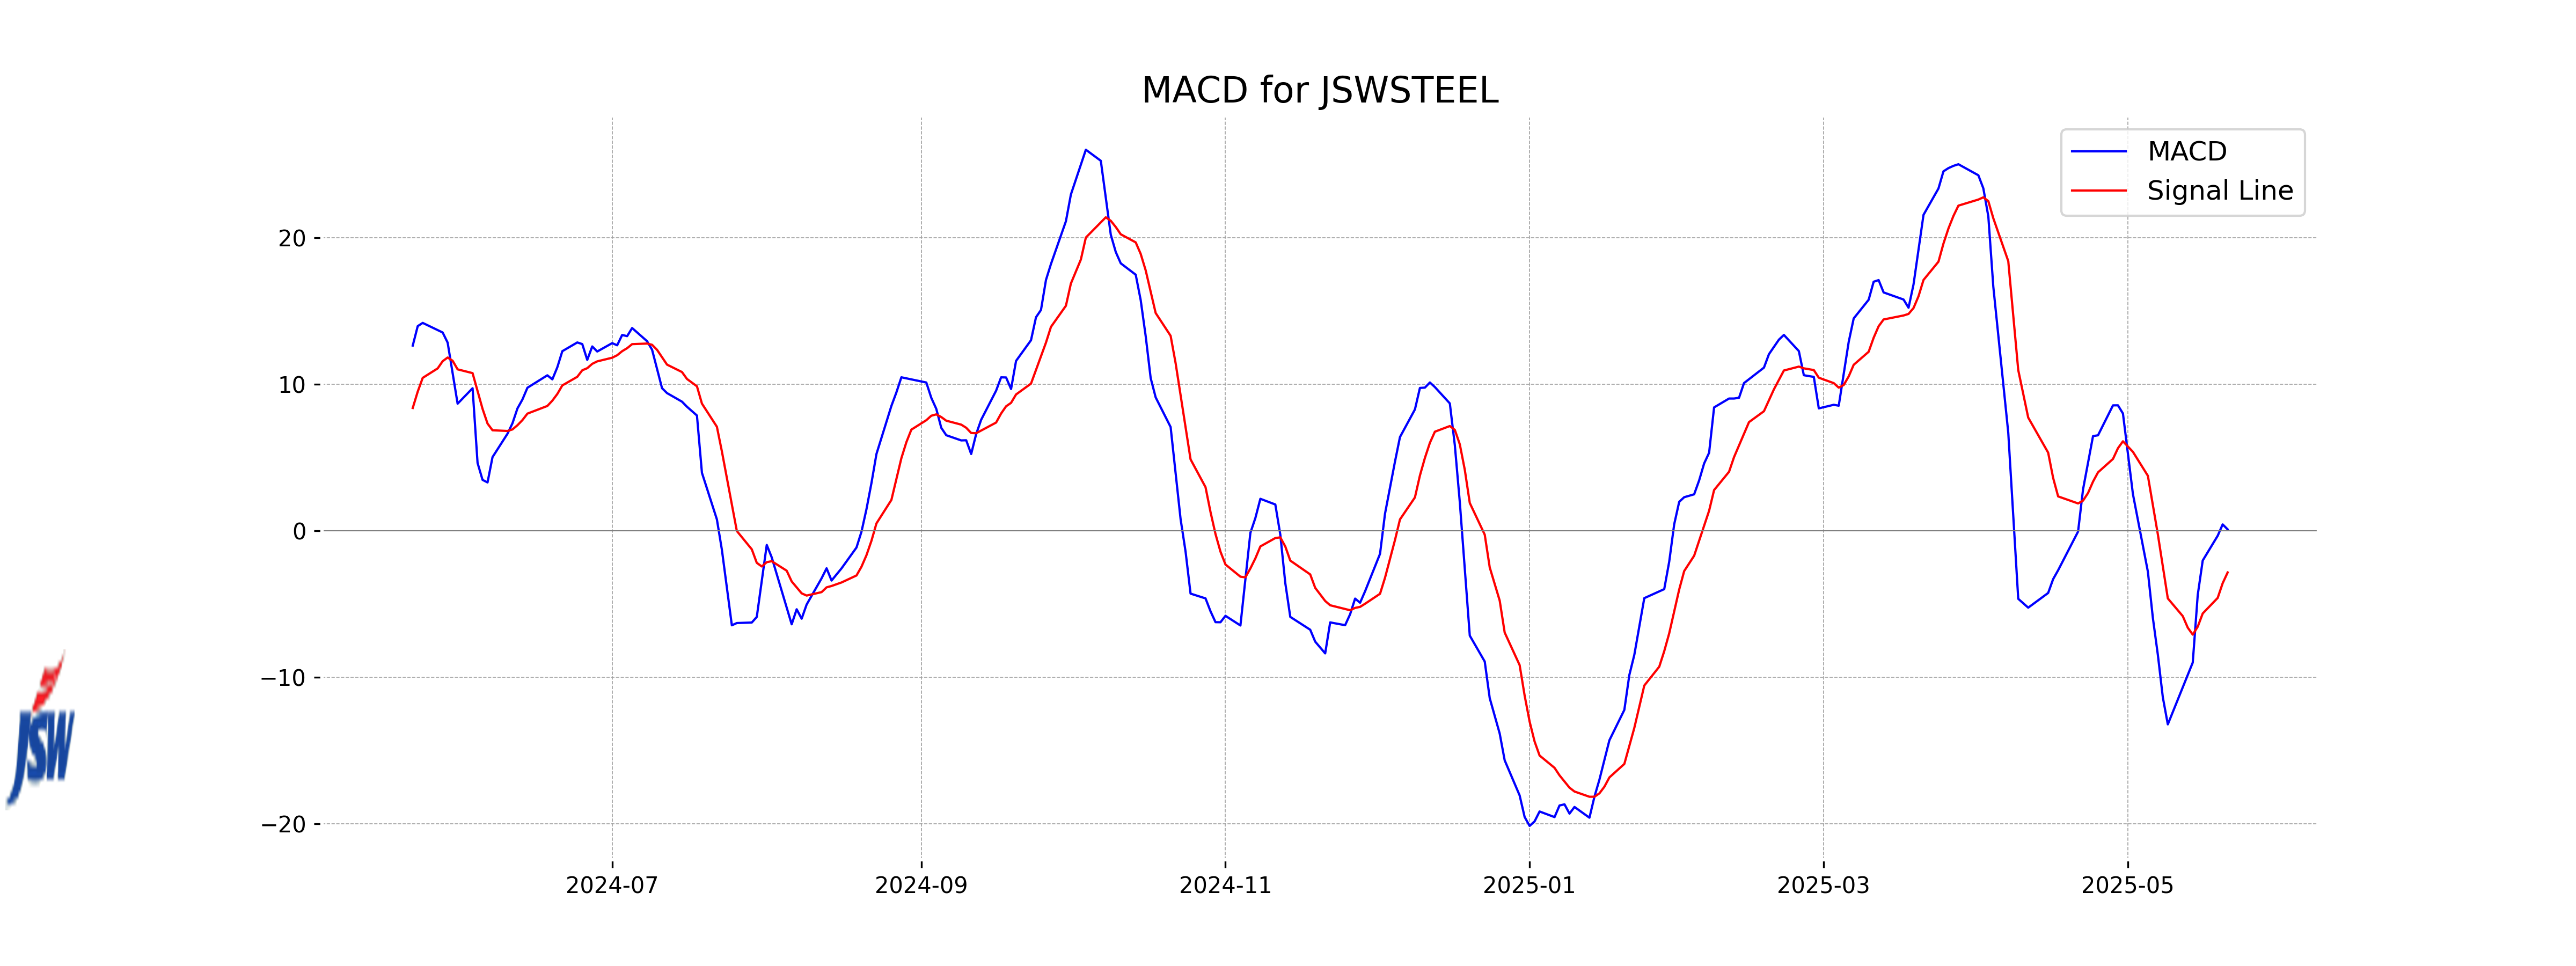
MACD Analysis for JSW Steel: The MACD value is 0.085, which is above the MACD Signal of -2.854. This indicates a bullish momentum as the MACD is above the signal line, suggesting potential for upward price movement. However, the strength of the bullish signal may not be very strong given it's not significantly above the signal line.
RSI Analysis
The RSI (Relative Strength Index) of JSW Steel is 49.24, which suggests a neutral position, indicating neither overbought nor oversold conditions. This may suggest limited momentum for strong upward or downward movement in the stock's price in the immediate term.
Analysis for Kotak Mahindra Bank - May 21, 2025
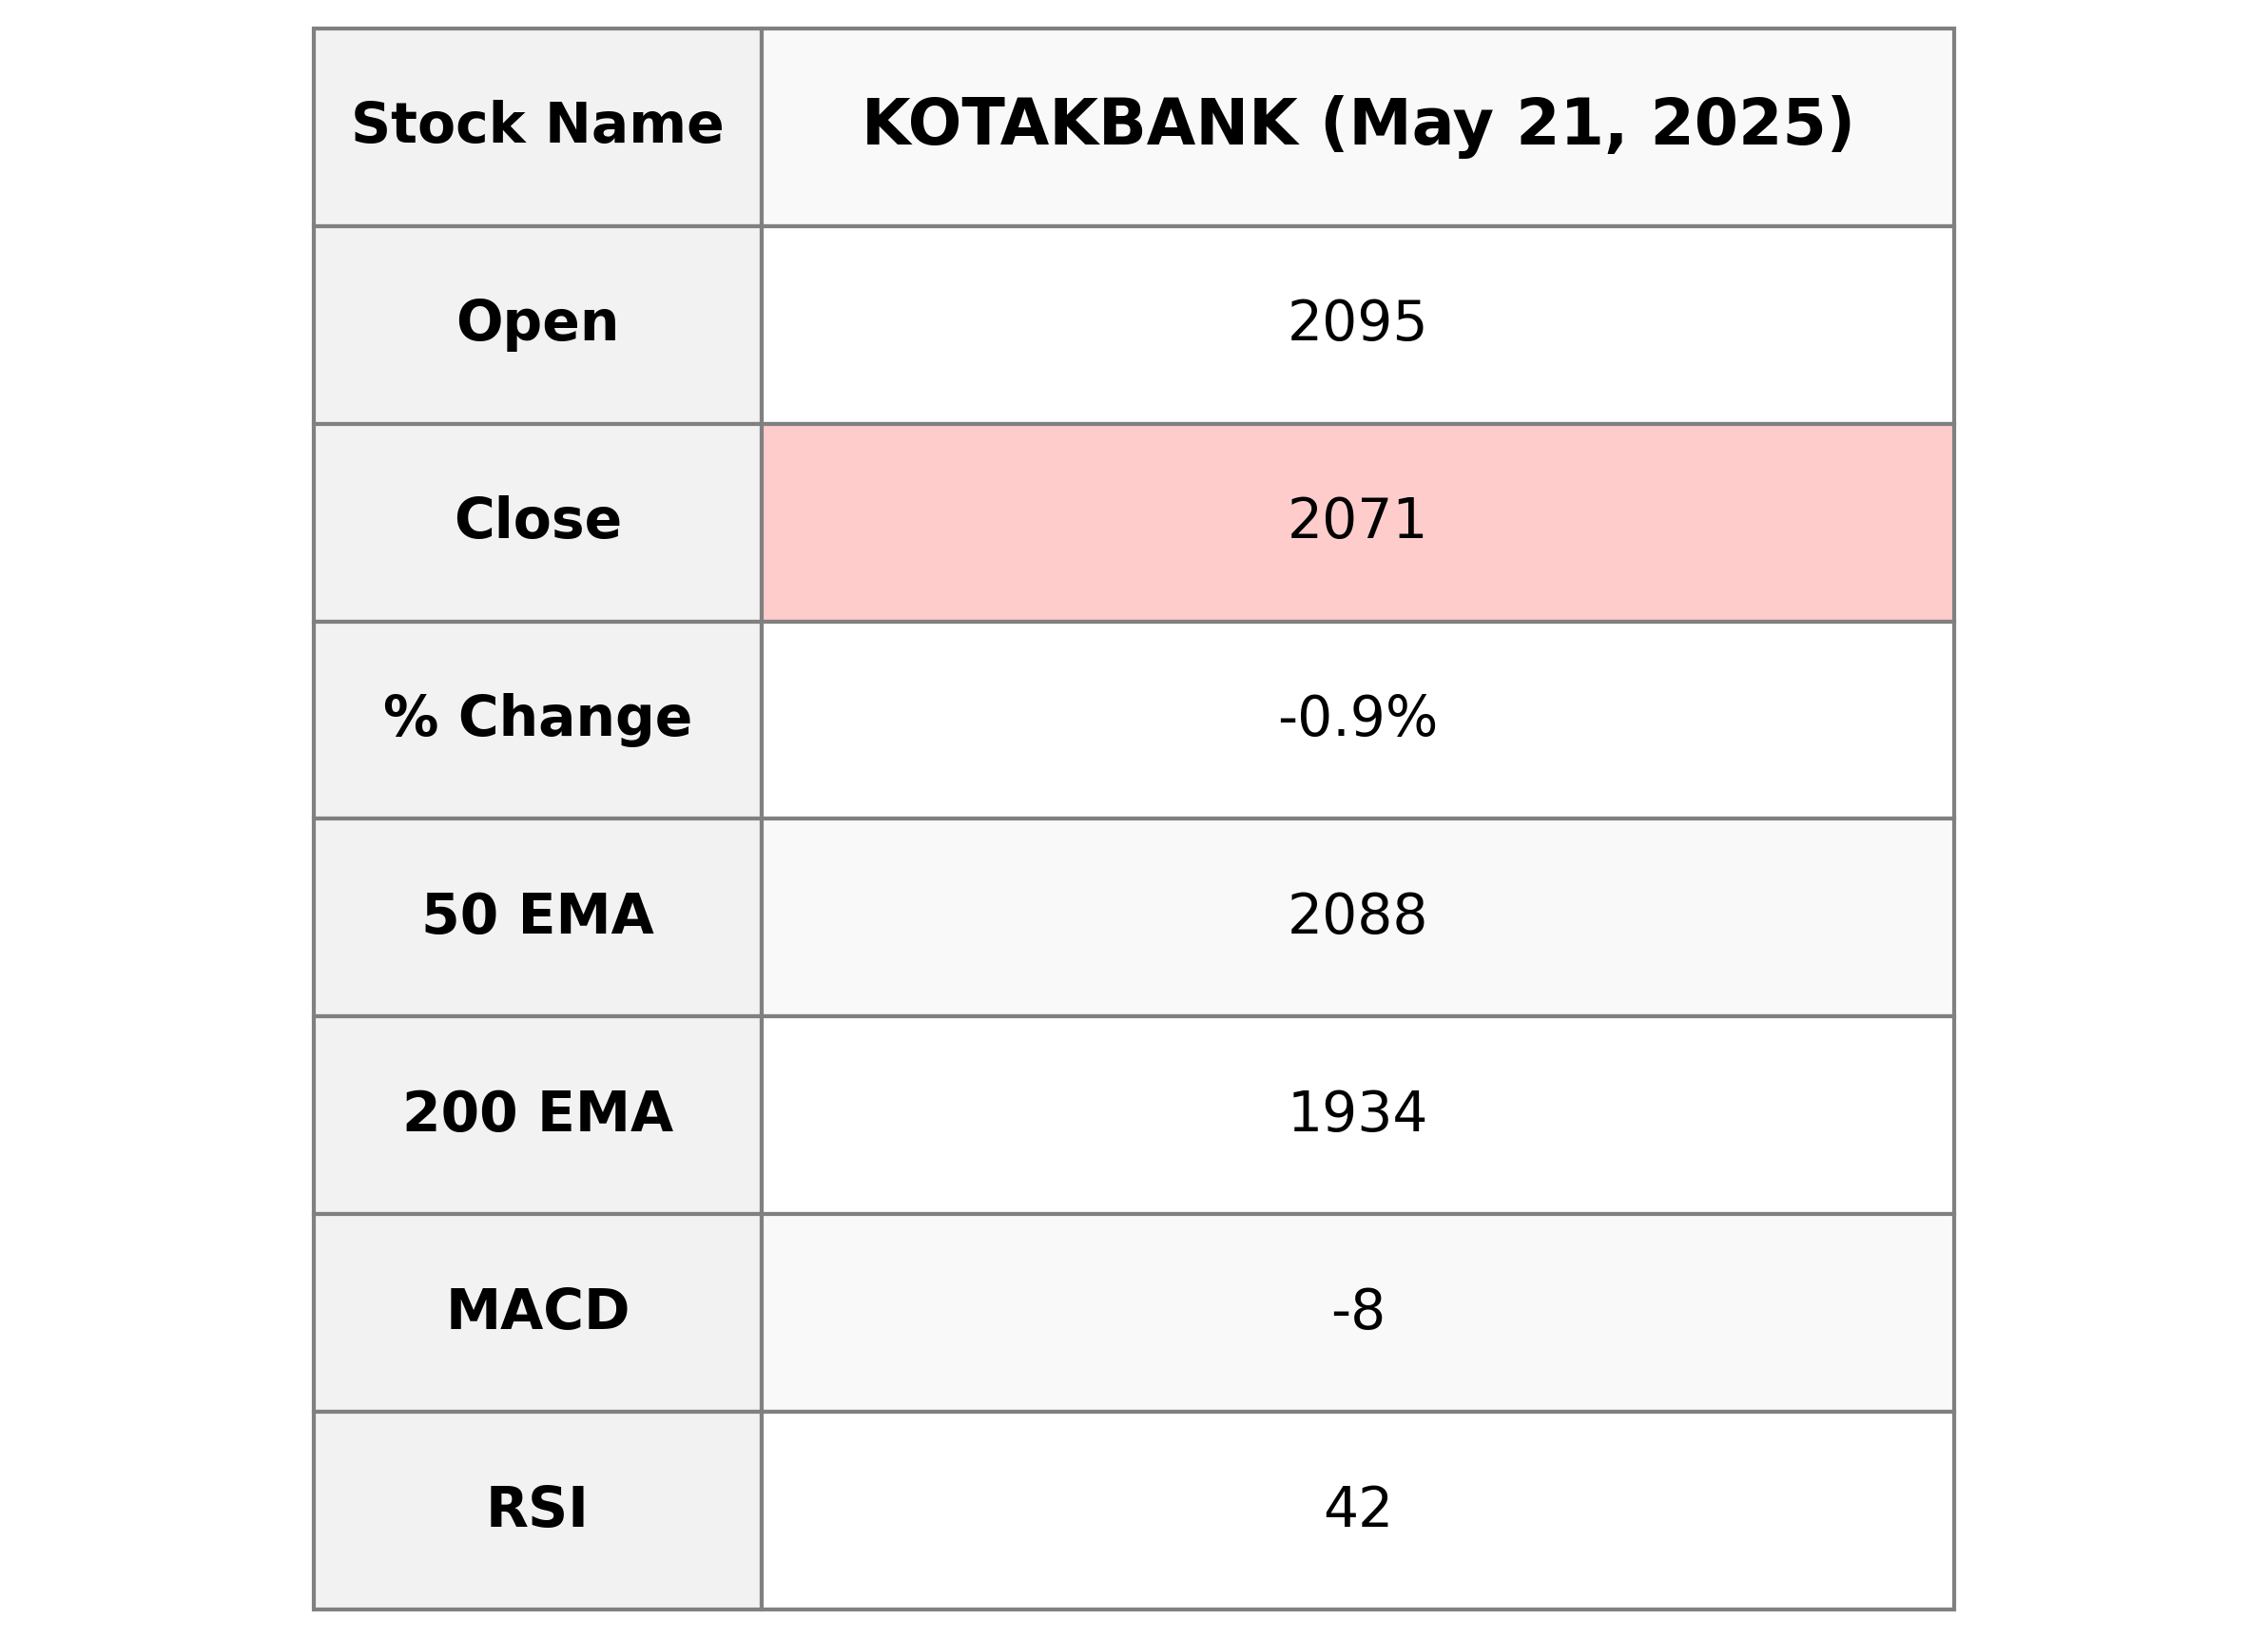
Kotak Mahindra Bank Performance: Kotak Mahindra Bank's stock opened at 2095.0 and closed at 2071.3, reflecting a decrease of approximately 0.9% from the previous close. The stock experienced a high of 2096.3 and a low of 2060.0 during the trading session. The bank operates in the financial services sector in India, with a PE Ratio of 18.63 and an EPS of 111.19.
Relationship with Key Moving Averages
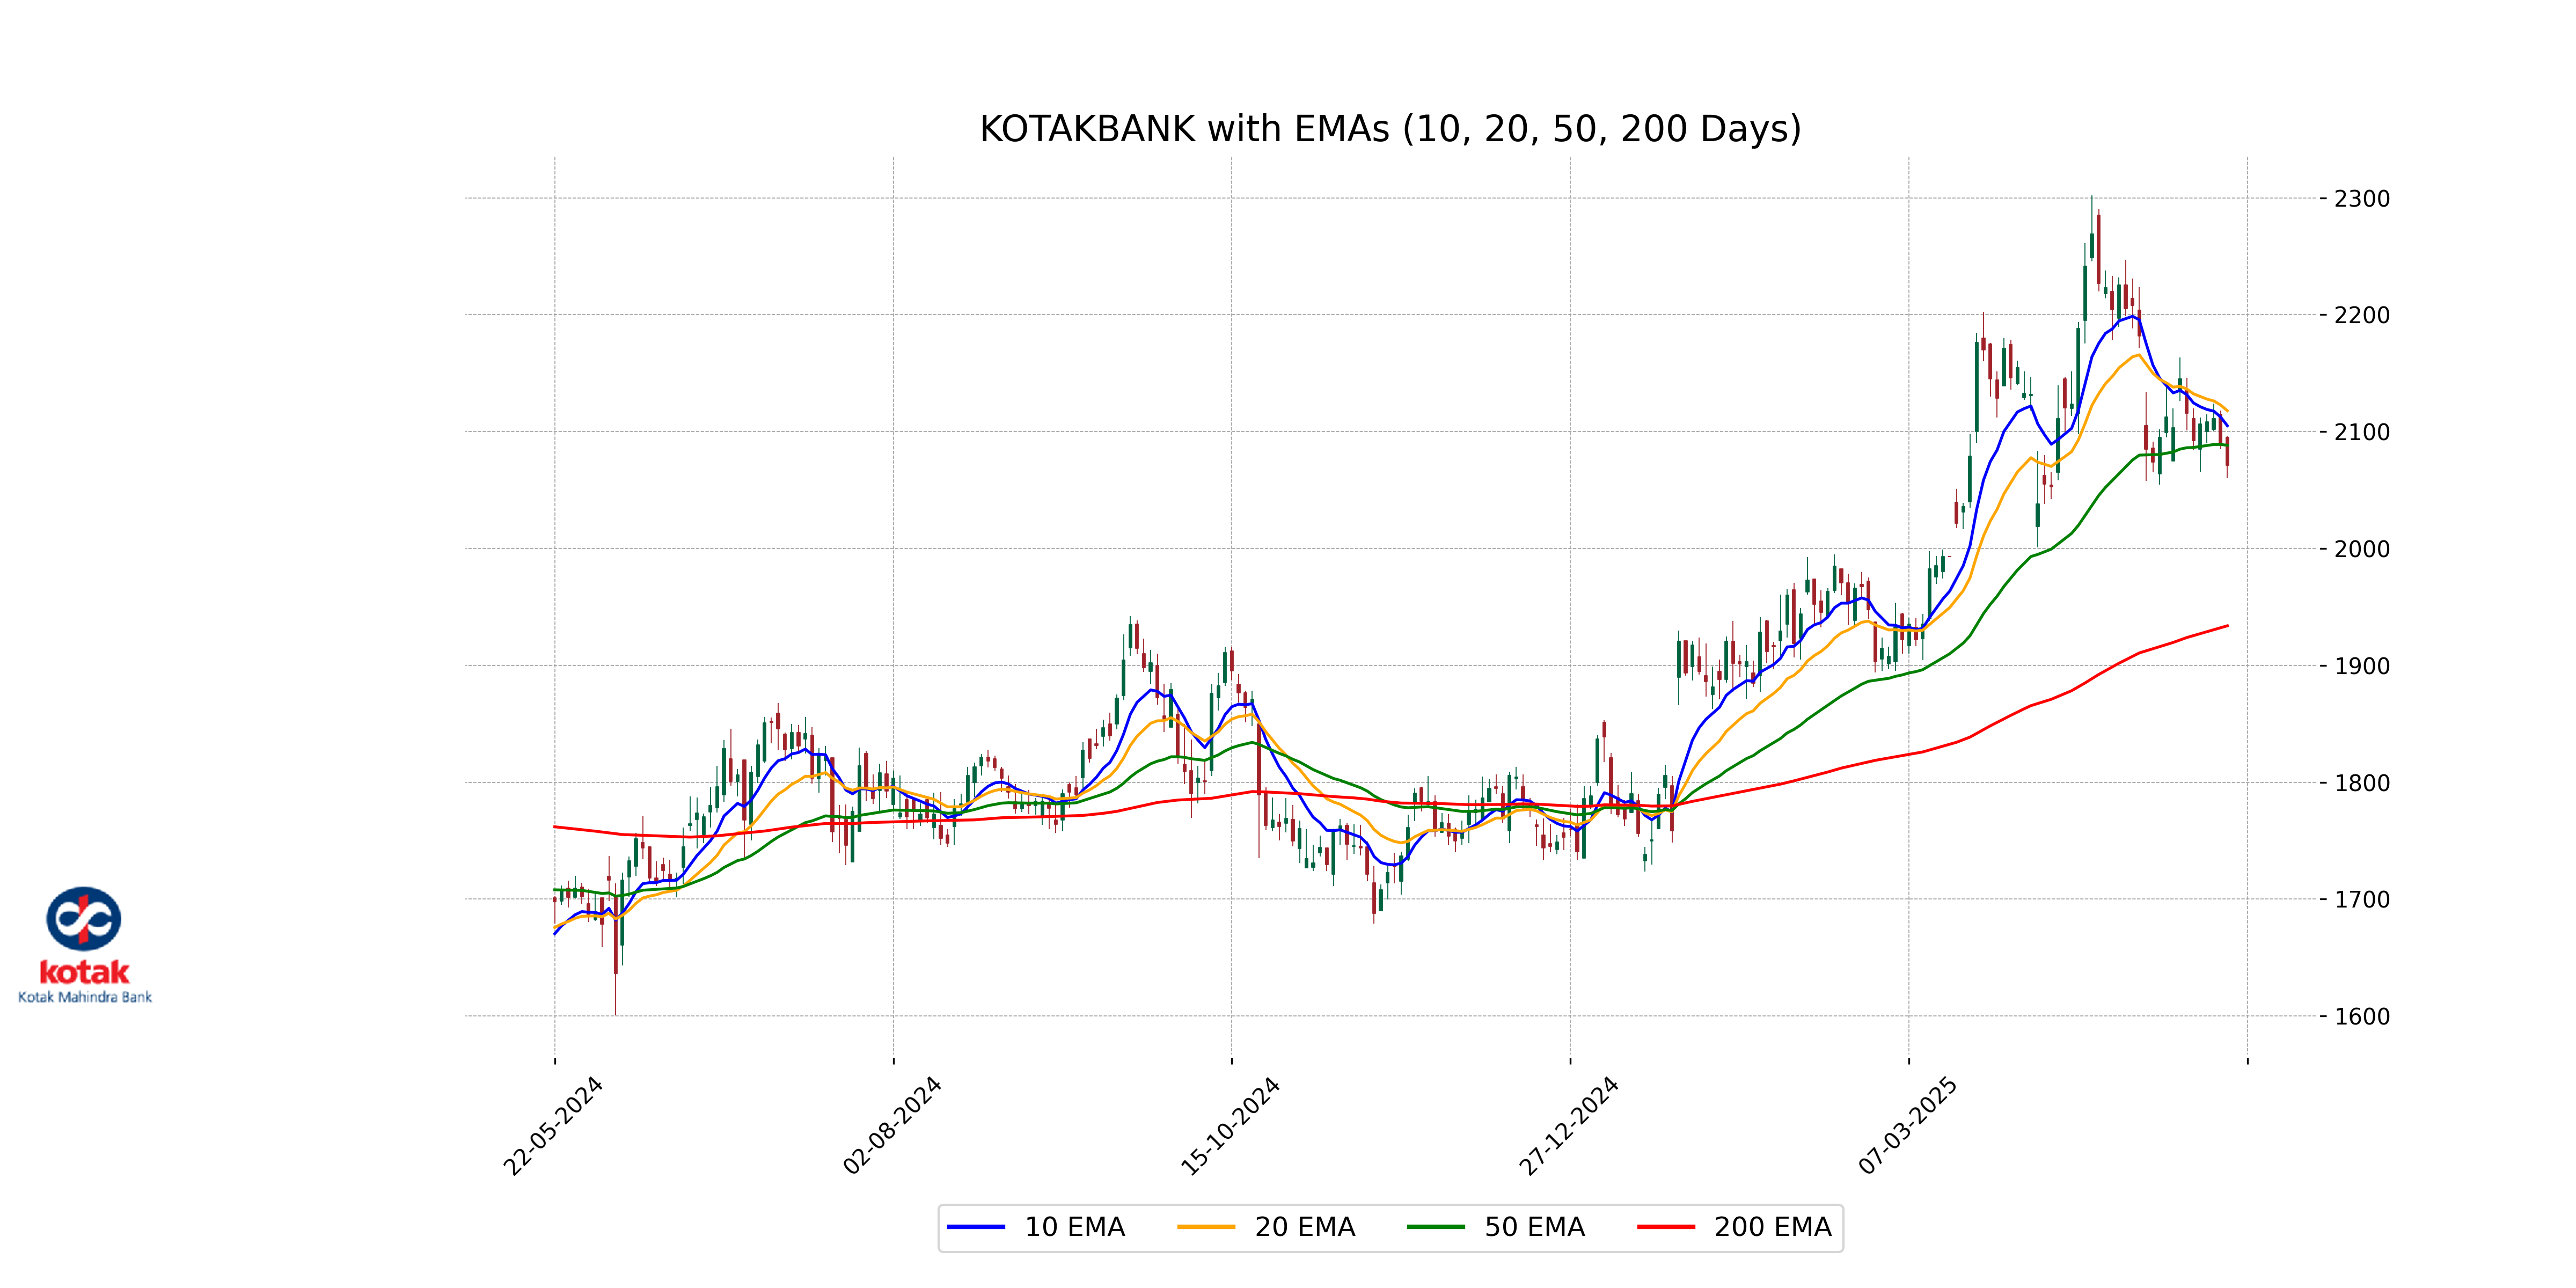
The closing price of Kotak Mahindra Bank at 2071.30 is currently below both the 50-day EMA (2088.26) and the 10-day EMA (2104.99), indicating potential bearish momentum. The price is also positioned below the 20-day EMA (2117.83), reinforcing a short-term downward trend relative to these key moving averages.
Moving Averages Trend (MACD)
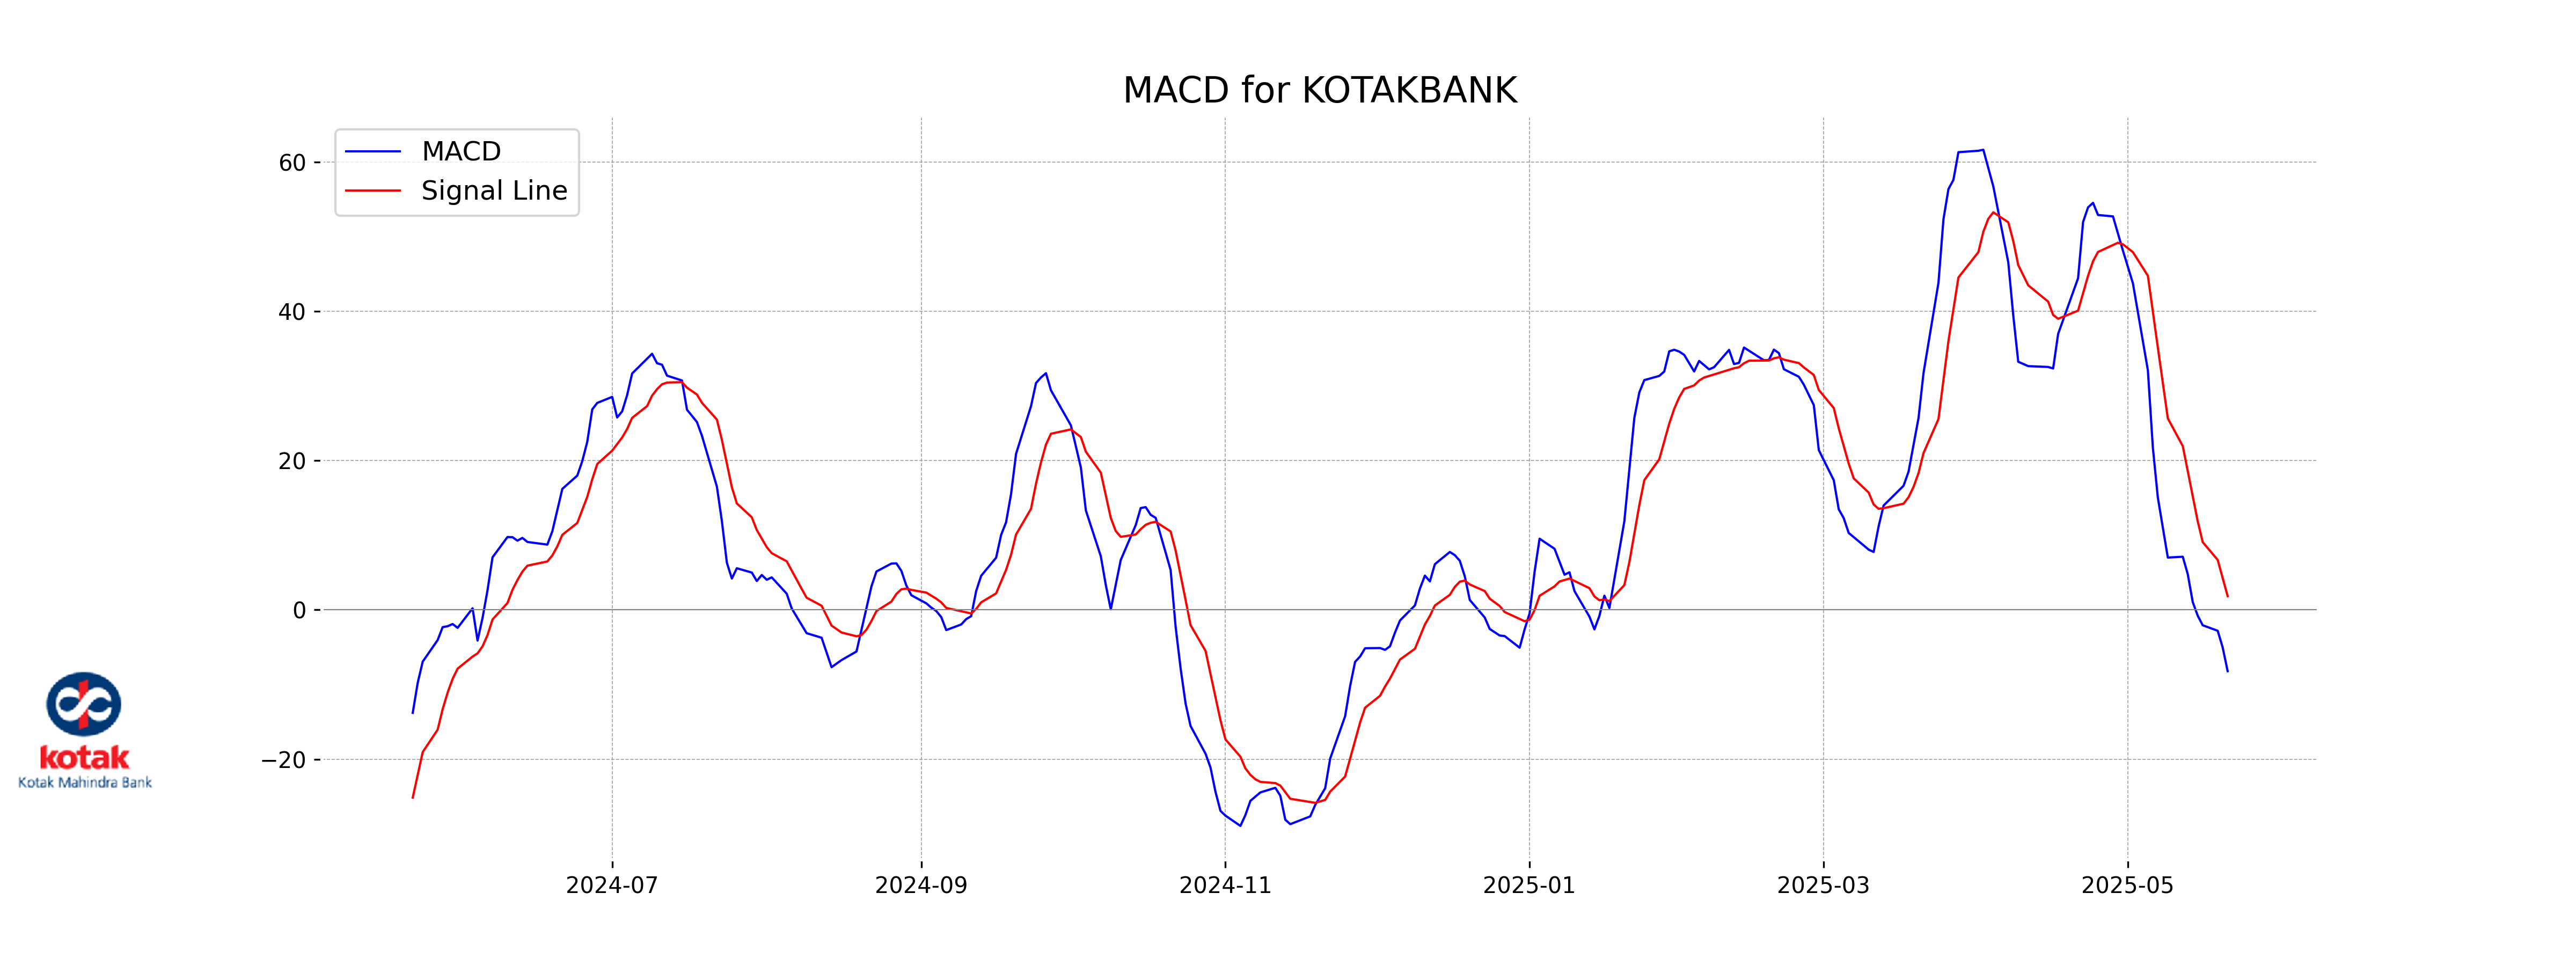
Kotak Mahindra Bank's MACD value of -8.22 indicates a bearish trend as it is below the MACD Signal line at 1.84. This might suggest that the stock price could continue to face downward pressure in the short term.
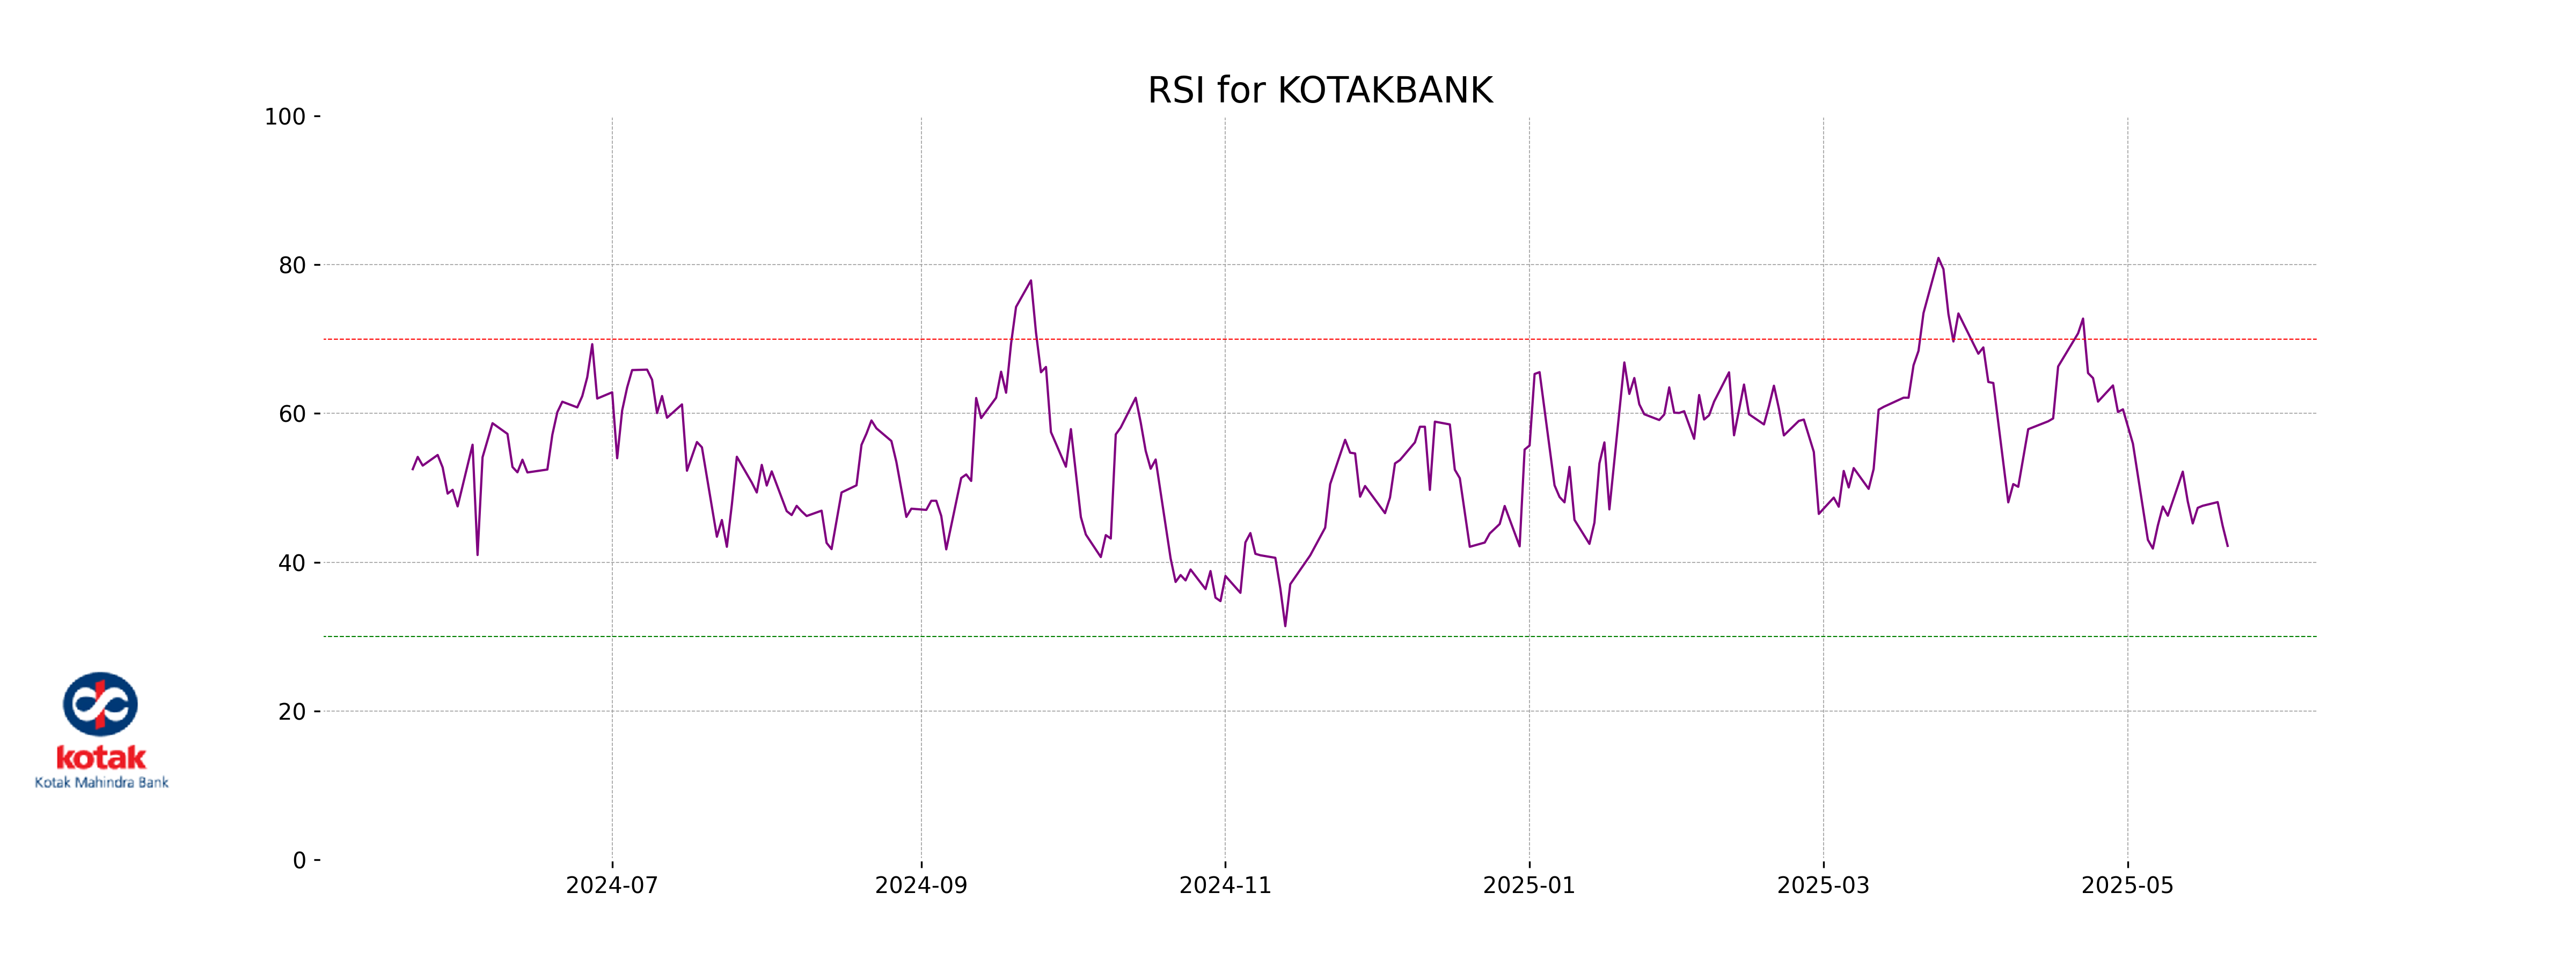
RSI Analysis
Kotak Mahindra Bank's Relative Strength Index (RSI) is at 42.20, which suggests that the stock is approaching the lower end of the neutral range. This value indicates that the stock is neither overbought nor oversold, but it is closer to being oversold, which could imply potential buying opportunities if the trend continues.
Analysis for Power Grid - May 21, 2025
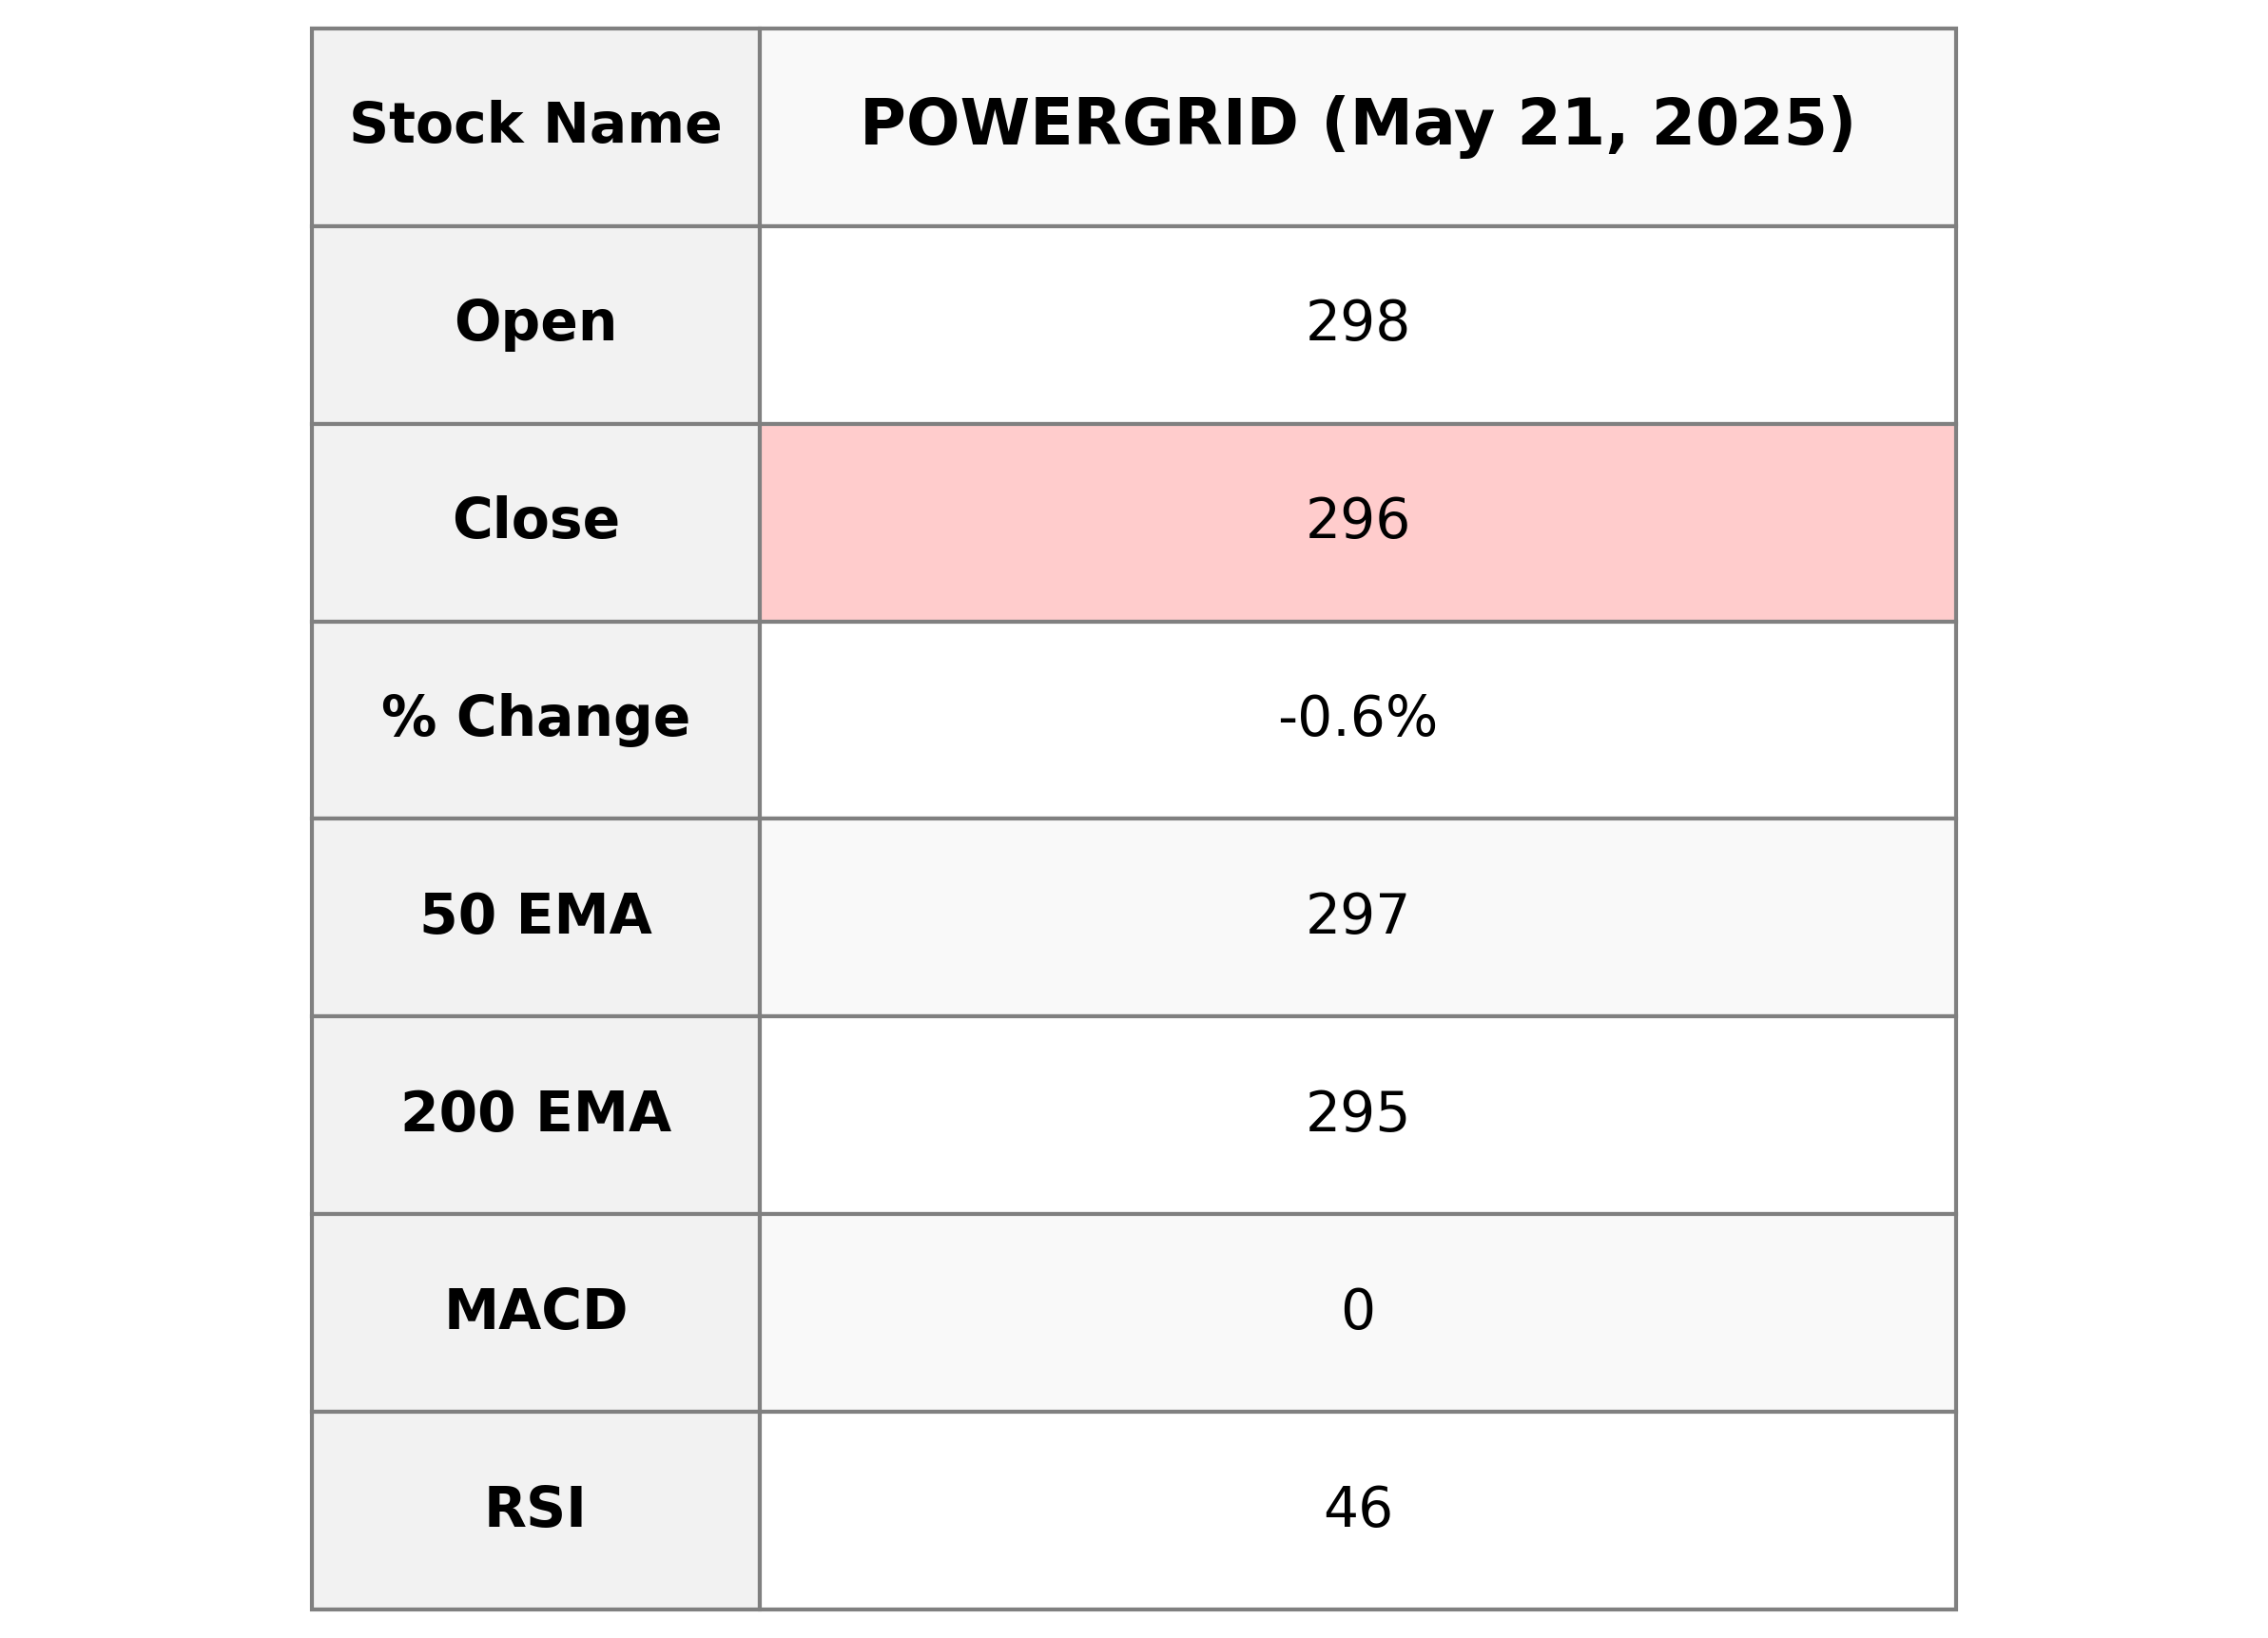
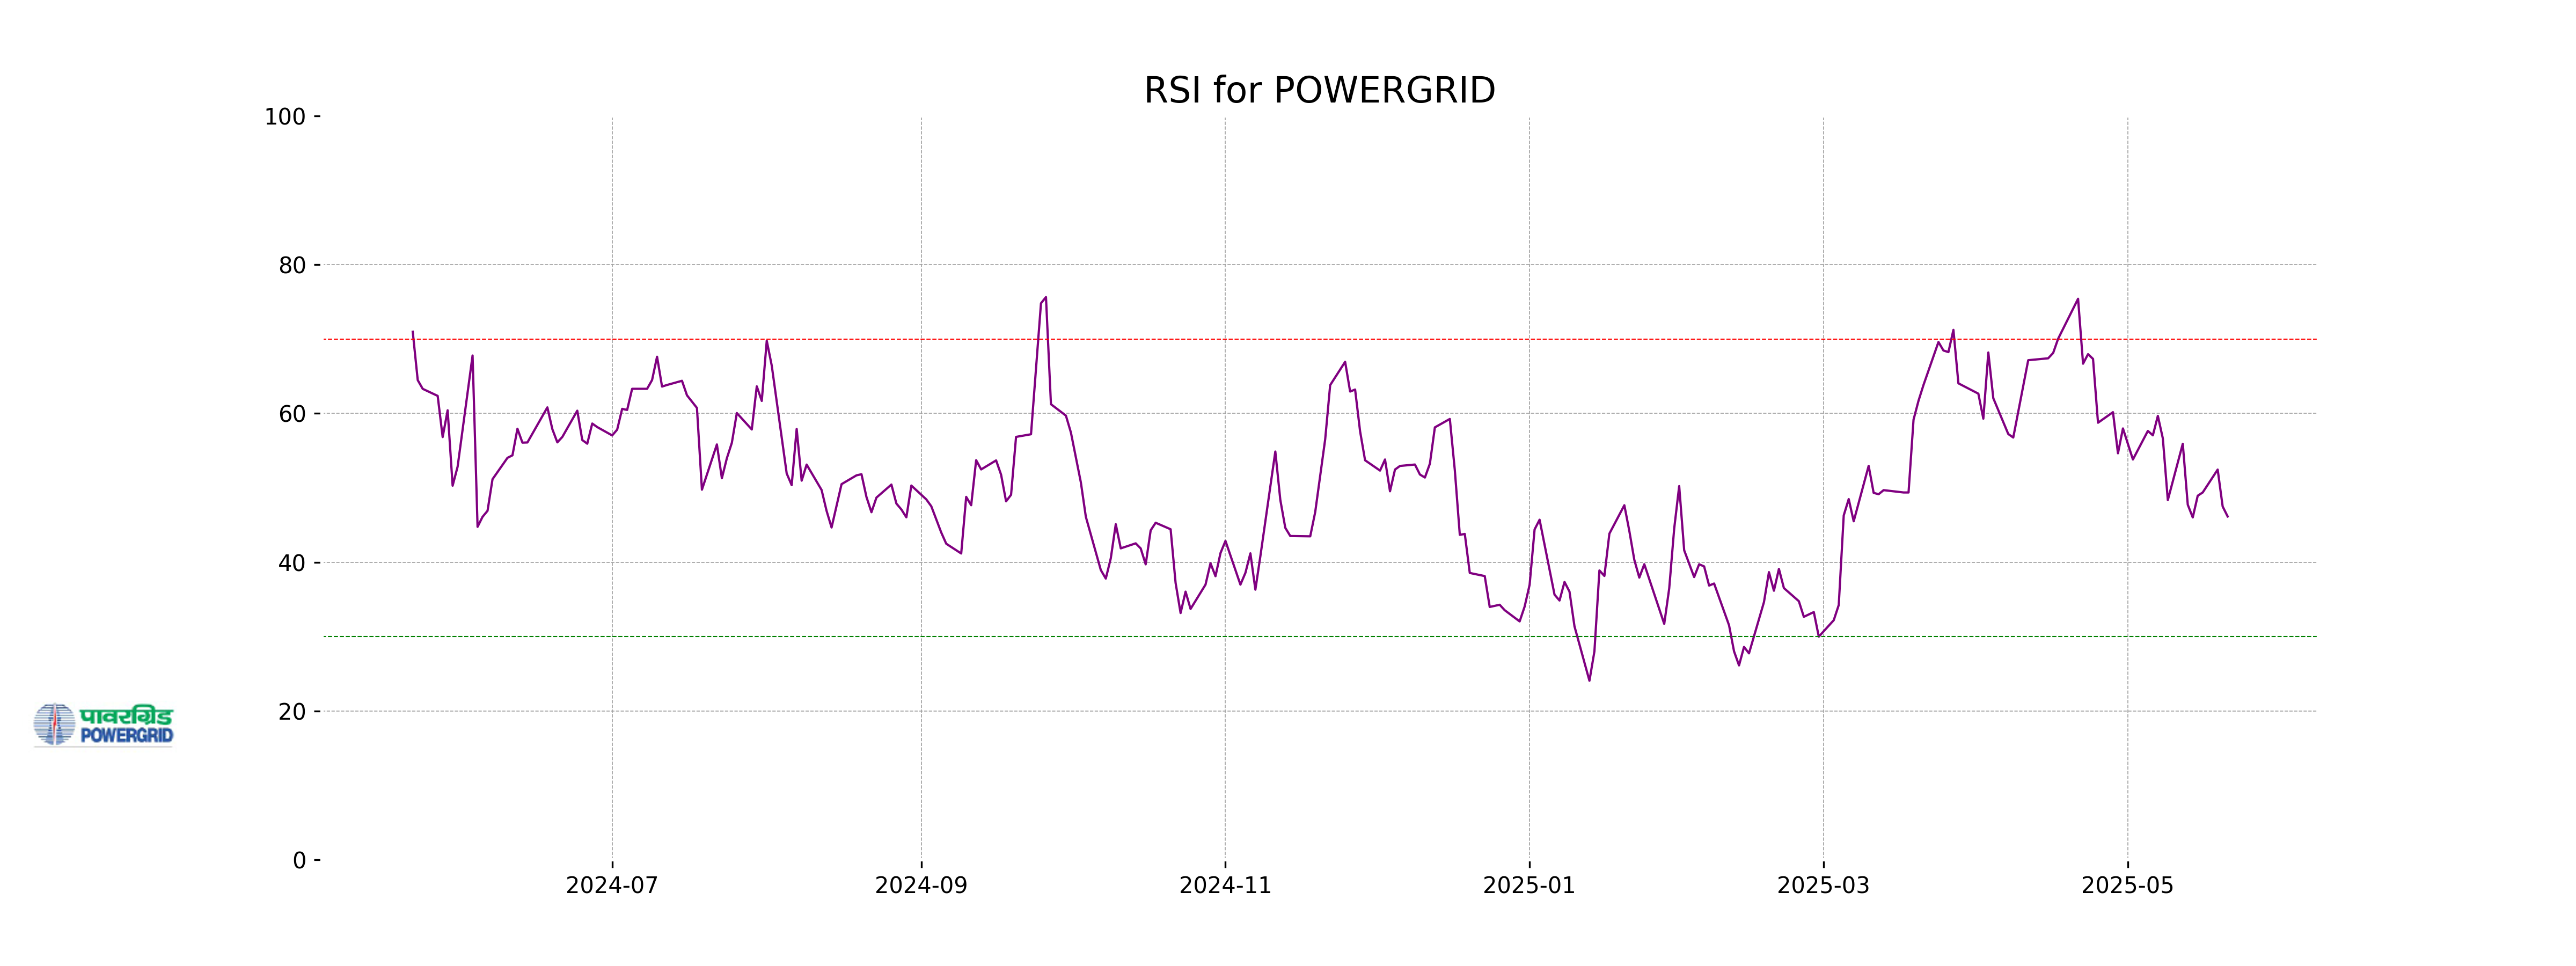
Power Grid Performance Overview: Power Grid's latest trading session closed with a slight decline, showing a 0.59% decrease from its previous close, despite reaching a high of 302.25 during the day. The stock's moving averages show it is trading just under its 50-day EMA but above its 200-day EMA, indicating potential mixed short-term and long-term trends. With an RSI of 46.15, the stock is hovering near neutral territory, suggesting balanced buying and selling pressure recently.
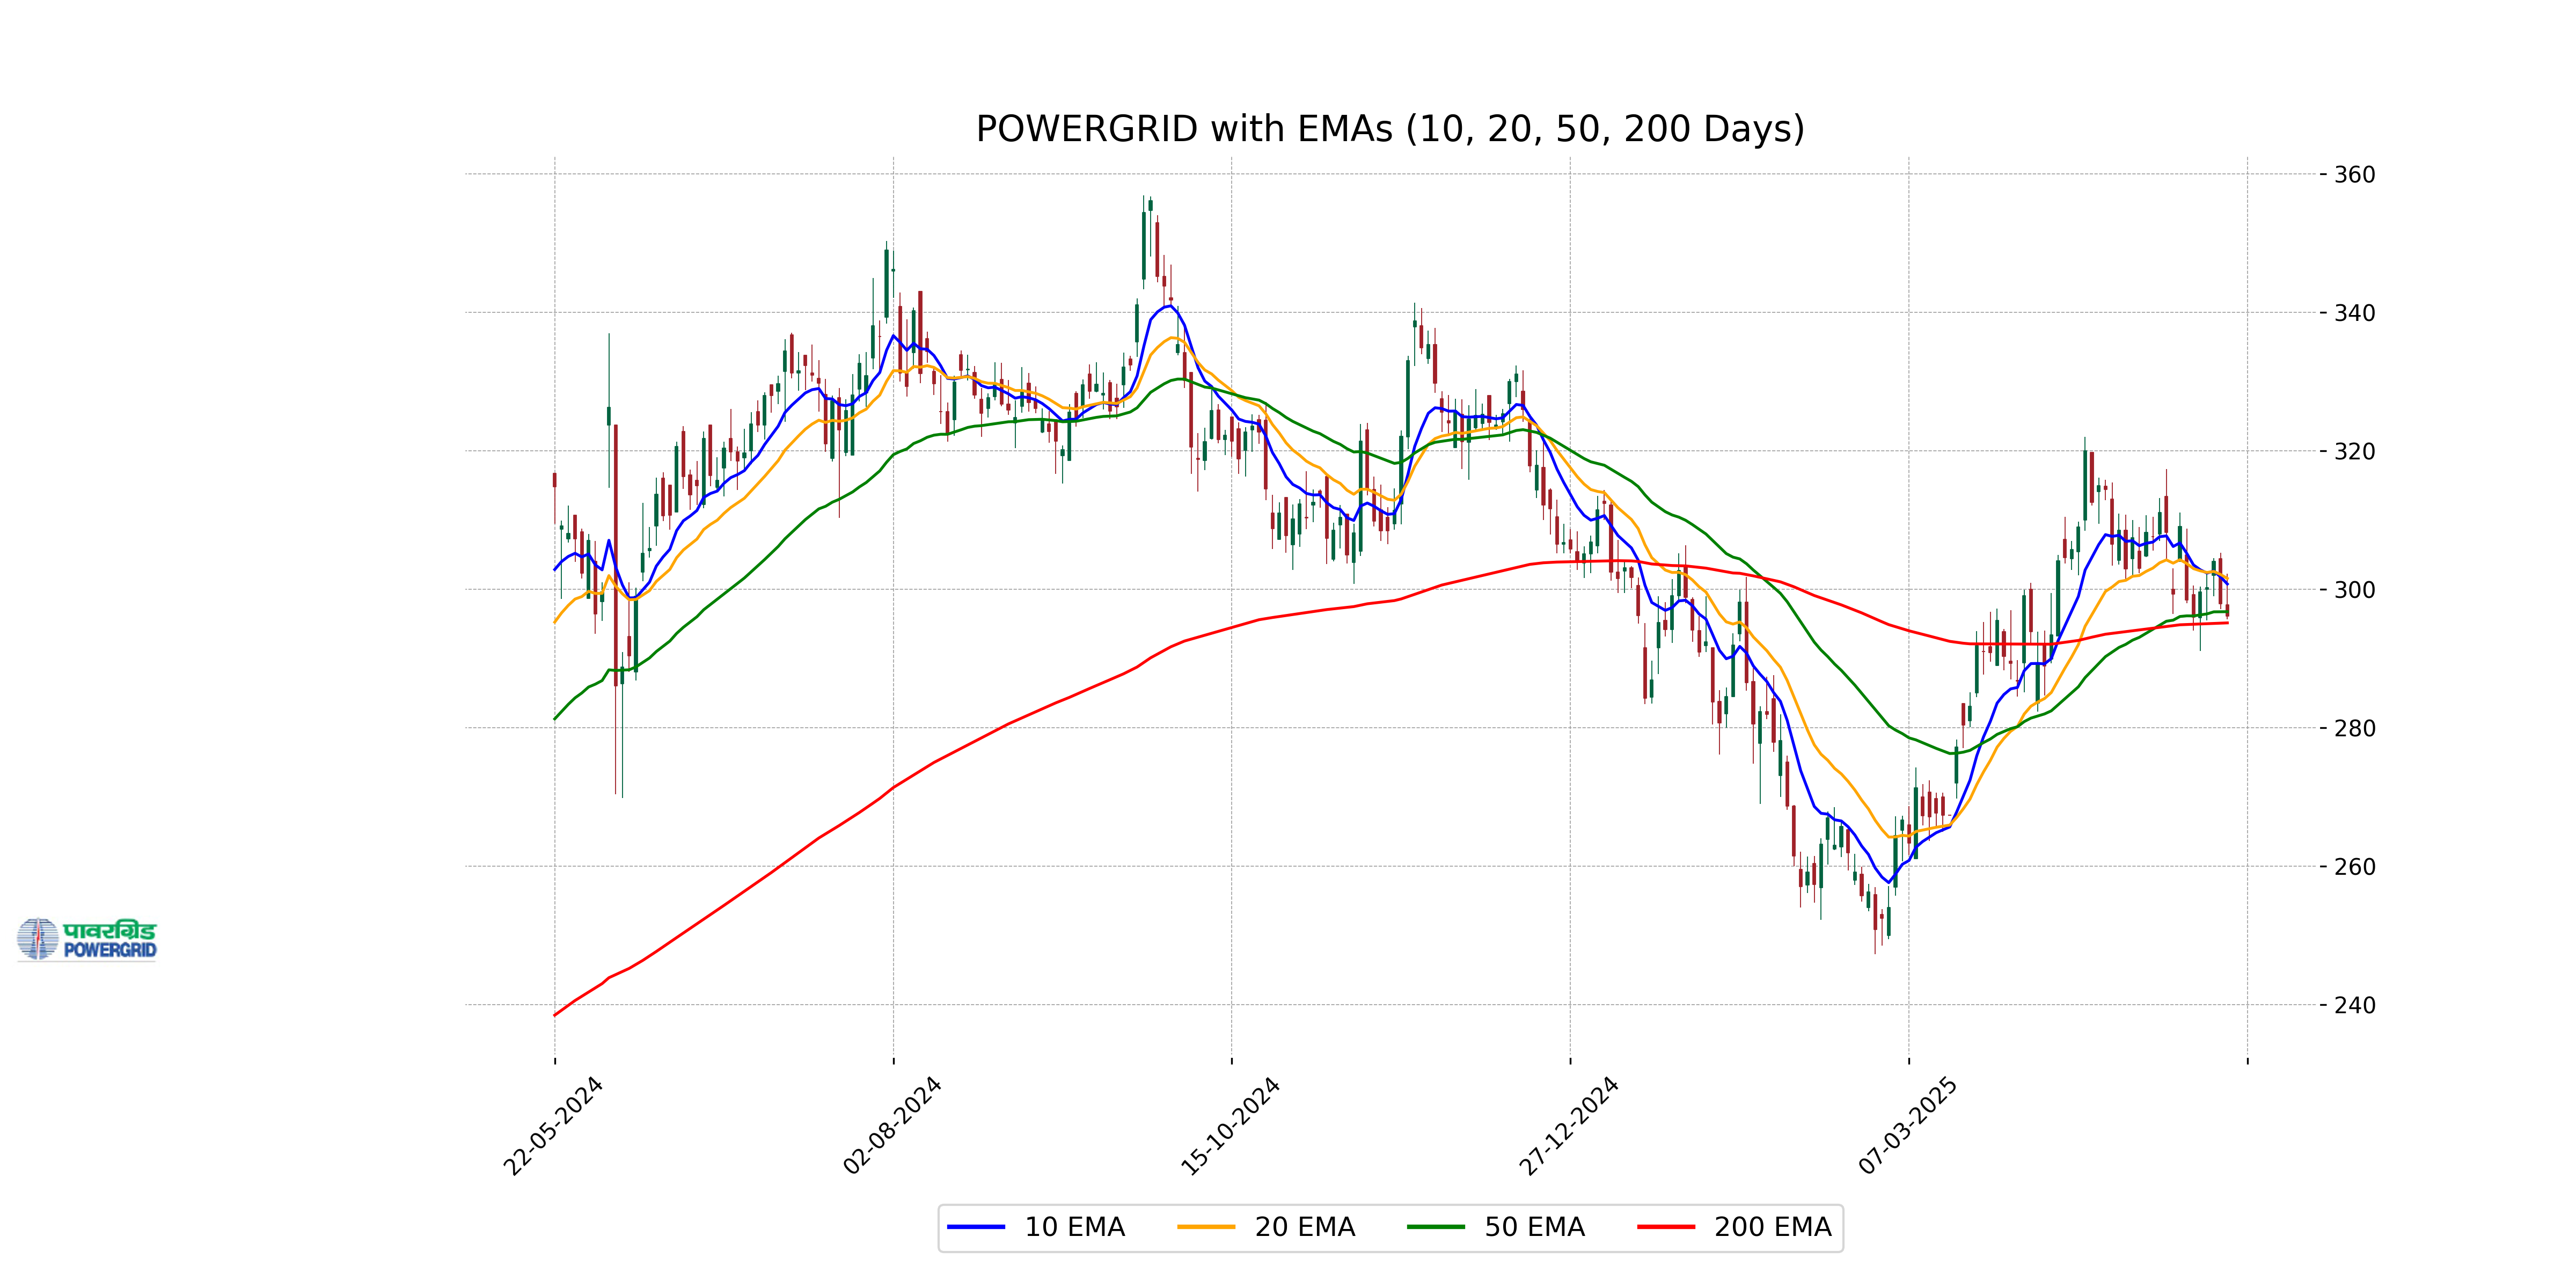
Relationship with Key Moving Averages
Power Grid's closing price of 296.15 is slightly below its 50-day EMA of 296.76 but above the 200-day EMA of 295.15, indicating a short-term weakness but long-term strength. Additionally, the 10-day EMA at 300.76 and the 20-day EMA at 301.57 are above the closing price, suggesting current pricing pressure.
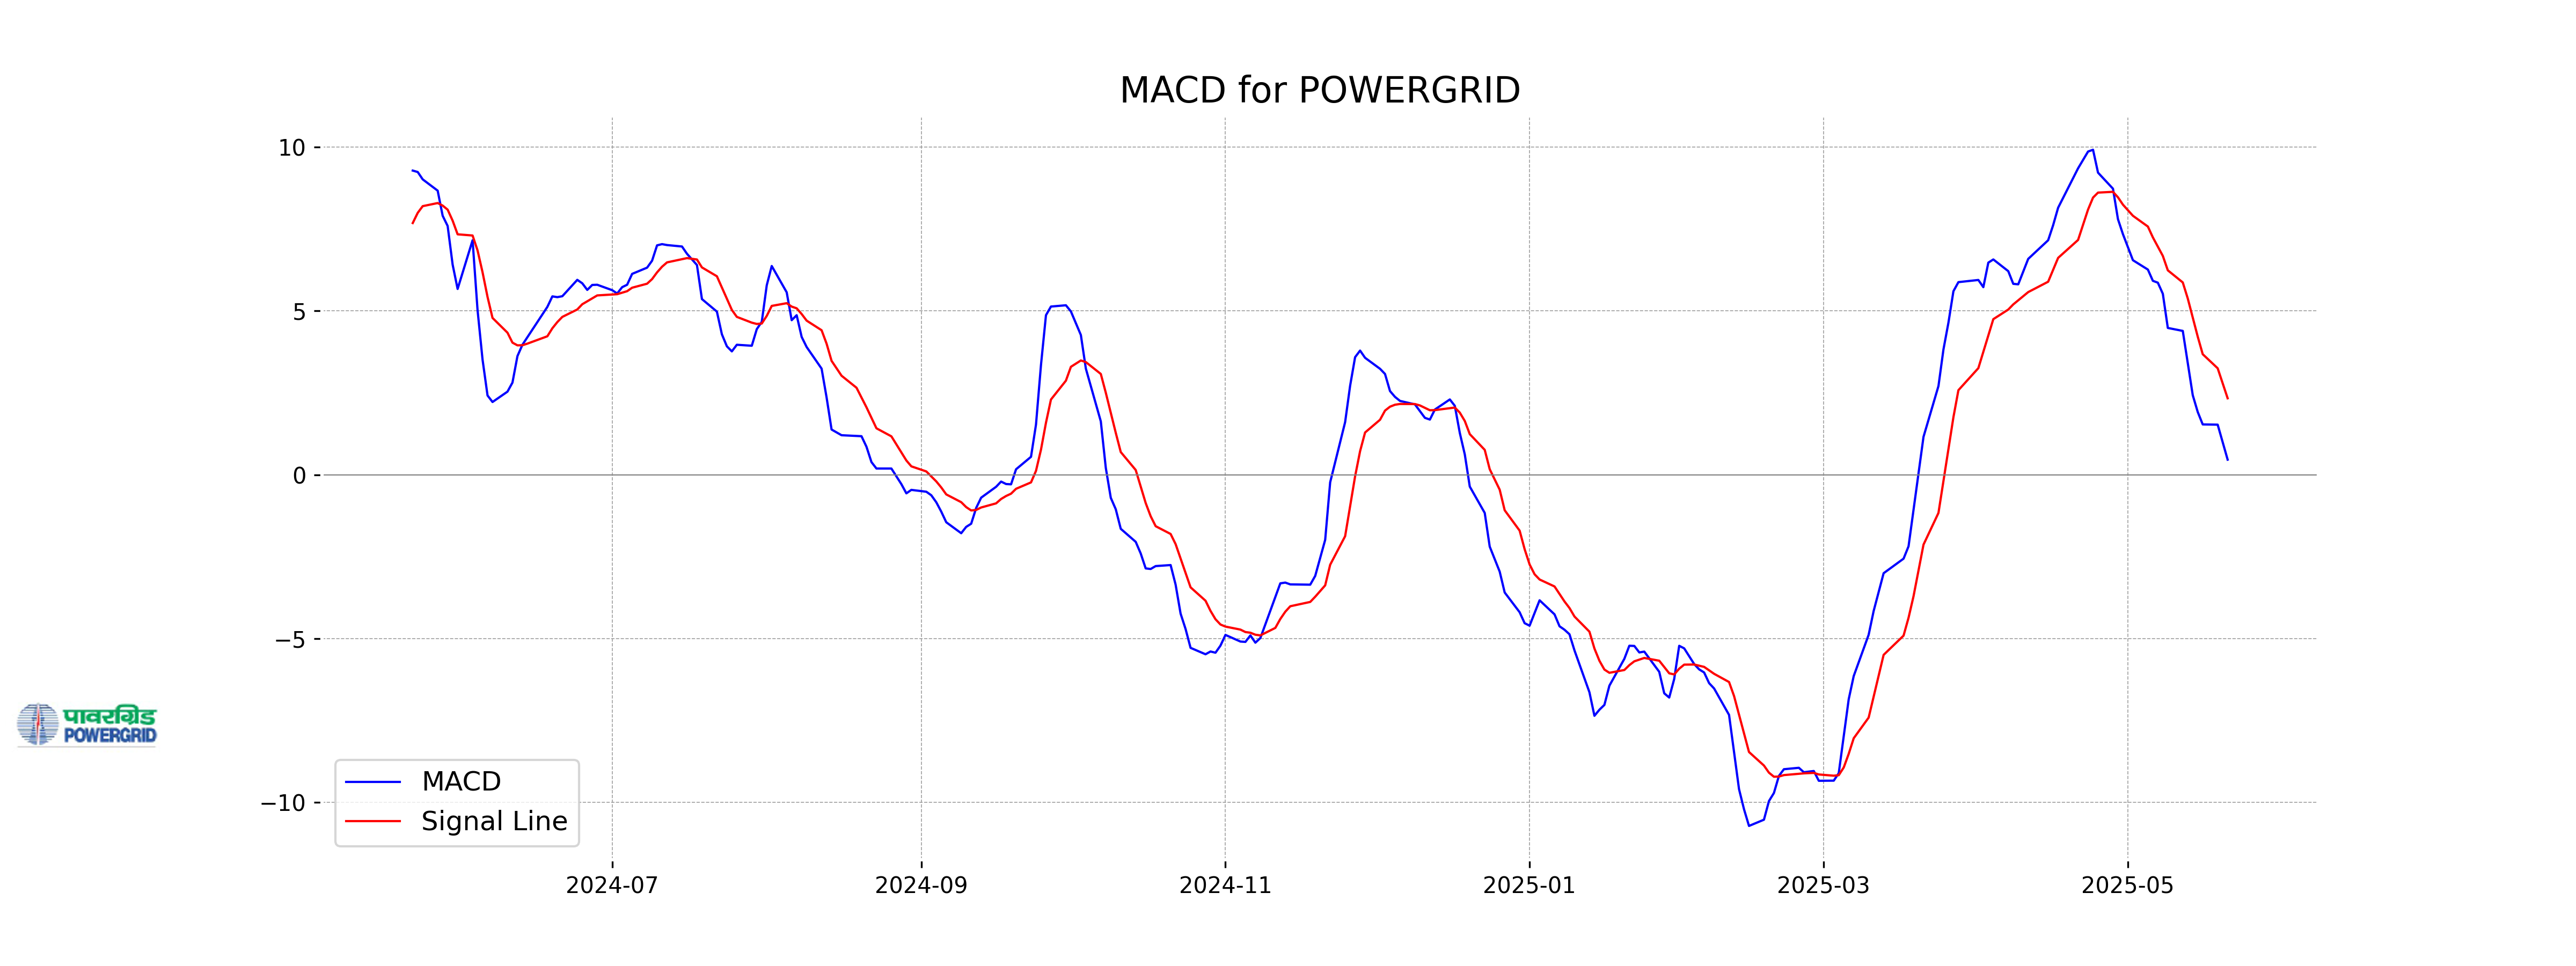
Moving Averages Trend (MACD)
The MACD for Power Grid stands at 0.4625, which is below its MACD signal line of 2.3356. This suggests a bearish momentum as the MACD is trending lower than its signal line. Additionally, both the 10 EMA and 20 EMA are higher than the current close, indicating potential downward pressure.
RSI Analysis
RSI Analysis for Power Grid: The Relative Strength Index (RSI) for Power Grid is 46.15, which indicates a neutral market condition. An RSI close to 50 suggests that the stock is neither overbought nor oversold, suggesting a balance between buying and selling pressures in recent trading sessions.