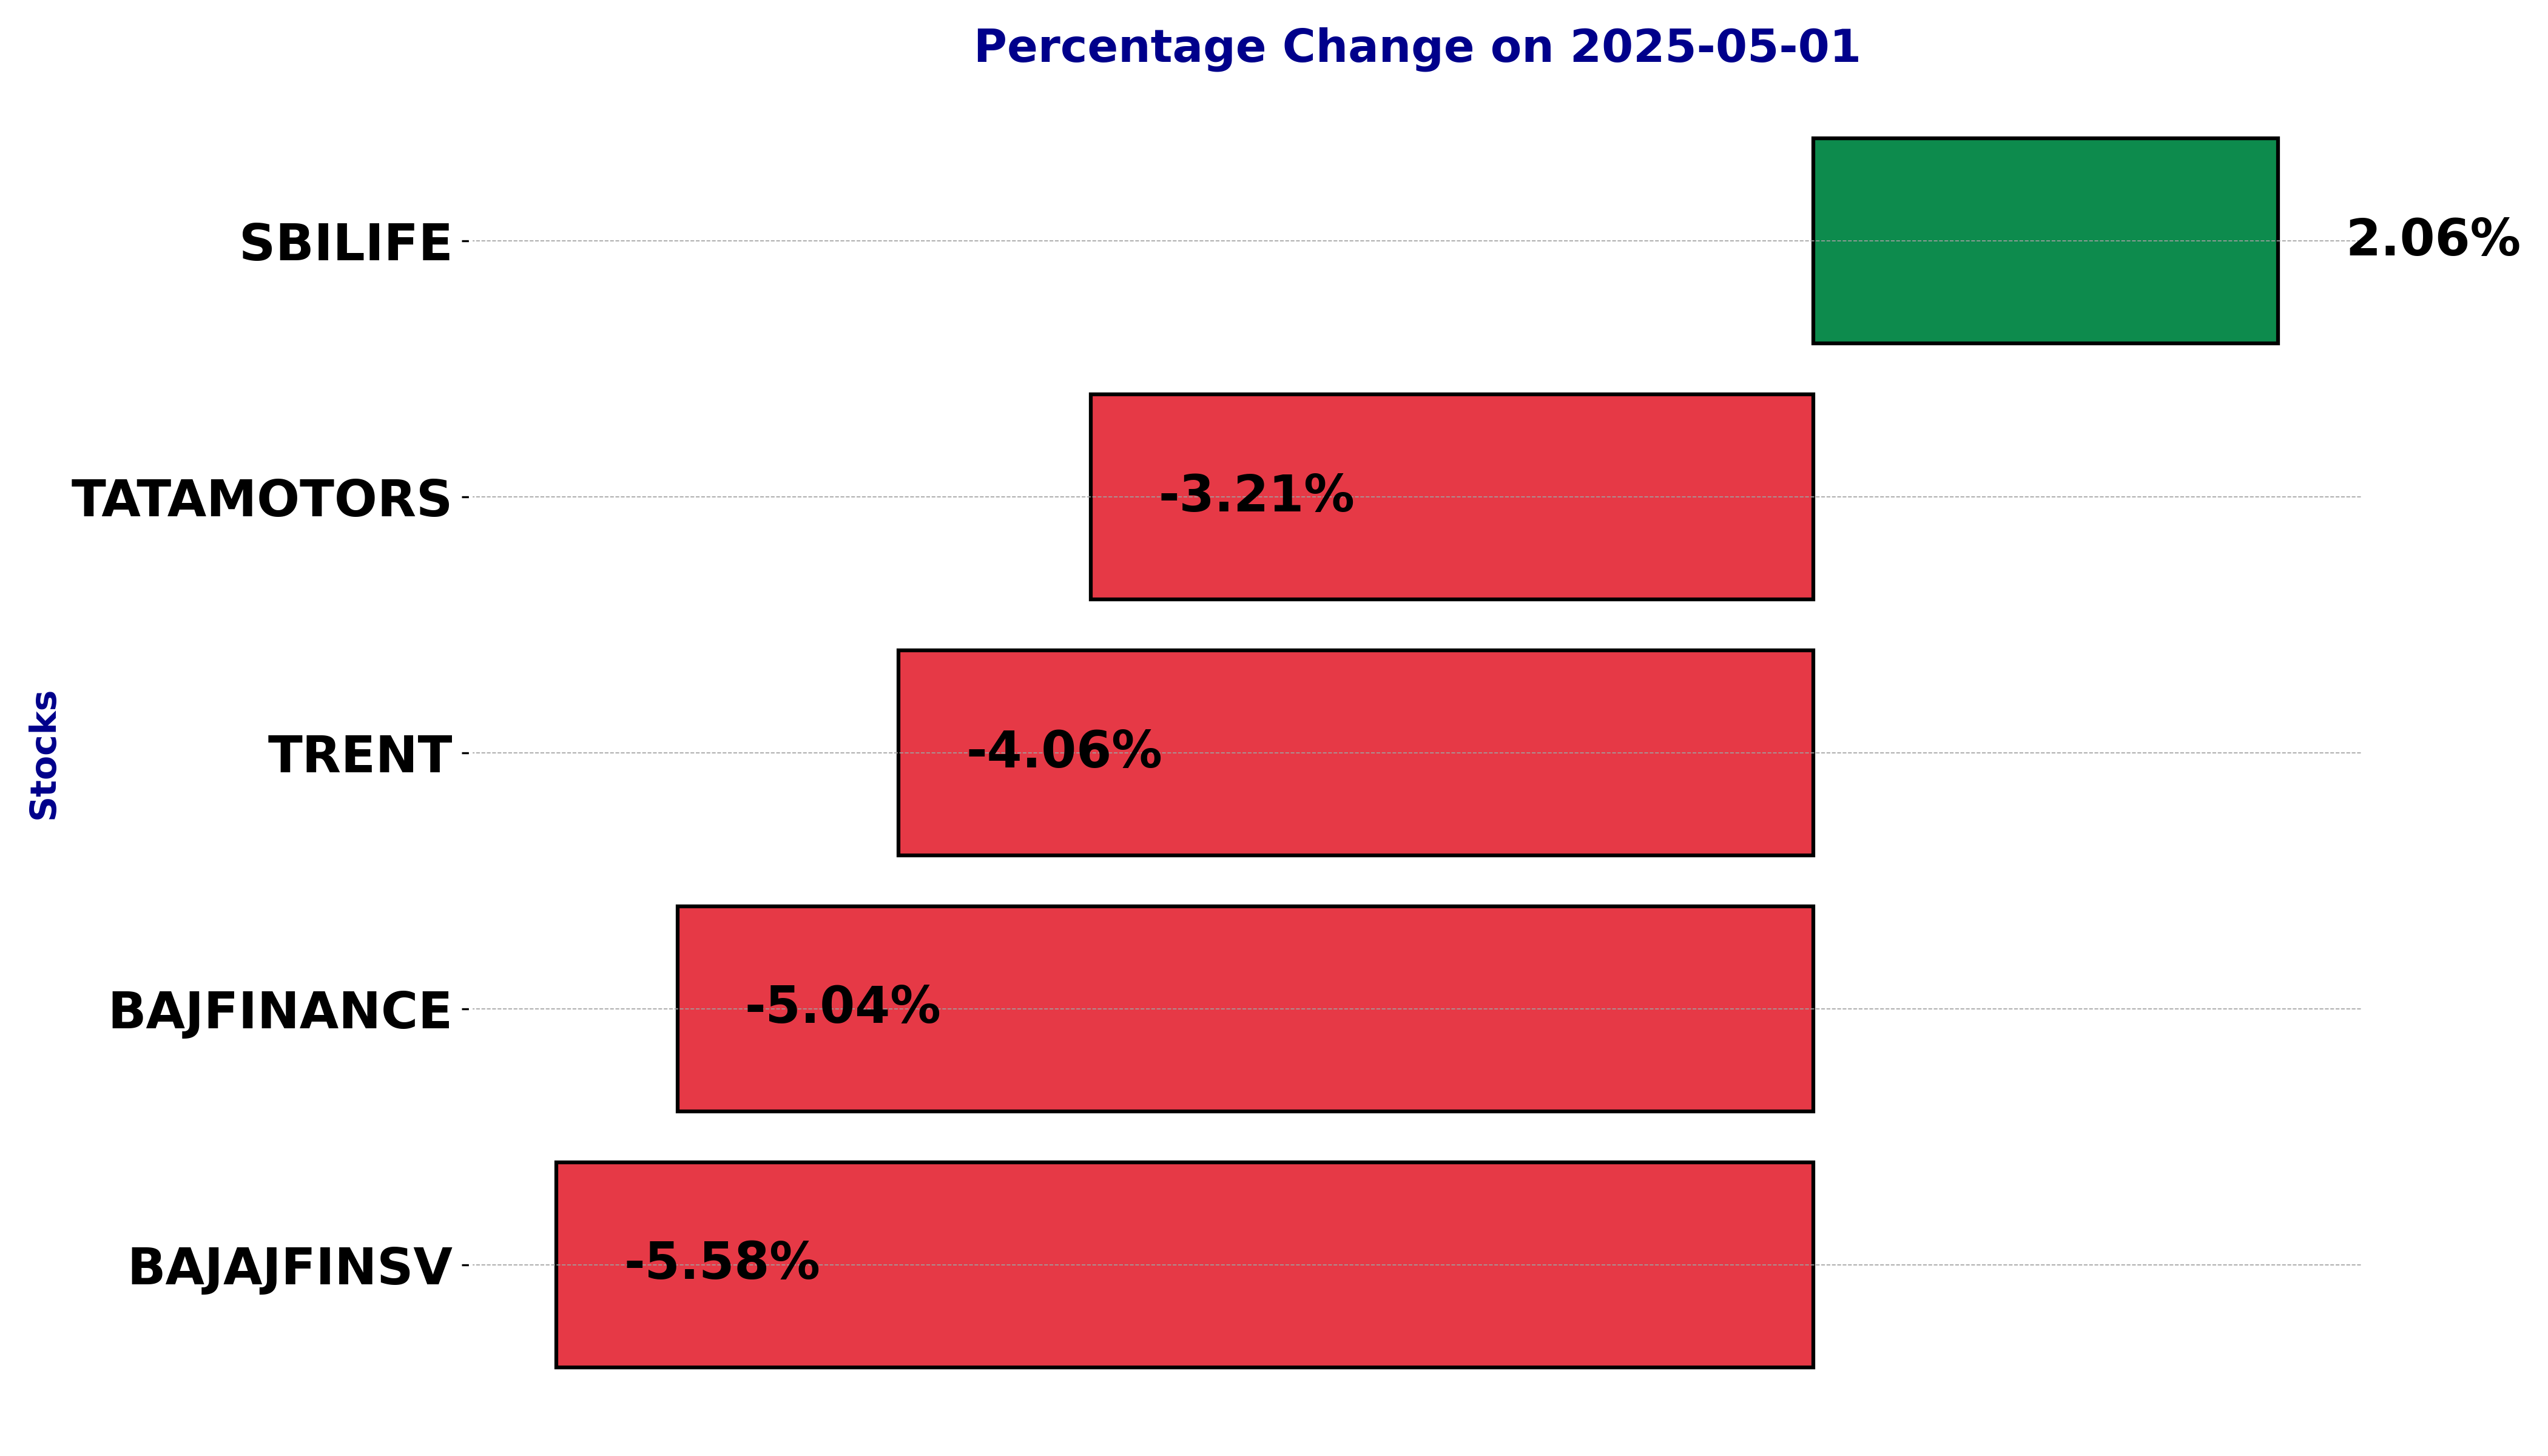
NSE Nifty 50: Top 5 stock losers of May 1, 2025
In this article, we will explore the technical indicators of some of the low-performing stocks on the Indian stock market, including BAJAJFINSV, BAJFINANCE, SBILIFE, TATAMOTORS, and TRENT.
By looking at these stocks through the lens of key technical factors, we aim to better understand their price movements, trends, and potential future performance.
Analysis for Bajaj Finserv - May 01, 2025
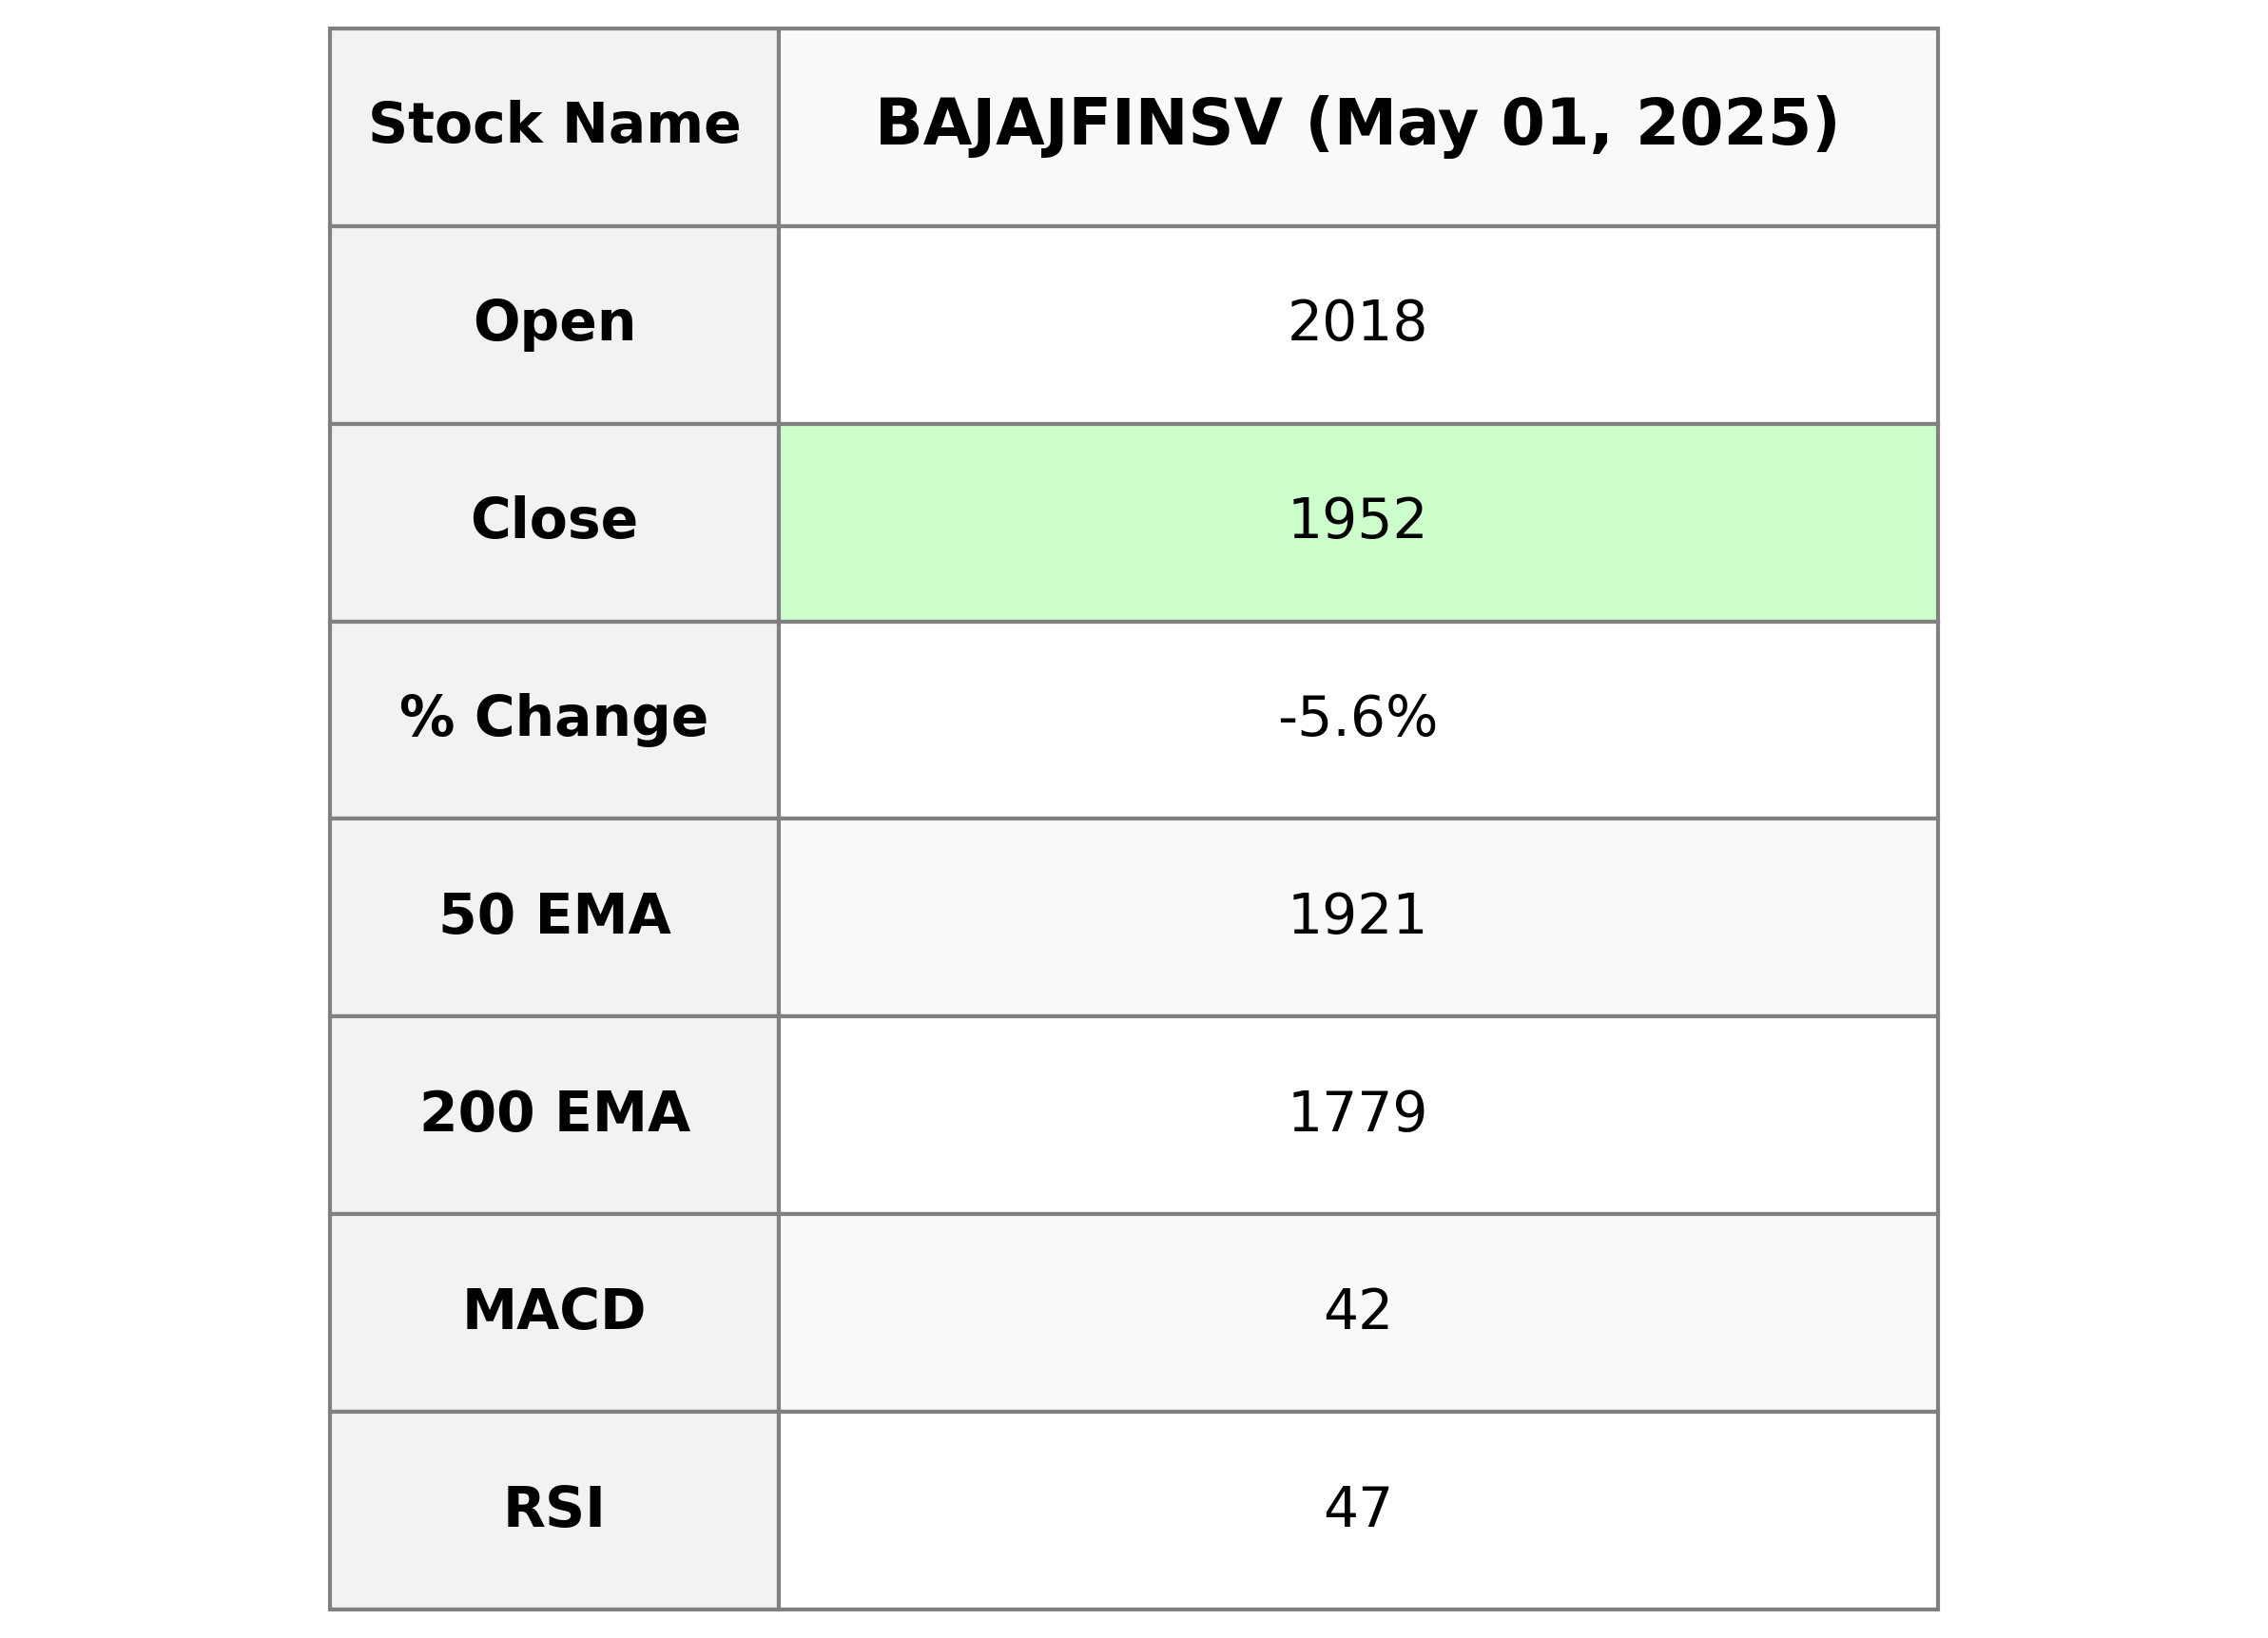
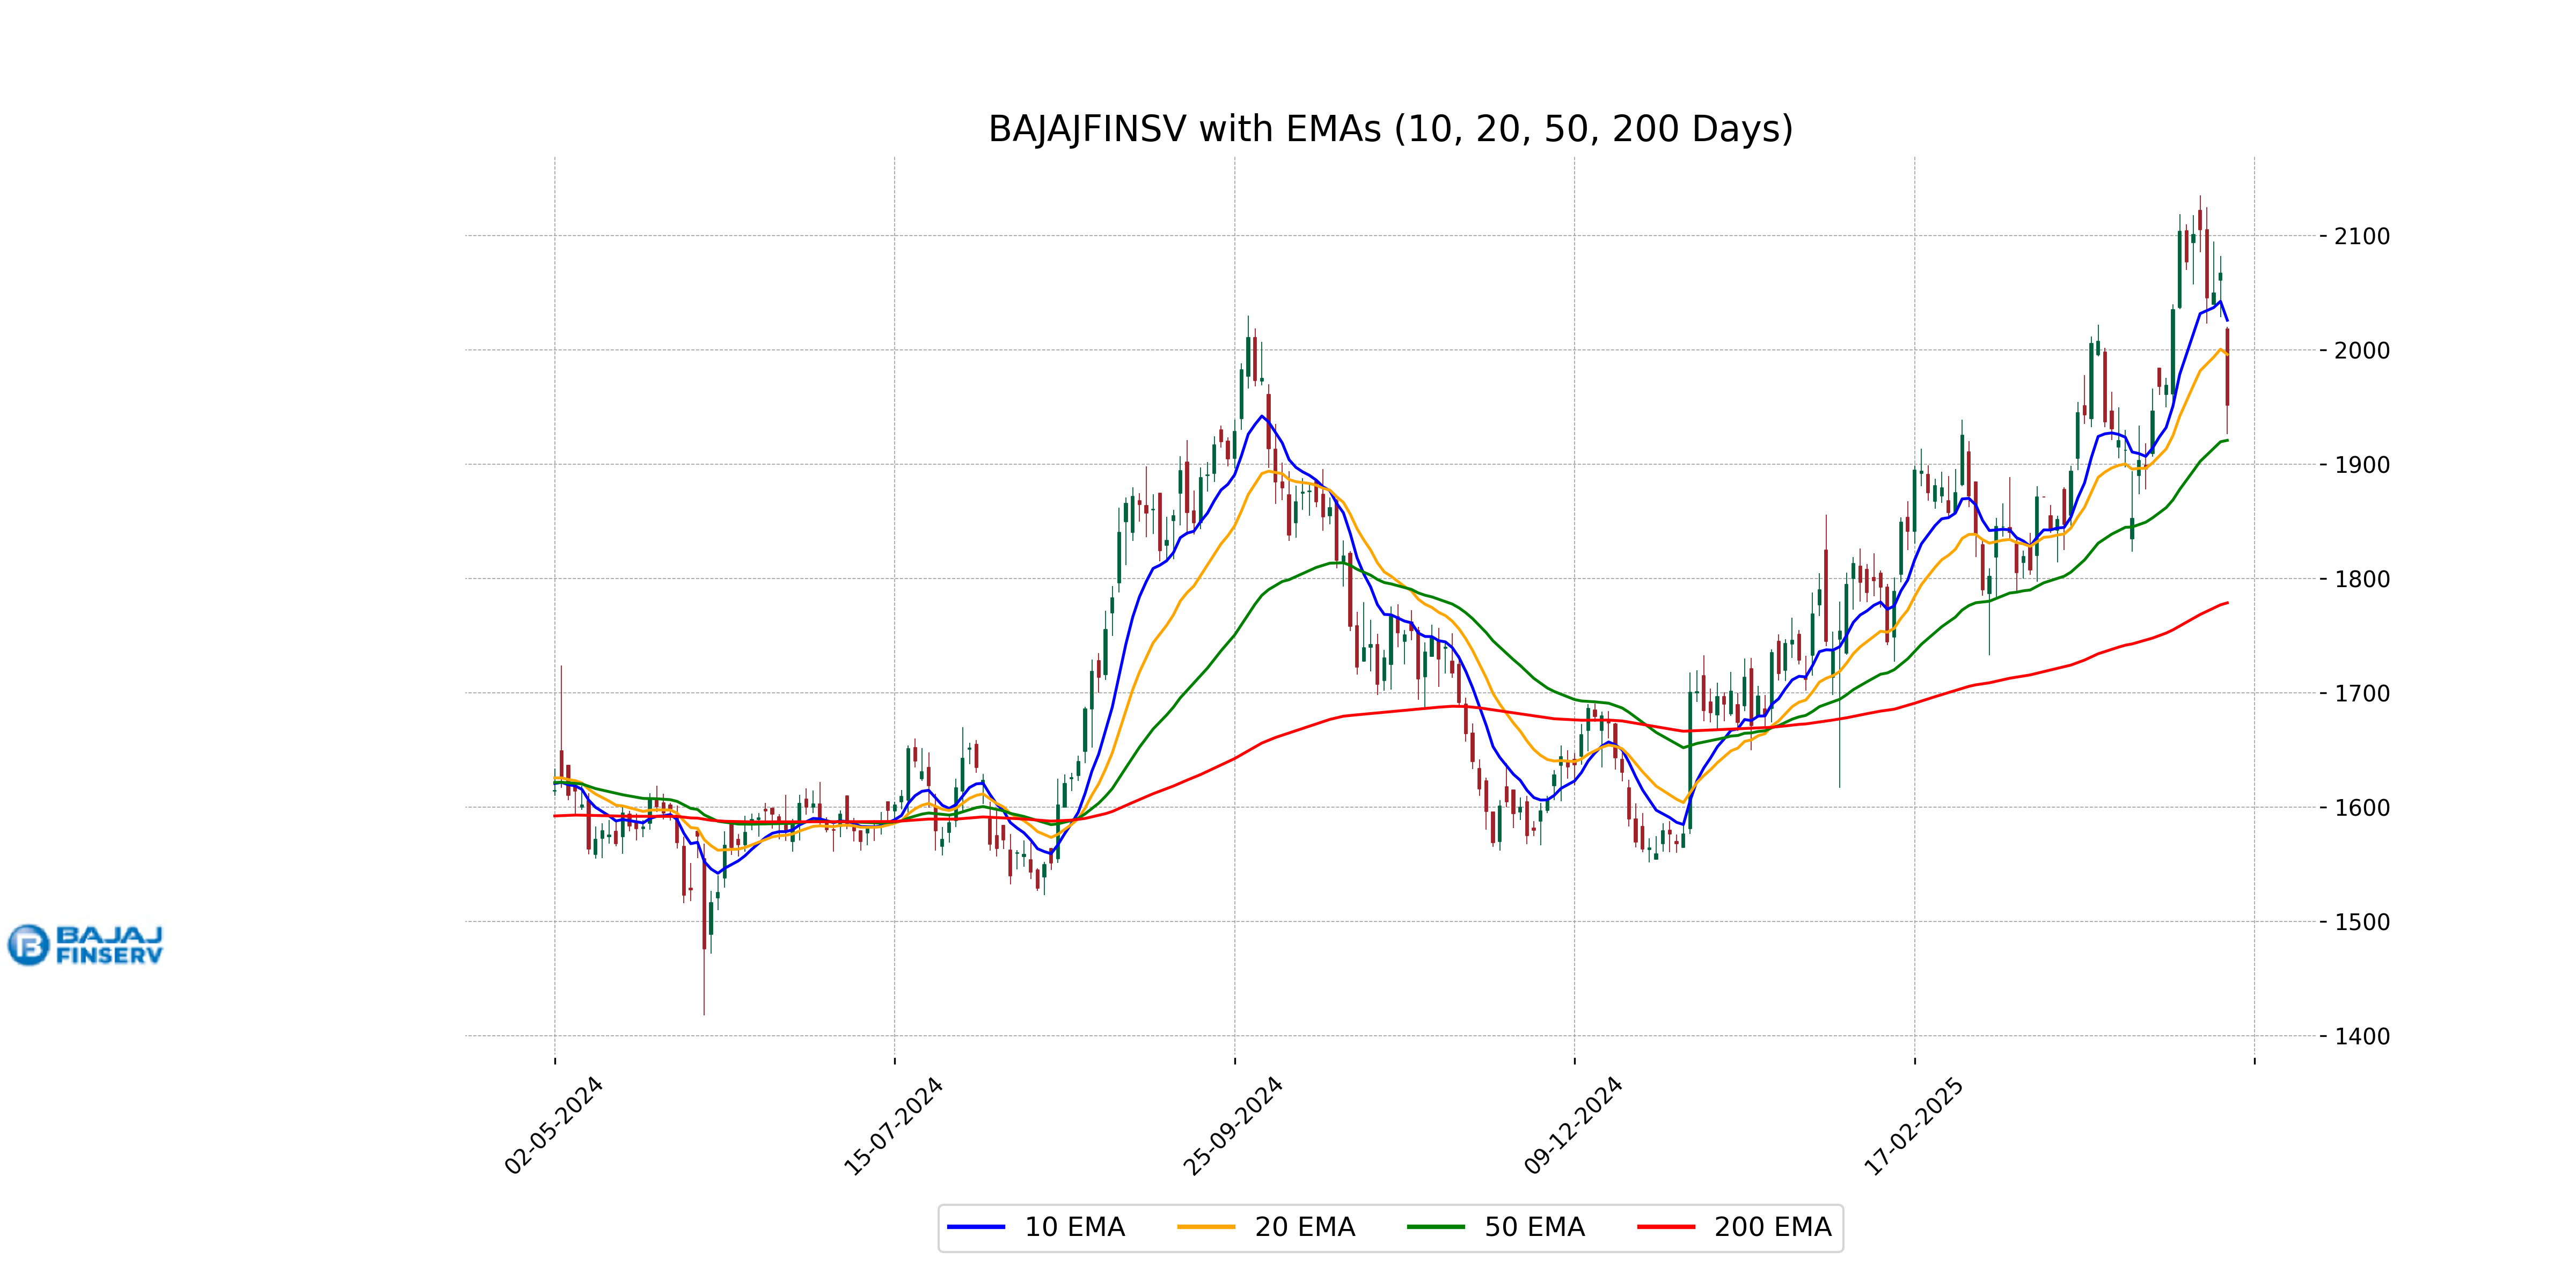
Bajaj Finserv closed at 1951.60, experiencing a decrease of -5.58% from its previous close of 2066.90. The stock witnessed a high of 2020 and a low of 1926.5. Despite a negative percentage and points change, it remains above its 50-EMA of 1920.91 and significantly above its 200-EMA of 1778.78. The company's market cap stands at 3.12 trillion INR, with a PE Ratio of 35.46, indicating robust financial standing in the Financial Conglomerates industry.
Relationship with Key Moving Averages
Bajaj Finserv's closing price of 1951.60 is above the 50-day EMA of 1920.91, indicating a short-term upward trend, but it is below the 10-day and 20-day EMAs of 2025.96 and 1995.99, respectively, suggesting potential short-term resistance. The price is significantly above the 200-day EMA of 1778.78, maintaining a long-term positive outlook.
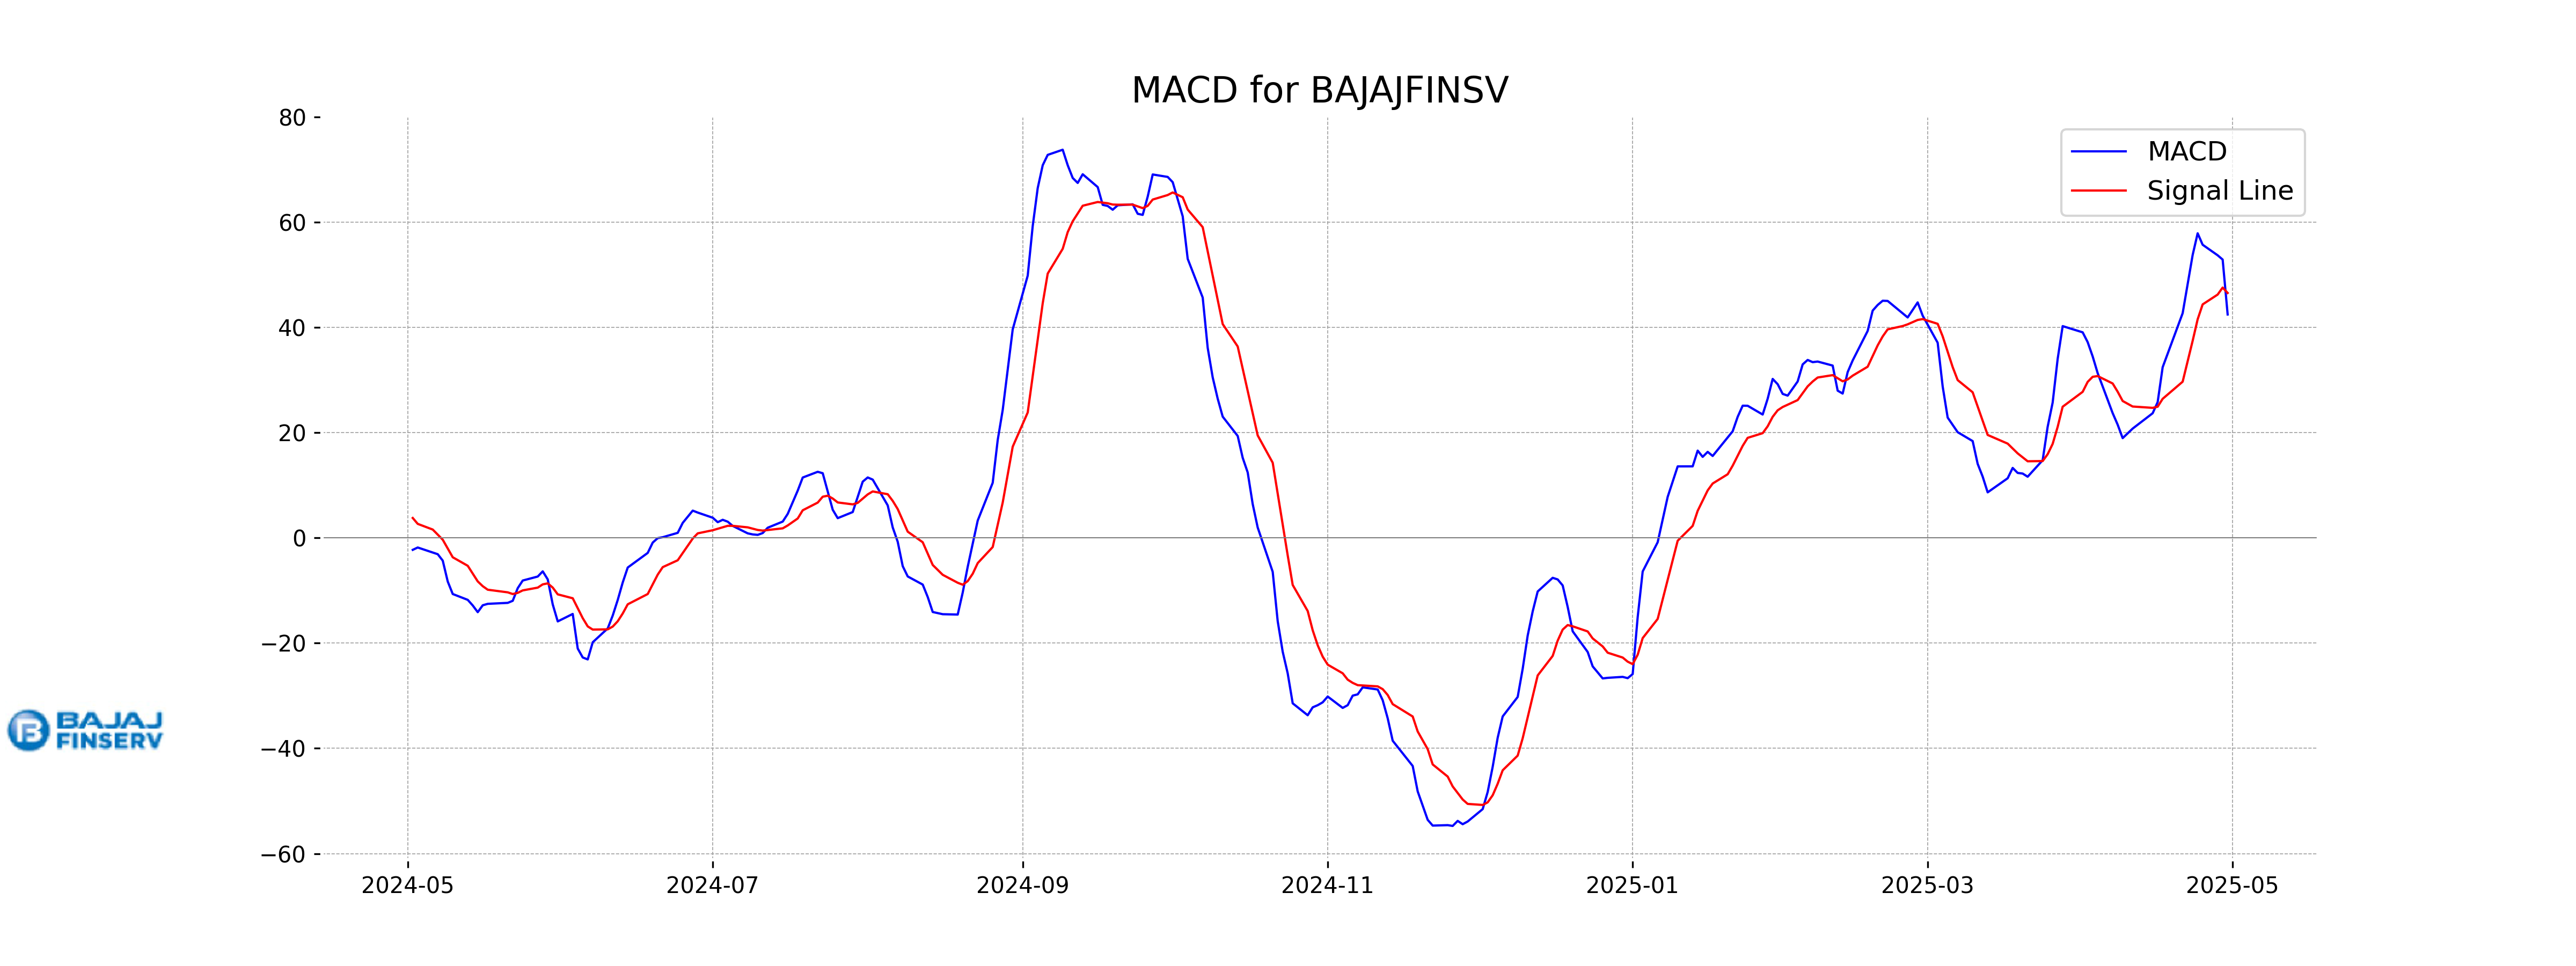
Moving Averages Trend (MACD)
MACD Analysis for Bajaj Finserv: The MACD for Bajaj Finserv is currently at 42.44, which is below its MACD Signal line of 46.53, indicating a bearish signal. This suggests that the momentum might be weakening, and there could be a further decline unless there's a reversal.
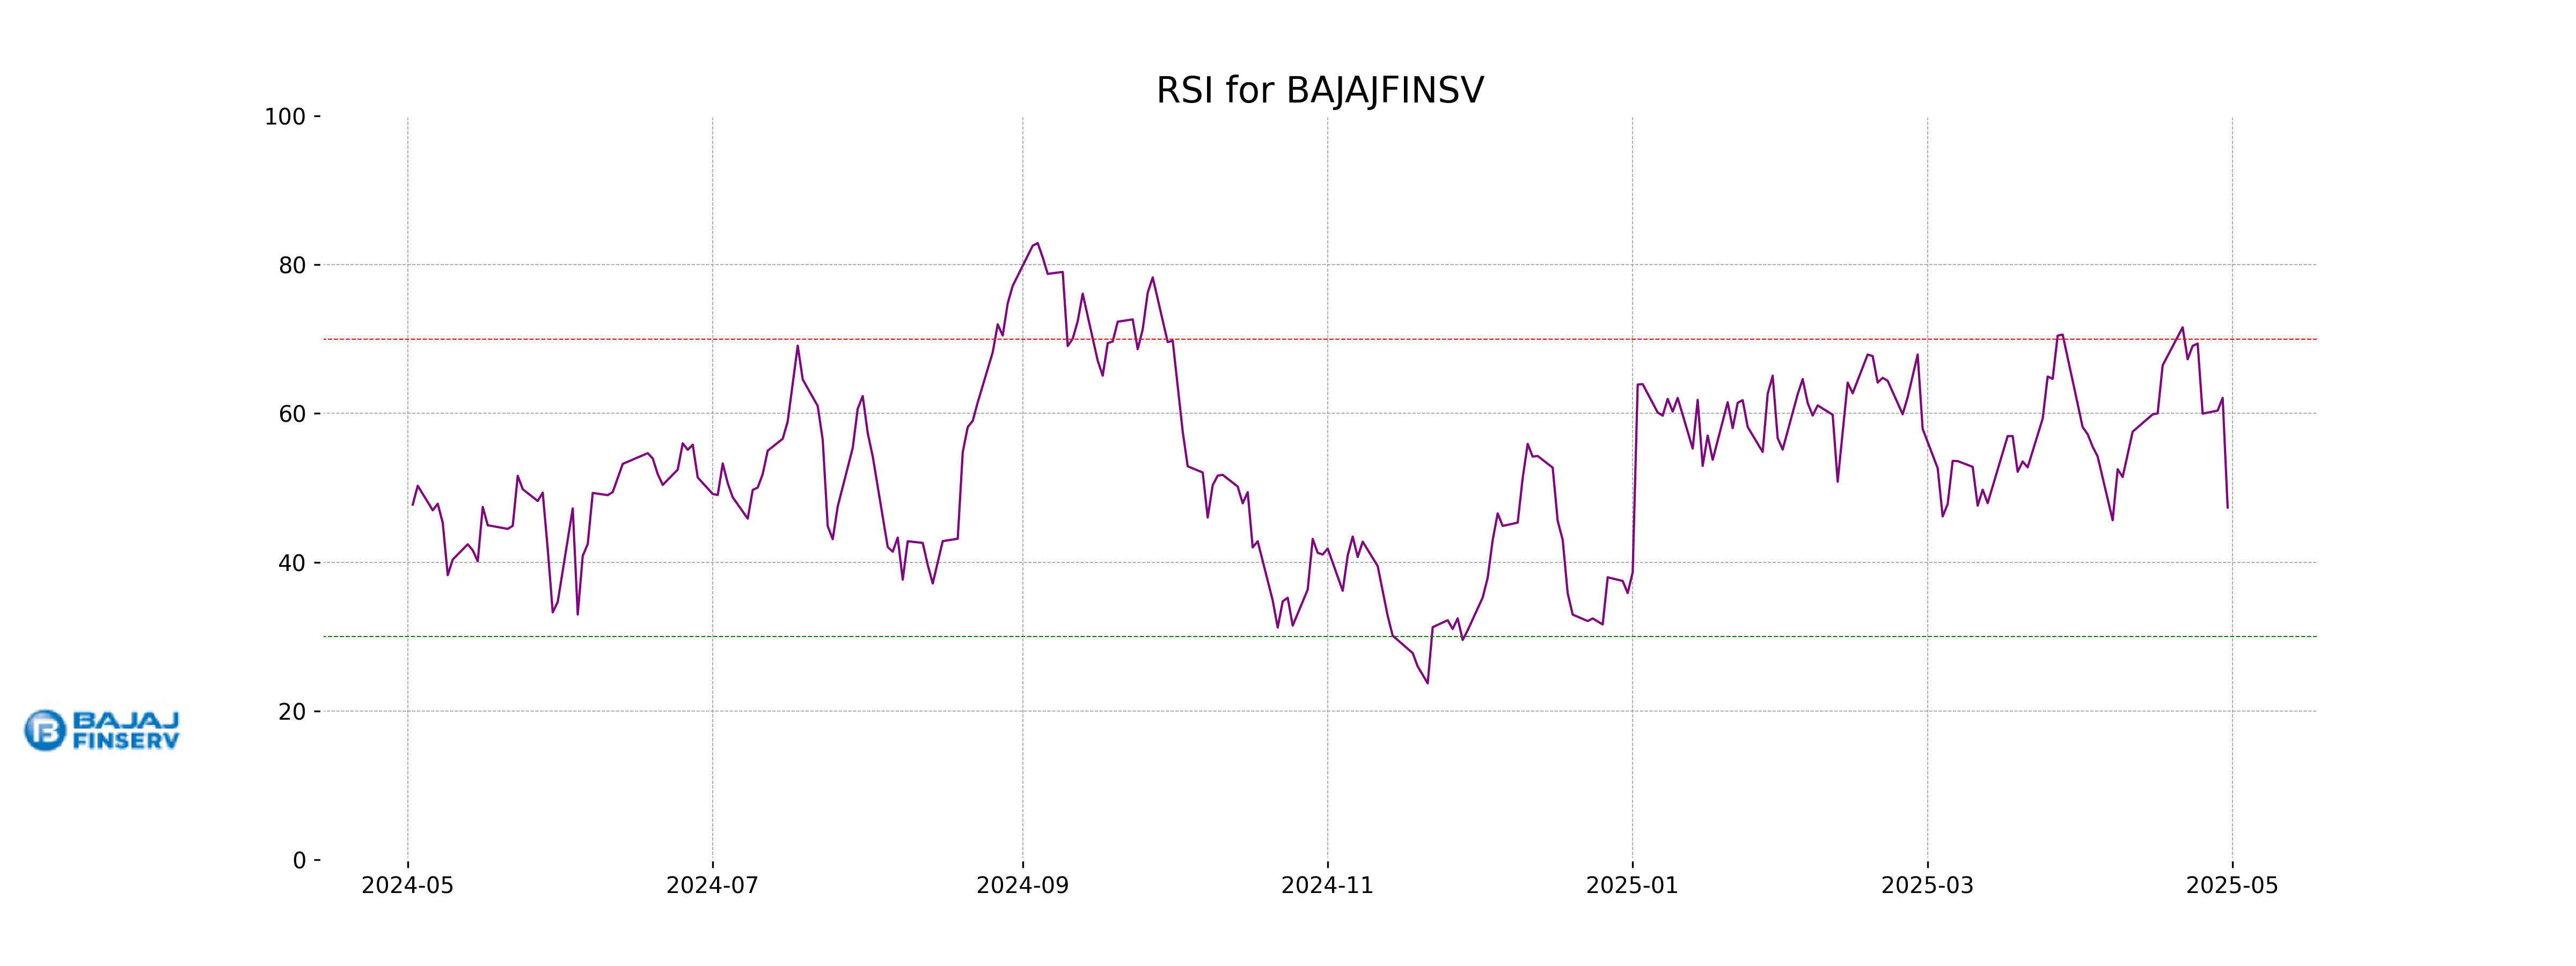
RSI Analysis
RSI Analysis for Bajaj Finserv: The Relative Strength Index (RSI) for Bajaj Finserv stands at 47.35, which indicates a neutral market sentiment. This value suggests that the stock is neither in an overbought nor oversold condition, implying potential stability in its current trading position.
Analysis for Bajaj Finance - May 01, 2025
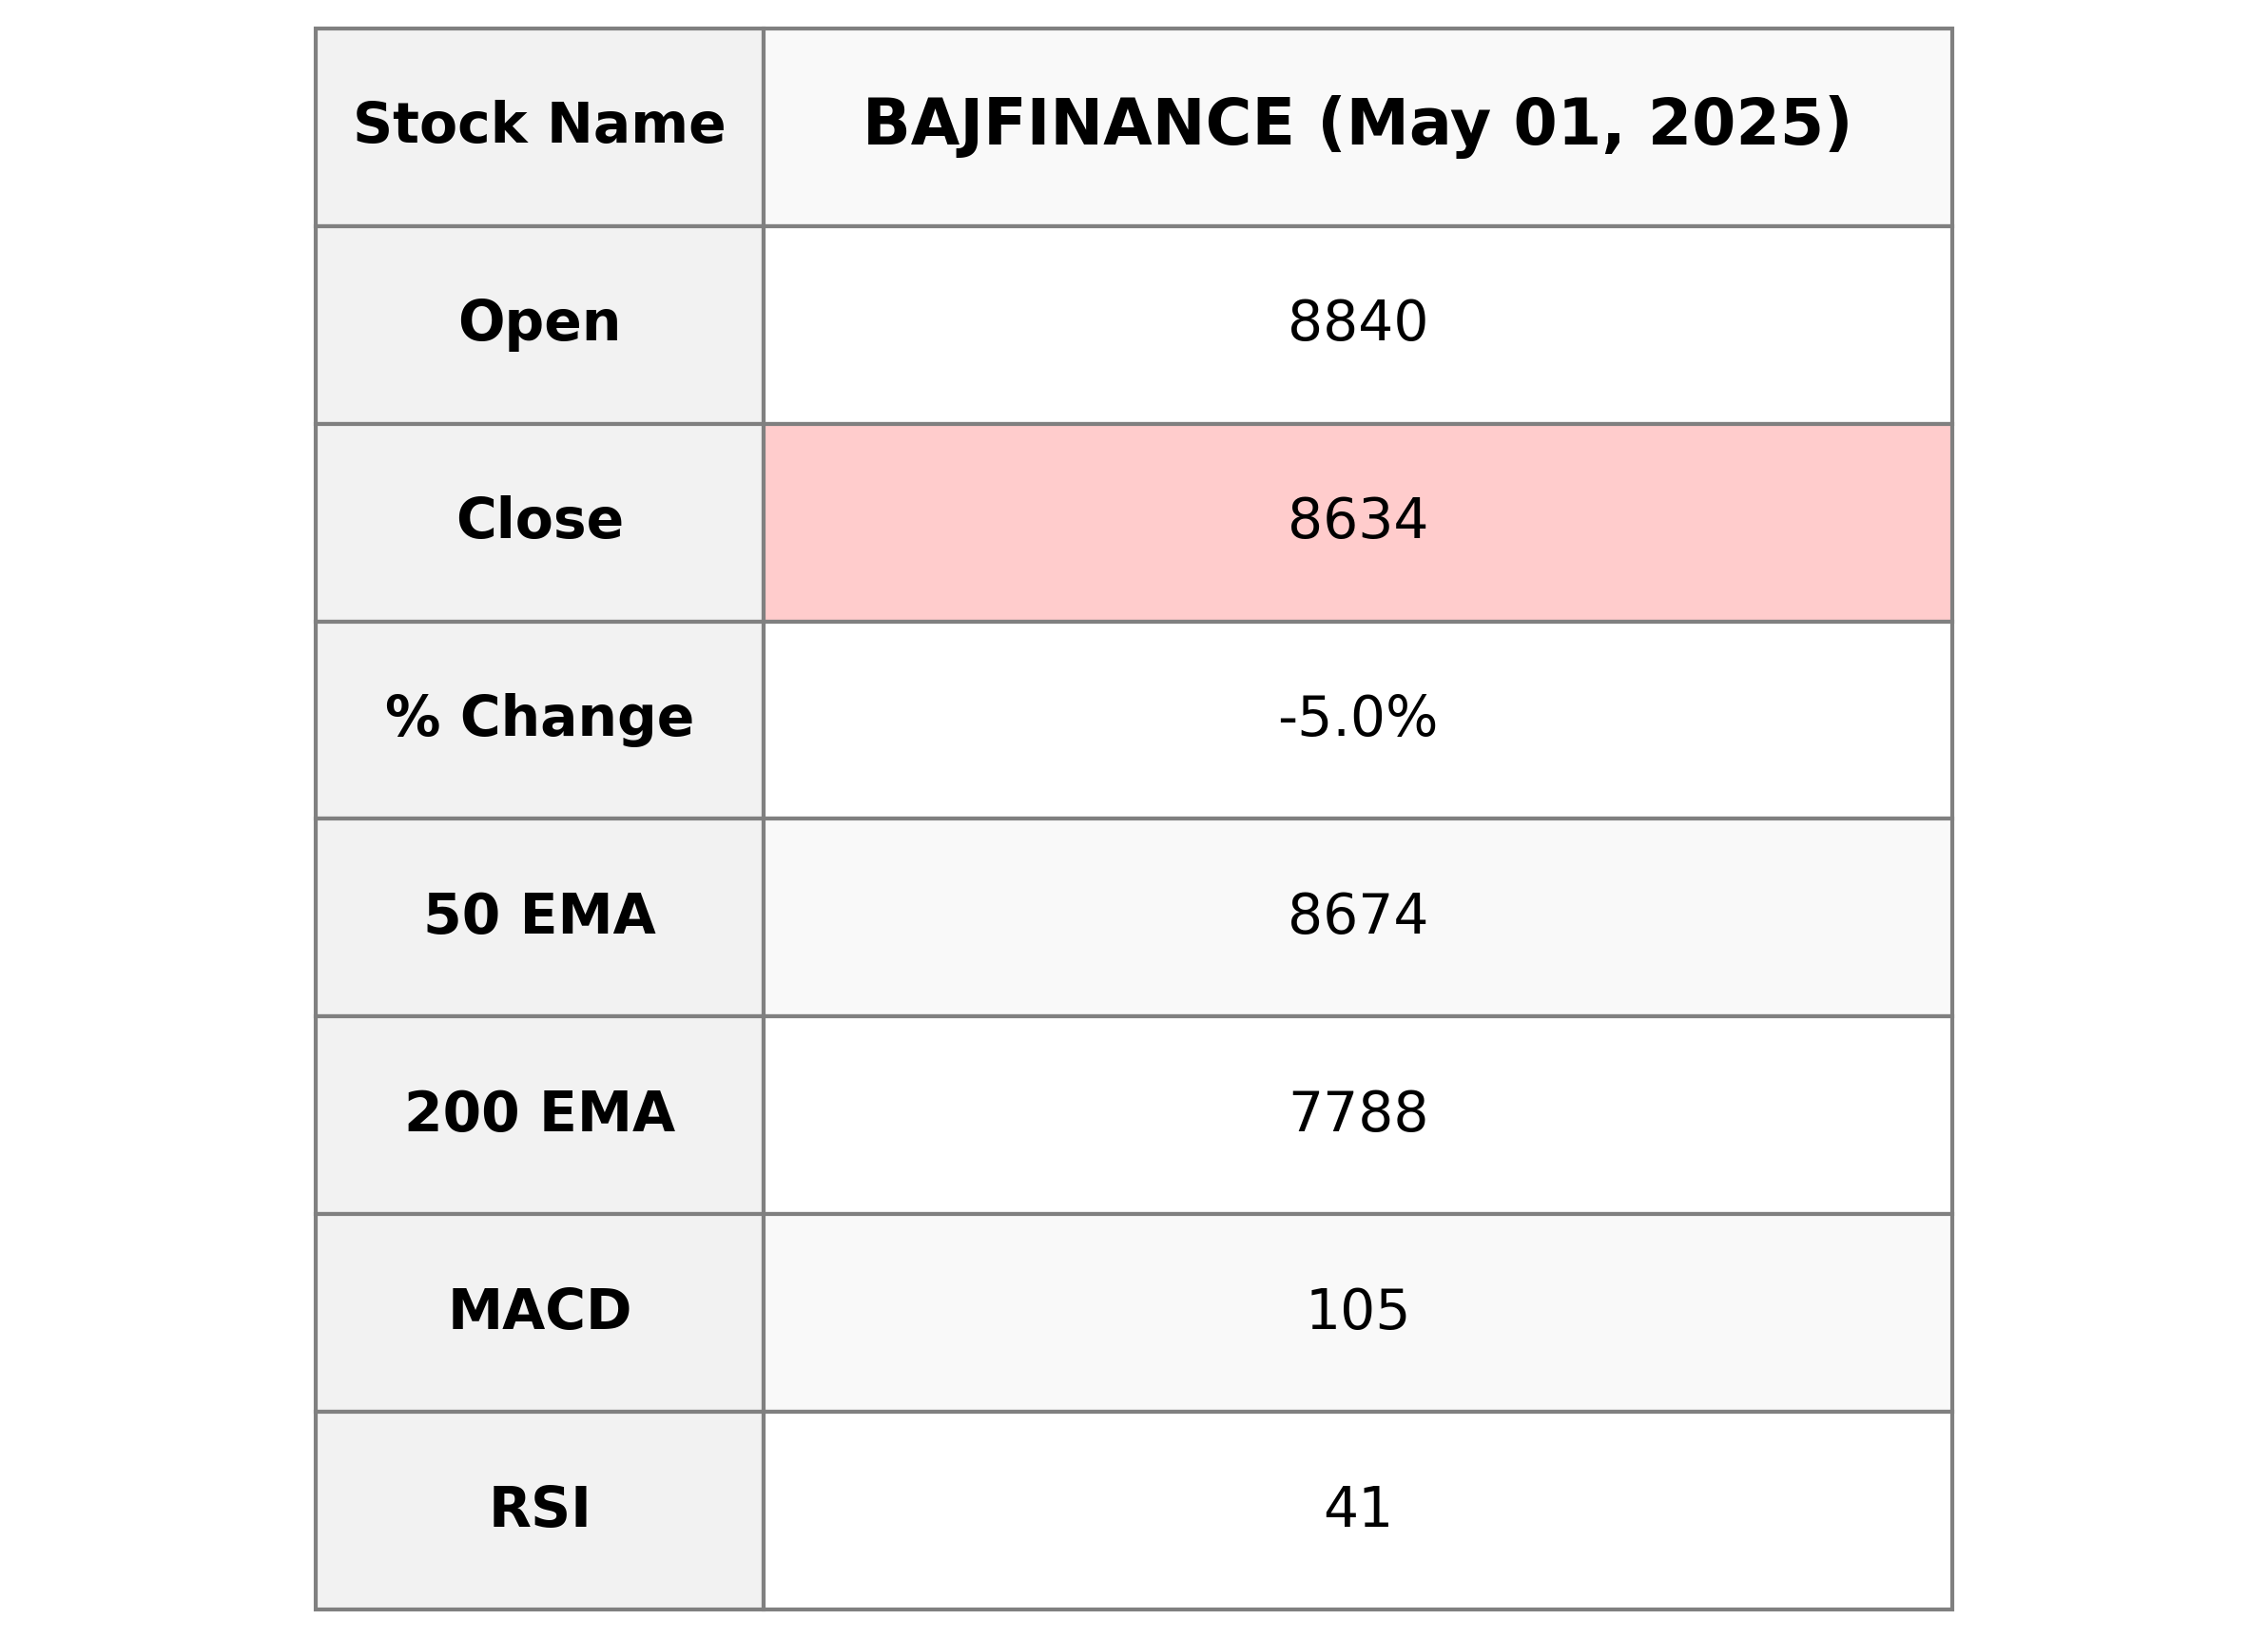
Bajaj Finance Performance Bajaj Finance closed at 8634.5, experiencing a significant drop of 5.04% from the previous close of 9093. Despite the bearish signal with the RSI at 41.46, the stock remains above its 200-day EMA of 7787.65, indicating longer-term strength. The market cap stands at ₹5,361,152,557,056 with a PE ratio of 32.15, reflecting its strong position in the Credit Services industry within India's Financial Services sector.
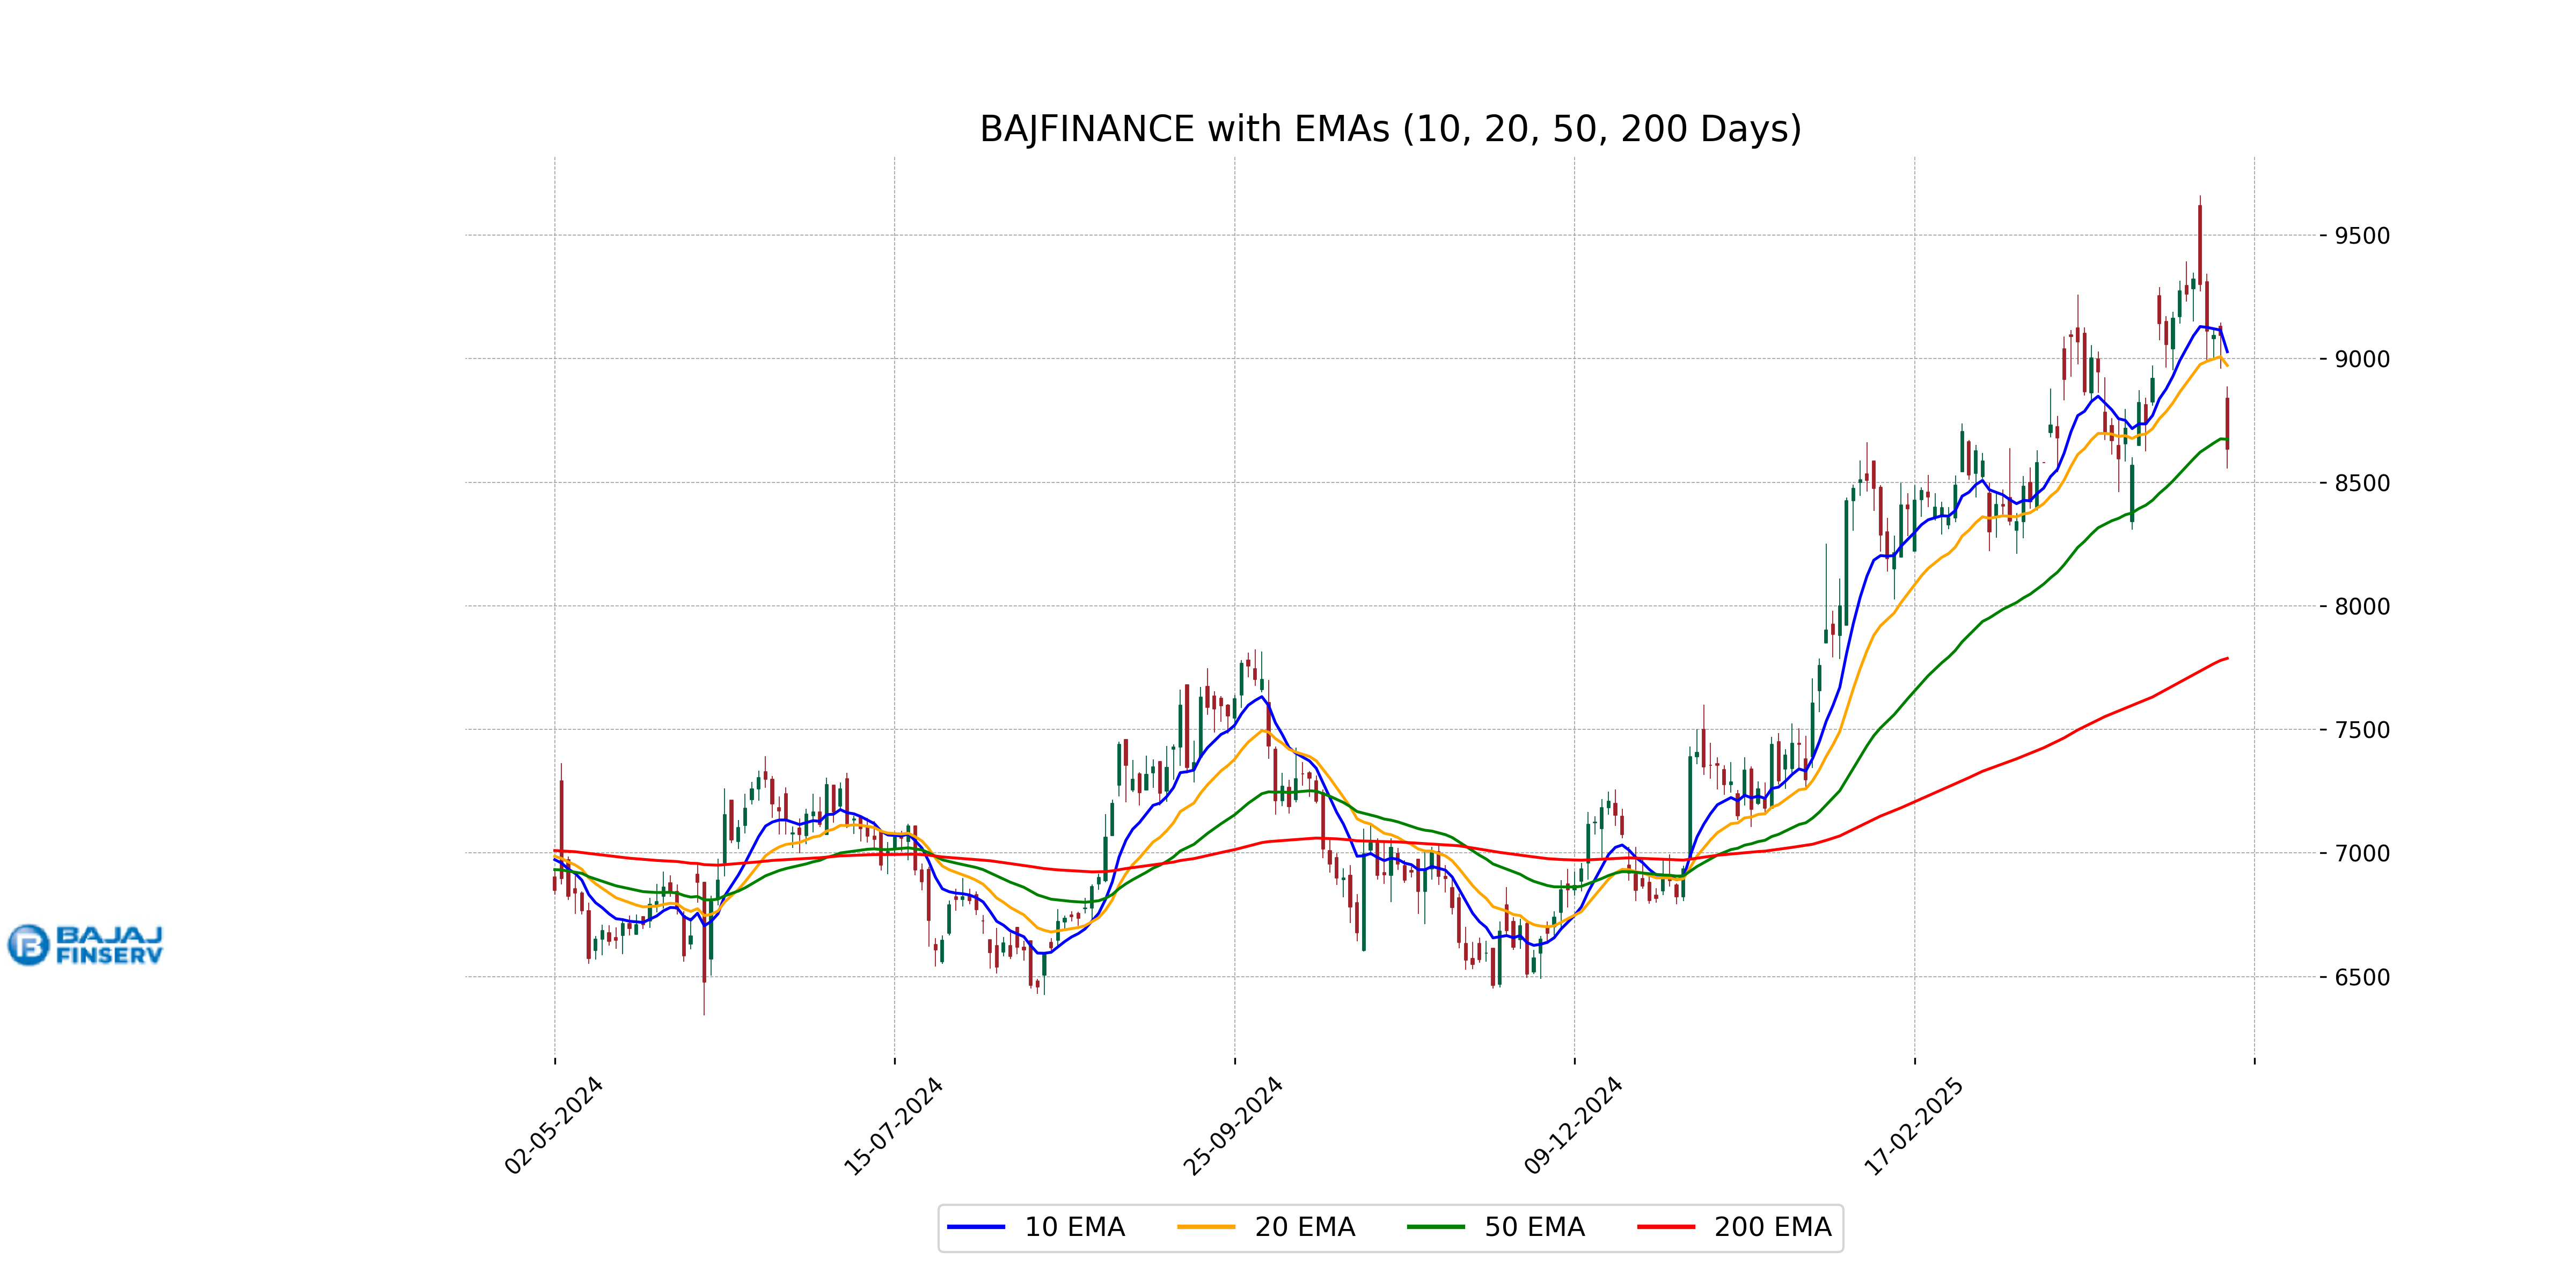
Relationship with Key Moving Averages
The closing price of Bajaj Finance at 8634.5 is below its 50-day EMA of 8674.0 and significantly below the 10-day EMA of 9028.1, indicating recent weakness in short-term momentum. However, it remains above the 200-day EMA of 7787.7, suggesting that the longer-term trend might still be upward.
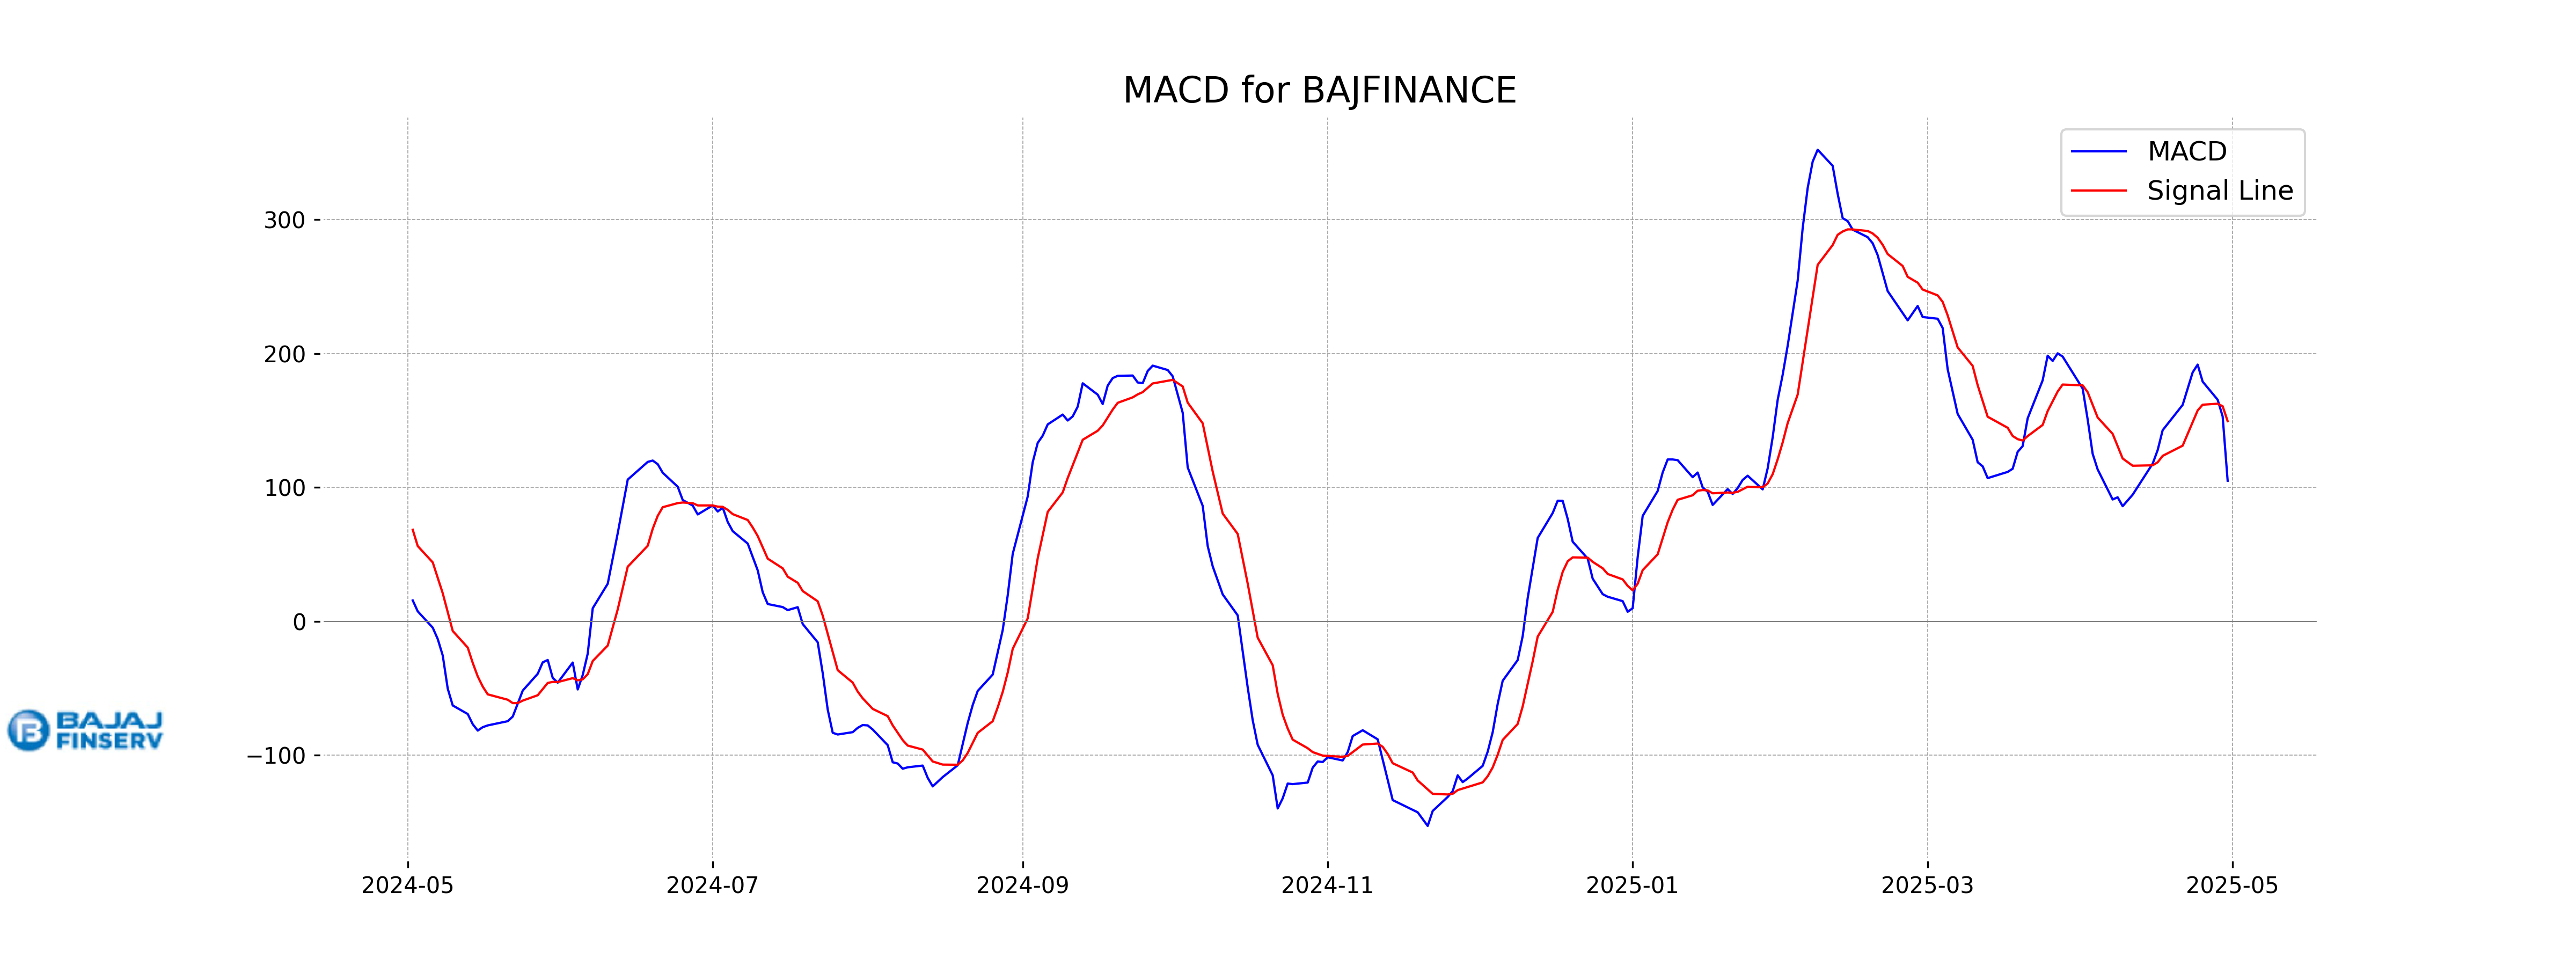
Moving Averages Trend (MACD)
Bajaj Finance's MACD analysis shows that the MACD line is below the MACD Signal line, indicating a bearish trend. The current MACD line value of approximately 104.90 is less than the signal line value of about 149.45, suggesting potential downward momentum.
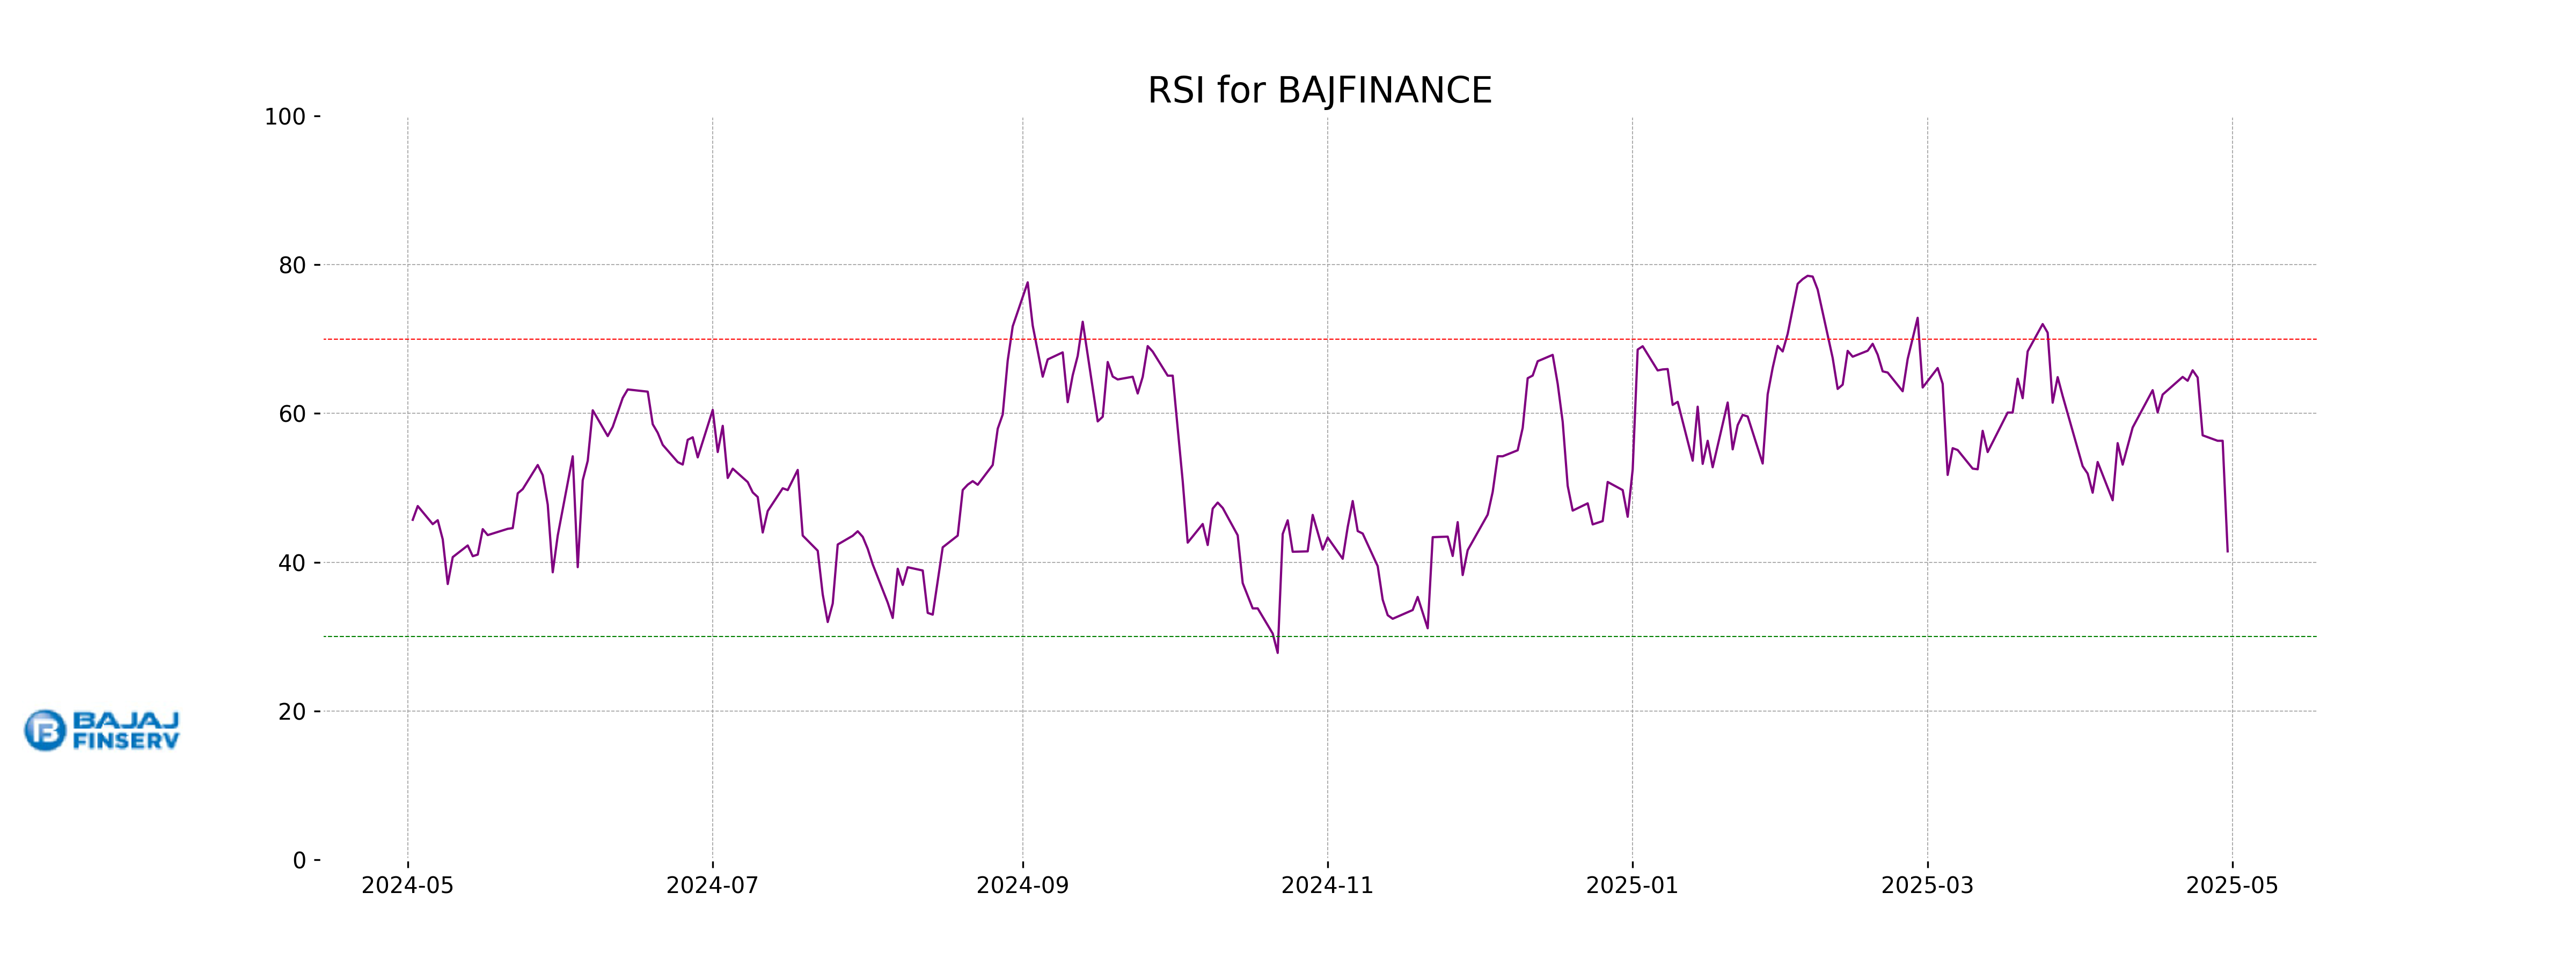
RSI Analysis
Based on the provided data, the RSI (Relative Strength Index) for Bajaj Finance is 41.46. An RSI below 50 typically suggests that the stock is experiencing bearish momentum, indicating potential selling pressure in the market. This level does not yet indicate an oversold condition, which would be confirmed if the RSI drops below 30.
Analysis for SBI Life - May 01, 2025
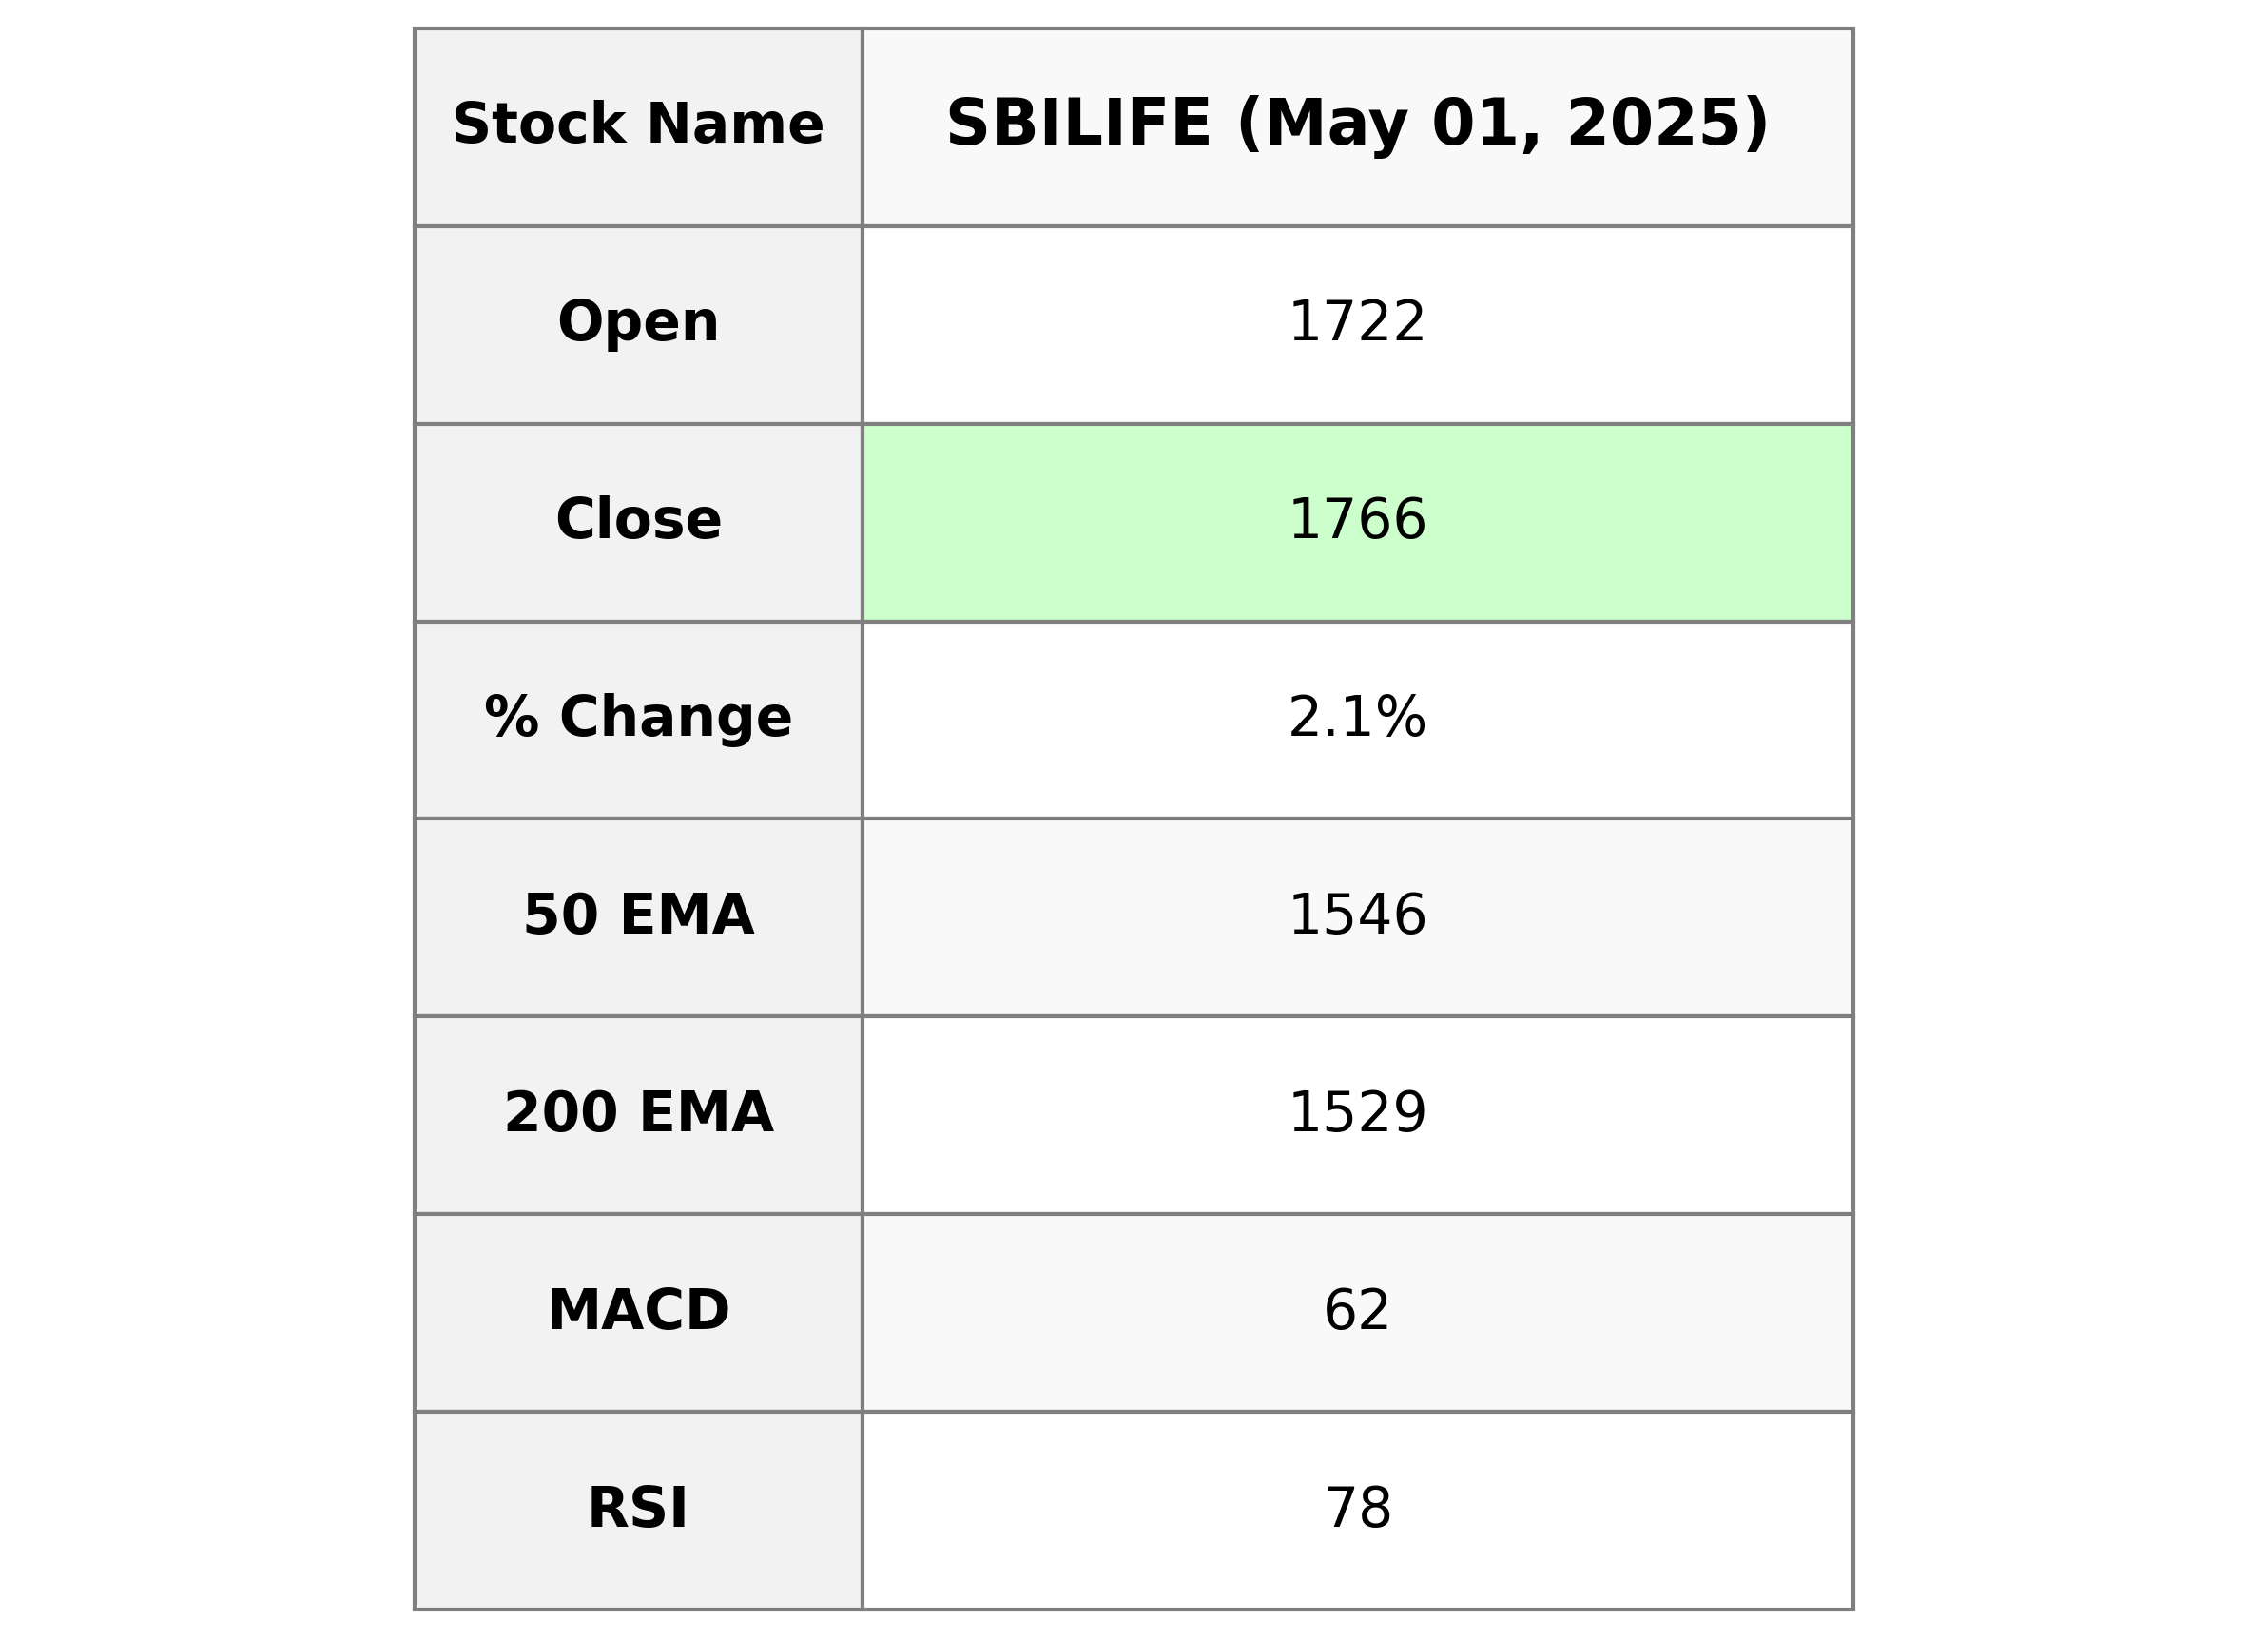
SBI Life Insurance SBI Life Insurance's stock opened at 1722.0 and rose to a high of 1772.5, closing at 1765.8, showing a 2.06% increase from the previous close. The volume traded was 2,031,563 shares. Key indicators such as a high RSI of 77.74 suggest the stock is overbought, while the MACD indicates strong momentum. With a PE Ratio of 73.54 and a significant market cap, it plays a pivotal role in the financial services sector, particularly in life insurance in India.
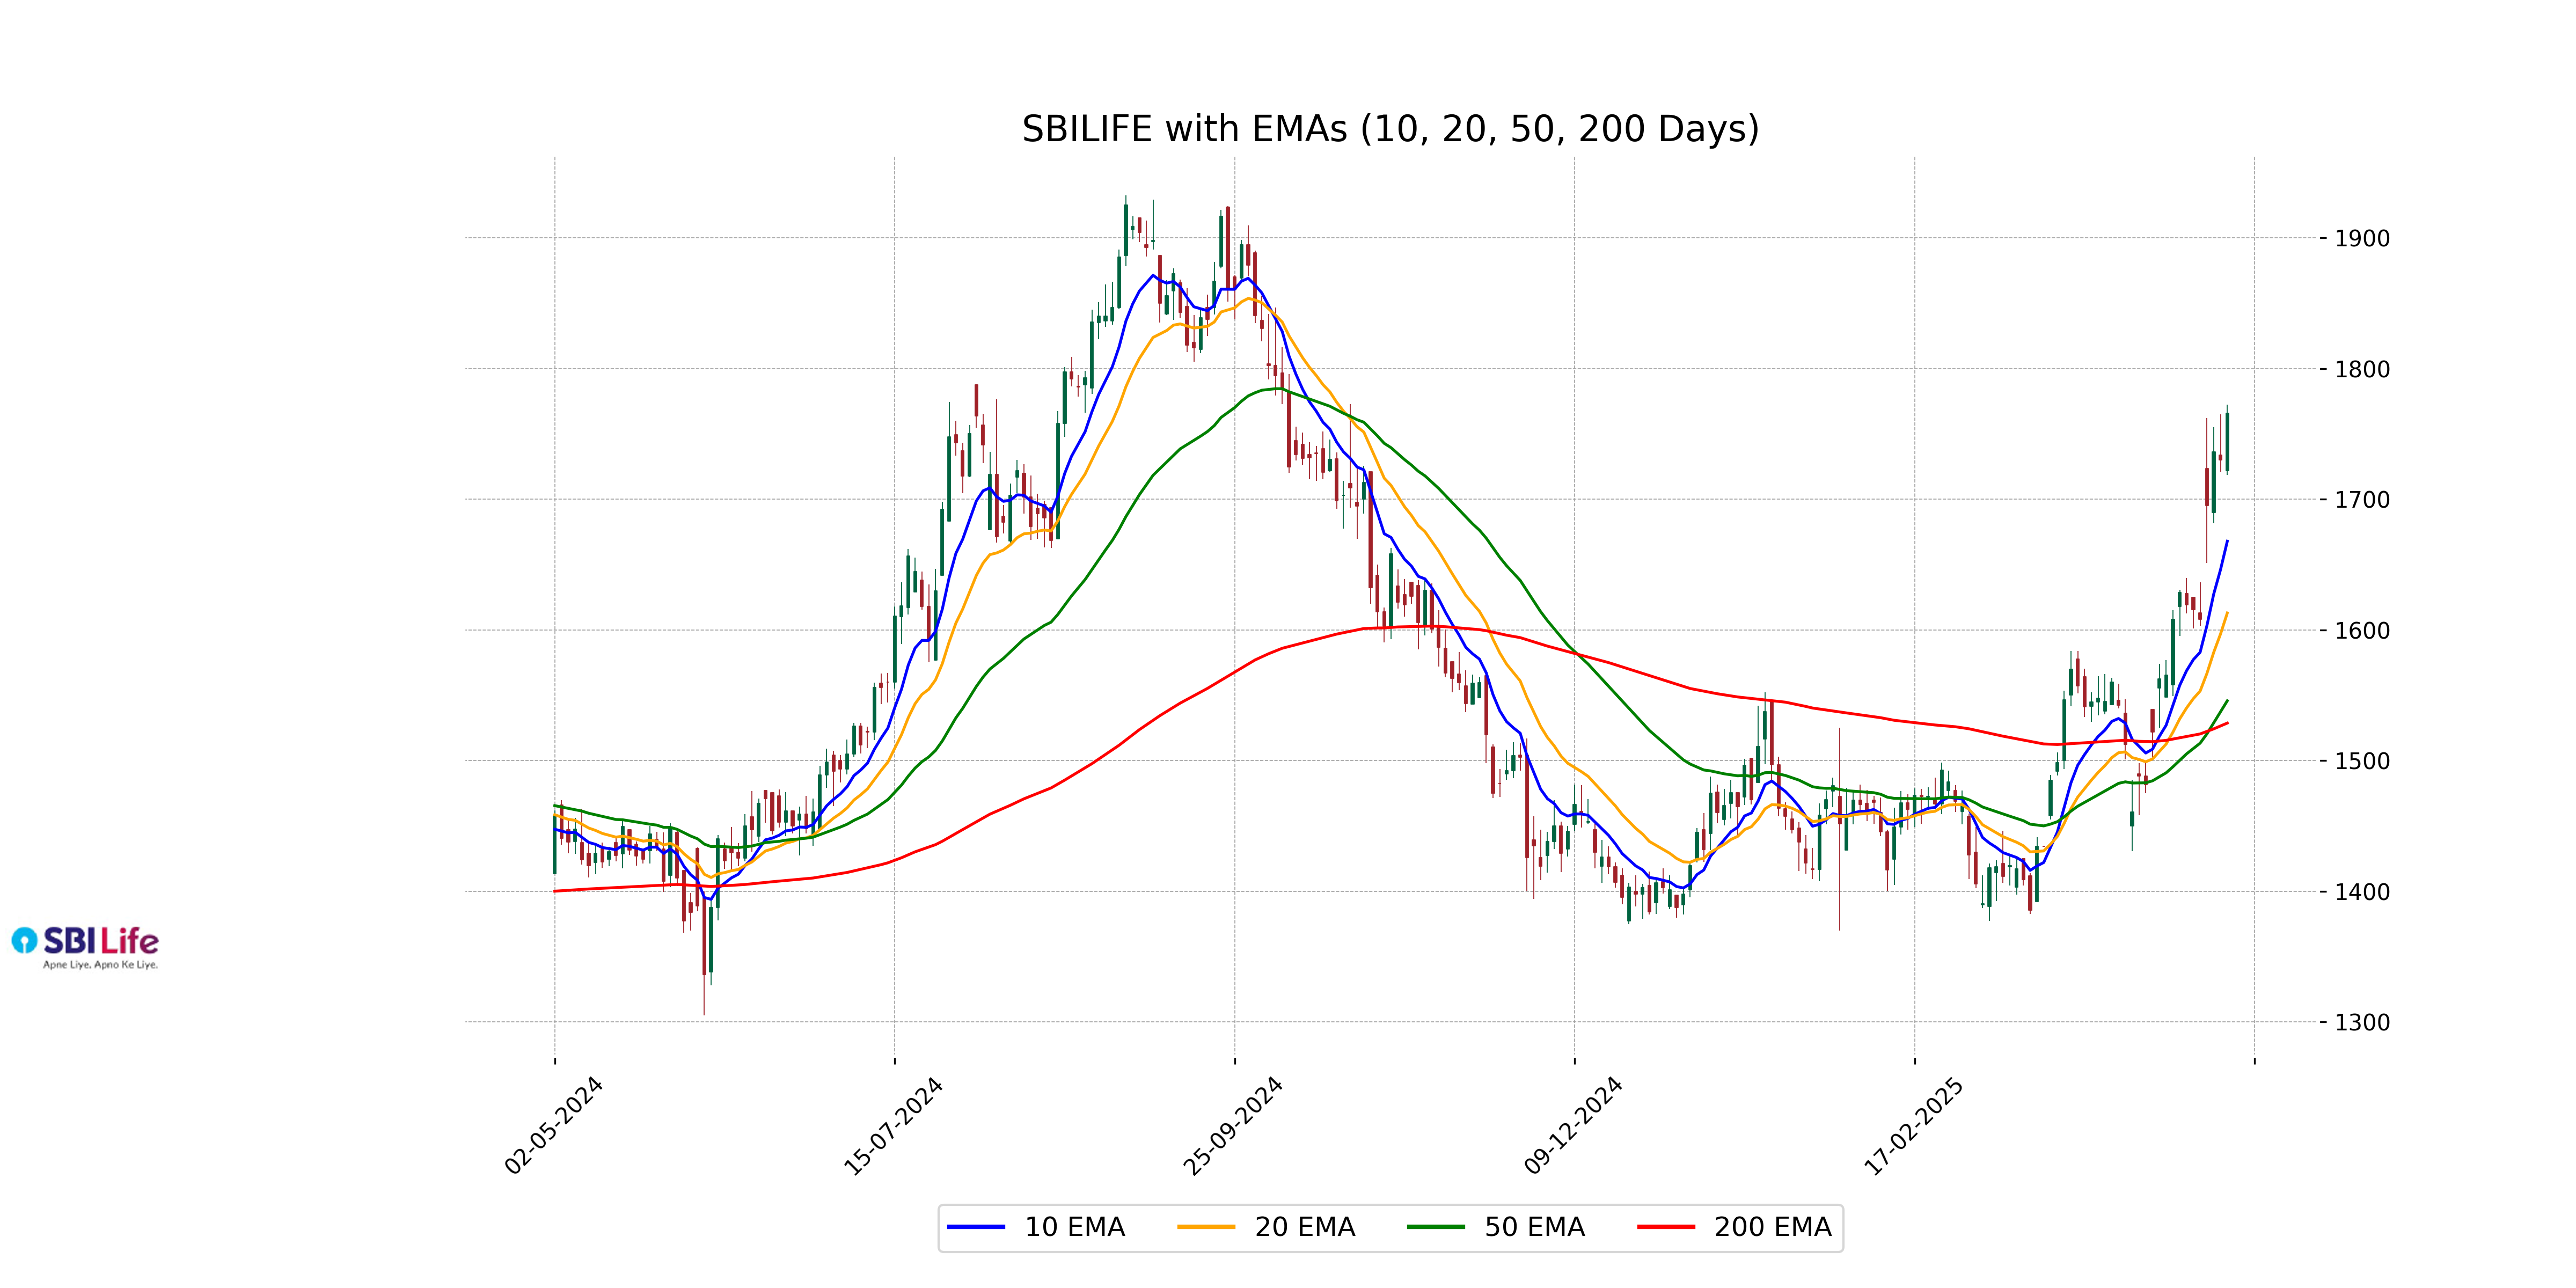
Relationship with Key Moving Averages
SBI Life's current stock price is significantly above all its key moving averages, with the close price at 1765.8 compared to the 50-day EMA of 1545.78 and the 200-day EMA of 1528.71. Additionally, the recent uptrend is supported by the 10-day EMA of 1667.86 and the 20-day EMA of 1612.94, indicating strong bullish momentum.
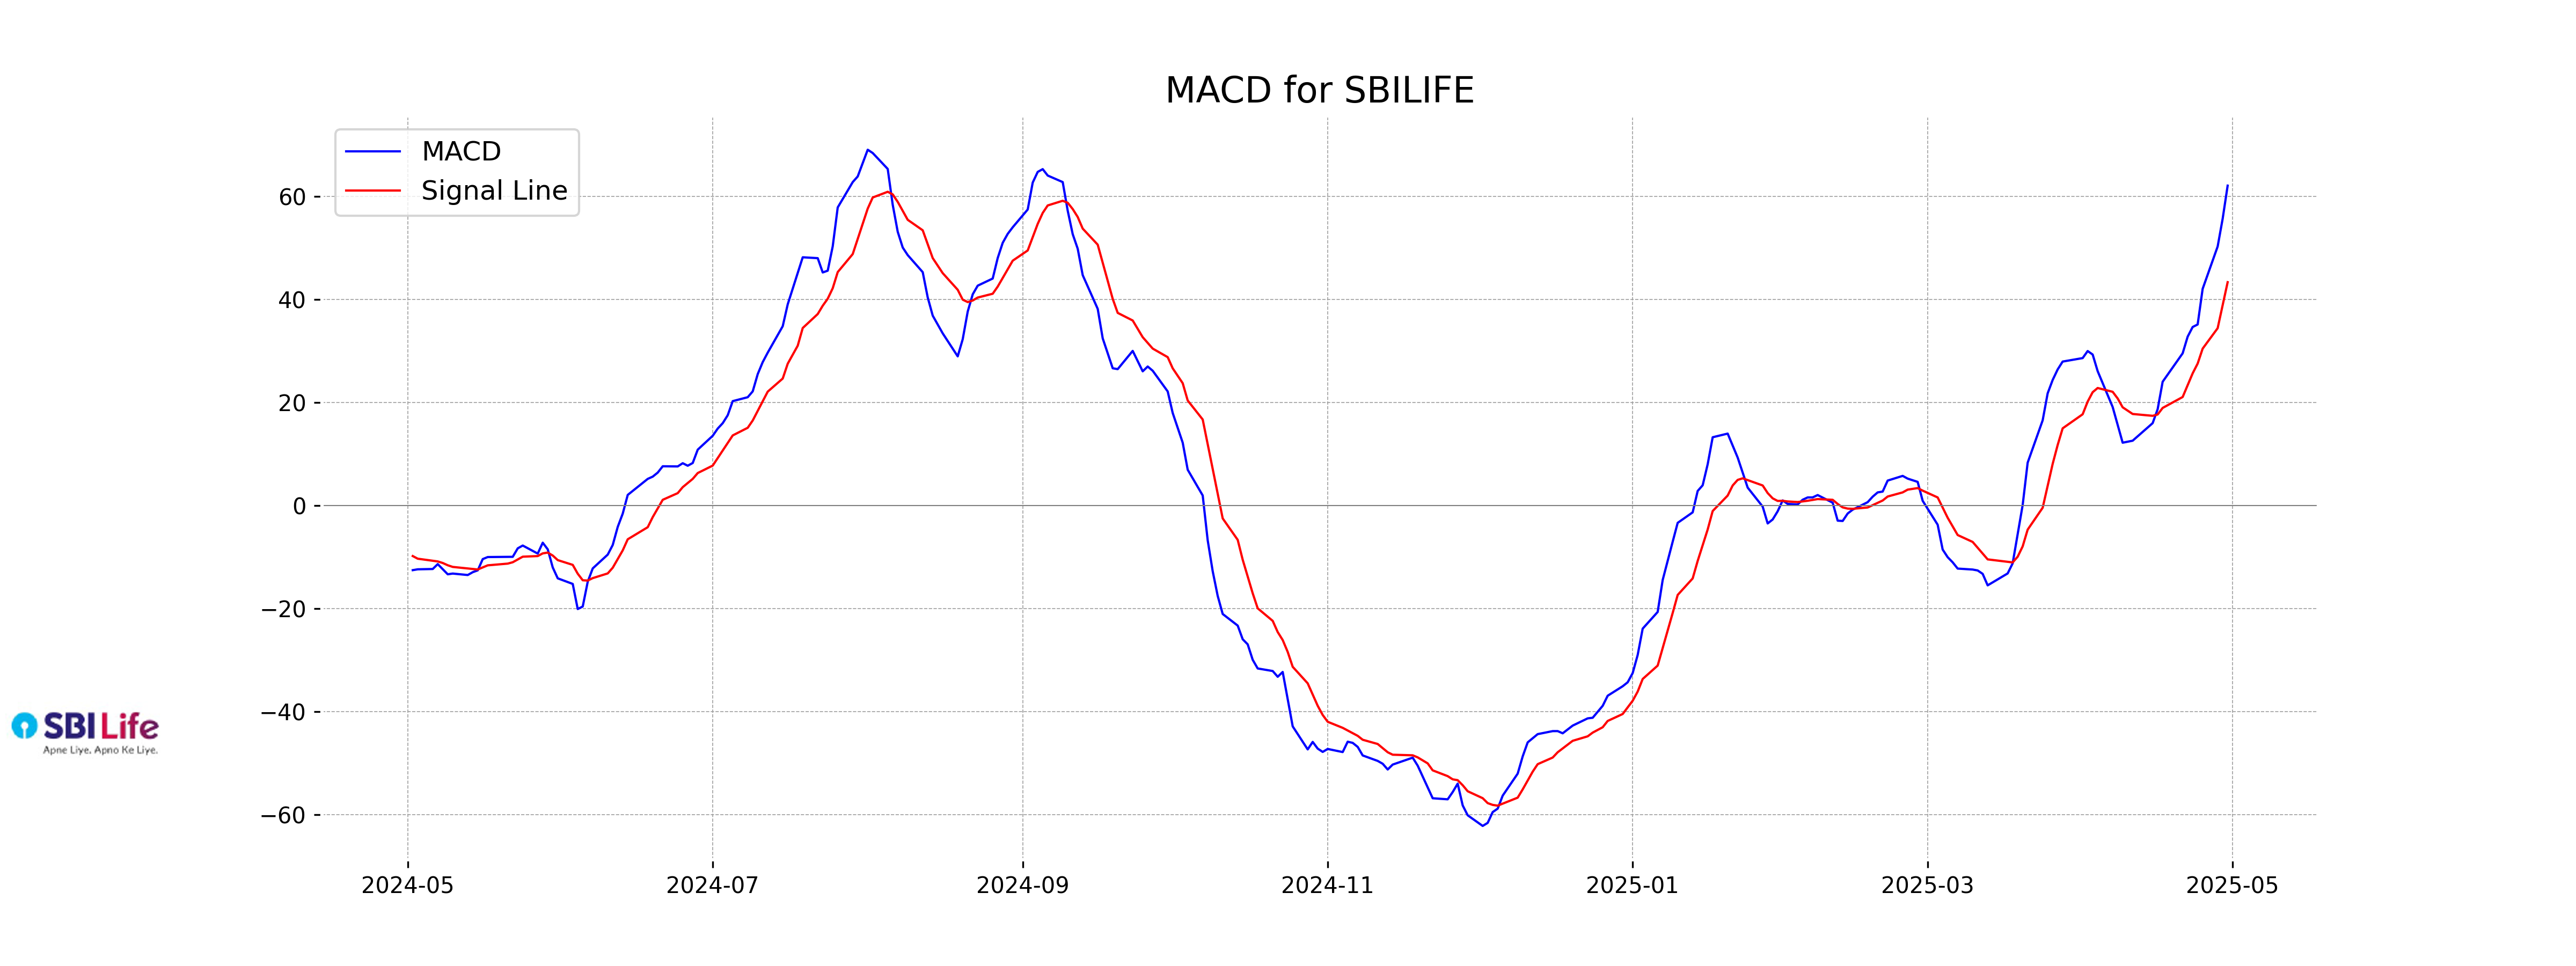
Moving Averages Trend (MACD)
SBI Life's MACD is currently at 62.08, which is above its signal line of 43.34, indicating a bullish trend. This suggests that the stock might be experiencing upward momentum. However, the RSI is relatively high at 77.74, which could indicate that the stock is overbought and might be due for a pullback.
RSI Analysis
SBI Life's RSI (Relative Strength Index) is at 77.74, indicating that the stock is in the overbought zone. This suggests potential for a price pullback, as the RSI value is above the standard threshold of 70. Traders should be cautious of potential price corrections.

Analysis for Tata Motors - May 01, 2025
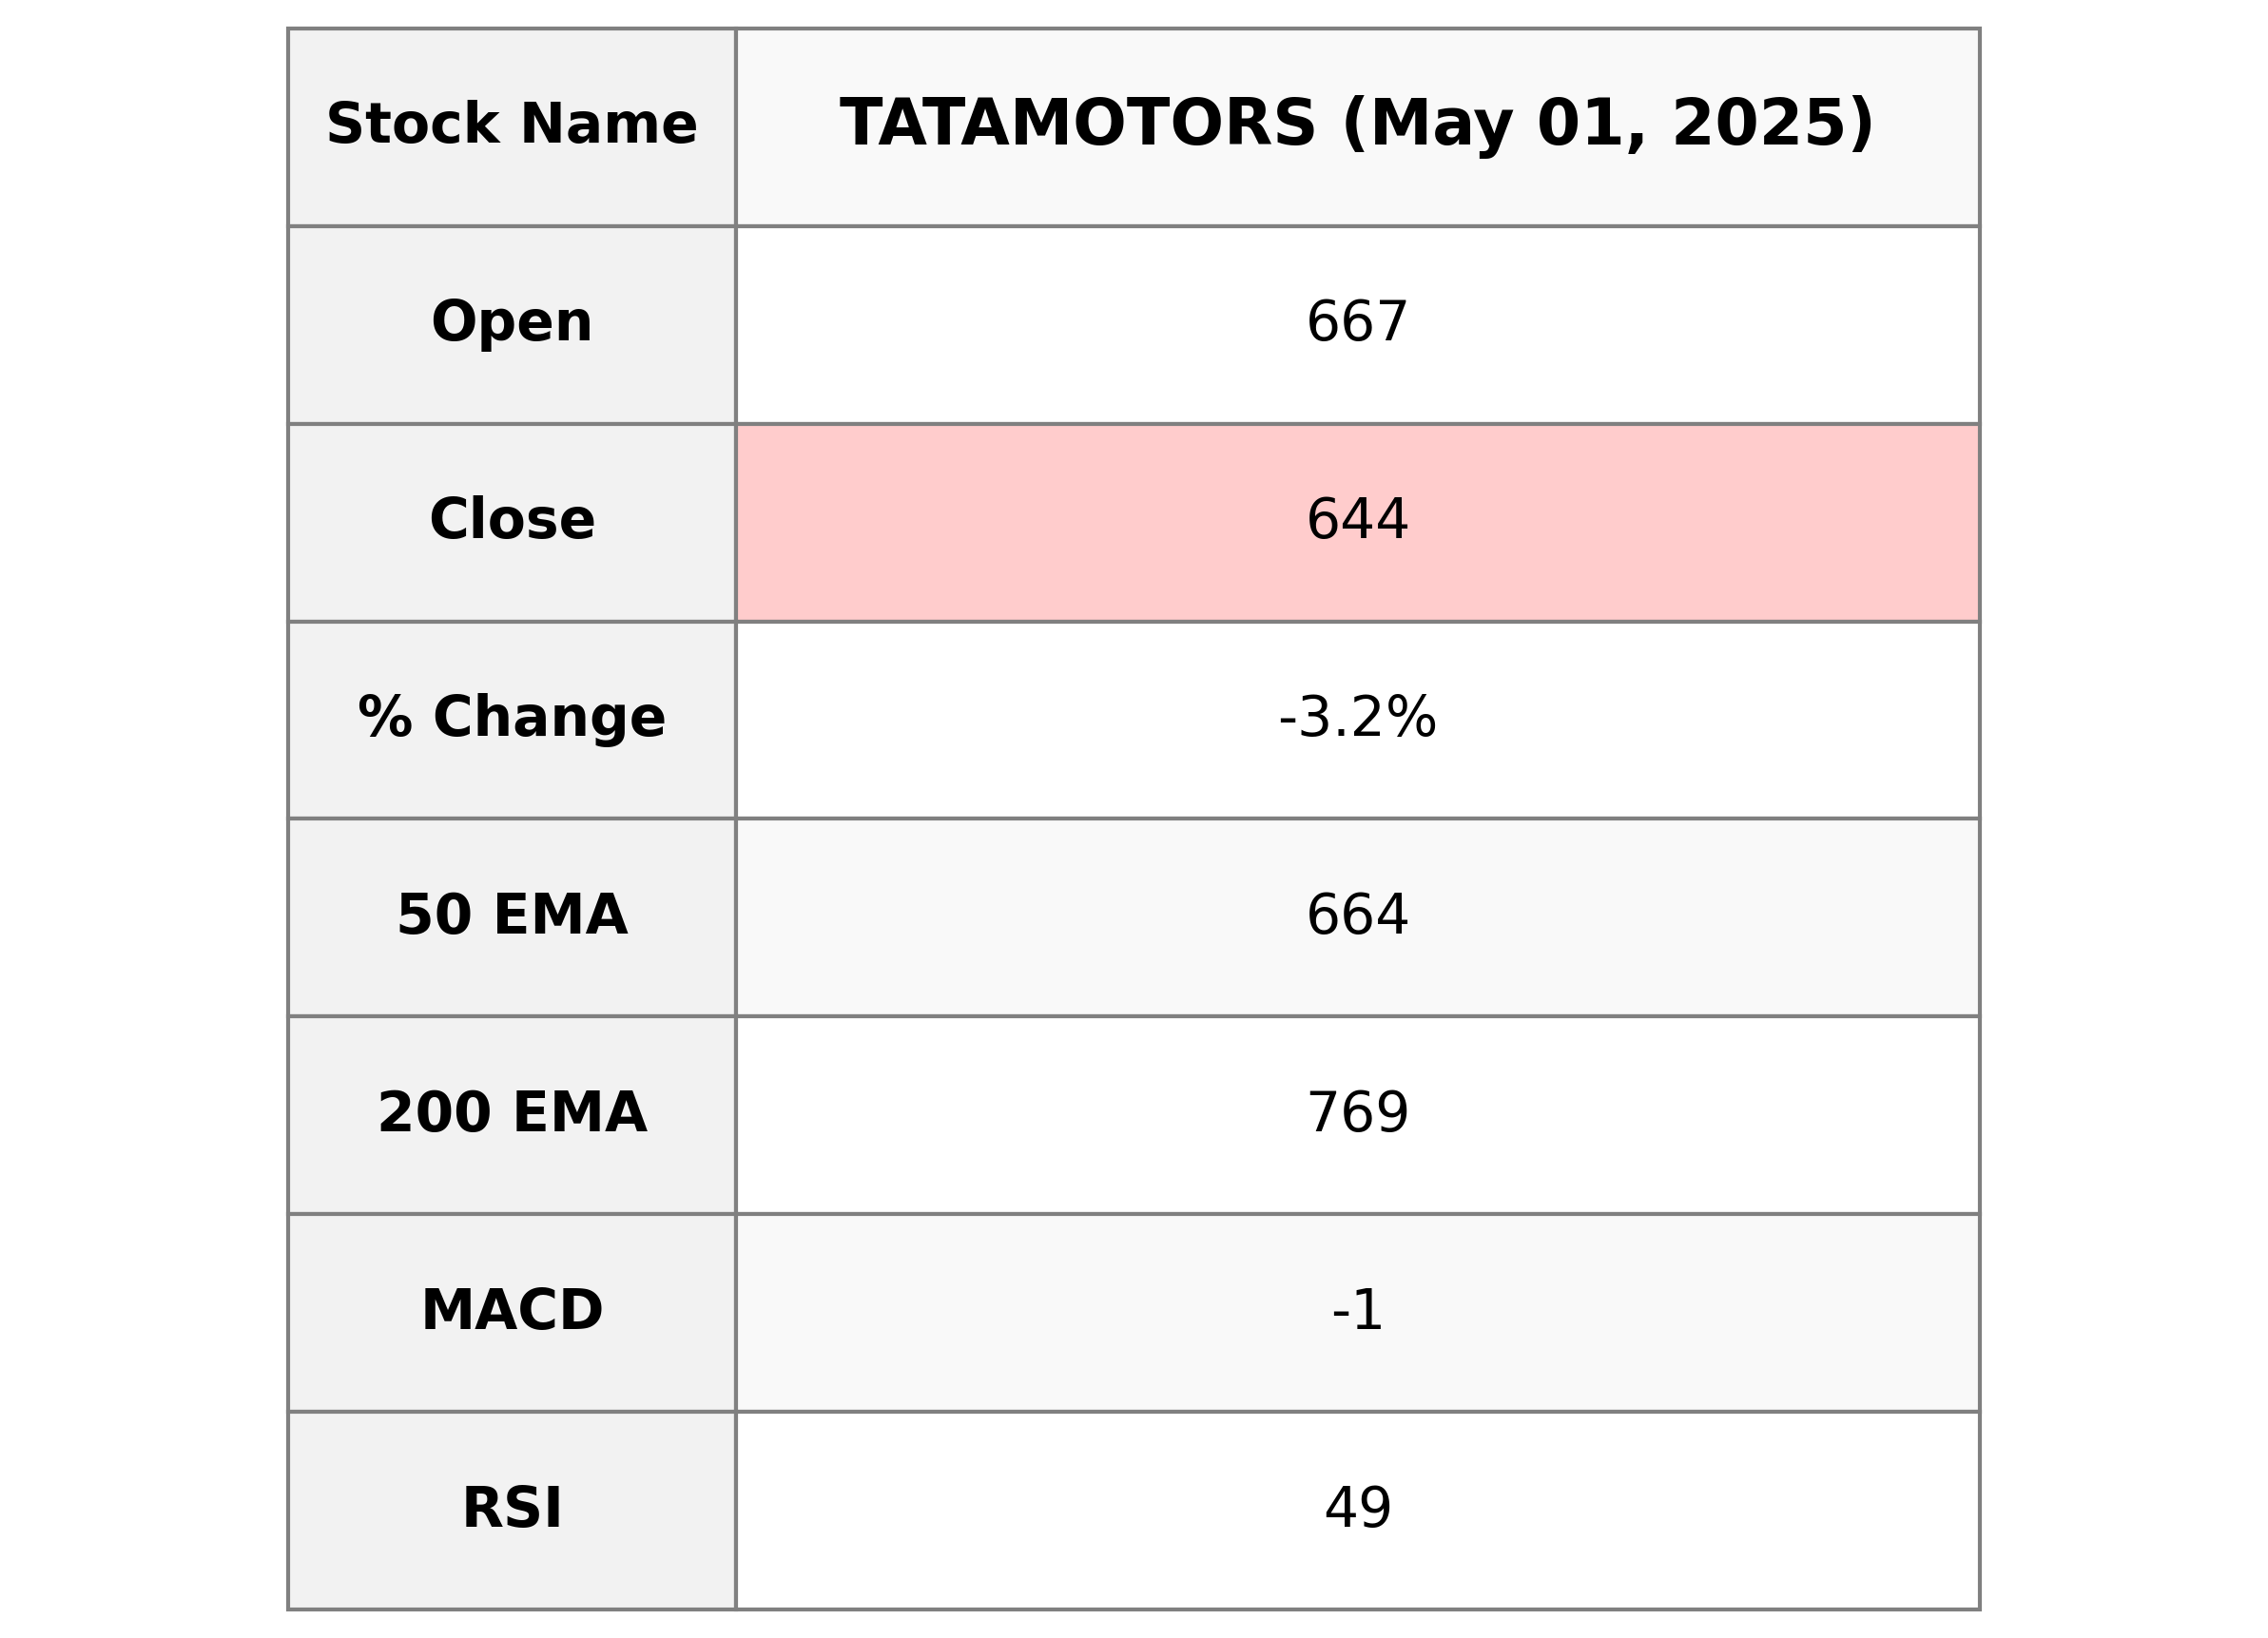
Tata Motors Performance Overview: Tata Motors exhibited a decline in its stock price, closing at 644.25, which marks a decrease of 3.21% from the previous close. Although the stock opened at its day's high of 667.0, it saw a downward movement, reflecting in a points change of -21.35. The current 50-day EMA is at 663.72, slightly above the closing price, indicating a potential bearish sentiment. Despite the negative short-term momentum indicated by an RSI of 48.66 and a negative MACD, Tata Motors remains a significant player in the Consumer Cyclical sector, with a strong market cap and a healthy PE ratio of 7.44.
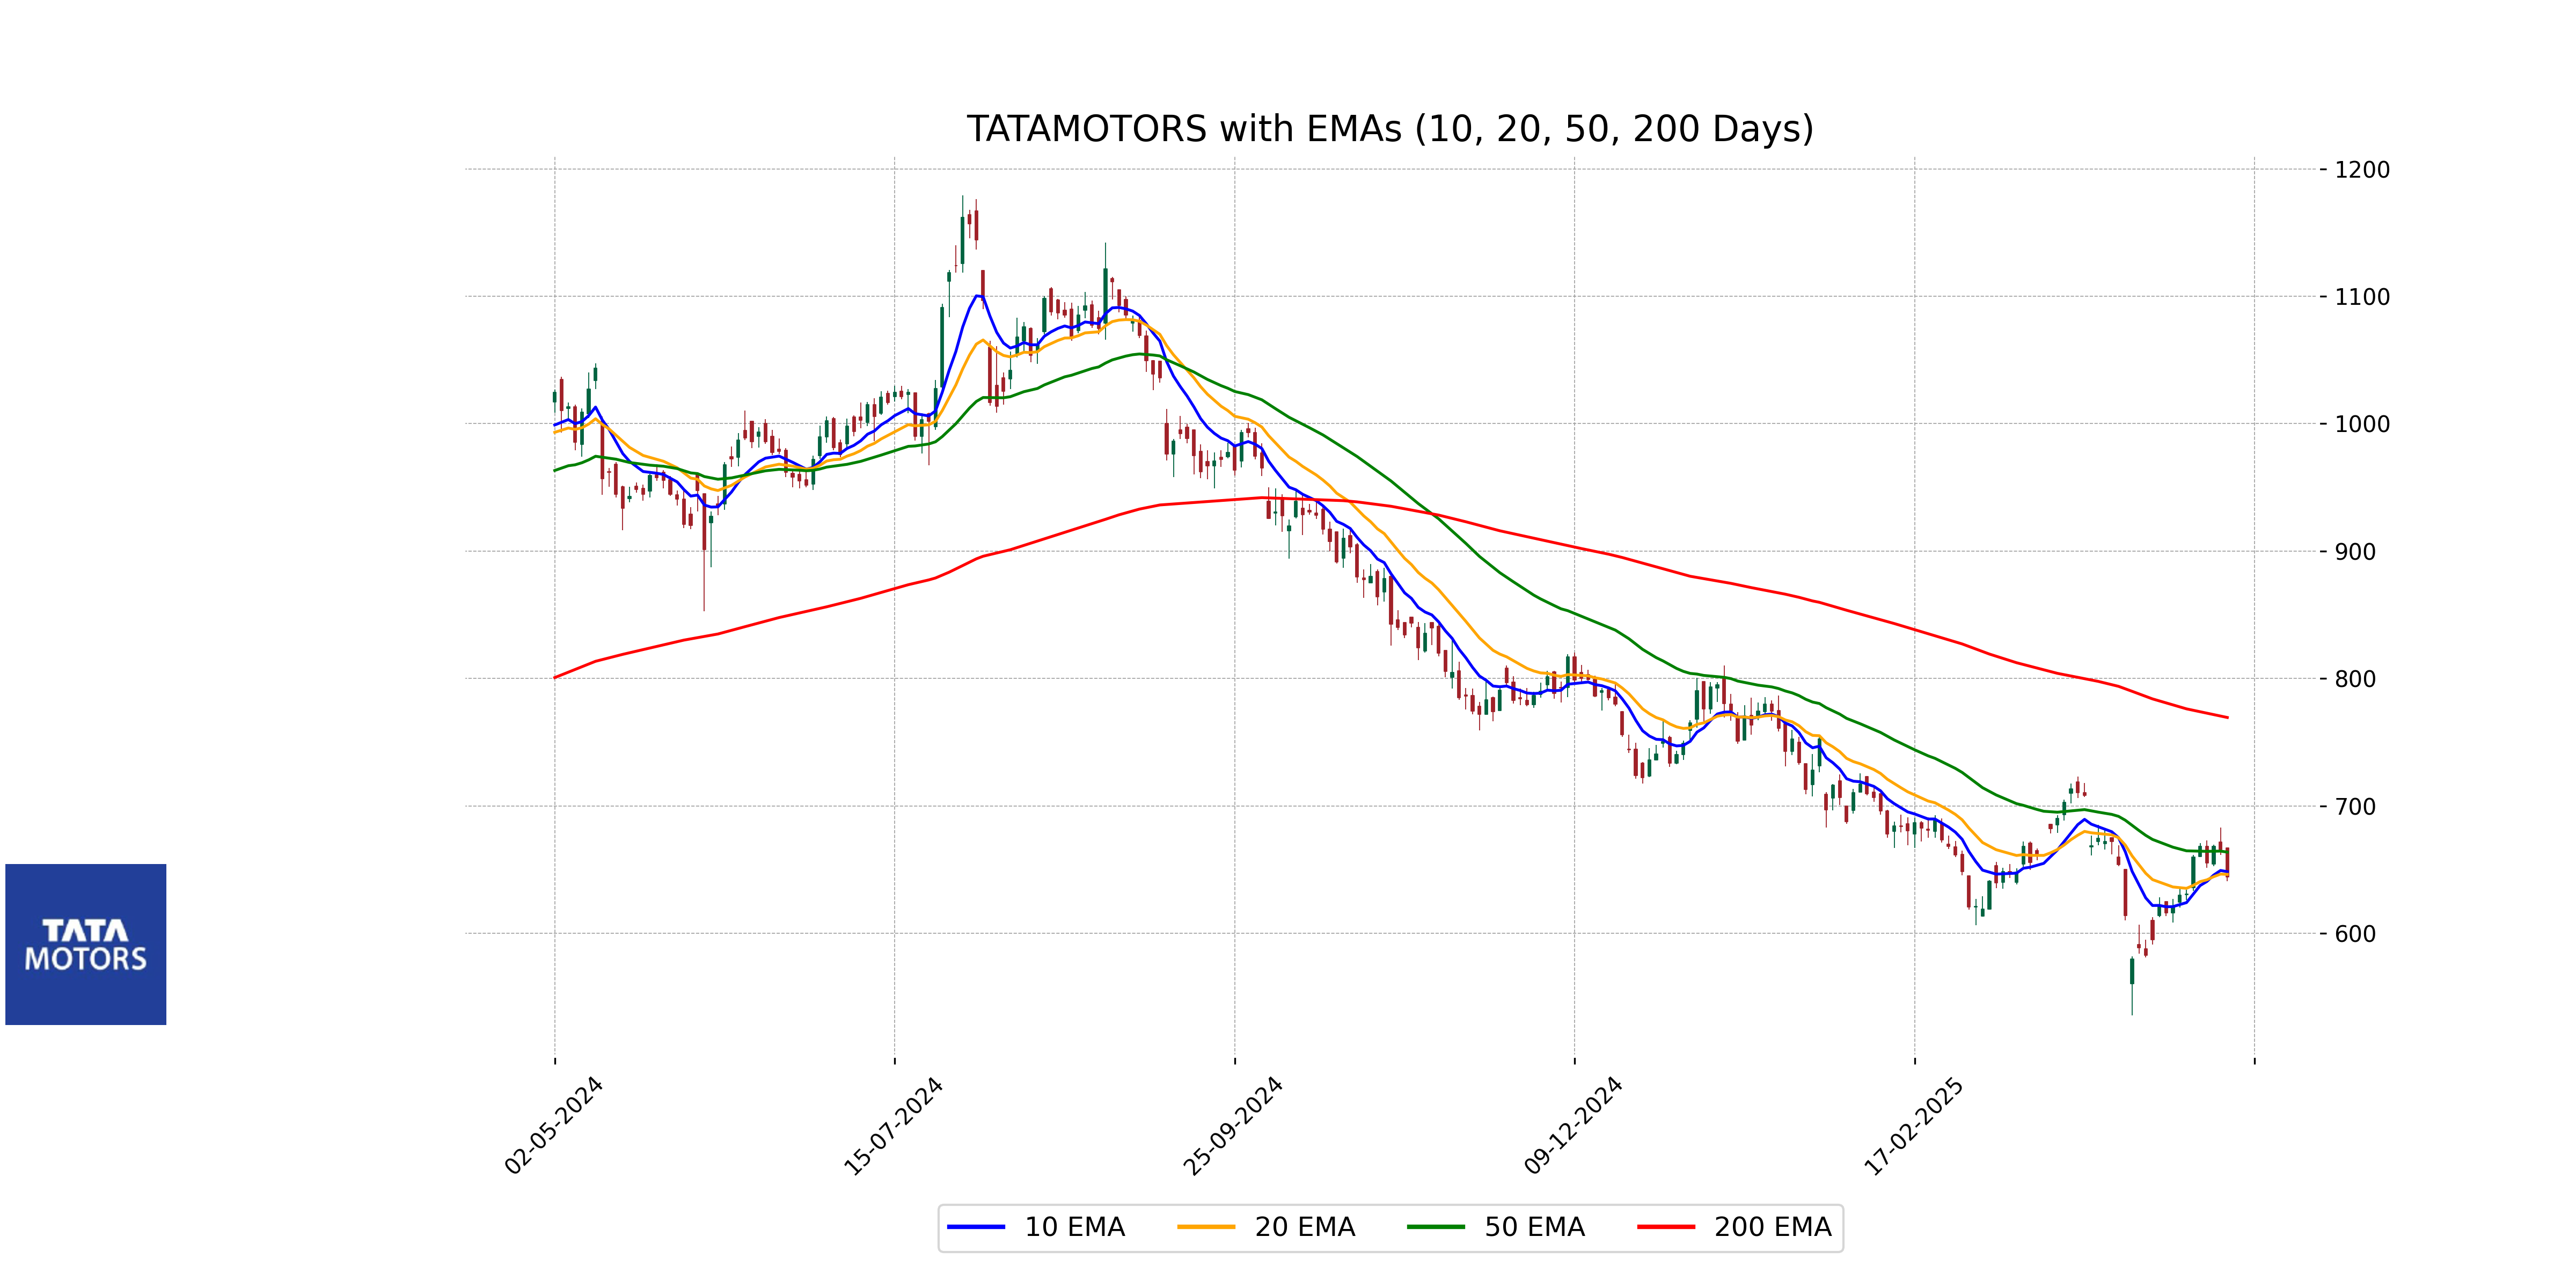
Relationship with Key Moving Averages
Tata Motors is currently trading below its 50-day EMA (663.72) and significantly below its 200-day EMA (769.38), indicating short and long-term downtrends. However, the stock is just below its 10-day (648.40) and 20-day (646.26) EMAs, showing signs of recent bearish momentum.
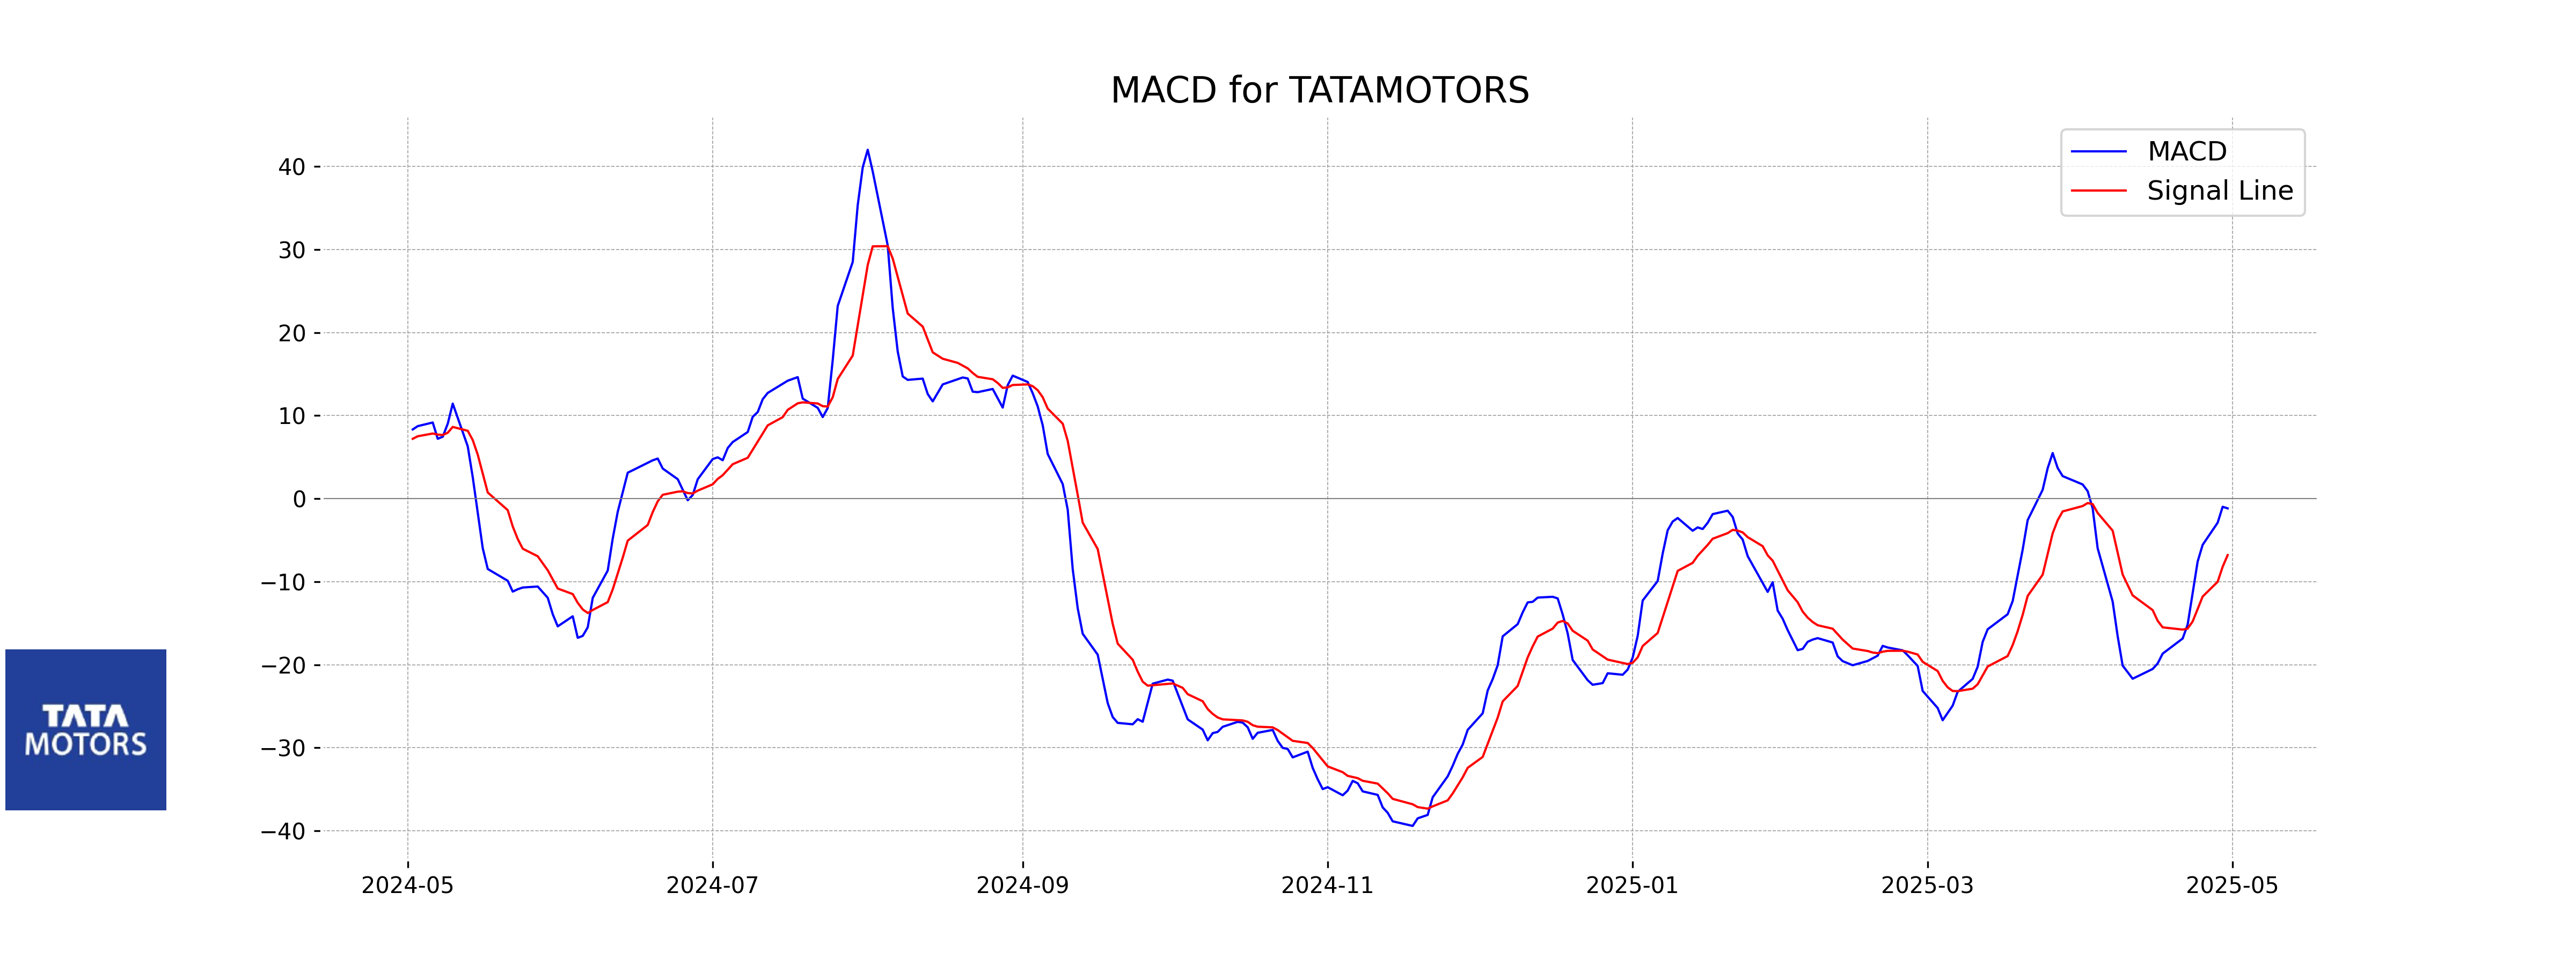
Moving Averages Trend (MACD)
The MACD for Tata Motors is currently at -1.17, which is above the MACD Signal line of -6.80. This indicates a potential bullish crossover, suggesting a possible upward momentum in the near term, but since both values are negative, caution is advised as the stock might still be in a bearish phase overall.
RSI Analysis
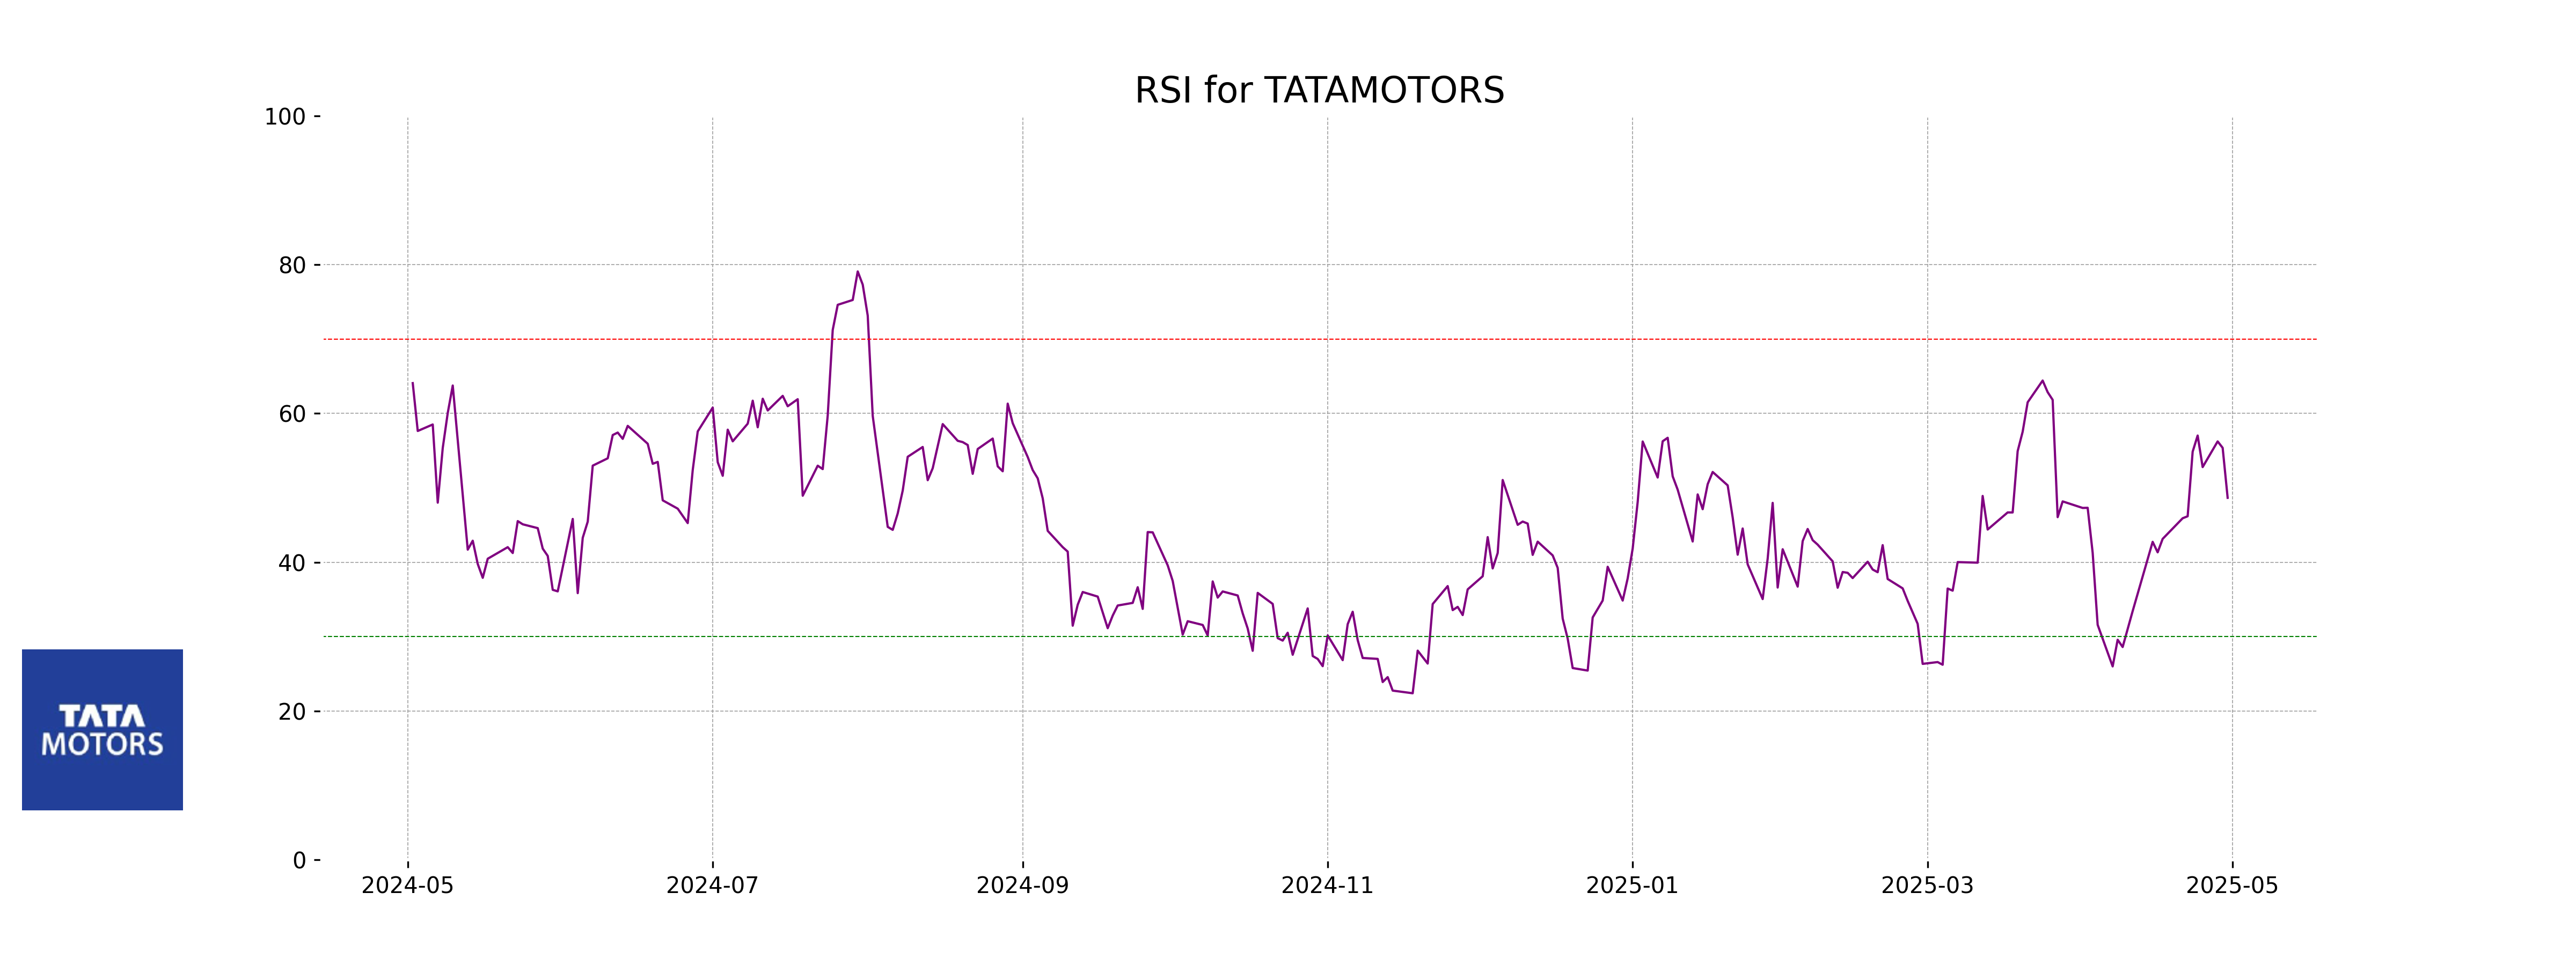
Tata Motors has an RSI of 48.66, indicating the stock is currently in a neutral zone. This suggests neither overbought nor oversold conditions in the short term, which might imply moderate trading activities without strong bullish or bearish sentiments.
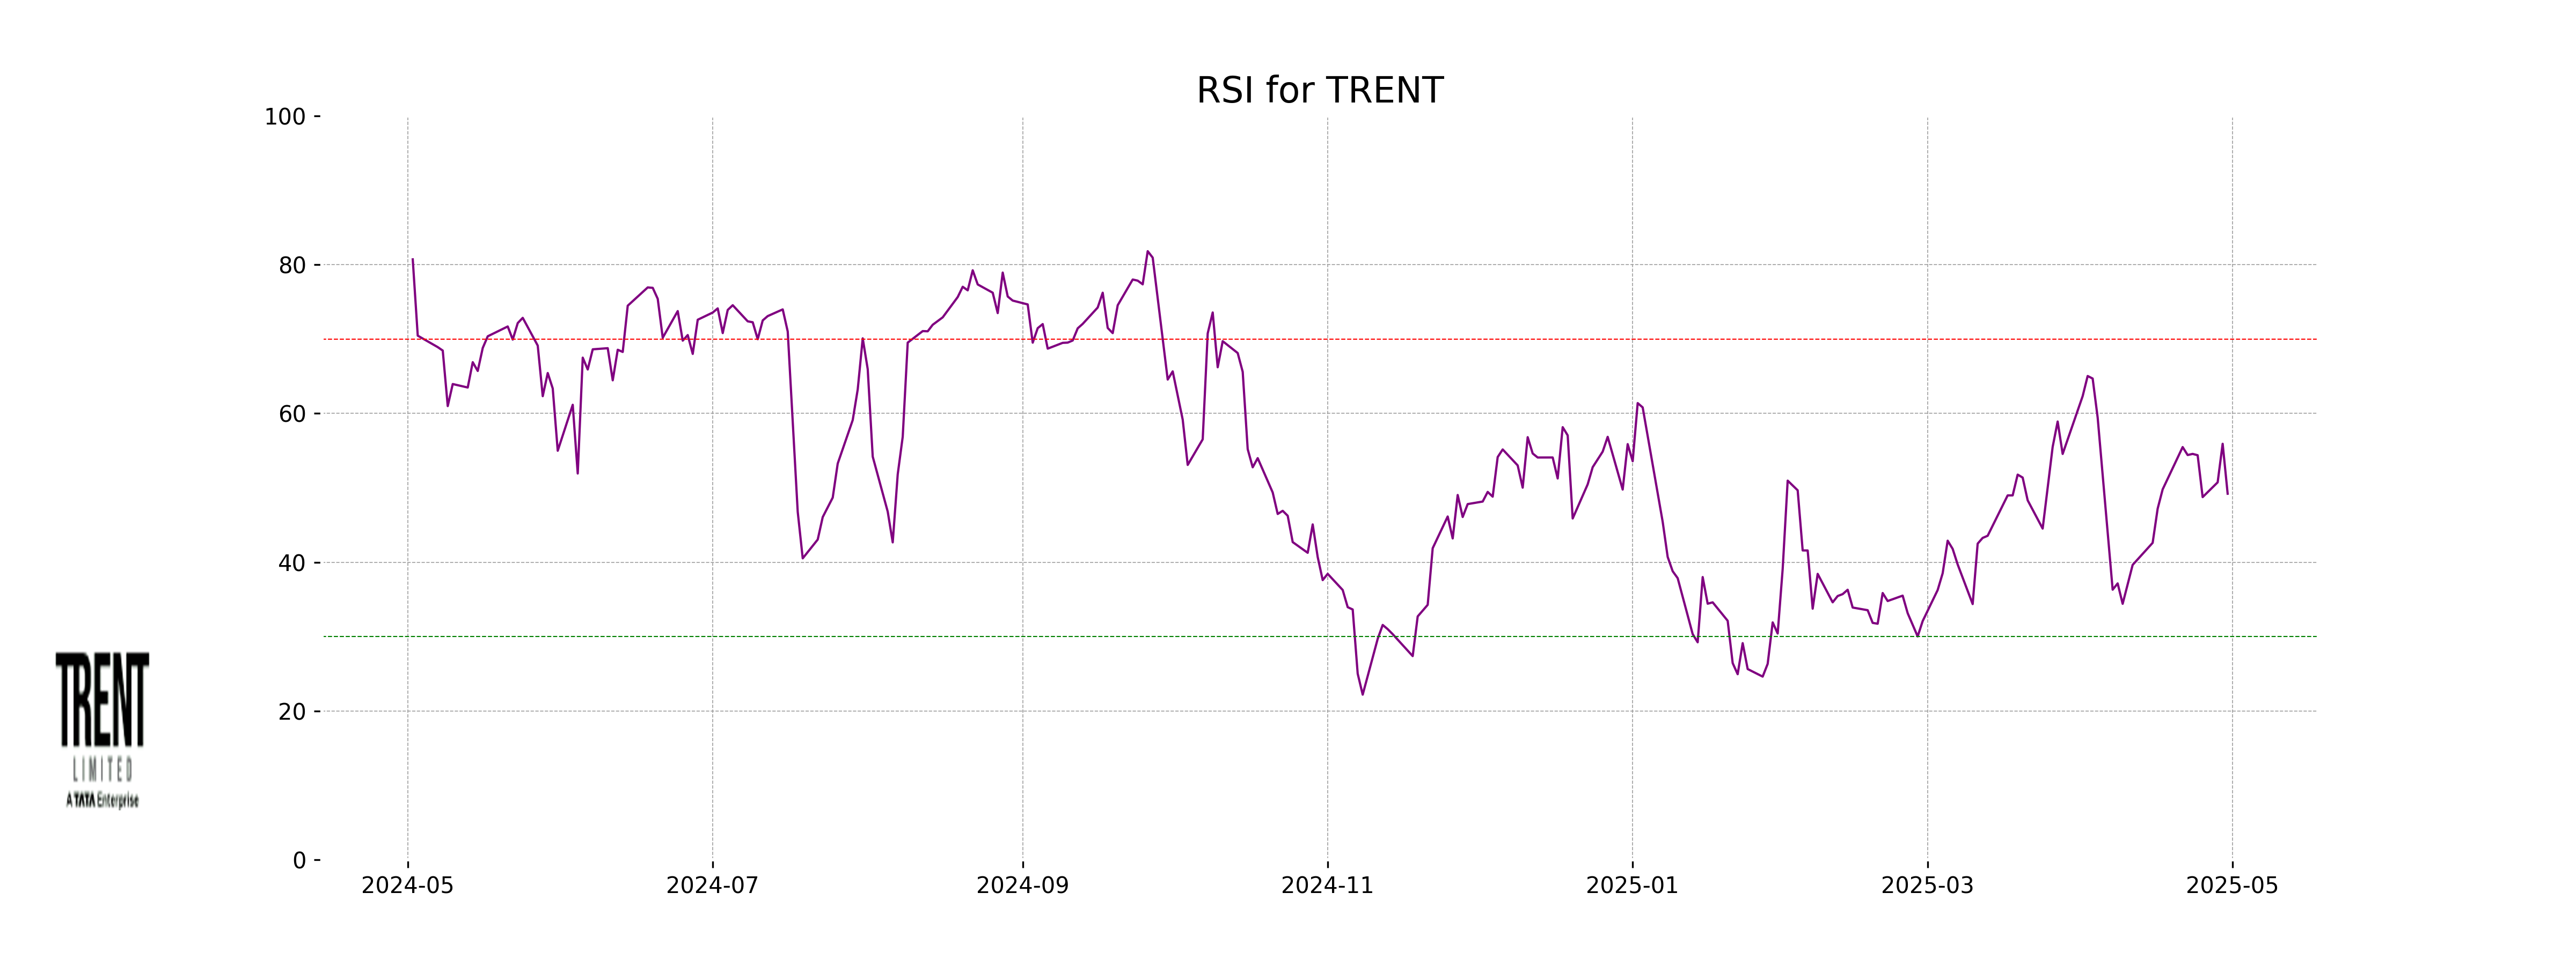
Analysis for Trent - May 01, 2025
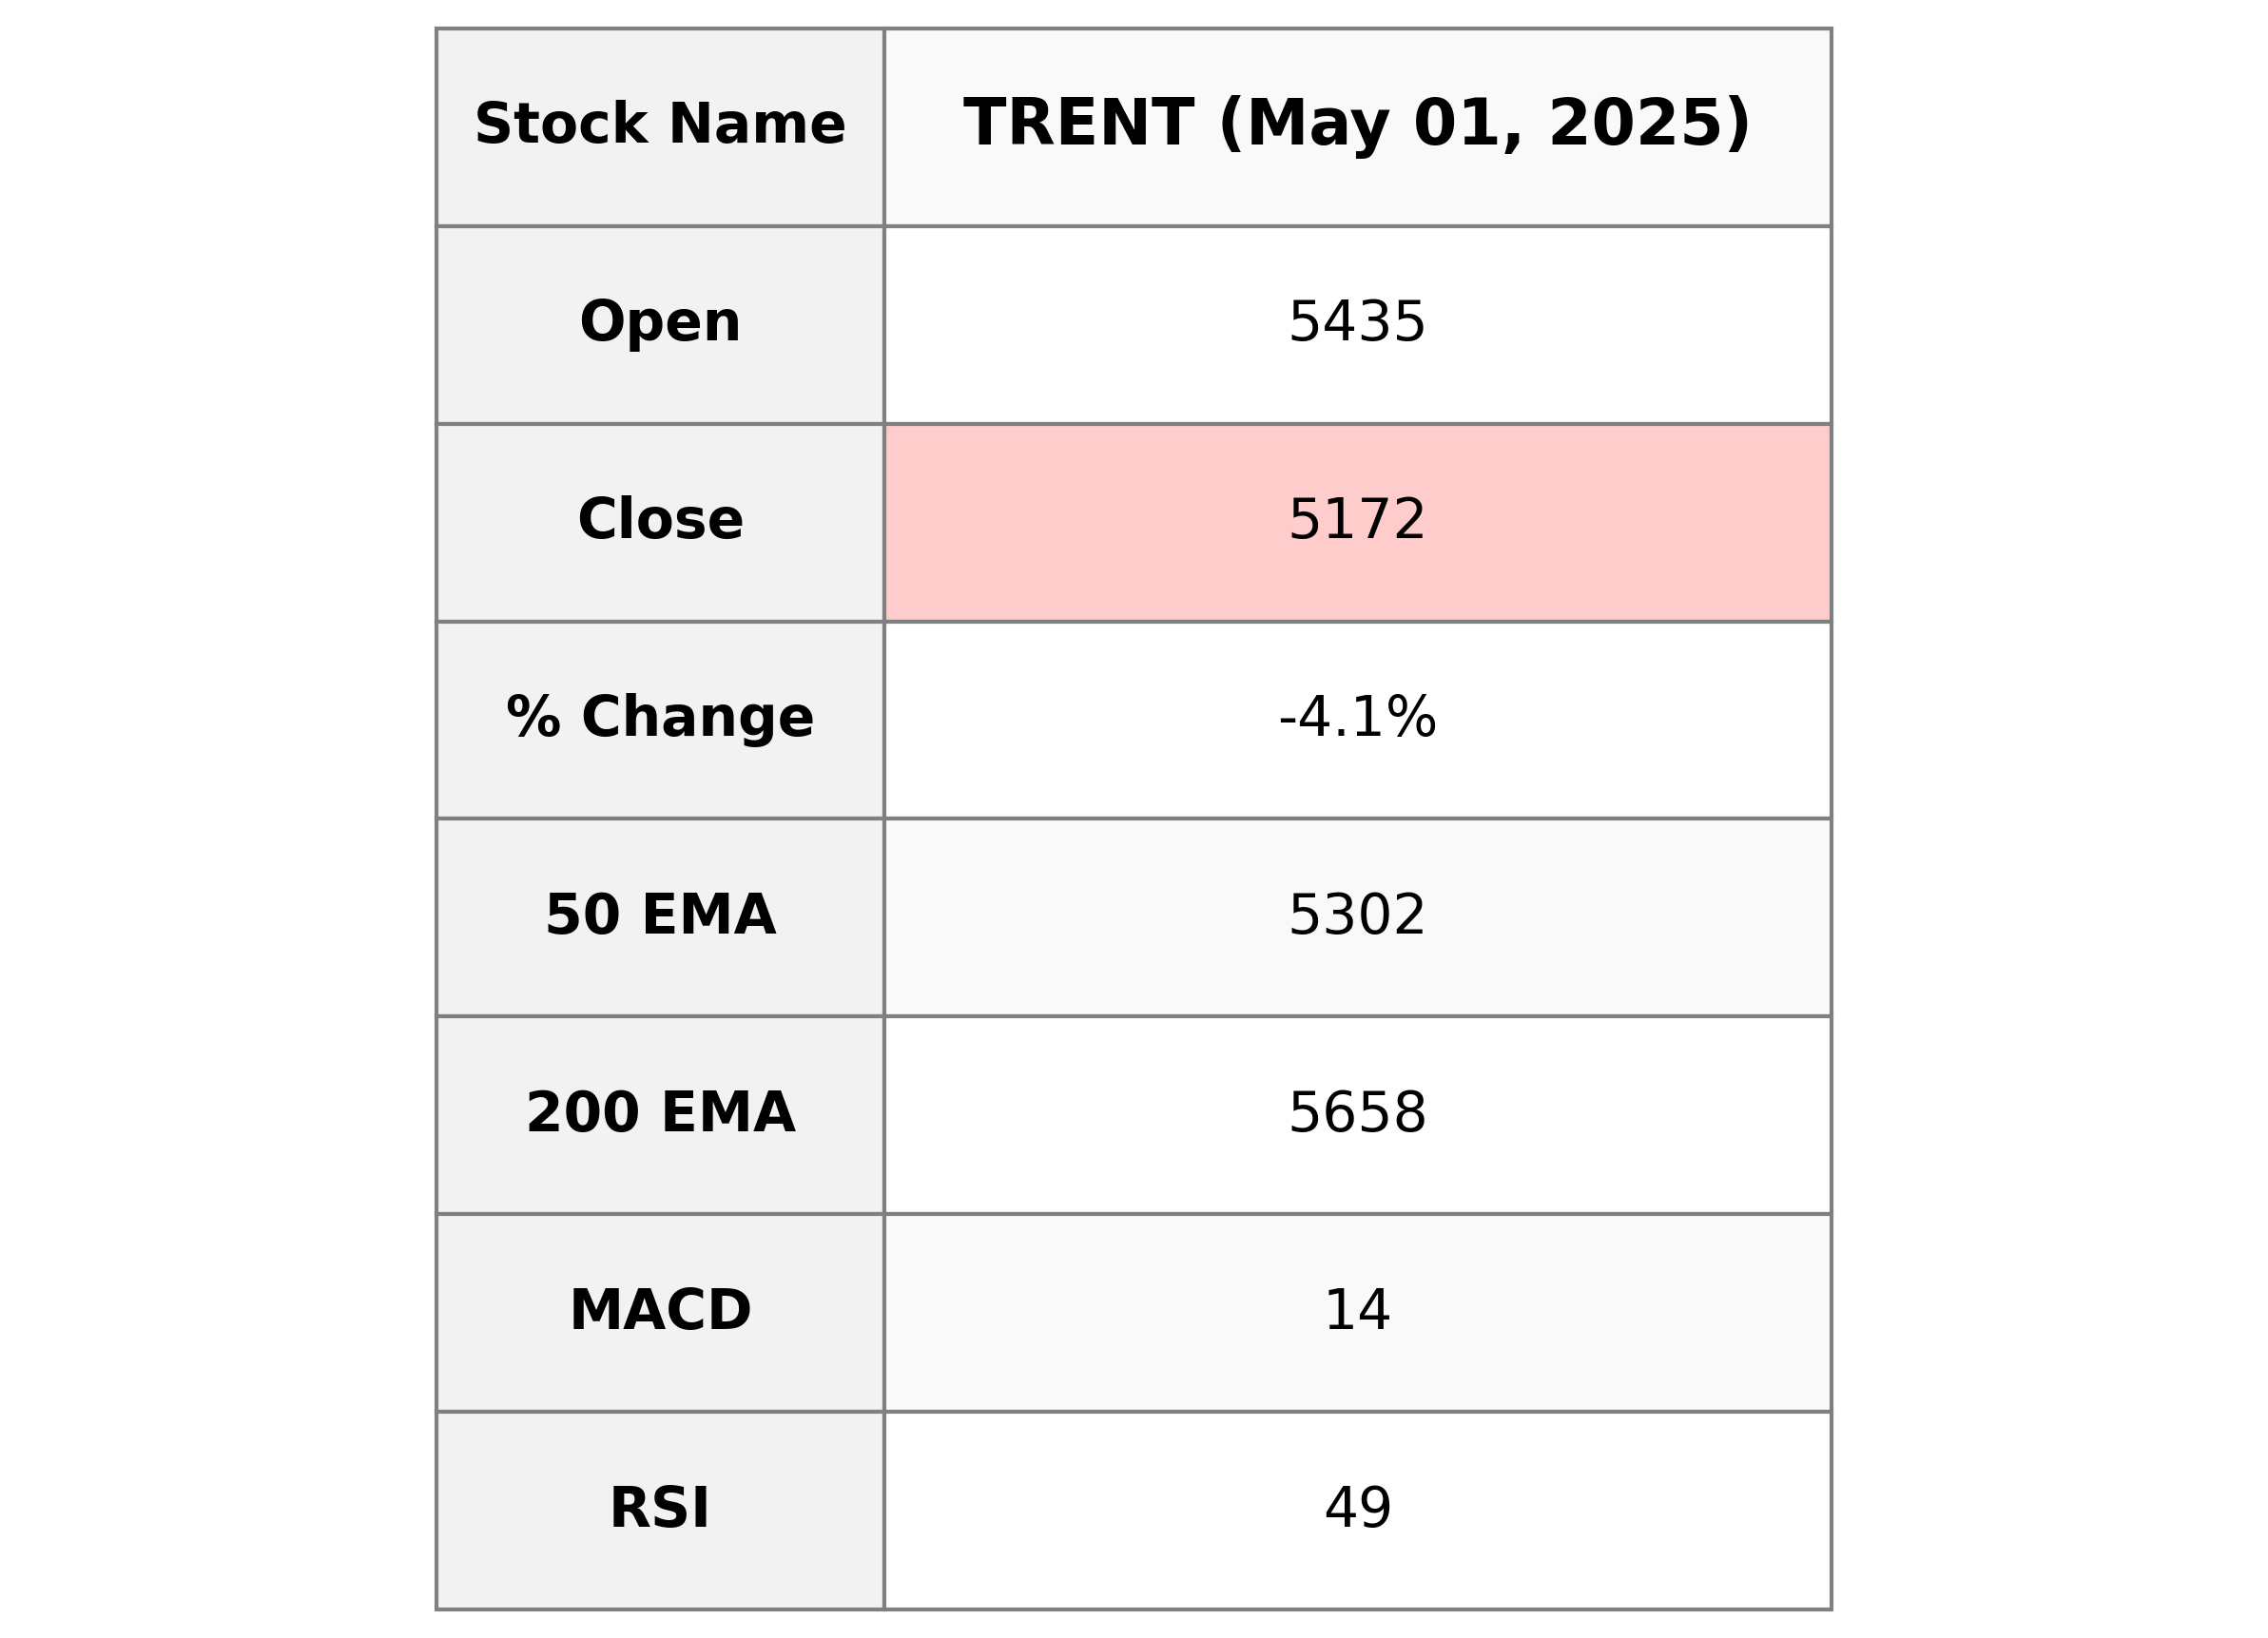
Trent's stock showed a decline with a close at 5172.5, which is down by approximately 4.06% from the previous close of 5391.5, indicating a points change of -219.0. The stock's technical indicators show a 50 EMA of 5302.12, while the RSI stands at 49.21, suggesting it is near a neutral state. The market cap is 1,839,077,130,240, and with a P/E ratio of 119.04, the company operates in the Consumer Cyclical sector, specifically in Apparel Retail, based in India.
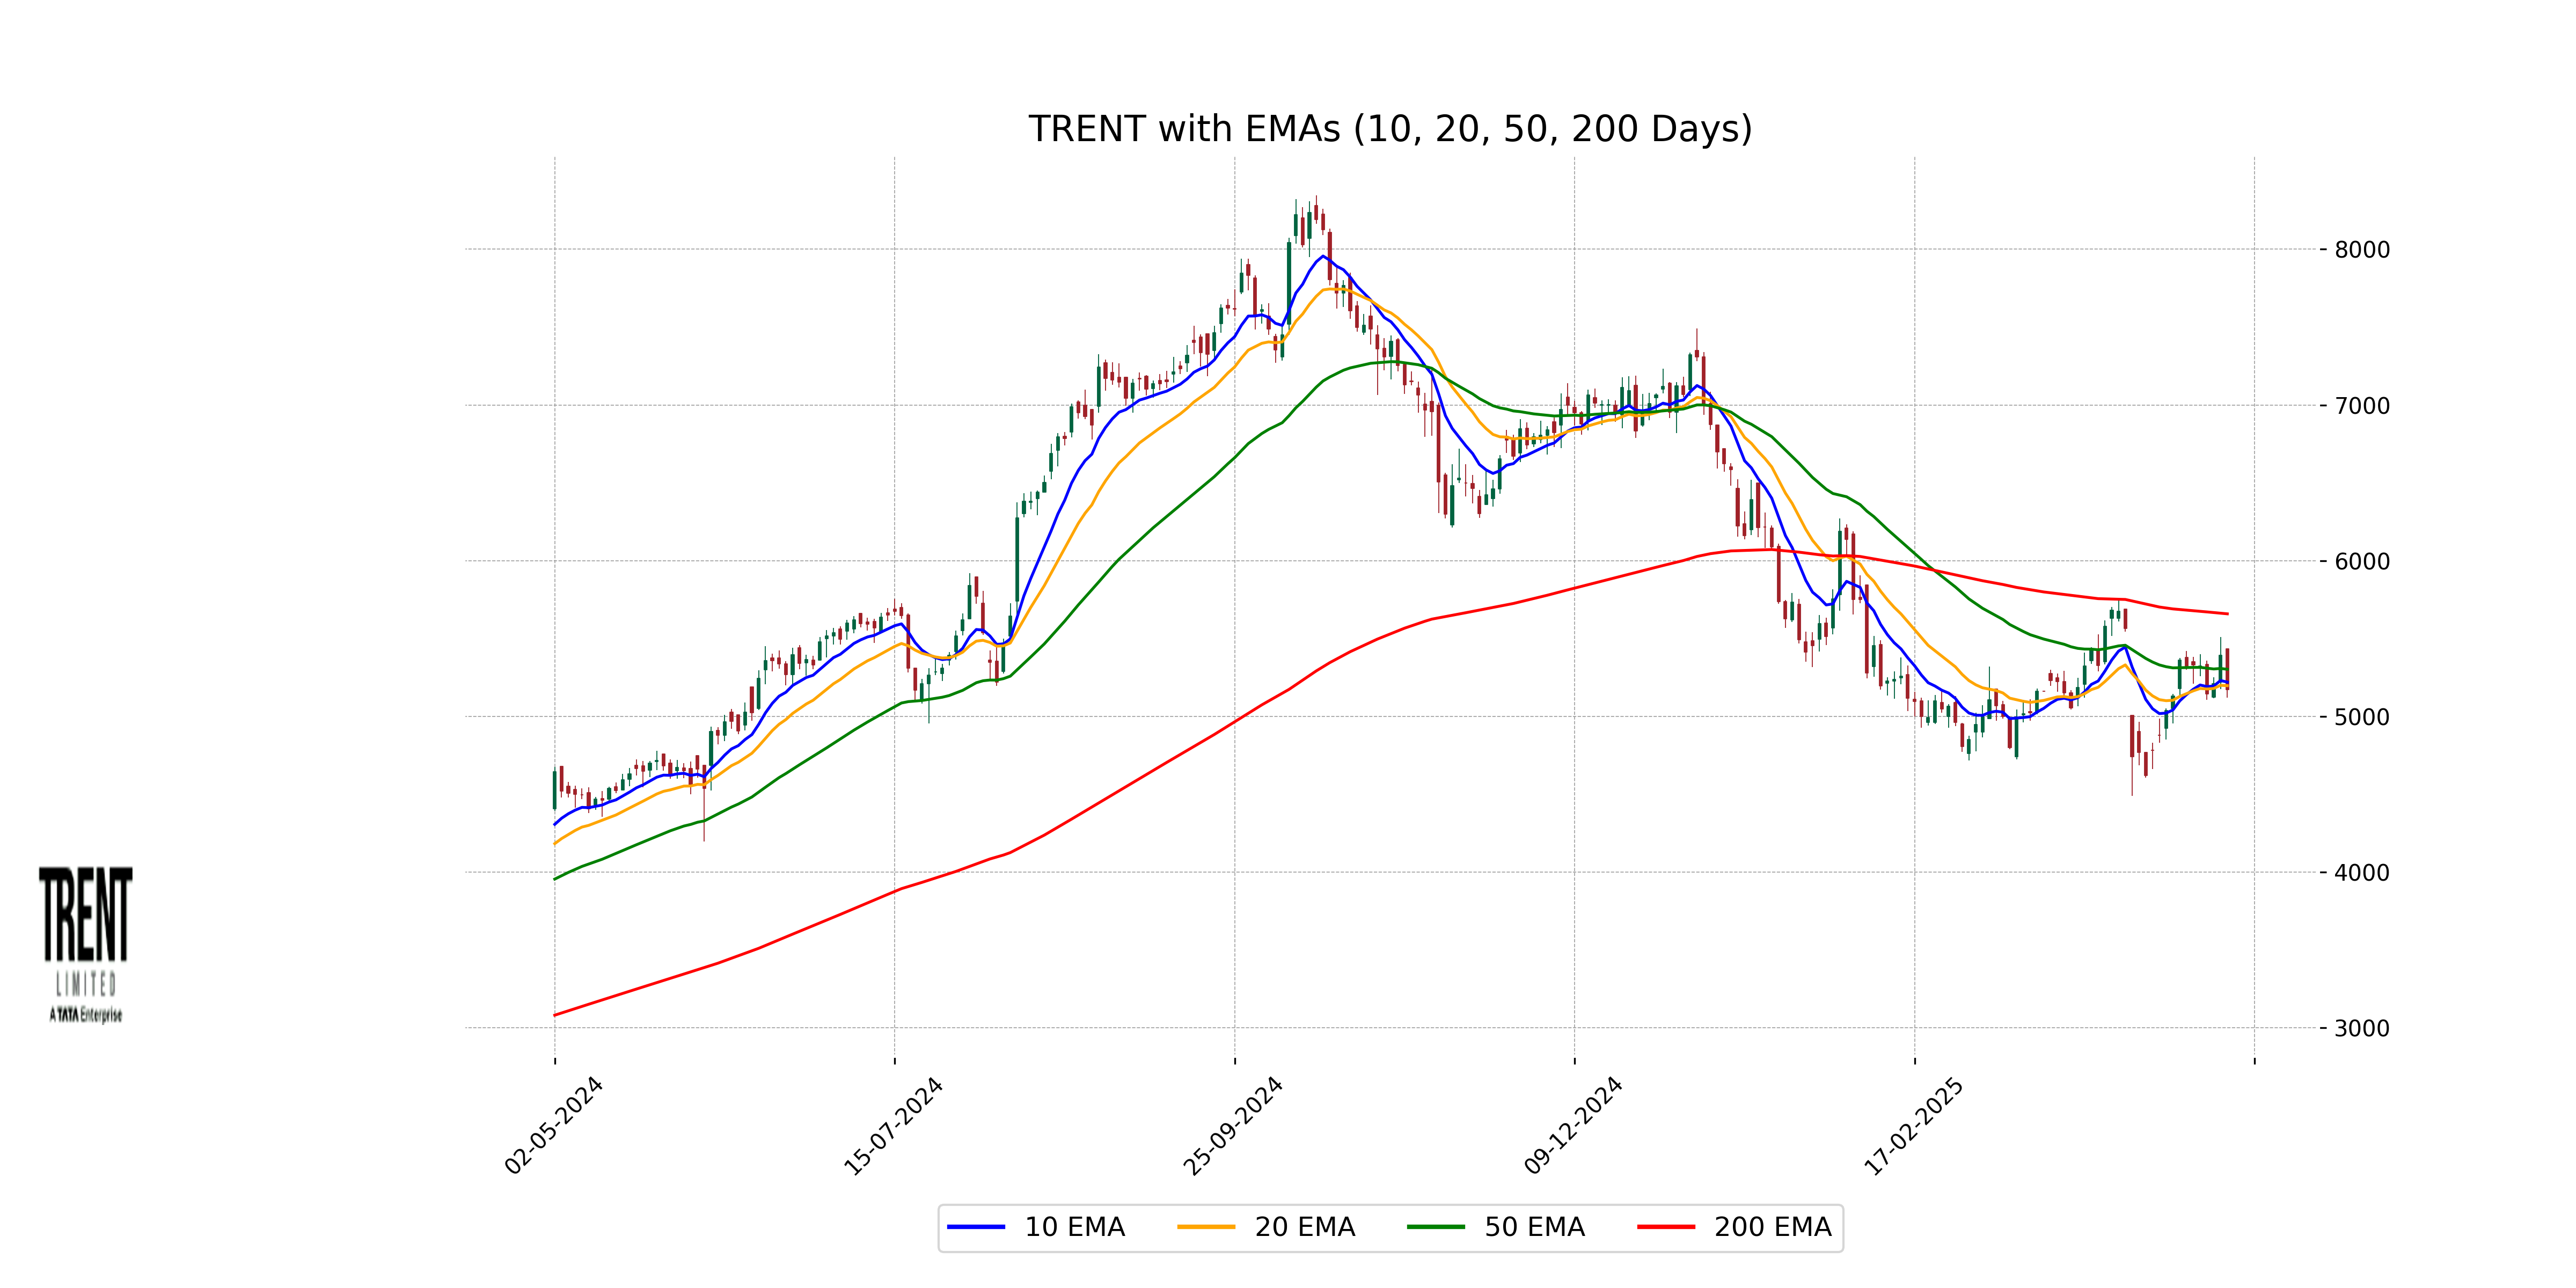
Relationship with Key Moving Averages
For Trent, the stock's closing price of 5172.5 is below both its 50-day EMA of 5302.12 and considerably below its 200-day EMA of 5658.29, indicating a potential bearish trend in the short to medium term. The 10-day EMA and 20-day EMA are also slightly above the close, suggesting short-term price pressure.
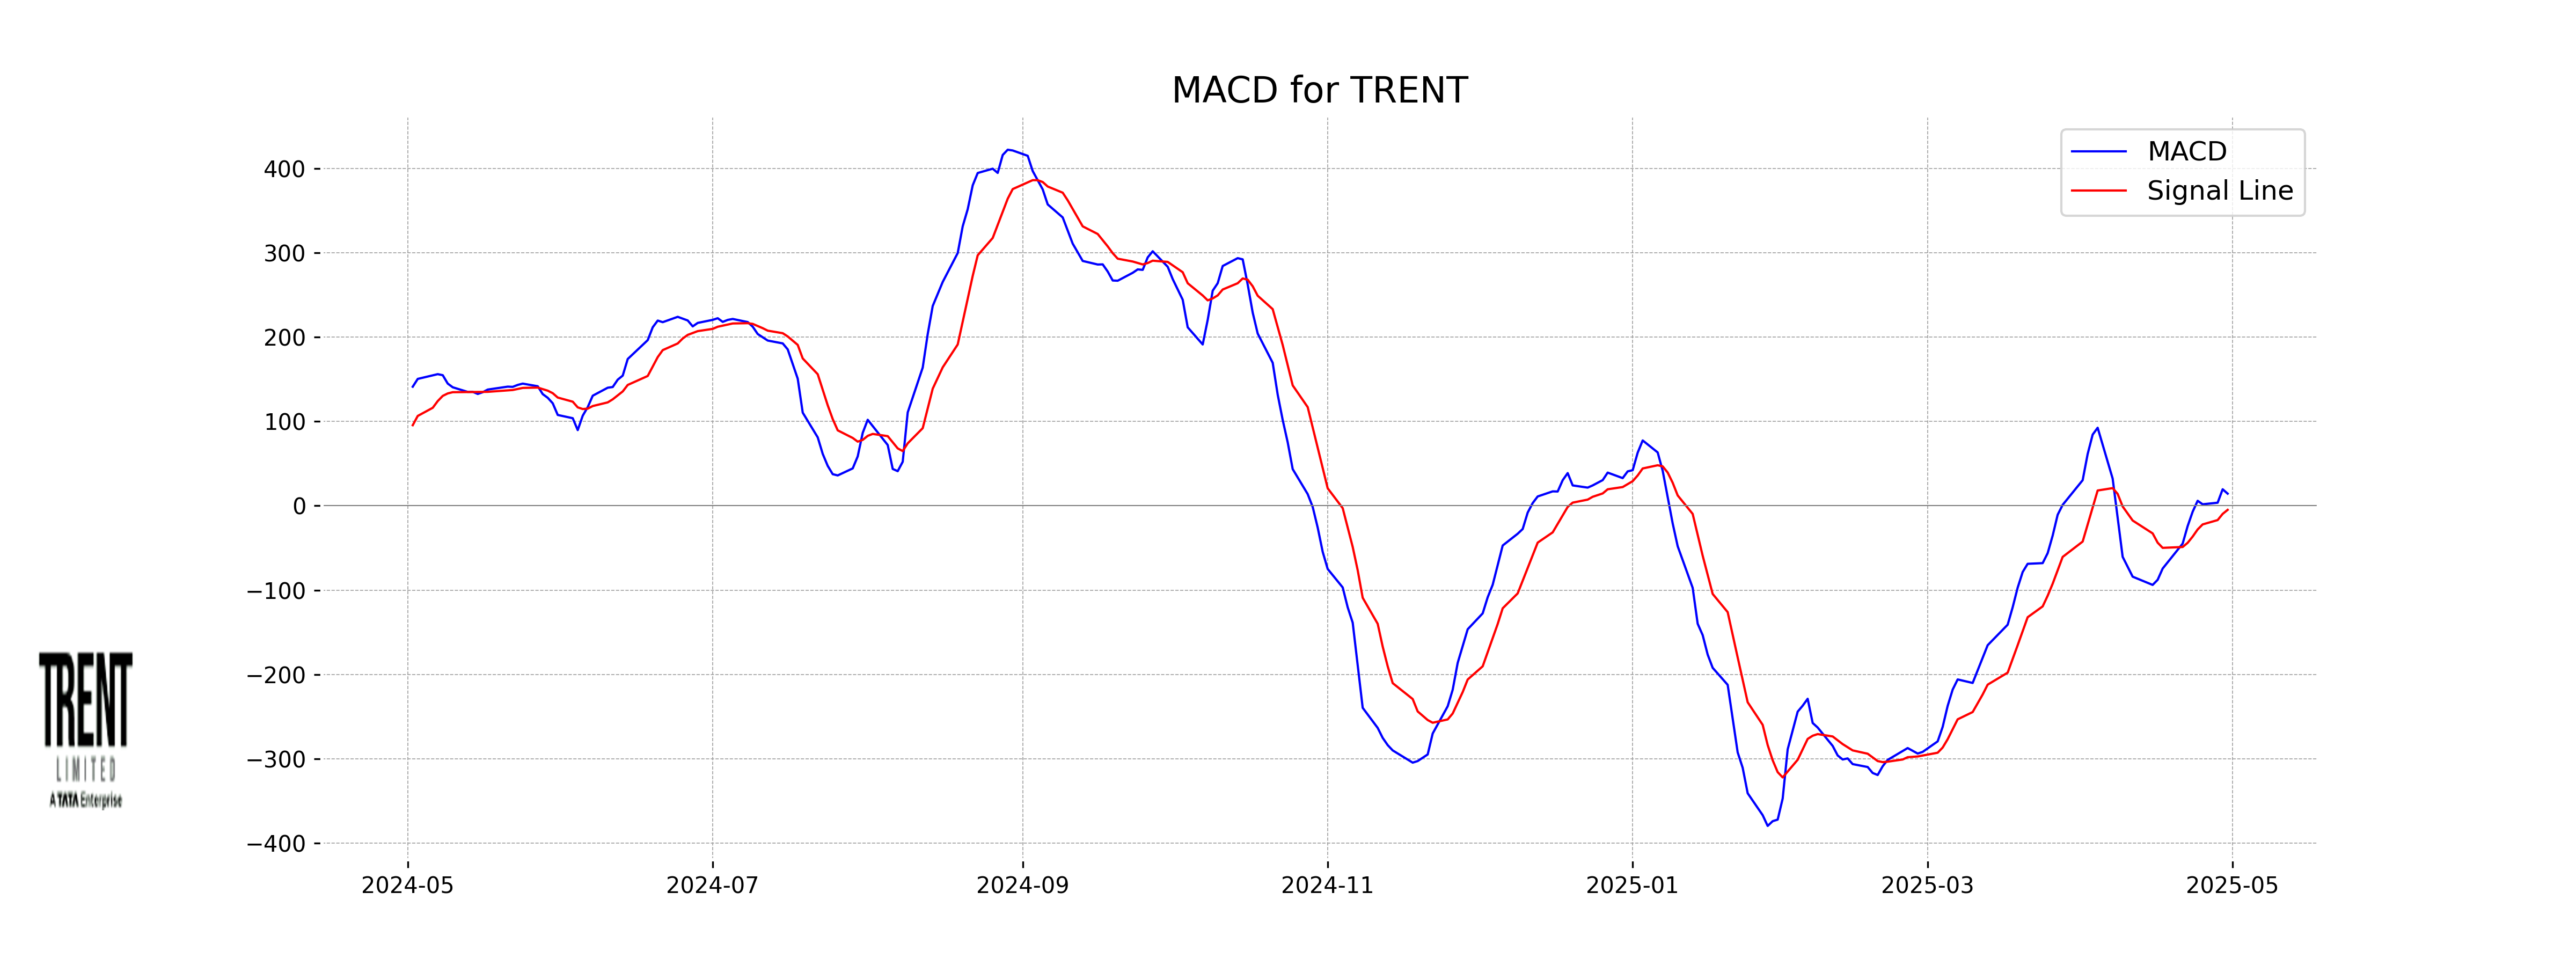
Moving Averages Trend (MACD)
Trent's MACD value is 14.38, indicating a bullish momentum as it is above its MACD Signal of -4.84. This suggests a potential upward price movement for the stock, given the positive difference between the MACD and the signal line.
RSI Analysis
RSI Analysis for Trent: The RSI for Trent is 49.21, which is close to the neutral zone. This suggests that the stock is neither overbought nor oversold, indicating a balance between buying and selling pressures in the recent period.