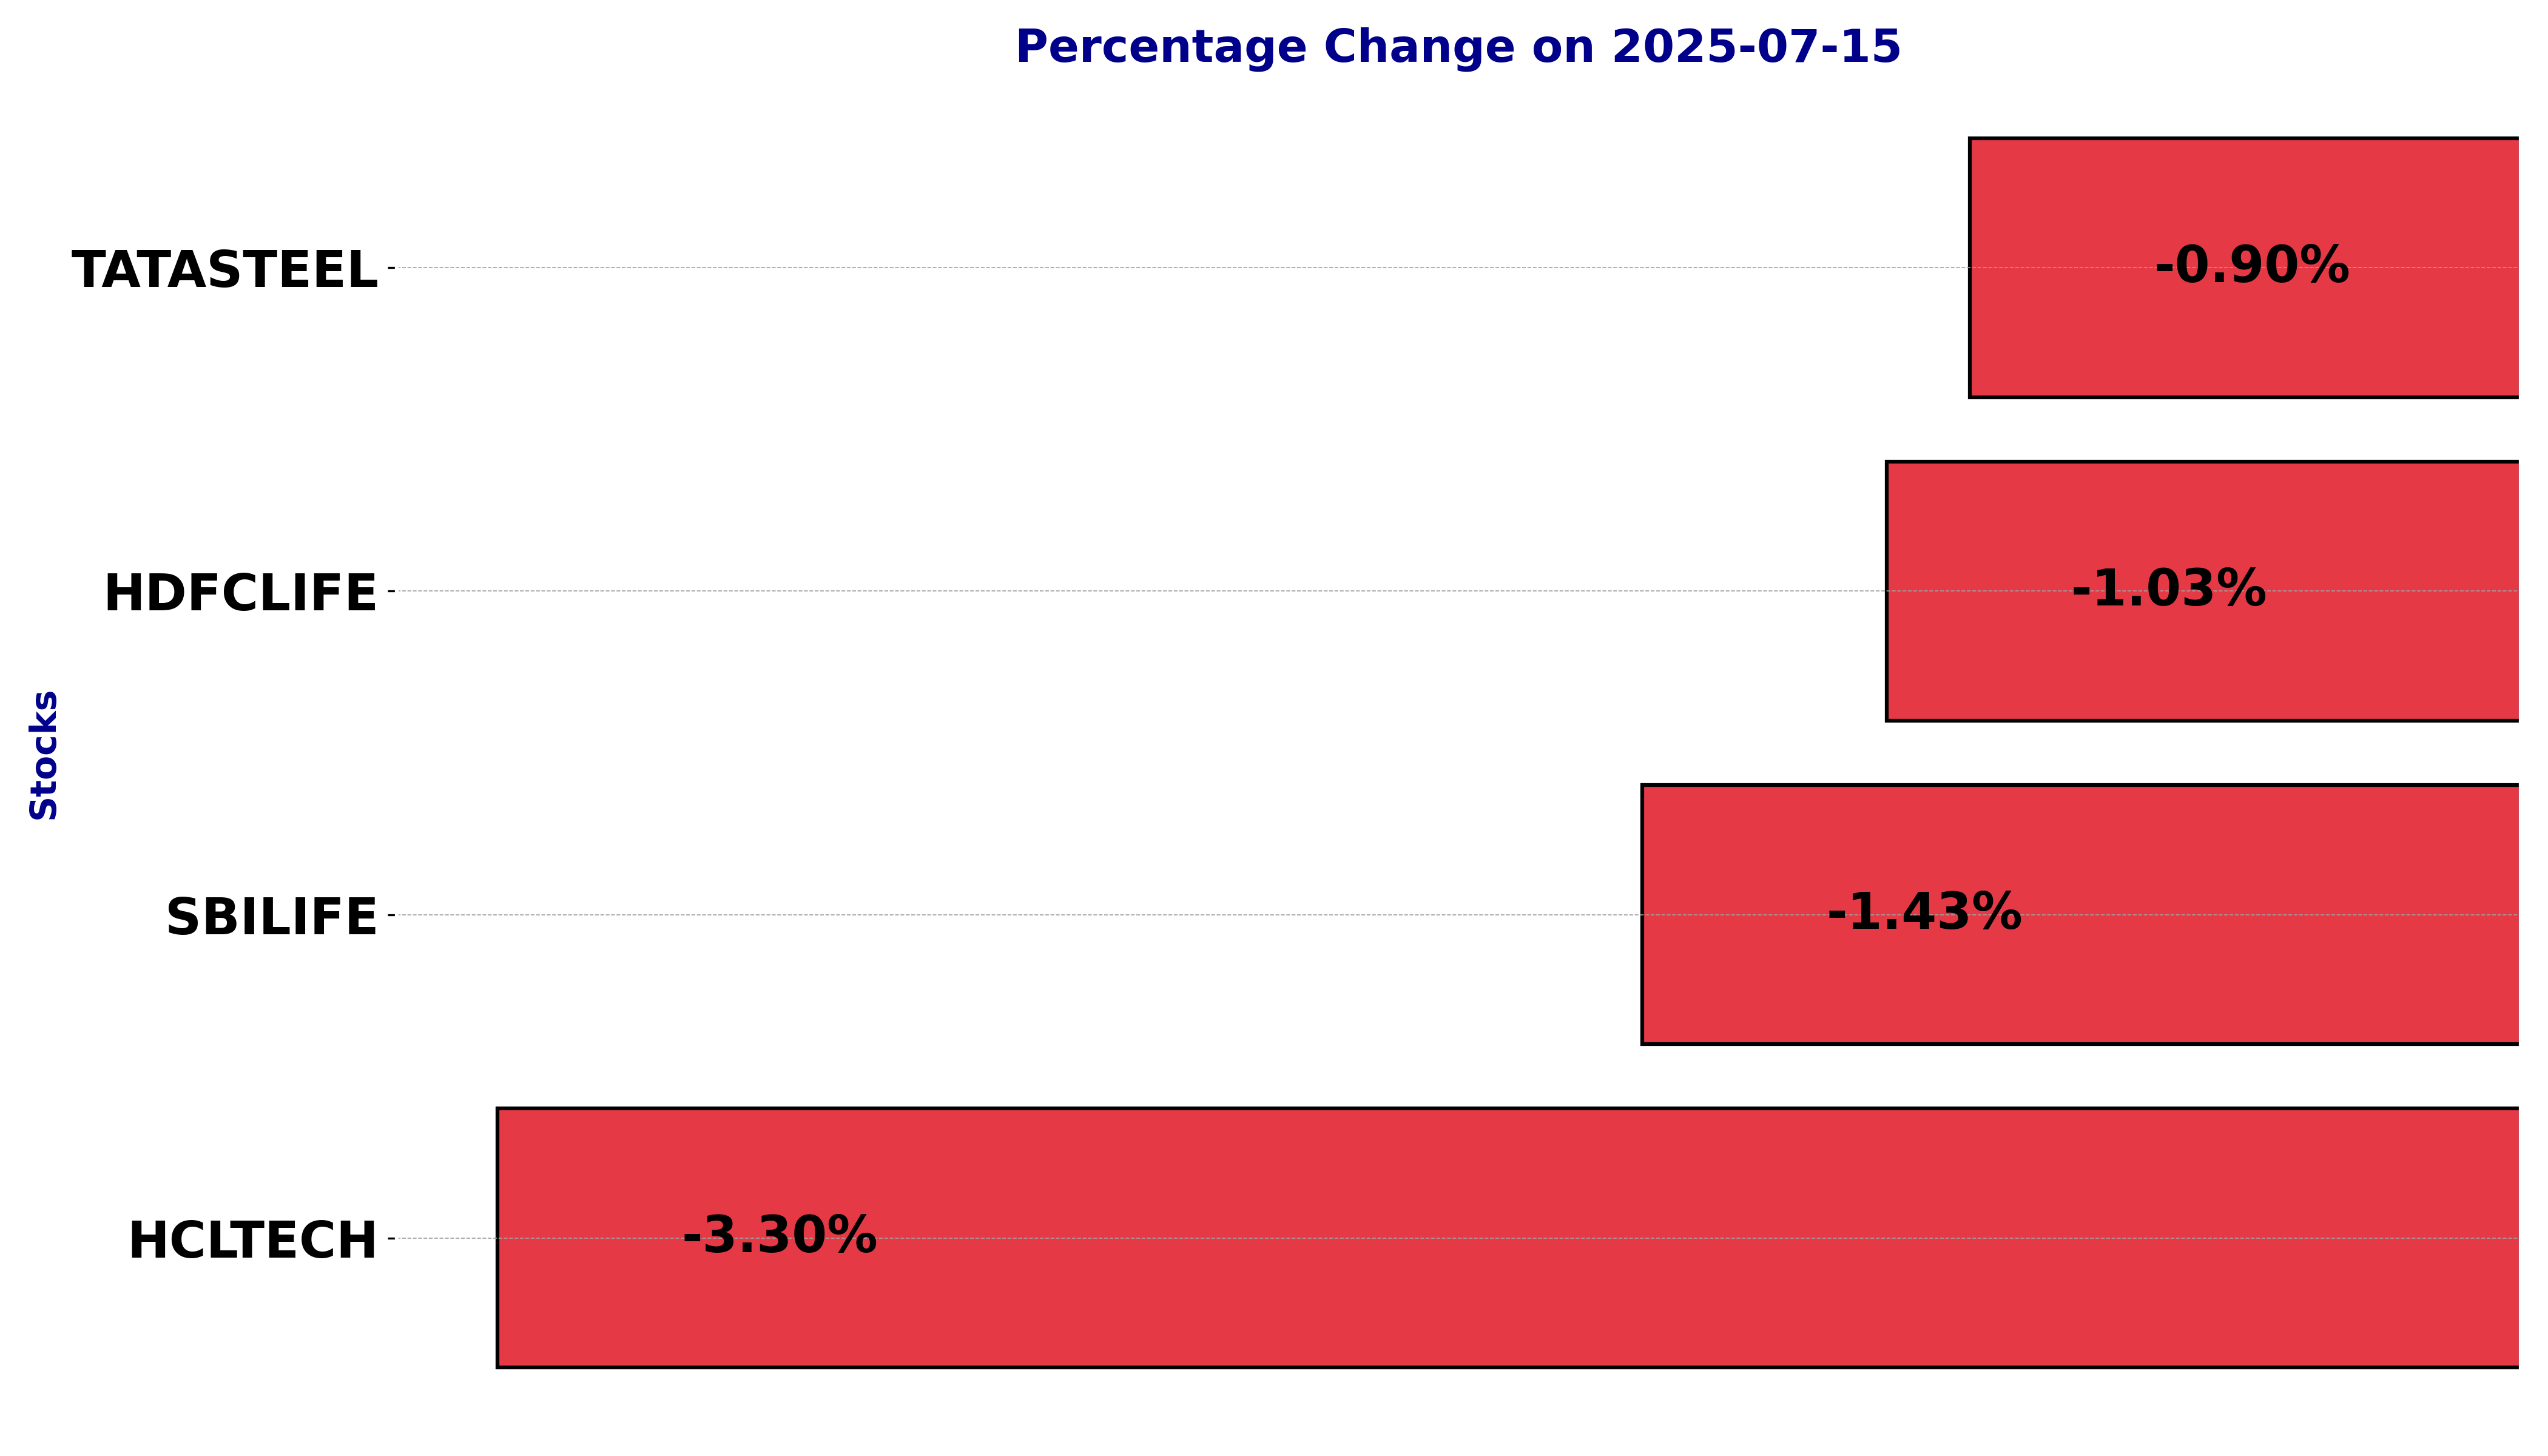
NSE Nifty 50: Top 5 stock losers of July 15, 2025
In this article, we will explore the technical indicators of some of the low-performing stocks on the Indian stock market, including HCLTECH, HDFCLIFE, SBILIFE, and TATASTEEL.
By looking at these stocks through the lens of key technical factors, we aim to better understand their price movements, trends, and potential future performance.
Analysis for HCL Technologies - July 15, 2025
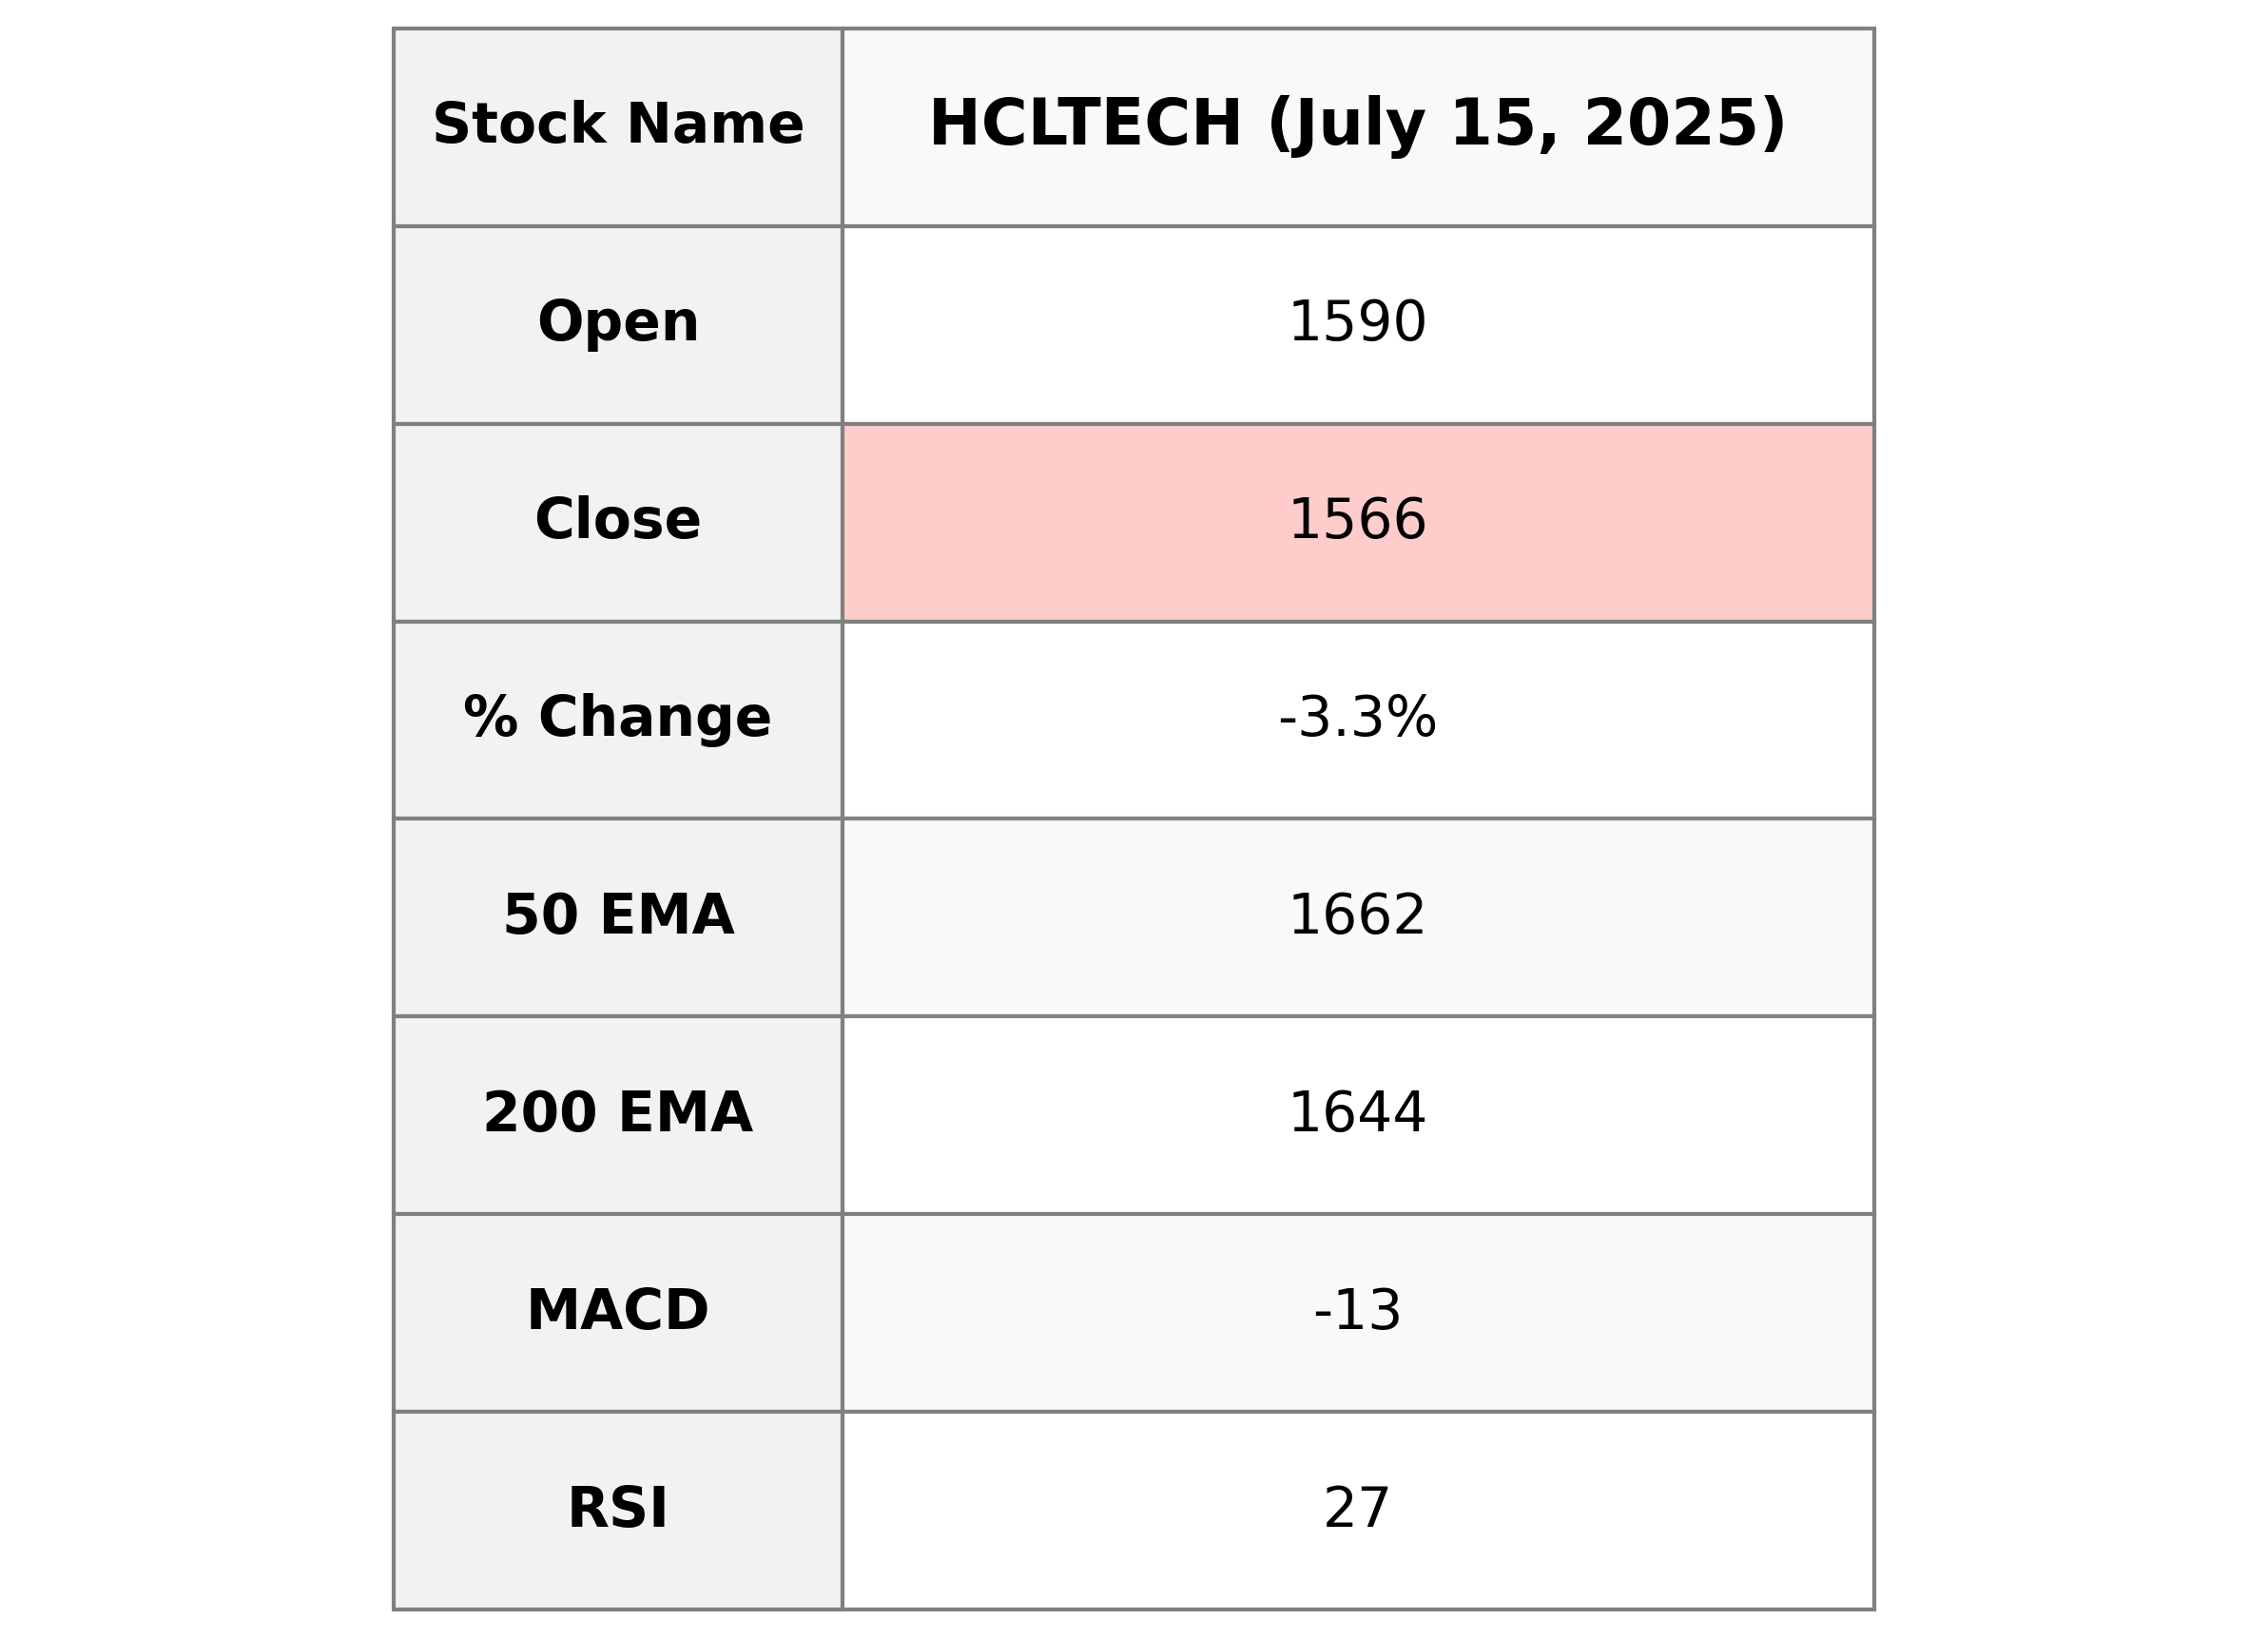
HCL Technologies: The stock of HCL Technologies experienced a decrease, closing at 1566.40, down by 3.30% from its previous close. The RSI indicates oversold conditions. The stock's MACD shows a negative crossover, suggesting bearish momentum. The current price is below its 10, 20, 50, and 200-day EMAs, reflecting potential weakness in the stock's performance.
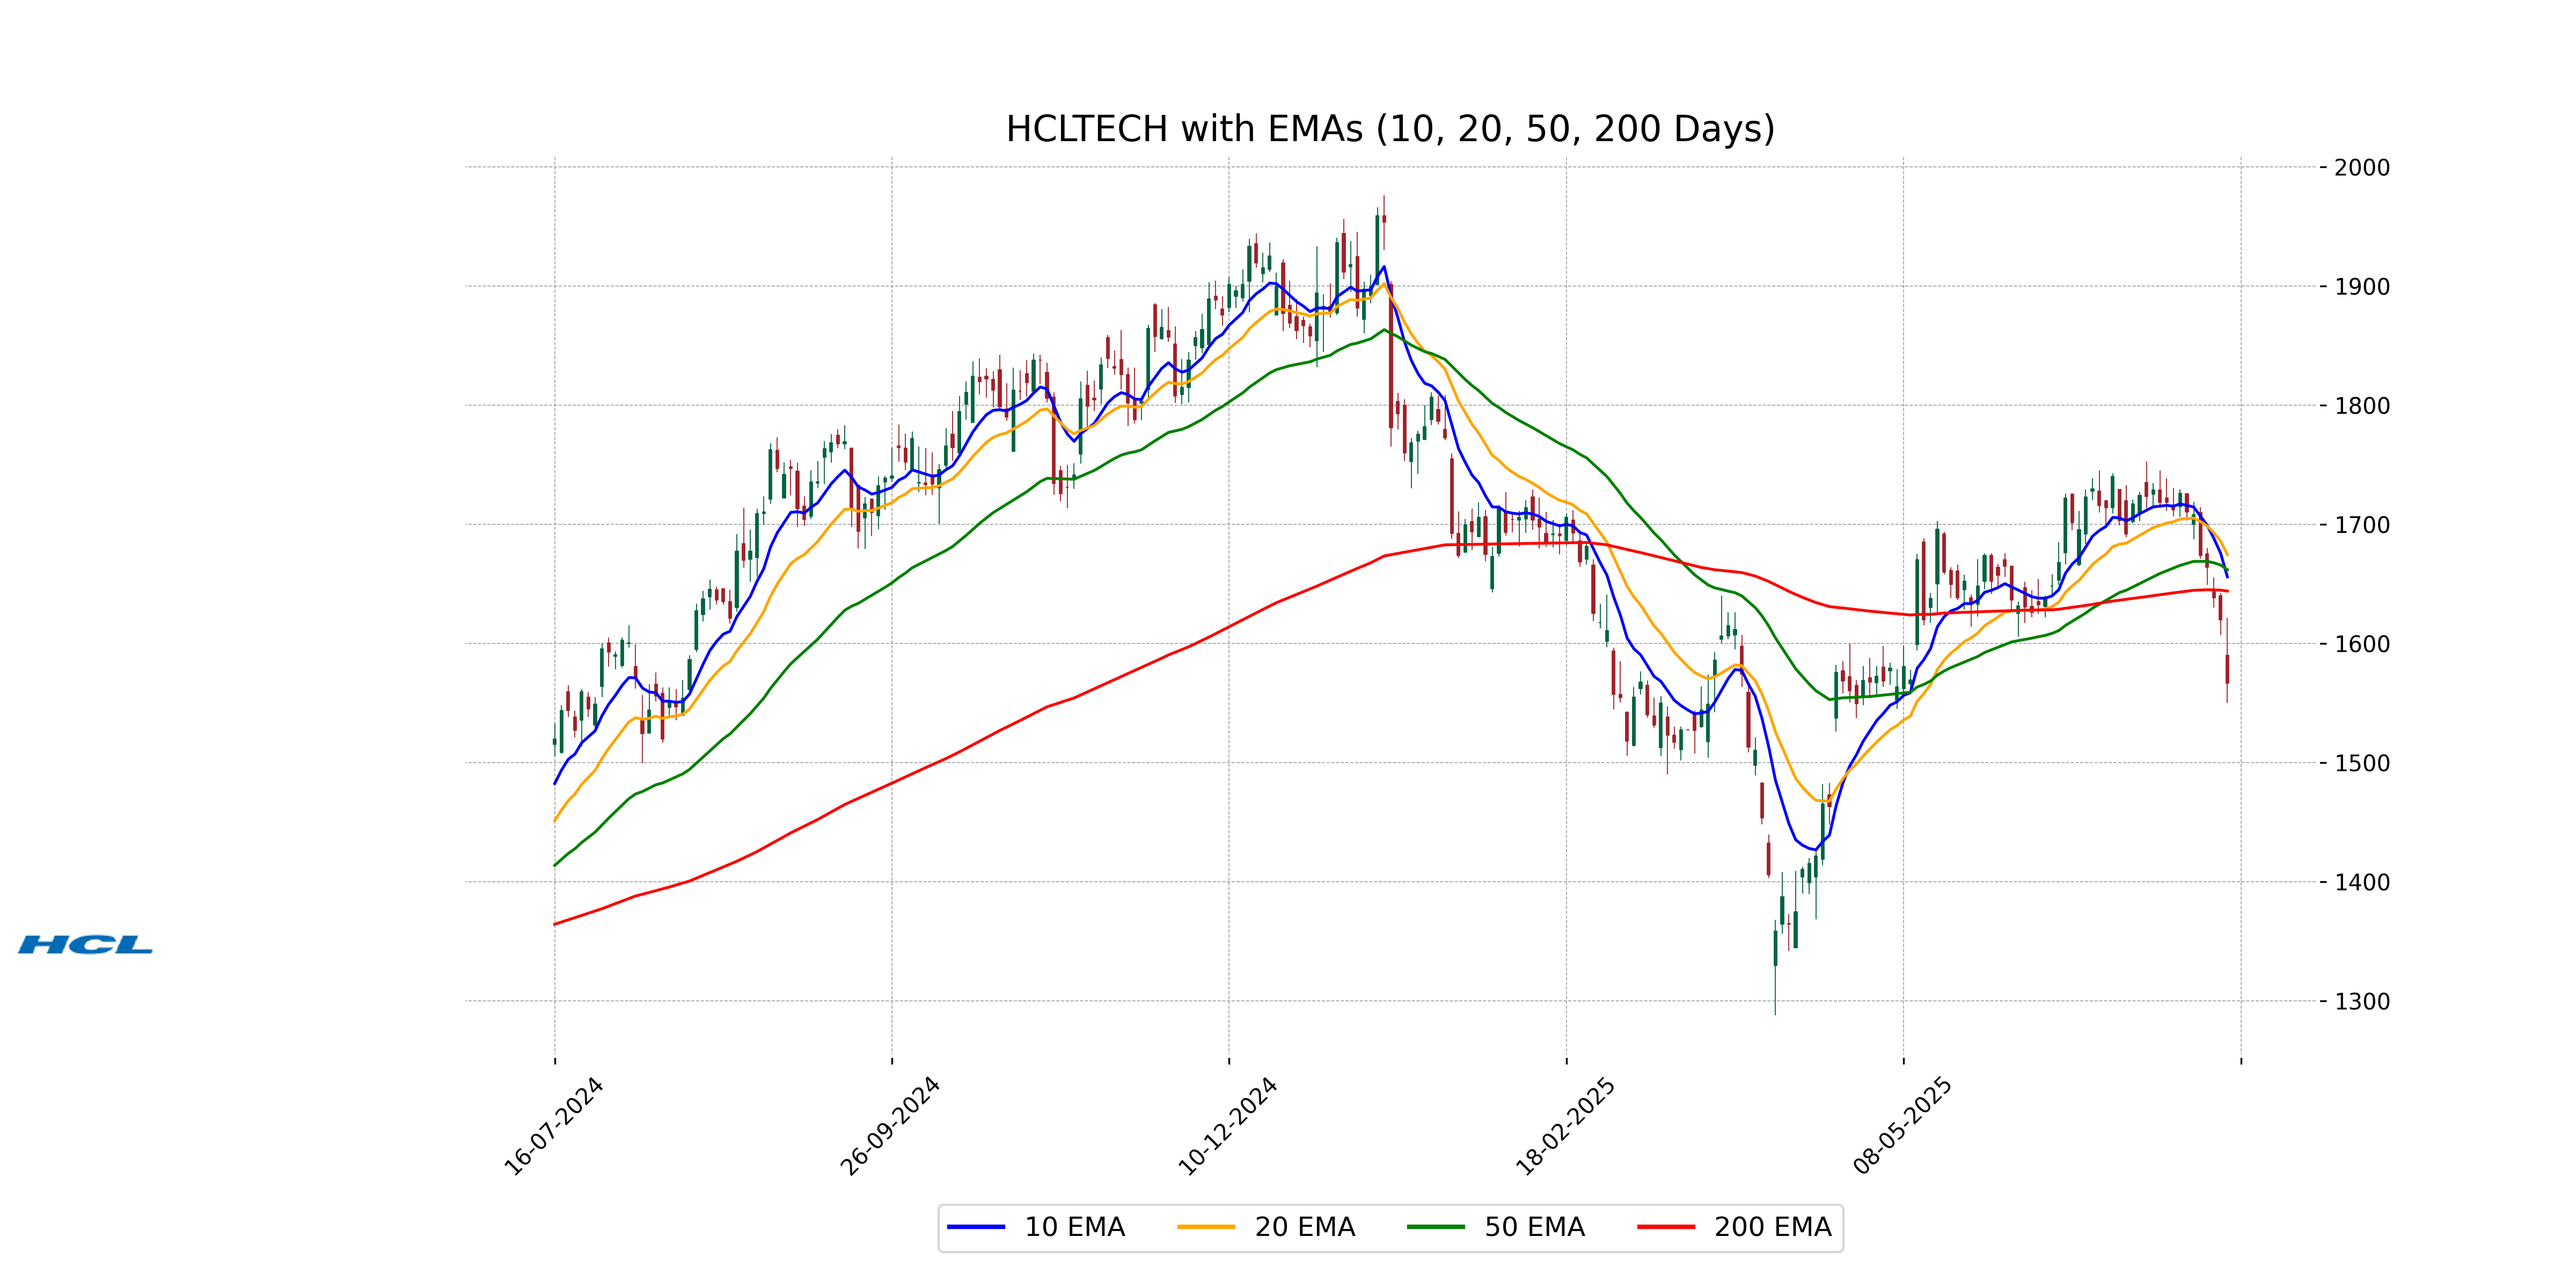
Relationship with Key Moving Averages
HCL Technologies's current close of 1566.40 is below all key moving averages: the 50-day EMA of 1661.86, the 200-day EMA of 1643.92, and the 10-day EMA of 1655.84, indicating a bearish trend.
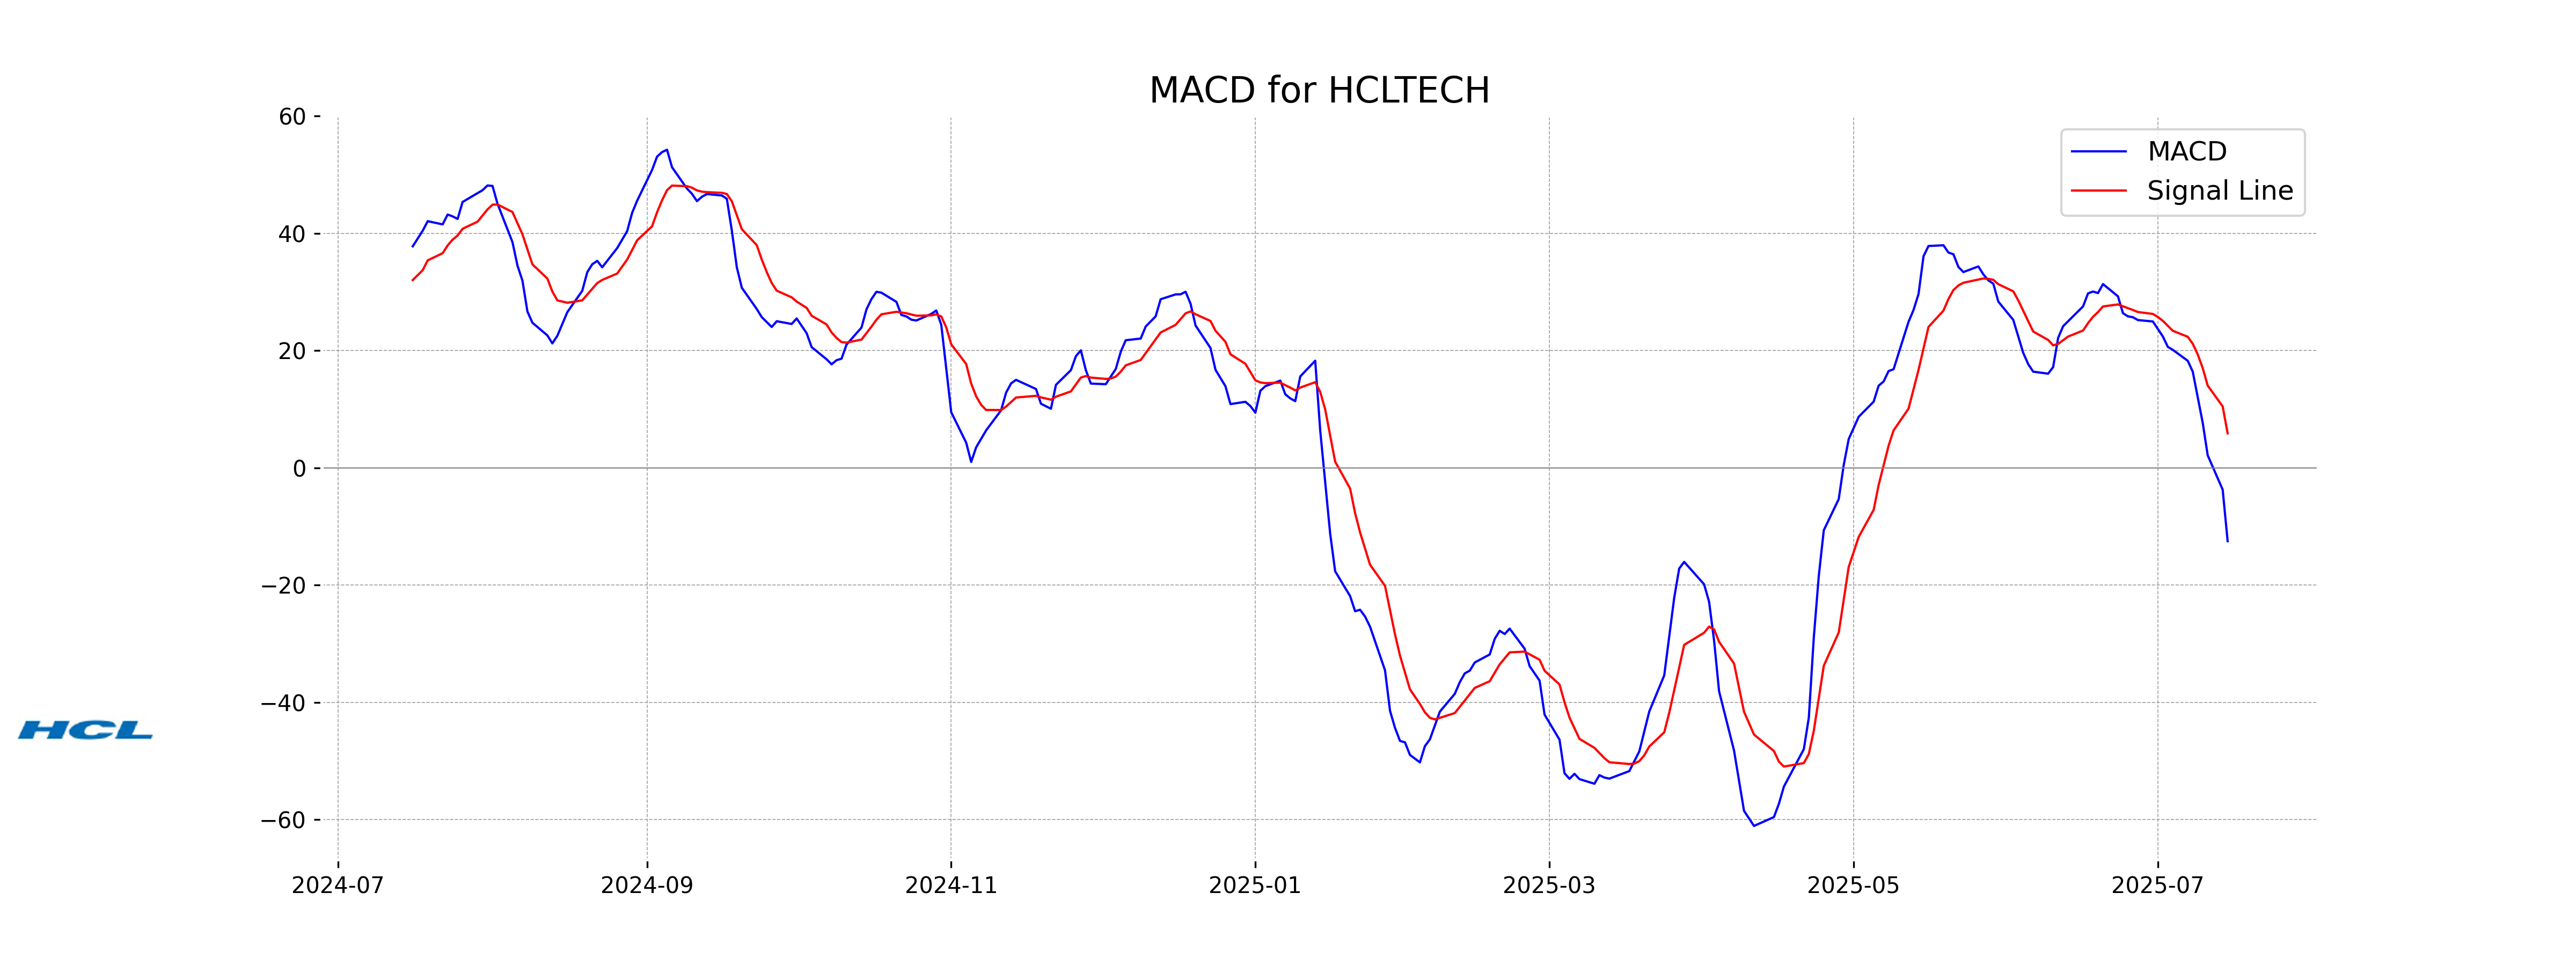
Moving Averages Trend (MACD)
MACD Analysis for HCL Technologies: The MACD for HCL Technologies is -12.50, indicating a bearish trend as it is below the MACD Signal line, which is 5.89. This suggests that the stock may experience further downward momentum in the short term. Additionally, the RSI at 26.90 also points towards an oversold condition, which could potentially trigger a consolidation or a rebound in the near future.
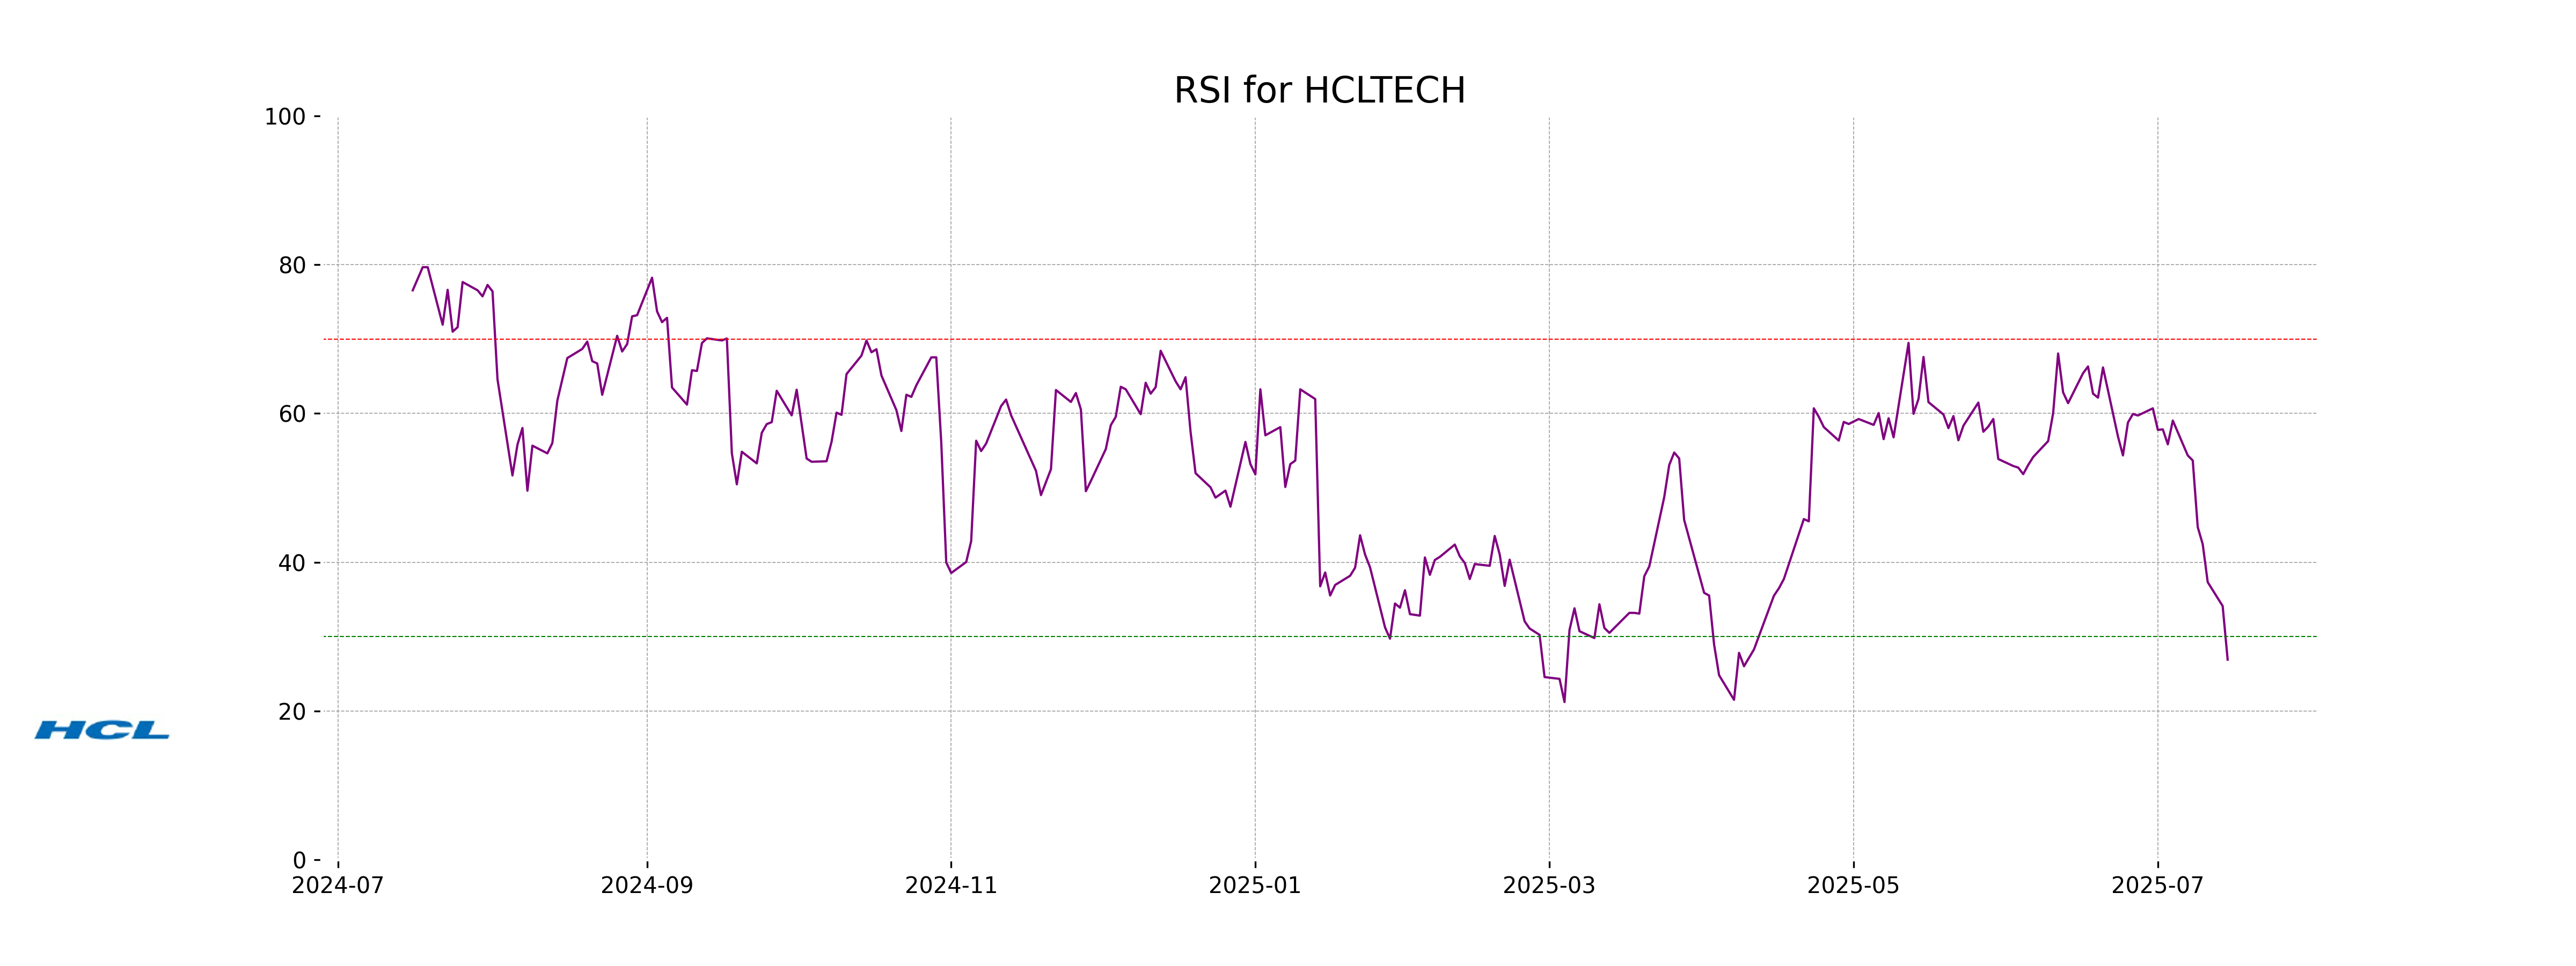
RSI Analysis
HCL Technologies is currently exhibiting an RSI of 26.90, indicating that the stock is in the oversold territory. This suggests that there may be a potential for a near-term rebound as the current RSI level implies that the selling pressure might be overextended.
Analysis for HDFC LIFE - July 15, 2025
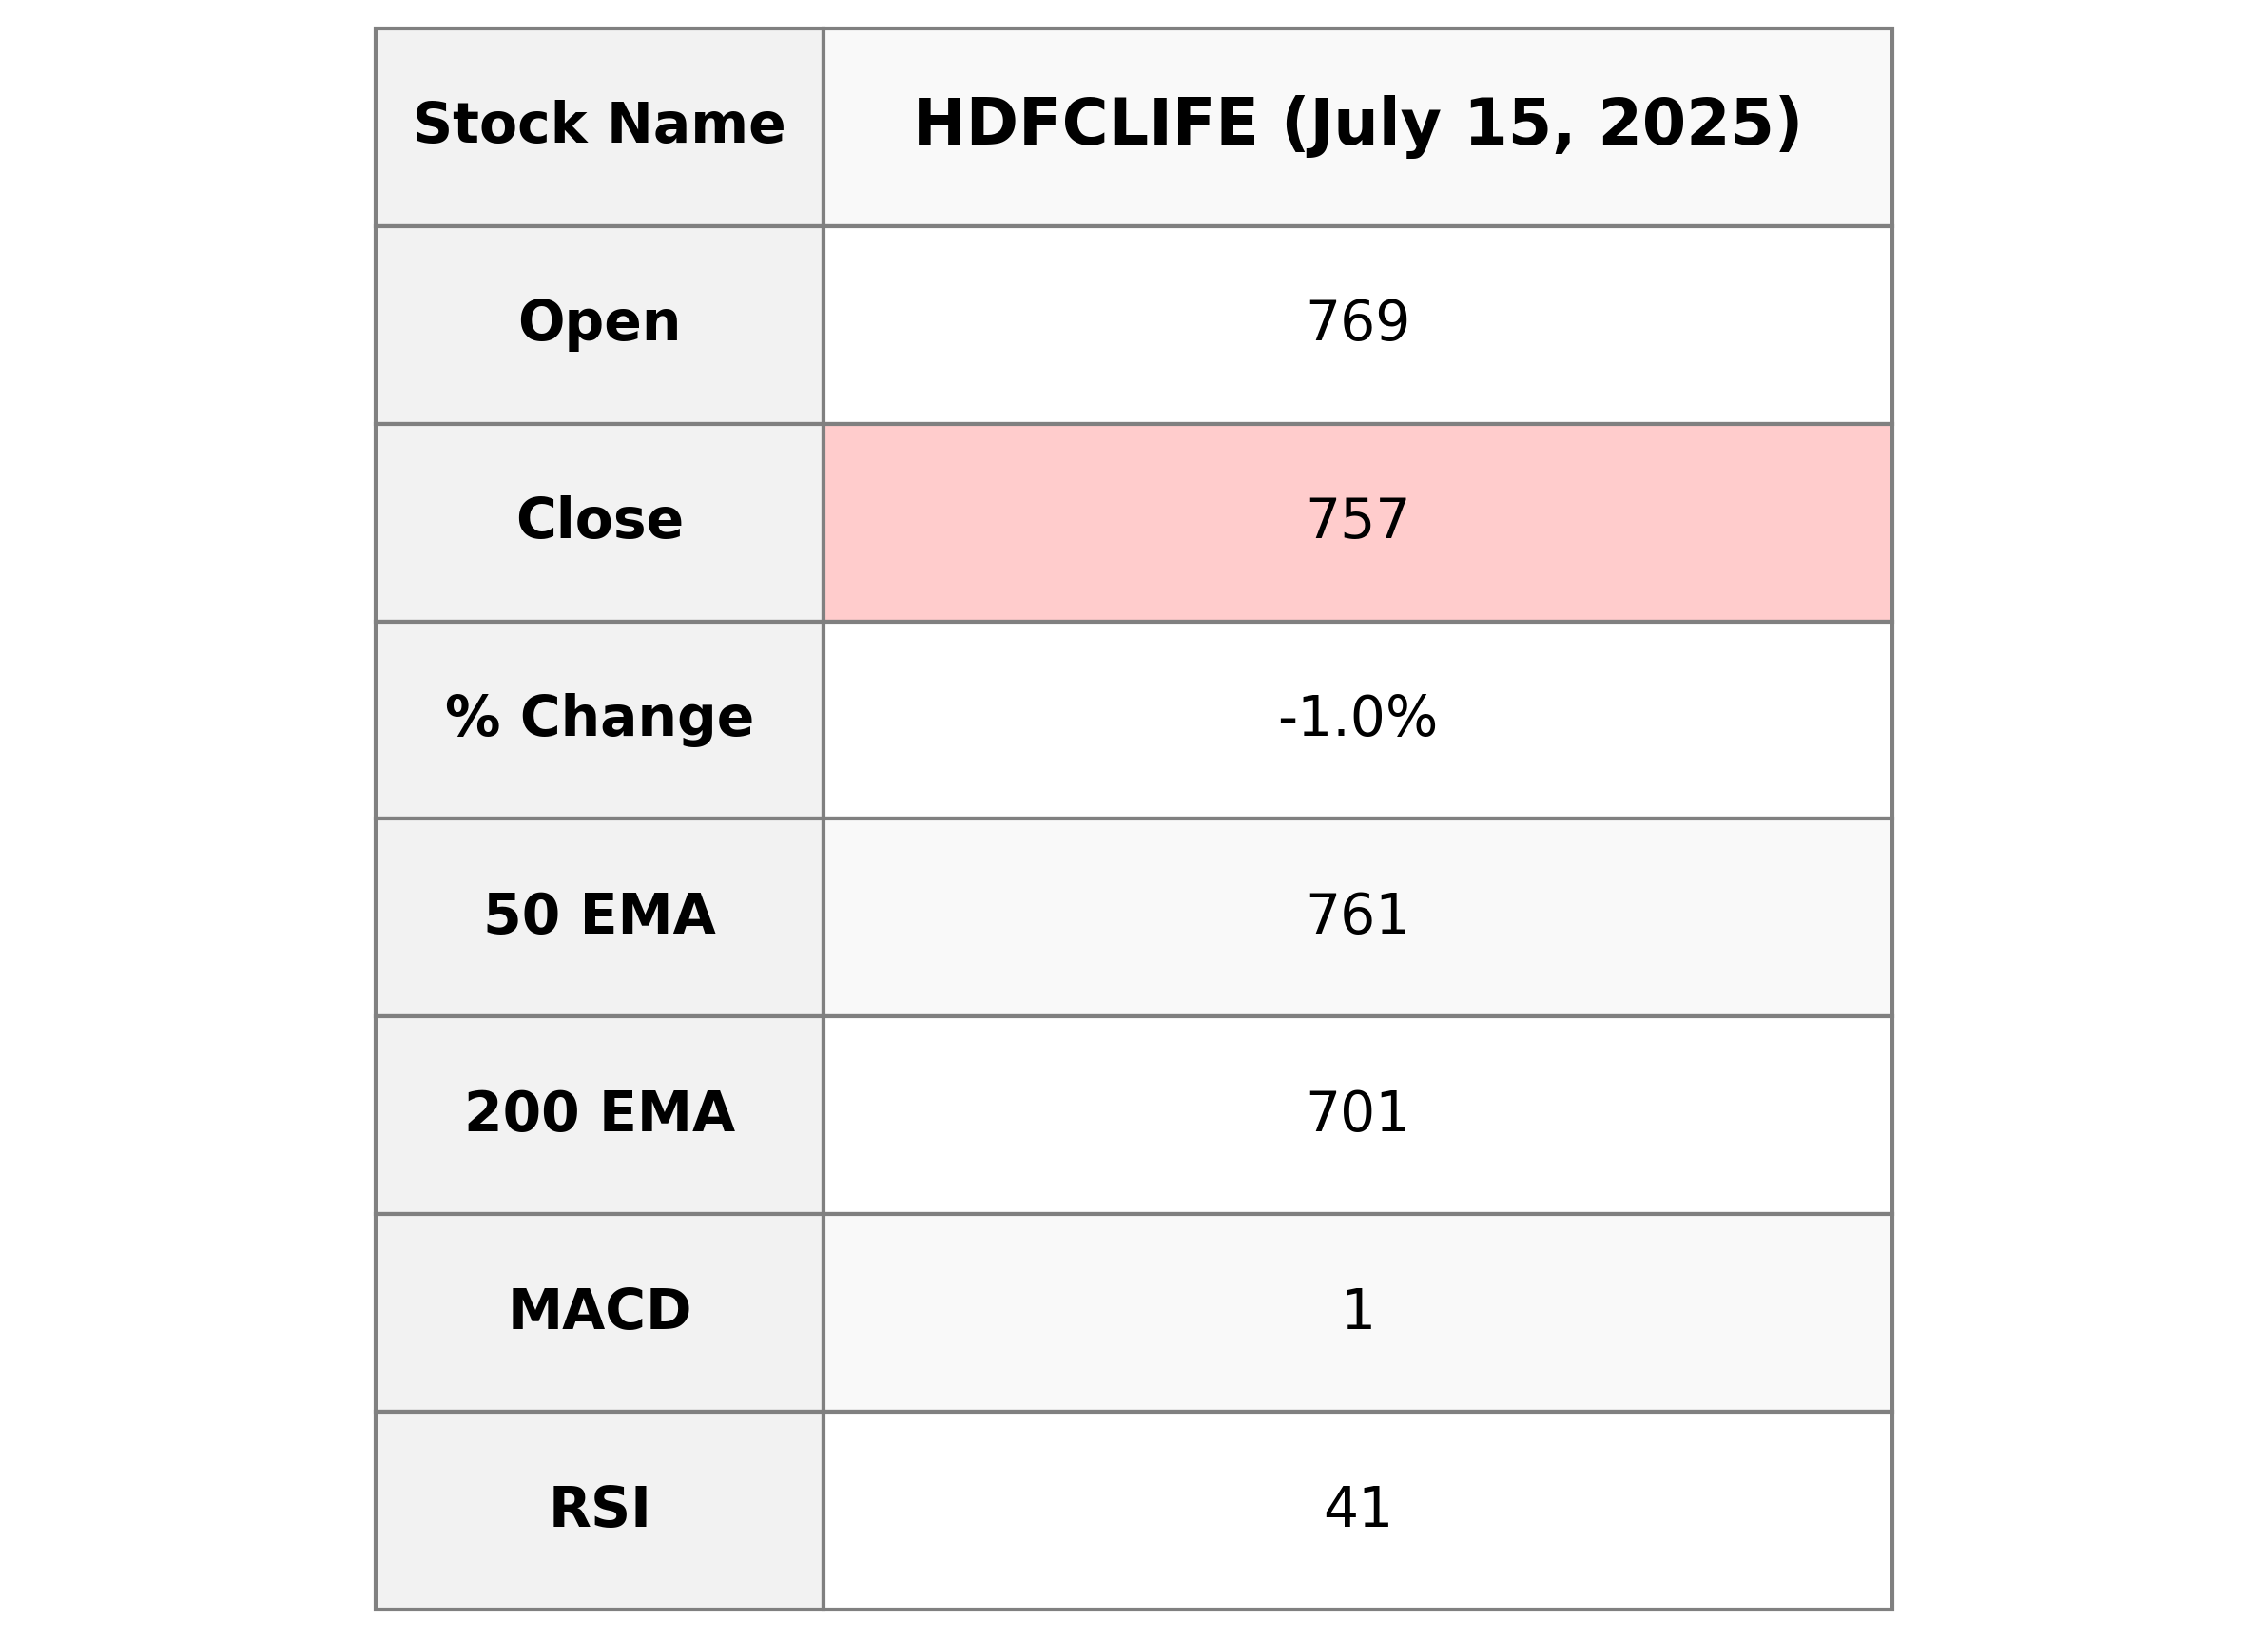
HDFC Life Performance: HDFC Life recently experienced a decrease in its stock price, closing at ₹756.85, which marks a -1.03% change from the previous close of ₹764.75. Despite a high volume of 2,838,539 shares traded, the stock has seen pressure as indicated by the RSI of 41.35, suggesting it may be approaching oversold conditions. The PE Ratio stands at 89.99, reflecting relatively high valuation metrics in the Life Insurance sector in India.
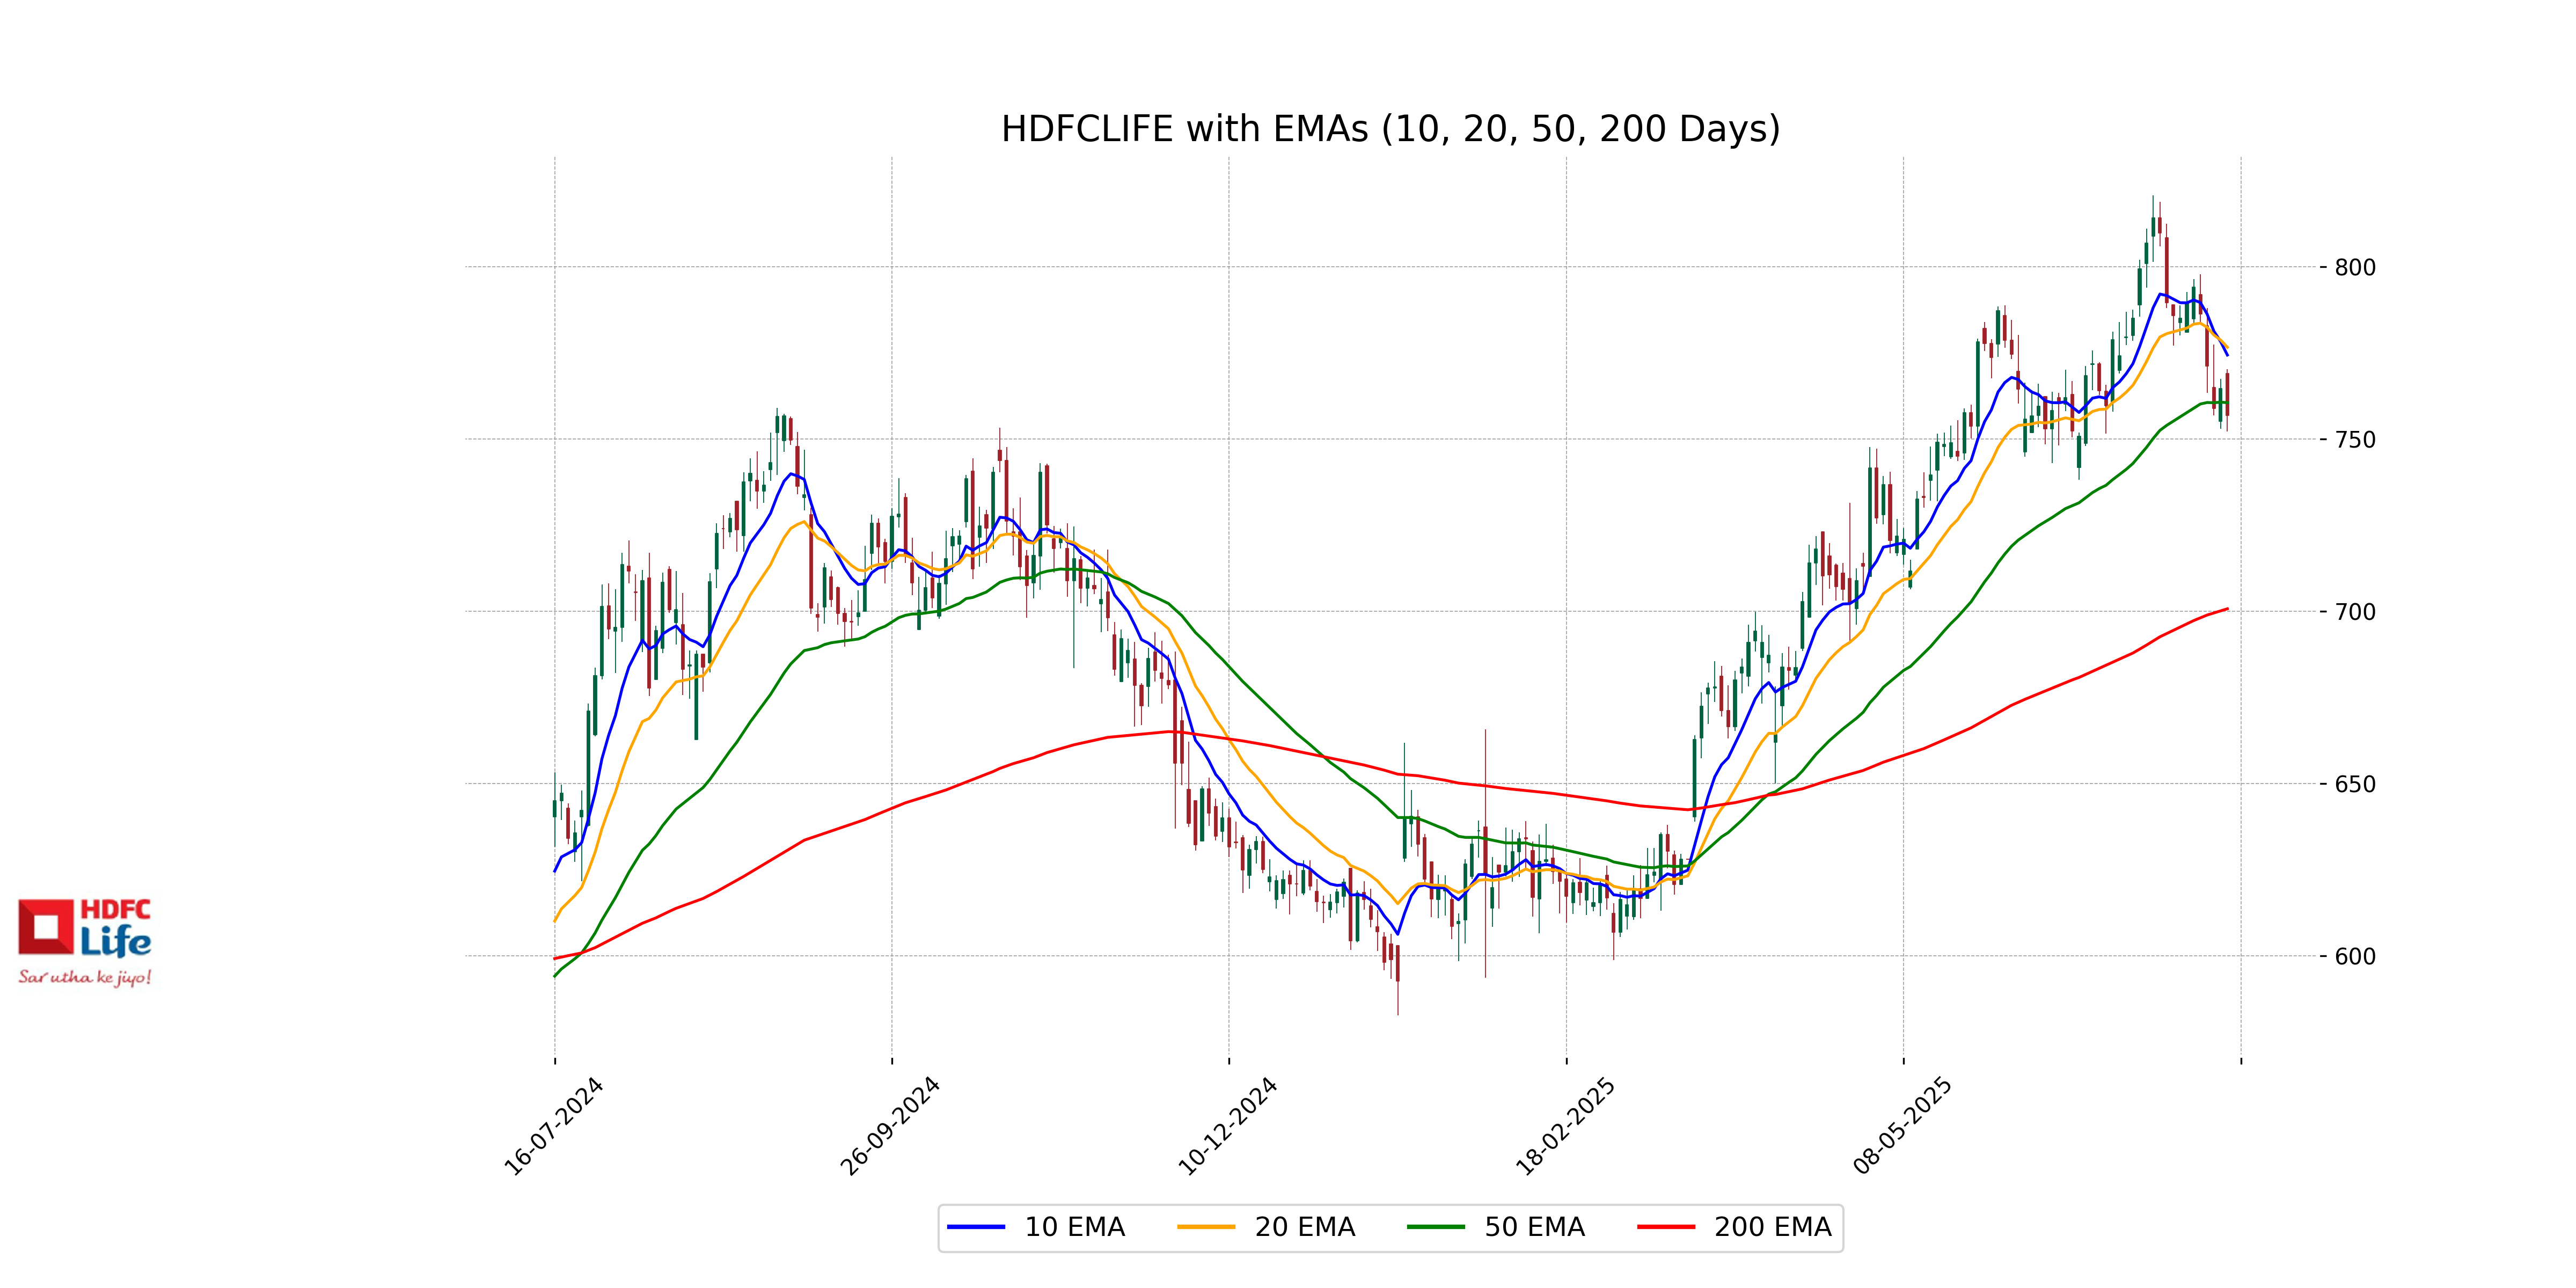
Relationship with Key Moving Averages
HDFC Life's current close price of 756.85 is below its 10 EMA of 774.43 and 20 EMA of 776.69, indicating a short-term bearish trend. However, it remains above the 200 EMA of 700.73, suggesting a long-term bullish trend. The 50 EMA is at 760.59, which is close to the current close, showing some support near this level.
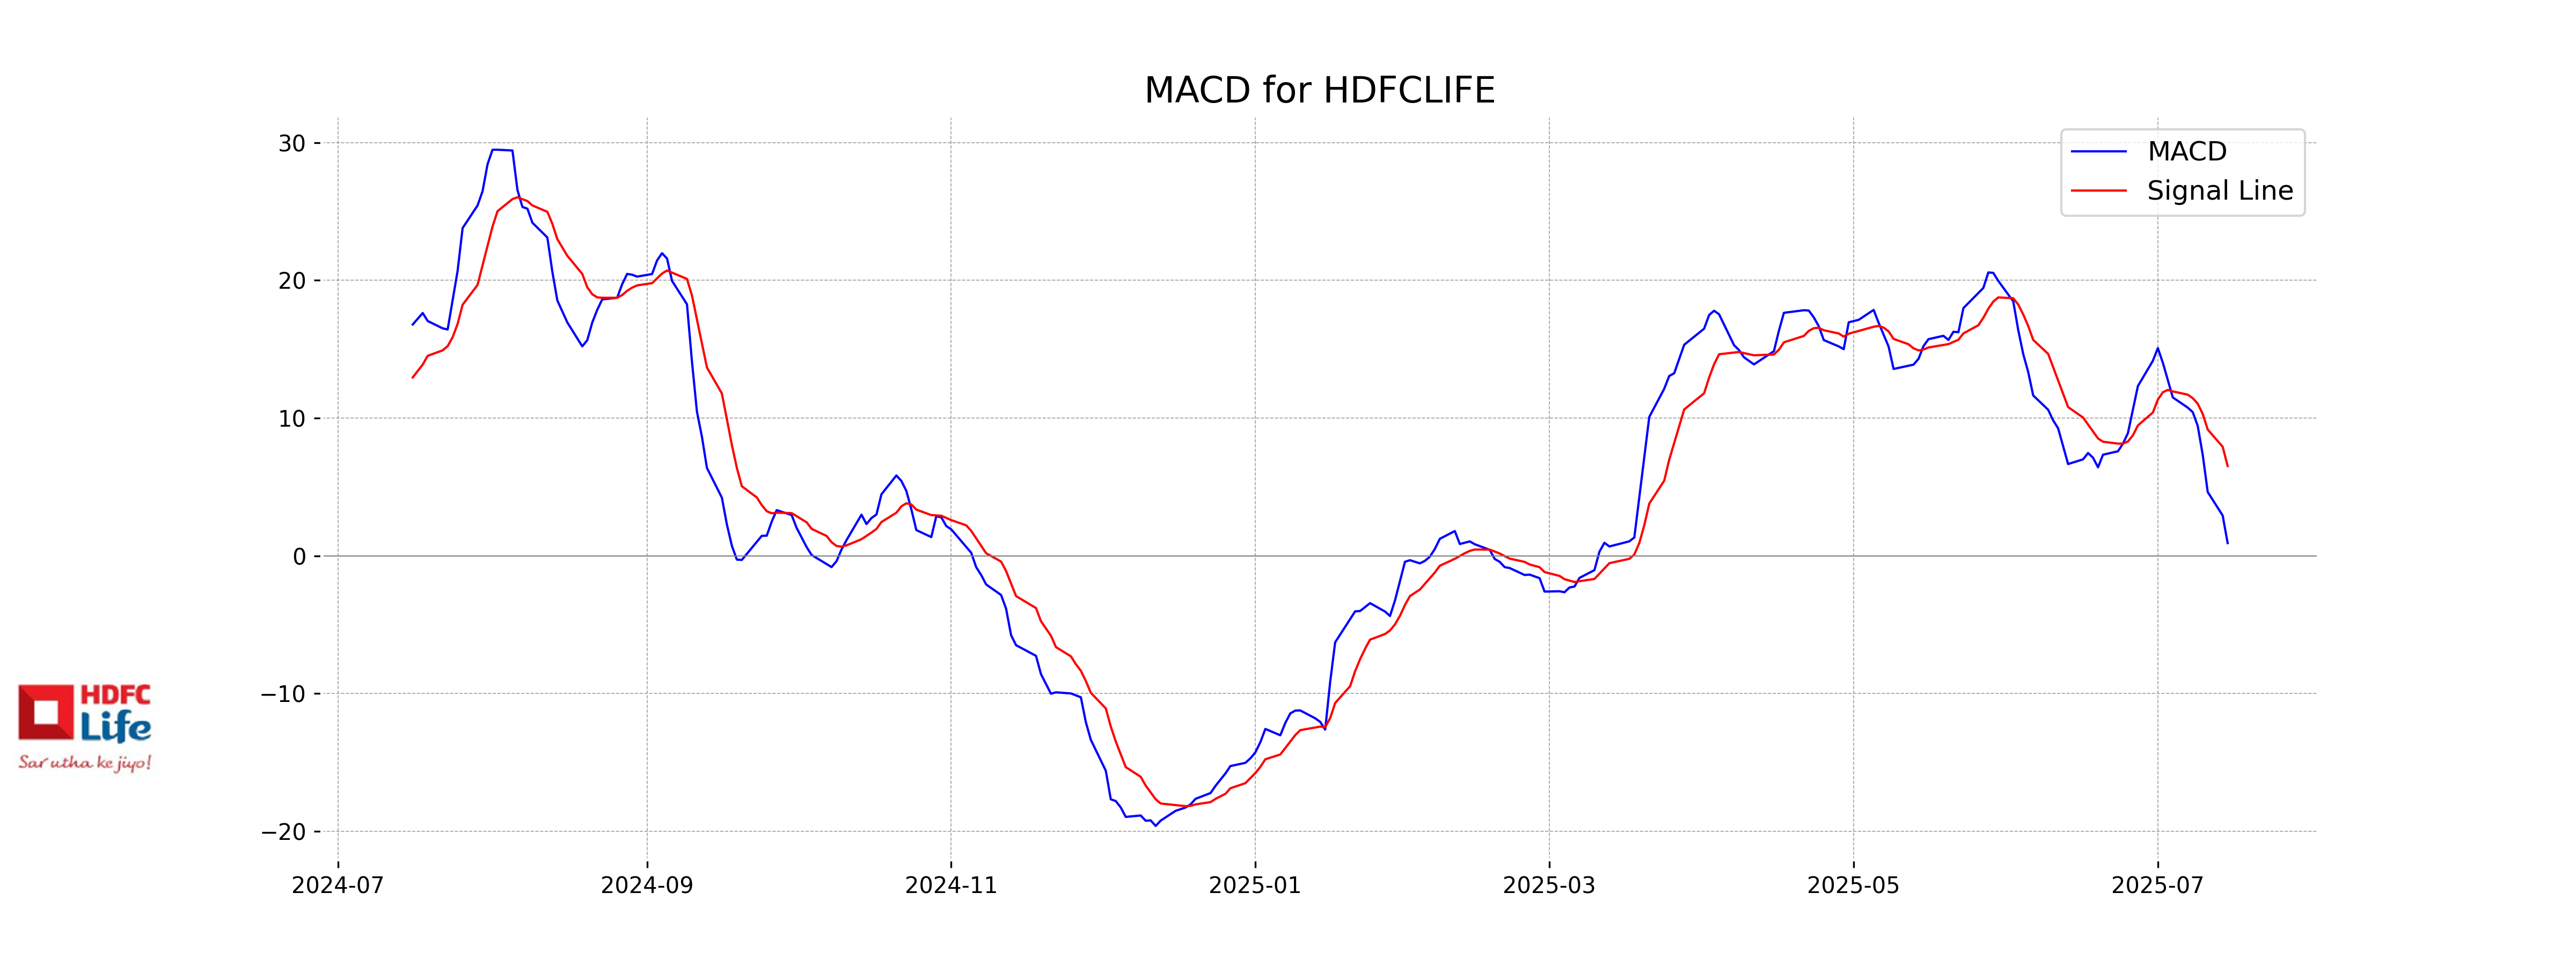
Moving Averages Trend (MACD)
HDFC Life currently exhibits a bearish trend in its Moving Average Convergence Divergence (MACD) analysis, as the MACD line (0.9183) is below the Signal line (6.5167). This suggests that the stock may experience downward pressure unless a reversal occurs.
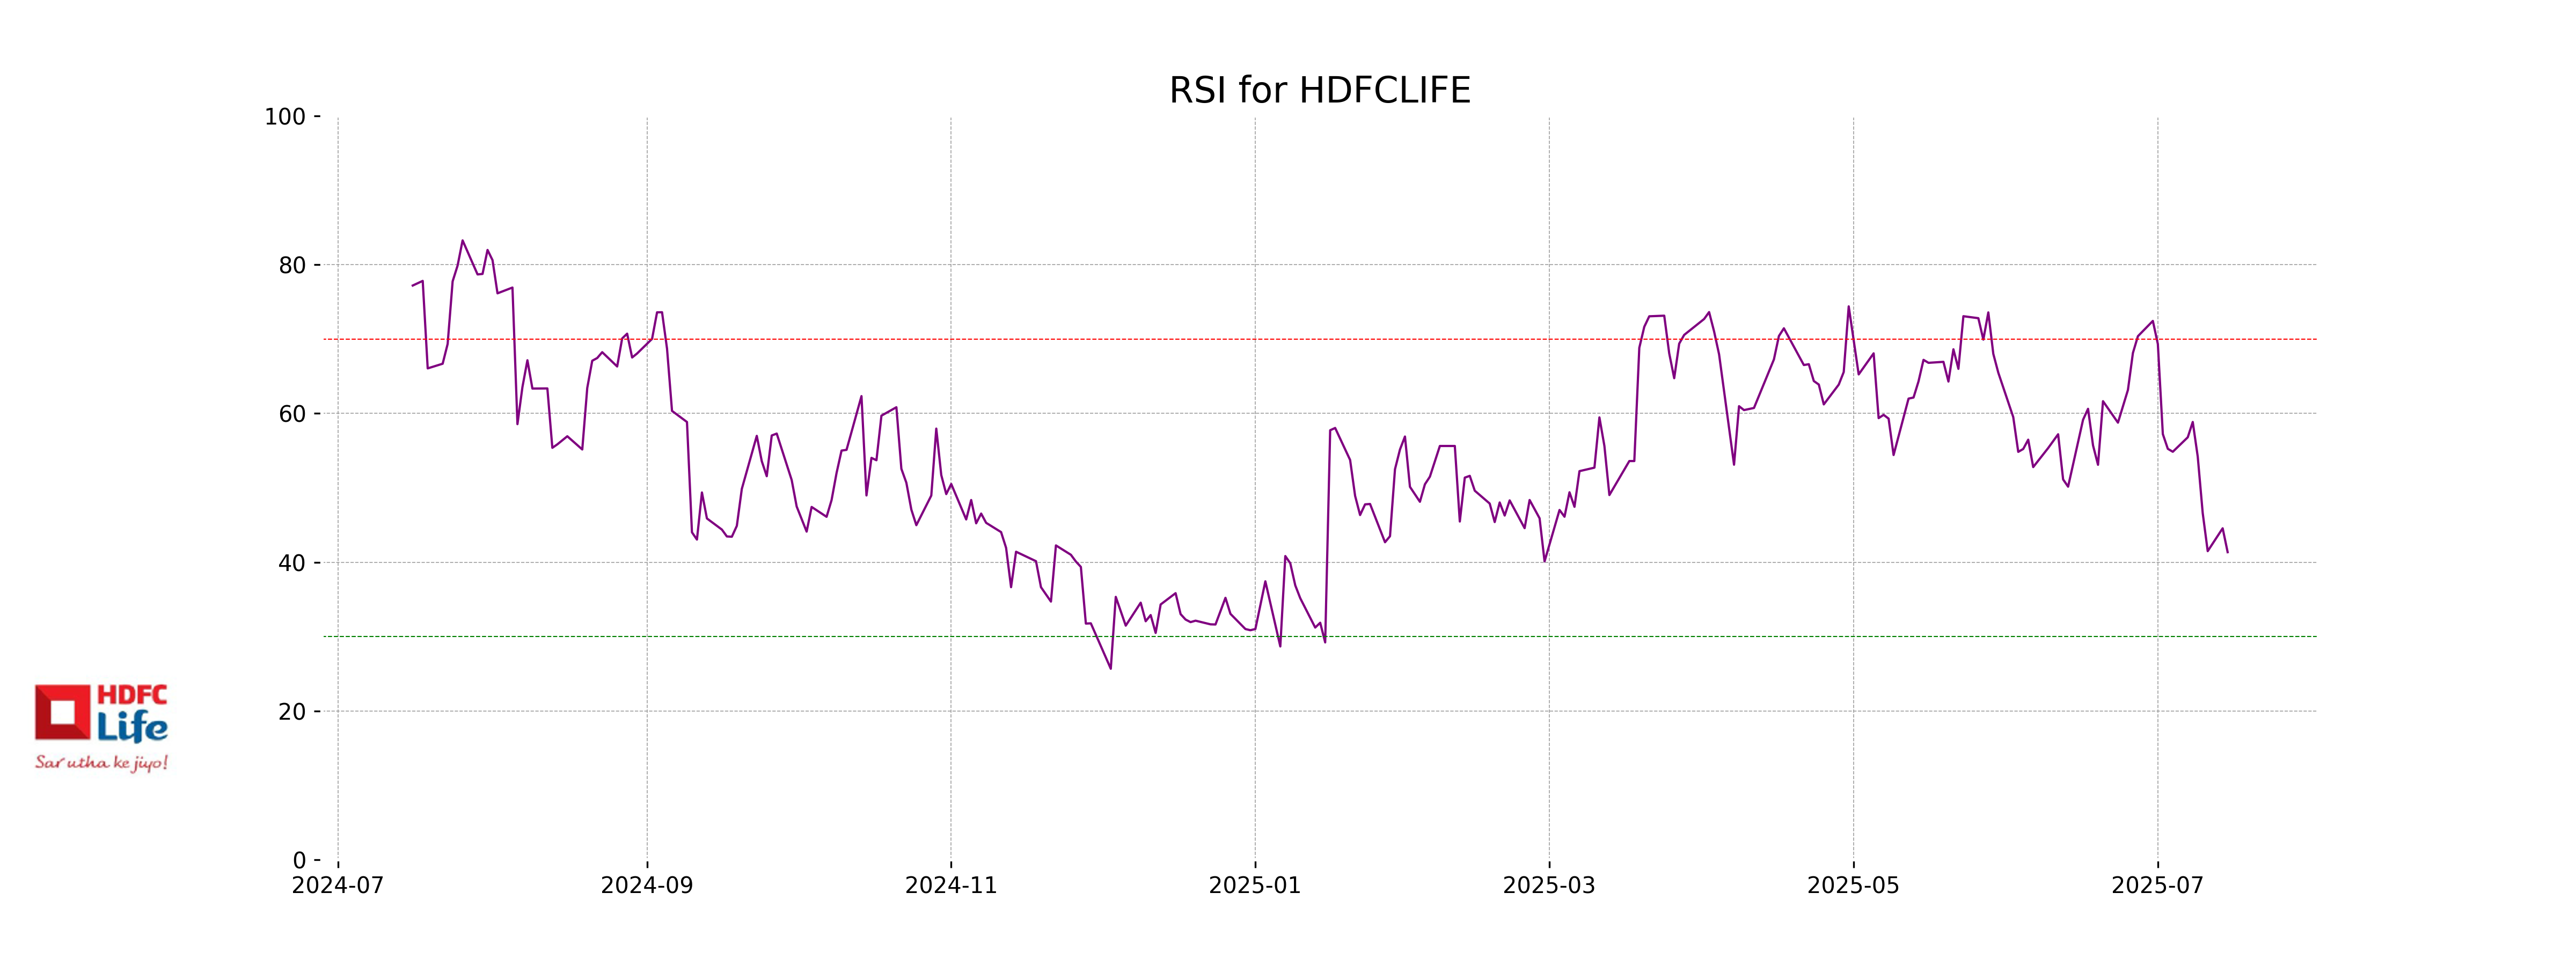
RSI Analysis
HDFC LIFE's current RSI is 41.35, which indicates that the stock is nearing oversold conditions. An RSI below 30 typically signals that a stock is oversold, so while HDFC LIFE is not there yet, it is trending towards a potentially oversold status. Investors might watch for any further RSI decreases as potential entry points.
Analysis for SBI Life - July 15, 2025
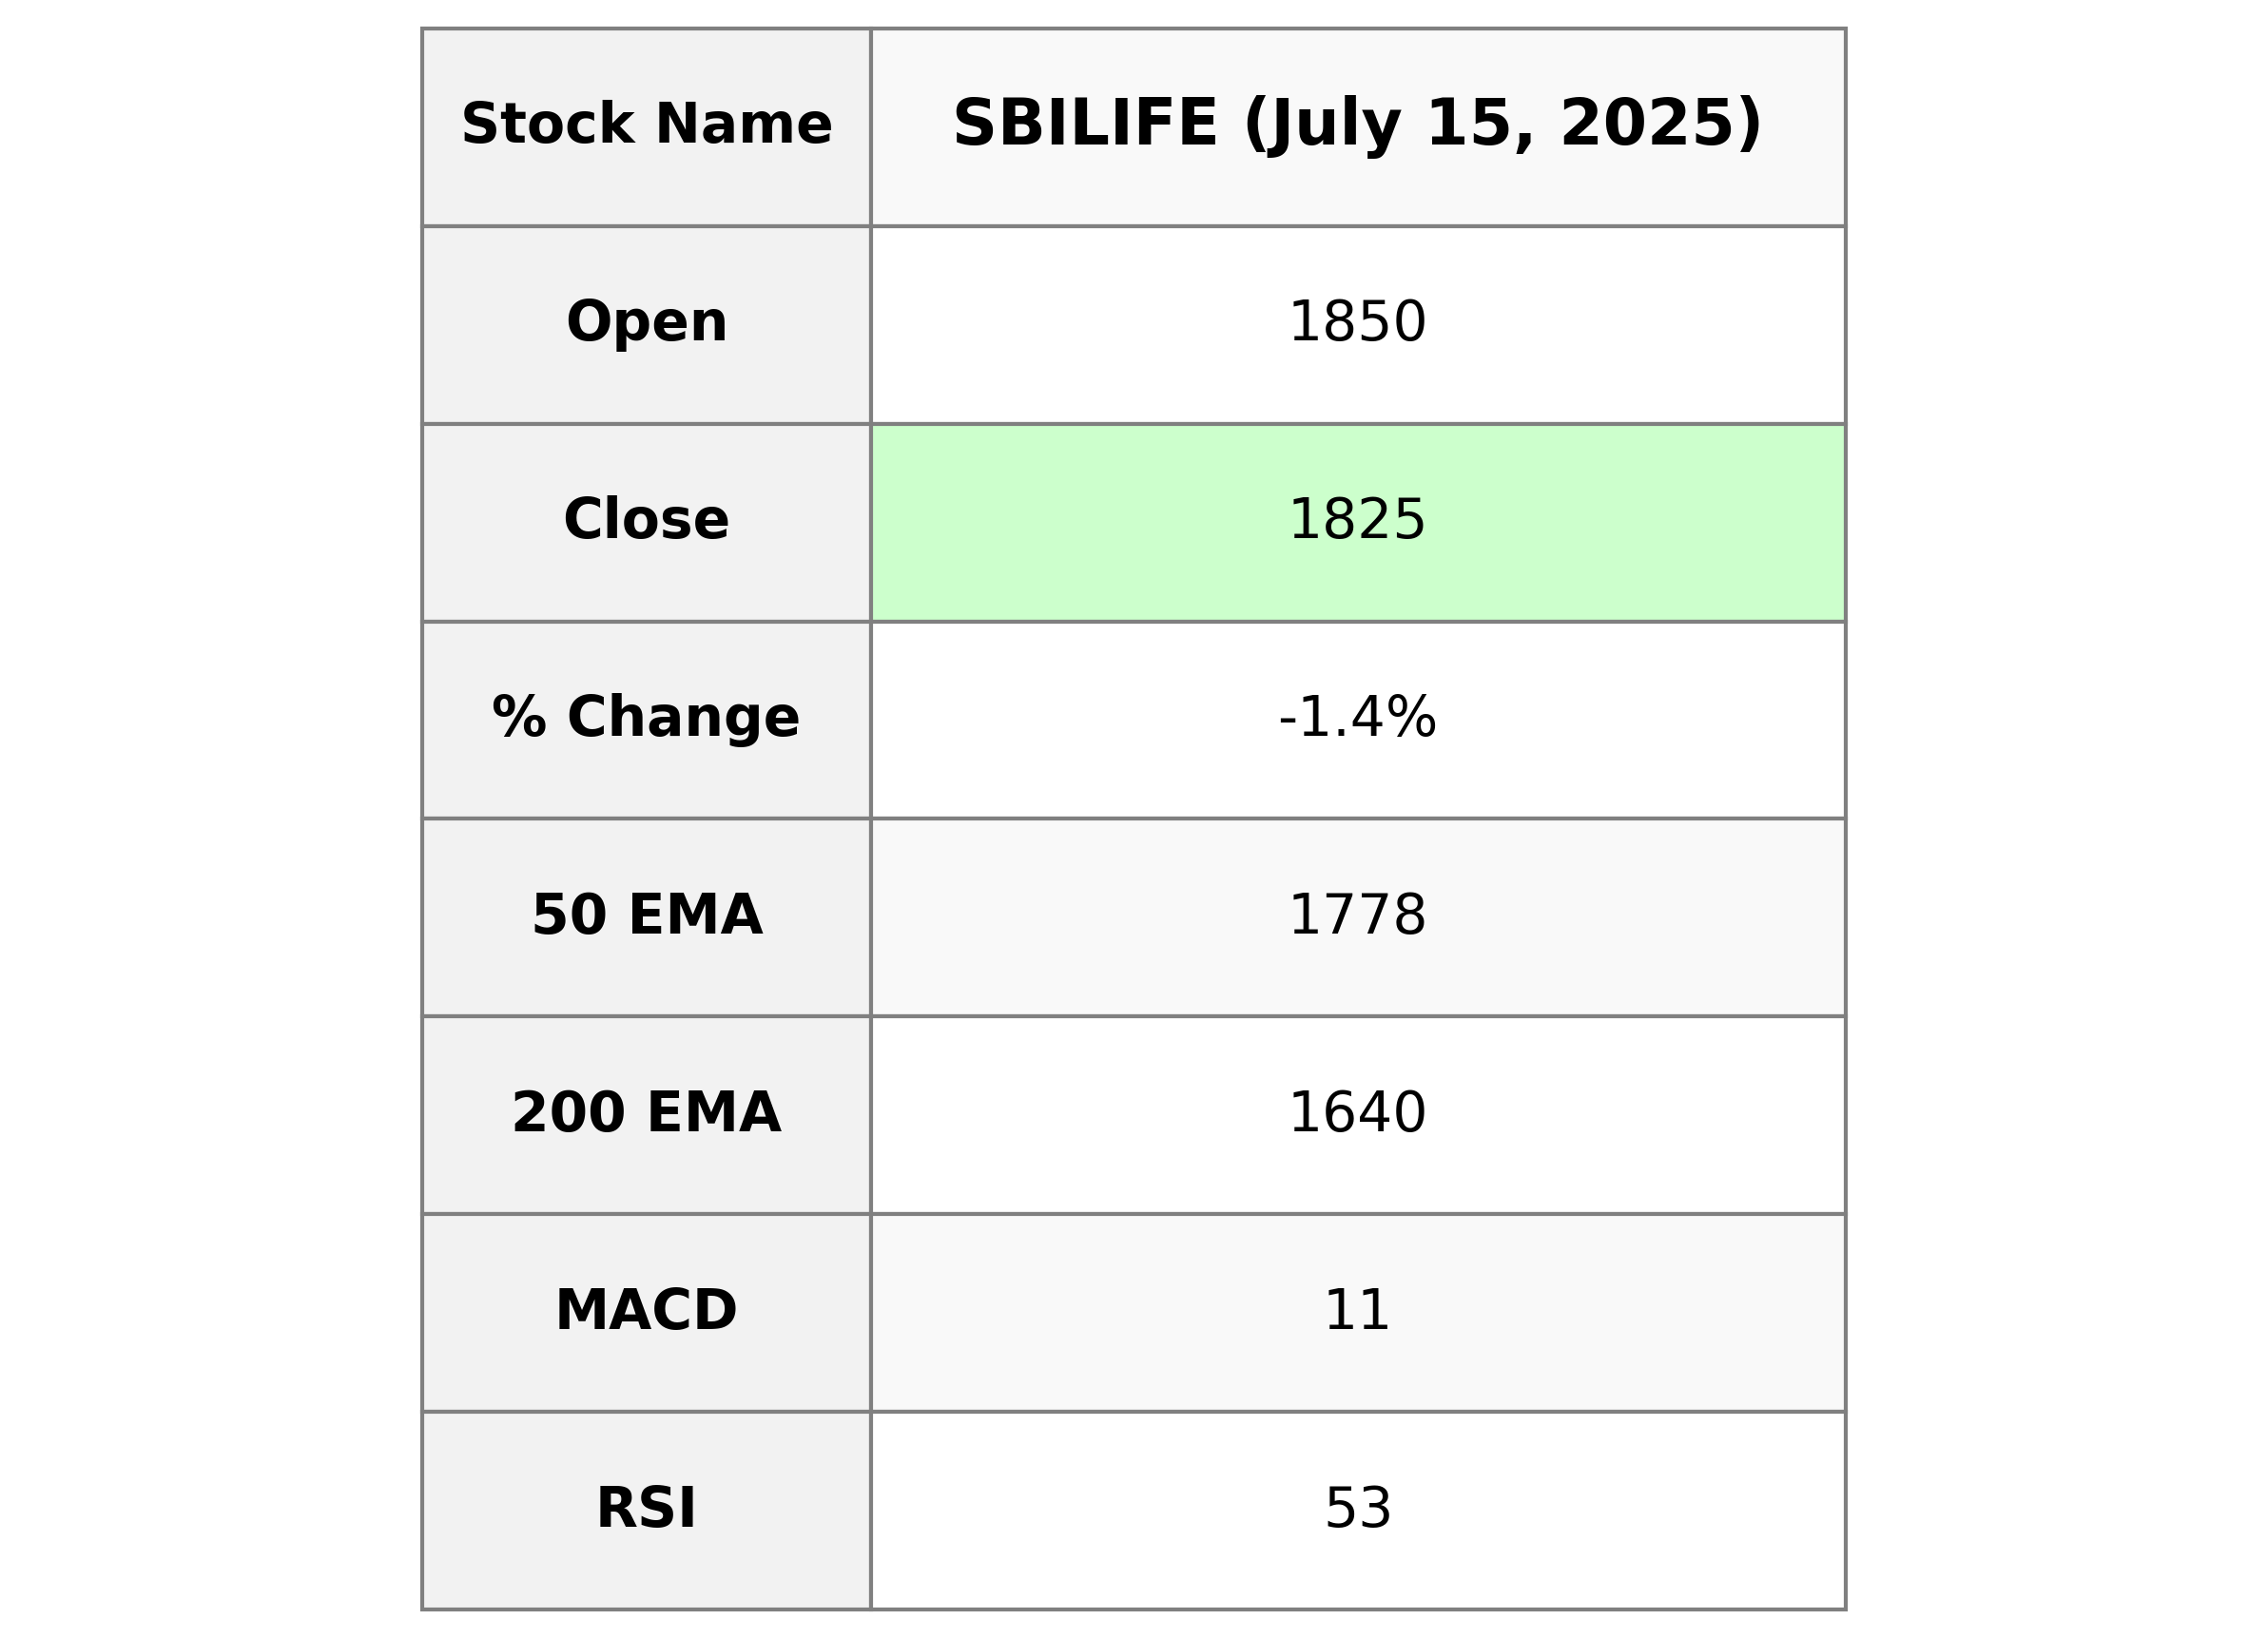
SBI Life has experienced a decline with a closing price of 1824.80, down by -1.43% and a points change of -26.5. Despite a strong market cap of 1,829,088,395,264 and positioning in the Financial Services sector, indicators like a PE Ratio of 75.81 and a MACD below the signal line suggest a cautious outlook.
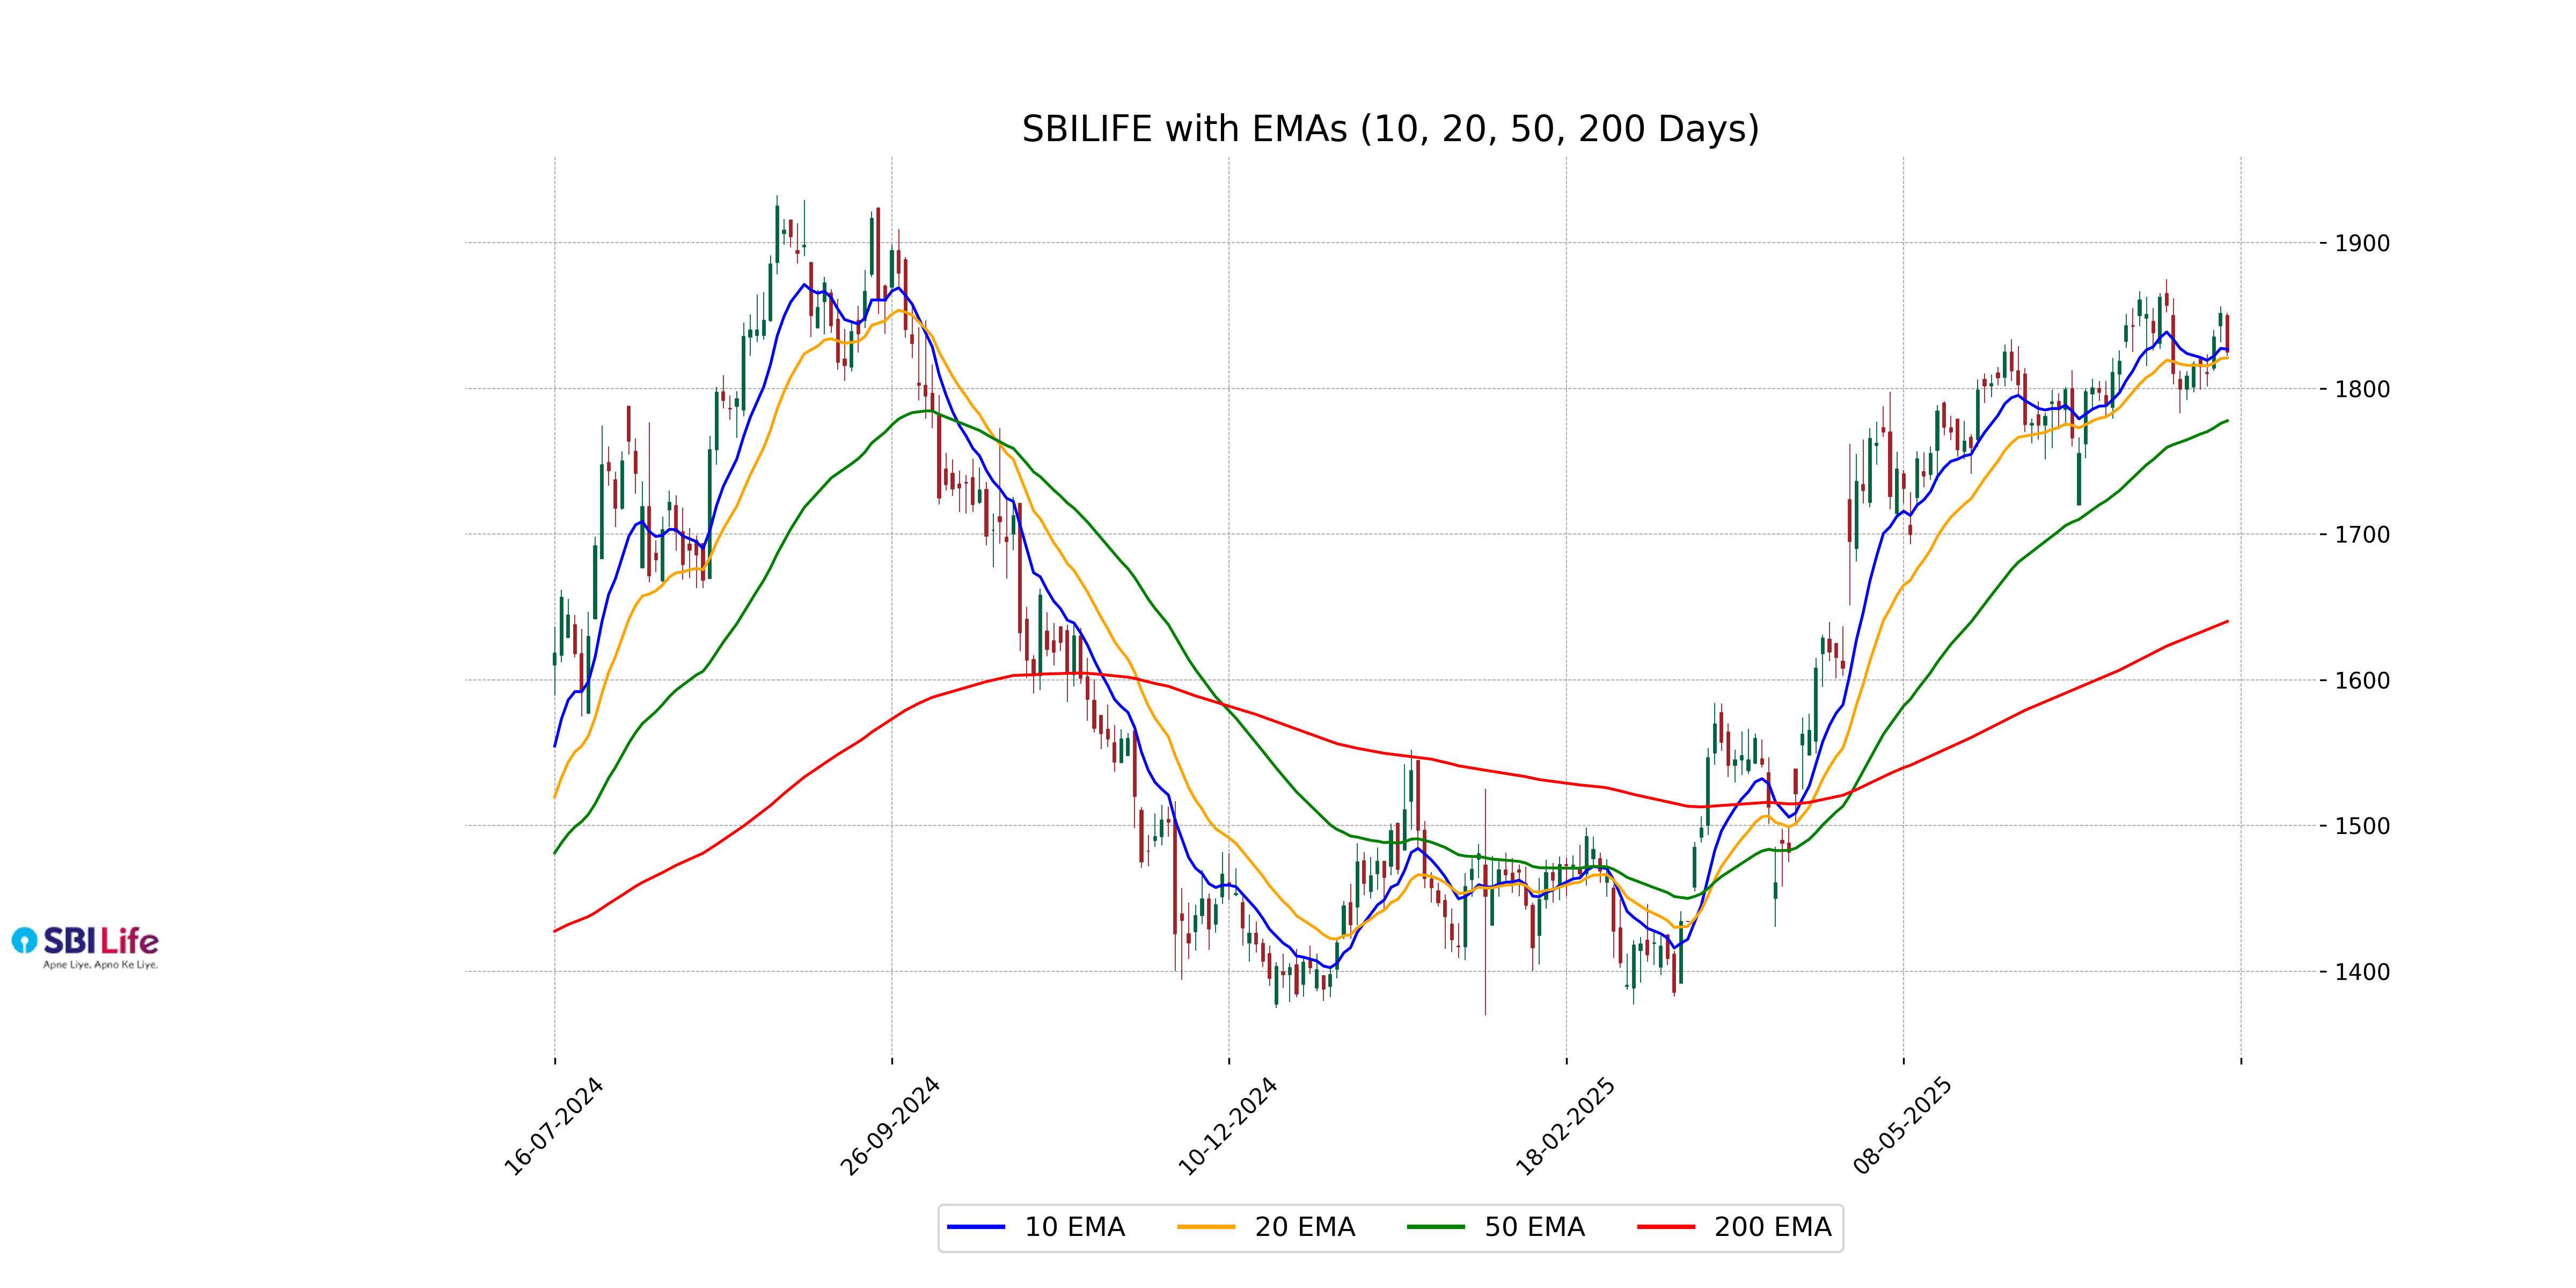
Relationship with Key Moving Averages
SBI Life is currently trading below its 10 EMA at 1826.96 and close to its 20 EMA at 1820.88, suggesting a short-term weakness. However, it remains above its 50 EMA at 1777.83, indicating that the broader trend could still be somewhat positive despite the recent dip.
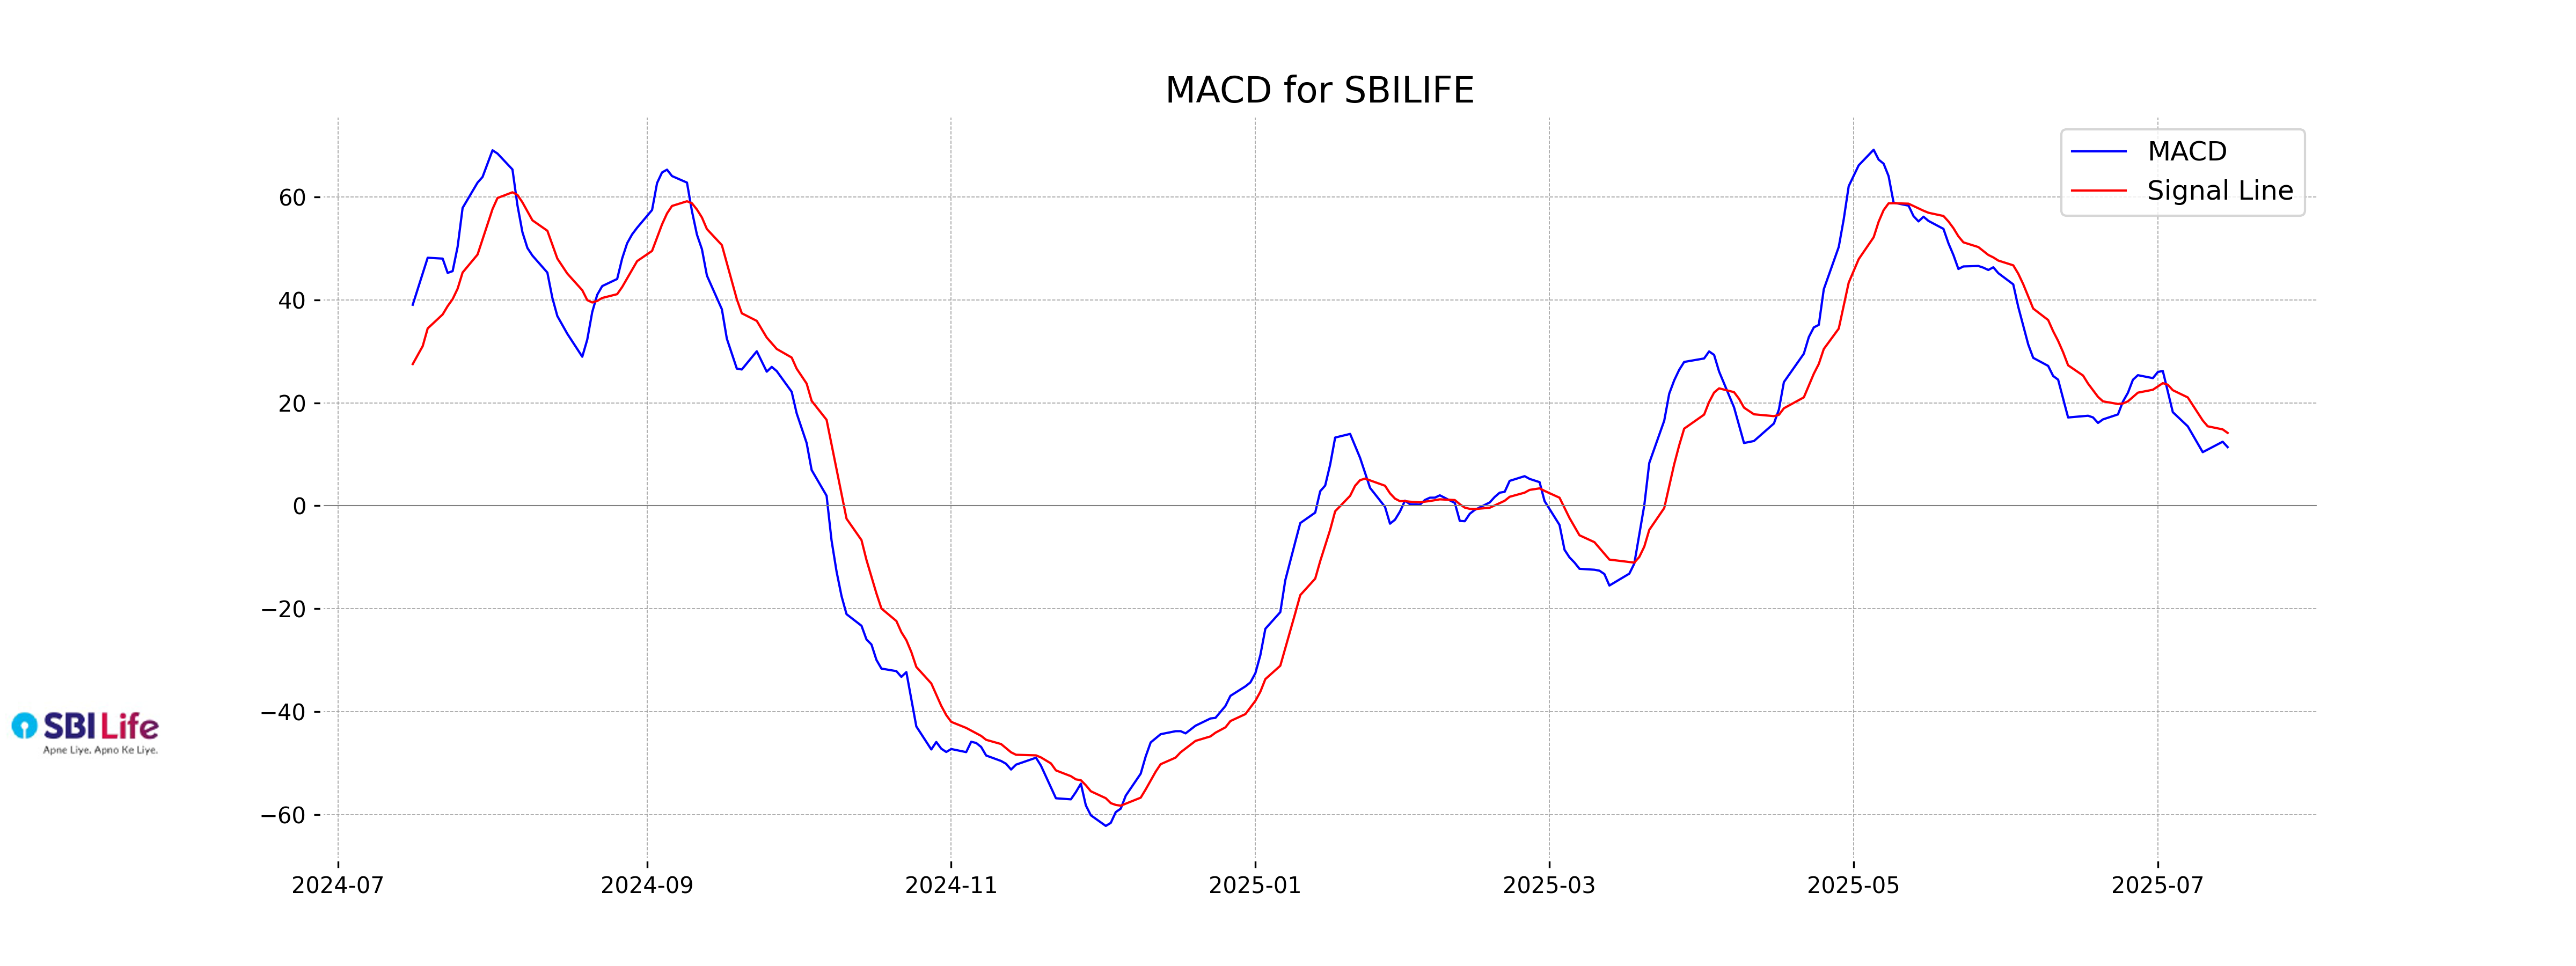
Moving Averages Trend (MACD)
SBI Life MACD Analysis: The MACD for SBI Life is at 11.39, which is below the MACD Signal line at 14.15. This suggests a bearish trend as the stock's recent momentum is weaker compared to the MACD Signal line, indicating a potential continuation of the current downward movement. However, considering other indicators or market conditions could provide a comprehensive view of the stock's potential price movement.
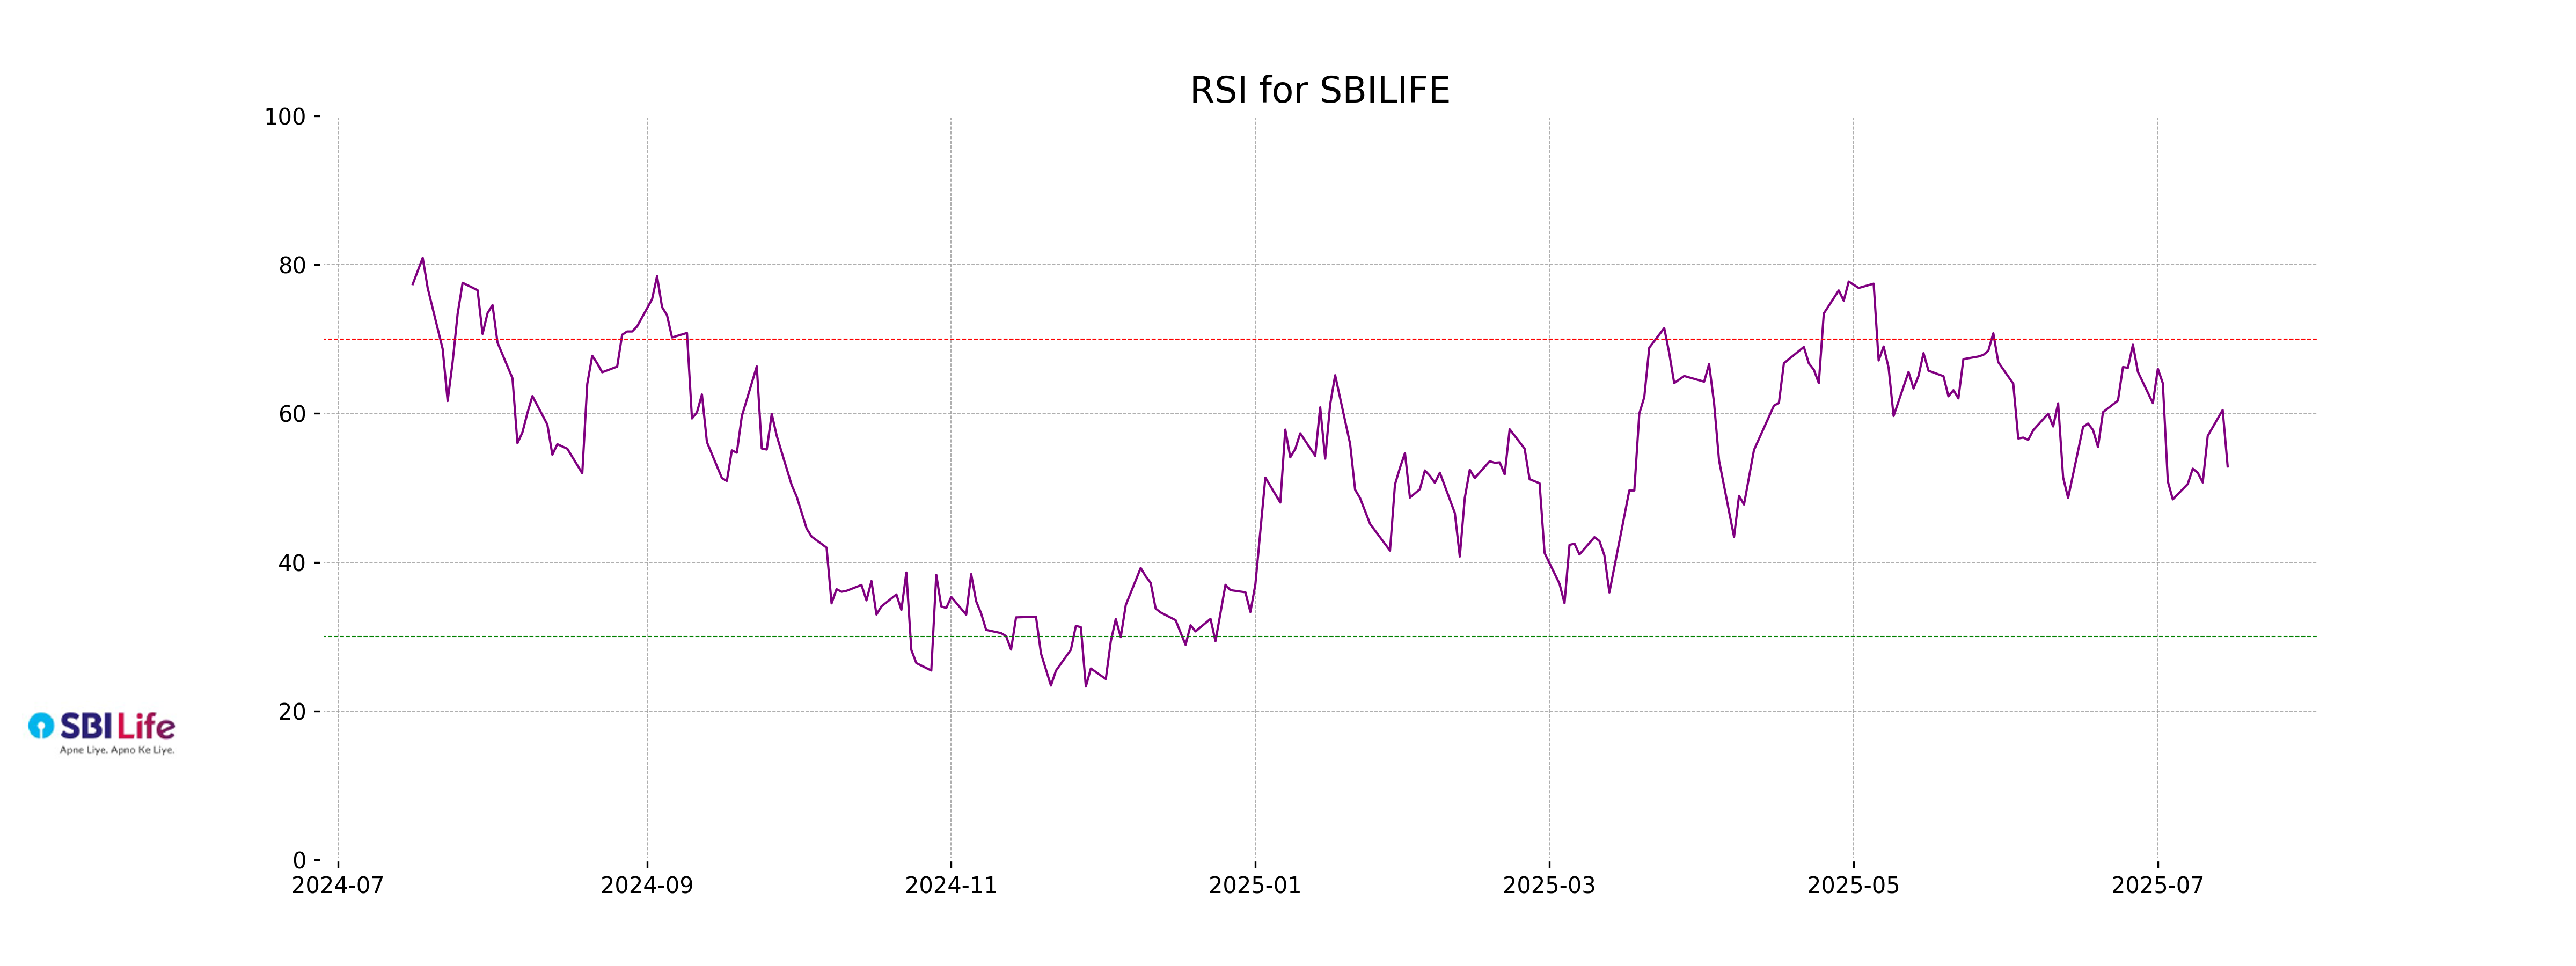
RSI Analysis
SBI Life's RSI is 52.87, which indicates a neutral momentum, suggesting that the stock is neither overbought nor oversold currently. An RSI value closer to 50 typically suggests equilibrium between buying and selling pressures.
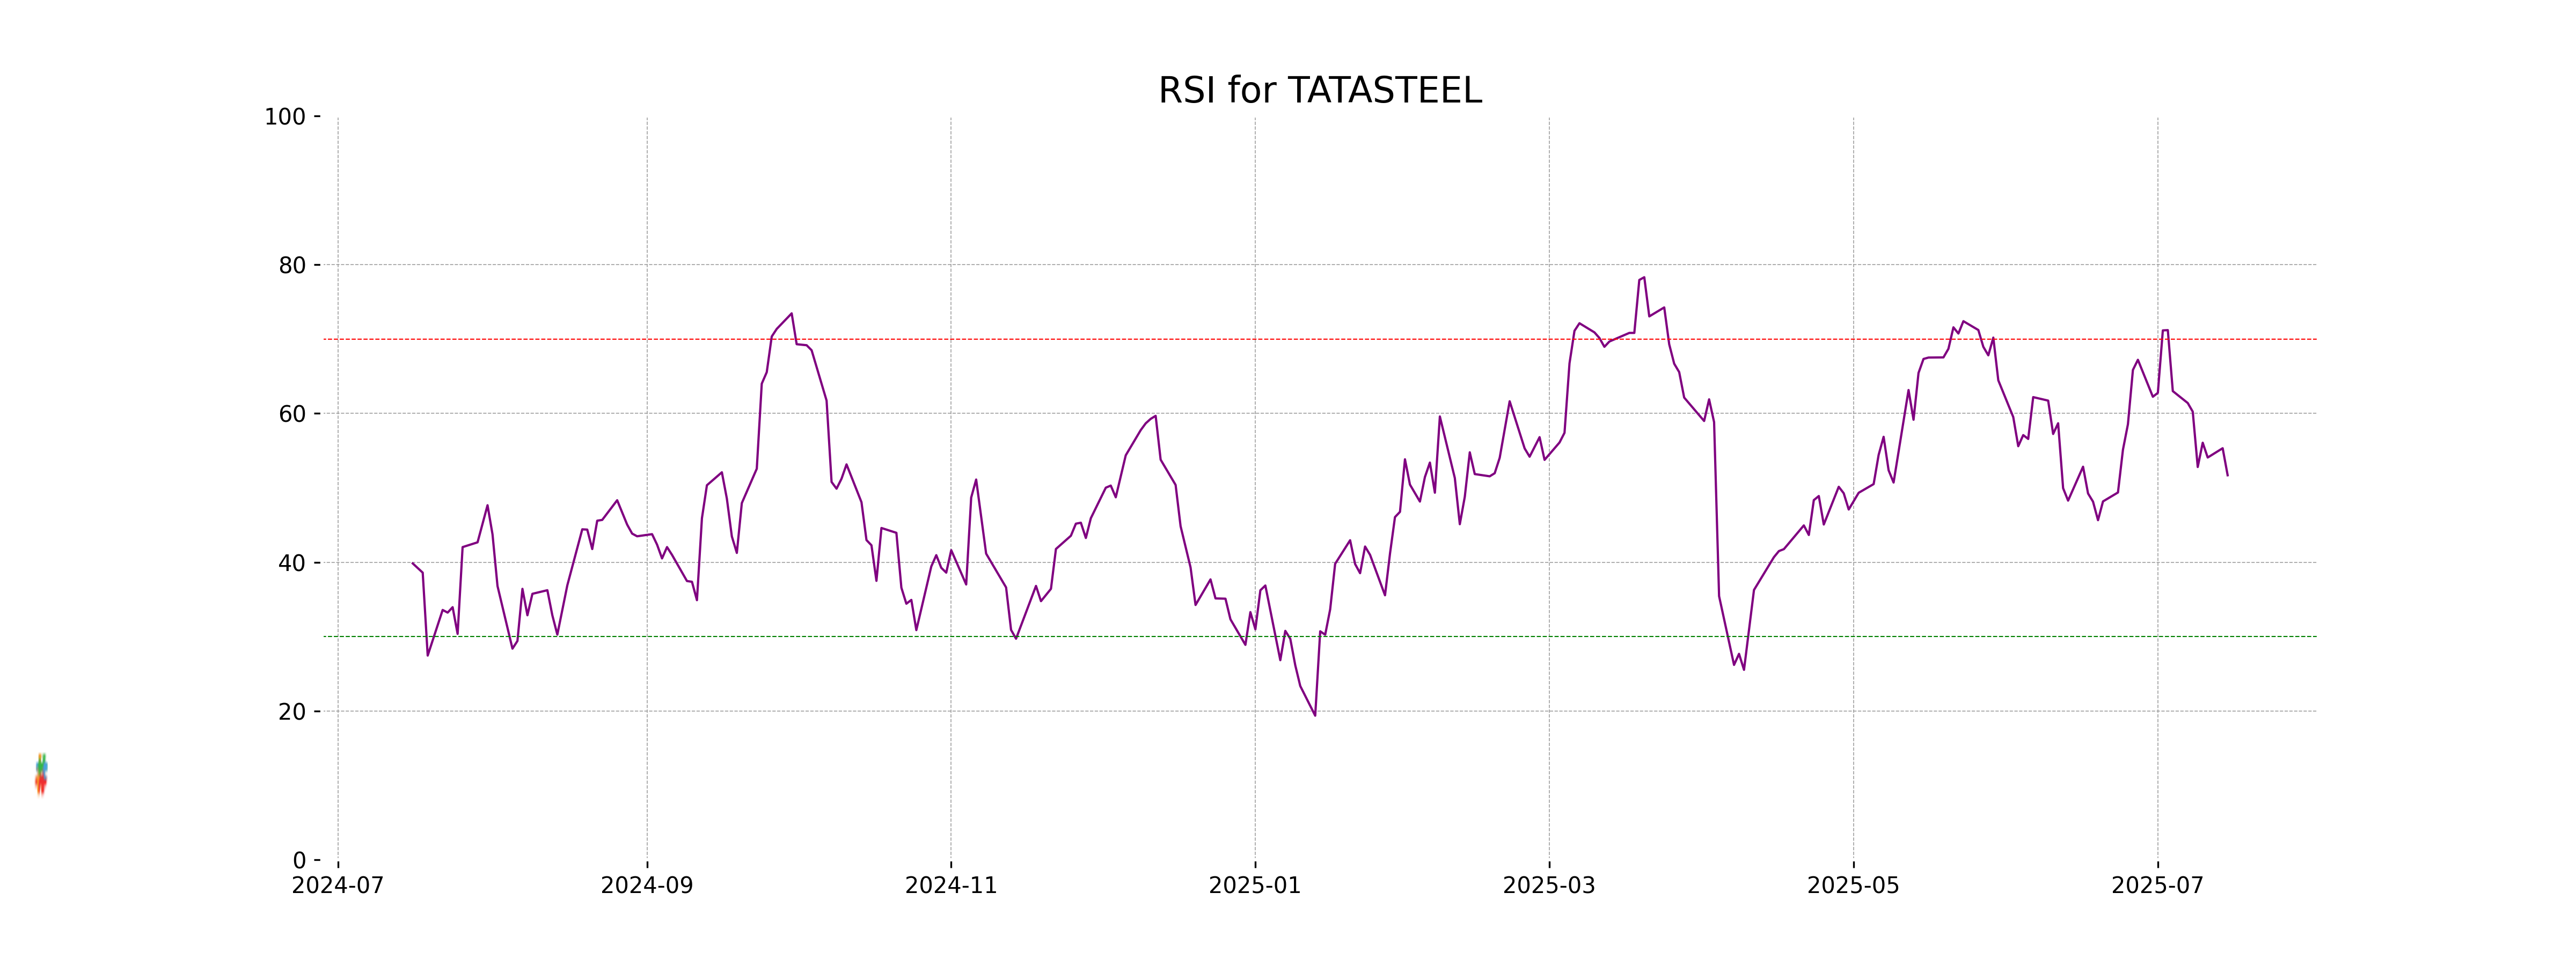
Analysis for Tata Steel - July 15, 2025
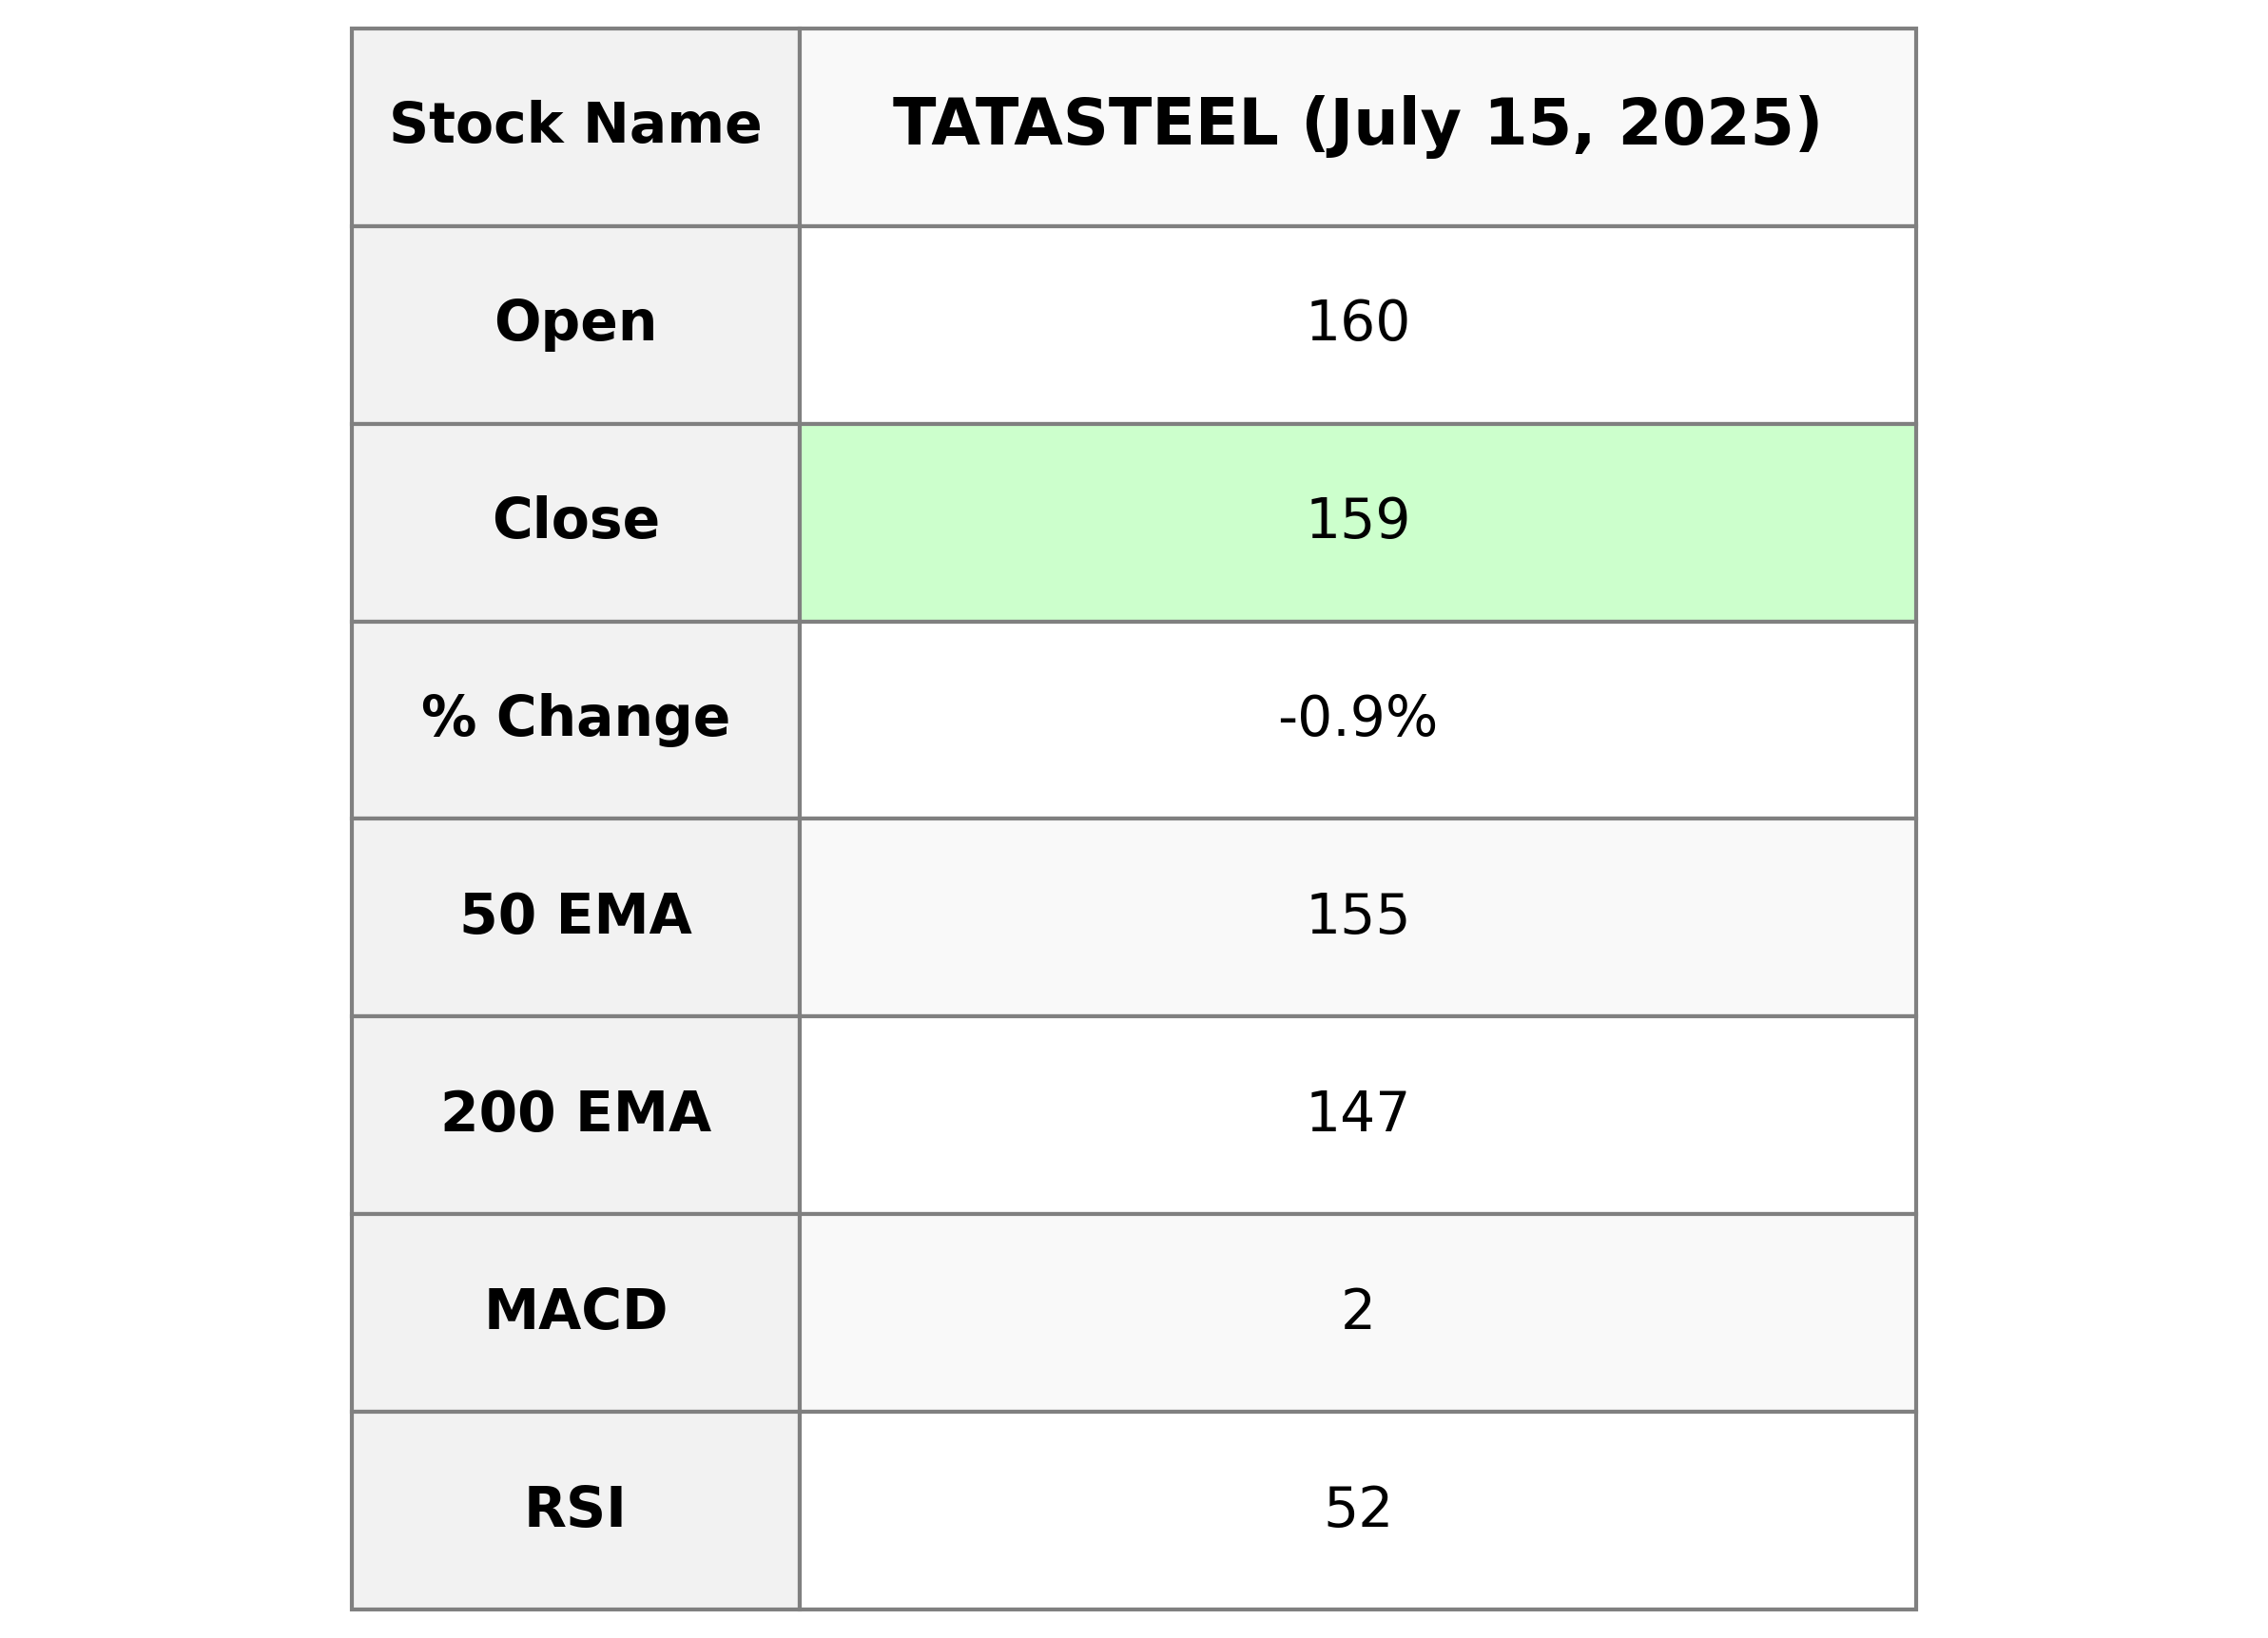
Tata Steel Performance: Tata Steel experienced a slight decline in its stock price with a 0.9% decrease to close at 159.0, below the previous close of 160.44. Despite the dip, the stock remains above its 50-day and 200-day exponential moving averages, indicating a positive long-term trend. The RSI of 51.69 suggests a neutral momentum, while a market cap of 2,007 billion INR demonstrates the company's substantial presence in the Basic Materials sector within the steel industry.
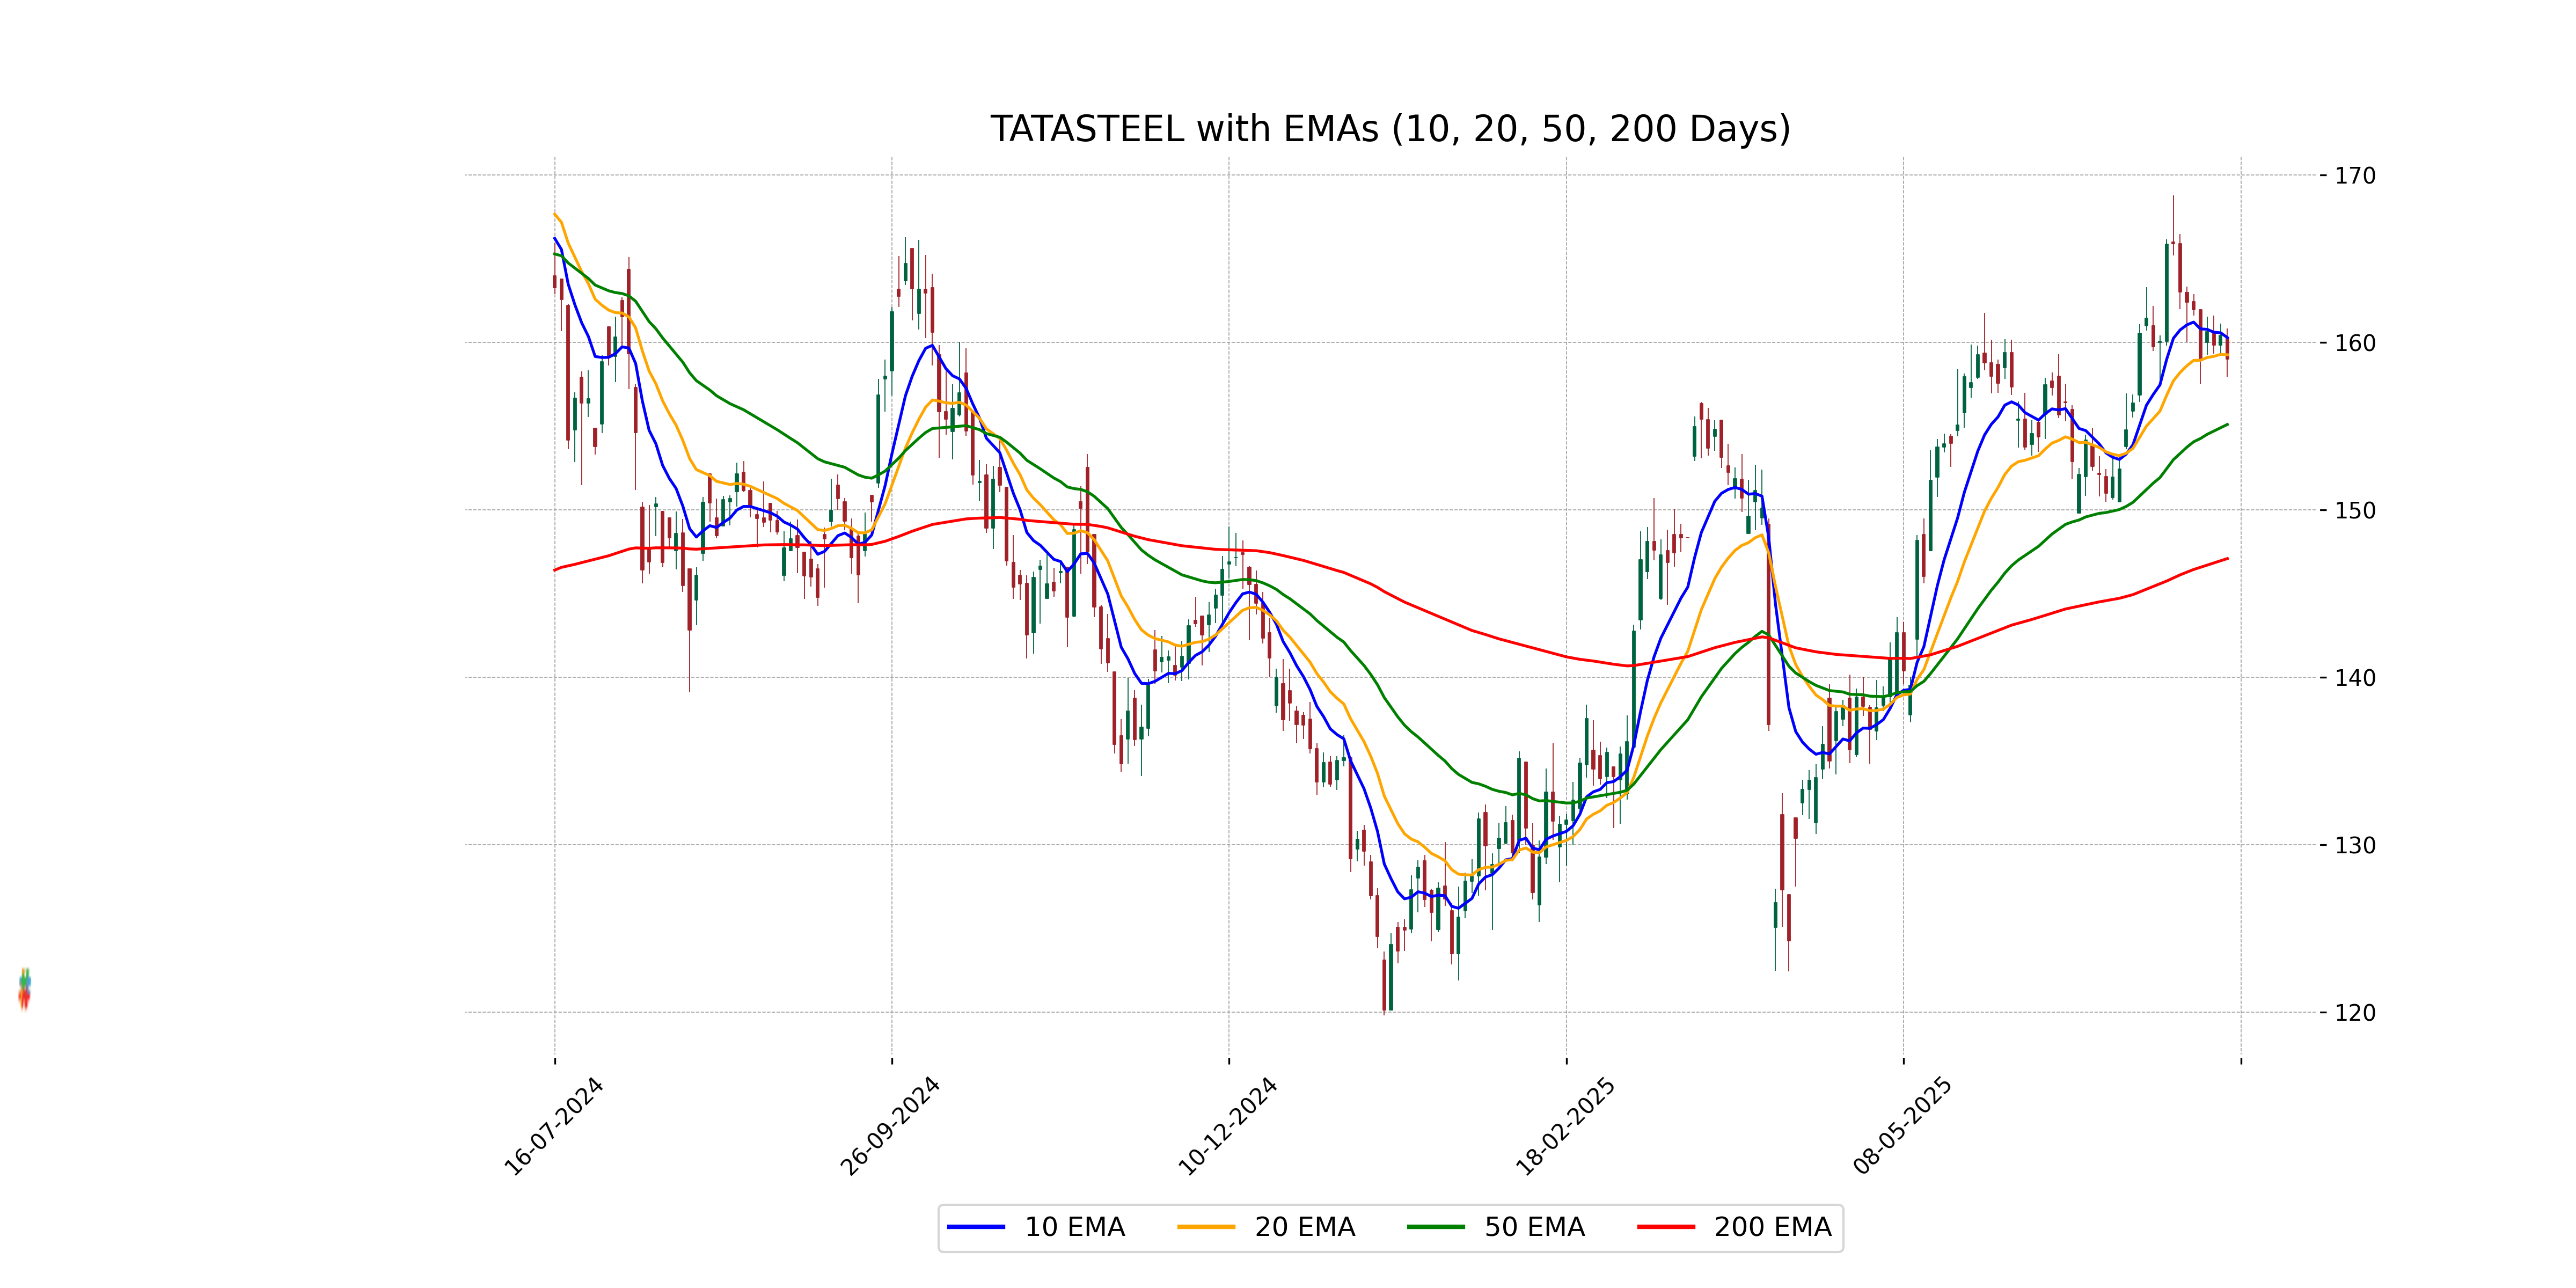
Relationship with Key Moving Averages
Tata Steel's current close price of 159.0 is above its 50-day EMA of 155.11 and 200-day EMA of 147.10, indicating a generally bullish trend over these periods. However, it is below the 10-day EMA of 160.30 and very close to the 20-day EMA of 159.27, suggesting possible short-term consolidation or weakness.
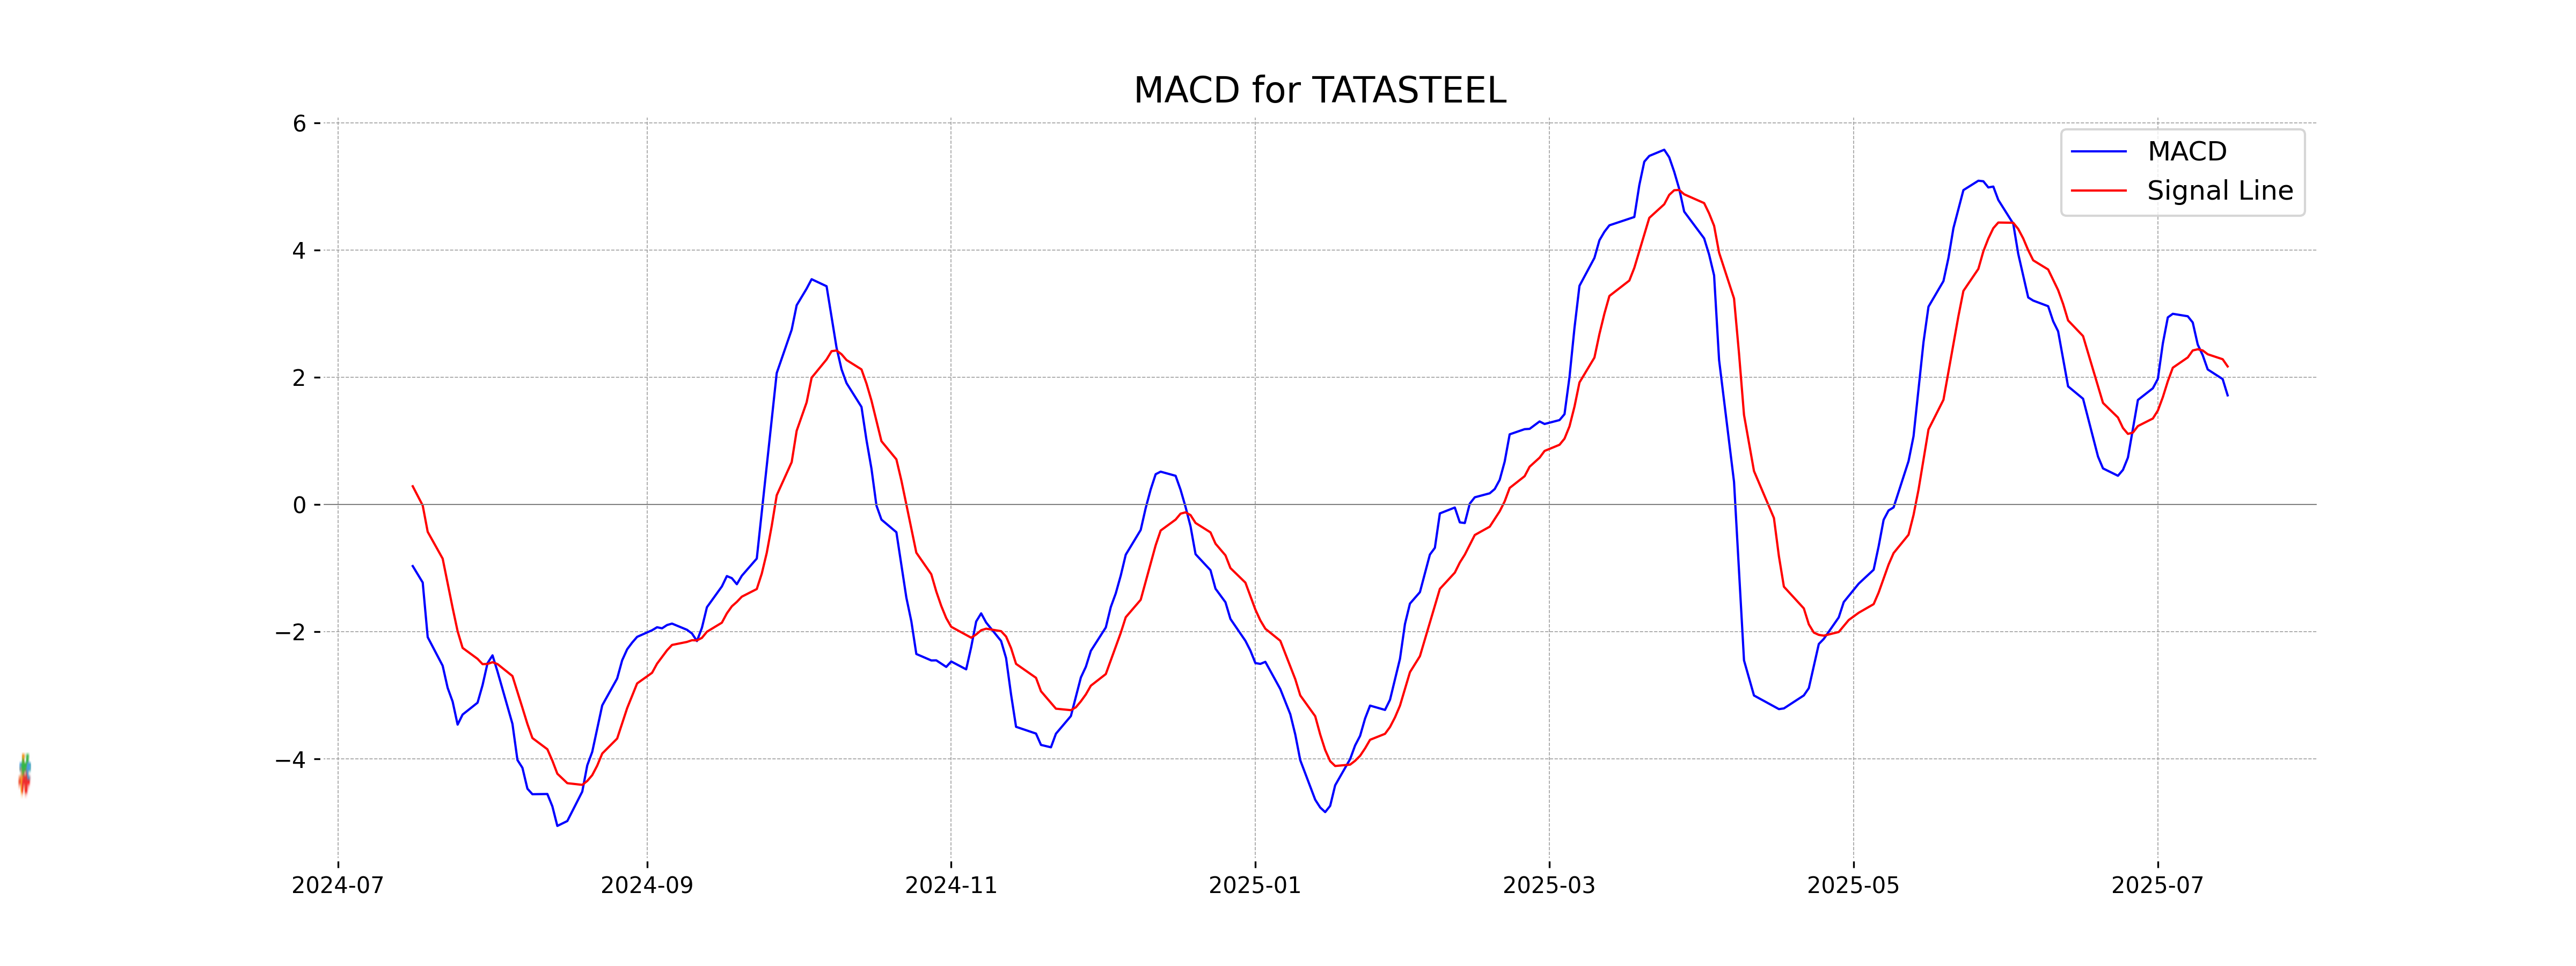
Moving Averages Trend (MACD)
Tata Steel's MACD analysis shows a MACD value of 1.714, which is below the MACD Signal of 2.169. This indicates a potential bearish trend in the stock, suggesting that it may be undergoing a period of selling pressure.
RSI Analysis
The Relative Strength Index (RSI) for Tata Steel is 51.69. This value suggests that the stock is currently in a neutral zone, indicating neither overbought nor oversold conditions. Typically, an RSI above 70 is considered overbought, while below 30 is considered oversold.