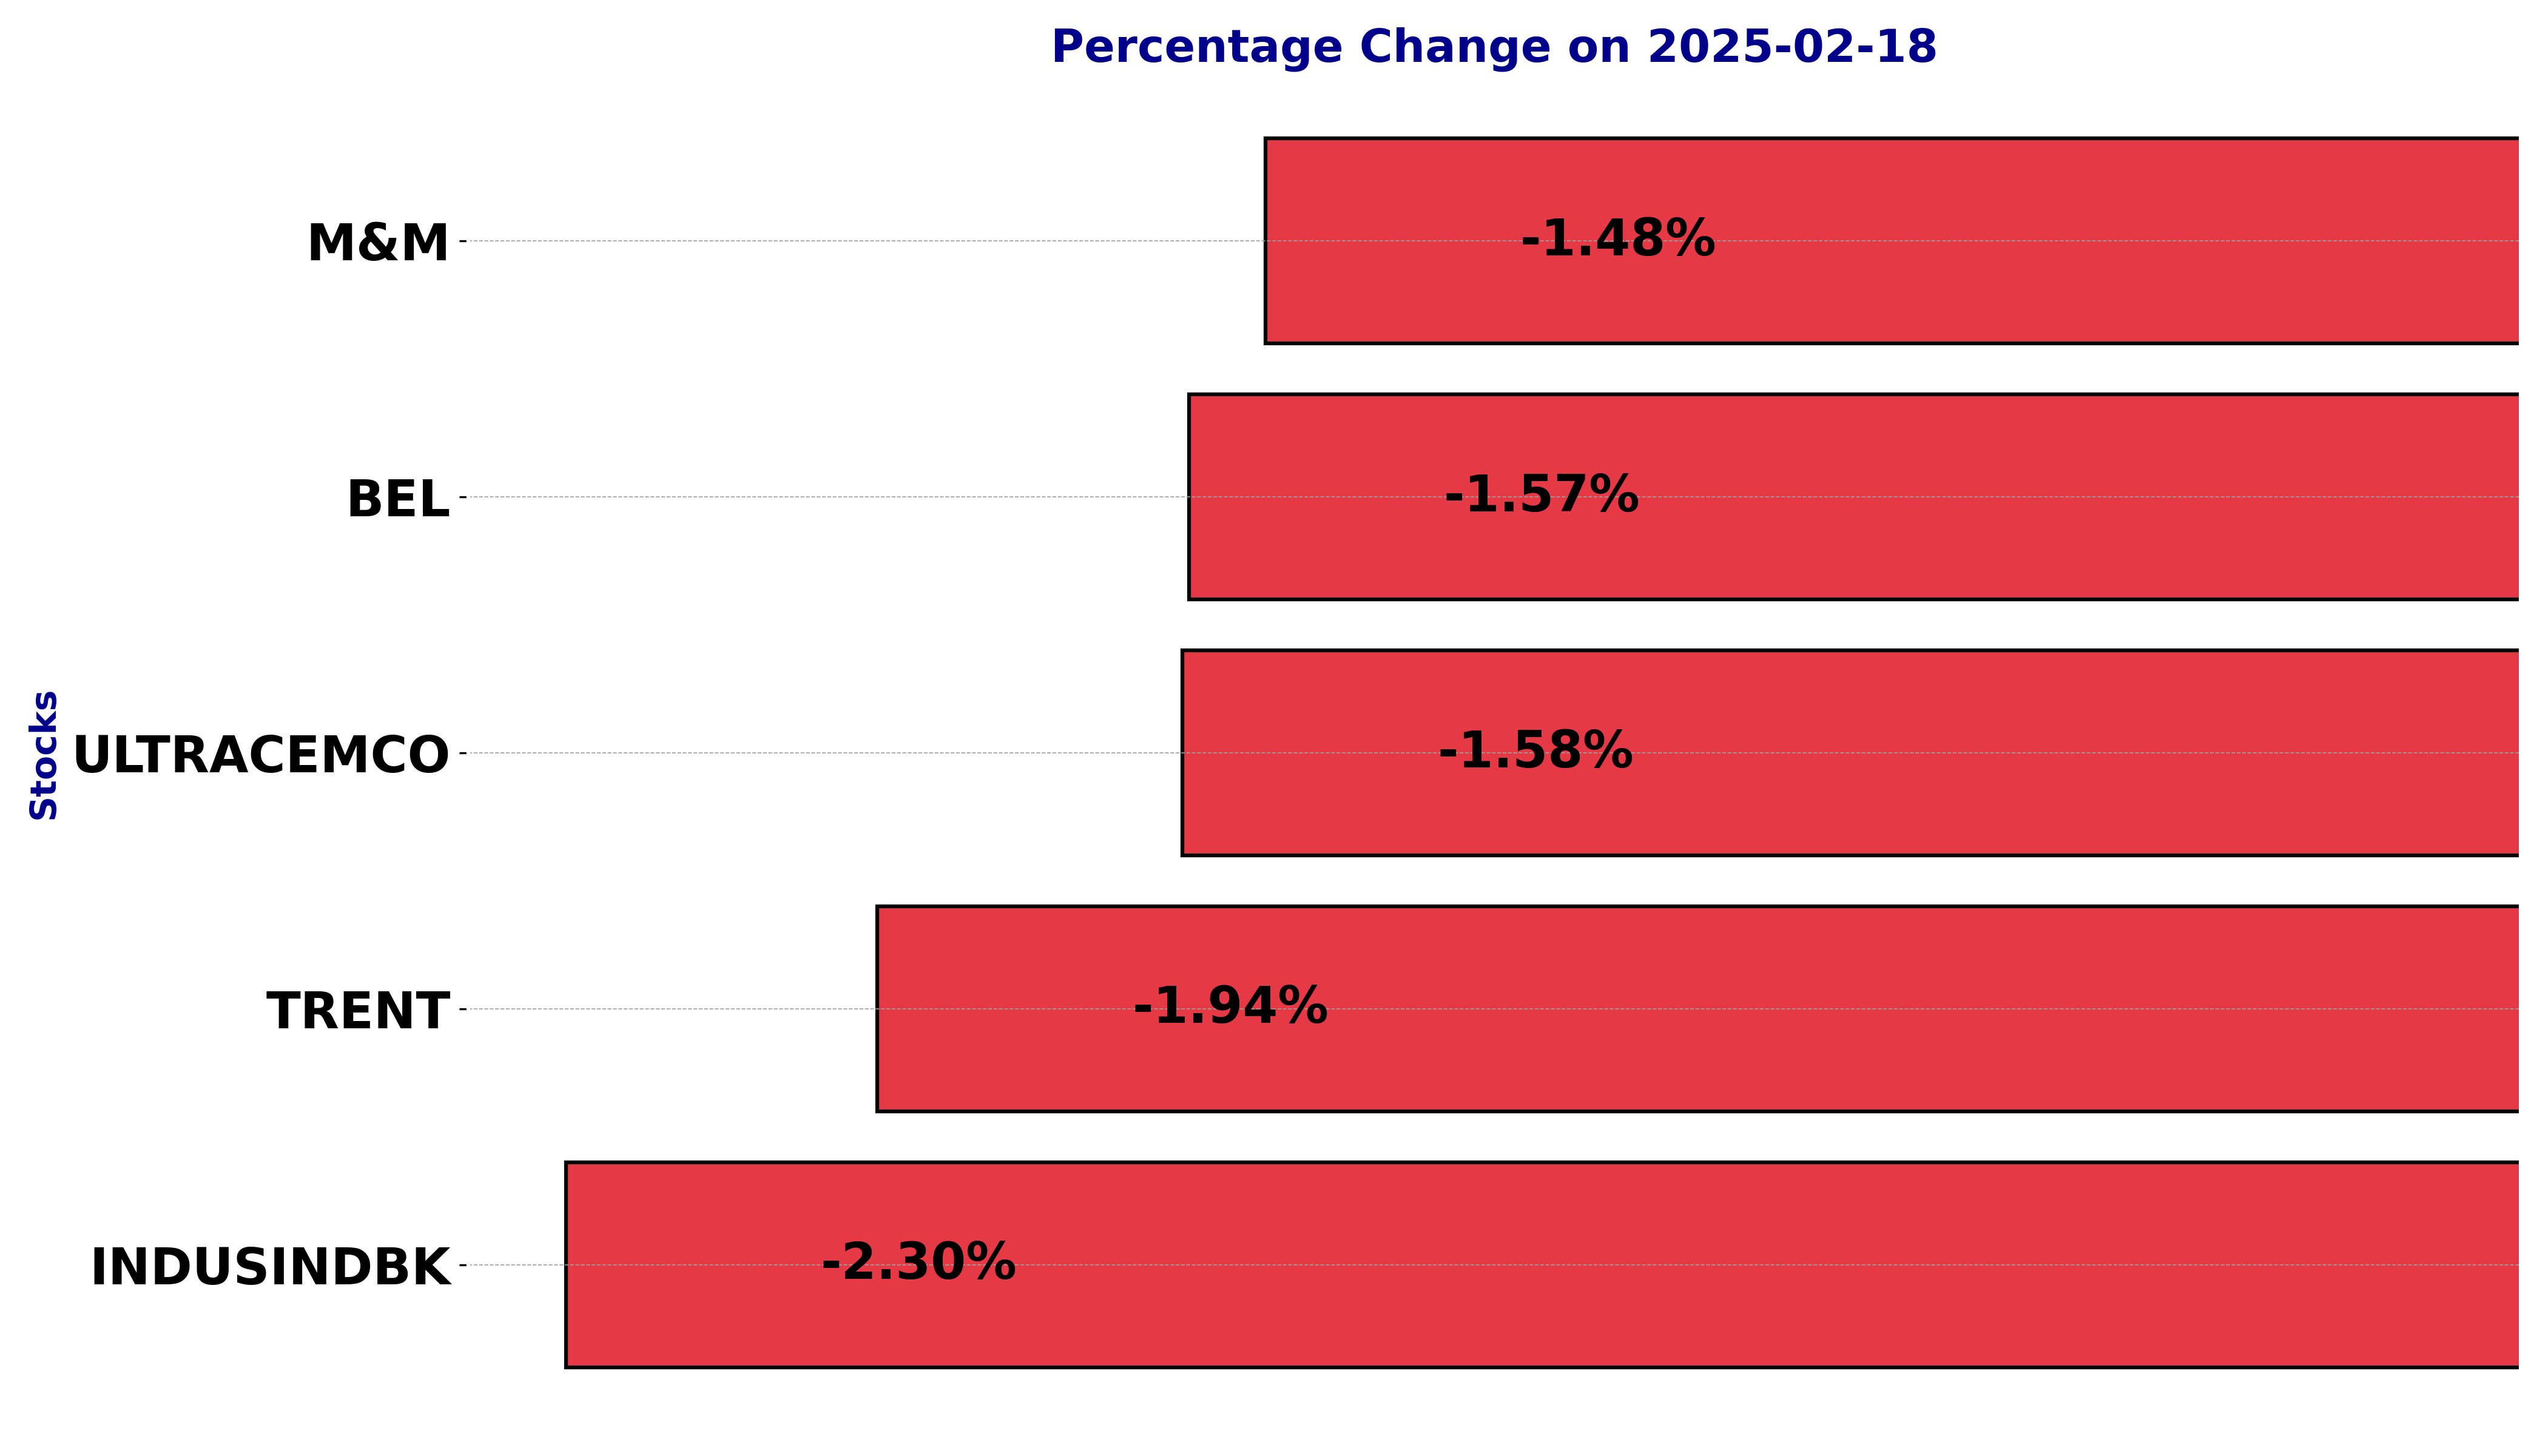
NSE Nifty 50: Top 5 stock losers of February 18, 2025
In this article, we will explore the technical indicators of some of the low-performing stocks on the Indian stock market, including BEL, INDUSINDBK, M&M, TRENT, and ULTRACEMCO.
By looking at these stocks through the lens of key technical factors, we aim to better understand their price movements, trends, and potential future performance.
Analysis for Bharat Electronics - February 18, 2025

Bharat Electronics experienced a decrease in its stock performance, with a closing price of 244.60 INR, a drop of approximately -1.57% from the previous close. The technical indicators suggest a bearish trend, with the RSI at 34 indicating potential oversold conditions, and the MACD below the signal line. The company's financial metrics show its market cap at approximately 1.79 trillion INR and a PE ratio of 35.81, indicating relatively high valuation compared to earnings. Bharat Electronics operates within the Industrials sector, specifically in Aerospace & Defense, in India.
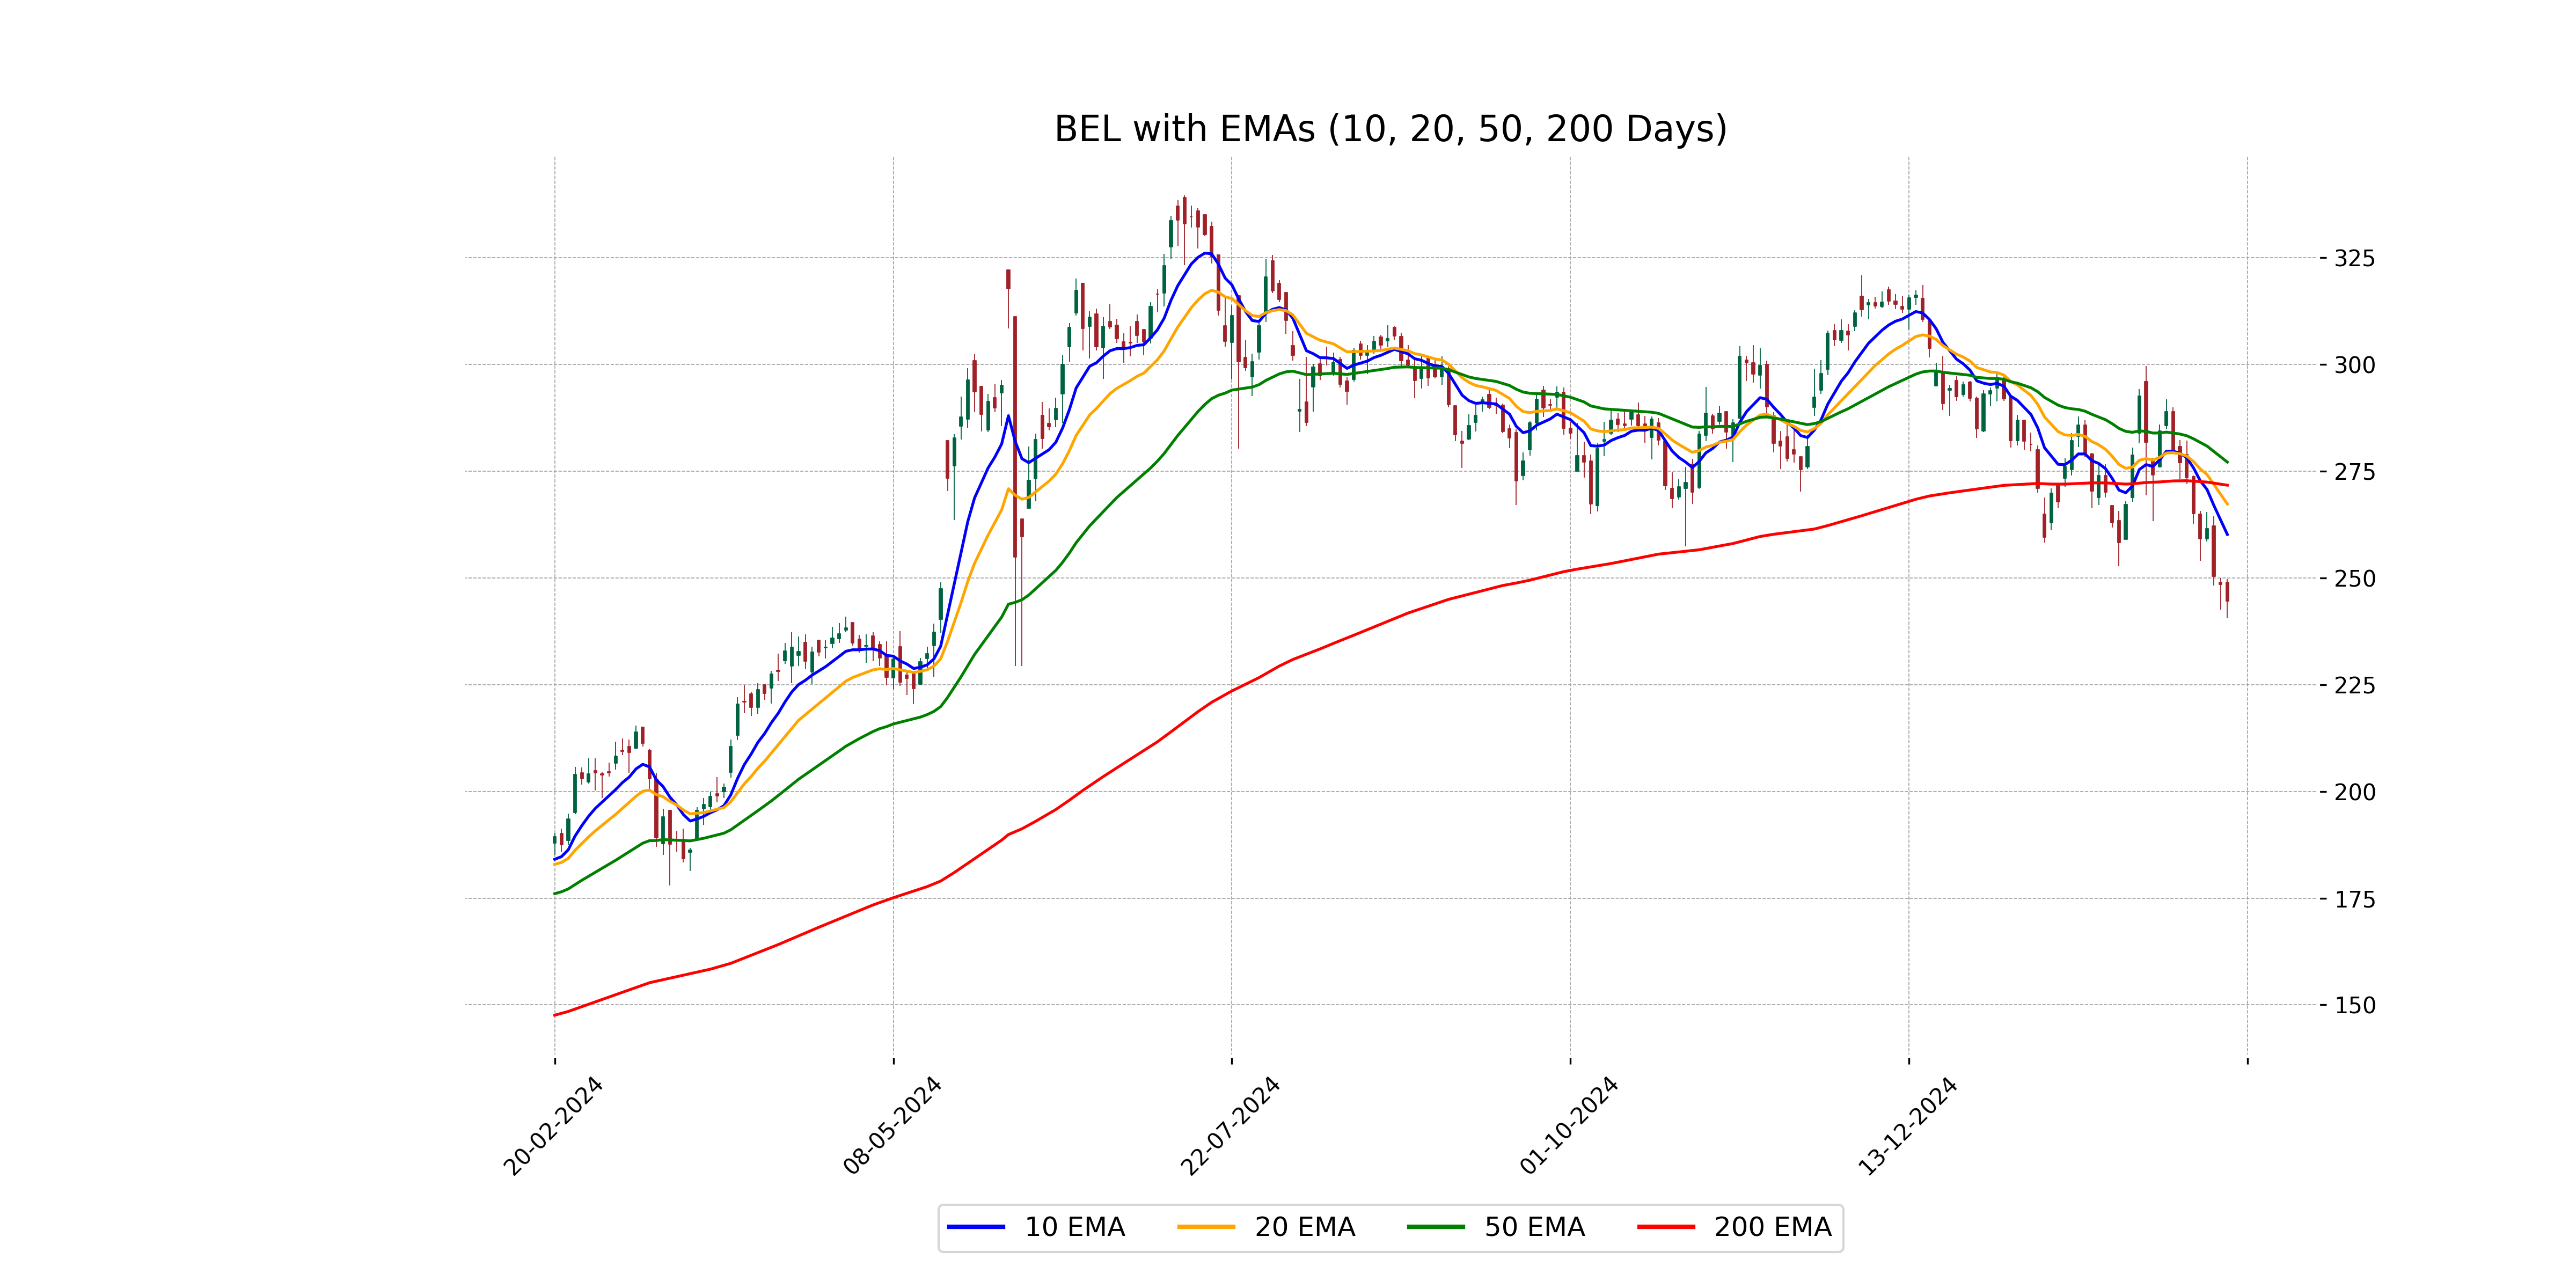
Relationship with Key Moving Averages
Bharat Electronics is currently trading below its 50-day and 200-day exponential moving averages, with the current stock price at approximately 244.60, compared to the 50 EMA of 277.14 and the 200 EMA of 271.73. Additionally, the stock is also below its 10-day and 20-day EMAs, indicating a bearish trend relative to short to long-term moving averages.
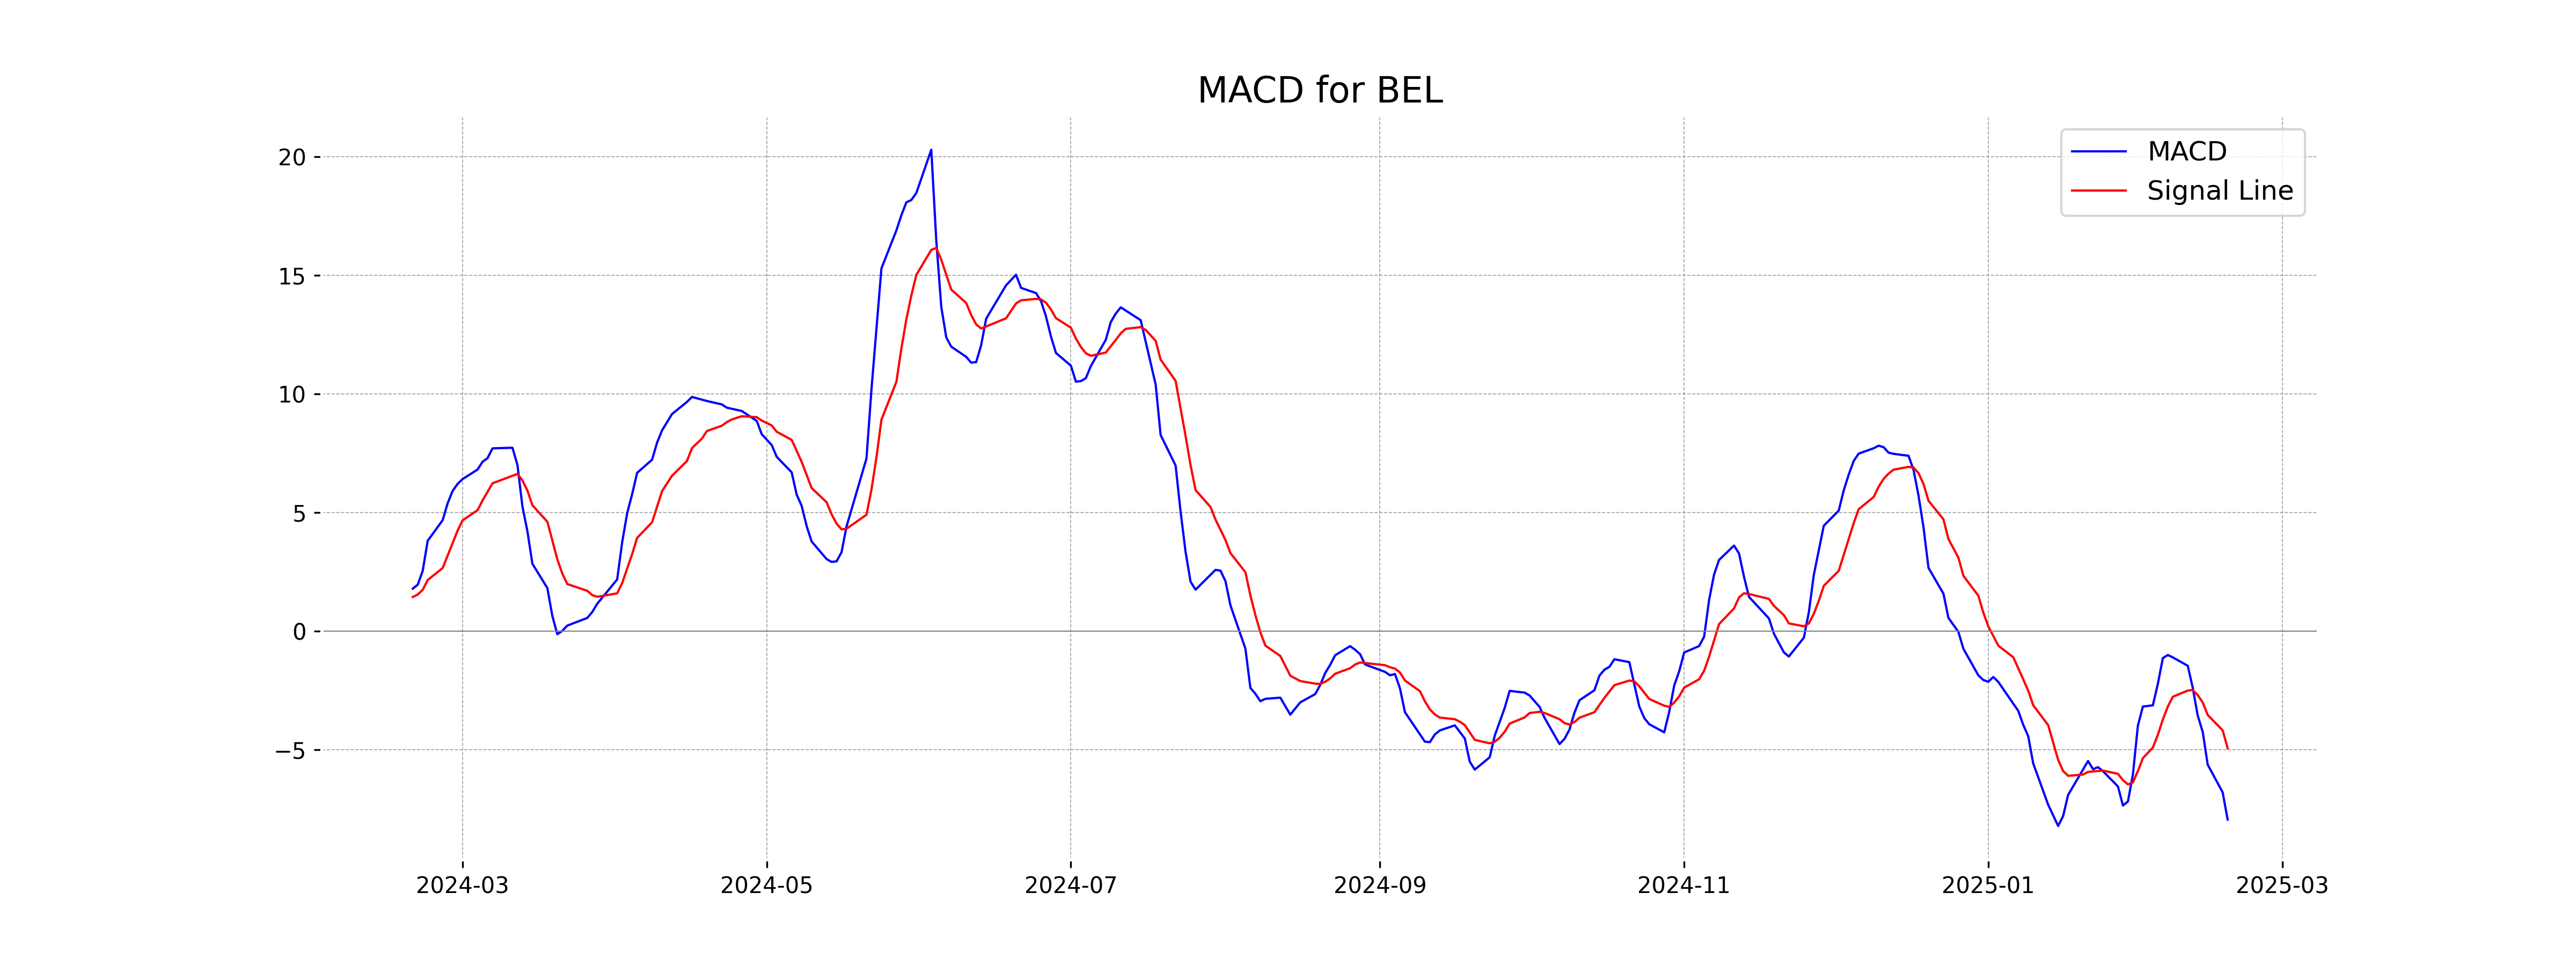
Moving Averages Trend (MACD)
The MACD for Bharat Electronics is currently at -7.95, which is below the MACD Signal line of -4.95. This indicates a bearish trend, as the negative value and its position below the signal line suggest downward momentum in the stock price.
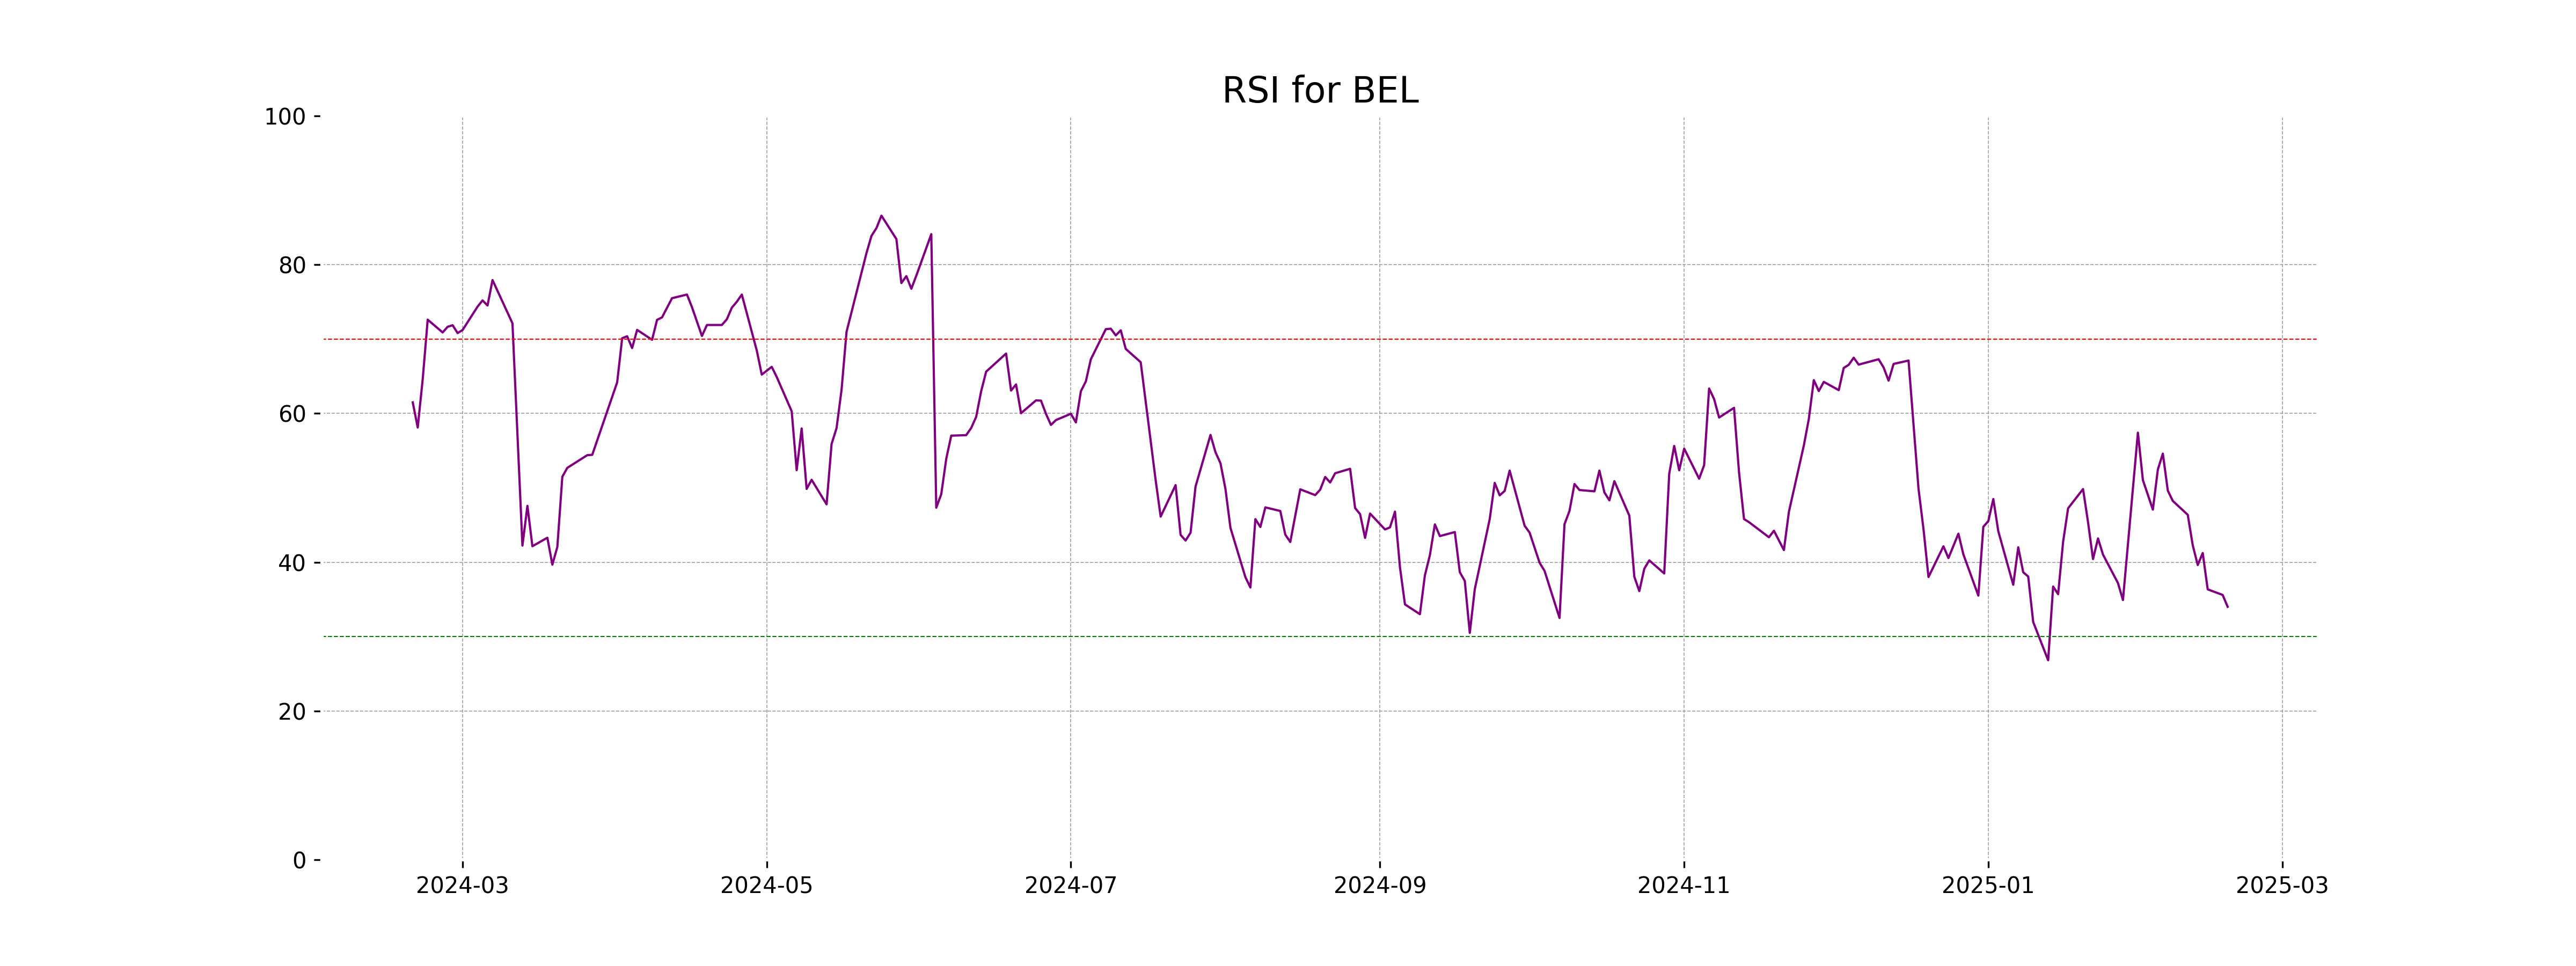
RSI Analysis
The RSI (Relative Strength Index) for Bharat Electronics is currently at 34.01, which suggests that the stock is approaching oversold territory. Typically, an RSI below 30 signals that a stock may be undervalued and ripe for a potential uptrend. However, caution should be exercised as further confirmation is needed before making any trading decisions.
Analysis for IndusInd Bank - February 18, 2025
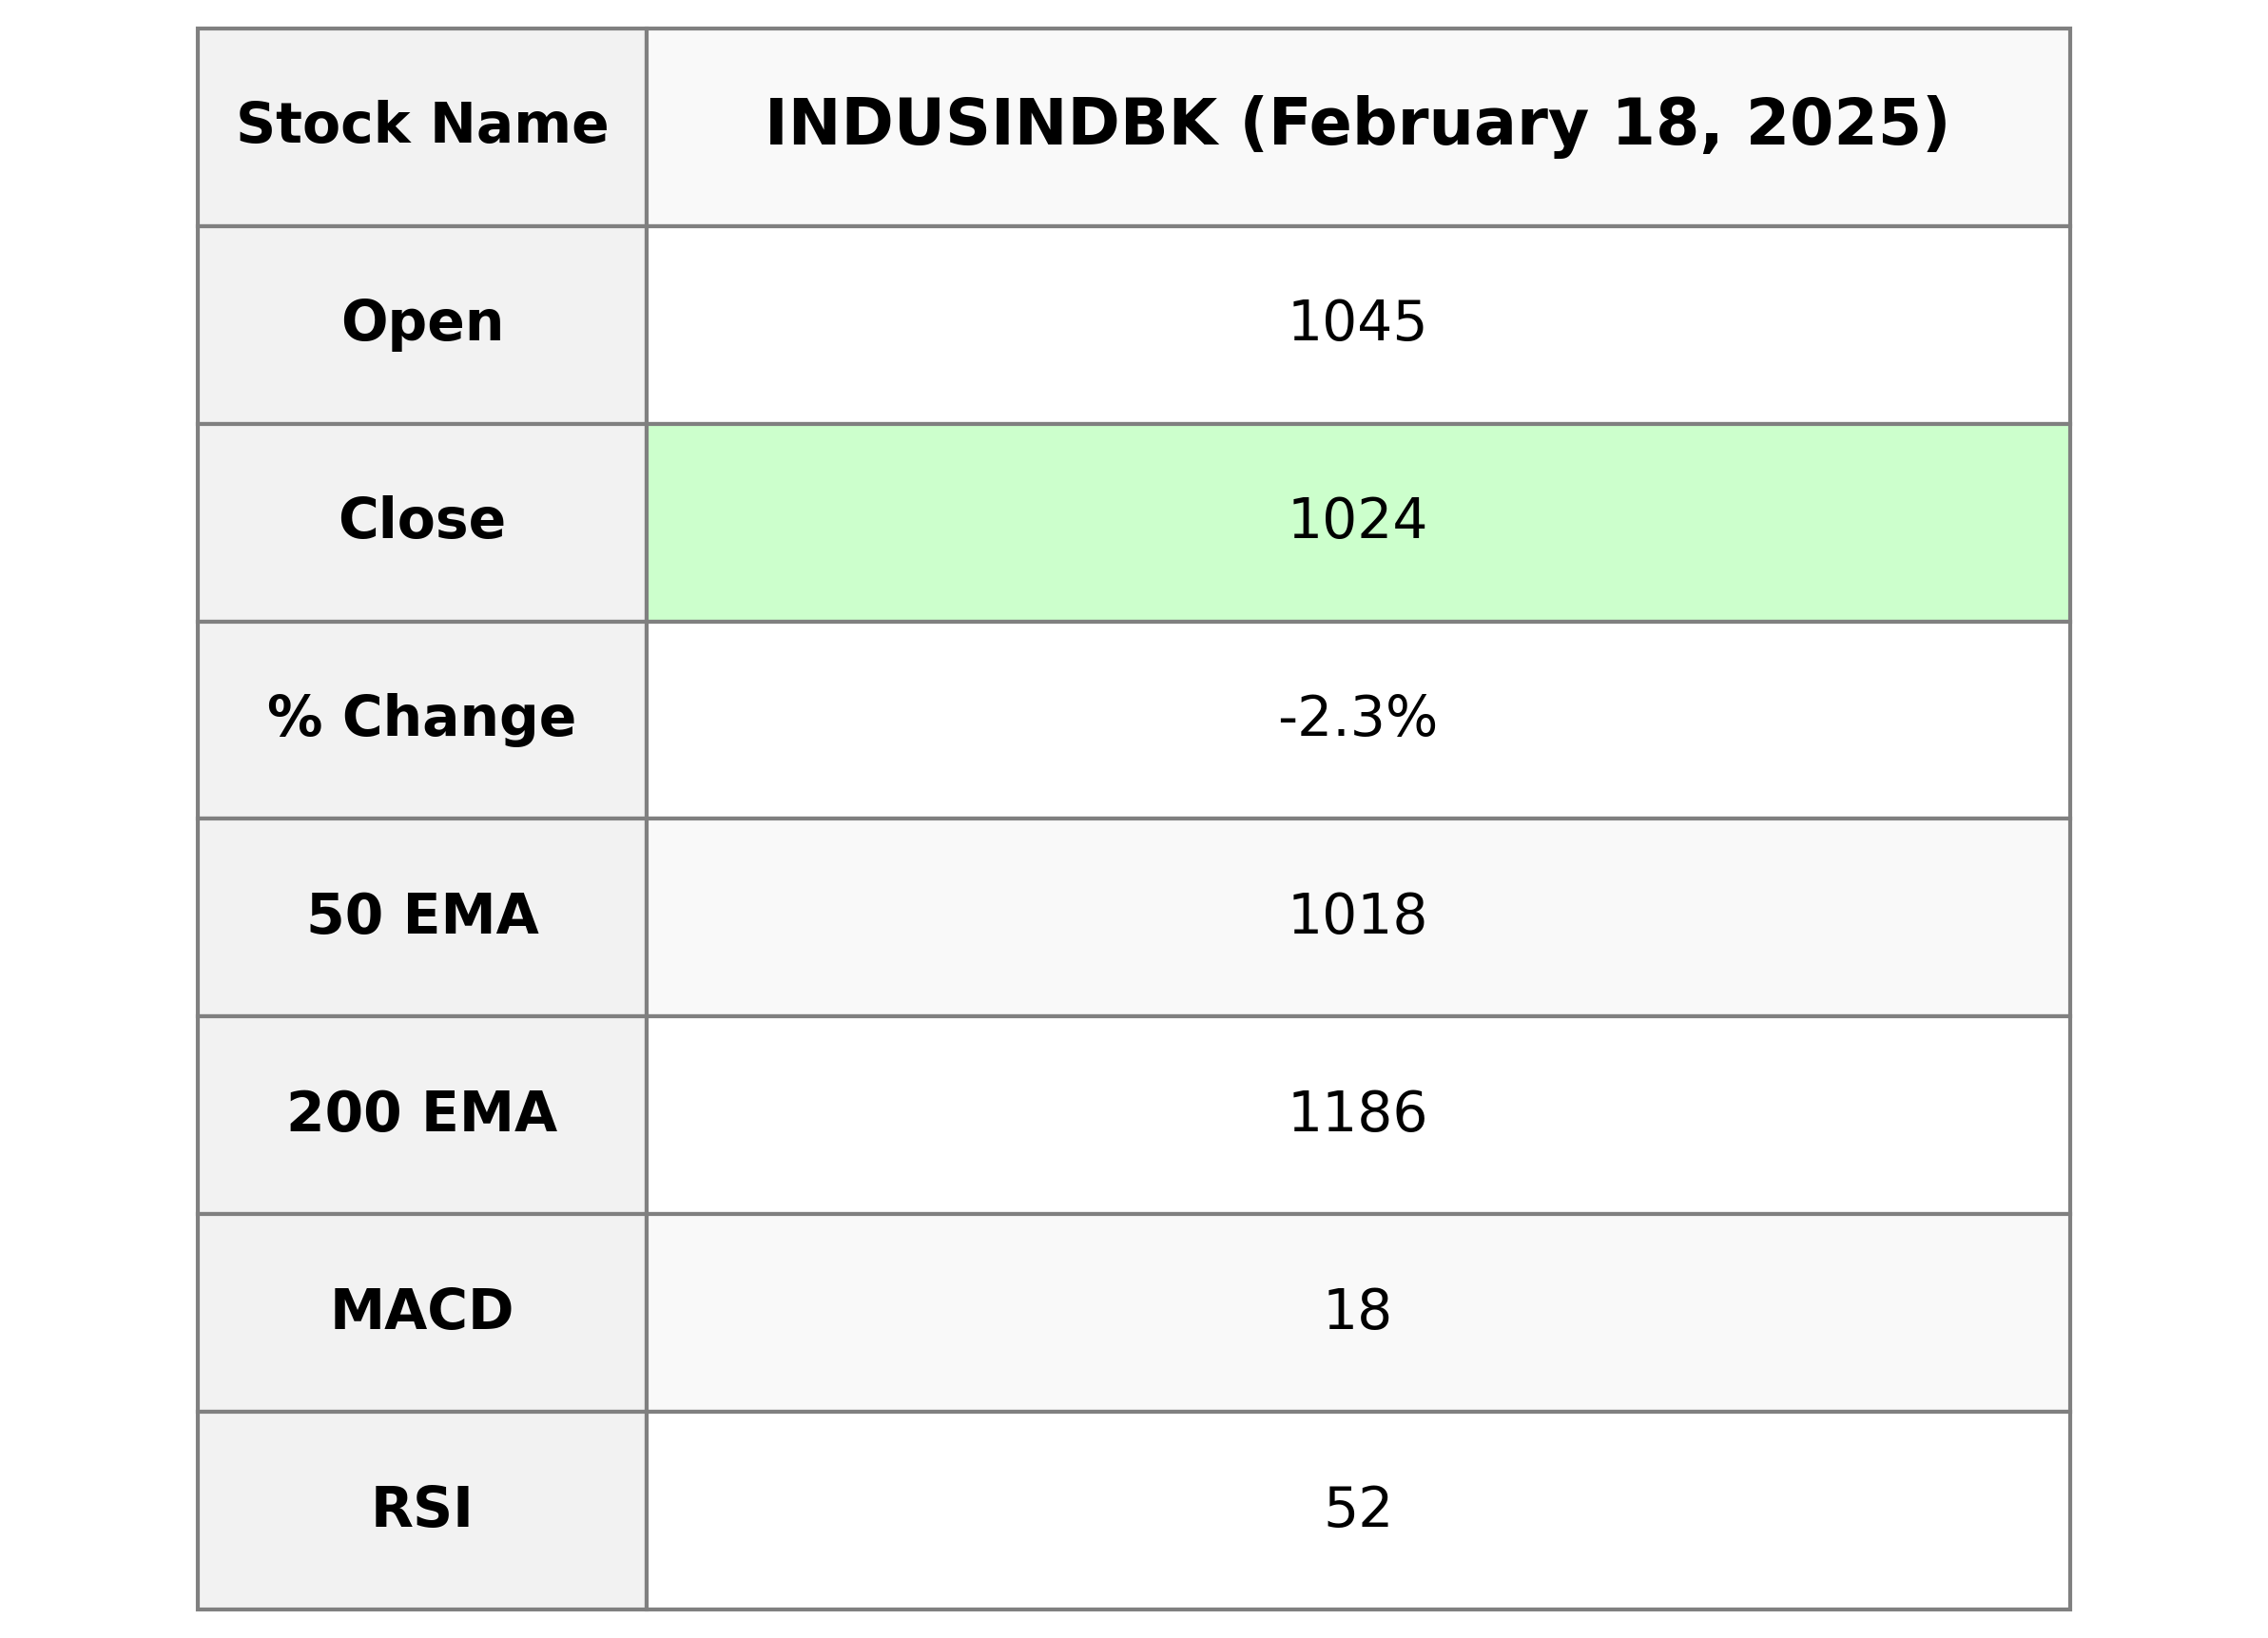
IndusInd Bank experienced a decline in performance, with the stock closing at 1024.10, down by 2.30% from the previous close of 1048.25. The Relative Strength Index (RSI) stands at 52.32, indicating neutral momentum. The MACD at 17.85 is slightly below its signal line of 18.18, which suggests a potential bearish crossover.

Relationship with Key Moving Averages
IndusInd Bank's current closing price of 1024.10 is slightly above its 50 EMA of 1017.67 and close to its 20 EMA of 1021.92, indicating short-term strength compared to these averages. However, it is significantly below the 200 EMA of 1186.26, suggesting weaker long-term momentum.
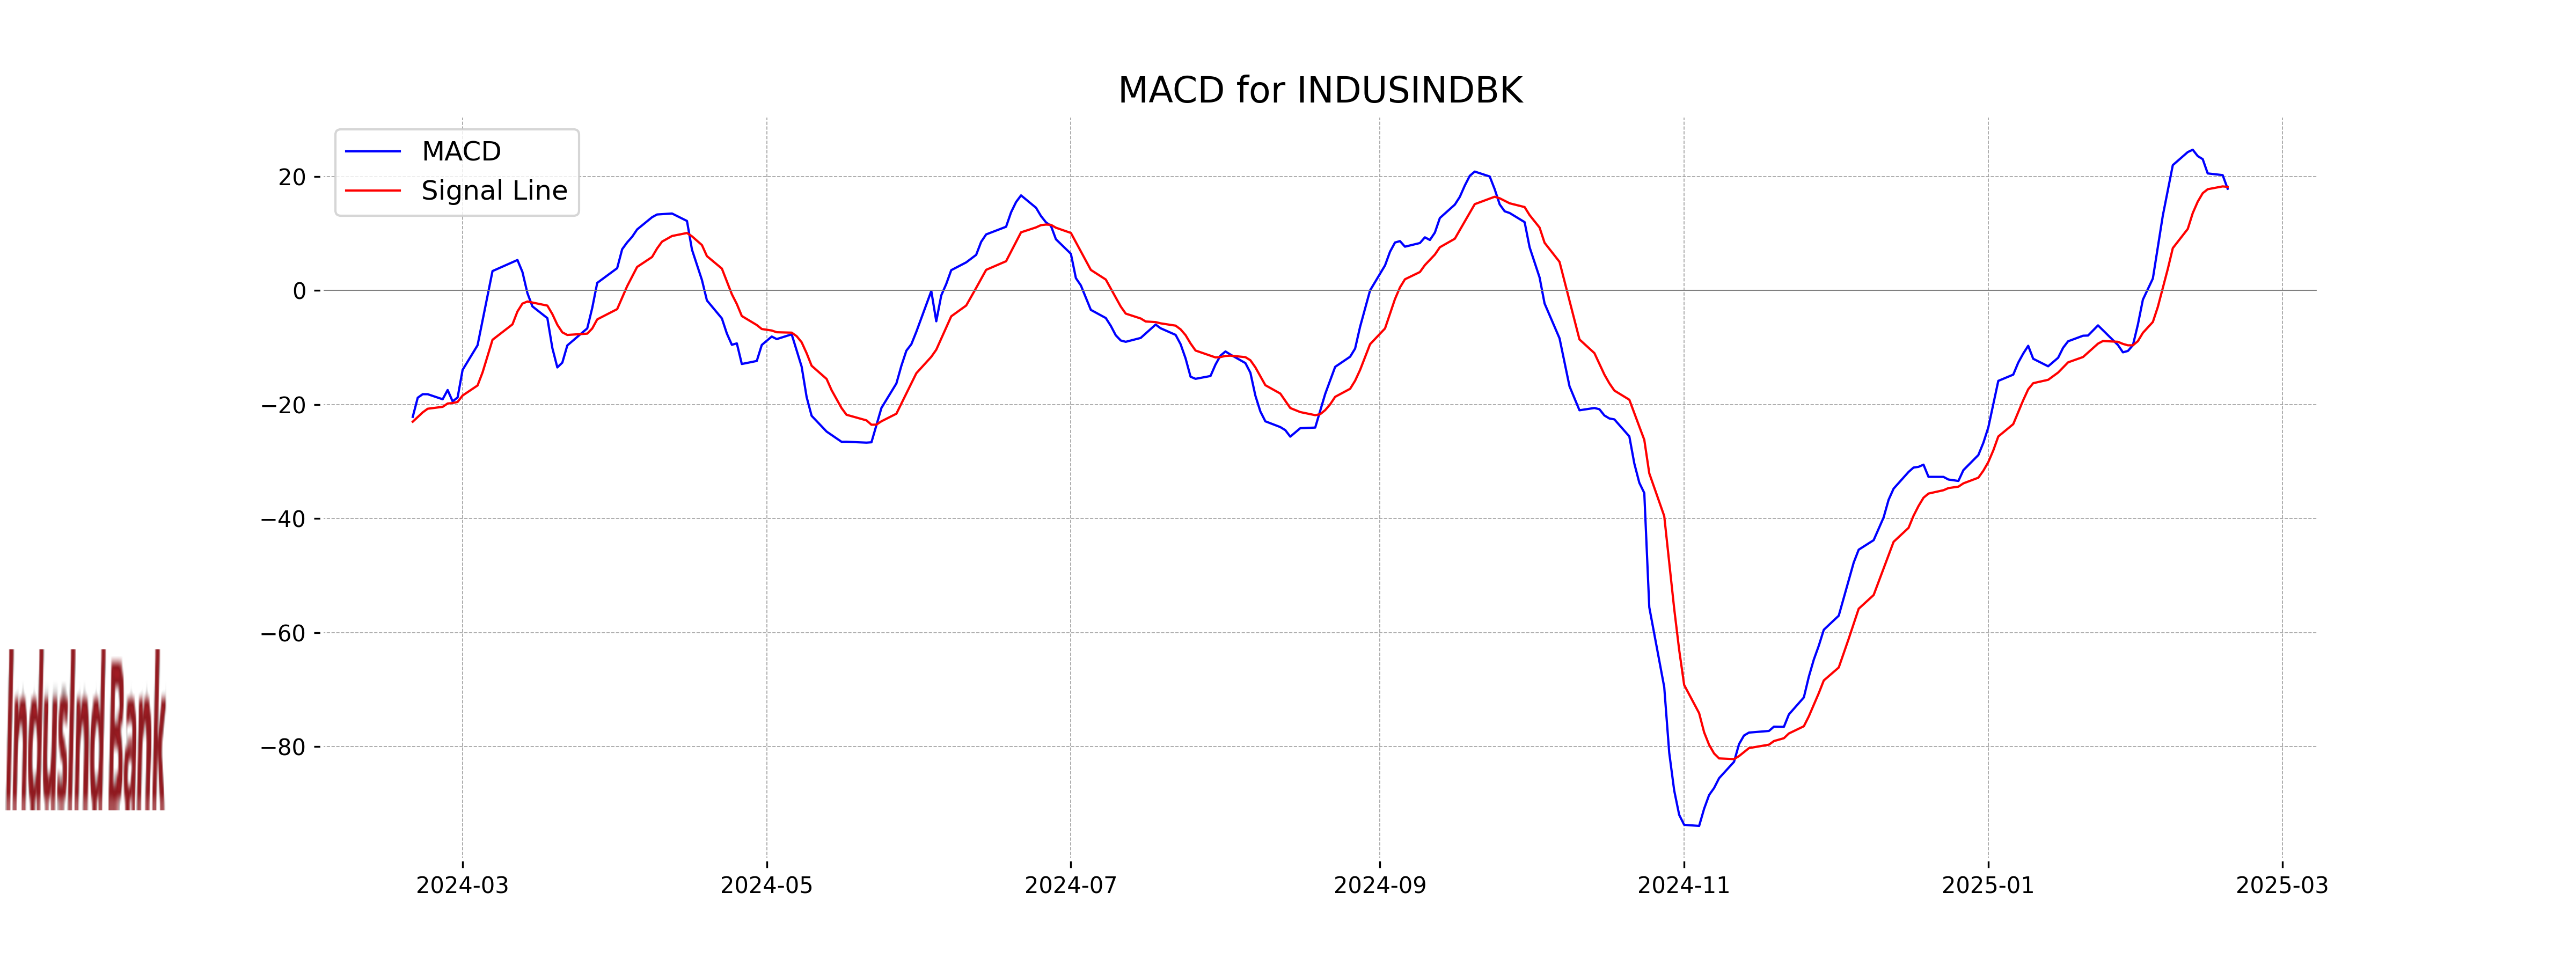
Moving Averages Trend (MACD)
IndusInd Bank's MACD line is currently at 17.85, which is below the MACD Signal line of 18.18. This indicates a bearish signal, suggesting potential downside pressure in the near term. Investors may want to watch for further developments before making trading decisions.
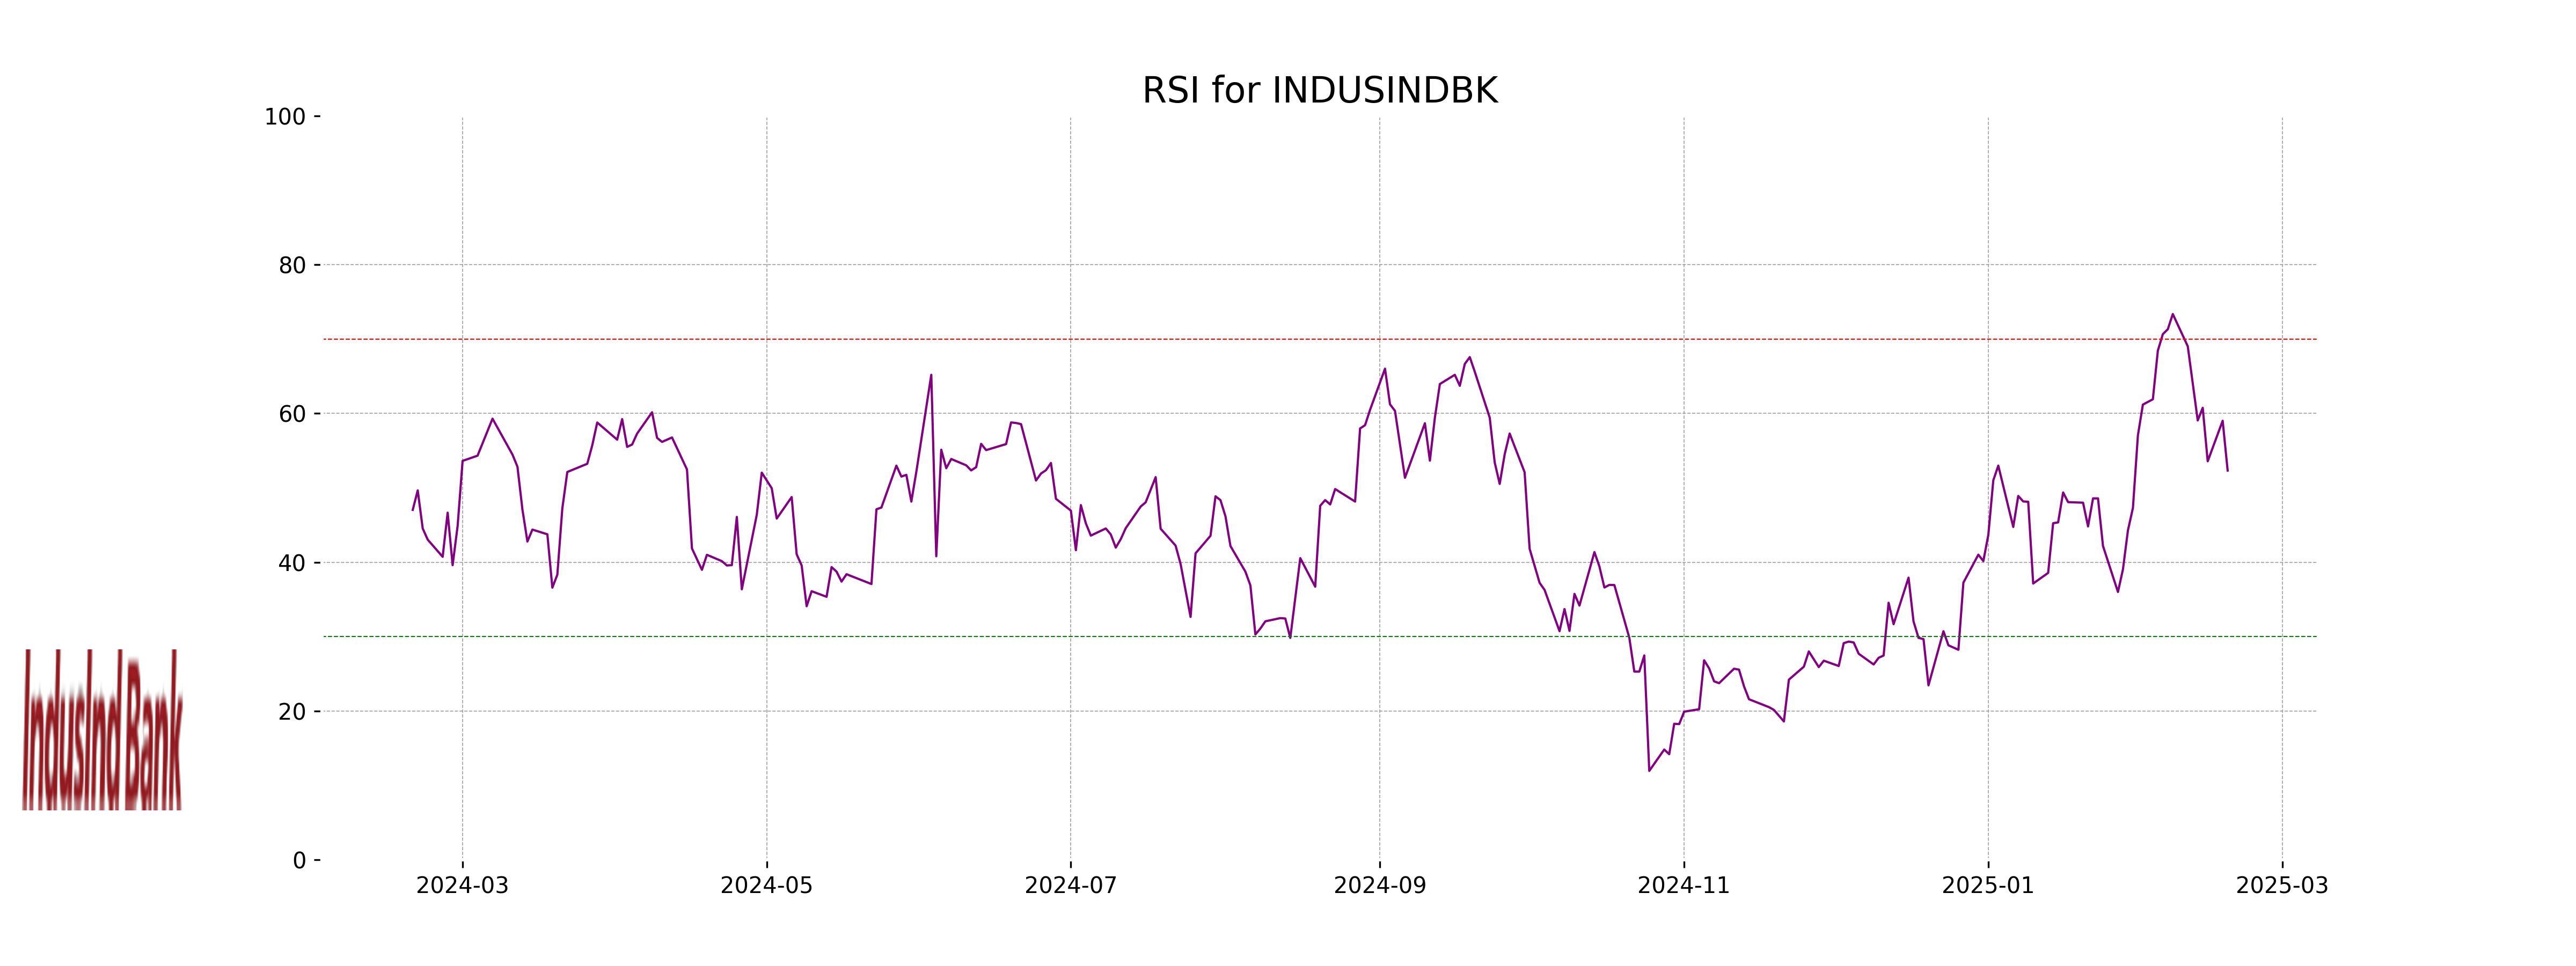
RSI Analysis
RSI Analysis for IndusInd Bank: The current RSI for IndusInd Bank is 52.32, indicating a neutral position. This suggests that the stock is neither overbought nor oversold, and the price may be stabilizing or consolidating.
Analysis for Mahindra & Mahindra - February 18, 2025
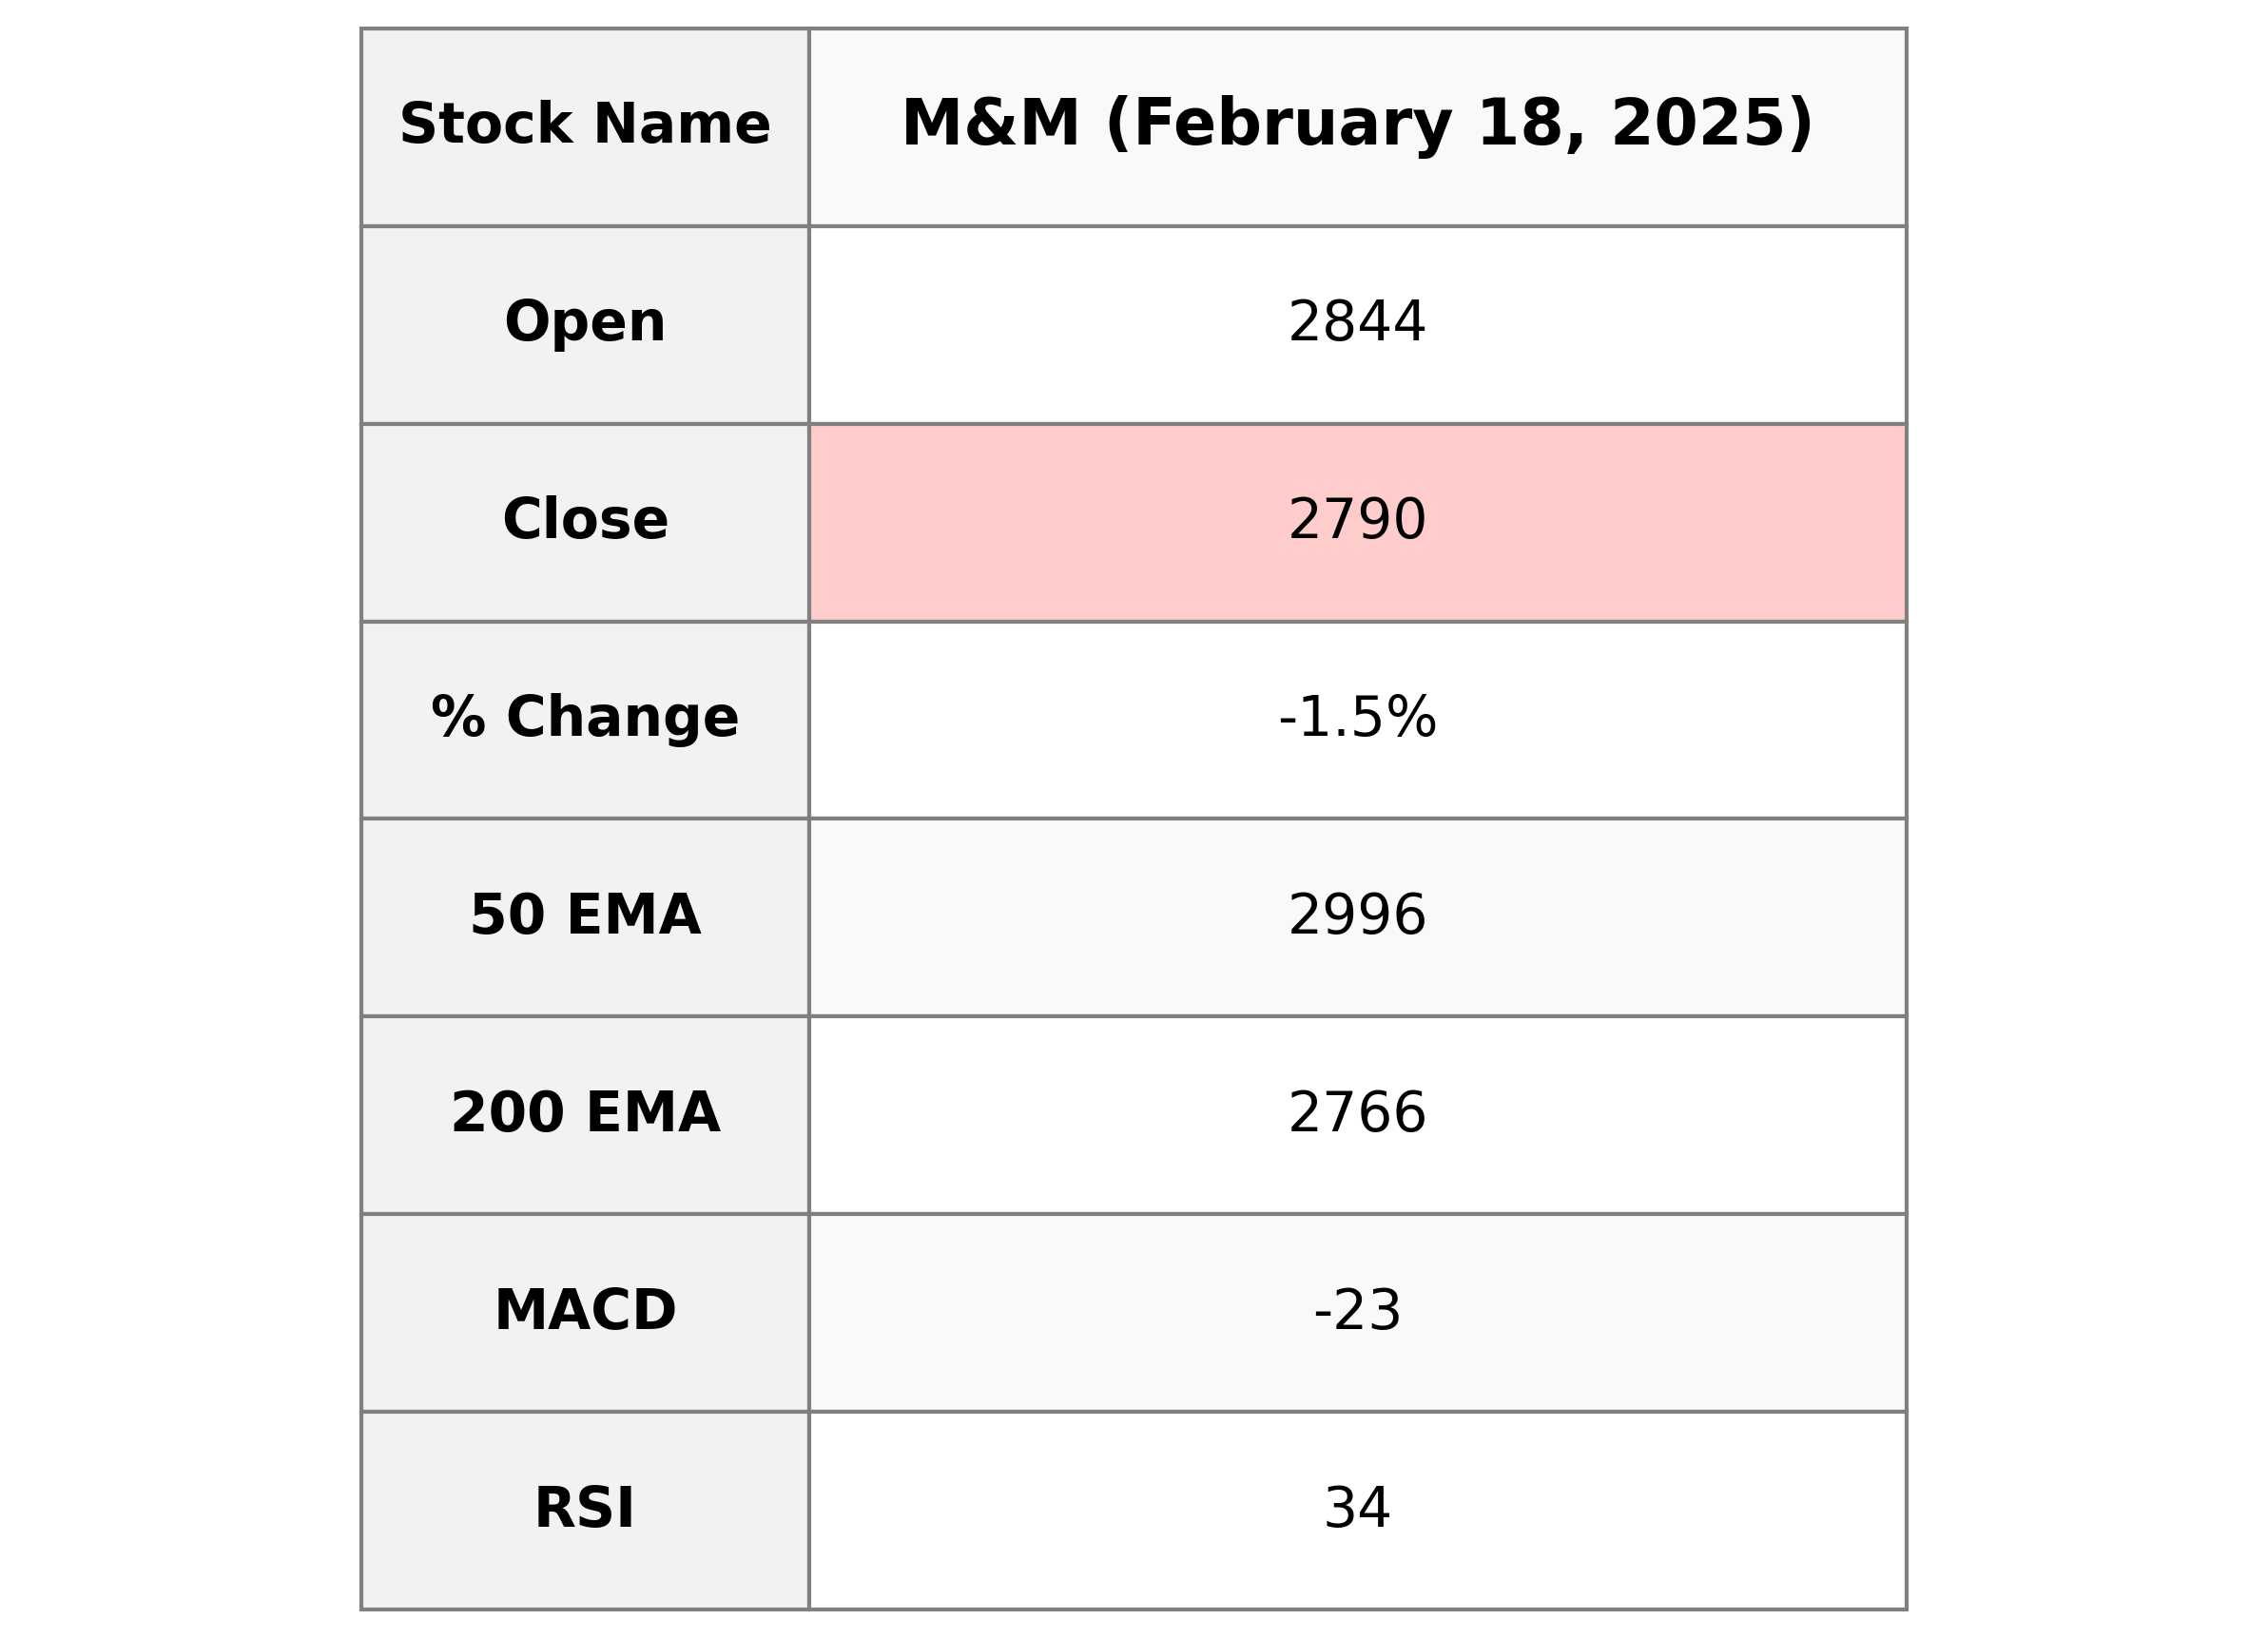
### Mahindra & Mahindra Performance Summary Mahindra & Mahindra experienced a decrease of approximately 1.48% in its stock price, closing at 2790.05 from the previous close of 2831.95. The stock exhibited a volatile session with a trading range between 2755.90 and 2845.00. Despite being below its 50 EMA, the company's RSI indicates oversold conditions, hinting at a potential rebound opportunity.
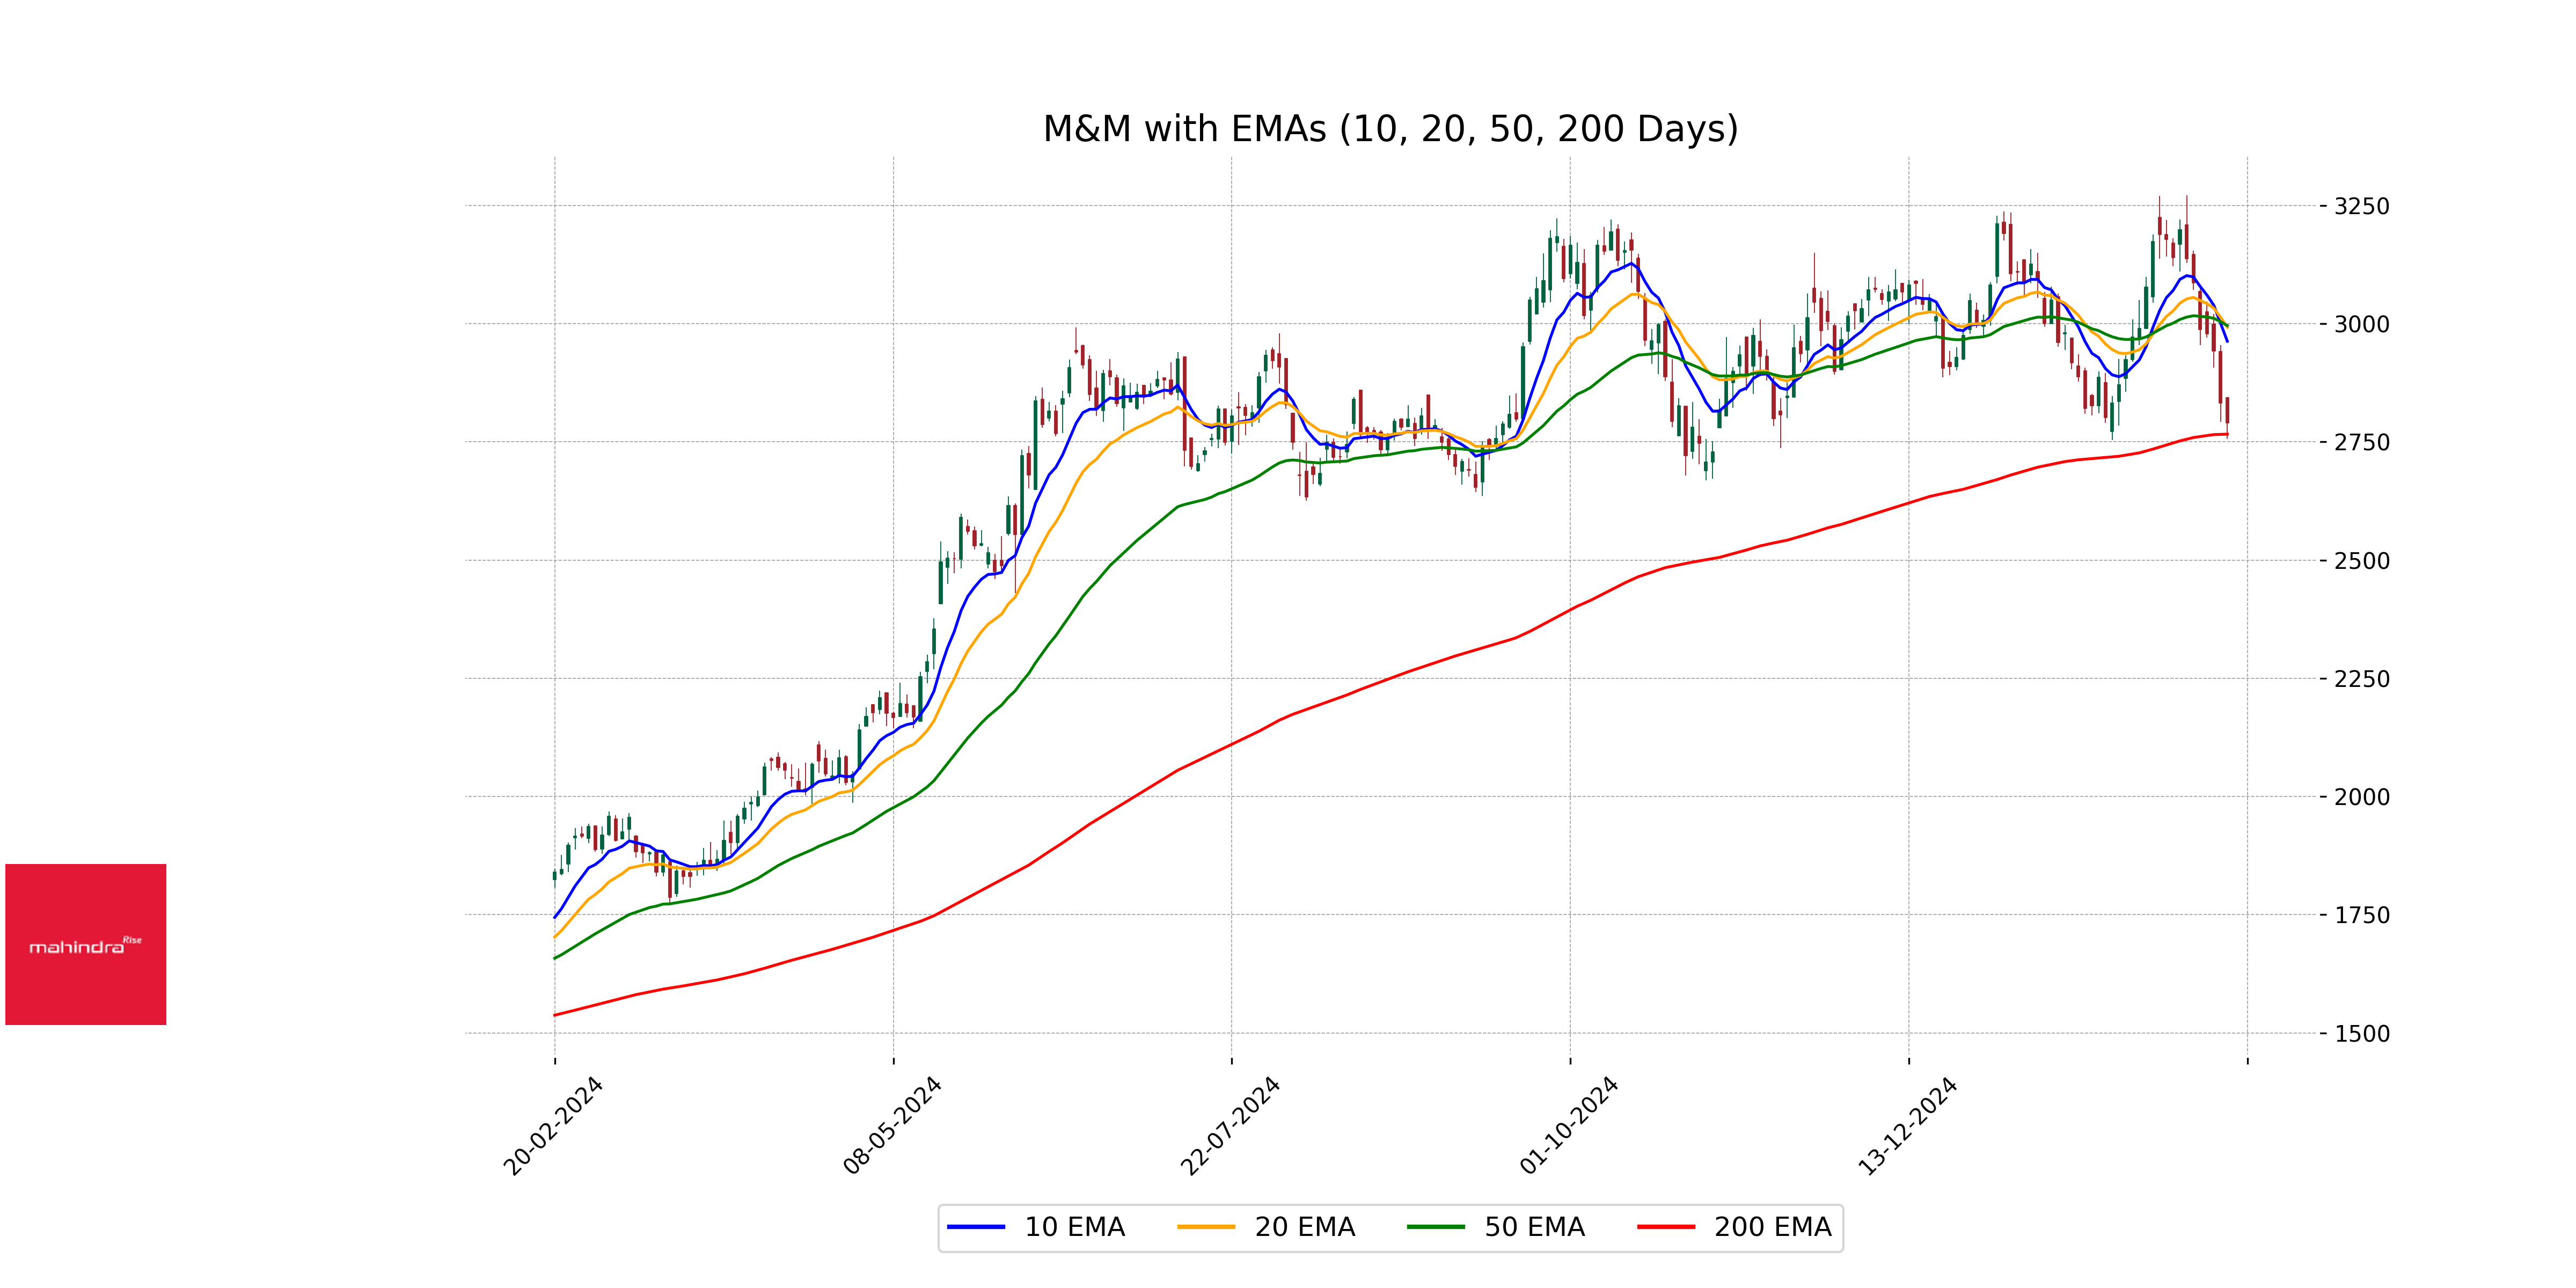
Relationship with Key Moving Averages
Mahindra & Mahindra's current closing price of 2790.05 is below its 50-day EMA of 2995.85 and 10-day EMA of 2962.82, indicating a bearish trend in the short to medium term. However, it remains slightly above the 200-day EMA of 2766.28, suggesting some longer-term support.
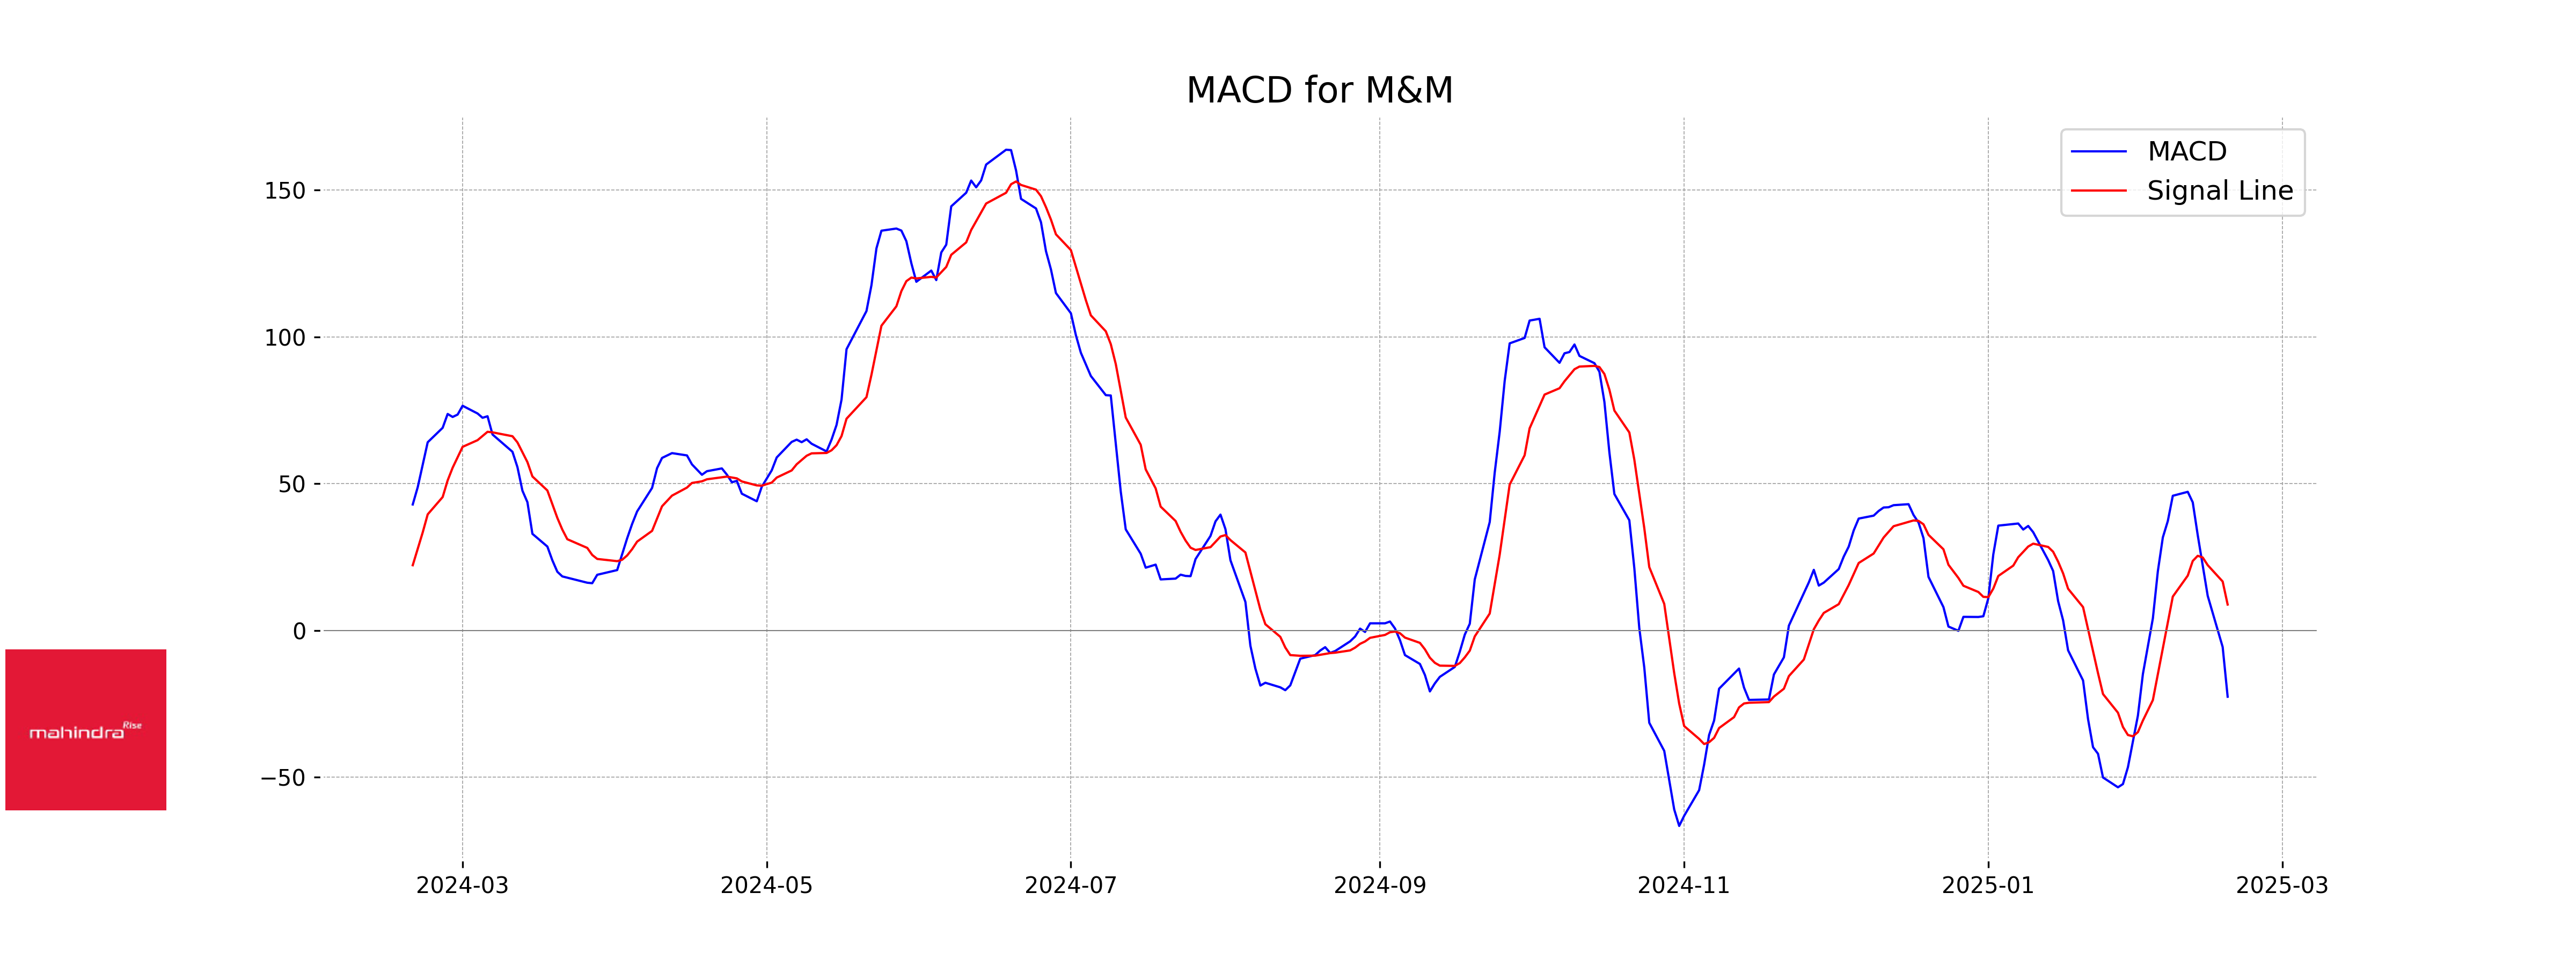
Moving Averages Trend (MACD)
Mahindra & Mahindra's MACD indicator is at -22.56, while the MACD Signal line is at 8.83, indicating a bearish momentum as the MACD line is below the signal line. This suggests potential downward pressure on the stock price.
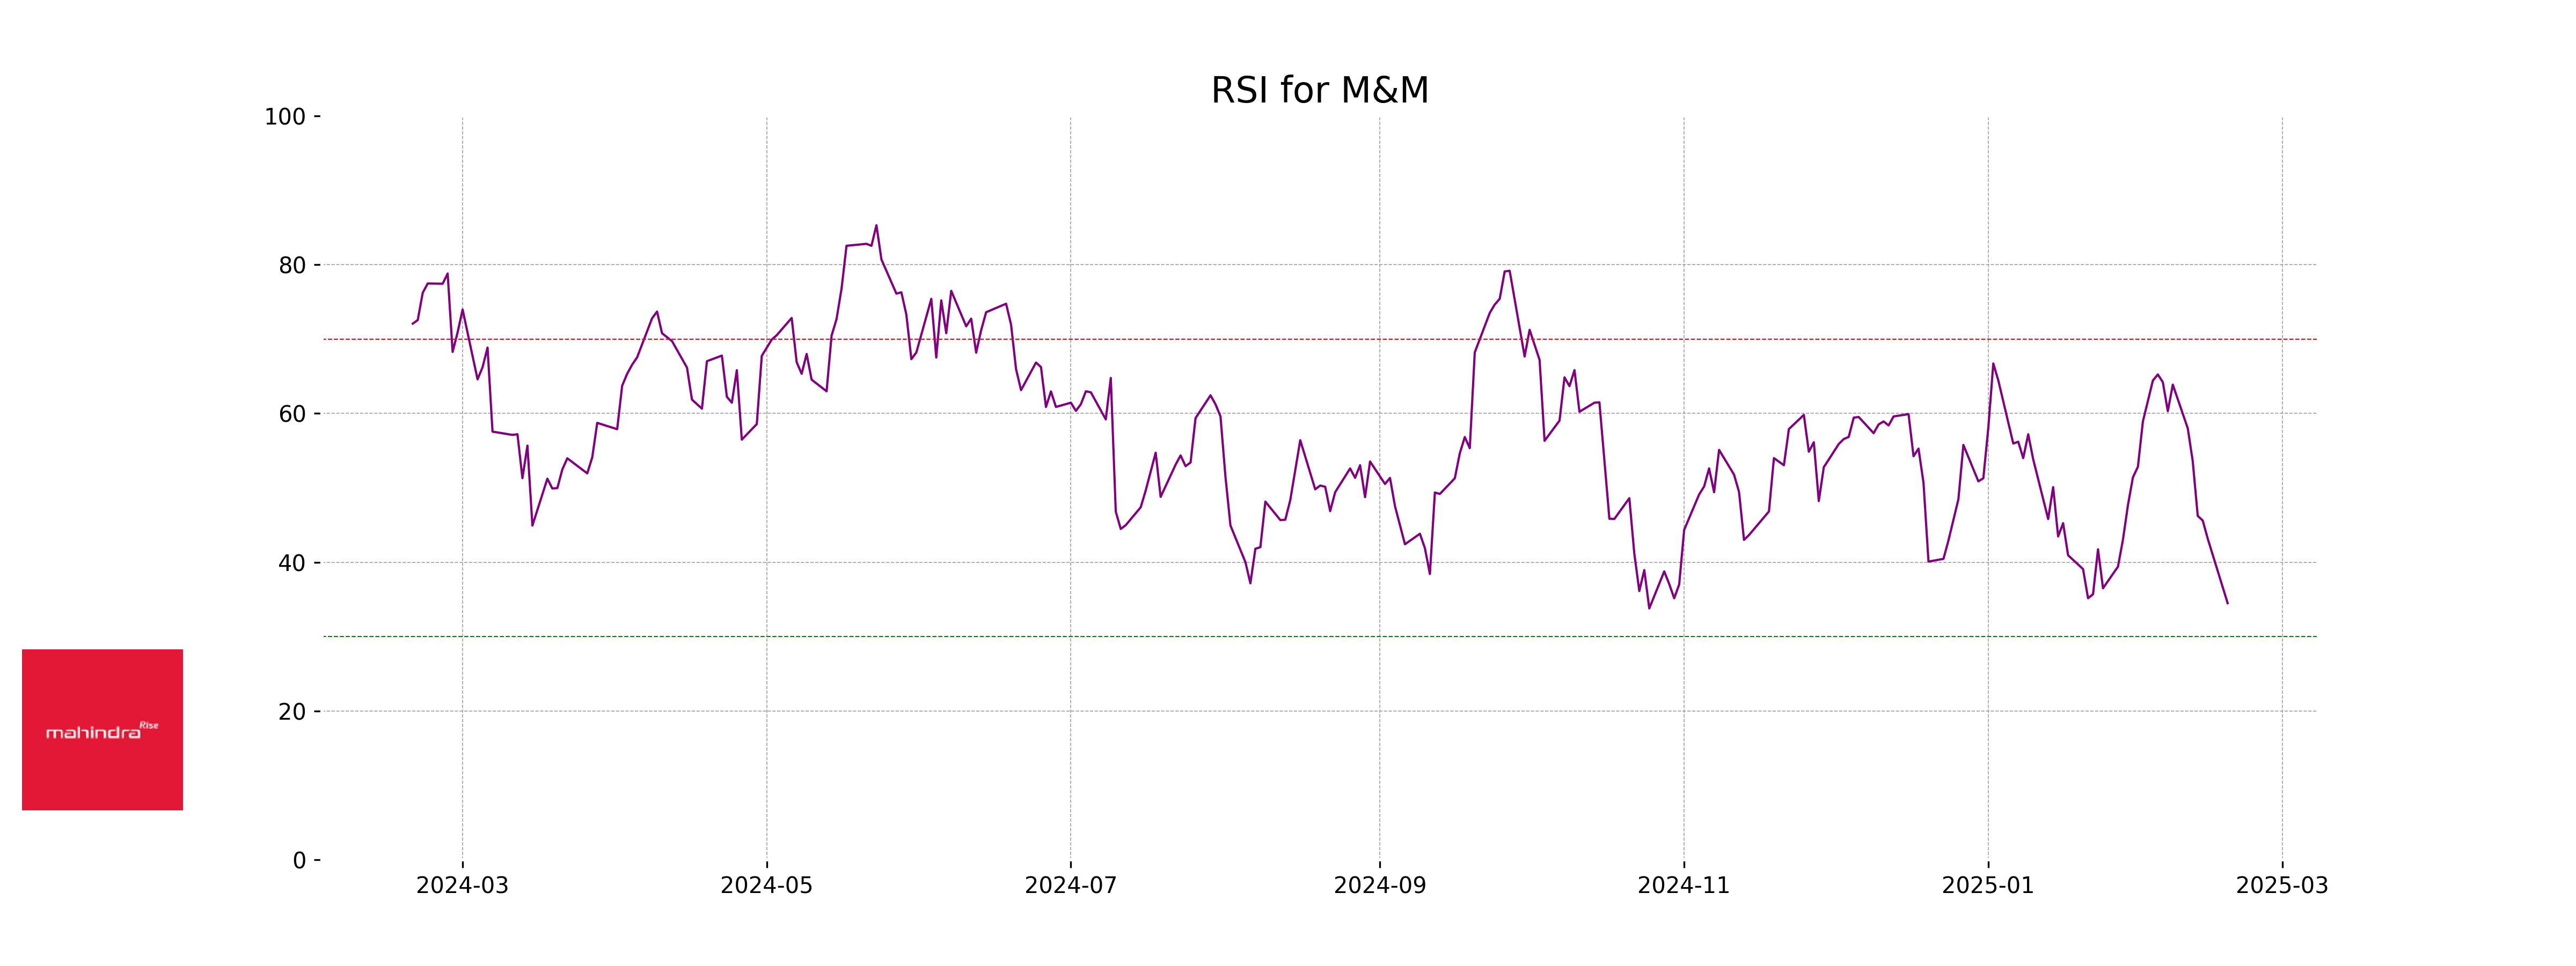
RSI Analysis
Mahindra & Mahindra's RSI is at 34.49, indicating that the stock is approaching the oversold territory. This suggests a potential buying opportunity, as the RSI is under 30, which is generally considered indicative of oversold conditions.
Analysis for Trent - February 18, 2025

Trent has experienced a negative performance with a closing price of 4997.75, showing a drop of -1.94% from its previous close of 5096.45, amounting to a points change of -98.70. Despite having a substantial market cap of 1,776,845,062,144 and a high PE ratio of 91.65, the stock's technical indicators show a bearish trend, evidenced by an RSI of 32.09 and a negative MACD.

Relationship with Key Moving Averages
Trent's current stock price of 4997.75 is below the 10-day EMA of 5257.92, indicating a short-term bearish trend. It is also below the 50-day EMA of 6013.74 and 200-day EMA of 5947.95, suggesting a bearish outlook in both medium and long-term trends.
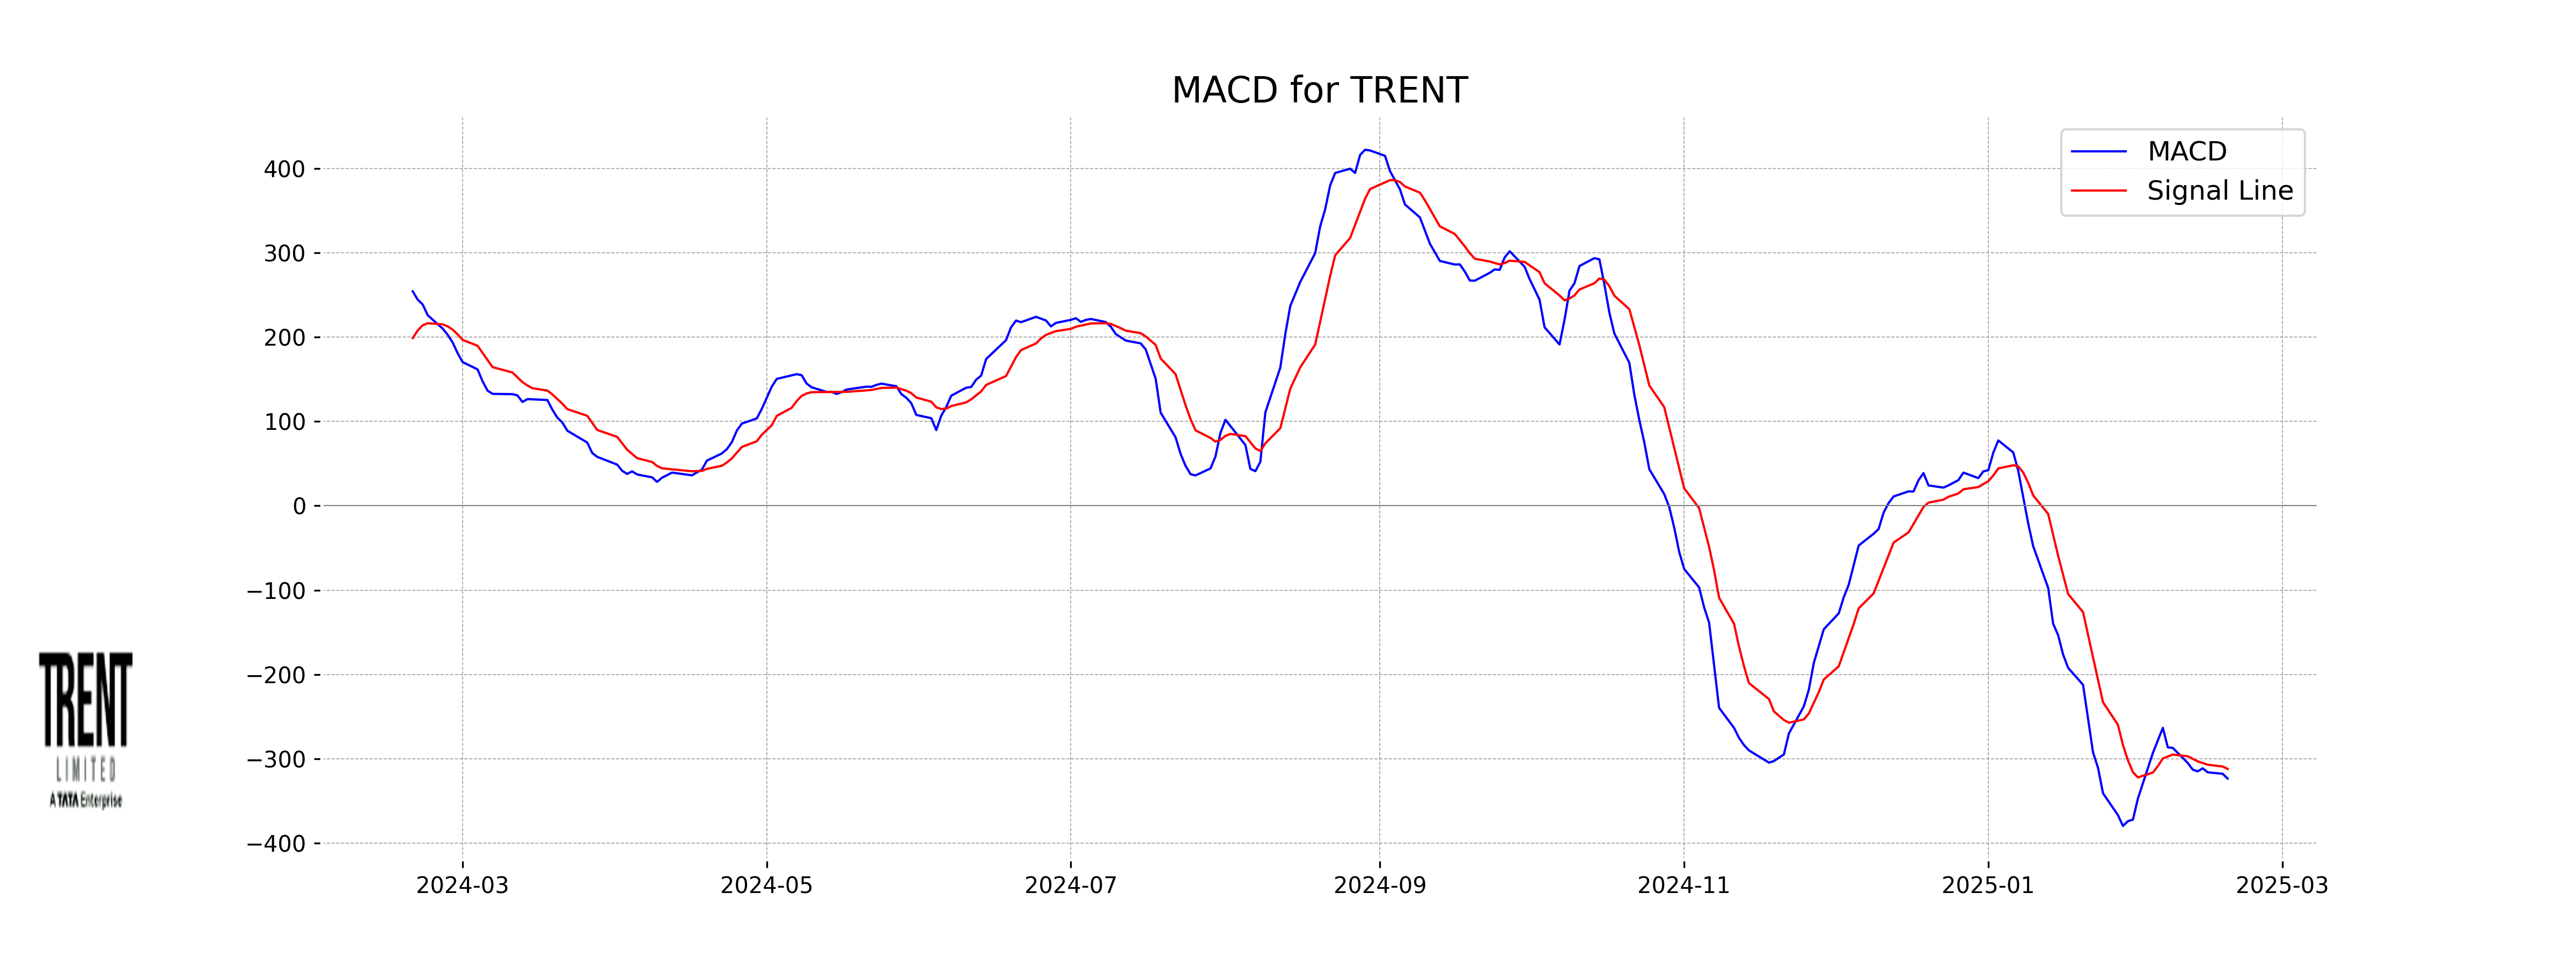
Moving Averages Trend (MACD)
Trent's MACD value of -323.34, which is below the MACD Signal value of -311.90, indicates bearish momentum in the stock. The negative MACD value suggests that the stock is currently in a downtrend, with potential for further downside if the trend continues.
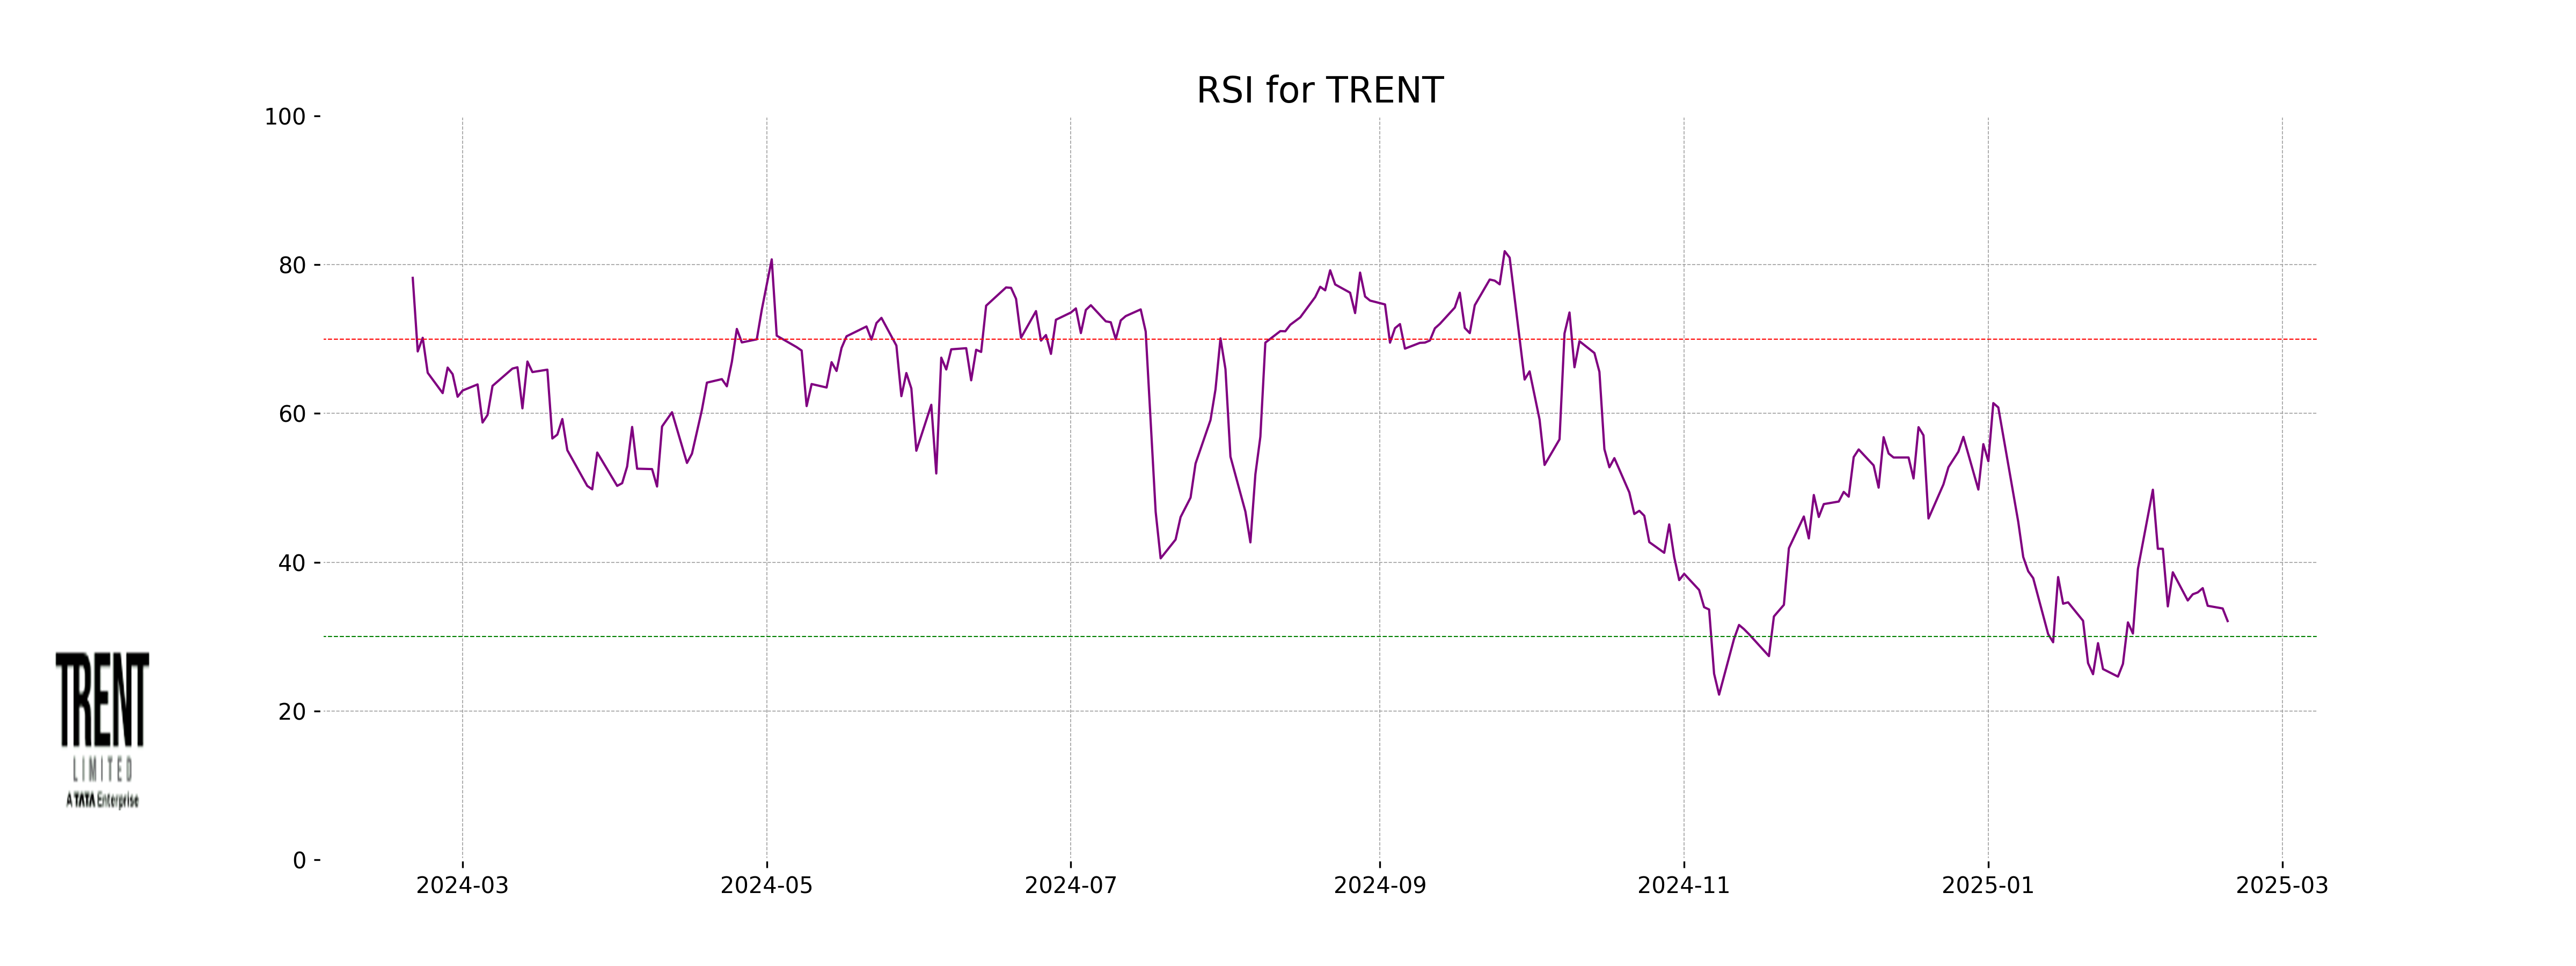
RSI Analysis
The current RSI for Trent is 32.09, which indicates that the stock is nearing oversold territory. This could suggest a potential buying opportunity if the downward trend reverses. However, further analysis and market conditions should be considered before making any investment decisions.
Analysis for UltraTech Cement - February 18, 2025

UltraTech Cement Performance: UltraTech Cement experienced a decline with a closing price of 11,308.90, down 1.58% from its previous close. The stock's trading volume was 268,788, and it is positioned above its 200-day EMA but slightly below its 50-day and 10-day EMAs. The RSI indicates relatively neutral momentum, while its MACD suggests the momentum may be declining.

Relationship with Key Moving Averages
UltraTech Cement's closing price of 11308.90 is below its 10-day EMA (11406.90) and 20-day EMA (11365.87), indicating short-term bearish momentum. However, it remains above the 200-day EMA (11001.88), suggesting a long-term upward trend.
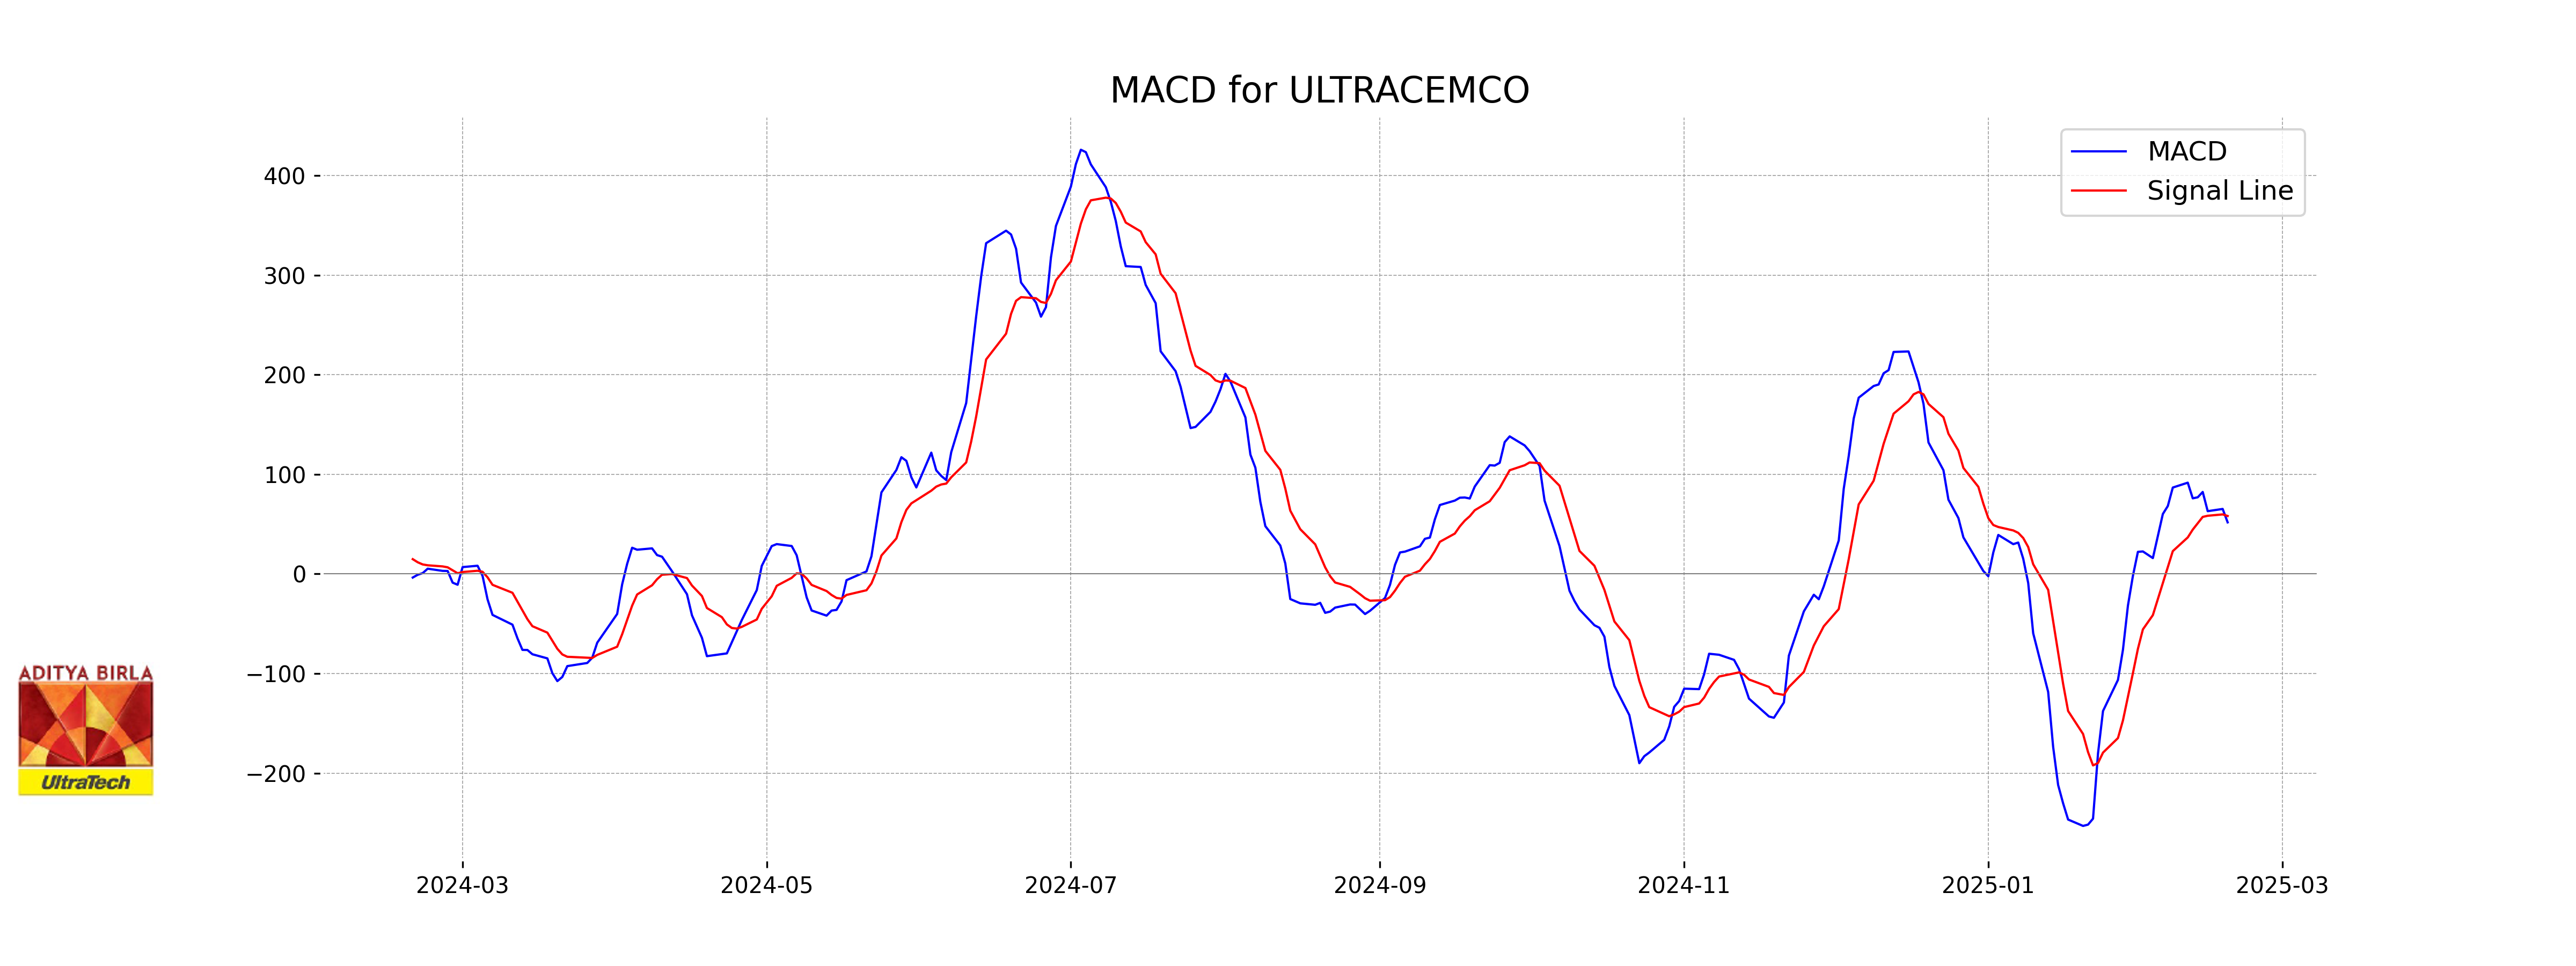
Moving Averages Trend (MACD)
UltraTech Cement's MACD value of 51.82 is below the MACD Signal line at 58.21, suggesting a bearish signal. This indicates that the stock price might experience some downward pressure in the short term.
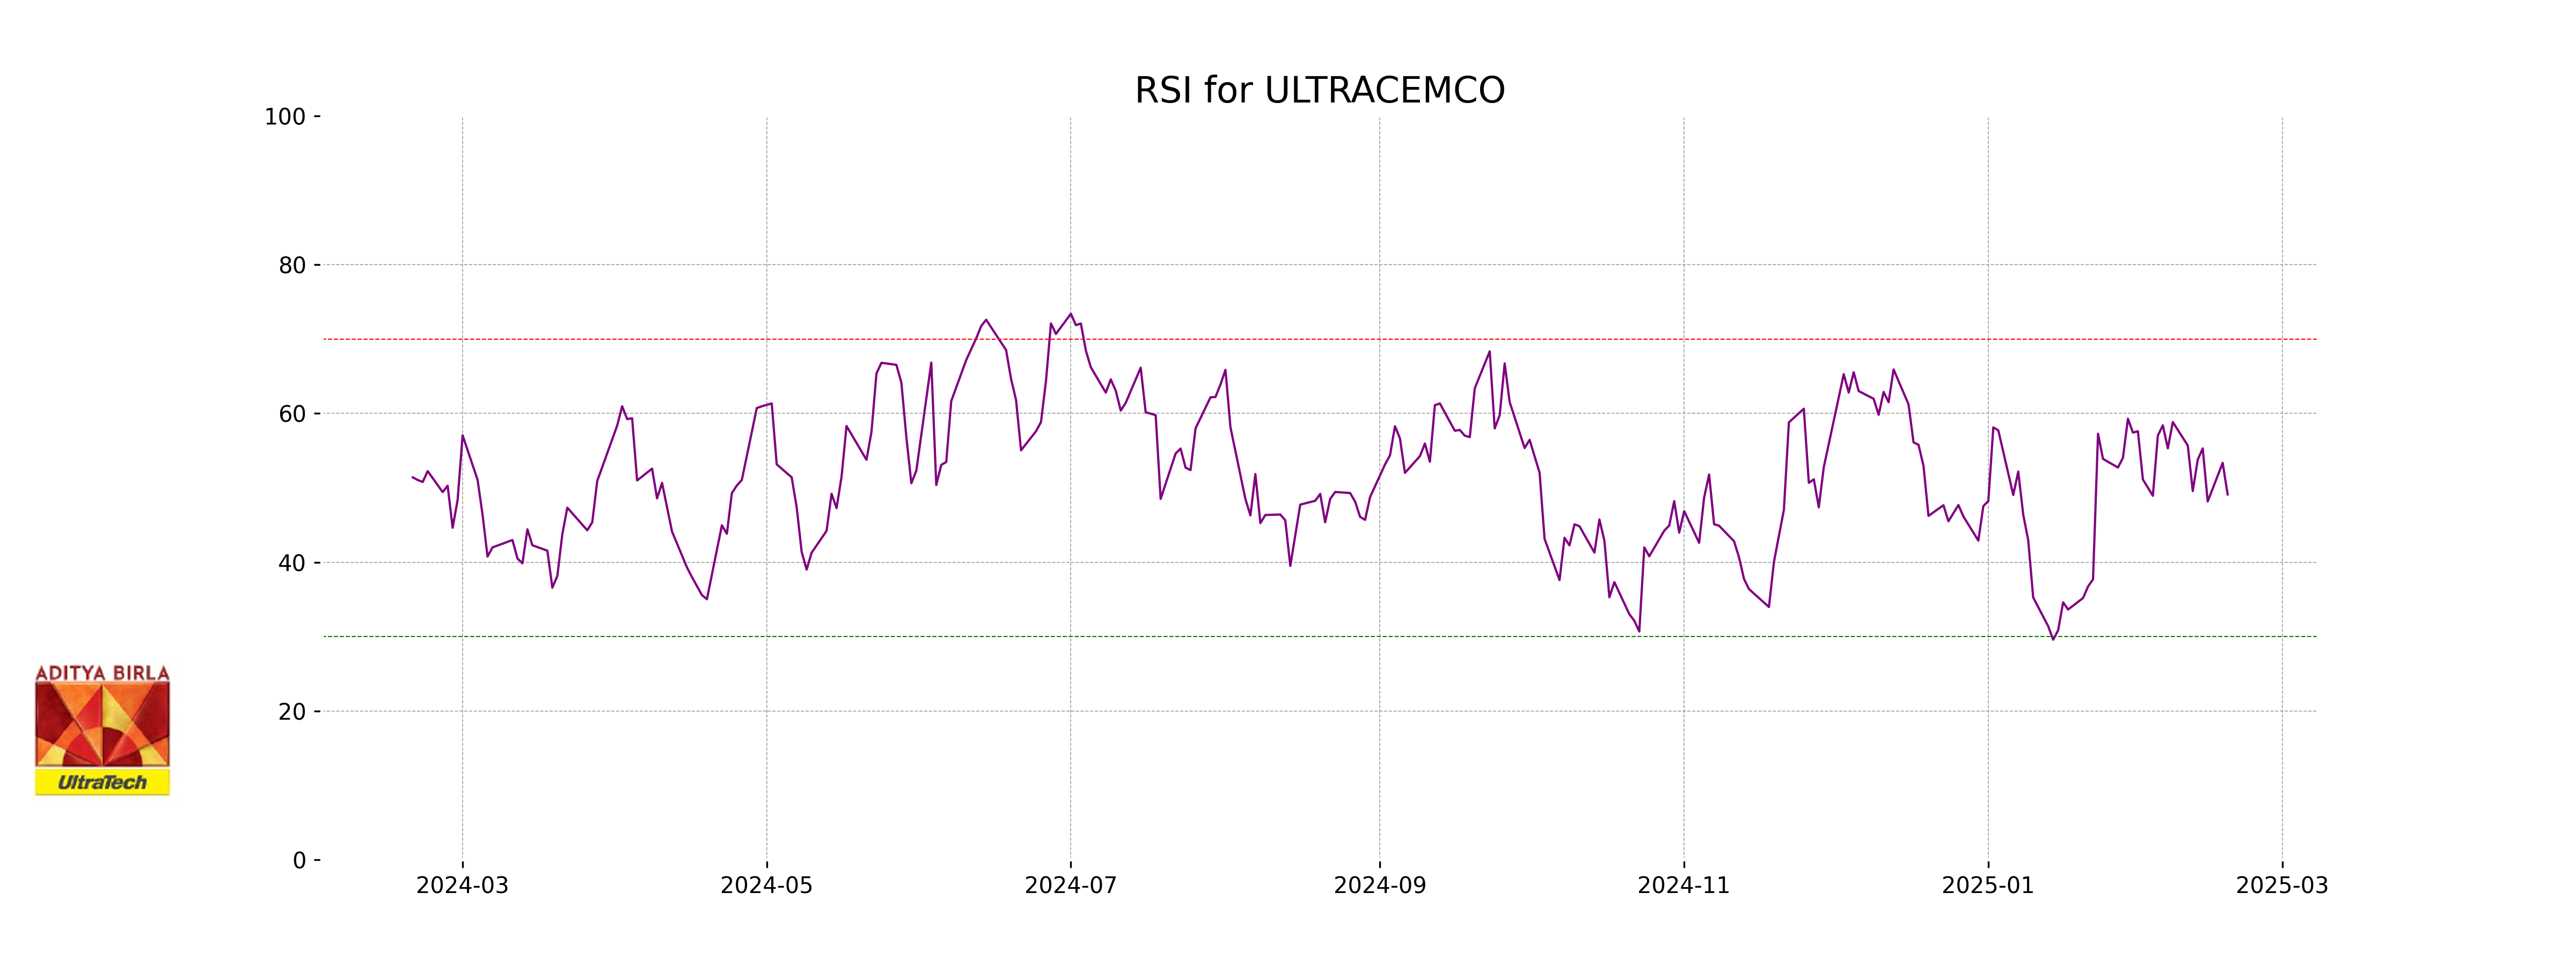
RSI Analysis
UltraTech Cement's current RSI (Relative Strength Index) is 49.11, which indicates a neutral momentum, as it is approximately halfway between the typical overbought (above 70) and oversold (below 30) levels. This suggests there is no strong trend in the stock's momentum at the moment.