NSE Nifty 50: Top 5 stock losers of February 17, 2025
In this article, we will explore the technical indicators of some of the low-performing stocks on the Indian stock market, including BHARTIARTL, INFY, M&M, TCS, and WIPRO.
By looking at these stocks through the lens of key technical factors, we aim to better understand their price movements, trends, and potential future performance.

Analysis for Bharti Airtel - February 17, 2025
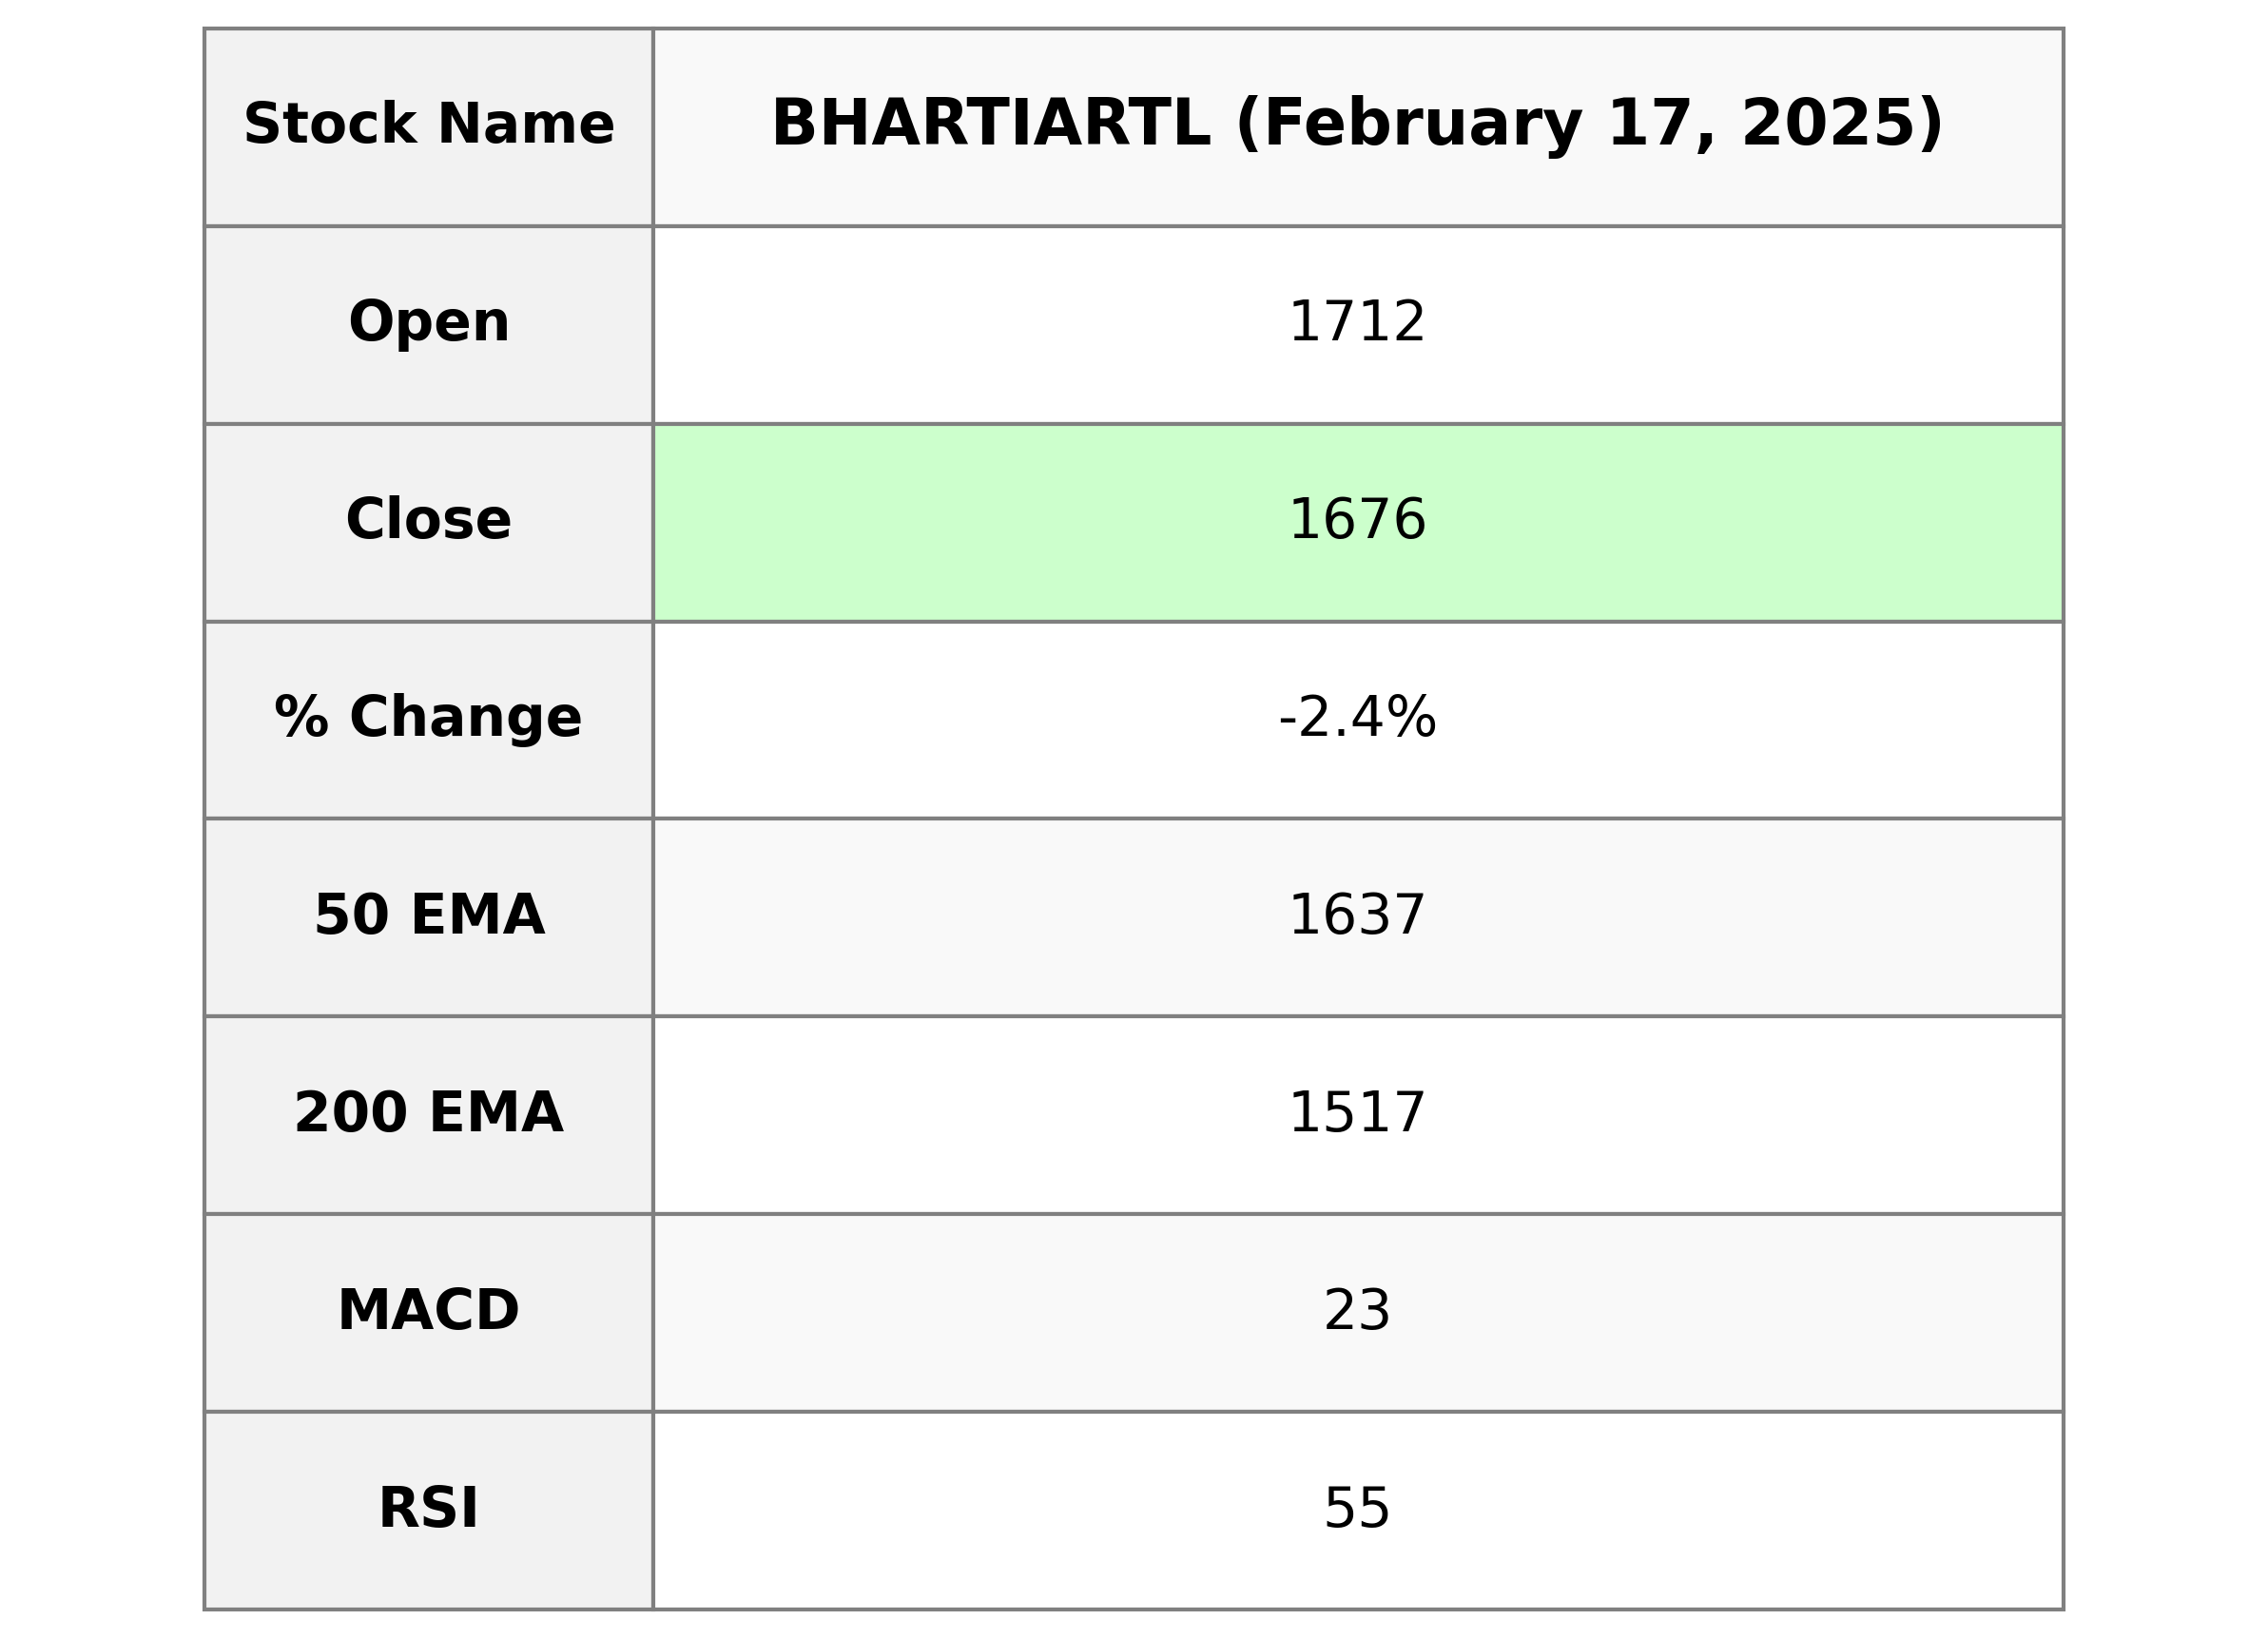
**Bharti Airtel Performance:** Bharti Airtel experienced a negative price change of -2.42% with its current closing price at 1675.55, down from the previous close of 1717.05. The company operates in the Communication Services sector, specifically within Telecom Services, in India. Despite a broad EMA support, the stock's RSI stands at 54.66, indicating moderate momentum, while the MACD suggests a bullish crossover trend.
Relationship with Key Moving Averages
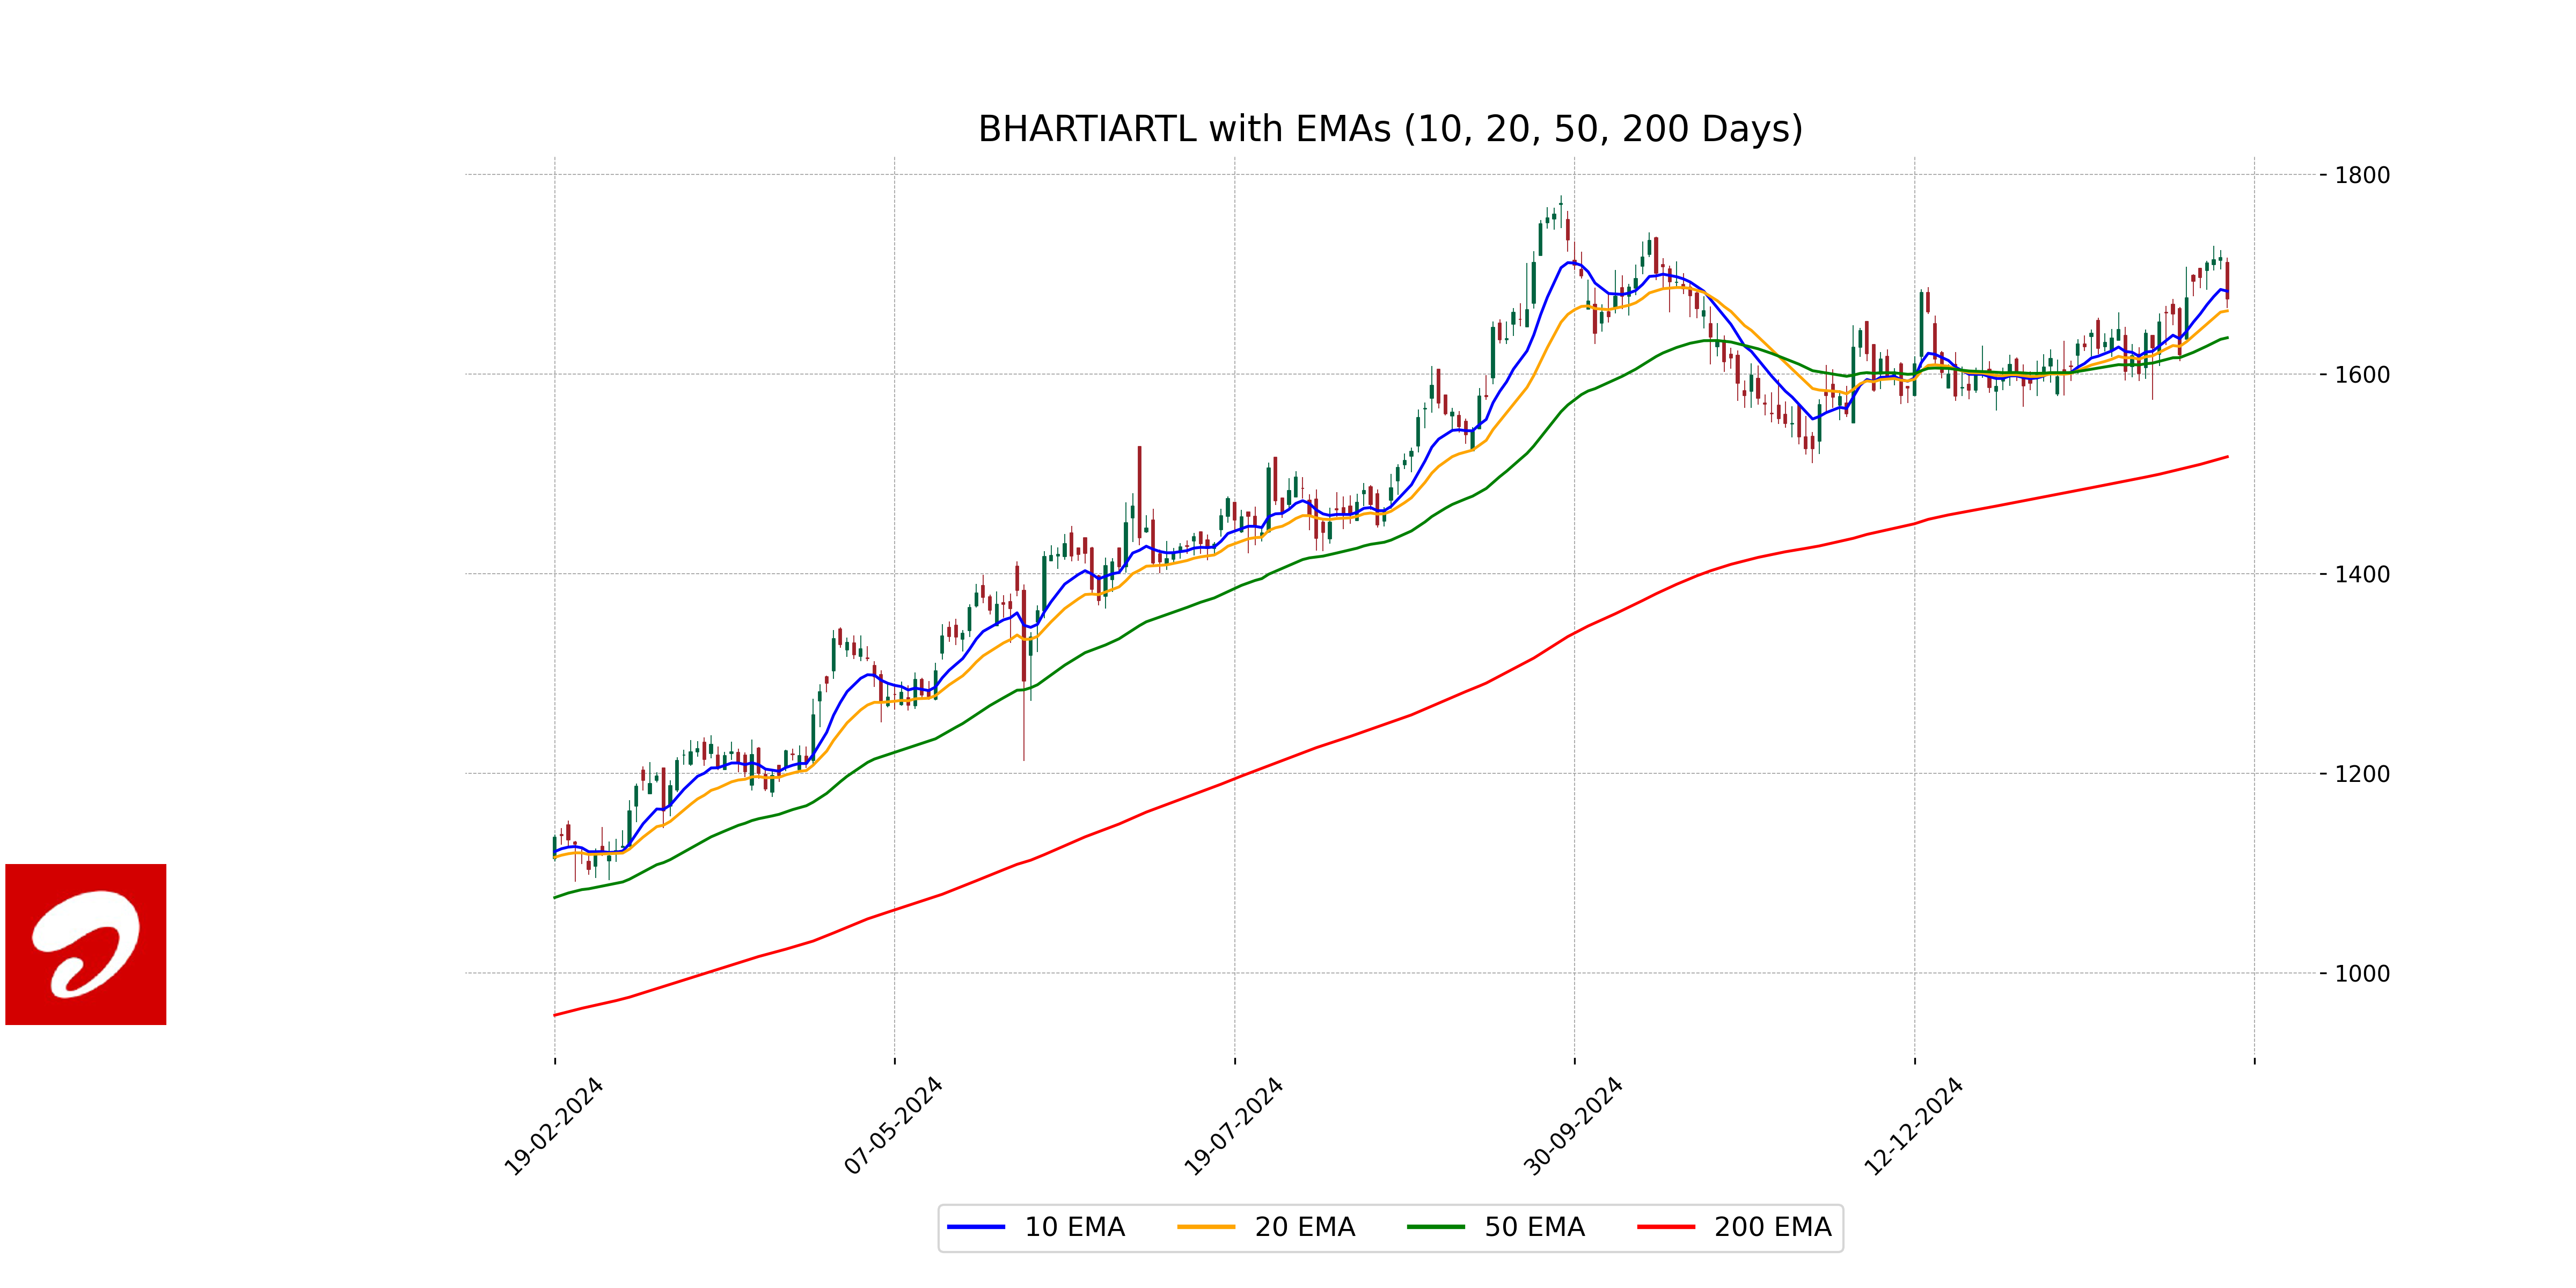
Bharti Airtel's current close price of 1675.55 is below the 10 EMA of 1683.20 and slightly above the 20 EMA of 1663.47, indicating short-term weakness but holding above a medium-term support. The stock remains above the 50 EMA of 1636.52 and significantly higher than the 200 EMA of 1517.28, suggesting a long-term uptrend.
Moving Averages Trend (MACD)
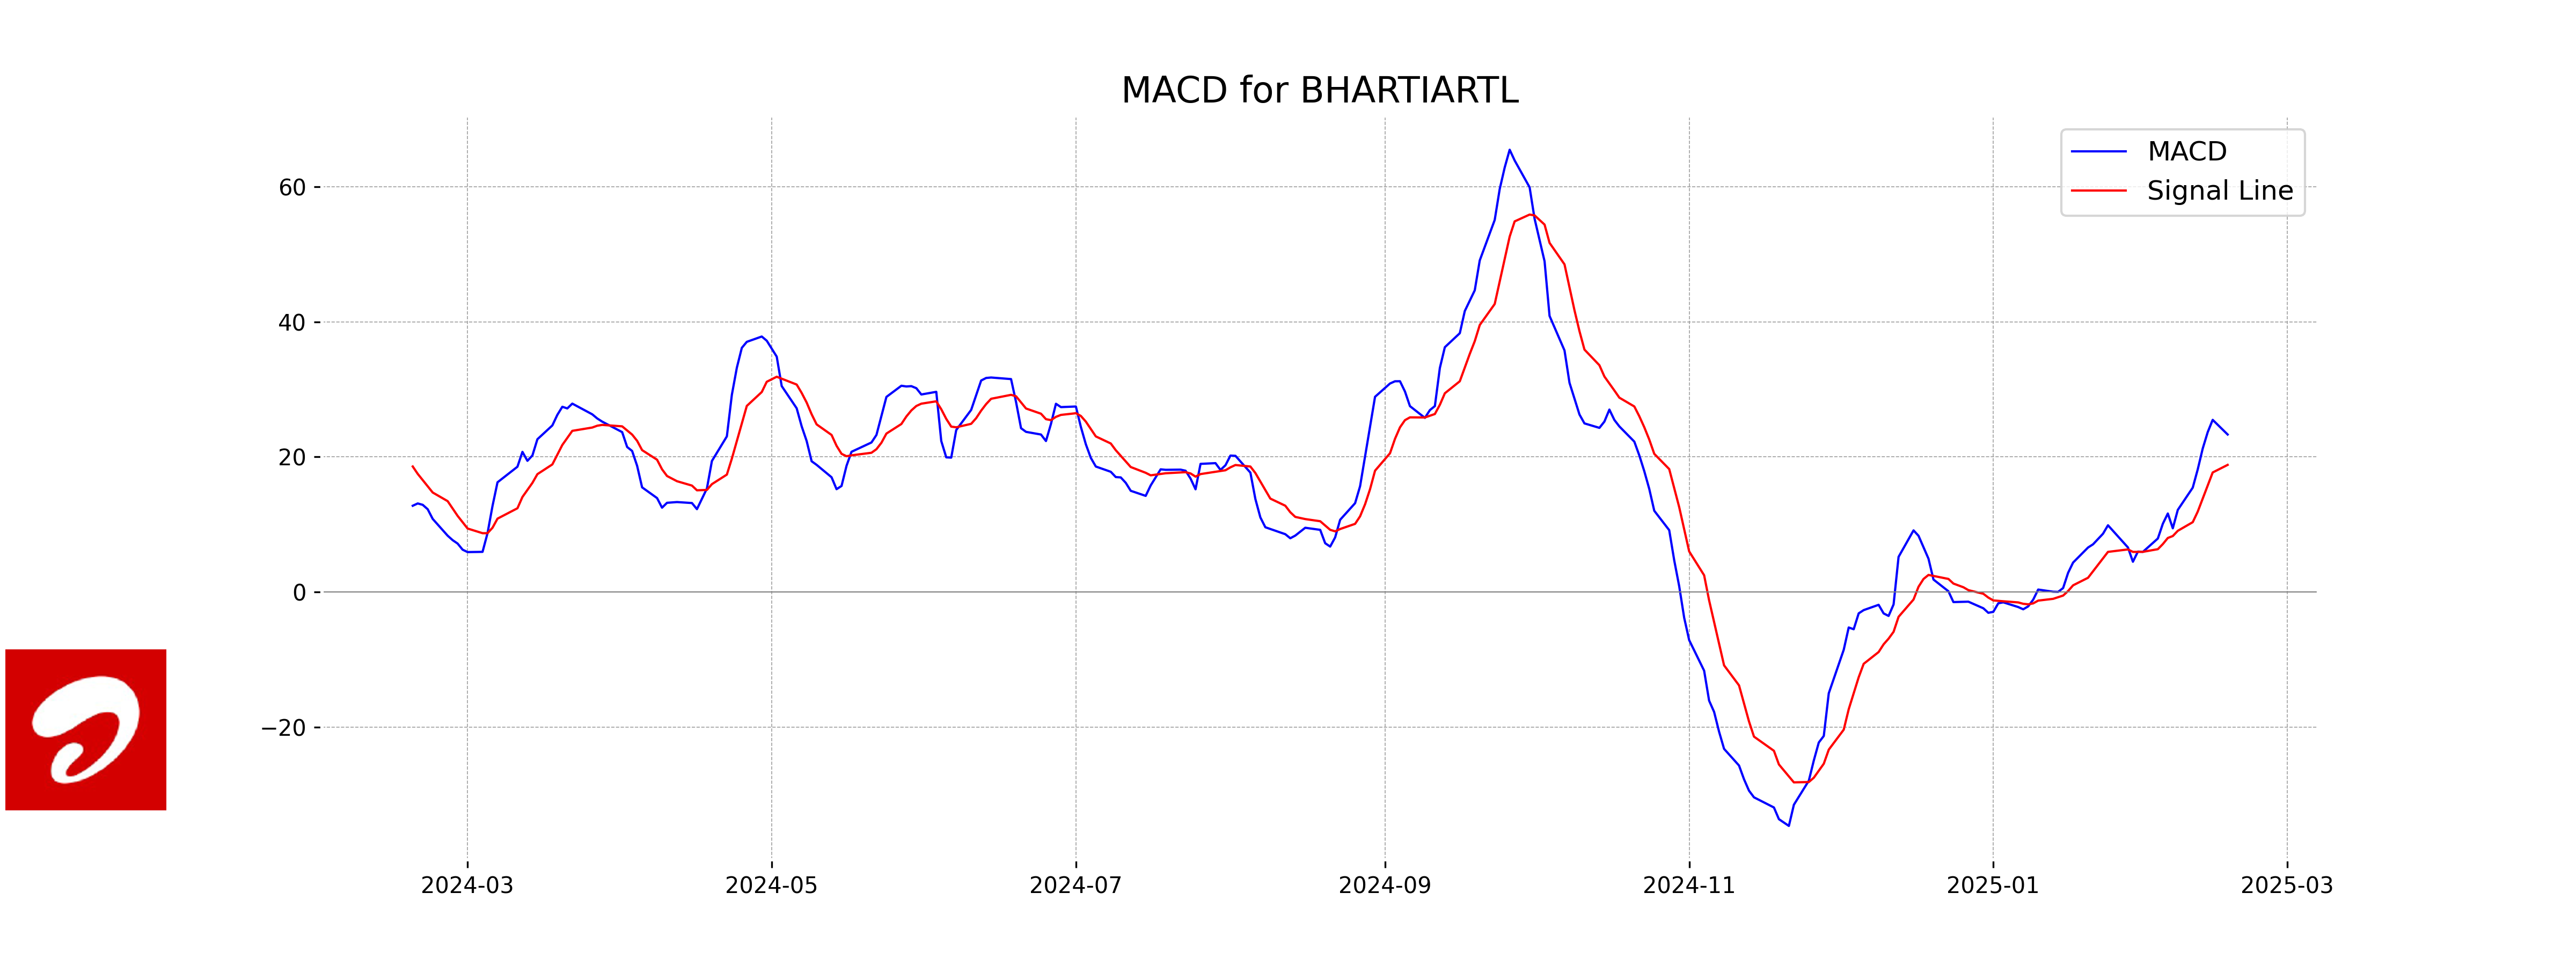
**MACD Analysis for Bharti Airtel** The MACD value for Bharti Airtel is 23.31, and the signal line is at 18.82, indicating a positive divergence. This suggests bullish momentum and the potential for upward price movement.
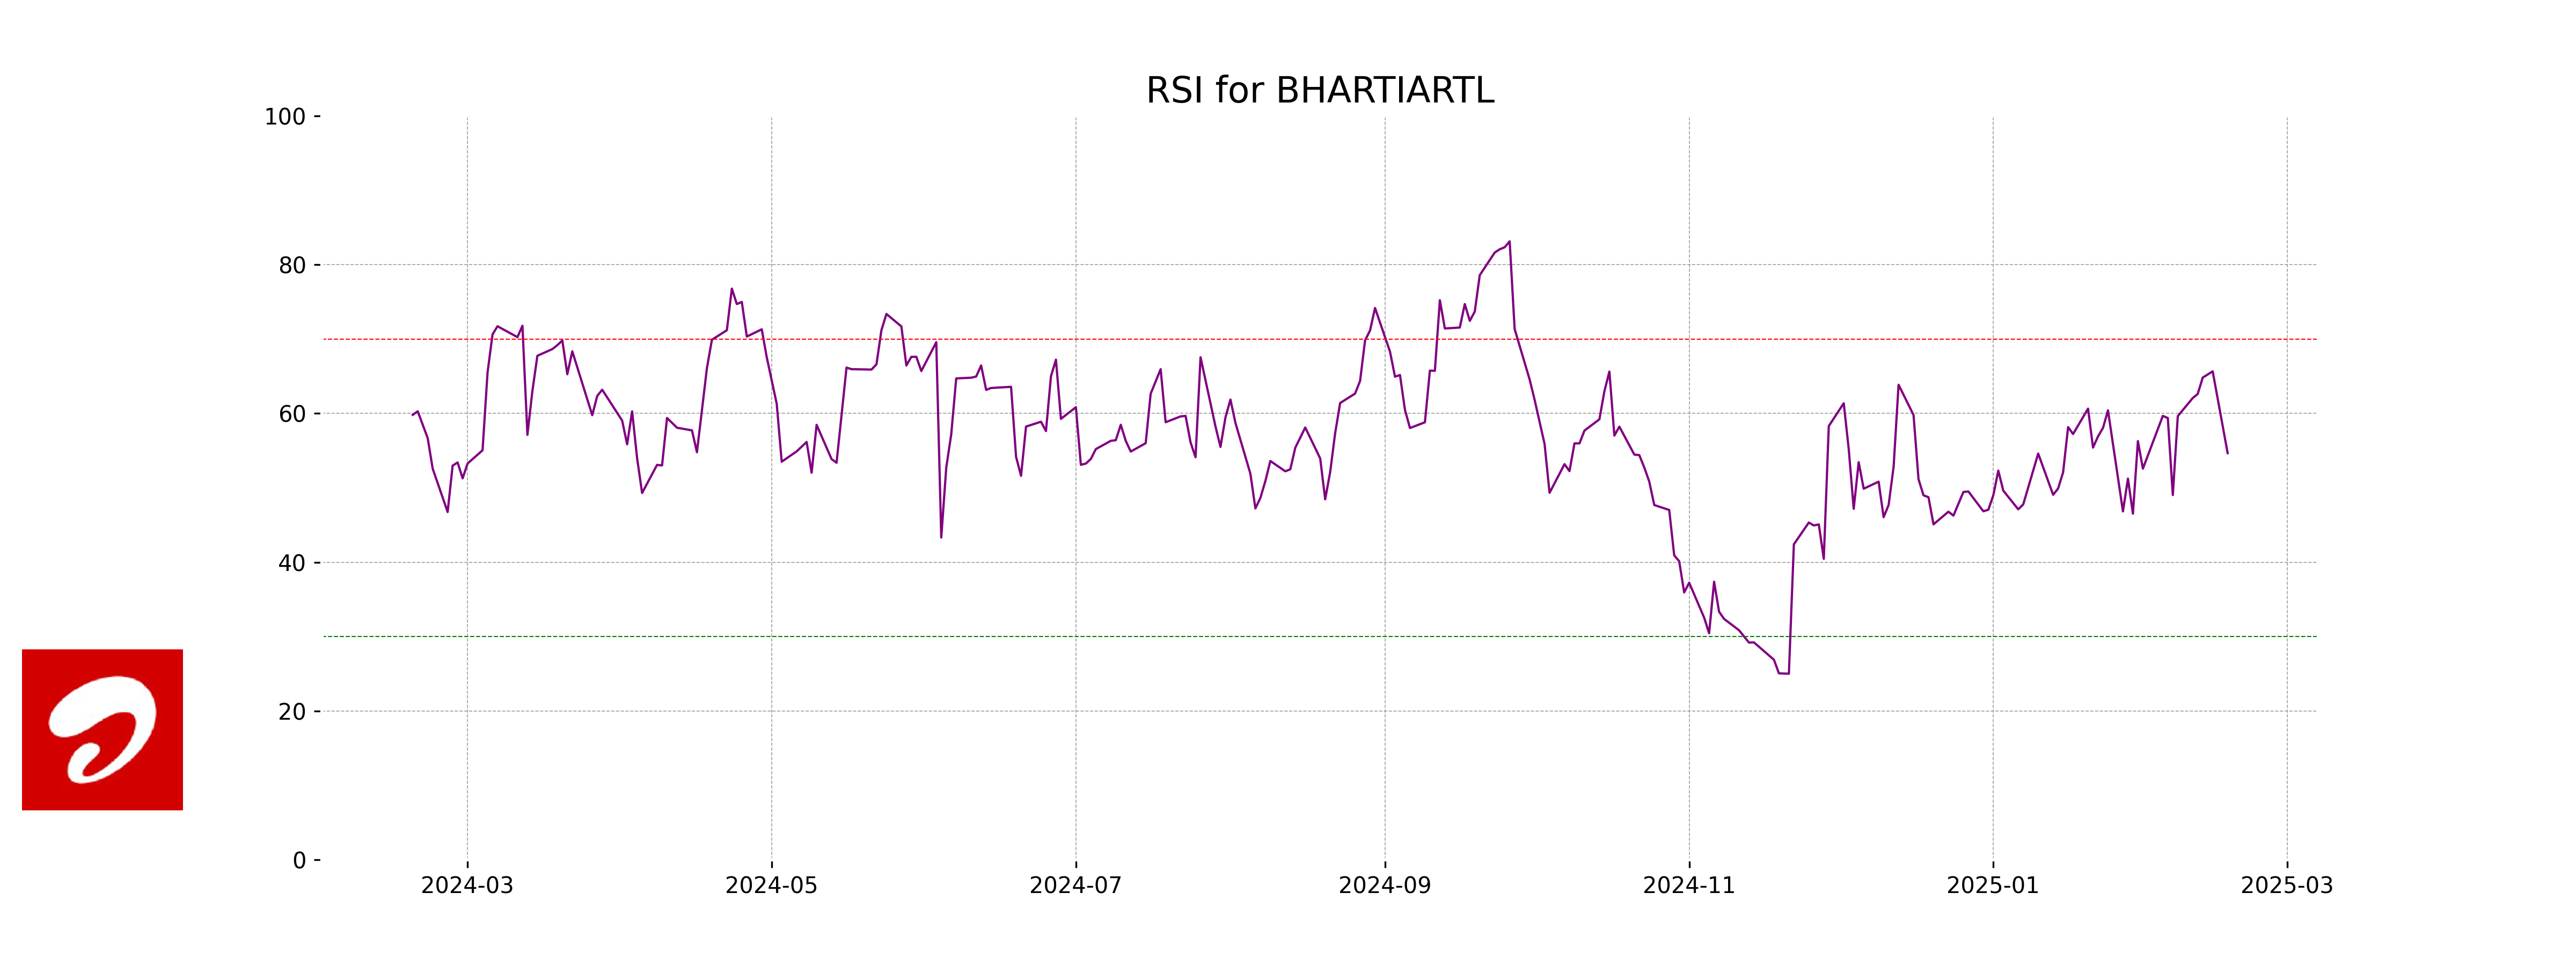
RSI Analysis
The RSI (Relative Strength Index) for Bharti Airtel is 54.66. This indicates a neutral market sentiment as the RSI value is close to 50, suggesting that the stock is neither overbought nor oversold at this point. Investors may look for further market signals before making trading decisions.
Analysis for Infosys - February 17, 2025
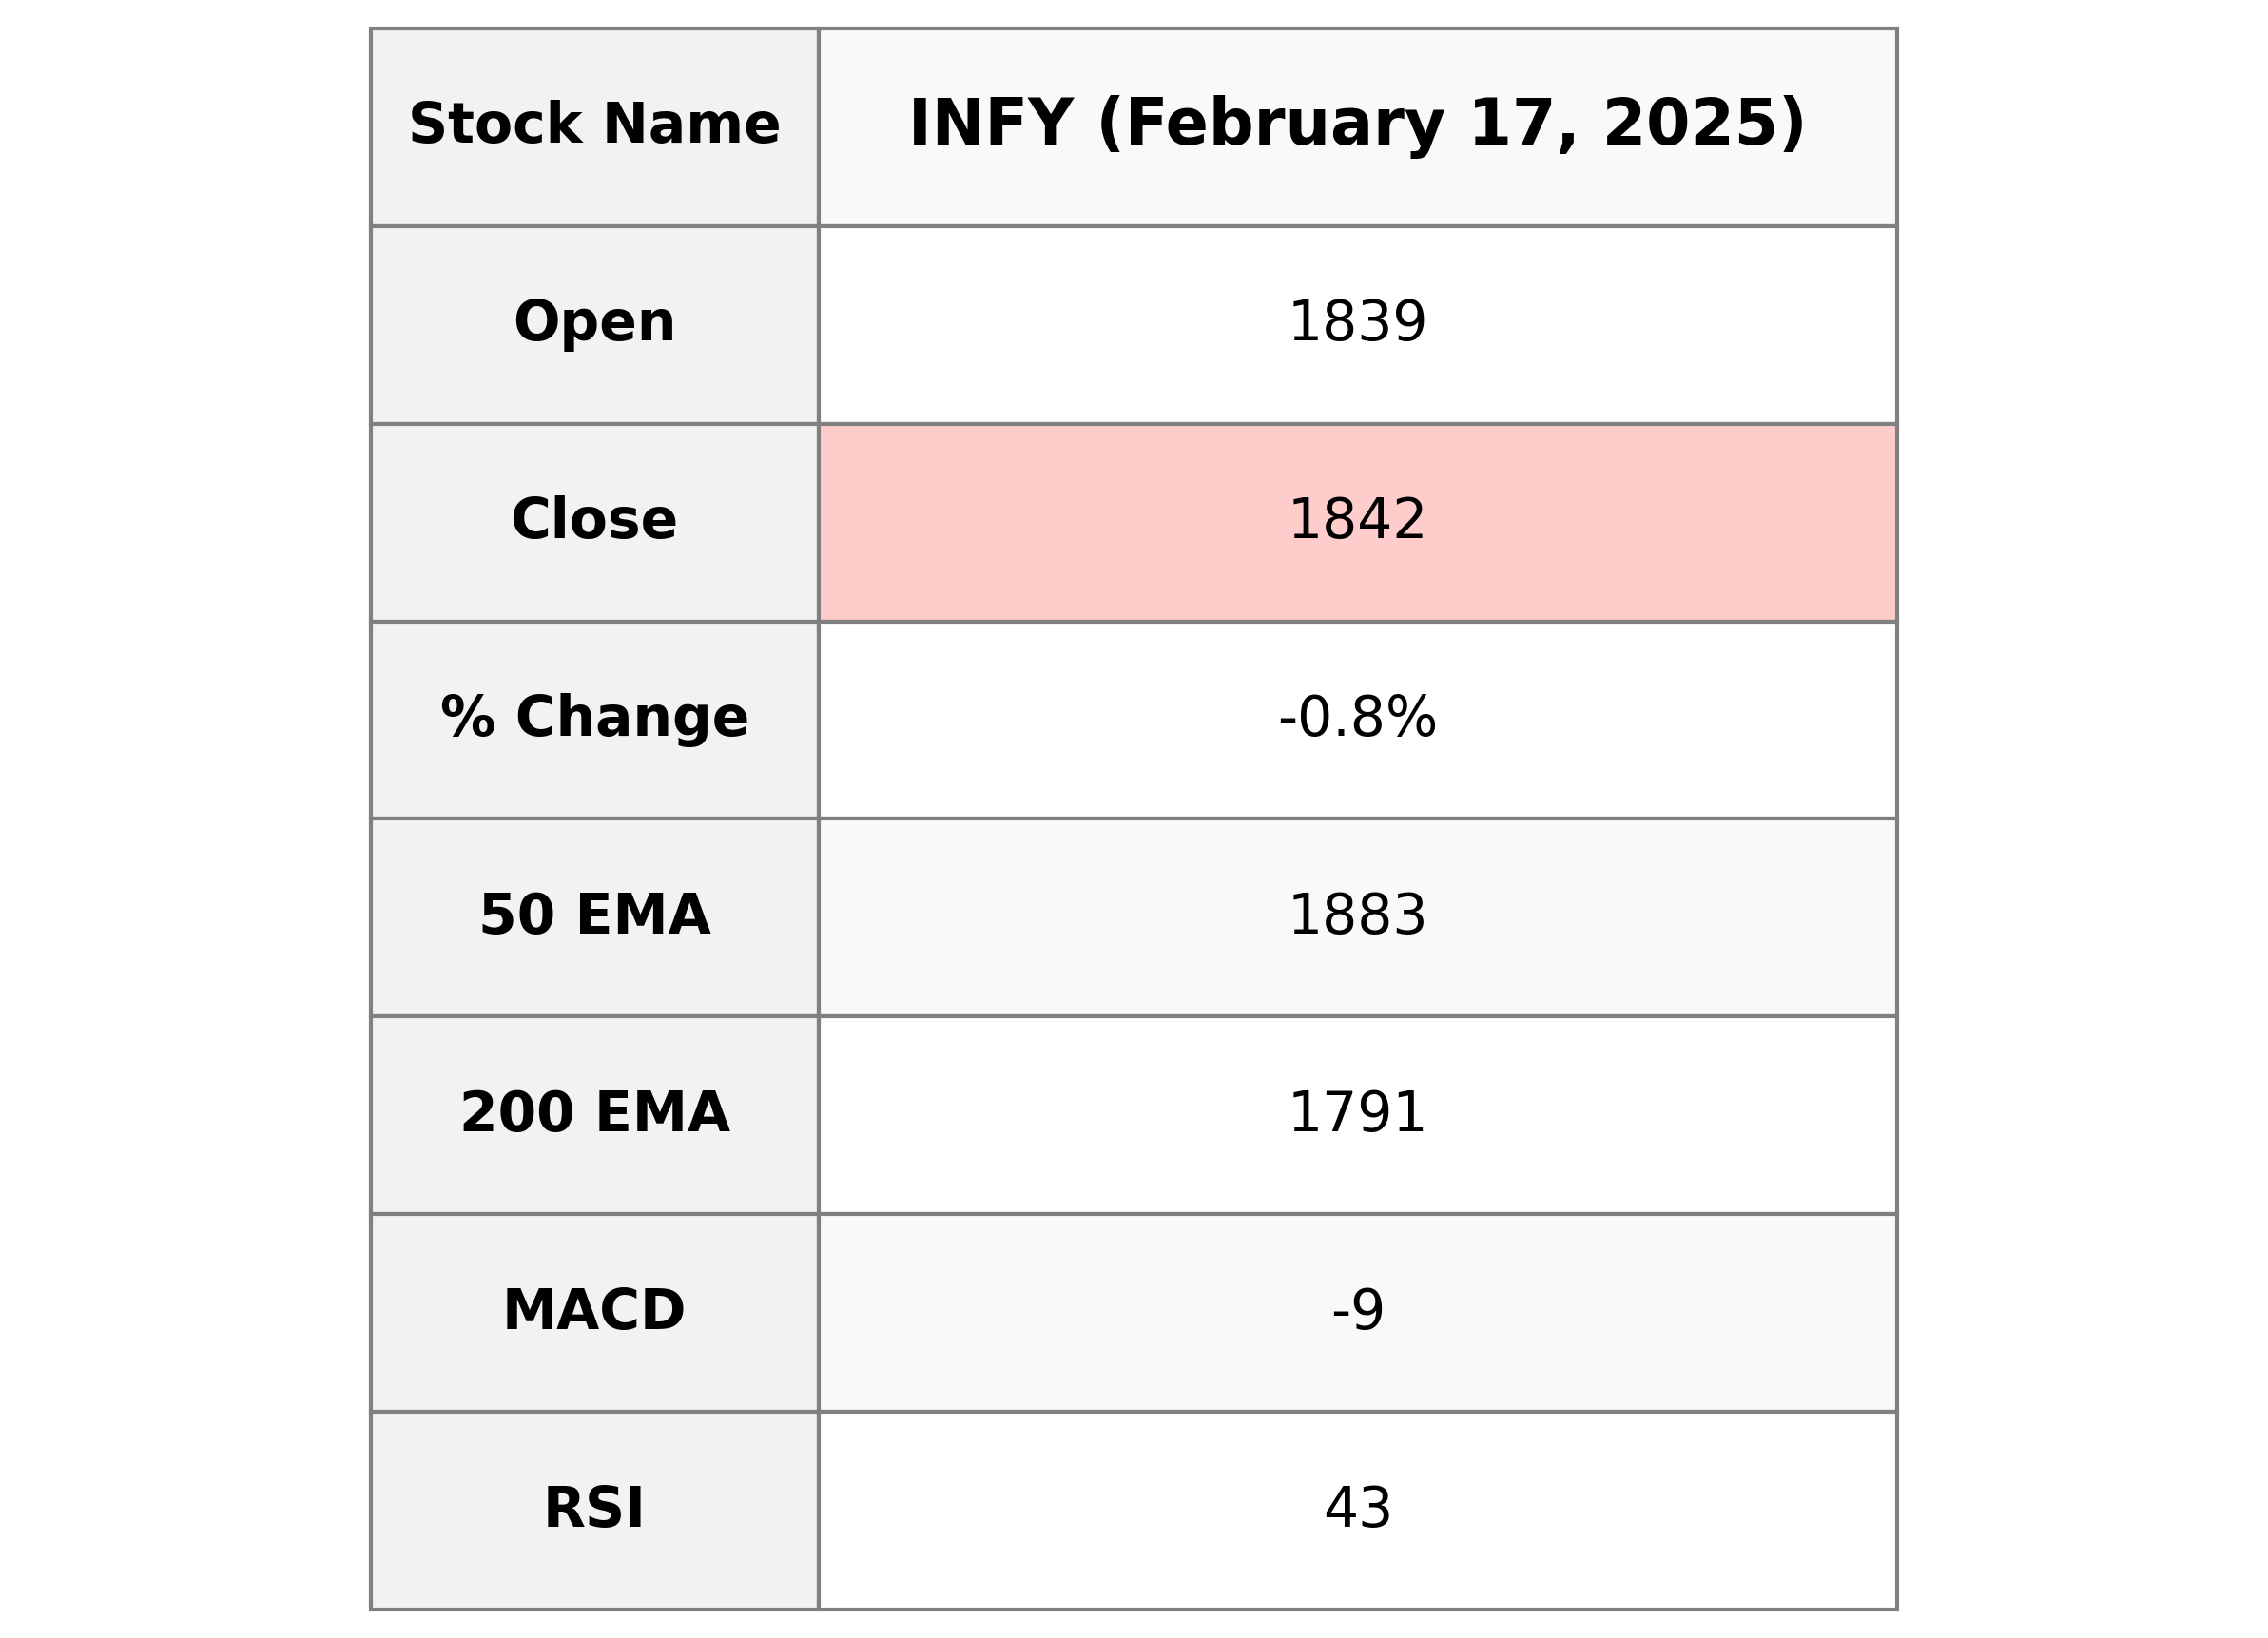
Infosys witnessed a slight decline in stock performance with a closing price of 1842.30, marking a 0.76% decrease from the previous close. The trading volume was roughly 4.43 million shares. The stock is trading below technical indicators such as the 50 EMA and 10 EMA, and the RSI indicates a relatively neutral market sentiment. Based in India, Infosys operates in the Technology sector, specifically in Information Technology Services.
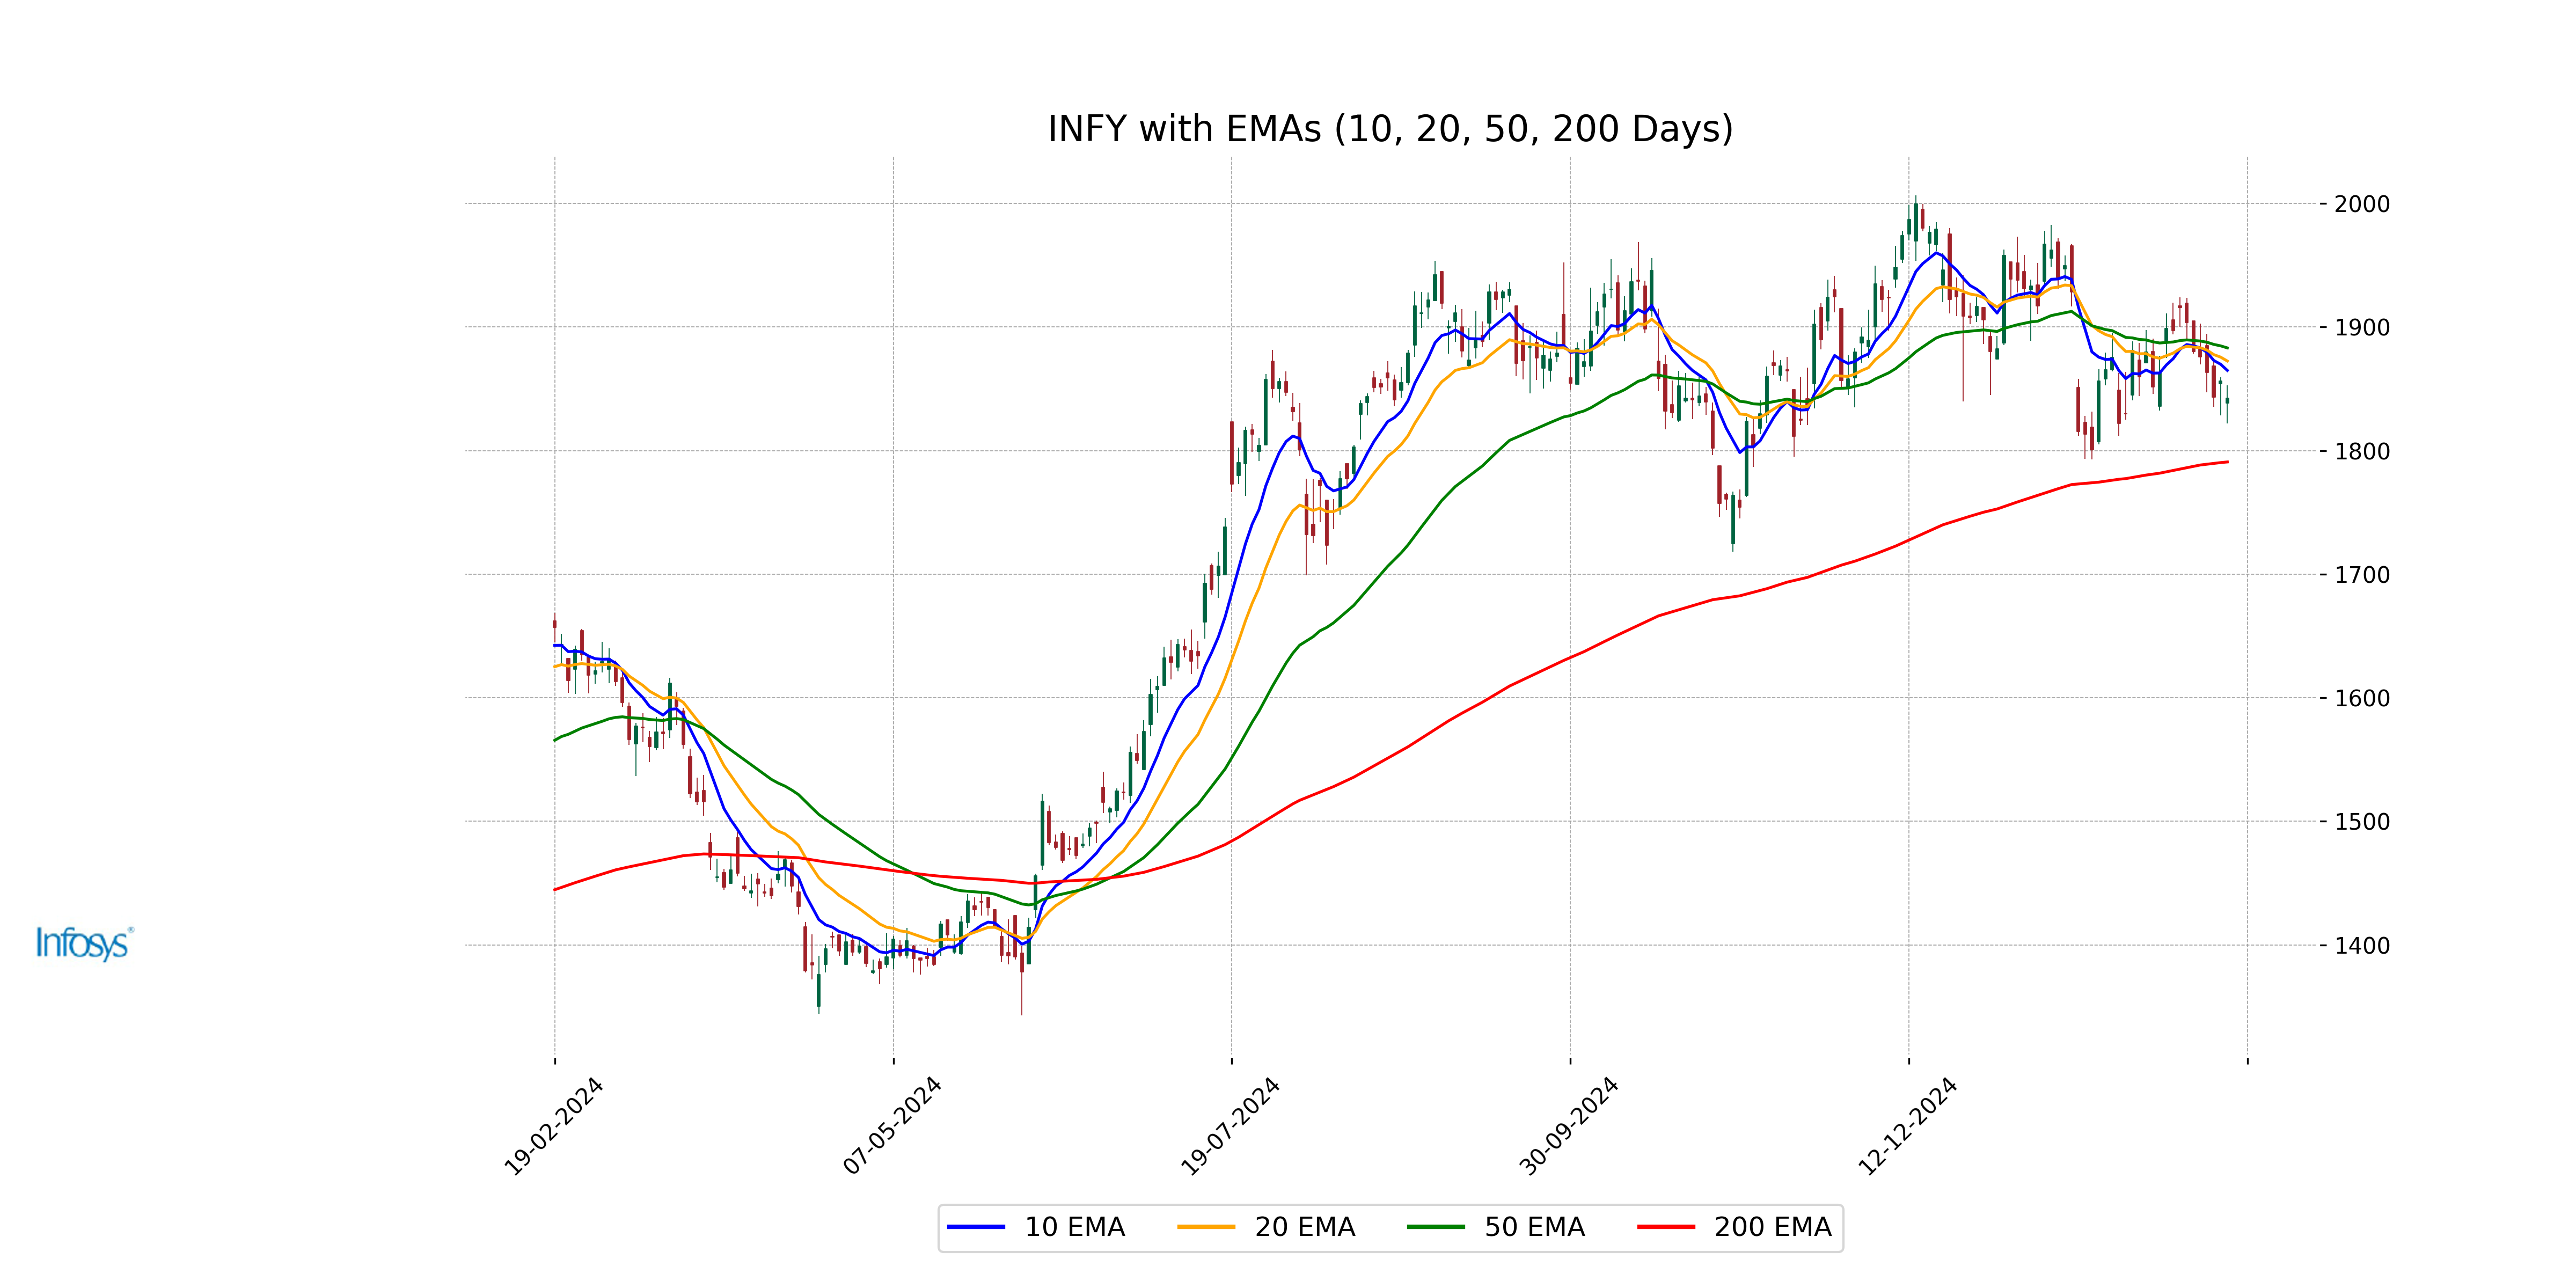
Relationship with Key Moving Averages
Infosys closed at 1842.30, which is below its 50-day EMA of 1883.13 and the 10-day EMA of 1864.90, indicating potential short-term bearish sentiment. However, it's still above the 200-day EMA of 1790.82, suggesting overall long-term trend support remains intact.
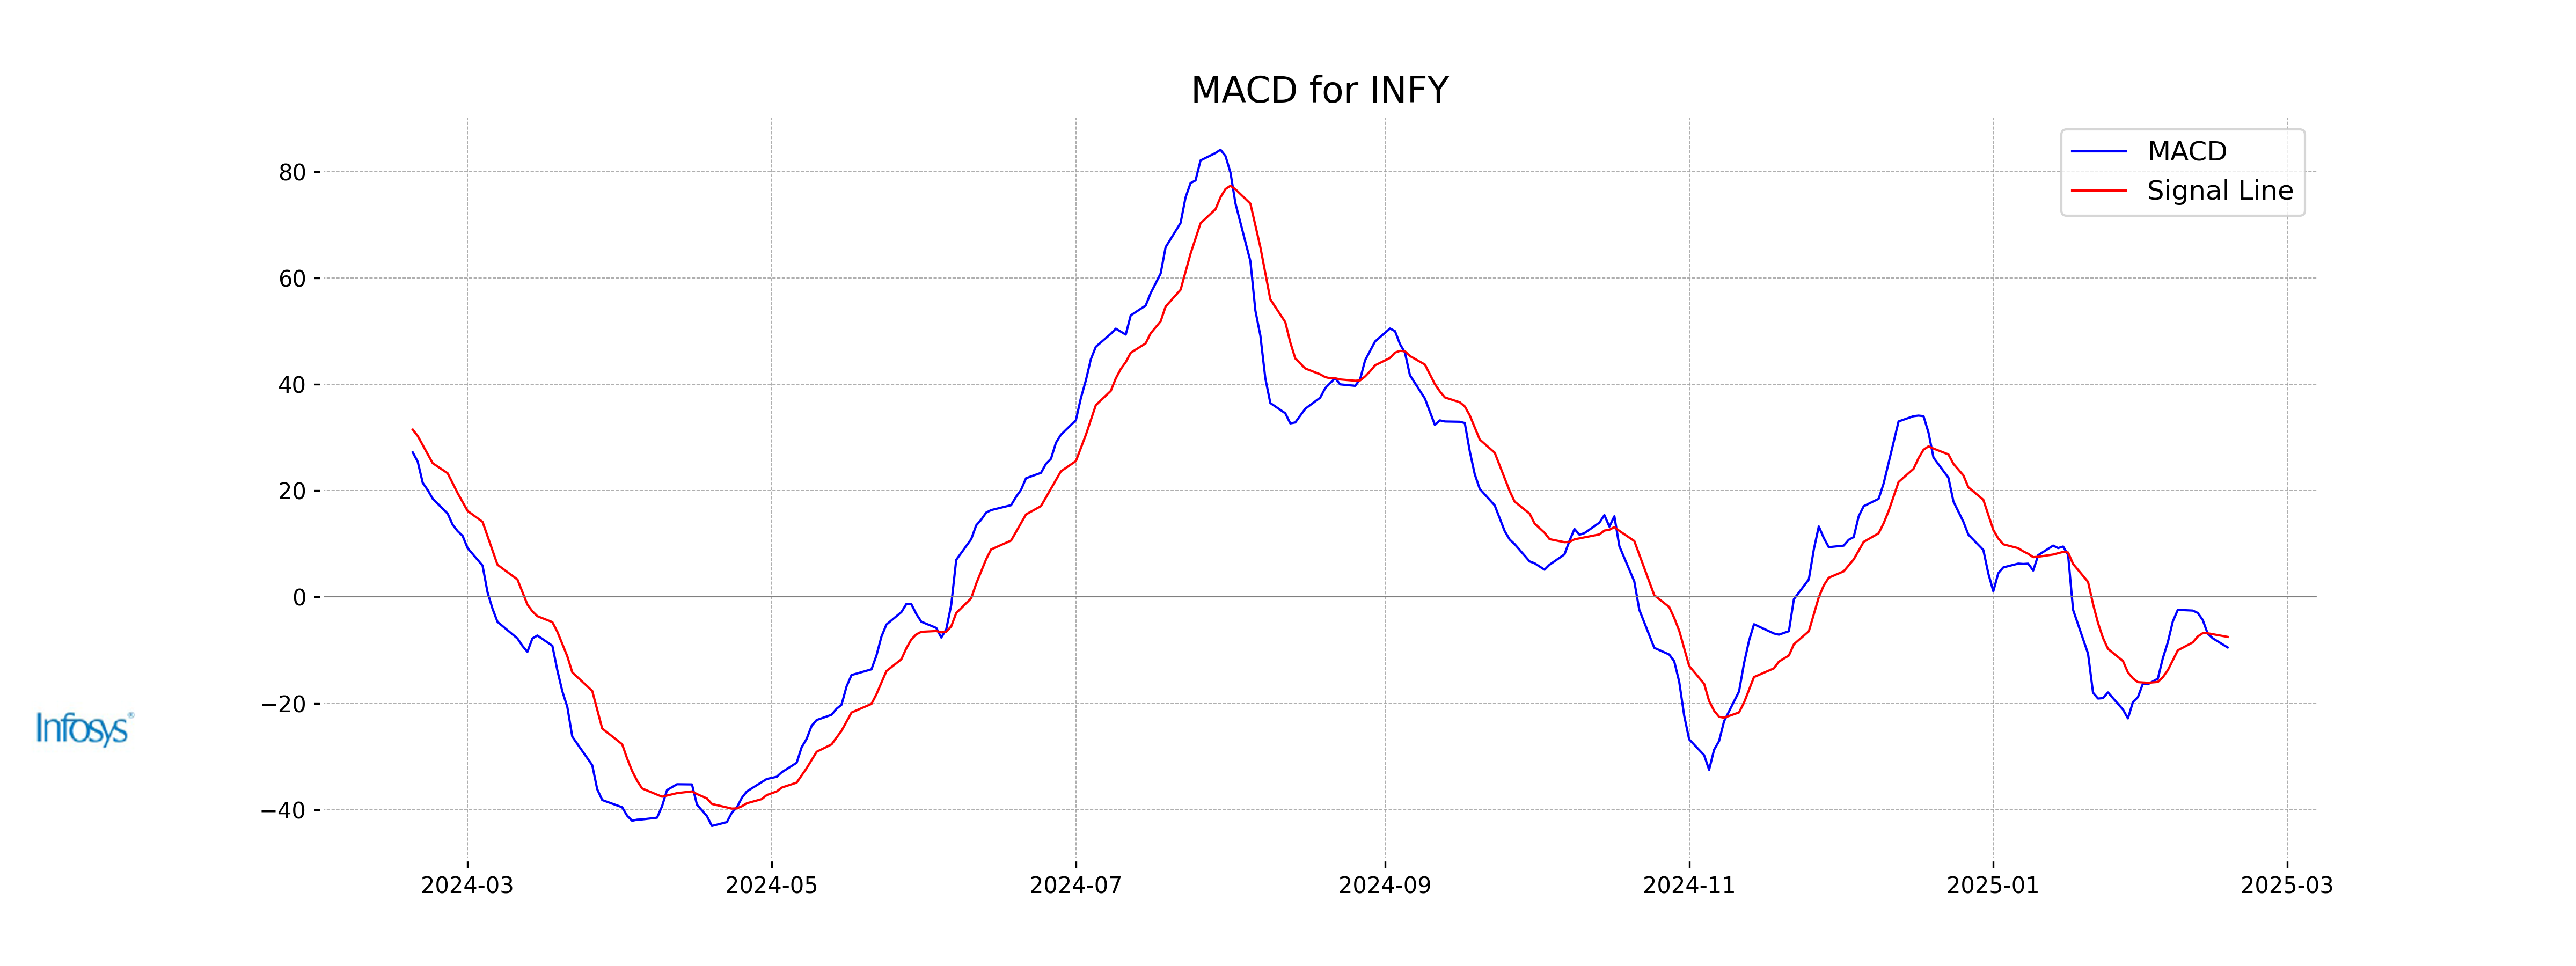
Moving Averages Trend (MACD)
The MACD for Infosys is at -9.48, indicating a bearish momentum as it is below the signal line, which is at -7.50. This suggests that the stock might be experiencing downward pressure currently.
RSI Analysis
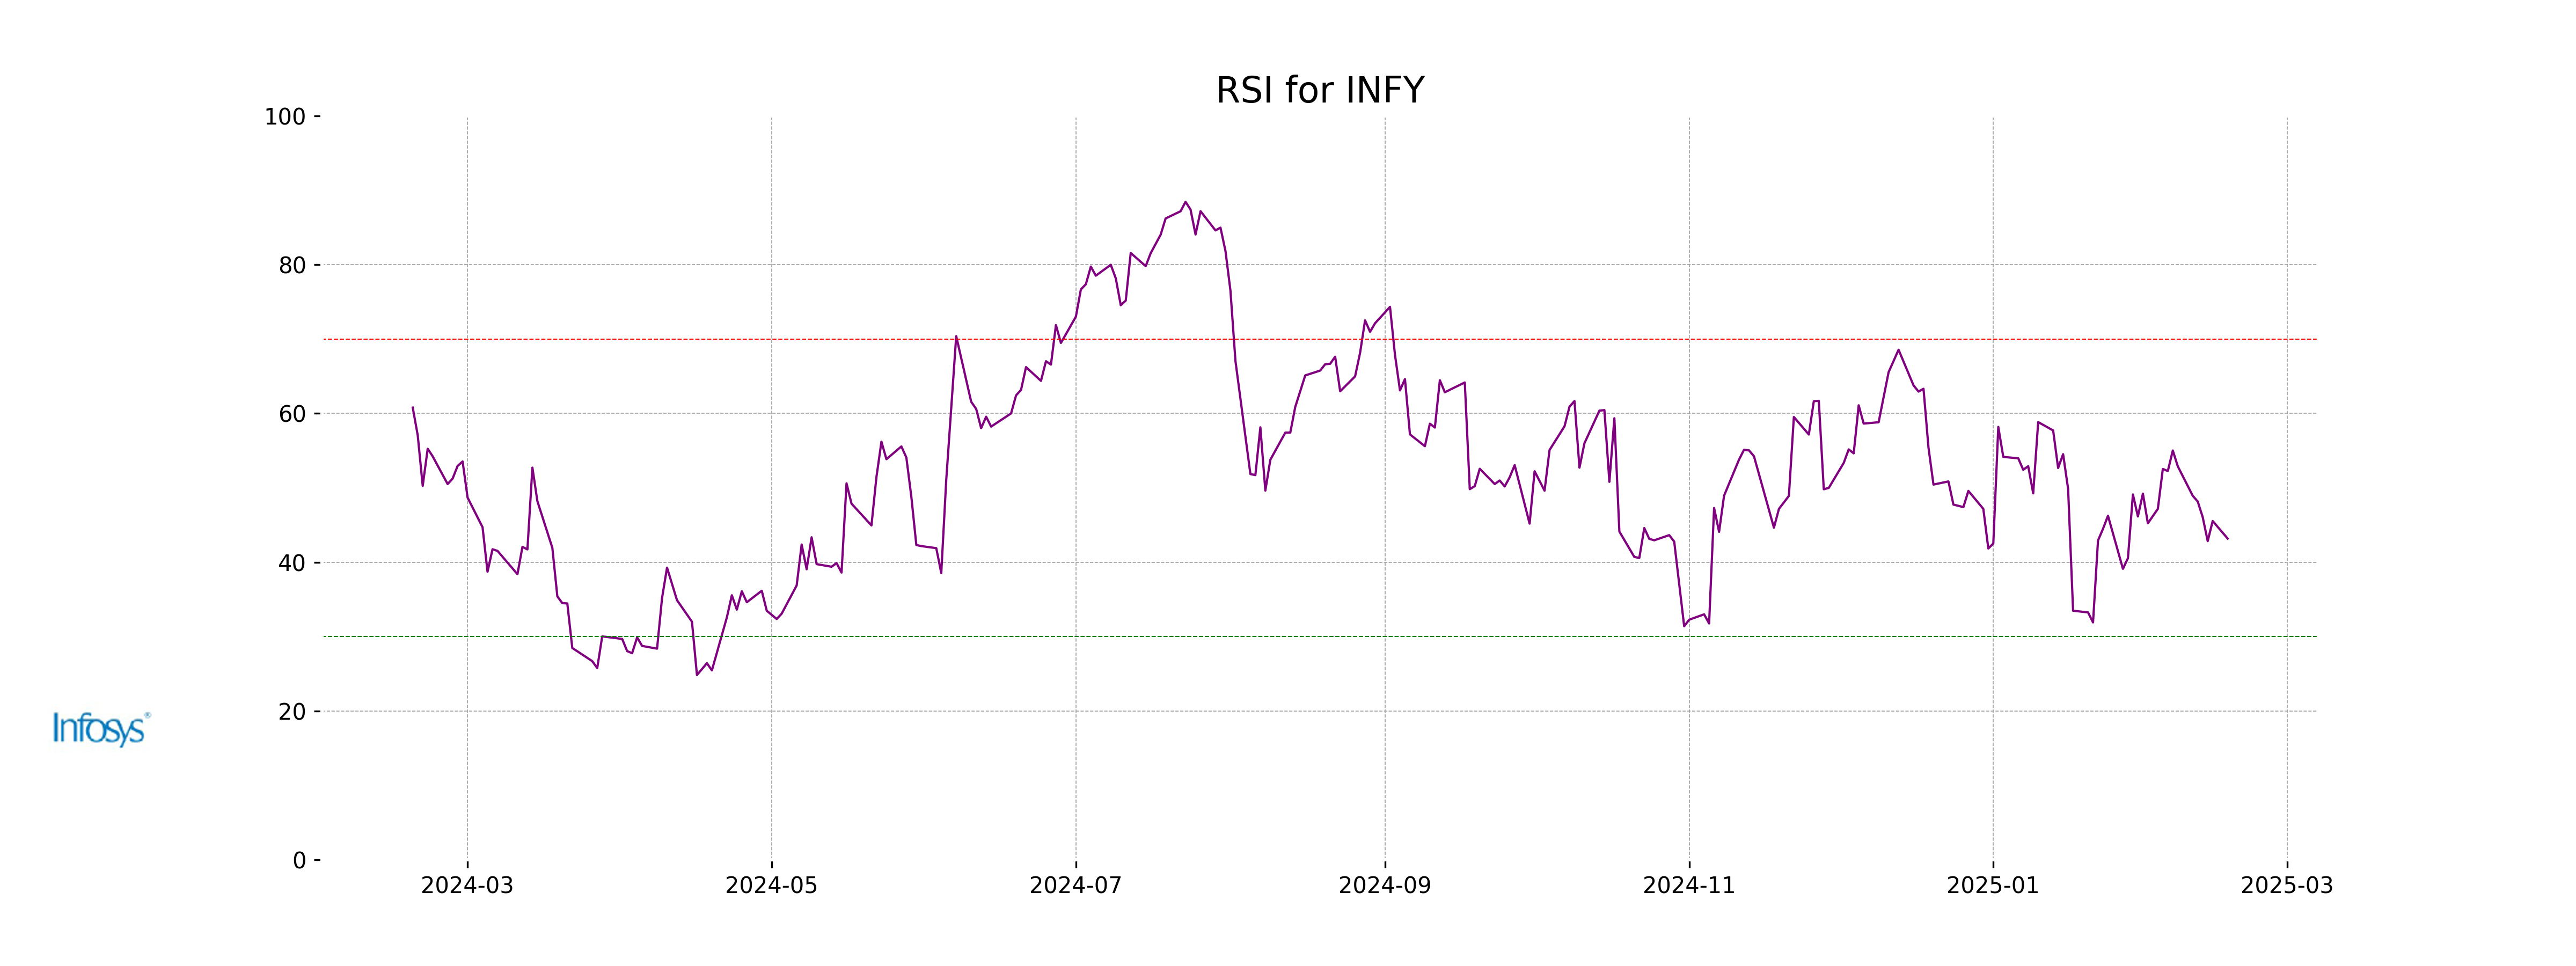
The RSI for Infosys is 43.18, which indicates that the stock is in a neutral zone, somewhat closer to being oversold. Typically, an RSI below 30 is considered oversold, while above 70 is considered overbought; hence, this suggests a need for monitoring the trend closely.
Analysis for Mahindra & Mahindra - February 17, 2025
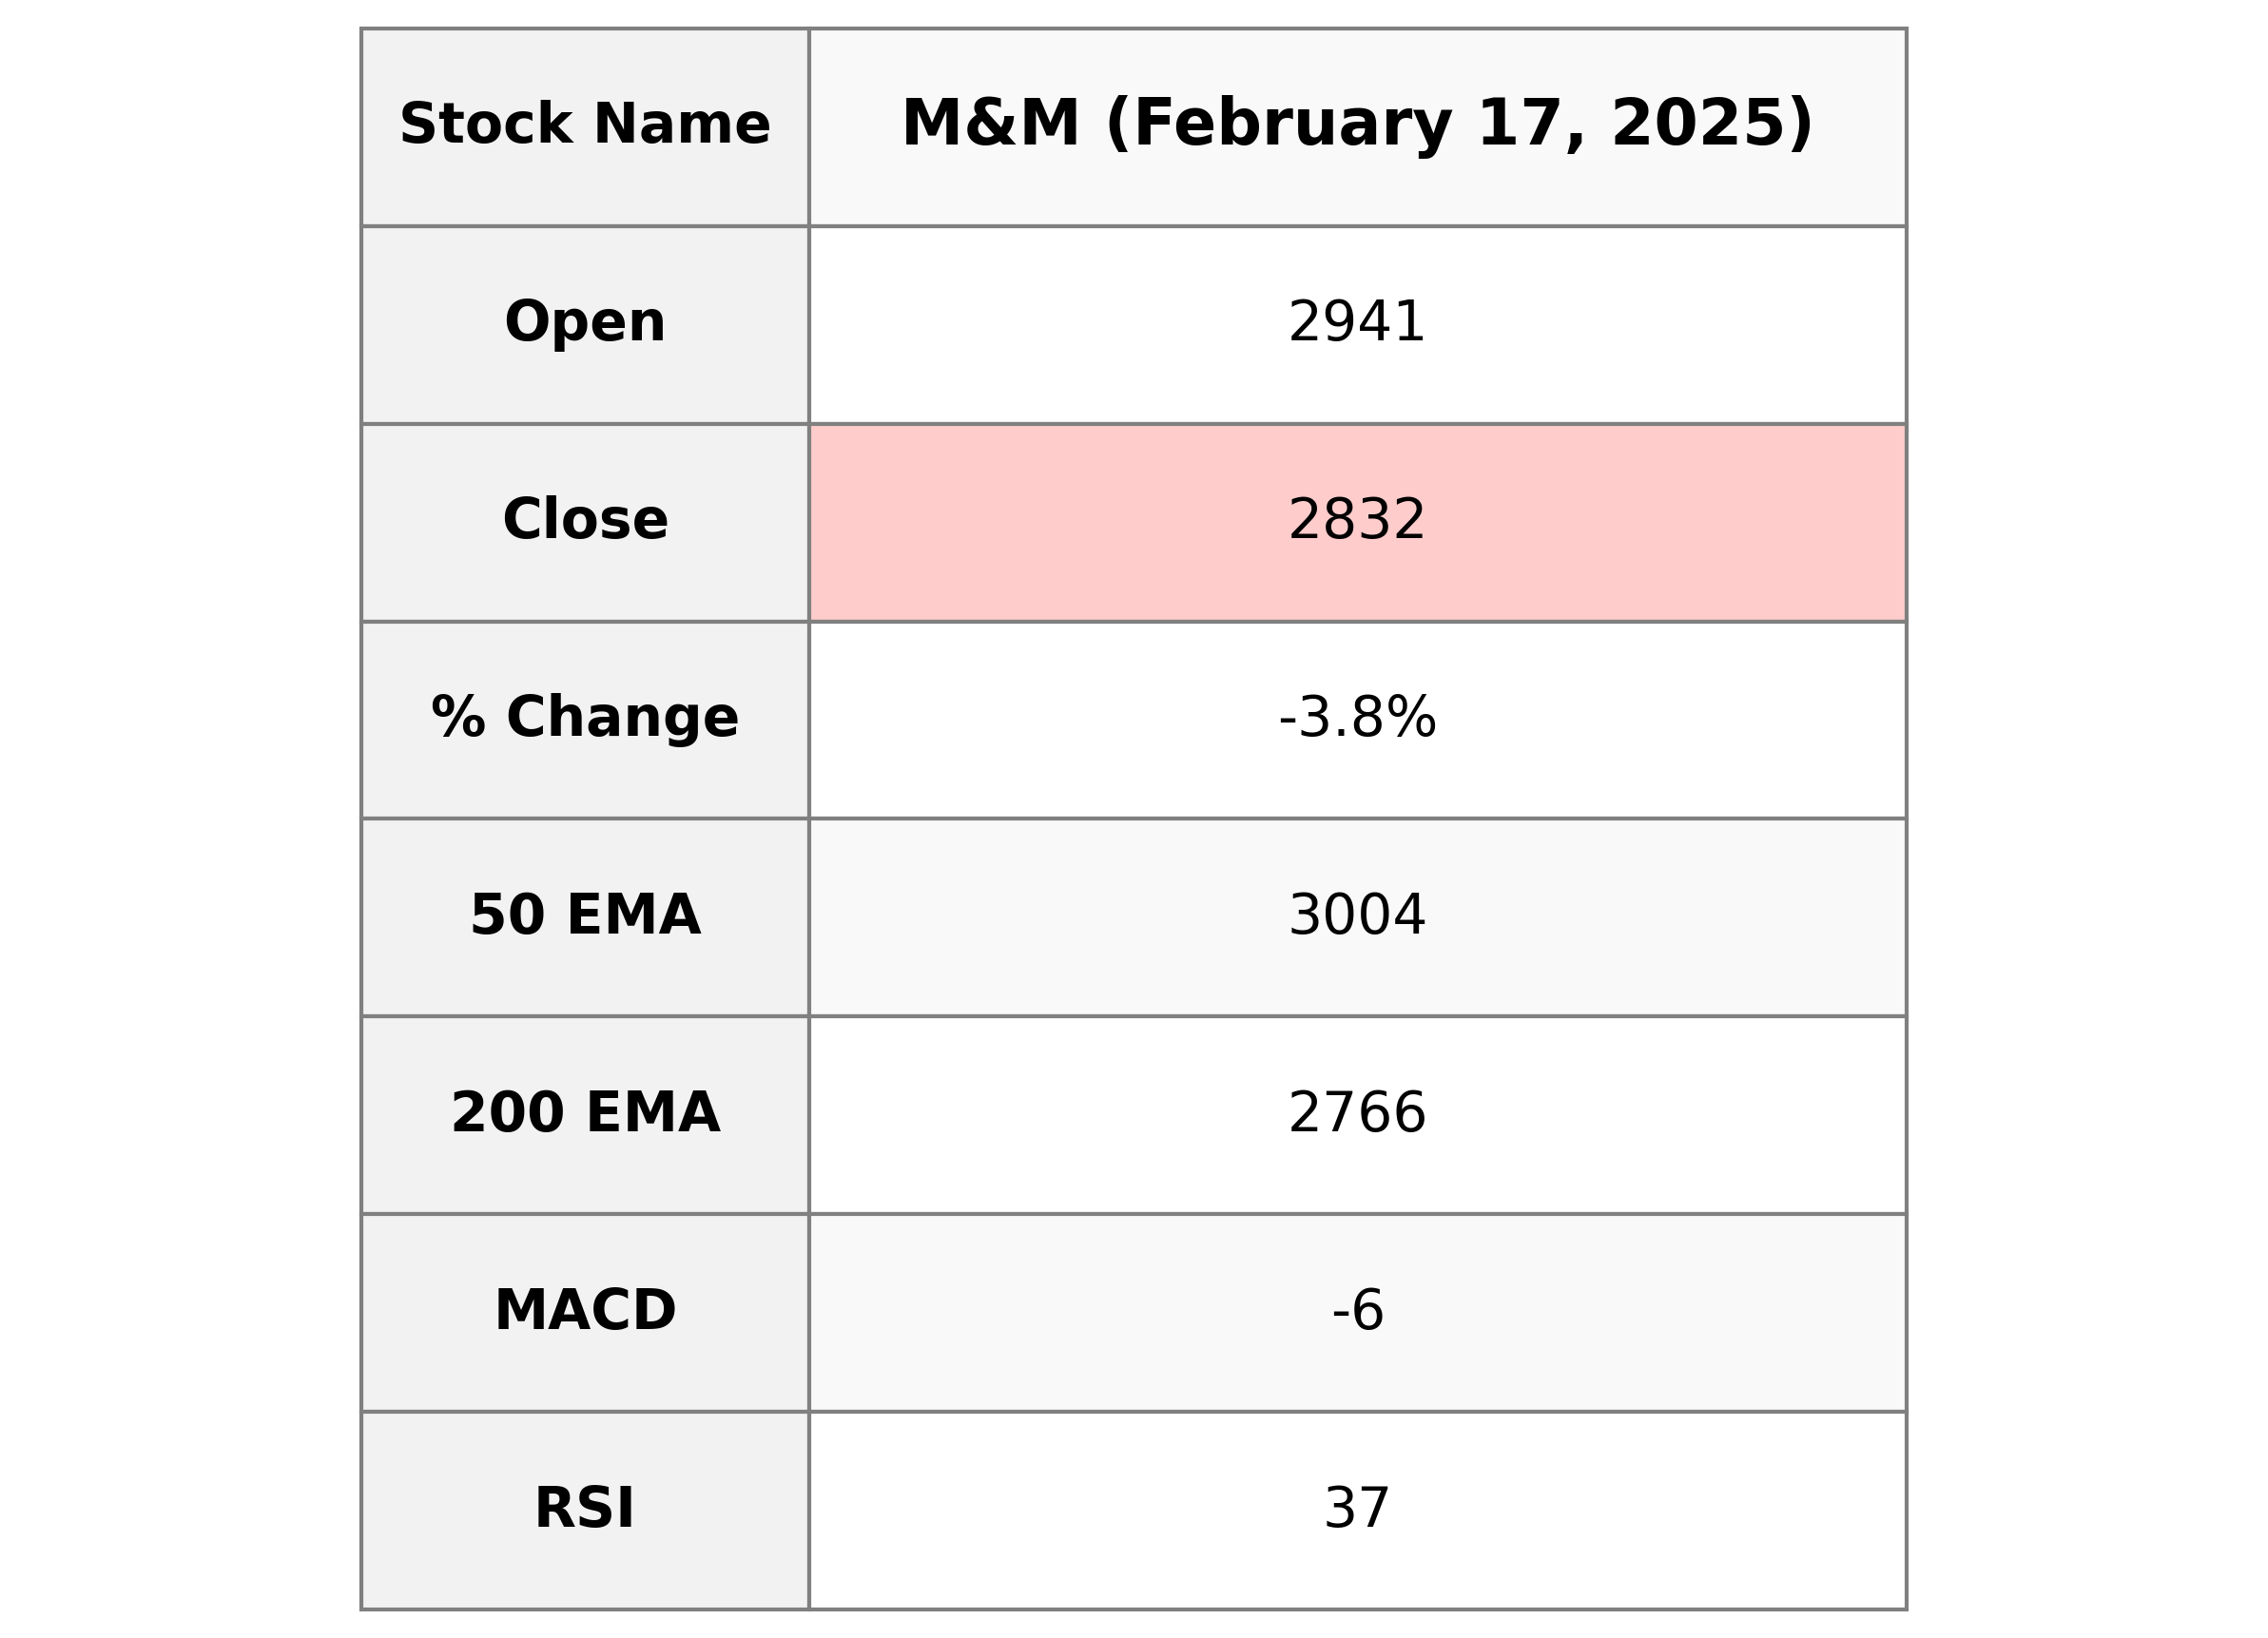
### Mahindra & Mahindra Performance Summary Mahindra & Mahindra experienced a decline in its stock price as indicated by a **3.76%** decrease from the previous close, closing at **2831.95**. The stock showed volatility with a high of **2955.0** and a low of **2792.25**. Technical indicators suggest a bearish trend with the RSI at **36.63** and a negative MACD of **-5.63**, while the PE Ratio stands at **25.60**.

Relationship with Key Moving Averages
**Relationship with Key Moving Averages for Mahindra & Mahindra**: The stock's closing price of 2831.95 is below its 10-day EMA of 3001.21 and 50-day EMA of 3004.25, suggesting a short-term bearish sentiment. However, it remains above the 200-day EMA of 2766.01, indicating potential long-term strength.
Moving Averages Trend (MACD)
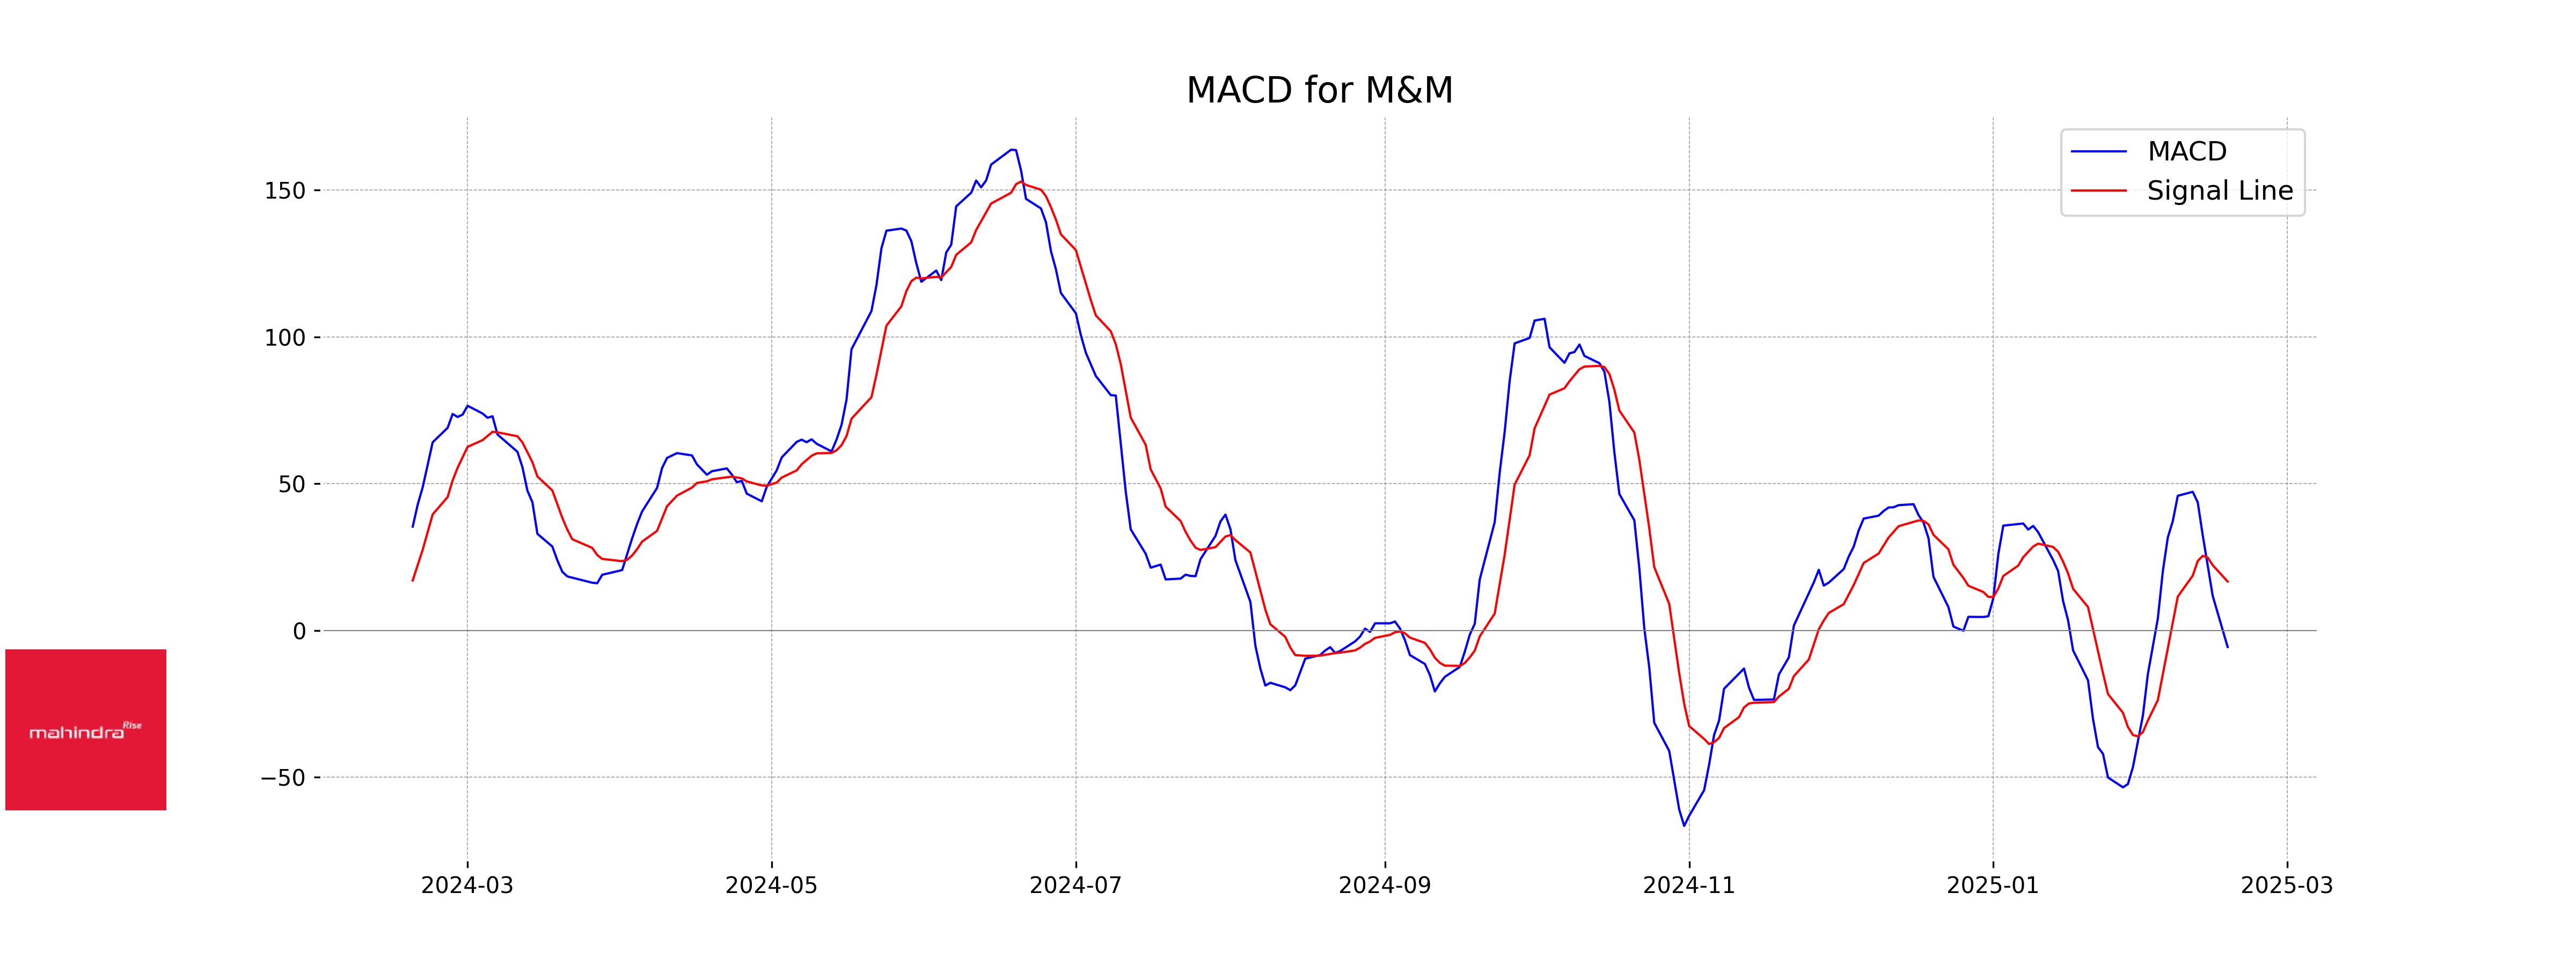
Mahindra & Mahindra currently shows a bearish trend in its MACD analysis, as indicated by the negative MACD value of -5.63, which is below the MACD Signal of 16.68. This suggests that the stock may be experiencing downward momentum or a weakening of its recent uptrend.
RSI Analysis
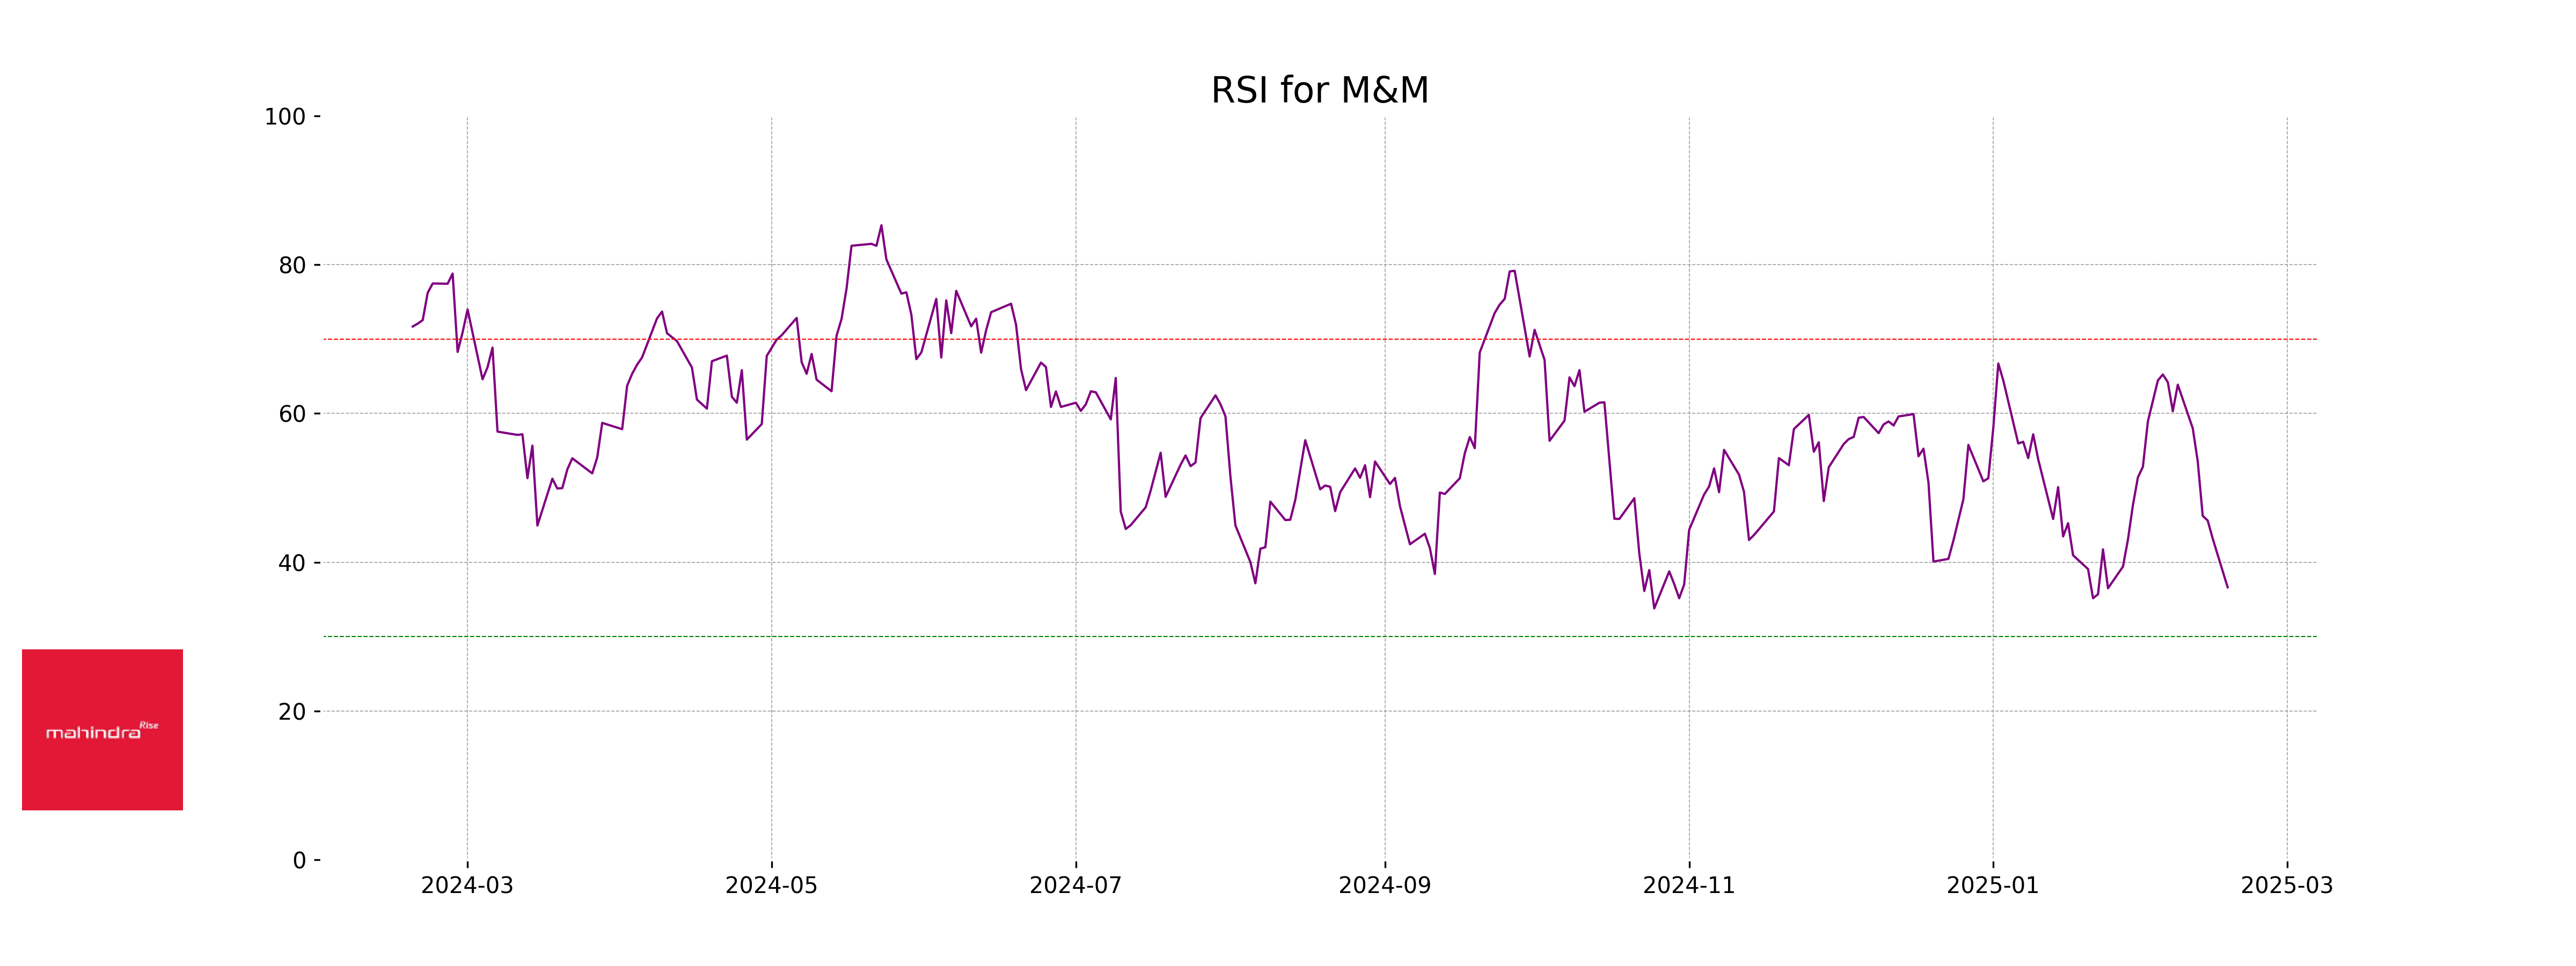
The RSI for Mahindra & Mahindra is currently 36.63, which indicates that the stock is approaching oversold territory. Generally, an RSI below 30 suggests that a stock may be undervalued, while an RSI above 70 indicates it may be overvalued.
Analysis for TCS - February 17, 2025
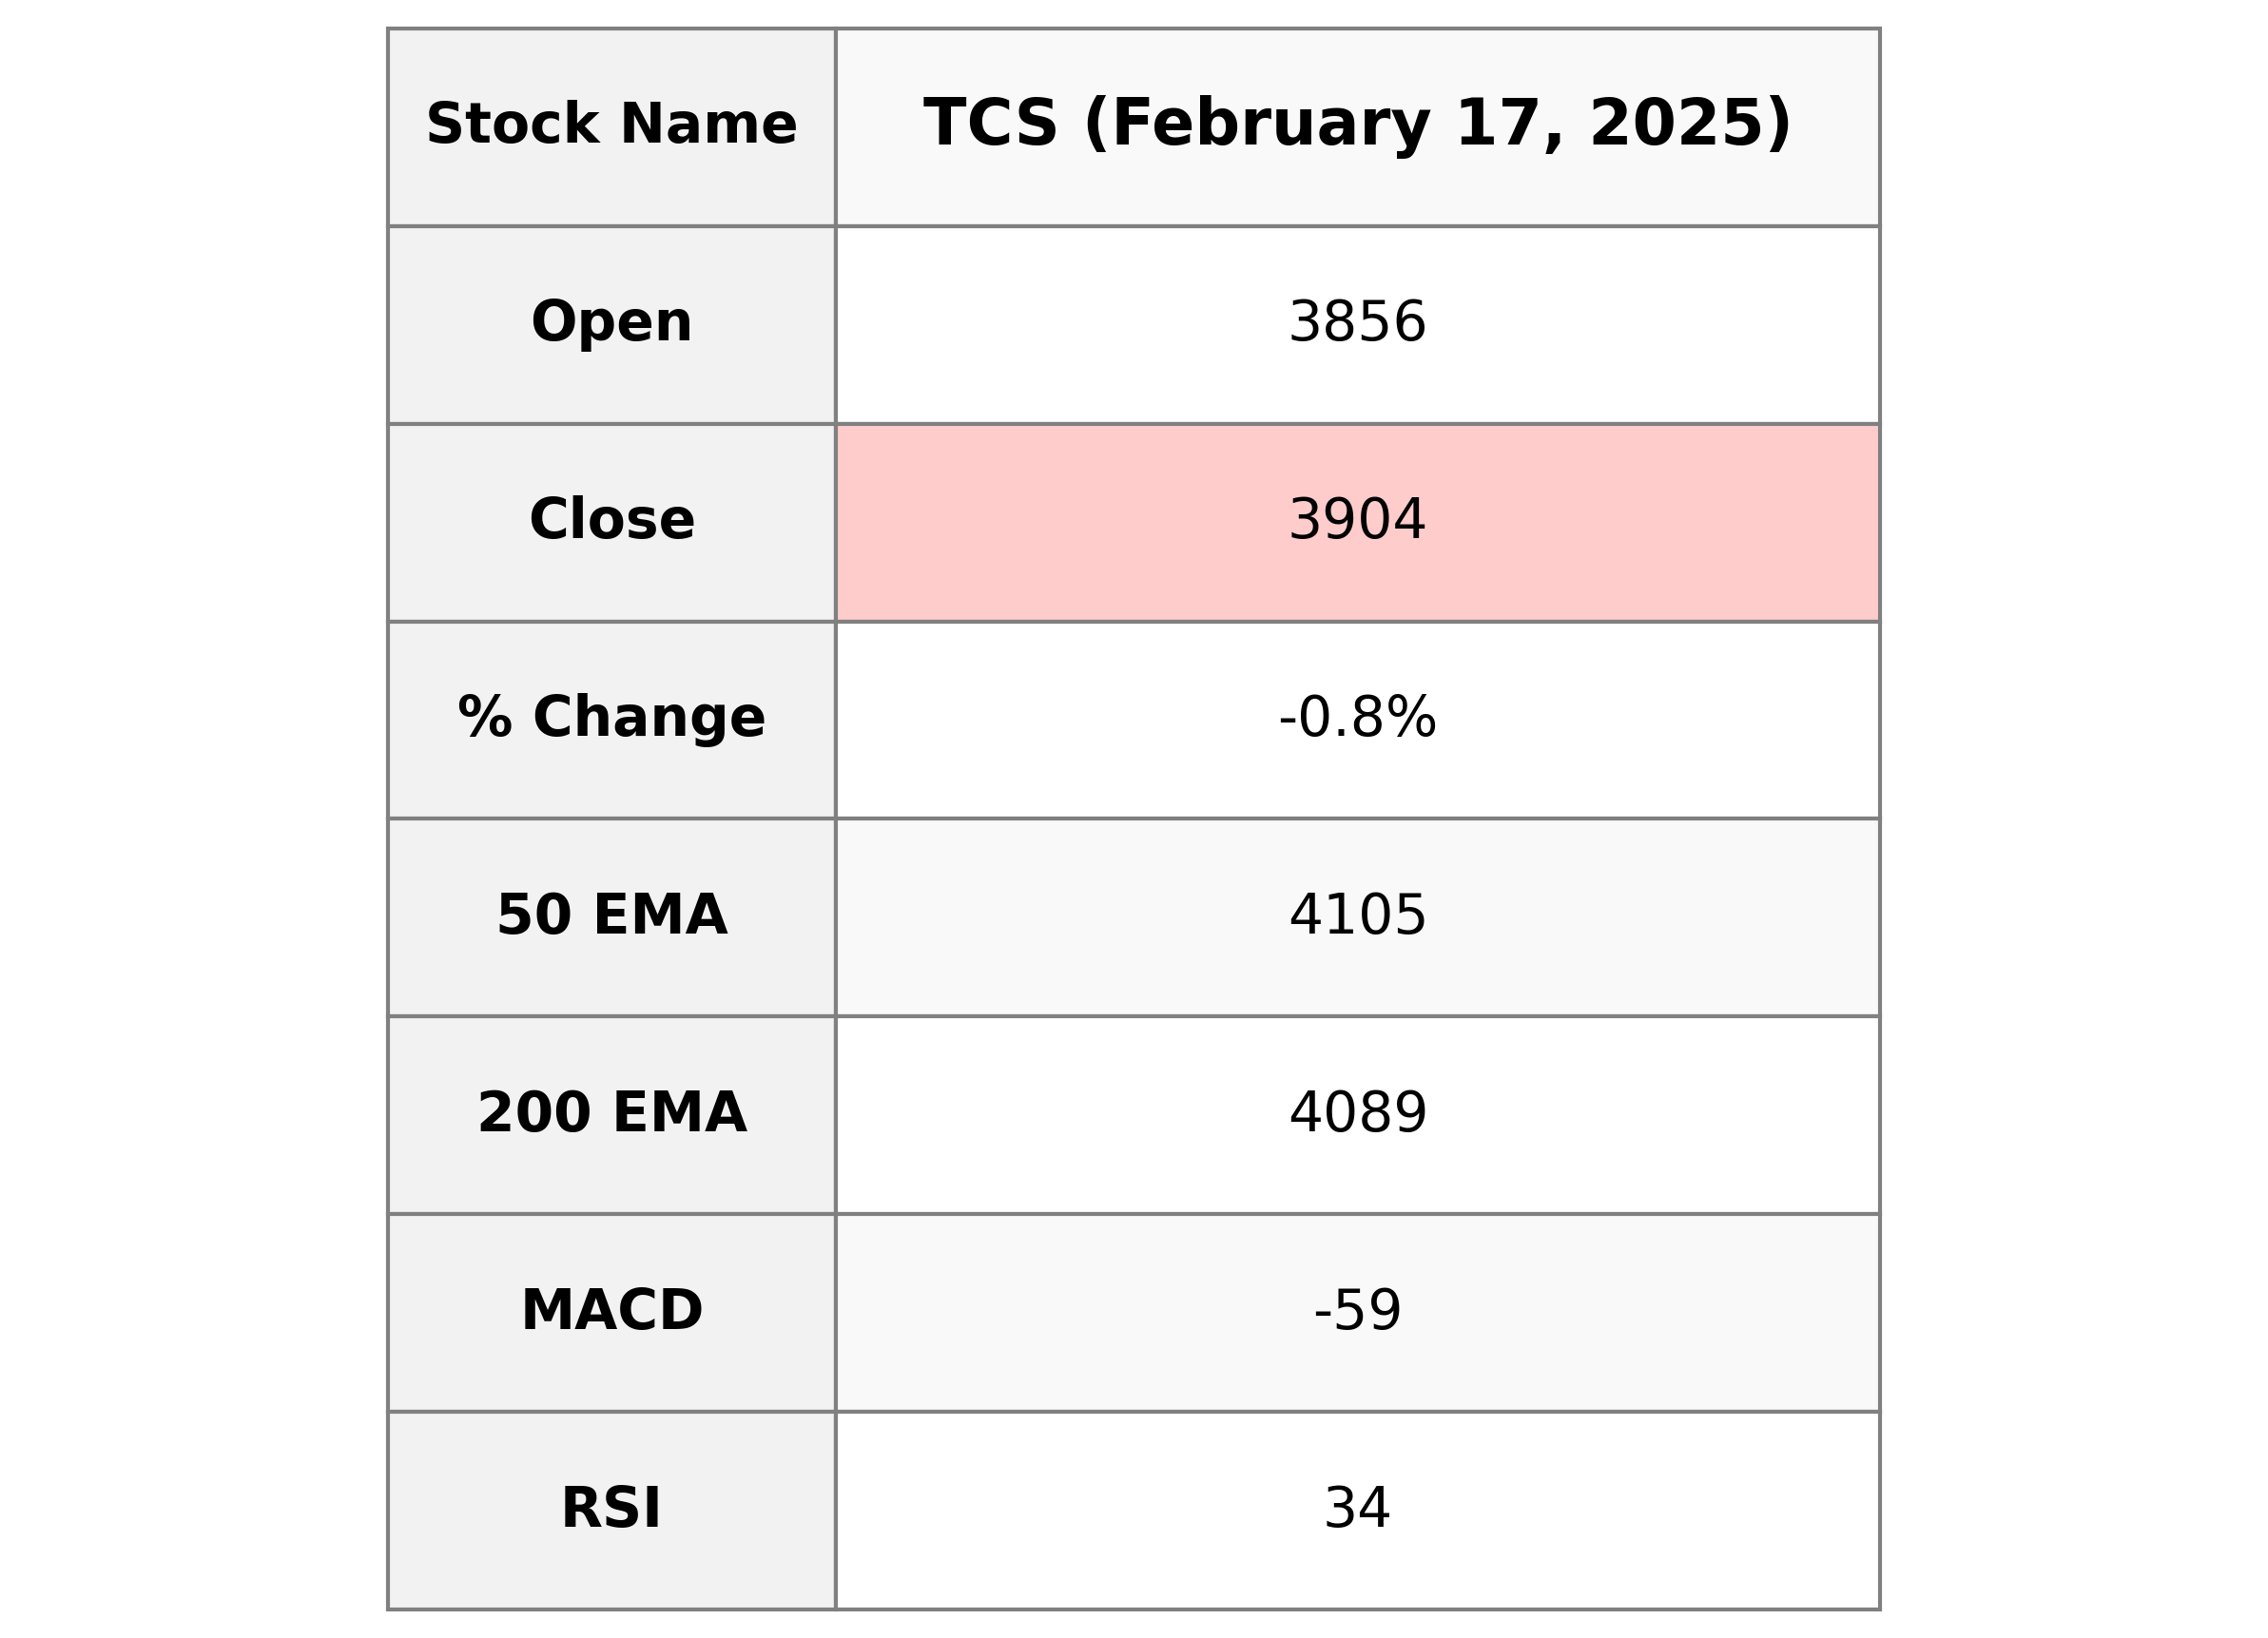
**Company:** TCS **Sector:** Technology **Industry:** Information Technology Services **Performance Description:** TCS had a recent closing price of 3904.5, experiencing a decline of -0.77% compared to the previous close. The stock's RSI is 33.97, indicating potential oversold conditions, while the MACD suggests a bearish trend. The company's market cap stands at approximately 14.13 trillion INR.
Relationship with Key Moving Averages
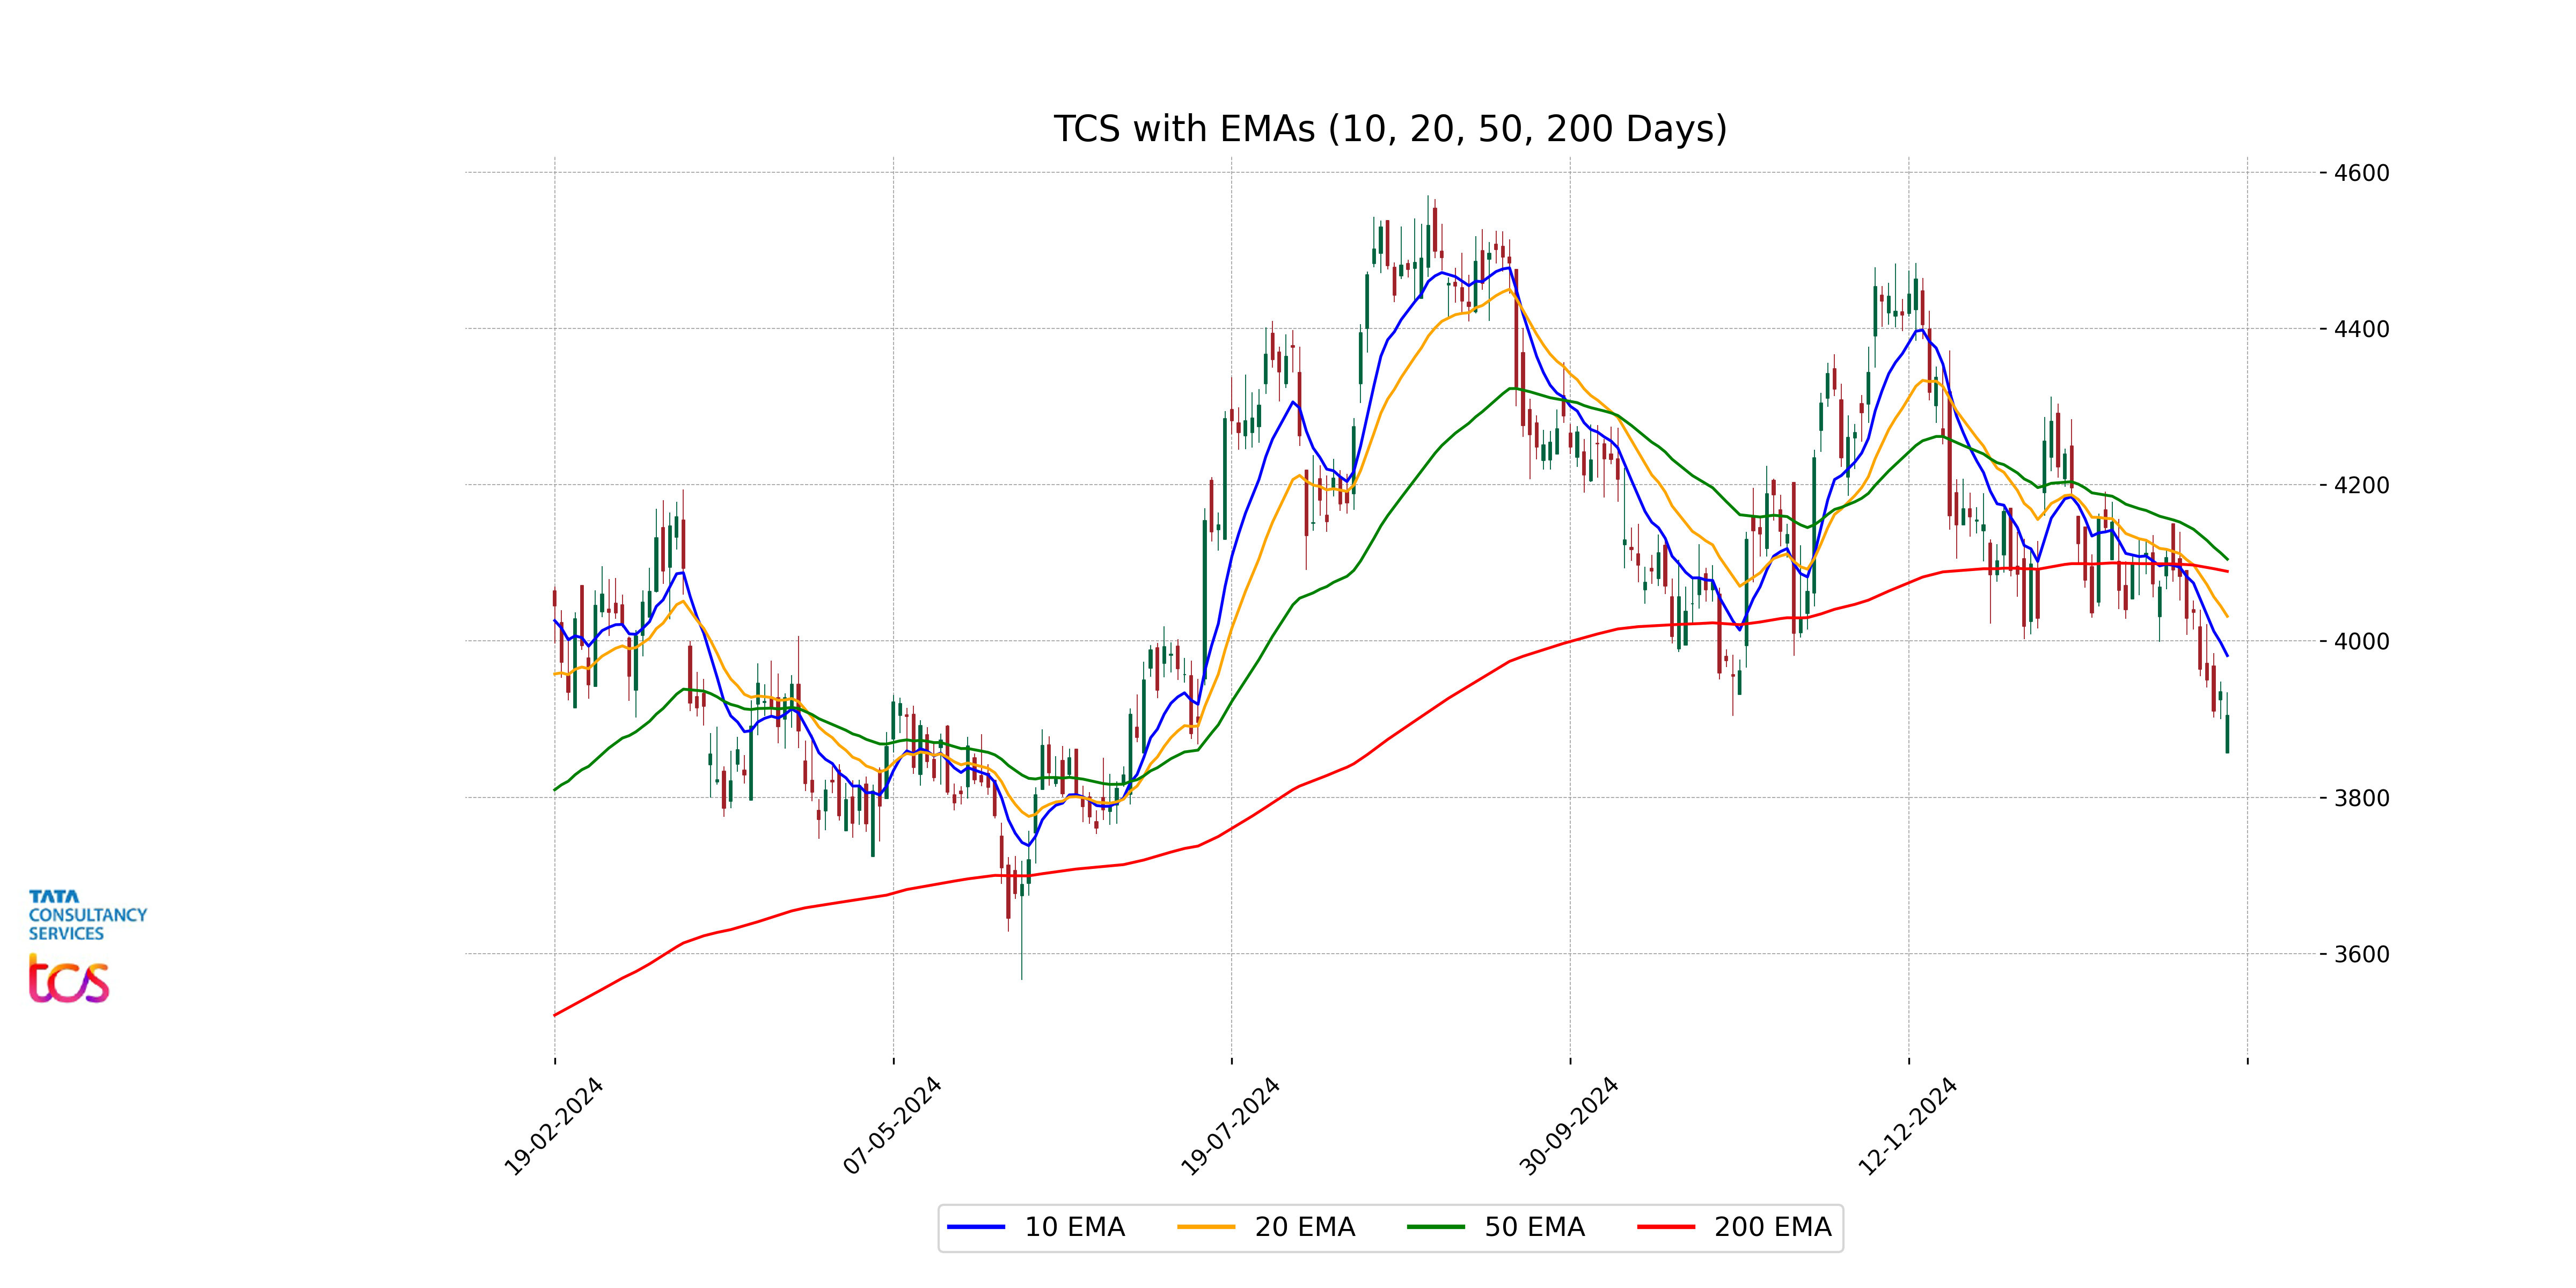
For Tata Consultancy Services (TCS), the current close price of 3904.5 is below its key moving averages, including the 10 EMA at 3981.29, the 20 EMA at 4031.60, the 50 EMA at 4104.70, and the 200 EMA at 4089.11. This indicates a short-term bearish trend as the stock is trading below these averages.
Moving Averages Trend (MACD)
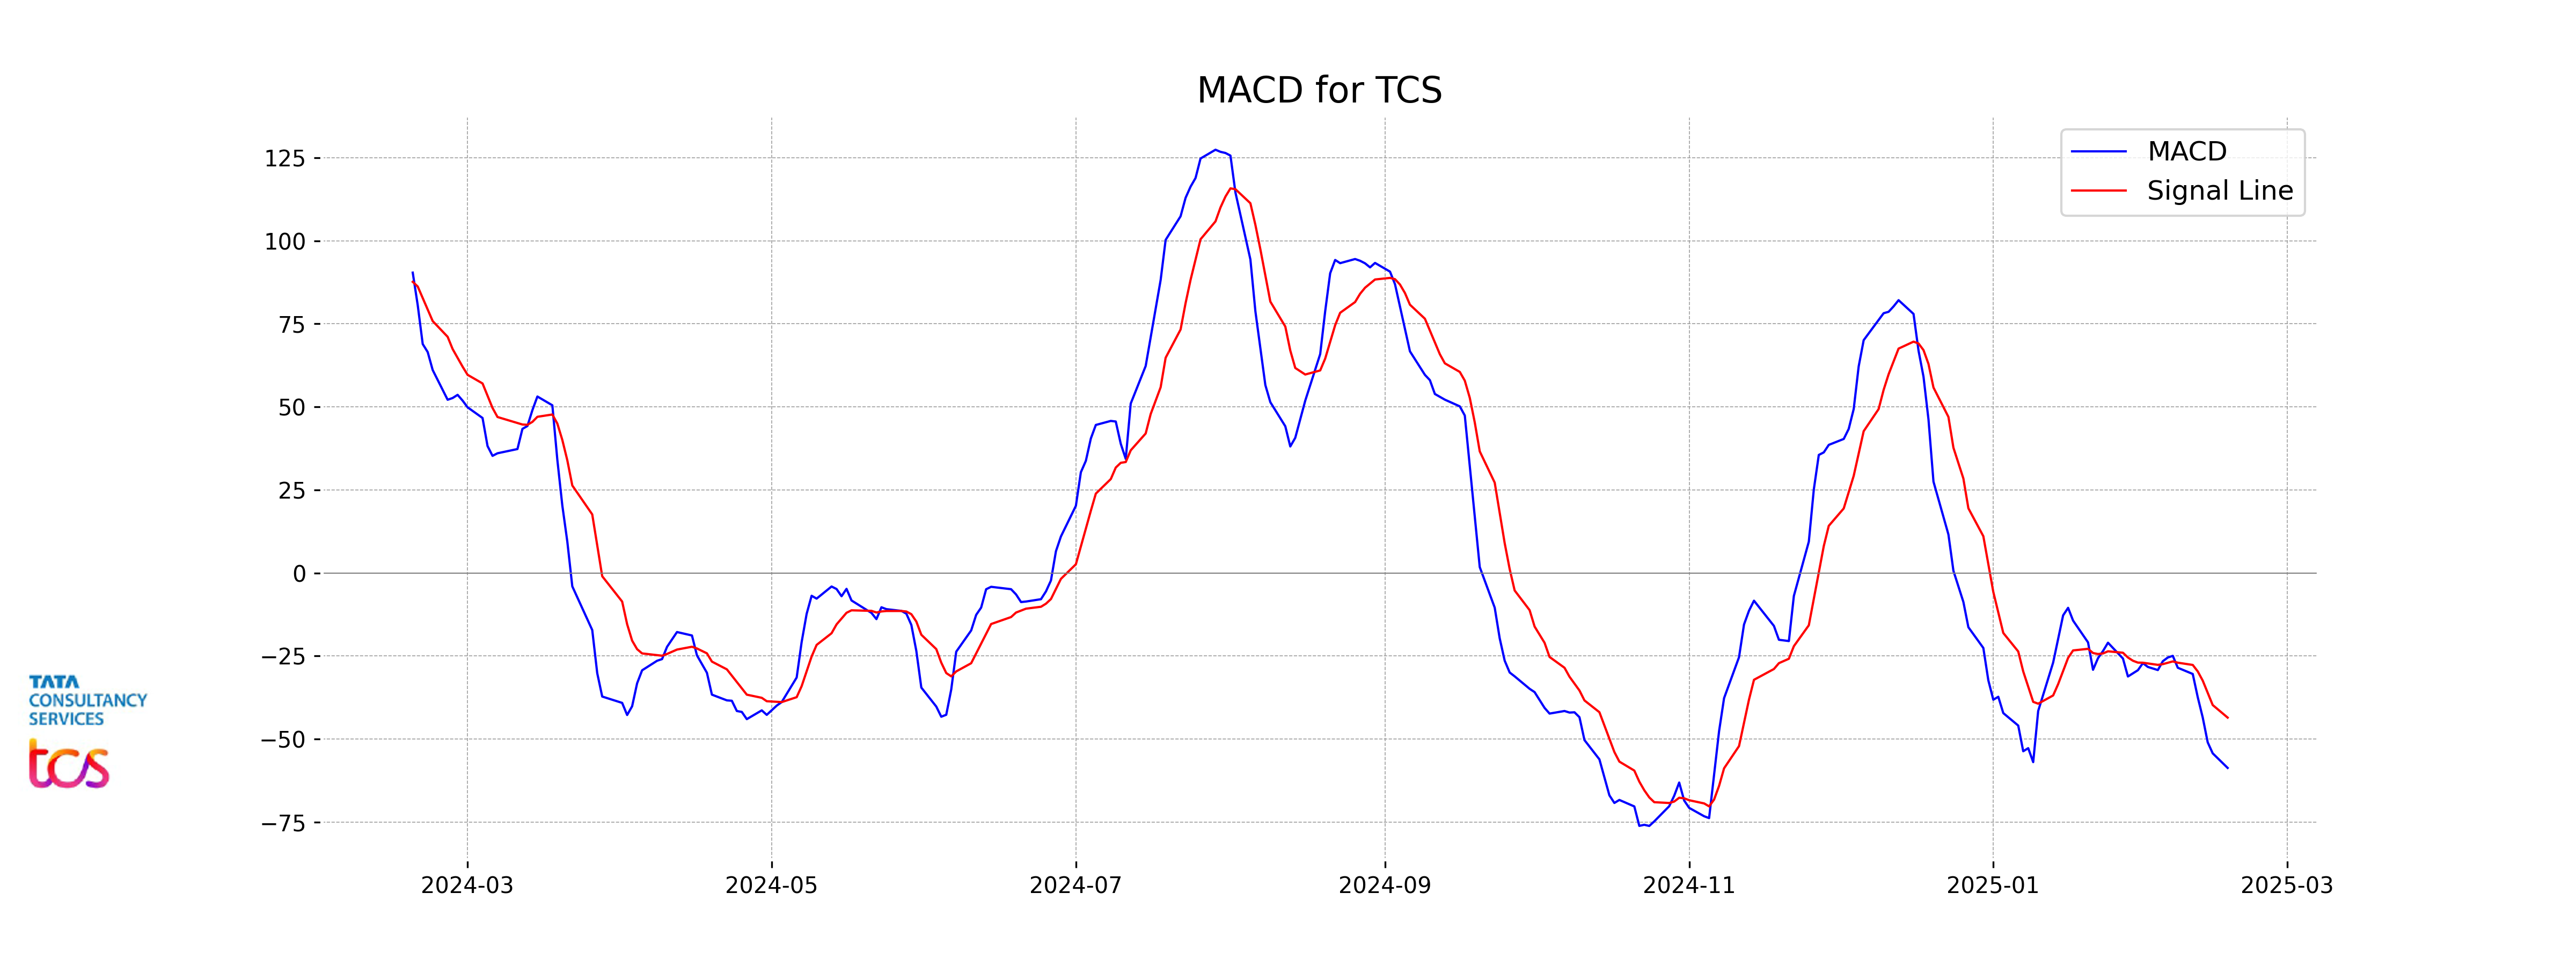
Tata Consultancy Services (TCS) has a MACD of -58.71, which is below the MACD Signal of -43.56, suggesting that the stock is experiencing bearish momentum. This indicates potential downside pressure, as the MACD line crossing below the MACD Signal can be seen as a bearish signal for TCS.
RSI Analysis
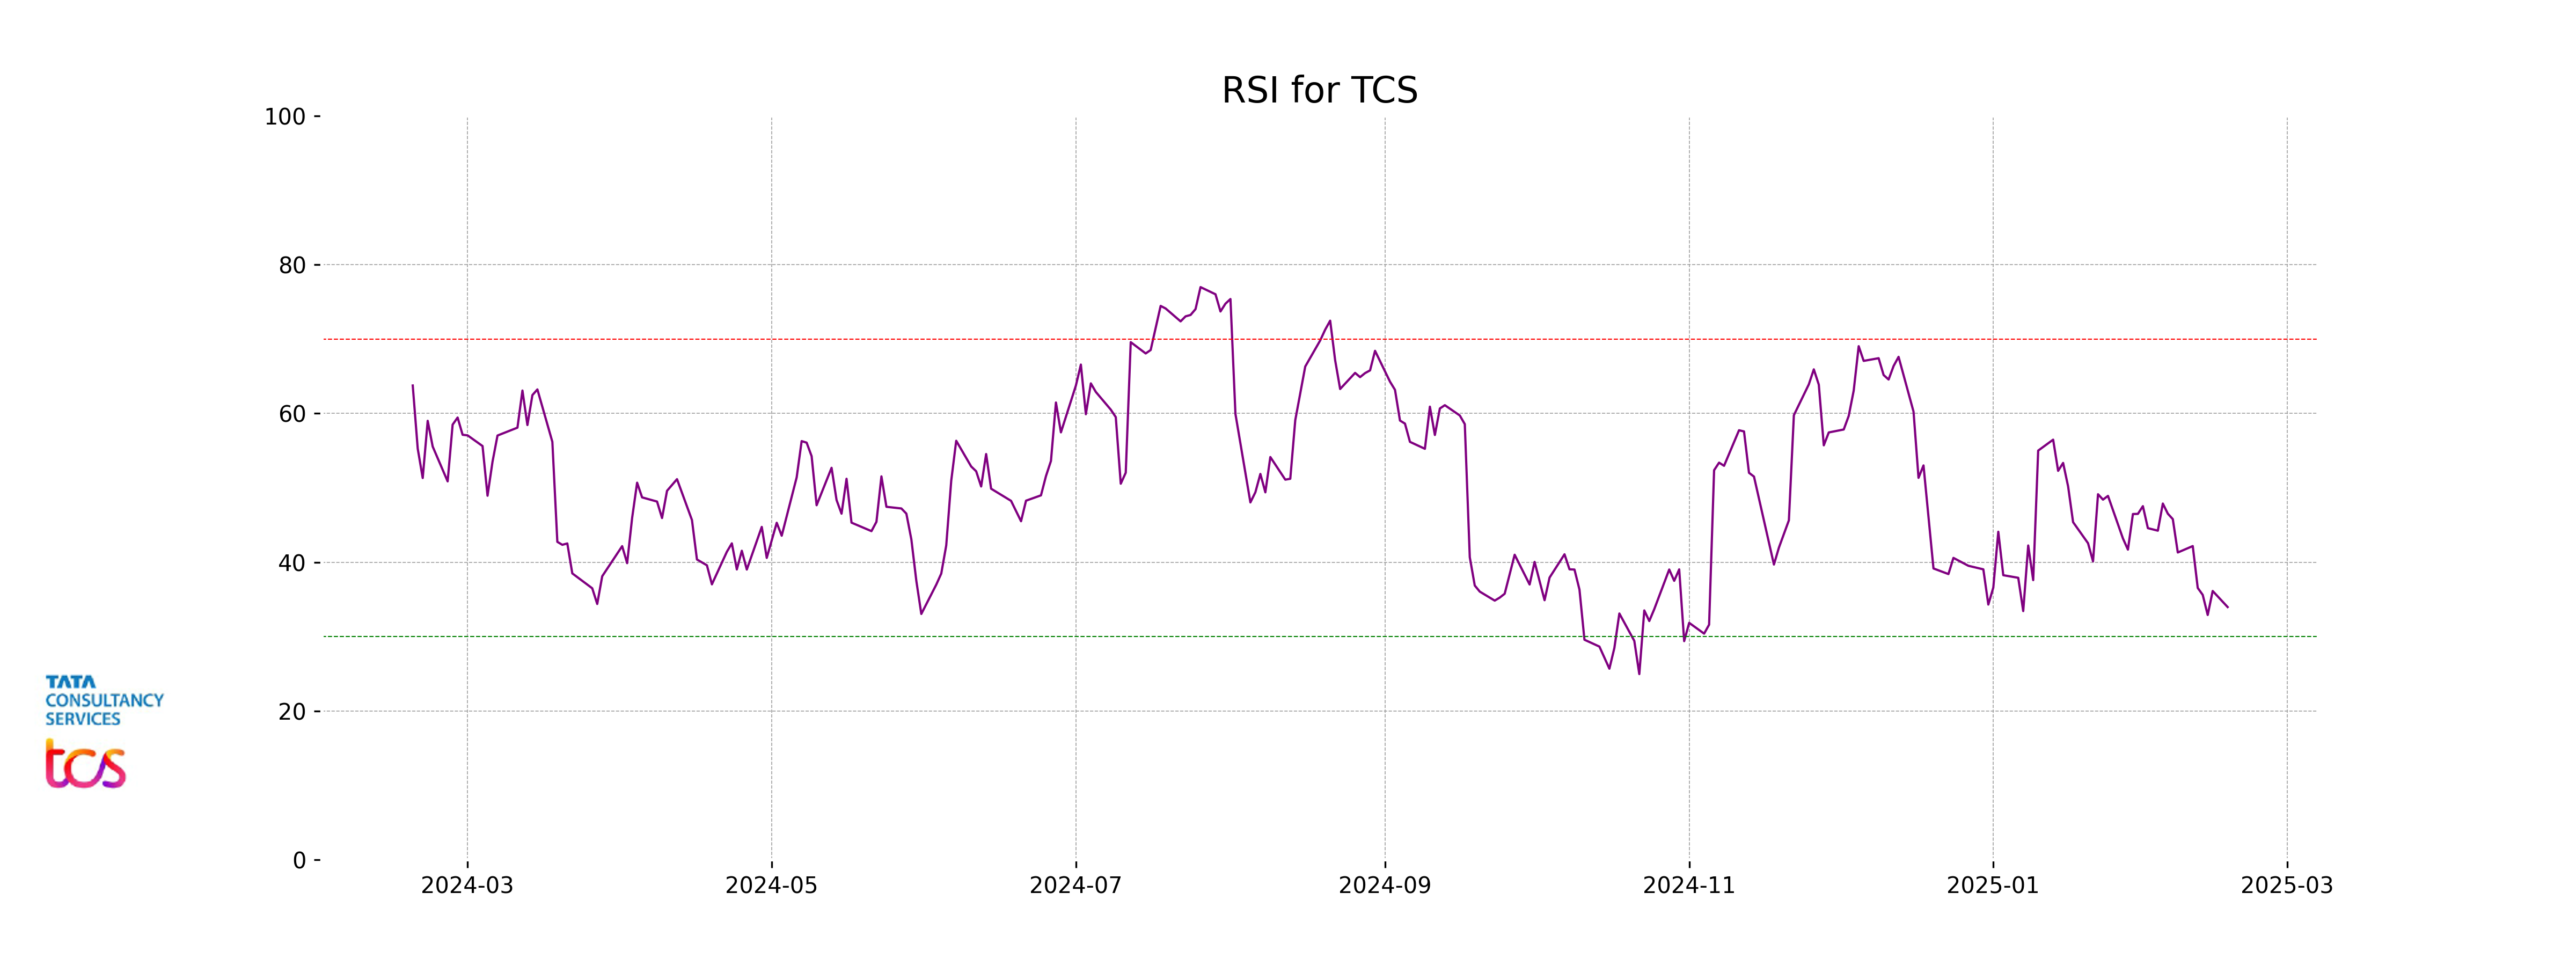
The Relative Strength Index (RSI) for TCS is 33.97, which suggests that the stock might be approaching oversold conditions. Typically, an RSI reading below 30 is considered oversold, indicating potential for a rebound, though TCS is not quite at that level yet. Traders may see this as a signal to watch for any potential price reversals.
Analysis for Wipro - February 17, 2025
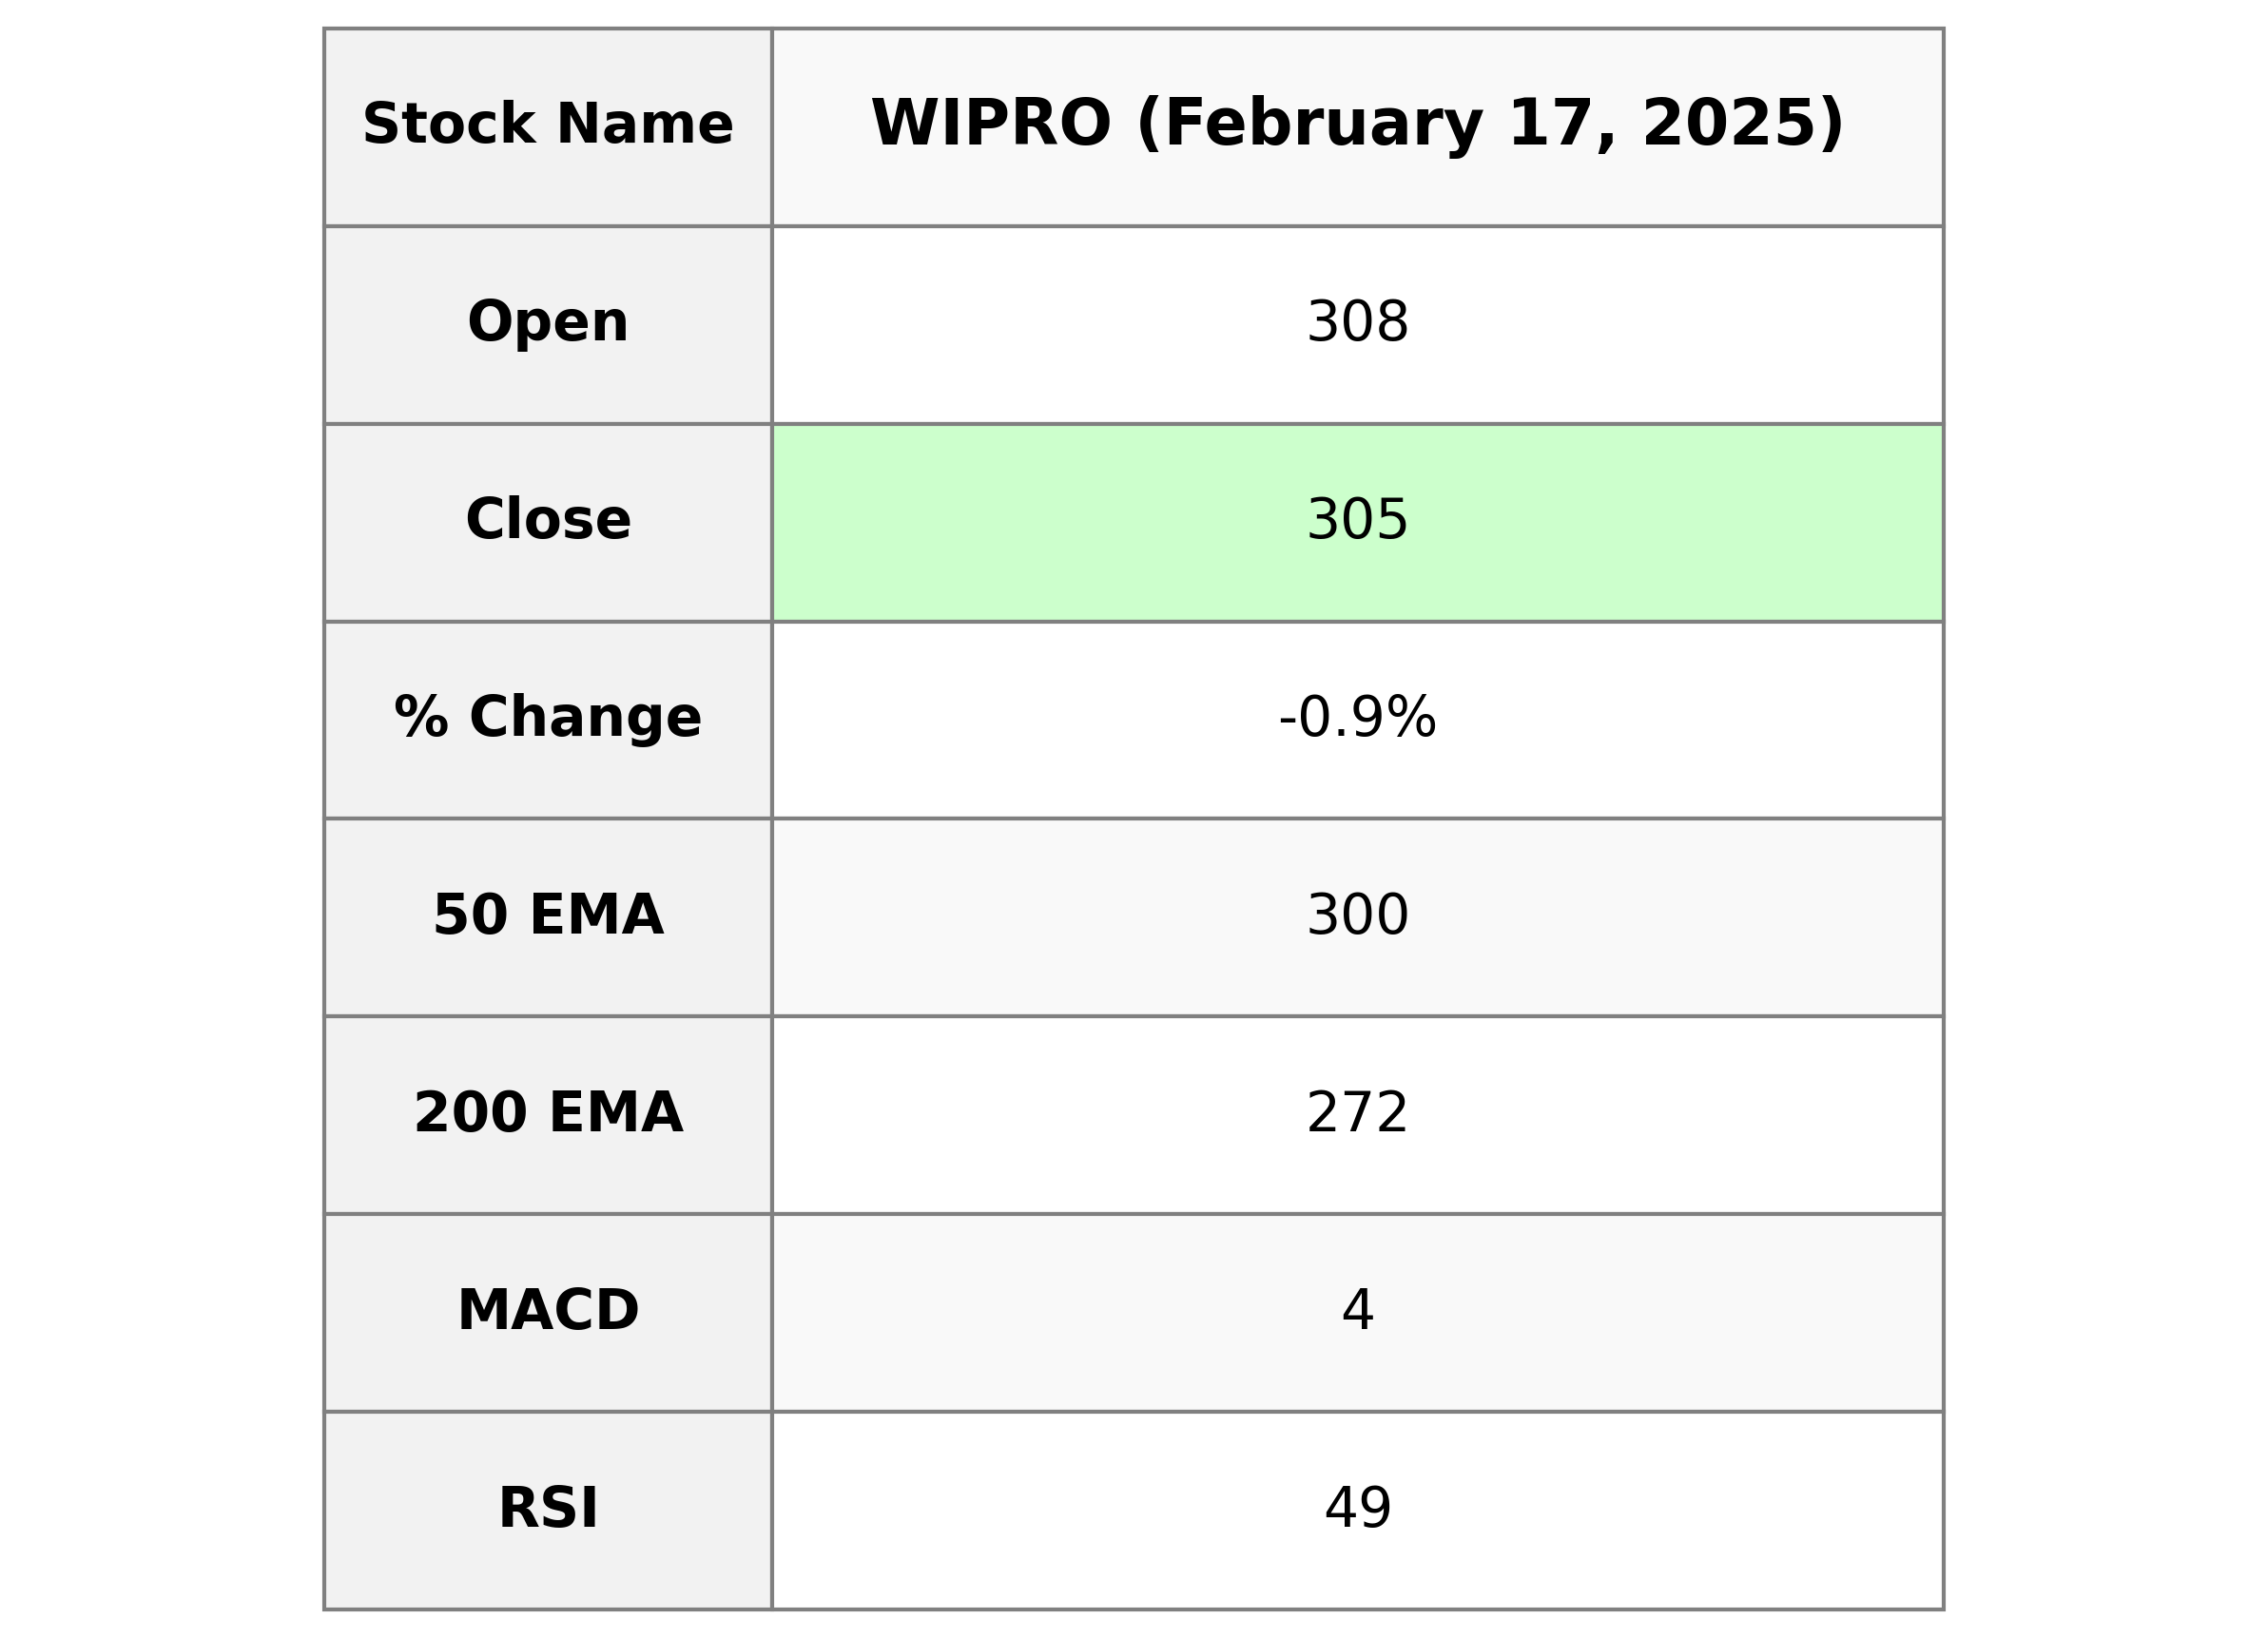
**Wipro** performance shows a slight decline with a closing stock price of 305.35, marking a decrease of 0.89% from the previous close. The stock's movements are supported by a robust volume of 7,506,534 shares. Wipro operates in the **Technology** sector, focusing on **Information Technology Services** in **India**.
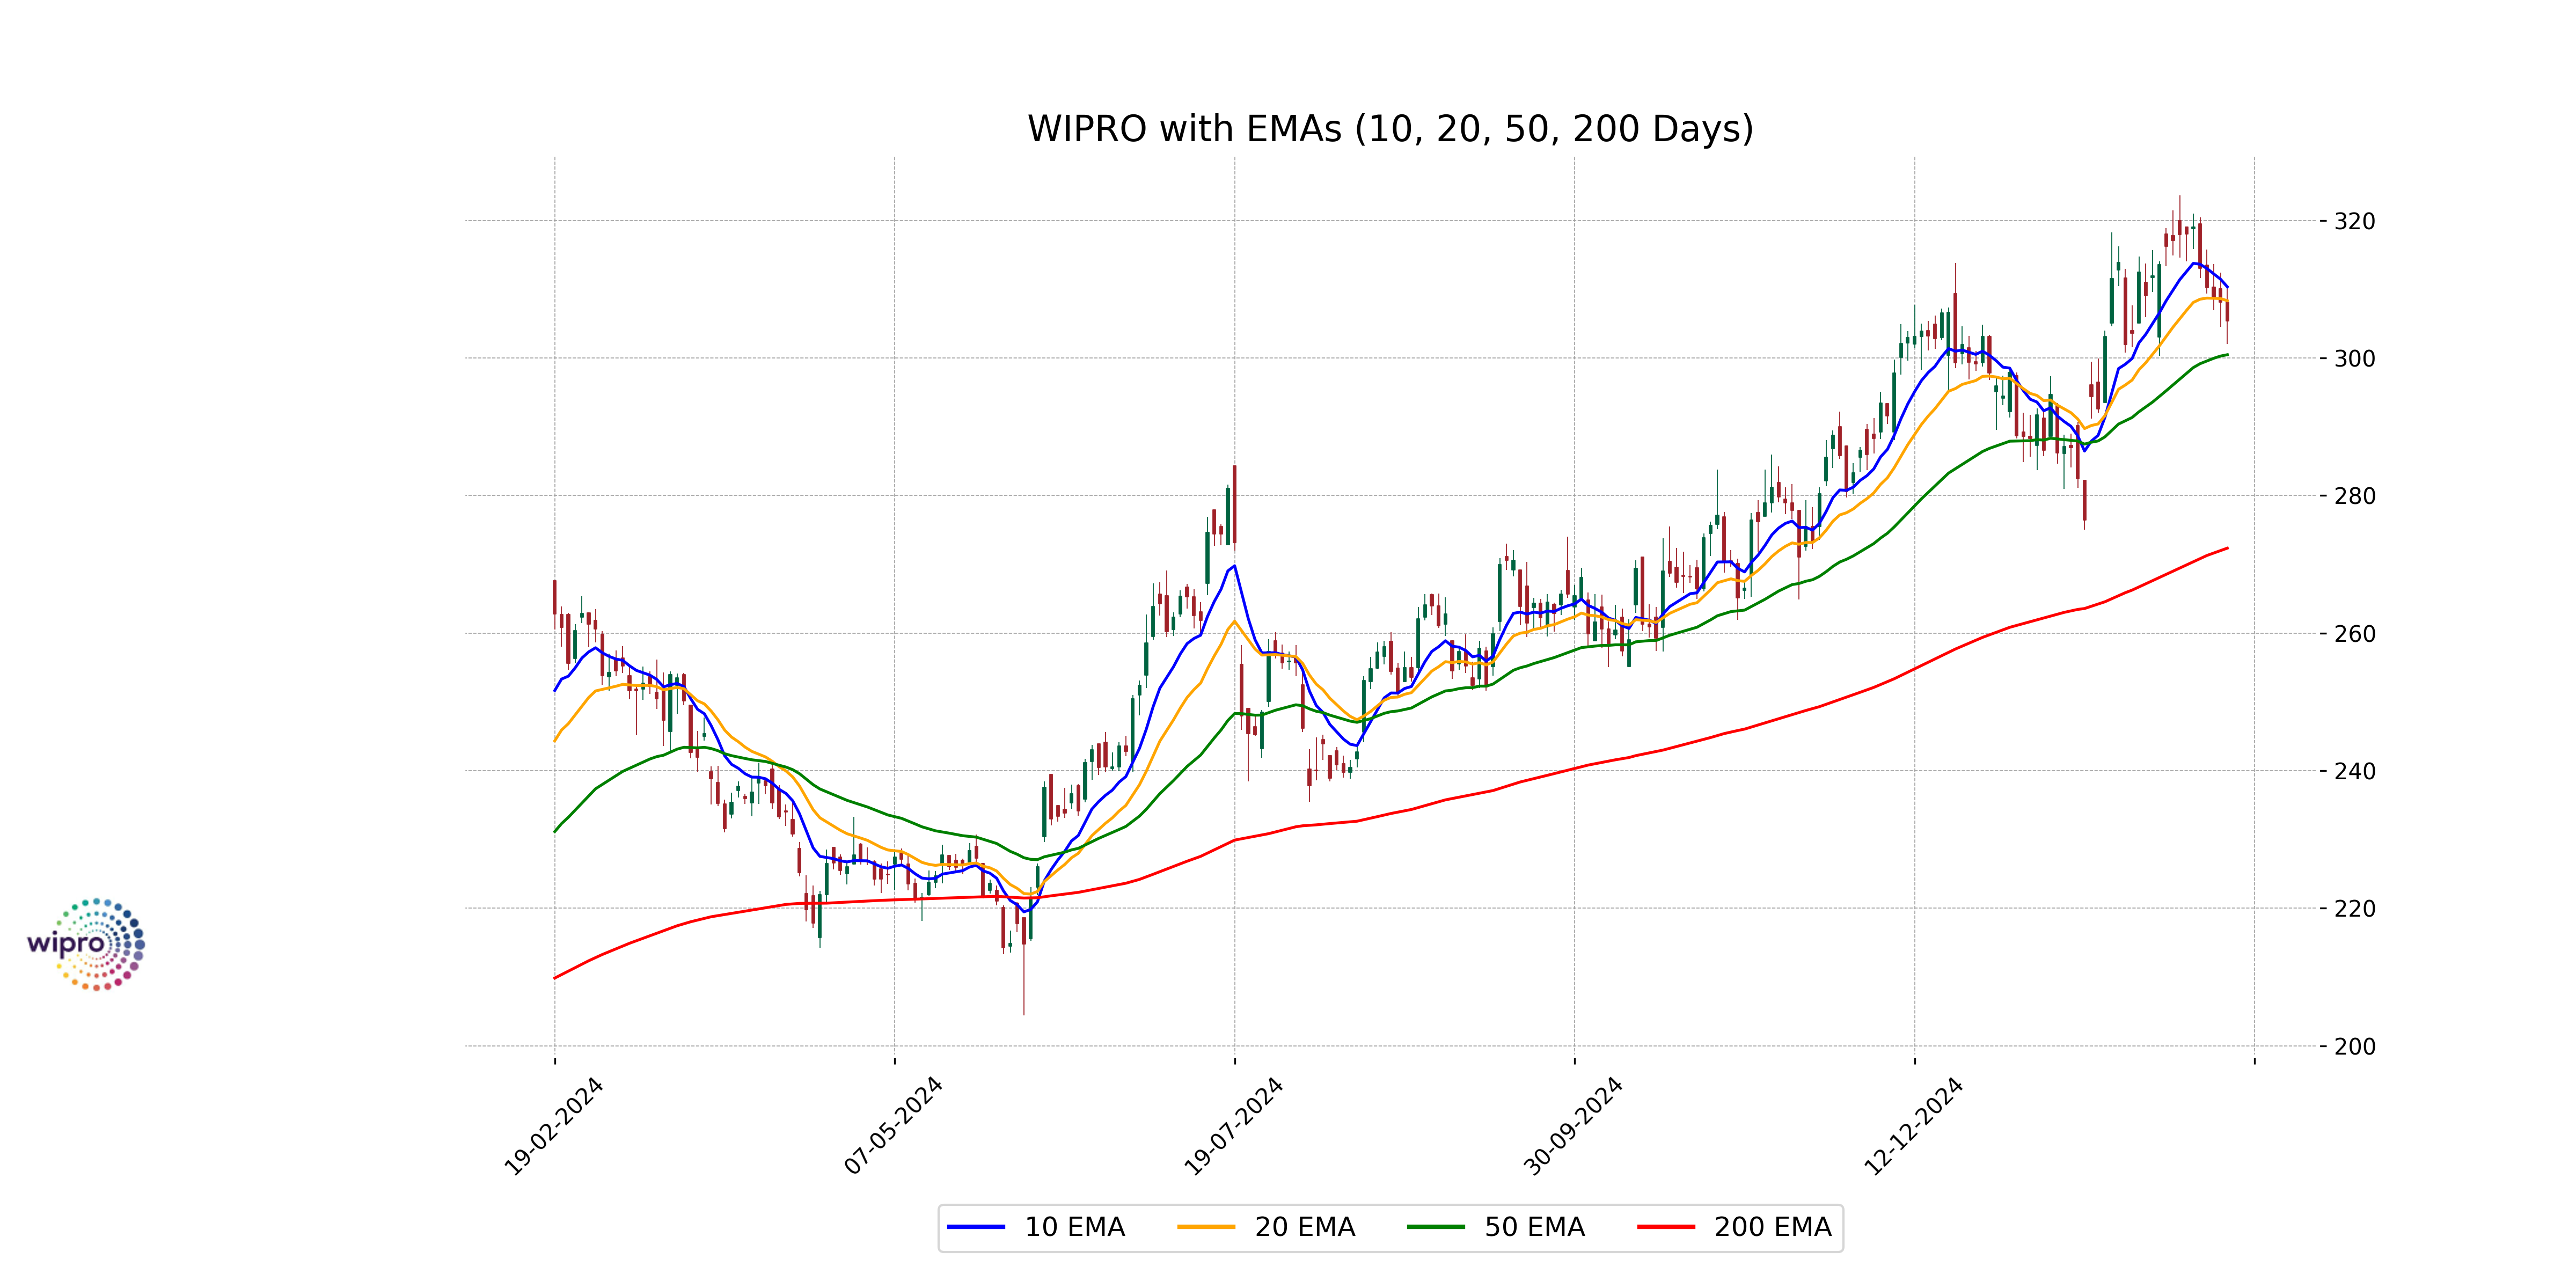
Relationship with Key Moving Averages
Based on the provided data, Wipro's latest closing price of 305.35 is above its 50-day EMA of 300.46 and significantly above its 200-day EMA of 272.34, indicating a longer-term upward trend. However, it is below the 10-day EMA of 310.33 and the 20-day EMA of 308.31, suggesting short-term bearish momentum.
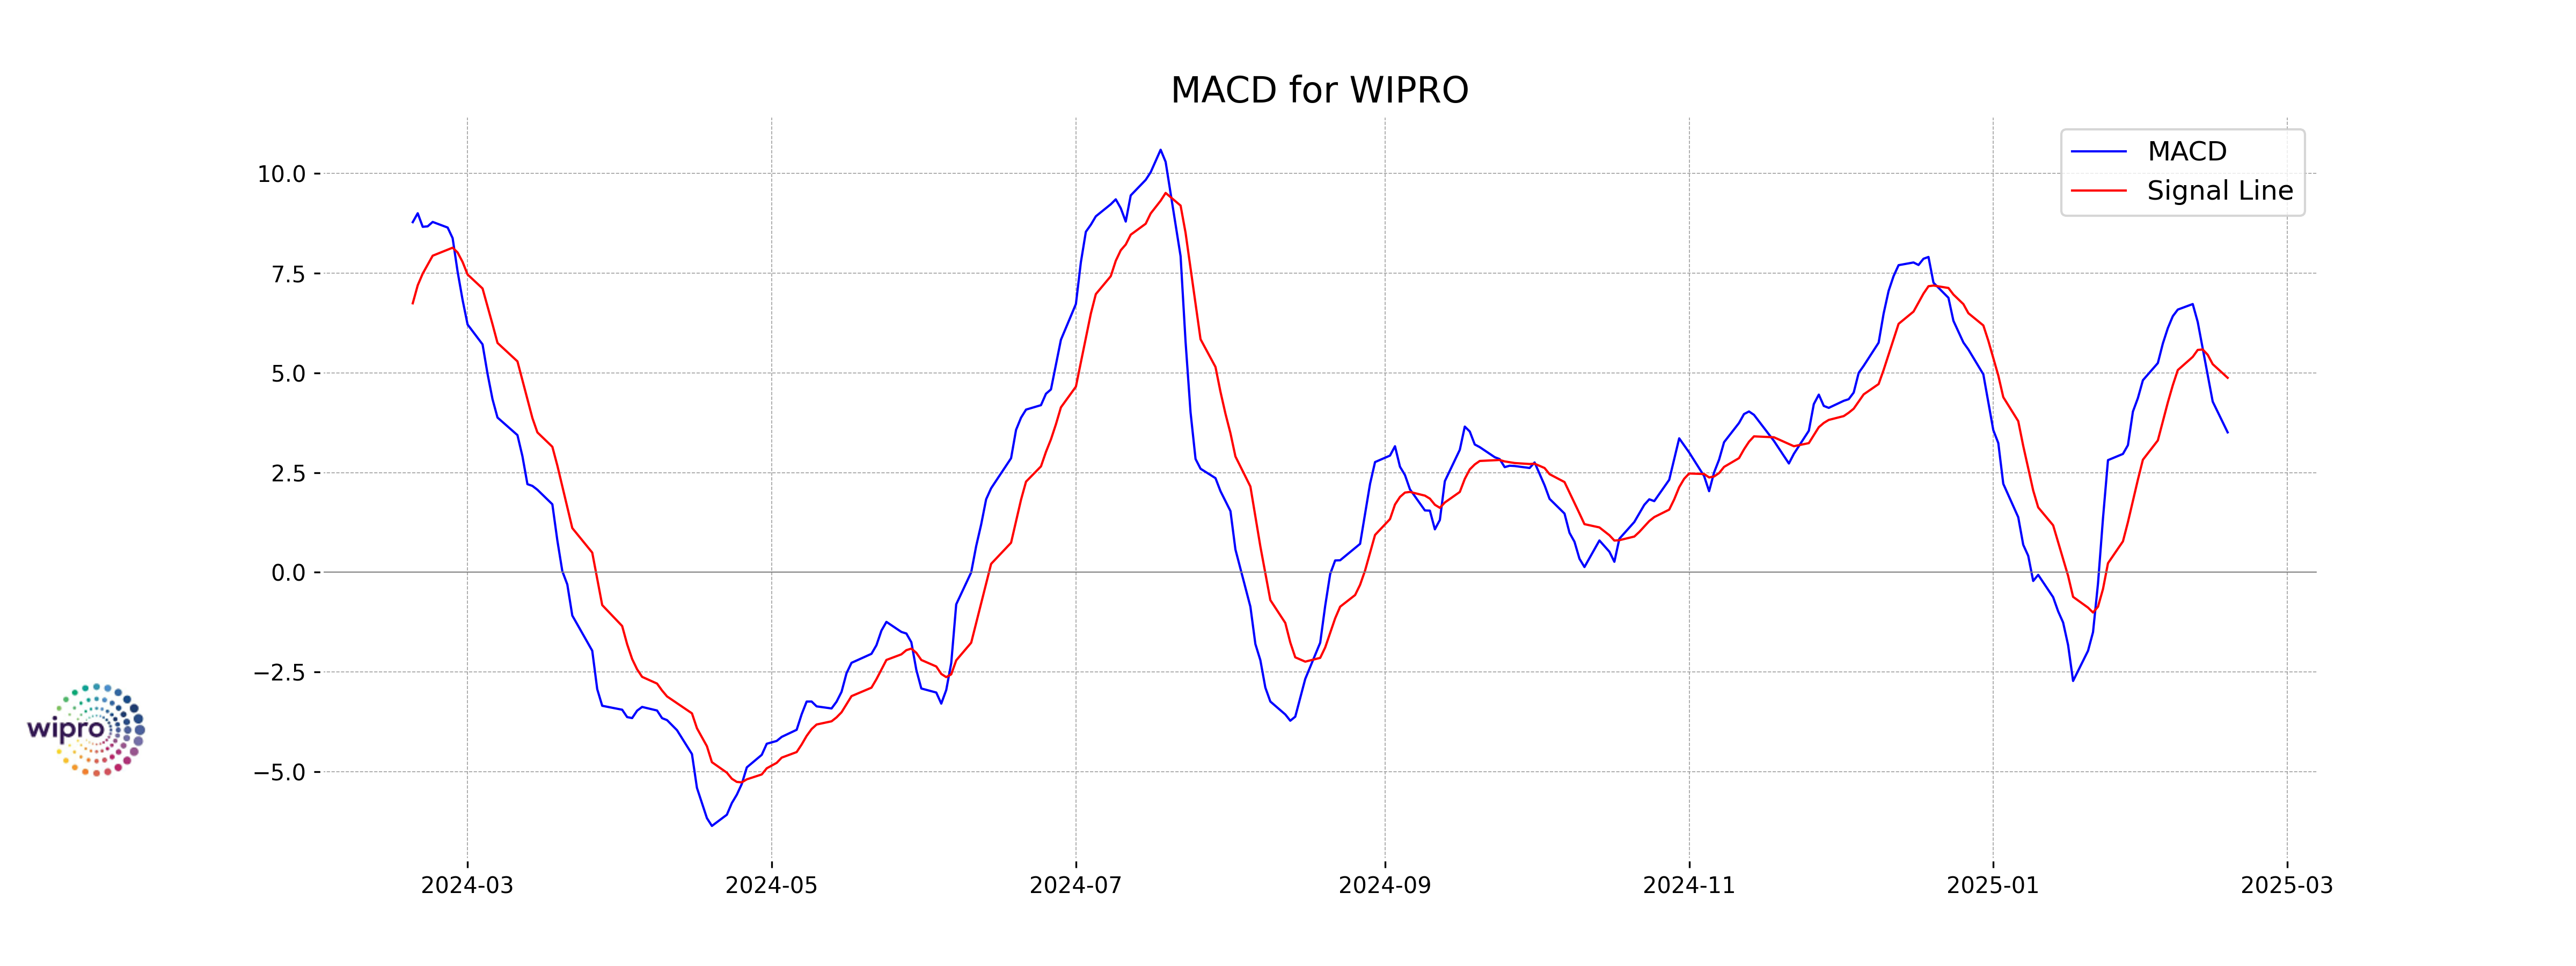
Moving Averages Trend (MACD)
**Wipro**: The MACD line for Wipro is below the MACD Signal line suggesting a bearish trend. This could be indicative of a potential downward movement in the stock price if the trend continues. Careful monitoring of the MACD for any reversal signals or divergences is recommended.
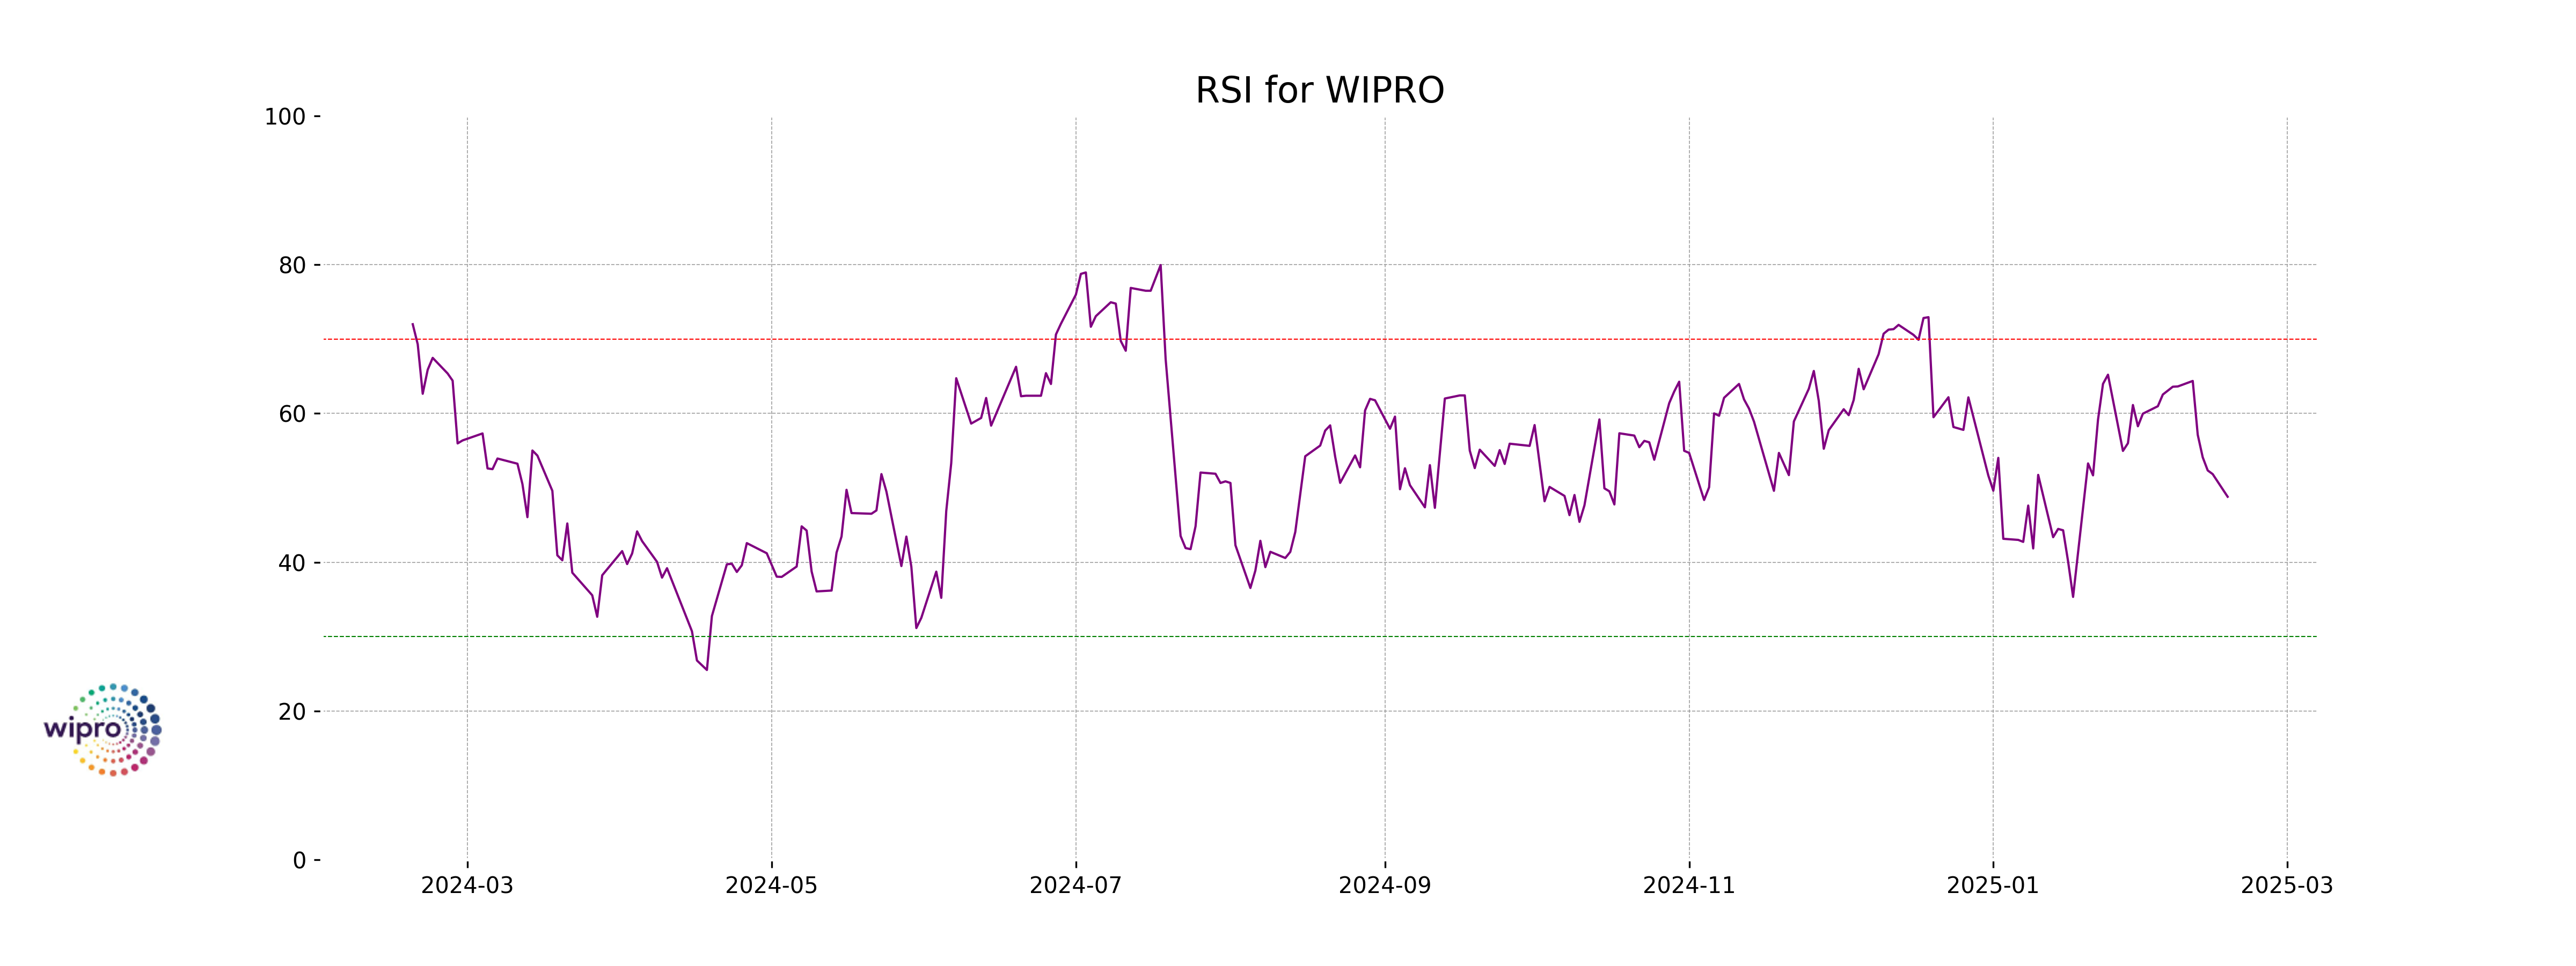
RSI Analysis
The RSI (Relative Strength Index) for Wipro is 48.80, which suggests that the stock is neither overbought nor oversold. It is close to the neutral 50 level, indicating a balance between buying and selling pressures.