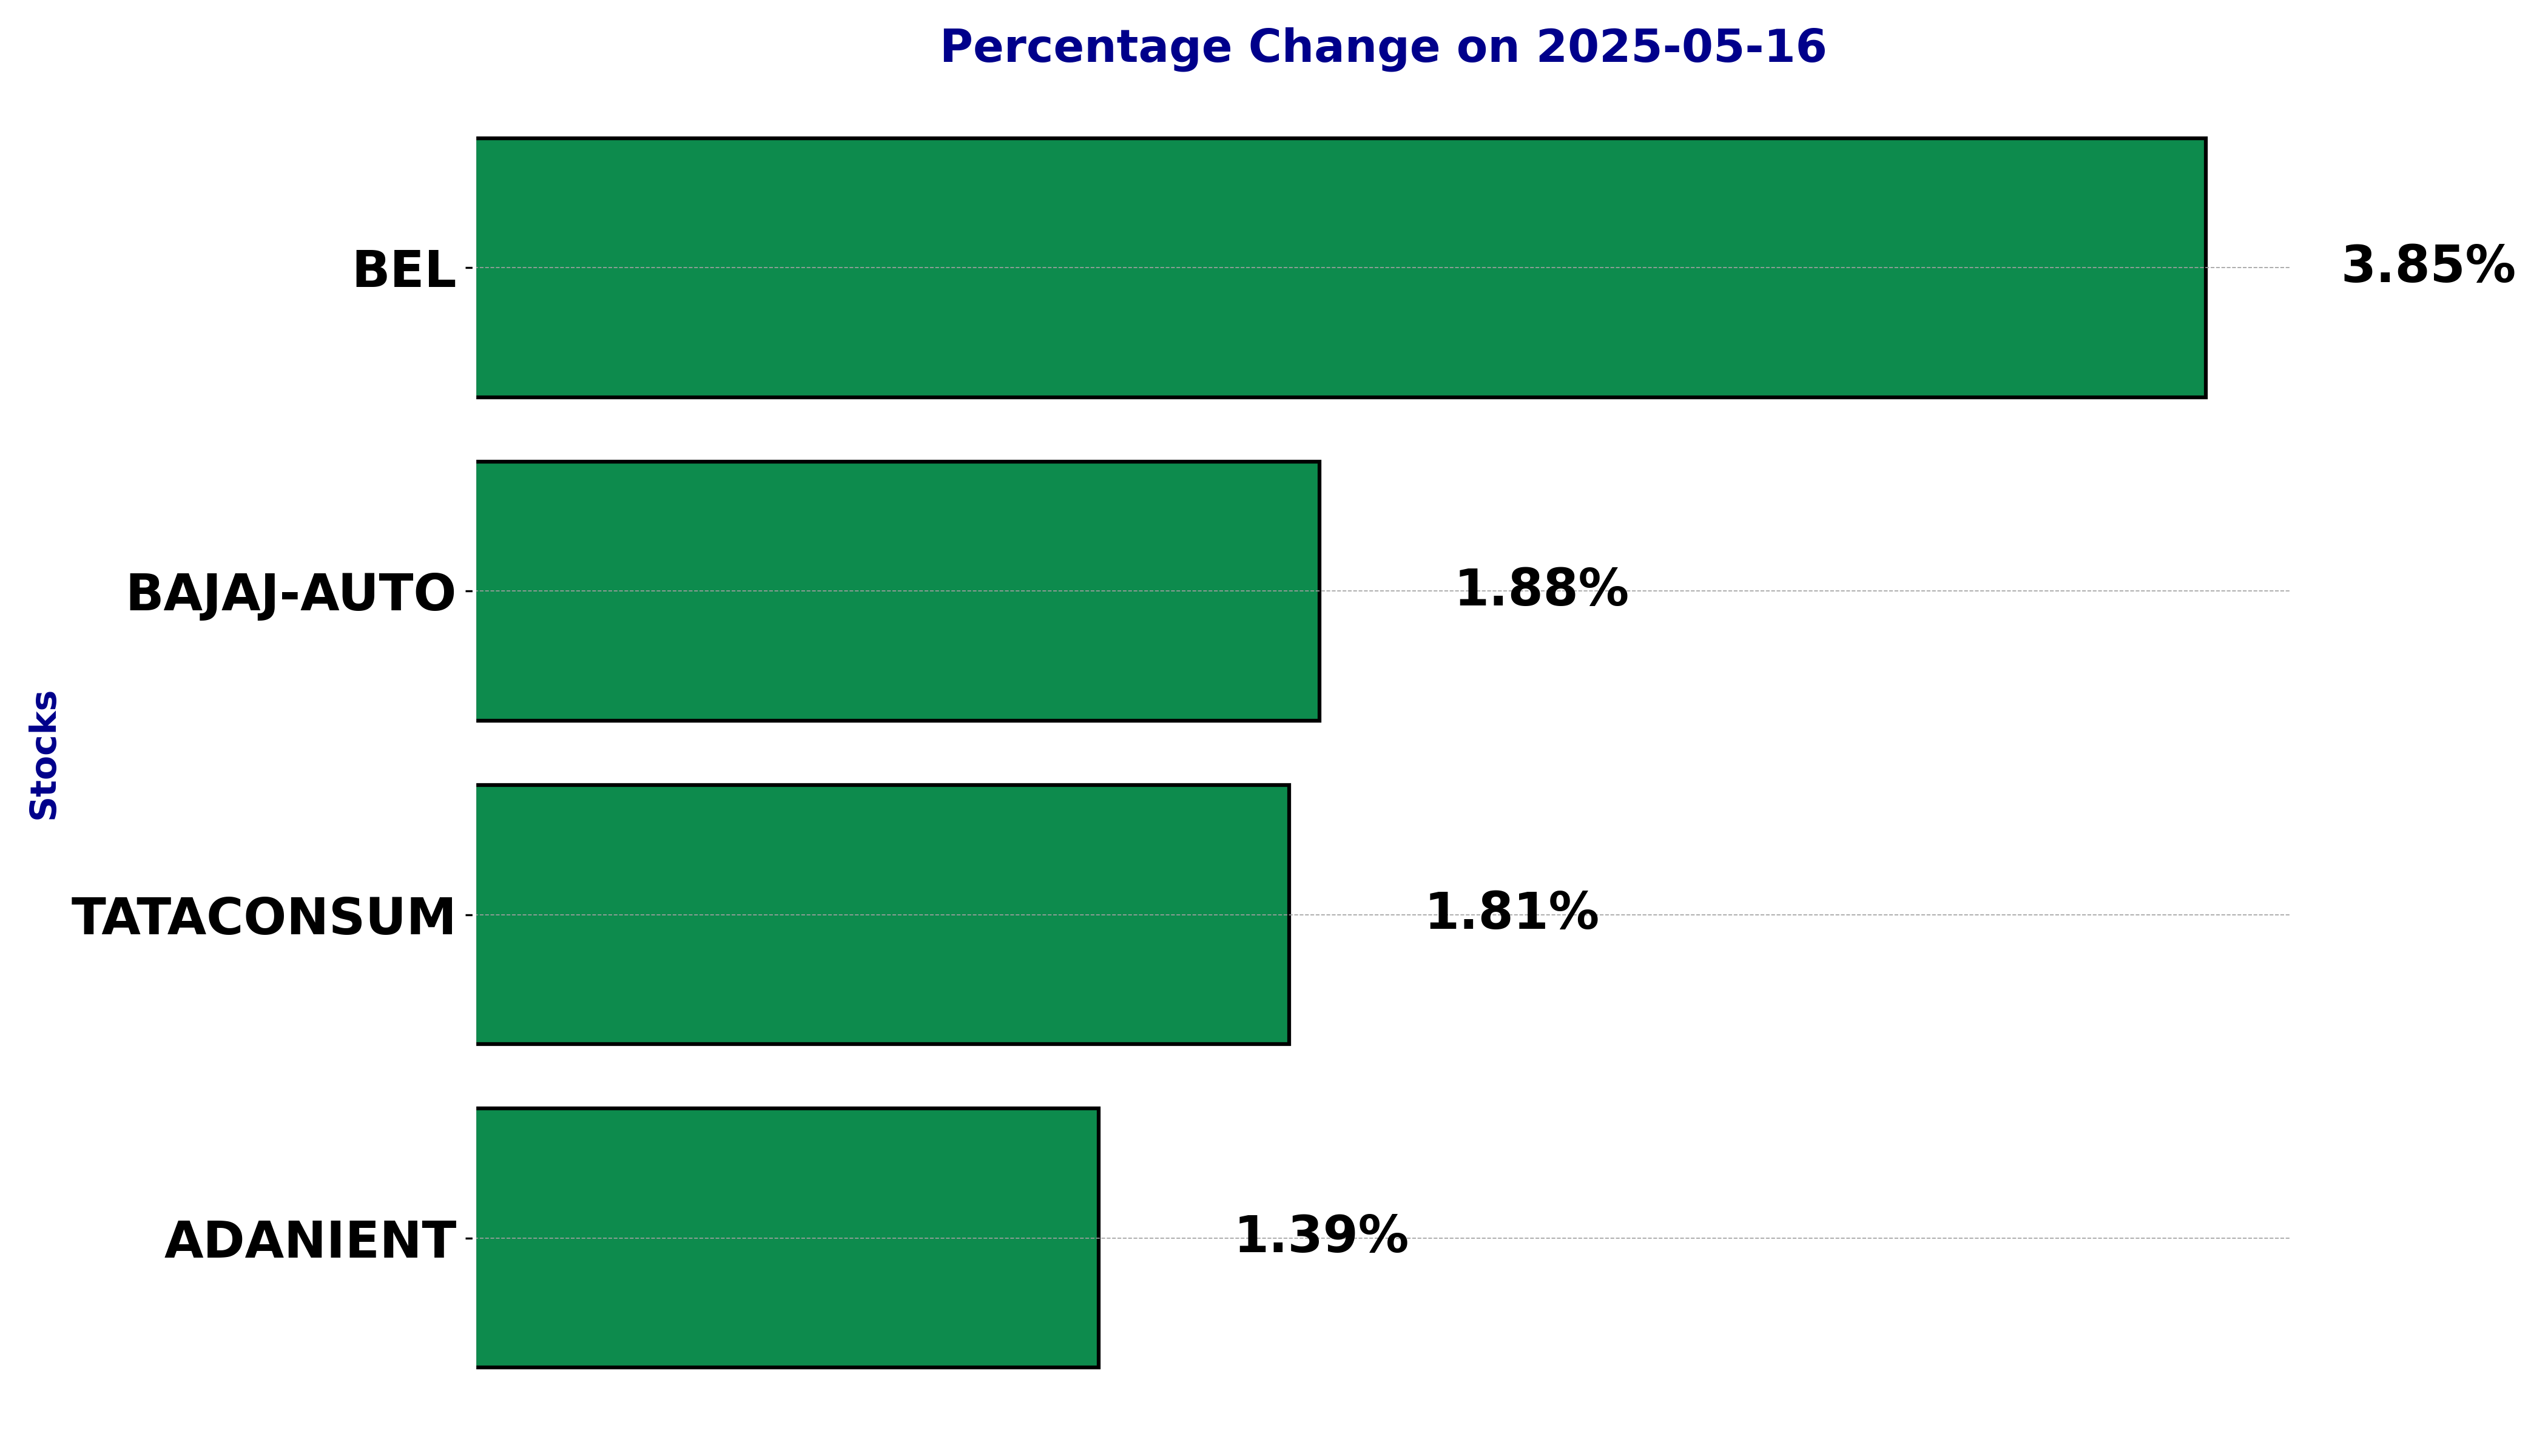
Top 5 Nifty 50 gainers today – May 16, 2025: Biggest stock moves
In this article, we will explore the technical indicators of some of the high-performing stocks on the Indian stock market, including ADANIENT, BAJAJ-AUTO, BEL, and TATACONSUM.
By looking at these stocks through the lens of key technical factors, we aim to better understand their price movements, trends, and potential future performance.
Analysis for Adani Enterprises - May 16, 2025
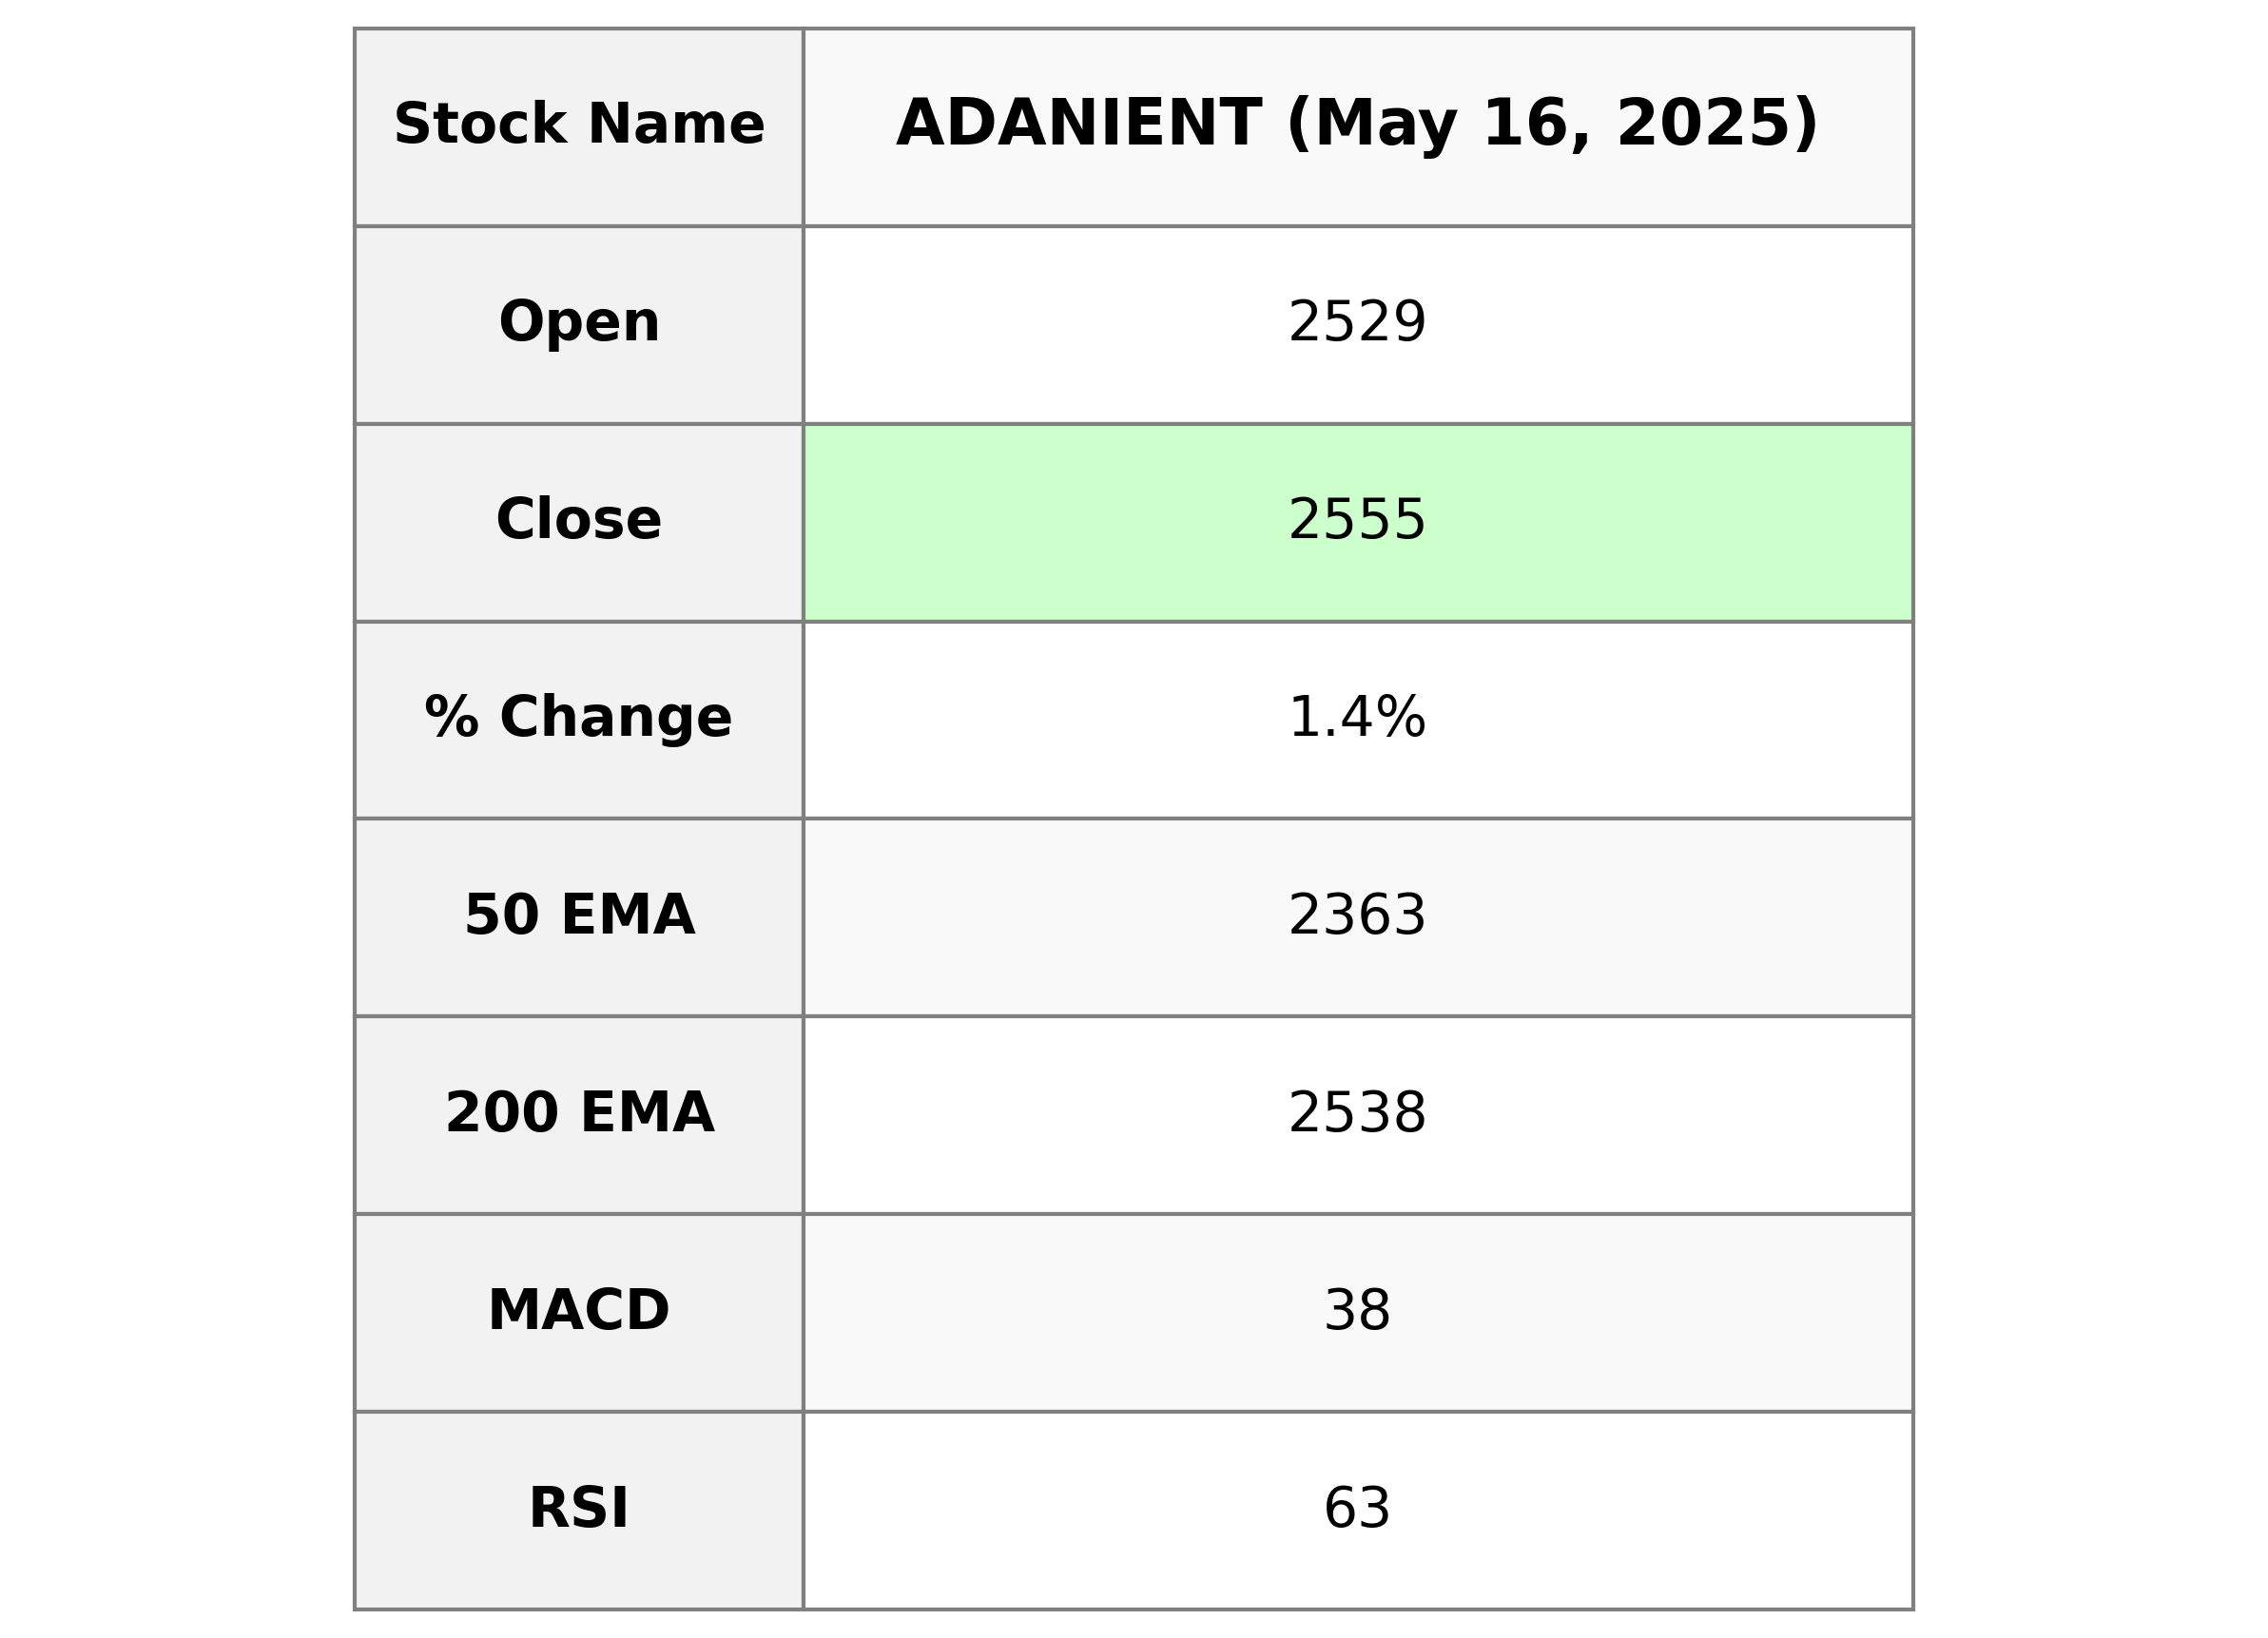
Stock Performance: Adani Enterprises opened at 2529, reaching a high of 2584.20 and a low of 2516.20, concluding at 2555. This marks a percentage change of approximately 1.39% from the previous close of 2520, with a points change of 35. The trading volume was 1,640,969. Technical Indicators and Market Metrics: The company currently has a 50-day EMA of 2362.73 and a 200-day EMA of 2538.20, indicating the stock is trading above both averages. The RSI is at 63.40, suggesting a level approaching overbought conditions, while the MACD of 38.03 is above the MACD Signal of 20.25. The market cap stands at 2,948,929,945,600 with a PE ratio of 42.07 and EPS of 60.73. Sector Information: Adani Enterprises operates in the Energy sector, primarily in the Thermal Coal industry, and is headquartered in India.
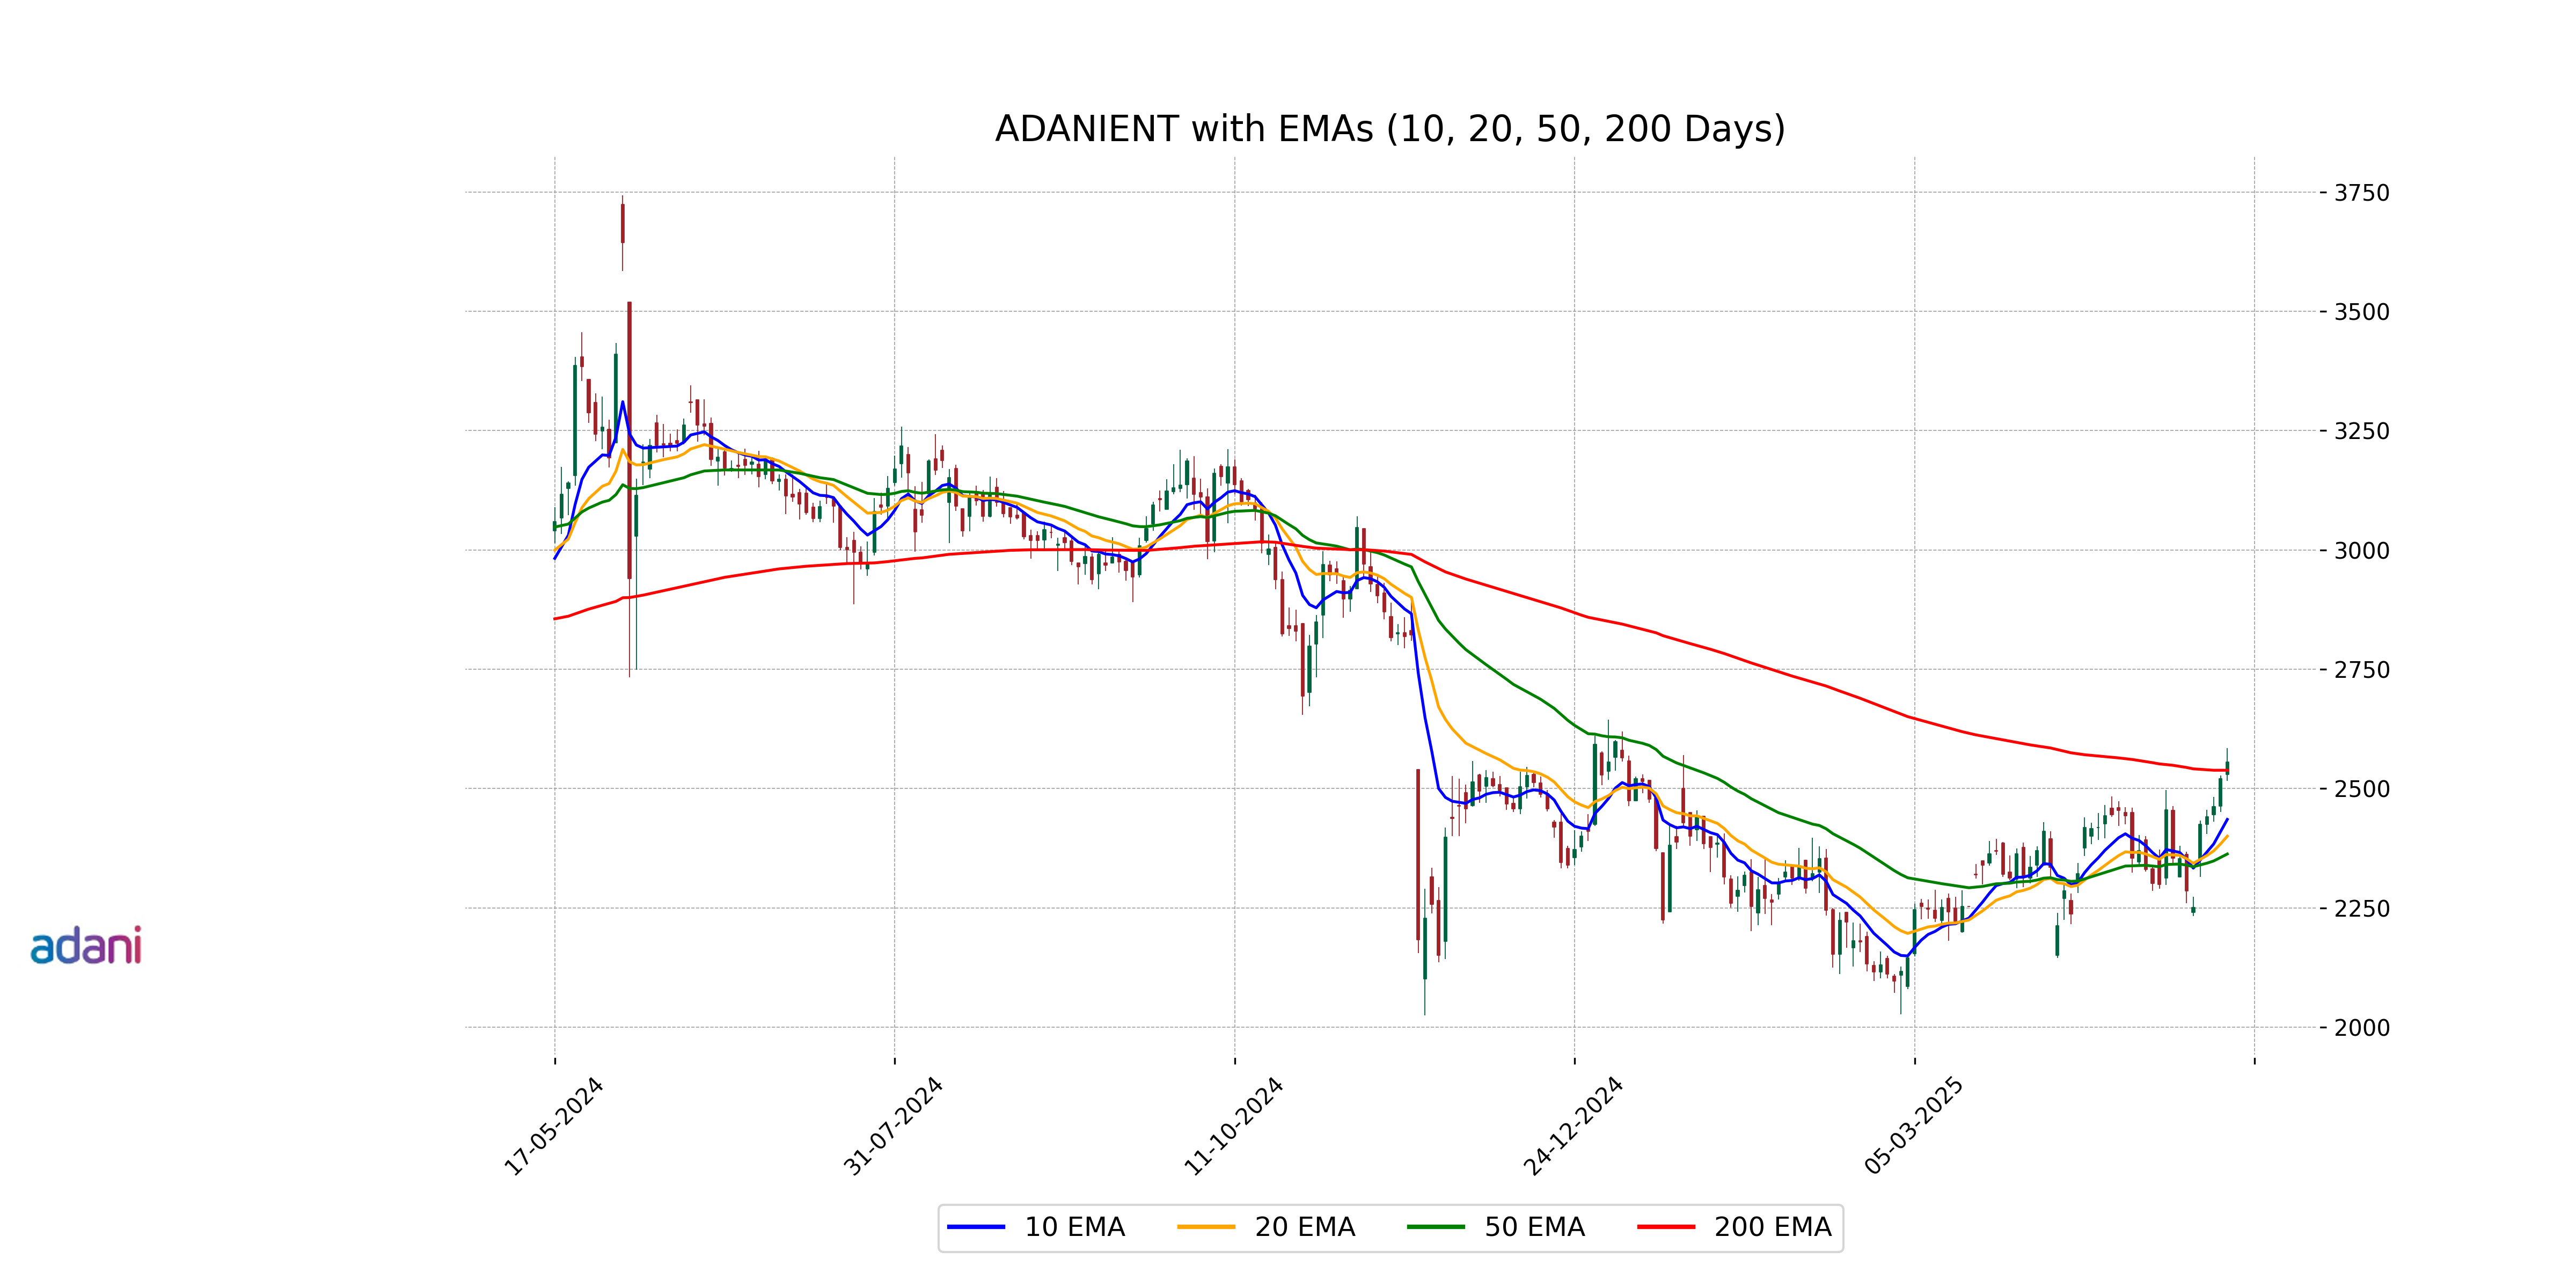
Relationship with Key Moving Averages
Adani Enterprises is trading above its 50 EMA of 2362.73 and near its 200 EMA of 2538.20, indicating a short-term bullish trend with potential resistance around the 200 EMA. The close price of 2555.0 also suggests strength relative to its shorter-term EMAs.
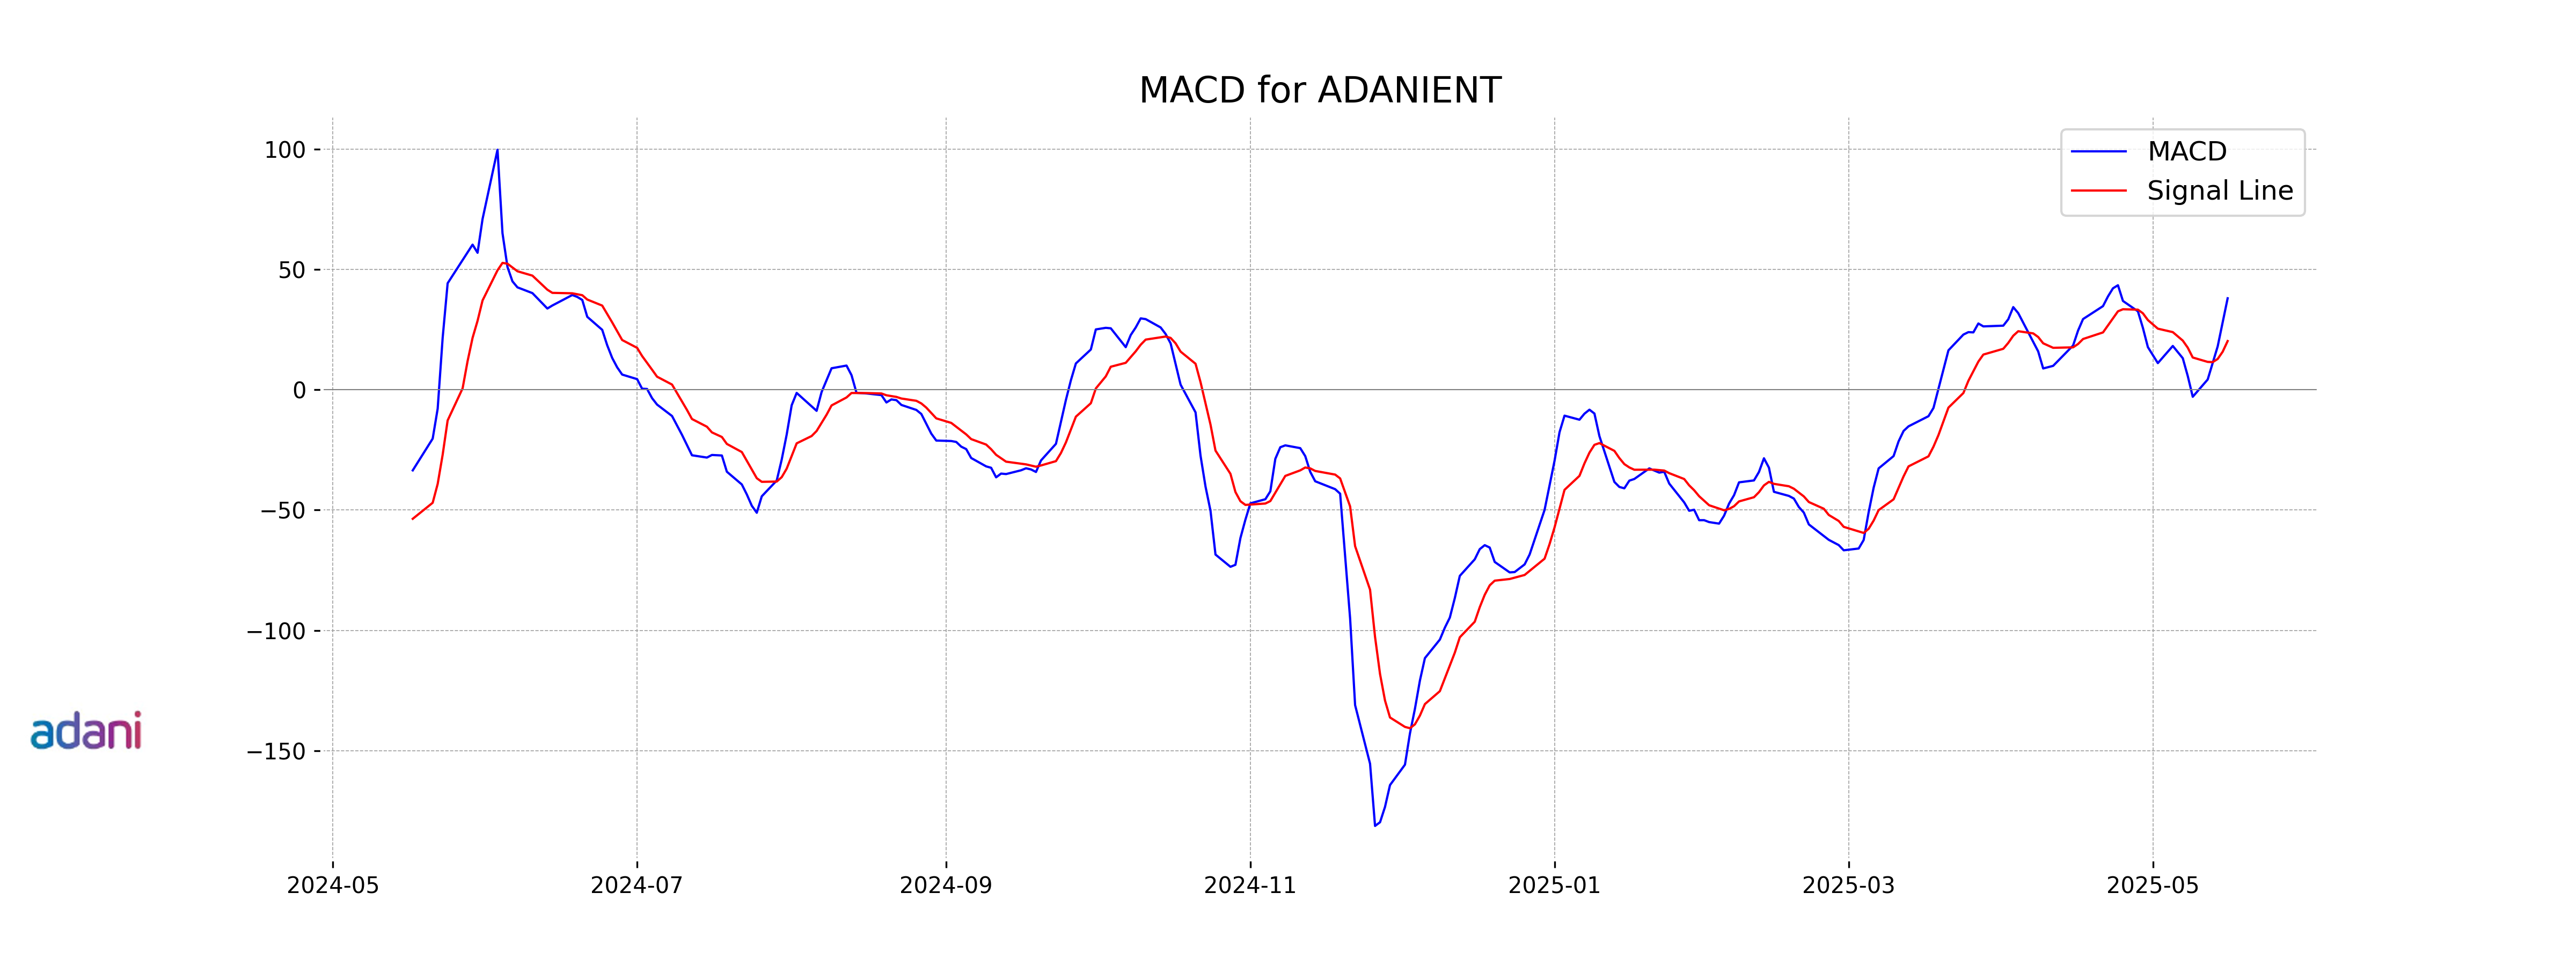
Moving Averages Trend (MACD)
MACD Analysis for Adani Enterprises: The MACD (38.03) is above the MACD Signal (20.25), indicating a bullish momentum for Adani Enterprises. With an RSI of 63.40, the stock shows strength and potential for continued upward movement, though it's nearing the overbought territory.
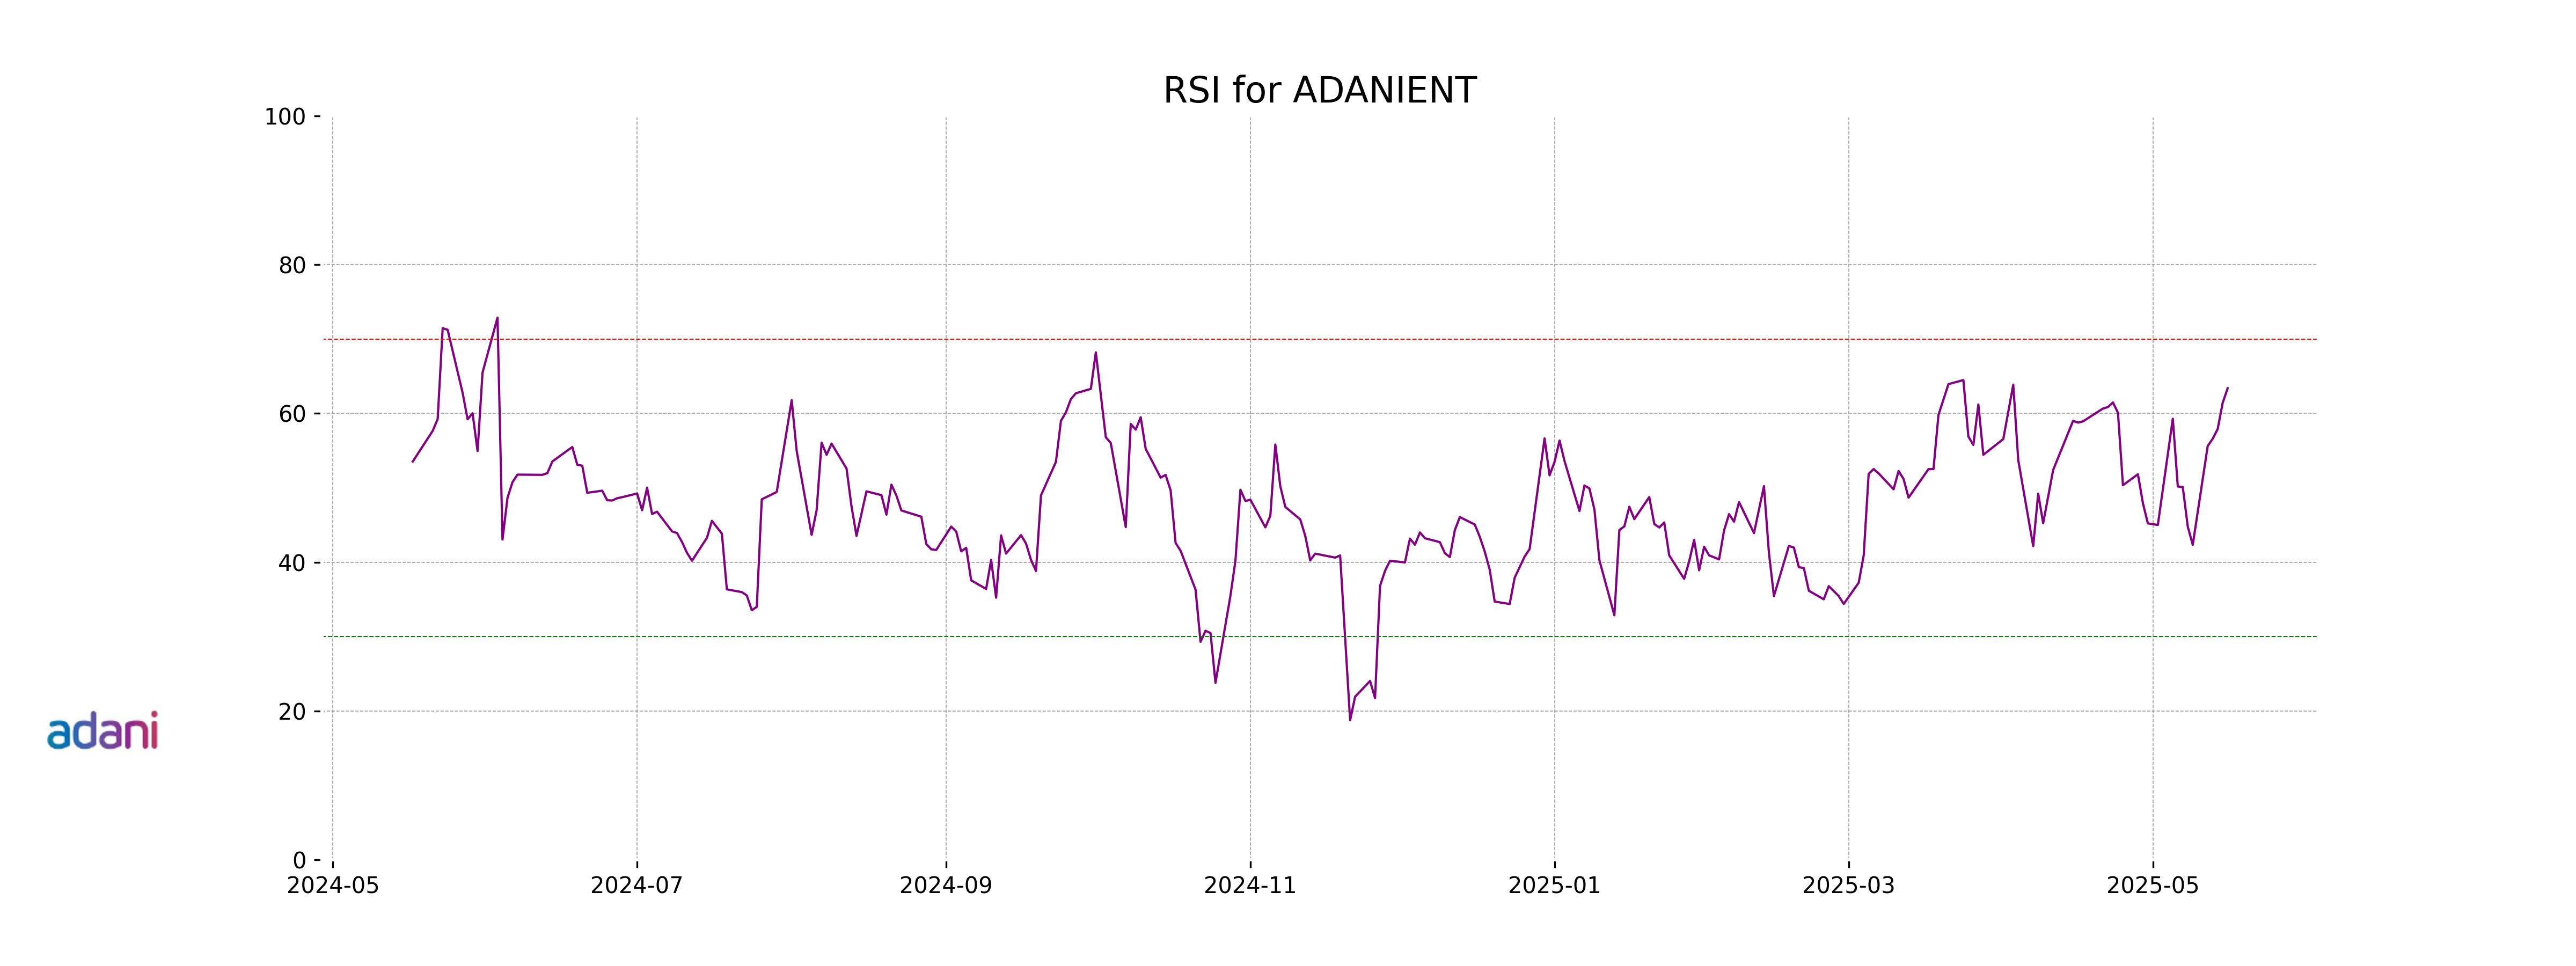
RSI Analysis
Adani Enterprises has an RSI of 63.40, indicating a stock that is neither overbought nor oversold, but leans towards the higher end of the neutral zone. This level suggests that there is some upward momentum, but not excessively so, implying stability with a potential for strength continuation.
Analysis for Bajaj Auto - May 16, 2025
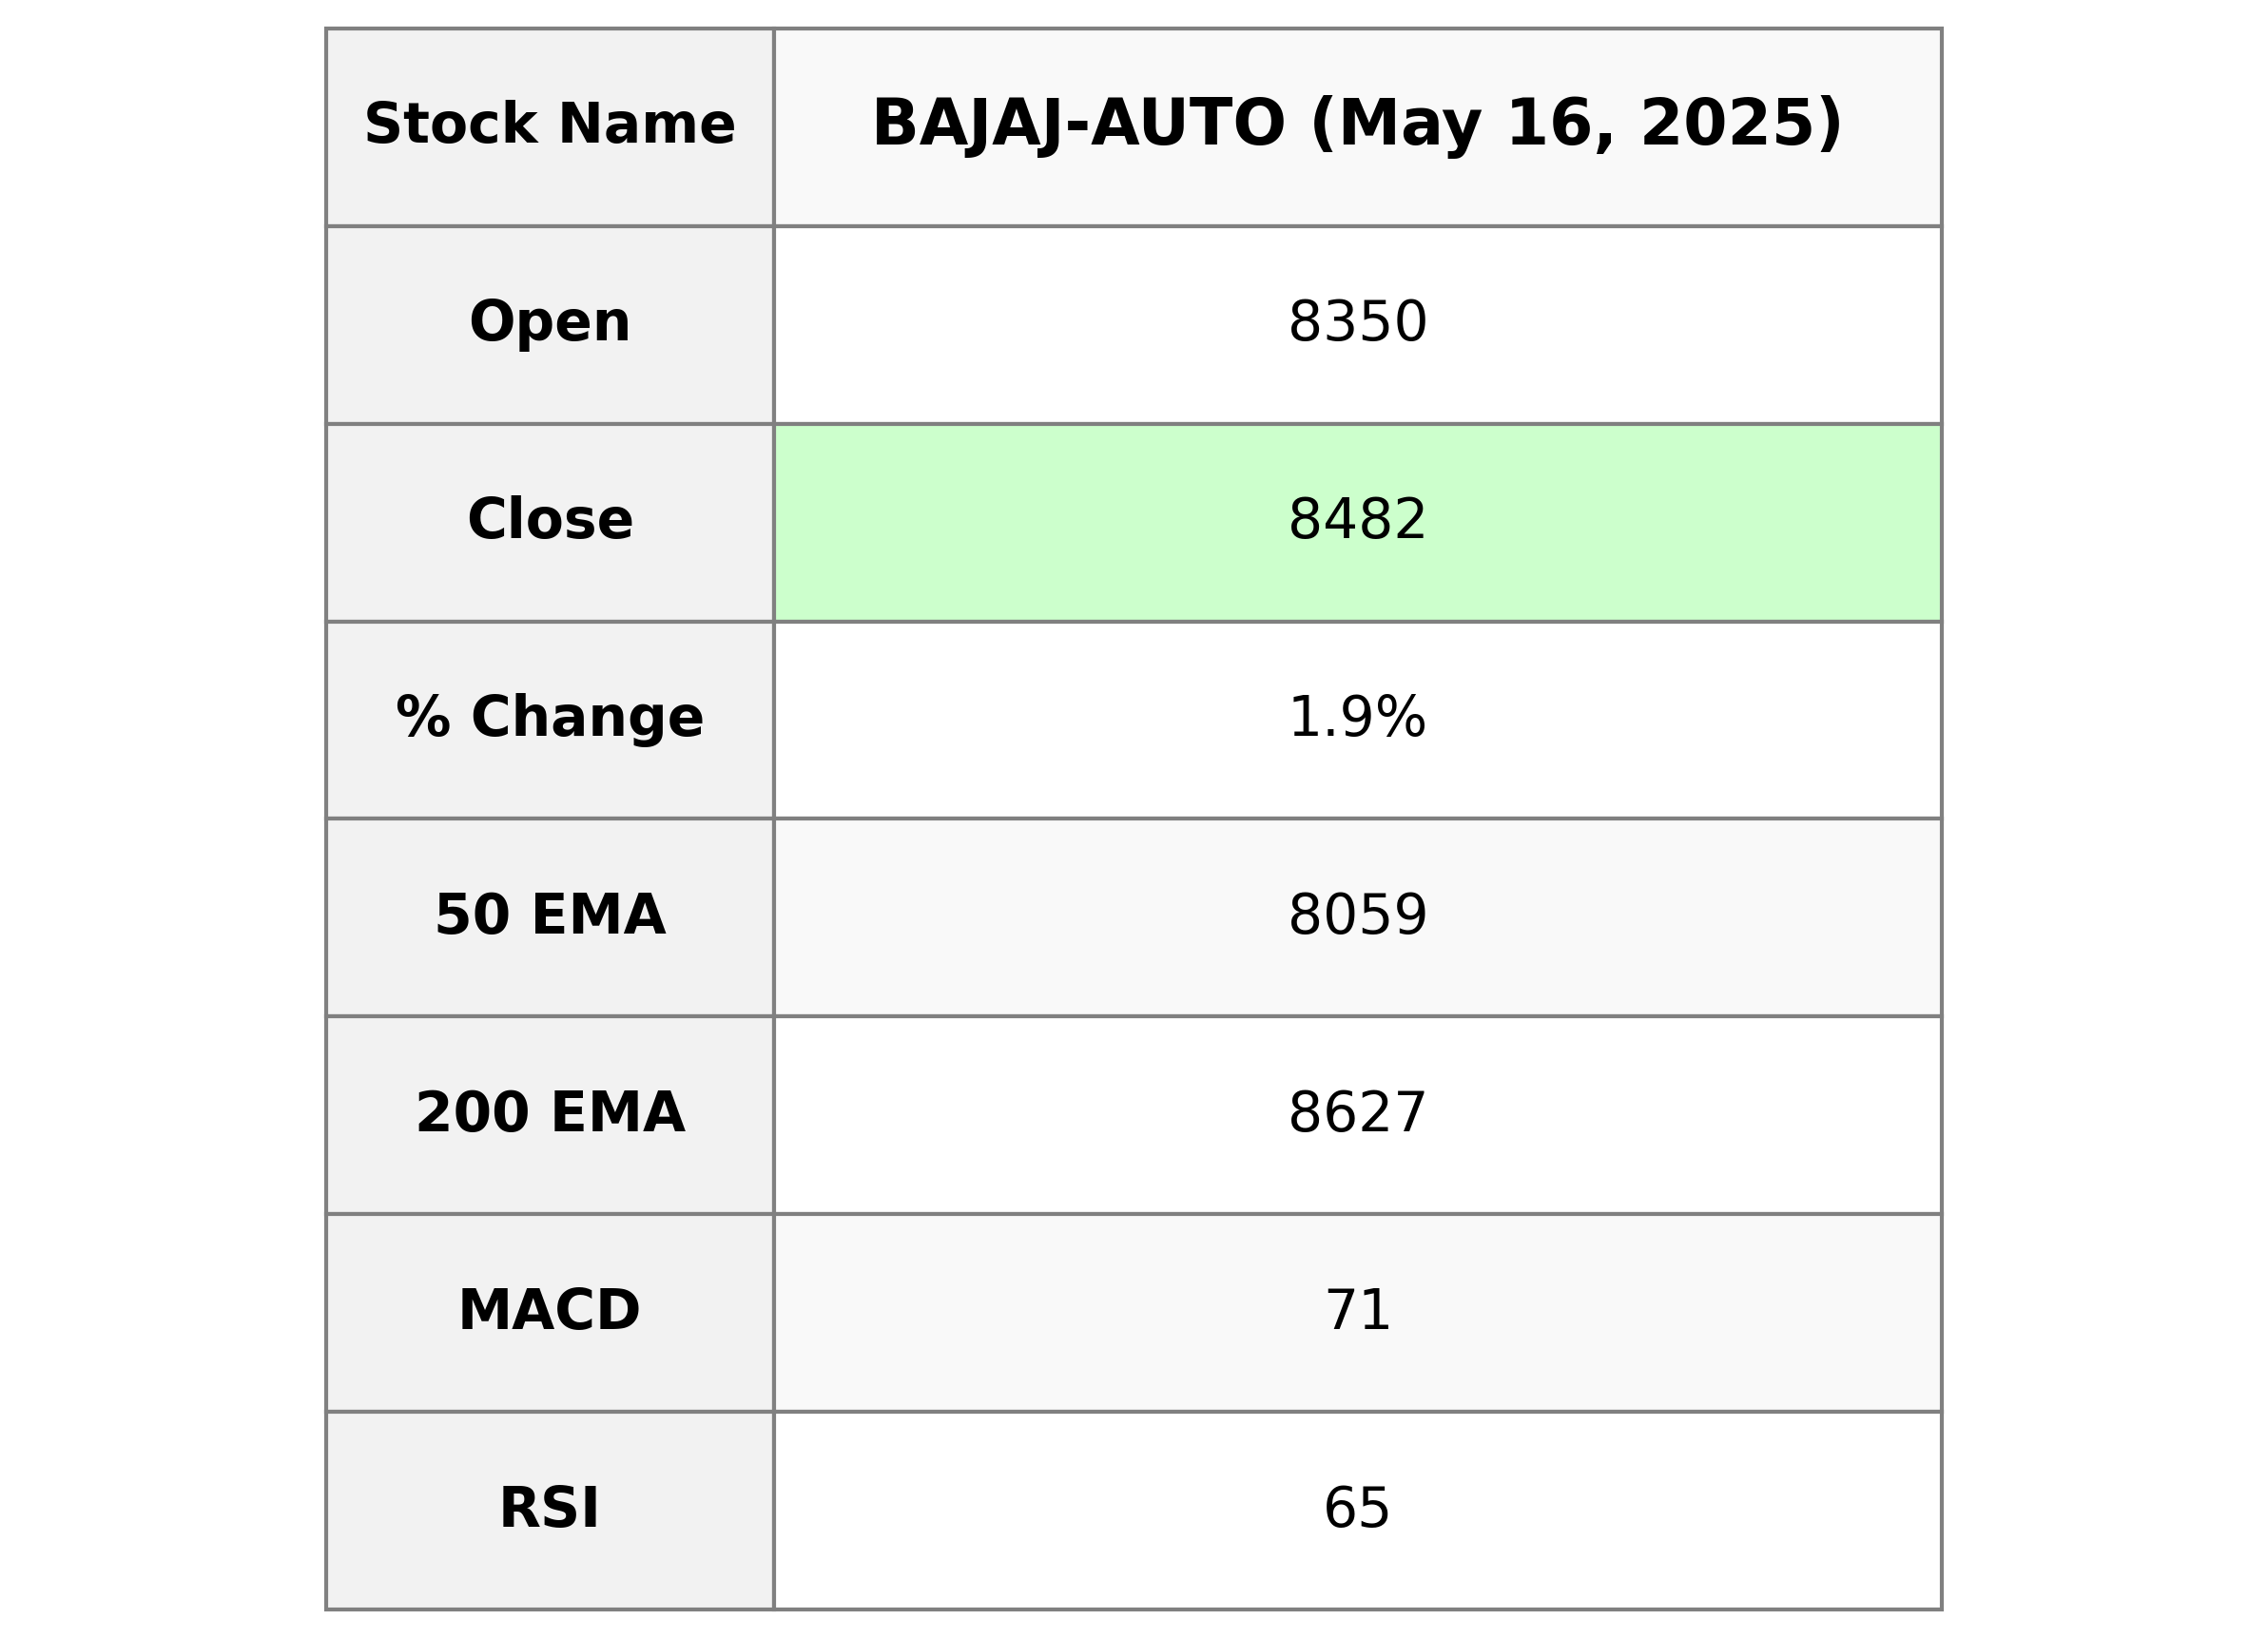
Bajaj Auto experienced a positive trading session, closing at 8482.5, marking a 1.88% increase from the previous close. With a healthy volume of 483,090 and a current RSI of 64.63, the stock shows bullish momentum against its longer-term EMAs. The auto manufacturer, part of the consumer cyclical sector in India, has a market capitalization of approximately 2.37 trillion INR.
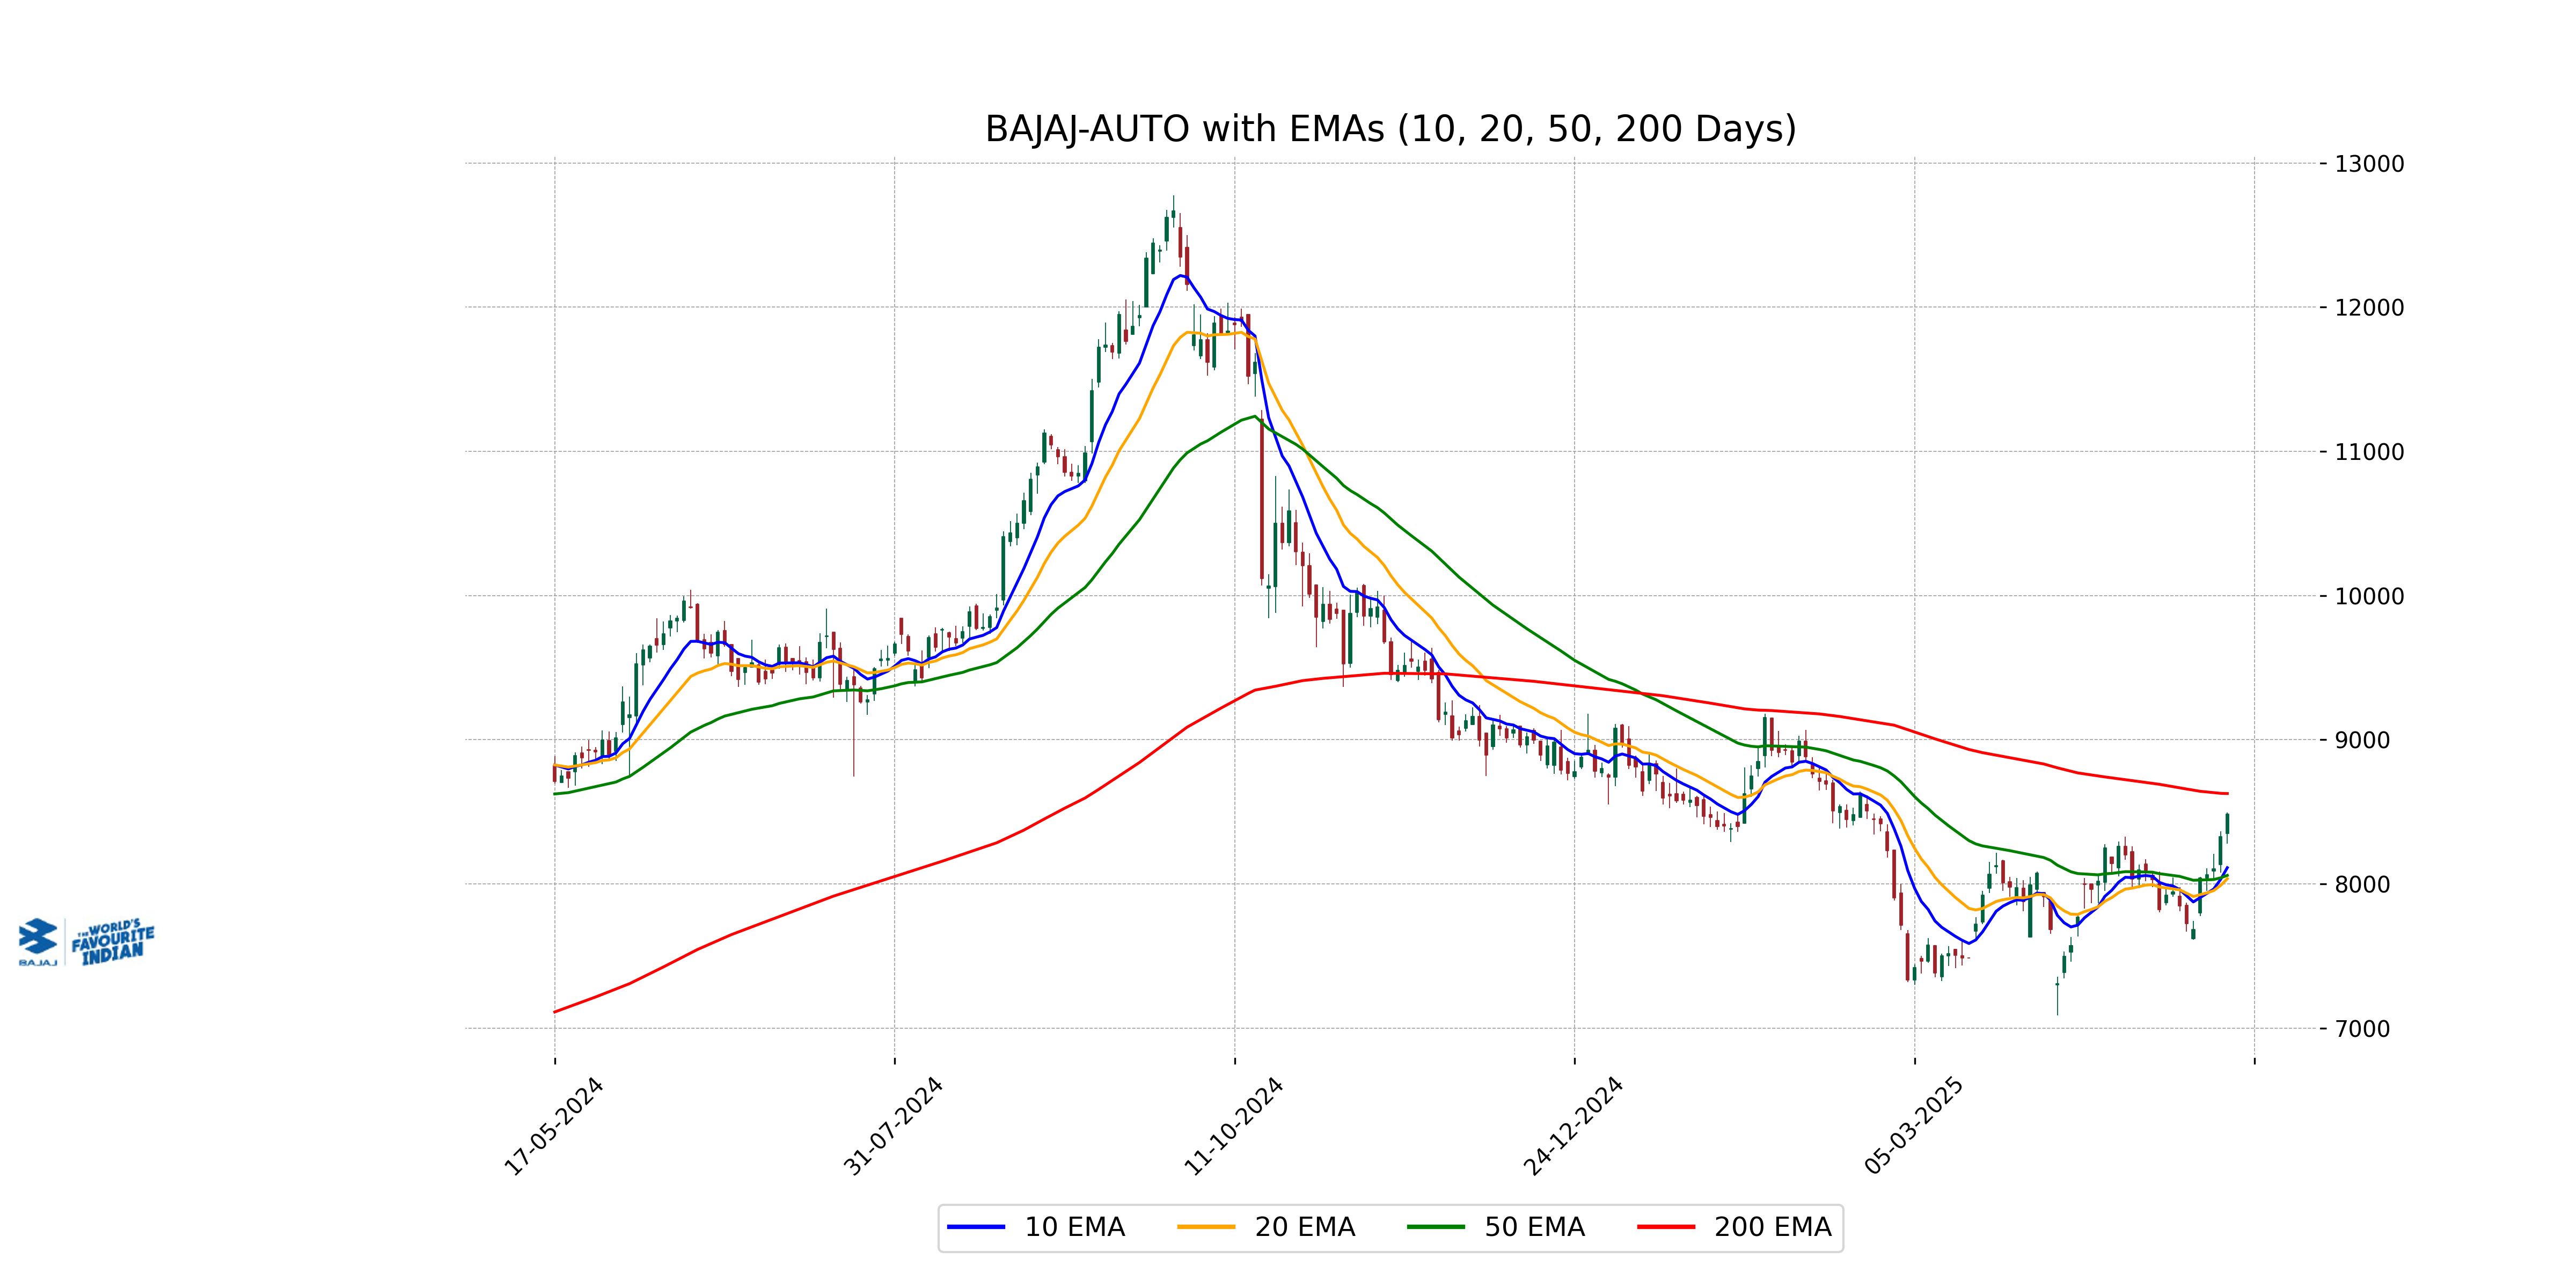
Relationship with Key Moving Averages
Bajaj Auto's close price of 8482.5 is above its 50-day EMA of 8059.02 and 10-day EMA of 8112.30, indicating a strong short-term uptrend, but it is below the 200-day EMA of 8626.60, suggesting it hasn't yet confirmed a long-term bullish trend.
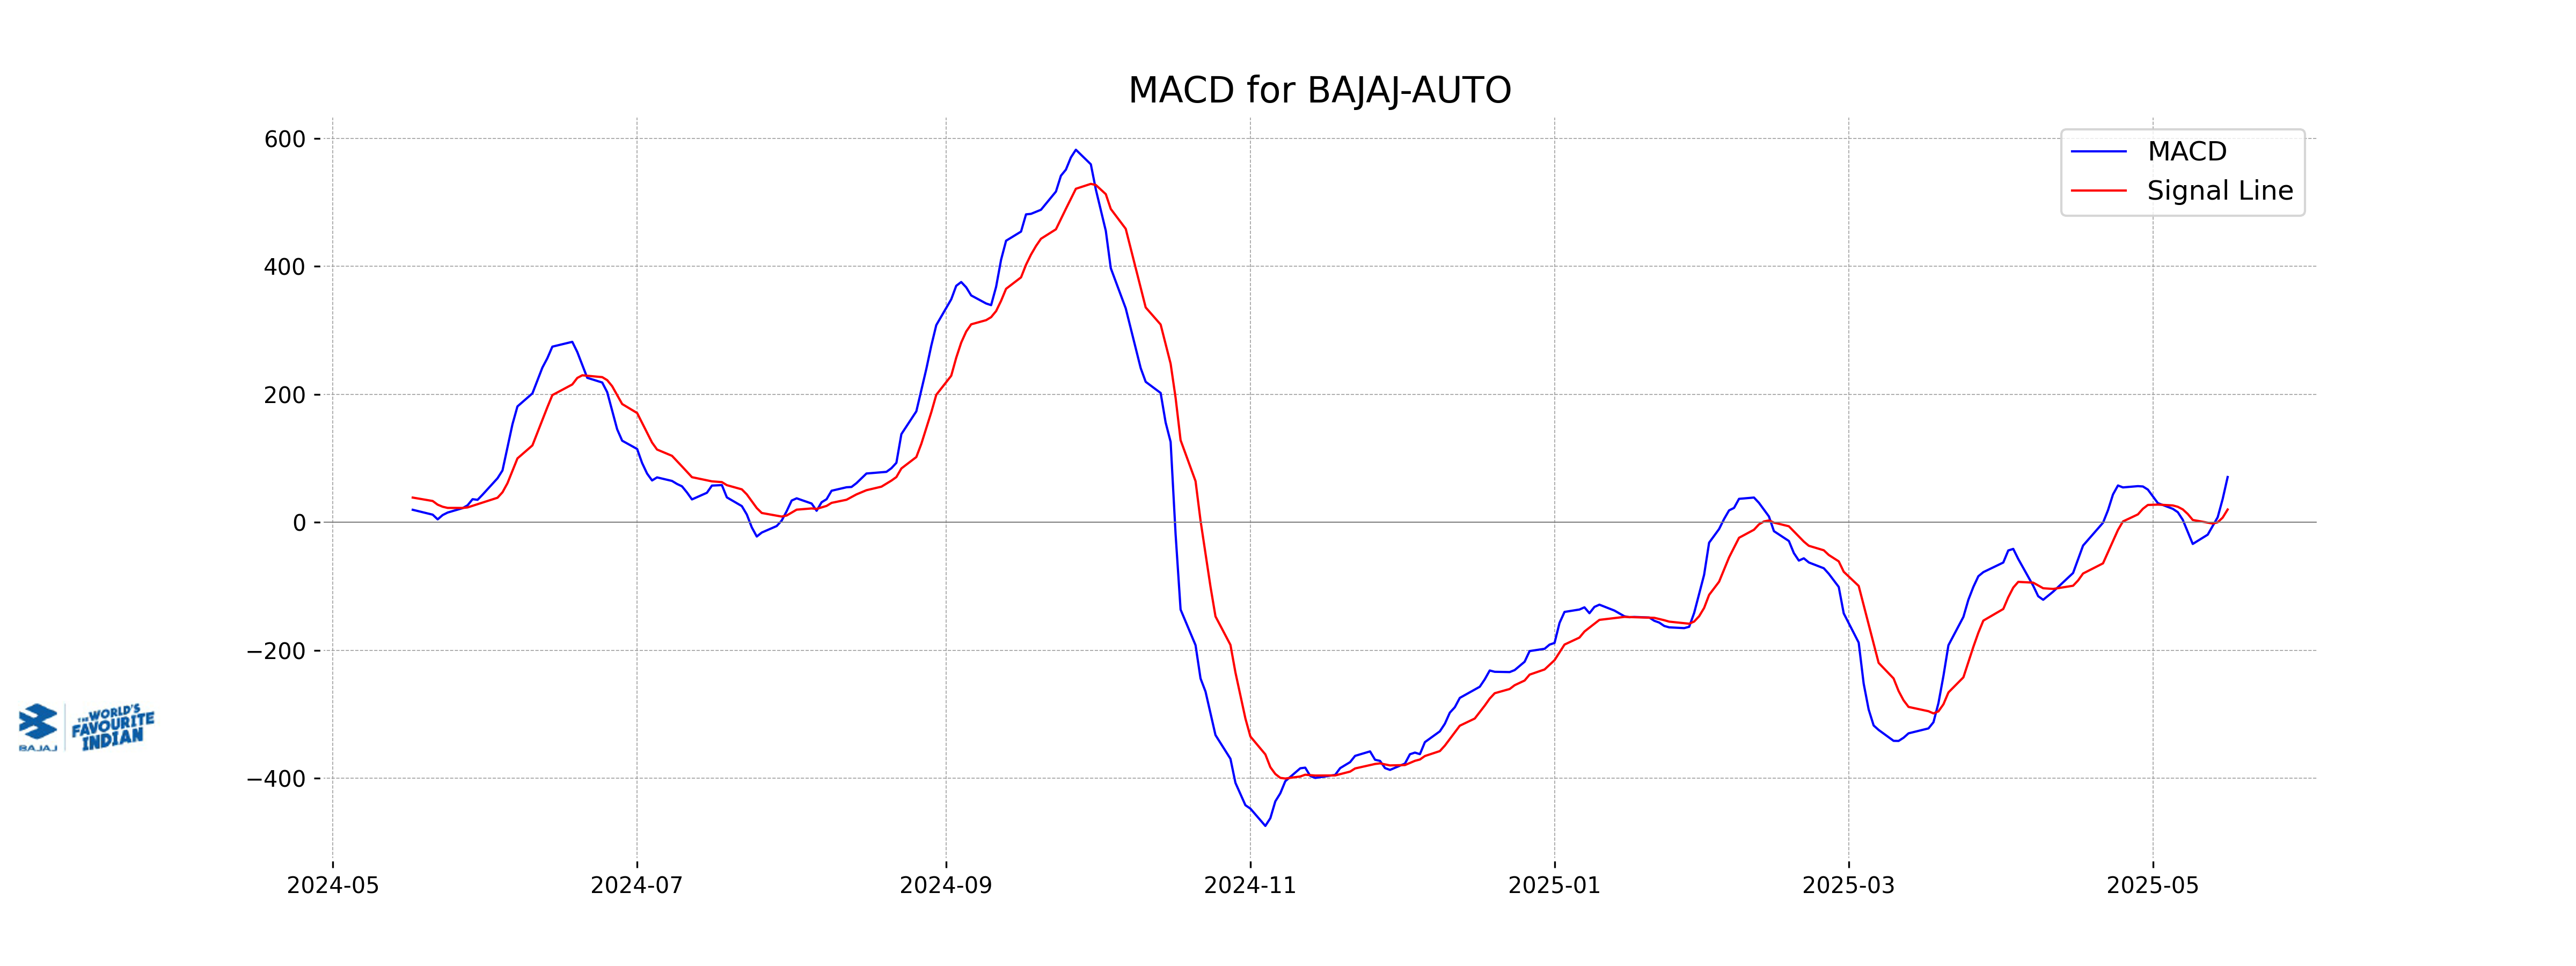
Moving Averages Trend (MACD)
MACD Analysis: Bajaj Auto's MACD value of 70.76, with a MACD Signal of 19.96, indicates a bullish momentum, as the MACD is significantly above the signal line. This suggests potential upward price movements if the trend continues.
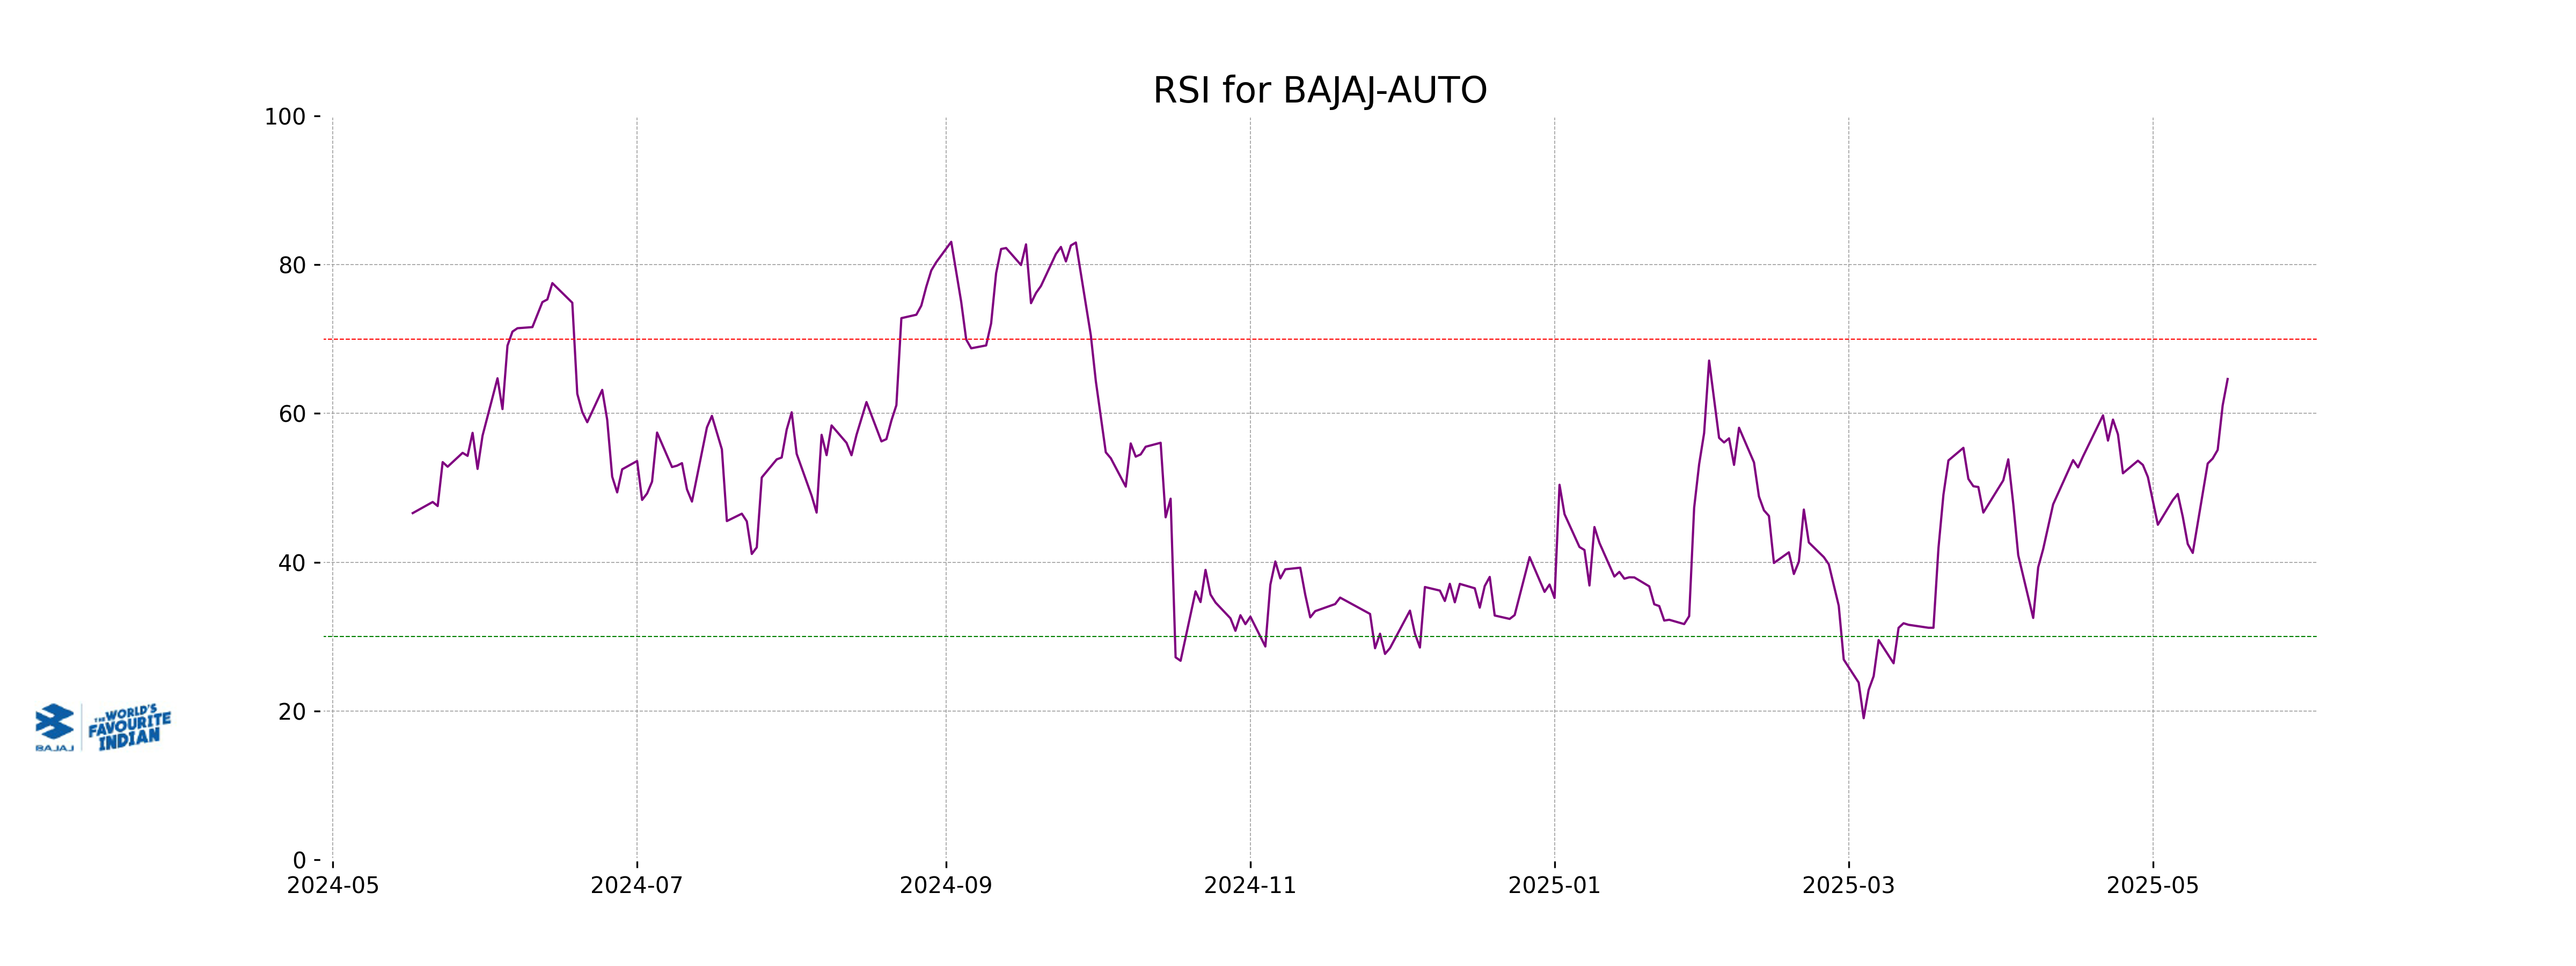
RSI Analysis
The RSI value for Bajaj Auto is 64.63, indicating that the stock is nearing overbought levels. Generally, an RSI above 70 is considered overbought, suggesting the stock might be due for a correction. However, it is currently in a neutral to slightly bullish zone, suggesting positive momentum.
Analysis for Bharat Electronics - May 16, 2025
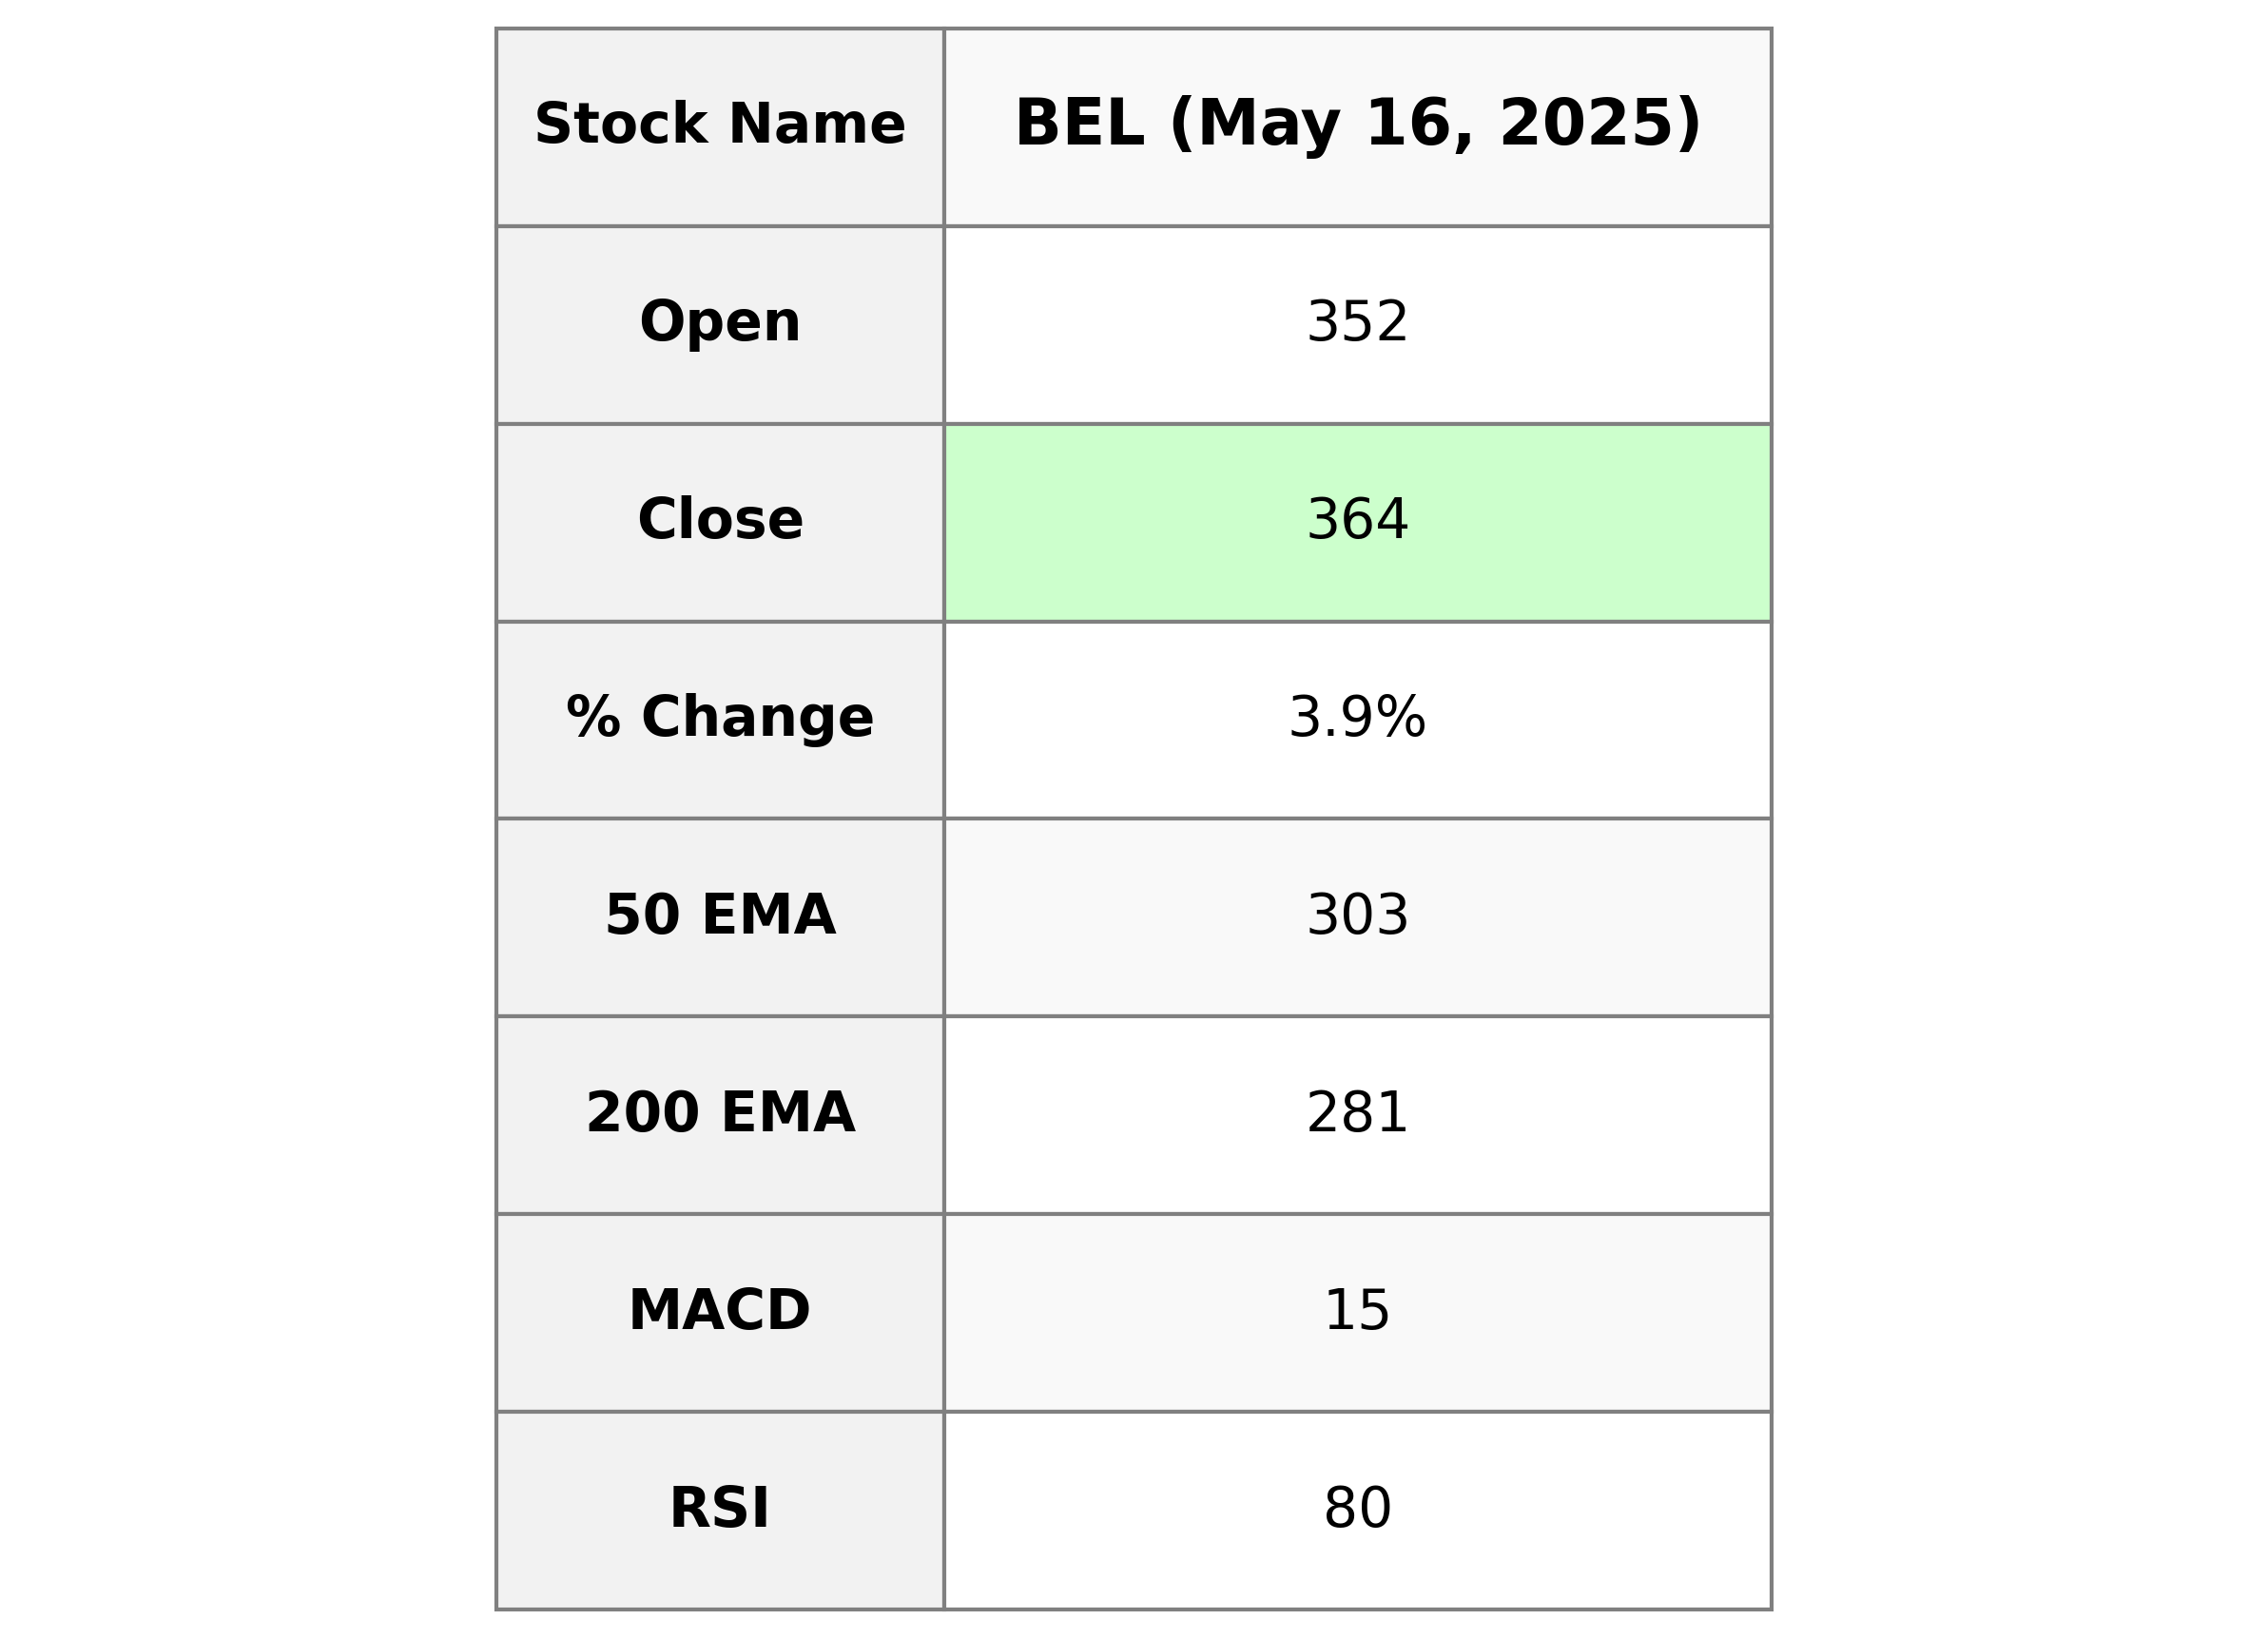
Bharat Electronics, a prominent player in the Aerospace & Defense sector in India, experienced a notable uptick in stock performance with a closing price of 363.90 INR. This signifies a 3.85% increase from the previous close, supported by strong trading volumes. Currently, the stock's RSI indicates overbought conditions, while technical indicators such as MACD suggest positive momentum. The company's market capitalization stands at approximately 2.66 trillion INR.
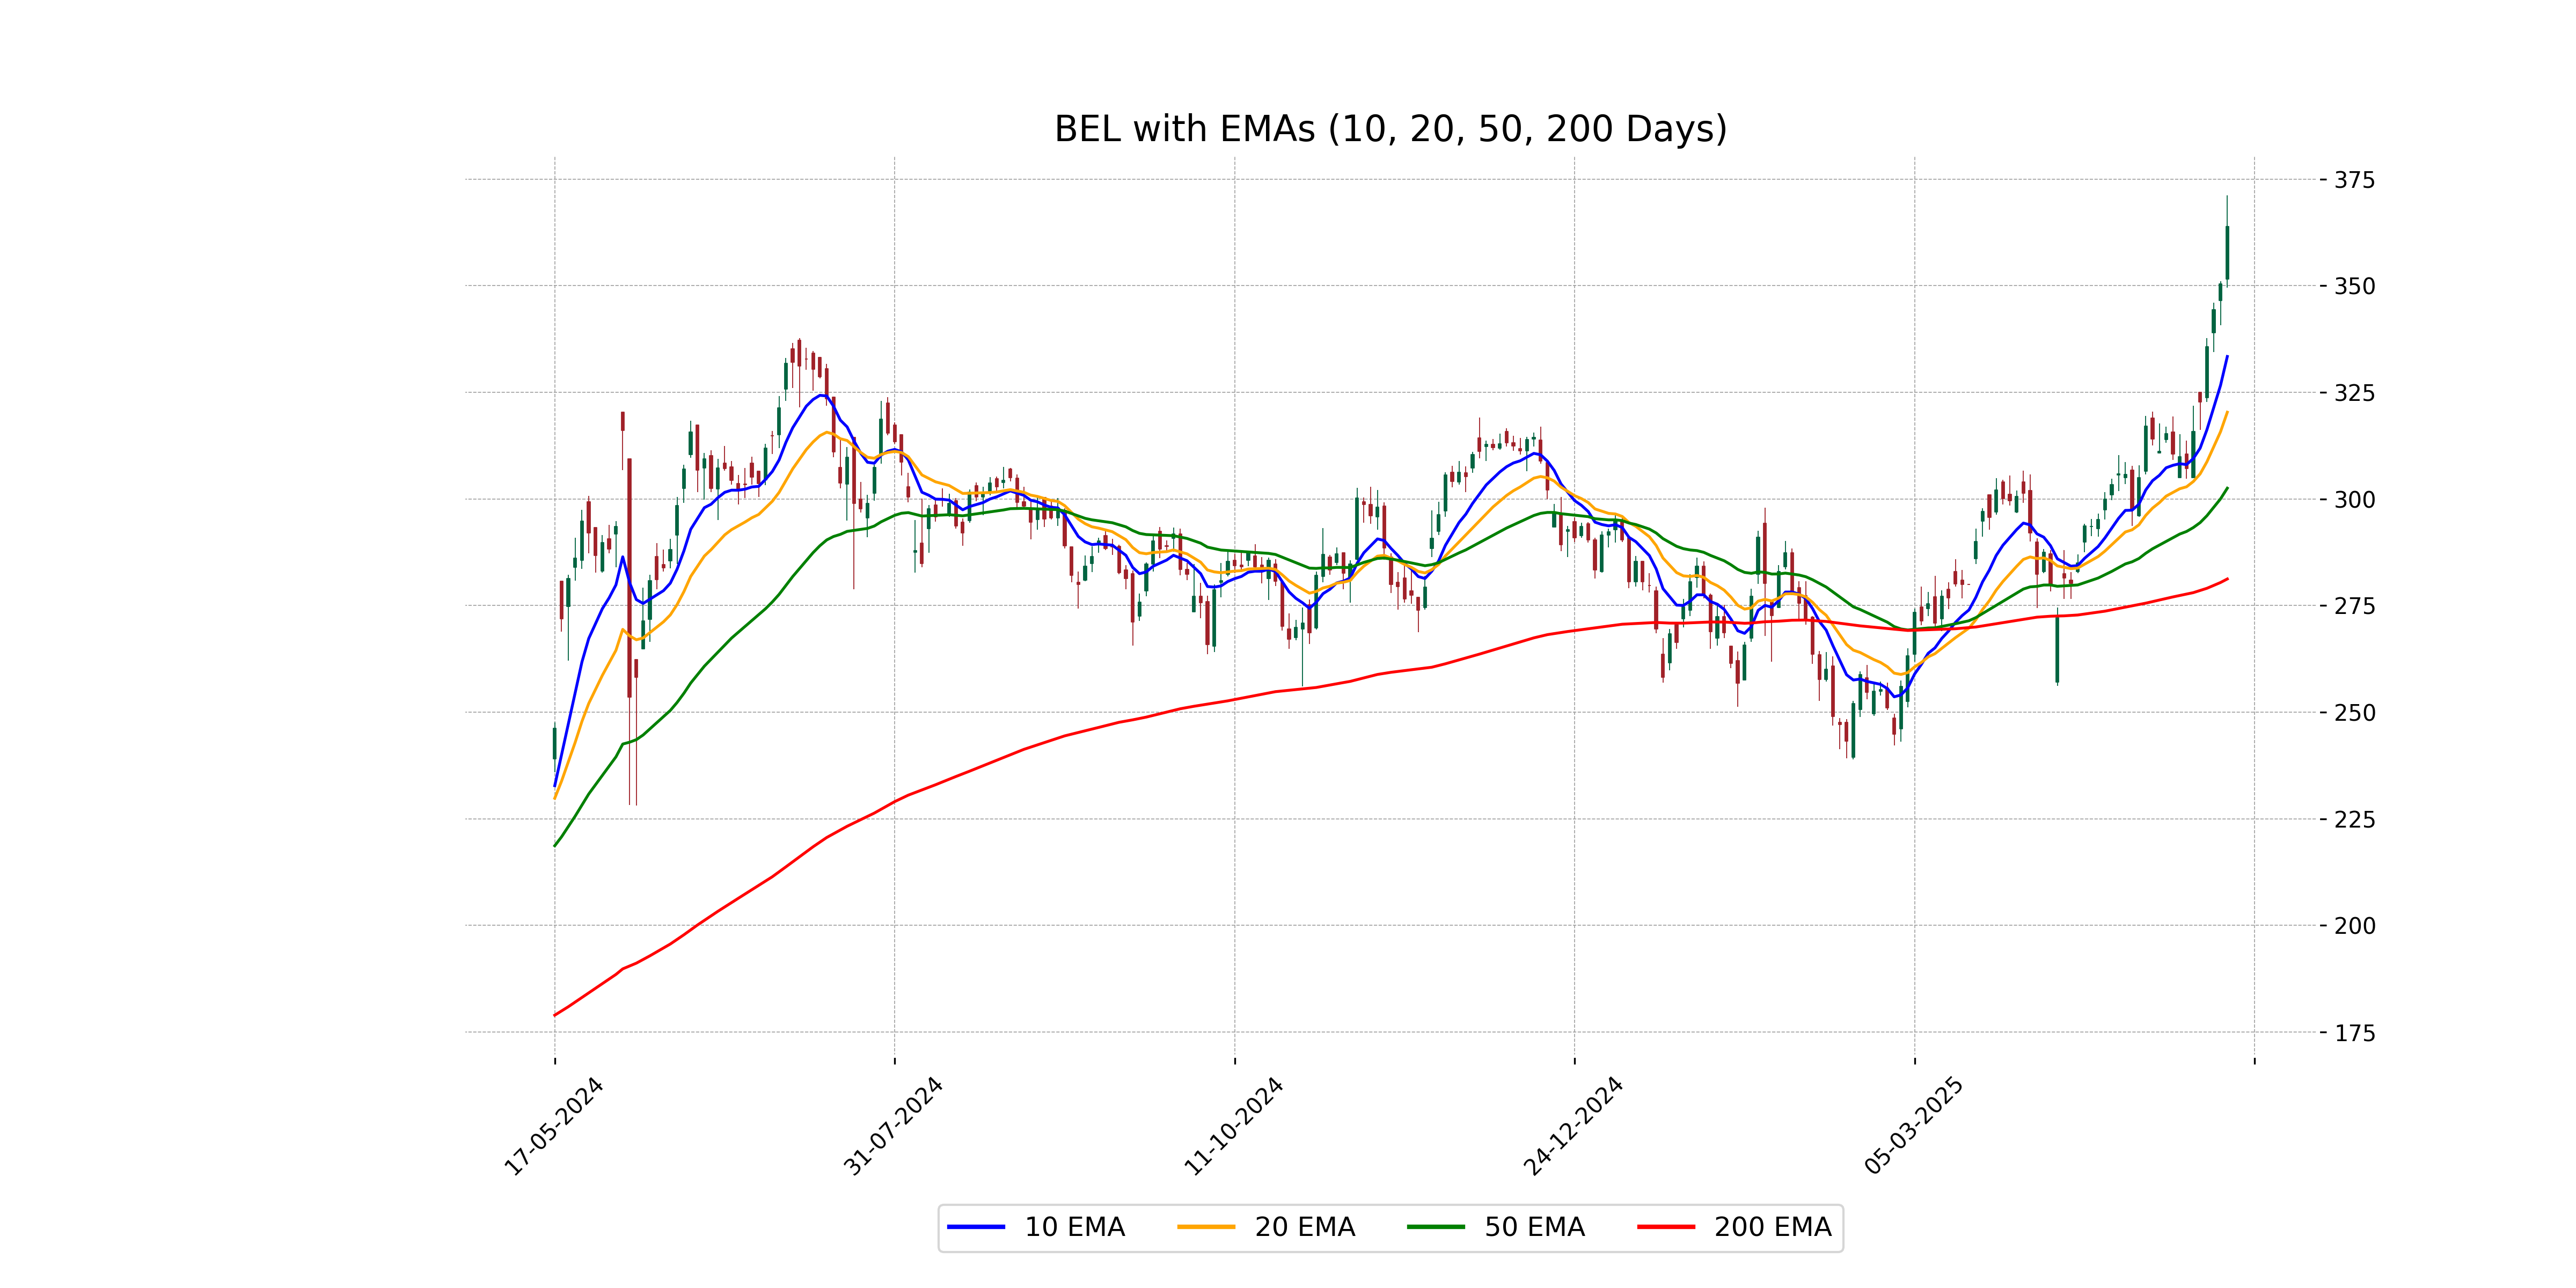
Relationship with Key Moving Averages
Bharat Electronics shows a strong upward trend as its current close price of 363.90 is significantly above all key moving averages, with a 50 EMA at 302.52, a 200 EMA at 281.23, and a 10 EMA at 333.41. This suggests robust momentum and recent price strength in its stock performance.
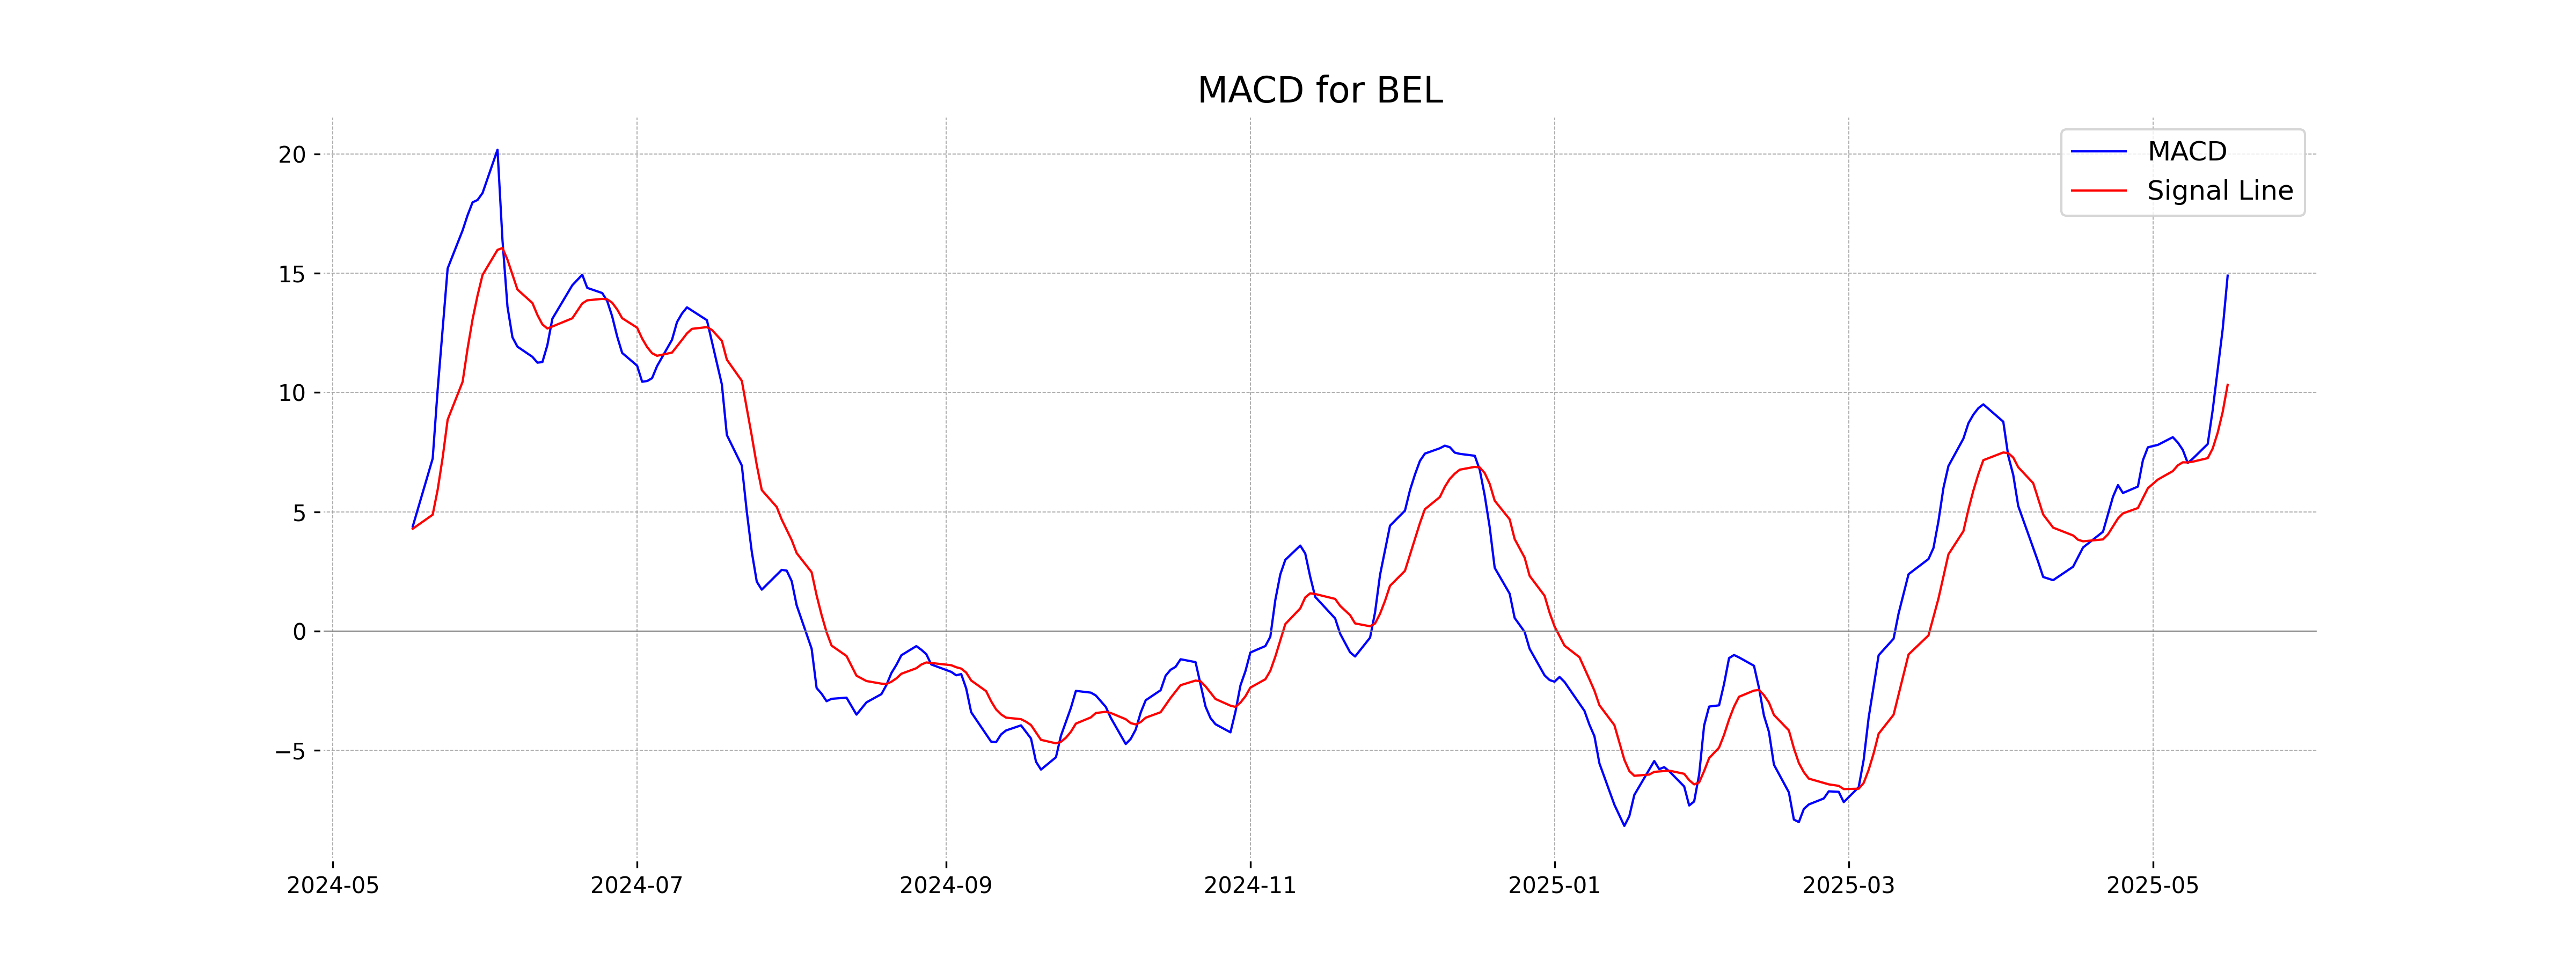
Moving Averages Trend (MACD)
Bharat Electronics' MACD value is significantly above the MACD Signal, indicating strong upward momentum. The MACD of 14.90 compared to the Signal of 10.32 suggests a bullish trend, which is further supported by a high RSI of 80.41, pointing to potential overbought conditions.
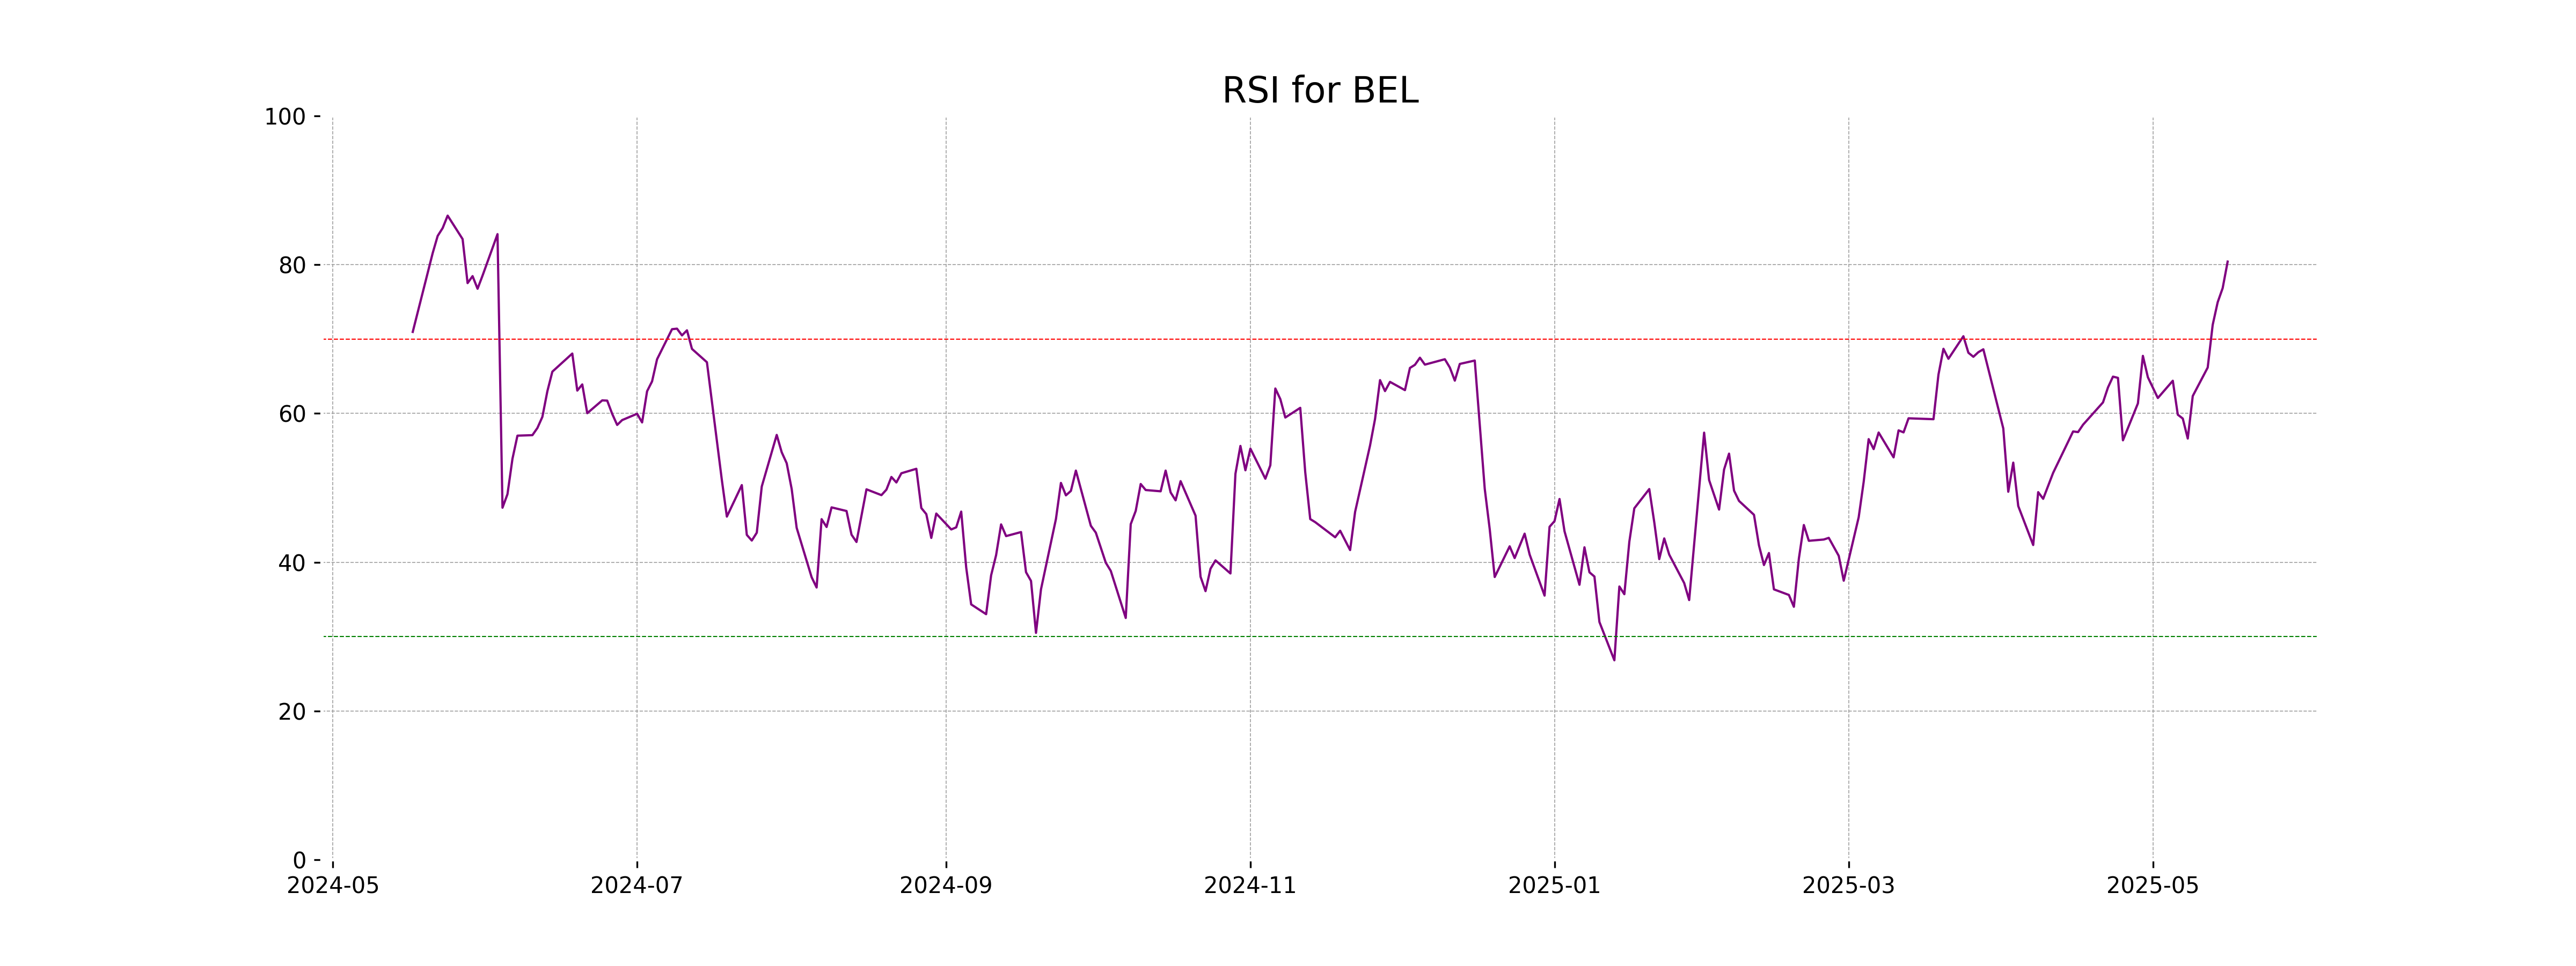
RSI Analysis
The RSI (Relative Strength Index) for Bharat Electronics is 80.41, which is well above the typical overbought threshold of 70. This indicates that the stock might be overbought, suggesting potential for a price correction or consolidation in the near term.
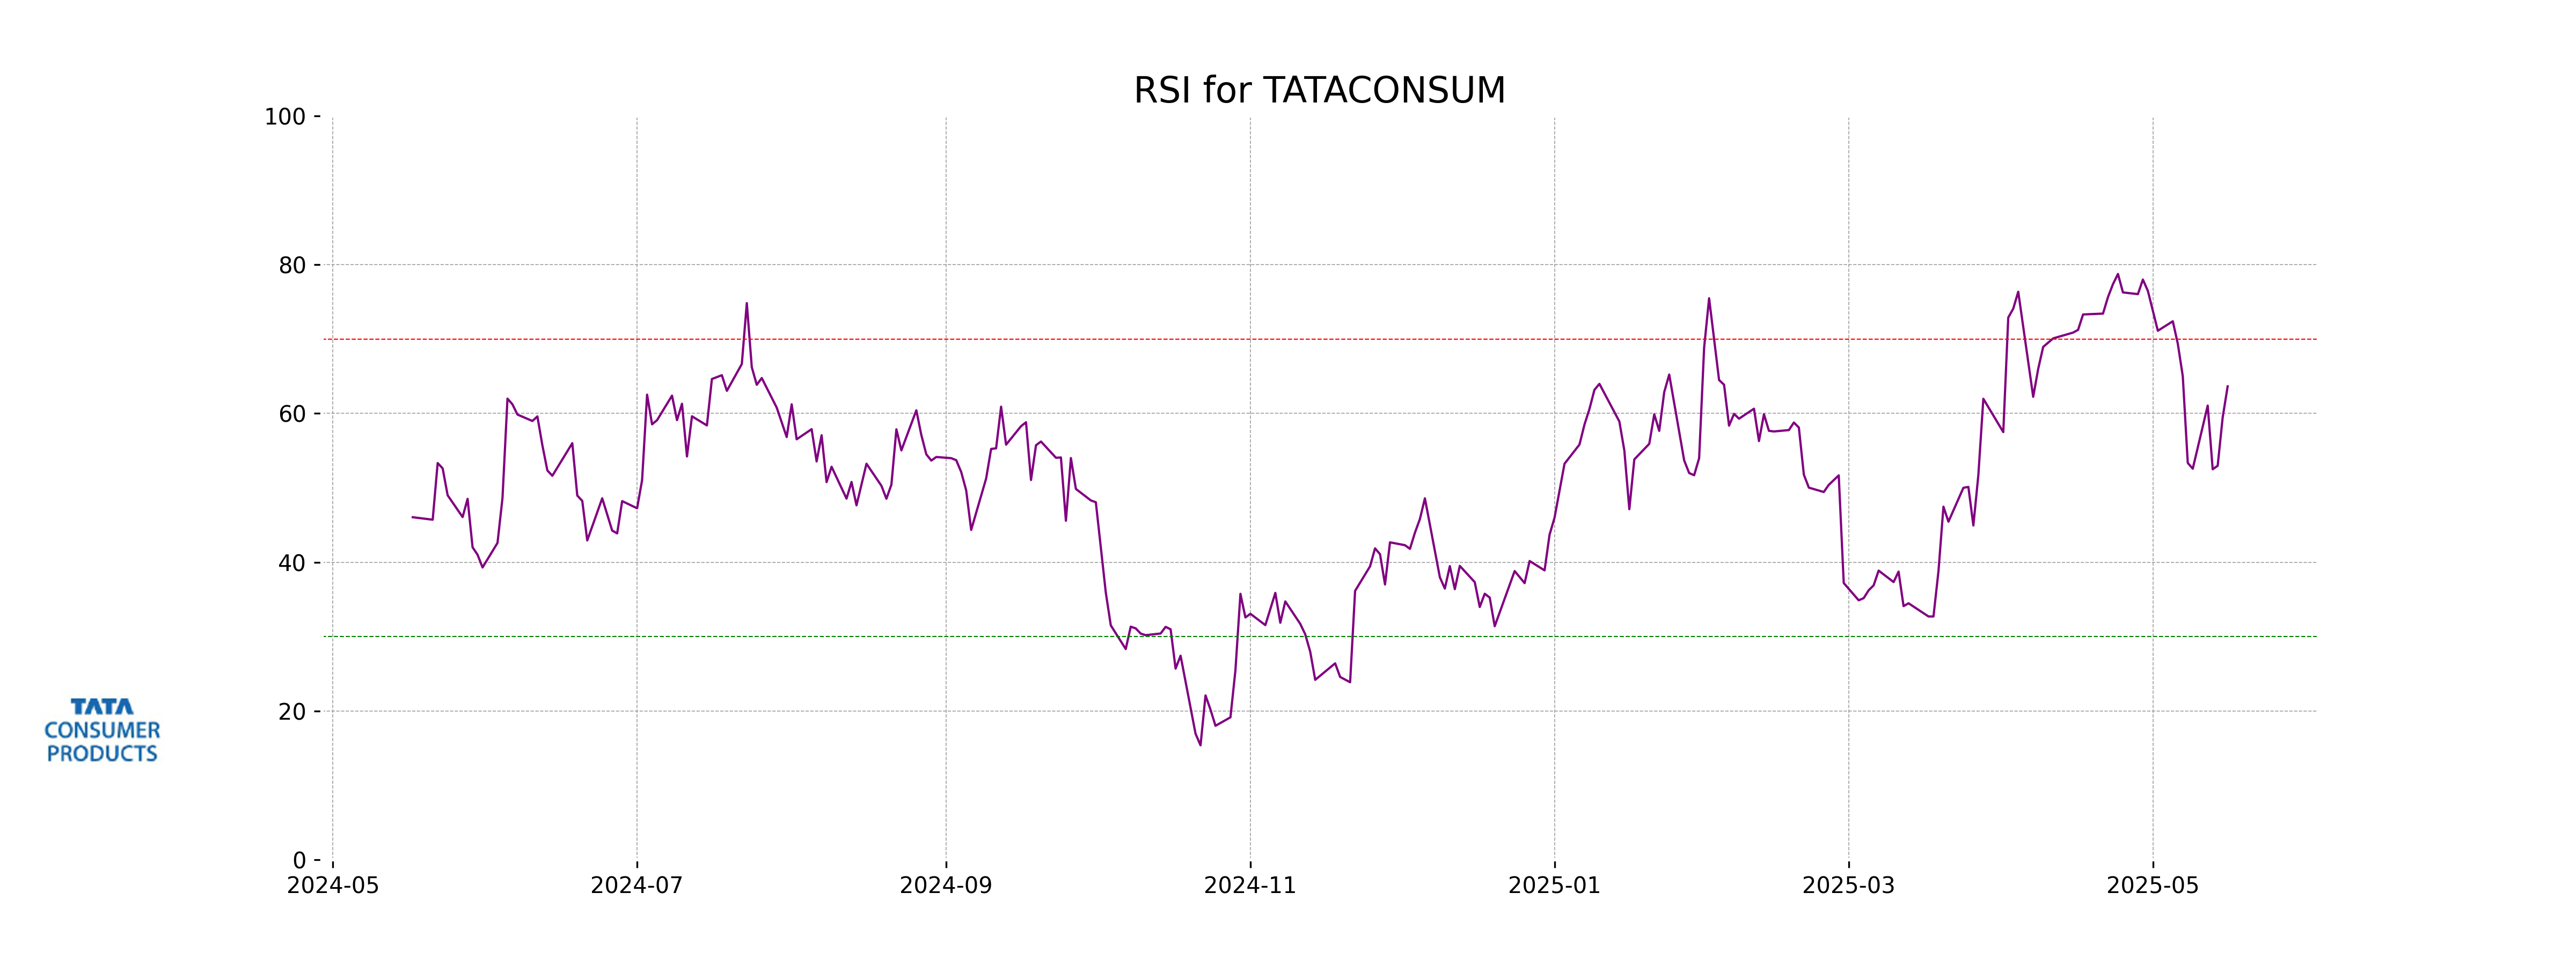
Analysis for Tata Consumer - May 16, 2025
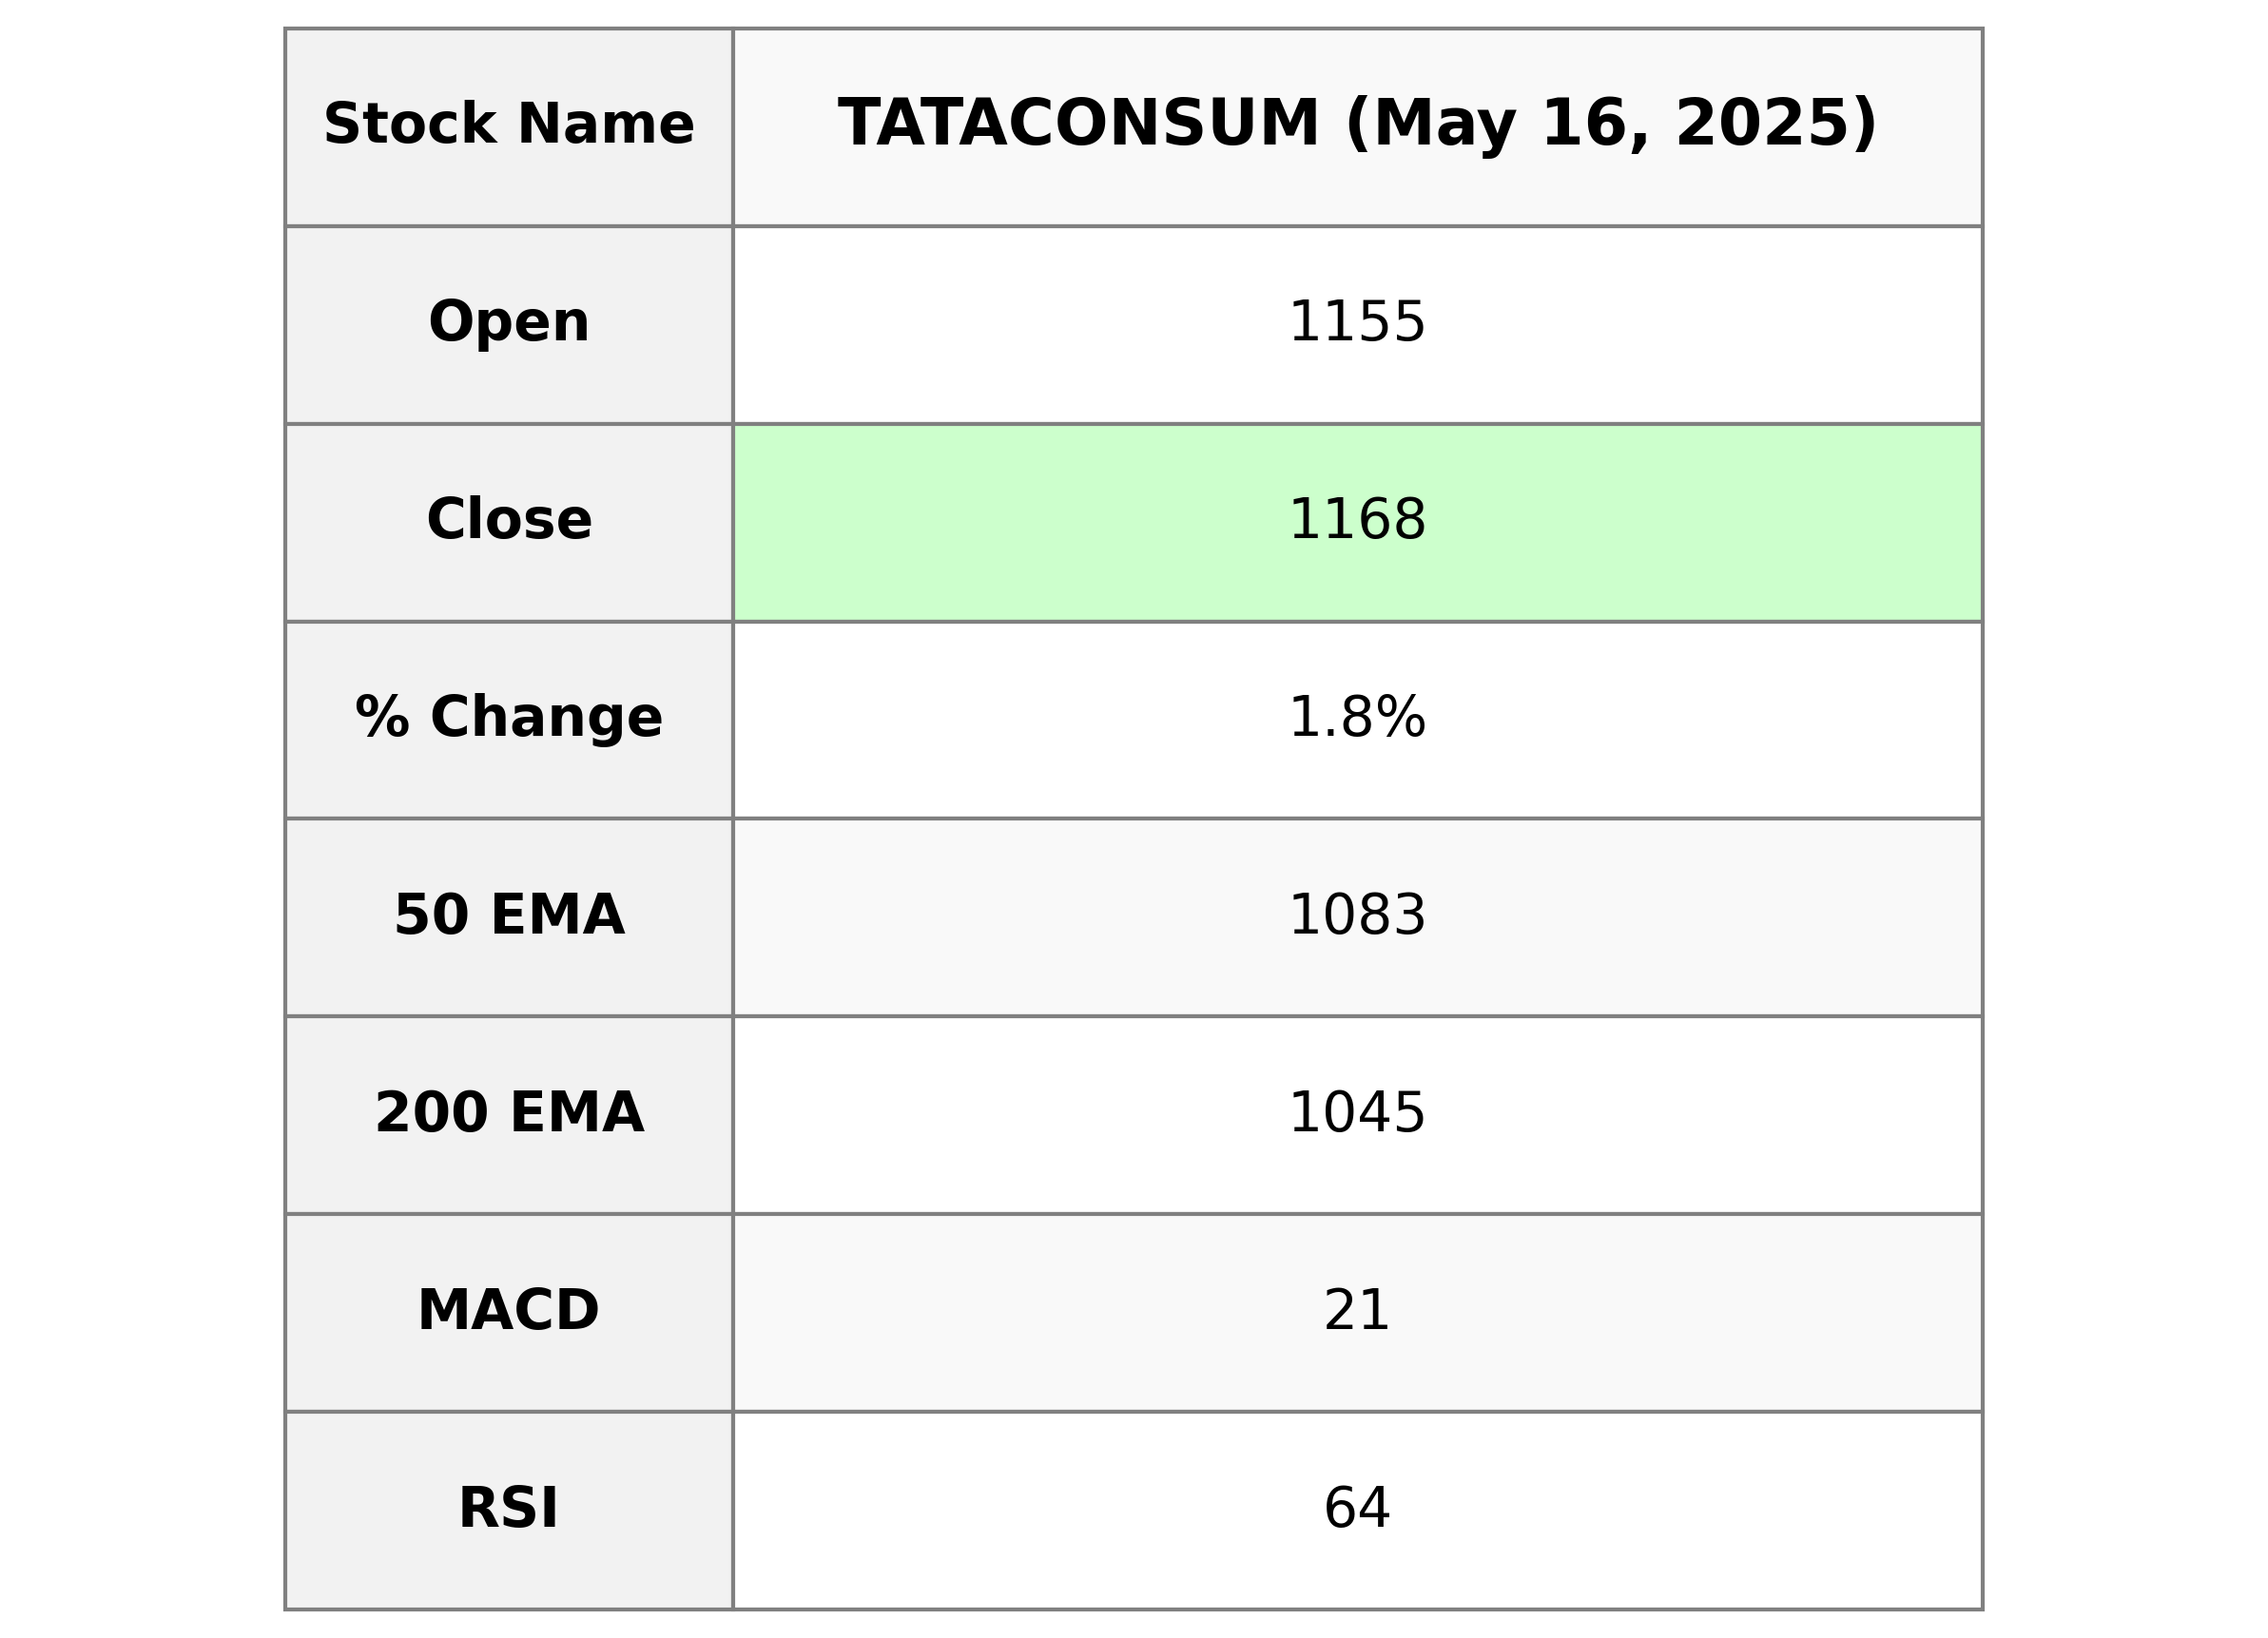
### Tata Consumer Performance Tata Consumer experienced a positive trading session with a closing price of 1168.0, marking a 1.81% increase from the previous close. The stock's volume traded was 1,336,569 shares. Its RSI of 63.64 indicates a bullish trend momentum, whereas the MACD is below its signal line, suggesting a potential weakening in momentum. The company's market cap stands at ₹1,155,738 million, with a PE ratio of 89.30, indicating it's relatively expensive compared to its earnings.
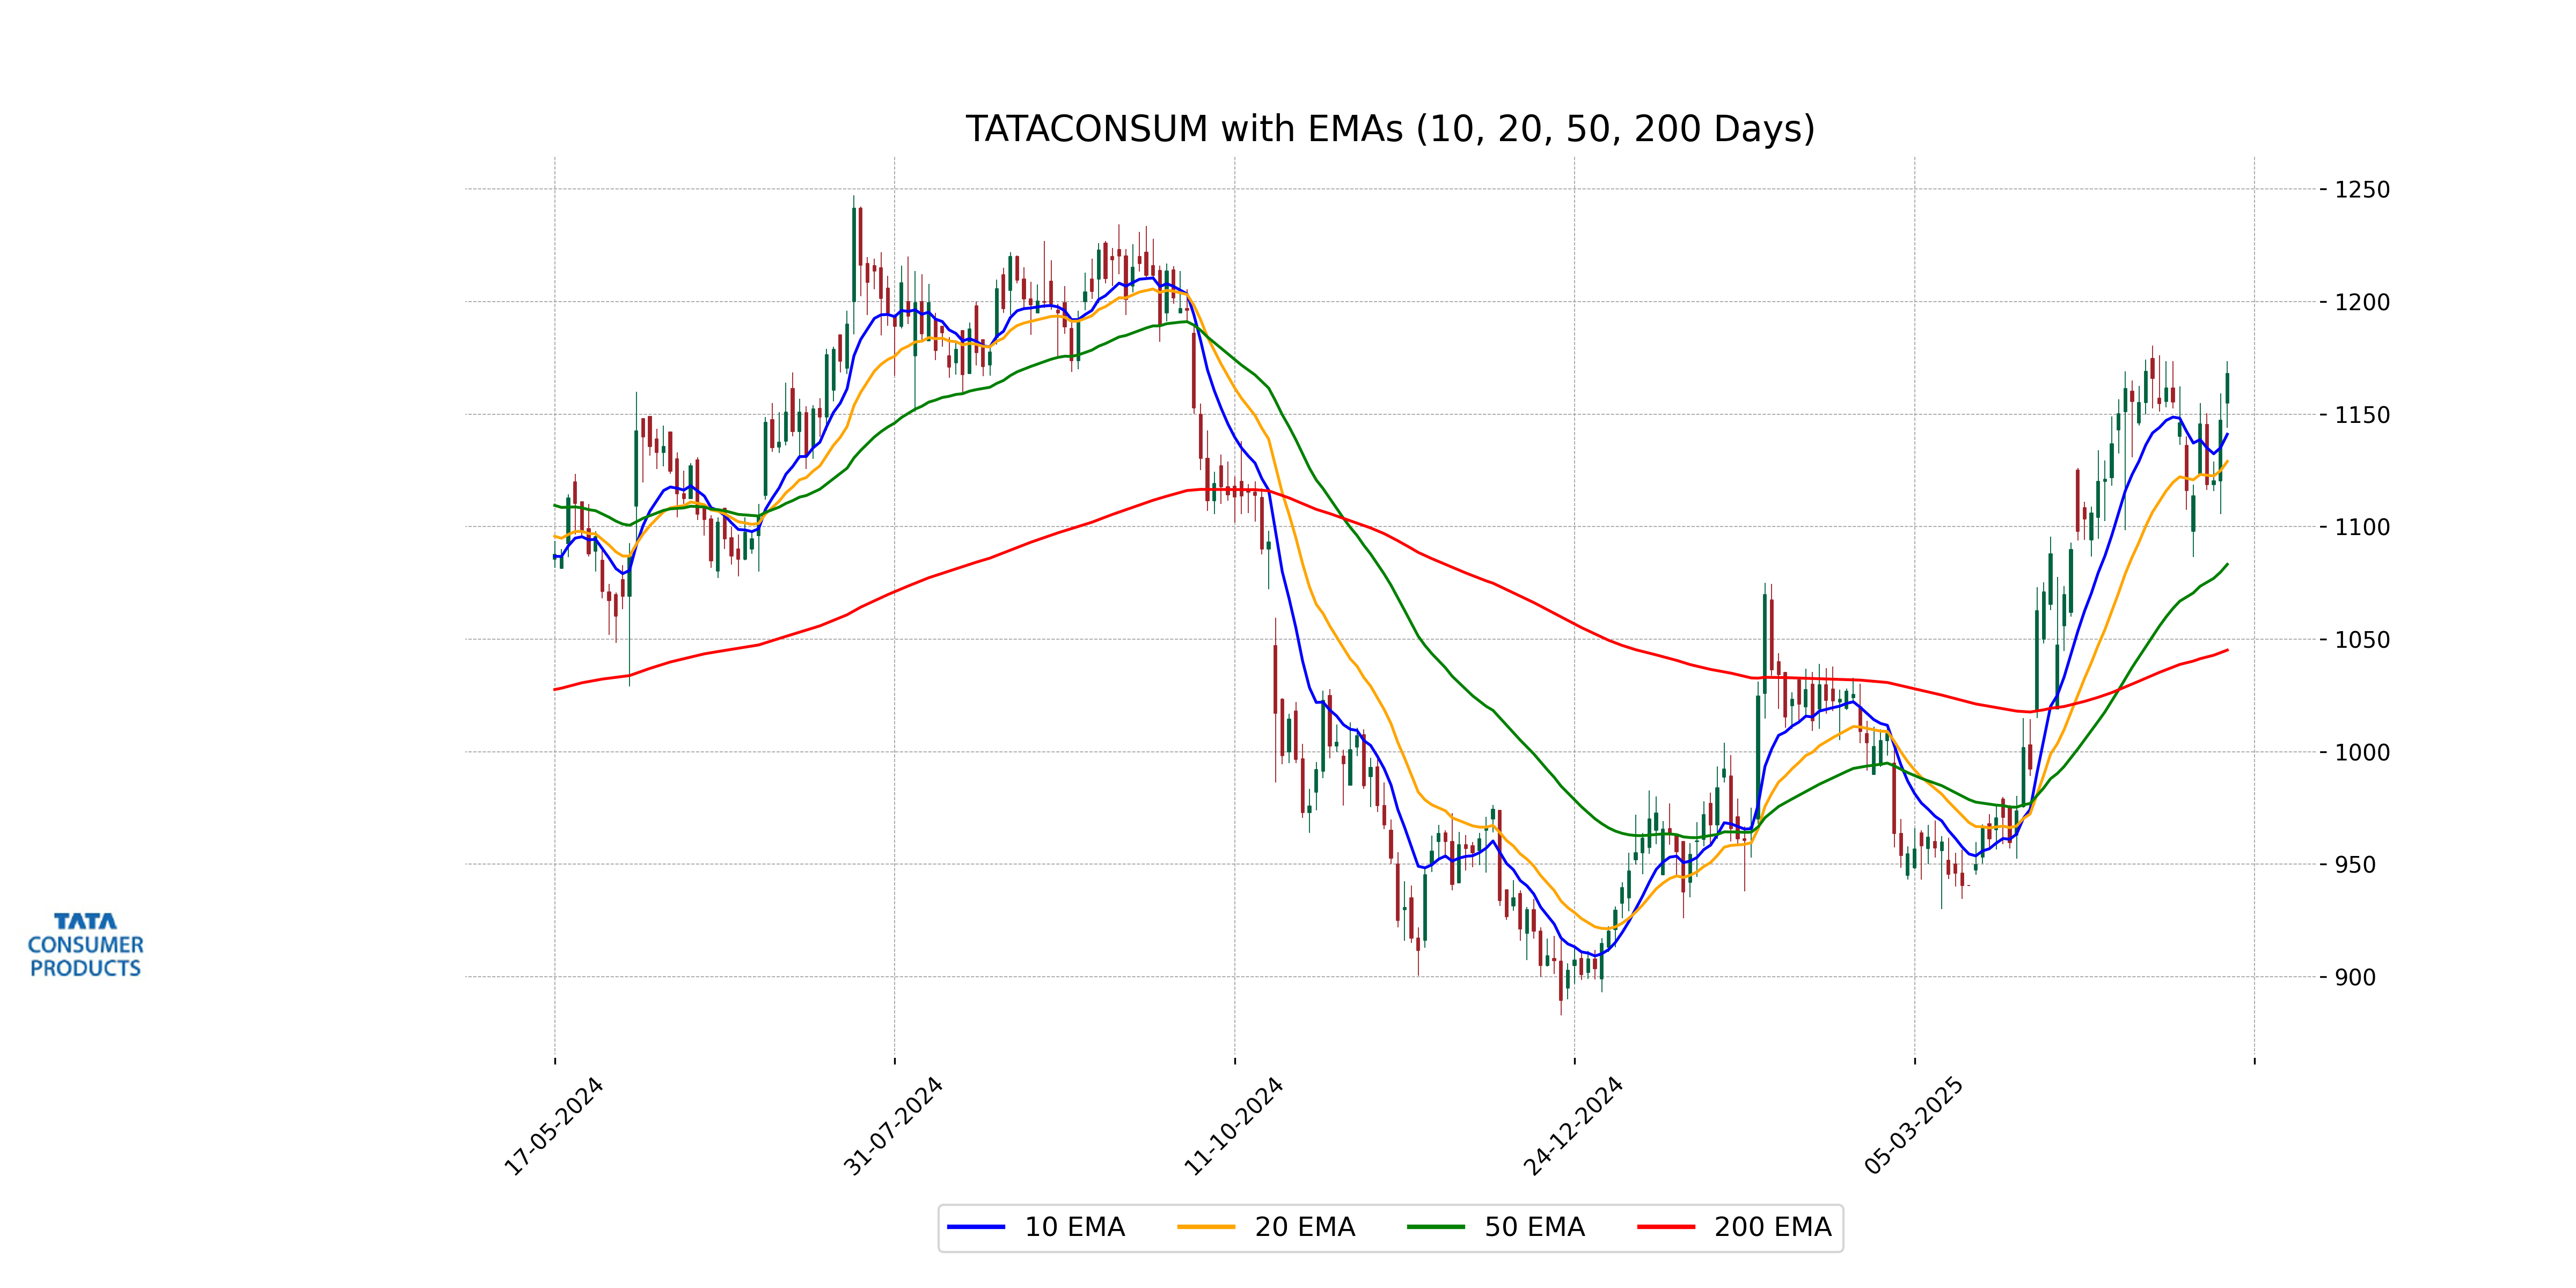
Relationship with Key Moving Averages
Tata Consumer's current close price of 1168.0 is above its 10-day EMA (1141.05), 20-day EMA (1128.96), 50-day EMA (1083.23), and 200-day EMA (1045.13), indicating a bullish trend. The stock is trading well above key moving averages, suggesting strong upward momentum.
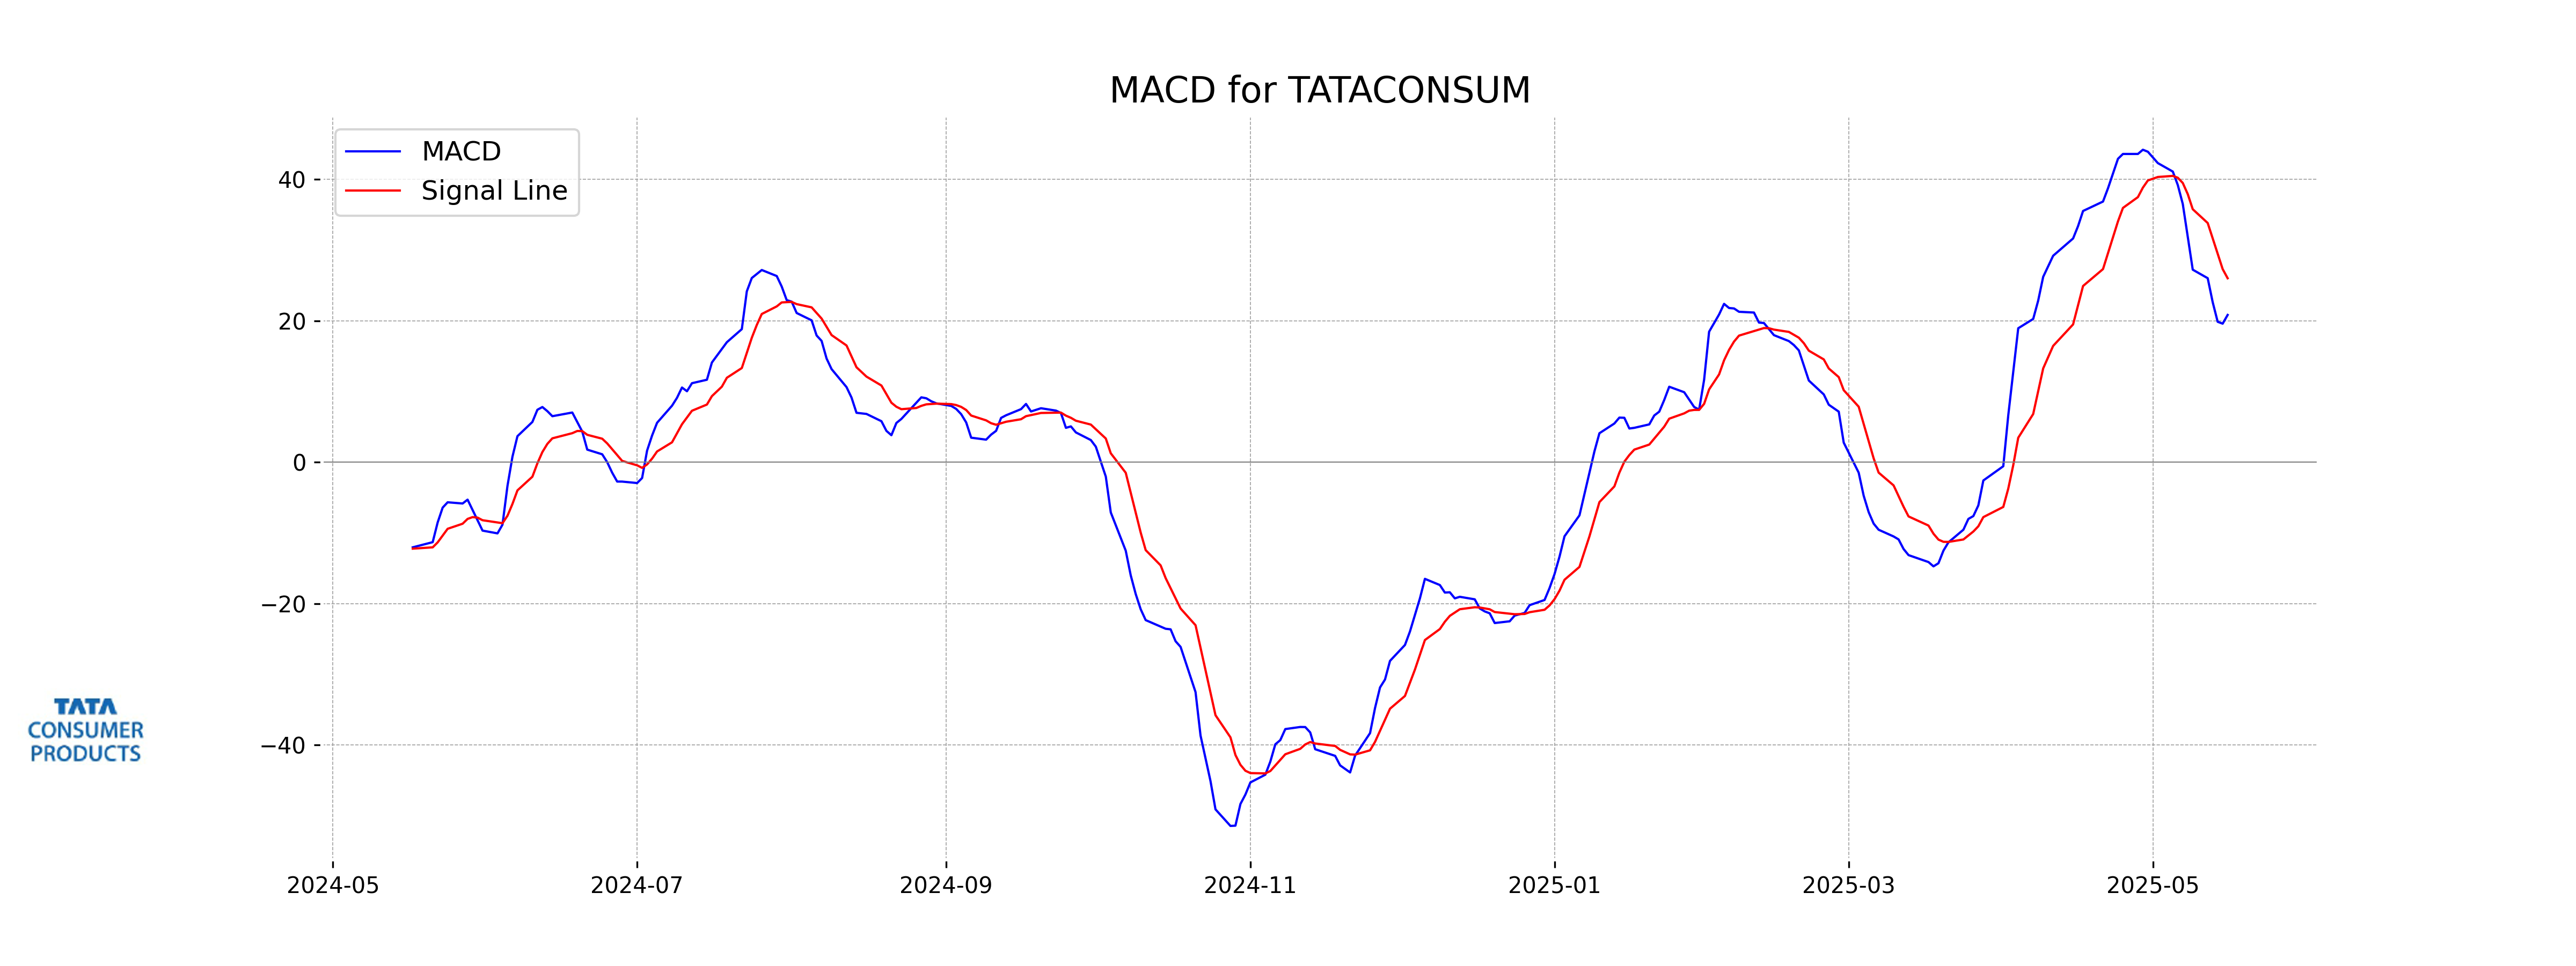
Moving Averages Trend (MACD)
MACD Analysis for Tata Consumer: The MACD value for Tata Consumer is 20.82, which is below the MACD Signal value of 26.01. This indicates potential bearish momentum, suggesting the stock may experience downward pressure in the short term. However, as the MACD is a lagging indicator, additional analysis and indicators should be considered for making informed decisions.
RSI Analysis
The RSI (Relative Strength Index) for Tata Consumer is 63.64, which suggests that the stock is nearing overbought territory, as an RSI above 70 typically indicates that. This implies some caution might be advisable for new entries, given potential price corrections.