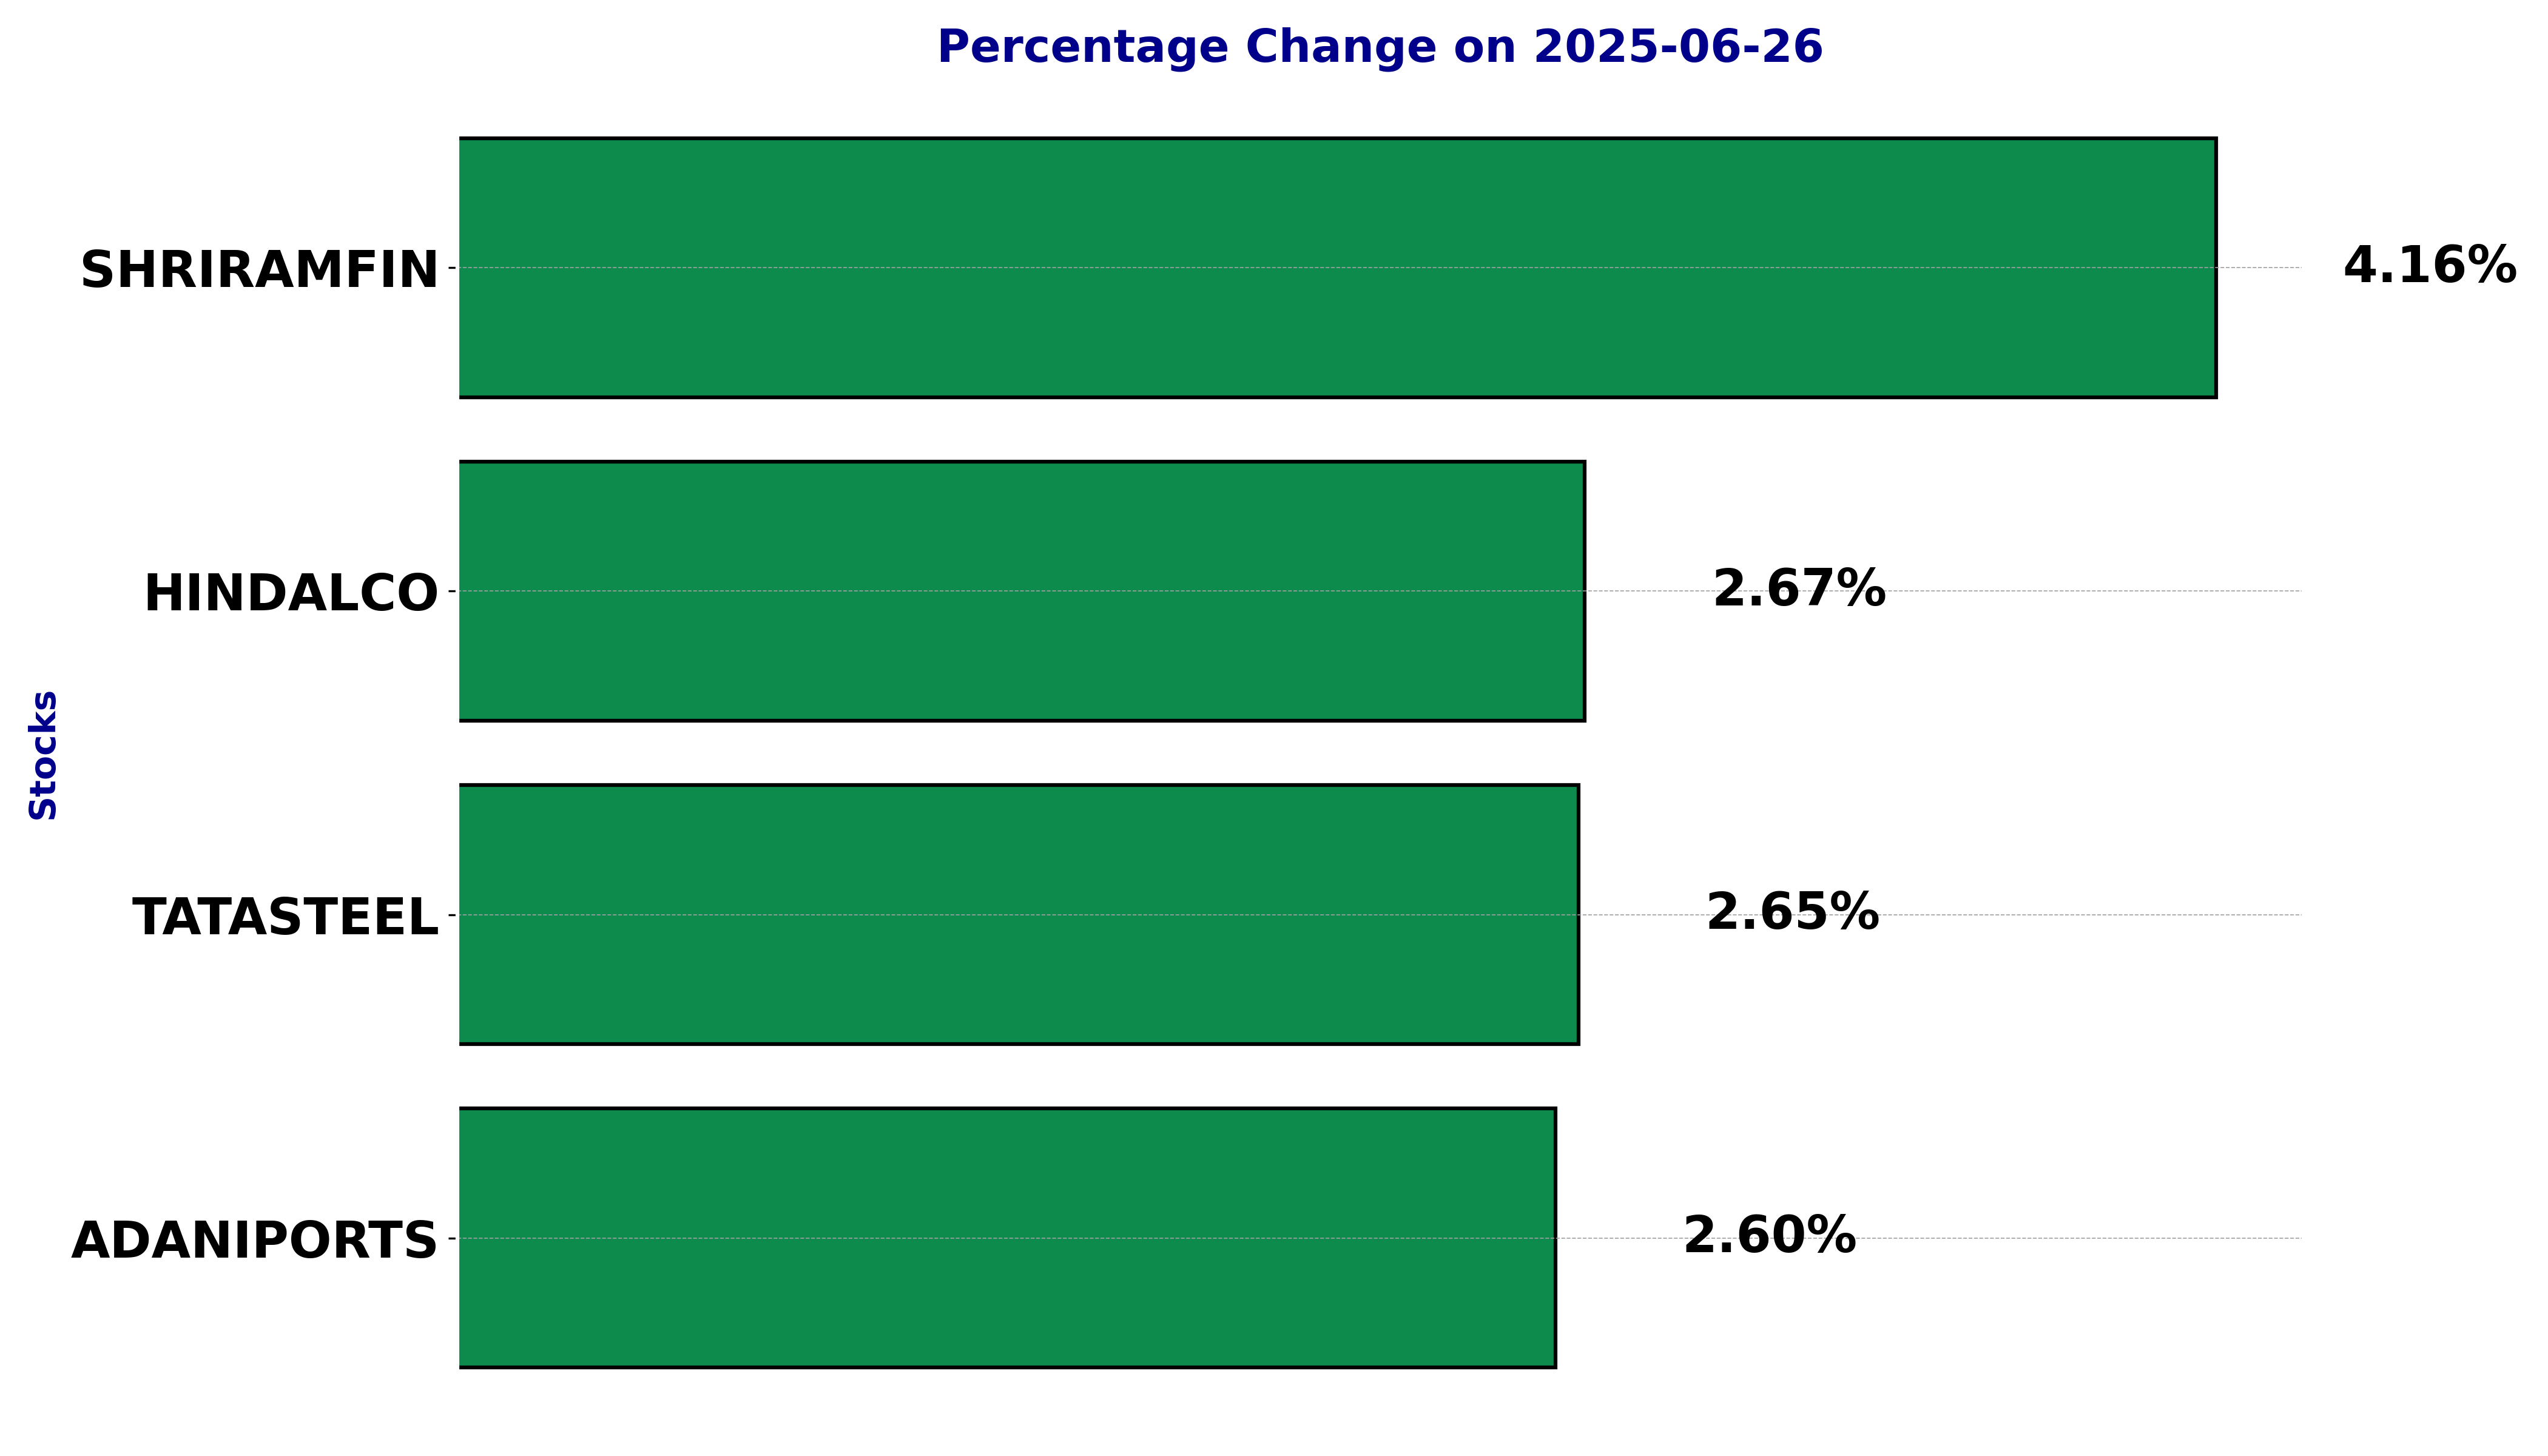
Top 5 Nifty 50 gainers today – June 26, 2025: Biggest stock moves
In this article, we will explore the technical indicators of some of the high-performing stocks on the Indian stock market, including ADANIPORTS, HINDALCO, SHRIRAMFIN, and TATASTEEL.
By looking at these stocks through the lens of key technical factors, we aim to better understand their price movements, trends, and potential future performance.
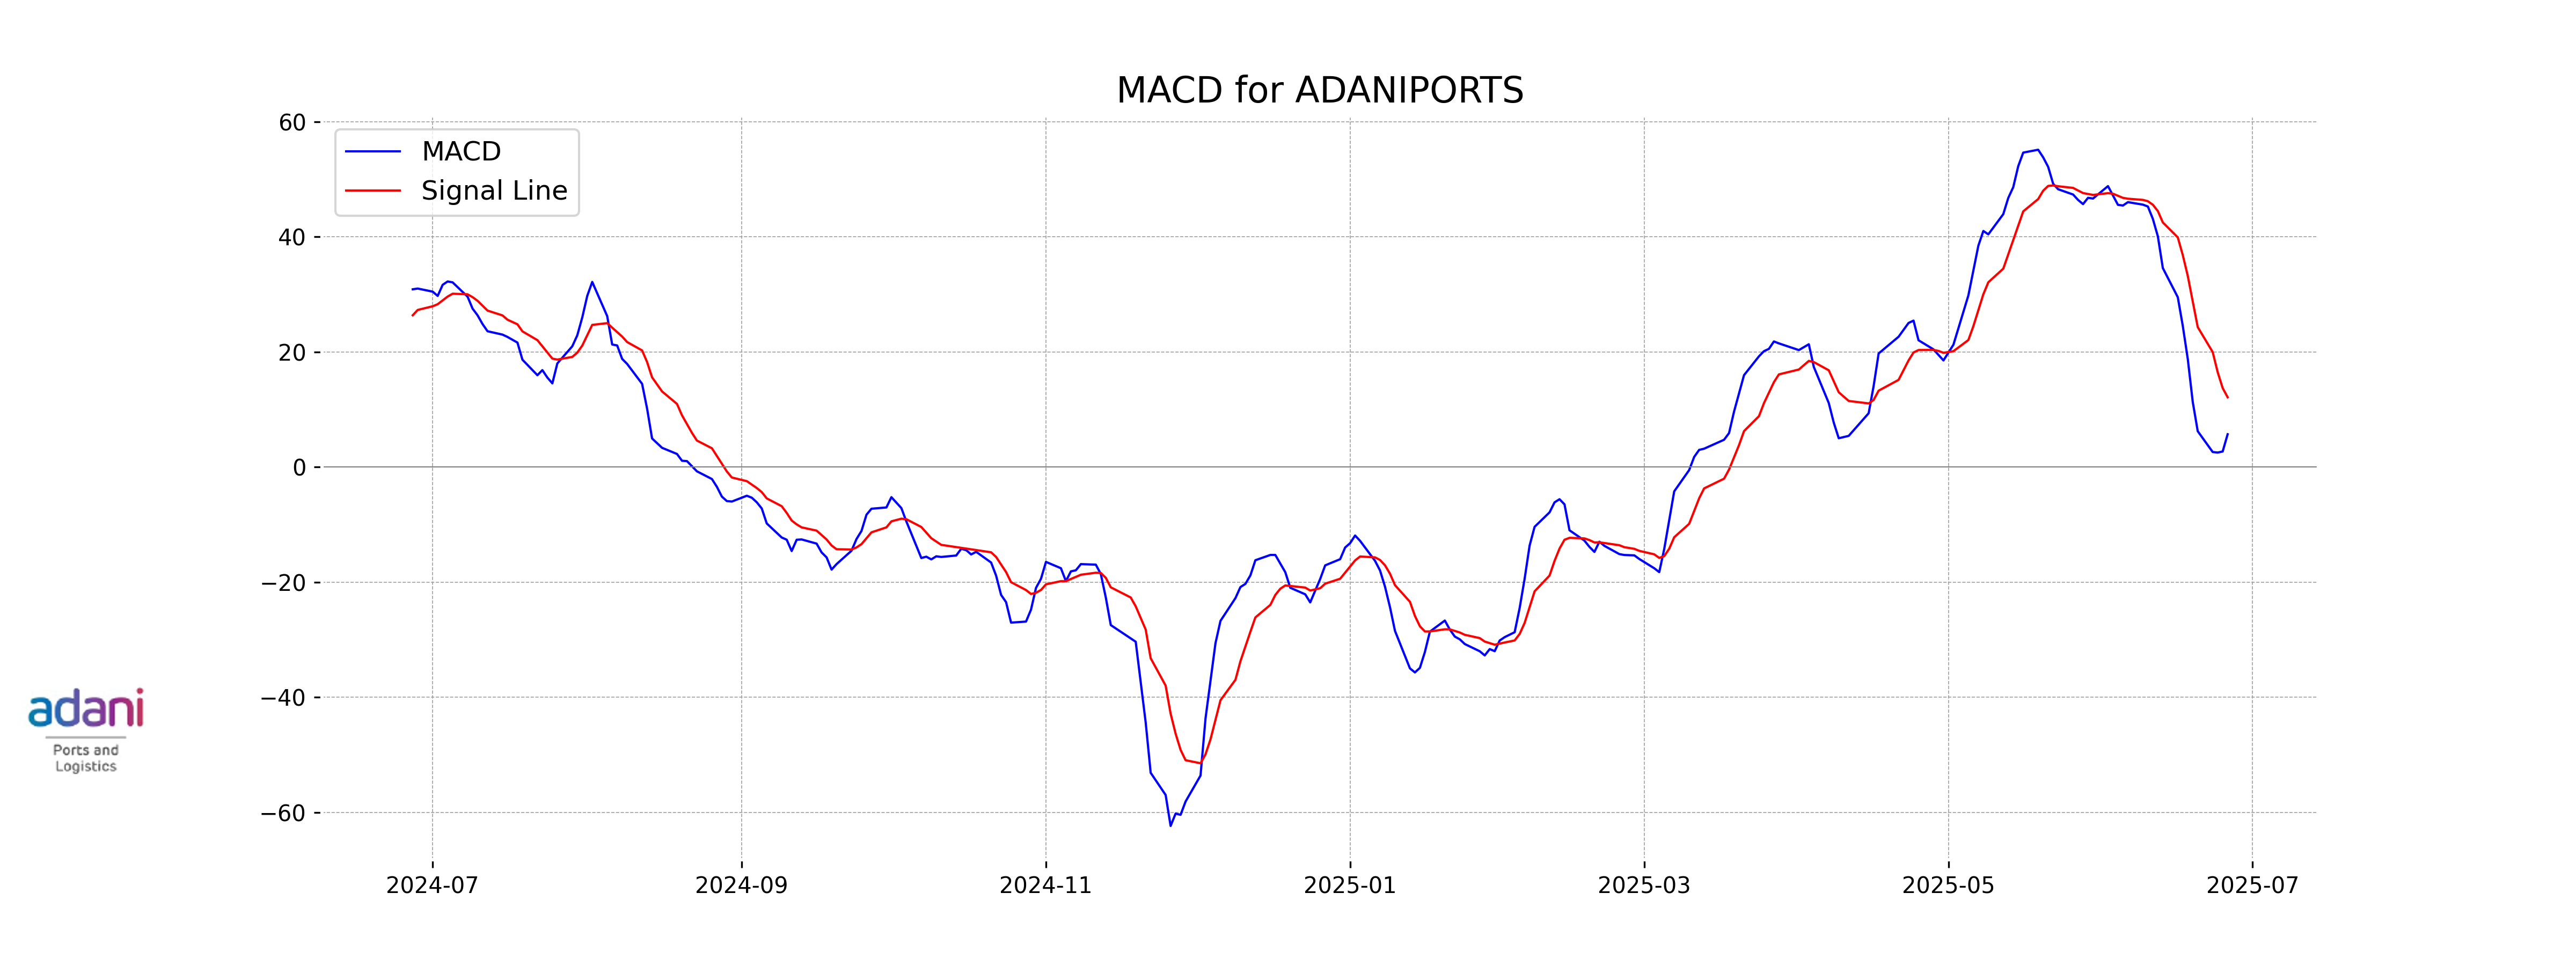
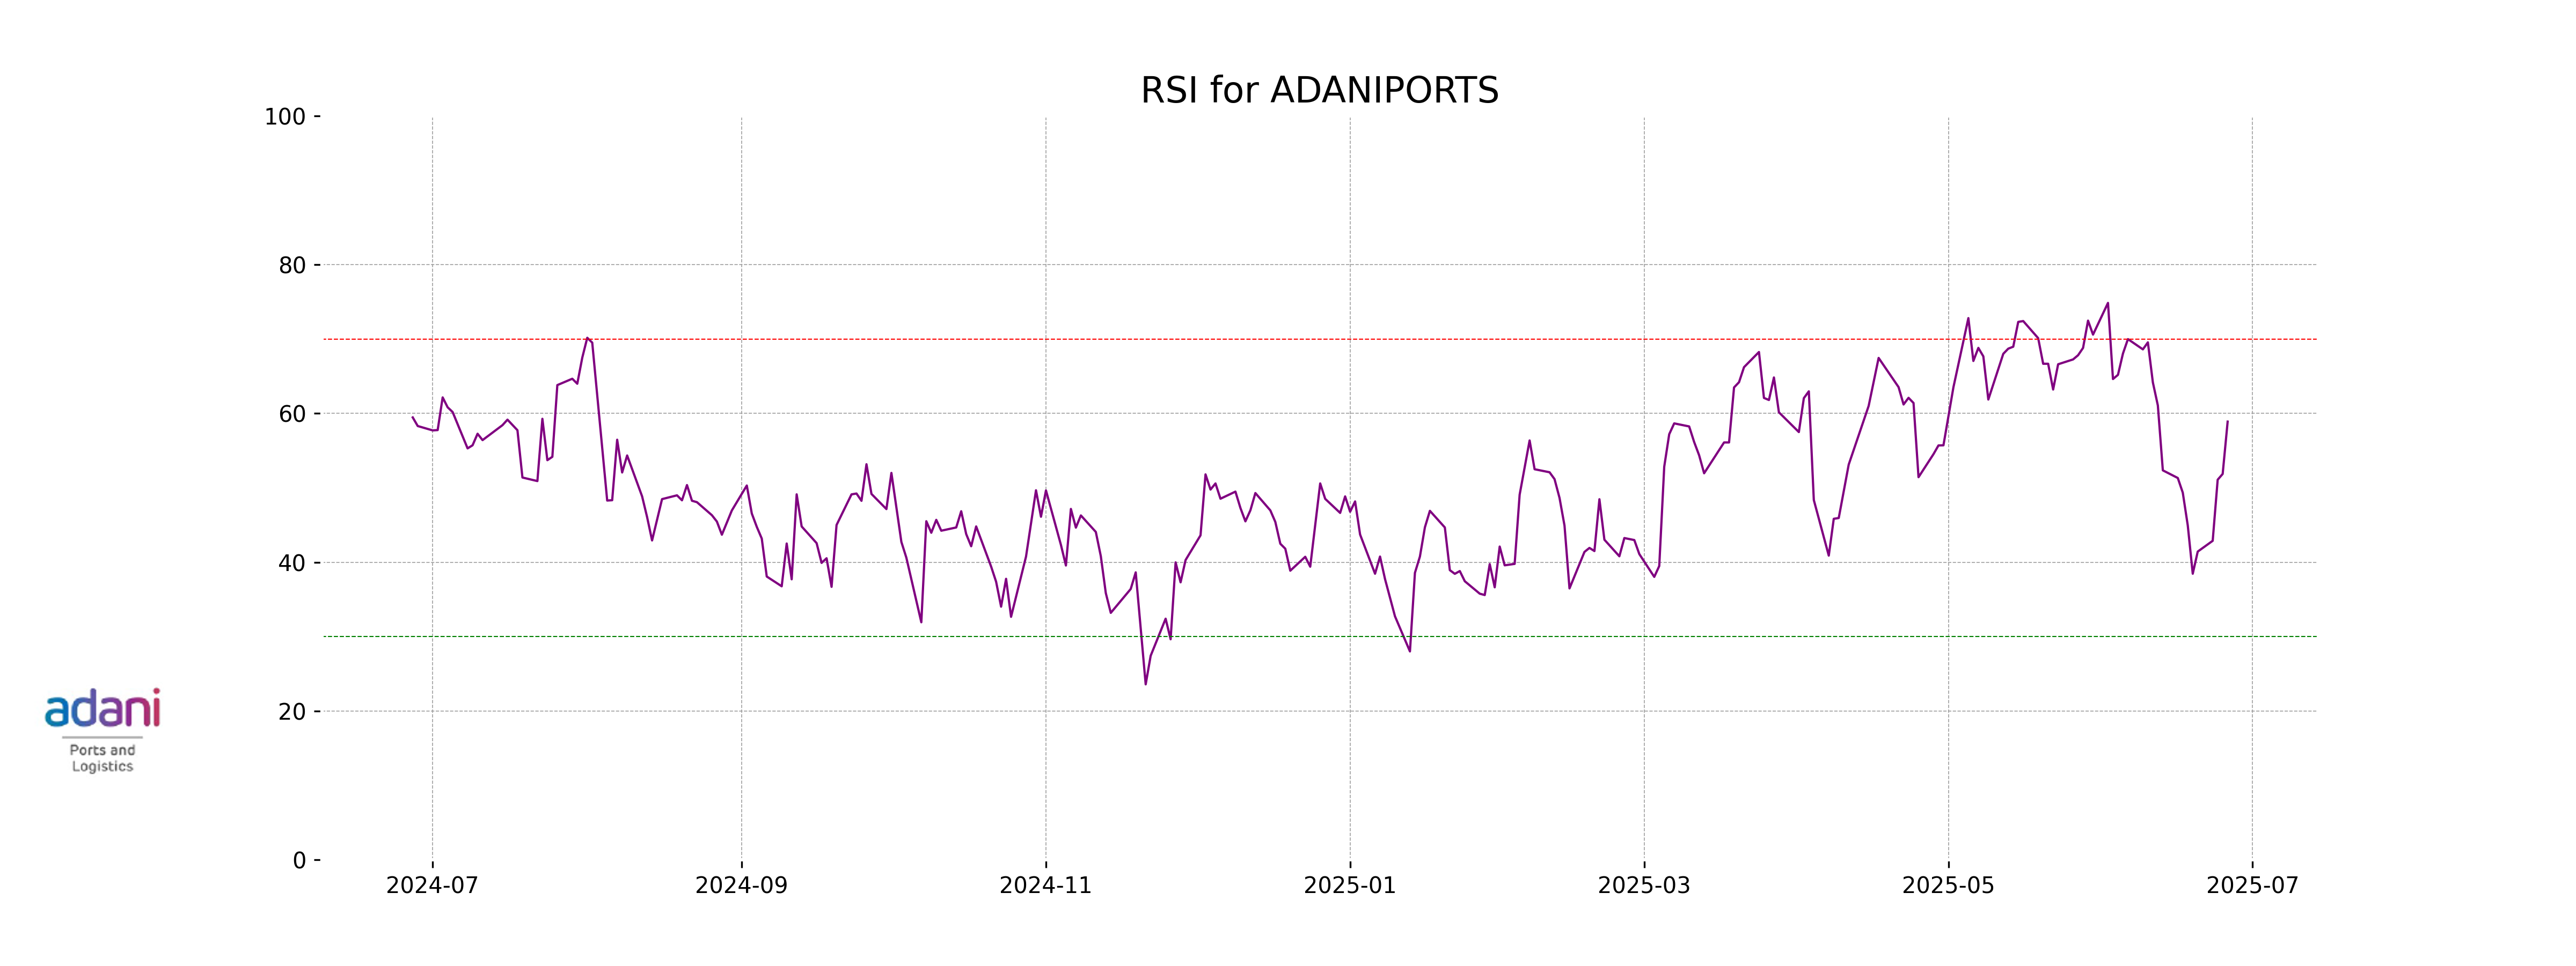
Analysis for Adani Ports - June 26, 2025
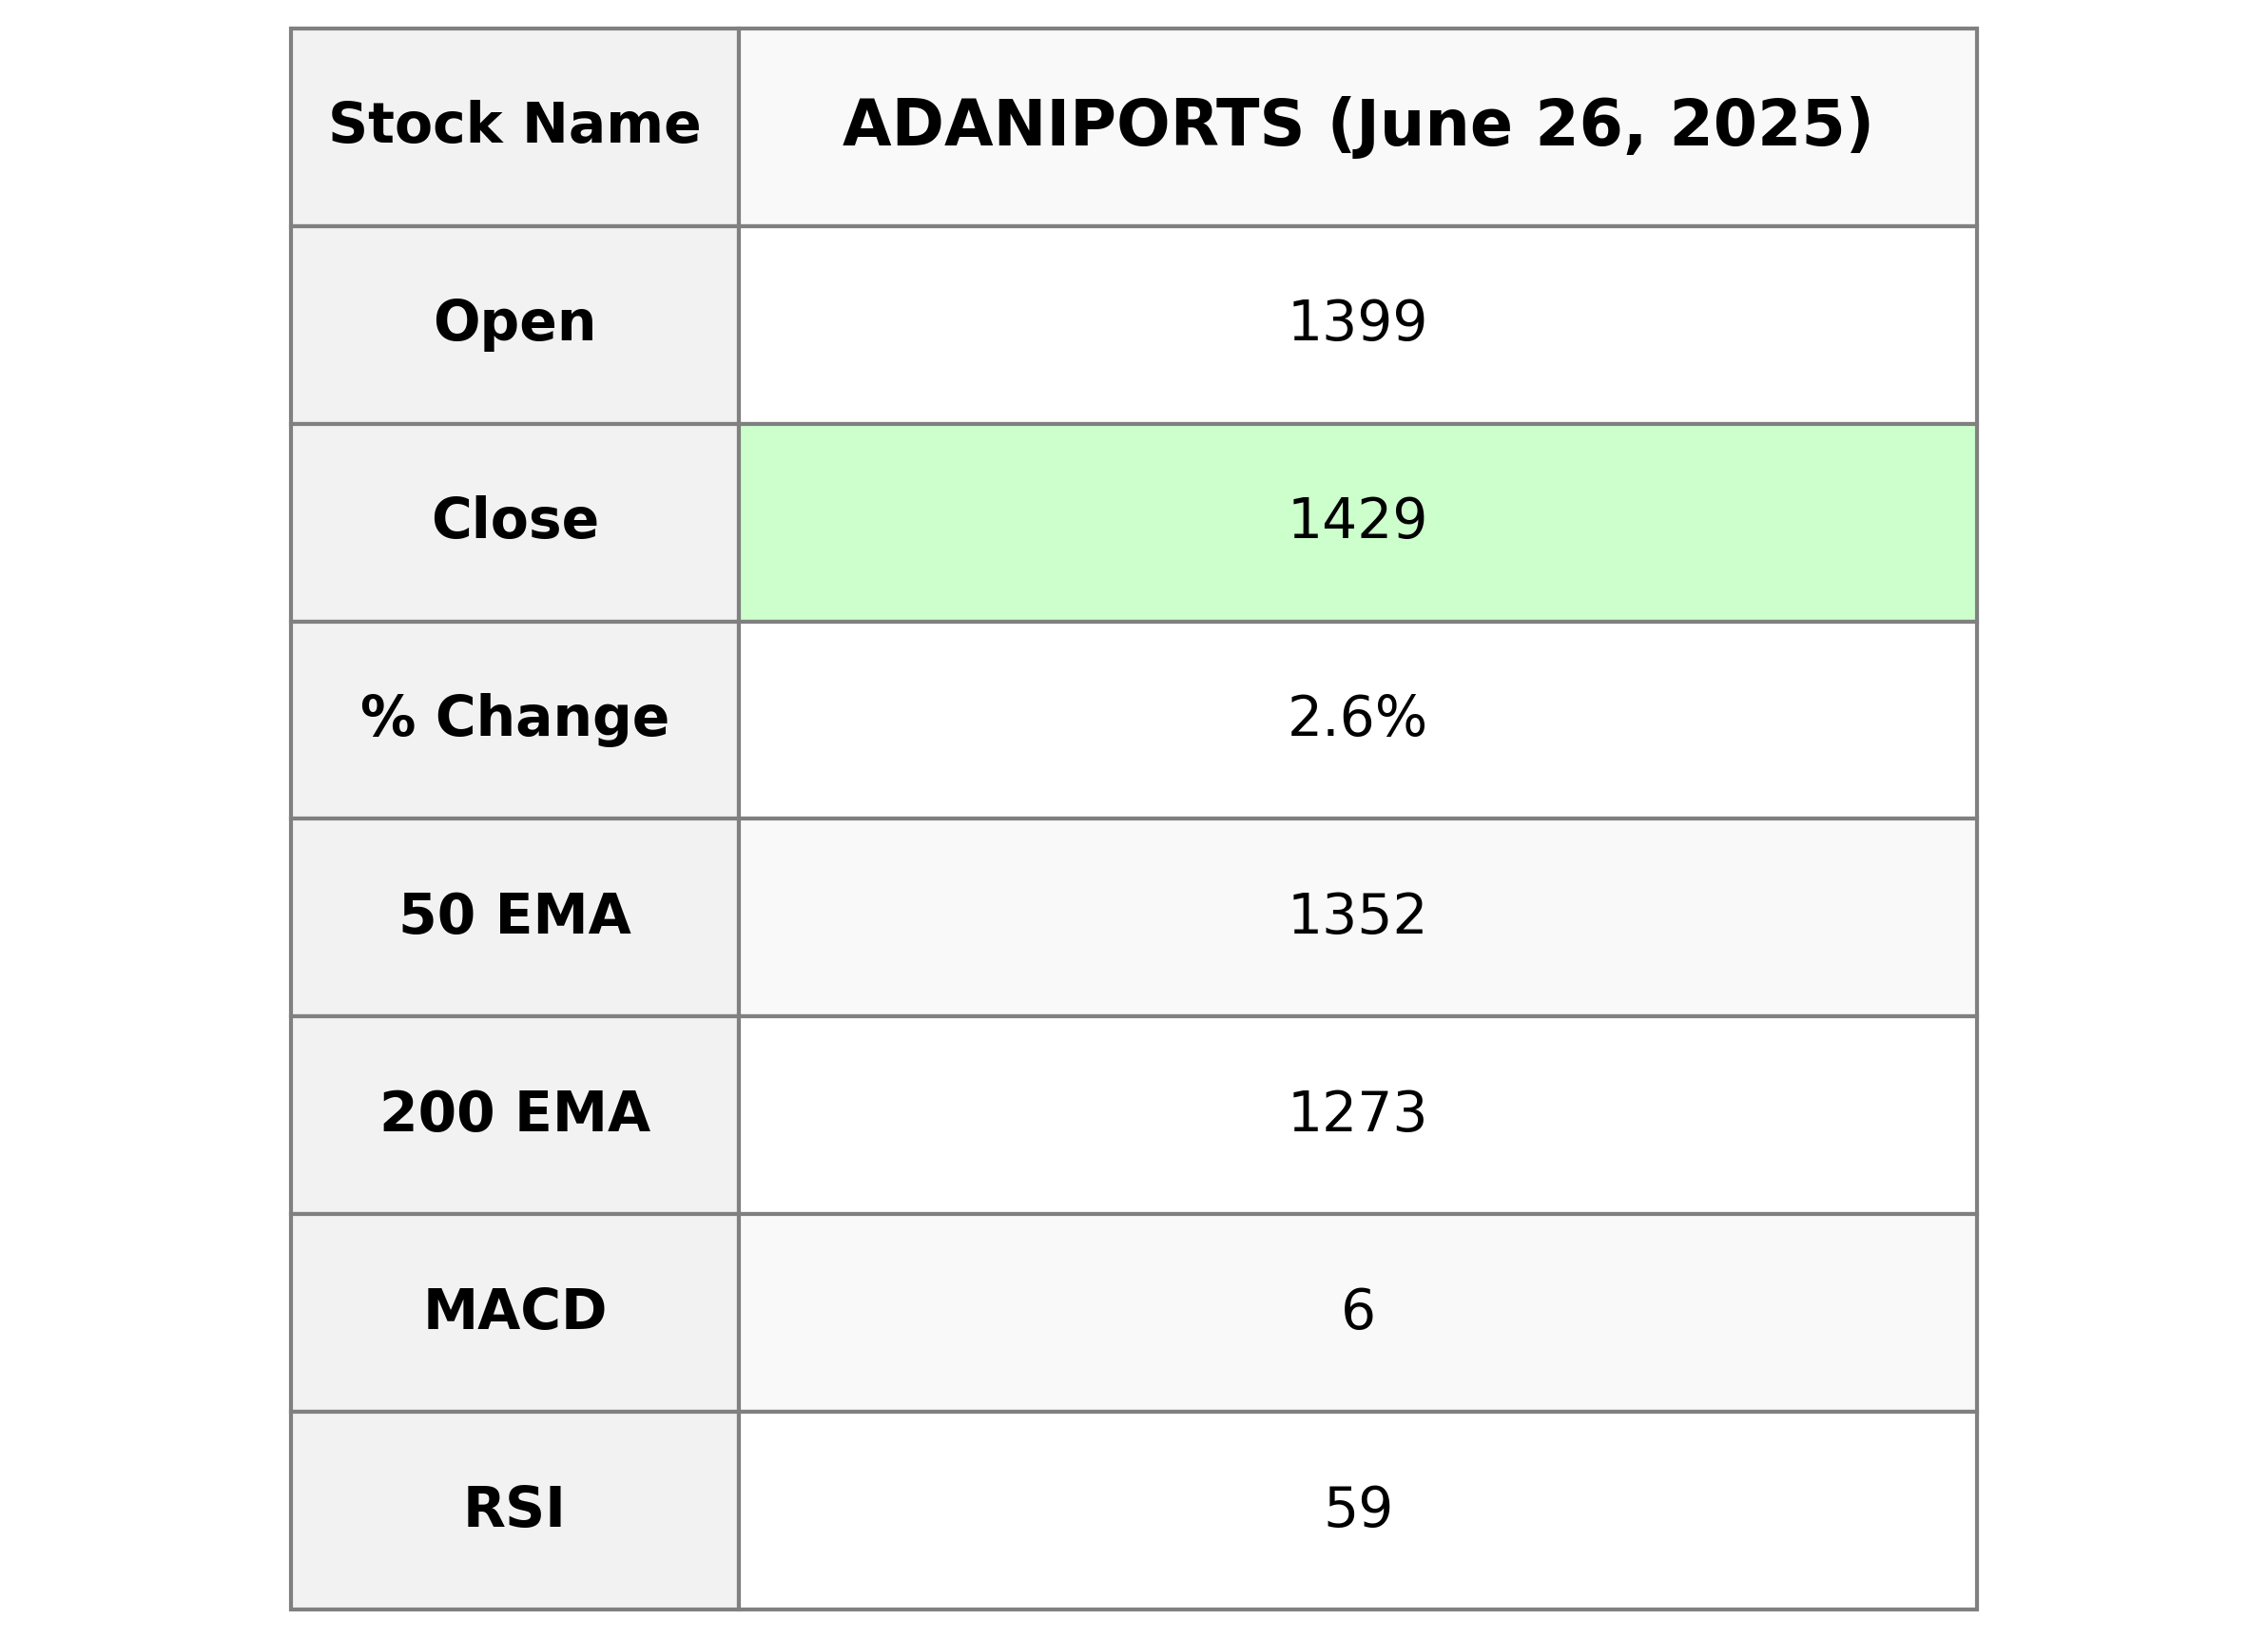
### Adani Ports Performance Overview Adani Ports opened at 1399.0 and closed at 1429.3, marking a percentage increase of 2.60%. The stock traded with a volume of 2,877,485 shares. Notably, the RSI is 58.90, indicating a moderately strong momentum, while the MACD is slightly below the MACD Signal, suggesting room for potential bullish or bearish movements. Adani Ports is part of the Industrials sector and operates within the Marine Shipping industry in India.
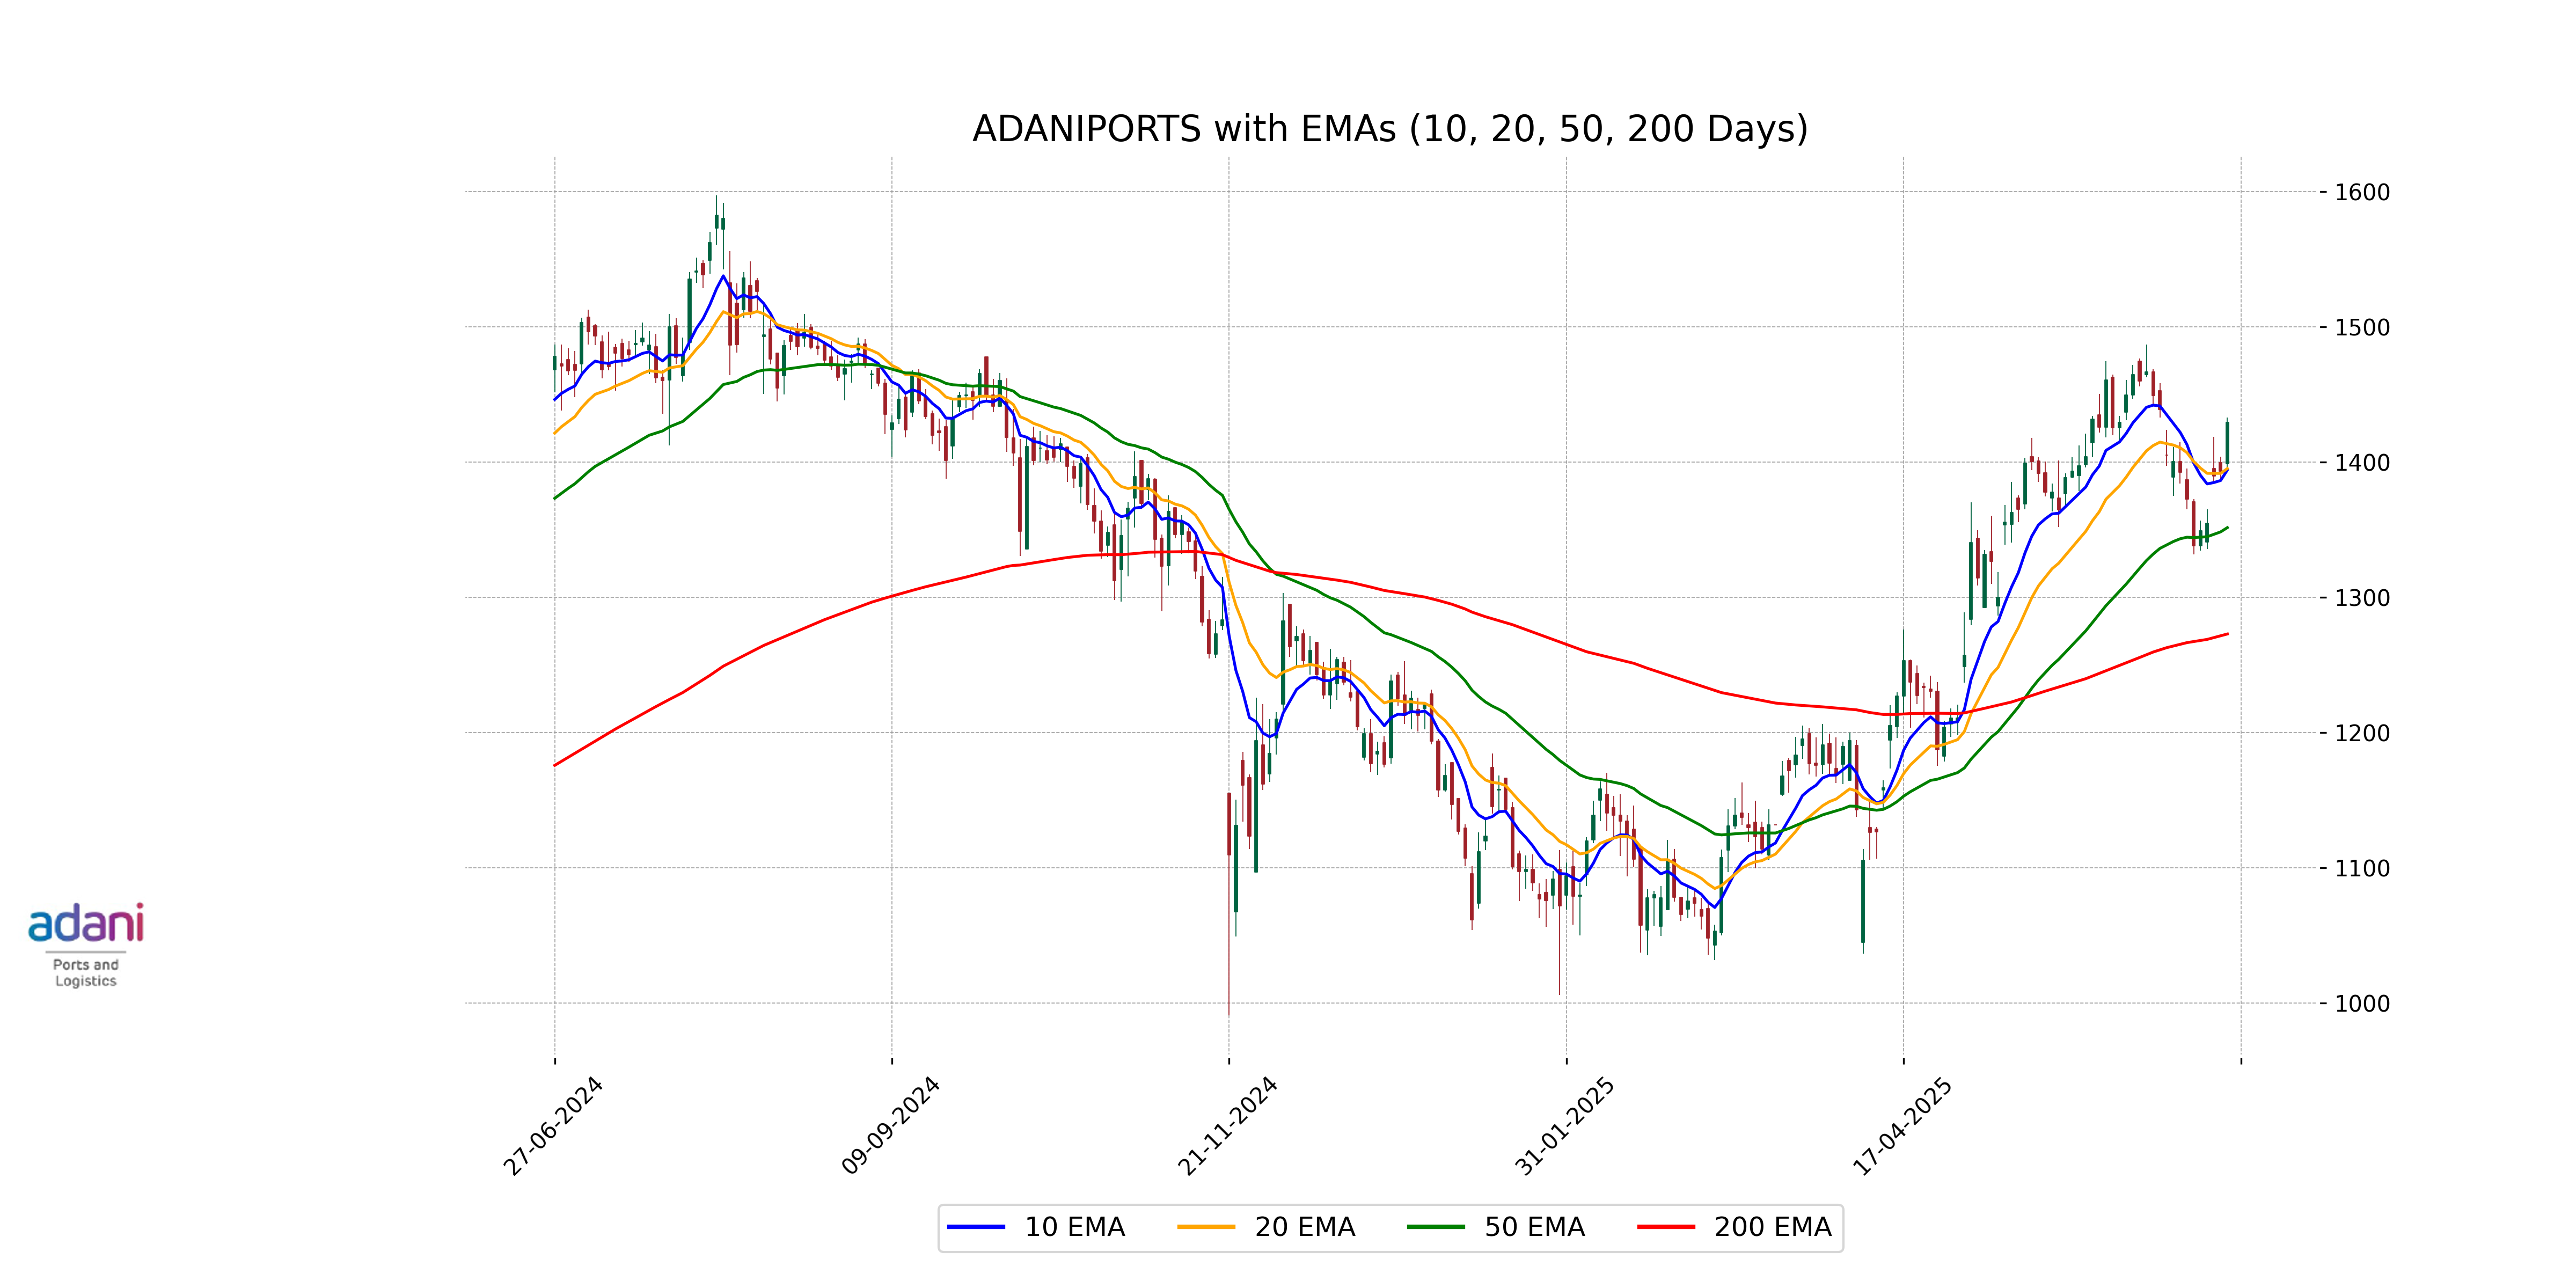
Relationship with Key Moving Averages
Adani Ports is trading above its key moving averages, with the current close price of 1429.30 being higher than the 10 EMA (1394.17), 20 EMA (1395.22), 50 EMA (1351.53), and 200 EMA (1272.83). This suggests a bullish trend as the stock price is positioned significantly above its short-term and long-term average price levels.
Moving Averages Trend (MACD)
Based on the MACD analysis for Adani Ports, the MACD value is 5.72 while the MACD Signal is 12.14. This indicates a potential bearish signal as the MACD line is below the Signal line, suggesting a possible weakening momentum in the stock's upward trend.
RSI Analysis
Adani Ports has an RSI of 58.90, which suggests that the stock is in the neutral zone. This indicates that it is neither overbought nor oversold, allowing for potential upward or downward movement based on other market factors.
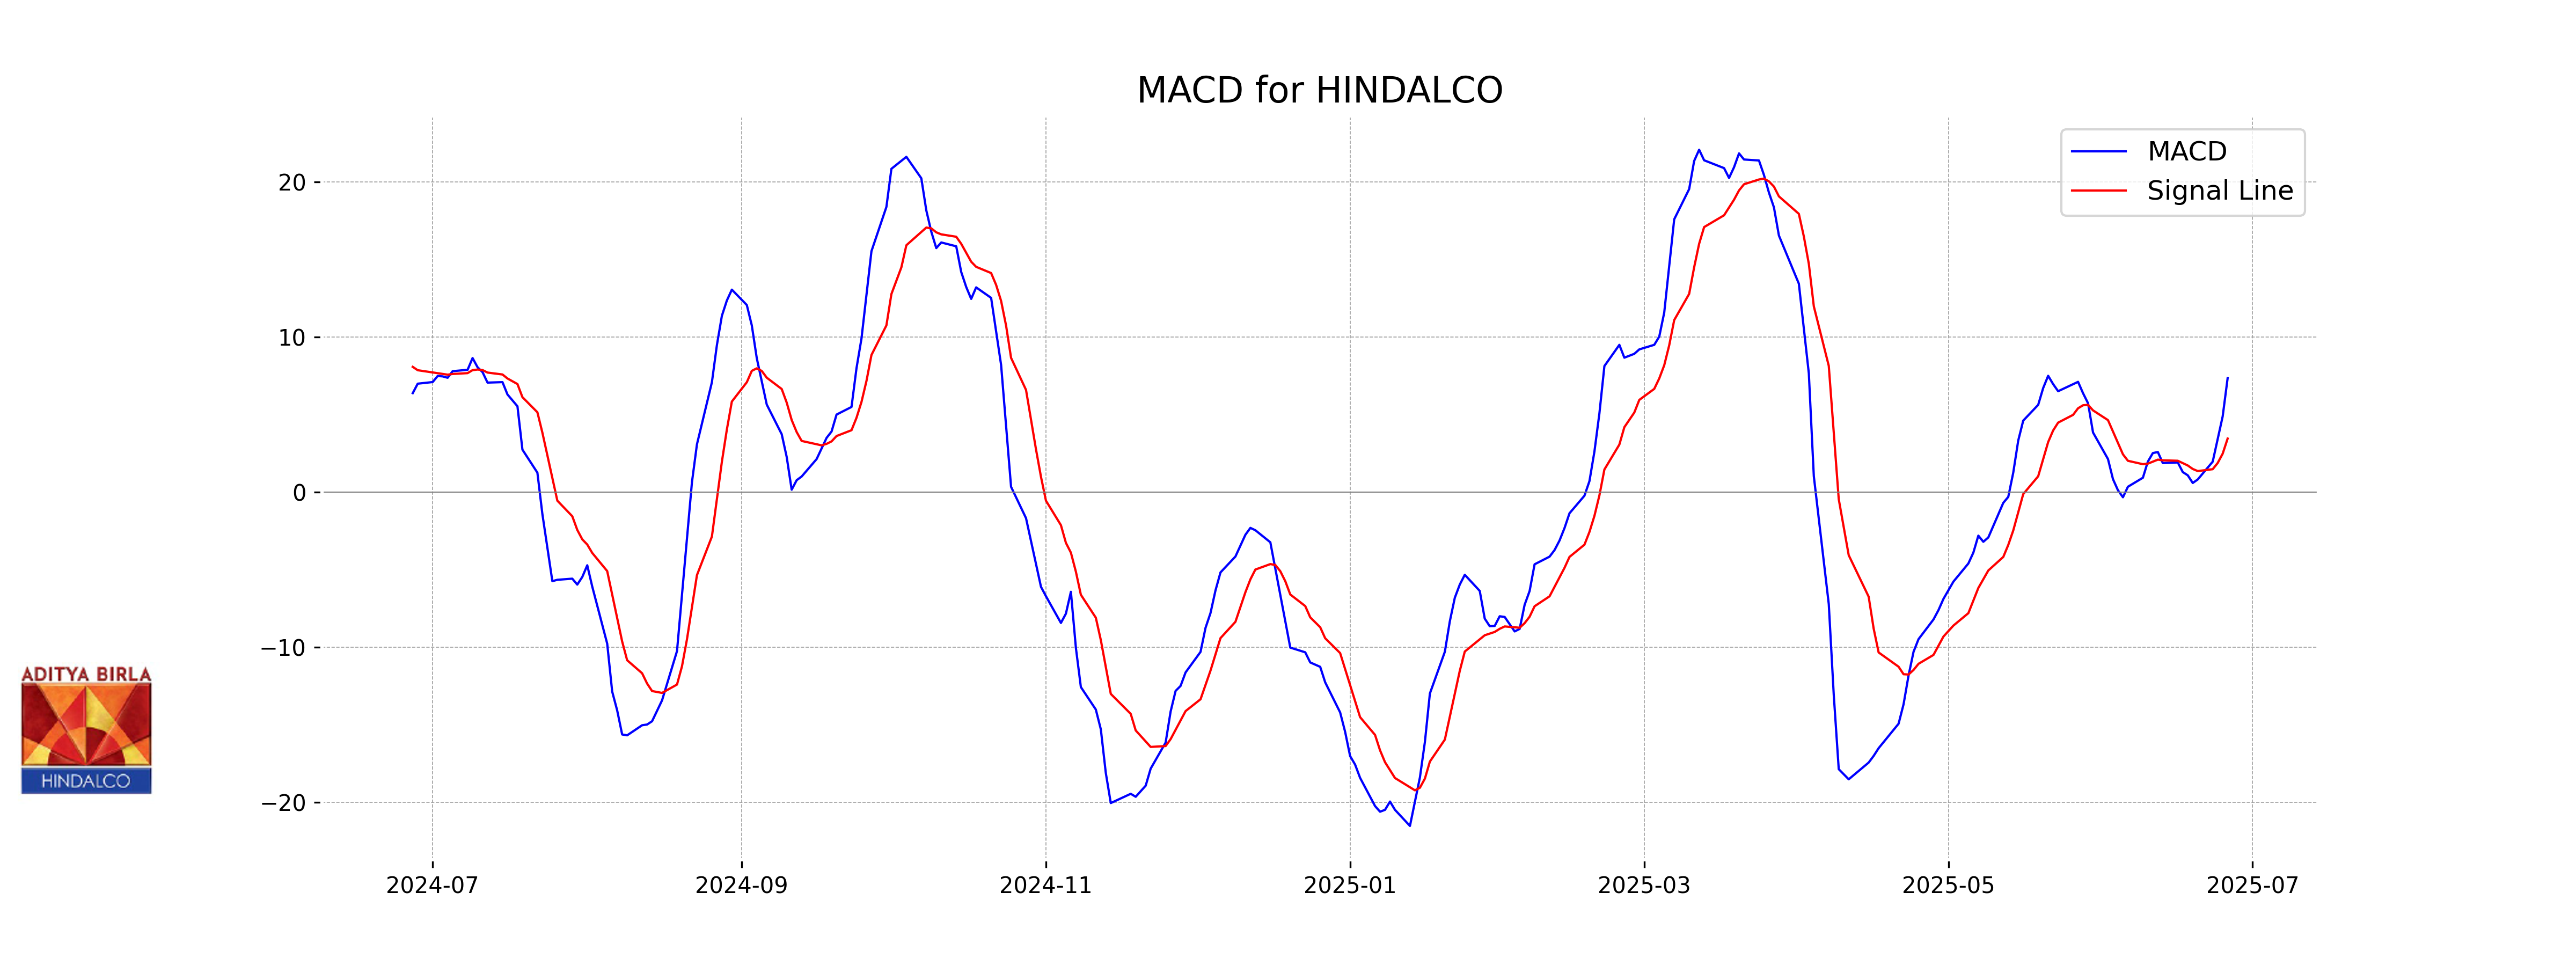
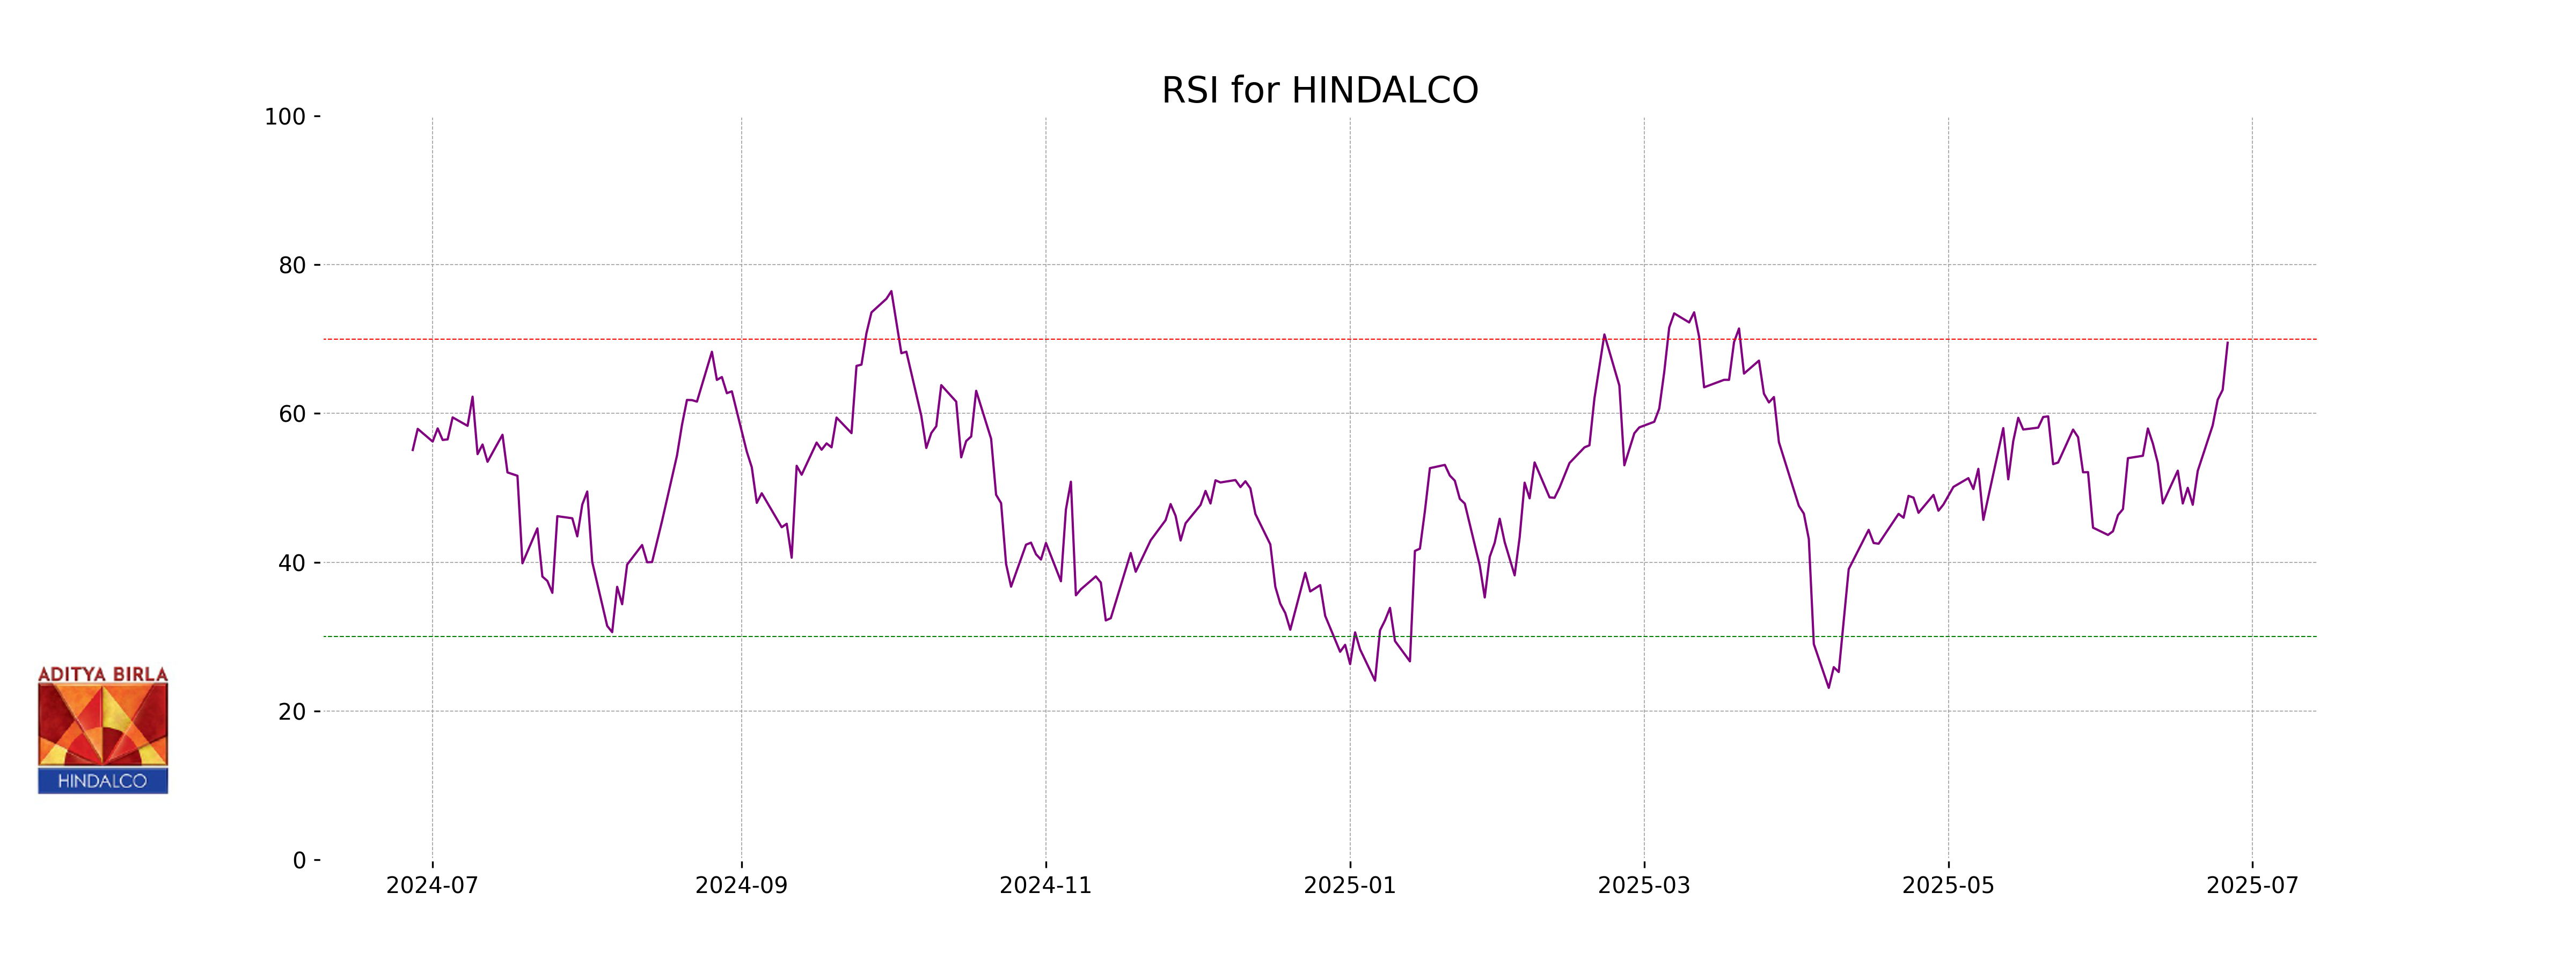
Analysis for HINDALCO - June 26, 2025
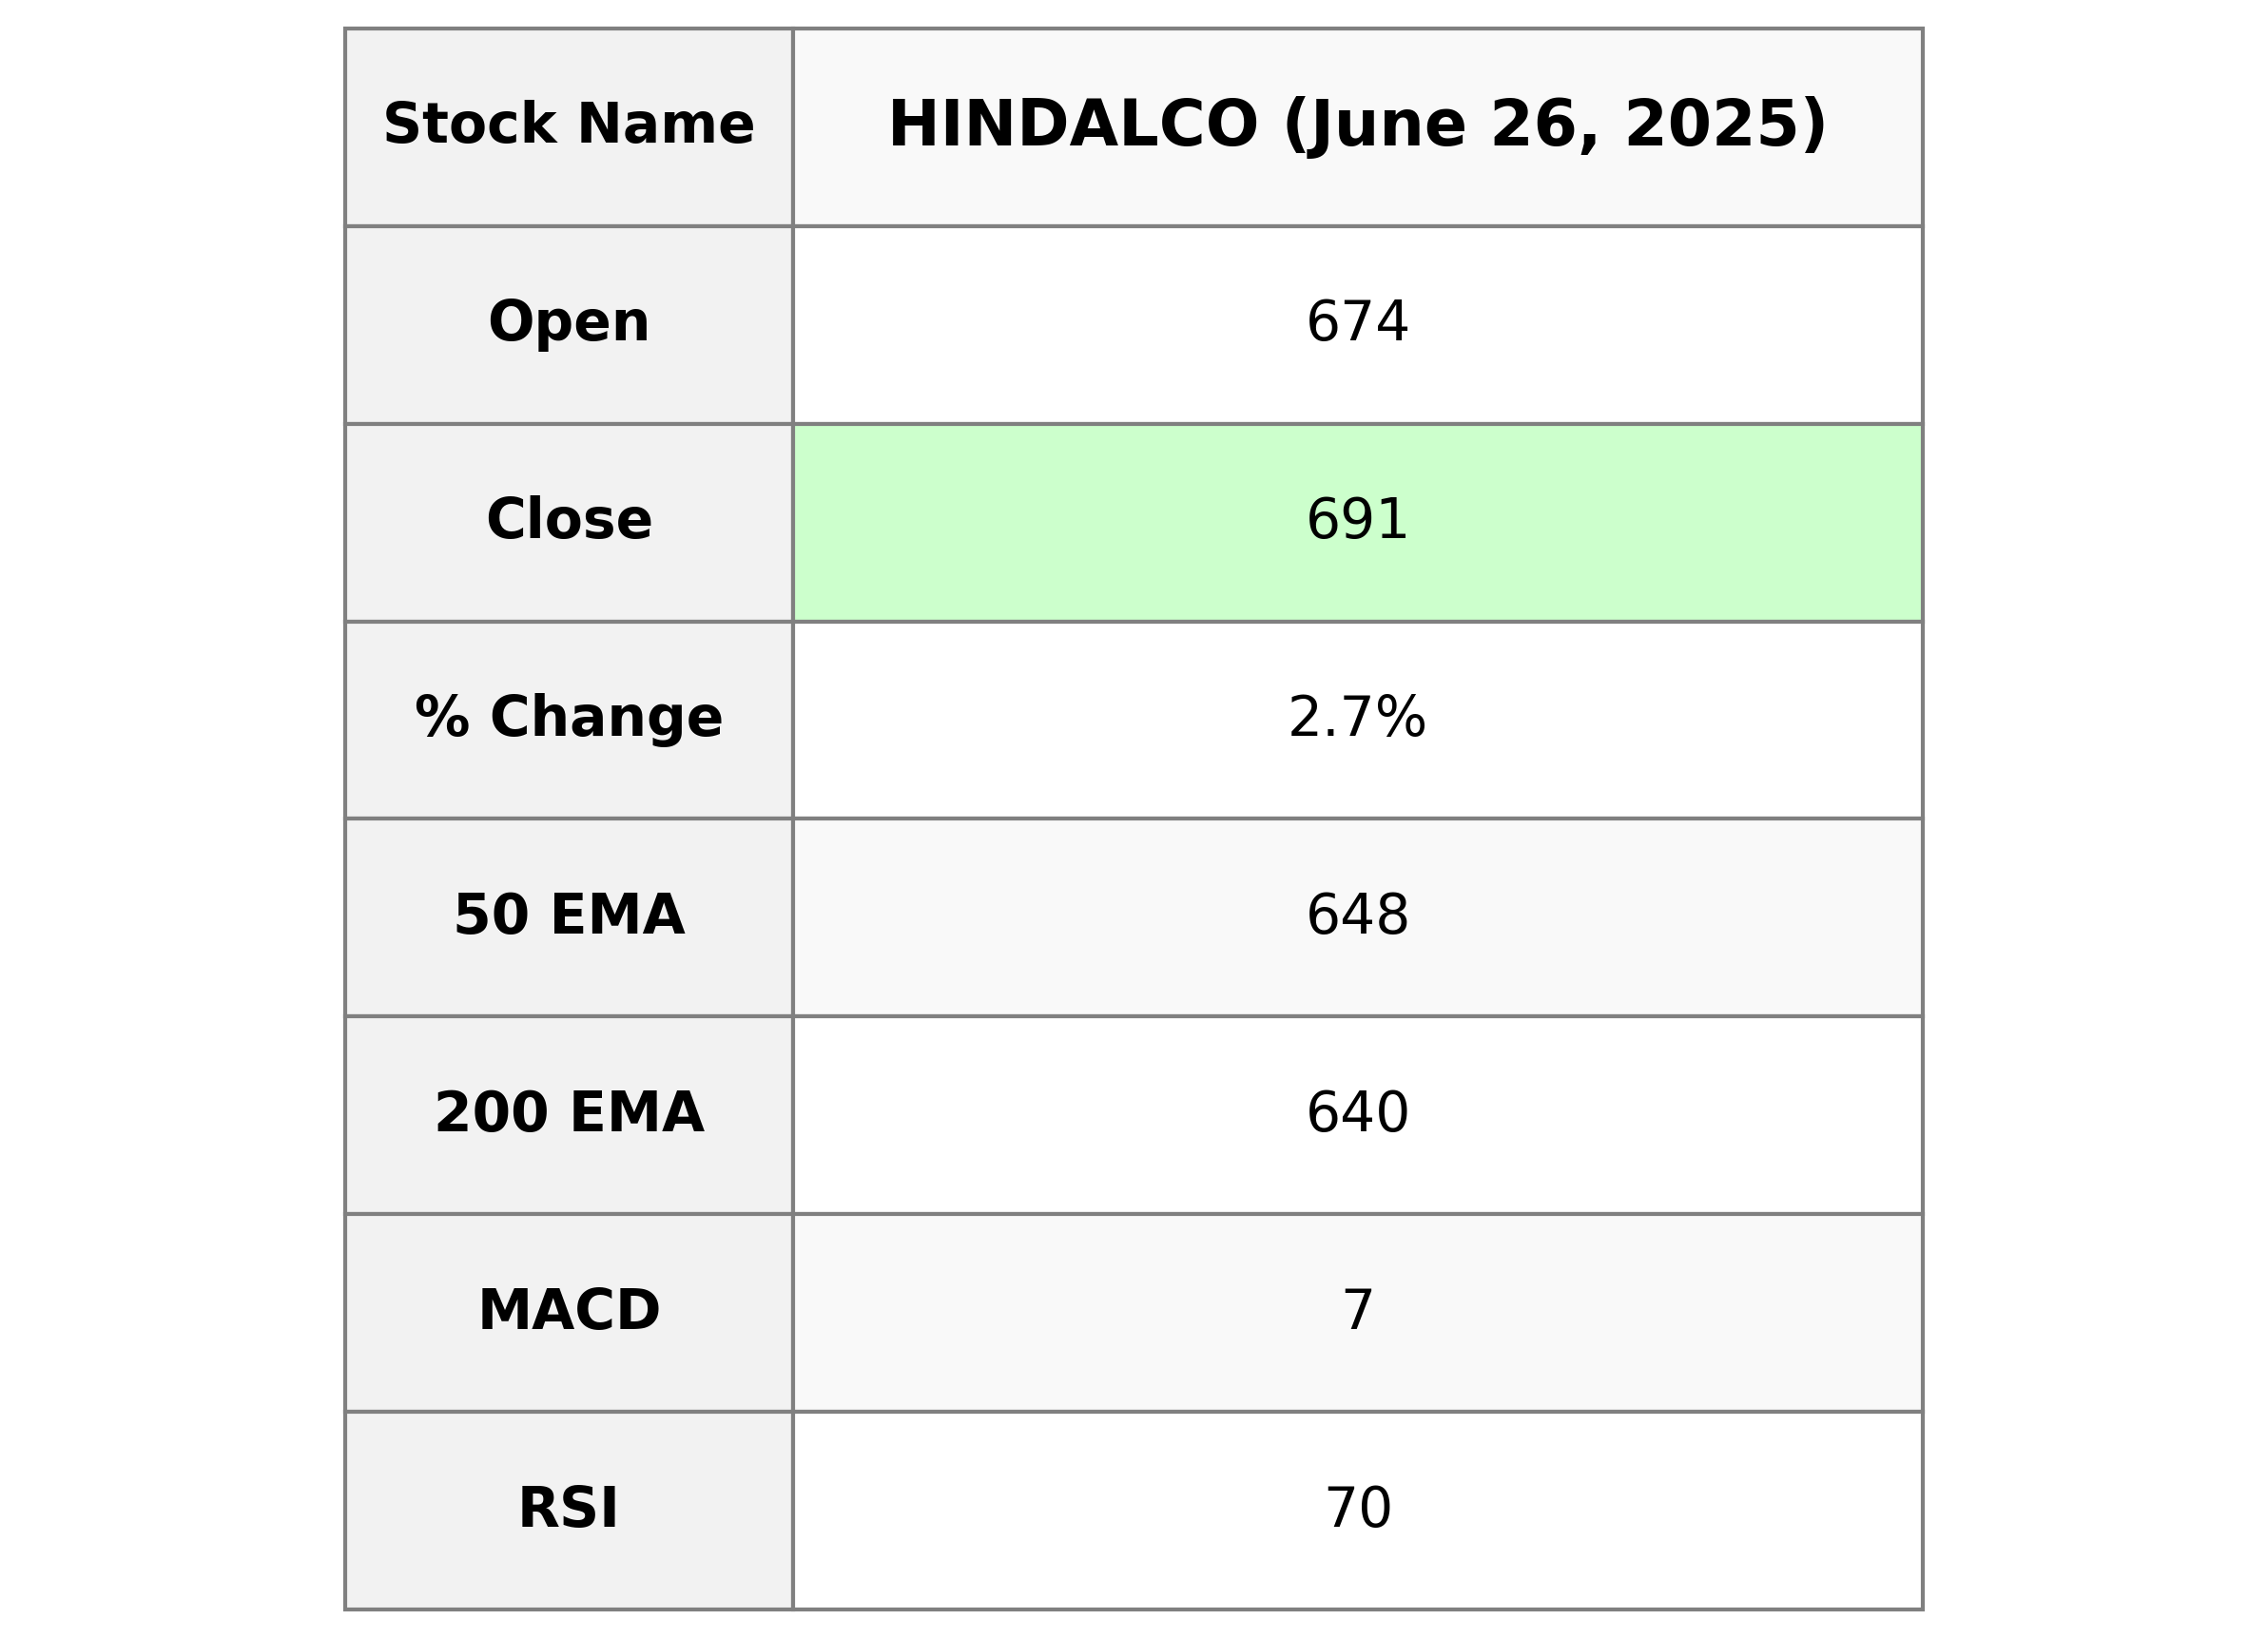
### HINDALCO Performance Description: Hindalco Industries showcased a robust market performance with a closing price of 690.60, marking a 2.67% increase from its previous close. The stock demonstrated strong momentum, evidenced by a high RSI of 69.51, indicating potential overbought conditions. With significant trading volume and a positive MACD, the stock is showing an upward trend in the Basic Materials sector, particularly within the Aluminum industry in India.
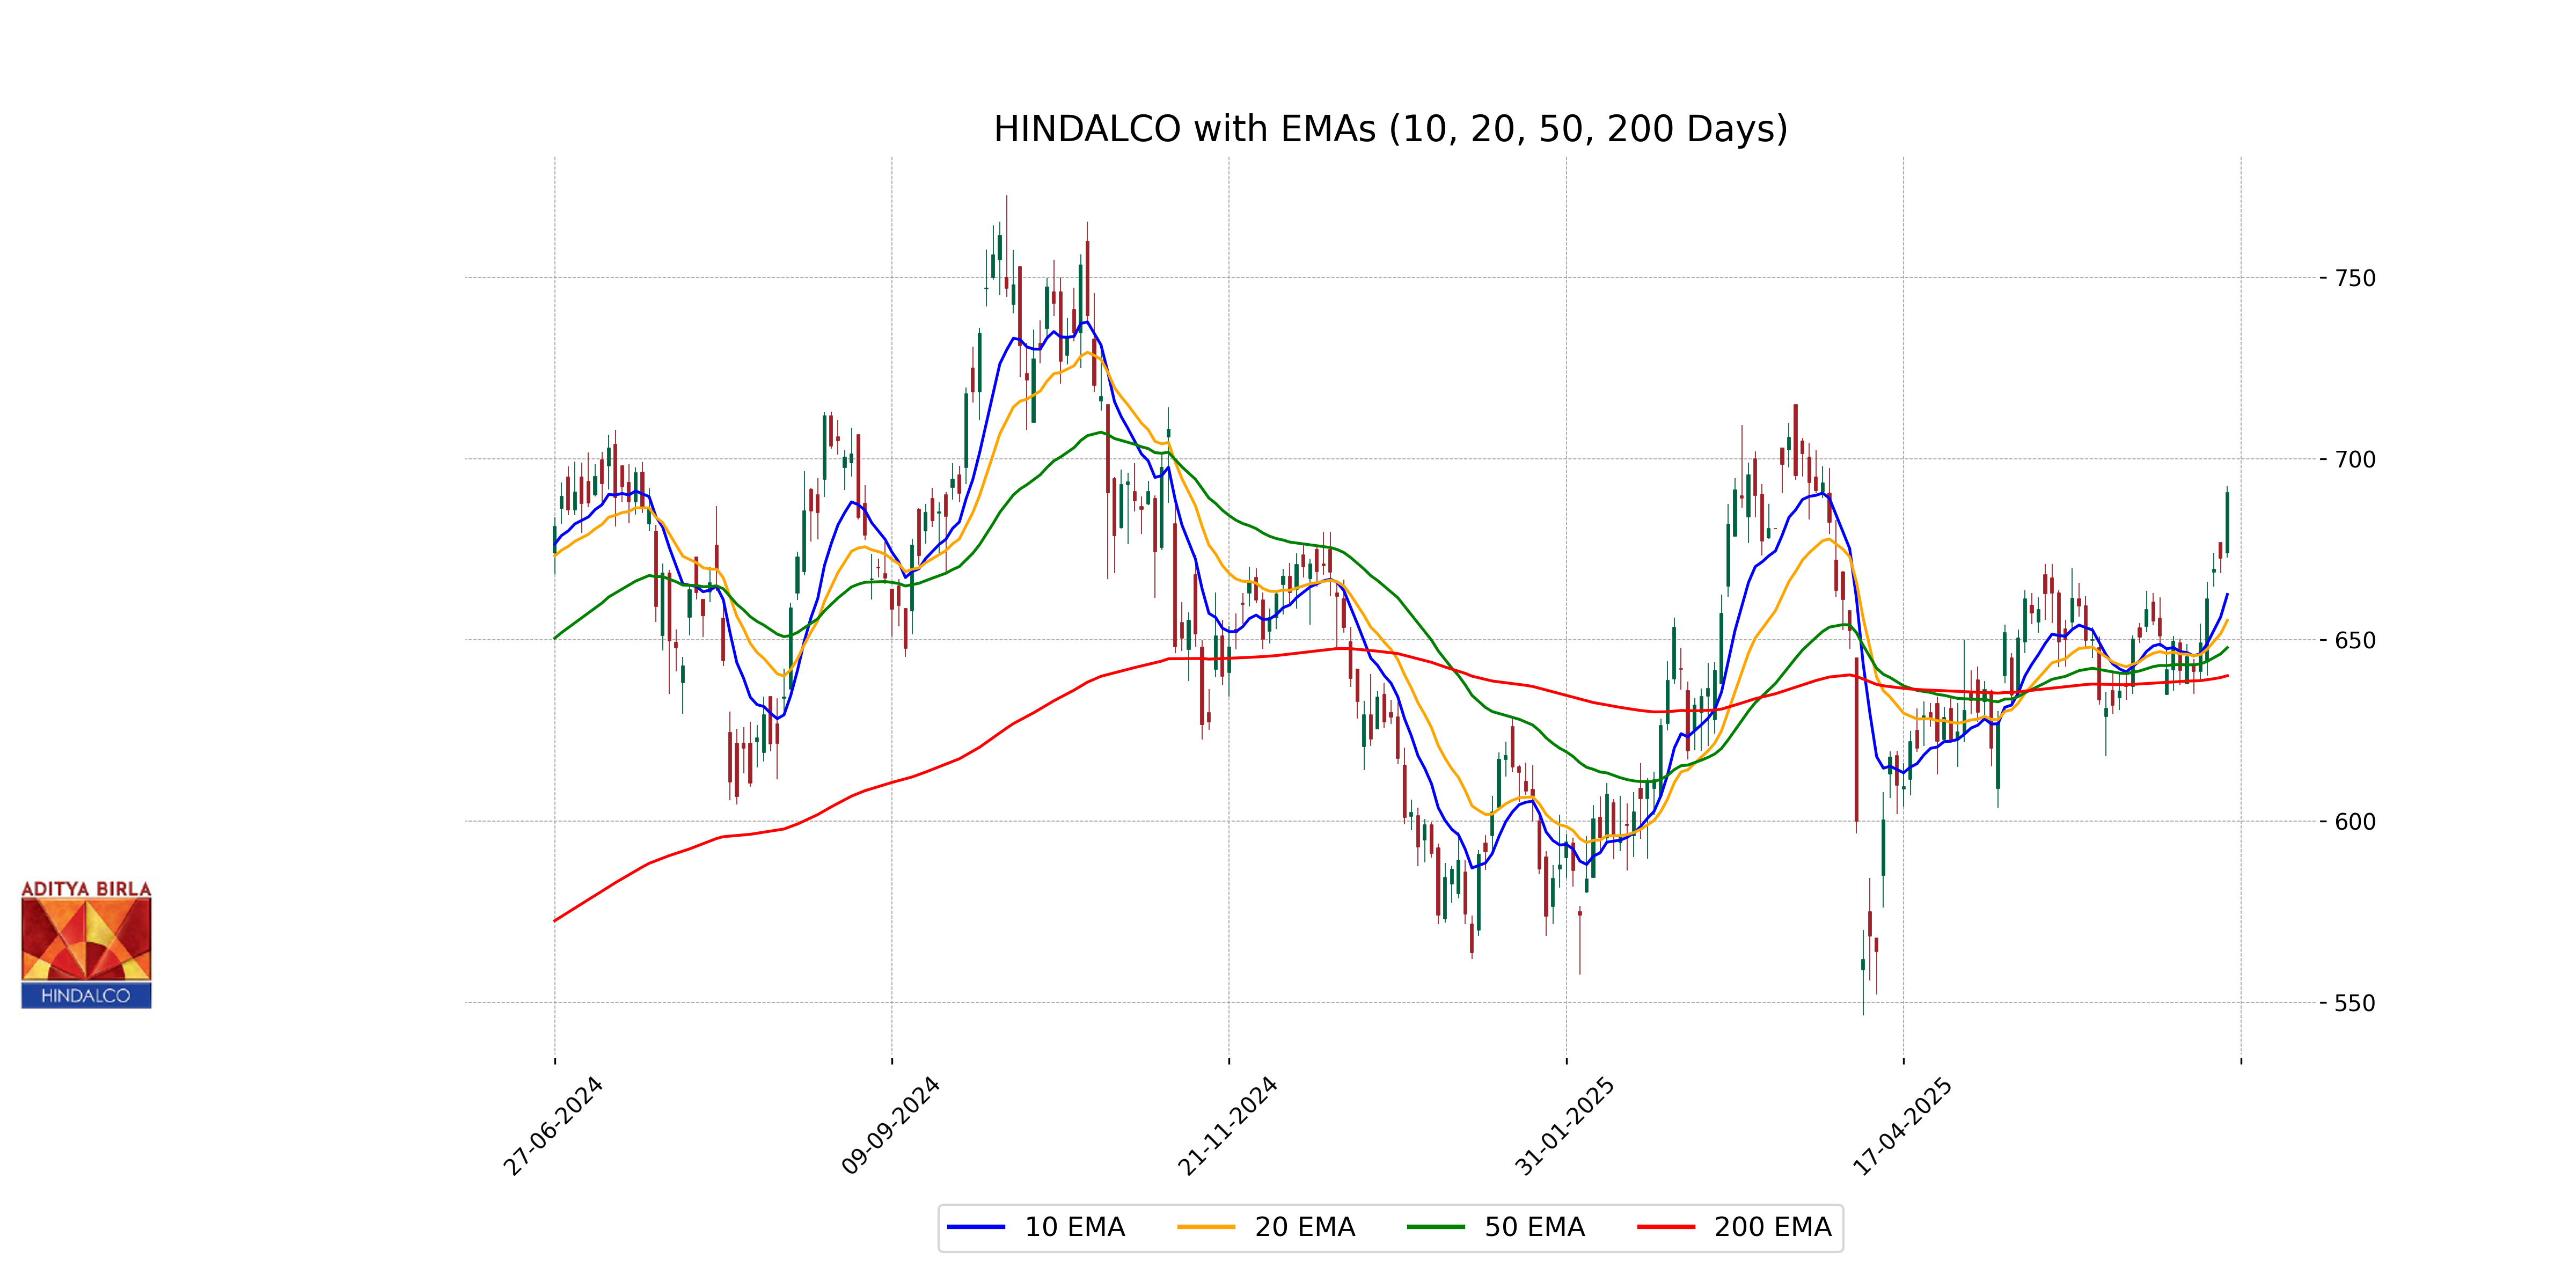
Relationship with Key Moving Averages
Hindalco's current close of 690.60 is above its 50 EMA at 647.90, indicating bullish momentum in the short to mid-term. It is also above the 200 EMA at 640.14 and the 10 EMA at 662.56, reinforcing a strong upward trend.
Moving Averages Trend (MACD)
The MACD for Hindalco is 7.36 with a signal line at 3.46, indicating a bullish momentum as the MACD line is above the signal line. This suggests that Hindalco is experiencing upward momentum in its price trend. The RSI at 69.51 confirms this upward trend, nearing overbought levels.
RSI Analysis
For Hindalco, the RSI (Relative Strength Index) is at 69.51, indicating that the stock is nearing overbought conditions since it is approaching the 70 mark. This suggests that the stock may be due for a price consolidation or a potential pullback in the near term.
Analysis for Shriram Finance - June 26, 2025
Shriram Finance has shown positive performance with a closing price of 703.20, representing a 4.16% increase from the previous close. The stock has strong trading volume at over 19 million, and its MACD of 6.49 indicates positive momentum. The stock trades above its 50-day and 200-day EMA, suggesting a bullish trend. With a market cap of approximately 1.32 trillion INR and a PE ratio of 14.04, it remains a significant player in the Financial Services sector within the Credit Services industry in India.
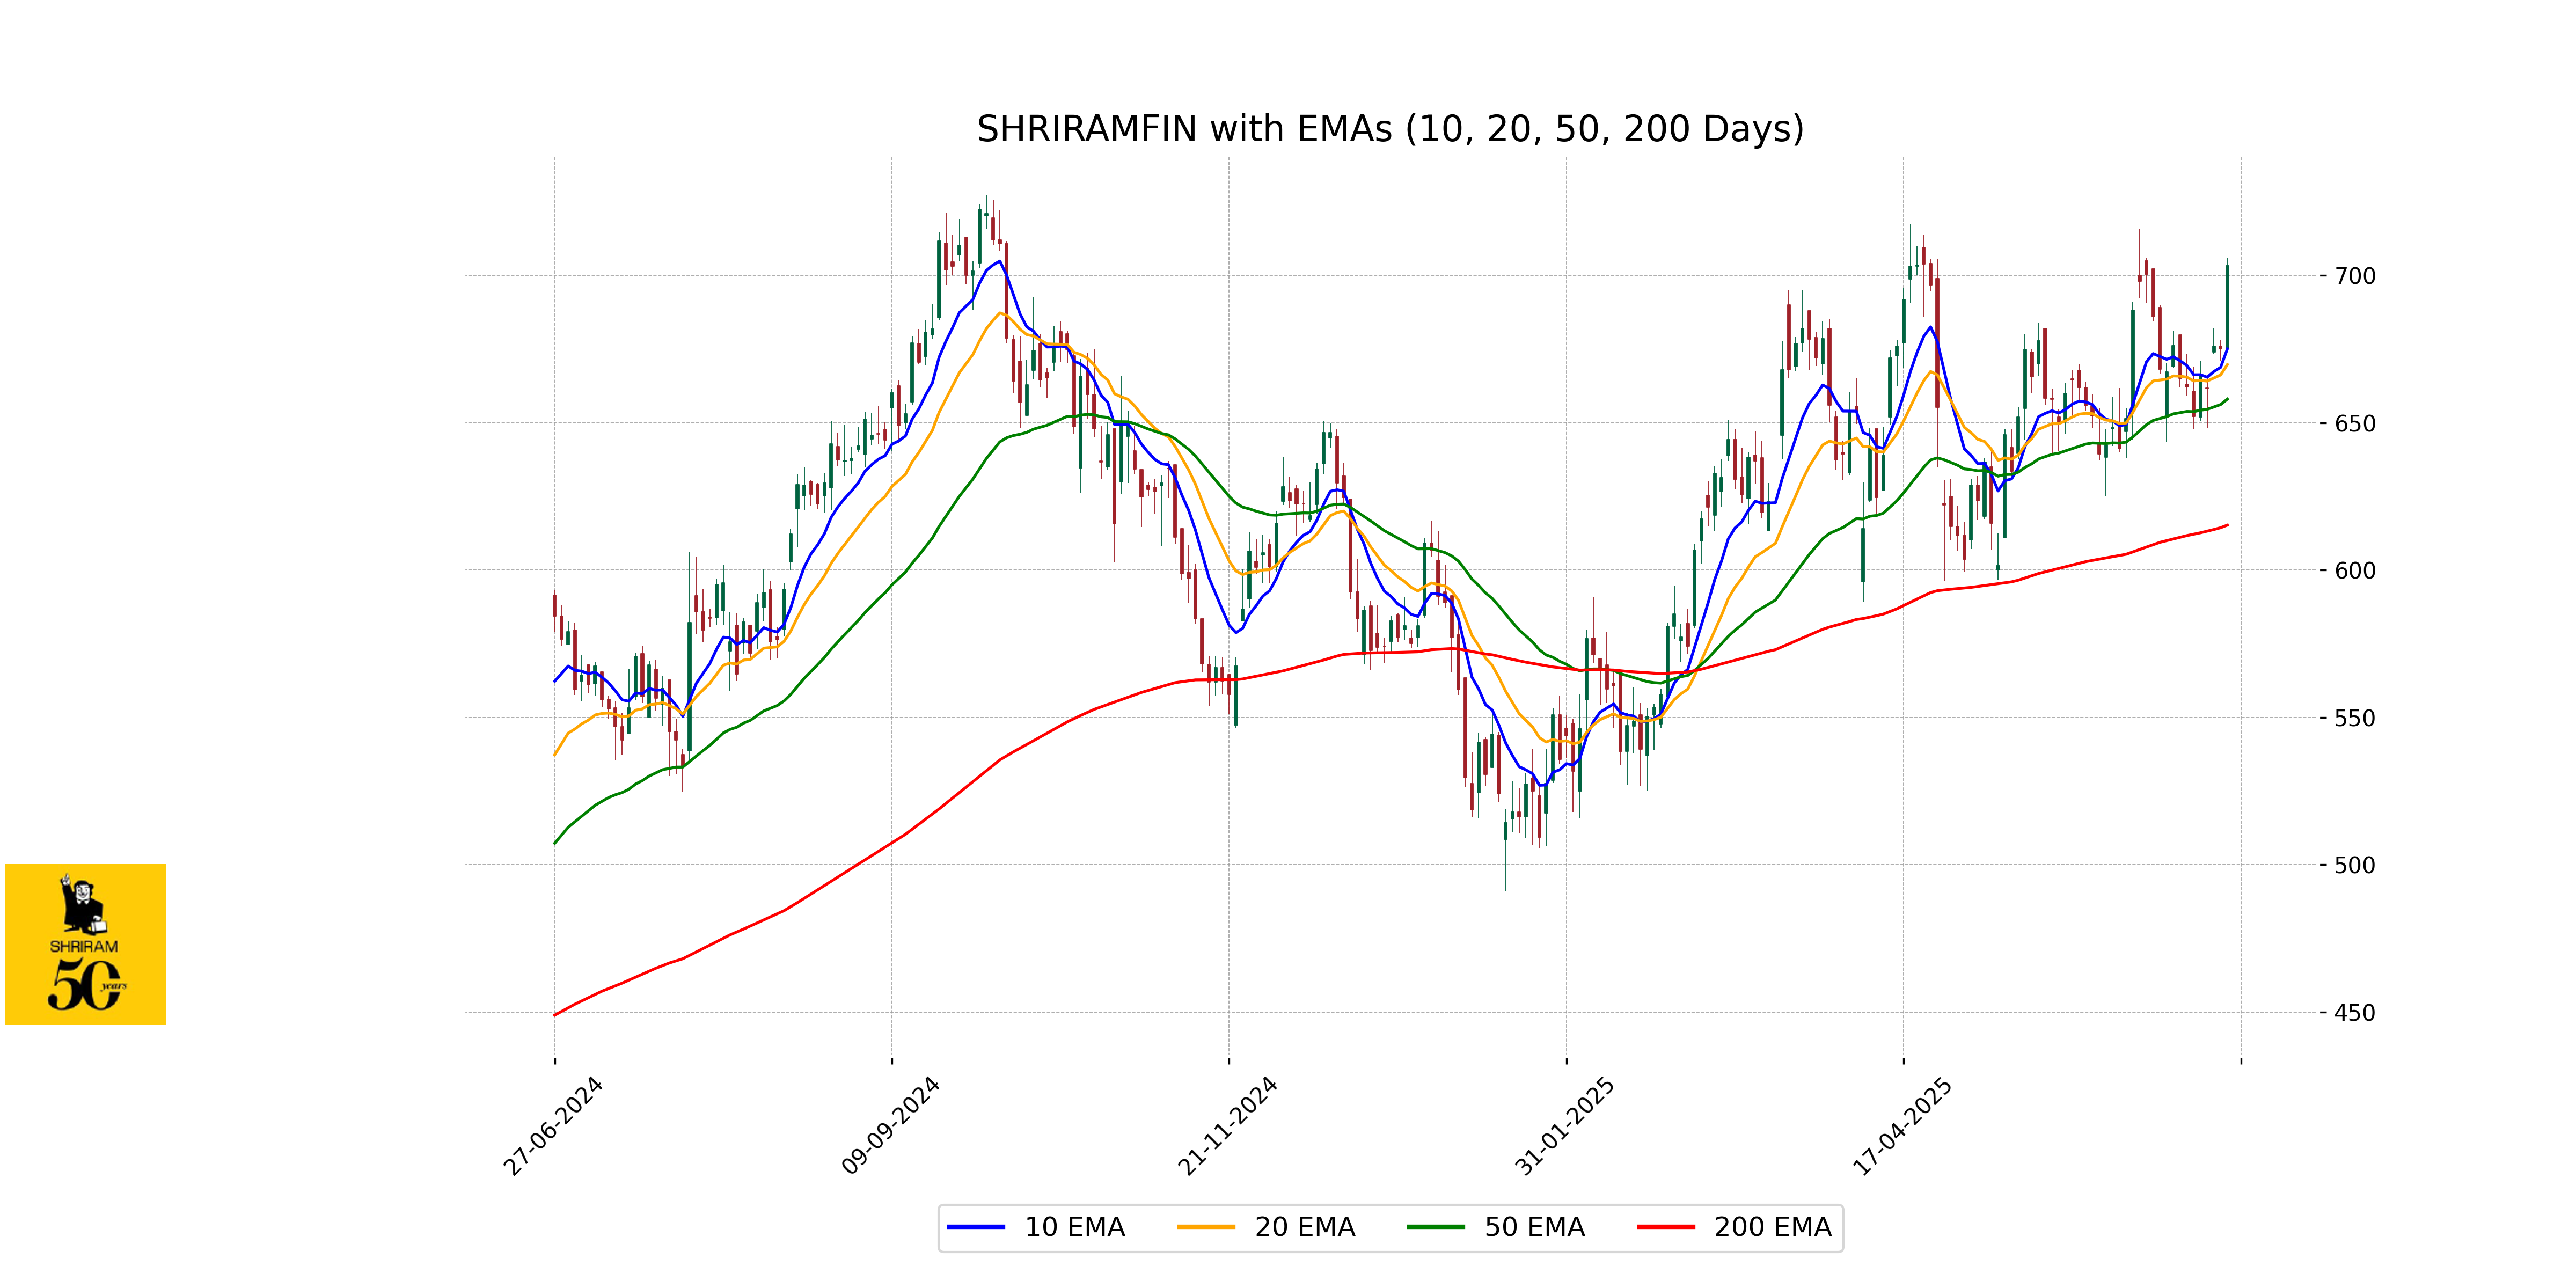
Relationship with Key Moving Averages
Shriram Finance's stock closed at 703.20, which is above all its key moving averages: the 10-day EMA at 675.03, the 20-day EMA at 669.71, the 50-day EMA at 657.99, and the 200-day EMA at 615.25. This indicates a strong bullish momentum.
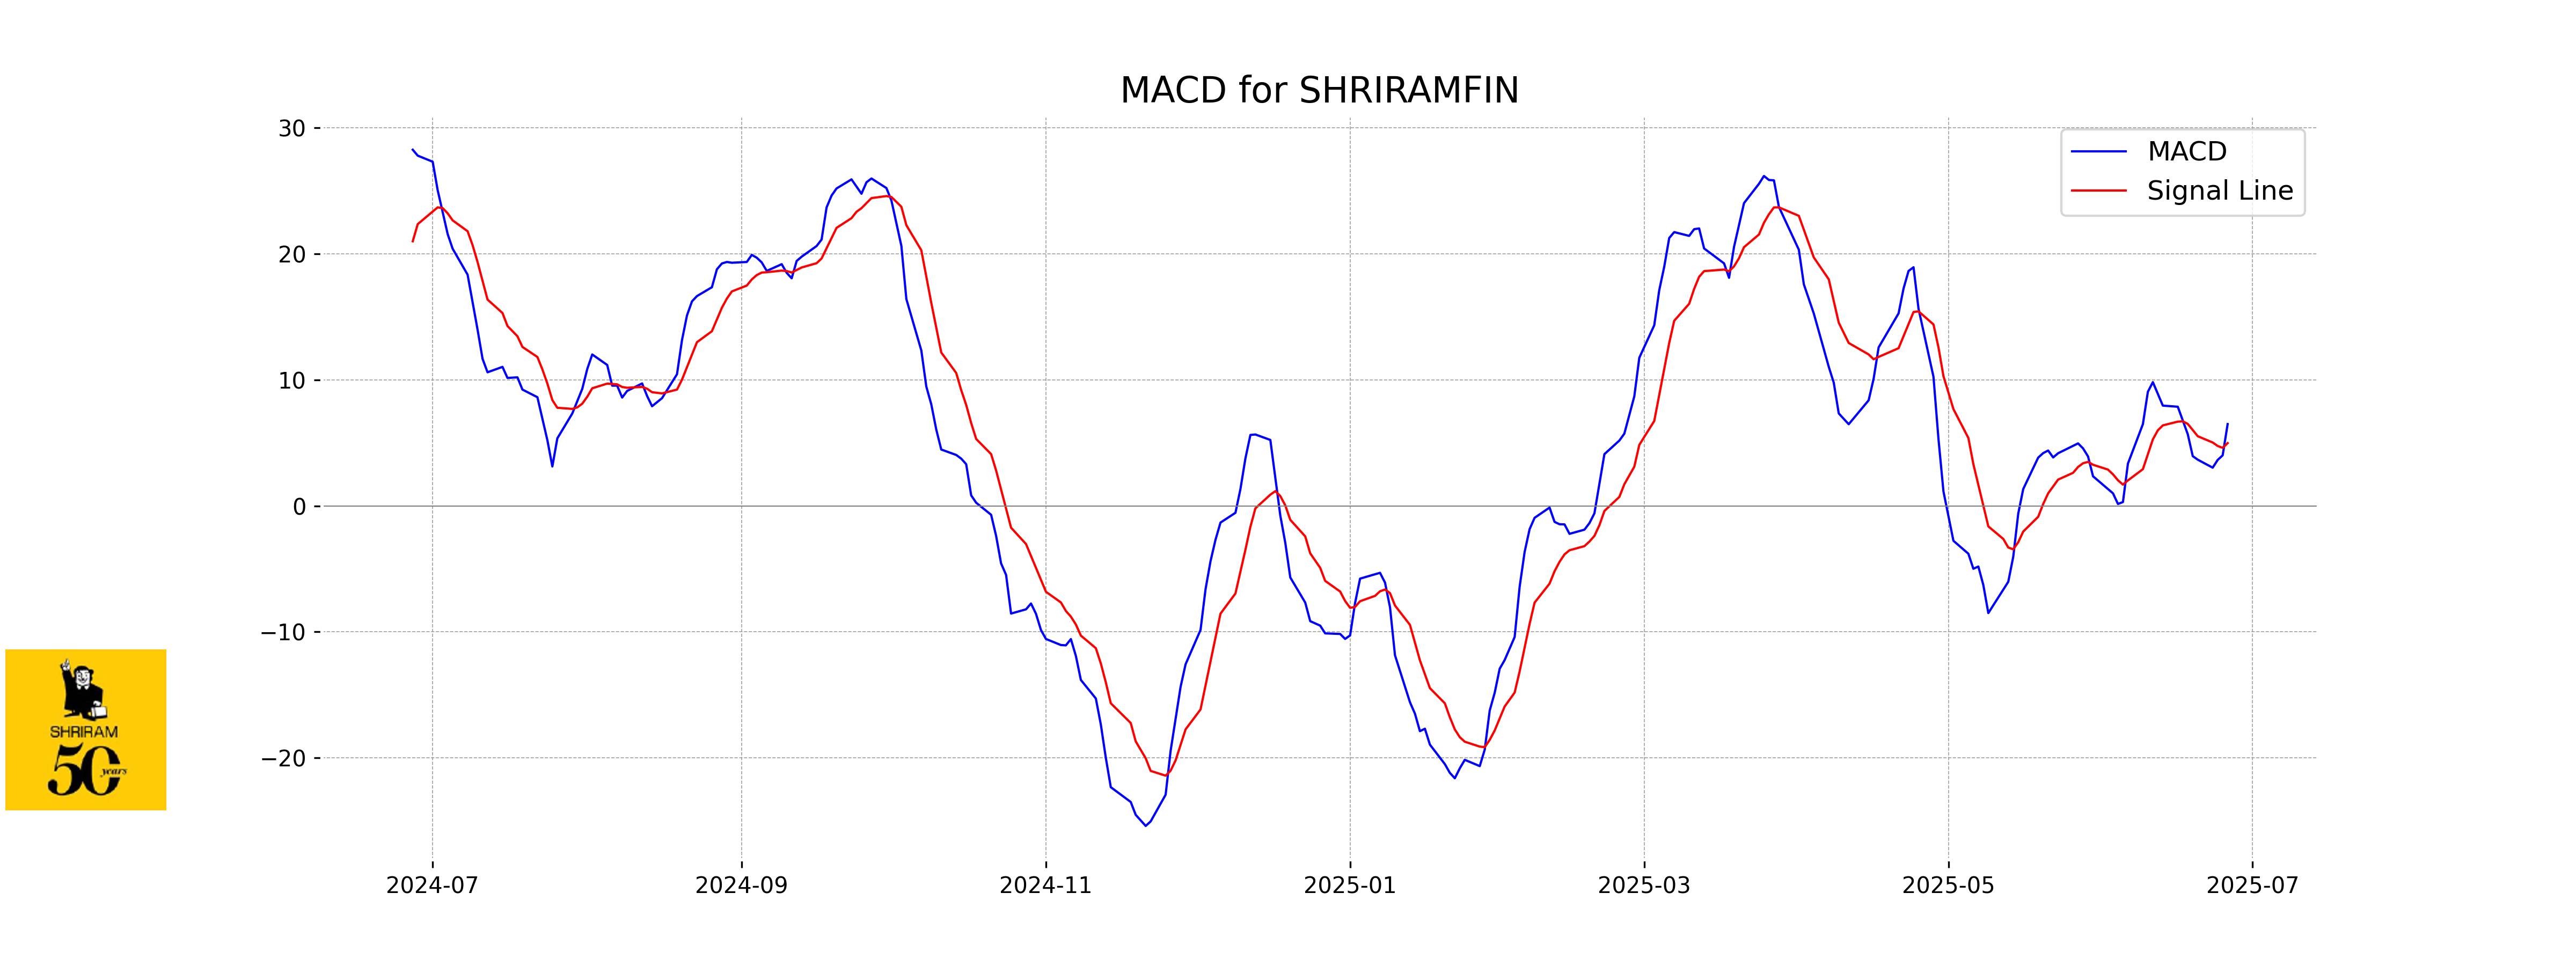
Moving Averages Trend (MACD)
MACD Analysis for Shriram Finance: The MACD line is at 6.49, which is above the signal line at 4.98, suggesting a bullish momentum. The positive MACD indicates potential for upward price movement.
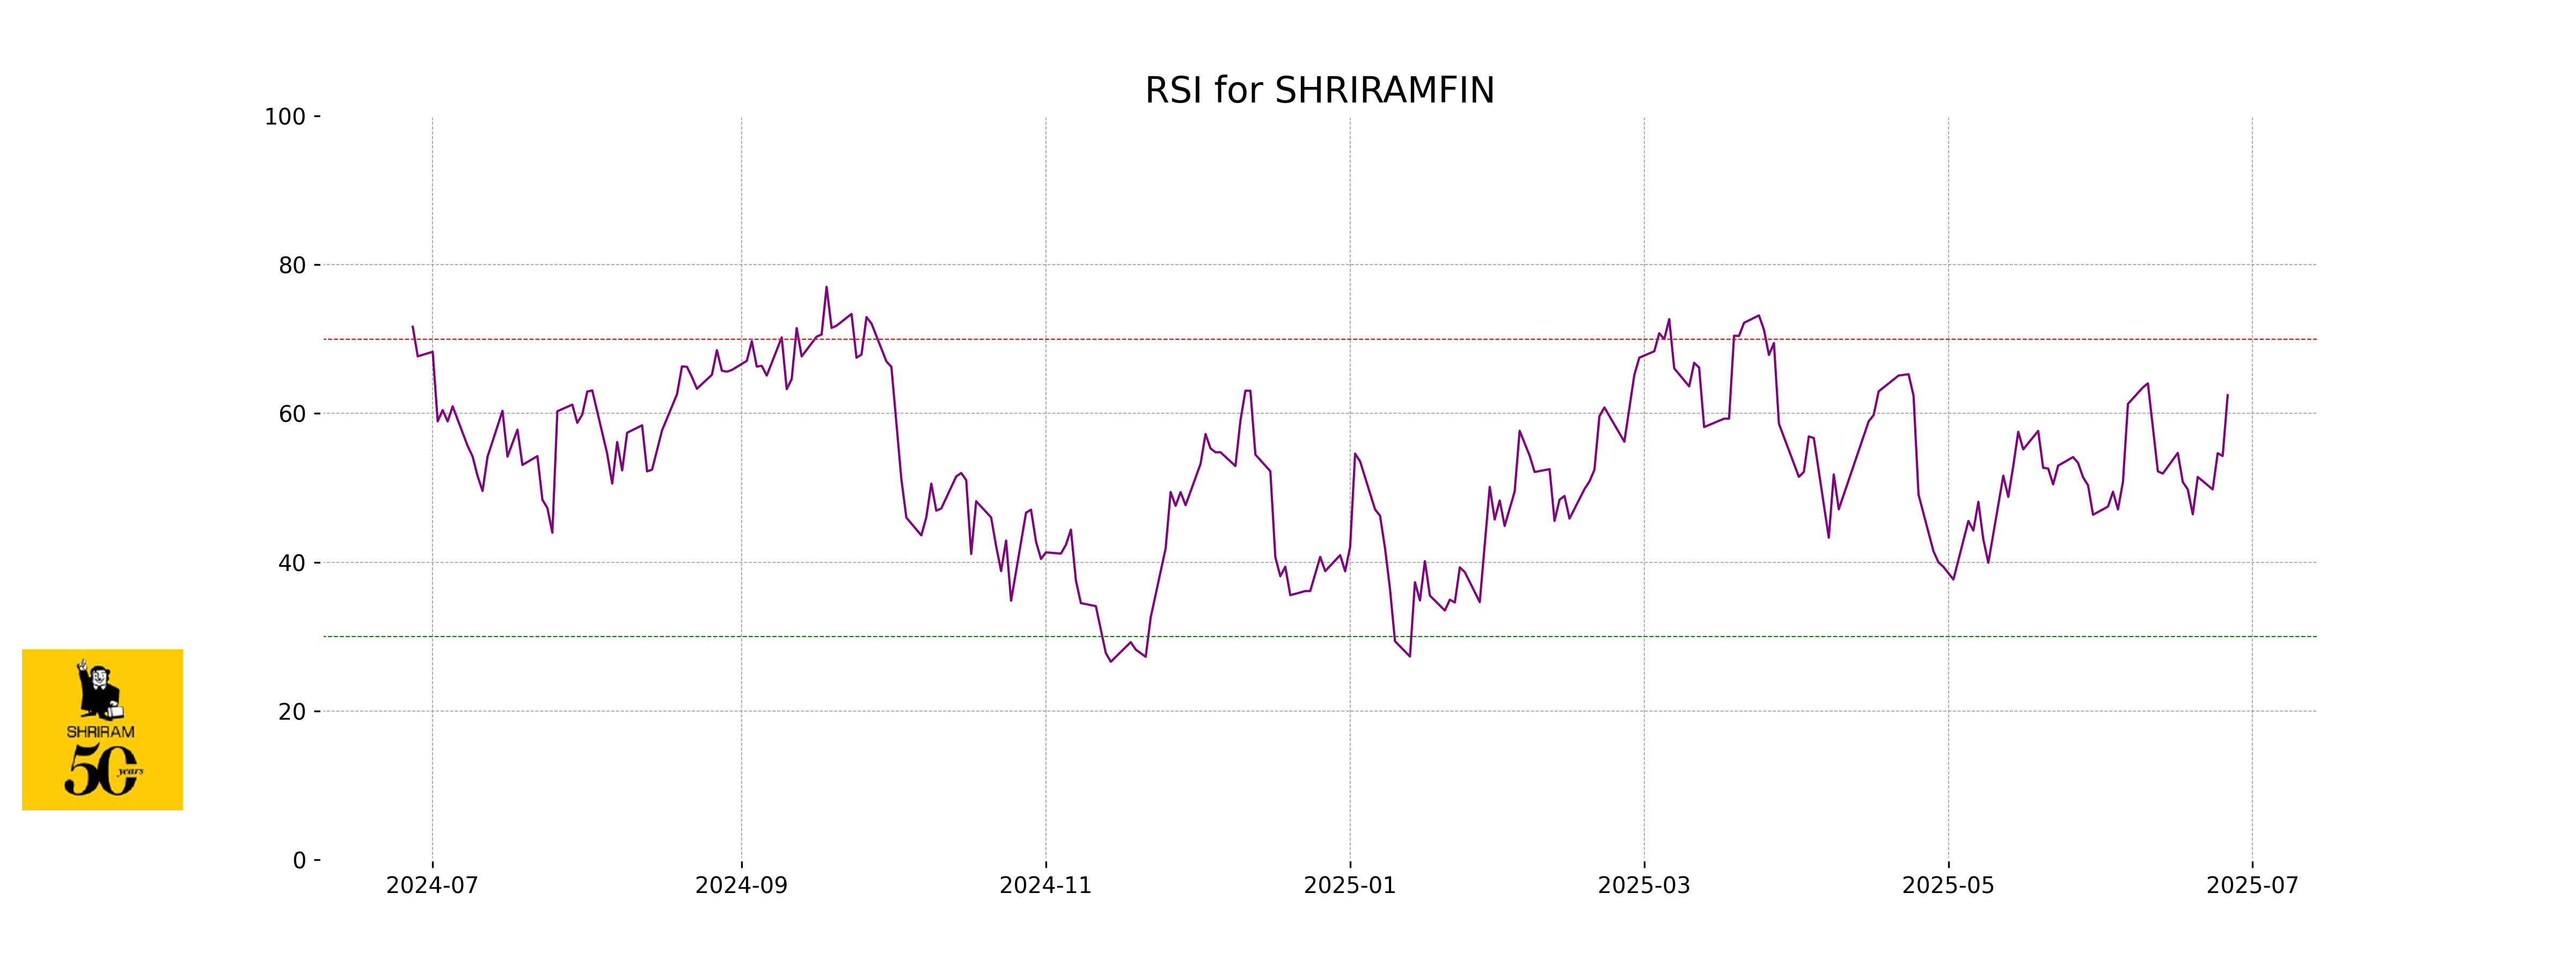
RSI Analysis
RSI Analysis for Shriram Finance The RSI (Relative Strength Index) for Shriram Finance is at 62.45, which indicates that the stock is in a moderately strong position. This level suggests that the stock is neither overbought nor oversold, and it may have room for further movement in either direction.
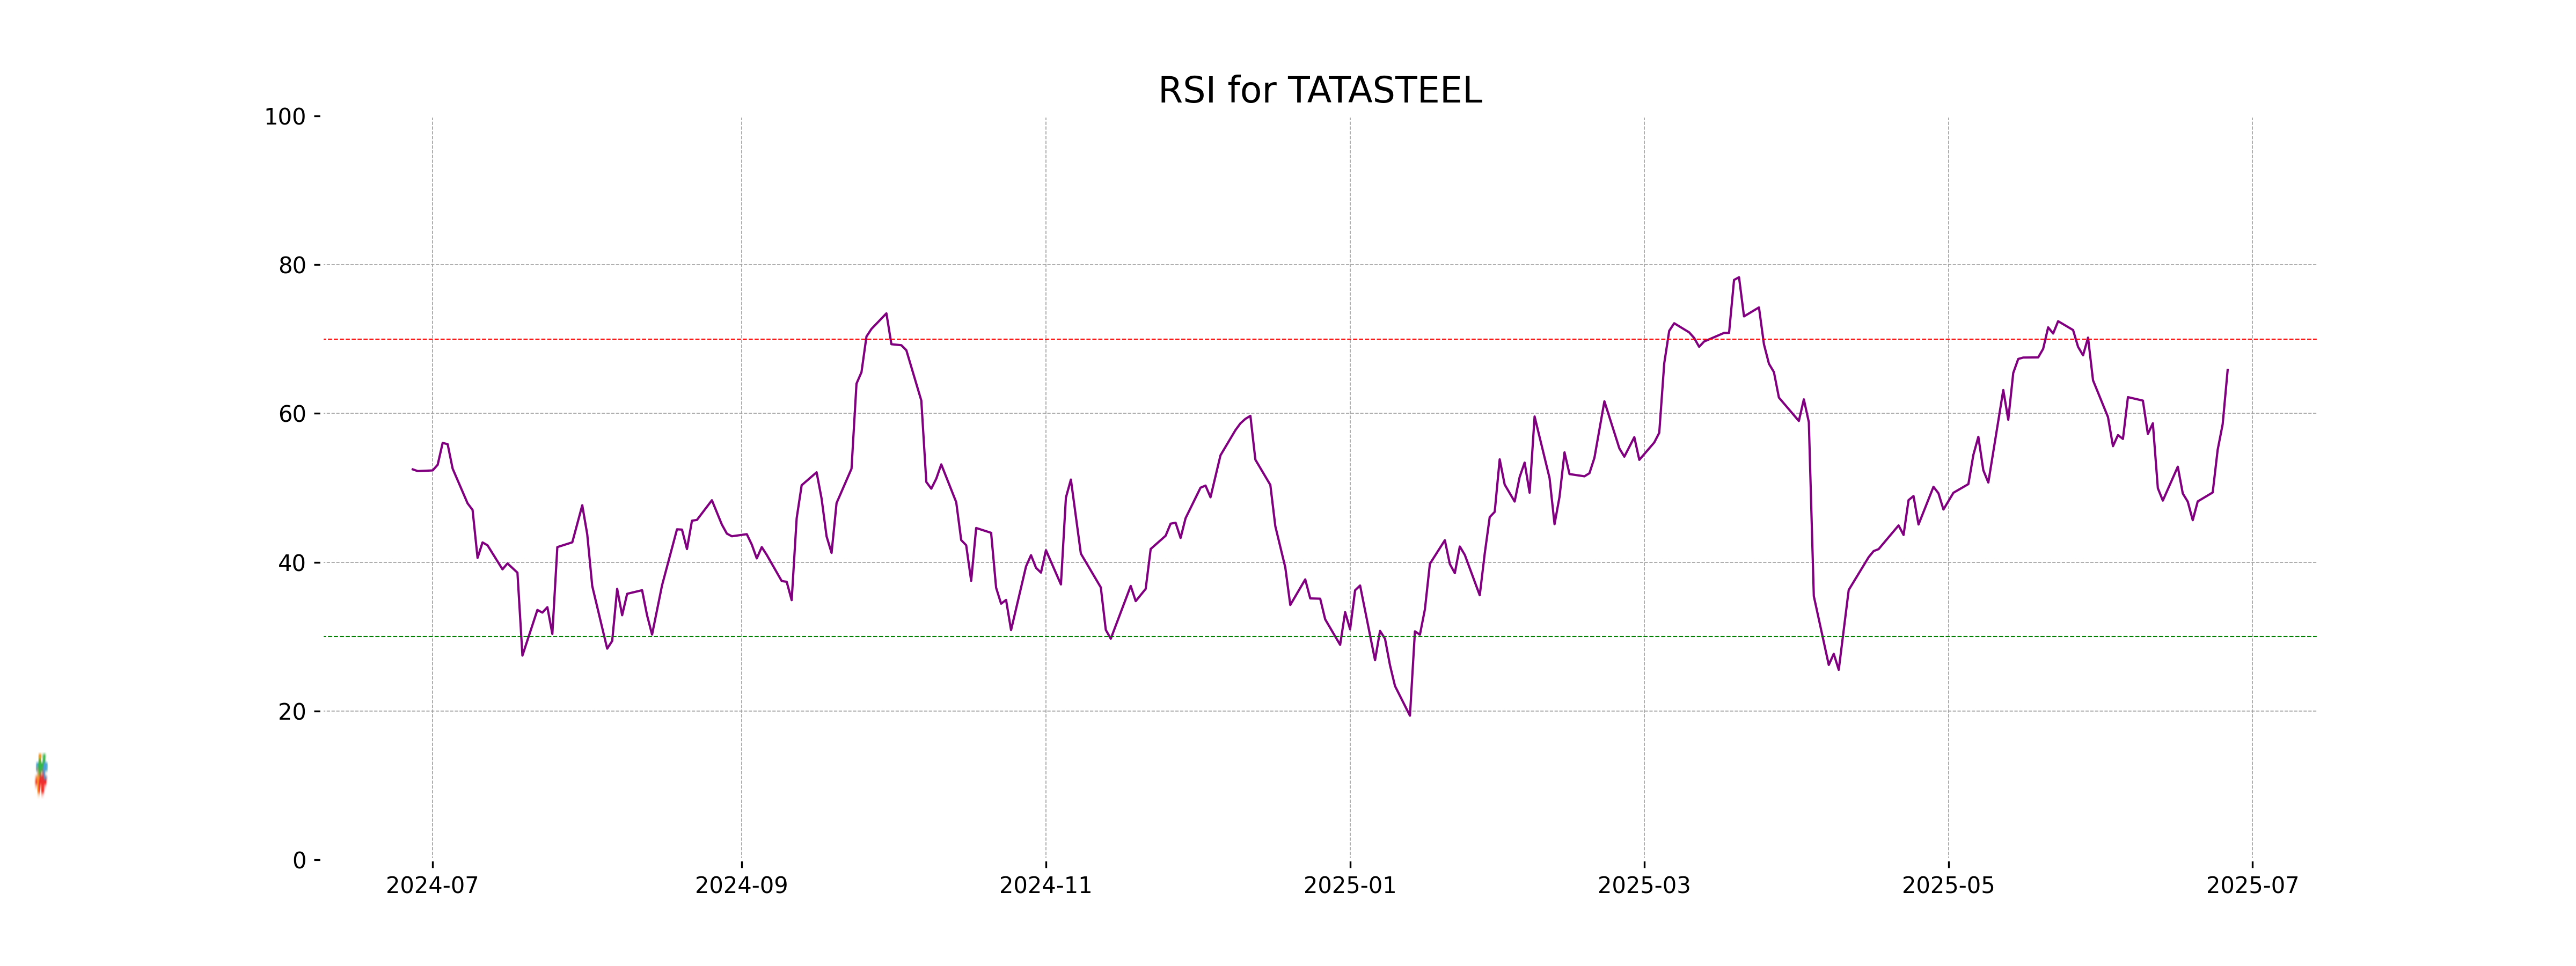
Analysis for Tata Steel - June 26, 2025
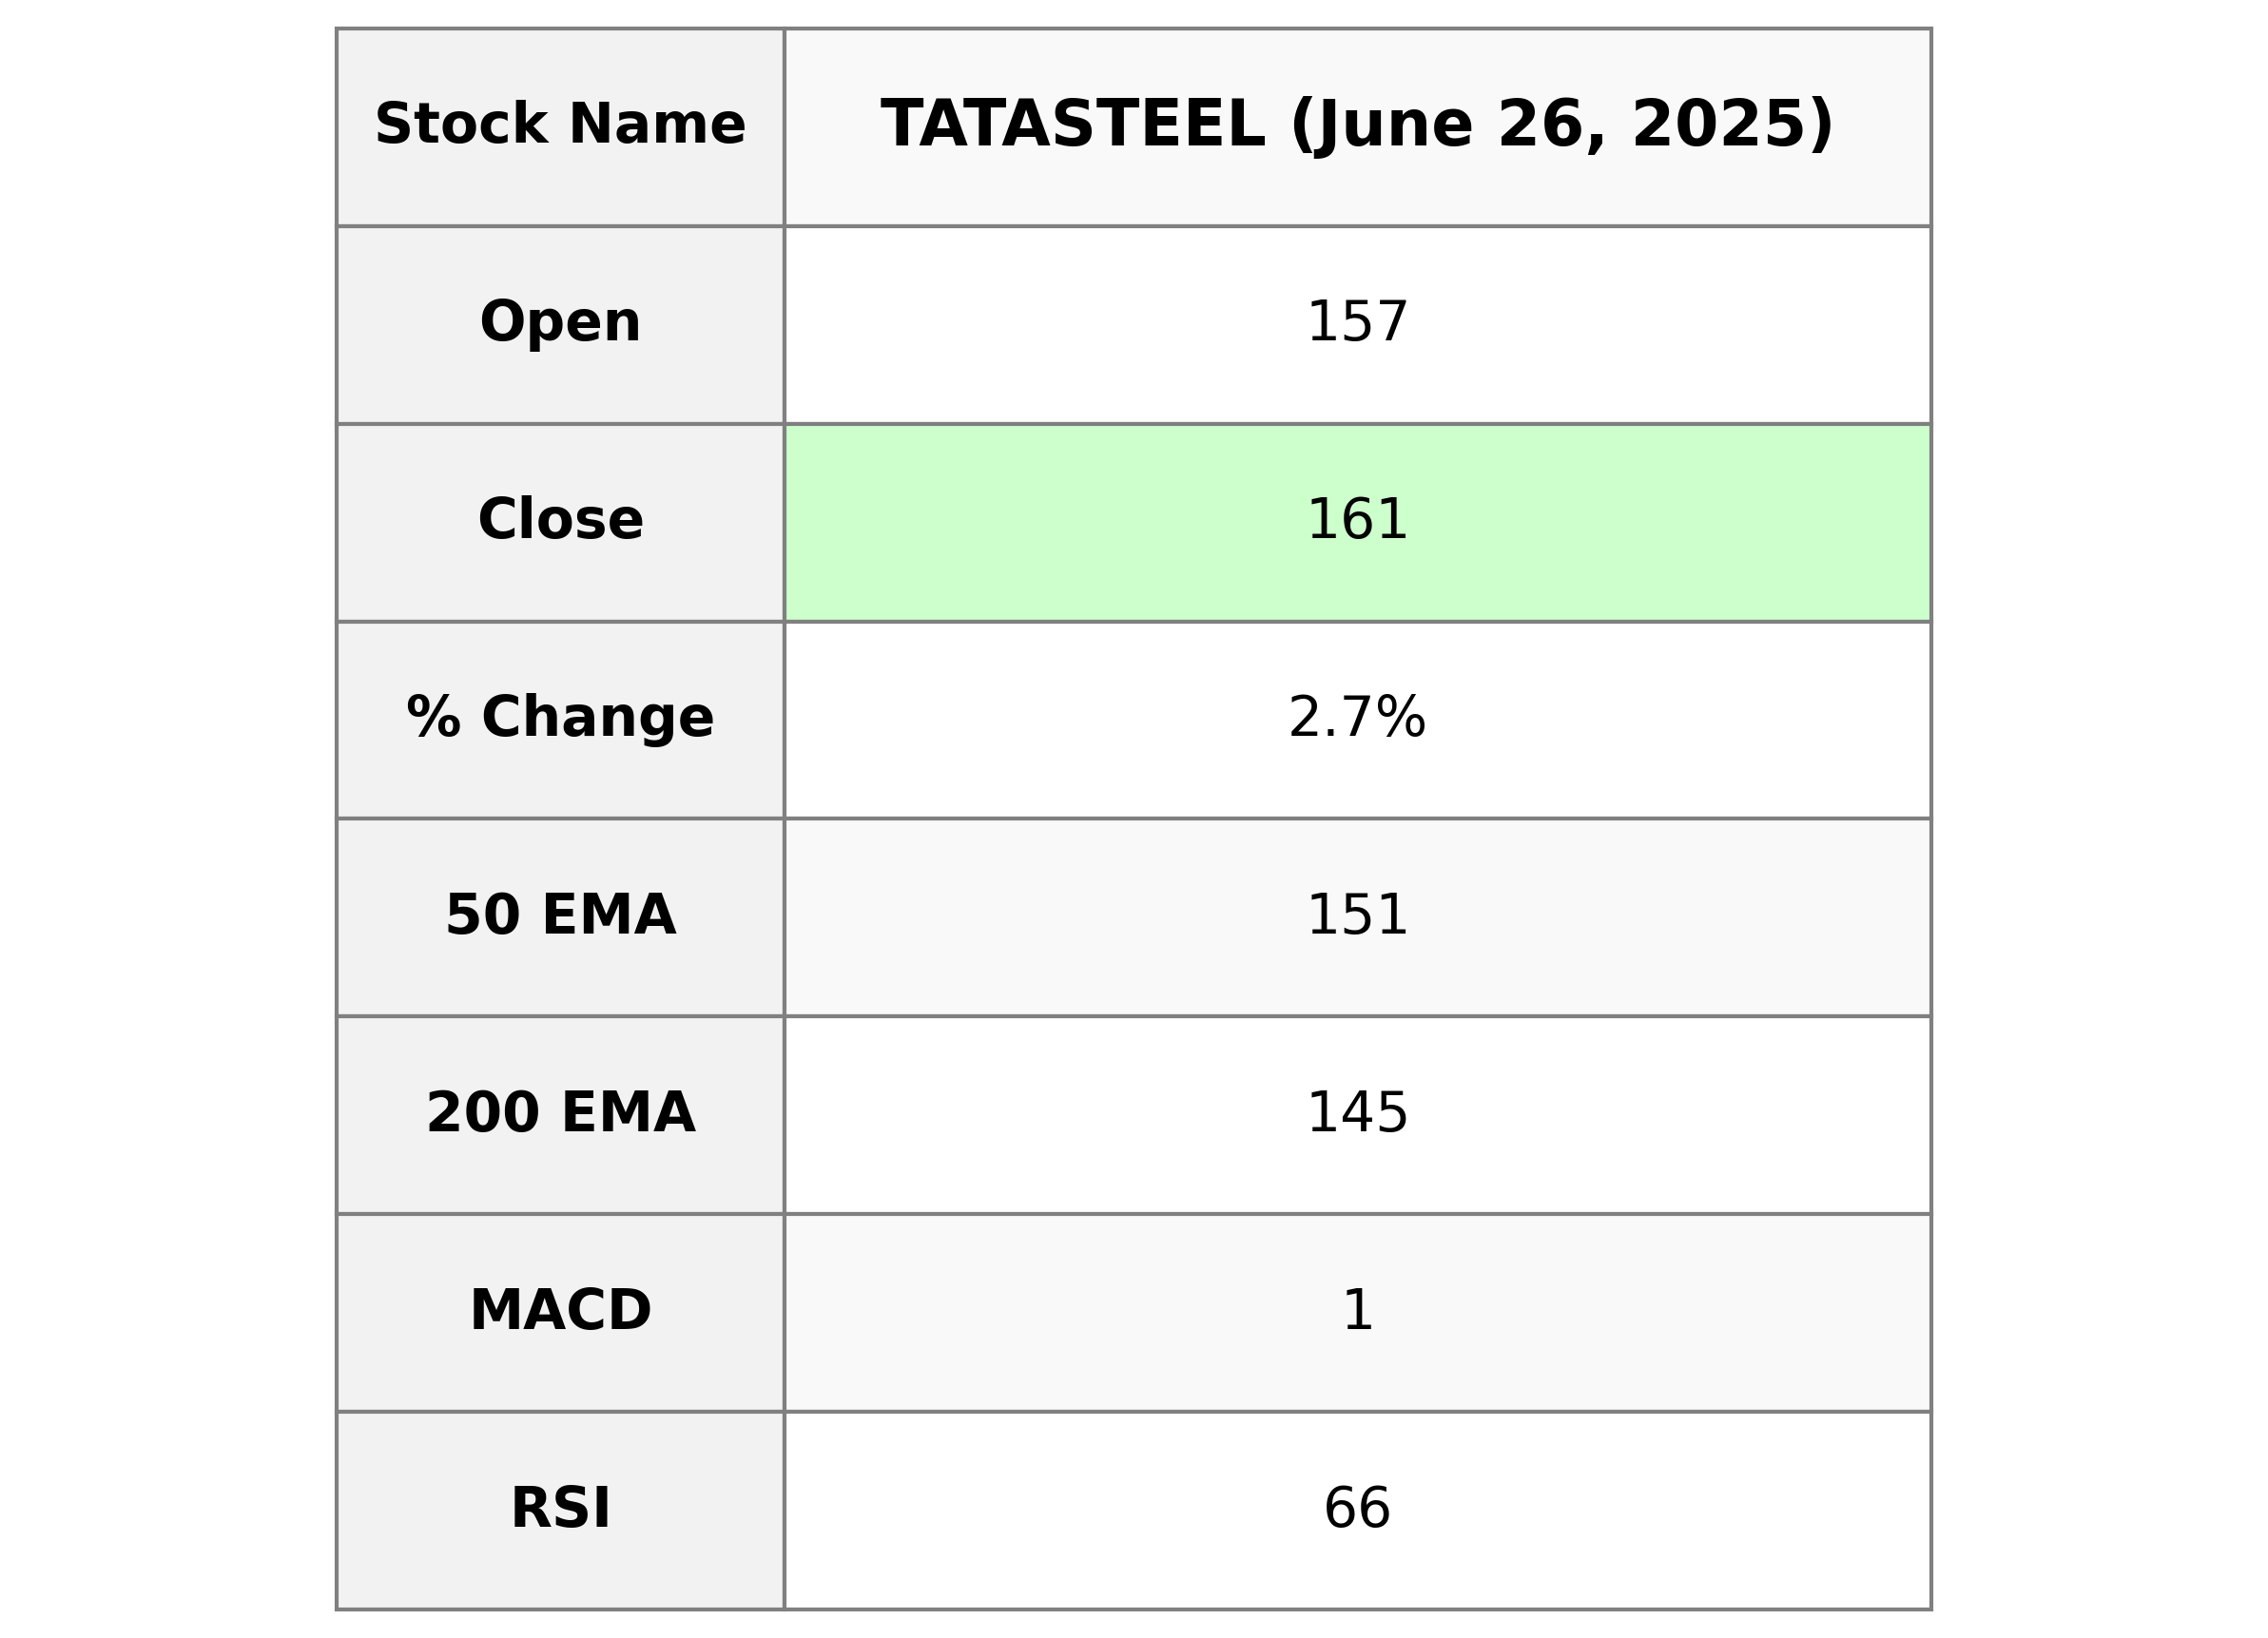
Tata Steel showed a strong performance, closing at 160.54 with a notable percentage change of 2.65% and a points change of 4.15 from its previous close. The stock traded with a high volume of 40,637,736 shares and demonstrated a solid position above its 50 EMA and 200 EMA indicators. With an RSI of 65.85, it indicates a possibly overbought condition. Tata Steel operates in the Basic Materials sector, specifically in the Steel industry, and it holds a significant market cap of 2,002,222,710,784 in India.
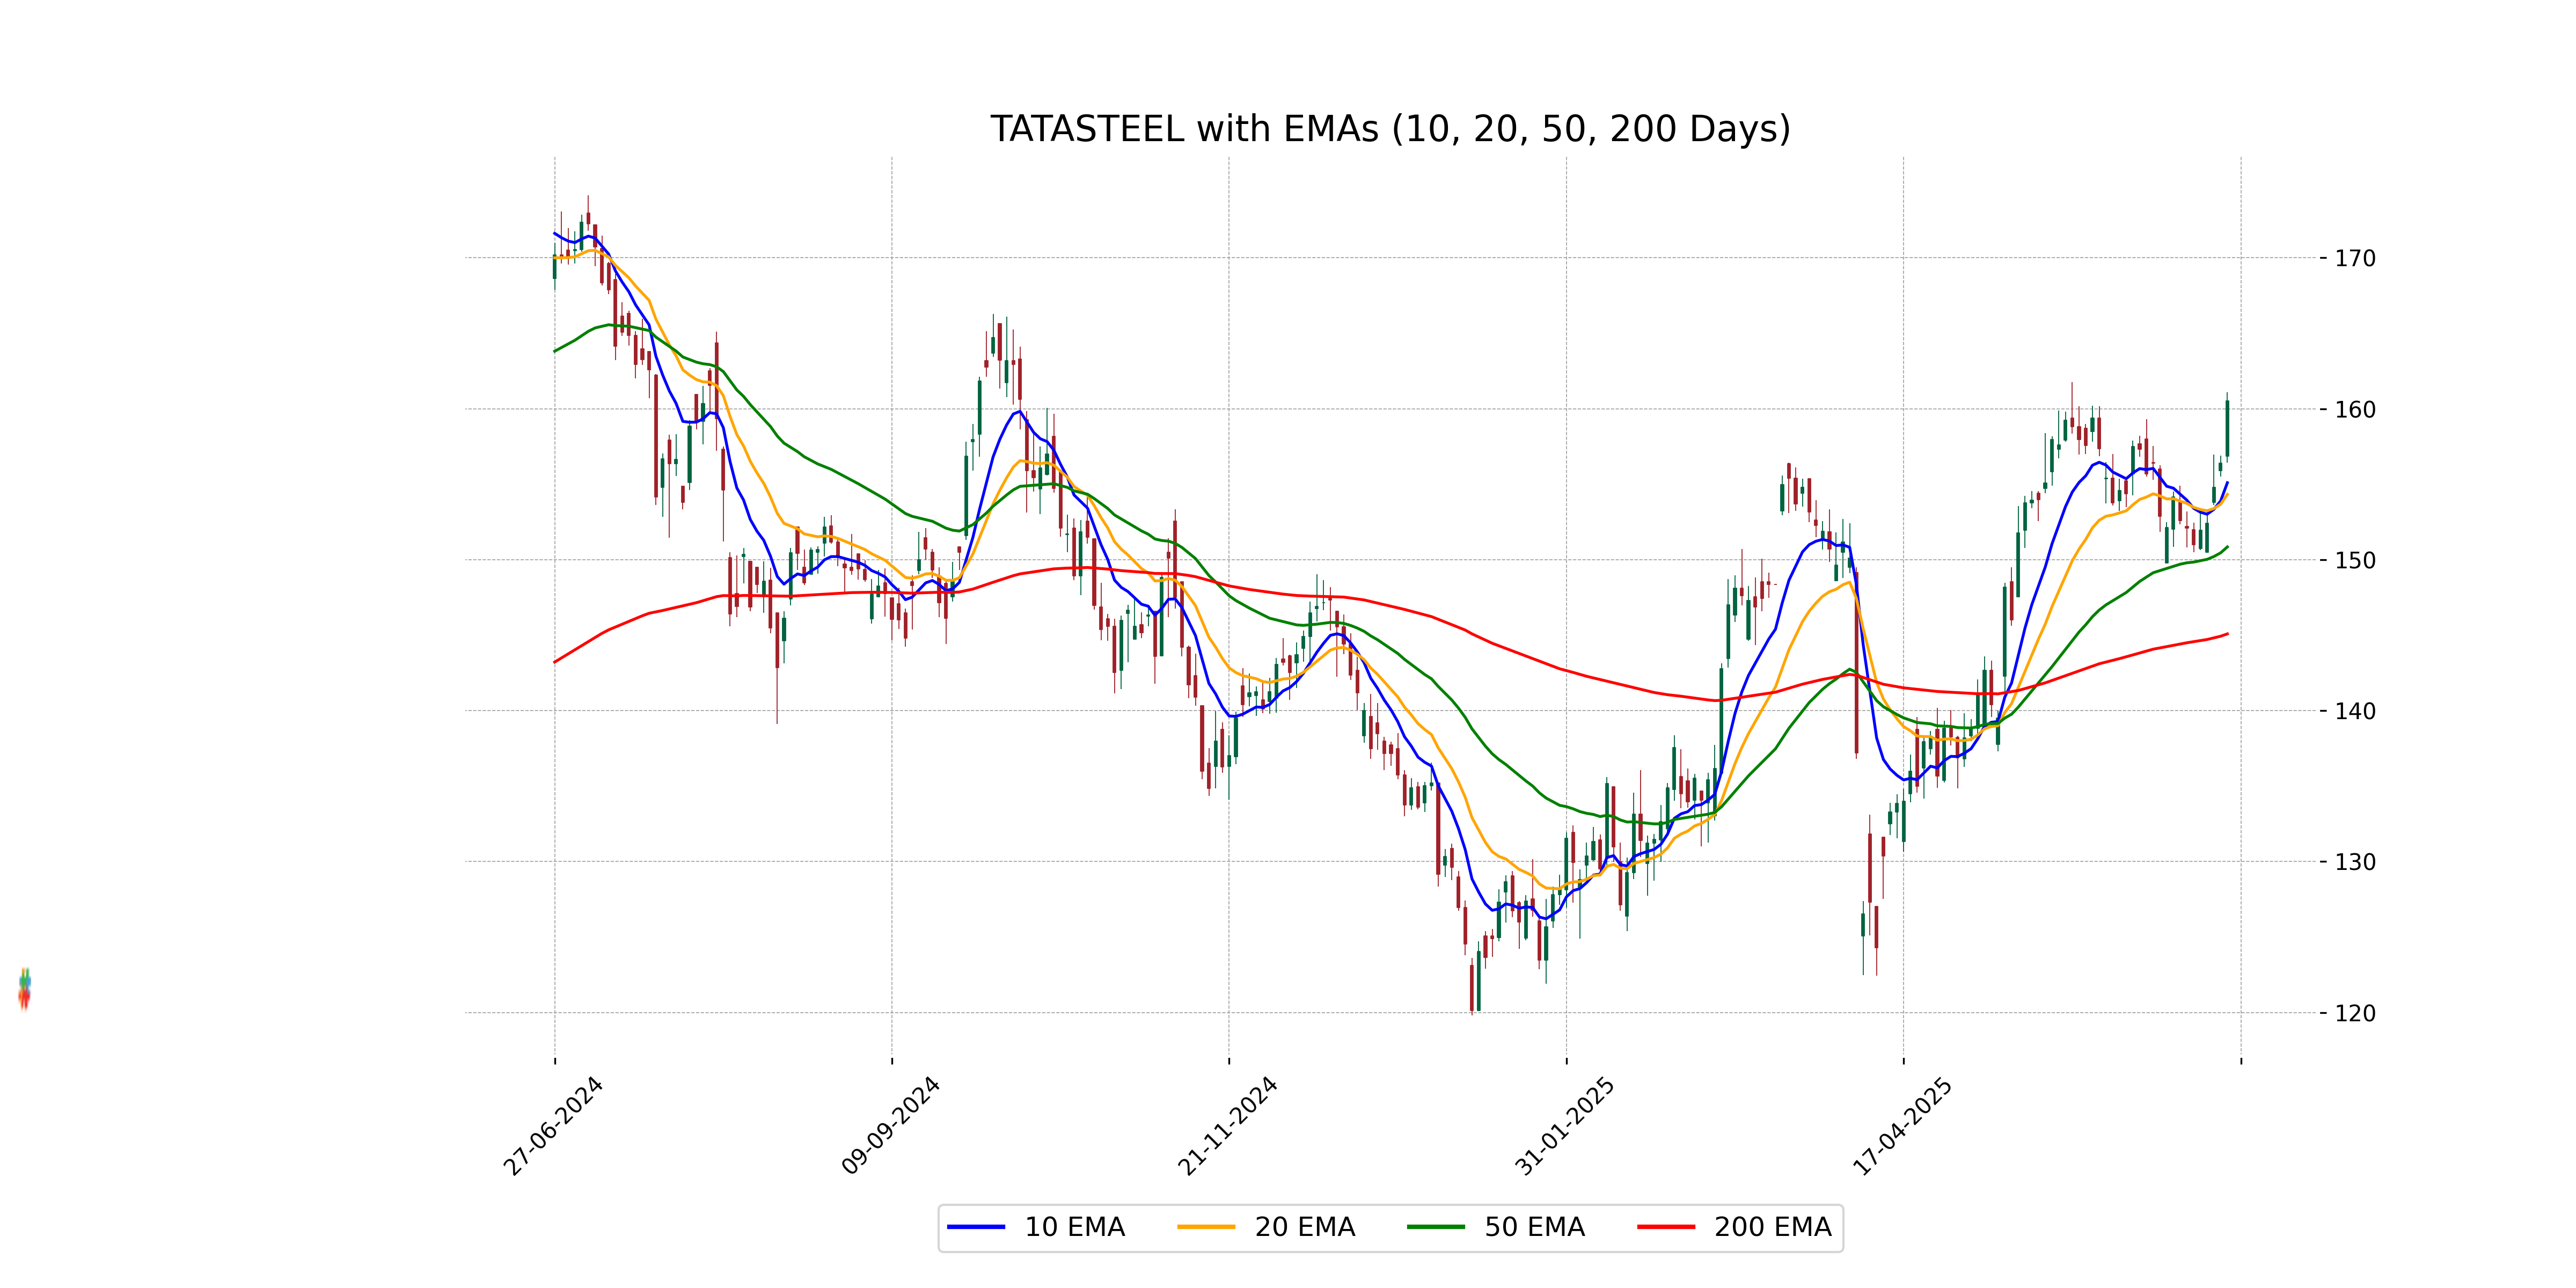
Relationship with Key Moving Averages
Tata Steel's closing price is above its key moving averages, specifically the 50 EMA (150.85) and the 200 EMA (145.09), indicating a bullish trend. The closing price (160.54) also sits above the 10 EMA (155.10) and the 20 EMA (154.33), further reinforcing short-term upward momentum.
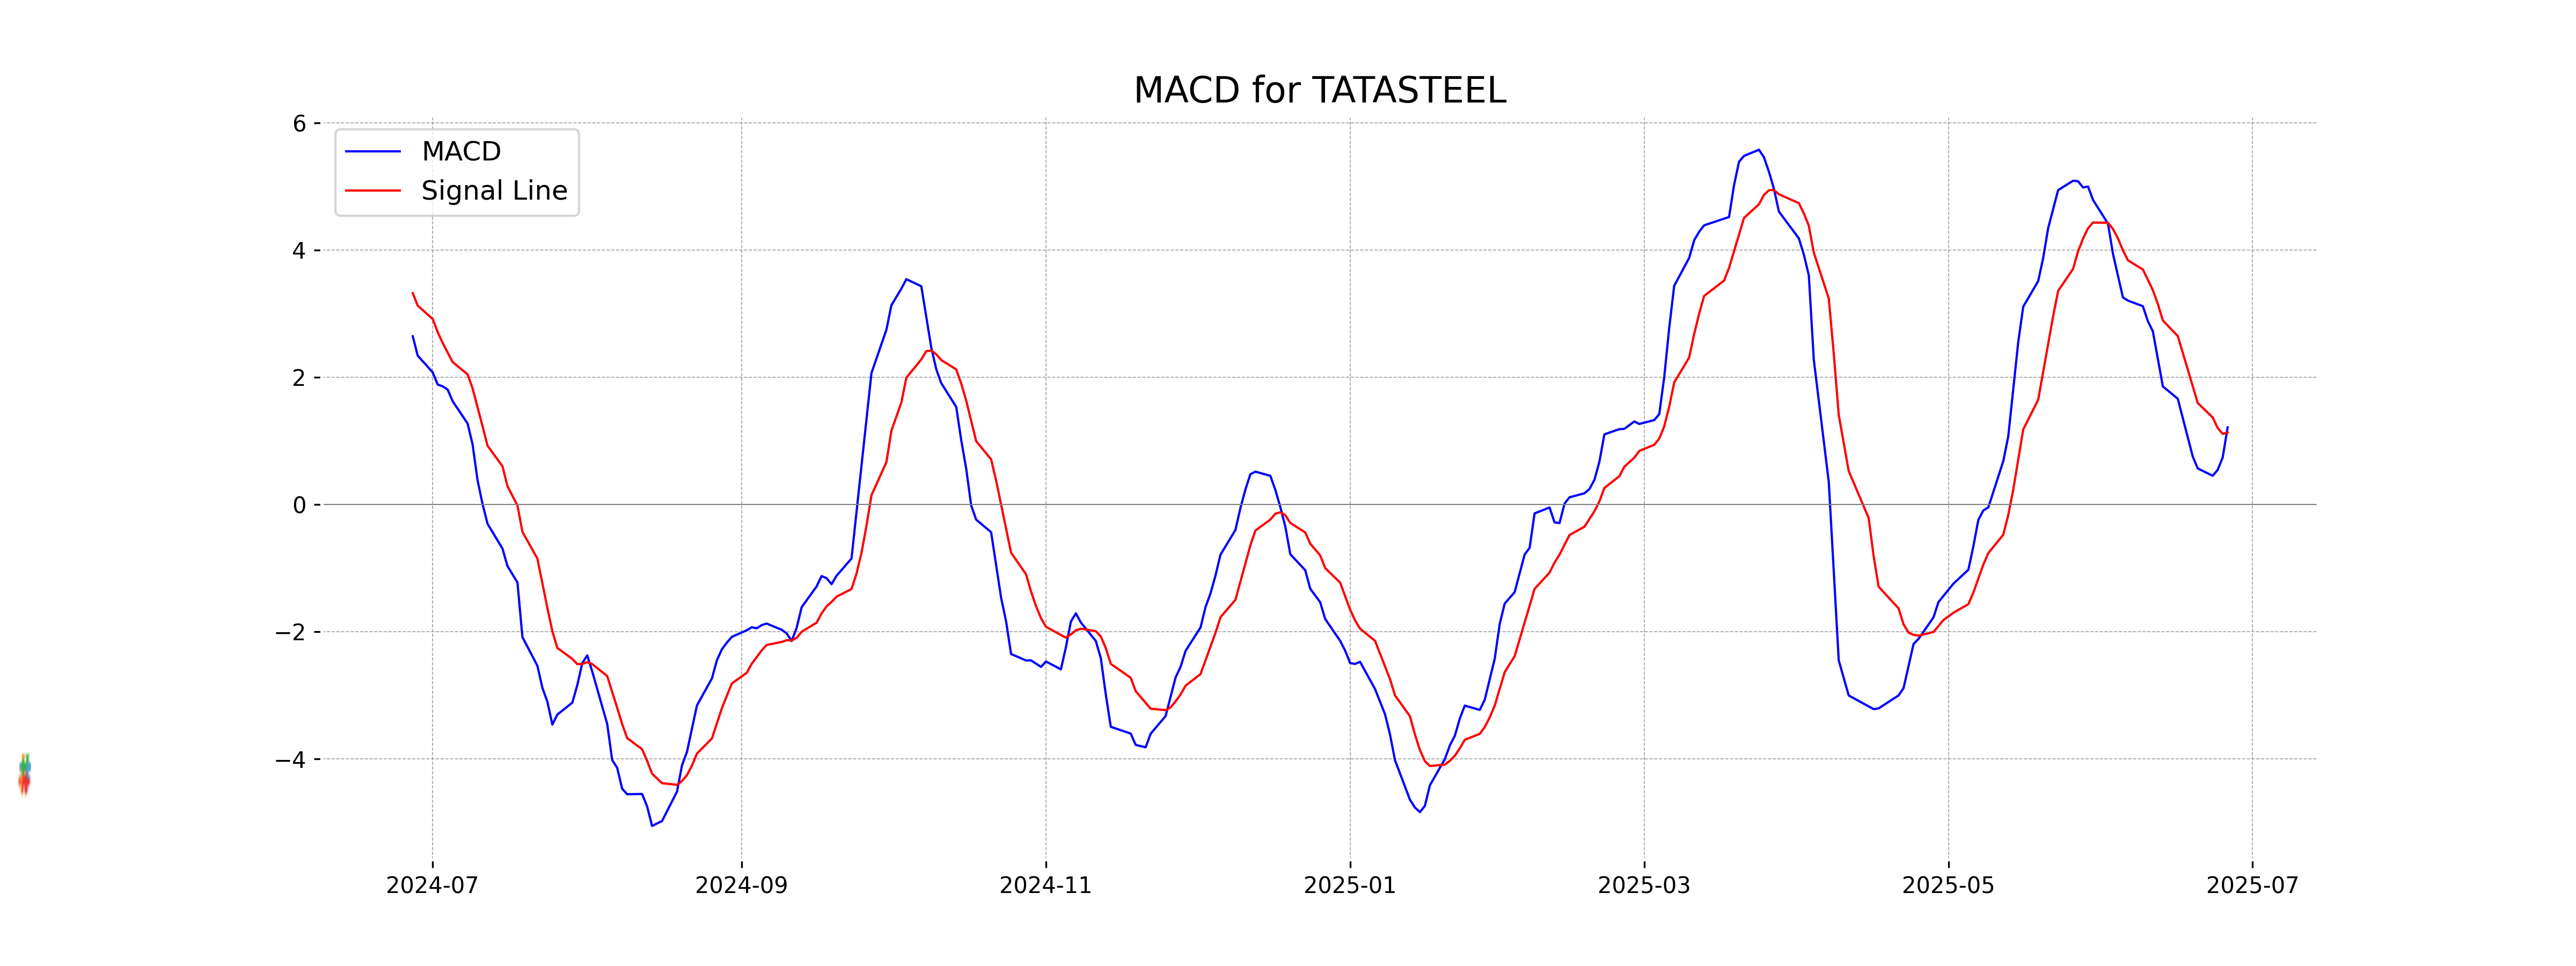
Moving Averages Trend (MACD)
Tata Steel shows a bullish outlook with the MACD value of 1.211 indicating strong upward momentum, as it is above the MACD Signal line at 1.129. This suggests a potential continuation of the current positive trend.
RSI Analysis
Tata Steel's RSI of 65.85 suggests that the stock is approaching overbought territory, indicating potential for a price pullback. However, it is not yet above the critical threshold of 70, which means there may still be some upward momentum.