Top 5 Nifty 50 gainers today – August 28, 2025: Biggest stock moves
In this article, we will explore the technical indicators of some of the high-performing stocks on the Indian stock market, including ASIANPAINT, COALINDIA, HEROMOTOCO, LT, and TITAN.
By looking at these stocks through the lens of key technical factors, we aim to better understand their price movements, trends, and potential future performance.

Analysis for Asian Paints - August 28, 2025

Asian Paints traded with an opening price of 2465.0 and closed at 2489.0, showing a slight percentage change of 0.31%. The stock experienced a high of 2528.0 and a low of 2465.0. It is positioned above its 50 EMA and 200 EMA values, suggesting a potential upward trend, but below the 10 EMA, indicating mixed signals. With an RSI of 52.64, the stock is in a neutral position. The company, part of the Basic Materials sector and Specialty Chemicals industry, has a market cap of 2391682580480 and a PE ratio of 66.43.
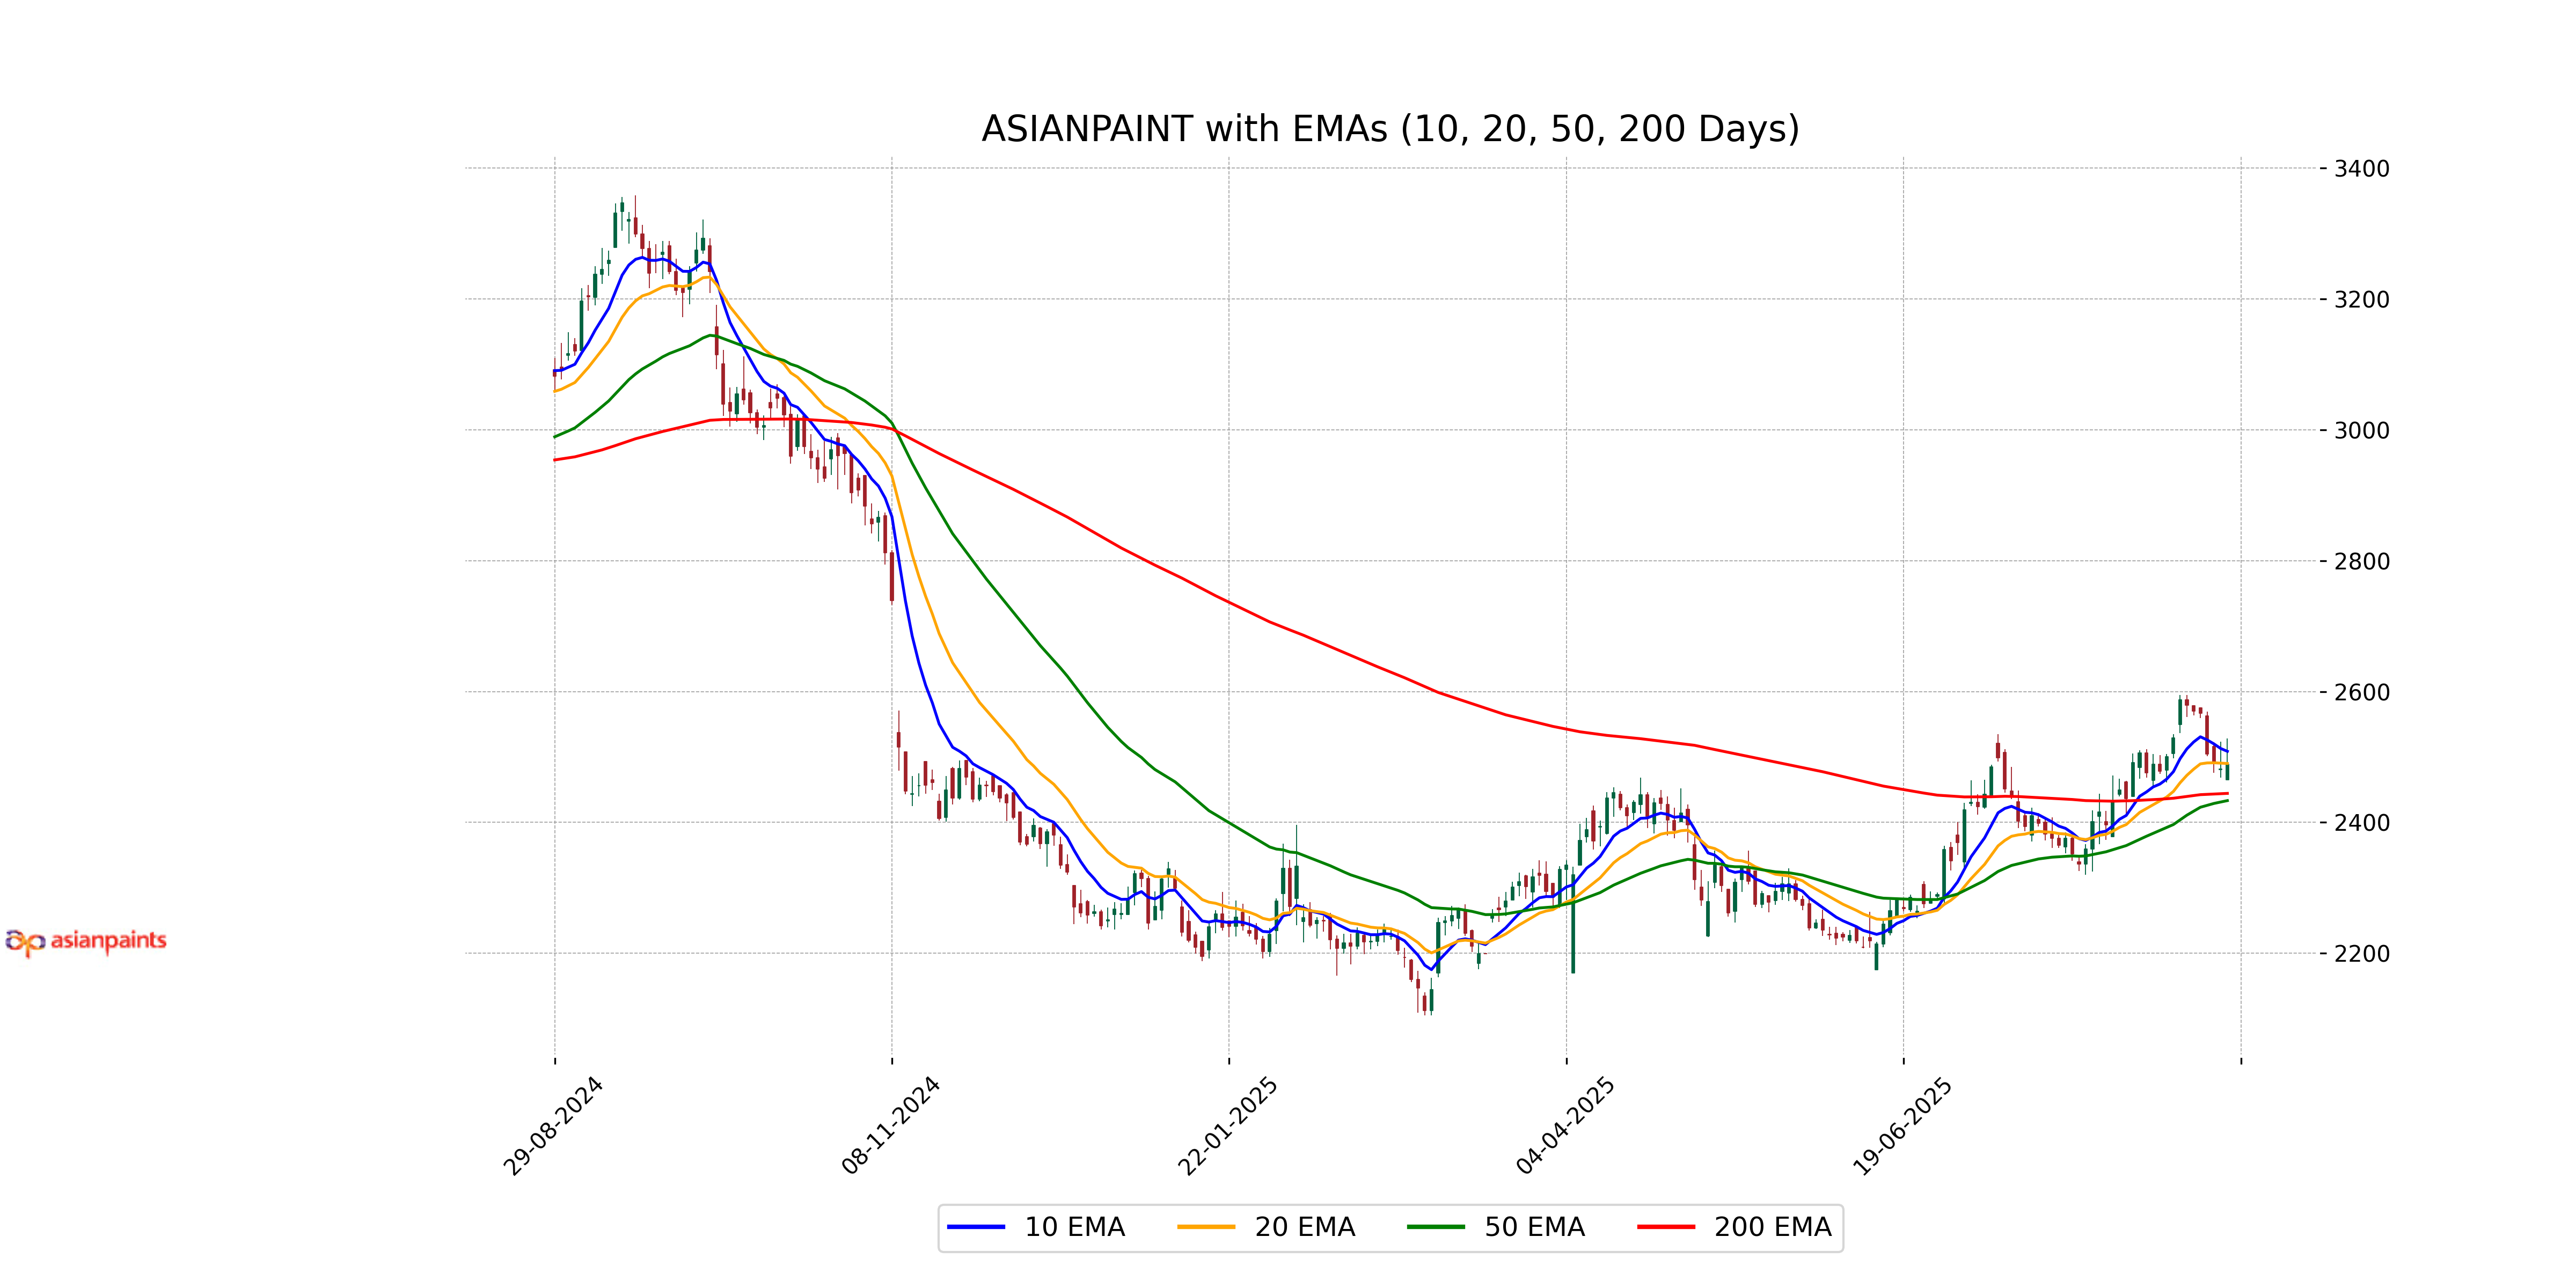
Relationship with Key Moving Averages
Asian Paints' current close price of 2489.0 is above its 50 EMA of 2433.28 and its 200 EMA of 2444.32, indicating a bullish trend over the medium to long term. However, it is below the 10 EMA of 2508.64 and close to the 20 EMA of 2490.05, suggesting short-term resistance.
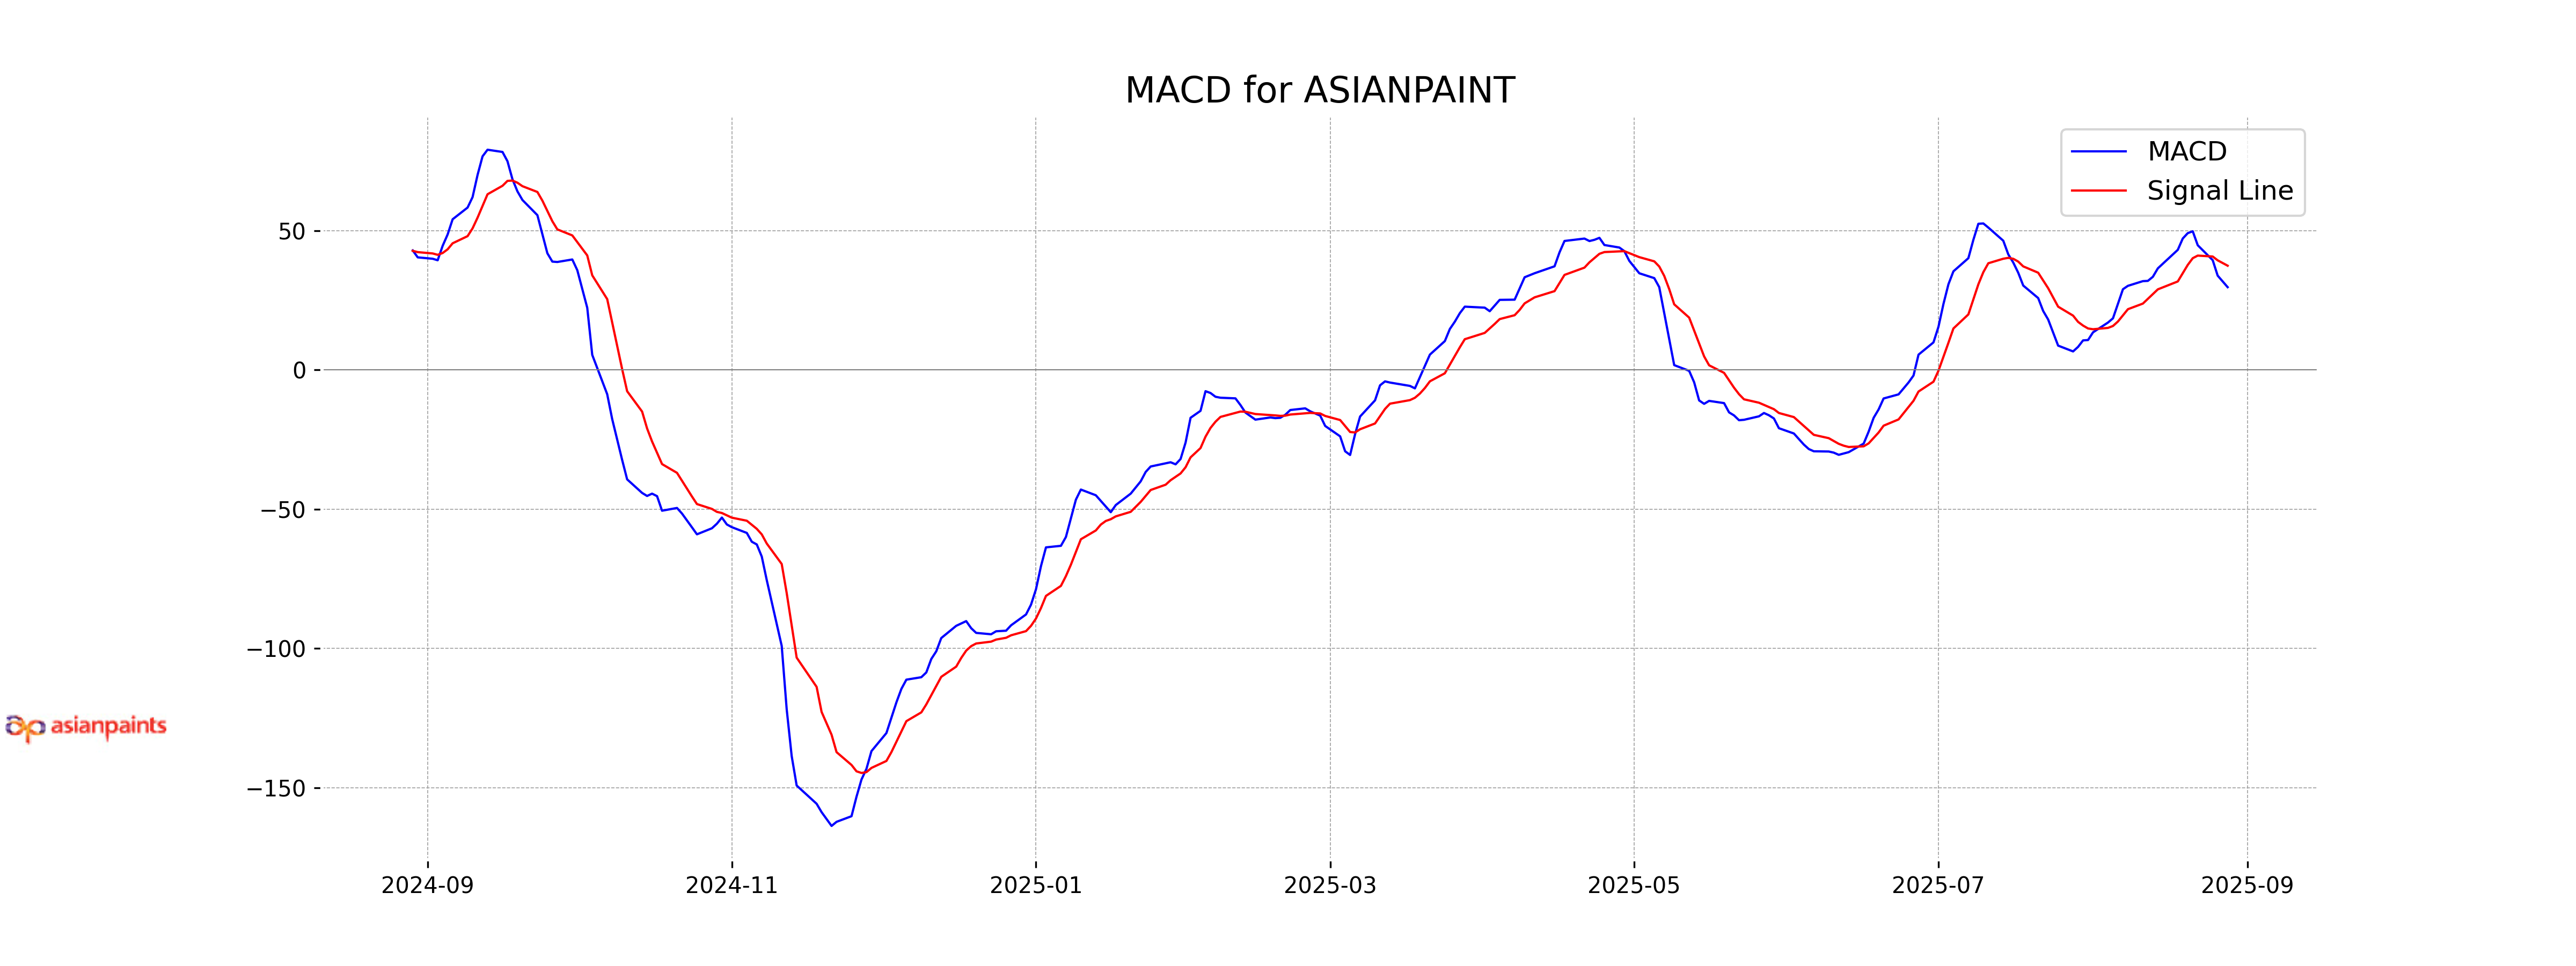
Moving Averages Trend (MACD)
For Asian Paints, the MACD value of 29.68 is below the MACD Signal of 37.39, indicating a potential bearish trend. This suggests that the stock's upward momentum might be weakening, and traders may want to watch for further signals or confirmation before making decisions.
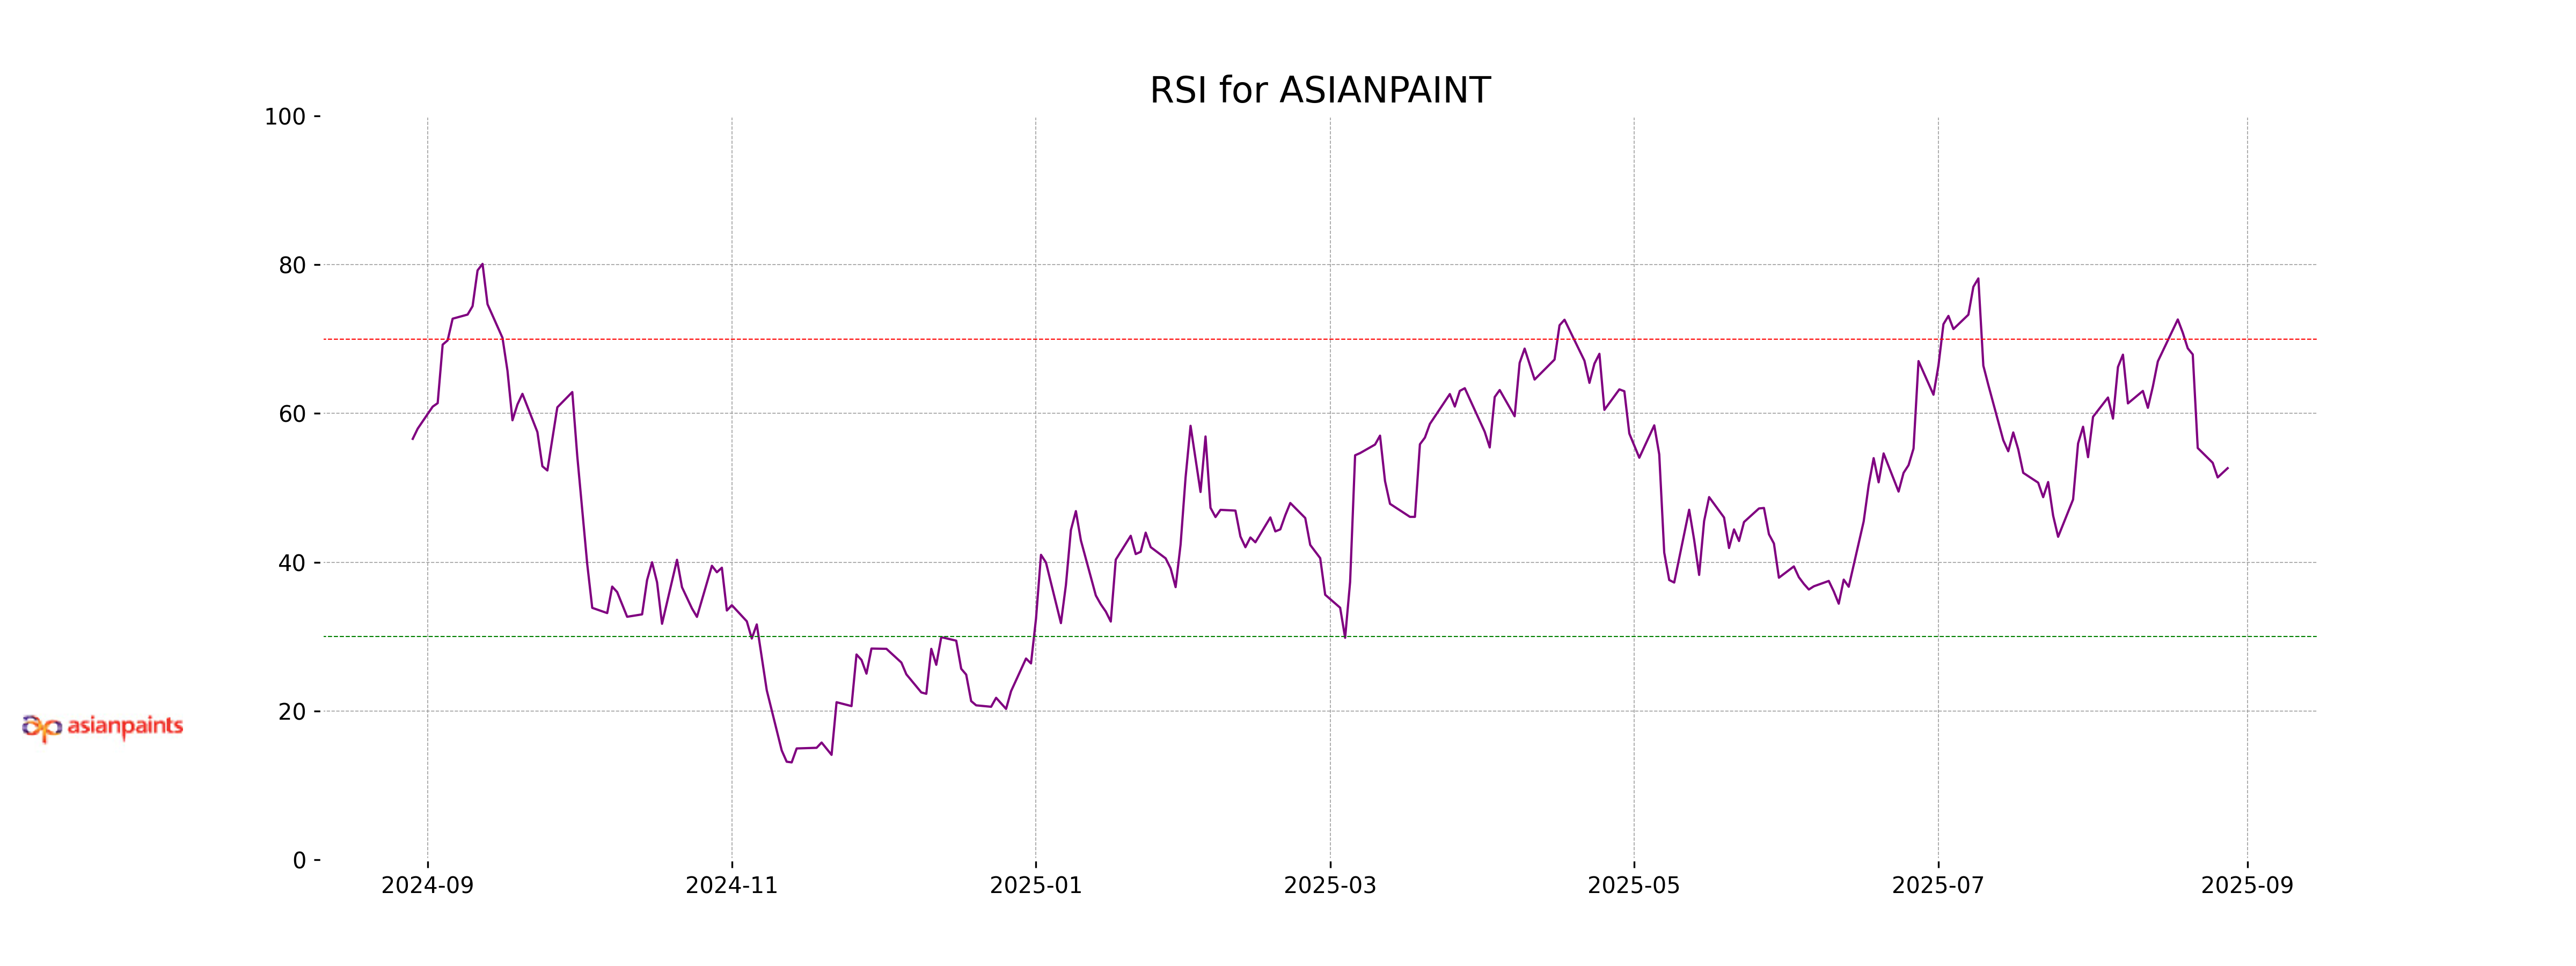
RSI Analysis
The Relative Strength Index (RSI) for Asian Paints is 52.64, indicating a neutral position in terms of momentum. With the RSI being close to the midpoint of 50, the stock is neither in oversold nor overbought territory, suggesting a balanced market condition.
Analysis for Coal India - August 28, 2025

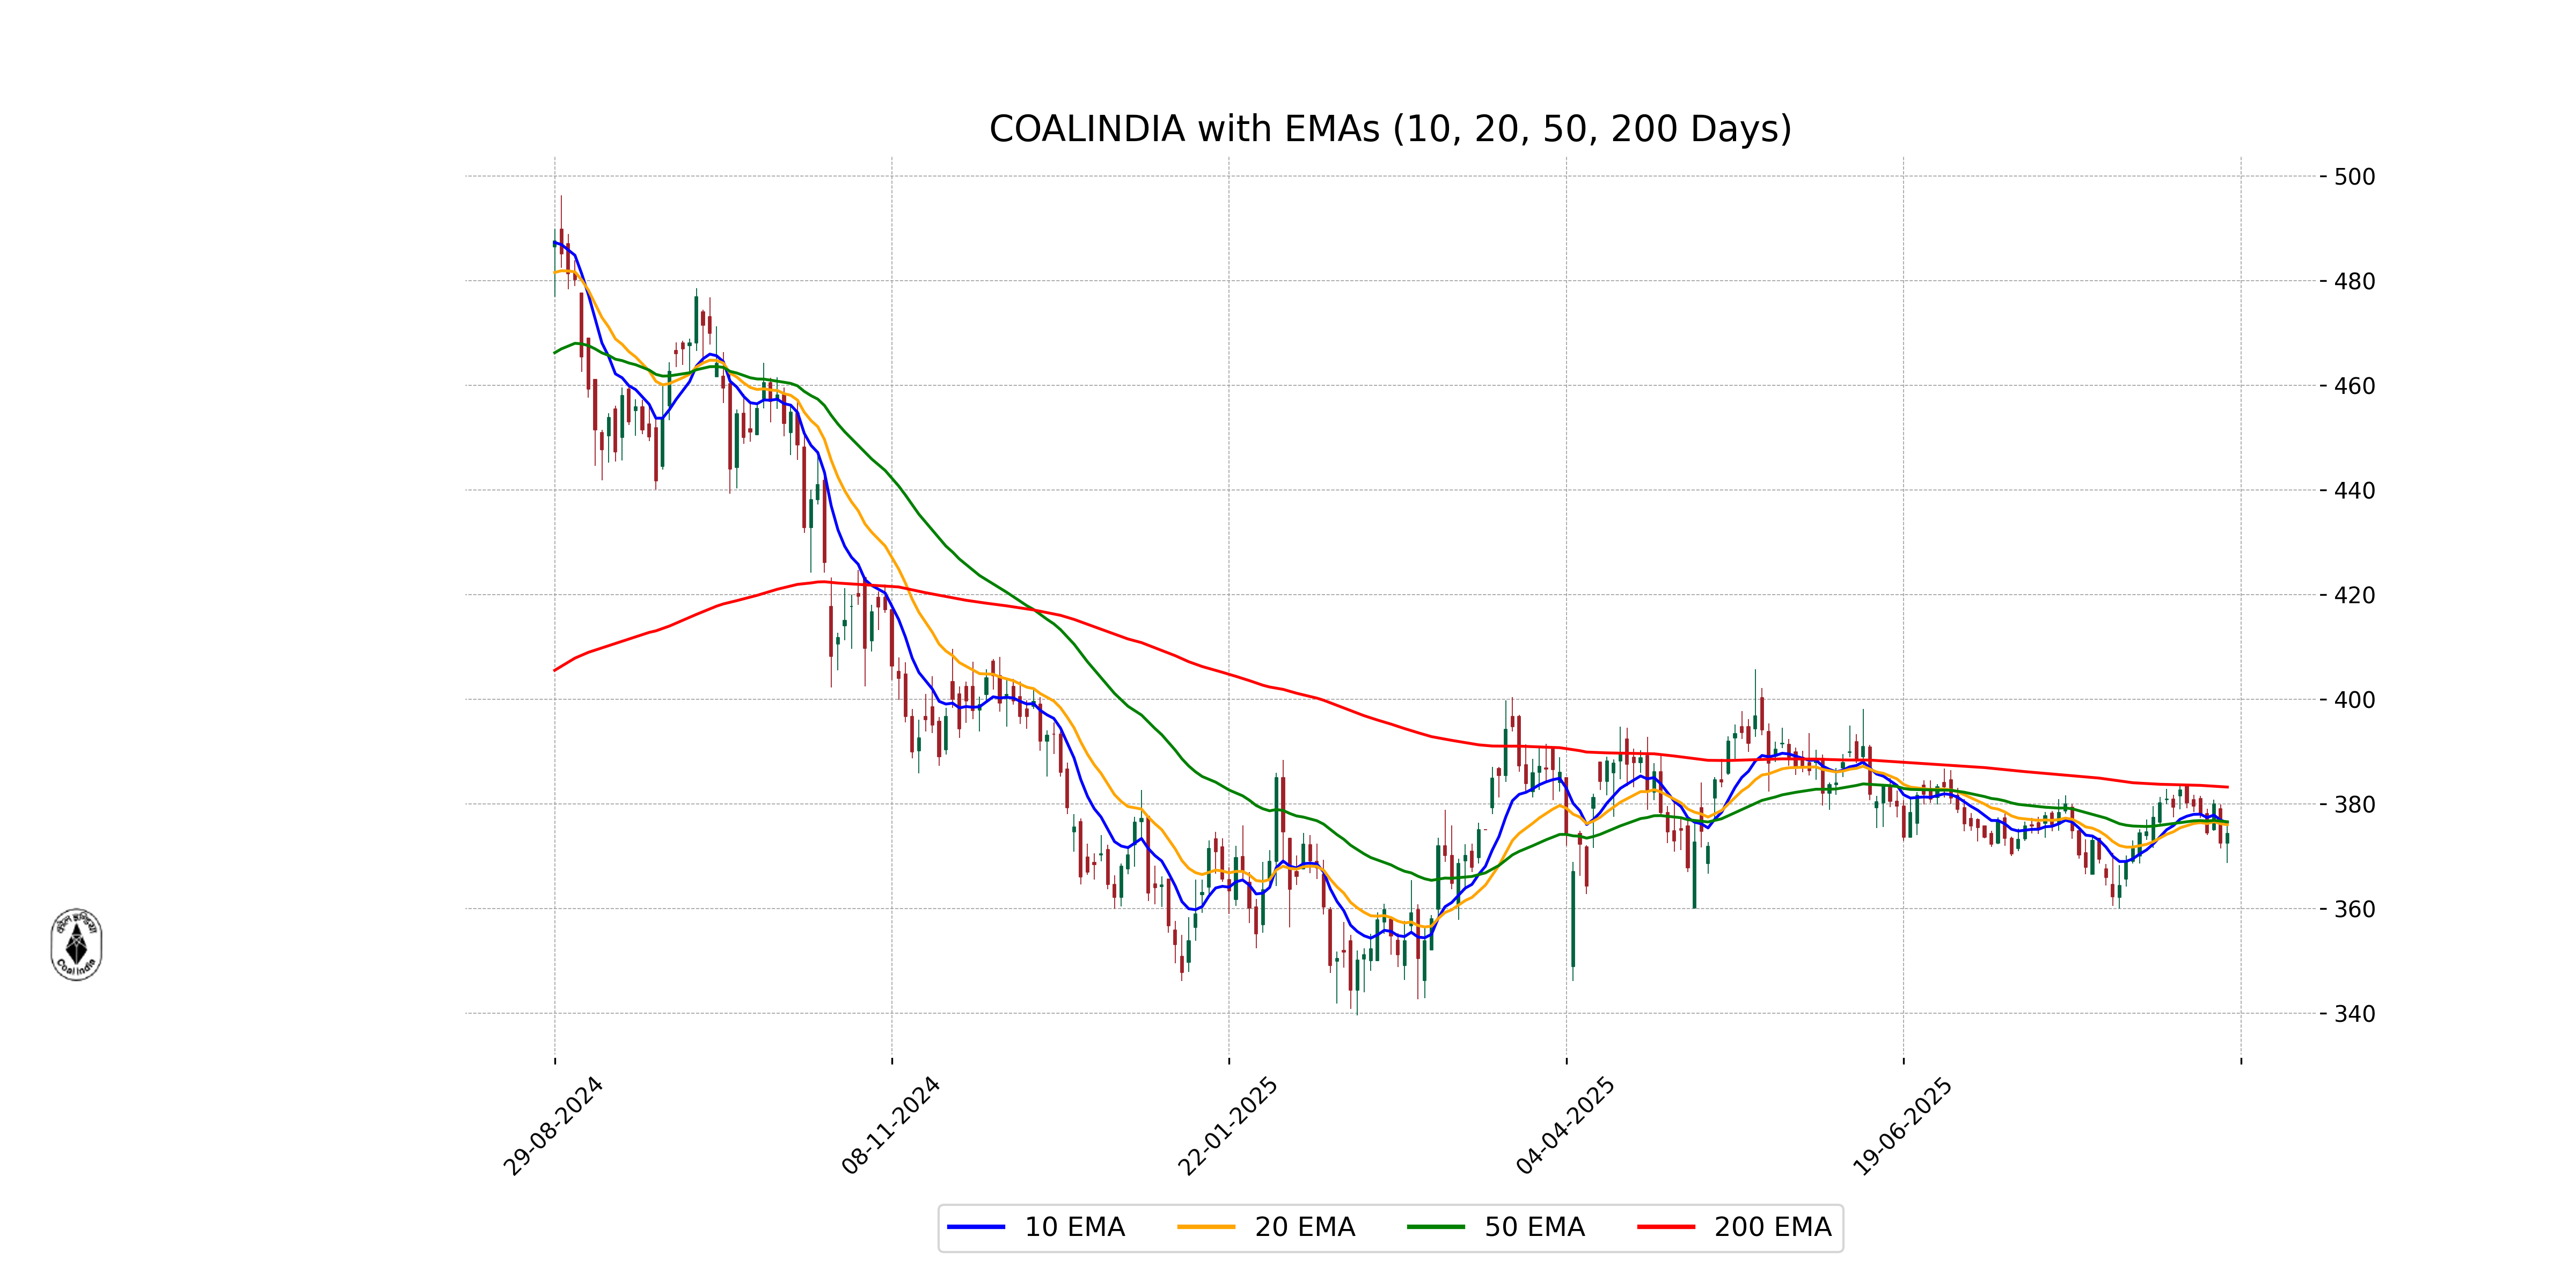
Coal India Performance Summary: Coal India opened at 372.50 and closed at 374.30, reflecting a slight positive percentage change of 0.50% from its previous close. The stock traded between a low of 368.65 and a high of 375.90 with a volume of over 4.25 million shares. While the stock remains below its 50 EMA of 376.56 and 200 EMA of 383.19, the RSI of 47.87 suggests a neutral momentum. Coal India has a substantial market capitalization of over 2.3 trillion INR, with a low PE Ratio of 6.96, indicating potentially attractive valuation given its EPS of 53.78. (Sector: Energy, Industry: Thermal Coal, Country: India)
Relationship with Key Moving Averages
Coal India's current closing price of 374.30 is below its 50-day EMA of 376.56, 10-day EMA of 376.39, and 20-day EMA of 375.99, indicating a possible bearish trend. Additionally, it remains below the 200-day EMA of 383.19, suggesting a longer-term bearish sentiment.
Moving Averages Trend (MACD)
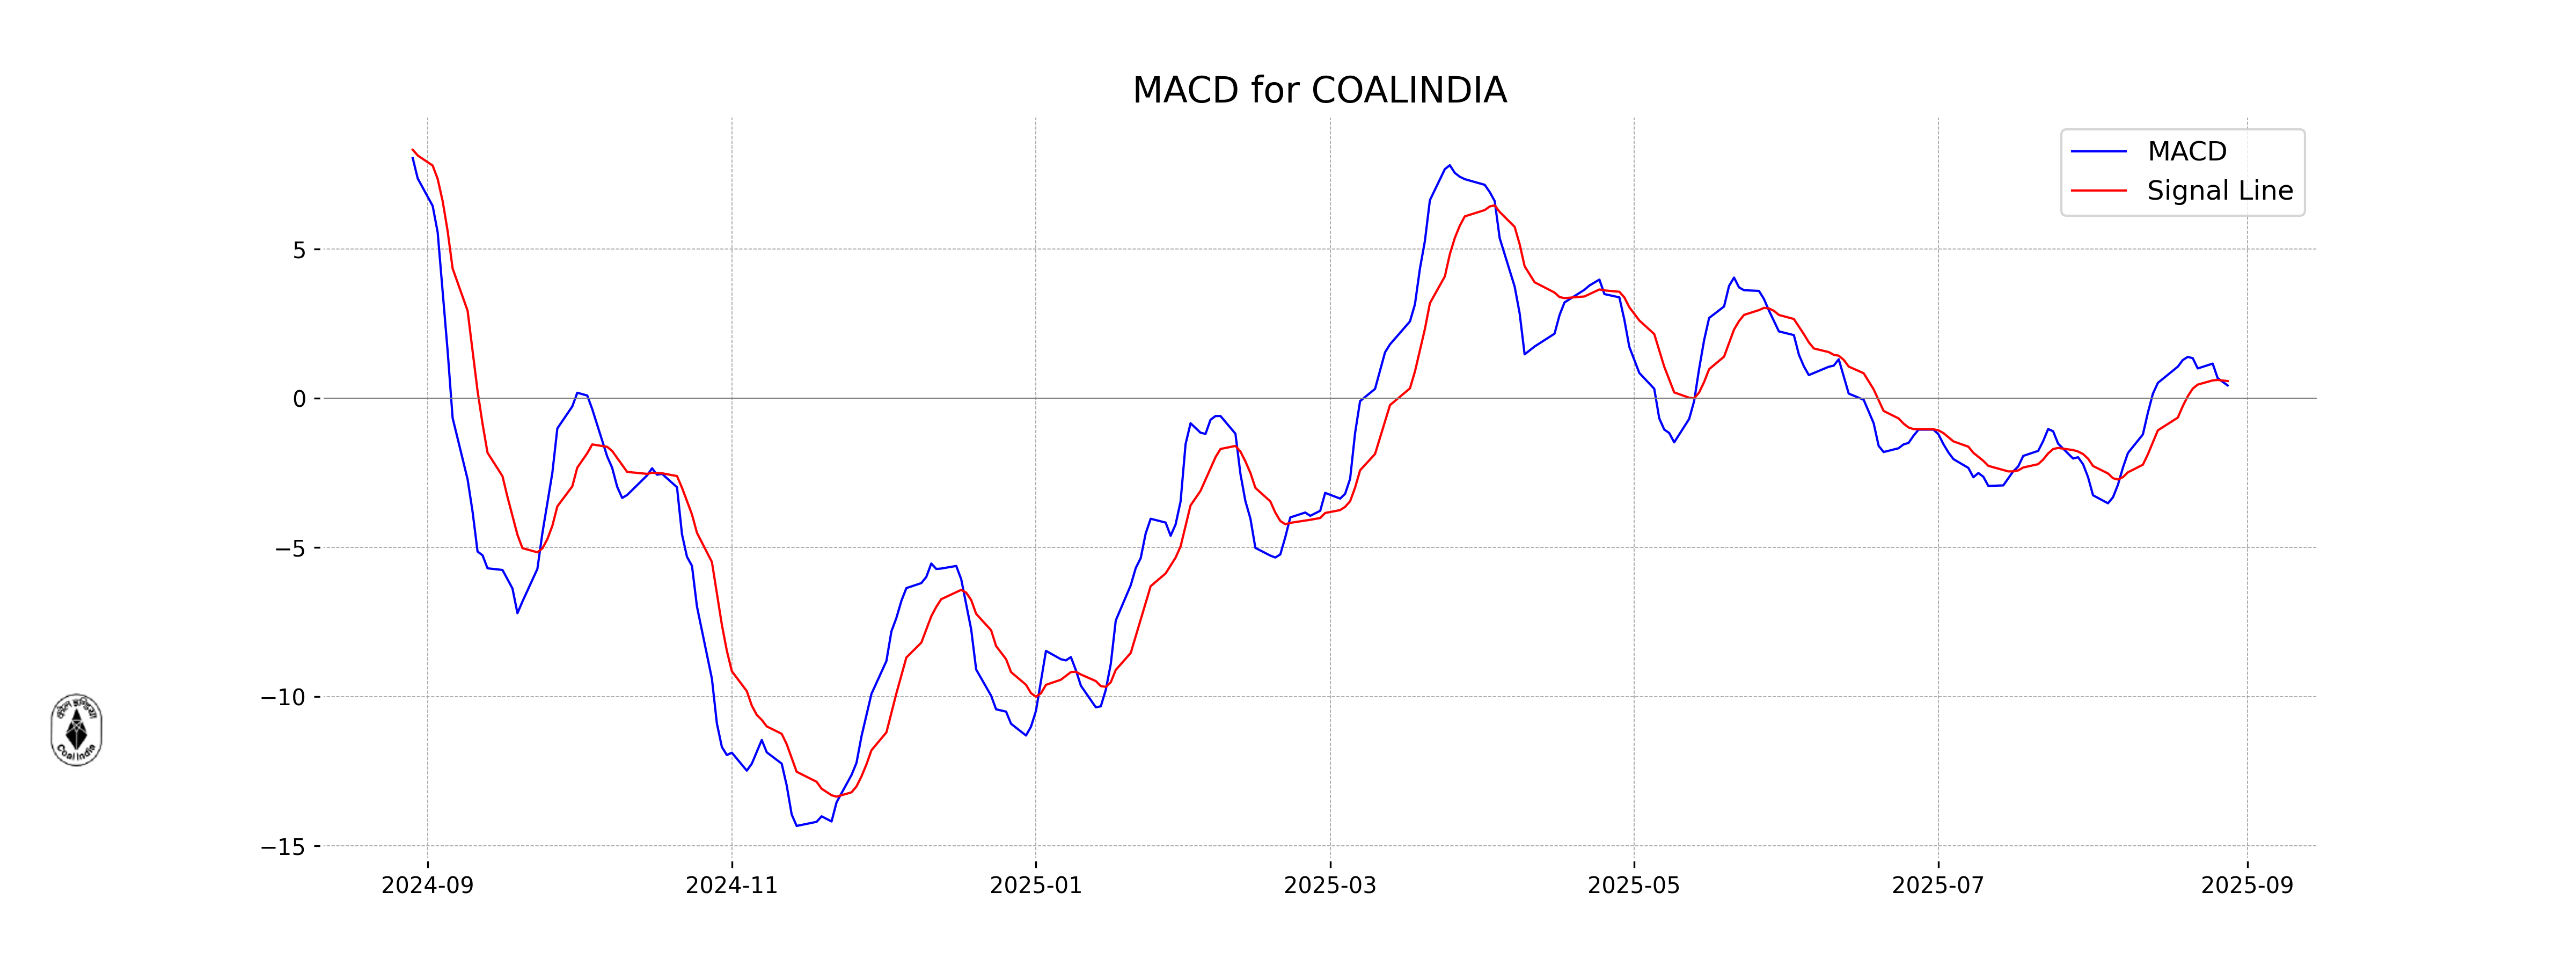
MACD Analysis for Coal India: The MACD for Coal India is currently at 0.43, which is below the MACD Signal line at 0.58. This indicates a potential bearish trend, suggesting that momentum could be slowing down. Monitoring for a crossover above the signal line may suggest a reversal in the trend.
RSI Analysis
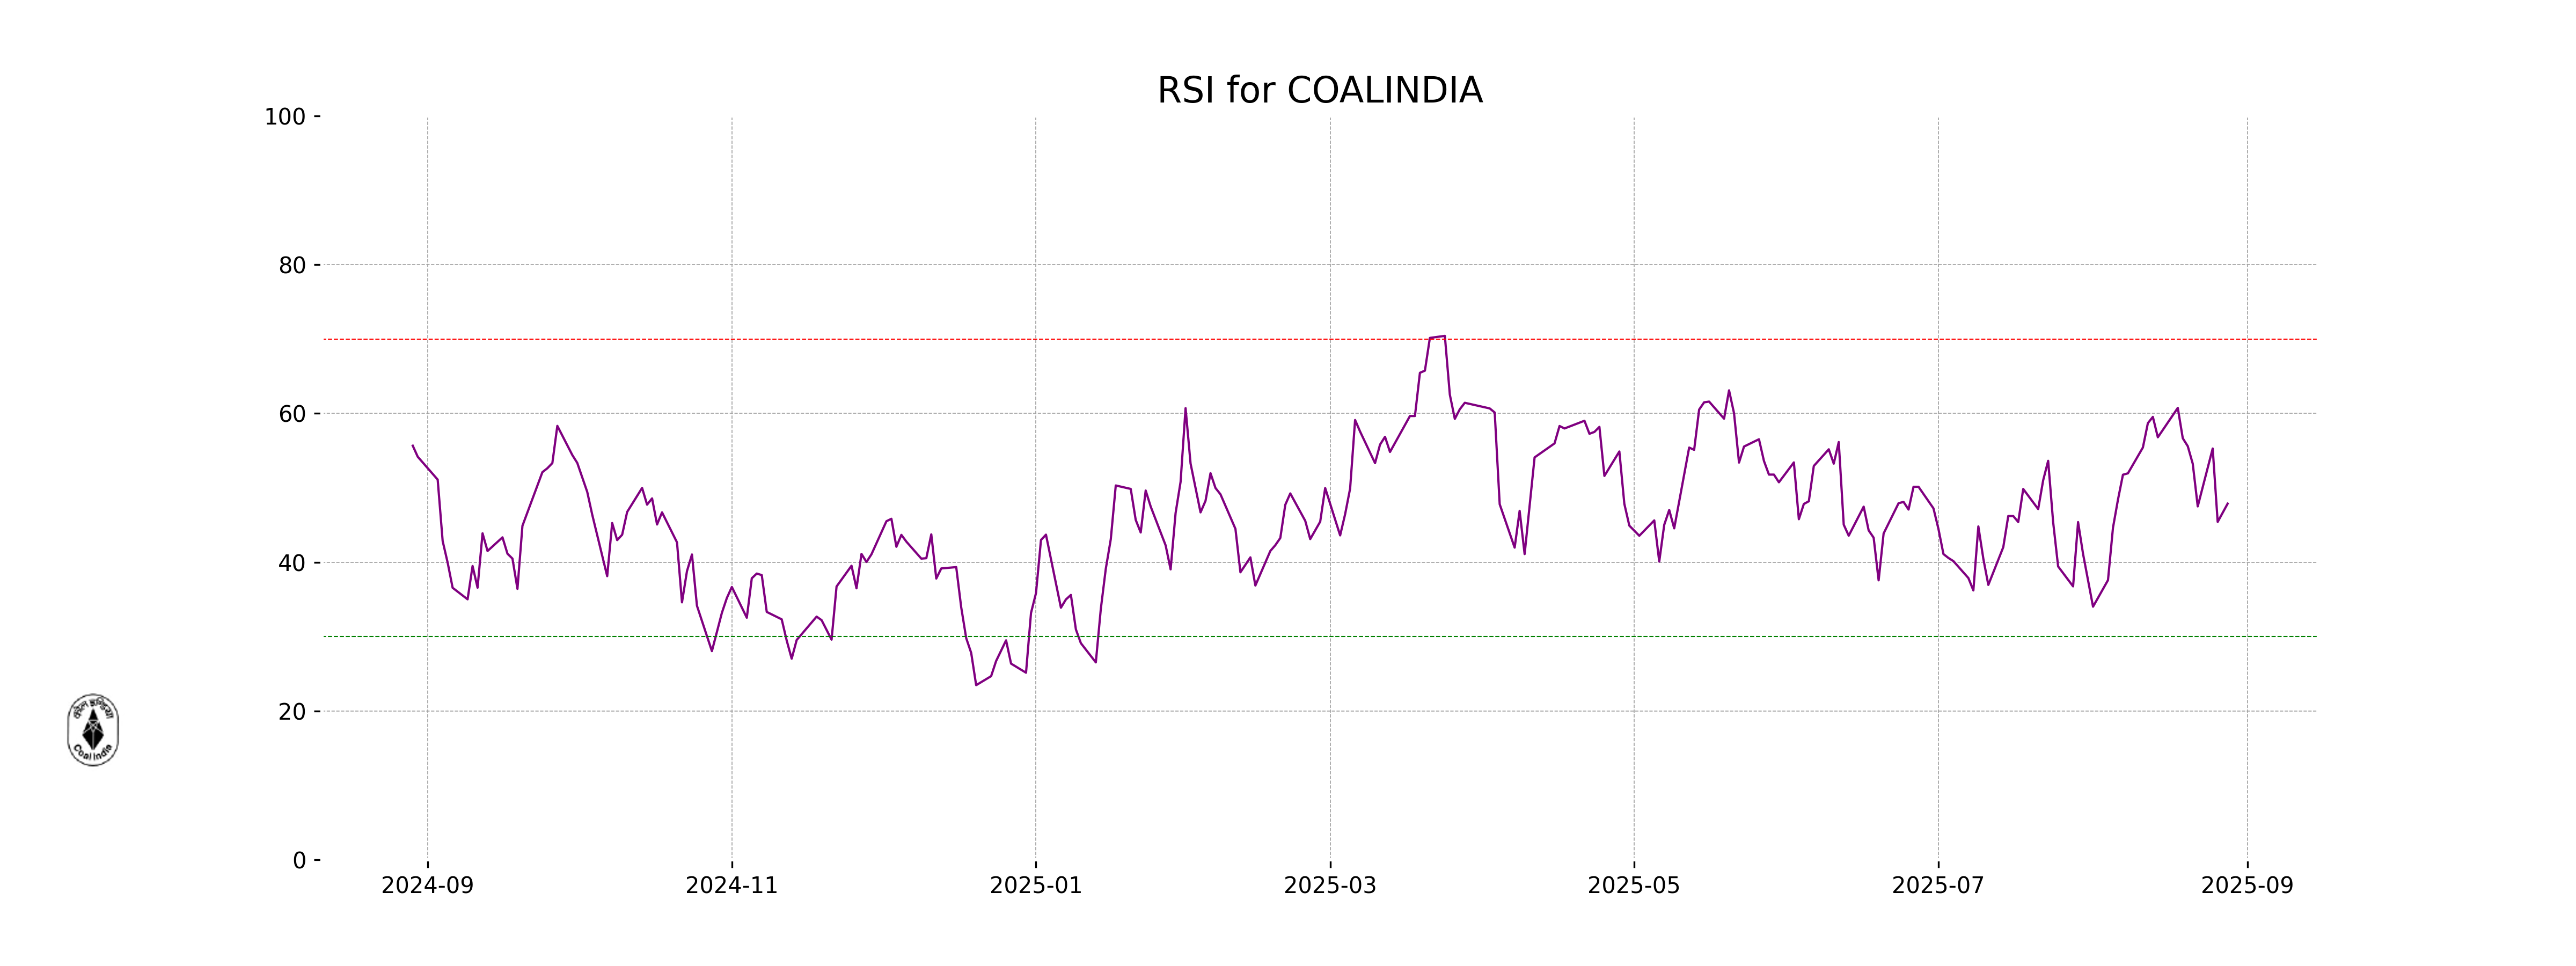
Coal India has an RSI of 47.87, indicating that it is currently in the neutral zone. This suggests that the stock is neither overbought nor oversold, providing no clear buy or sell signals from RSI alone.
Analysis for Hero MotoCorp - August 28, 2025

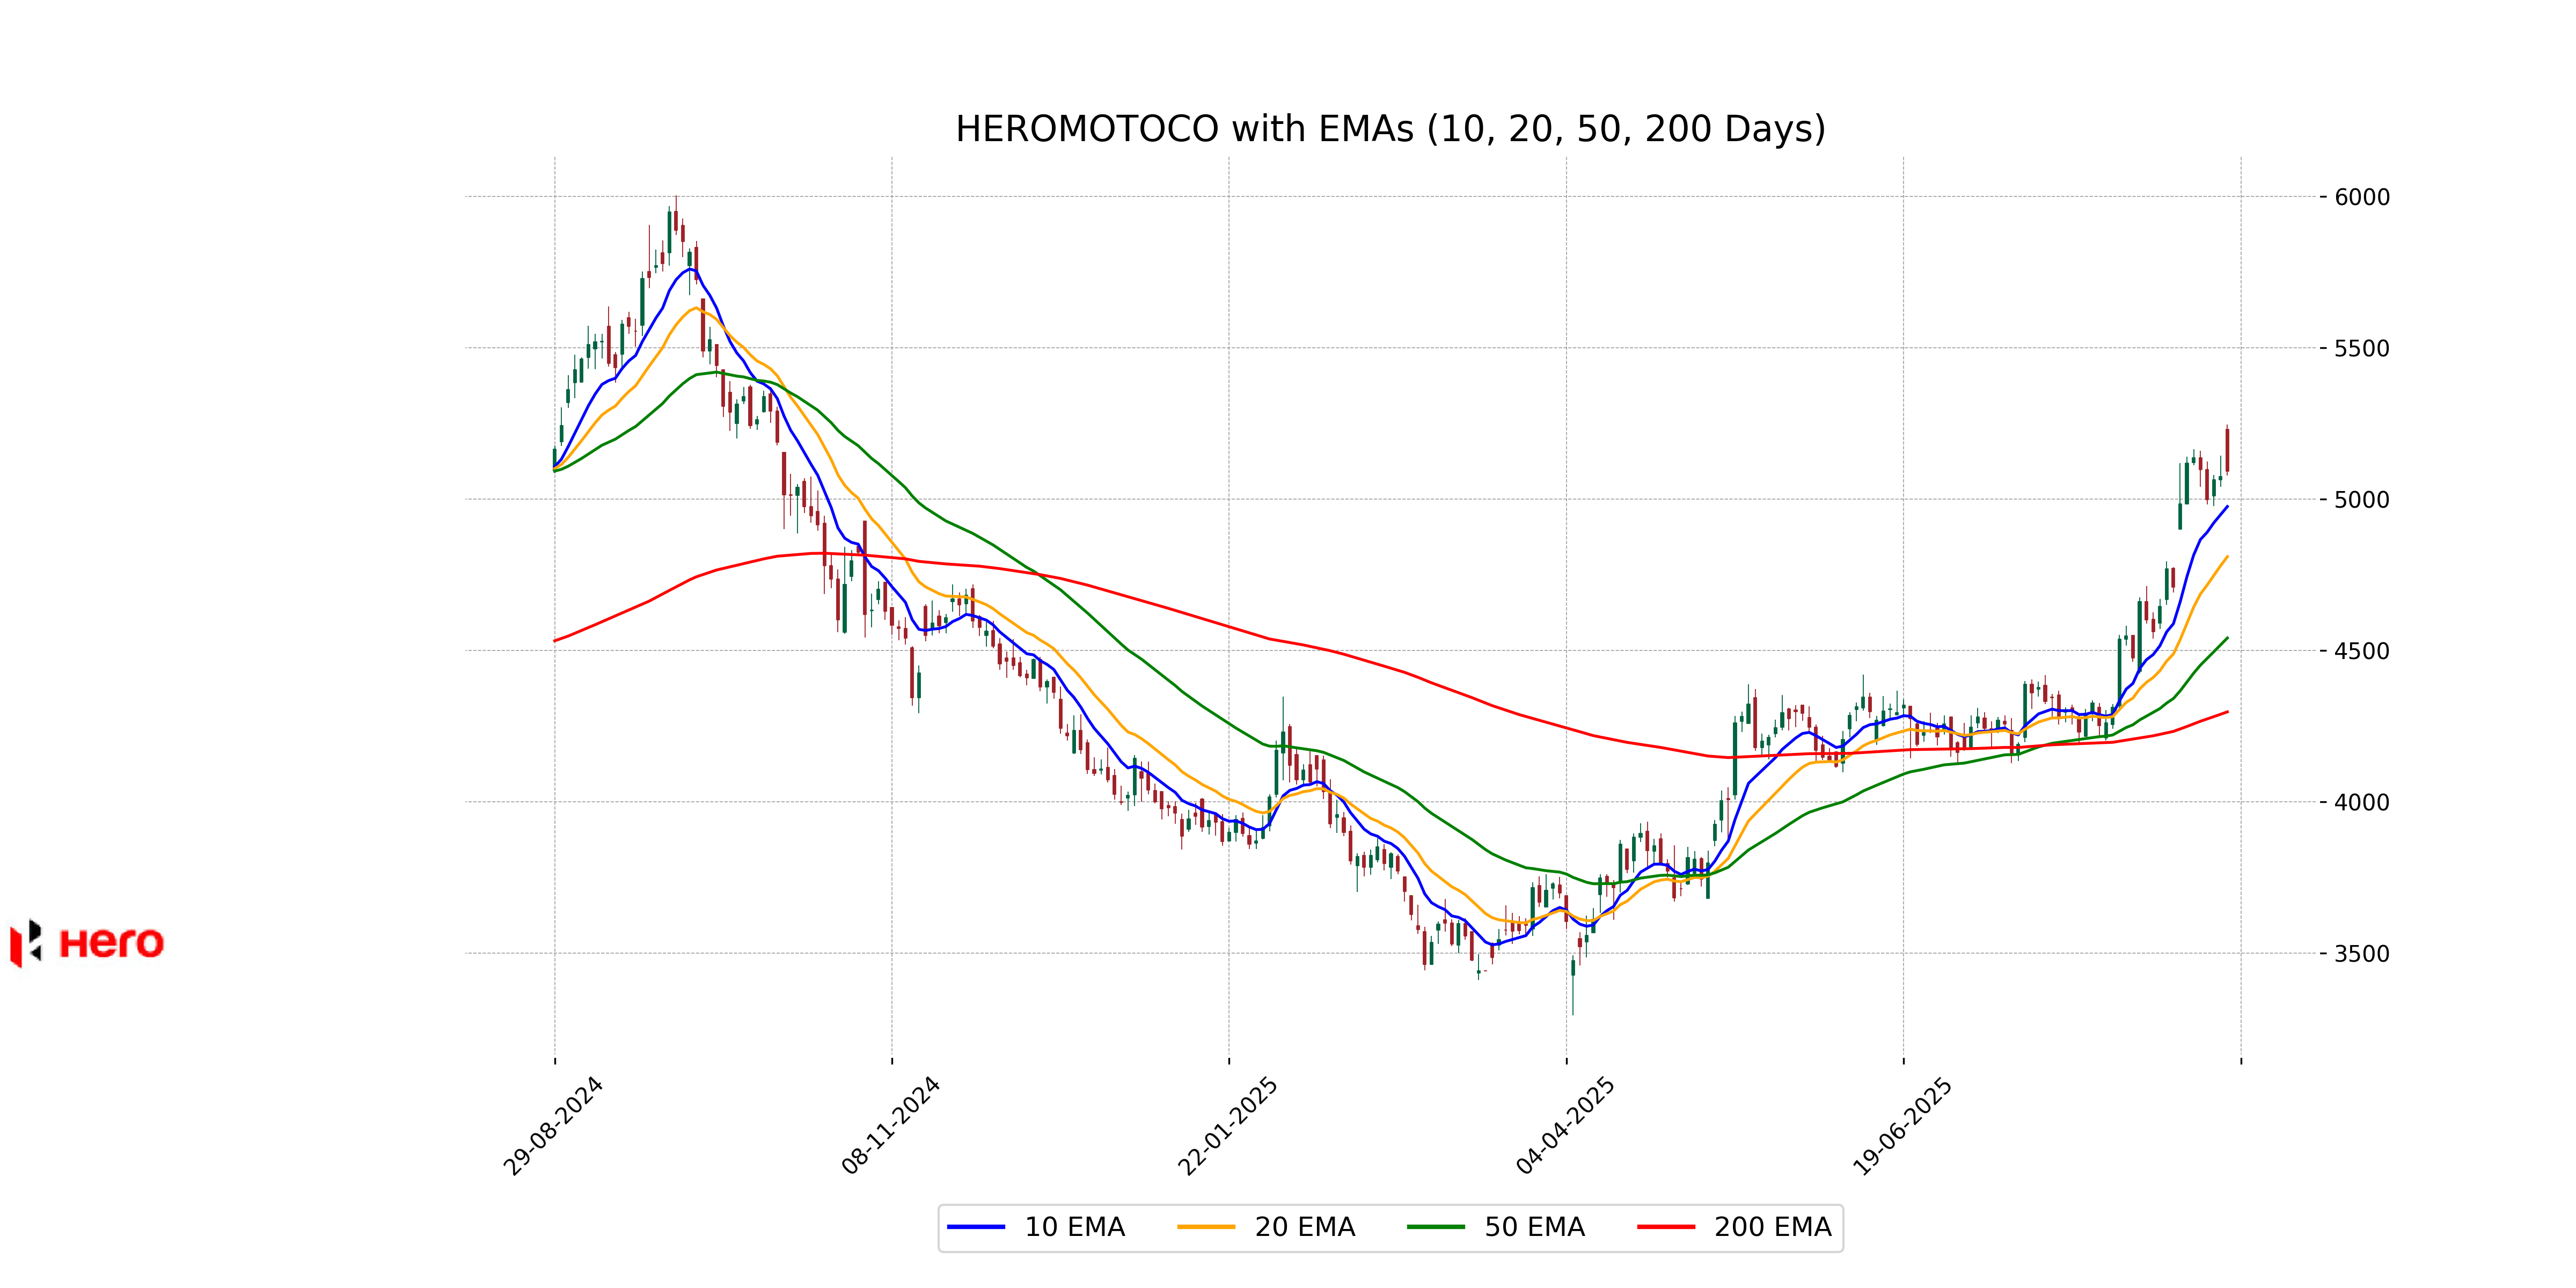
Hero MotoCorp recorded a modest percentage change of 0.36% with the stock closing at 5091.70, slightly above the previous close of 5073.40. With a high RSI of 70.29, it suggests the stock is potentially overbought. The company, operating in the Consumer Cyclical sector within the Auto Manufacturers industry in India, maintains a strong market cap of 1,018,686,275,584 with a PE ratio of 20.23.
Relationship with Key Moving Averages
Hero MotoCorp's current close of 5091.70 is above the 10 EMA of 4975.05, indicating a short-term uptrend. Additionally, it is significantly higher than both the 50 EMA of 4540.53 and the 200 EMA of 4296.52, suggesting overall bullish momentum in the medium to long-term timeframe.
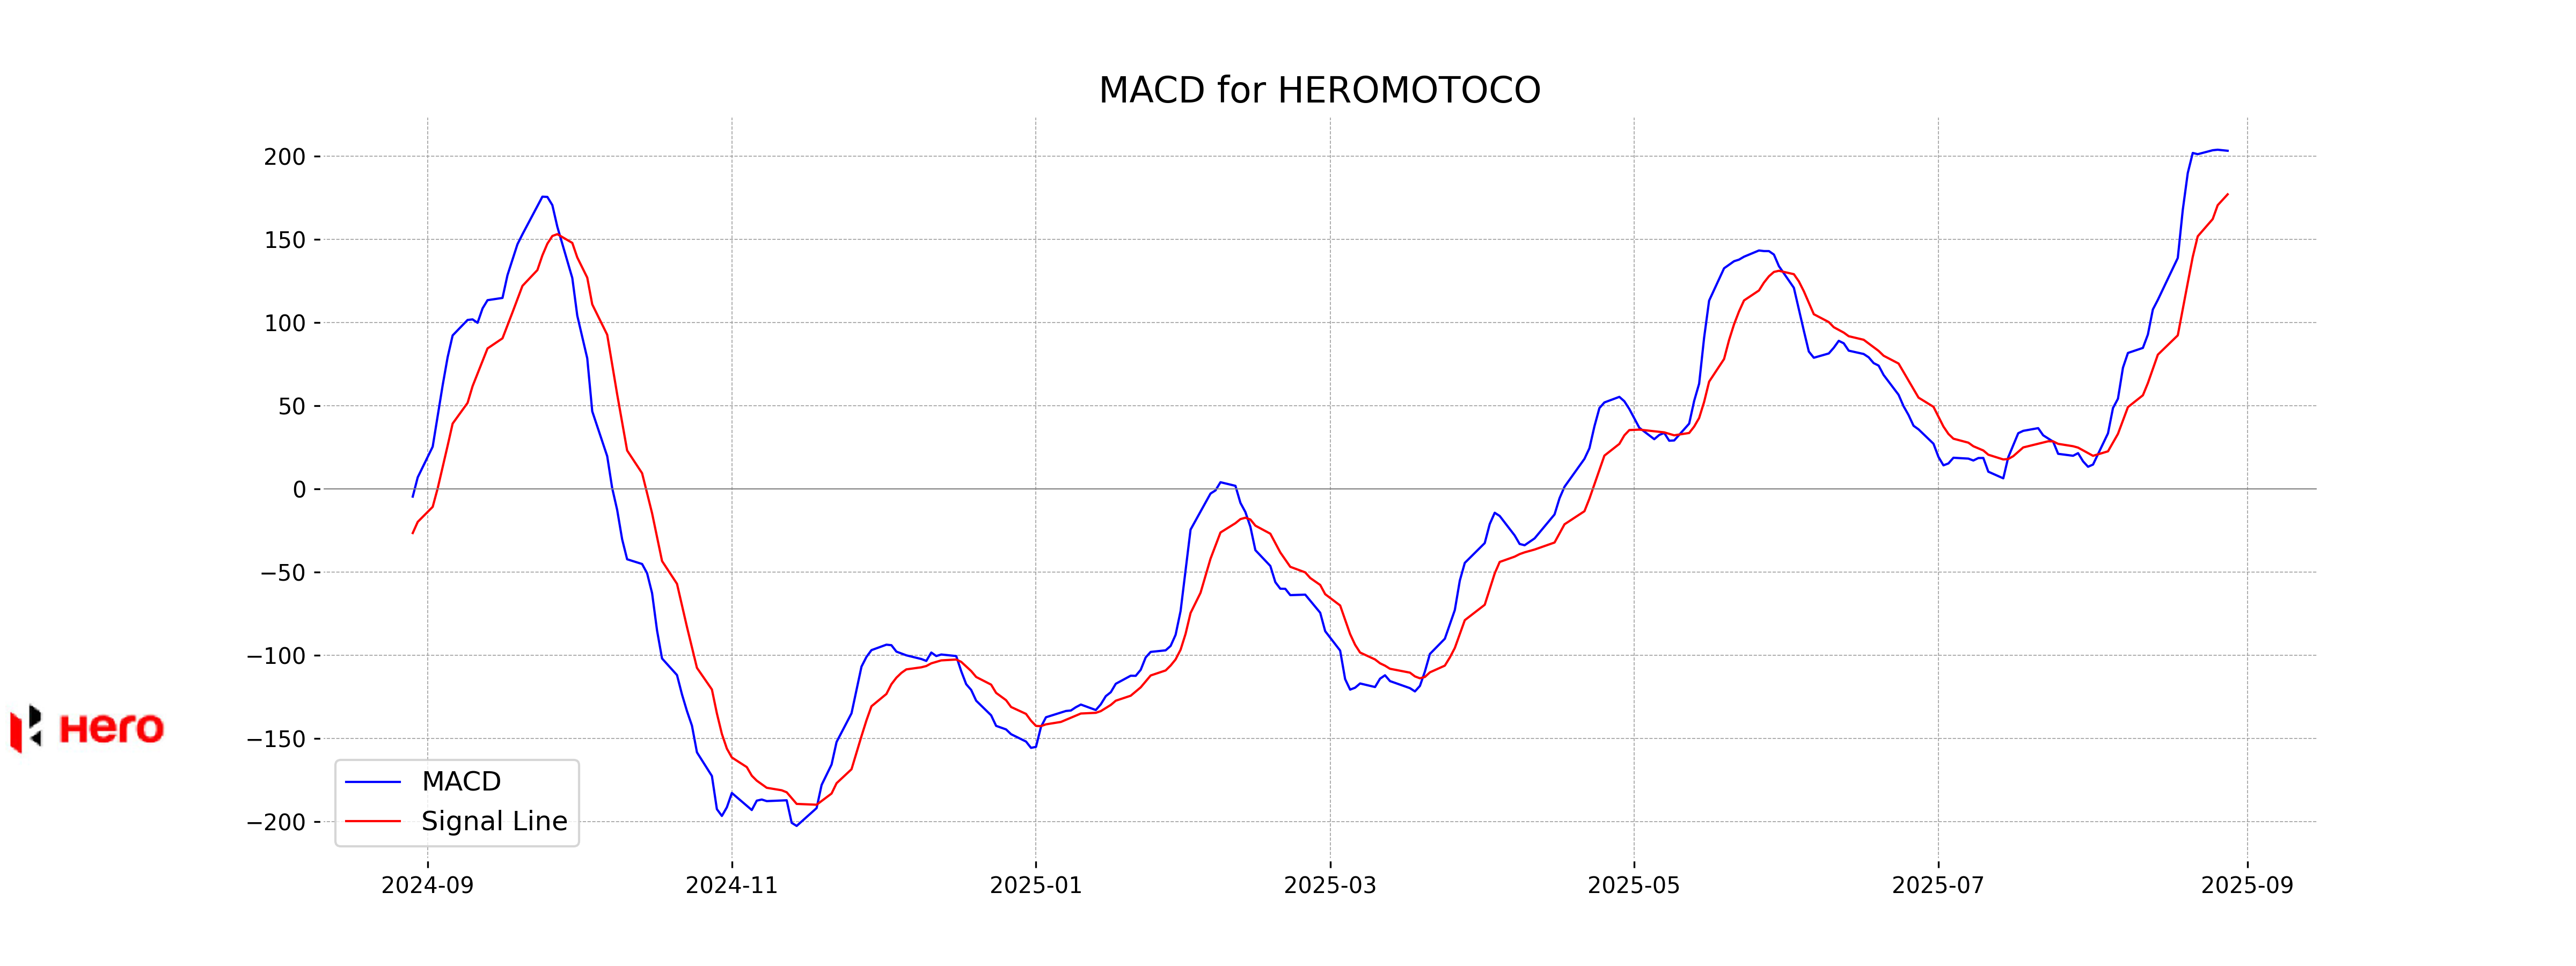
Moving Averages Trend (MACD)
MACD Analysis for Hero MotoCorp: The MACD value is 203.24, while the MACD Signal is 177.04. This difference suggests a positive trend and bullish momentum, indicating that Hero MotoCorp is likely experiencing upward price movement.
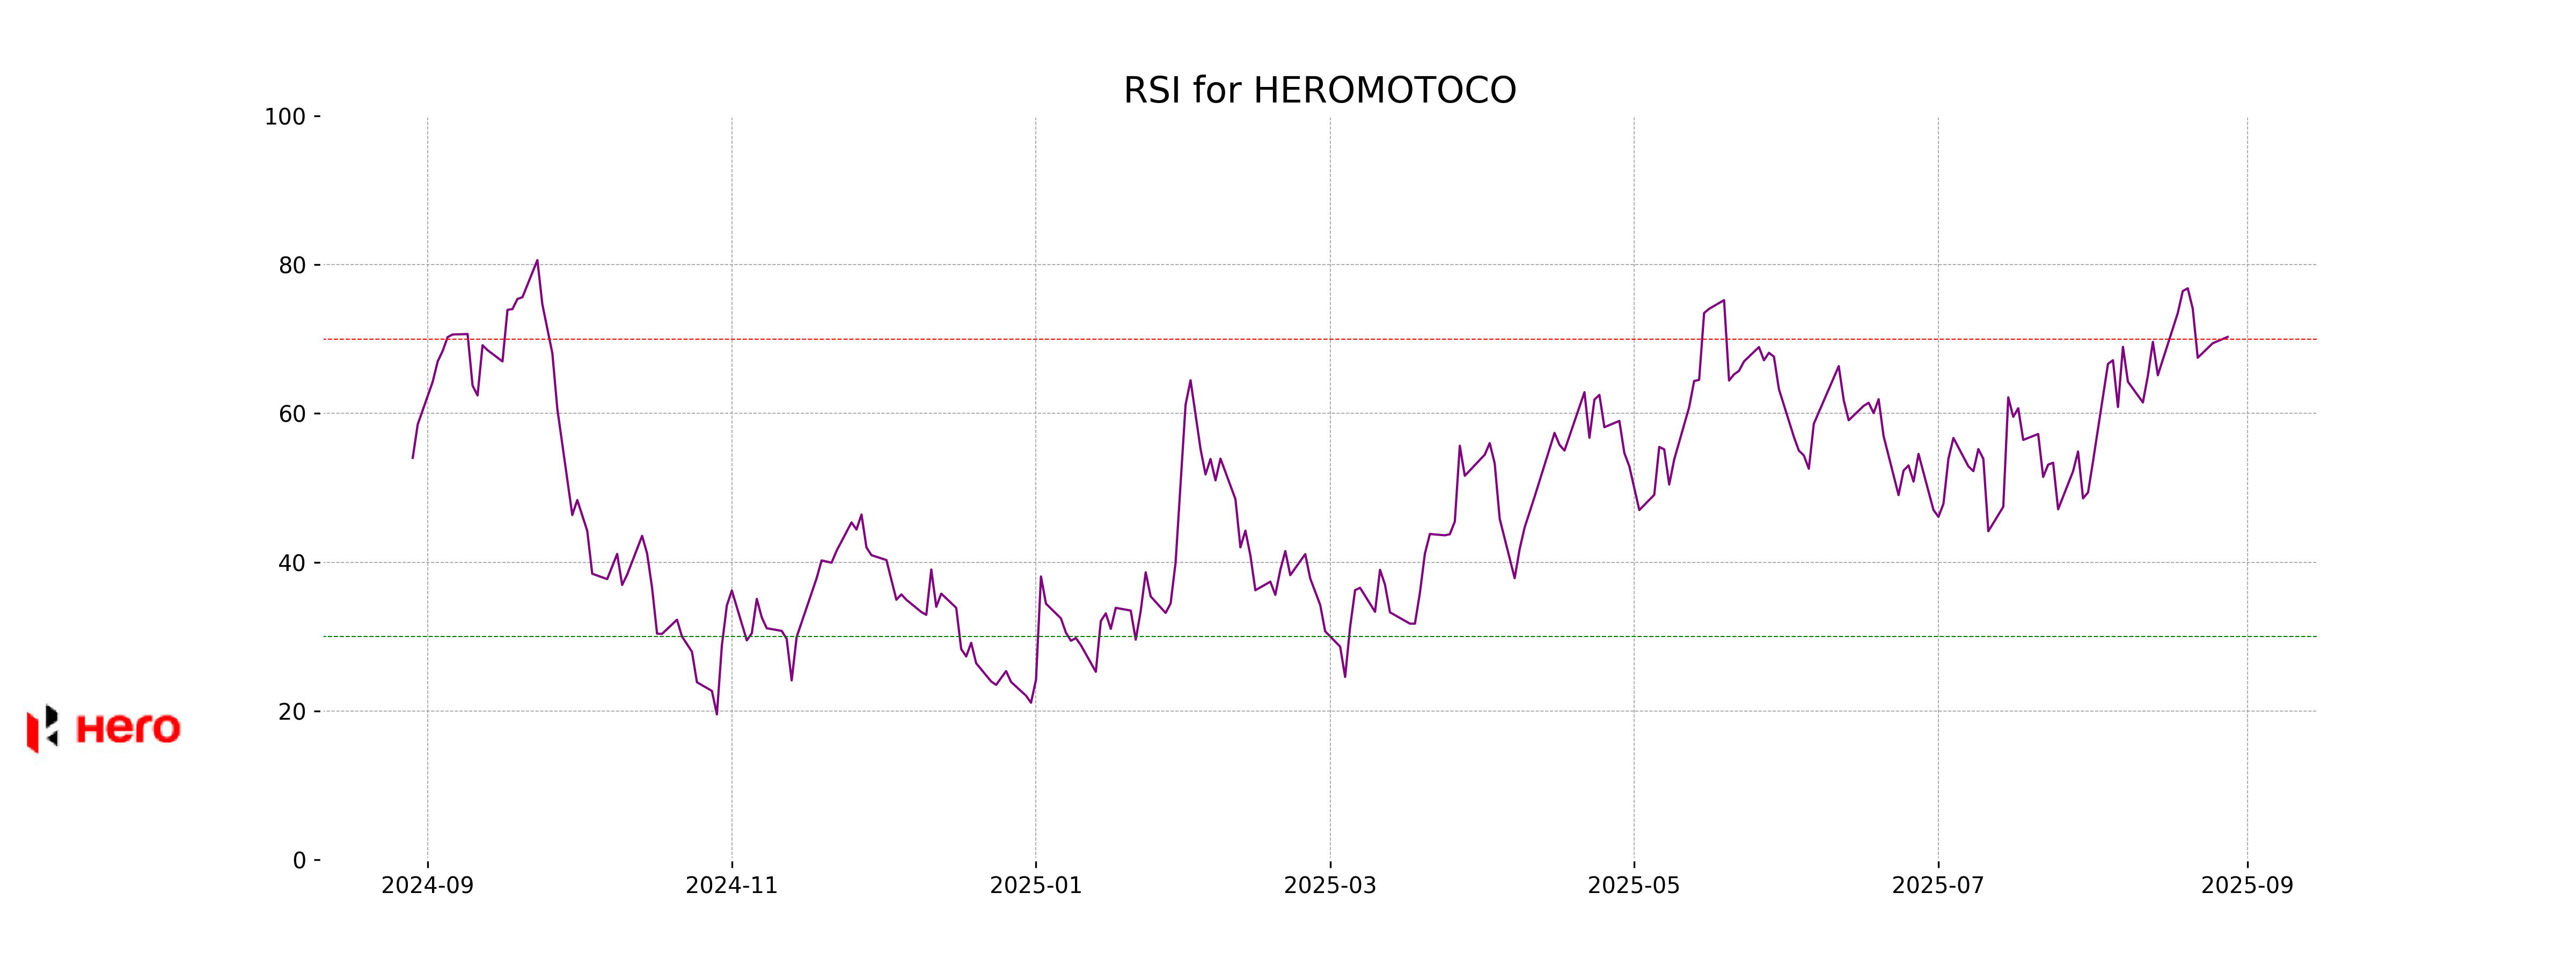
RSI Analysis
Hero MotoCorp's RSI (Relative Strength Index) stands at 70.29, indicating that the stock is entering overbought territory. This suggests that there might be a potential for a price correction in the near term as the RSI approaches higher levels typically associated with an overbought condition.
Analysis for HCL Technologies - August 28, 2025

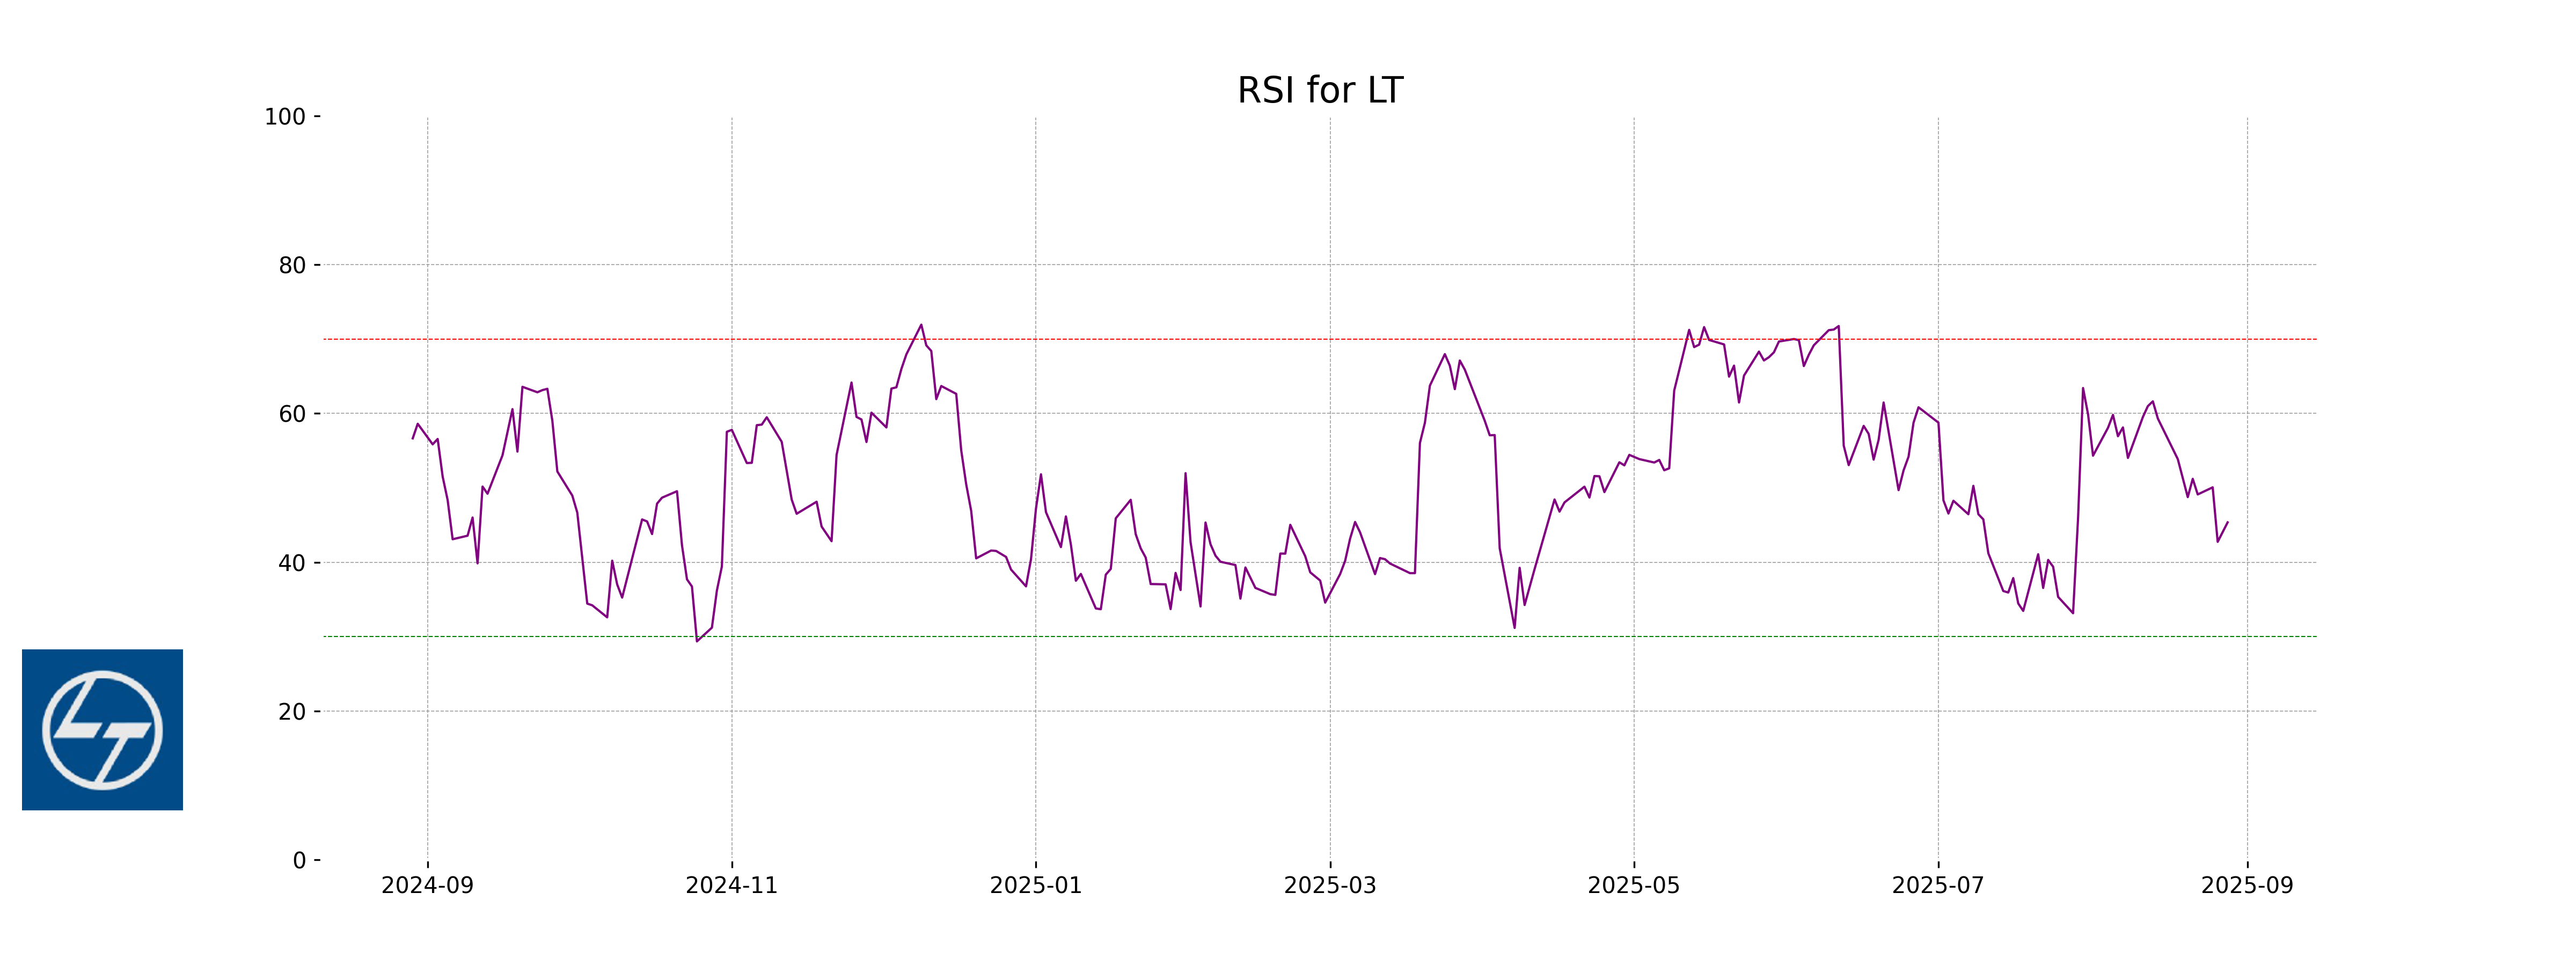
- Company Name: Larsen & Toubro - Opening Price: 3540.0 - Closing Price: 3560.1 - Performance Summary: - Larsen & Toubro showed a slight uptick in its stock performance with a closing price higher than its previous close, marking a percentage change of 0.53%. The company's stock price fluctuated between a low of 3537.2 and a high of 3576.9. Although its 50-day EMA (3578.7) is higher than the closing price, signaling a short-term bearish trend, its overall RSI of 45.36 indicates a neutral momentum. Located in the Industrials sector in India, the company operates in the Engineering & Construction industry with a substantial market cap.
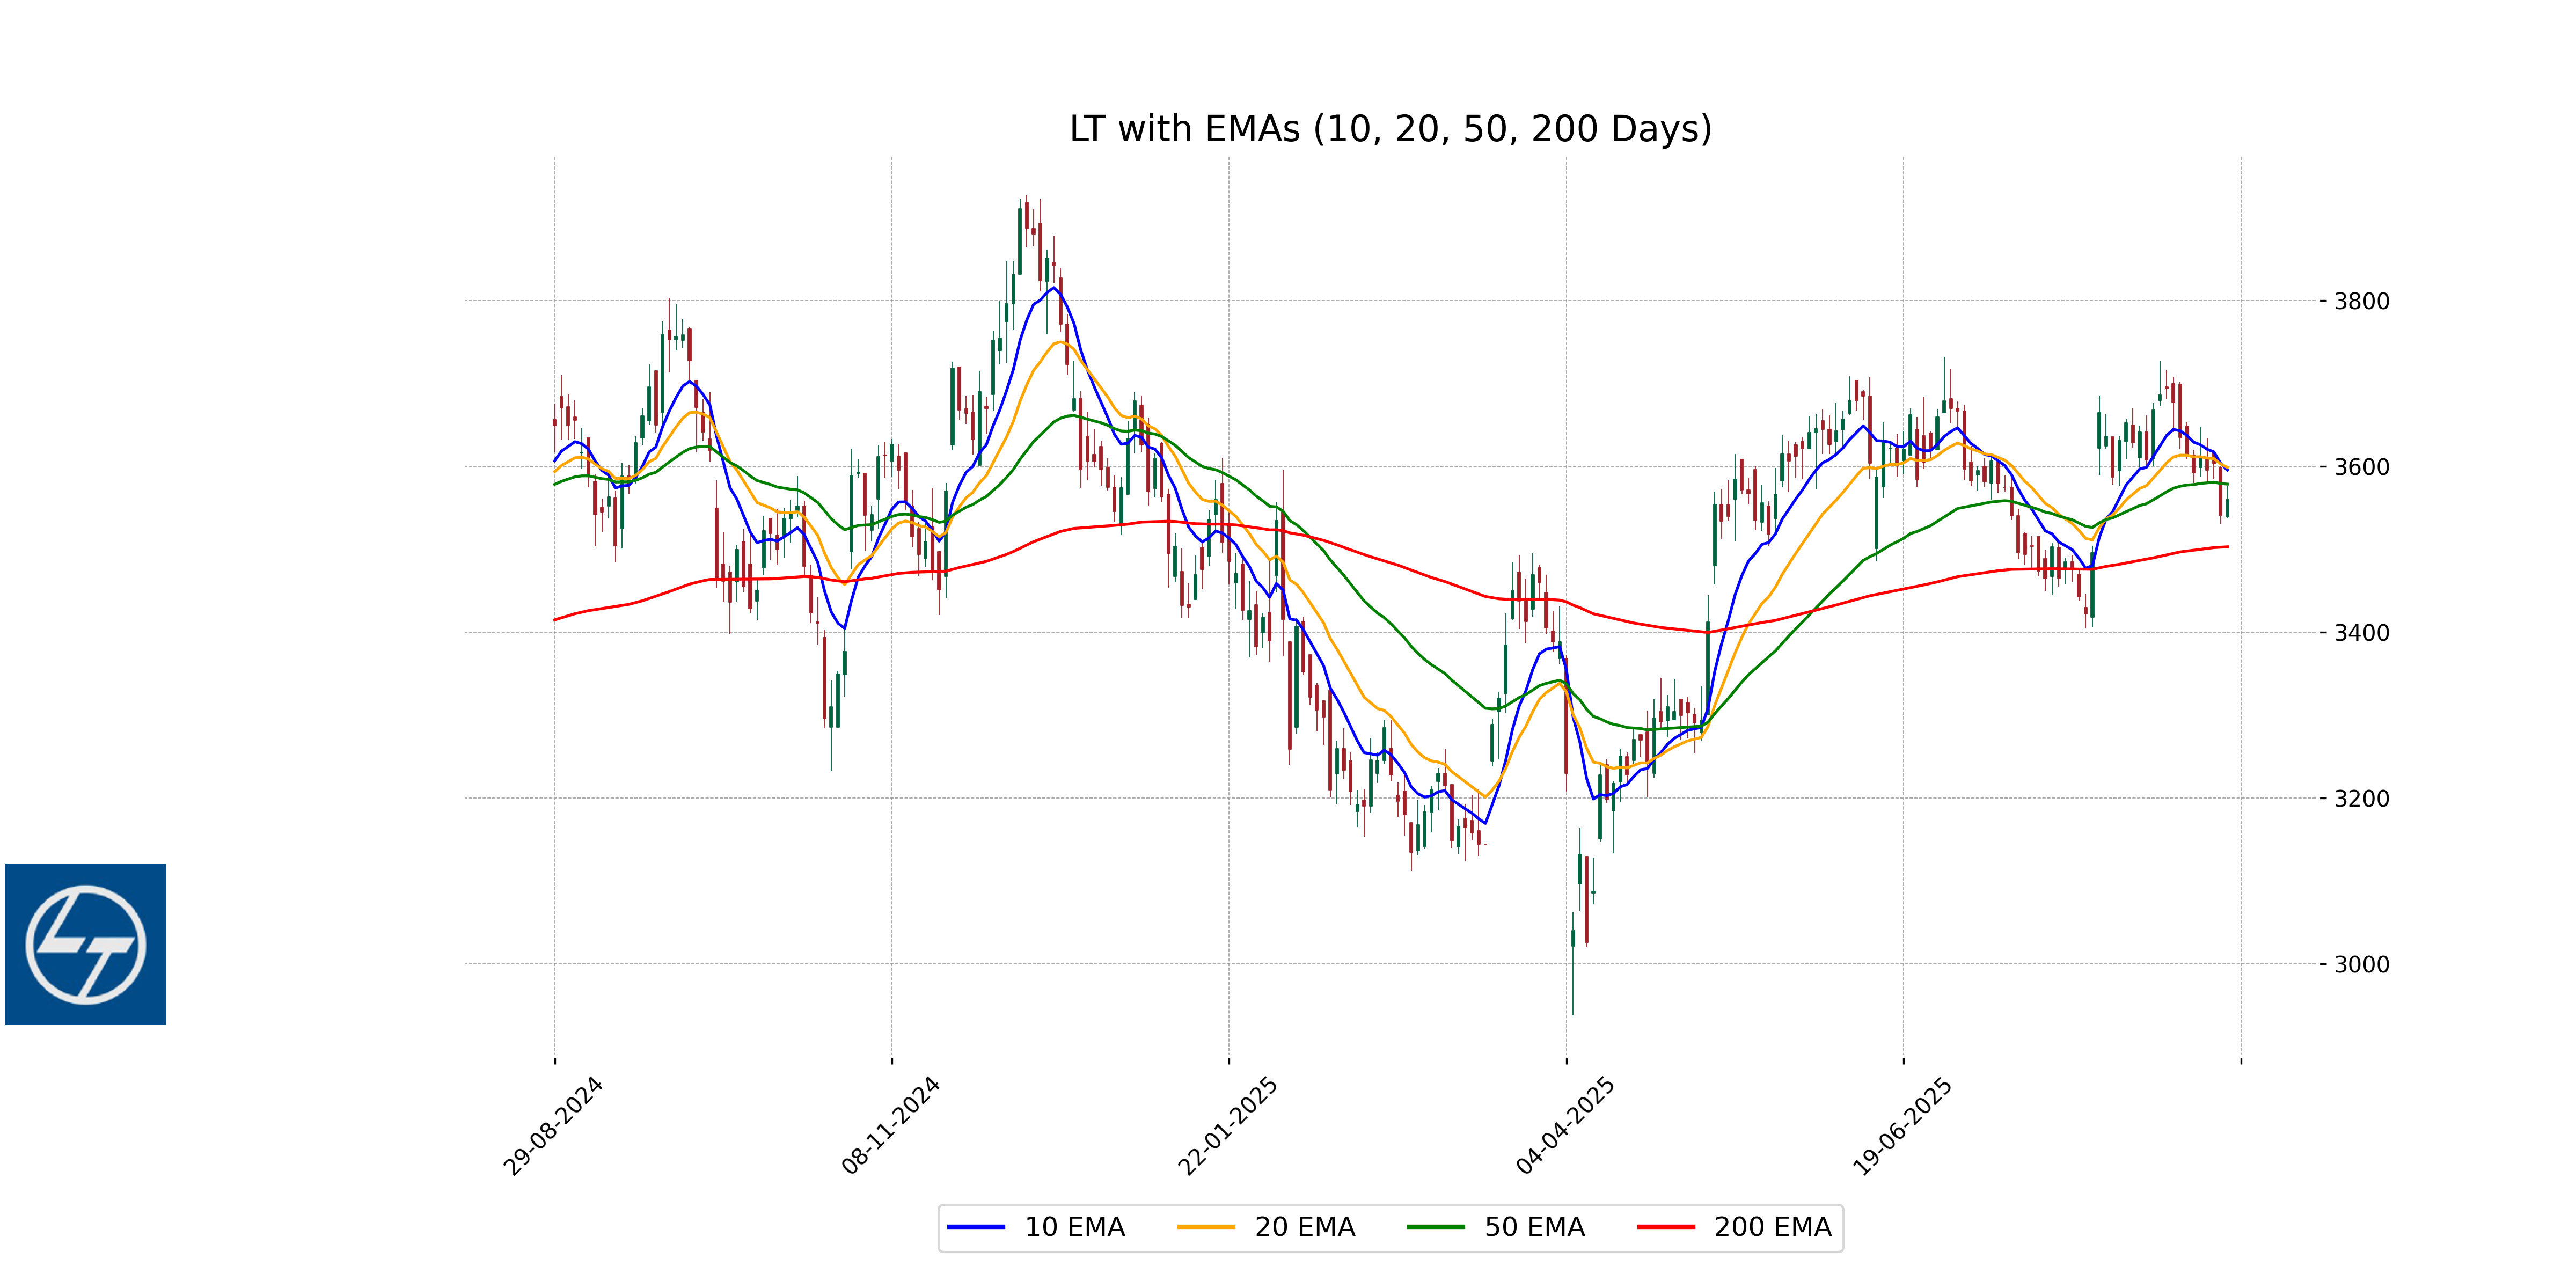
Relationship with Key Moving Averages
Based on the provided data, Larsen & Toubro's closing price of 3560.10 is below its 10-day EMA of 3595.74 and 20-day EMA of 3598.87, suggesting a short-term bearish trend. However, it's close to its 50-day EMA of 3578.69 and above the 200-day EMA of 3503.04, indicating a longer-term bullish outlook.
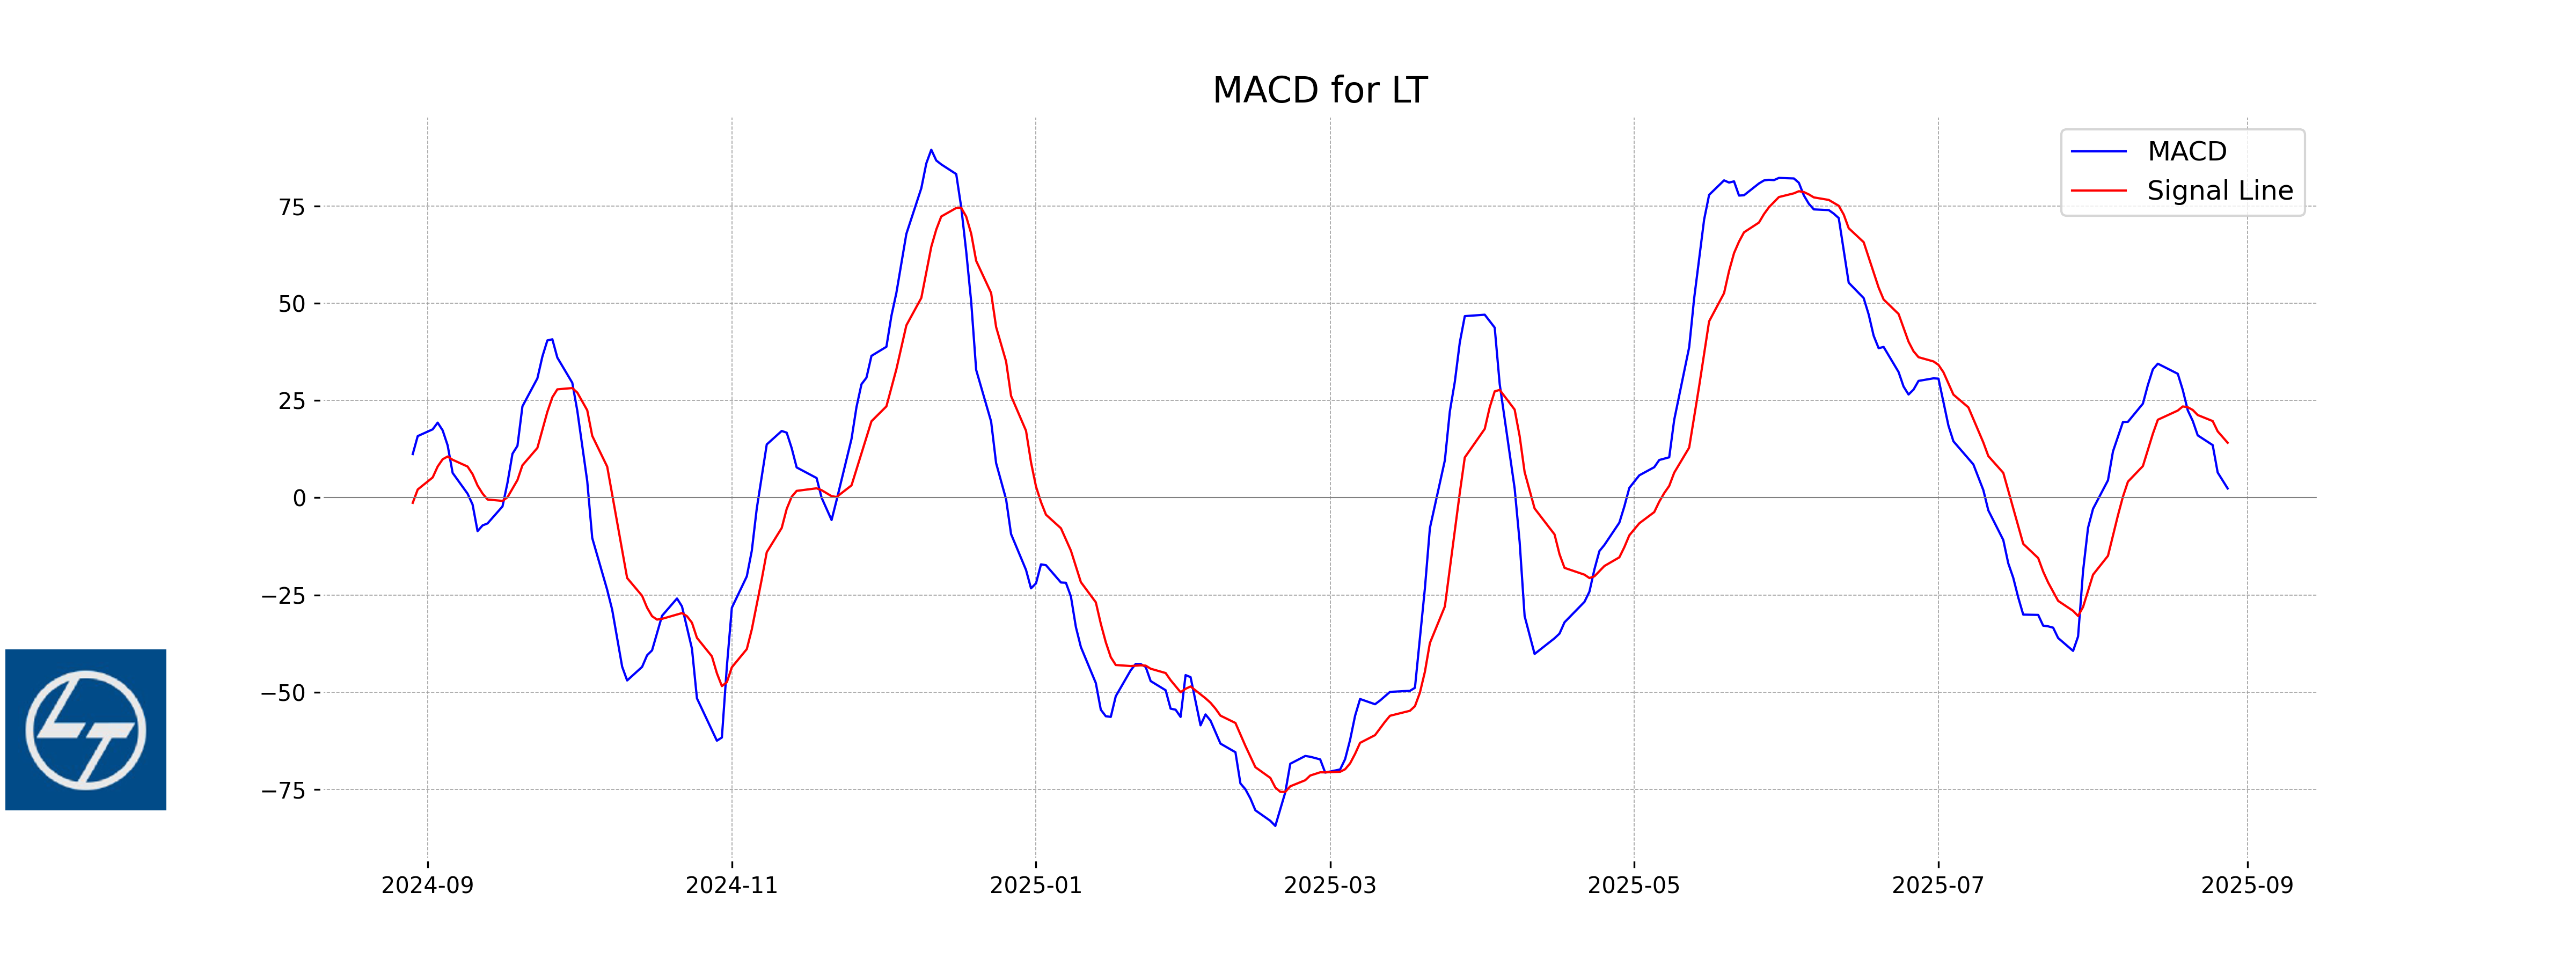
Moving Averages Trend (MACD)
HCL Technologies currently shows a MACD of 2.39, while the MACD Signal is at 14.13. The MACD being lower than the MACD Signal indicates a possible bearish sentiment in the short term, suggesting that the stock might experience downward pressure if the trend continues.
RSI Analysis
The Relative Strength Index (RSI) for HCL Technologies is 45.36, suggesting that the stock is neither overbought nor oversold at this level. An RSI around 45 indicates a neutral market, with potential for future movement based on upcoming market conditions.
Analysis for Titan Company - August 28, 2025

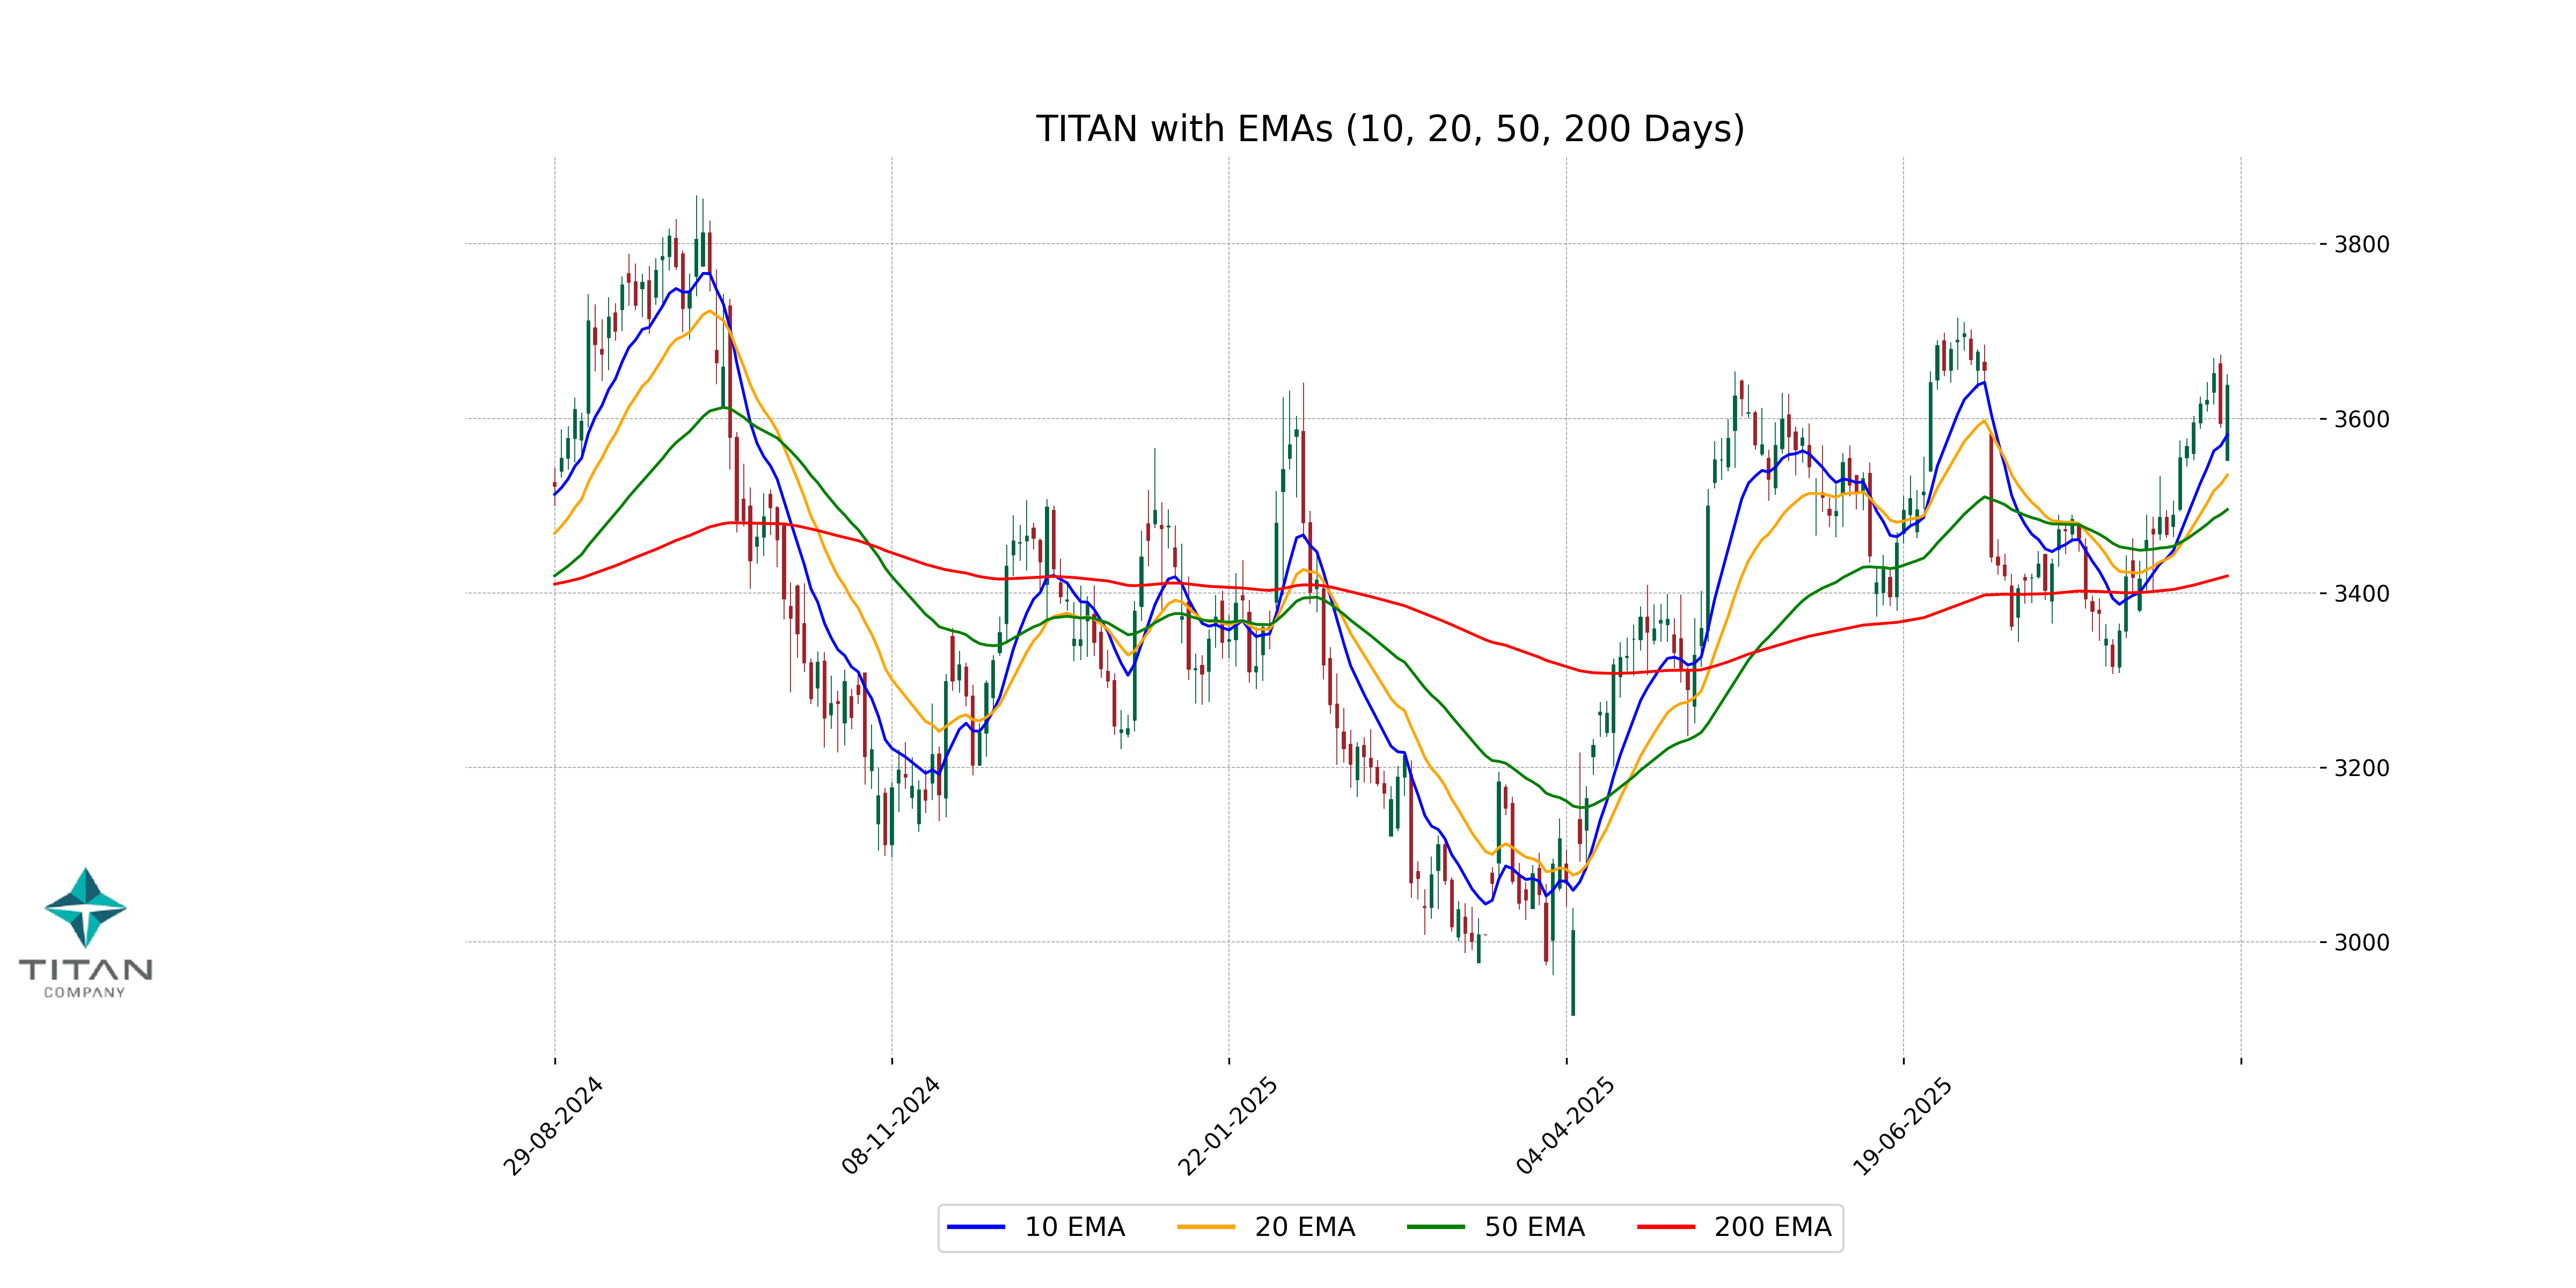
Titan Company, operating within the Consumer Cyclical sector and Luxury Goods industry in India, saw its stock close at 3637.70, marking a 1.22% increase from the previous close. Despite a high PE ratio of 87.26, indicating potential overvaluation, the company's strong EPS of 41.69 and favorable technical indicators such as a MACD greater than its signal line, suggest a positive momentum. With an RSI of 65.41, the stock appears to be nearing overbought territory.
Relationship with Key Moving Averages
Titan Company's stock is trading above its key moving averages, with a closing price of 3637.70, which is above the 10-day EMA of 3581.15, the 20-day EMA of 3535.22, the 50-day EMA of 3495.61, and the 200-day EMA of 3419.52. This indicates a bullish trend for the stock.
Moving Averages Trend (MACD)
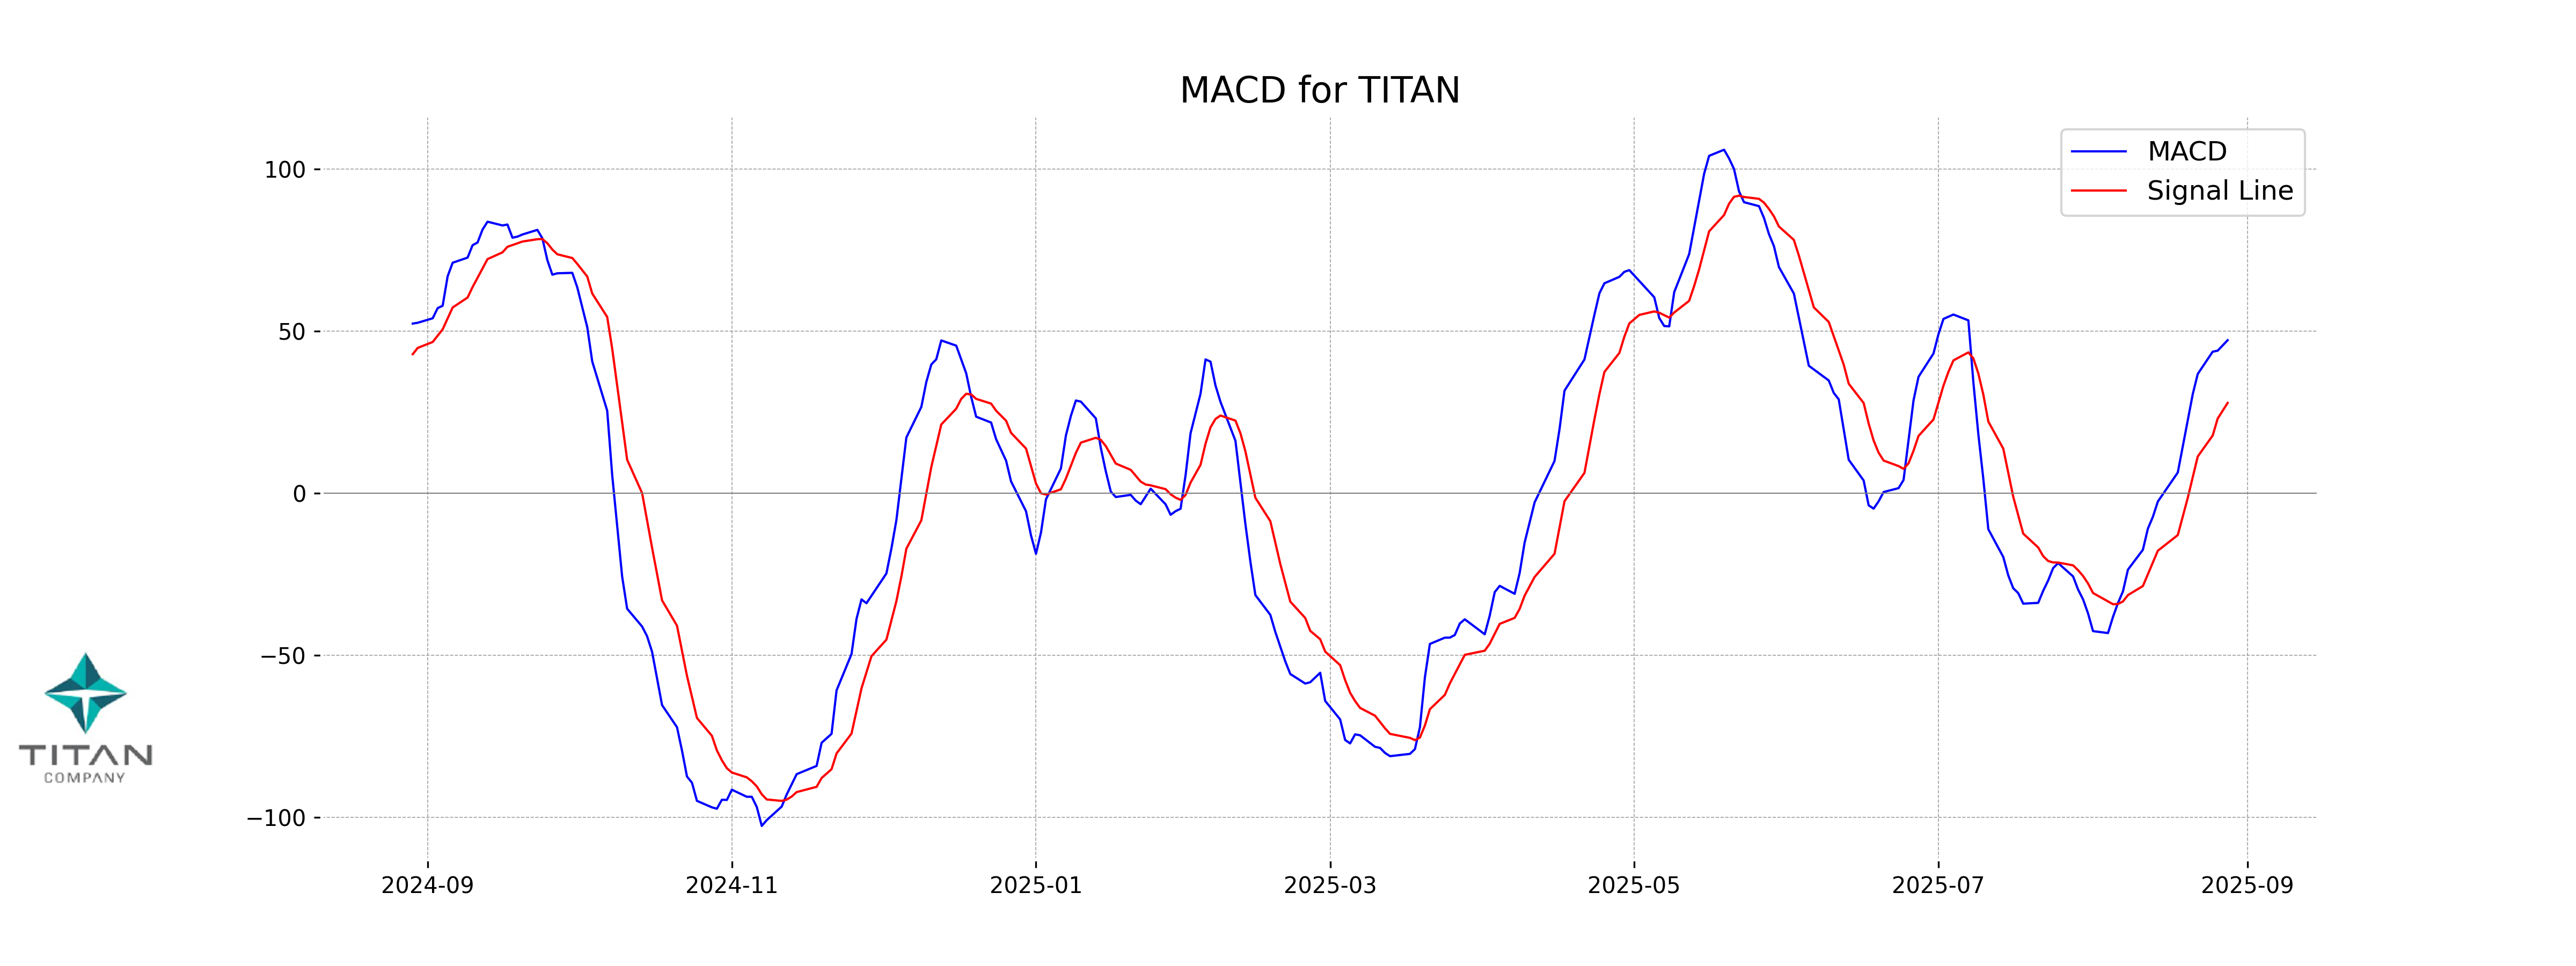
Titan Company's MACD value is 47.21, which is above the MACD signal line at 27.88. This indicates a bullish trend, suggesting potential upward momentum in the stock's price.
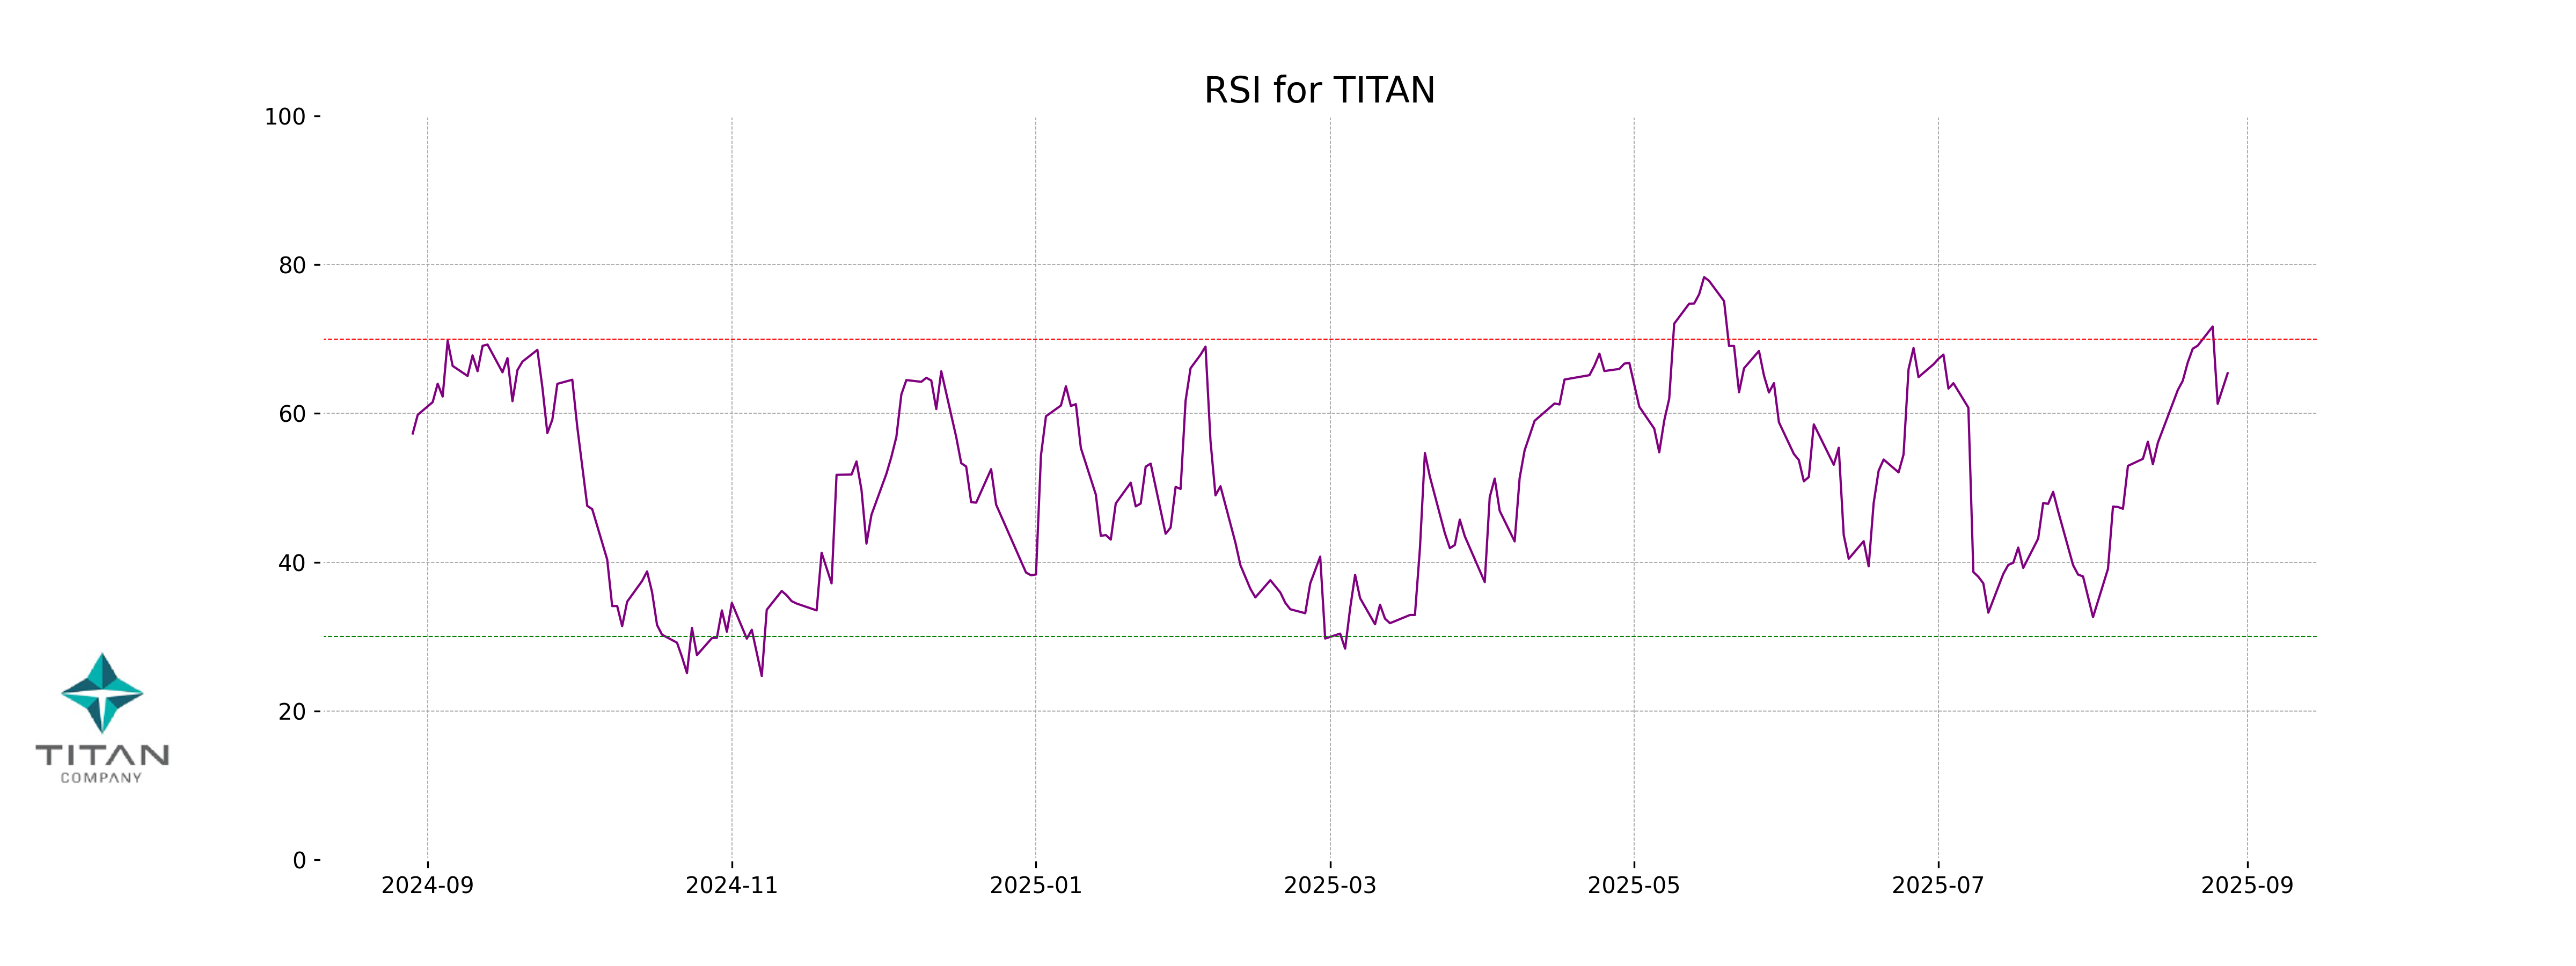
RSI Analysis
The Relative Strength Index (RSI) for Titan Company is 65.41, which suggests that the stock is approaching the overbought territory but is not quite there yet. Generally, an RSI above 70 indicates an overbought condition, so current levels suggest cautious optimism for further gains.