Top 5 Nifty 50 gainers today – August 6, 2025: Biggest stock moves
In this article, we will explore the technical indicators of some of the high-performing stocks on the Indian stock market, including ADANIPORTS, ASIANPAINT, BEL, HDFCLIFE, and SBILIFE.
By looking at these stocks through the lens of key technical factors, we aim to better understand their price movements, trends, and potential future performance.

Analysis for Adani Ports - August 06, 2025

Adani Ports' performance shows a minor increase with a % change of 0.66% and a point change of 9.0. The stock closed at 1367.10 after opening at 1374.0, with a trading volume of 2,293,202. Despite challenging market conditions indicated by a low RSI of 41.77 and a negative MACD, the company maintains a significant market cap of 2,953,127,395,328 and a PE Ratio of 26.14 in the Industrials sector, specifically Marine Shipping in India.
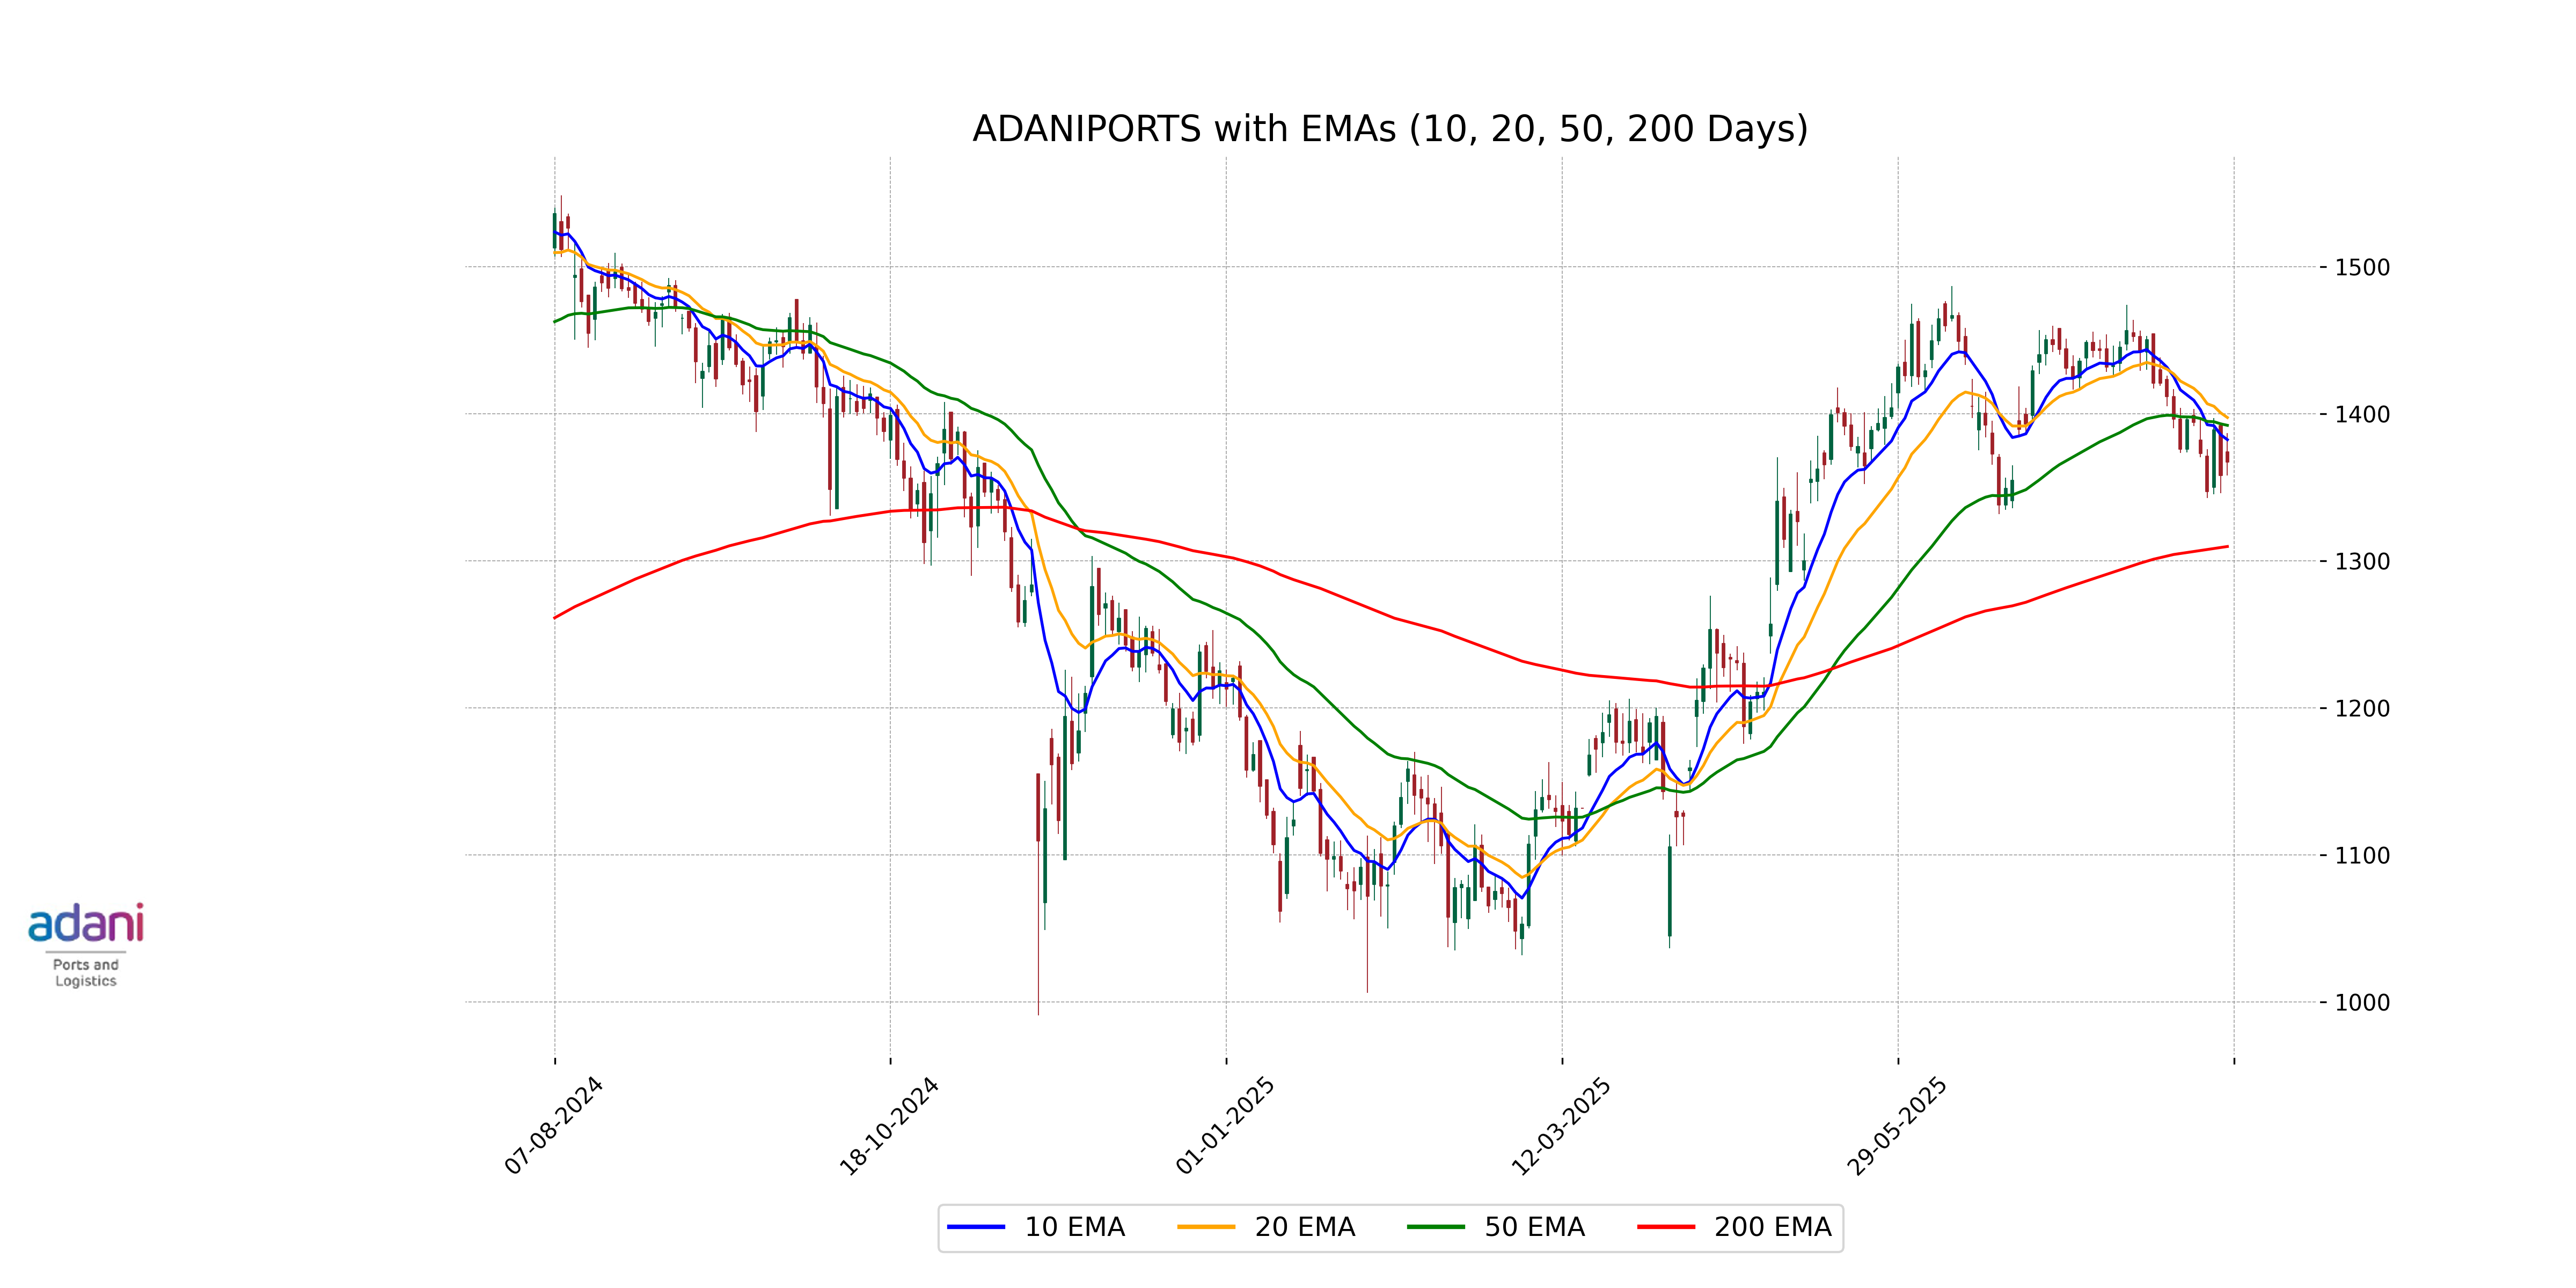
Relationship with Key Moving Averages
Adani Ports is currently trading below its 50-day and 20-day EMAs, with close prices at 1367.10 compared to 1392.13 and 1397.43 respectively, indicating a bearish sentiment in the short term. However, it remains above the 200-day EMA of 1309.69, suggesting a longer-term bullish trend.
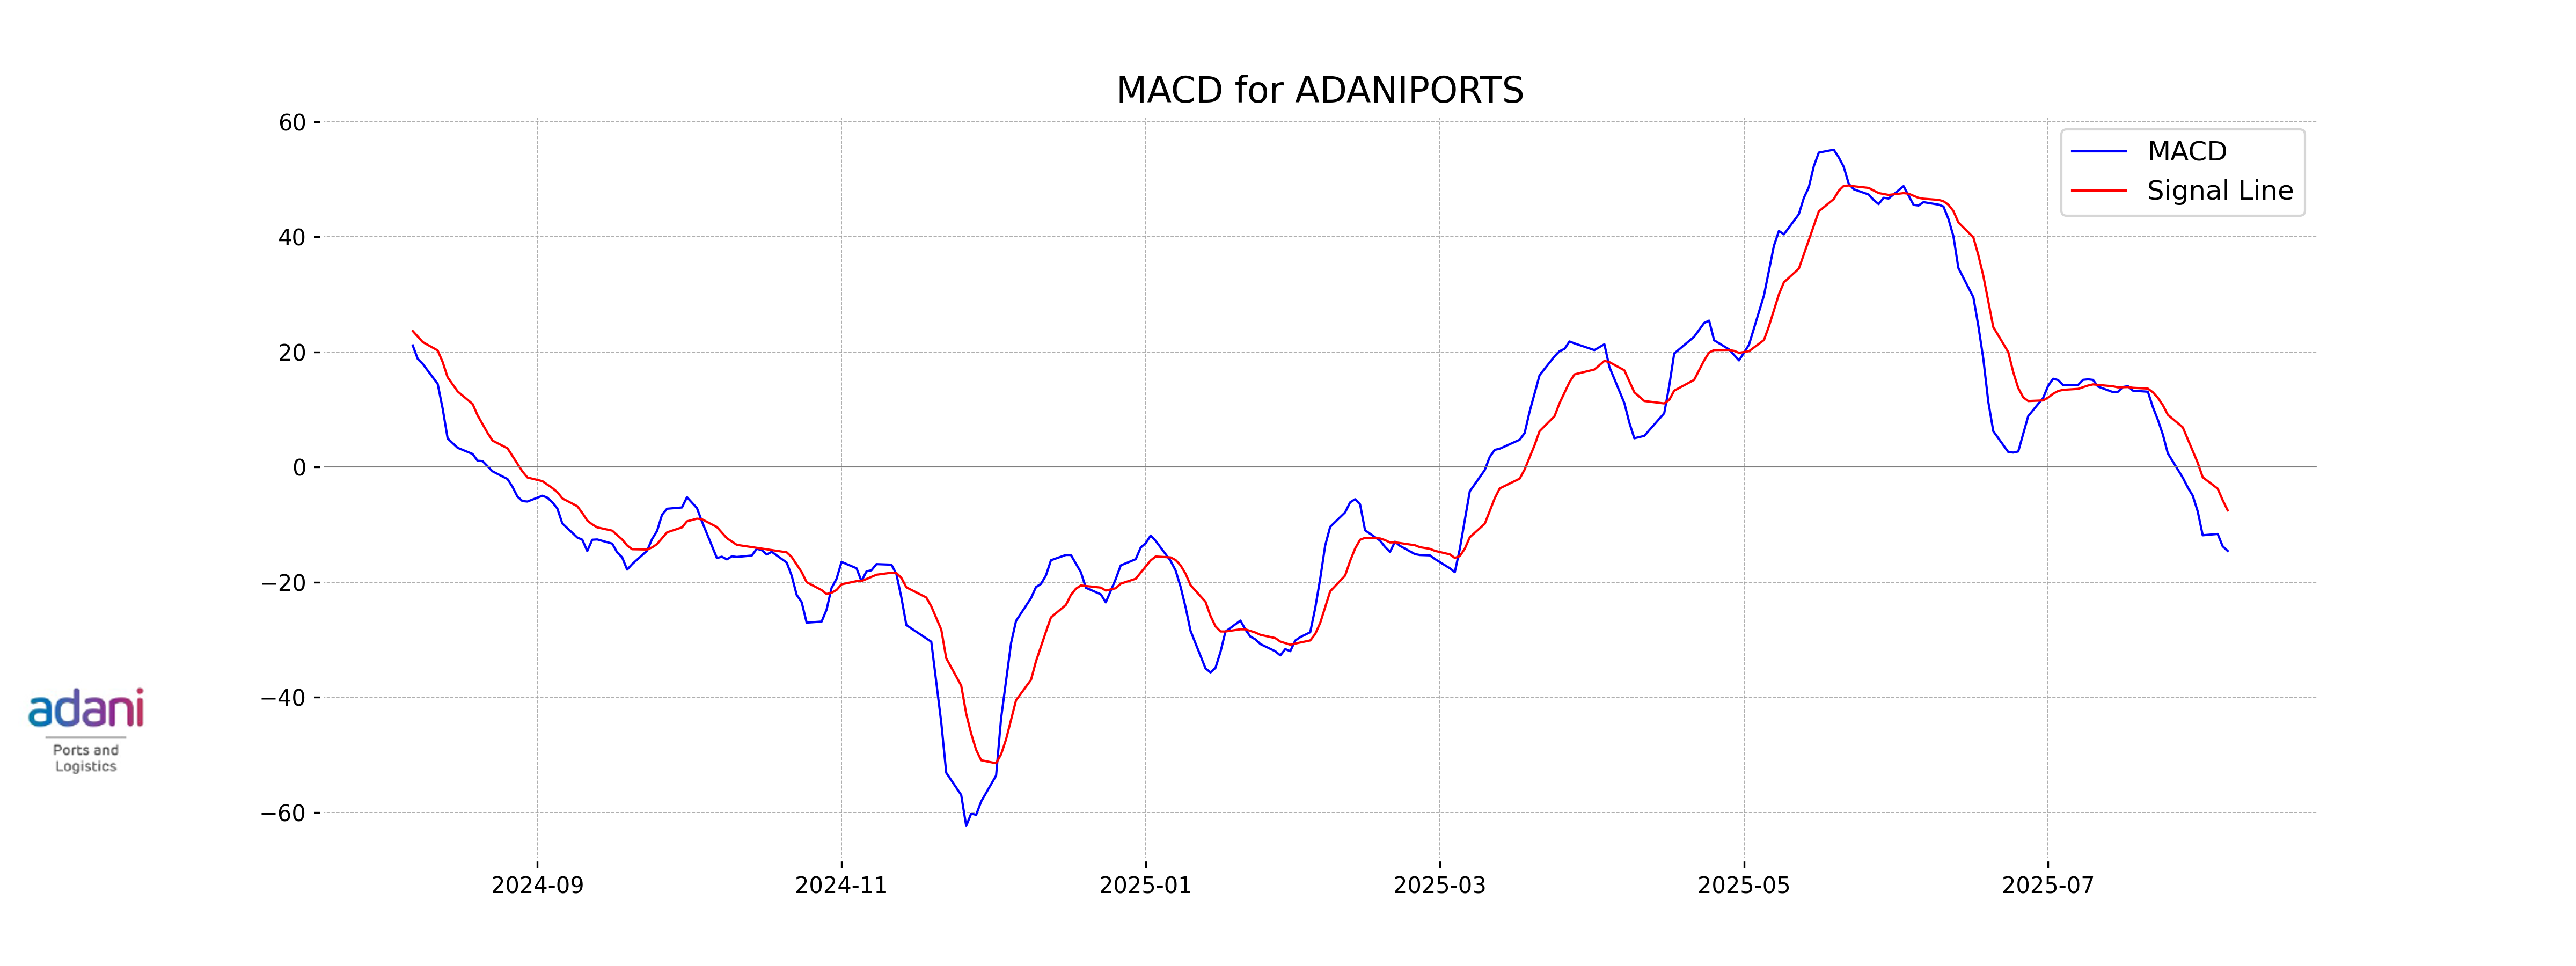
Moving Averages Trend (MACD)
The MACD for Adani Ports is currently at -14.55, which is below the MACD Signal line at -7.50. This indicates a bearish momentum as the MACD is negative and suggests that the stock may be experiencing downward pressure.
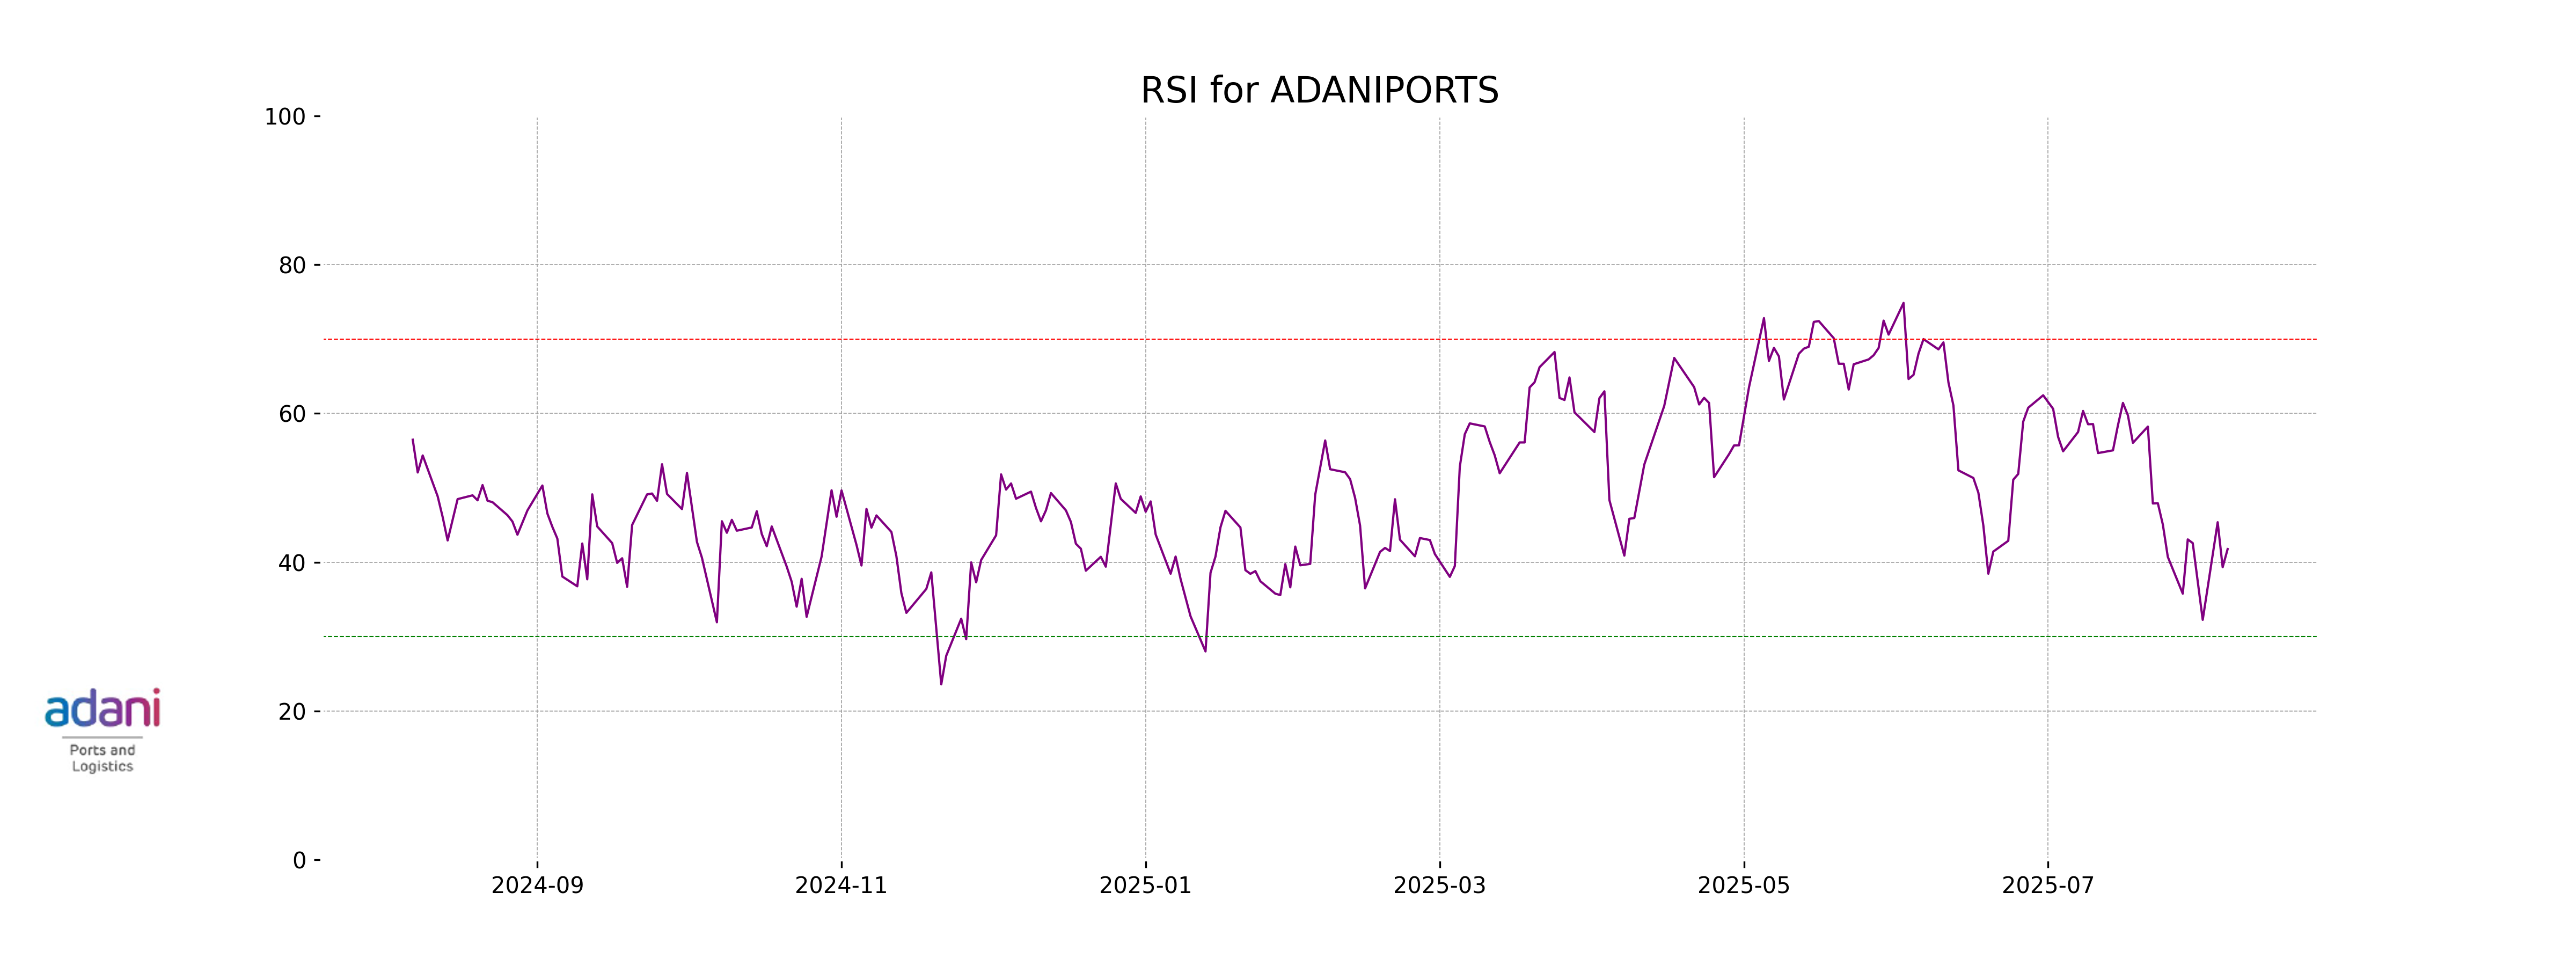
RSI Analysis
The RSI (Relative Strength Index) for Adani Ports stands at 41.77, suggesting that the stock is approaching the oversold territory but is not yet considered oversold. This level may indicate potential bullish opportunities if the indicator continues to trend downward and subsequently reverses.
Analysis for Asian Paints - August 06, 2025

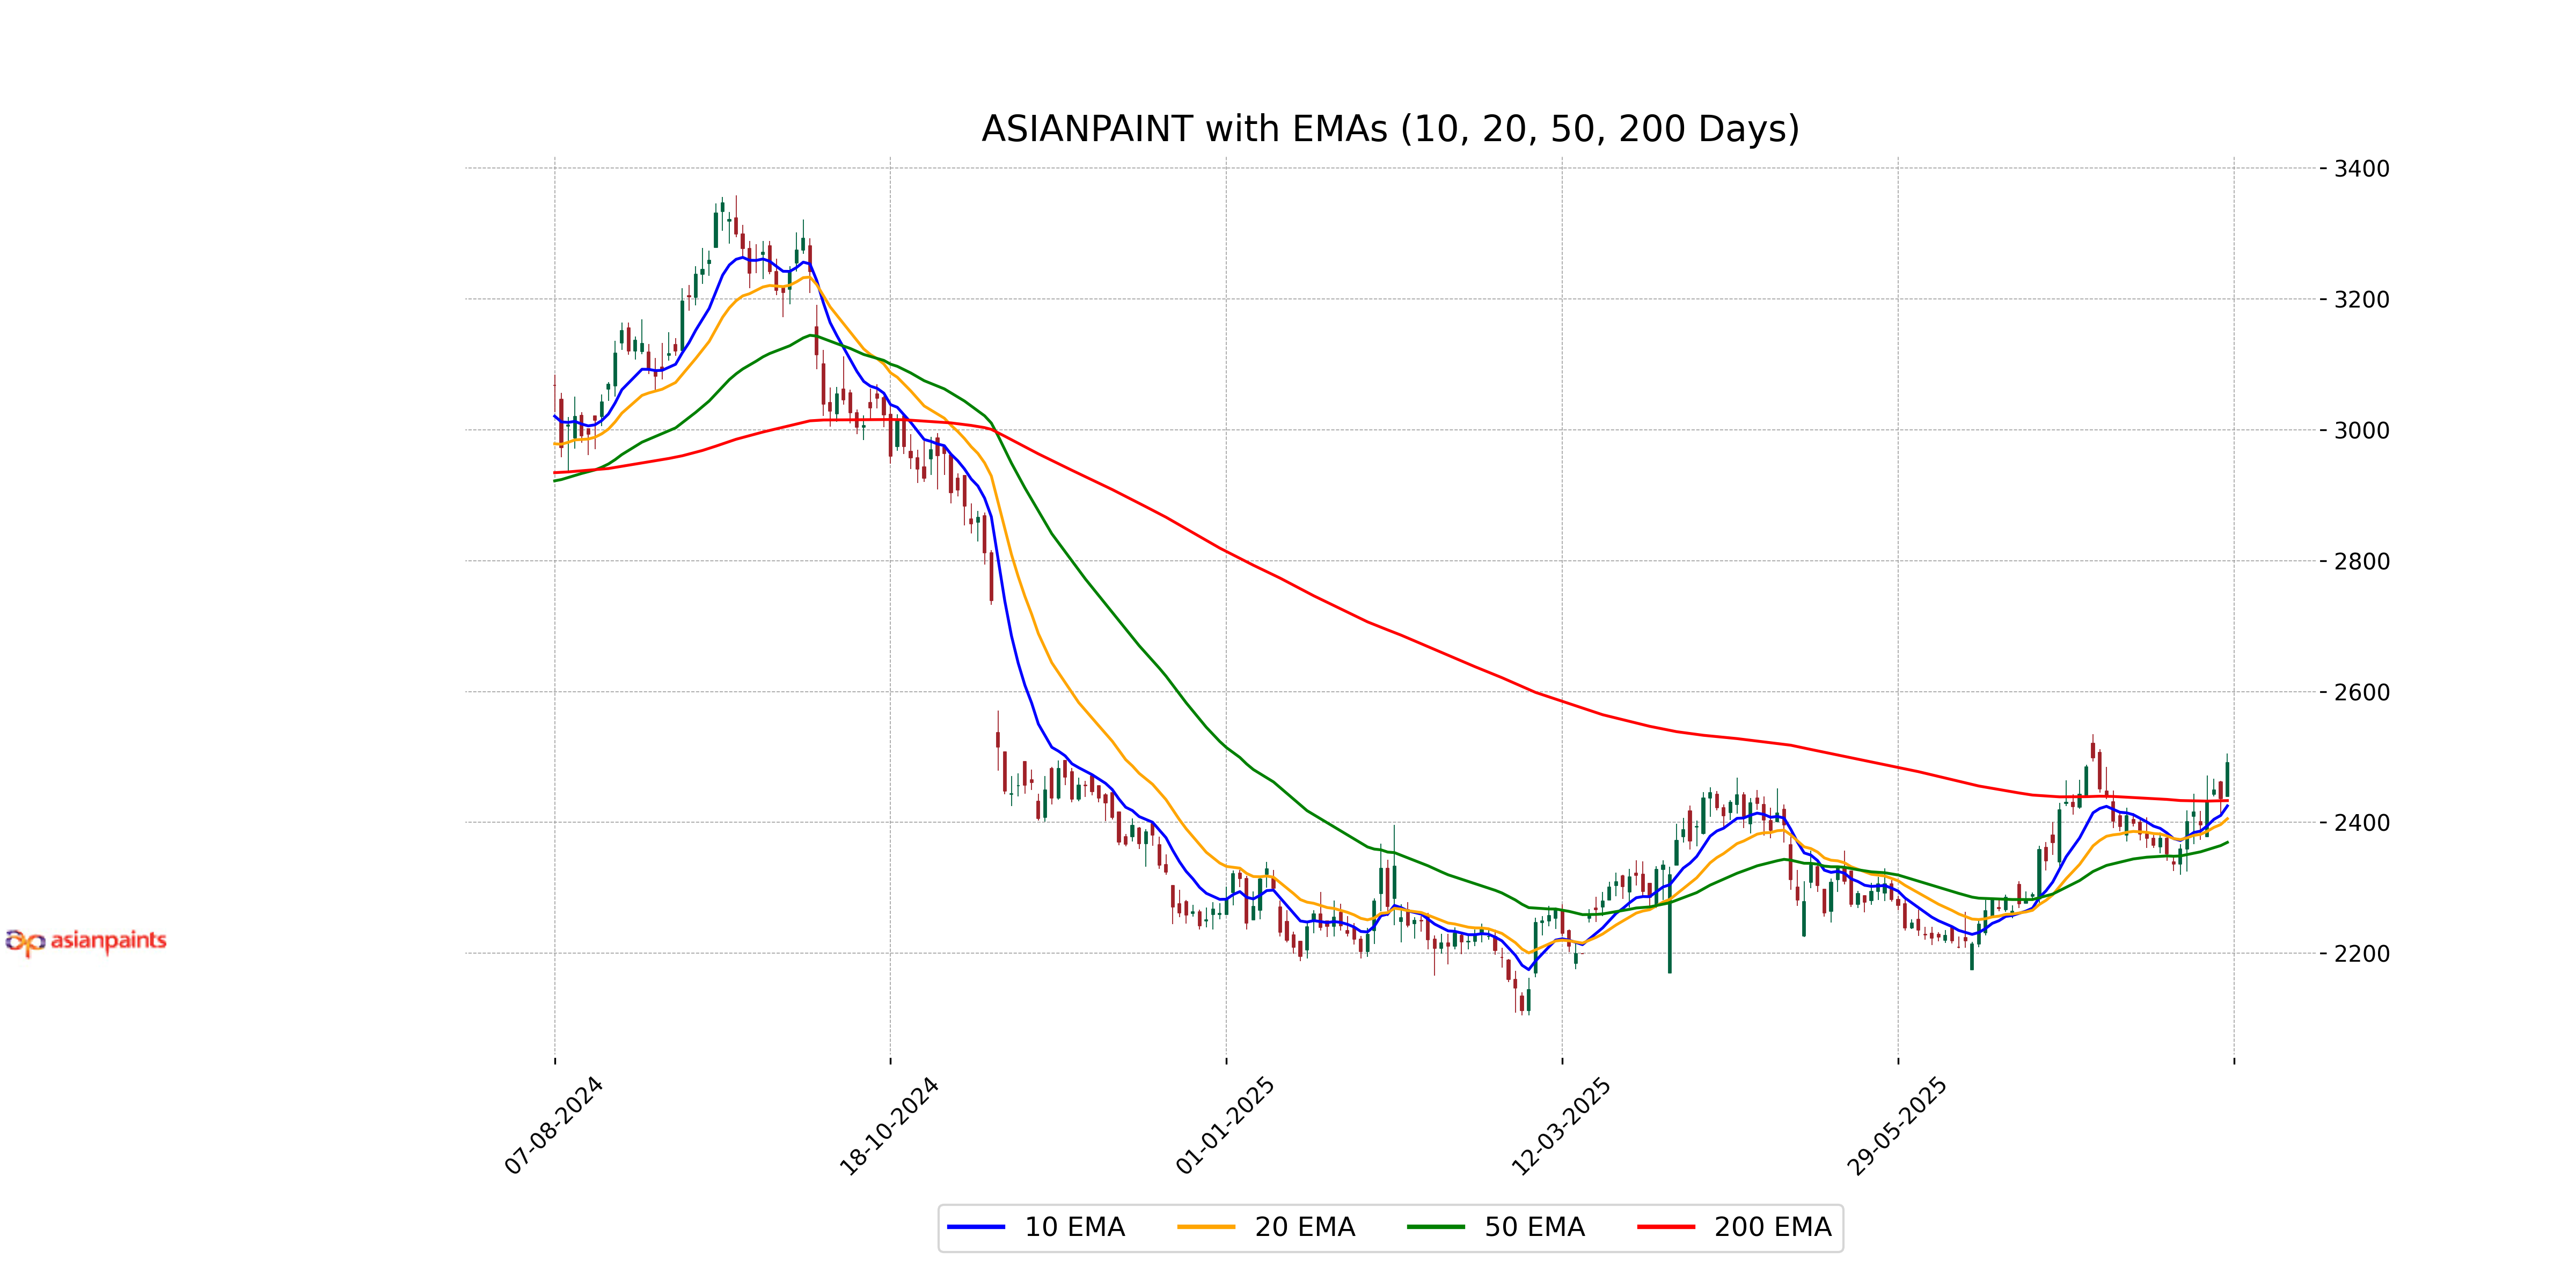
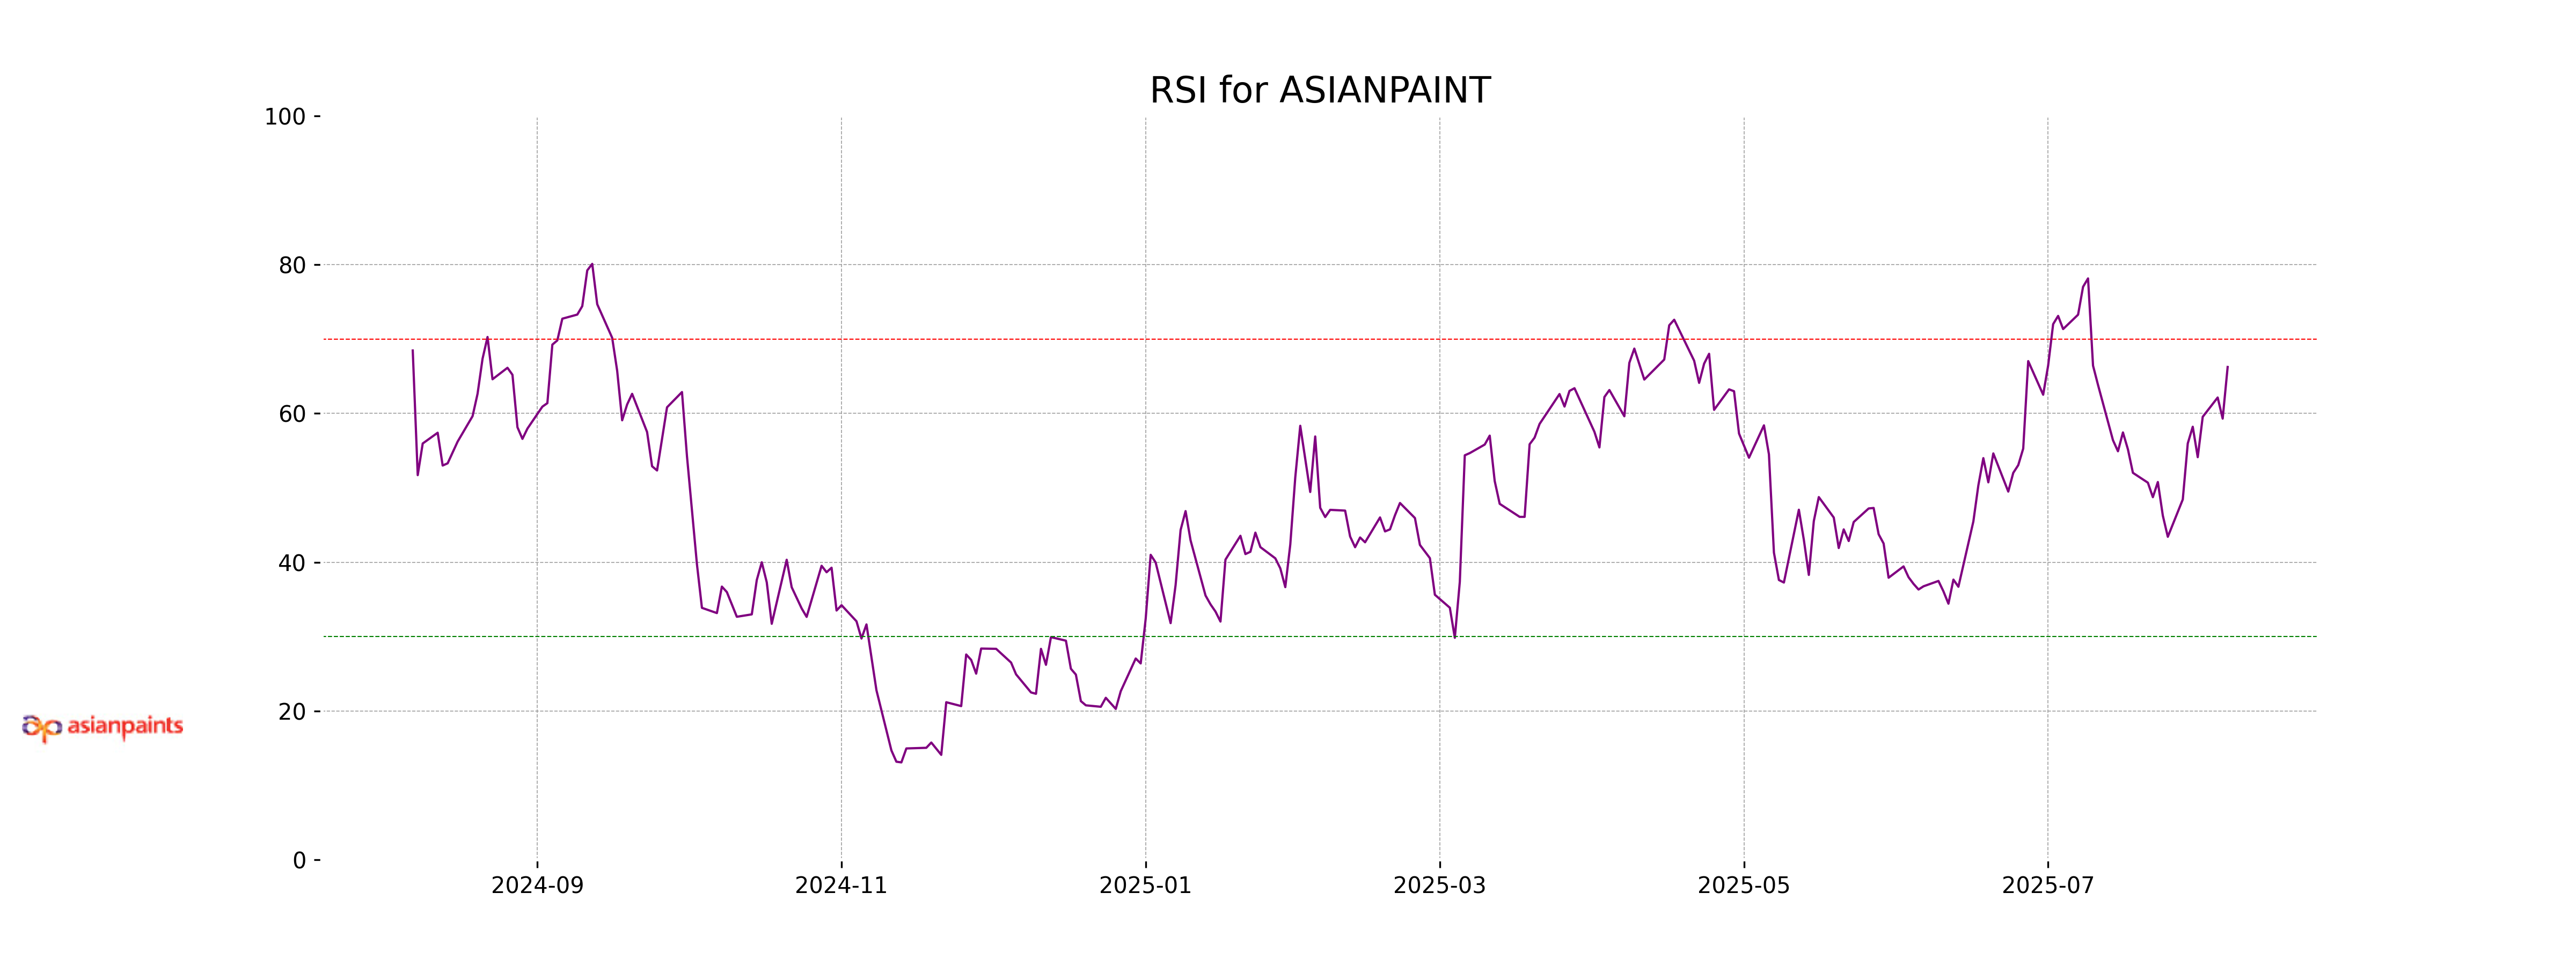
Asian Paints opened at 2440.0 and closed at 2491.2, demonstrating a positive performance with a 2.23% increase from the previous close of 2436.8. The company's market capitalization stands at 2.39 trillion INR, and it operates within the Specialty Chemicals industry in the Basic Materials sector in India. The stock's Relative Strength Index (RSI) is at 66.25, indicating strong momentum.
Relationship with Key Moving Averages
The closing price of Asian Paints is above its 10-day, 20-day, 50-day, and 200-day EMAs, indicating a bullish trend in the short to long term. Given these relationships, the stock is experiencing upward momentum relative to these key moving averages.
Moving Averages Trend (MACD)
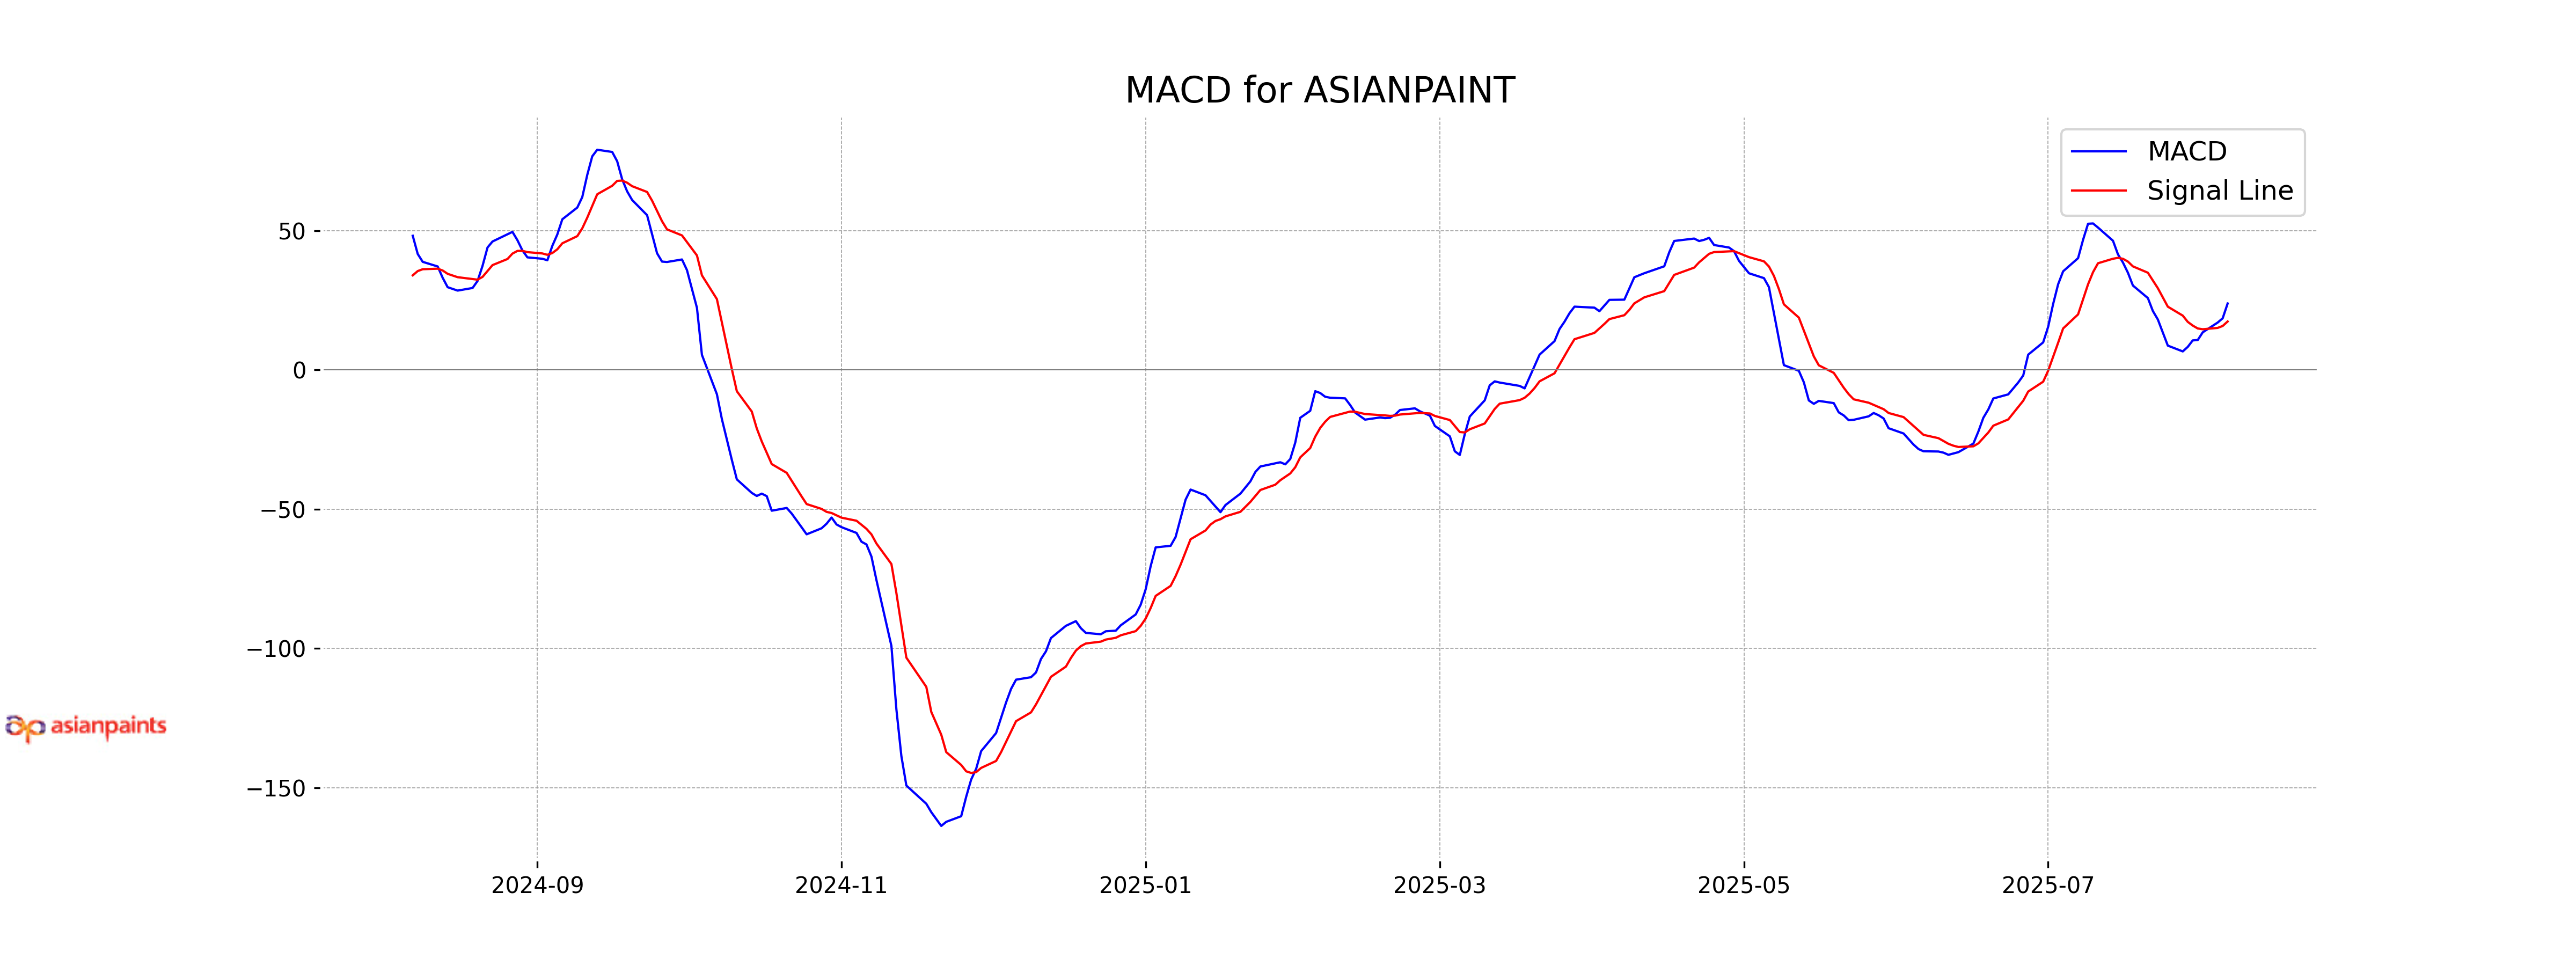
The MACD for Asian Paints is 23.83, with a MACD Signal of 17.37. Since the MACD is greater than the MACD Signal, it indicates a bullish signal, suggesting that the stock may continue to rise in the near term.
RSI Analysis
Asian Paints has an RSI of 66.25, which suggests that the stock is nearing the overbought territory. This indicates a strong upward momentum, but it also warrants caution as it approaches higher RSI levels, hinting at potential future price corrections.
Analysis for Bharat Electronics - August 06, 2025

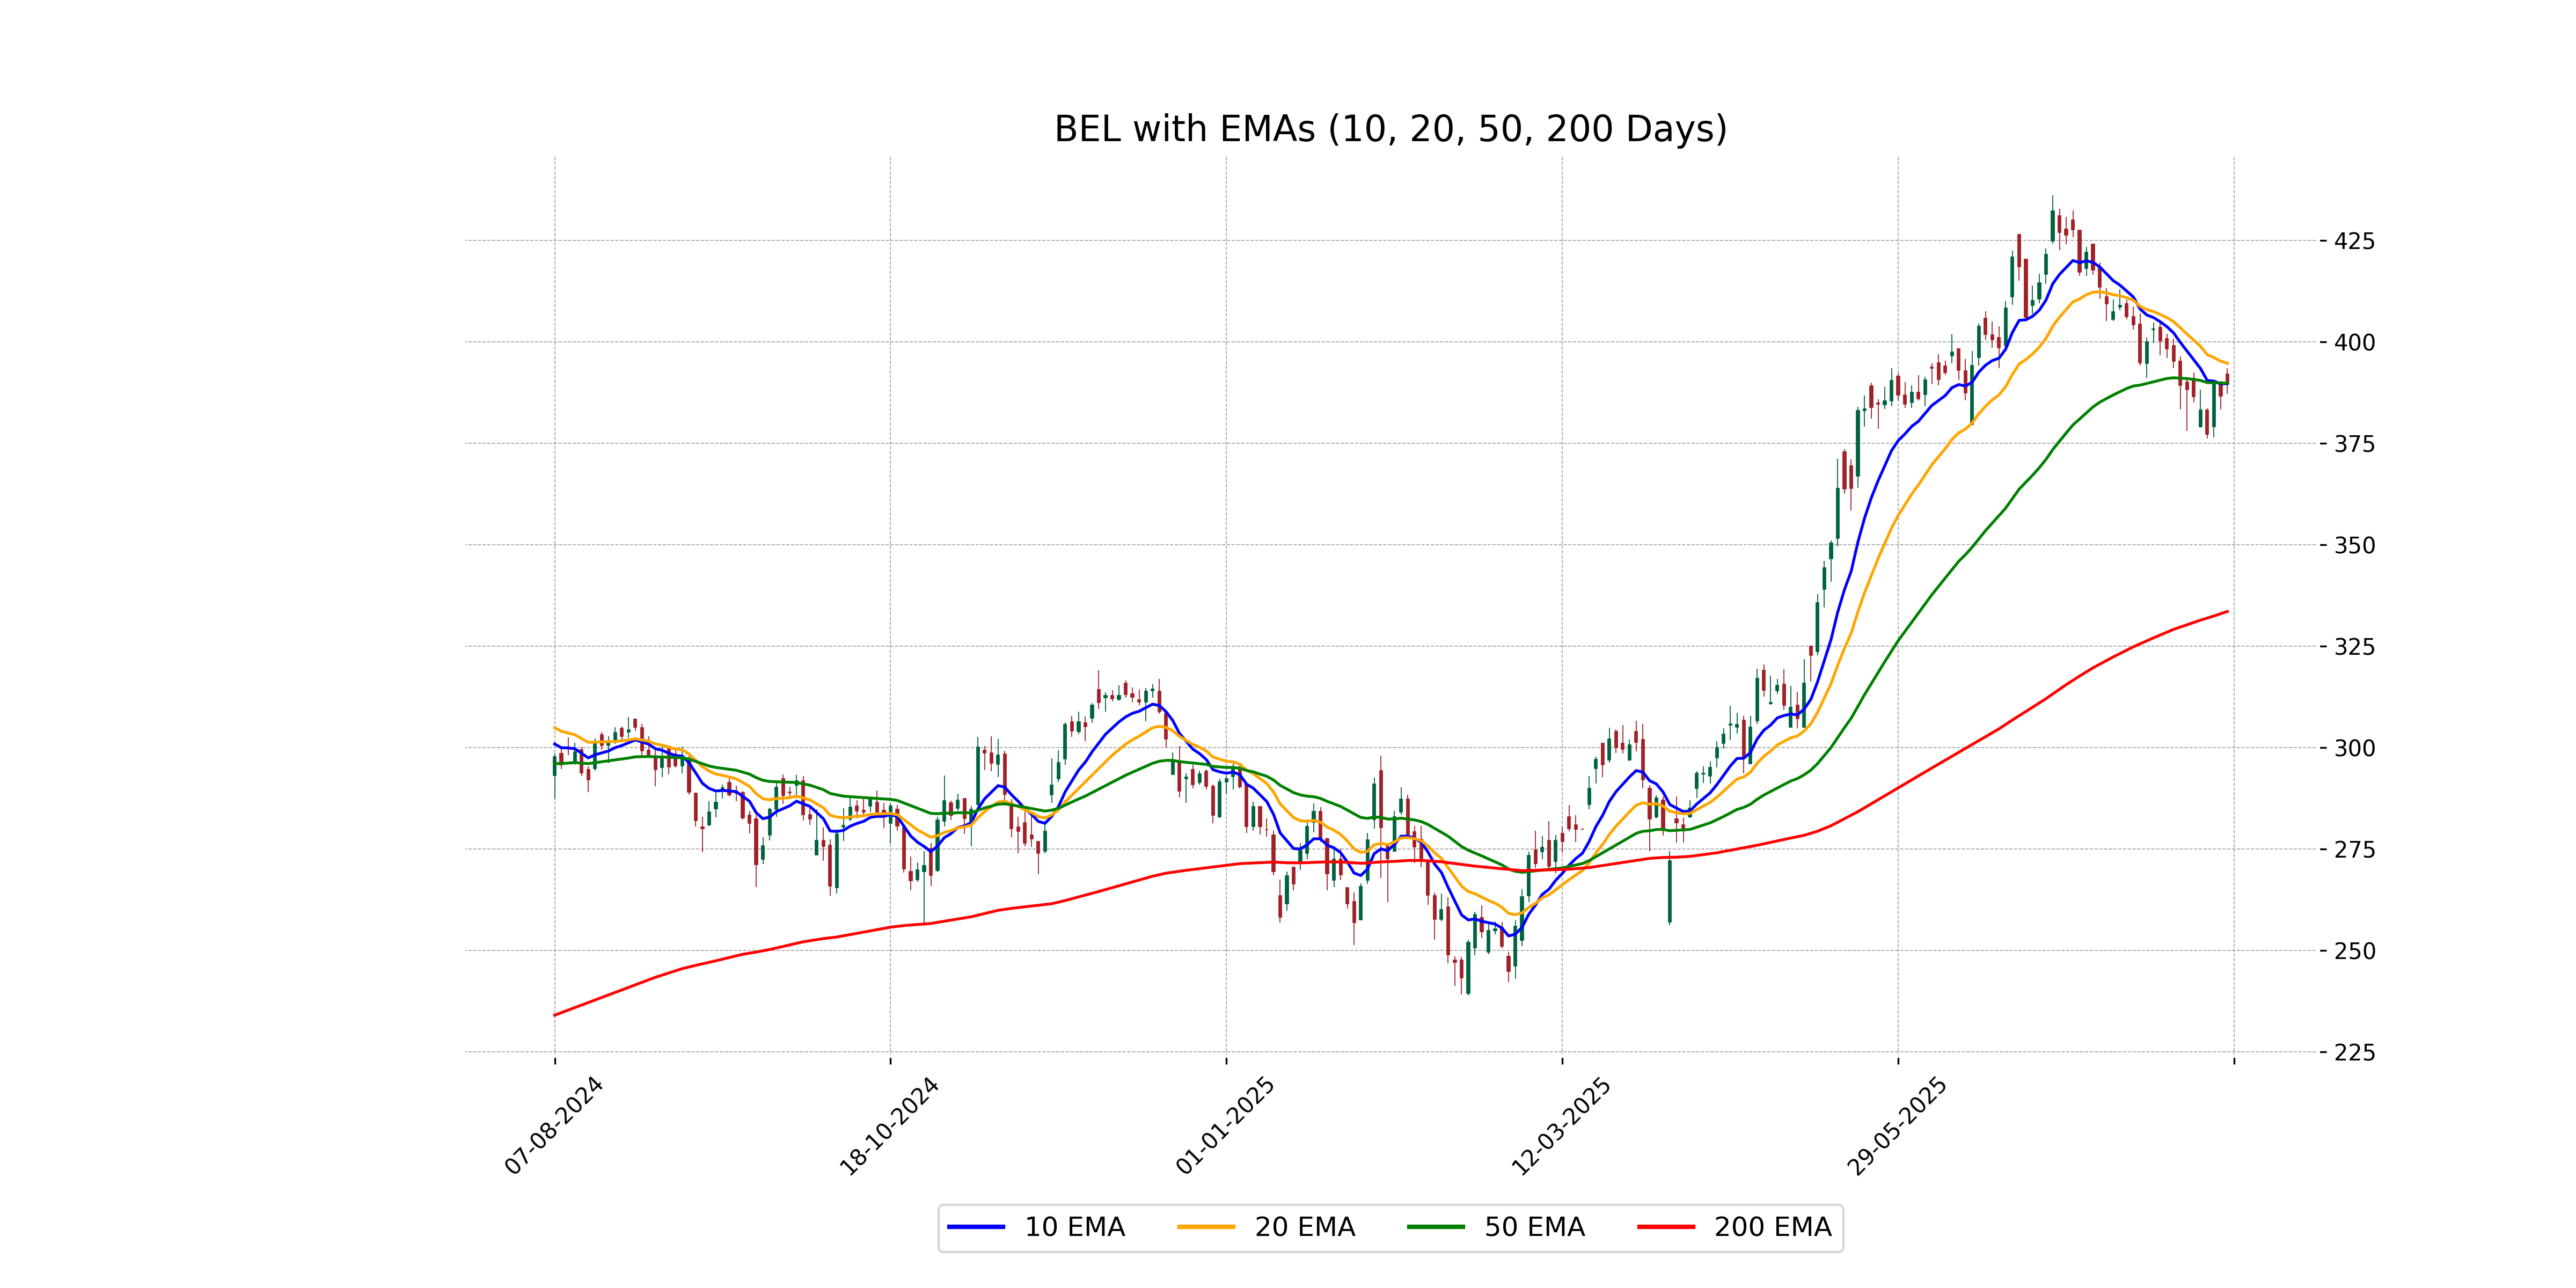
Bharat Electronics performance reflects a slight positive price movement, with a close of 389.70, indicating a 0.79% increase from the previous close. The stock's volume is substantial at 16,845,733 shares, and it operates in the Industrials sector, specifically the Aerospace & Defense industry in India. The EMA and RSI indicate short-term volatility, while the MACD suggests a bearish sentiment.
Relationship with Key Moving Averages
Bharat Electronics is trading below its 50 EMA, slightly below at 389.700 compared to a 50 EMA of 389.776. The stock is also trading well above its 200 EMA of 333.526, suggesting a longer-term uptrend while short-term moving averages indicate possible consolidation or downward pressure.
Moving Averages Trend (MACD)
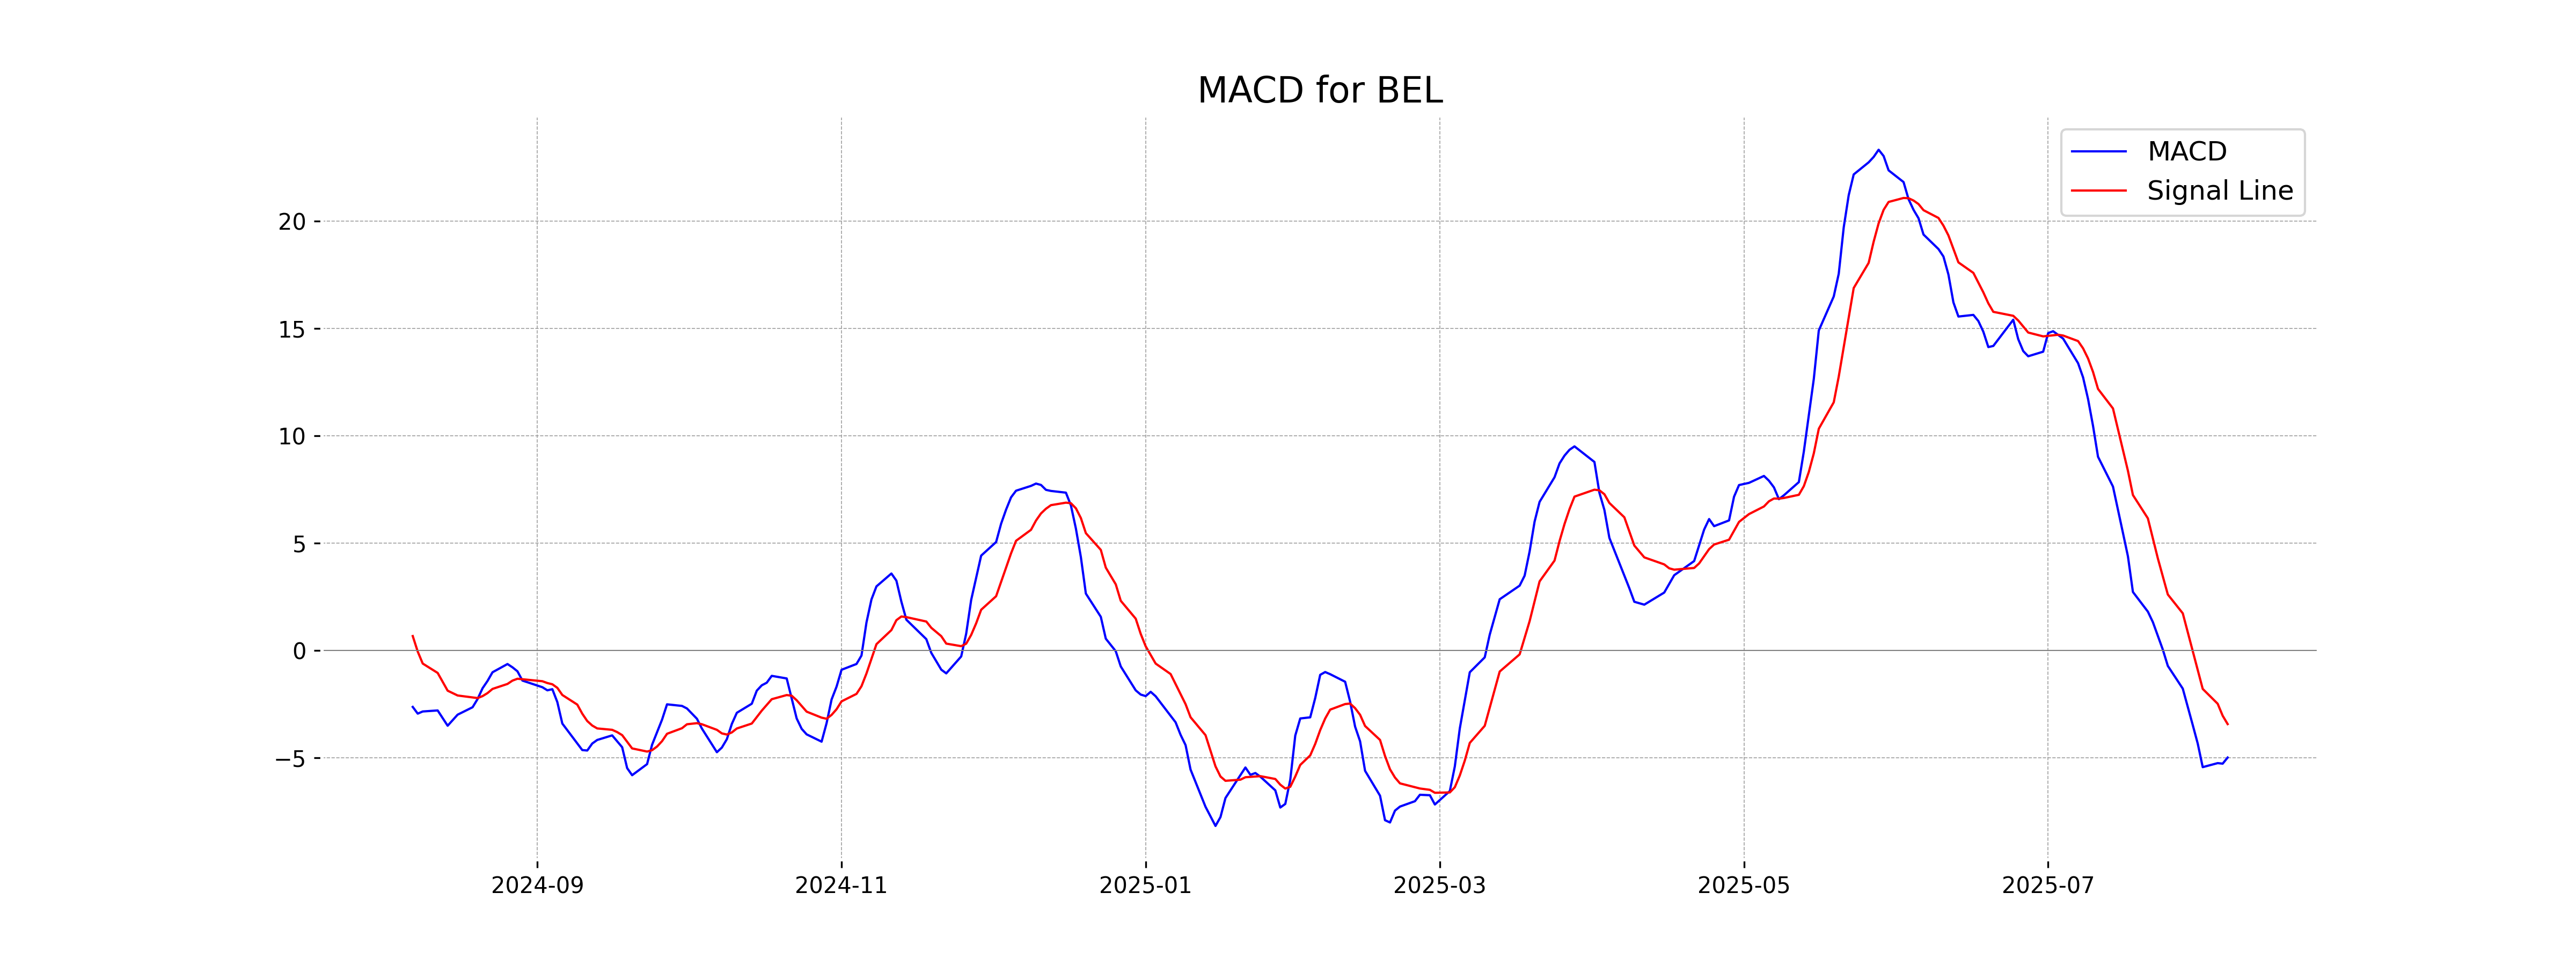
The MACD value for Bharat Electronics is -4.99, while the MACD Signal is -3.43, indicating bearish momentum. This suggests the stock may be experiencing downward pressure, as the MACD line is below the signal line.
RSI Analysis
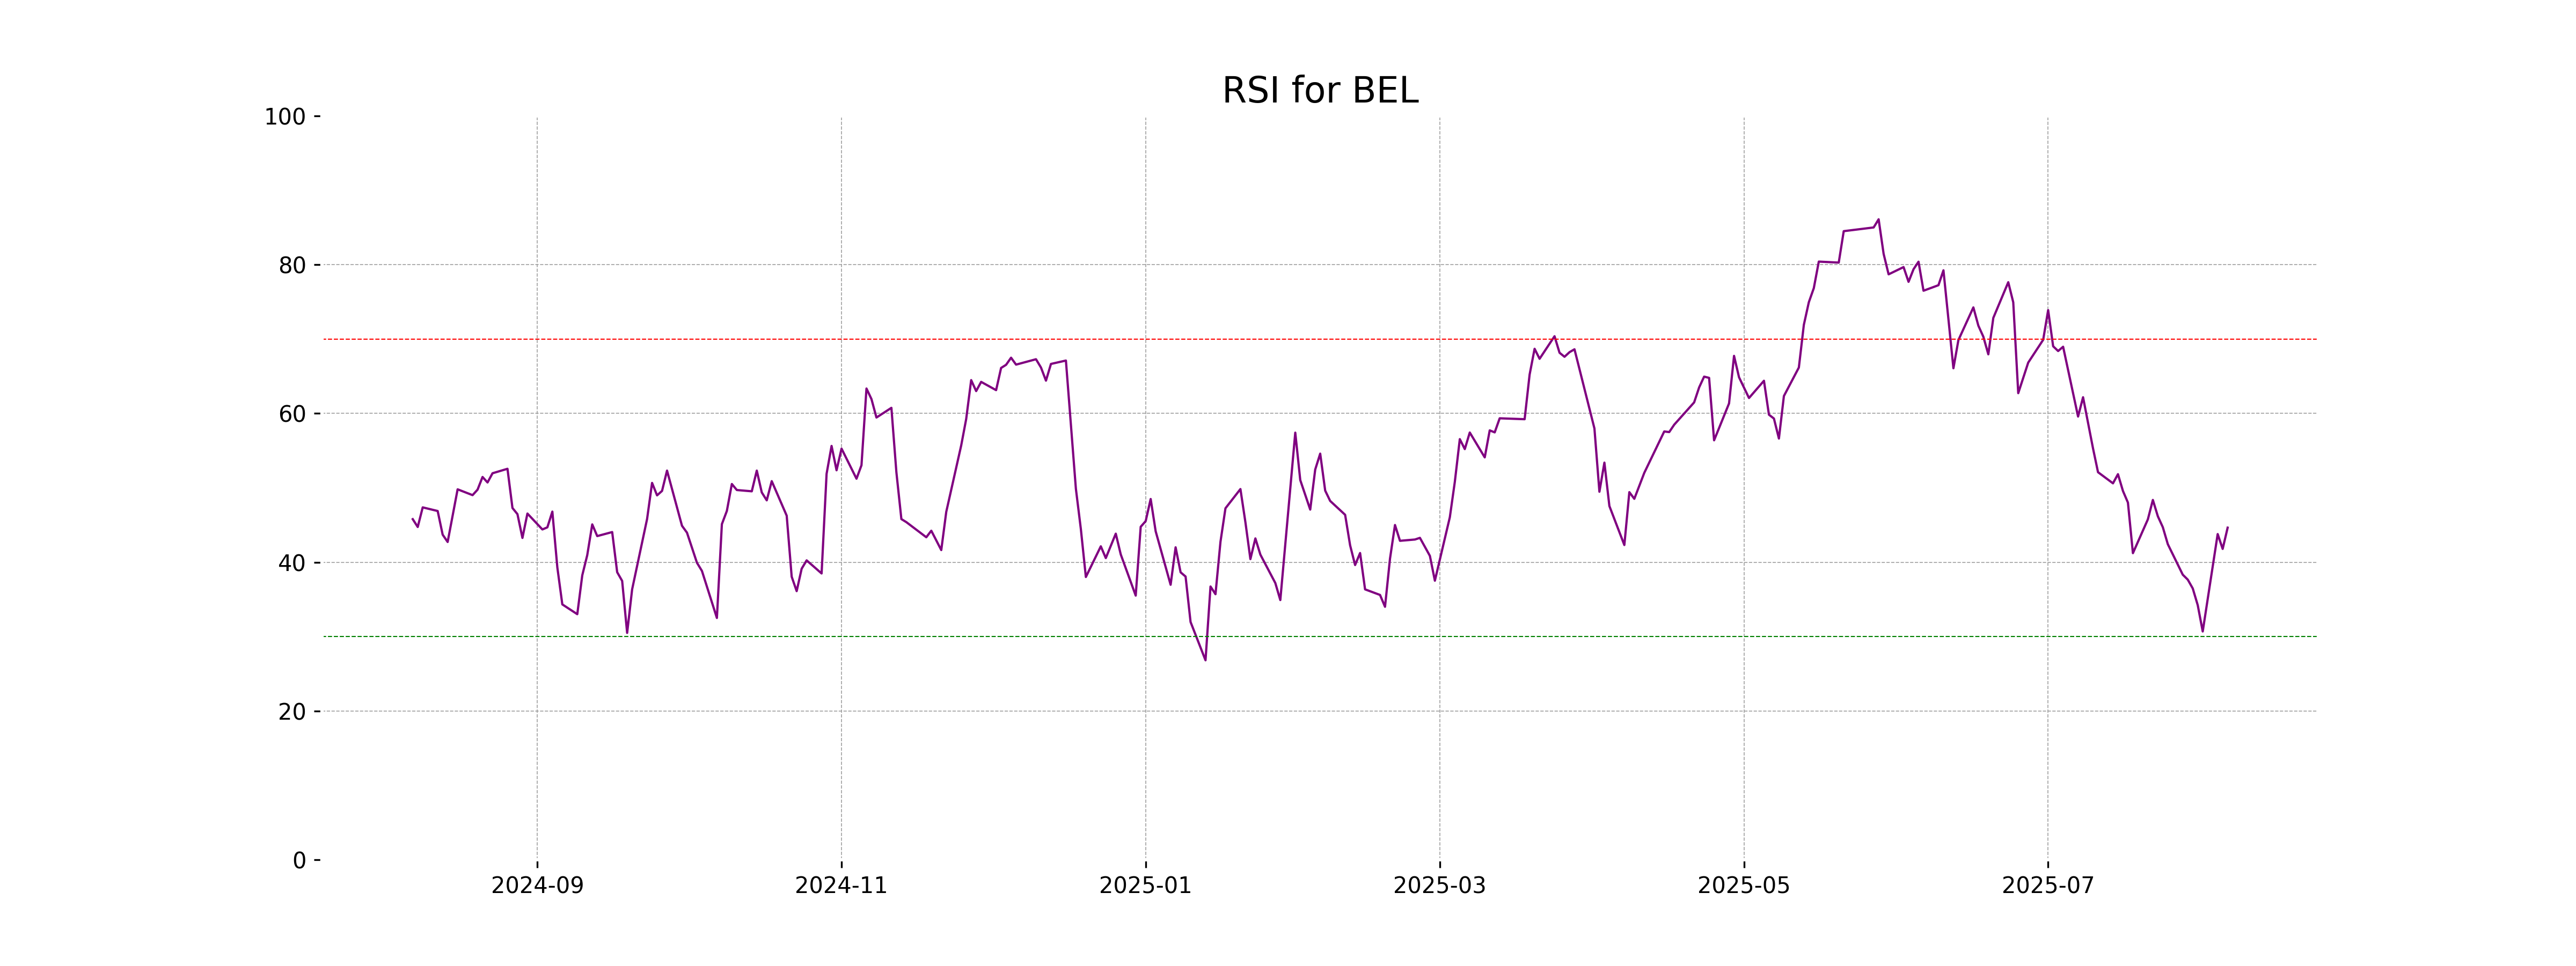
The RSI value for Bharat Electronics is approximately 44.65, indicating a neutral market condition as it is close to the midpoint of 50. This suggests that the stock is neither overbought nor oversold, implying balanced pressure from buyers and sellers.
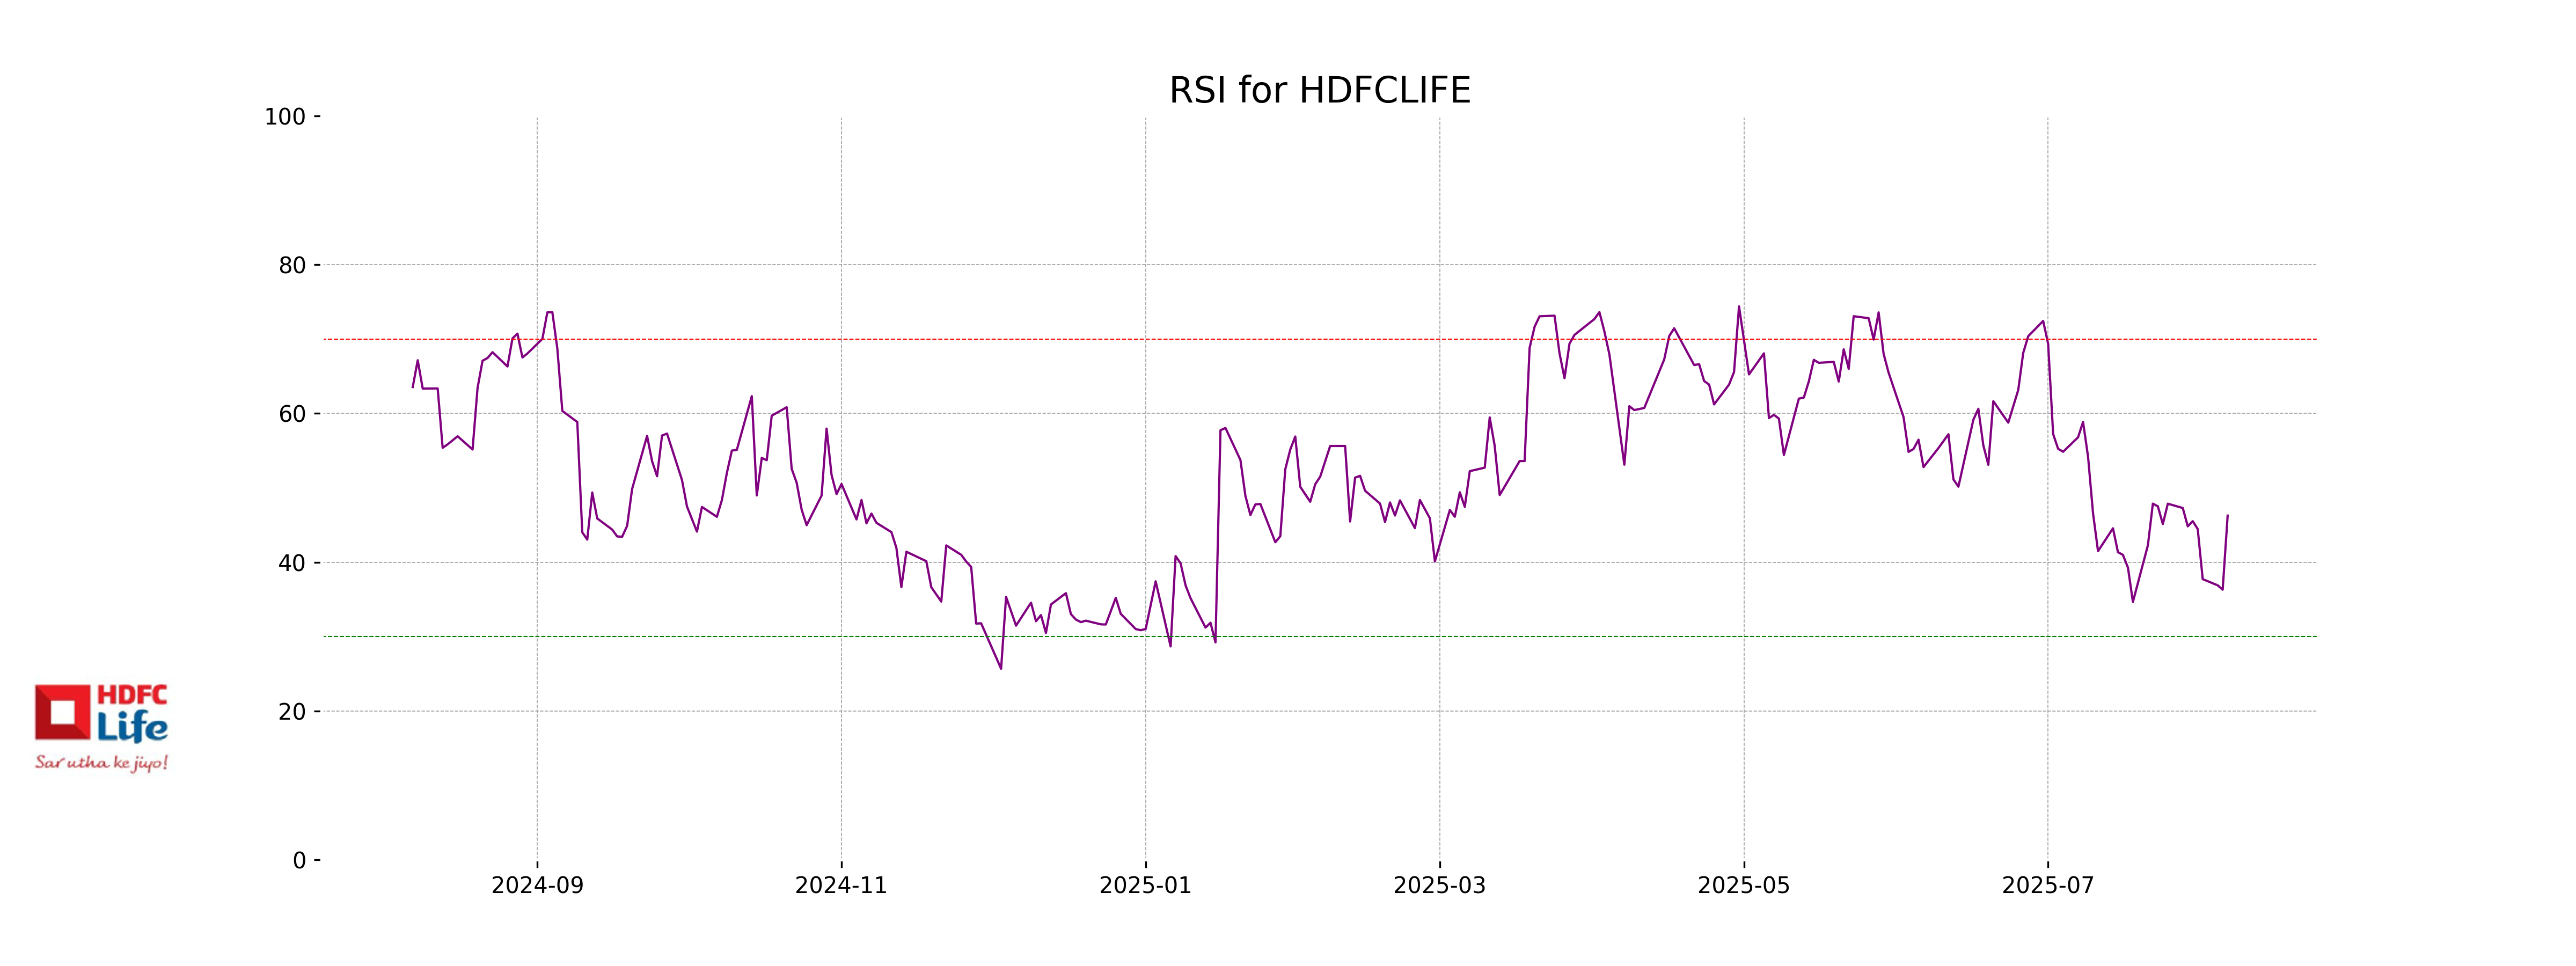
Analysis for HDFC LIFE - August 06, 2025

HDFC LIFE showed a positive performance with a closing price of 752.55, reflecting a 1.90% increase from the previous close of 738.5. The company's stock traded within a range of 734.10 to 755.00, supported by a daily trading volume of 1,797,821 shares. Despite the recent gain, the 50-day EMA of 756.74 indicates a slightly bearish trend compared to its 20-day EMA of 756.53 and 10-day EMA of 750.67, along with a below-average RSI of 46.26.
Relationship with Key Moving Averages
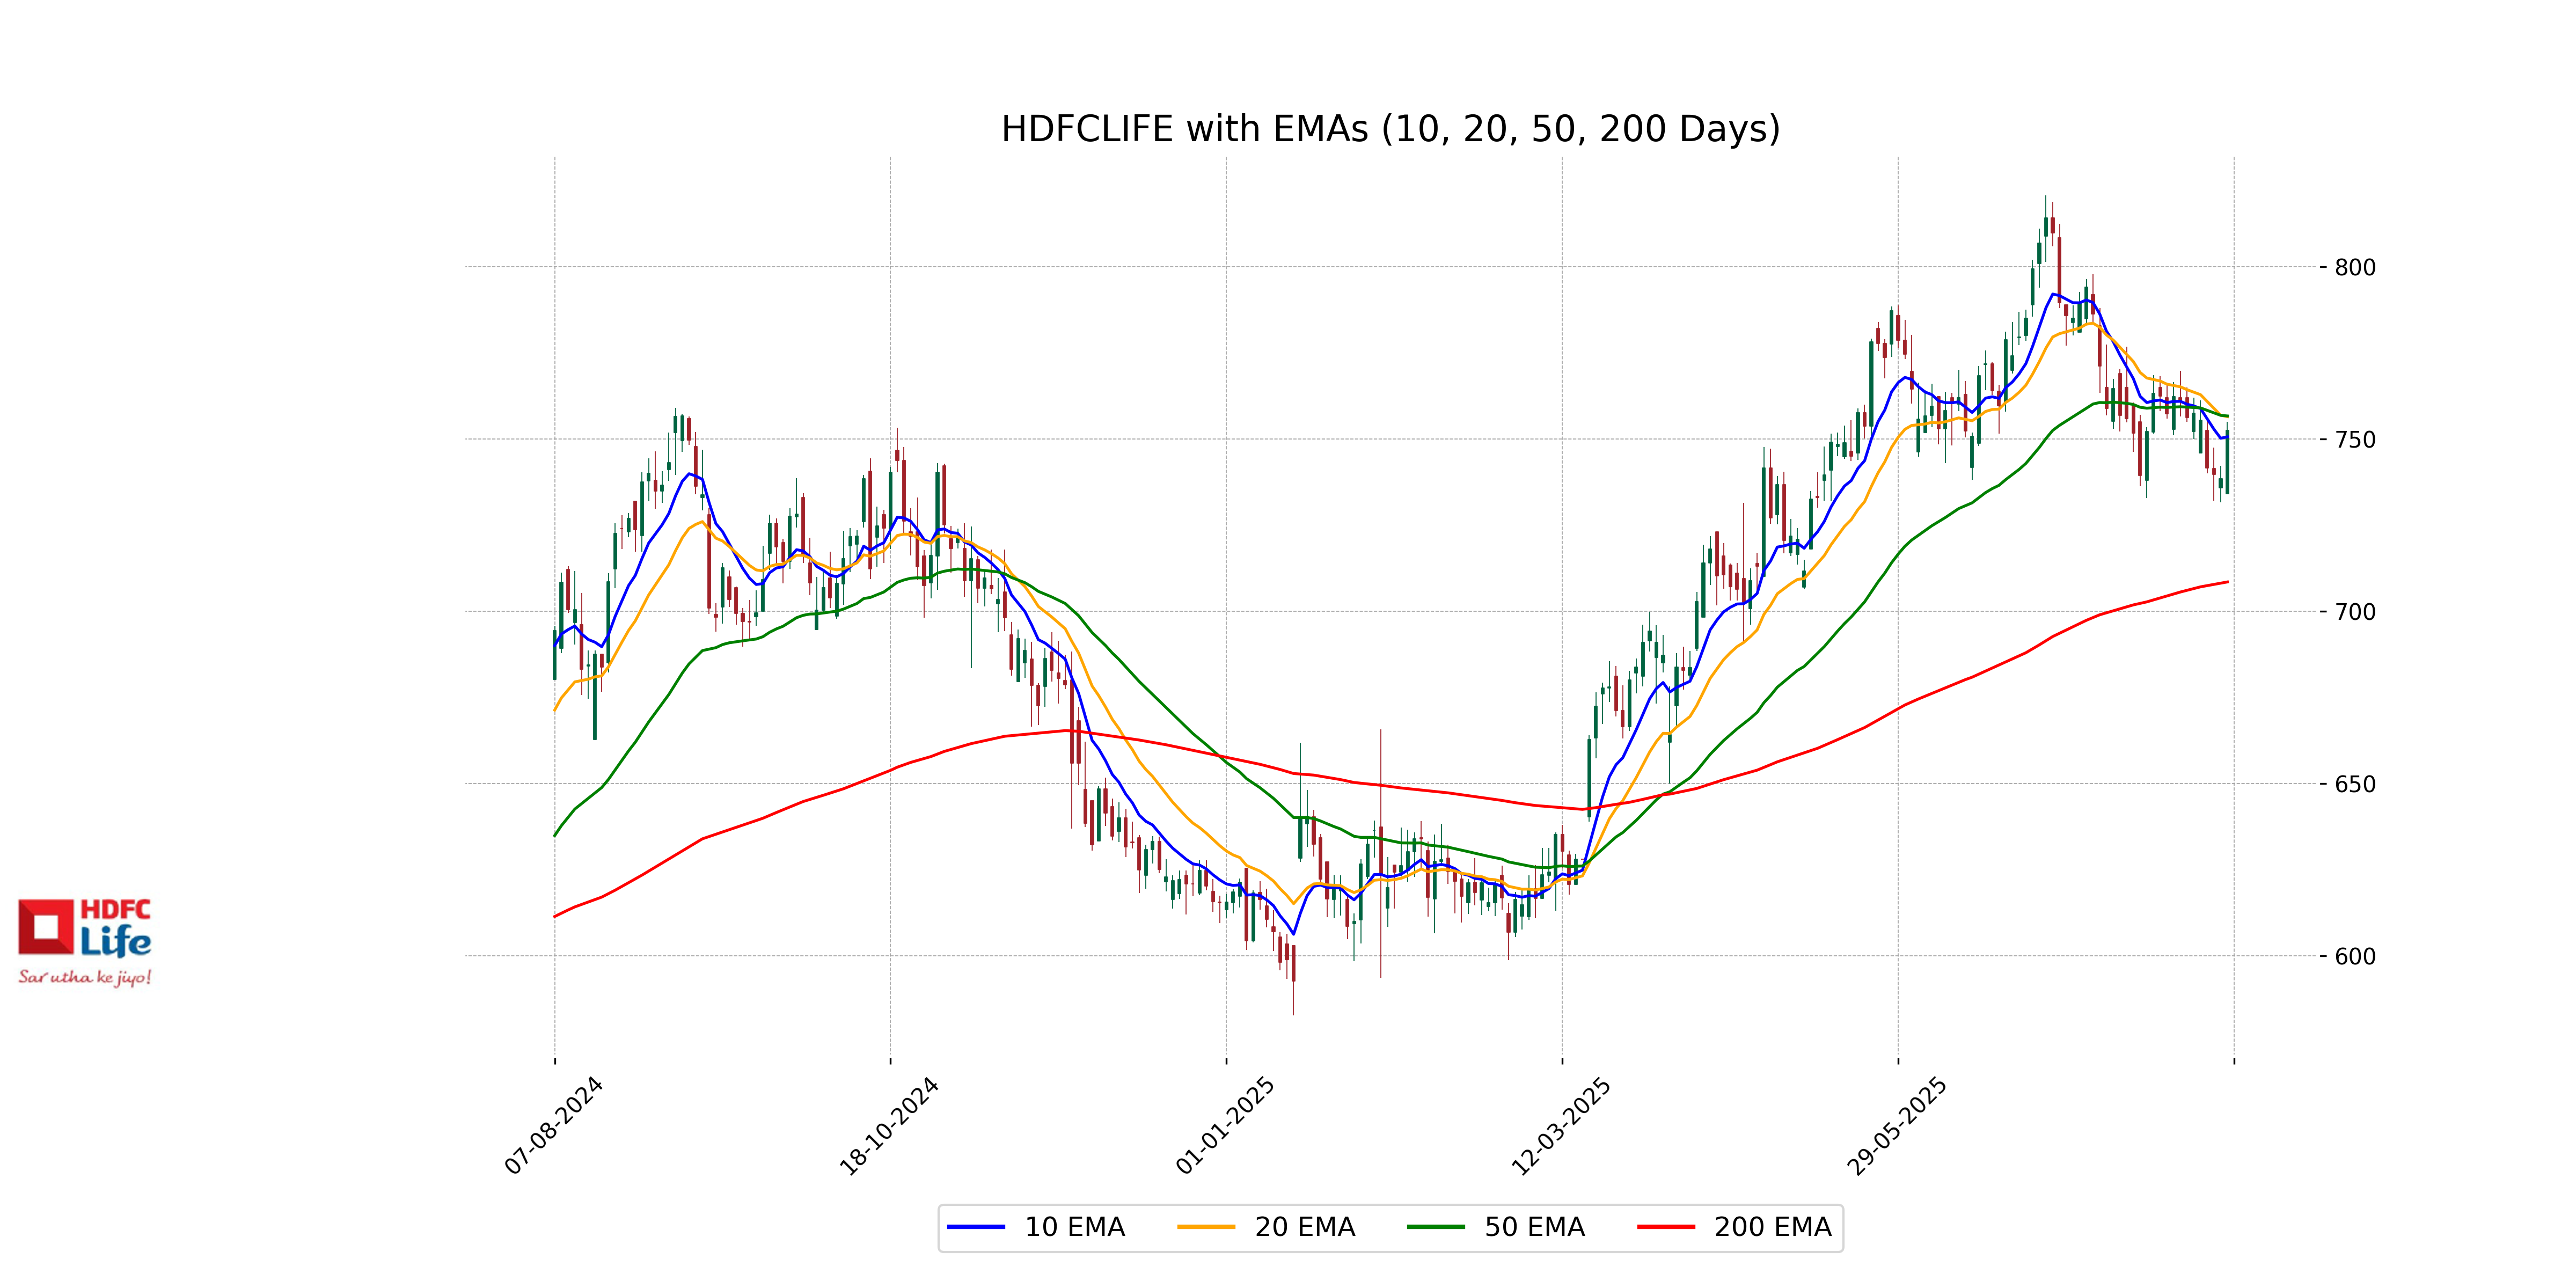
HDFC Life's closing price of 752.55 is below its 50 EMA of 756.74 and slightly below the 20 EMA of 756.53, indicating a potential bearish trend. However, it is above the 10 EMA of 750.67, suggesting short-term bullishness. The stock is well above the 200 EMA of 708.52, highlighting a strong overall position in the longer term.
Moving Averages Trend (MACD)
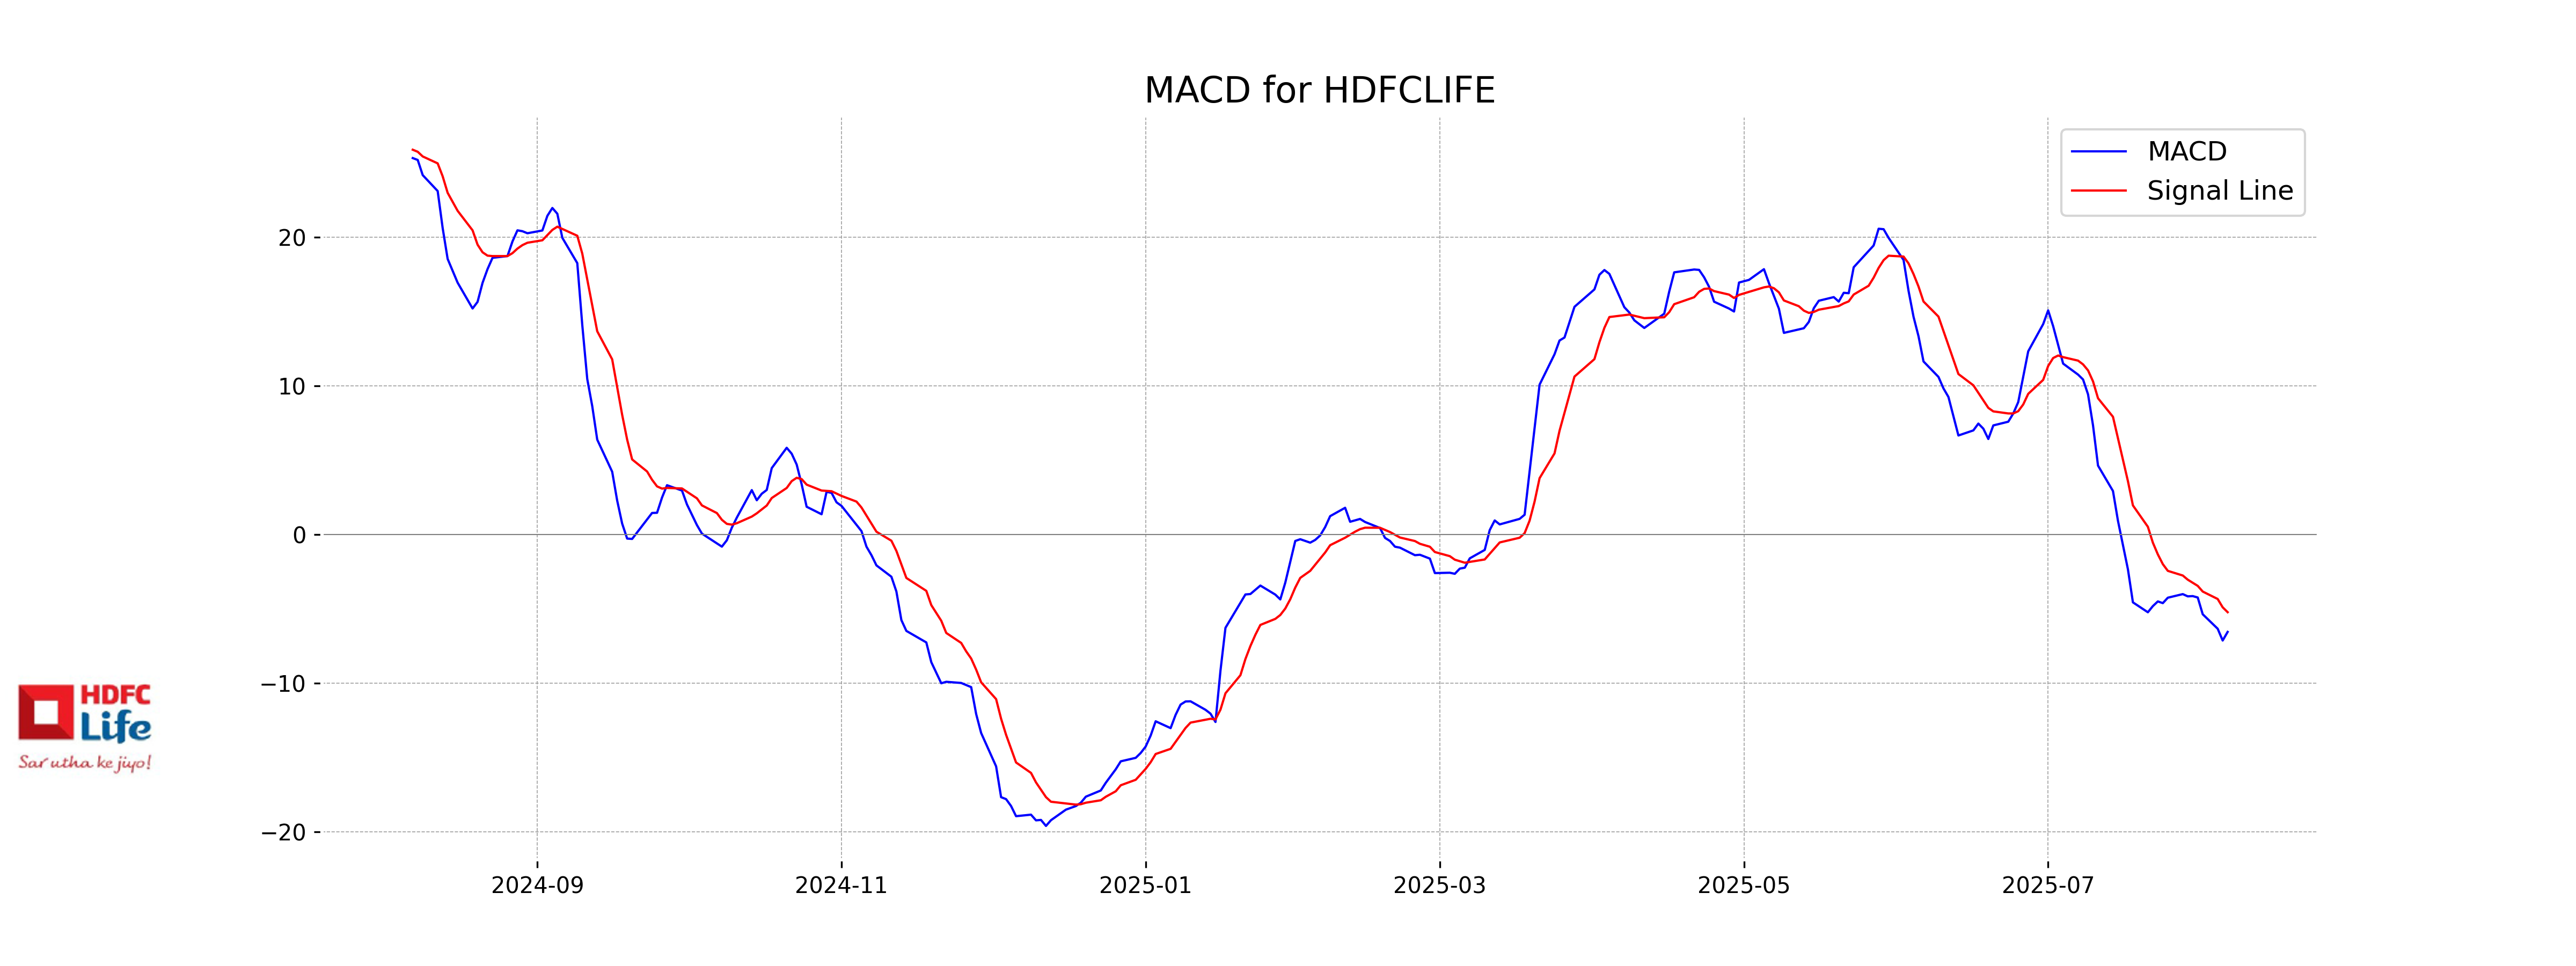
The current MACD for HDFC Life is -6.56, with a signal line of -5.23. This suggests a bearish sentiment, as the MACD line is below the signal line, indicating potential downward momentum in the stock.
RSI Analysis
RSI Analysis for HDFC Life: The RSI of 46.26 indicates that the stock is currently in a neutral zone, not in overbought or oversold territory. This suggests a balance between buying and selling pressures.
Analysis for SBI Life - August 06, 2025

SBI Life Insurance exhibited a marginal decline in its stock price with a closing value of 1854.3, showing a small decrease of approximately -0.15% from the previous close. The trading volume stood at 816,407 shares. The stock's performance indicators reveal it is trading above its 50 and 200-day EMAs, indicating a positive long-term trend, while maintaining a healthy RSI of 56.95, suggesting balanced buying and selling pressure.
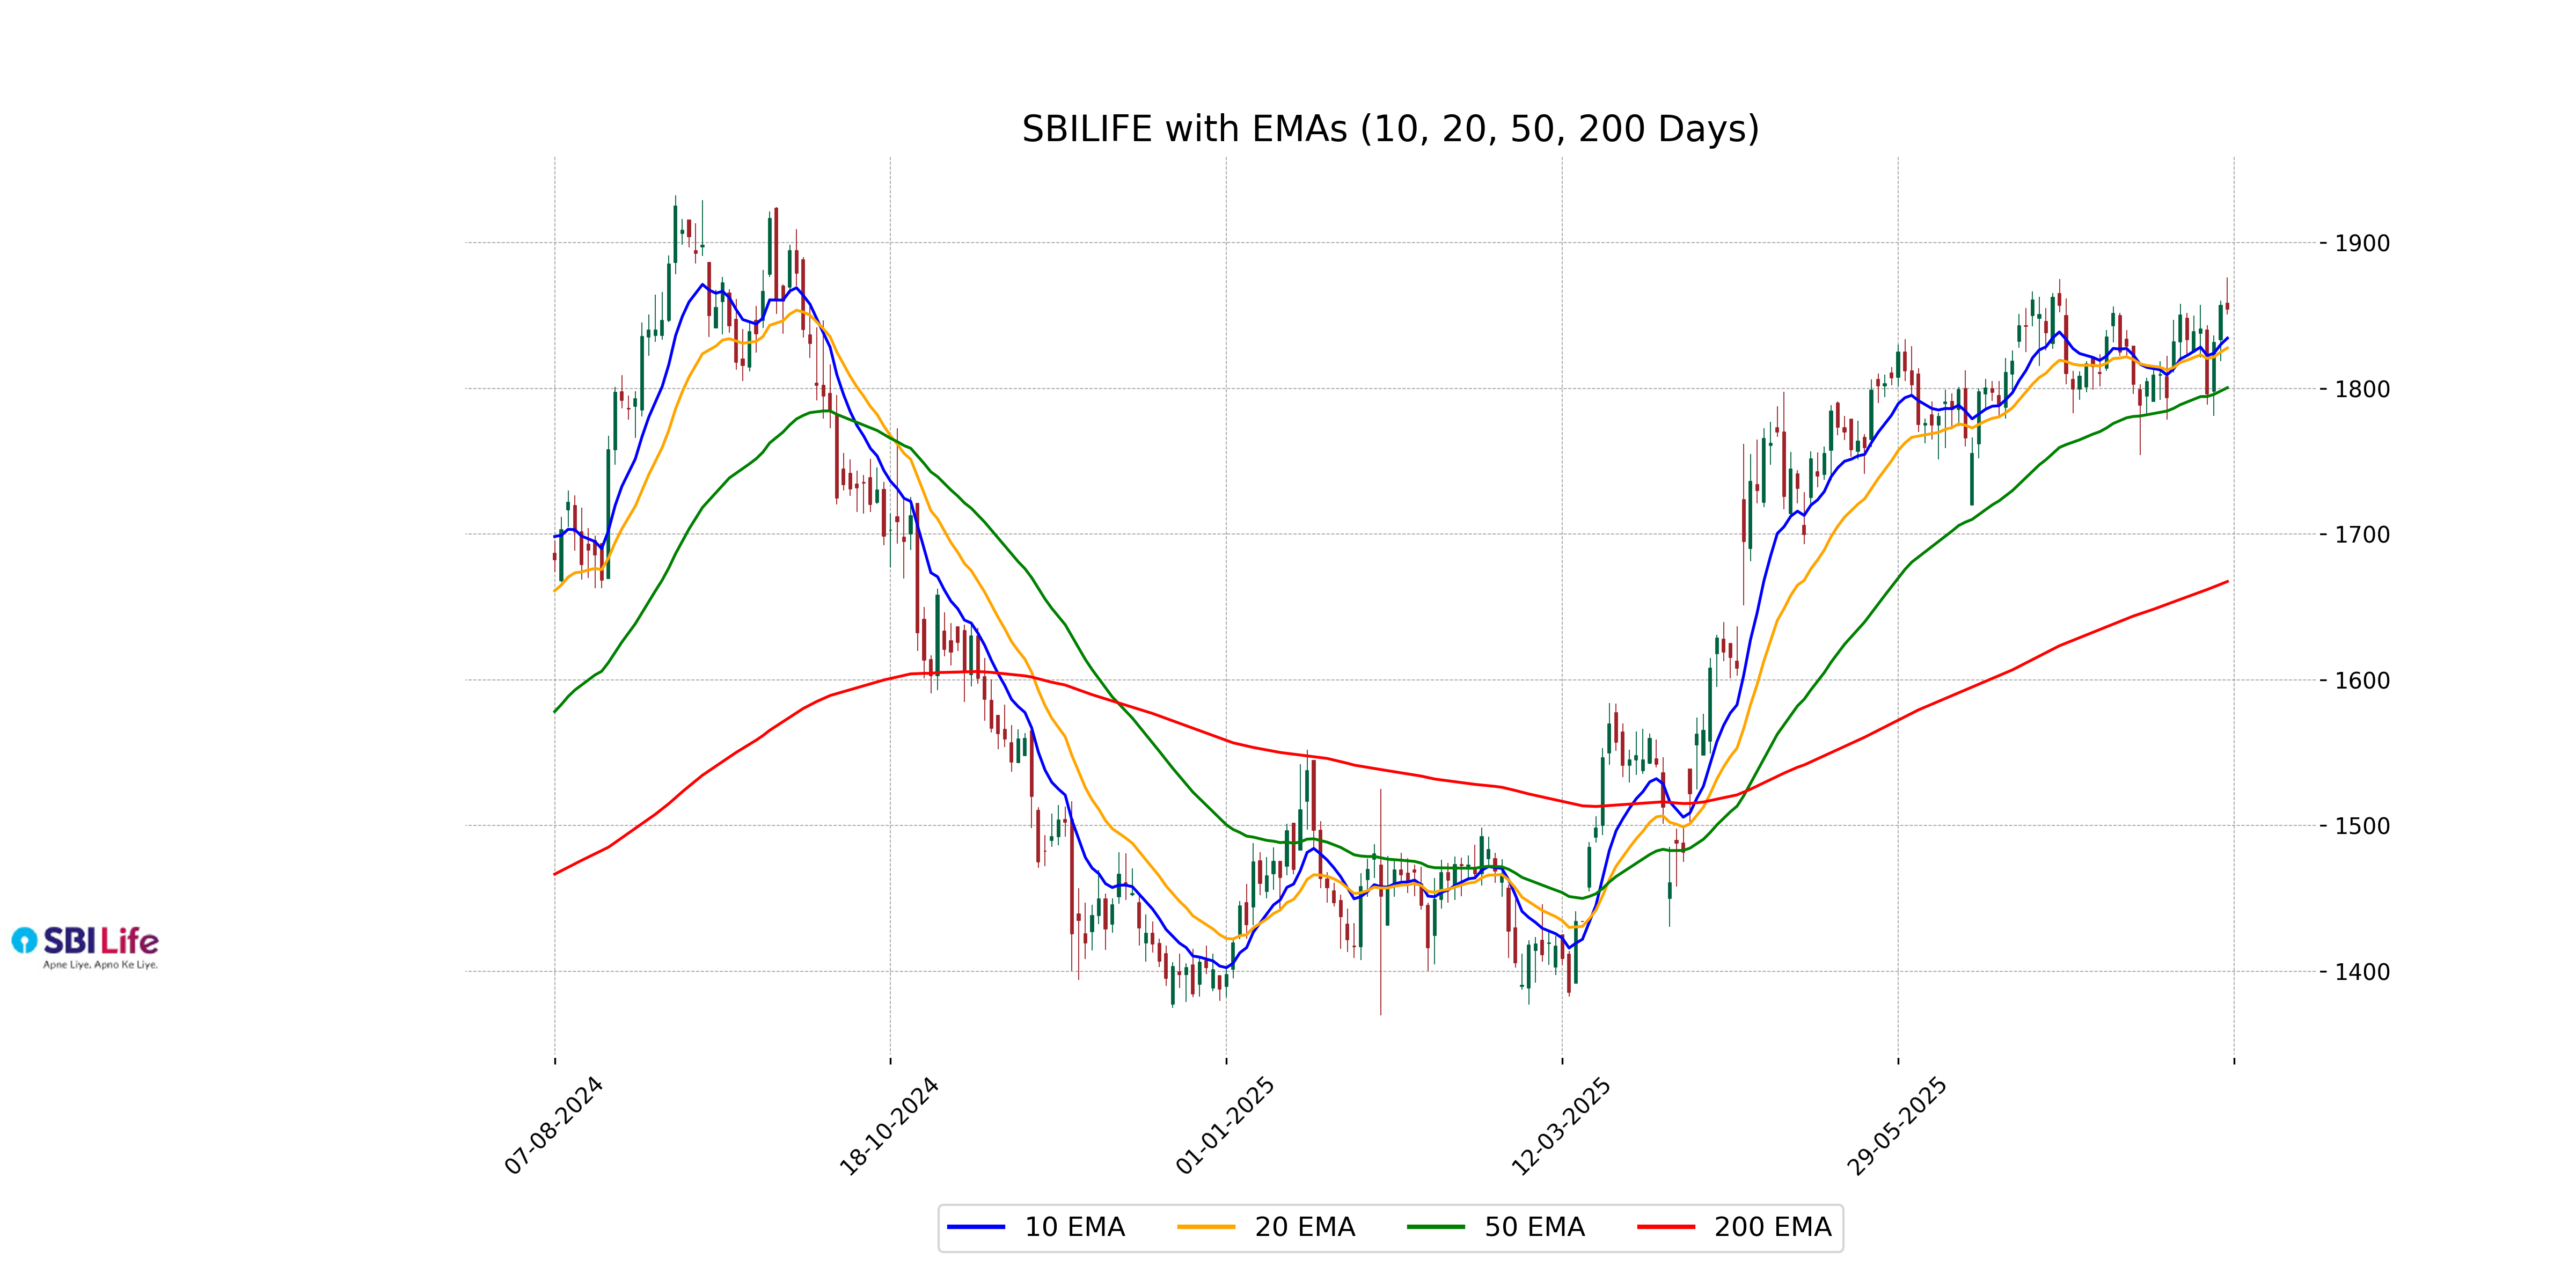
Relationship with Key Moving Averages
SBI Life's current closing price of 1854.30 is above both its 50-day EMA of 1800.49 and 200-day EMA of 1667.52, indicating a bullish trend over both medium and long-term periods. Additionally, the price is slightly above the 10-day EMA of 1834.50 and the 20-day EMA of 1827.73, suggesting a stronger short-term uptrend.
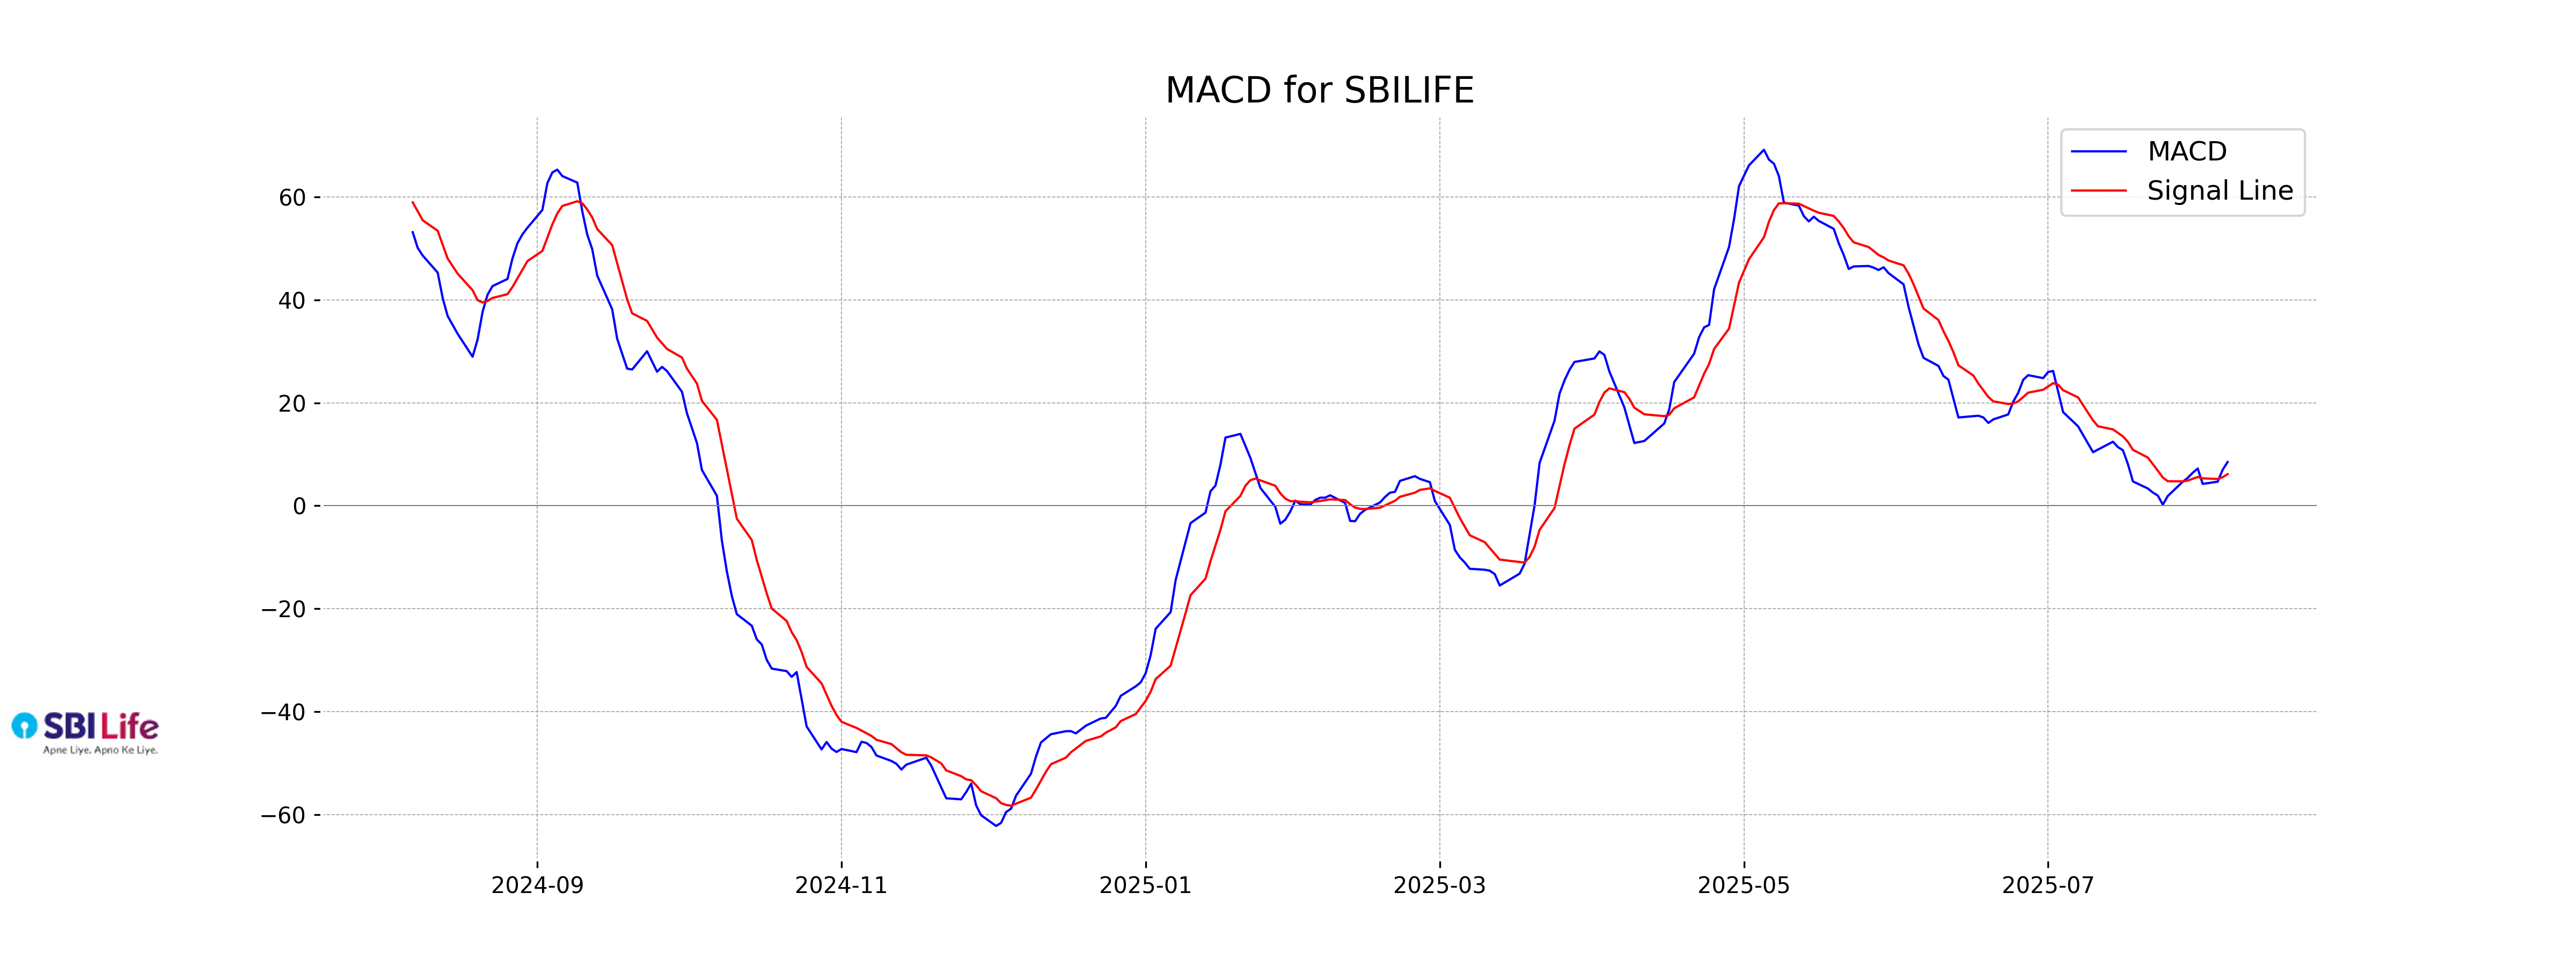
Moving Averages Trend (MACD)
MACD Analysis for SBI Life: The MACD value is 8.51, which is above the MACD signal line at 6.15, suggesting a bullish momentum. This indicates potential upward movement in the stock price if current conditions persist.
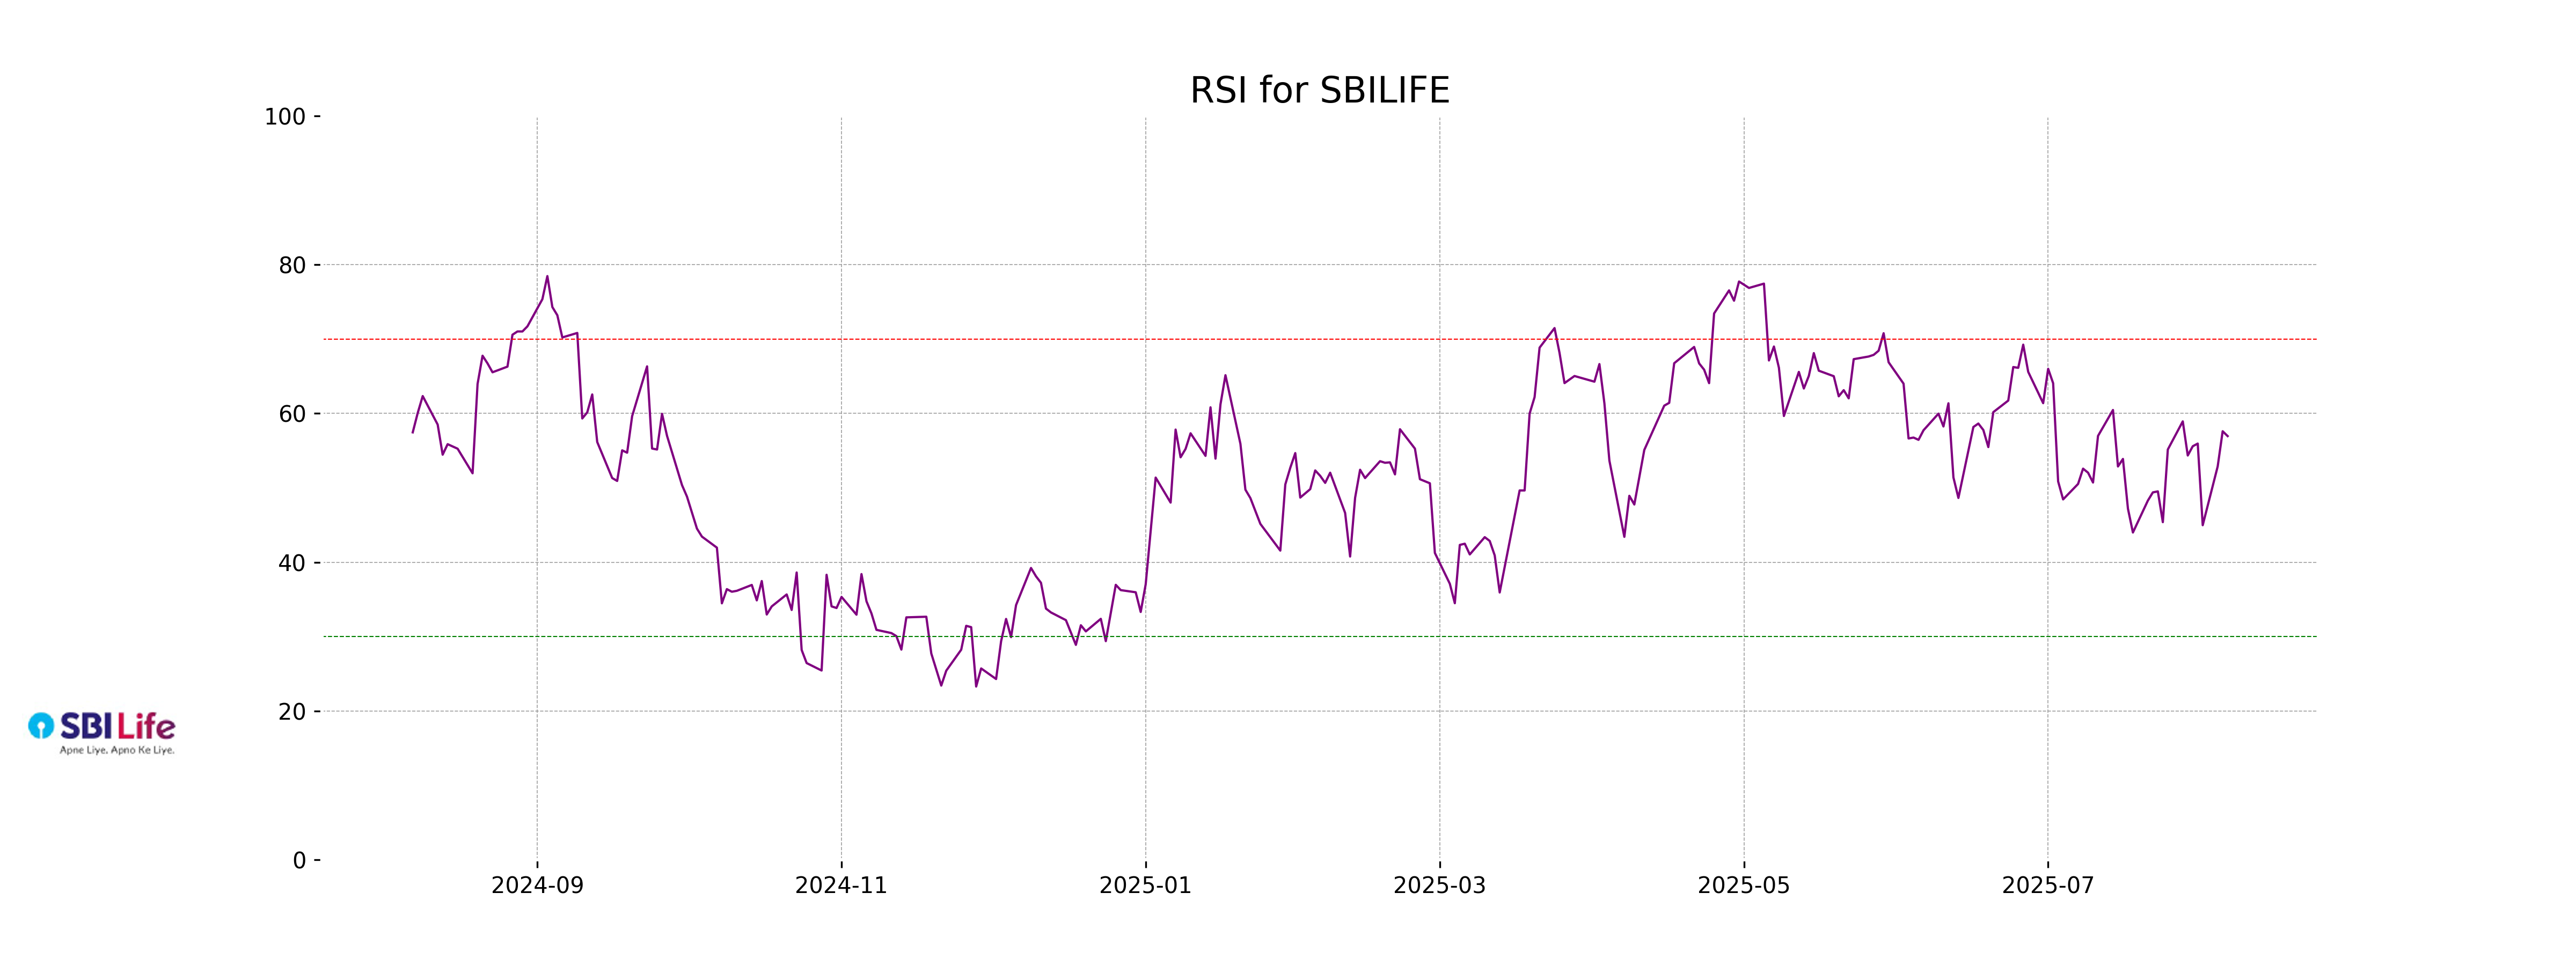
RSI Analysis
The current RSI for SBI Life is approximately 56.95, indicating a neutral market sentiment. An RSI around 50 suggests that the stock is neither overbought nor oversold, implying potential stability or consolidation in the near term.