Top 5 Nifty 50 gainers today – April 29, 2025: Biggest stock moves
In this article, we will explore the technical indicators of some of the high-performing stocks on the Indian stock market, including BEL, RELIANCE, TECHM, and TRENT.
By looking at these stocks through the lens of key technical factors, we aim to better understand their price movements, trends, and potential future performance.

Analysis for Bharat Electronics - April 29, 2025

Performance of Bharat Electronics: Bharat Electronics experienced a positive trading session with a closing price of 317.10, reflecting a 3.95% increase from its previous close. The stock is trading above its short, medium, and long-term EMAs, indicating a bullish trend. With an RSI of 67.74, it is approaching overbought territory. The company's market cap stands at 2,317,931,249,664, and it operates within the Aerospace & Defense industry in India.

Relationship with Key Moving Averages
Bharat Electronics is currently trading above its key moving averages of 10, 20, 50, and 200-day EMAs, indicating a bullish trend. With a closing price of 317.10, it is above the 10 EMA (302.09), 20 EMA (296.13), 50 EMA (287.25), and 200 EMA (275.51).
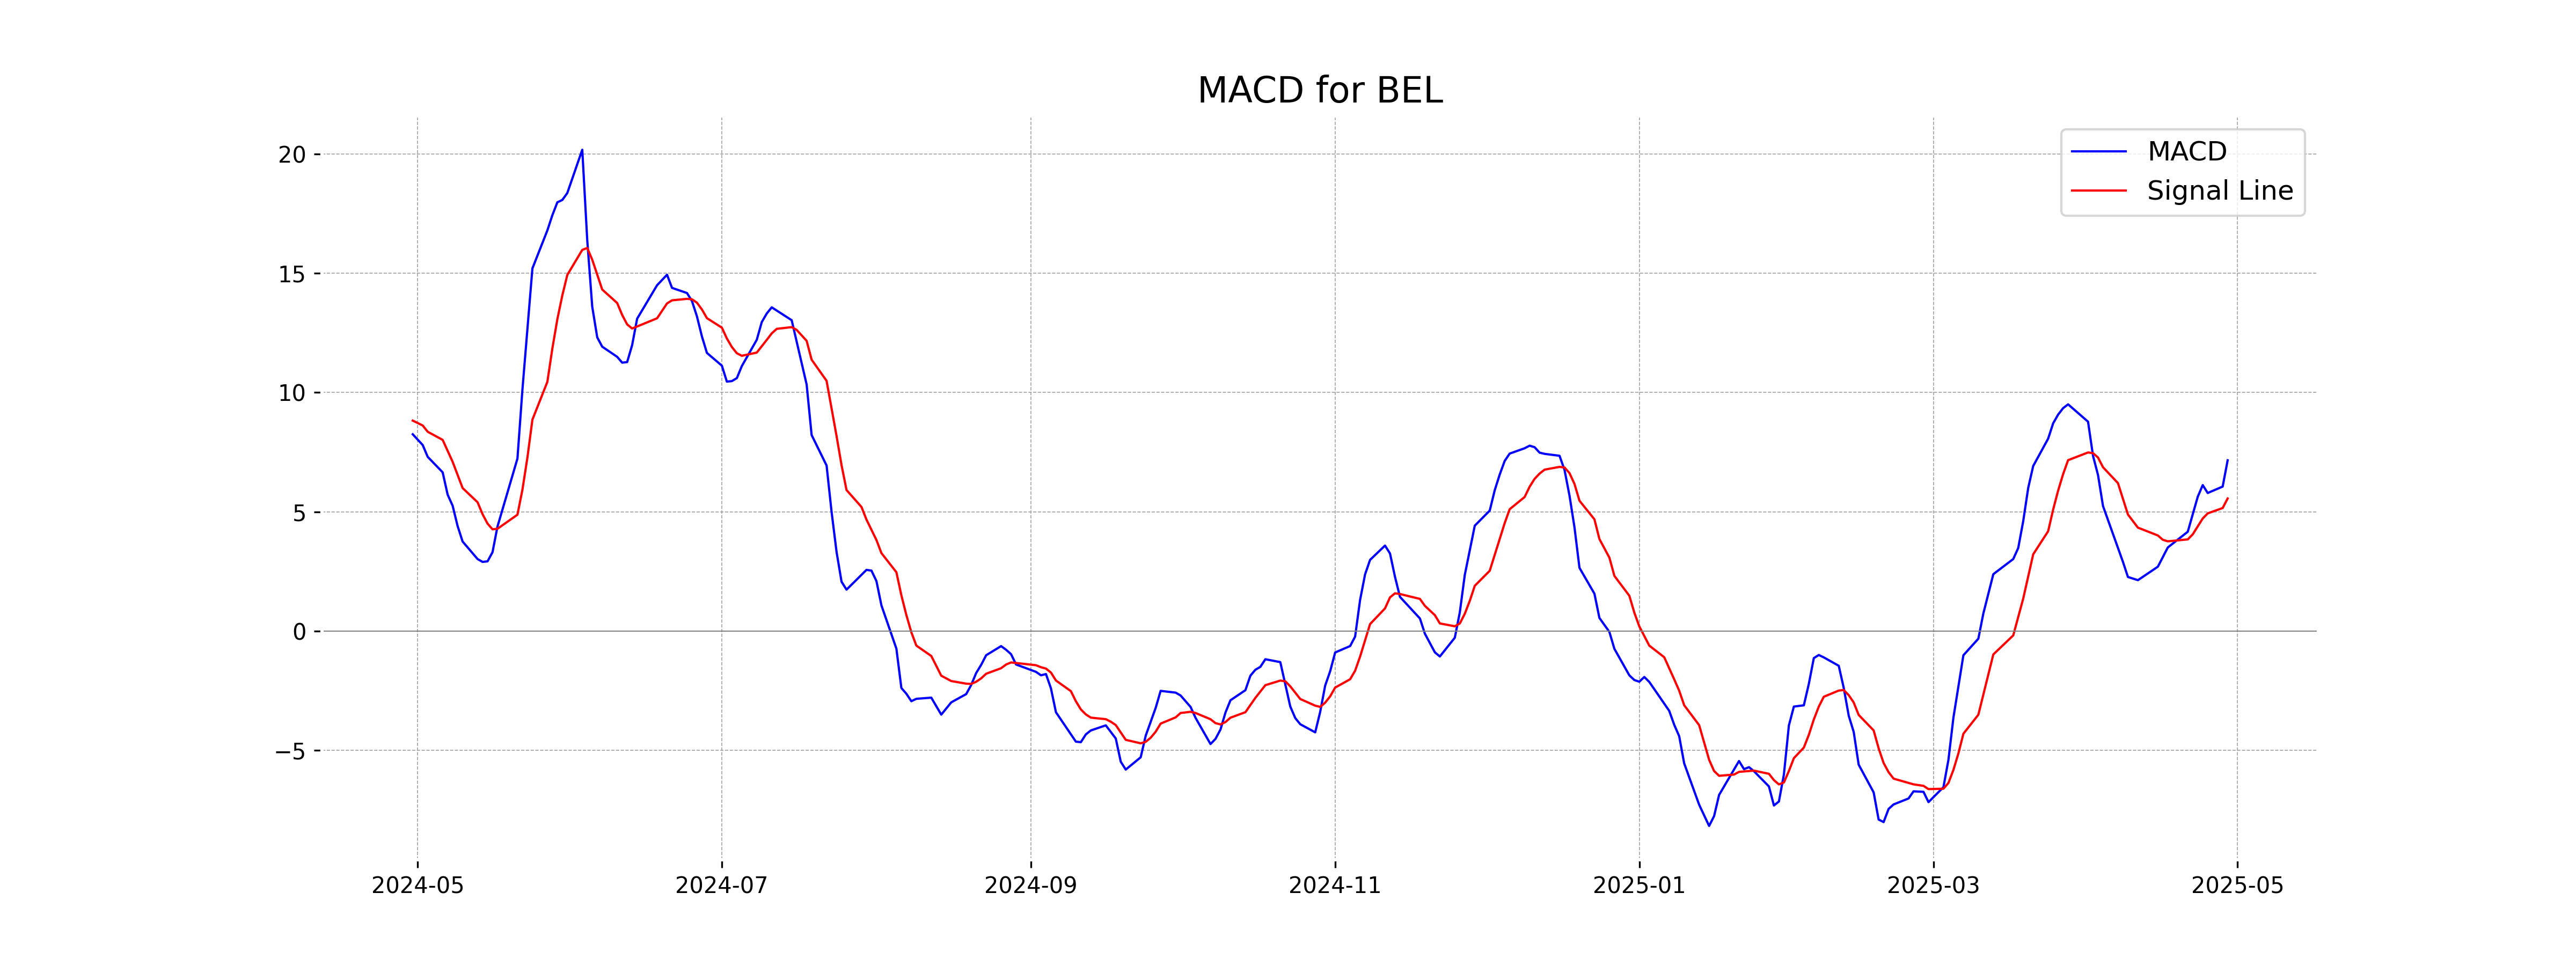
Moving Averages Trend (MACD)
Bharat Electronics exhibits a positive MACD value of 7.16, which is above the MACD Signal of 5.56, indicating a bullish momentum. This suggests that the stock could continue its upward trend if the momentum is sustained.
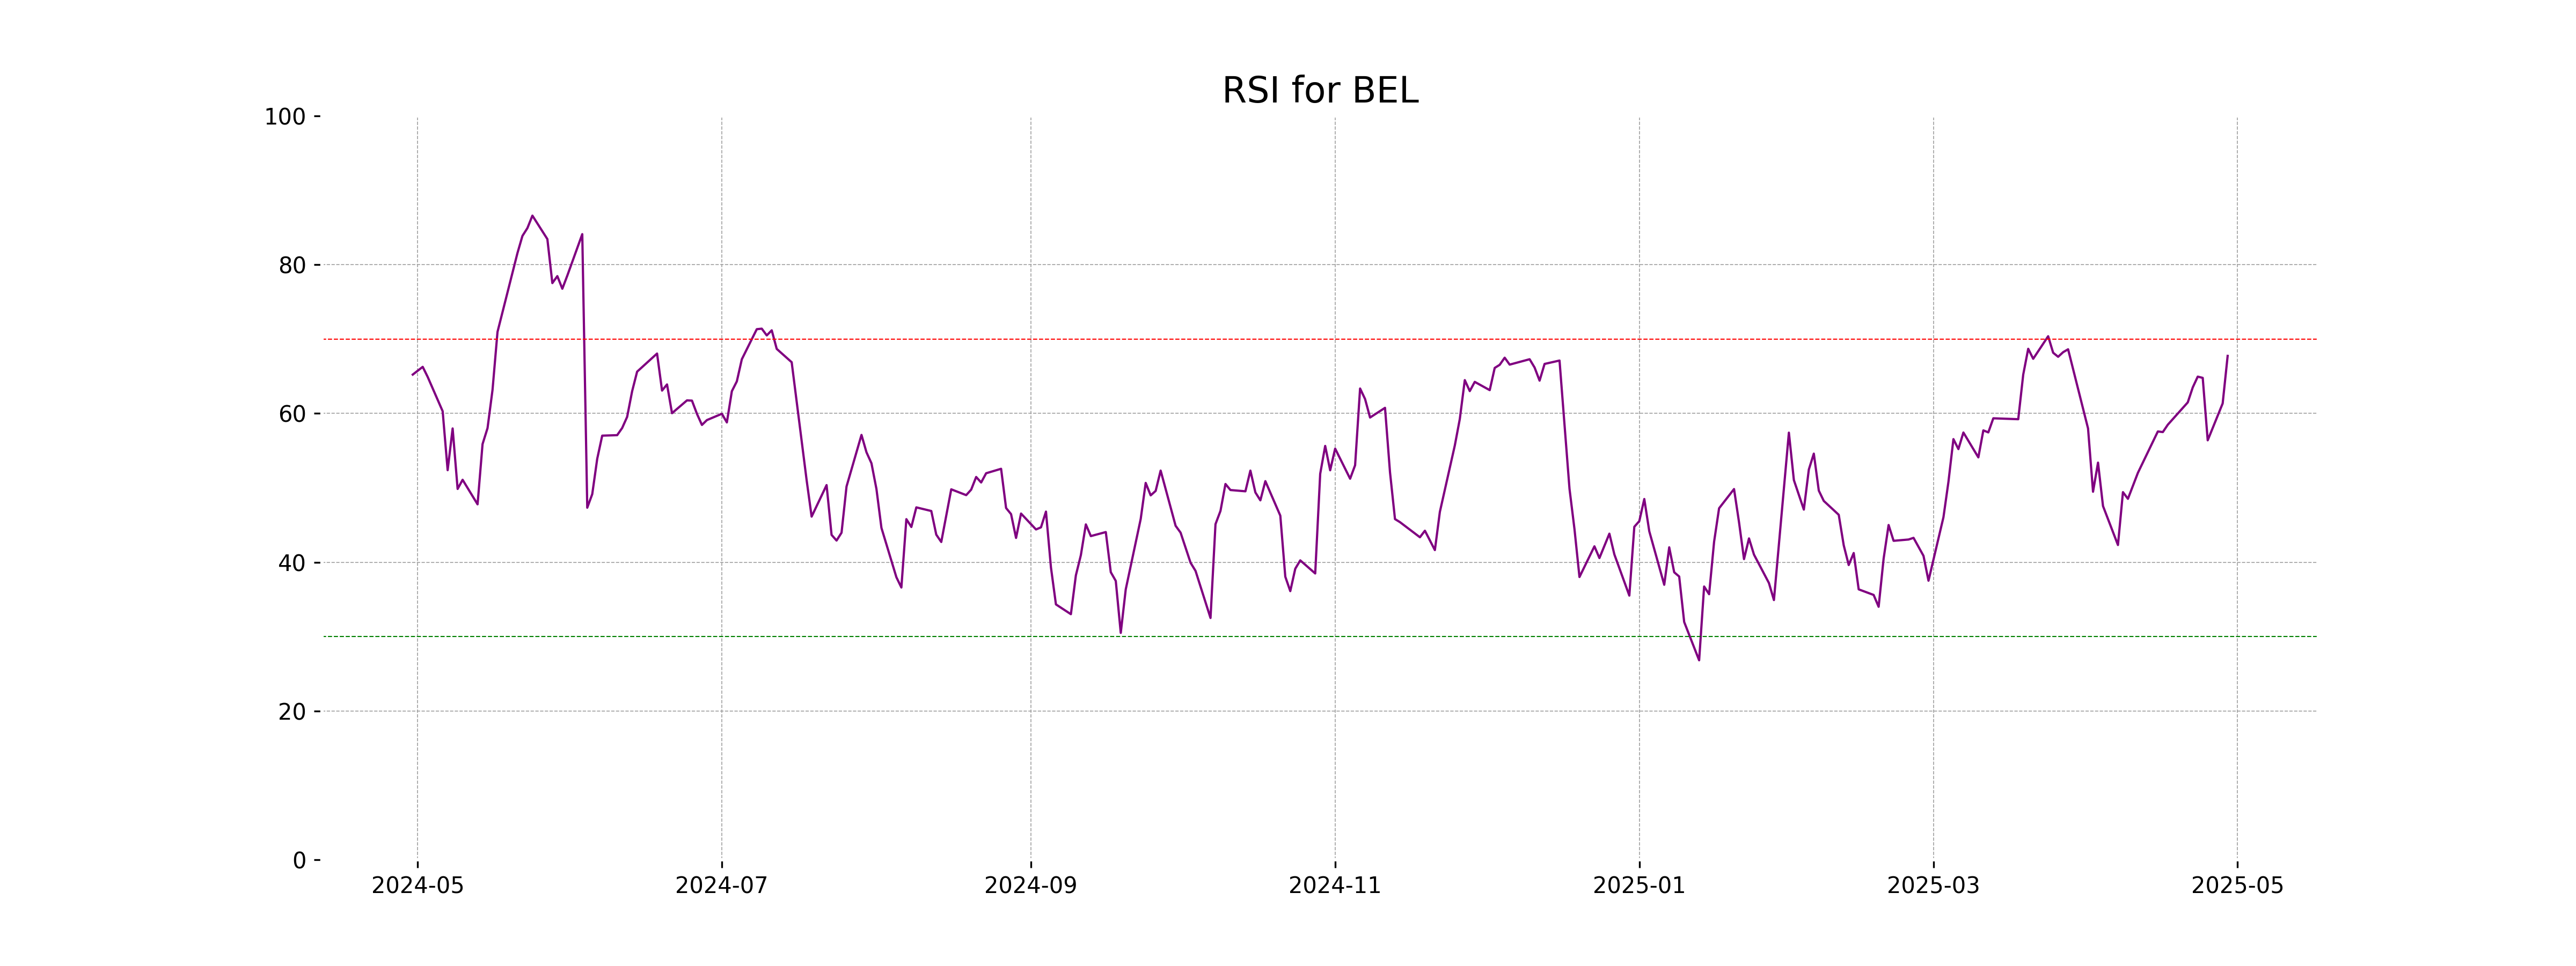
RSI Analysis
The RSI value for Bharat Electronics is 67.74, indicating that the stock is approaching overbought territory. Generally, an RSI above 70 suggests that the stock might be overbought, while a value below 30 indicates it might be oversold. Therefore, investors should closely monitor the stock's movement.
Analysis for Reliance - April 29, 2025

Reliance Performance Summary: Reliance, a major player in the Oil & Gas Refining & Marketing industry in India, showed a notable stock performance with a significant increase in its closing price of 2.26% to 1399.70, compared to its previous close. This performance is supported by strong market indicators like a high RSI of 76.29, indicating bullish momentum, and a robust trading volume of 32,535,873 shares, reflecting considerable market interest.

Relationship with Key Moving Averages
The closing price of Reliance is 1399.70, which is above the 50 EMA (1261.41), 200 EMA (1304.31), 10 EMA (1311.60), and 20 EMA (1282.94). This suggests a strong upward momentum, as the price is outperforming these key moving averages.
Moving Averages Trend (MACD)
Reliance's MACD value is 28.73, which is above the MACD Signal line at 12.93. This indicates a bullish trend, suggesting that the stock might continue to experience upward momentum. With the RSI at 76.29, it also shows that it may be in an overbought condition, so caution is advised.

RSI Analysis
RSI Analysis for Reliance: The RSI (Relative Strength Index) for Reliance is 76.29, indicating that the stock is currently in overbought territory. This suggests that the stock might be experiencing upward pressure, and there could be a potential for a price correction.

Analysis for Tech Mahindra - April 29, 2025

Tech Mahindra experienced a positive trading session with its share price opening at 1466.20 and closing at 1495.30, marking a 2.31% increase from the previous close of 1461.50. The stock’s performance is supported by a notable trading volume of 2,652,752 shares, with strong momentum indicators such as an RSI of 63.36 suggesting bullish activity in the Information Technology Services sector in India. Despite trading below its 200-day EMA of 1525.43, Tech Mahindra shows signs of recovery evidenced by its MACD nearing the signal line, and its market cap stands at approximately 1.32 trillion INR.

Relationship with Key Moving Averages
Tech Mahindra's current close price of 1495.30 is above its 50-day EMA of 1461.04 but below its 200-day EMA of 1525.43. This positioning suggests a short-term upward trend, while the long-term trend may still be downward.
Moving Averages Trend (MACD)
The MACD for Tech Mahindra is currently at -0.1574, with a MACD Signal of -26.8906. The negative MACD value combined with the highly negative MACD Signal suggests bearish momentum might be slowing. Traders should watch for further signals of trend reversal or confirmation of continued bearishness.

RSI Analysis
The RSI (Relative Strength Index) of Tech Mahindra is 63.36, which suggests that the stock is nearing the overbought territory typically associated with an RSI above 70. This level may indicate strong recent performance, but investors should be cautious as the stock could be due for a pullback if it moves higher into overbought conditions.

Analysis for Trent - April 29, 2025

Trent showed a notable performance with a close price of 5391.5, marking a positive % Change of 3.49 compared to its previous close. This was achieved on a significant volume of 1419169, with the stock reaching a high of 5510. The company operates in the Apparel Retail industry under the Consumer Cyclical sector in India and holds a substantial market cap of 1916608184320, with a PE Ratio of 99.51 and an EPS of 54.18. The relative strength index indicates a moderately positive trend at 55.92, while both the MACD and EMAs suggest a bullish sentiment.

Relationship with Key Moving Averages
The current closing price of Trent at 5391.5 is above its 50-day EMA of 5307.41 and well above the 10-day and 20-day EMAs of 5230.19 and 5199.11, respectively, indicating a short-term bullish momentum. However, it remains below the 200-day EMA of 5663.08, suggesting that, on a long-term basis, there might be some bearish pressure.
Moving Averages Trend (MACD)
The MACD for Trent is 19.58, which is above the MACD Signal of -9.64, indicating a bullish momentum. This suggests that the stock may continue to rise as the MACD line is above the signal line, signaling potential upward movement in price.

RSI Analysis
The RSI (Relative Strength Index) for Trent is 55.92, which suggests that the stock is in a neutral zone, not currently overbought or oversold. This level indicates a balanced momentum and potential for further upside or downside movement depending on market conditions.
