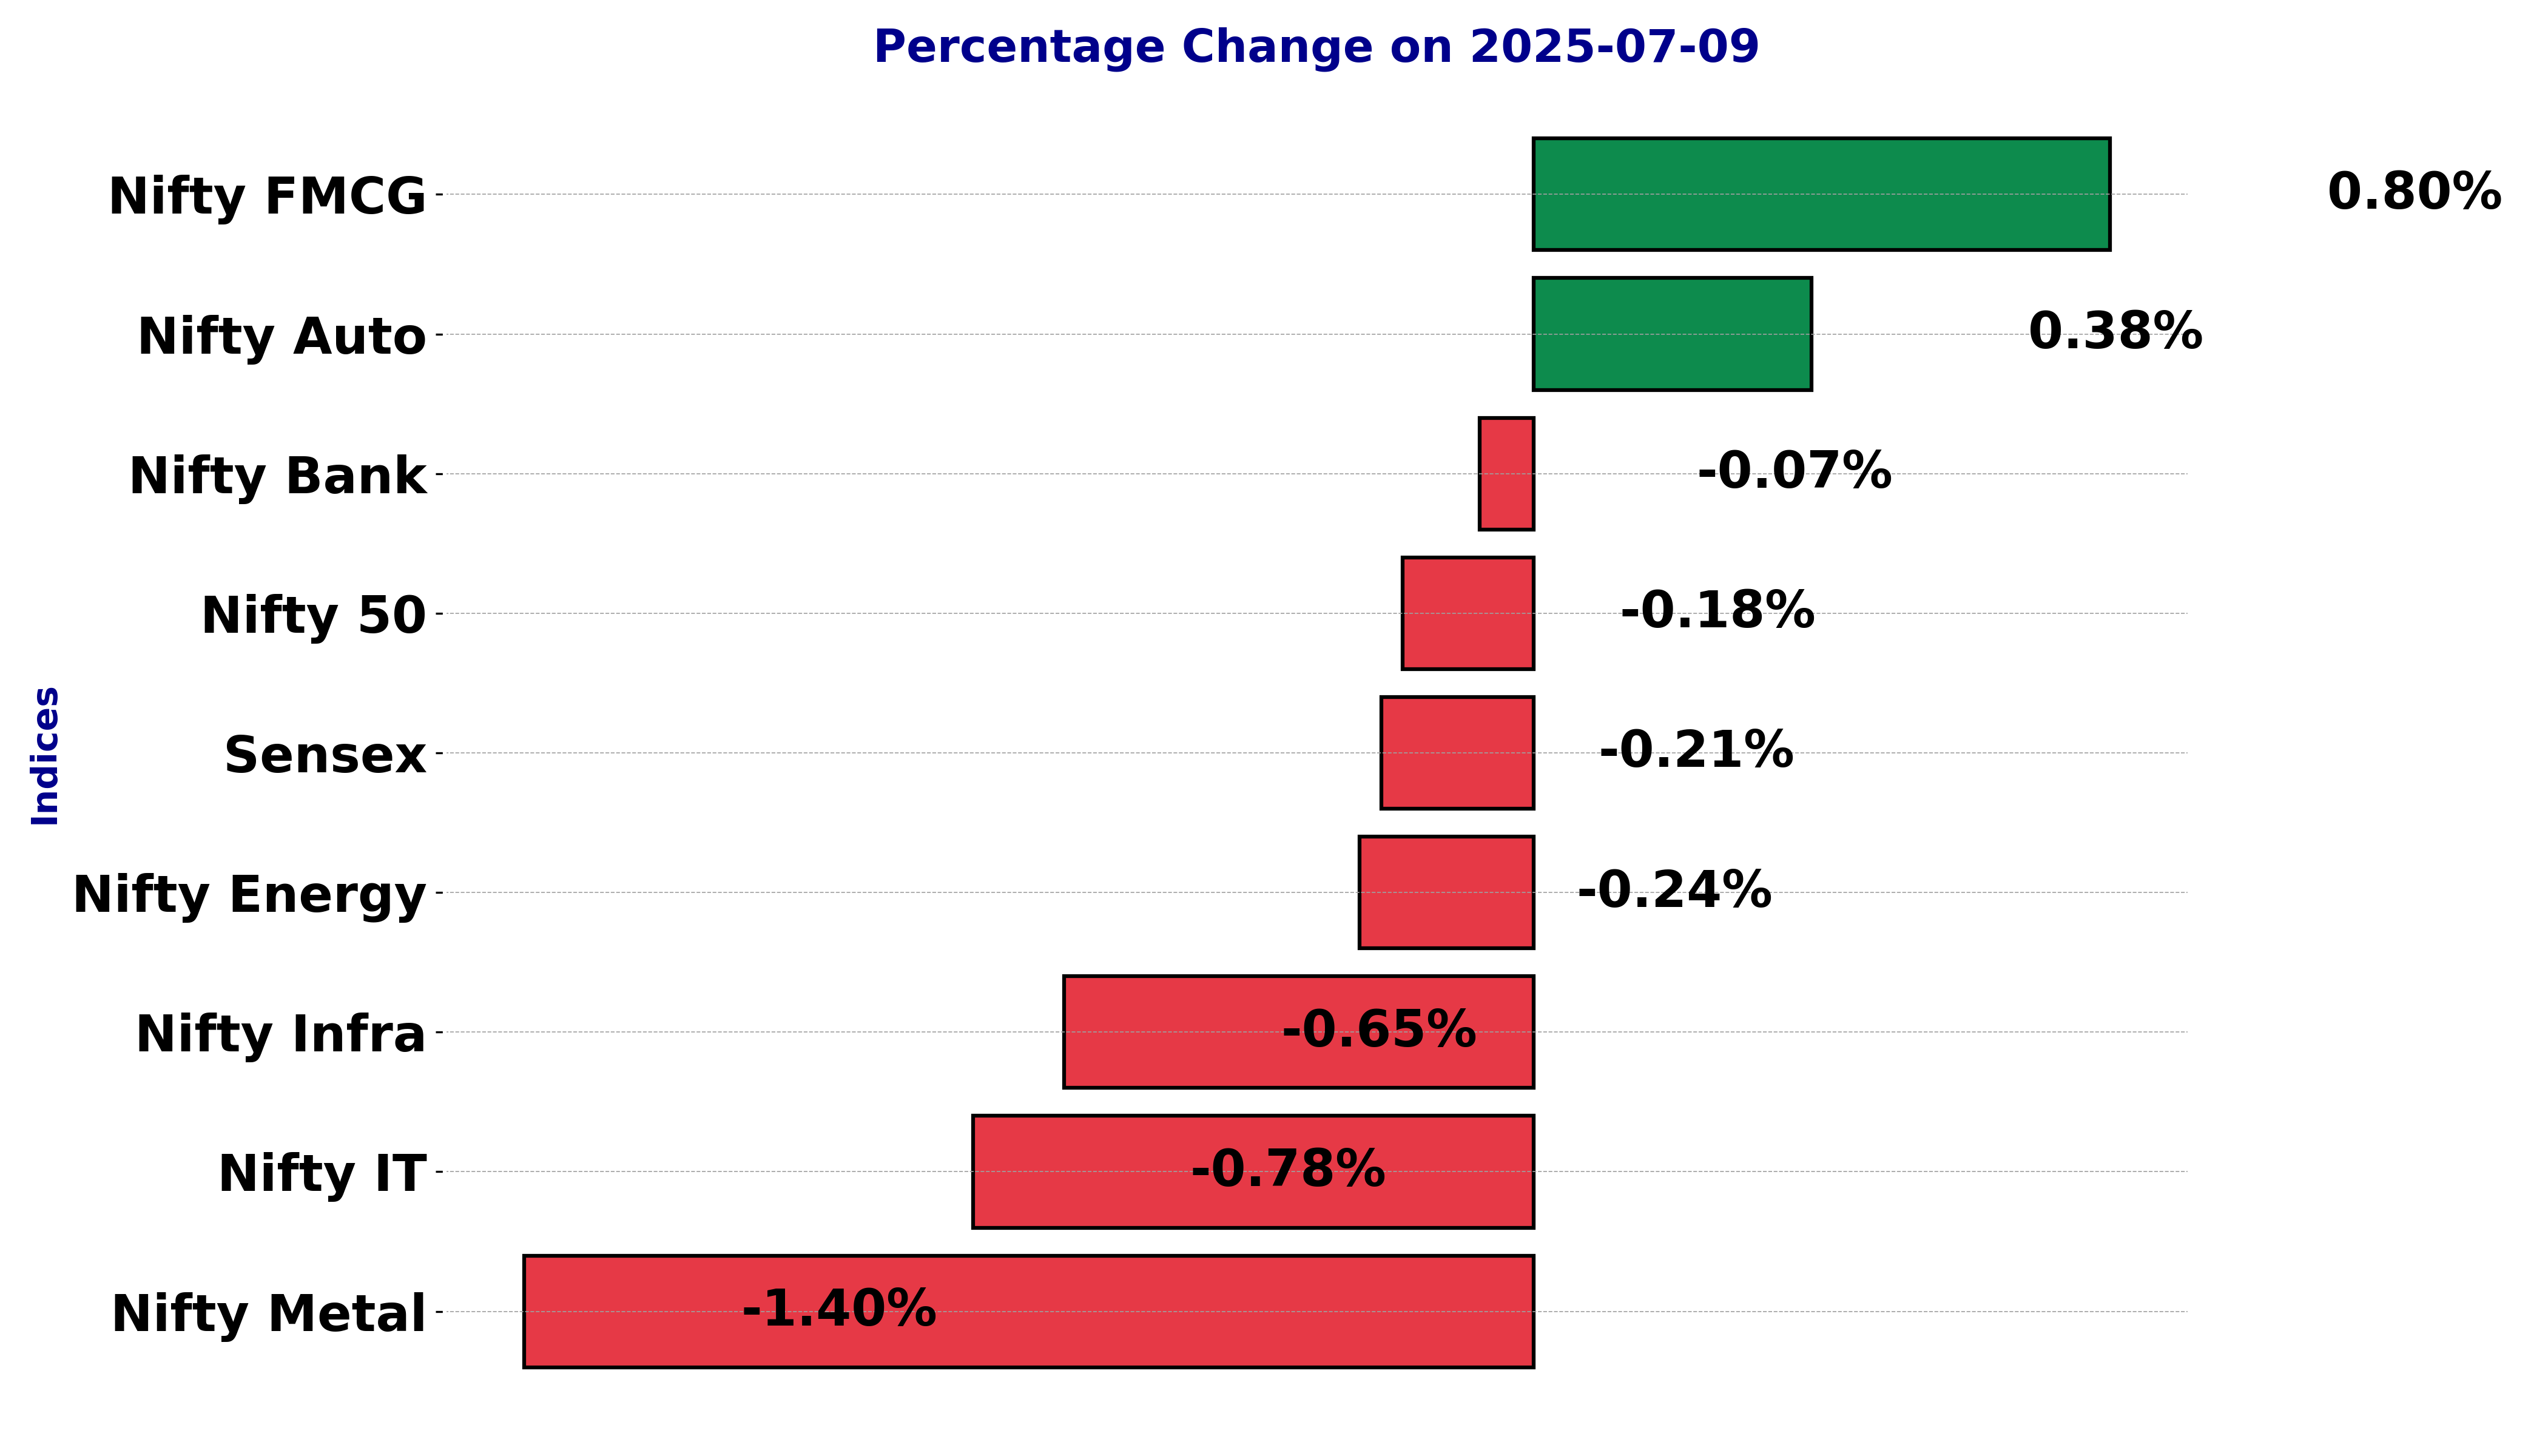
Indian stock market sector-wise performance today - July 9, 2025
The stock market on Wednesday (July 9, 2025) displayed a range of movements across different sectors and indices, providing investors with a mixed landscape to navigate.
The BSE Sensex index showed a slight downturn, experiencing a decline of 0.21%. This drop was mirrored by a tangible decrease of 176.43 points from the previous close, implying cautious market sentiments.
The CNX Auto, on the other hand, emerged with a positive note, marking a modest increase of 0.38%, indicating a recovering and possibly robust automotive sector.
The energy sector, represented by CNX Energy, saw a slight dip of 0.24%, while the FMCG sector illustrated resilience with an impressive upward movement of 0.80%.
Among the sectors, Nifty Infra experienced a notable drop of 0.65%, raising concerns about infrastructure investment sentiments.
However, Nifty IT posted a more concerning retreat, declining by 0.78%. Furthermore, Nifty Metal stood out with a significant decline of 1.40%, signaling sector-specific challenges.
An examination of the Nifty Metal sector reveals underlying factors contributing to its notable decline. Metals often experience volatility due to fluctuations in global demand, raw material price variations, and geopolitical issues impacting supply chains.
Moreover, economic outlook adjustments and regulatory shifts can exert substantial pressure on commodity-based sectors, such as metals.
The banking sector, represented by NSE Bank, maintained relative stability with a marginal decrease of 0.07%, showcasing resilience amidst broader market shifts.
Meanwhile, the broader NSE Nifty index experienced a minor fall of 0.18%, encapsulating the day's overall market sentiment. This mixed performance suggests a landscape where investors might be weighing sector-specific developments against broader economic indicators, regulatory changes, and market volatility.
While some sectors displayed resilience, others faced pressures potentially driven by external macroeconomic factors and internal sectoral challenges.
Analysis for Sensex - July 09, 2025
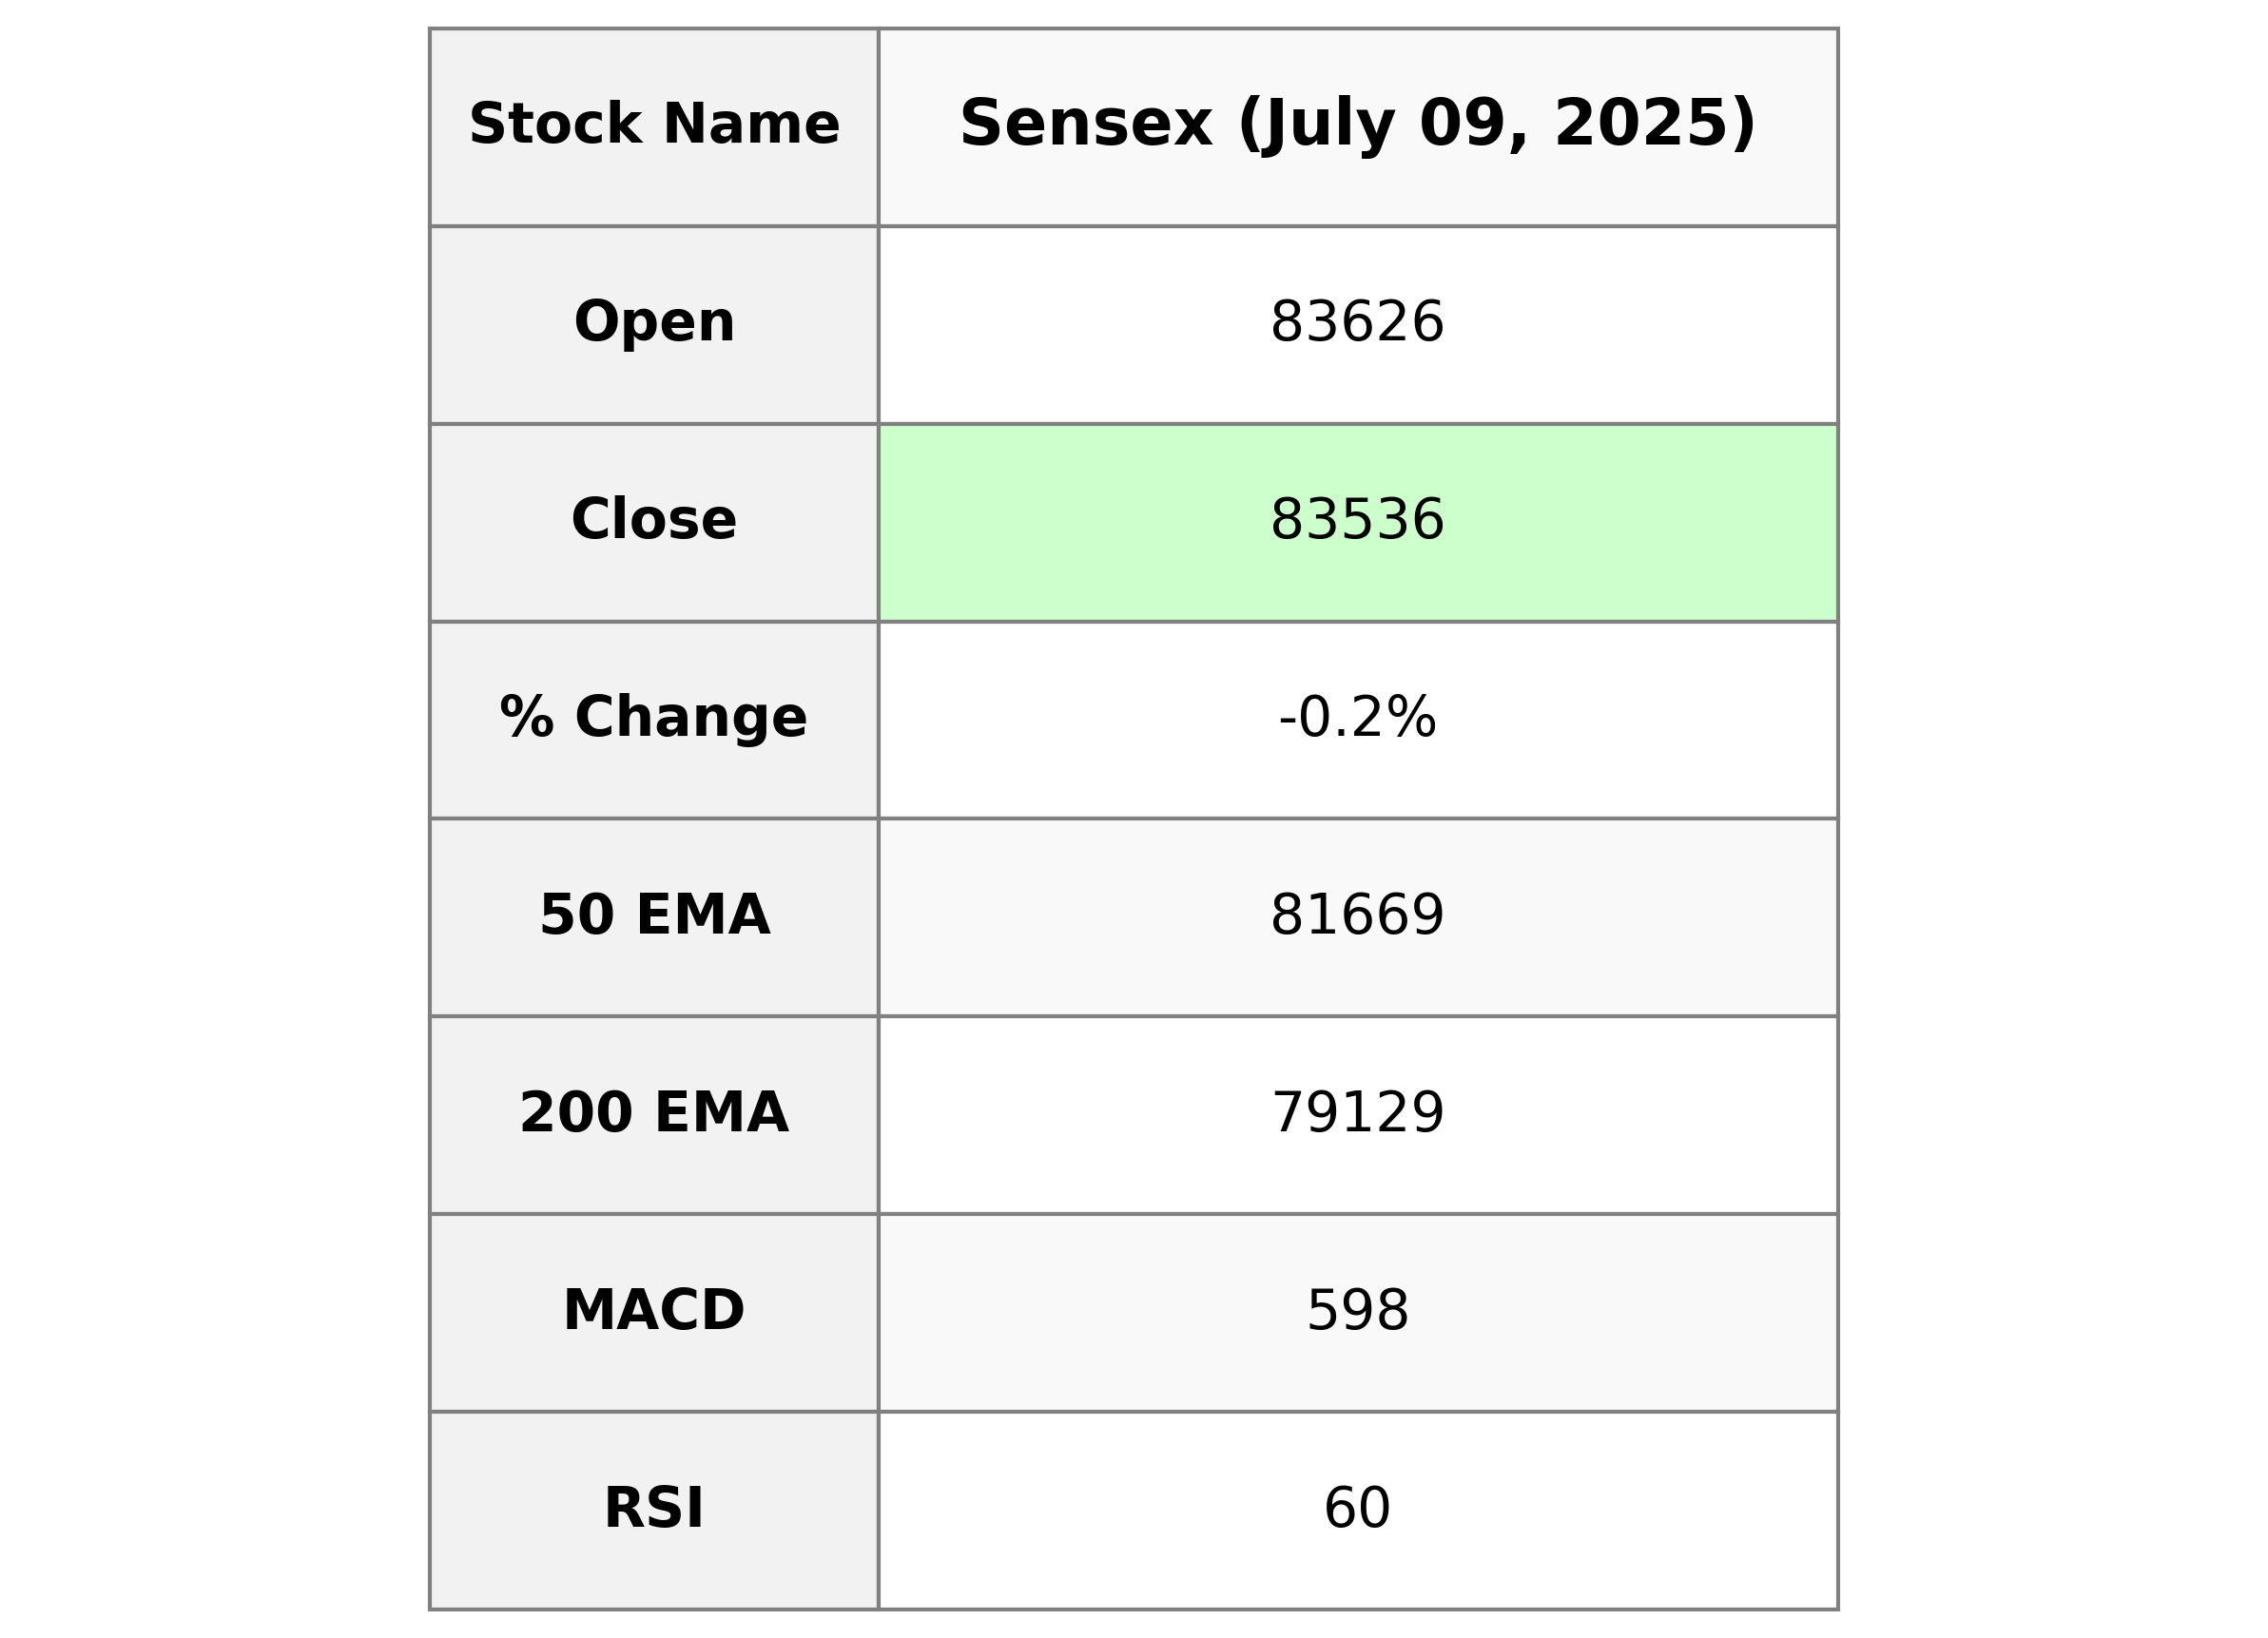
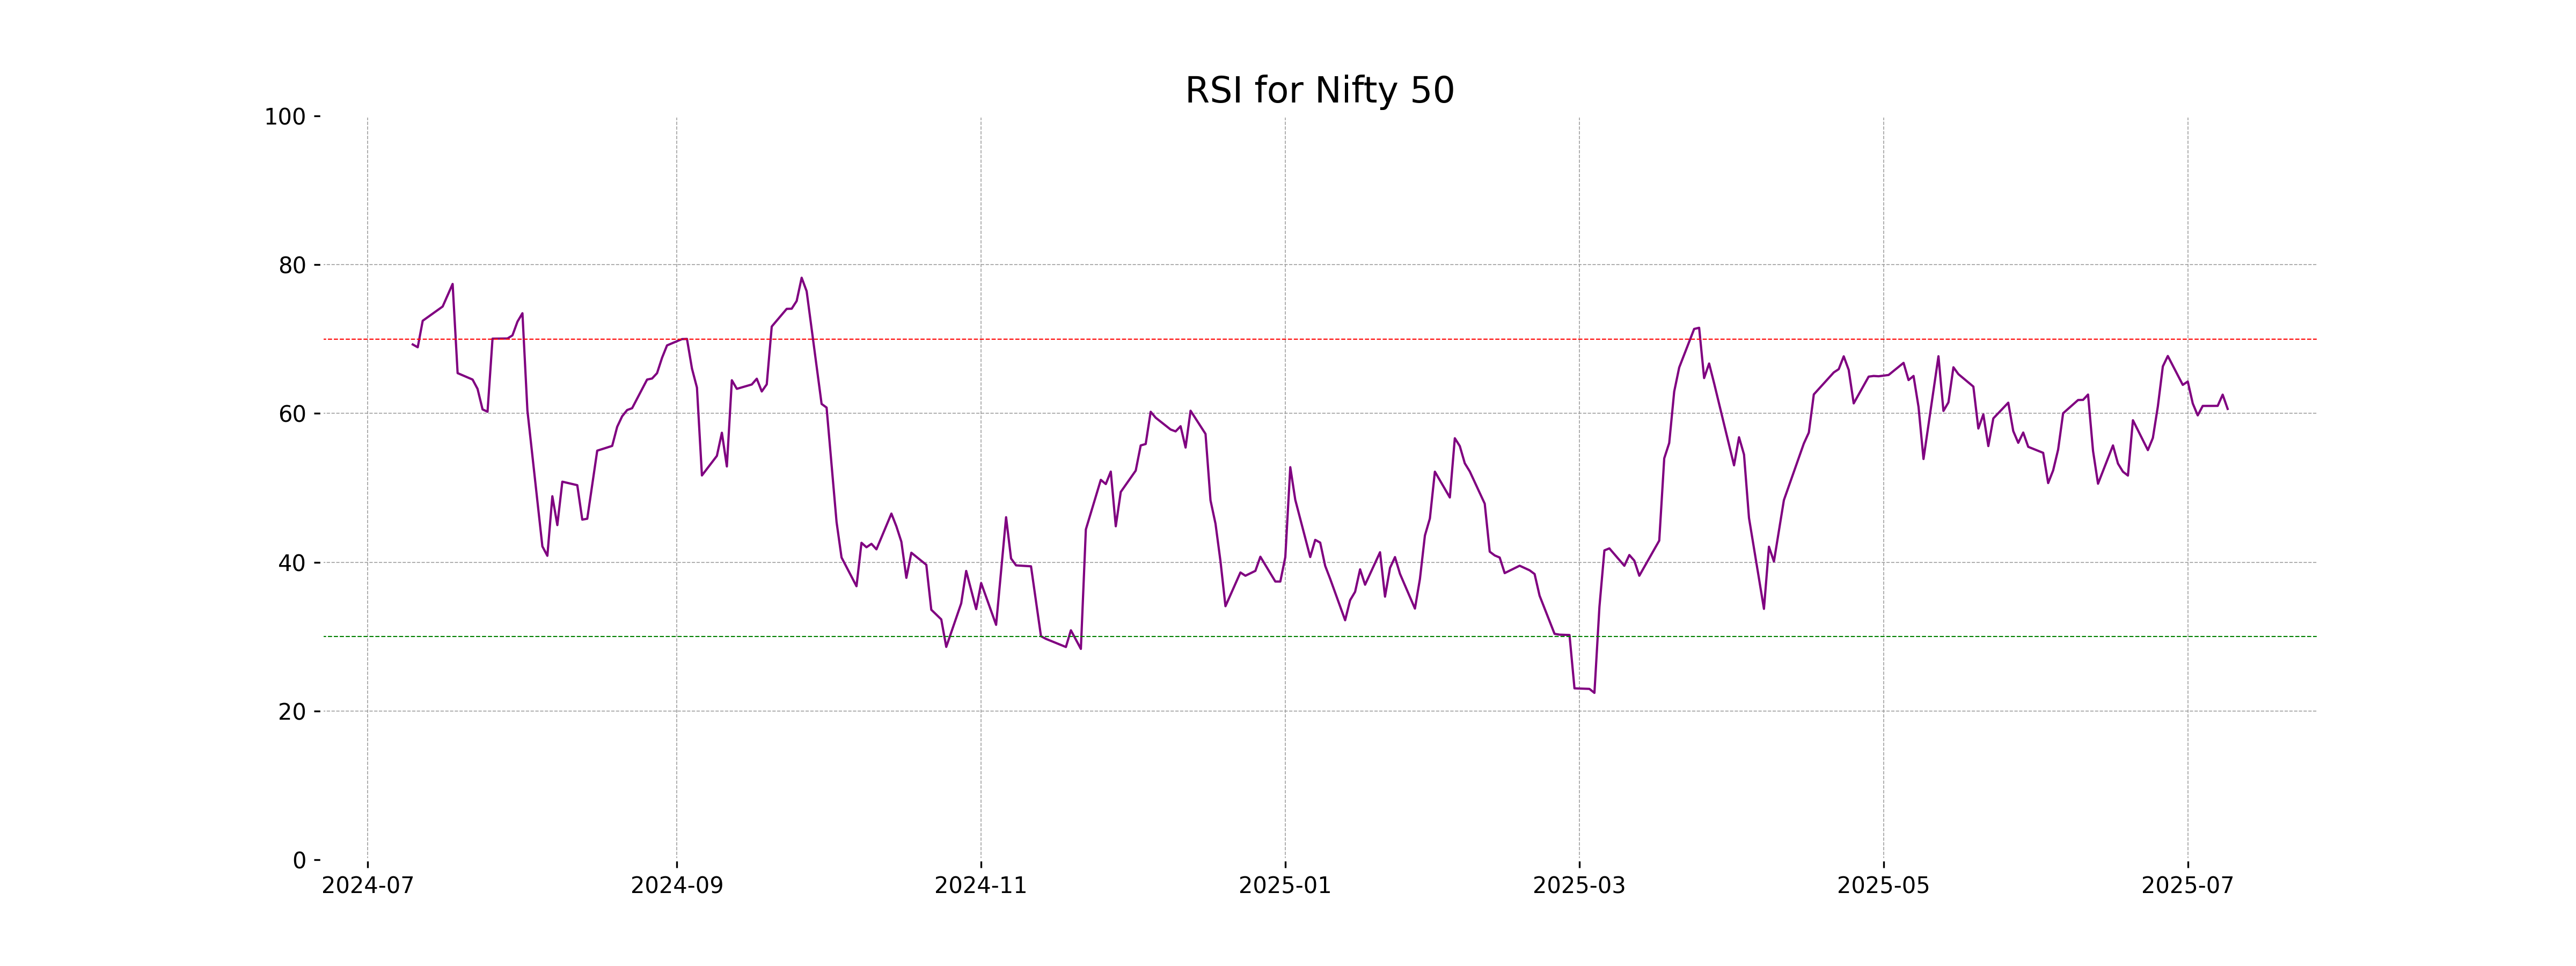
The Sensex opened at 83,625.89 and closed at 83,536.08, marking a decrease of 0.21% or 176.43 points from the previous close of 83,712.51. Despite the decline, the Relative Strength Index (RSI) suggests a moderately strong momentum at 59.82.
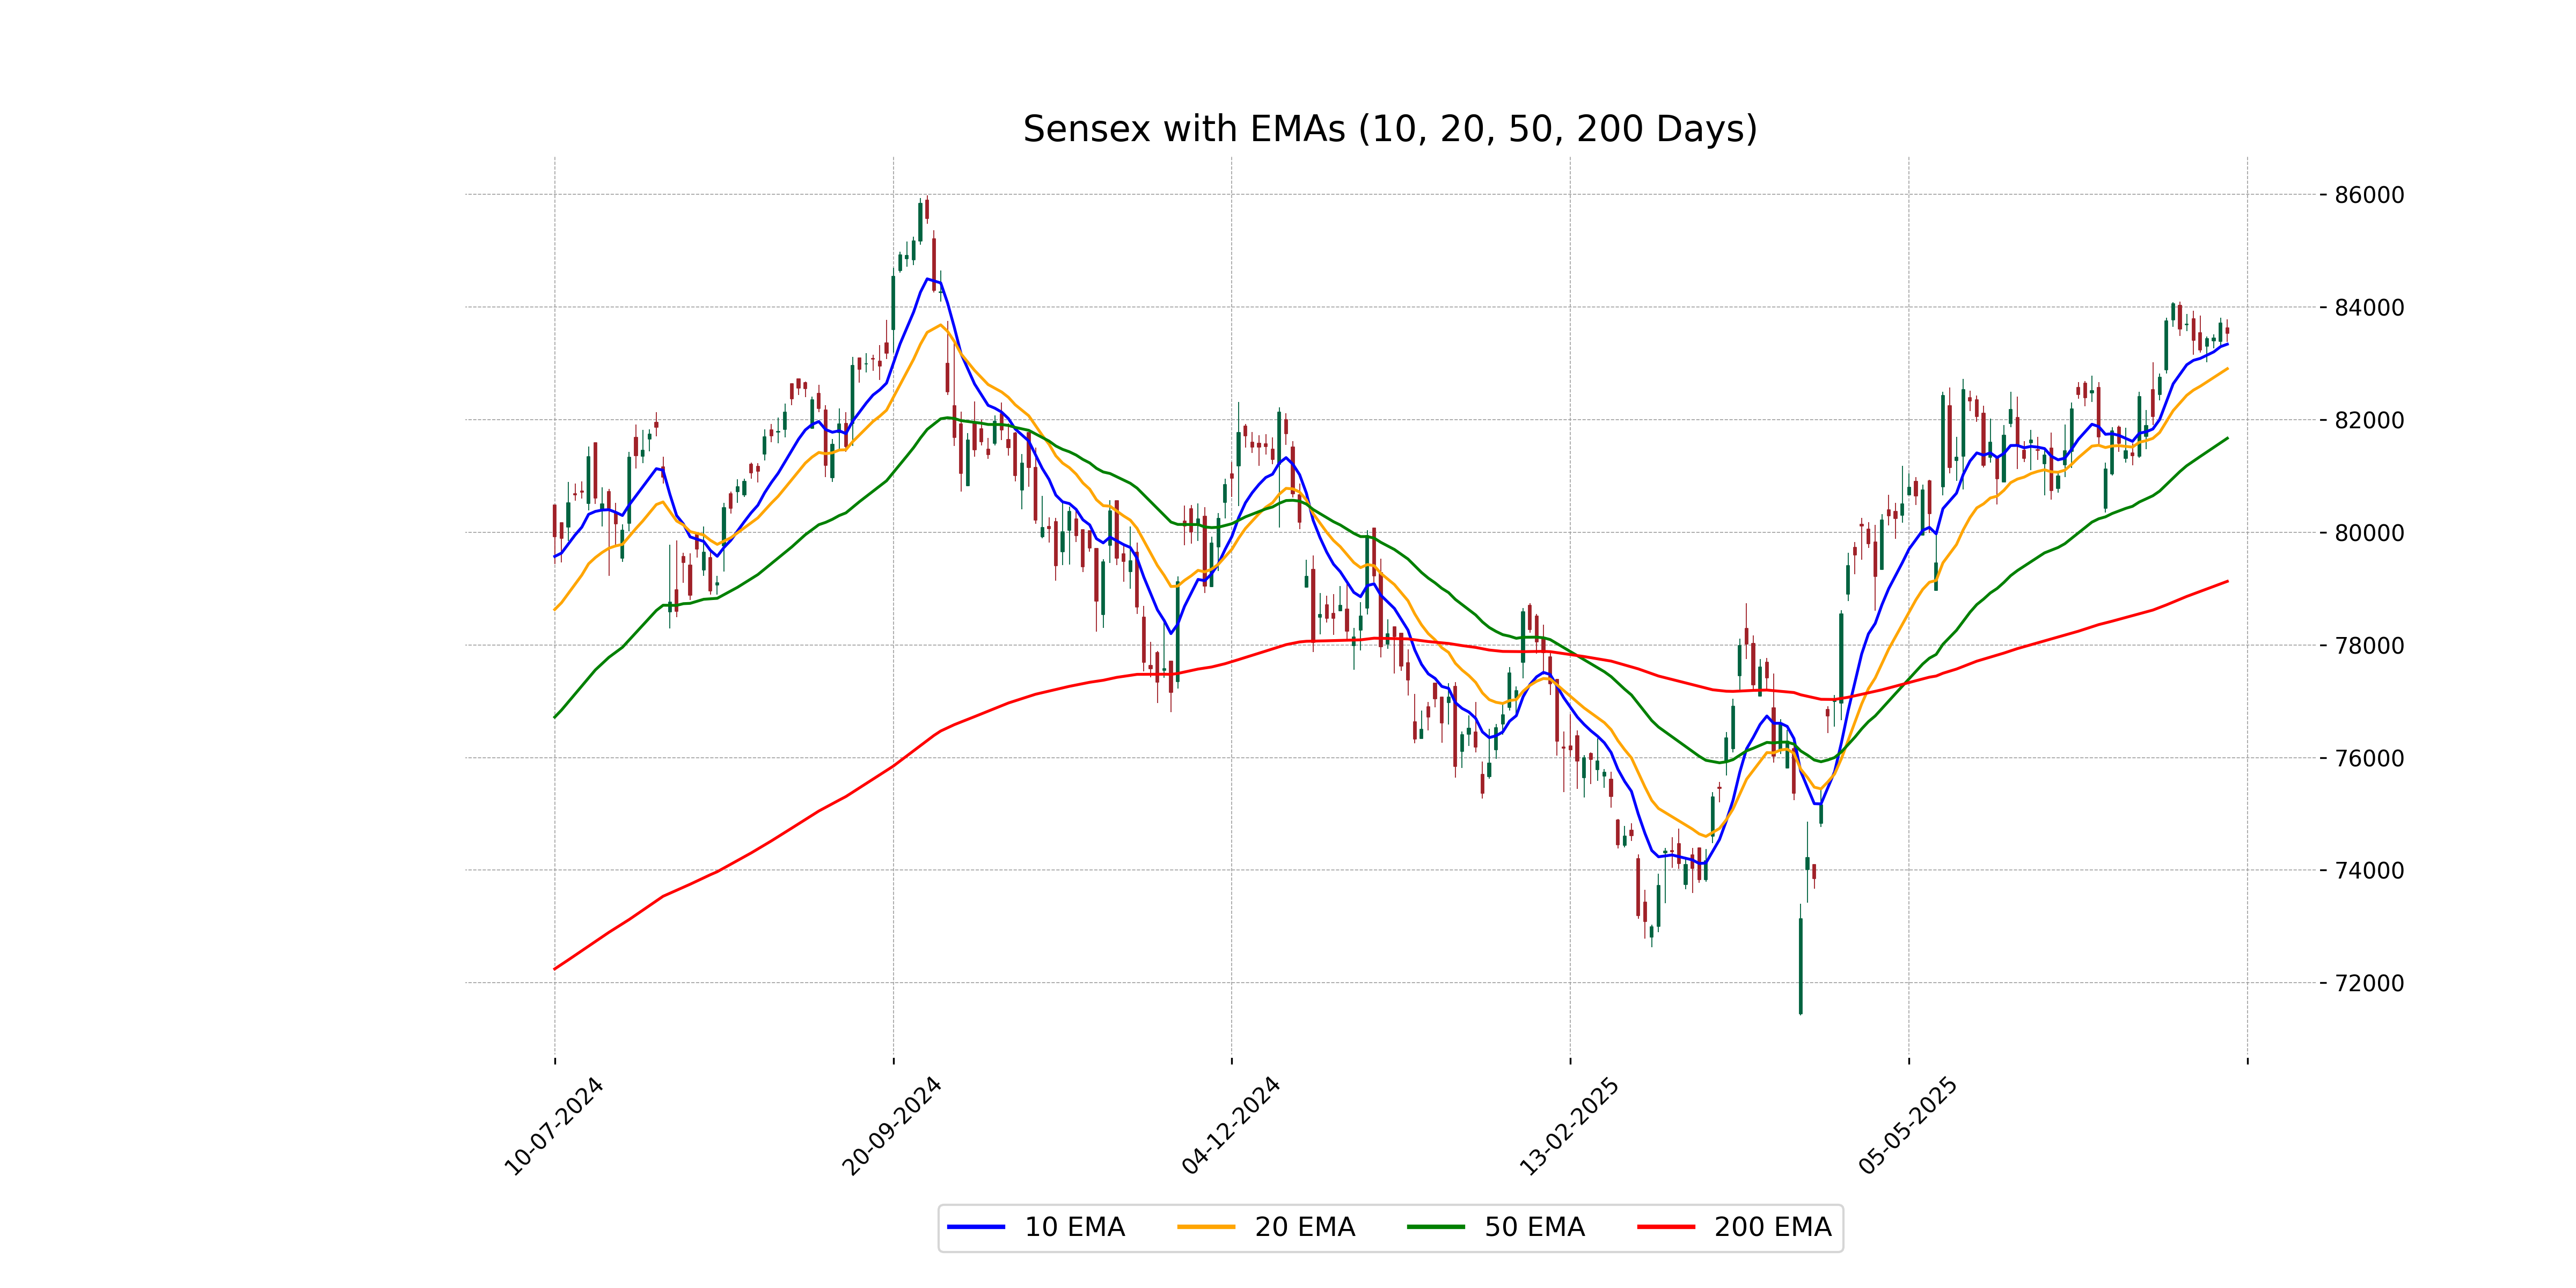
Relationship with Key Moving Averages
The Sensex closed at 83,536.08, which is above both its 50 EMA at 81,669.11 and the 200 EMA at 79,128.51, indicating a bullish trend. It also remained above its 10 EMA of 83,339.21 and its 20 EMA of 82,904.12, suggesting current positive momentum.
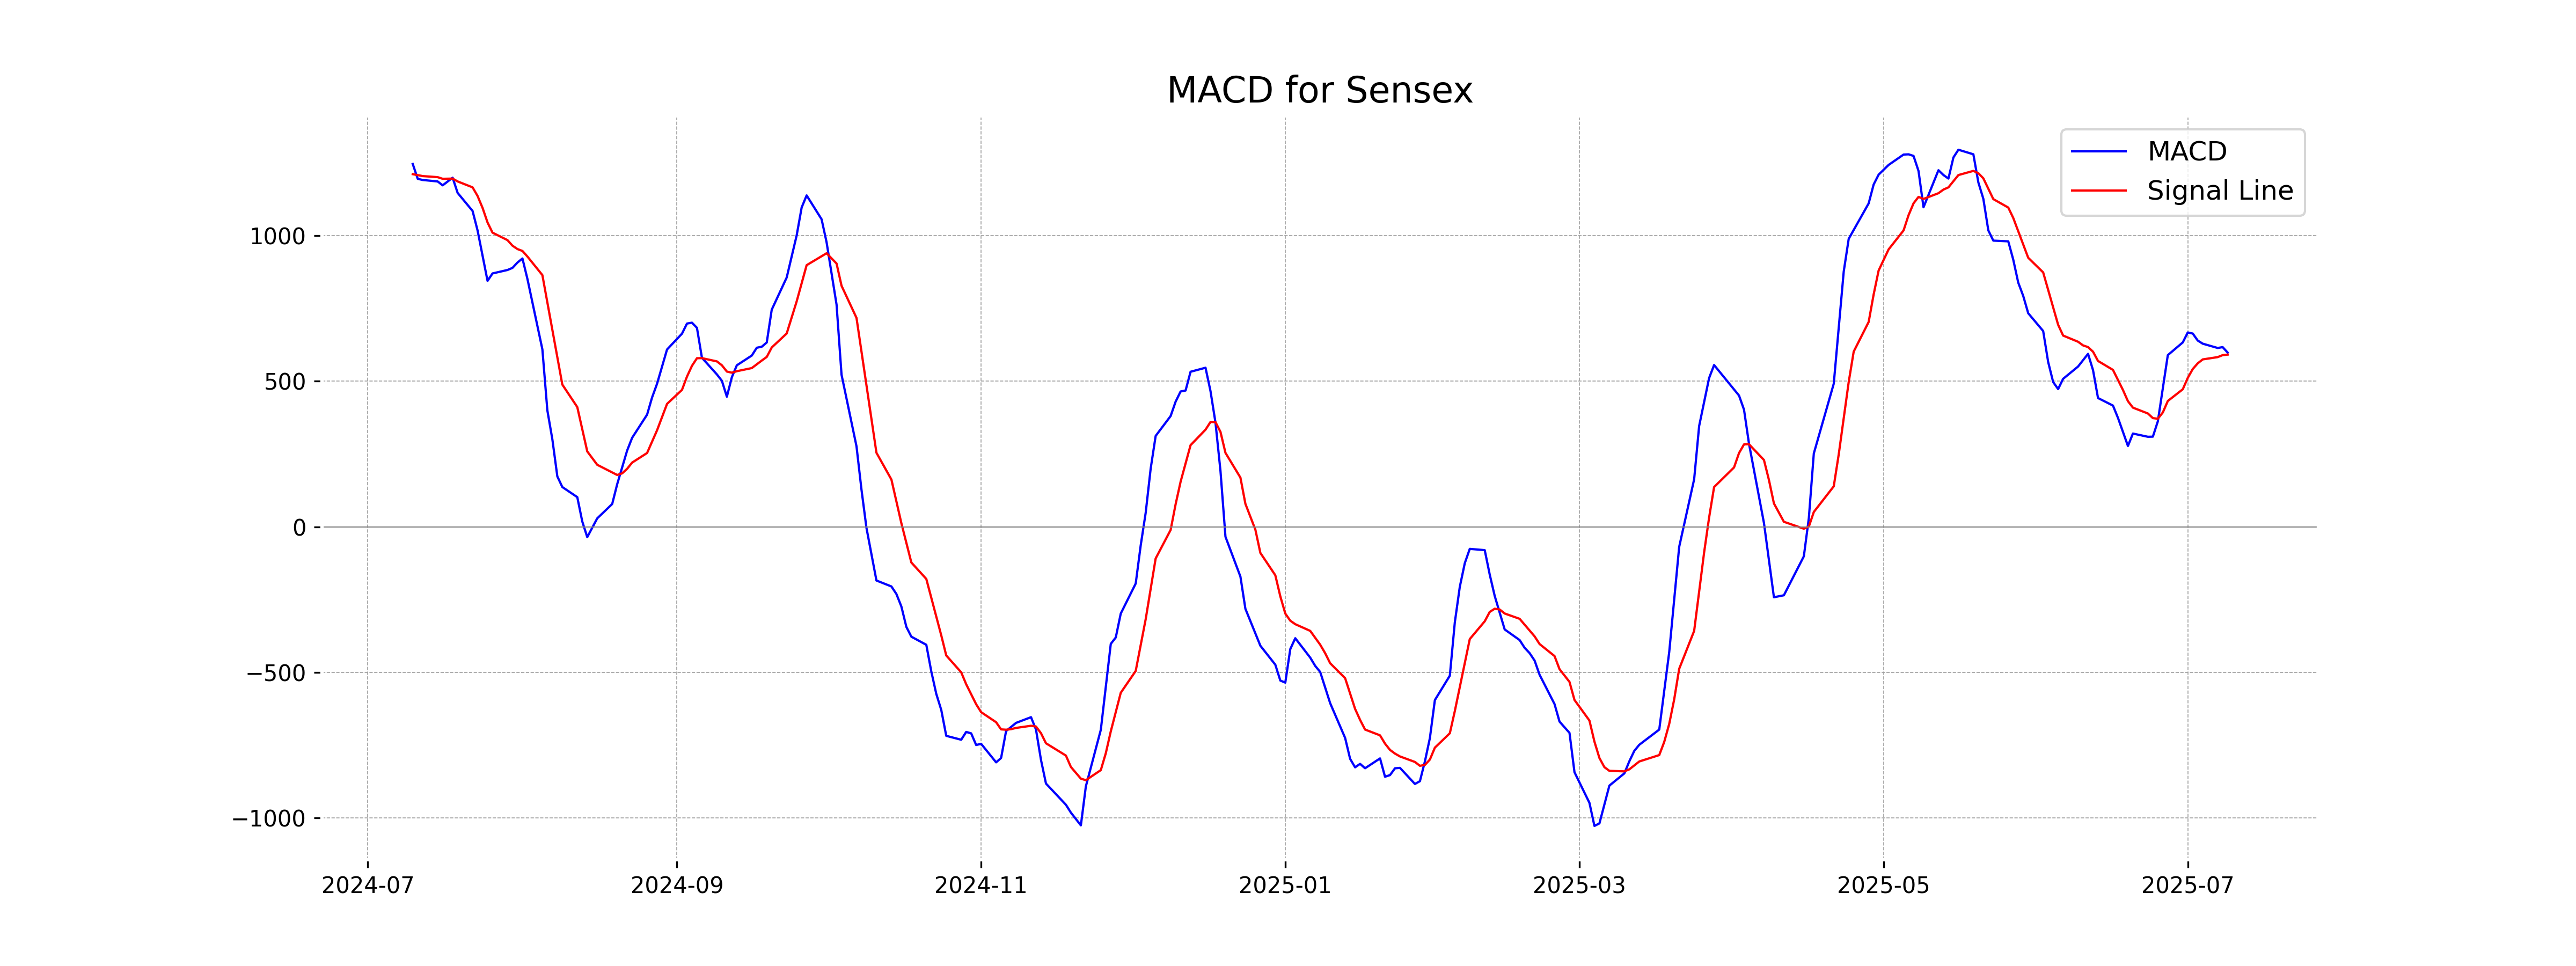
Moving Averages Trend (MACD)
The MACD for the Sensex is positive with a value of 598.13, indicating a bullish trend since it is above the MACD Signal of 591.19. However, the close proximity of the two values suggests a potential consolidation phase or a possible change in trend if the MACD continues to decrease towards the signal line.
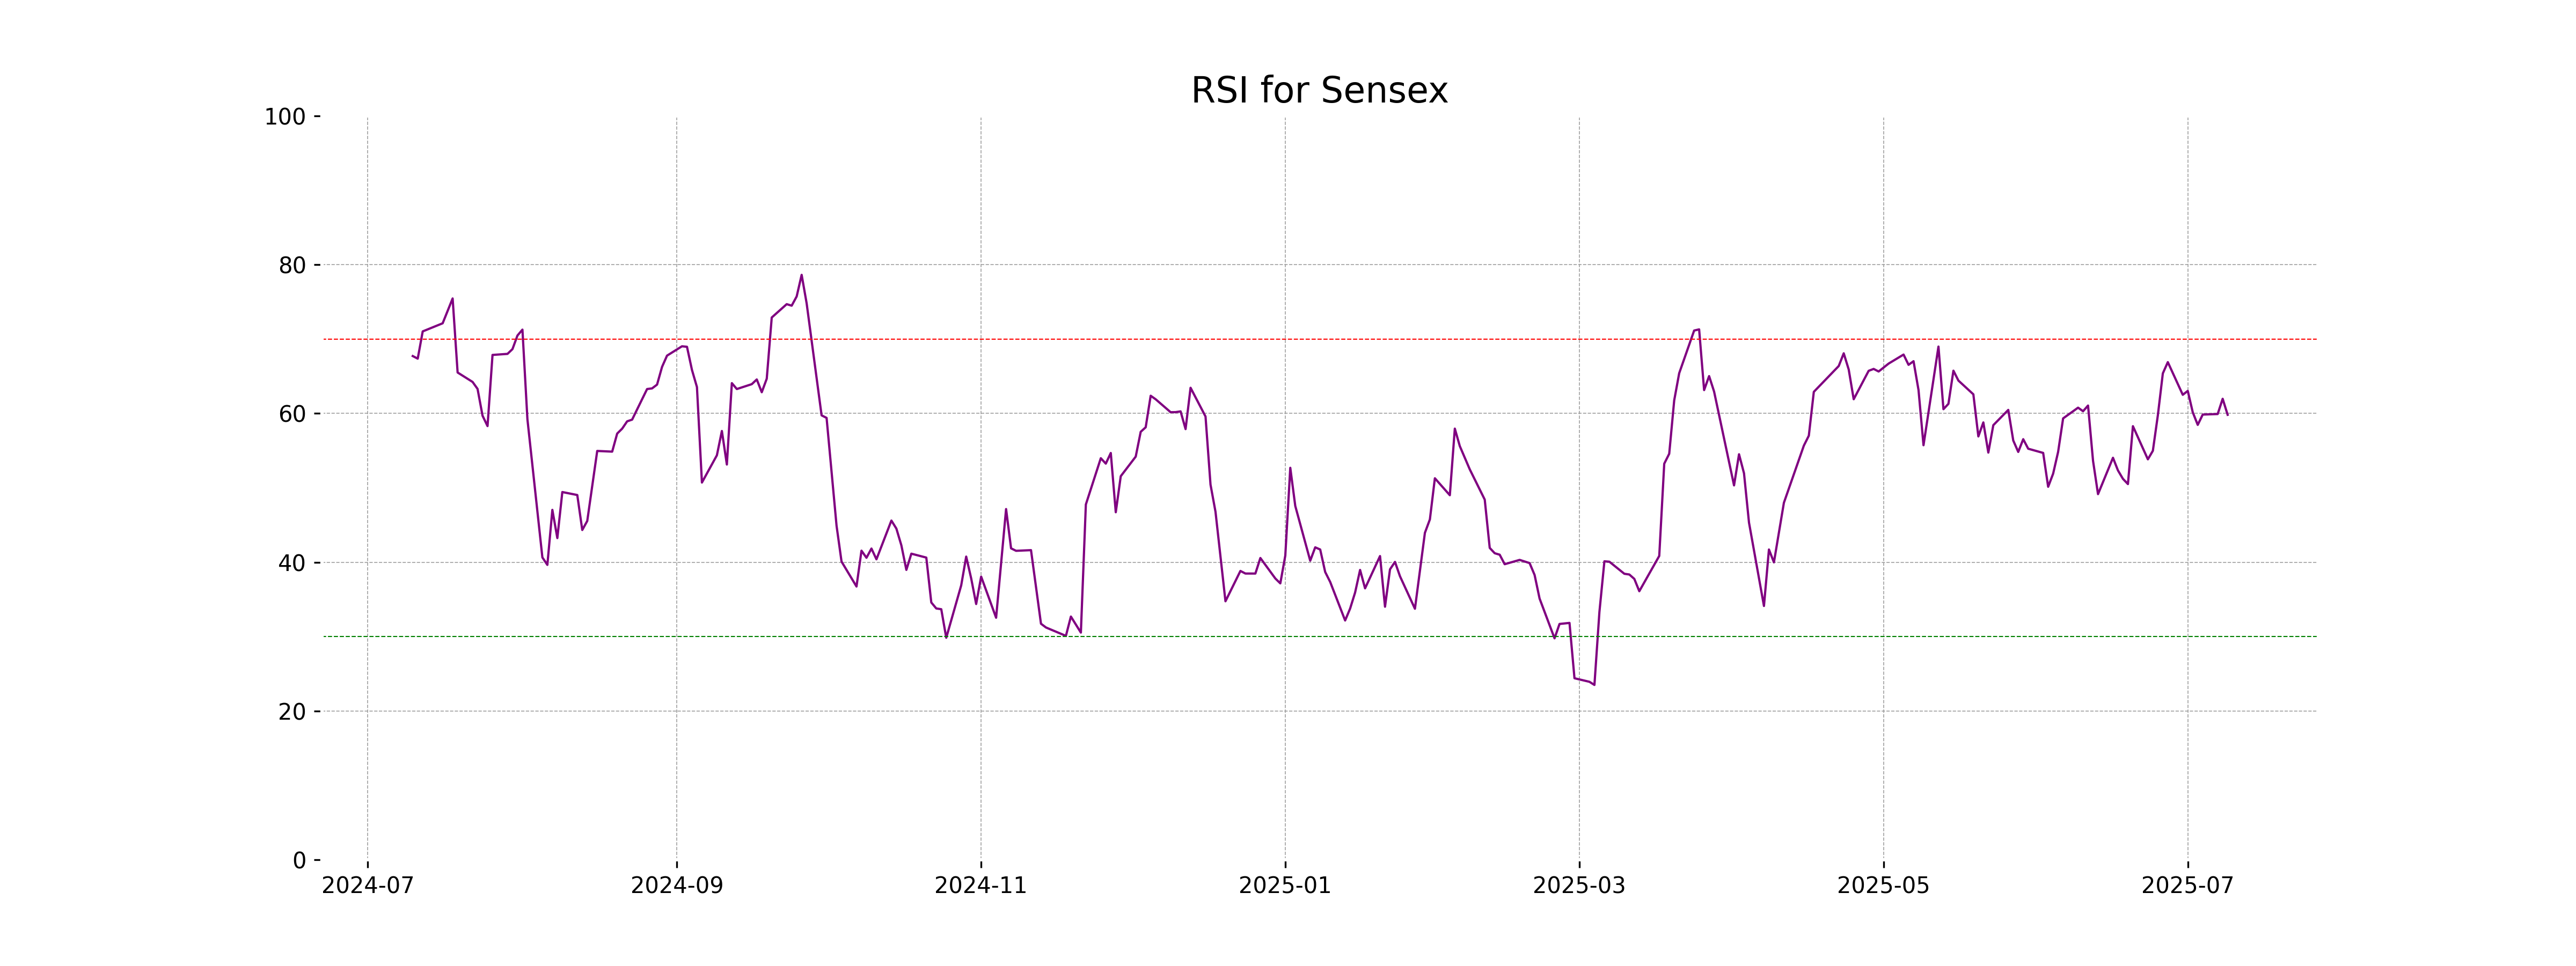
RSI Analysis
The Relative Strength Index (RSI) for Sensex is 59.82, which suggests that the index is nearing the overbought threshold of 70. This level indicates a moderately bullish market sentiment, but it is not yet in overbought territory. Caution may be warranted if the RSI approaches higher levels.
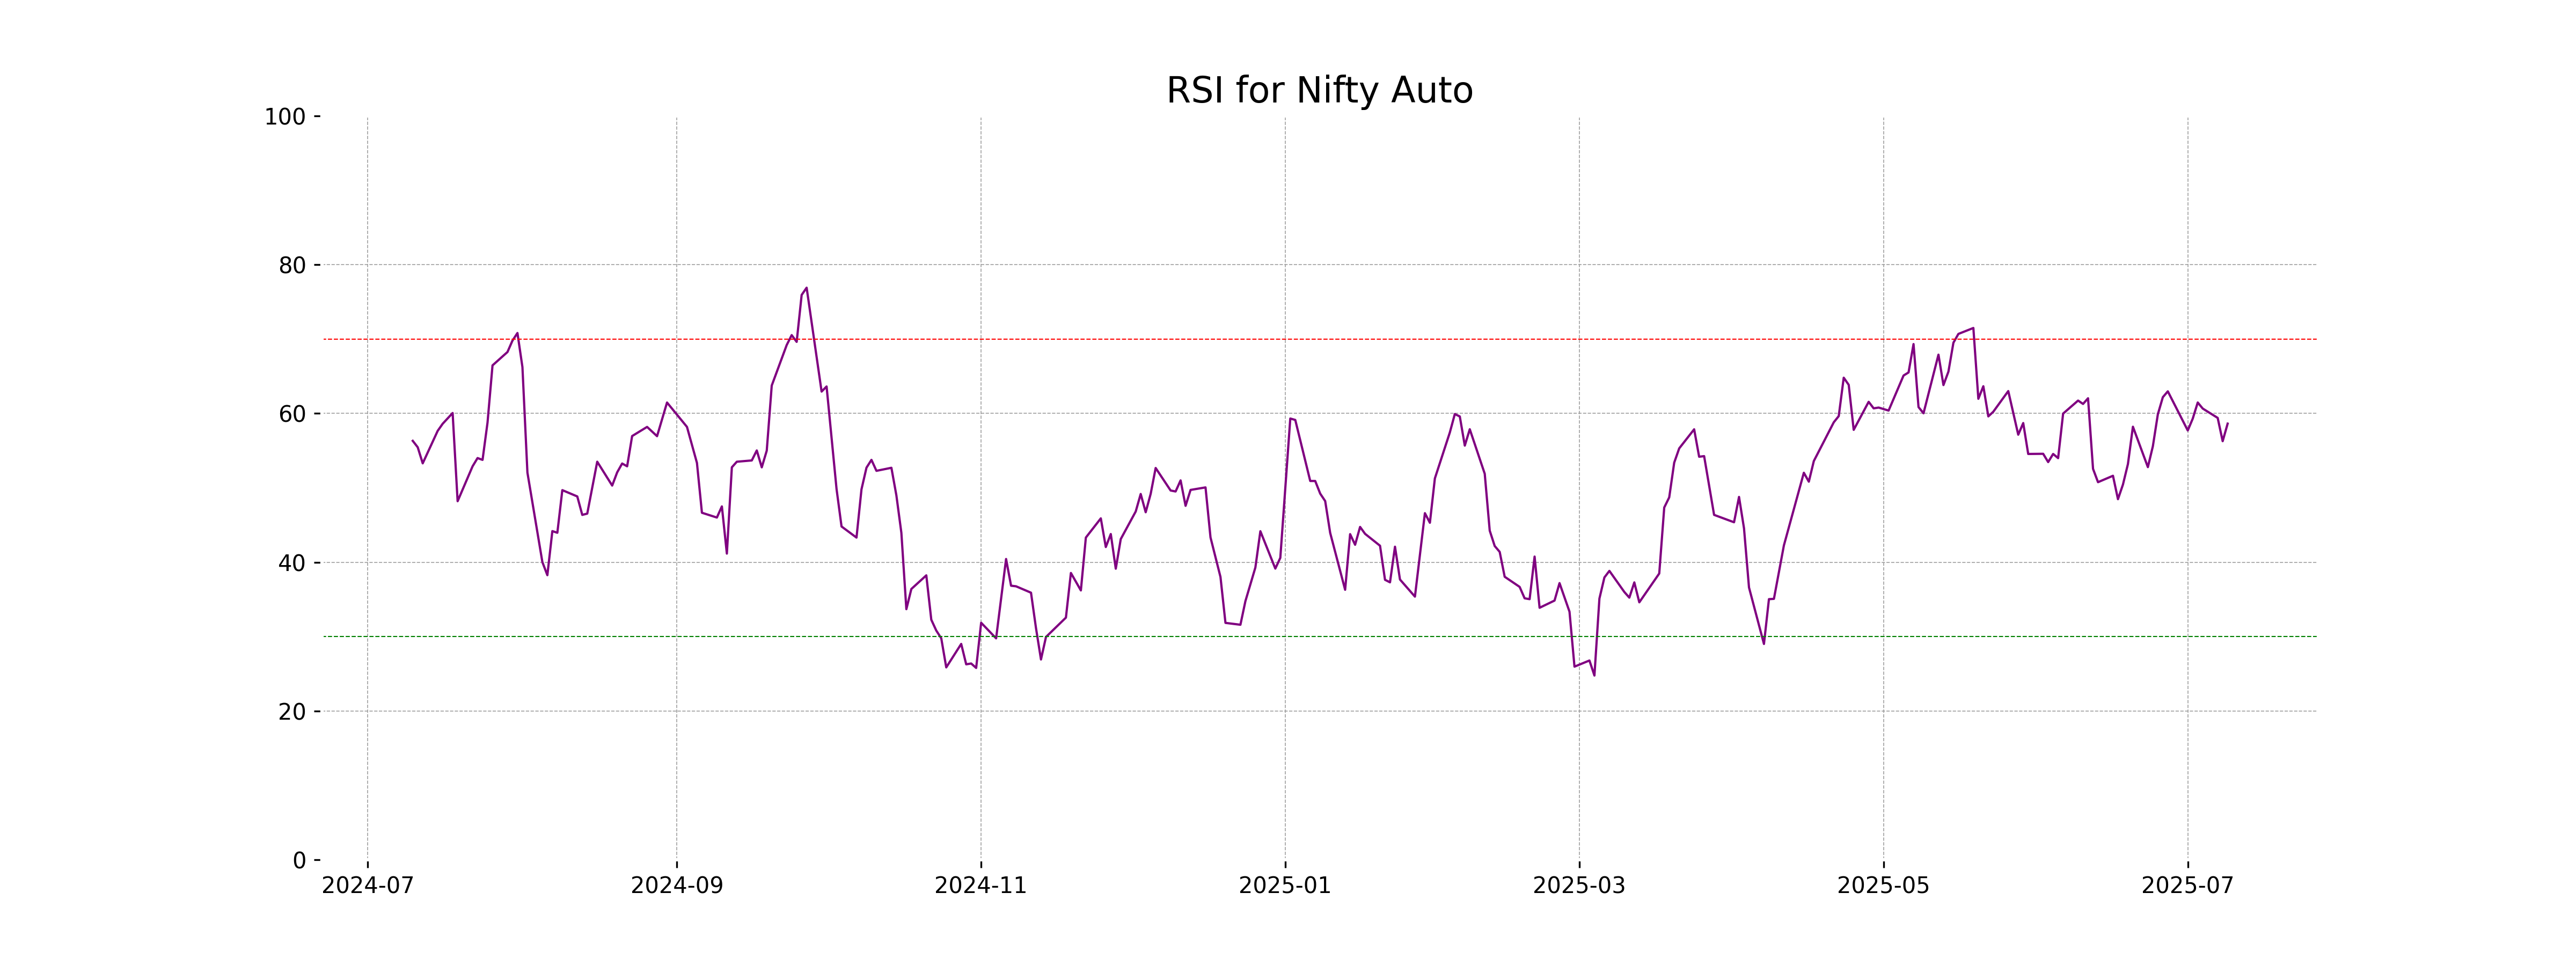
Analysis for Nifty Auto - July 09, 2025

Nifty Auto Performance: Nifty Auto opened at 23807.0 and closed at 23944.4, marking an increase of 91.5 points or 0.38%. The Relative Strength Index (RSI) suggests moderate strength at 58.63, while the MACD indicates a slight bearish momentum with a value lower than the signal line. The 50-day and 200-day EMAs are trending upwards, supporting a positive outlook.
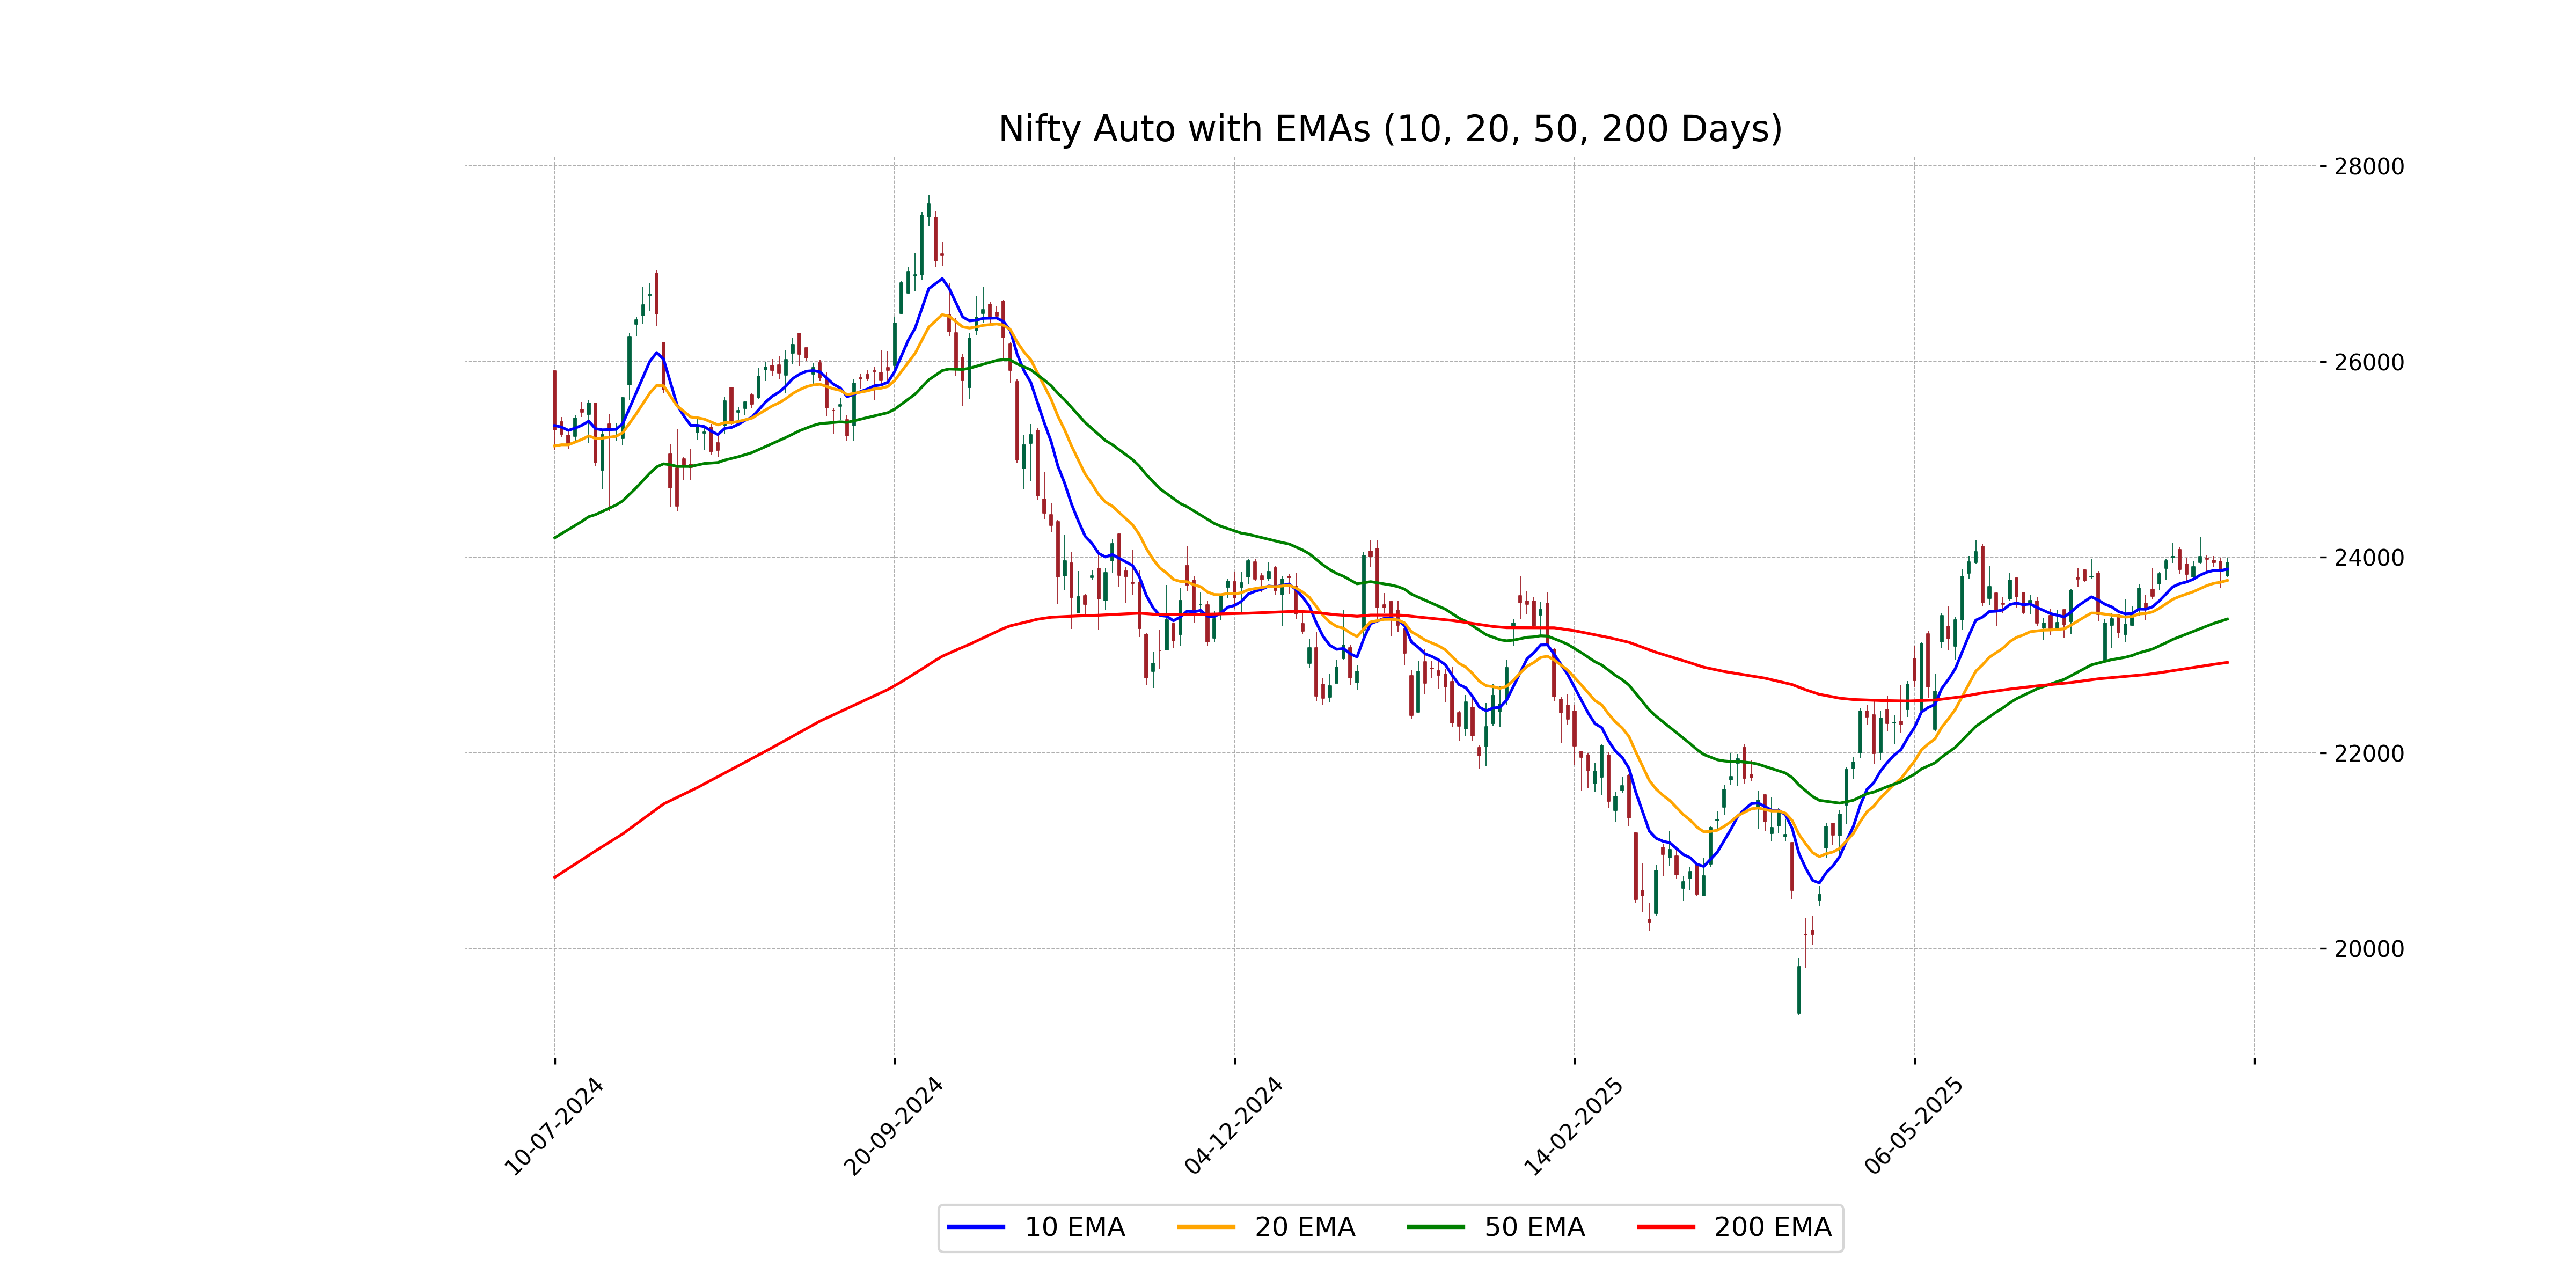
Relationship with Key Moving Averages
Nifty Auto closed at 23944.40, which is above its 50 EMA of 23366.45 and 200 EMA of 22923.05, indicating a potential bullish trend. Additionally, it is slightly above its 10 EMA and 20 EMA, suggesting short-term positive momentum.
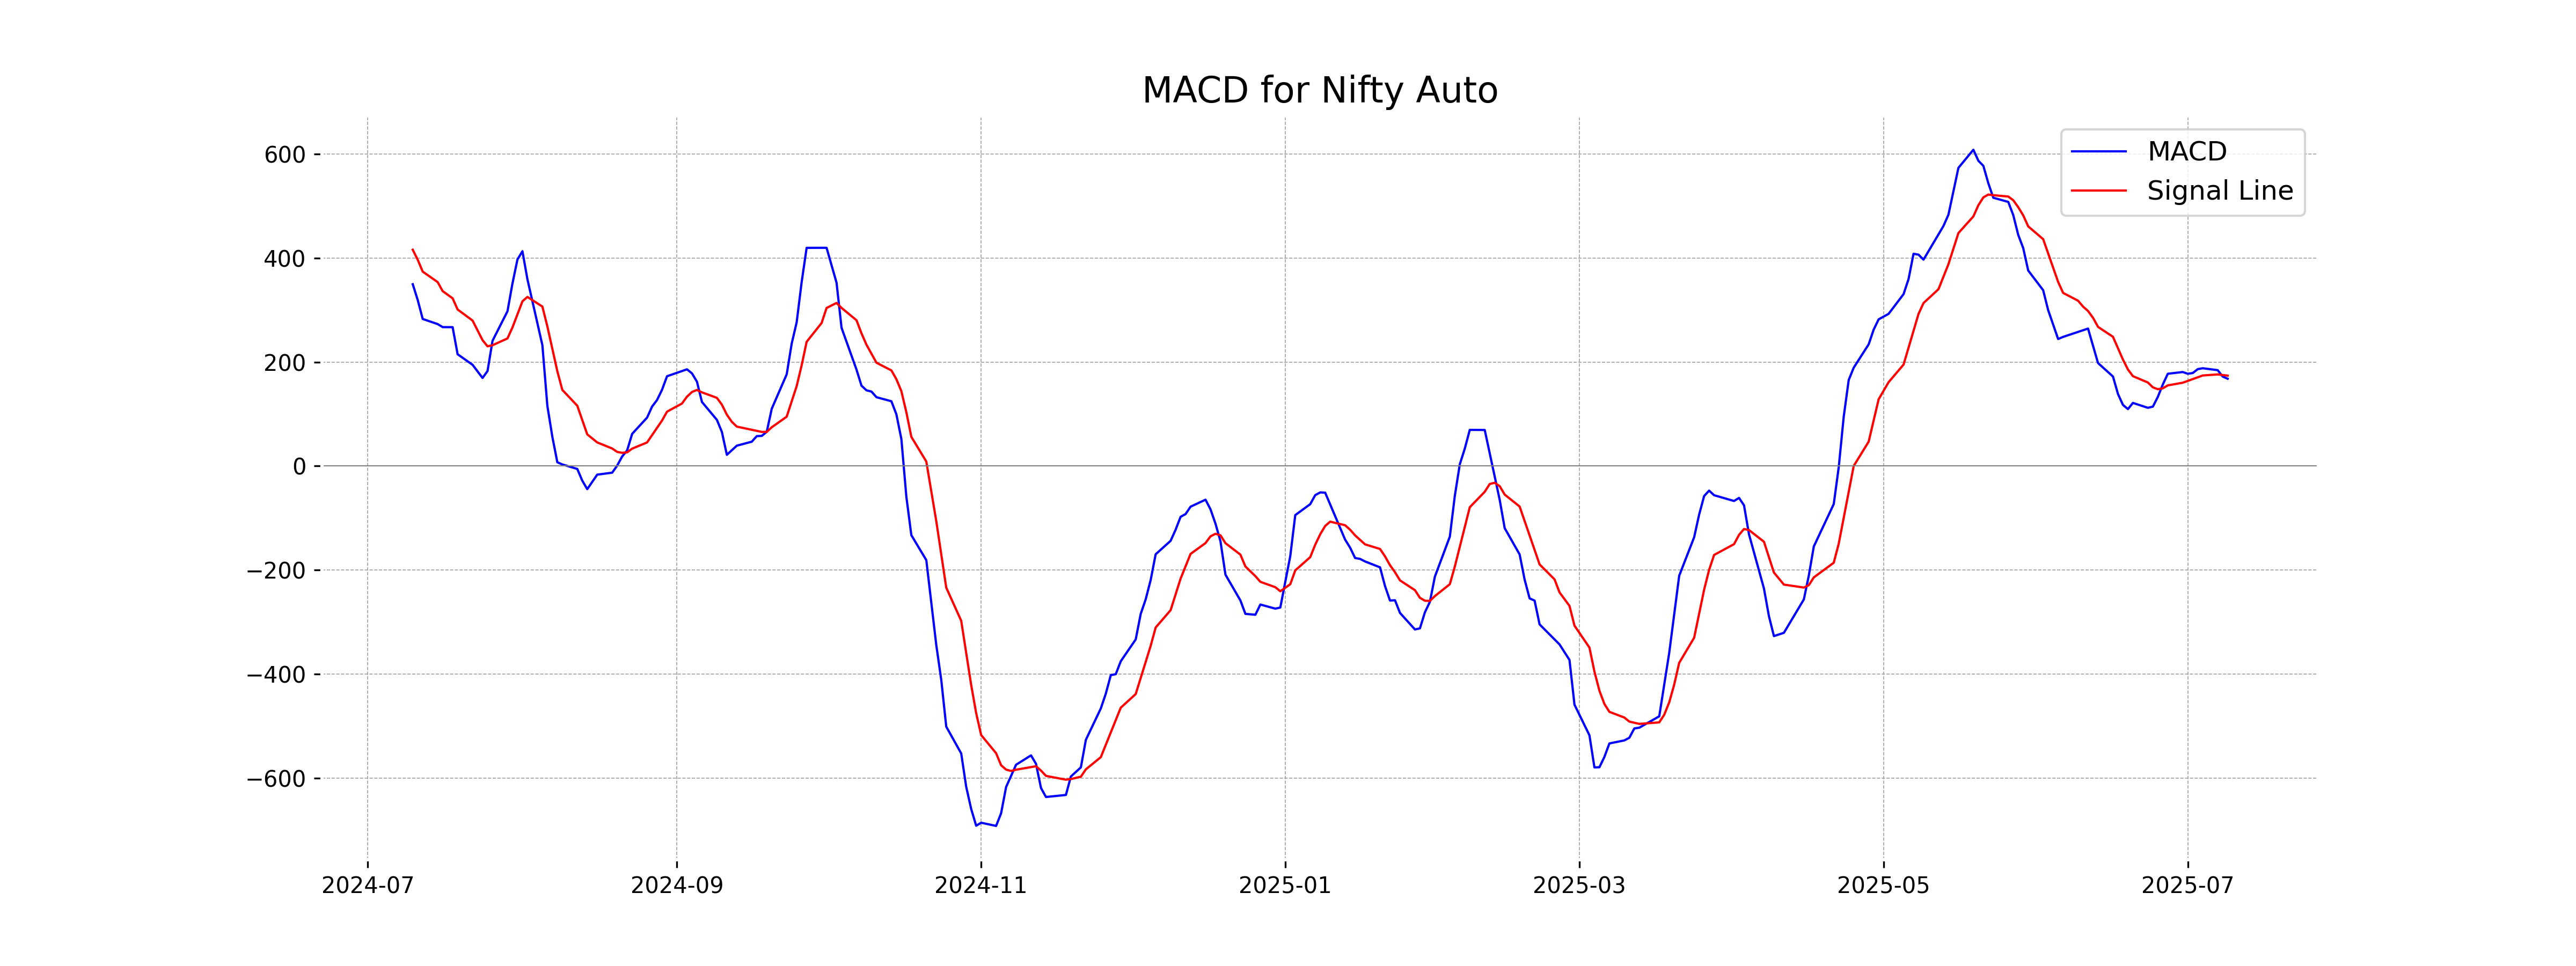
Moving Averages Trend (MACD)
The MACD for Nifty Auto stands at 168.05, with the MACD Signal at 174.04, which indicates a slight bearish divergence as the MACD is below the signal line. This suggests a potential slowdown in bullish momentum in the short term.
RSI Analysis
The RSI for Nifty Auto is 58.63, which indicates a neutral to slightly bullish sentiment. This suggests that the index is not currently in an overbought or oversold condition, and there may be room for further uptrend.
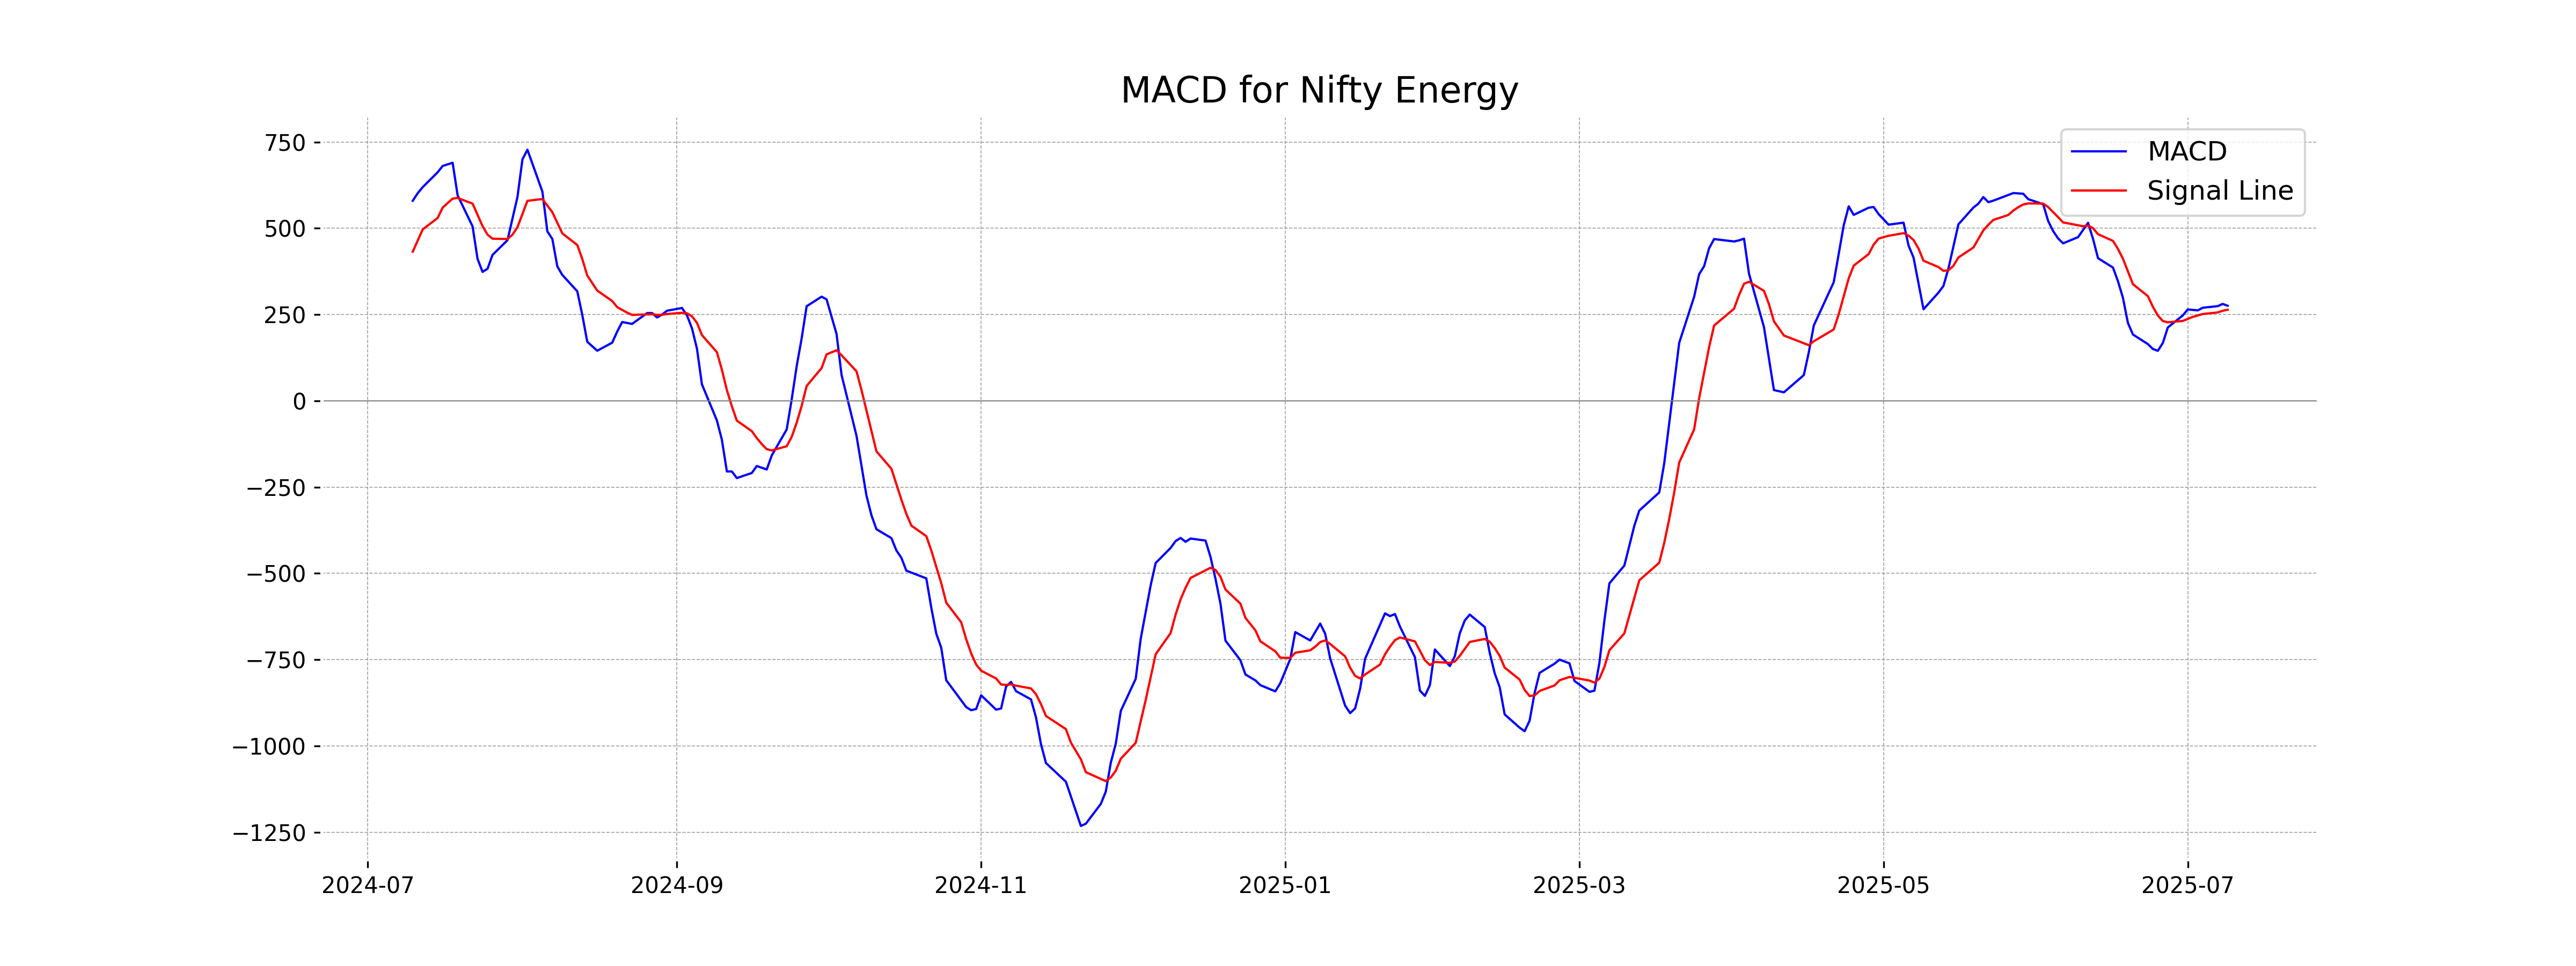
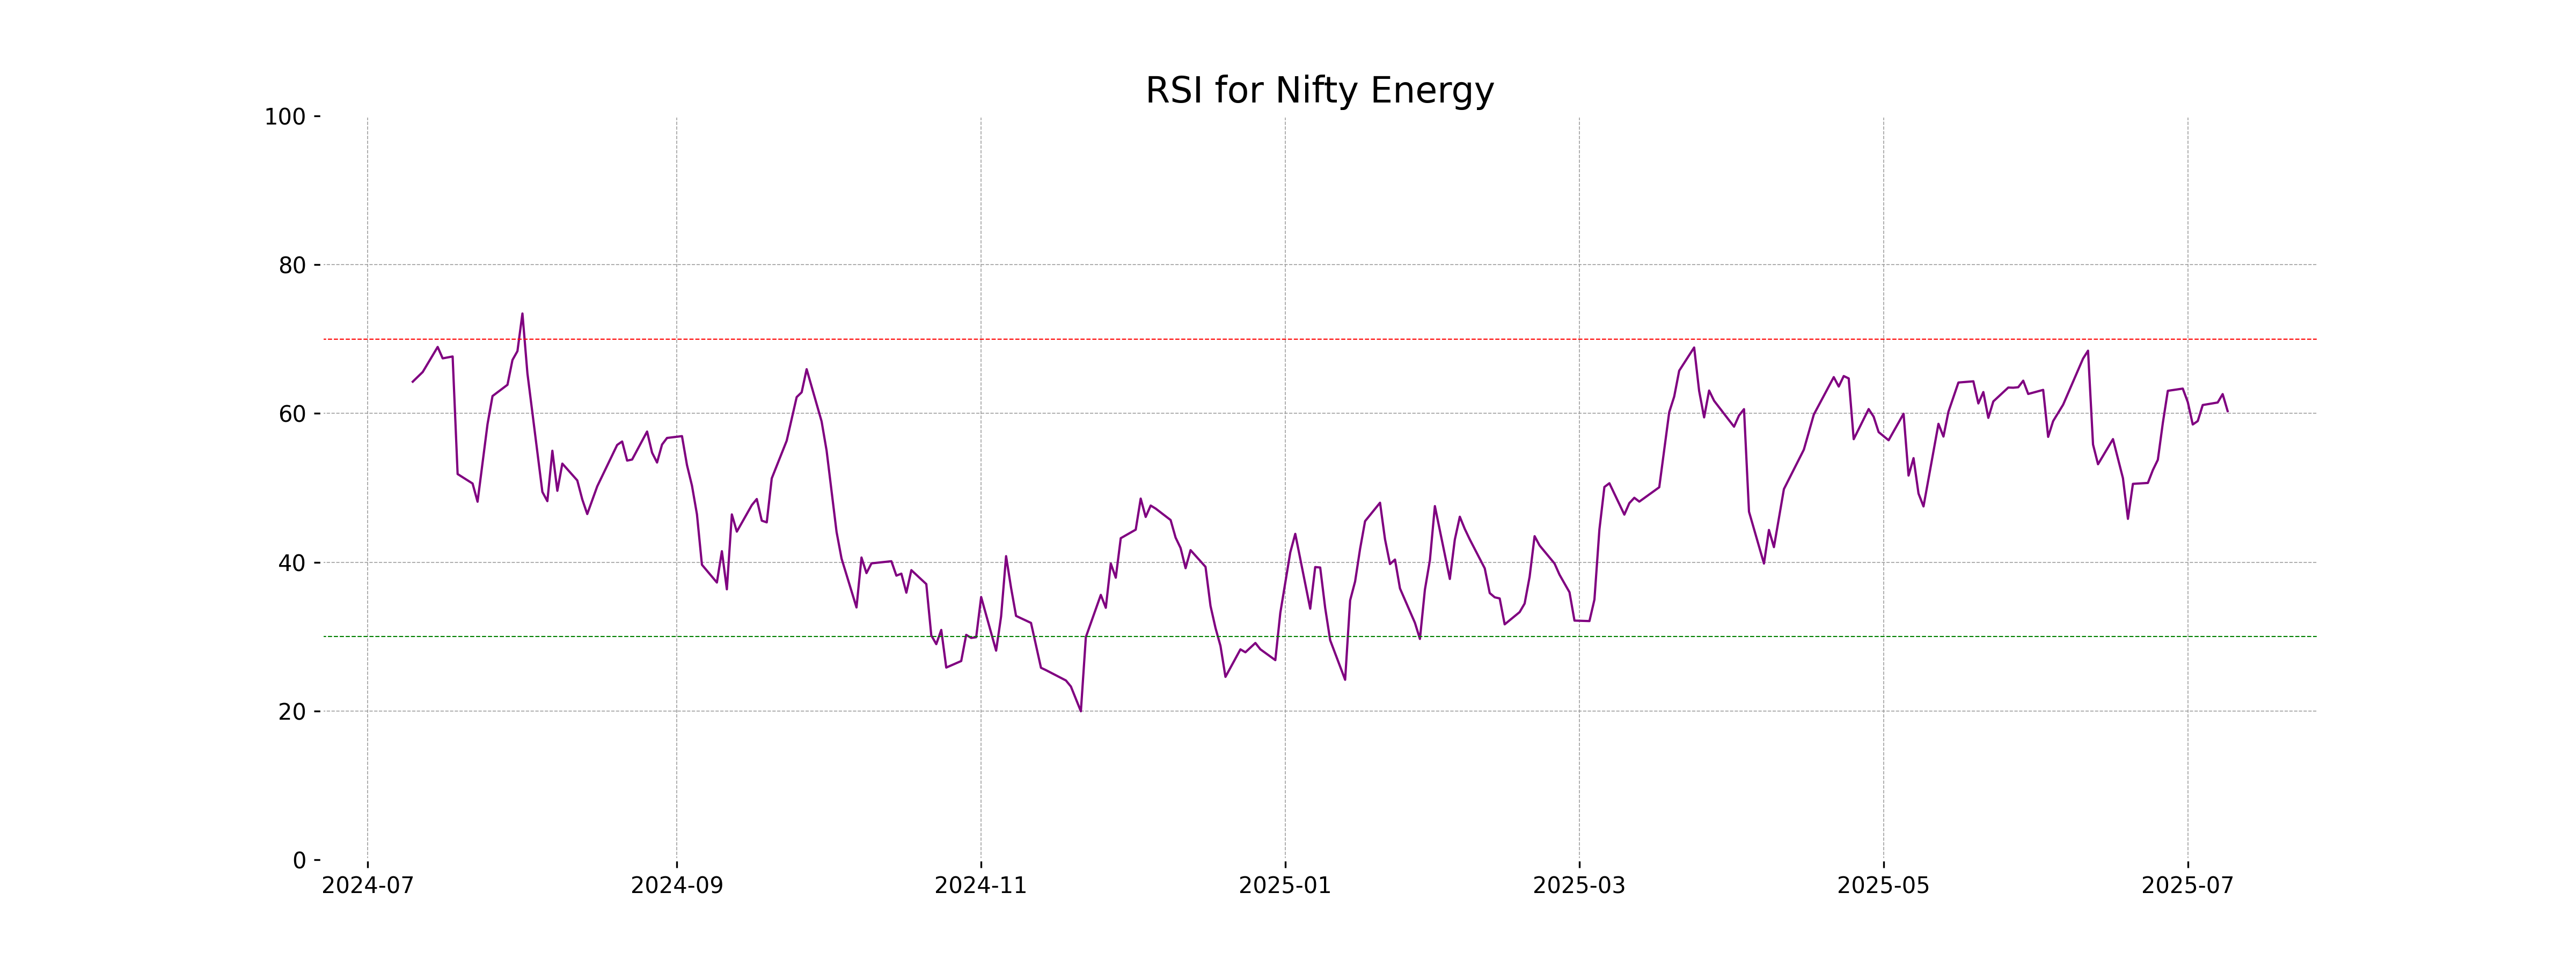
Analysis for Nifty Energy - July 09, 2025
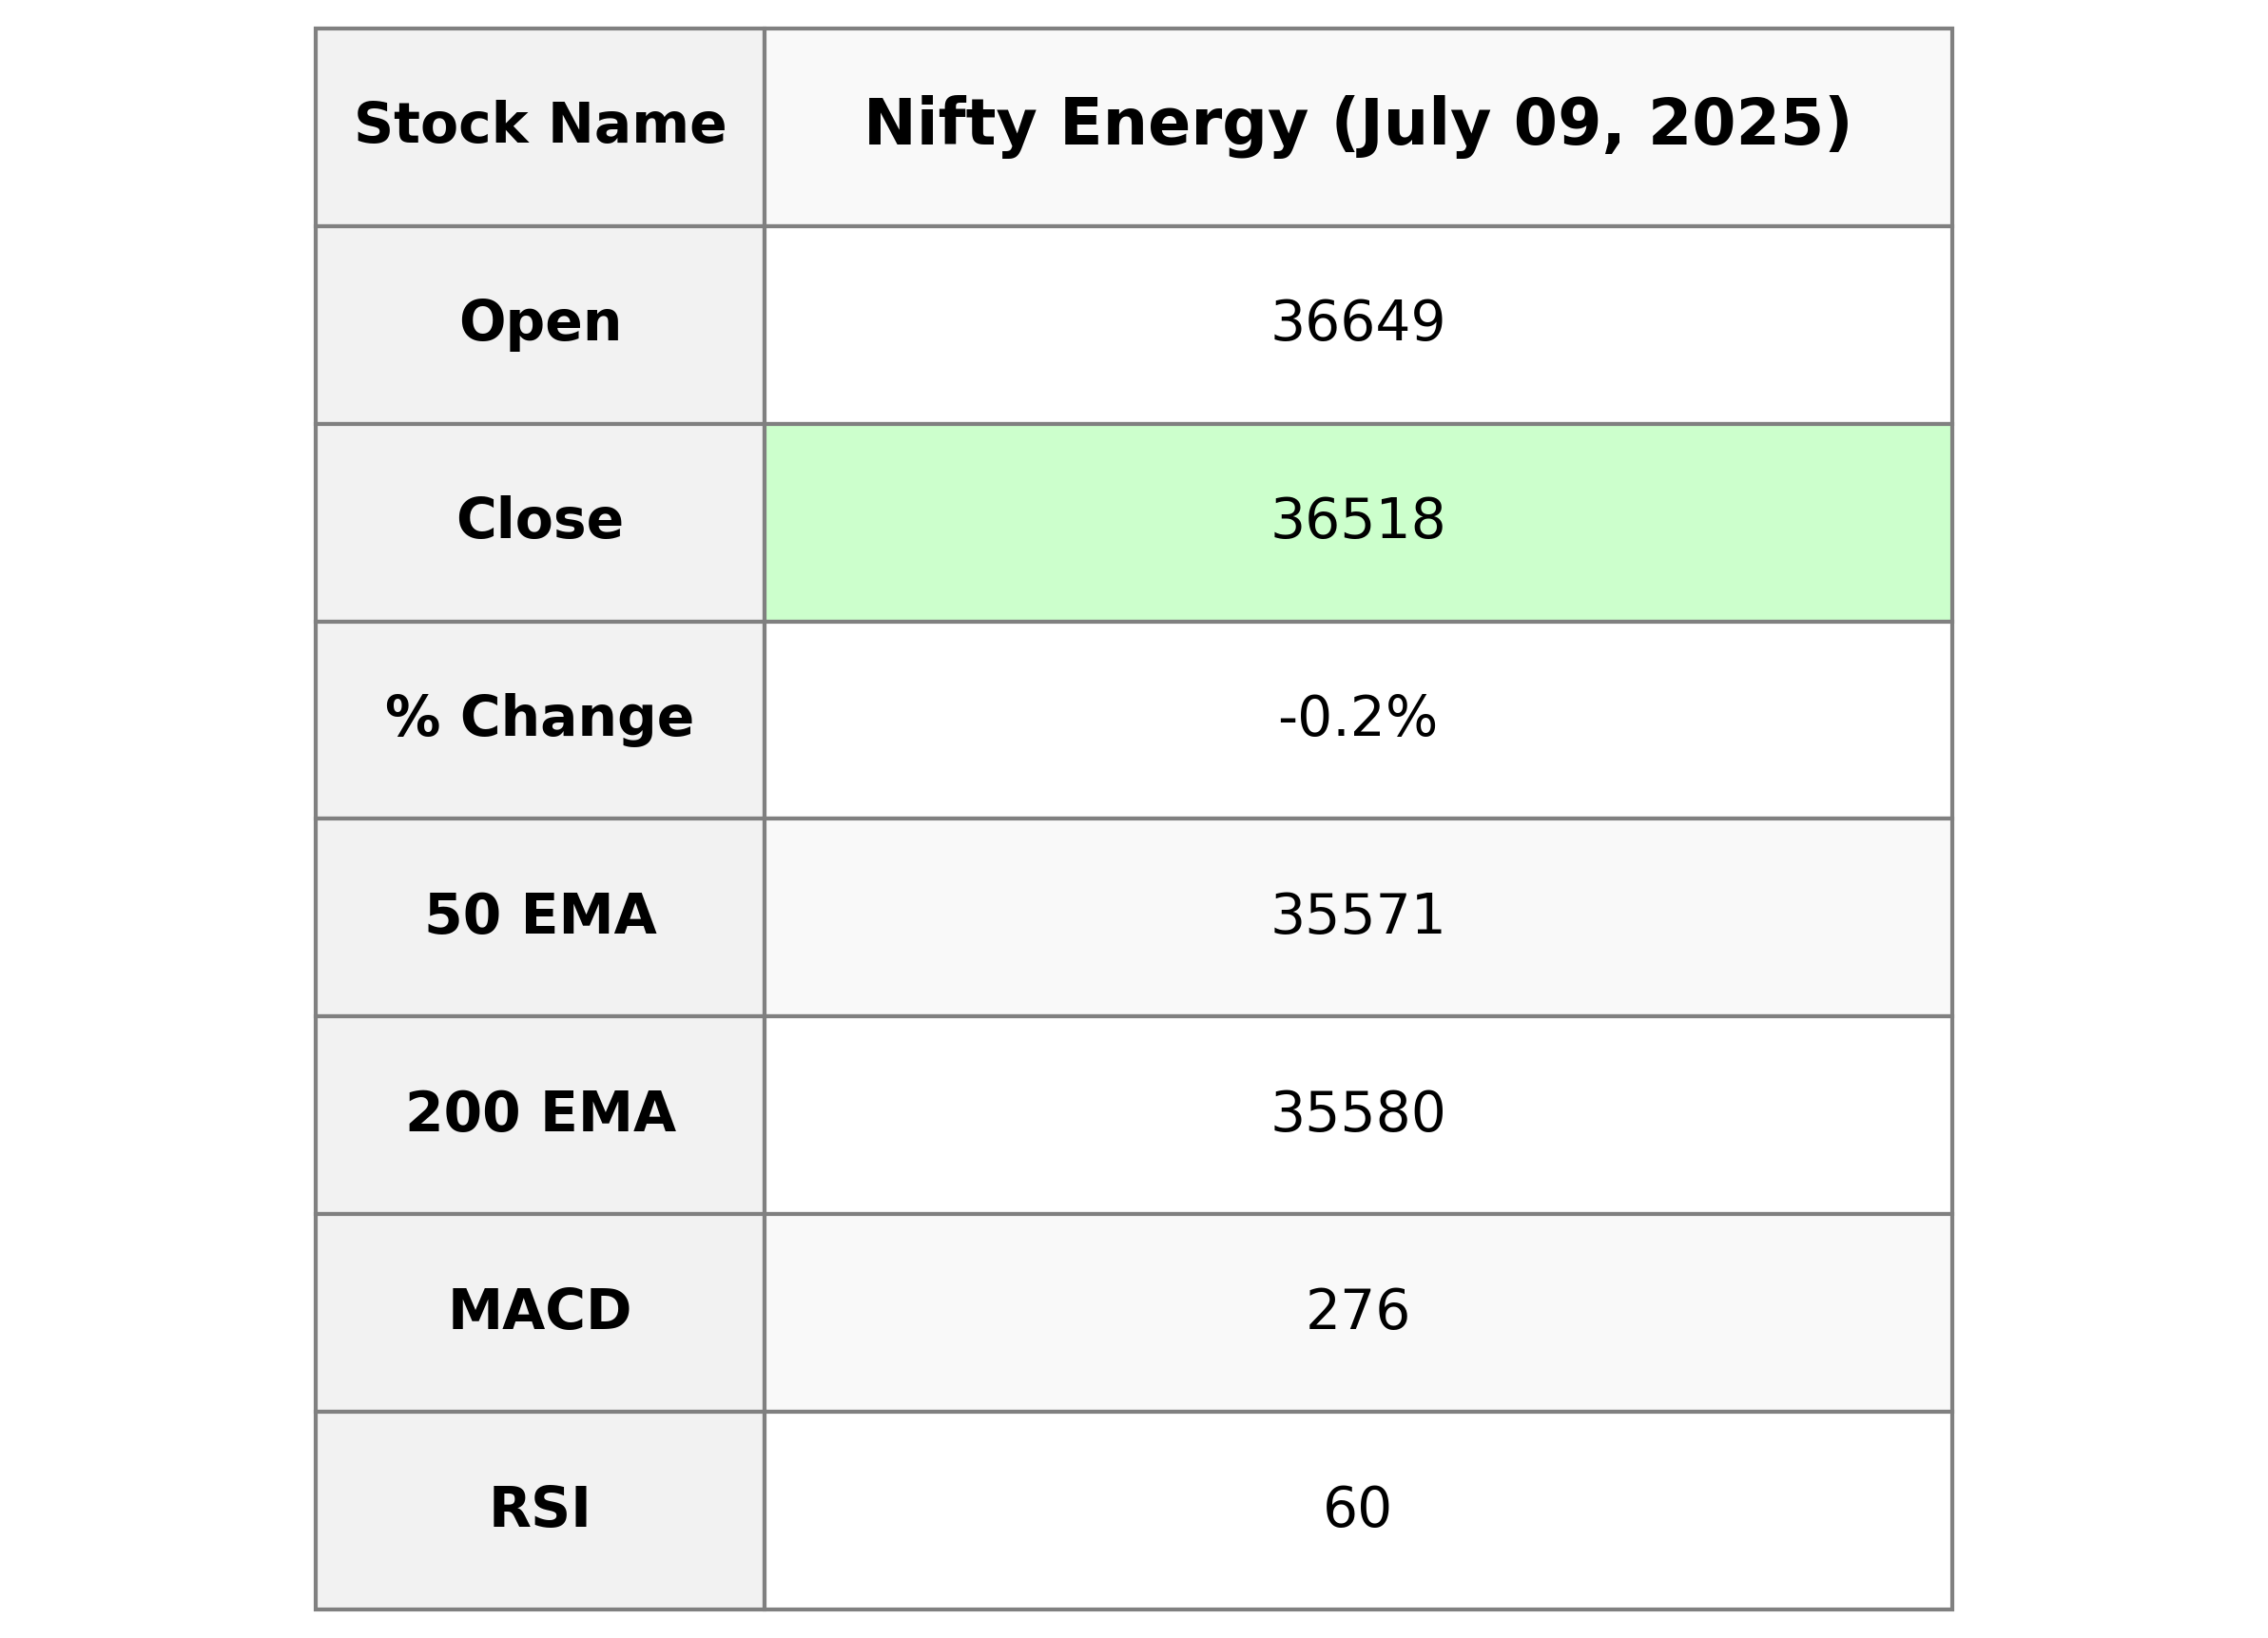
Nifty Energy opened at 36,648.85 and closed at 36,517.50, showing a slight decline with a points change of -88.35 and a percentage change of -0.24%. The 50-day and 200-day EMAs are nearly converging, suggesting a steady trend near 35,571.30 and 35,579.54, respectively. The RSI stands at 60.31, indicating the stock is in neutral to slightly overbought territory, and the MACD indicates minor bullish momentum with a value of 275.56.
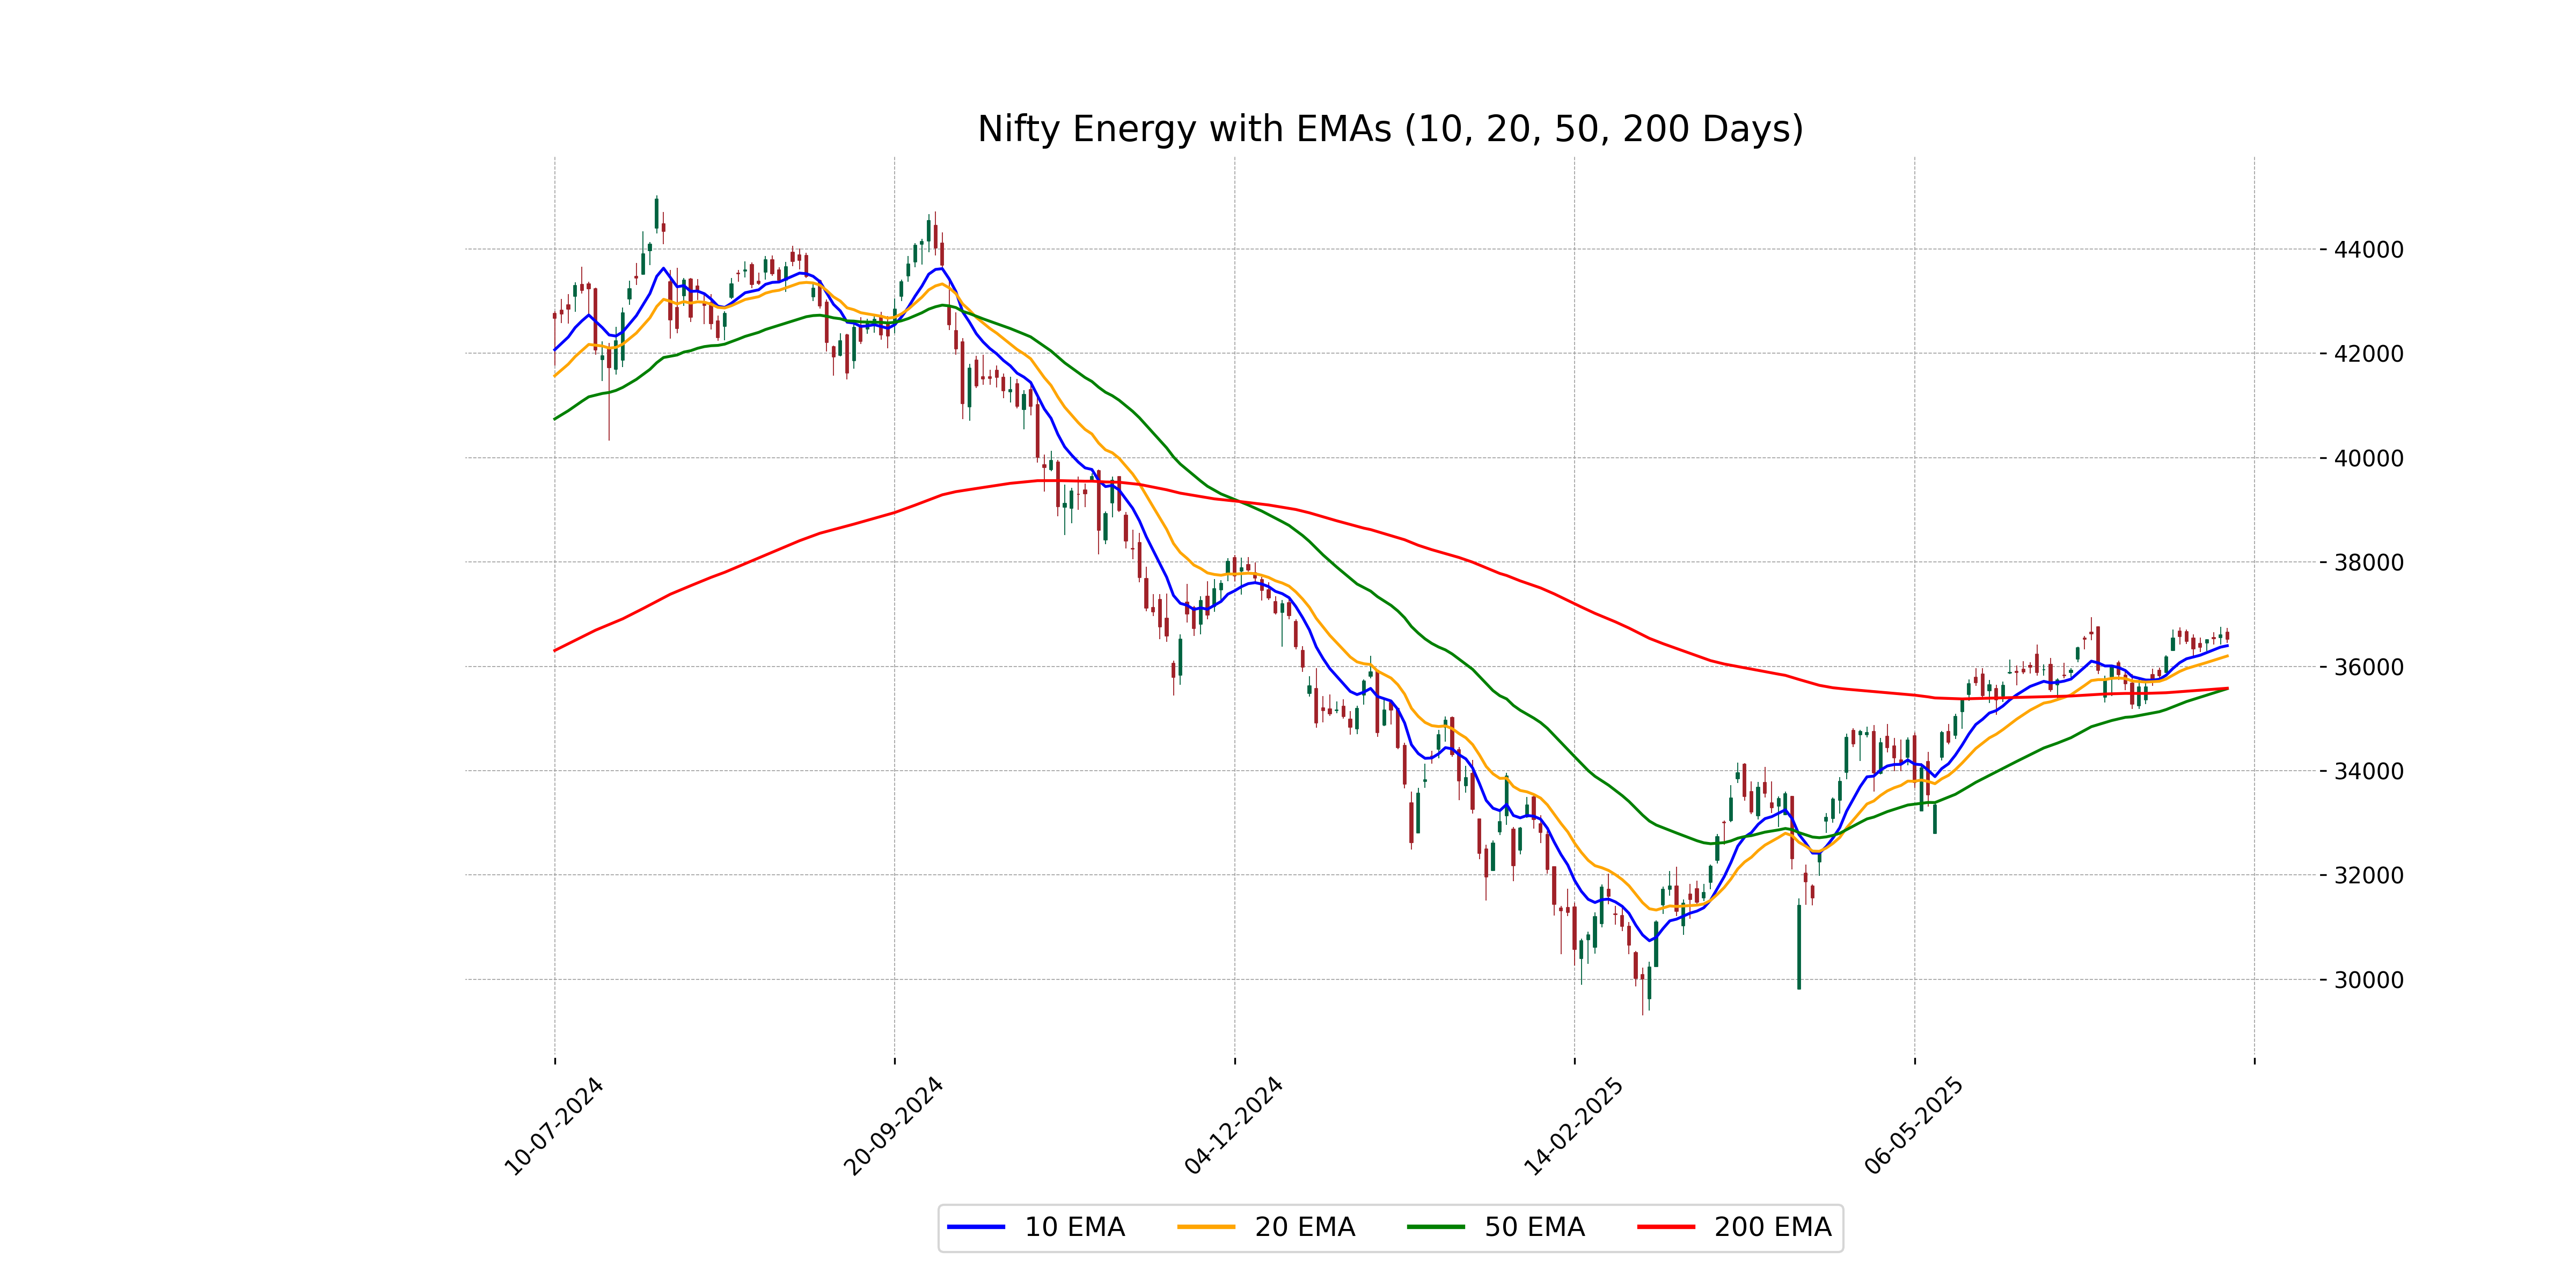
Relationship with Key Moving Averages
Nifty Energy closed at 36,517.5, slightly below its 10 EMA of 36,394.64, indicating mild bearish momentum. However, it remains above both the 50 EMA of 35,571.30 and the 200 EMA of 35,579.54, suggesting long-term bullish strength.
Moving Averages Trend (MACD)
Based on the data, Nifty Energy's MACD value is 275.56, which is above its MACD Signal line at 263.98. This indicates a potential bullish momentum, suggesting that the price may continue to rise if the trend persists. However, the negative percentage change in the latest close should also be considered for comprehensive analysis.
RSI Analysis
The RSI for Nifty Energy is 60.31, indicating a relatively strong position but not in overbought territory. This suggests that while the index is showing some strength, it might not yet signal an immediate overvaluation or correction. Traders could view this as a stable situation, with neither extreme bullish nor bearish momentum.
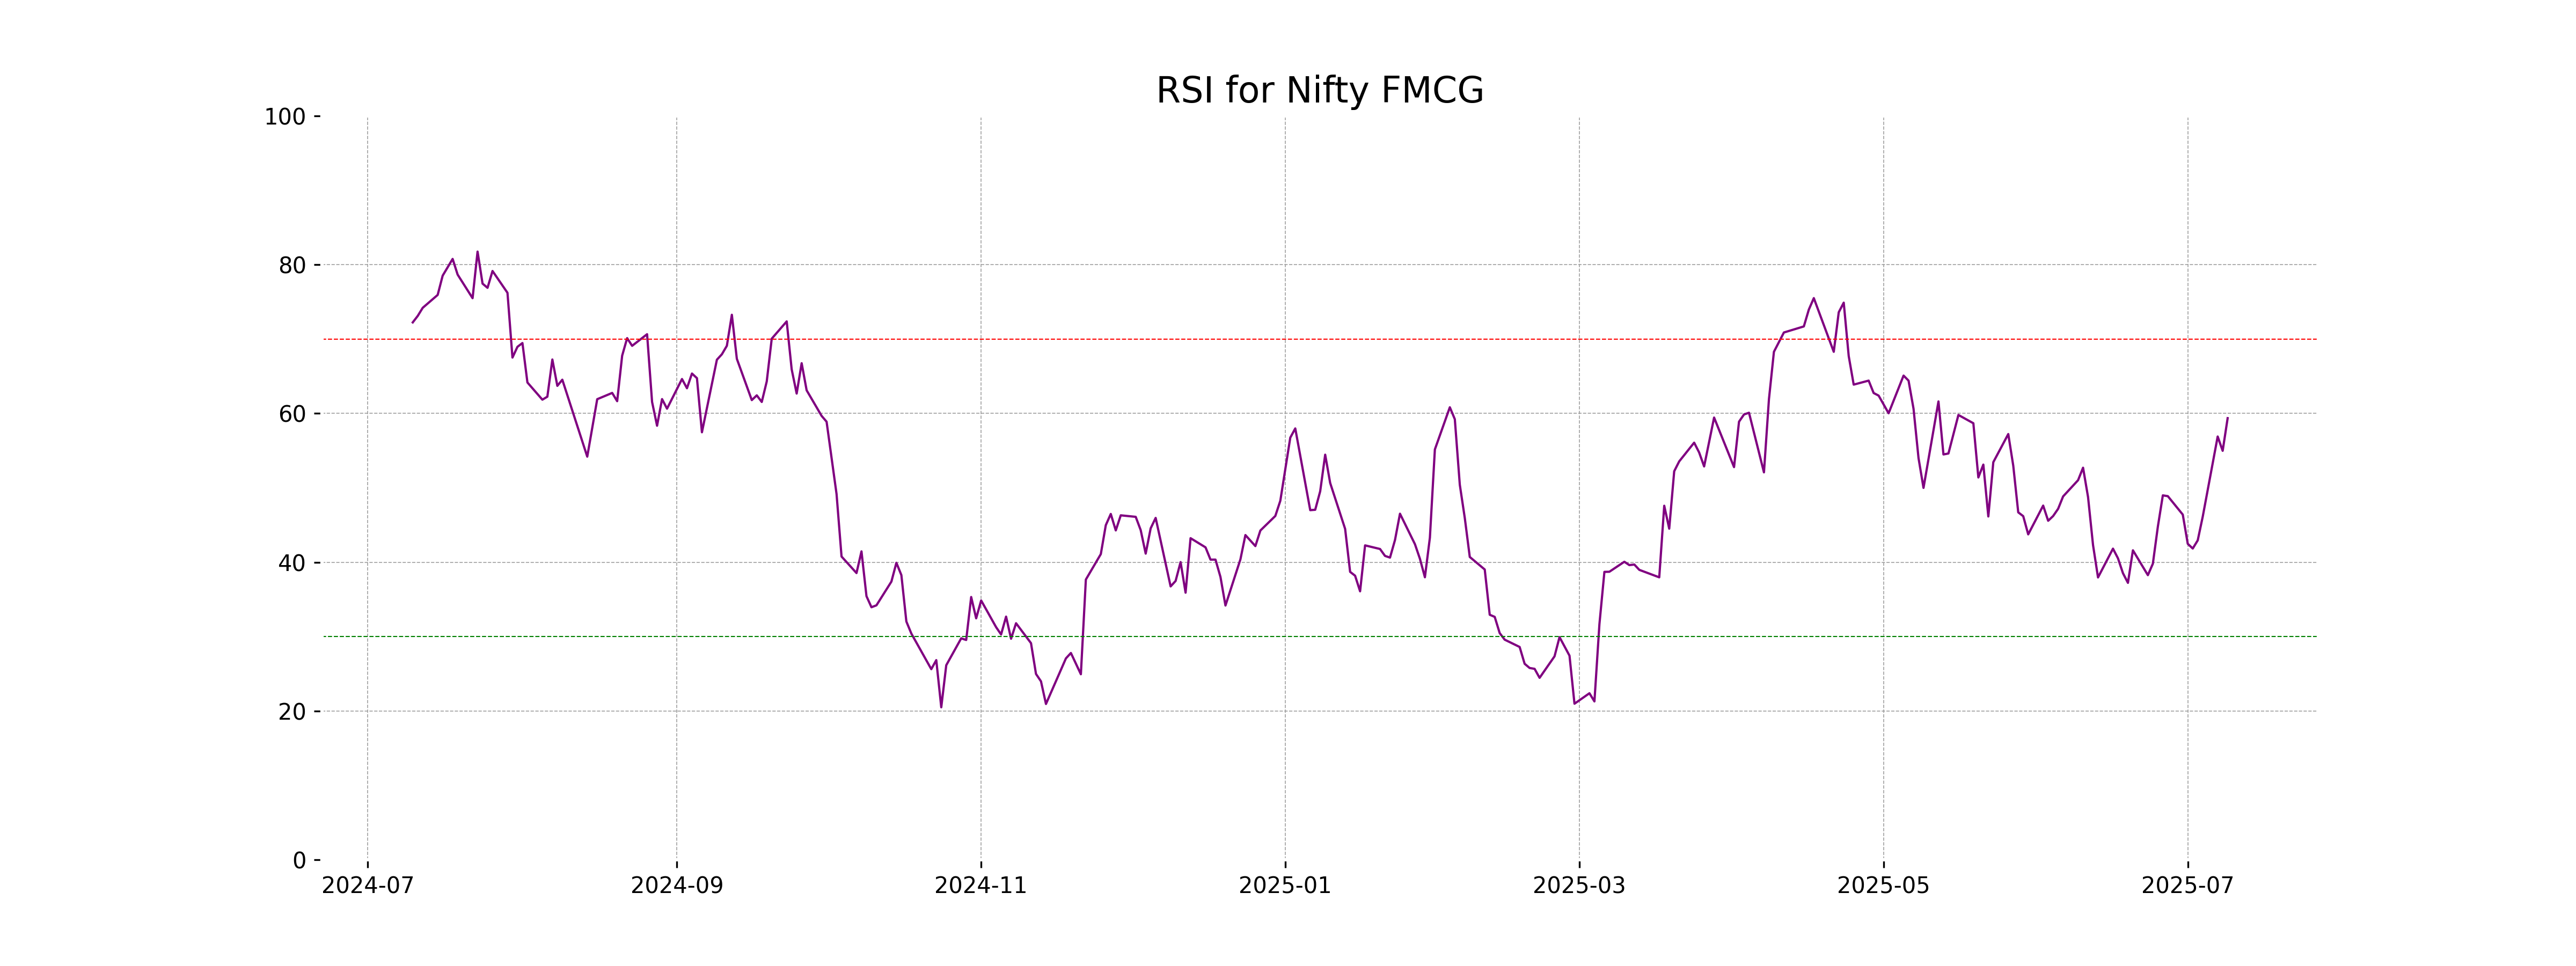
Analysis for Nifty FMCG - July 09, 2025
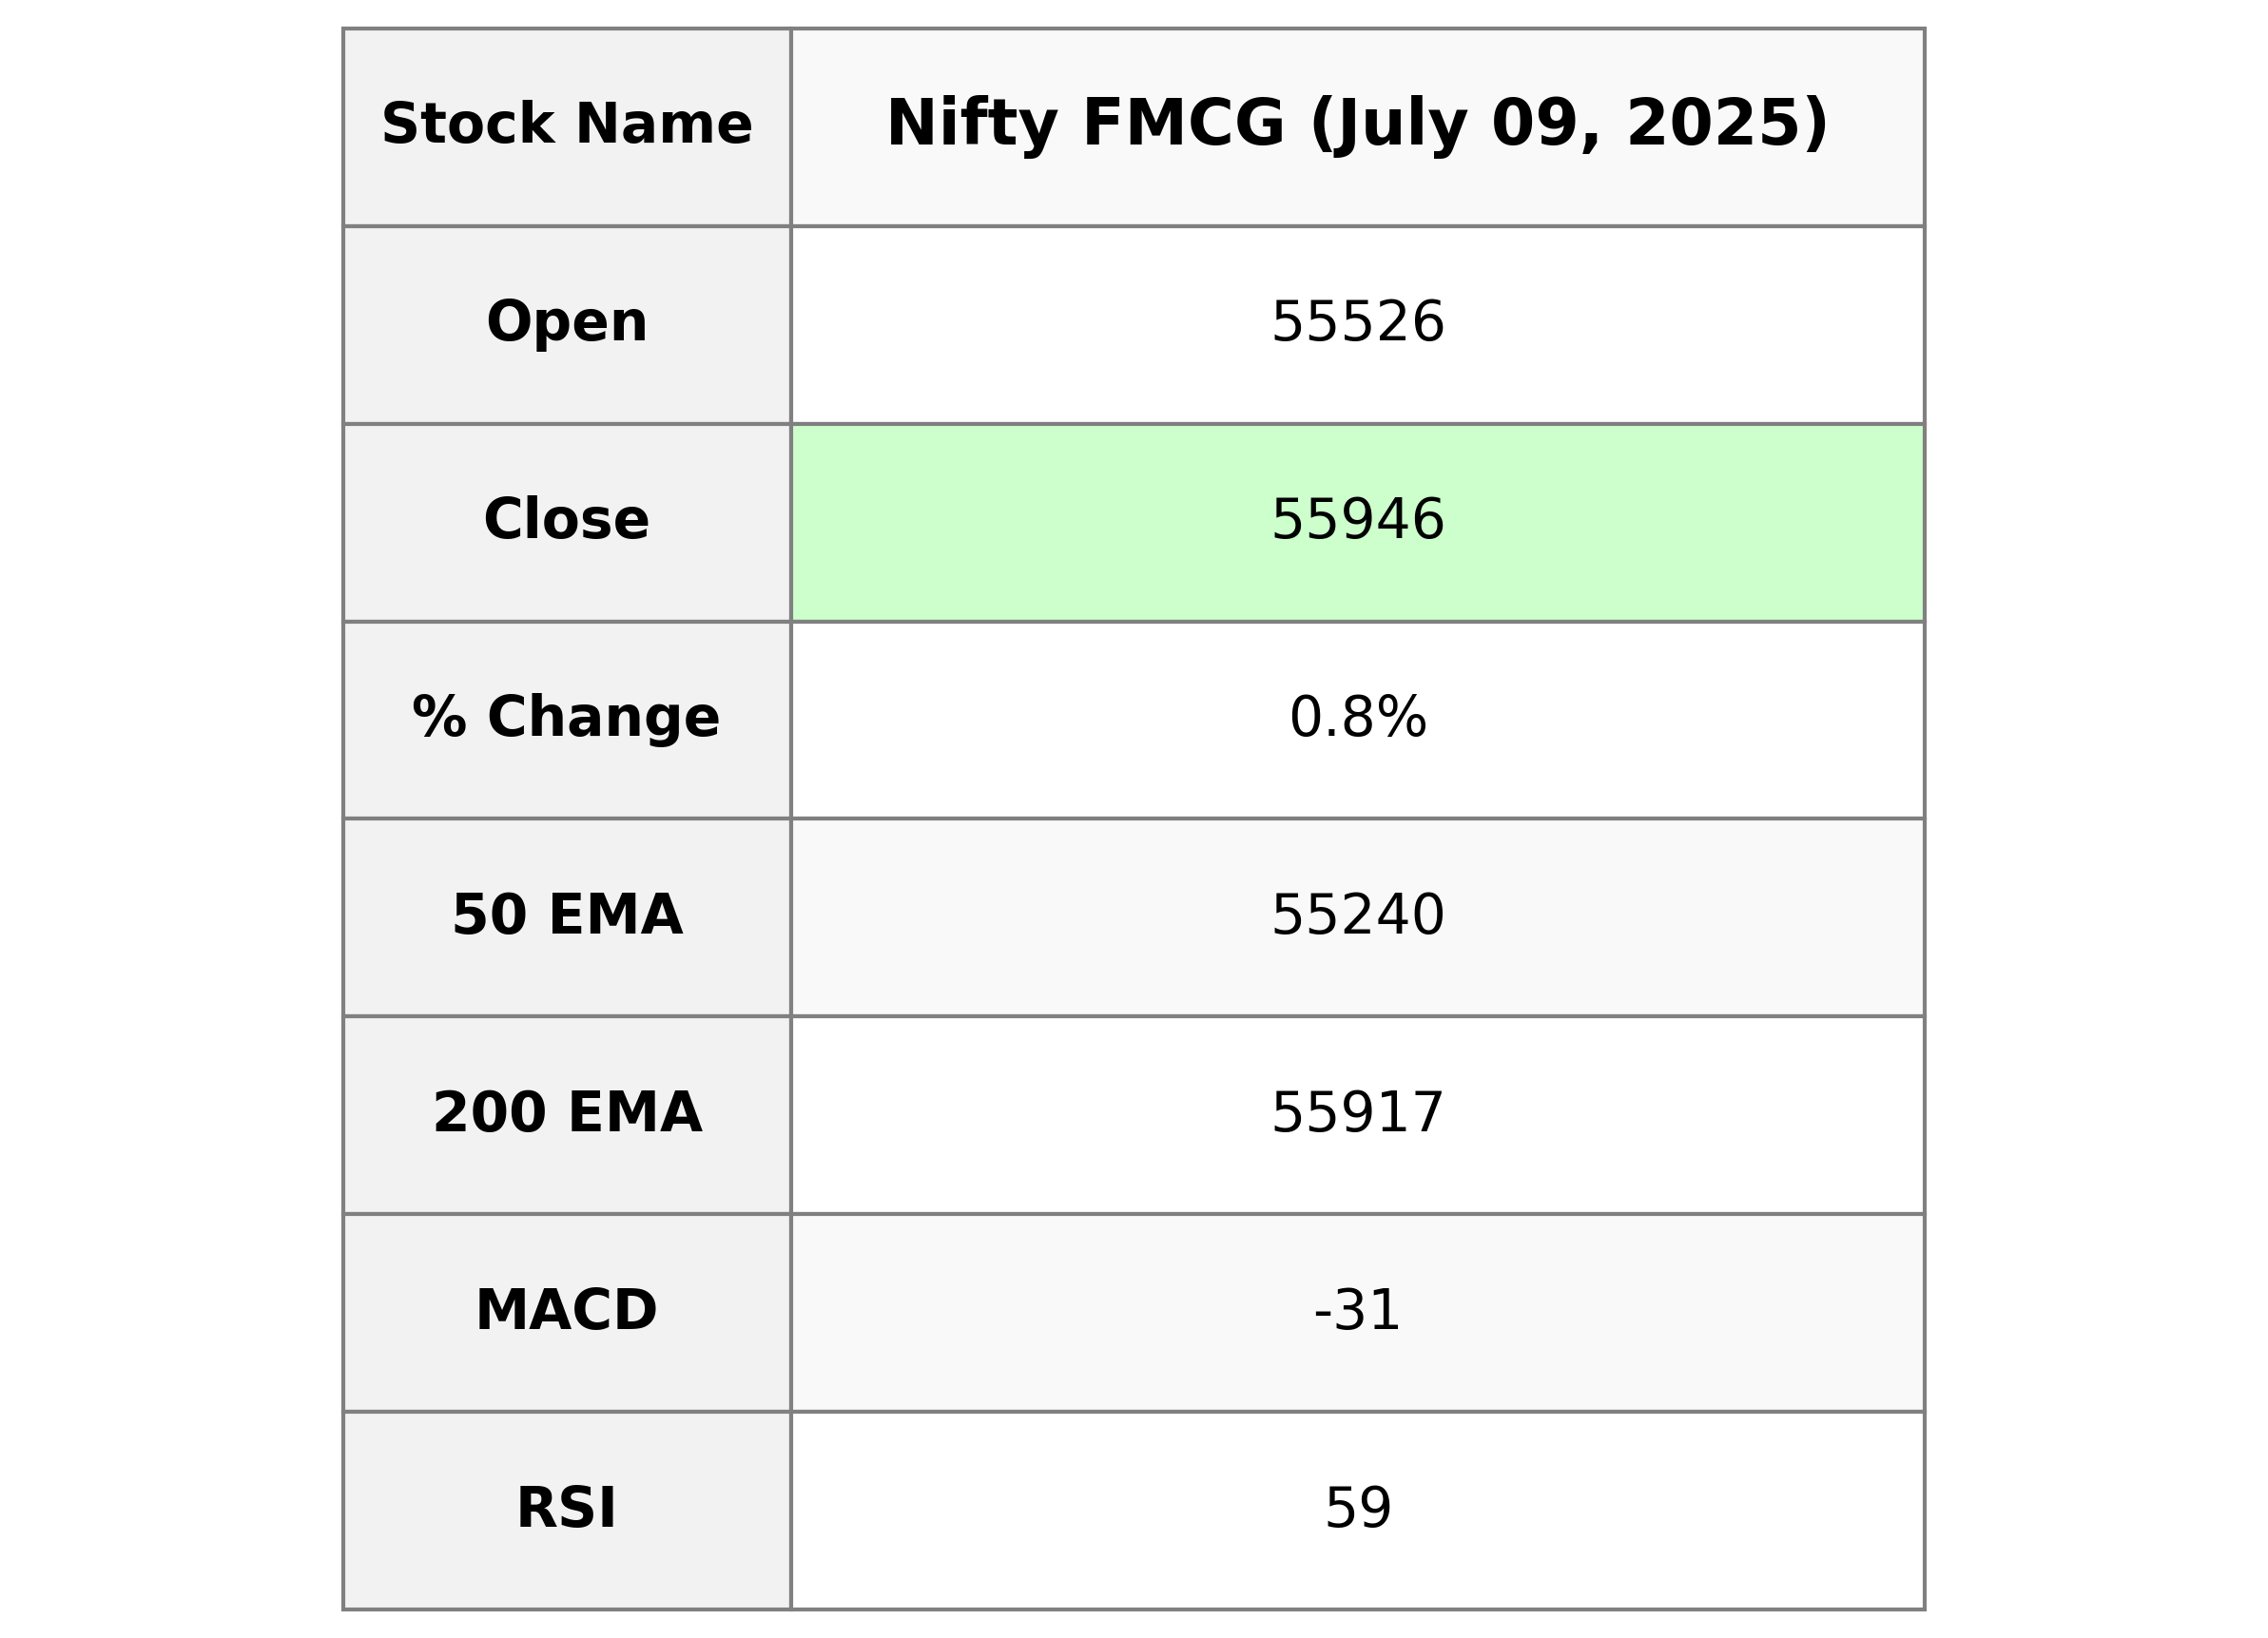
The Nifty FMCG index opened at 55,526.40 and closed higher at 55,946.20, with a percentage change of approximately 0.80%. The index experienced a gain of 442.20 points. Technical indicators show the index trading above its 50-day and 10-day EMAs, with an RSI of 59.37 indicating a moderately strong momentum.
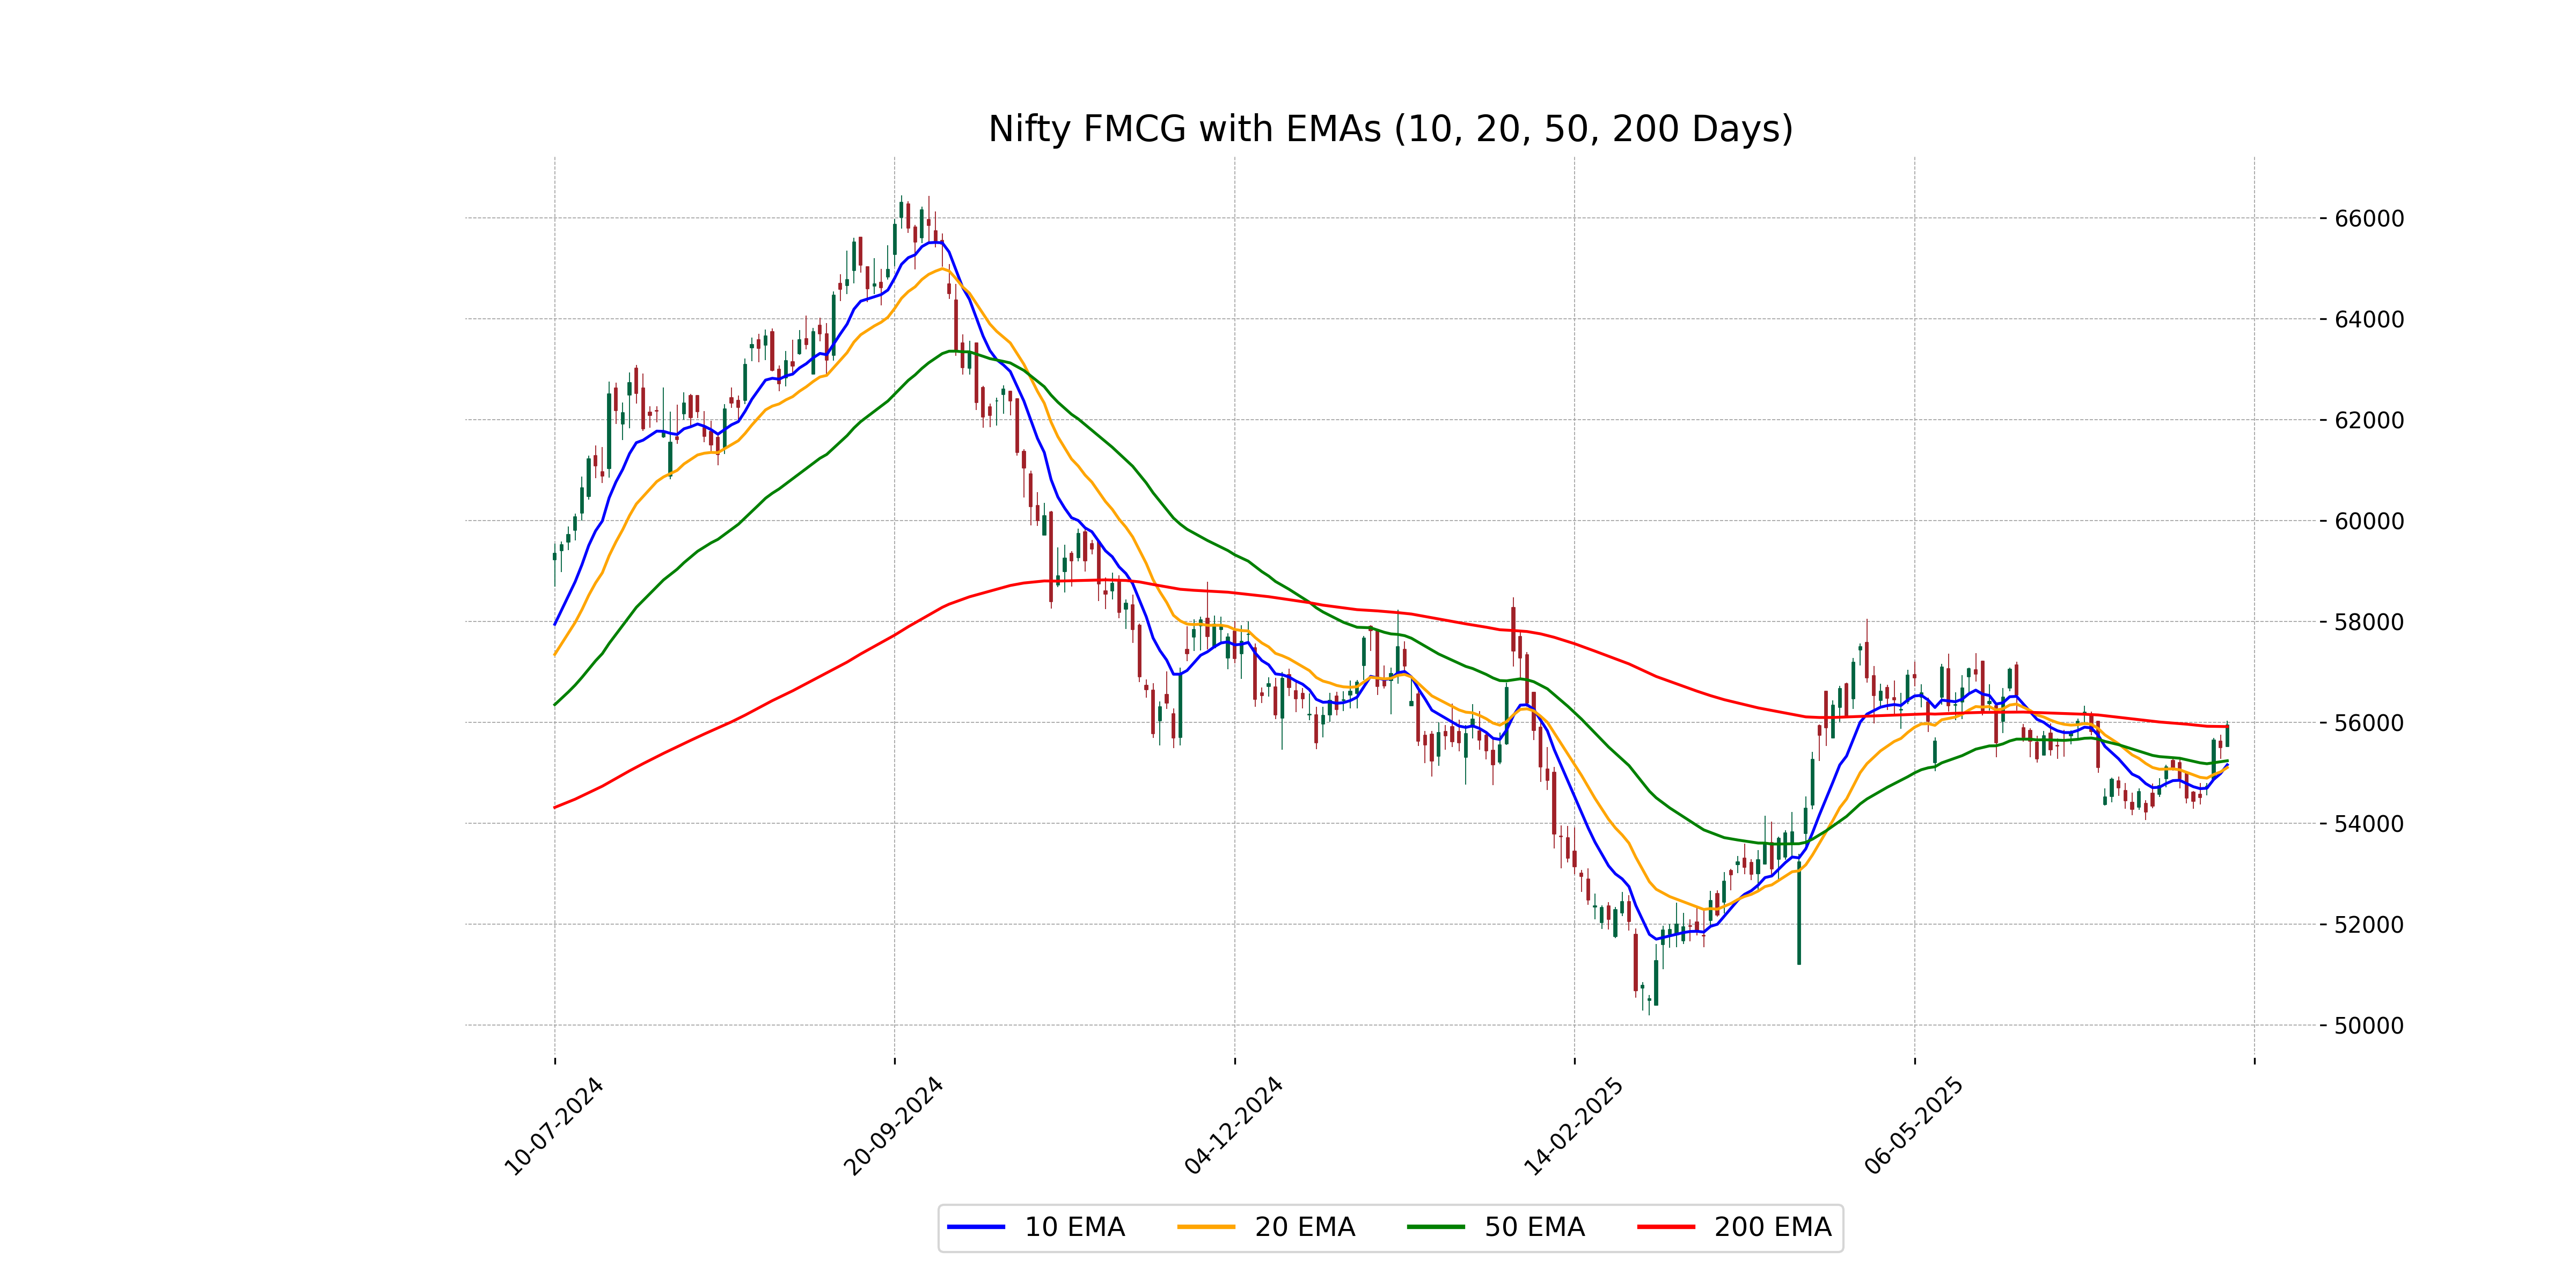
Relationship with Key Moving Averages
Nifty FMCG closed above its 10 and 20 EMA, indicating a short-term bullish trend, and also exceeded its 50 EMA, suggesting strengthening momentum. However, it is very close to its 200 EMA, indicating the possibility of a strong resistance level around this point.
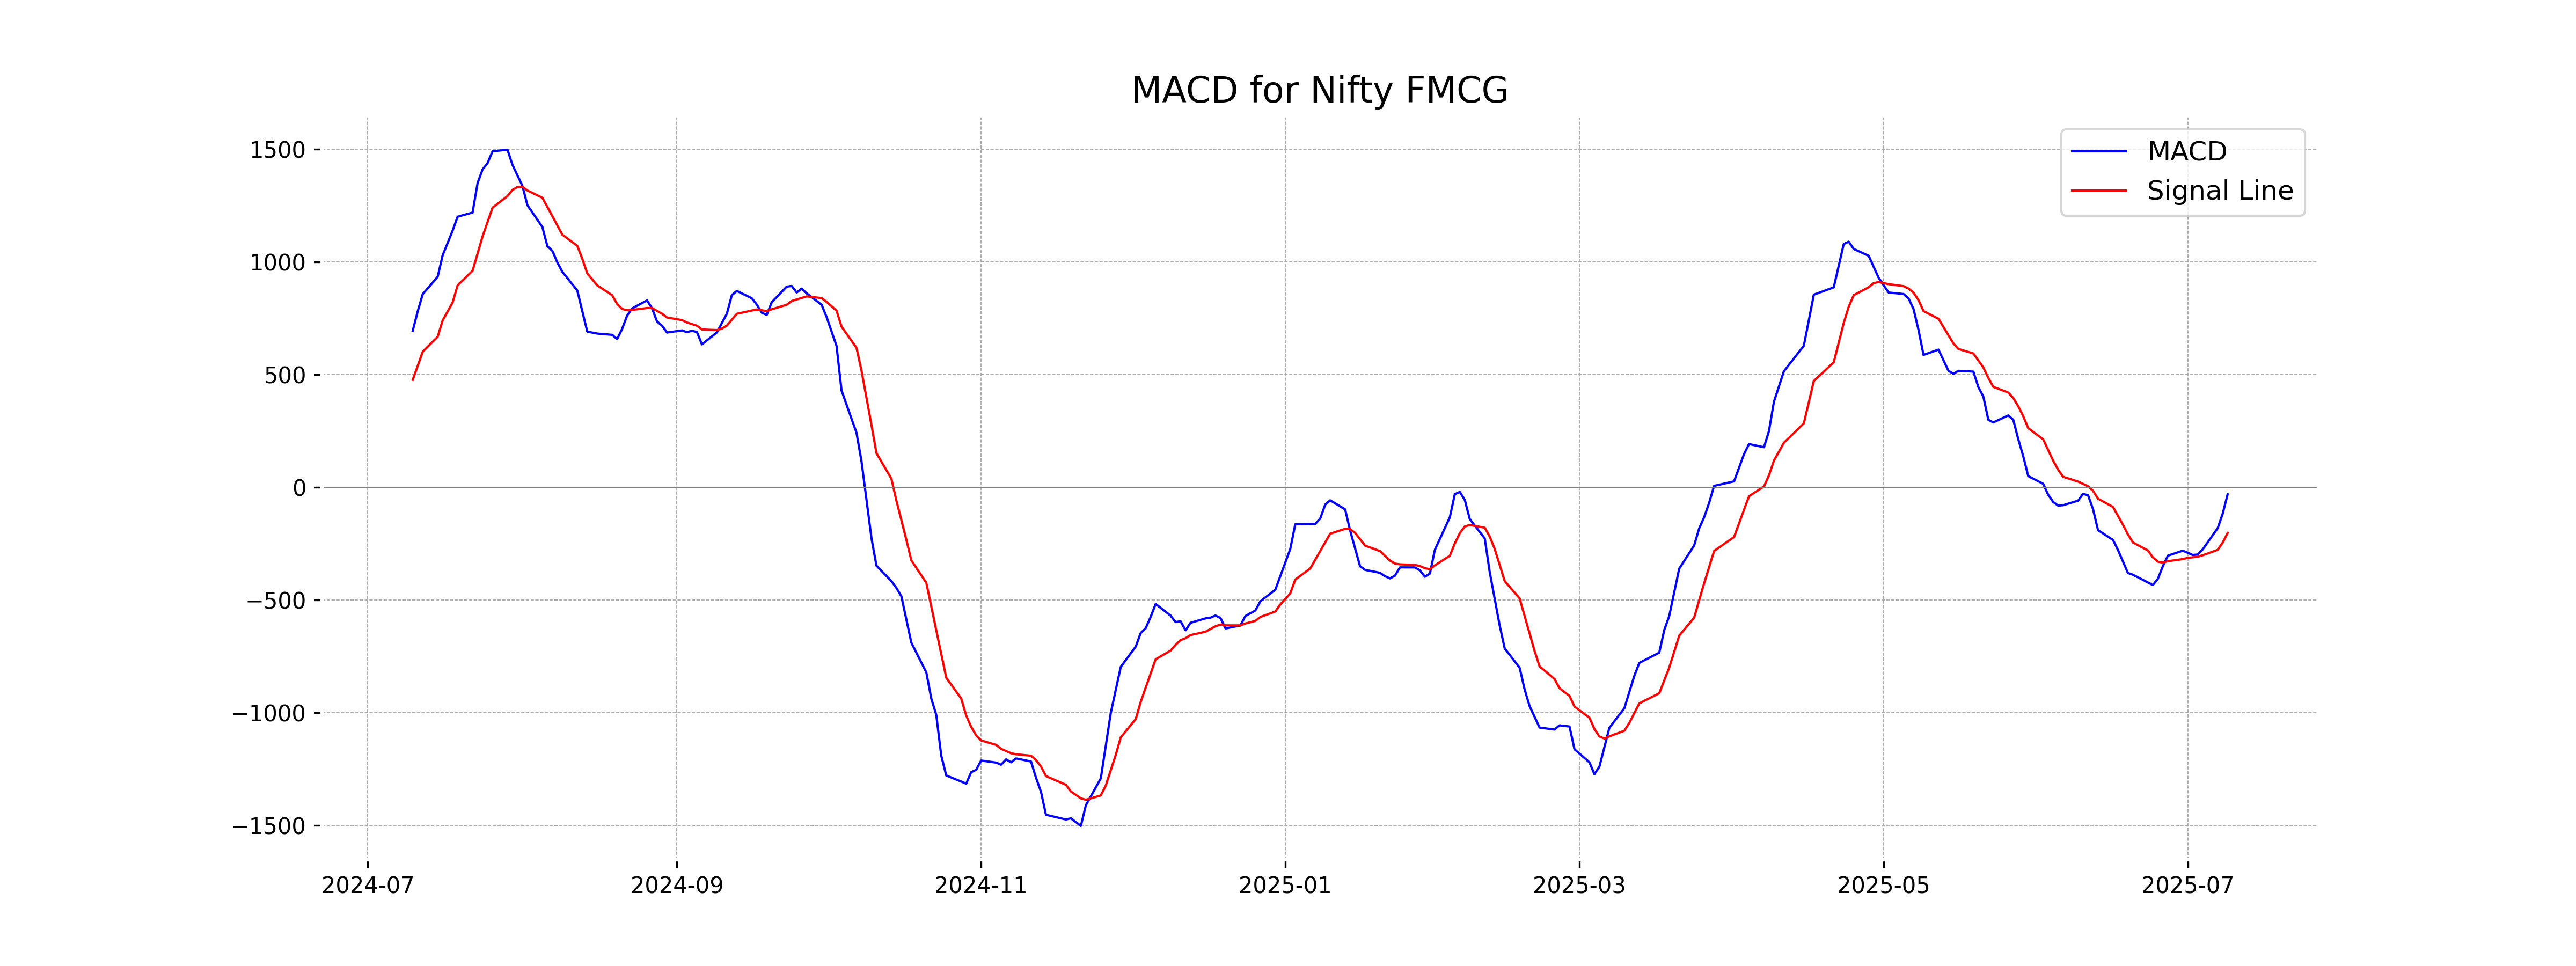
Moving Averages Trend (MACD)
The MACD value for Nifty FMCG is -30.73, while the MACD Signal is -202.33. This indicates a potential bullish crossover, as the MACD is moving towards the signal line. The negative values suggest the potential for continued upward momentum if the crossover completes.
RSI Analysis
The current RSI for Nifty FMCG stands at 59.37, which indicates a neutral to slightly bullish momentum as it hovers below the commonly overbought threshold of 70. This suggests that the index may have room to move upwards before hitting potential resistance levels.
Analysis for Nifty Infra - July 09, 2025

The Nifty Infra opened at 9481.25 and closed at 9419.70, experiencing a decline of -0.65% from the previous close. The stock's RSI is at 63.40, indicating a relatively strong momentum. Additionally, MACD is above the signal line, suggesting potential bullish trends, despite the day's negative performance.
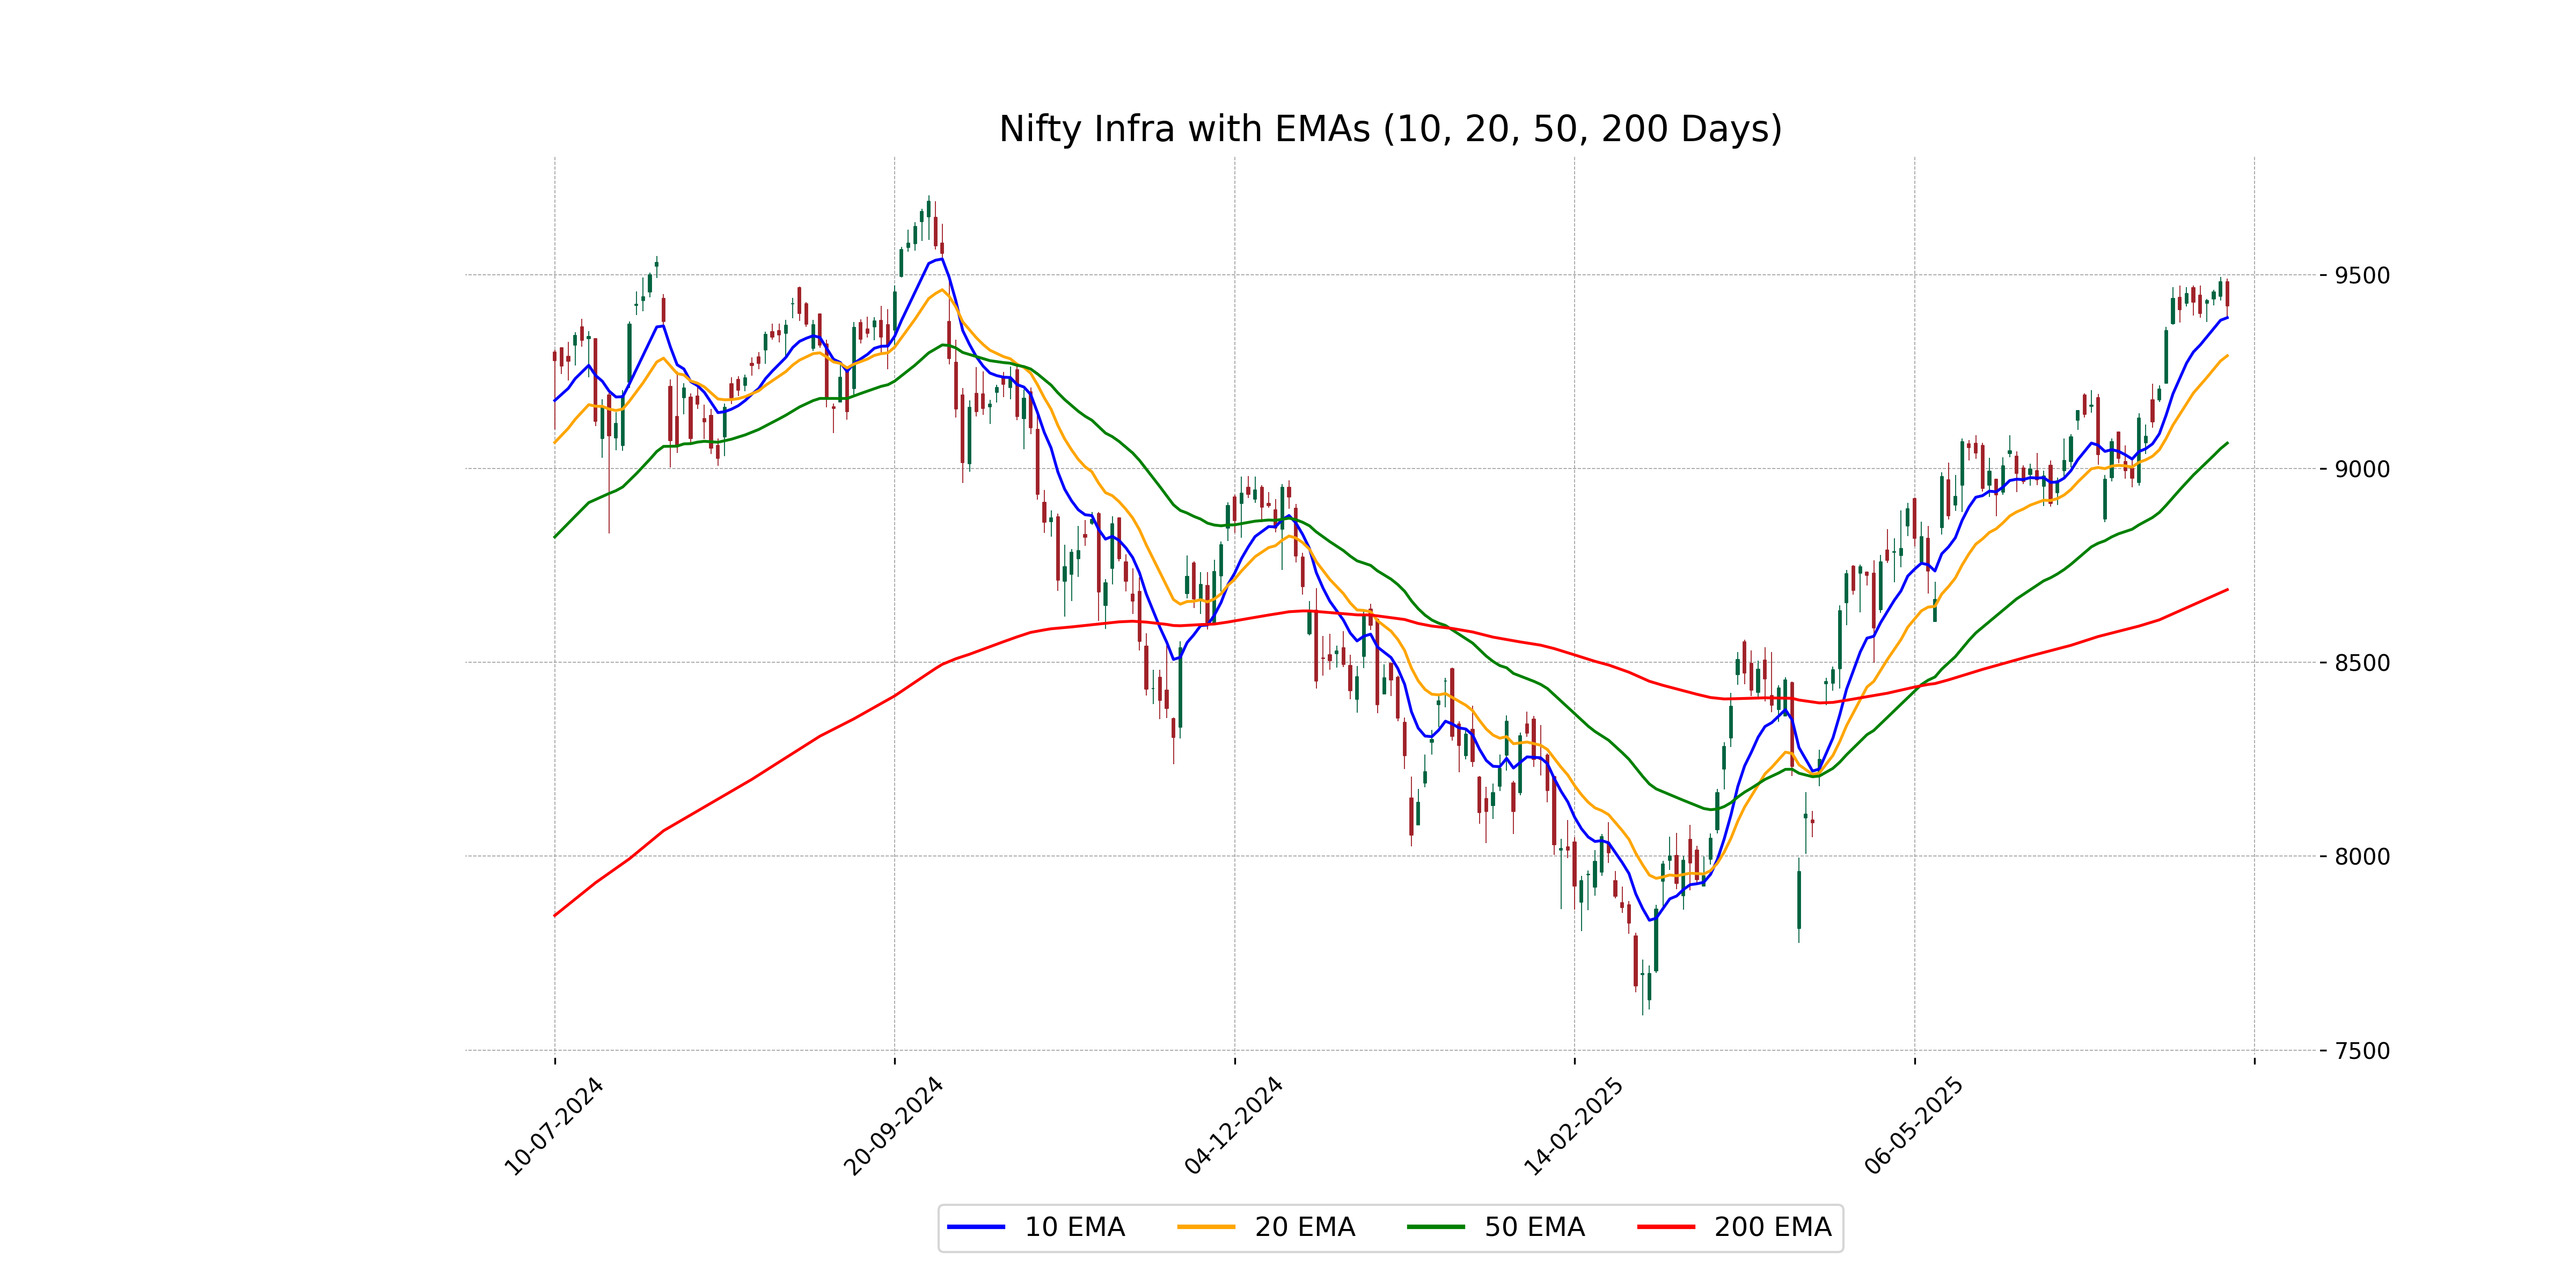
Relationship with Key Moving Averages
Nifty Infra closed at 9419.70, above the 50 EMA of 9065.67 and significantly above the 200 EMA of 8687.62, indicating a bullish trend in the medium to long term. However, it sits slightly above the 10-day EMA of 9389.23, suggesting a near-level short-term trend.
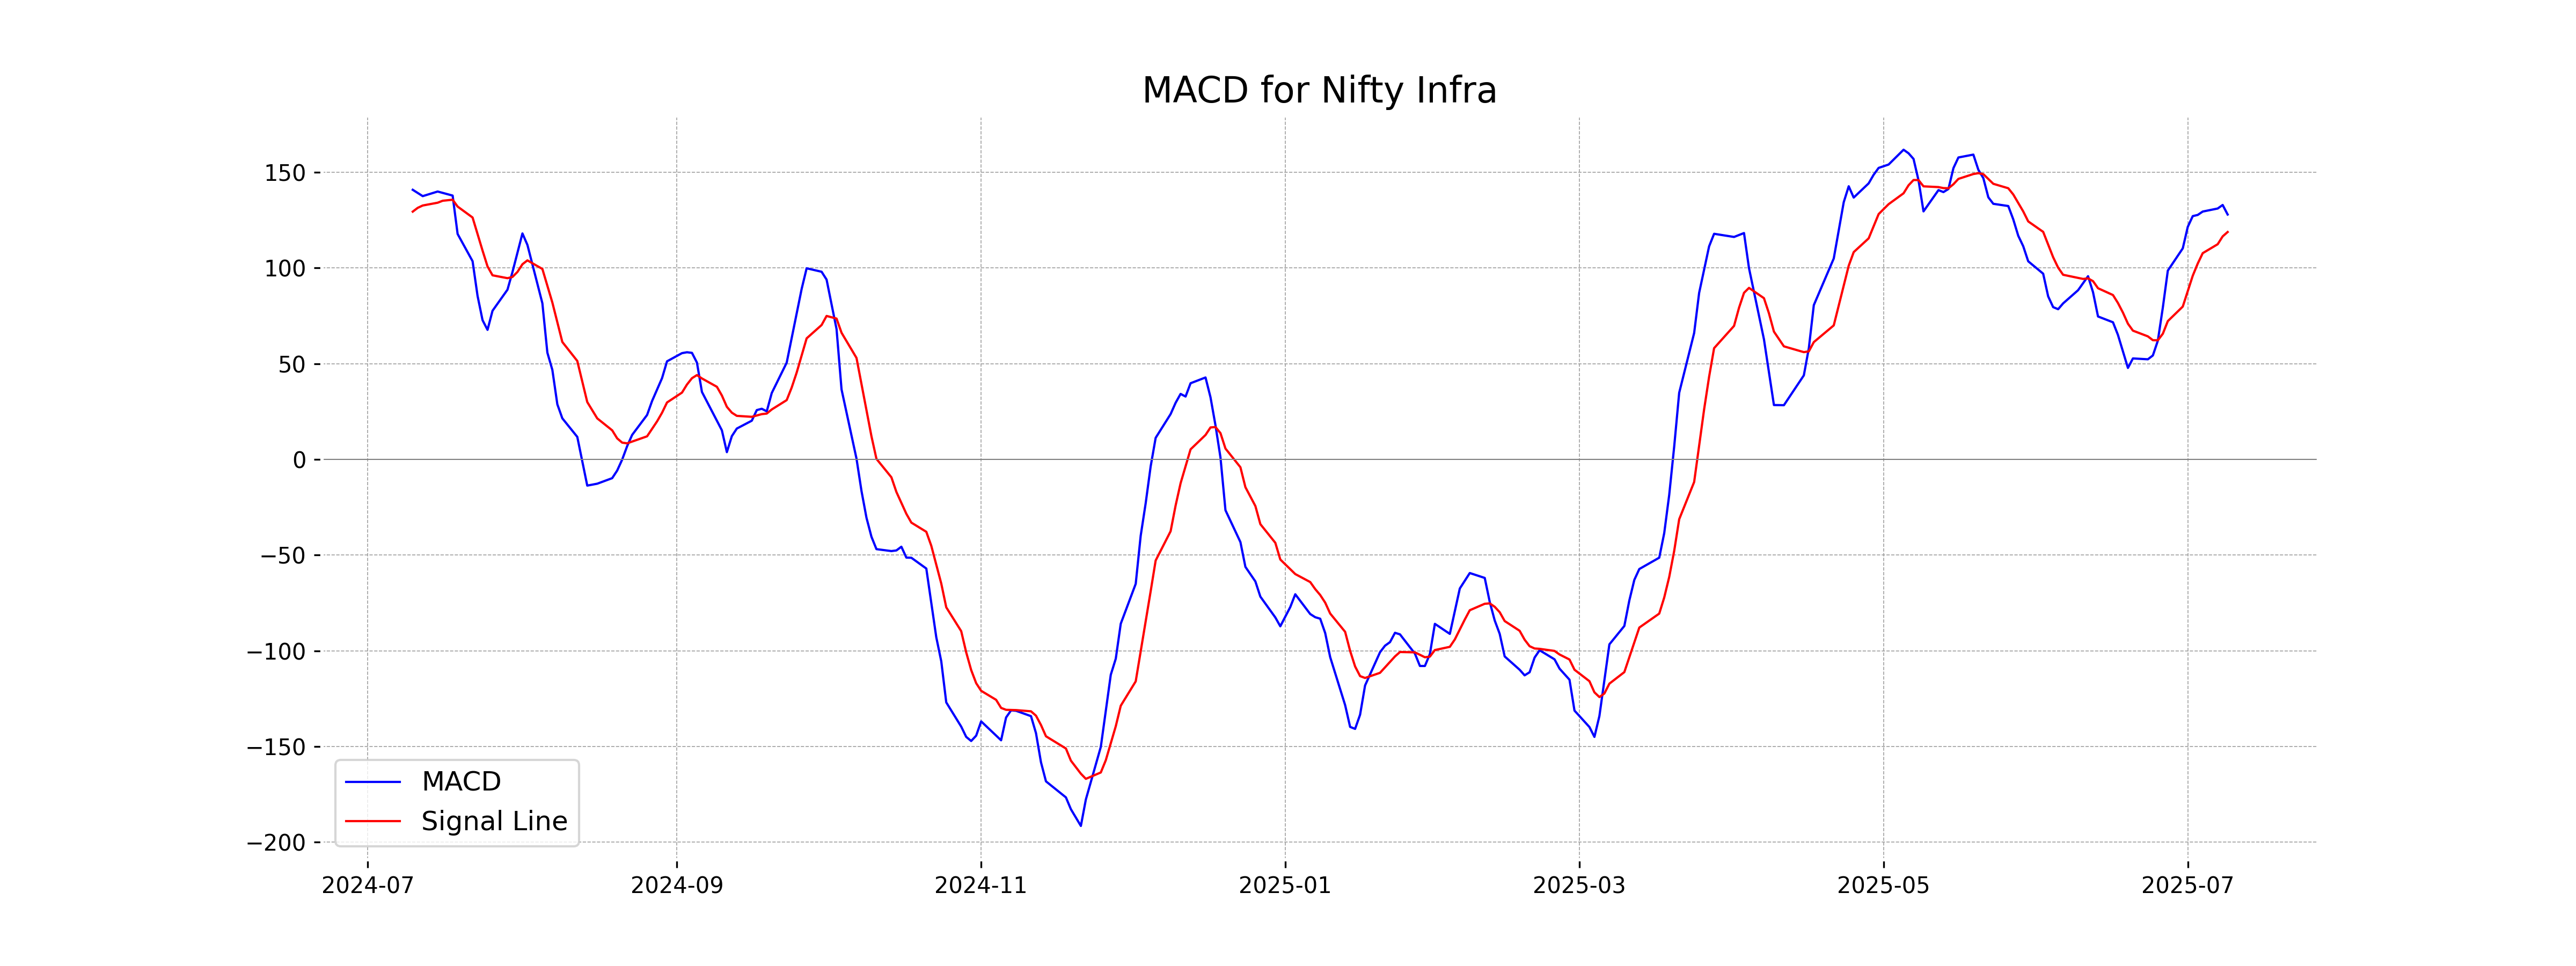
Moving Averages Trend (MACD)
Nifty Infra is showing a bullish signal with the MACD line (127.91) being above the MACD Signal line (118.77), which suggests positive momentum. However, the % change for the day is negative at -0.65%, indicating some short-term selling pressure.
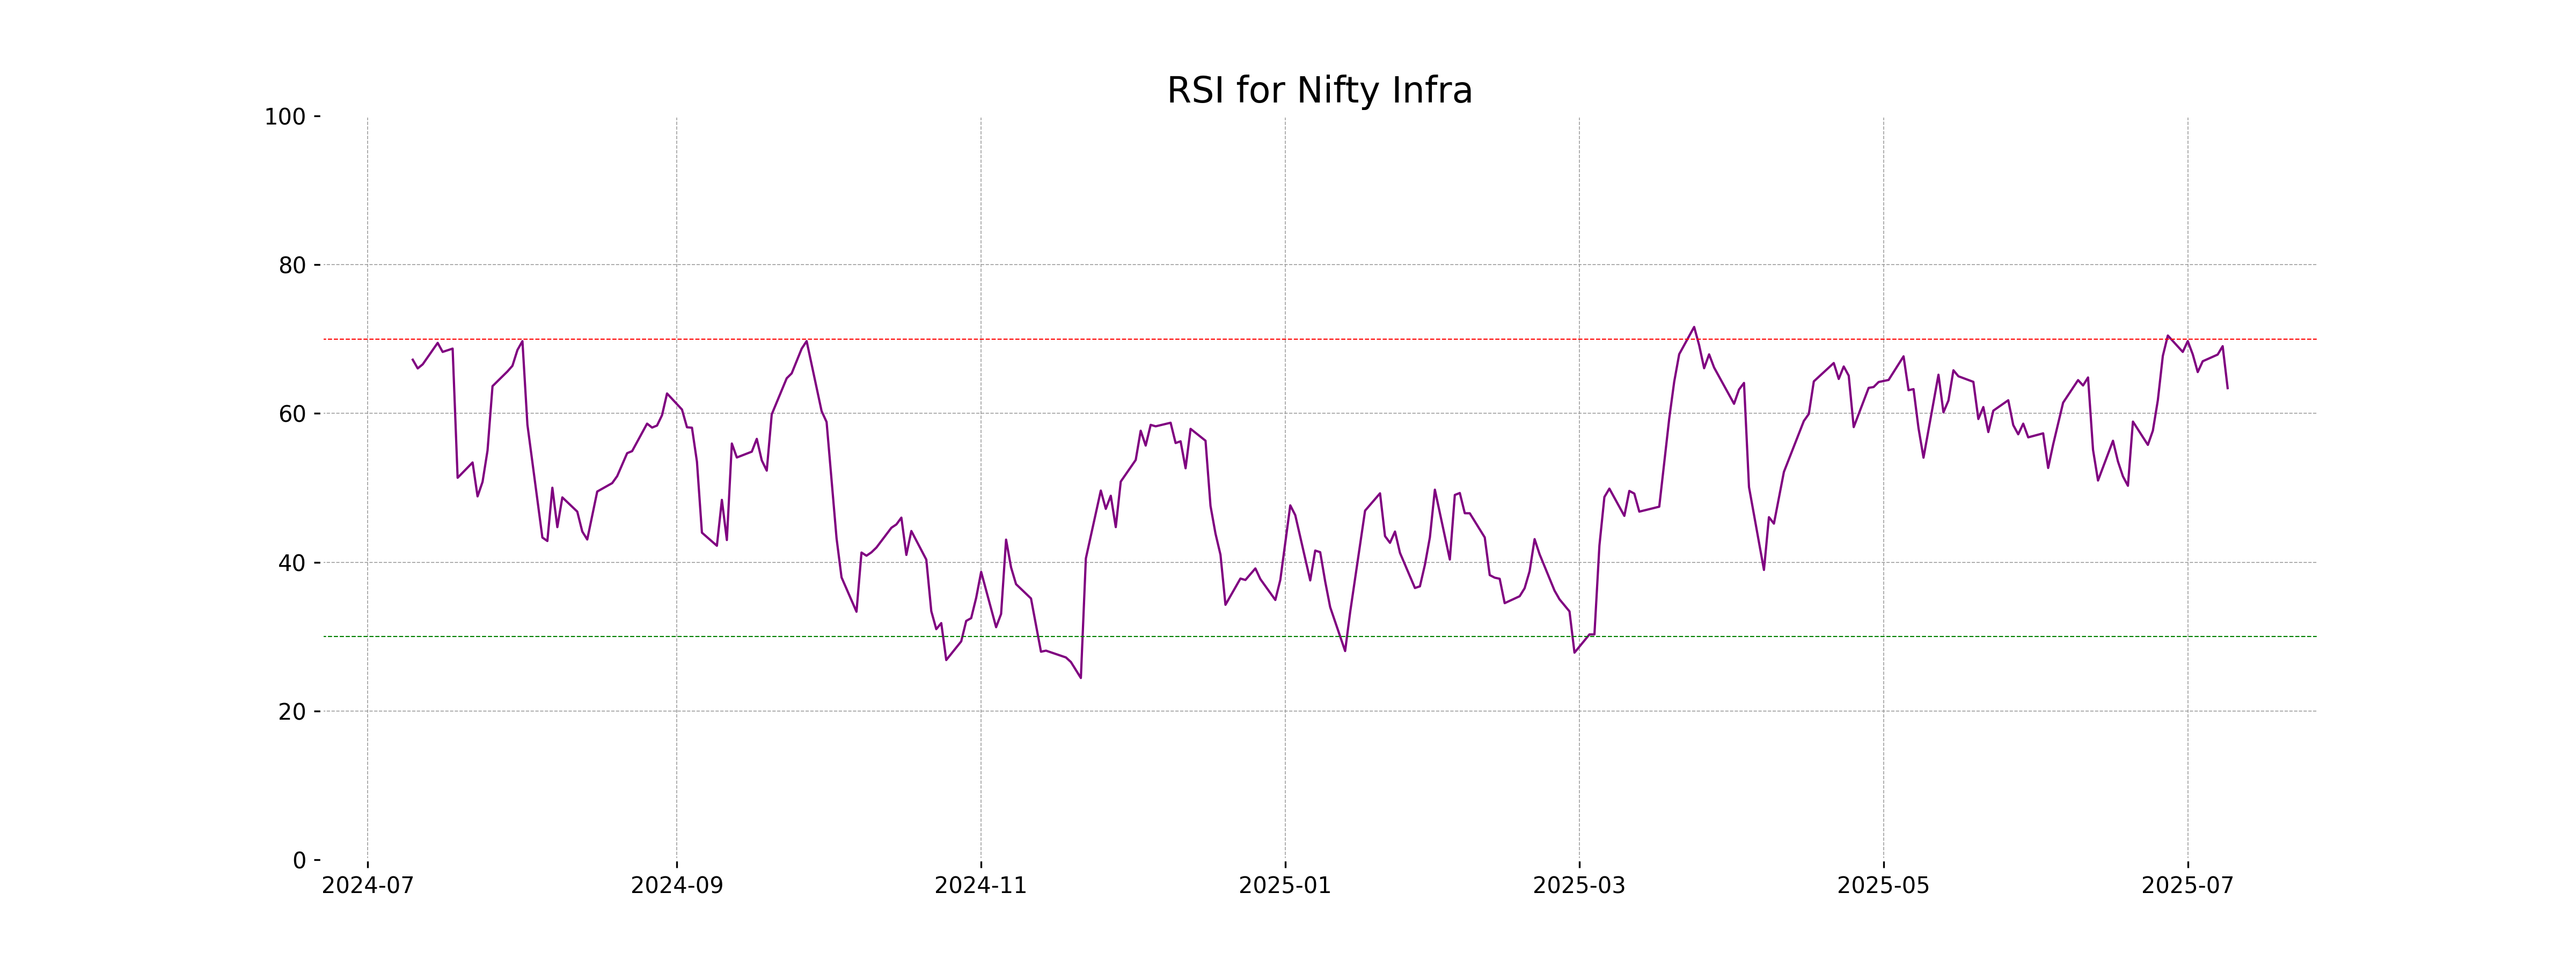
RSI Analysis
Nifty Infra RSI Analysis: The RSI (Relative Strength Index) for Nifty Infra stands at 63.40, indicating that the index is moving towards the overbought territory but is not yet above the critical level of 70. This suggests a bullish sentiment, but traders should monitor it closely for any signs of reversing to avoid potential overvaluation risks.
Analysis for Nifty IT - July 09, 2025
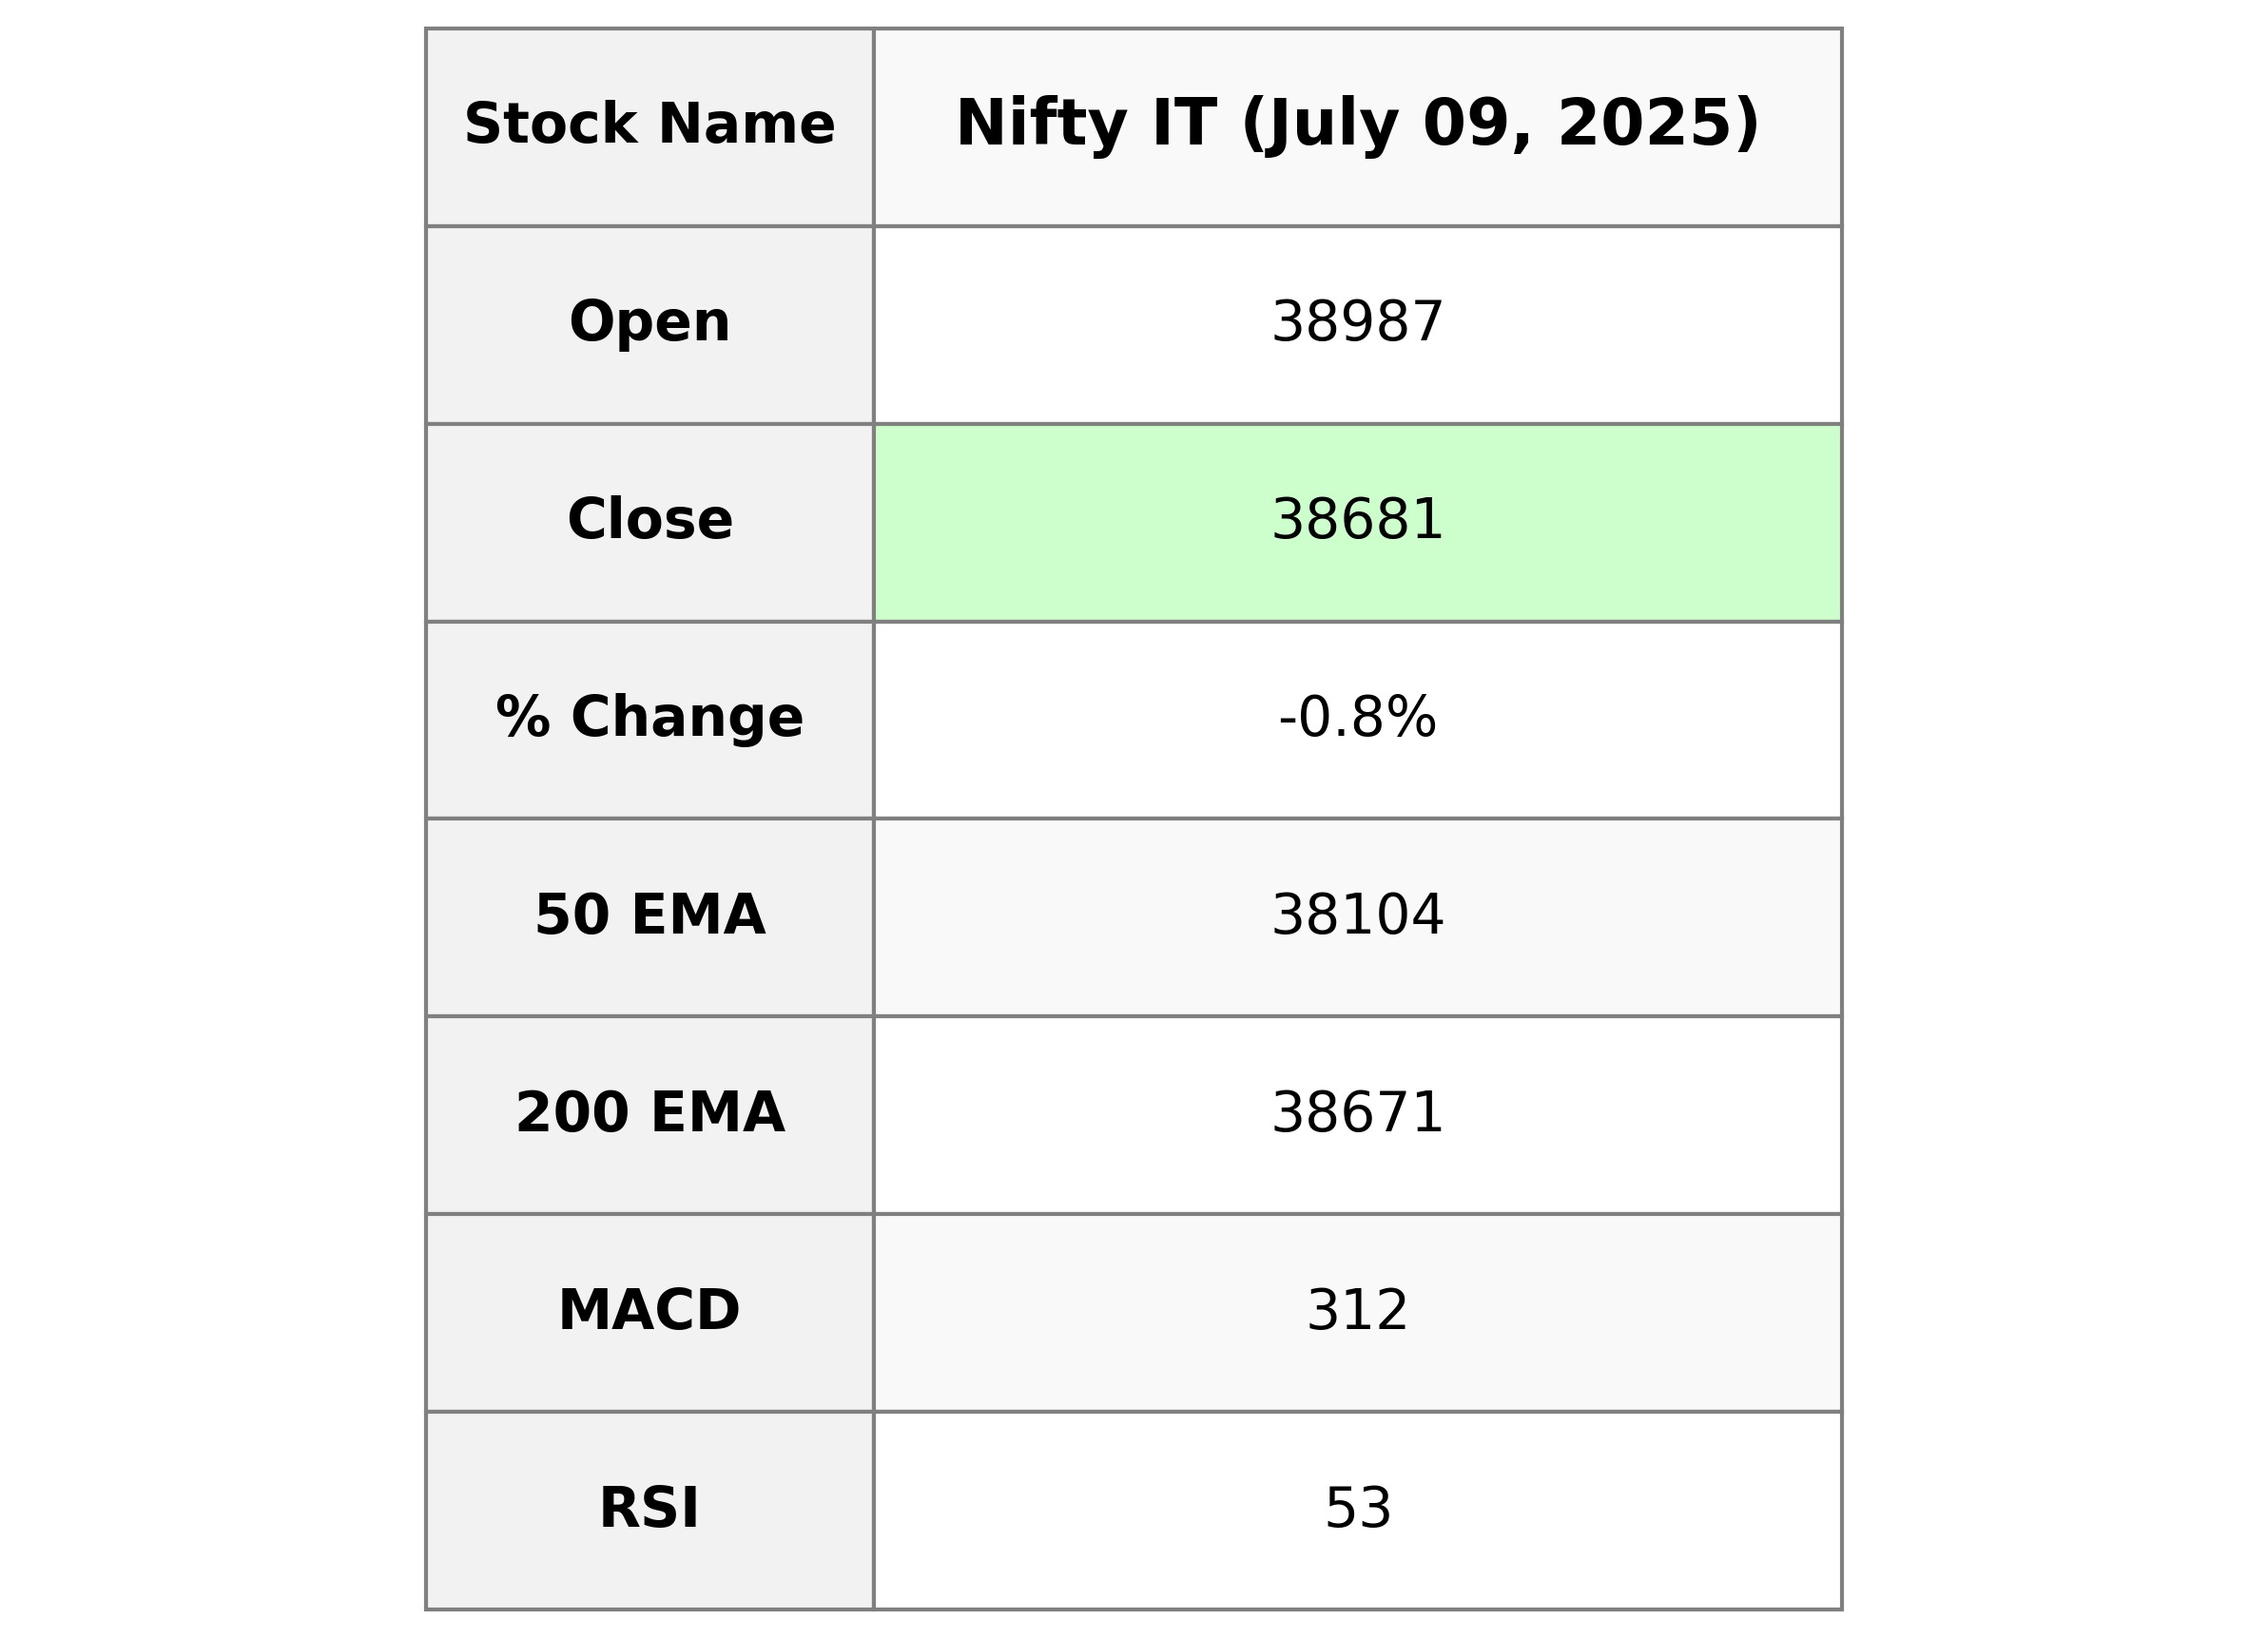
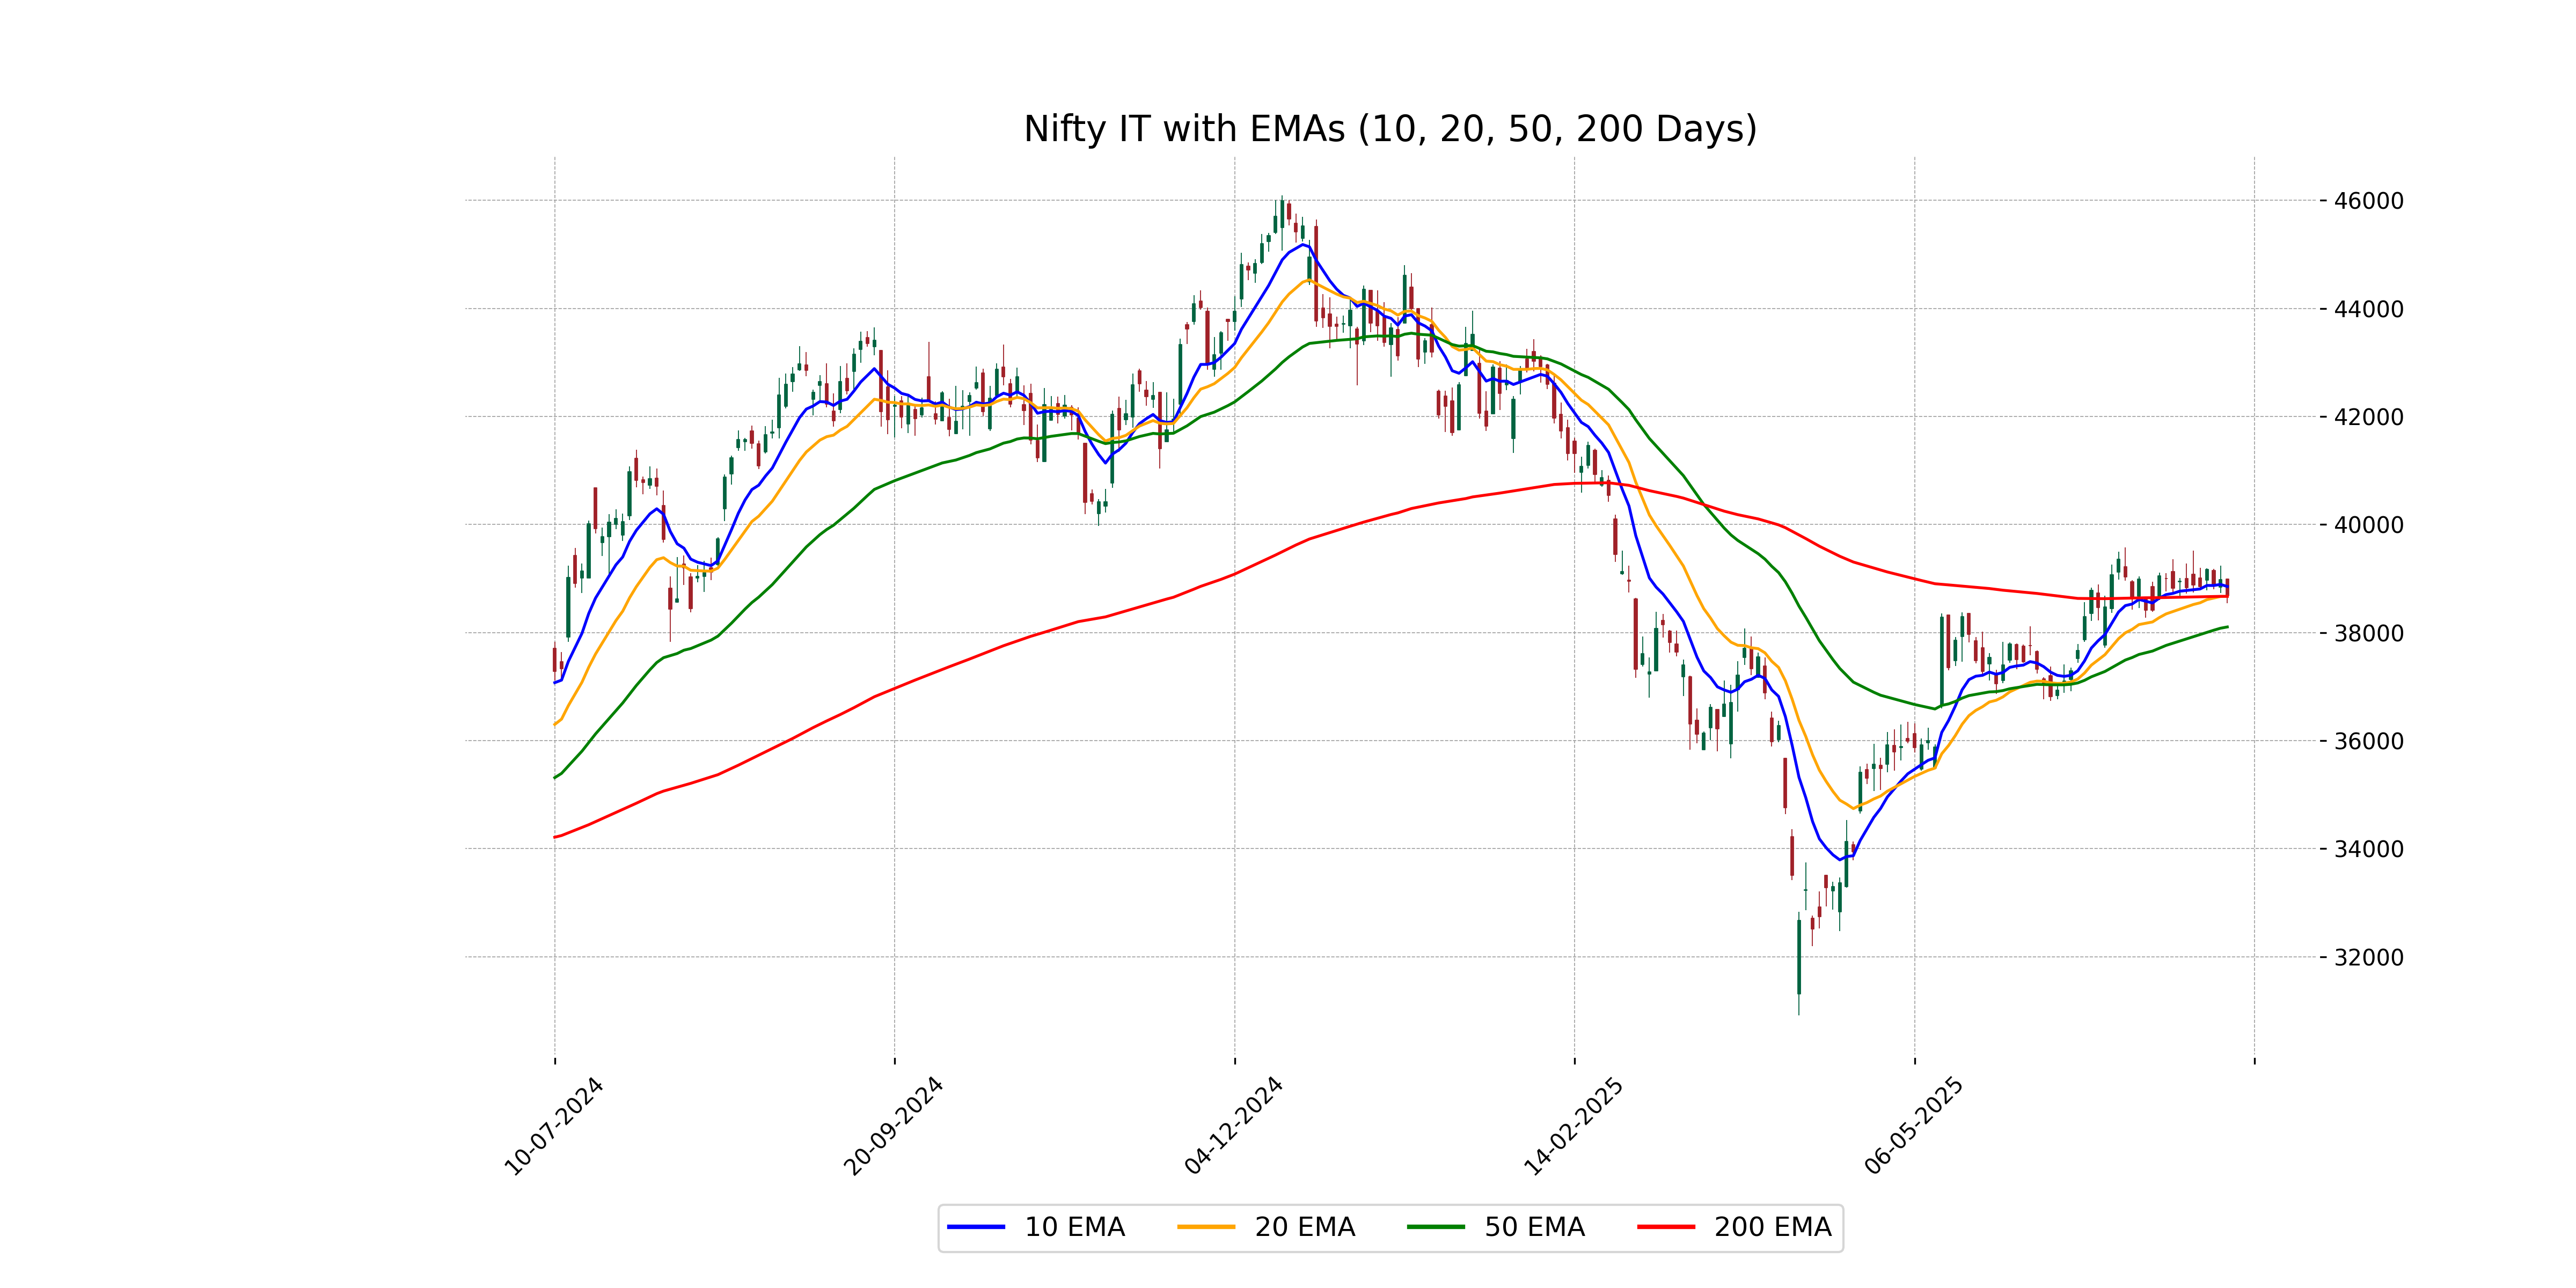
Nifty IT opened at 38,986.80, reached a high of 38,999.75, and closed at 38,680.85, marking a decrease of 0.78% or 302.40 points compared to the previous close of 38,983.25. Currently, the 50-day EMA stands at 38,104.38, while the 200-day EMA is at 38,670.80, indicating a slight short-term bullish sentiment as the recent close is above the 50-day EMA. The Relative Strength Index (RSI) is at 52.77, suggesting a neutral market stance, neither overbought nor oversold.
Relationship with Key Moving Averages
The Nifty IT index closed at 38,680.85, which is above its 50-day EMA of 38,104.38 but below its 10-day EMA of 38,853.46 and its 20-day EMA of 38,668.99, indicating recent short-term pressure. The index is also slightly above its 200-day EMA of 38,670.80, showing it is currently maintaining a level higher than its longer-term trend.
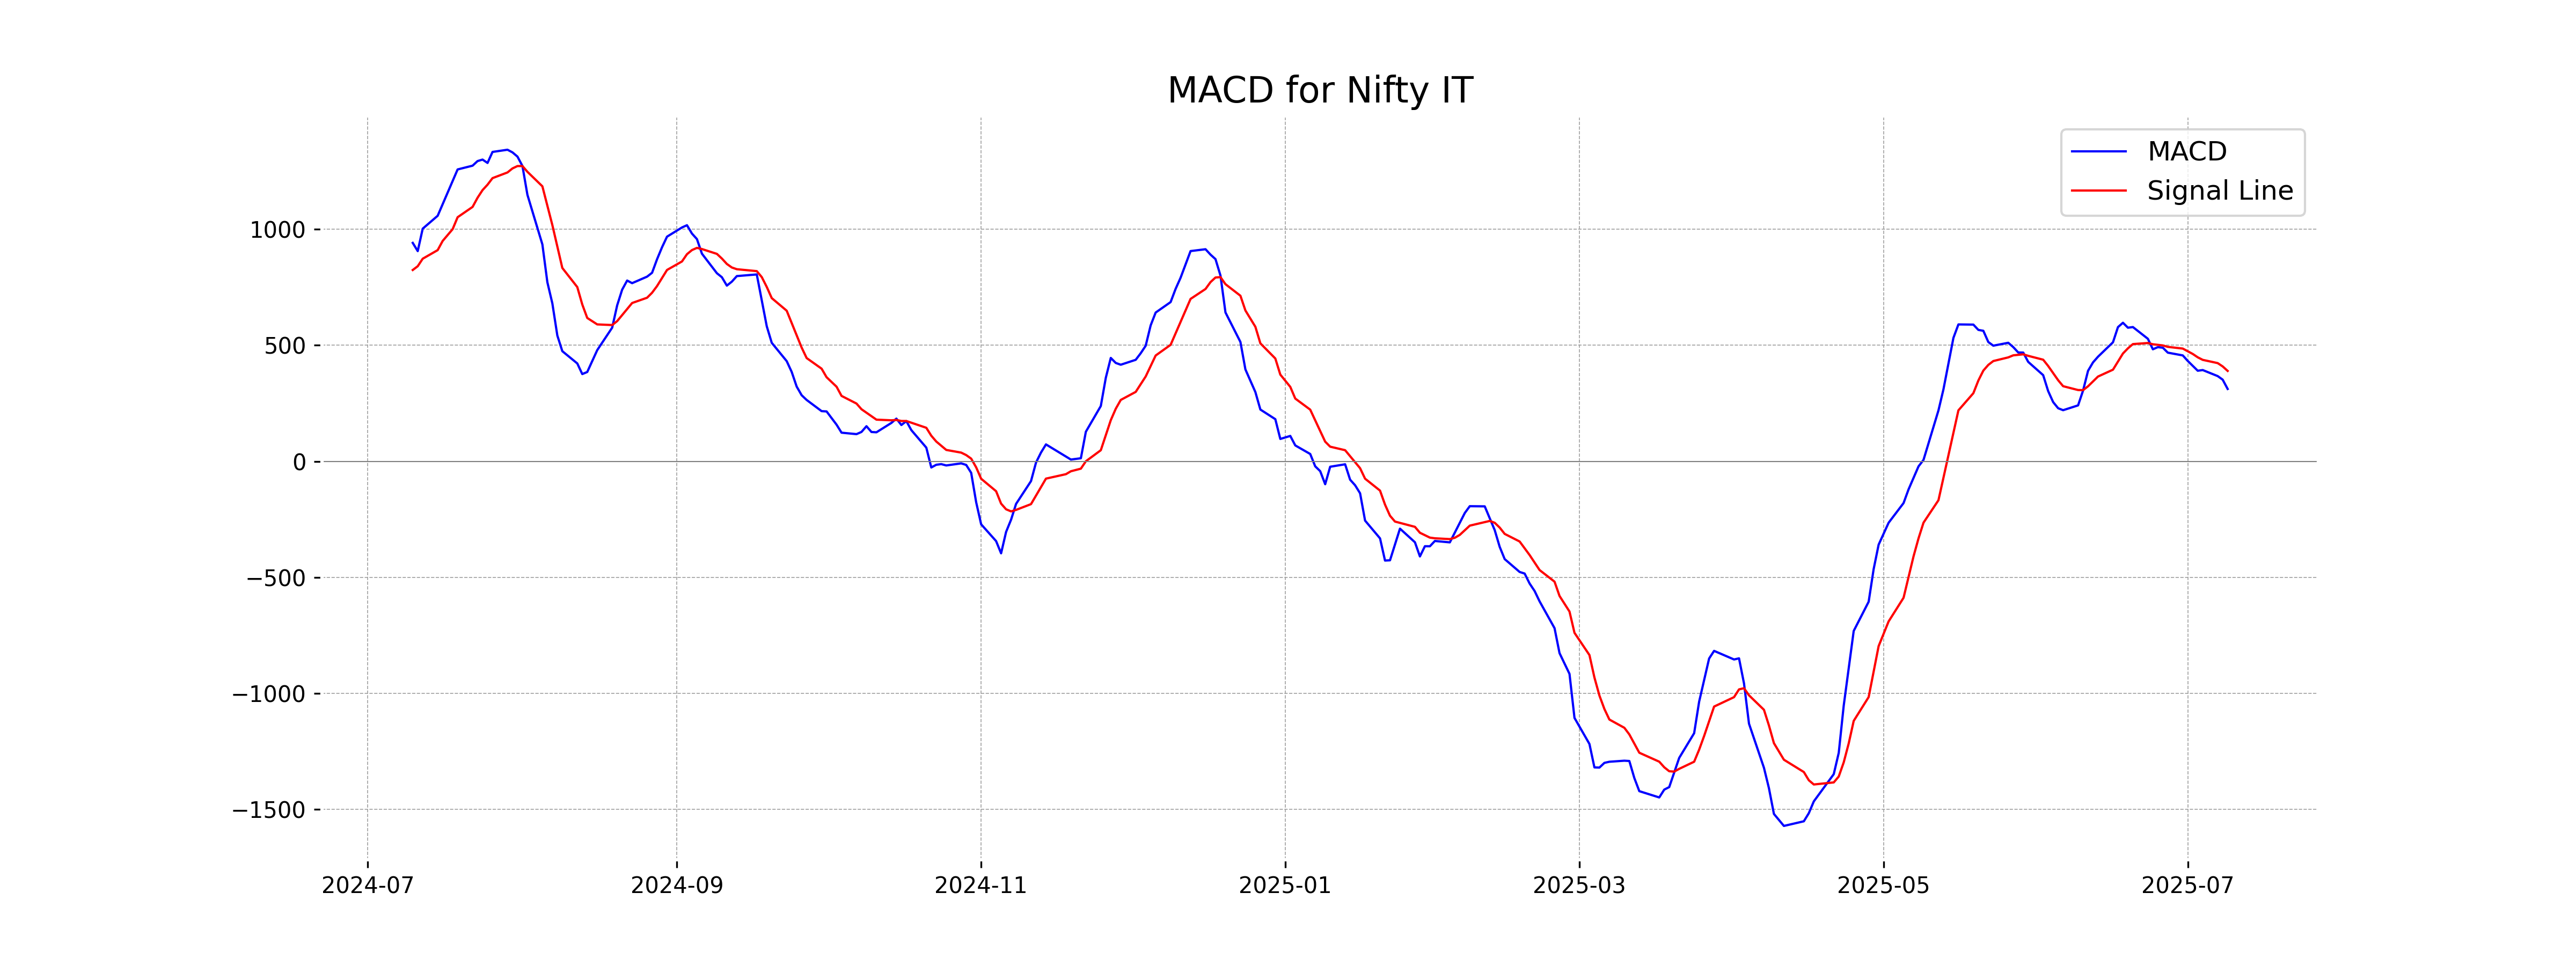
Moving Averages Trend (MACD)
Based on the data, the MACD for Nifty IT is at 311.78, which is below the MACD Signal line at 389.49. This indicates a bearish trend as the MACD line is below the signal, suggesting potential downward momentum in the near term.
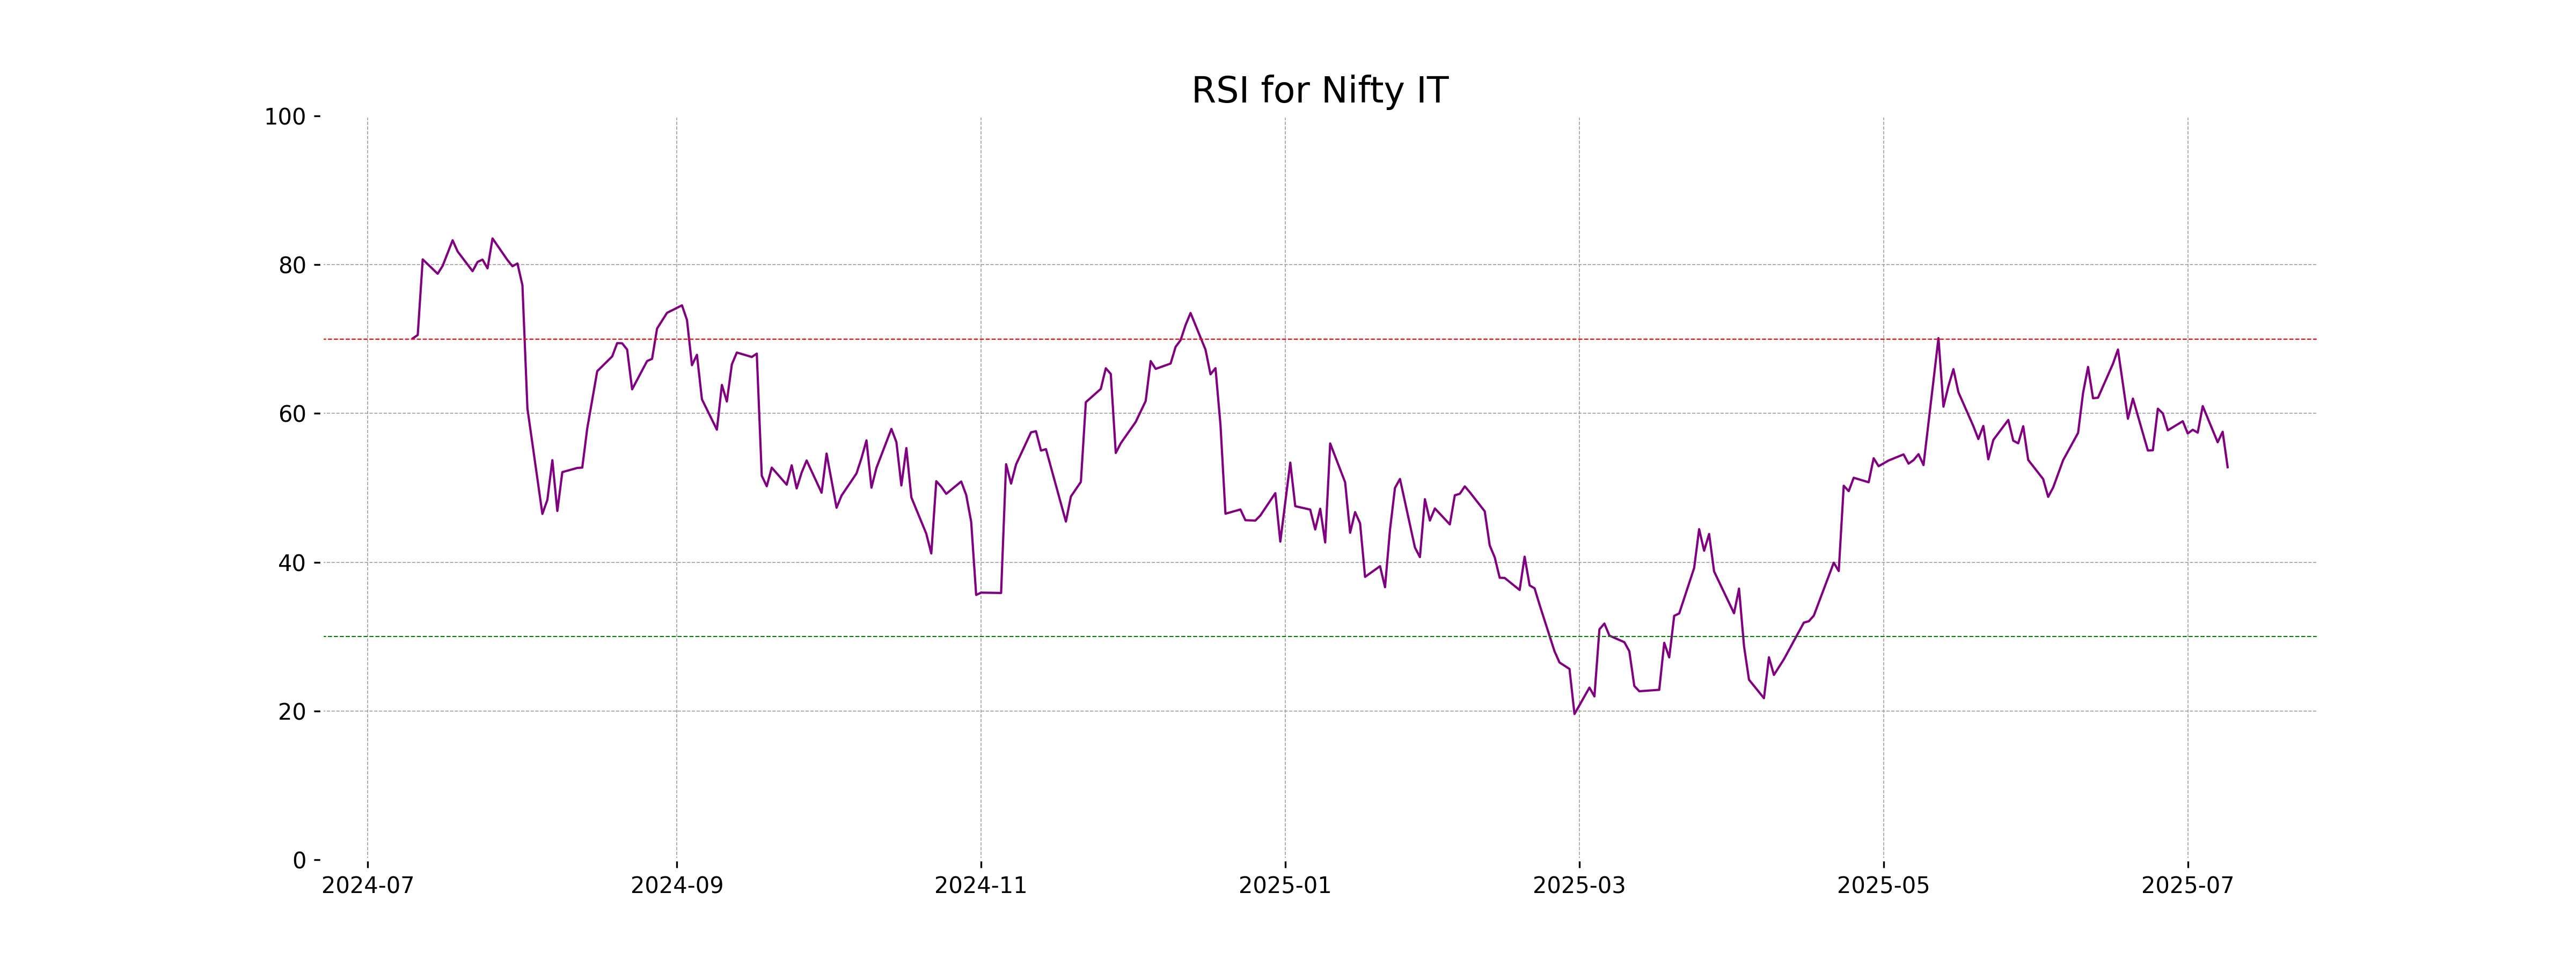
RSI Analysis
The RSI value for Nifty IT stands at 52.77, indicating that the index is in a neutral zone. This suggests a balance between buying and selling pressure and signals neither overbought nor oversold conditions. Traders might wait for the RSI to approach closer to traditional thresholds (30 or 70) for stronger buy or sell signals.
Analysis for Nifty Metal - July 09, 2025
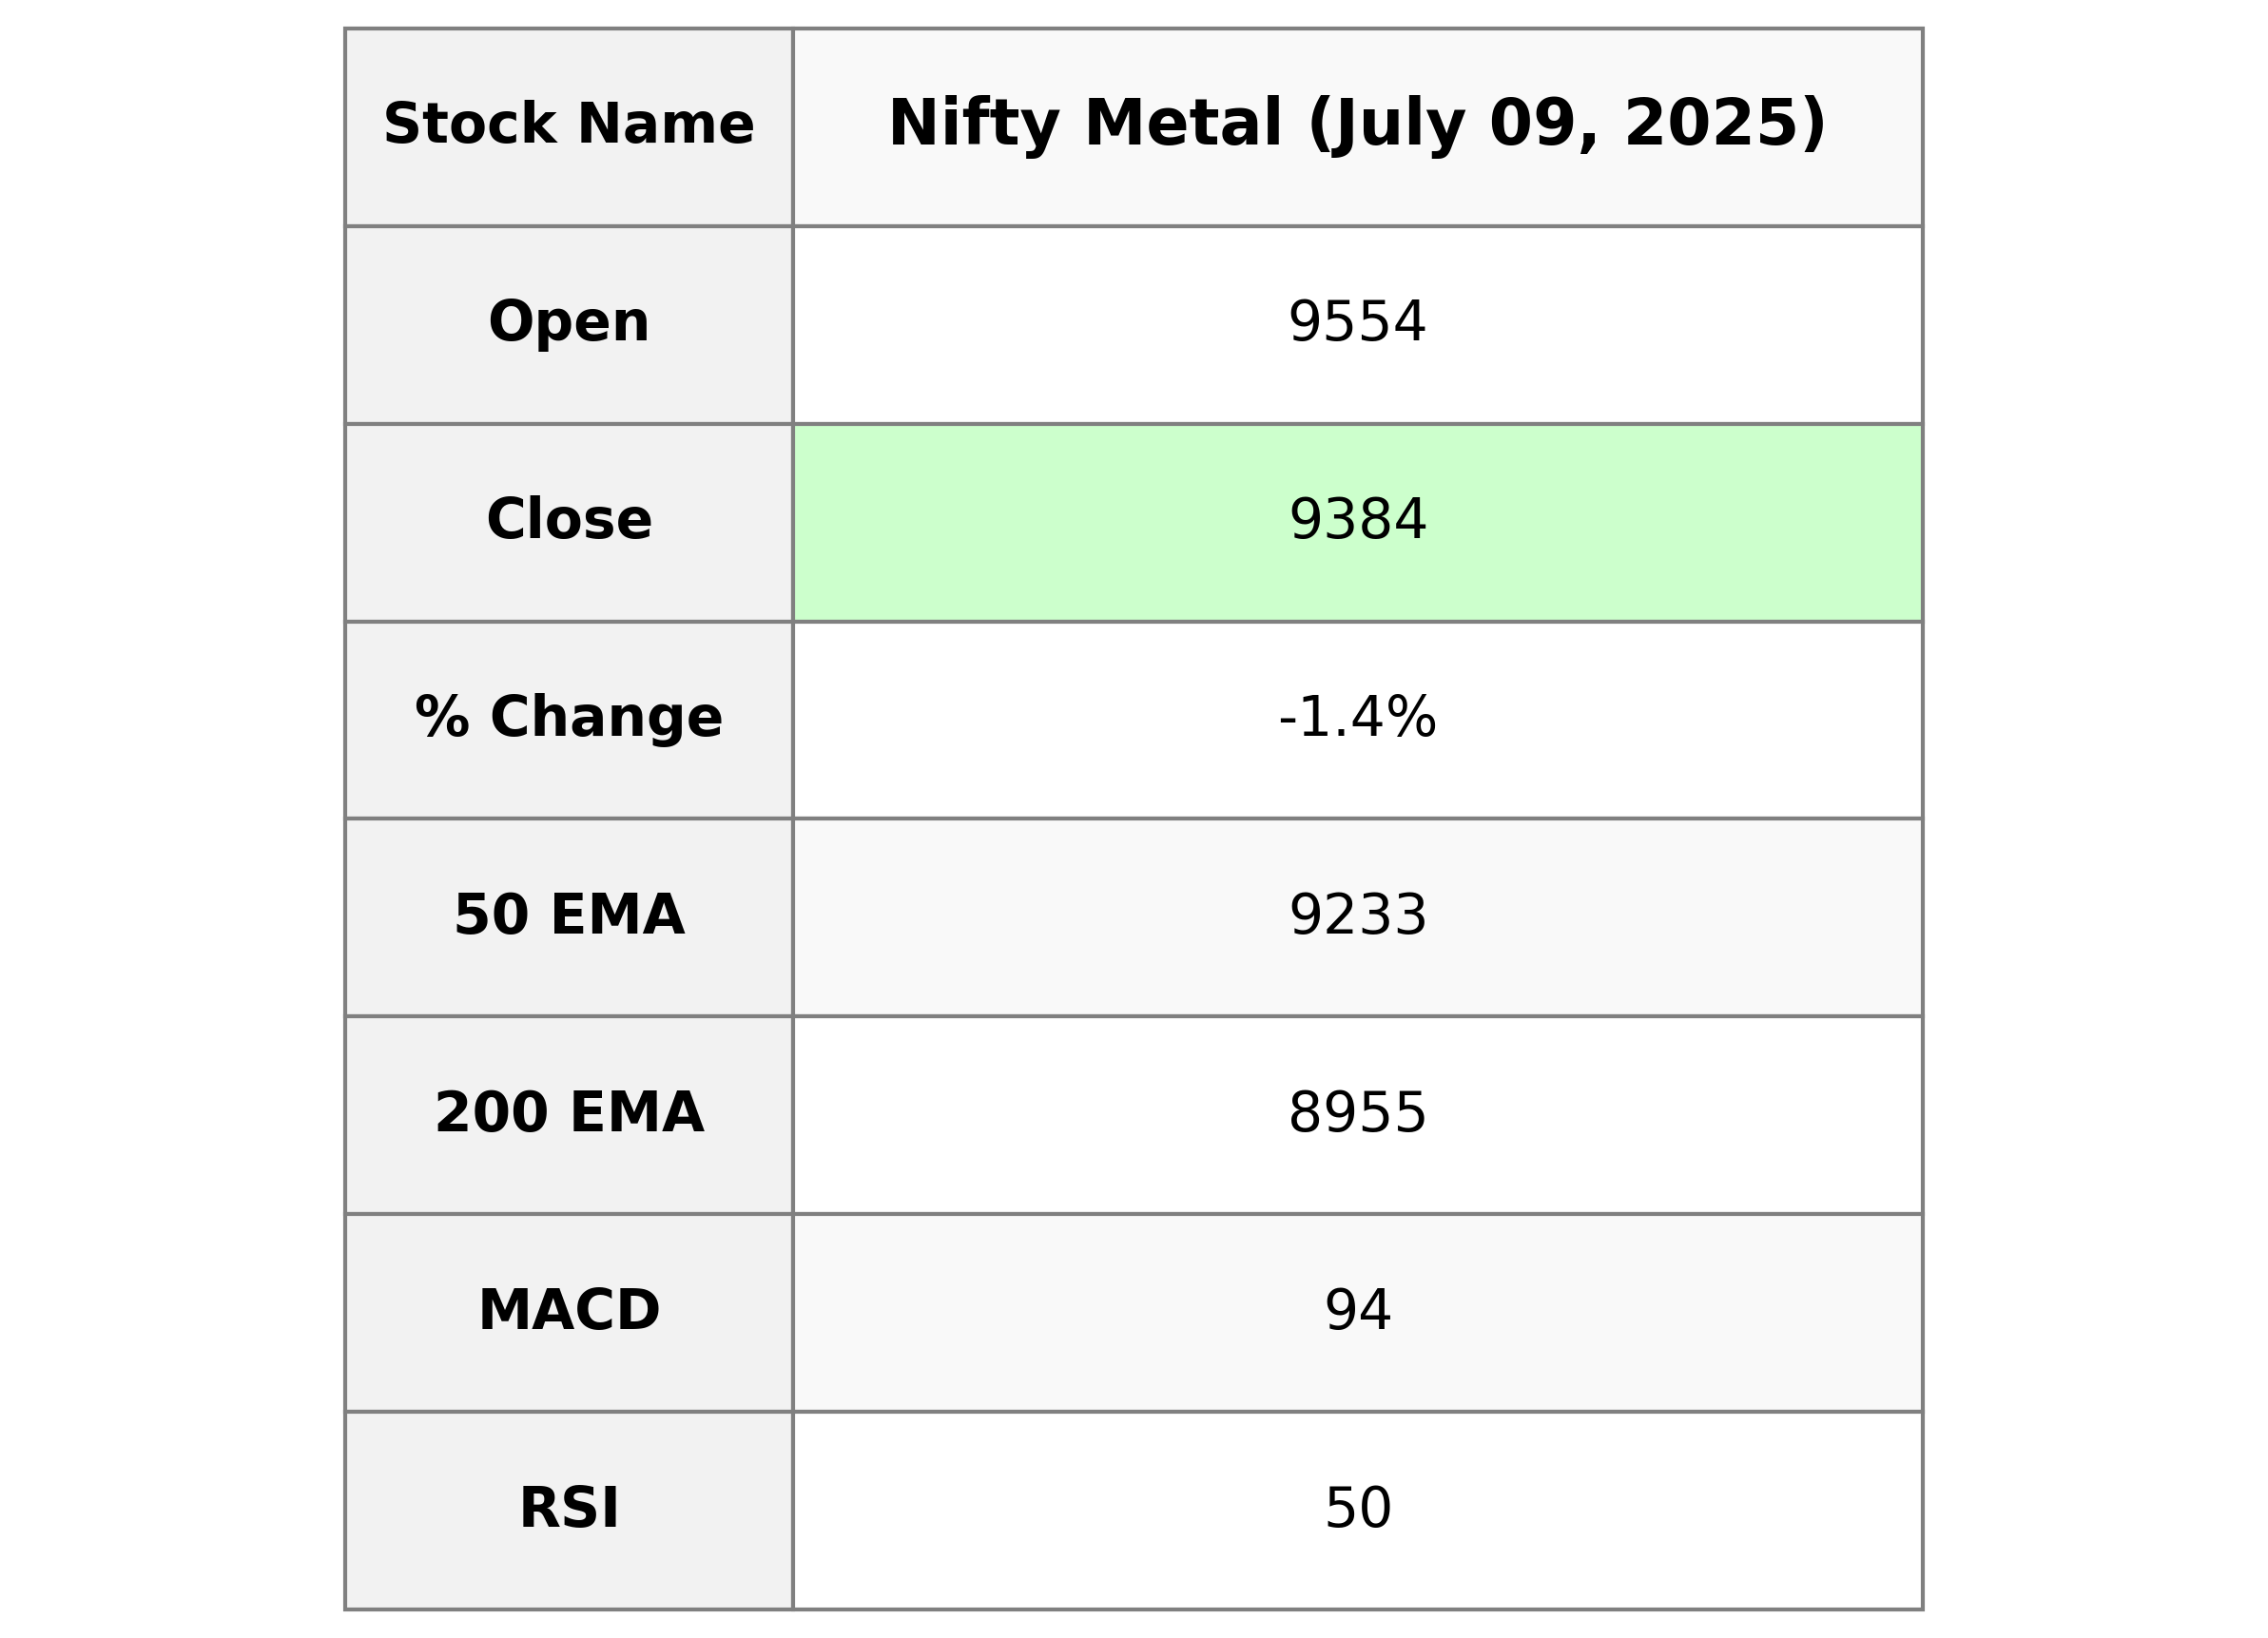
Nifty Metal Performance Overview: Nifty Metal opened at 9554.40 and closed at 9384.5, marking a decrease of approximately 1.40%, equivalent to a drop of 132.90 points from the previous close of 9517.40. The RSI is at 50.26, indicating a neutral momentum, and the current MACD is below the signal line, suggesting a bearish trend. The 50-day EMA (9233.07) is above the 200-day EMA (8954.99), reflecting a longer-term uptrend despite the recent decrease.
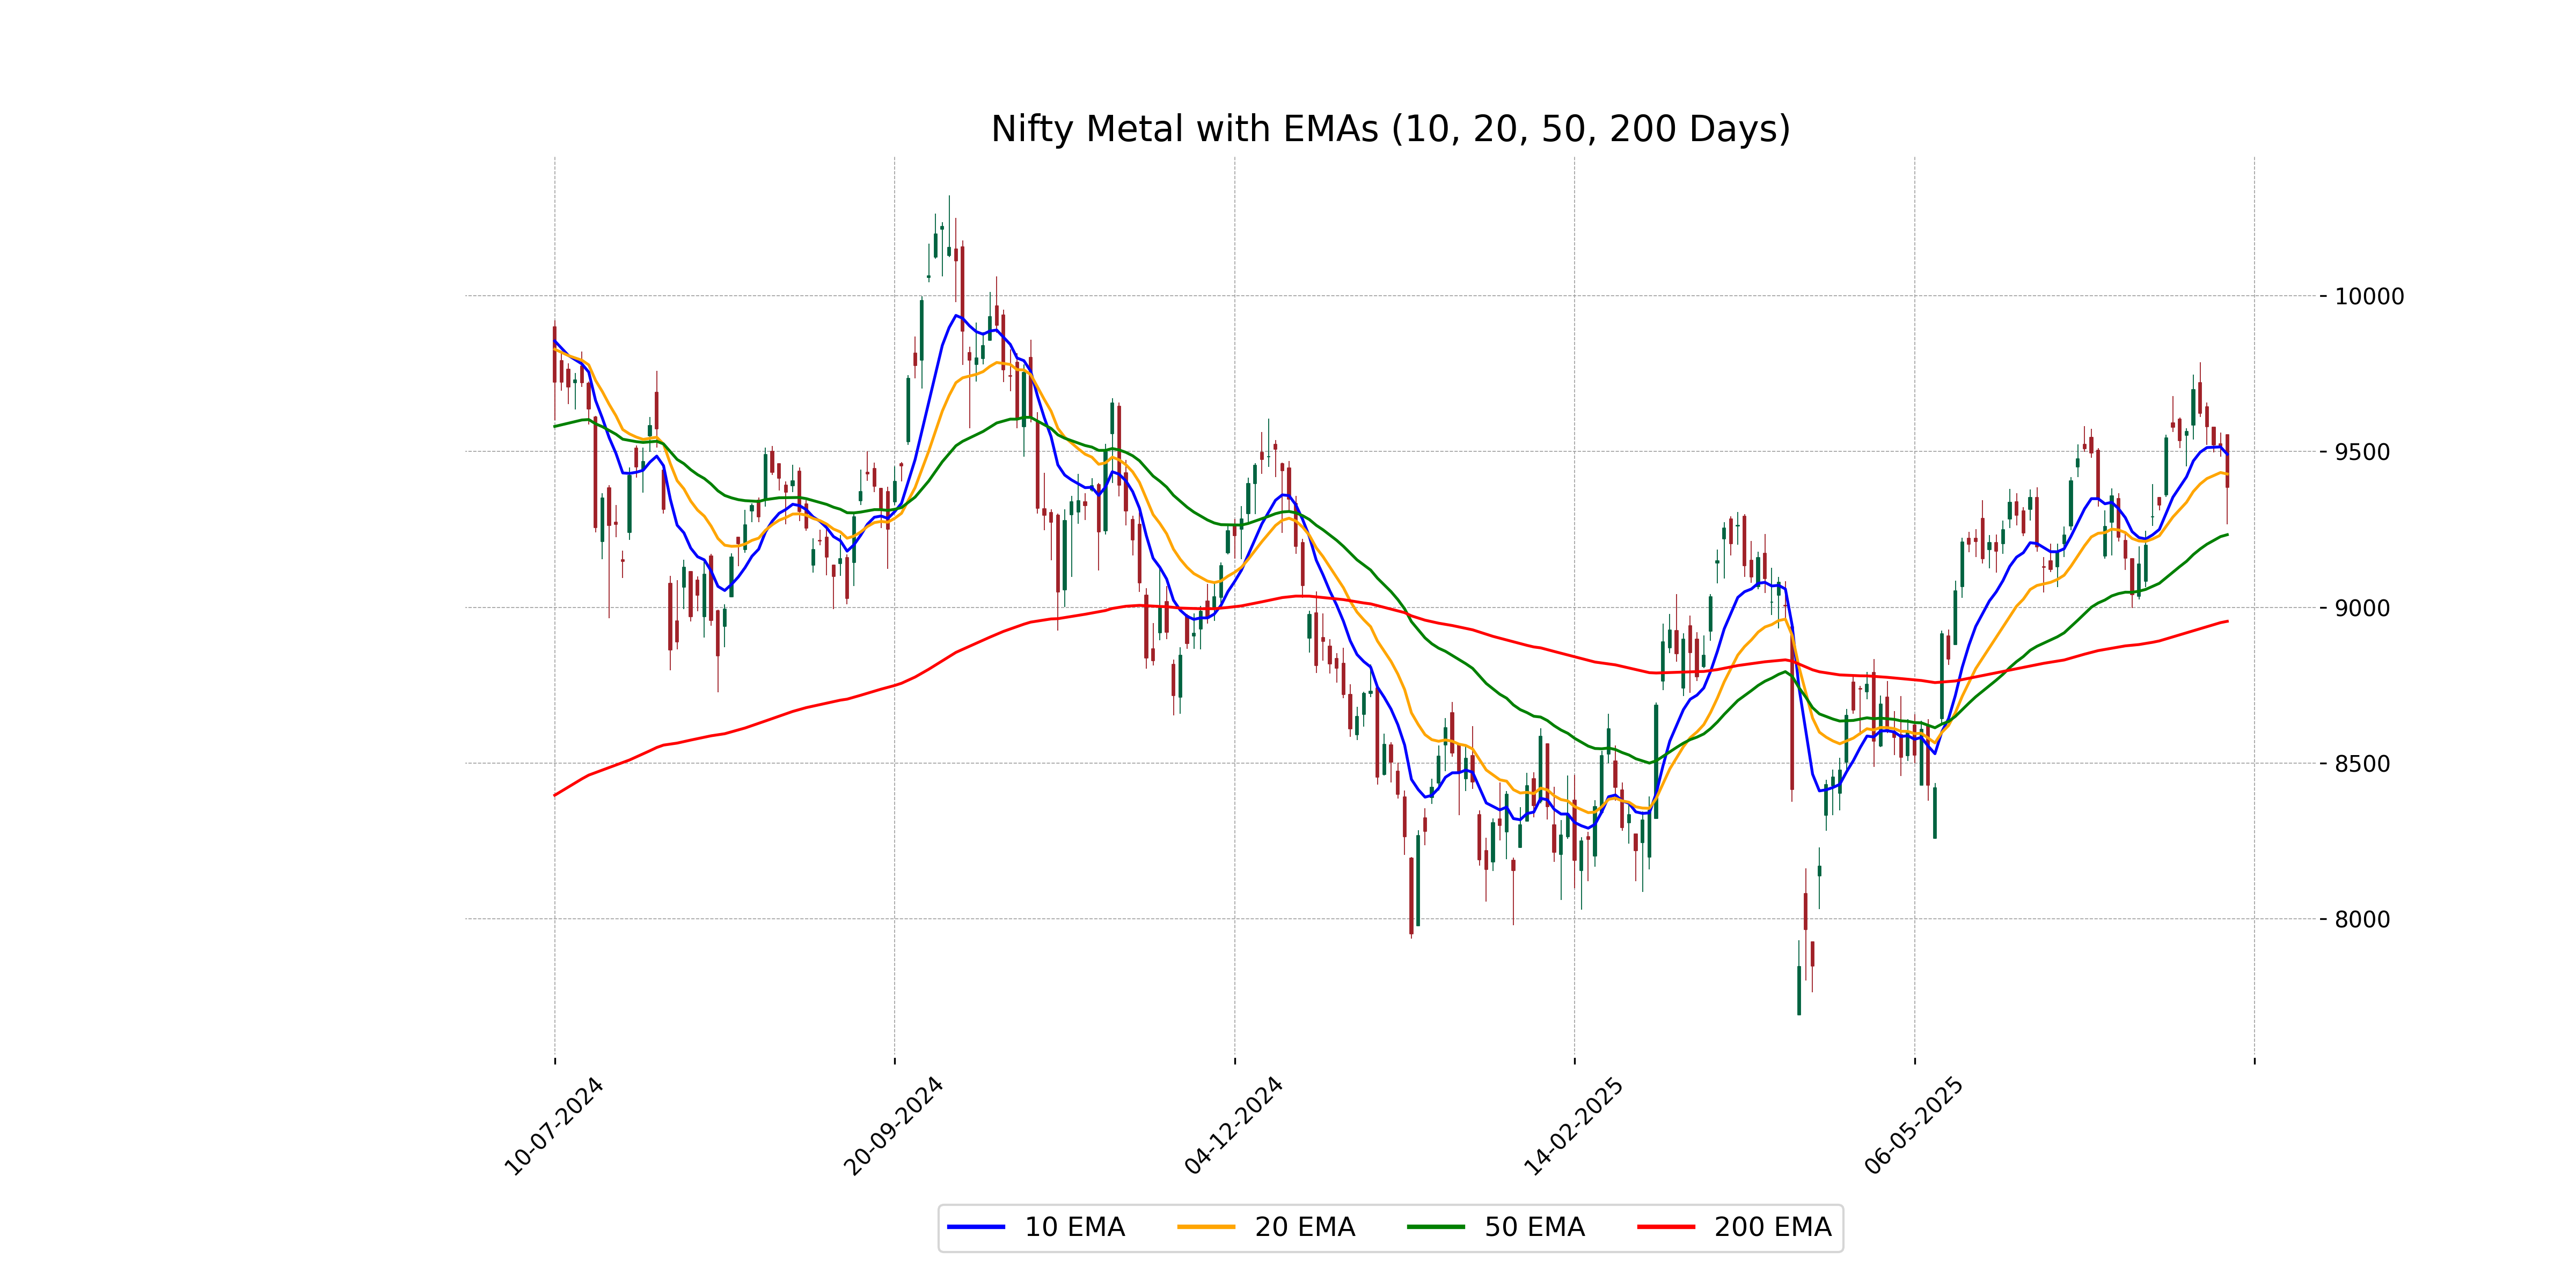
Relationship with Key Moving Averages
The Nifty Metal index closed at 9384.5, which is above its 50-day EMA of 9233.07, suggesting short-term bullish momentum. However, it is below its 10-day EMA of 9491.27 and 20-day EMA of 9427.99, indicating recent weakness or consolidation. The index's position suggests mixed signals, with potential for rebound if it regains levels above its shorter-term EMAs.
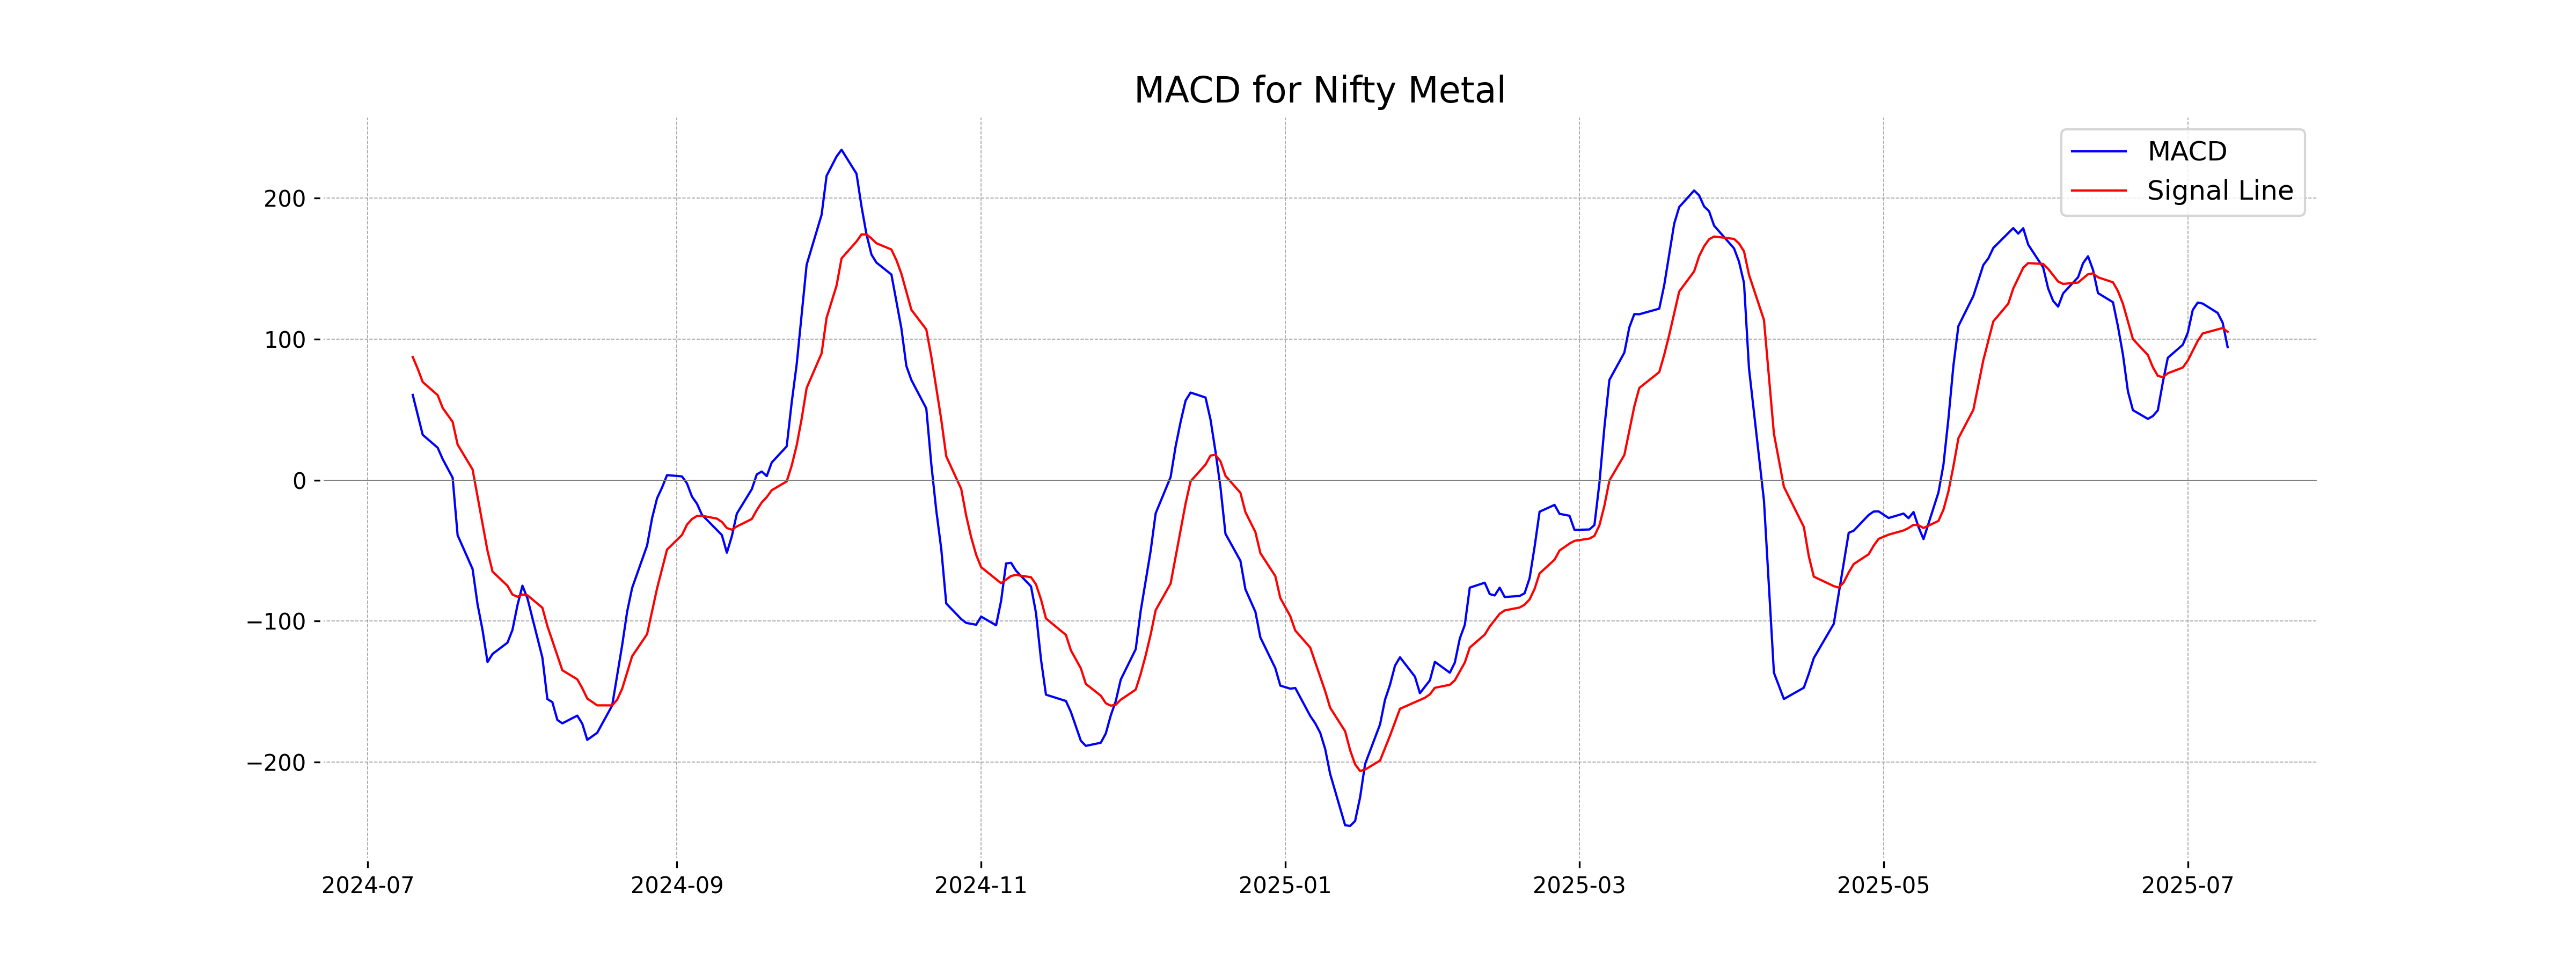
Moving Averages Trend (MACD)
For Nifty Metal, the MACD is at 94.37 while the MACD Signal is at 105.23, indicating a bearish signal since the MACD line is below the signal line. This suggests potential downward momentum or weakness in the current trend.
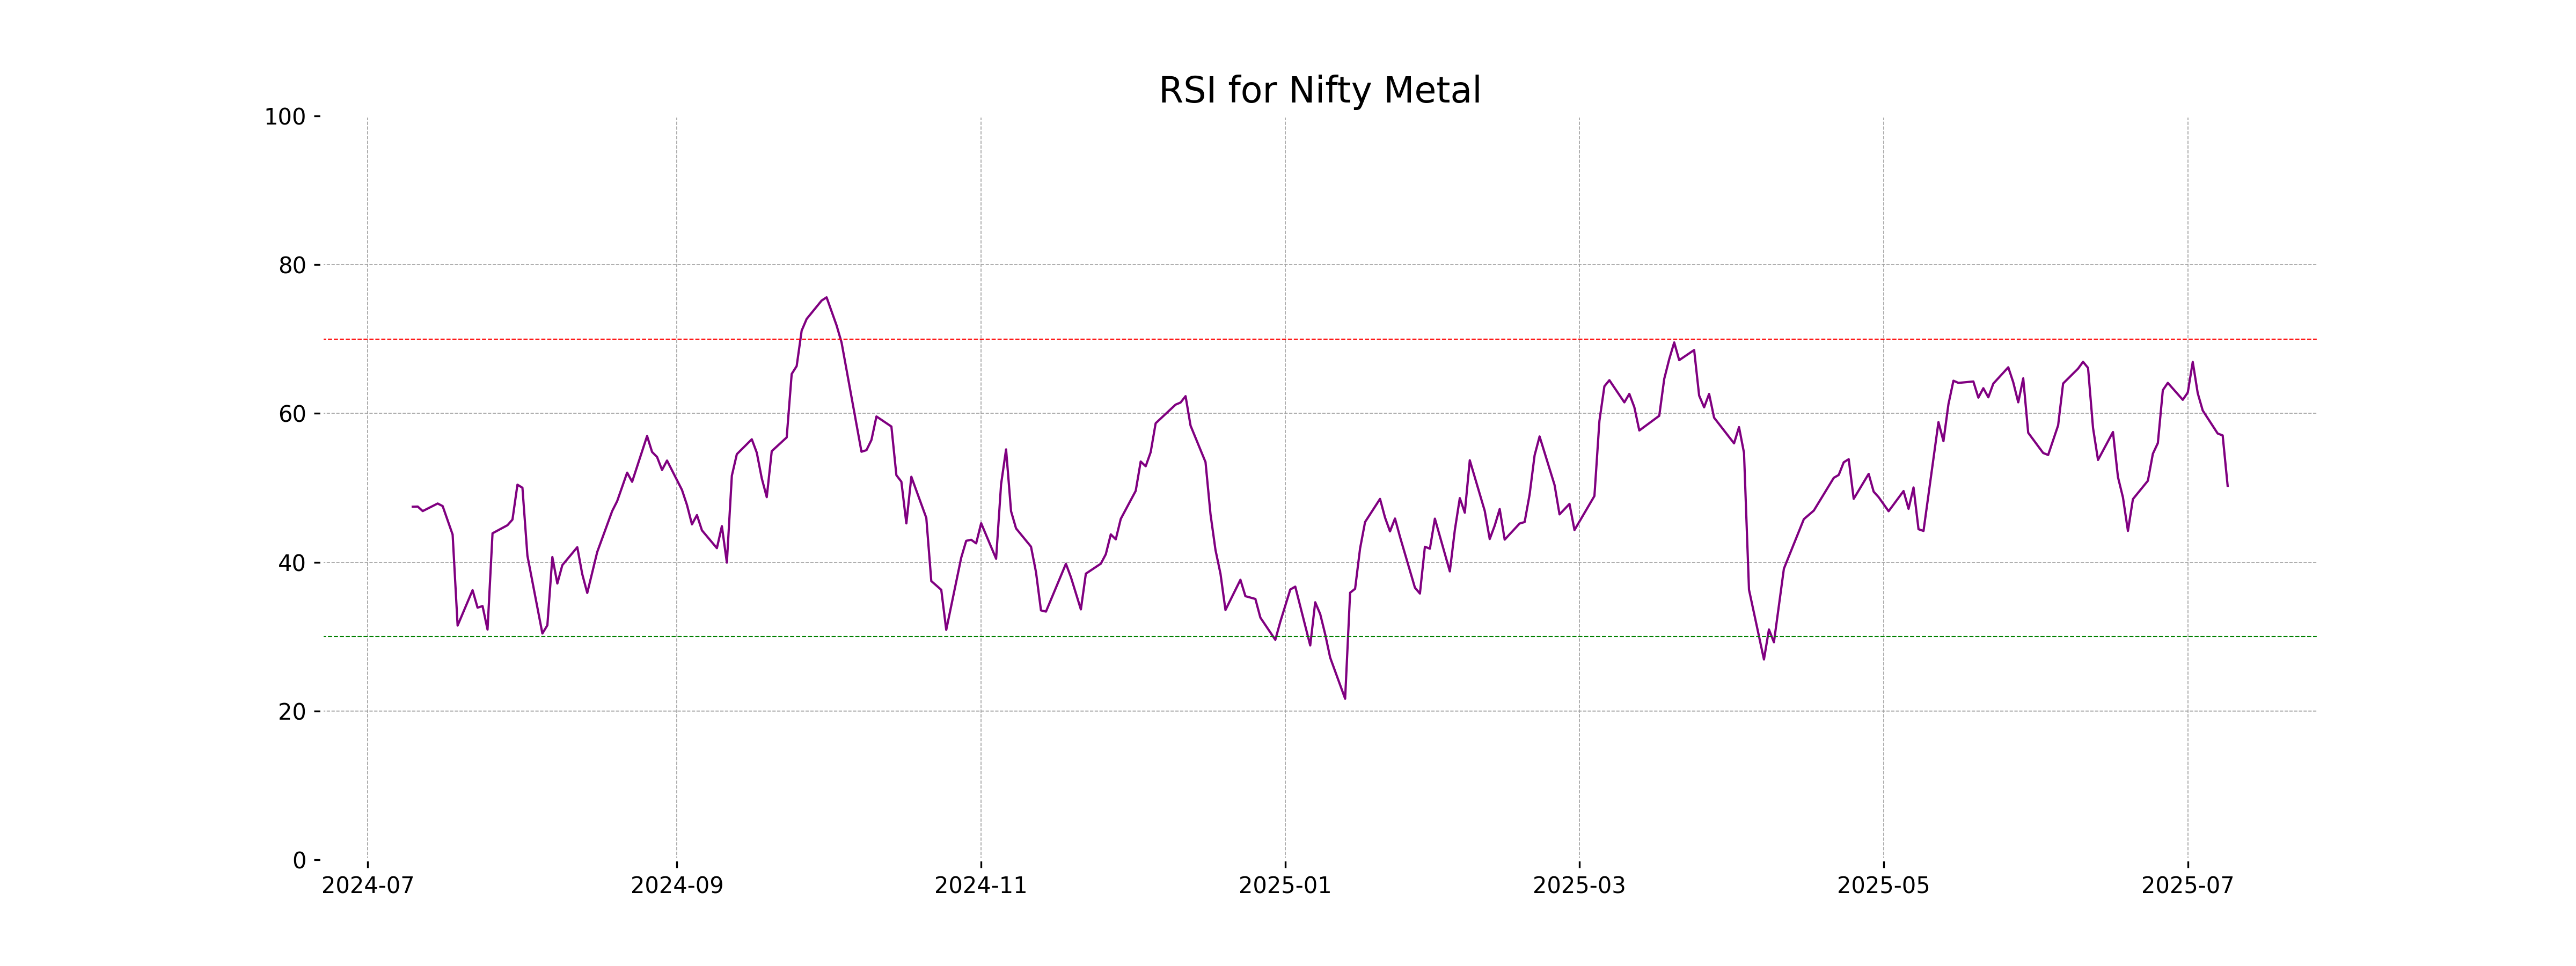
RSI Analysis
The relative strength index (RSI) for Nifty Metal is 50.26, which is near the midpoint of the typical scale range between 0 and 100. This suggests that the stock is neither in overbought nor oversold territory, indicating a relatively neutral market sentiment.
Analysis for Nifty Bank - July 09, 2025

Nifty Bank opened at 57199.75 and closed slightly lower at 57213.55, reflecting a minor decline of 0.07% or 42.75 points from the previous close of 57256.30. The stock's Relative Strength Index (RSI) is at 60.45, which suggests moderate momentum. The stock's moving averages indicate that it is trading above its 10, 20, 50, and 200 EMAs, suggesting a generally bullish trend.
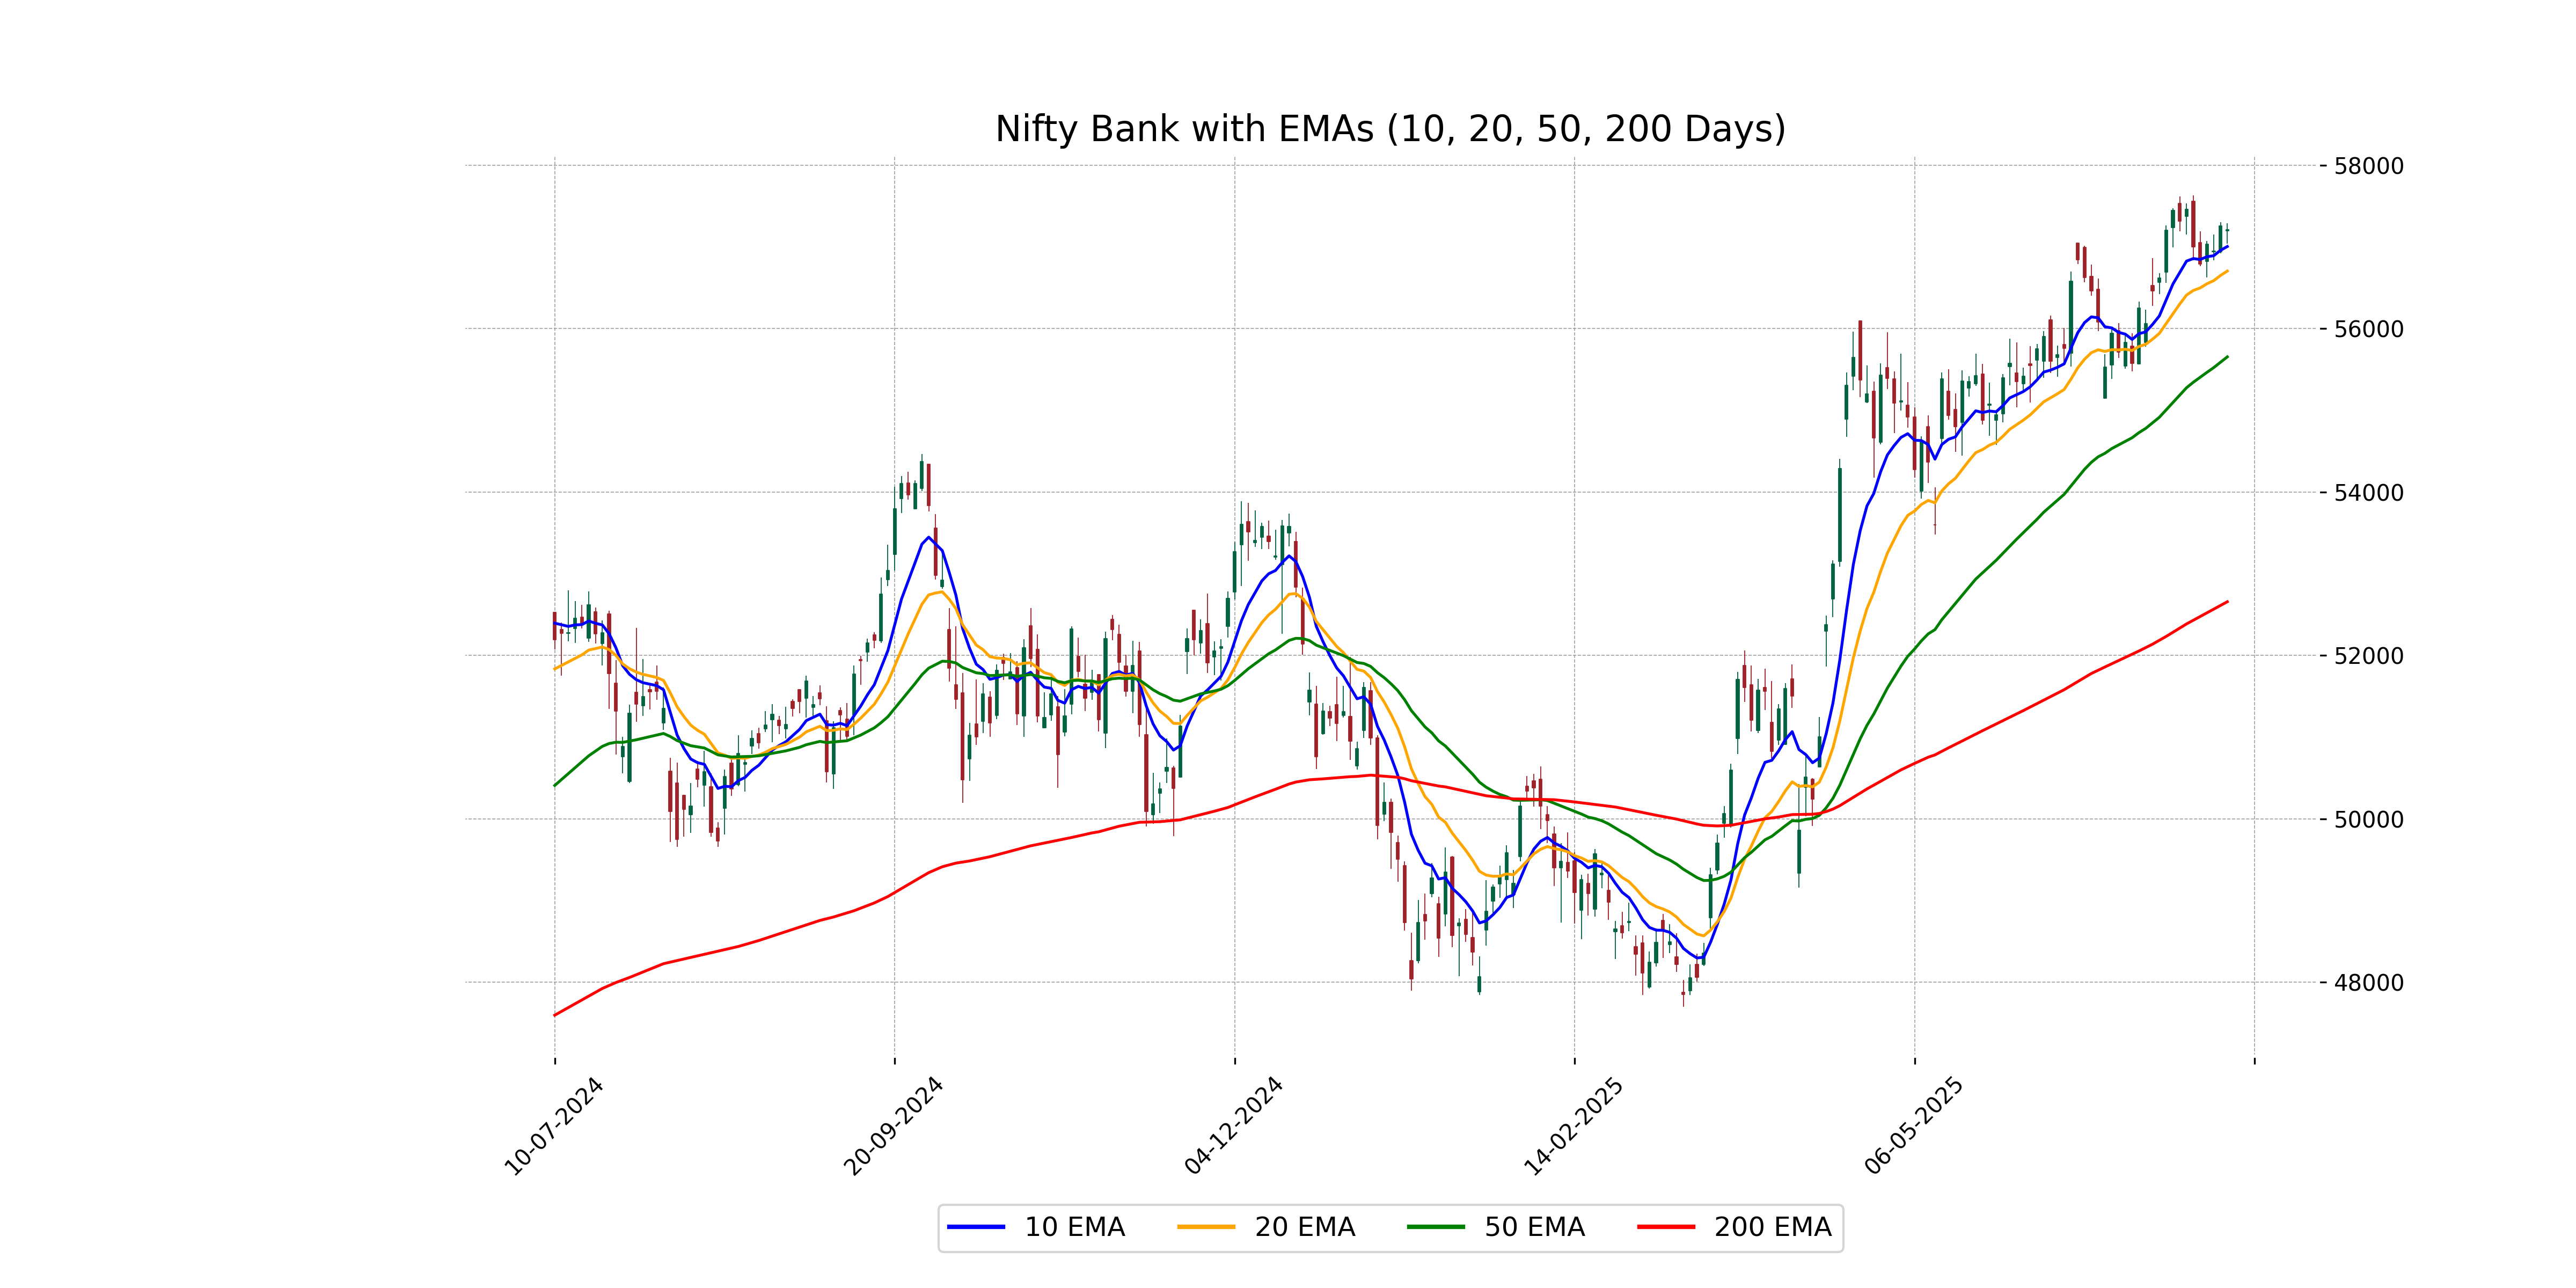
Relationship with Key Moving Averages
The closing price of Nifty Bank at 57213.55078125 is above its 10-day EMA of 57004.7031 and 20-day EMA of 56704.0856, indicating a short-term bullish trend. However, it remains significantly above both the 50-day EMA of 55654.1967 and the 200-day EMA of 52657.0334, suggesting an overall strong upward trend in the medium to long term.
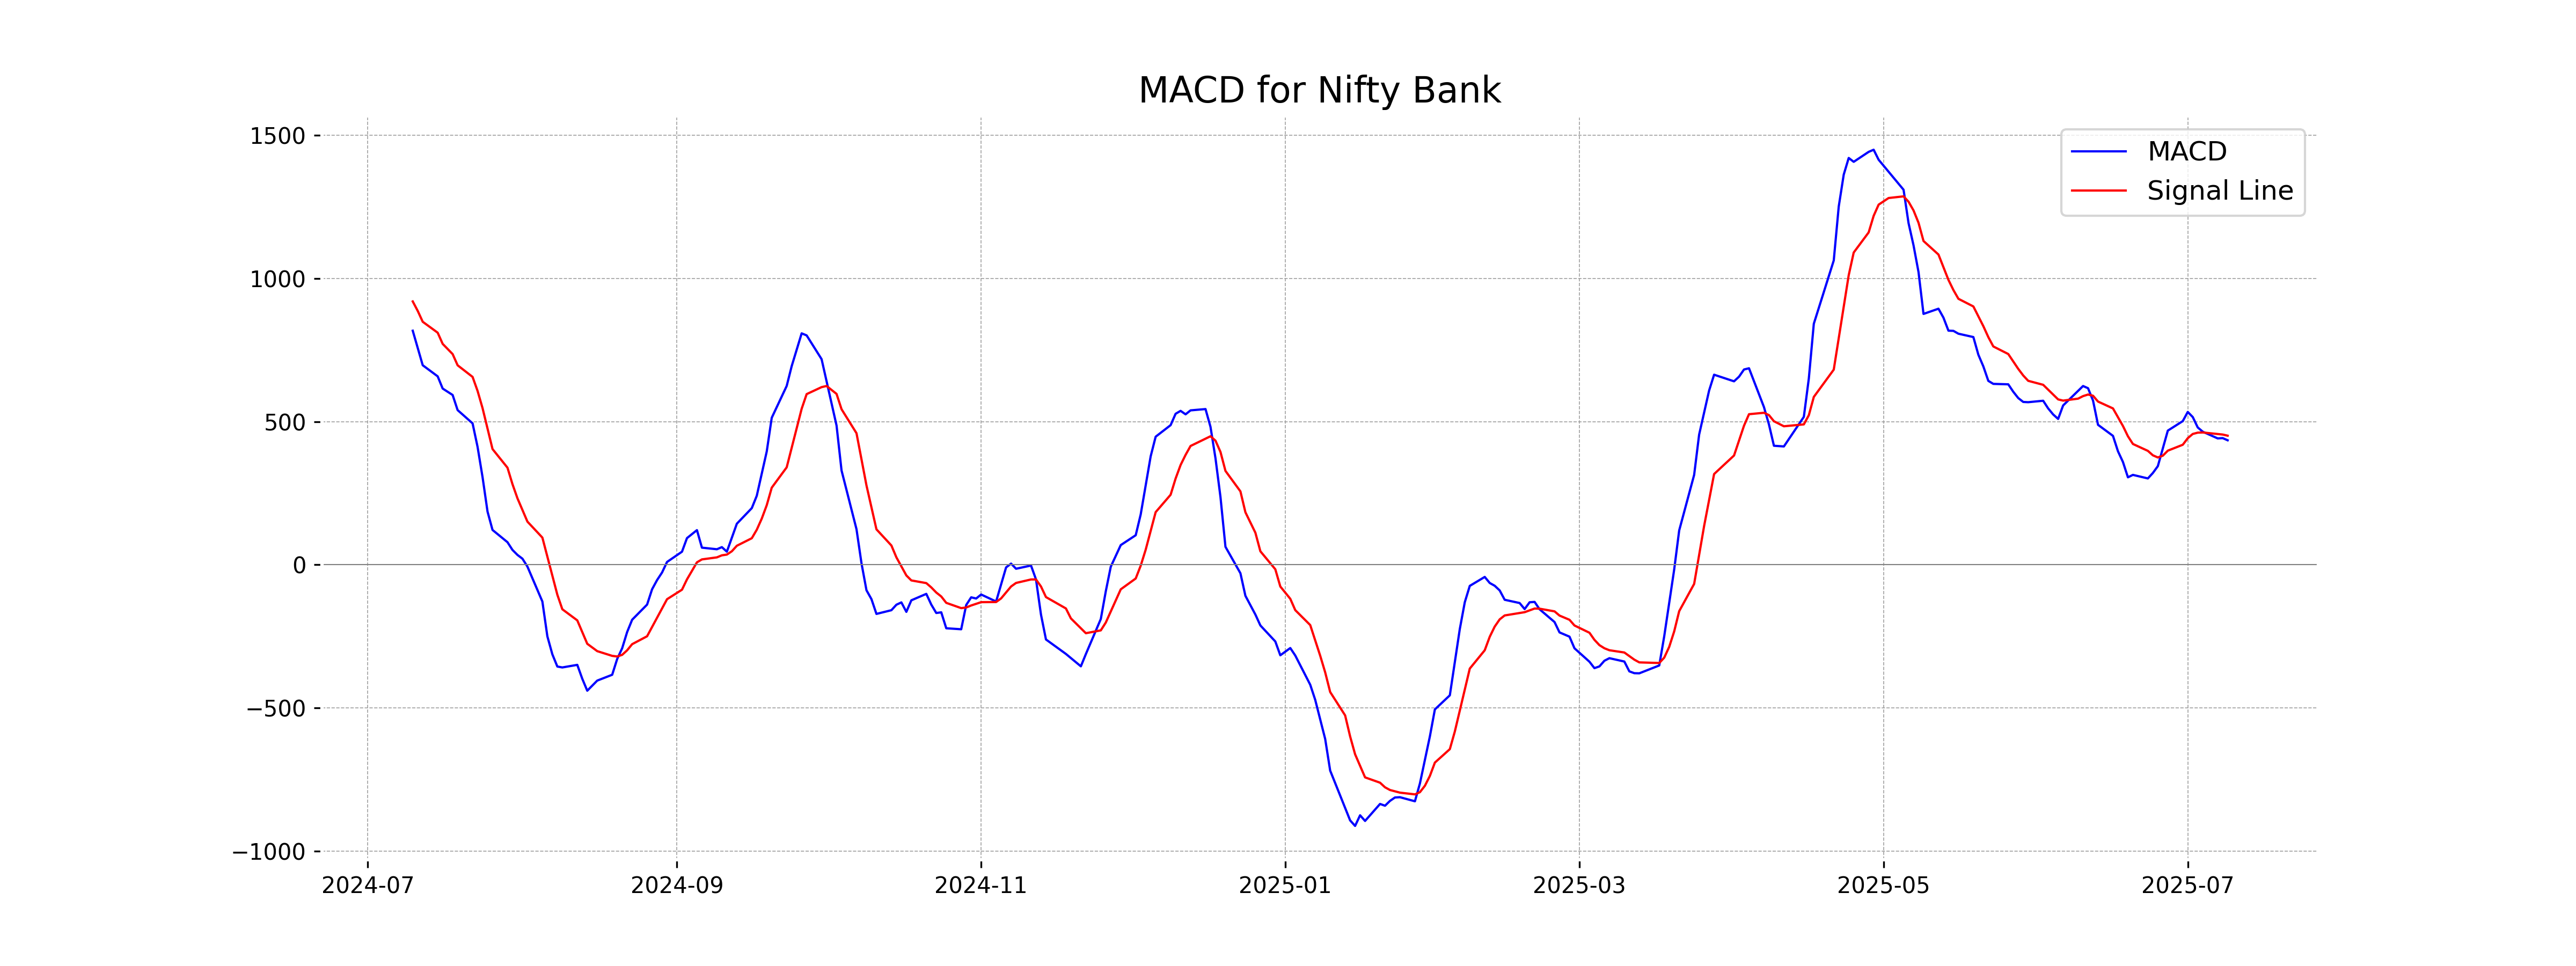
Moving Averages Trend (MACD)
- The Moving Average Convergence Divergence (MACD) value for Nifty Bank is 434.81. - The MACD line is below the Signal line, which is at 450.82, indicating a potential bearish signal. - Traders might interpret this as a signal to be cautious about bullish positions in the short term.
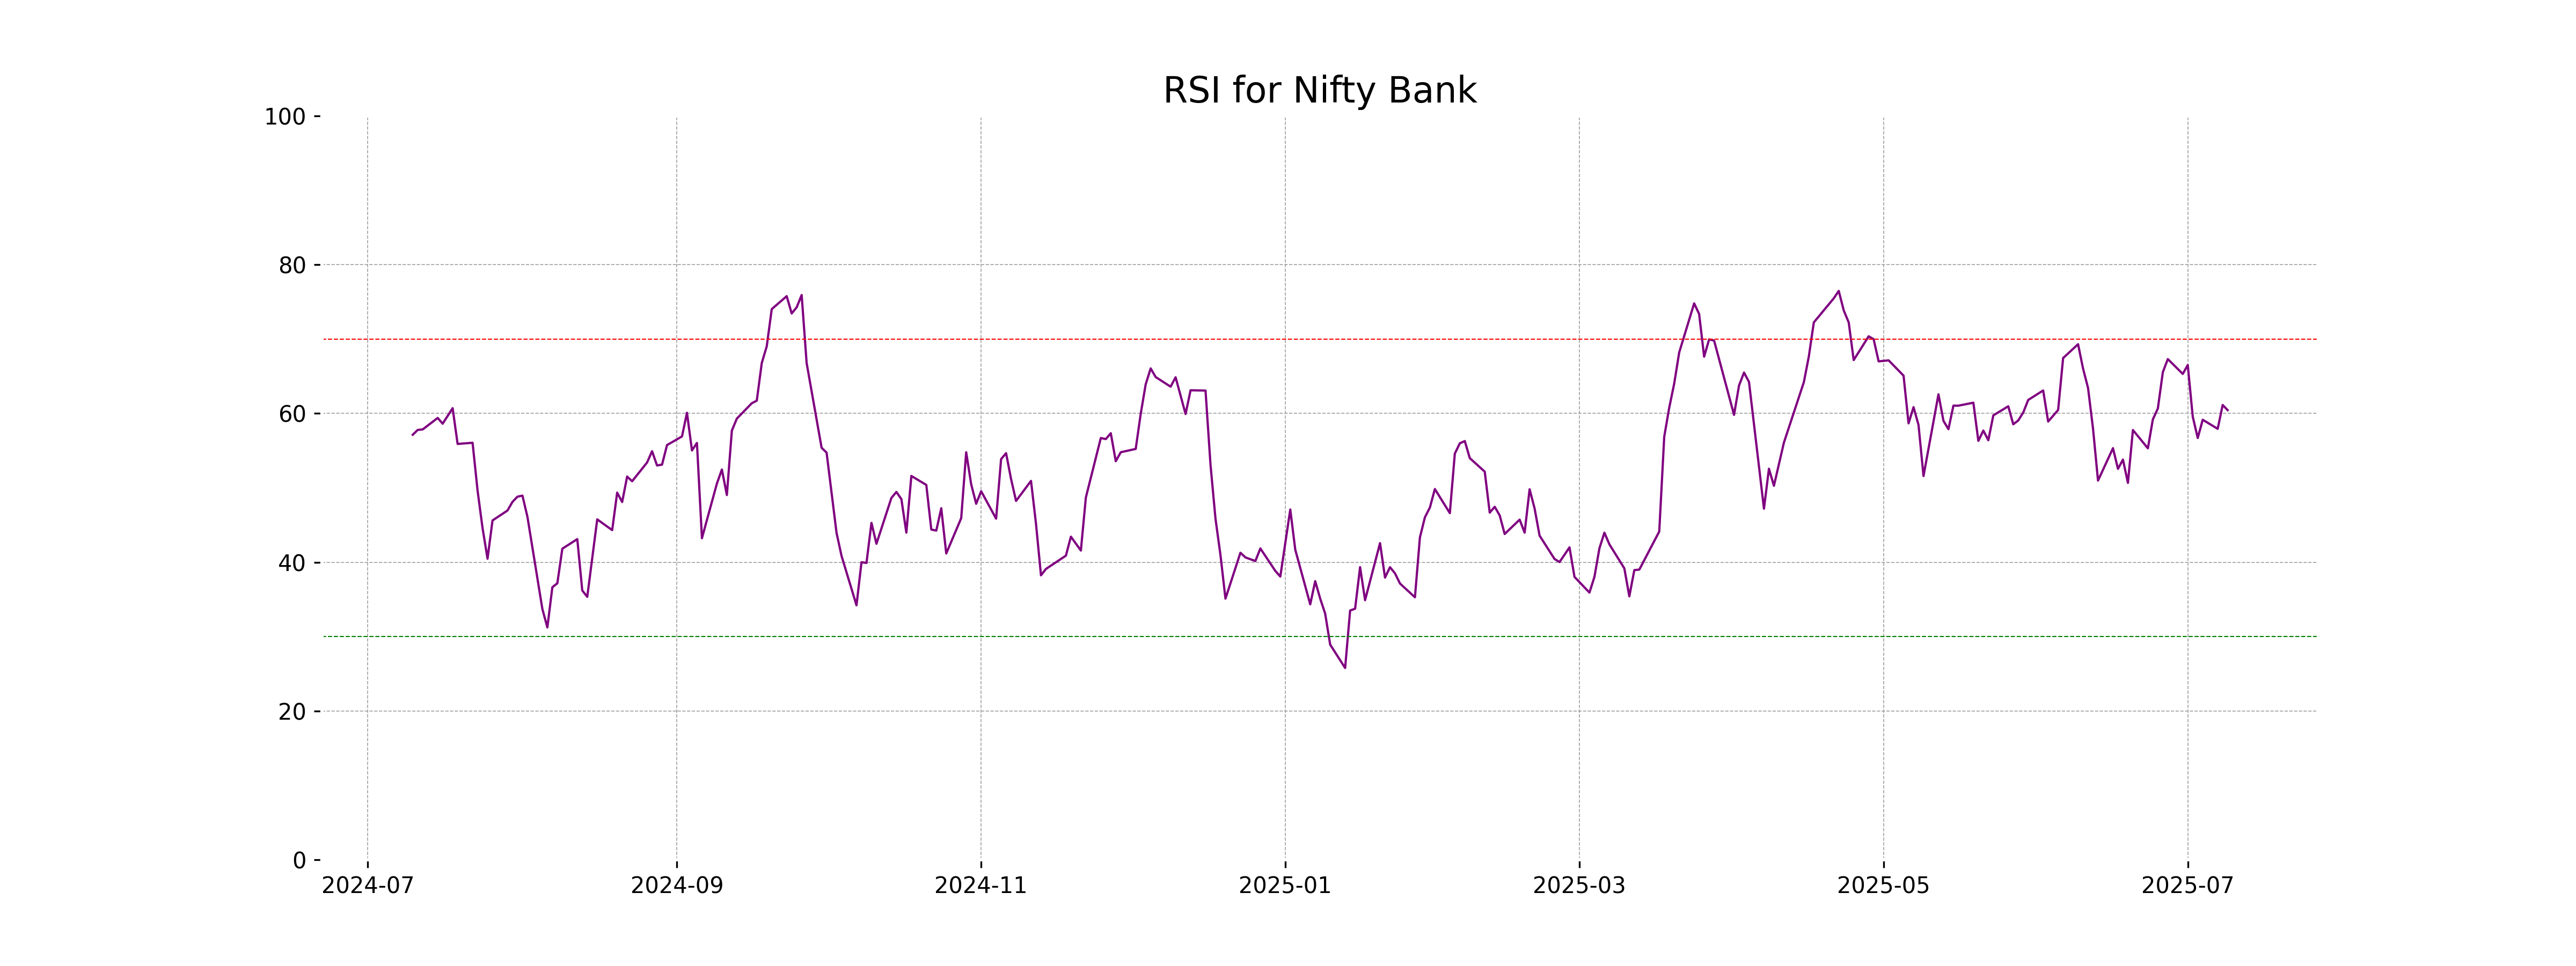
RSI Analysis
The Nifty Bank index has an RSI of 60.45, indicating that it is in the neutral to slightly overbought territory. Generally, an RSI above 70 suggests overbought conditions, while below 30 suggests oversold. Therefore, the current RSI suggests that Nifty Bank is experiencing moderated buying pressure and is not at extreme levels.
Analysis for Nifty 50 - July 09, 2025
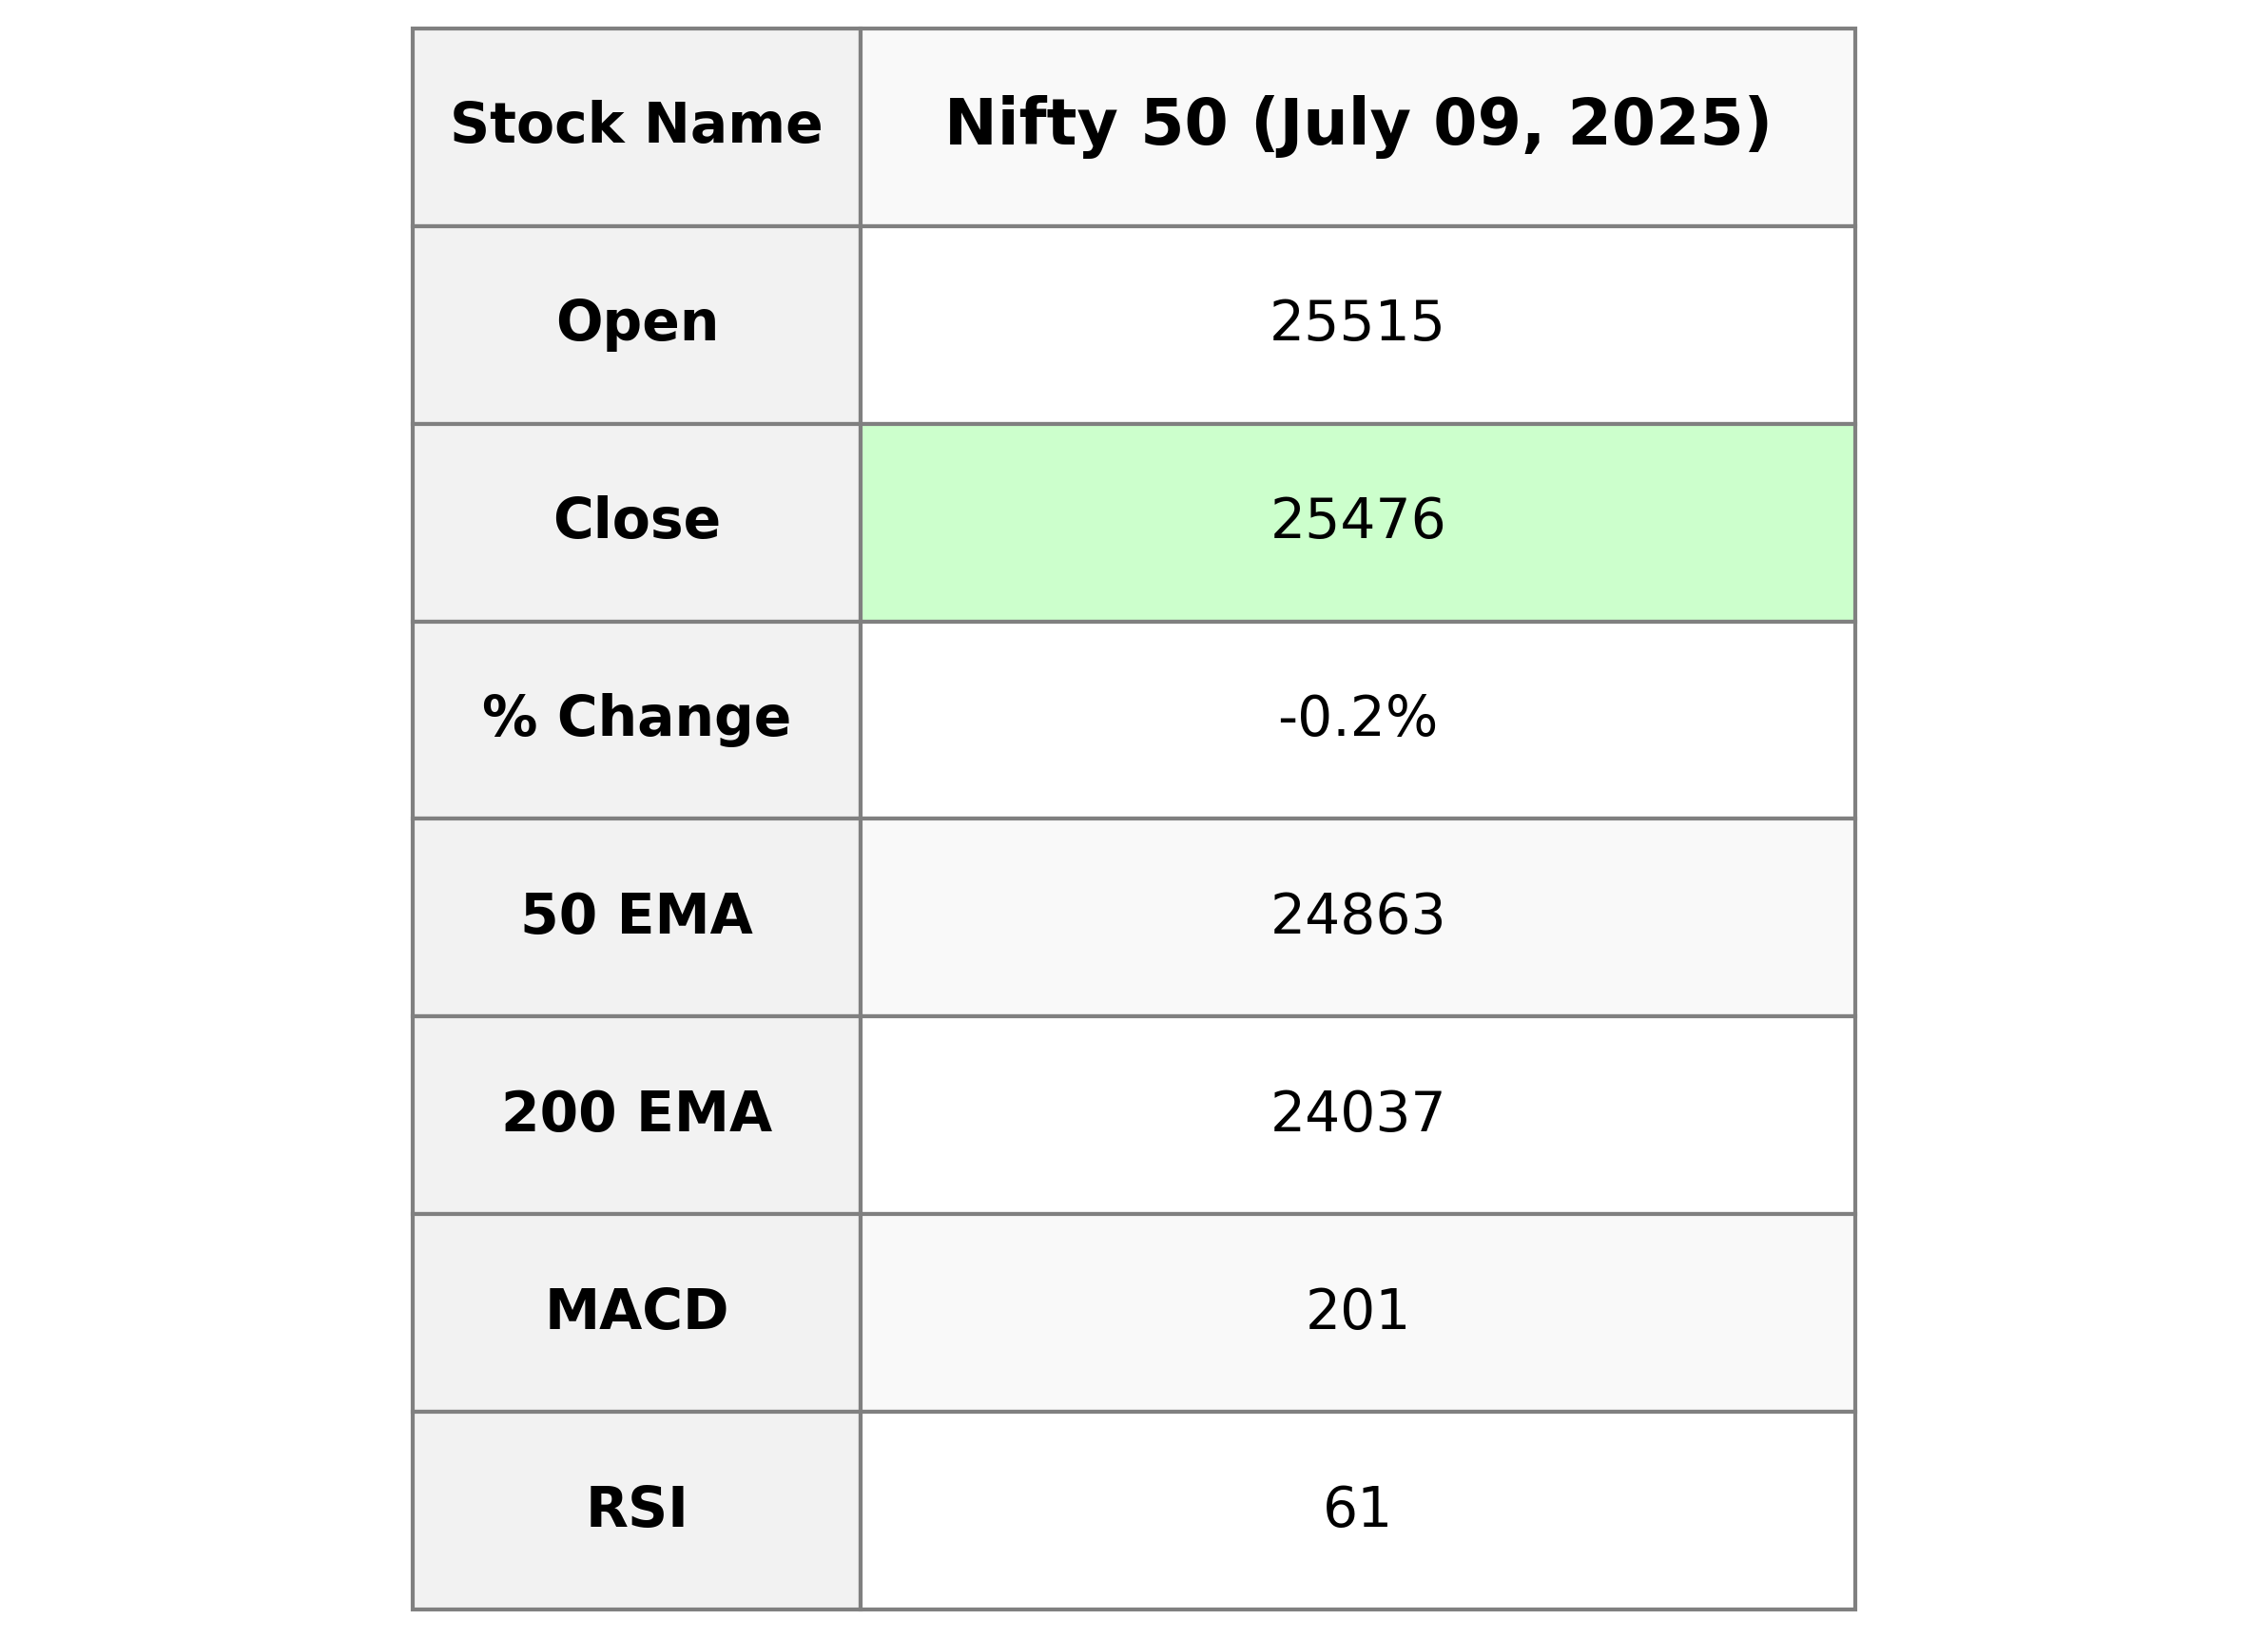
The Nifty 50 opened at 25,514.60 and closed slightly lower at 25,476.10, indicating a decrease of 46.40 points or -0.18%. The stock experienced a high of 25,548.70 and a low of 25,424.35, with an RSI of 60.61 suggesting moderate strength. The technical indicators, including a MACD of 200.92, show that the index is above its 50-day and 200-day EMA, indicating potential bullish momentum despite the day's slight decline.
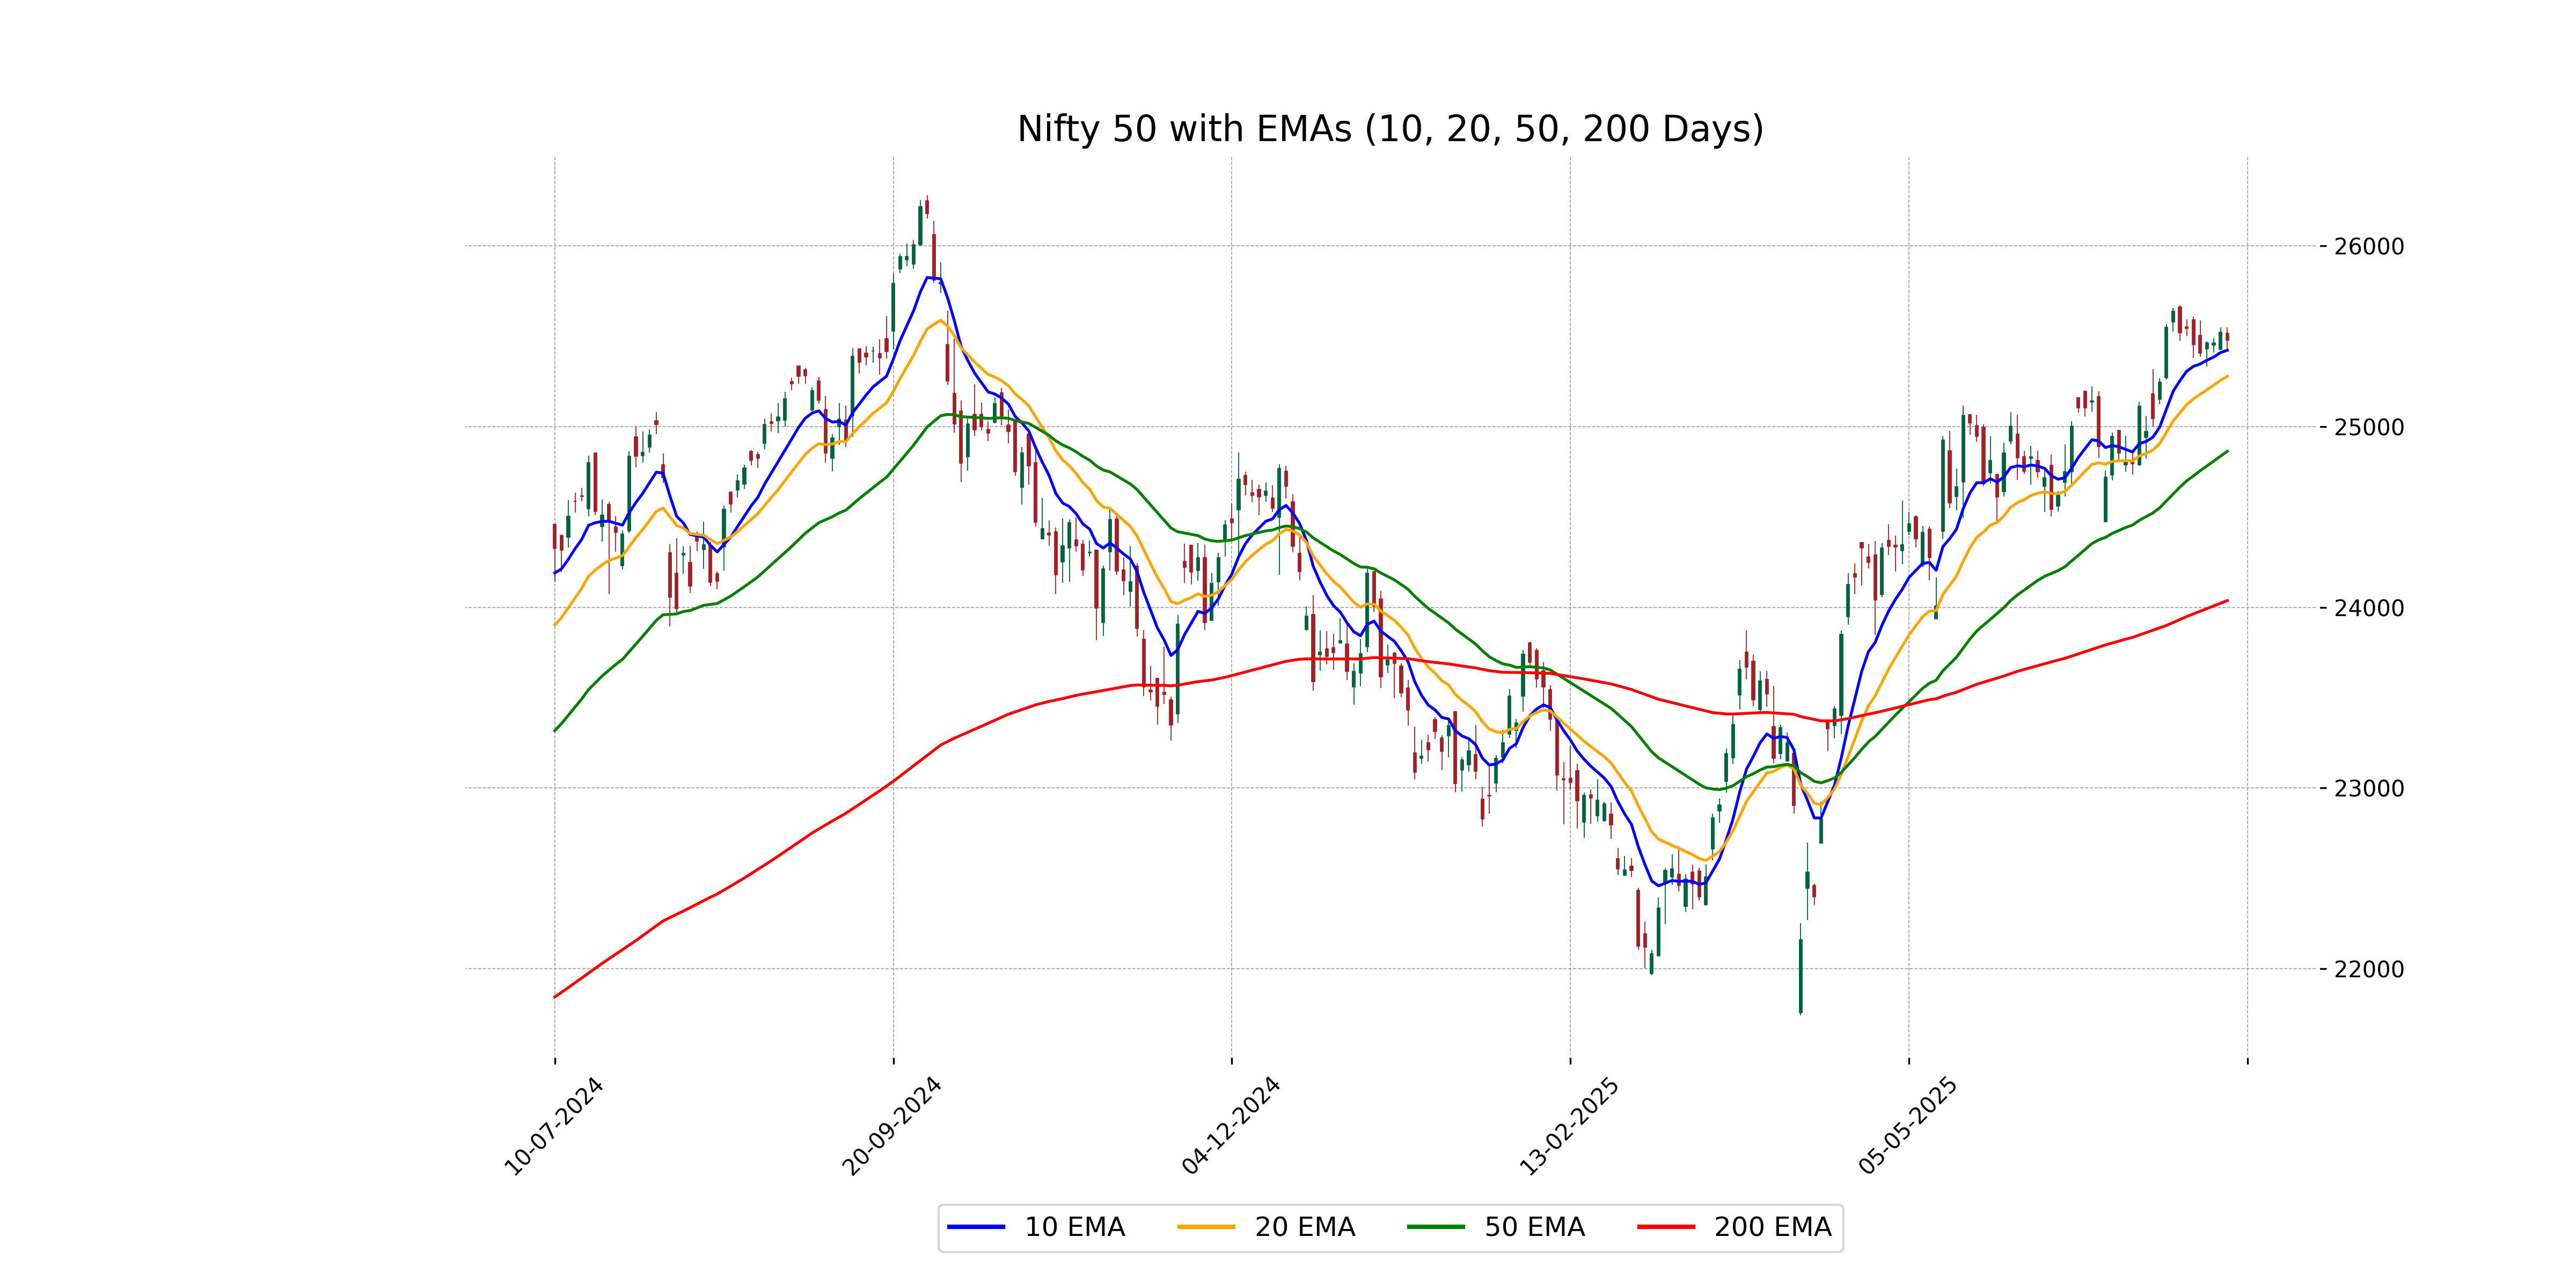
Relationship with Key Moving Averages
The Nifty 50 closed at 25,476.10, slightly below its previous close of 25,522.50, indicating a minor decline. The closing price is above the 10 EMA of 25,421.32 and the 20 EMA of 25,277.22, suggesting short-term bullish momentum, while also being above the 50 EMA of 24,862.59 and the 200 EMA of 24,037.00, pointing to a longer-term uptrend.
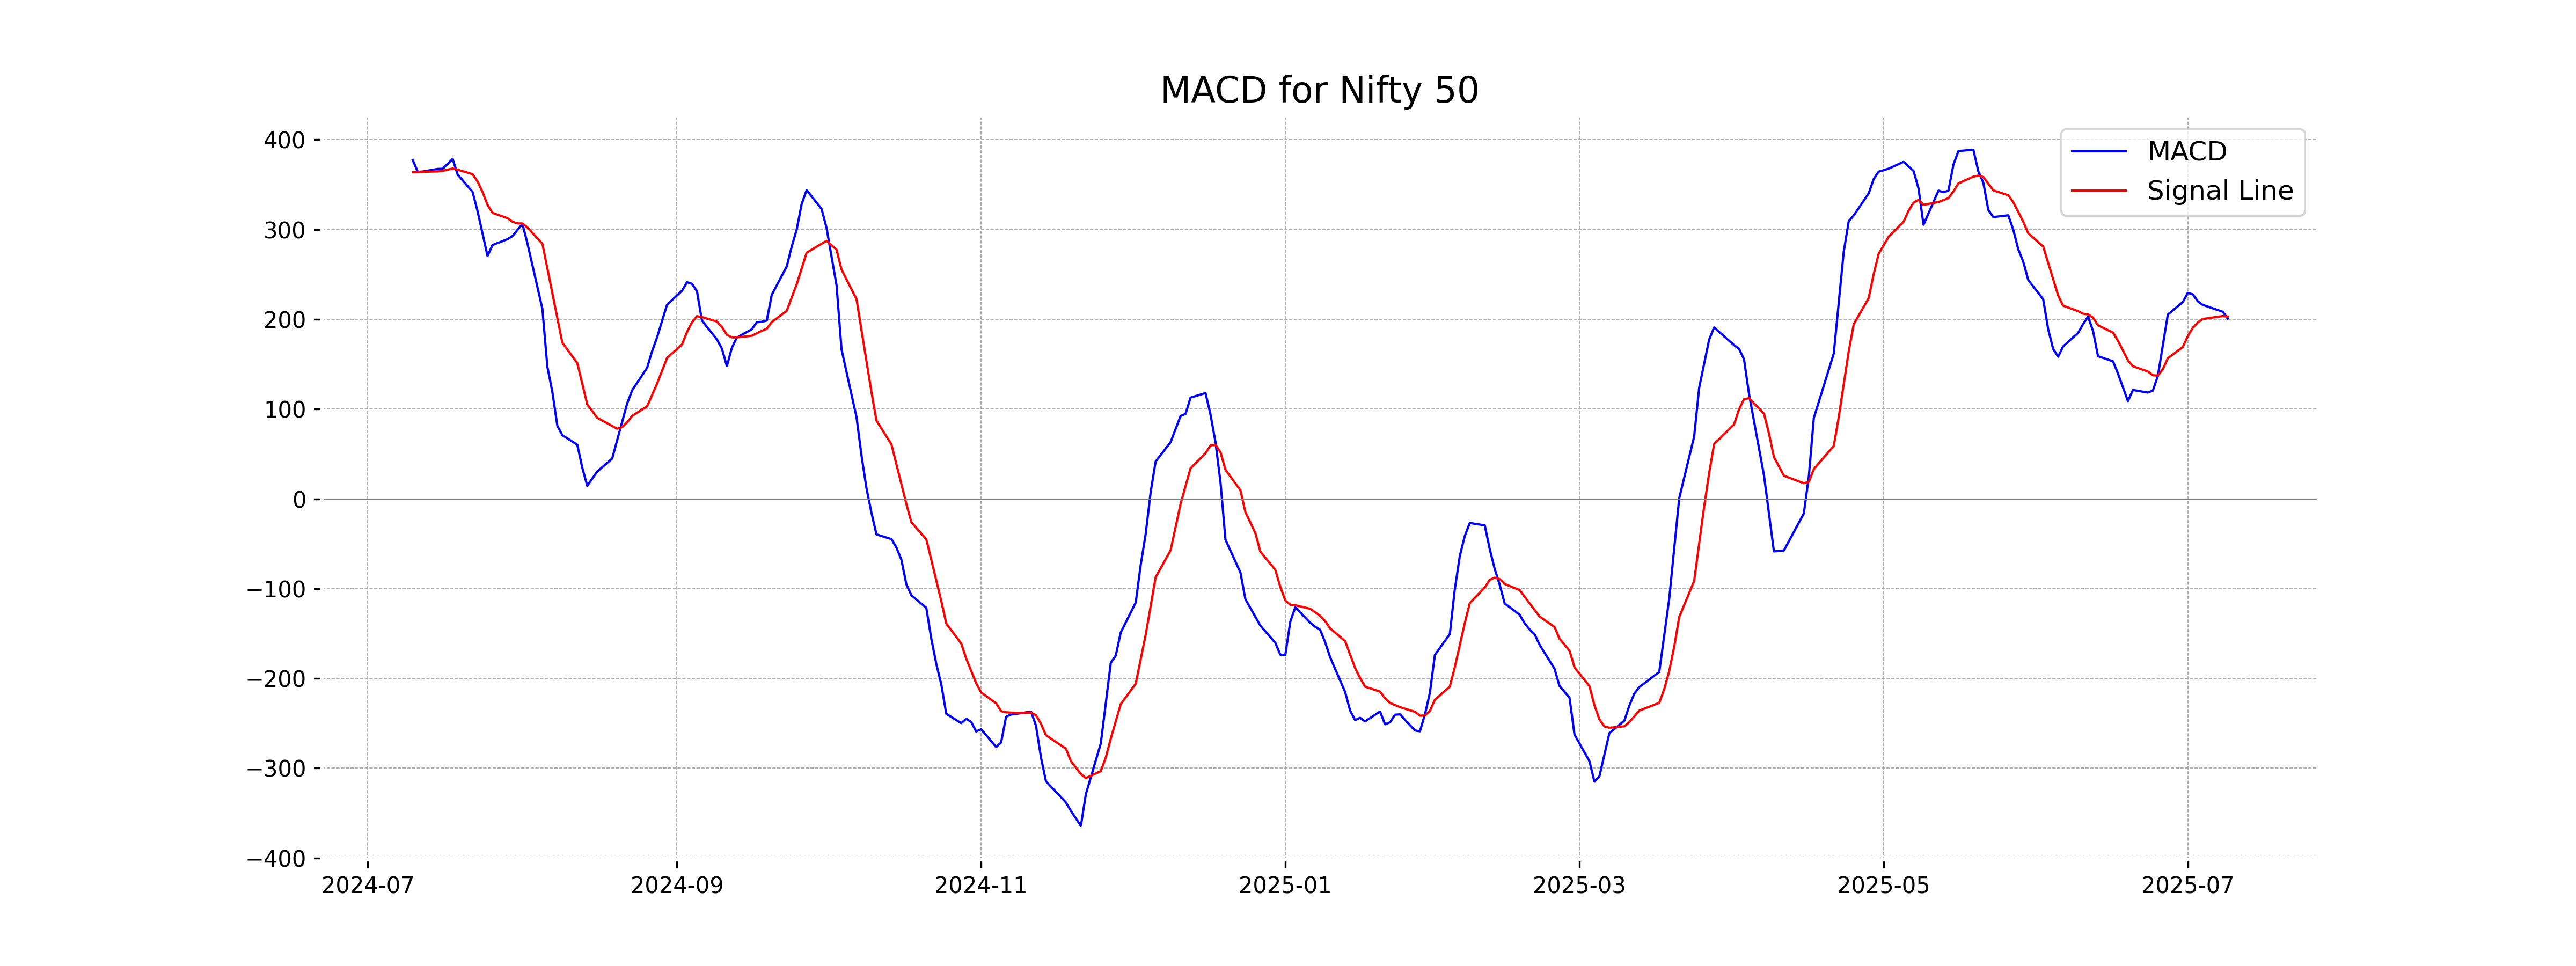
Moving Averages Trend (MACD)
The Nifty 50's MACD value is 200.92, which is slightly below its MACD Signal line at 203.08, indicating a potential bearish crossover. This suggests cautiousness as the momentum might be slowing down. However, the RSI is at a healthy level, hinting at a still positive momentum overall.
RSI Analysis
The Relative Strength Index (RSI) for Nifty 50 is 60.61, indicating that the stock is in a neutral to slightly overbought range. RSI values above 70 typically indicate overbought conditions, while values below 30 may indicate oversold conditions. Currently, the RSI suggests balanced market momentum with potential mild positive sentiment.