Indian stock market sector-wise performance today - August 6, 2025
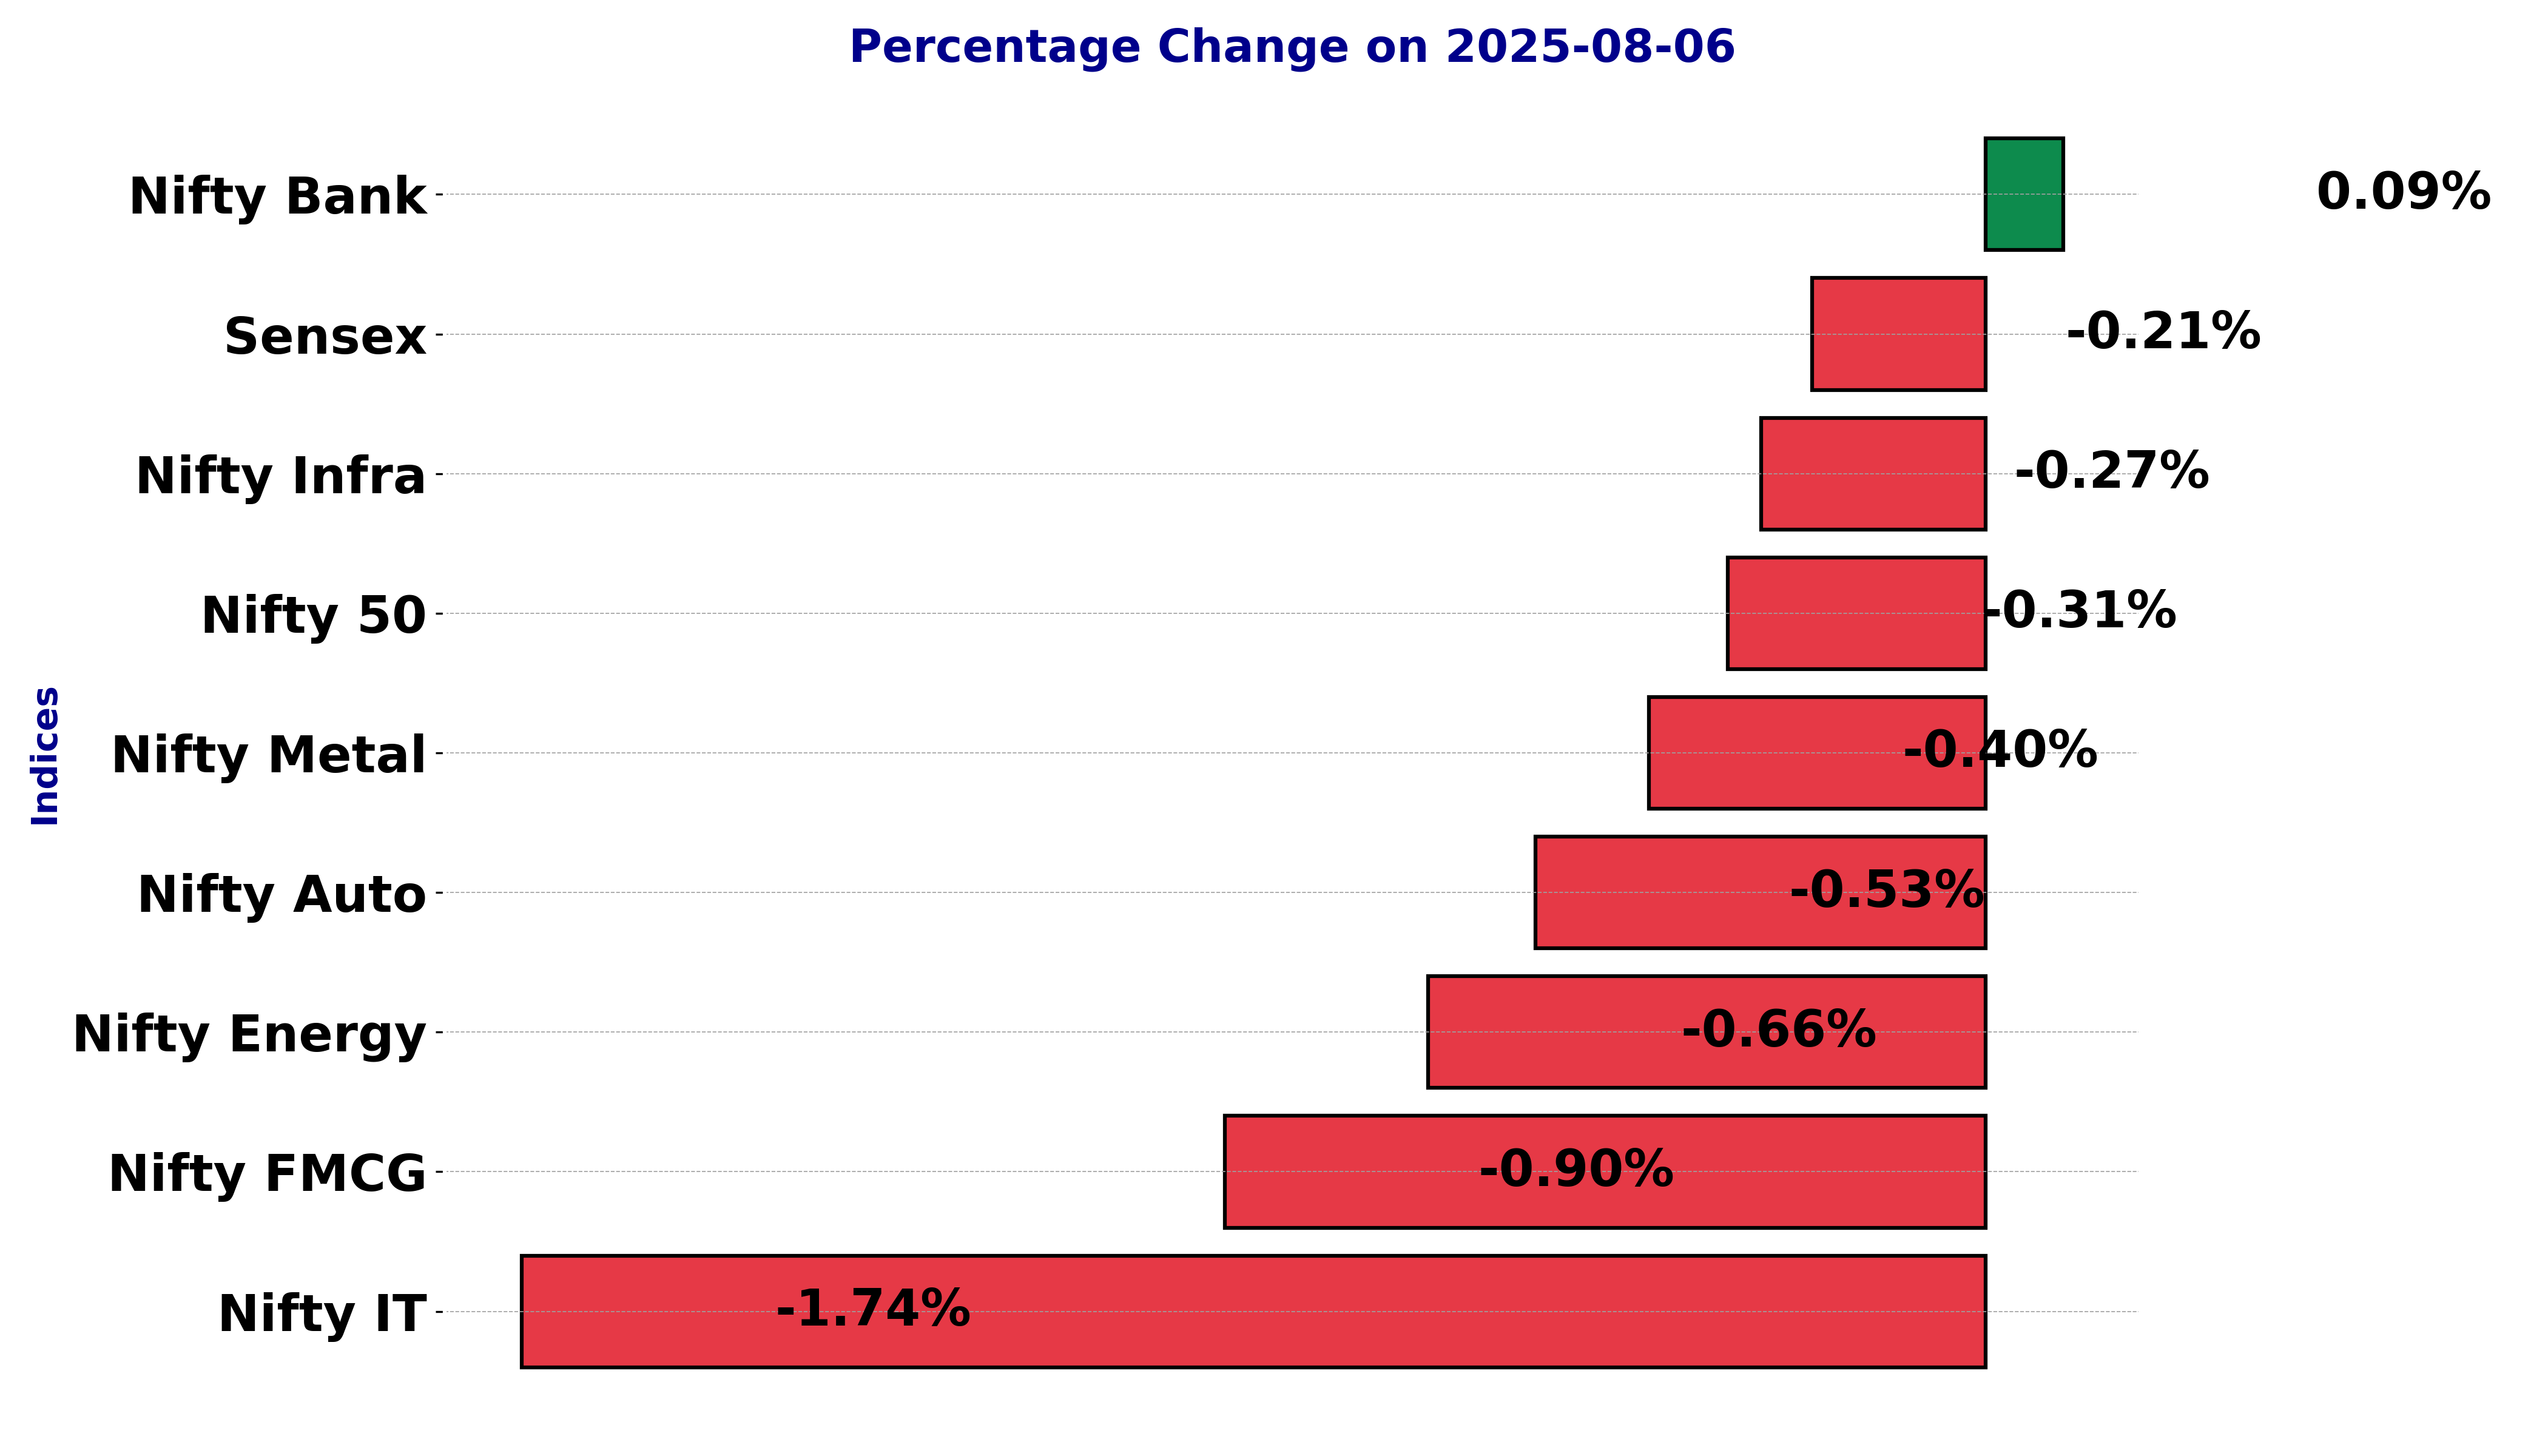
On a particularly challenging day for the stock market on Wednesday (August 6, 2025), several key indices experienced notable changes, often veering into negative territory.
Leading the decline was the Nifty IT index, which plunged by 1.74%. This significant dip reflects underlying challenges in the information technology sector, possibly due to broader concerns about tech spending or profit warnings from major players within the industry.
The Nifty FMCG index also registered a considerable downturn, declining by 0.90%. This drop may suggest waning consumer confidence or shifts in consumer spending patterns, influencing the Fast-Moving Consumer Goods sector negatively.
Similarly, the Nifty Energy index dropped by 0.66%, indicating potential fluctuations in commodity prices or other external pressures affecting energy companies.
The Nifty Auto index saw a decrease of 0.53%, which could be attributed to weaker demand dynamics or supply chain constraints impacting the automotive sector.
Meanwhile, the BSE Sensex showed a slight decrease of 0.21%, as investors possibly reacted to mixed economic signals or anticipation around upcoming fiscal policies.
The Nifty 50, a significant gauge for the Indian stock market, fell by 0.31%, in line with overall market sentiment reflecting cautious investor behavior amidst uncertain market conditions.
In contrast, the Nifty Bank managed a marginal gain of 0.09%, suggesting some resilience or investor optimism around the financial sector despite the broader market downturn.
Lastly, the Nifty Infra and Nifty Metal indices experienced declines of 0.27% and 0.40%, respectively, highlighting concerns related to infrastructure and metal sectors possibly due to policy uncertainty or global trade tensions.
Overall, the mixed performance across various indices suggests a day marked by broader market volatility, with the most profound impact observed in the technology sector, as reflected by the steep drop in the Nifty IT index.
This indicates potential investor apprehension over technological sector growth prospects underpinned by economic and global market uncertainties.
Analysis for Sensex - August 06, 2025

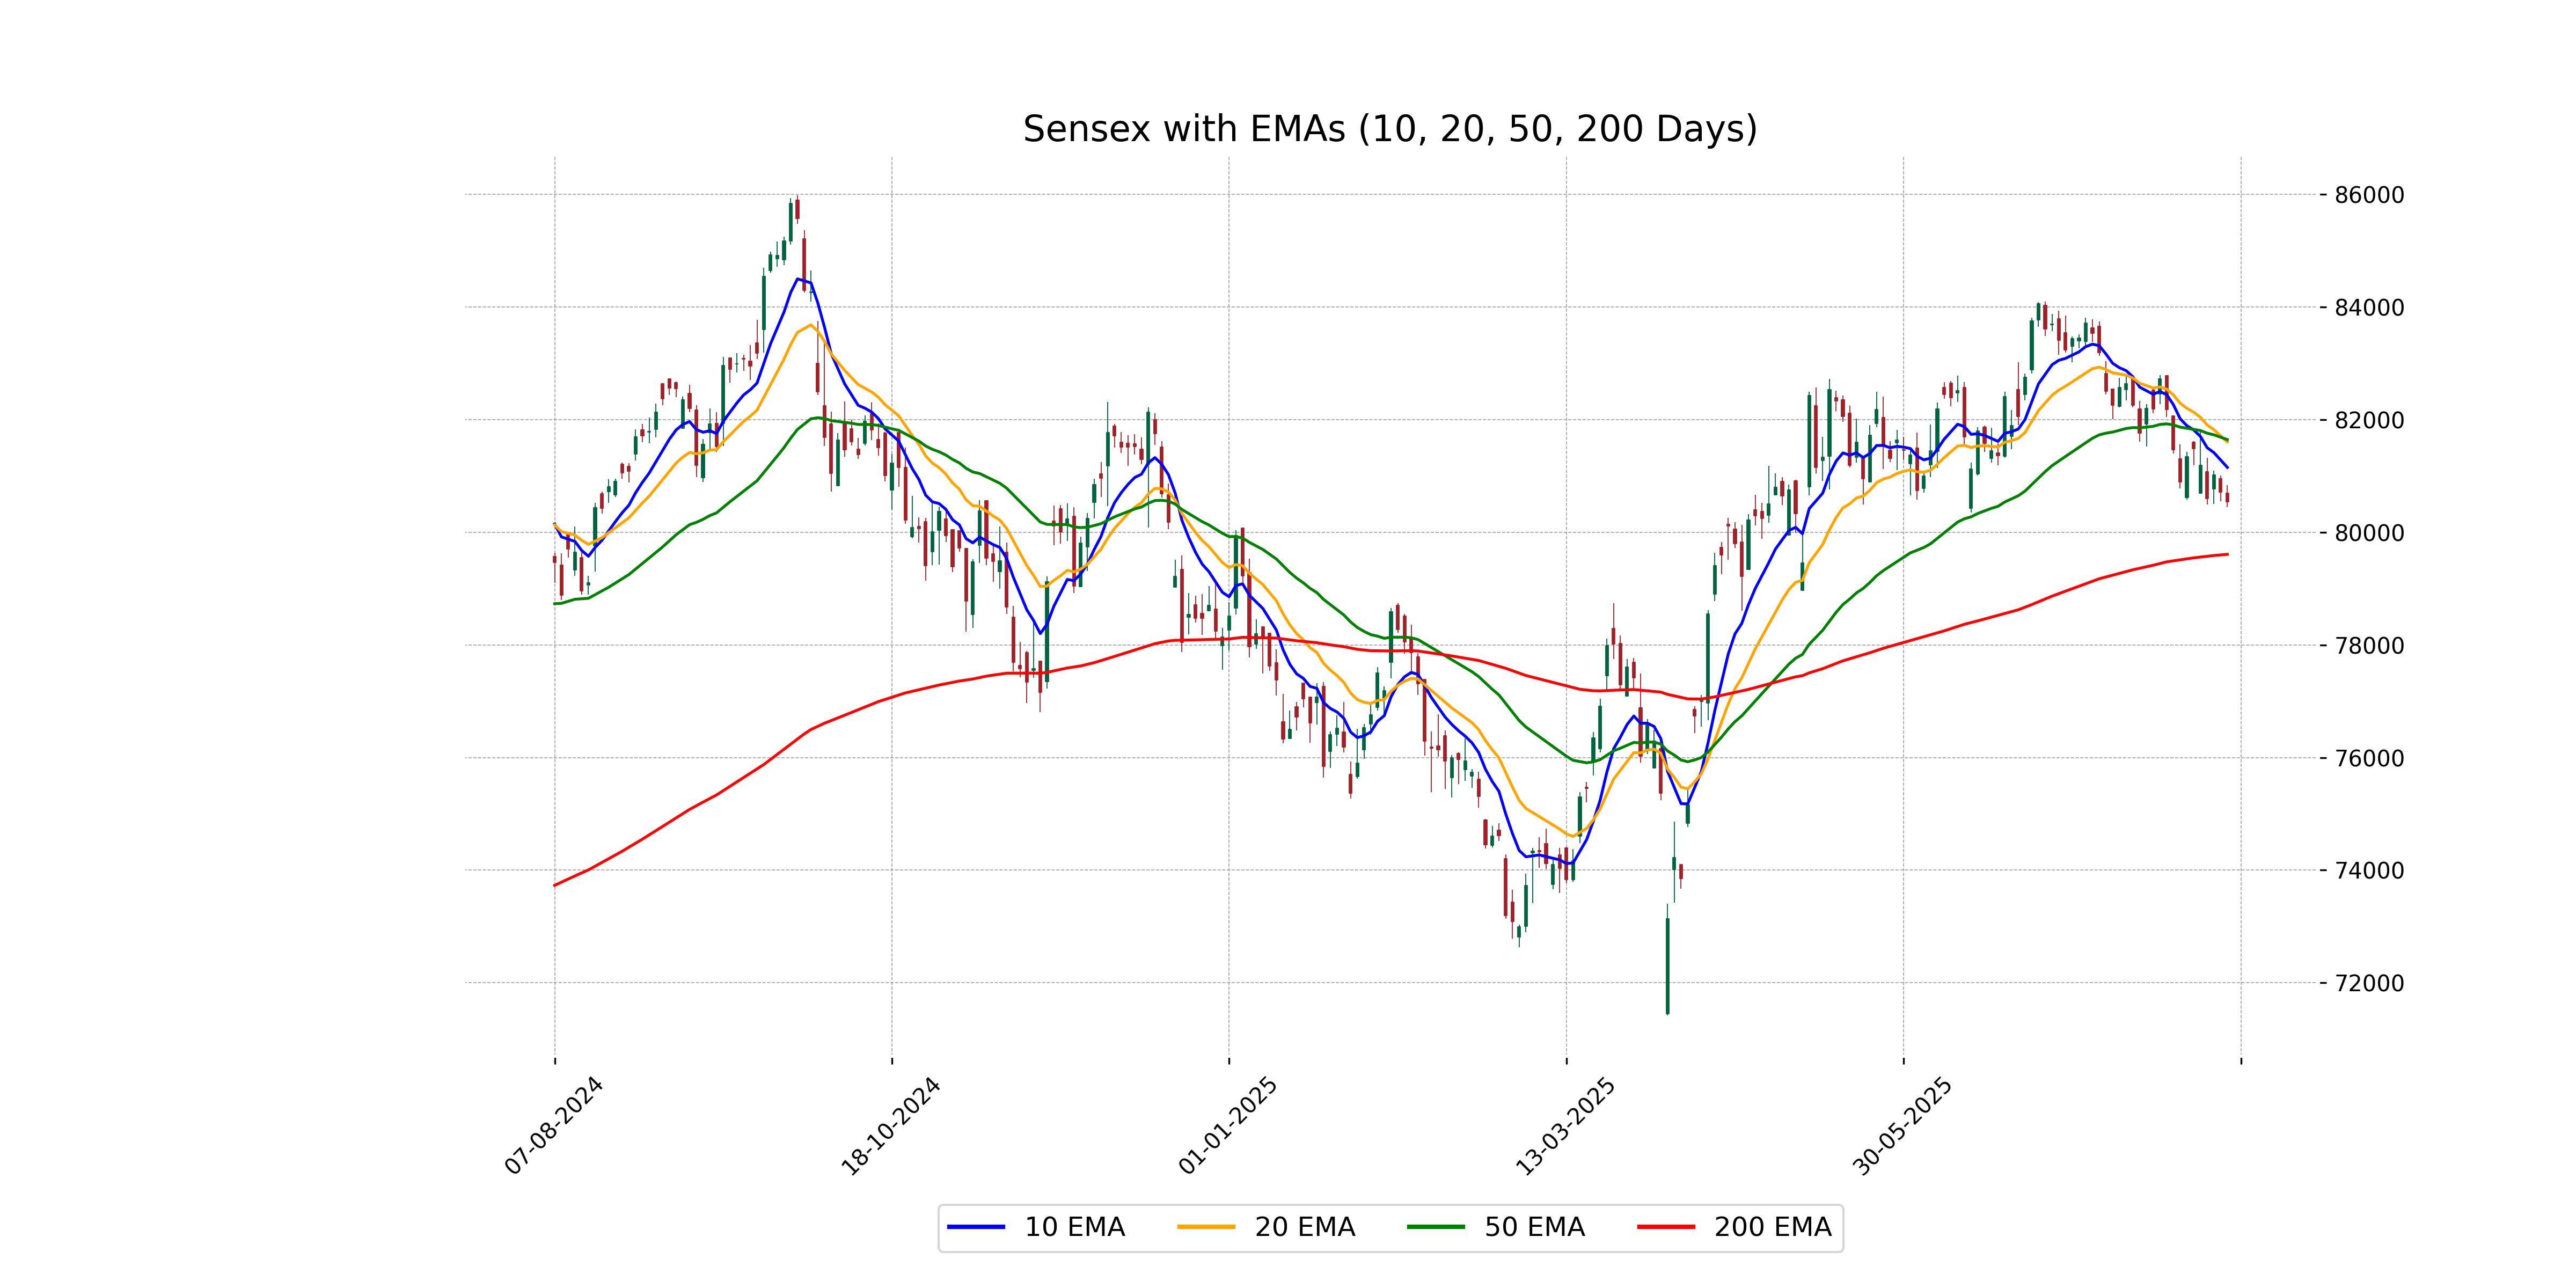
Sensex Performance: On the given trading day, Sensex opened at 80,694.98, recorded its highest at 80,834.43, and closed slightly lower at 80,543.99. The index experienced a decline with a points change of -166.26 and a percentage change of -0.21%. The technical indicators show a negative sentiment, with RSI relatively low at 37.74 and MACD indicating a bearish trend.
Relationship with Key Moving Averages
The Sensex closed at 80543.99, which is below the 50 EMA of 81644.75 and the 10 EMA of 81151.15, indicating a bearish trend. It is, however, slightly above the 200 EMA of 79606.99, suggesting some long-term support might still be present.
Moving Averages Trend (MACD)
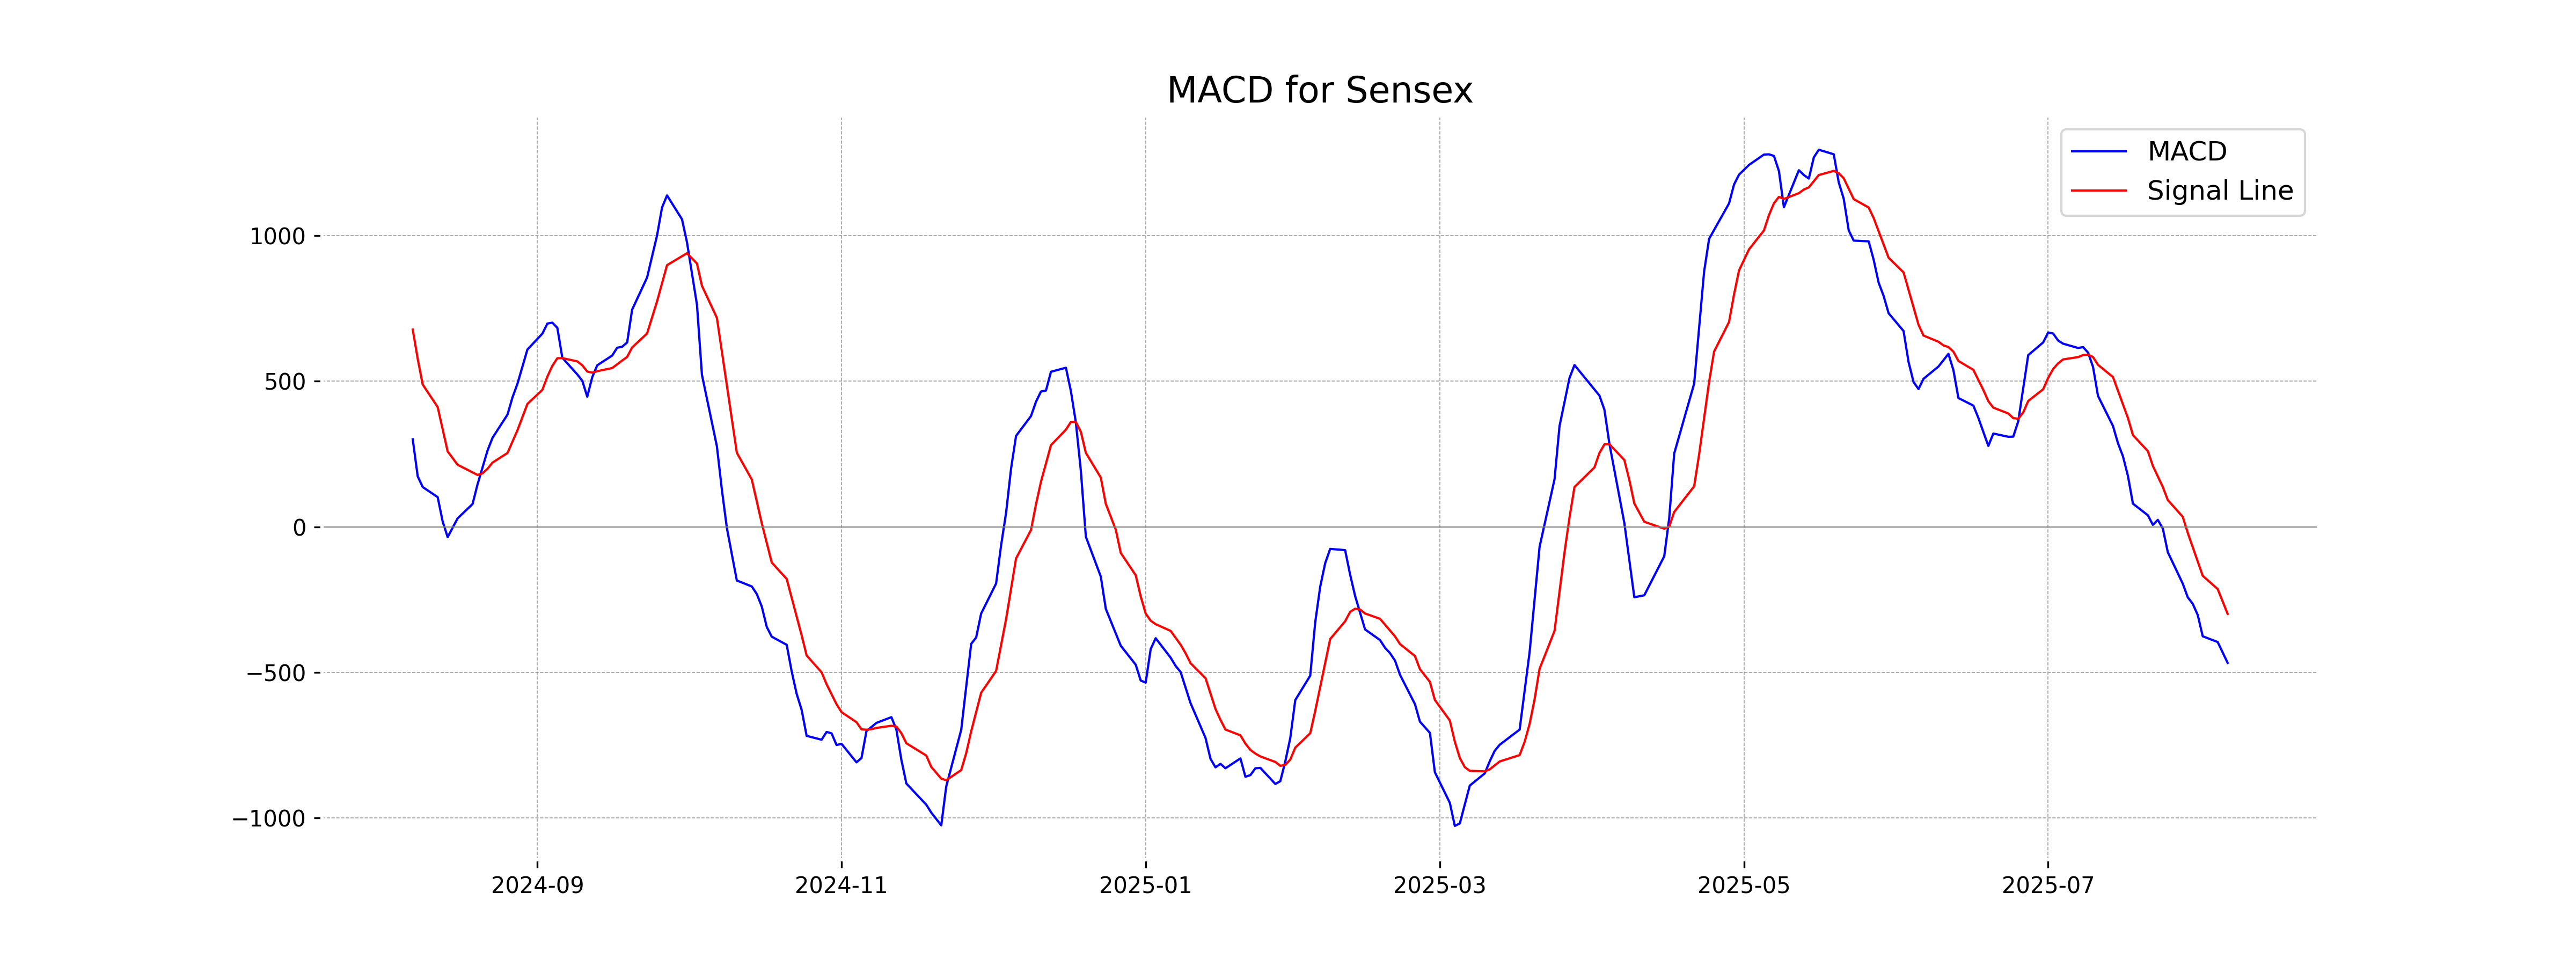
Based on the provided data, the MACD for Sensex is negative at -467.37, with a MACD Signal of -299.31. This suggests a bearish sentiment as the MACD is below the signal line, indicating potential downward momentum in the market.
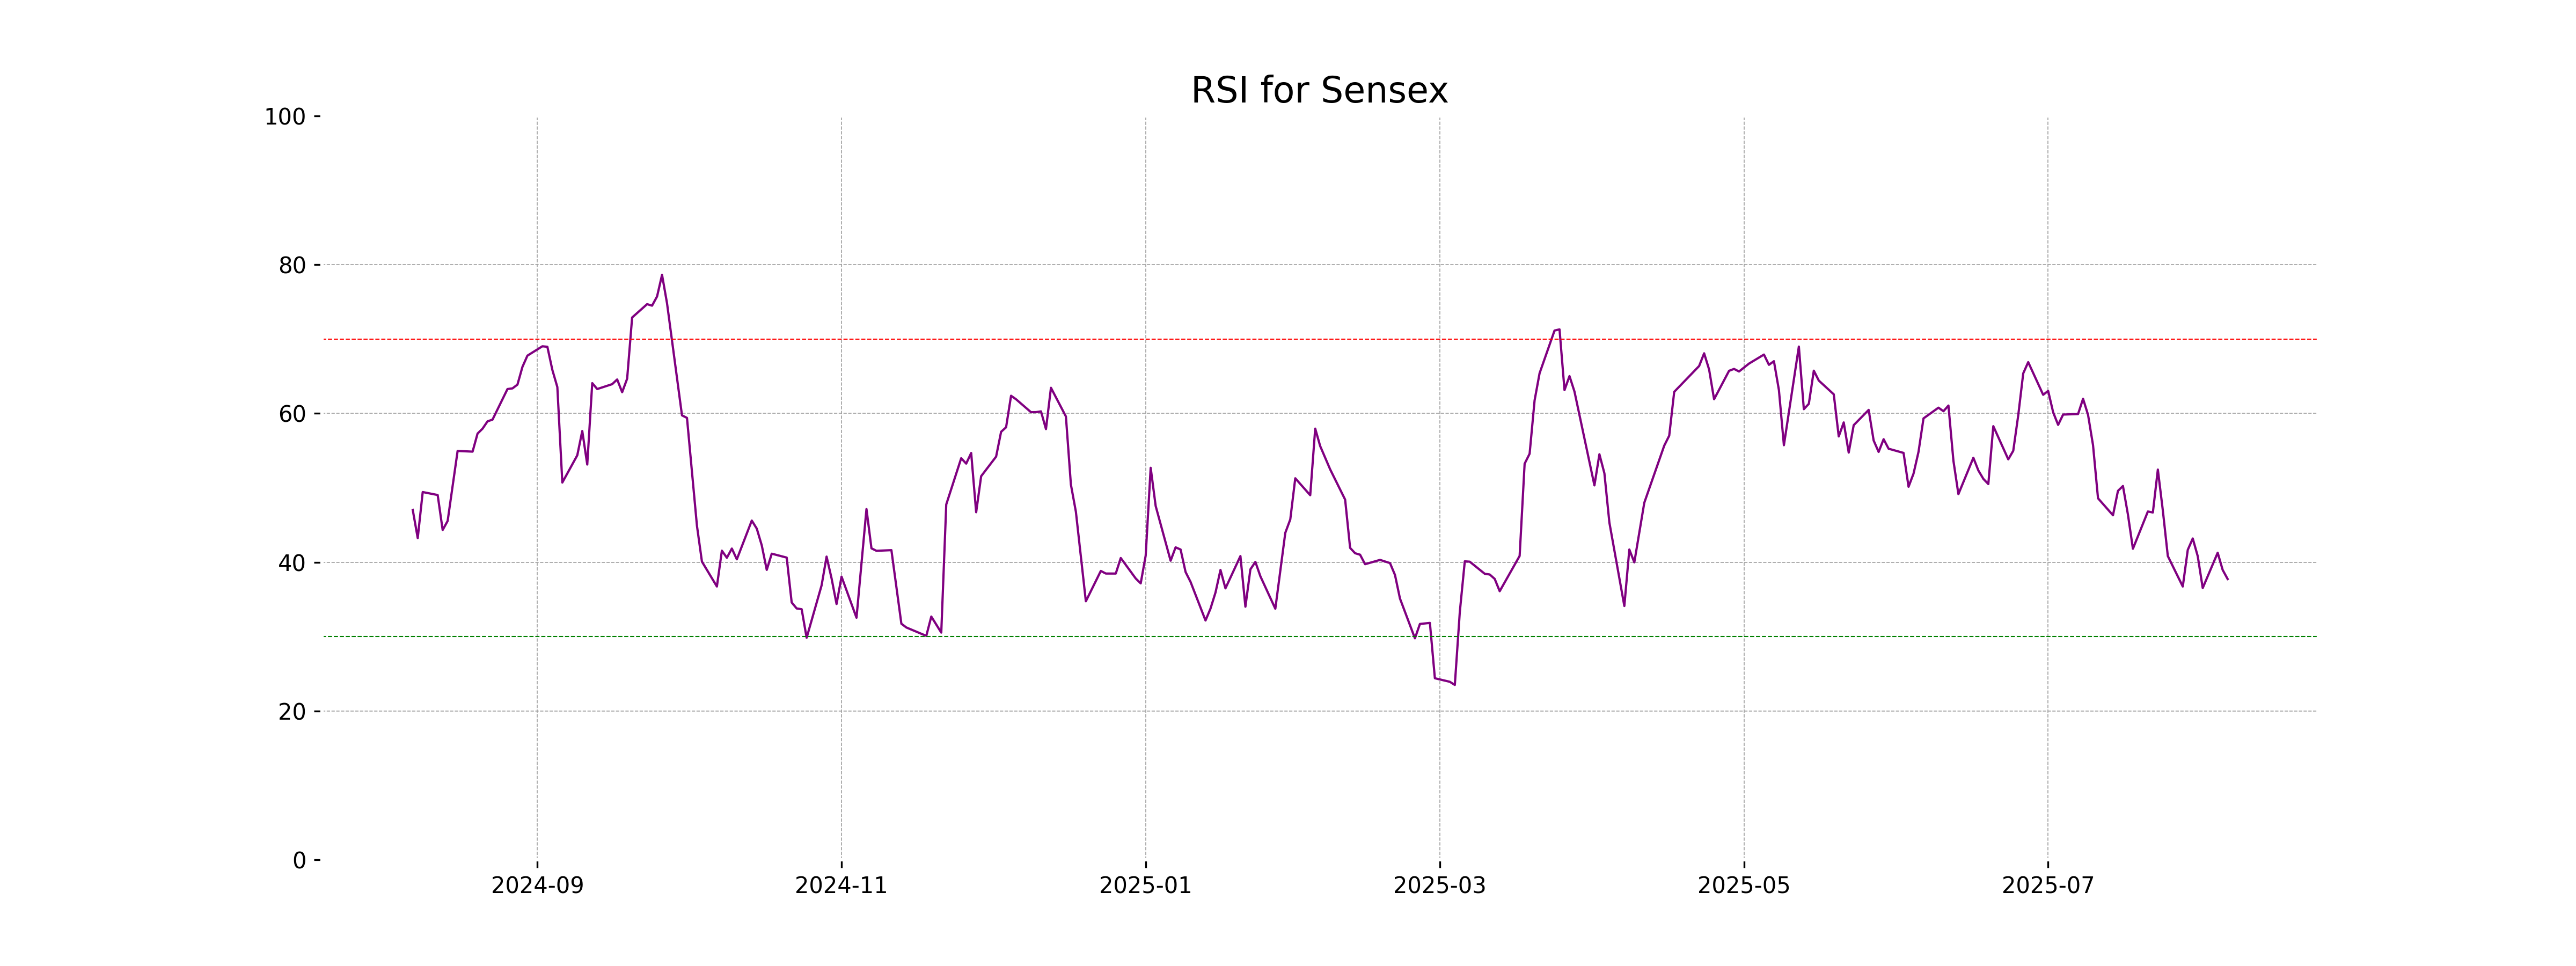
RSI Analysis
The RSI for Sensex stands at approximately 37.74, indicating that the index is nearing the oversold region, which is typically below 30. This suggests potential undervaluation or waning momentum, indicating a possibility of a bullish reversal if buying interest increases.
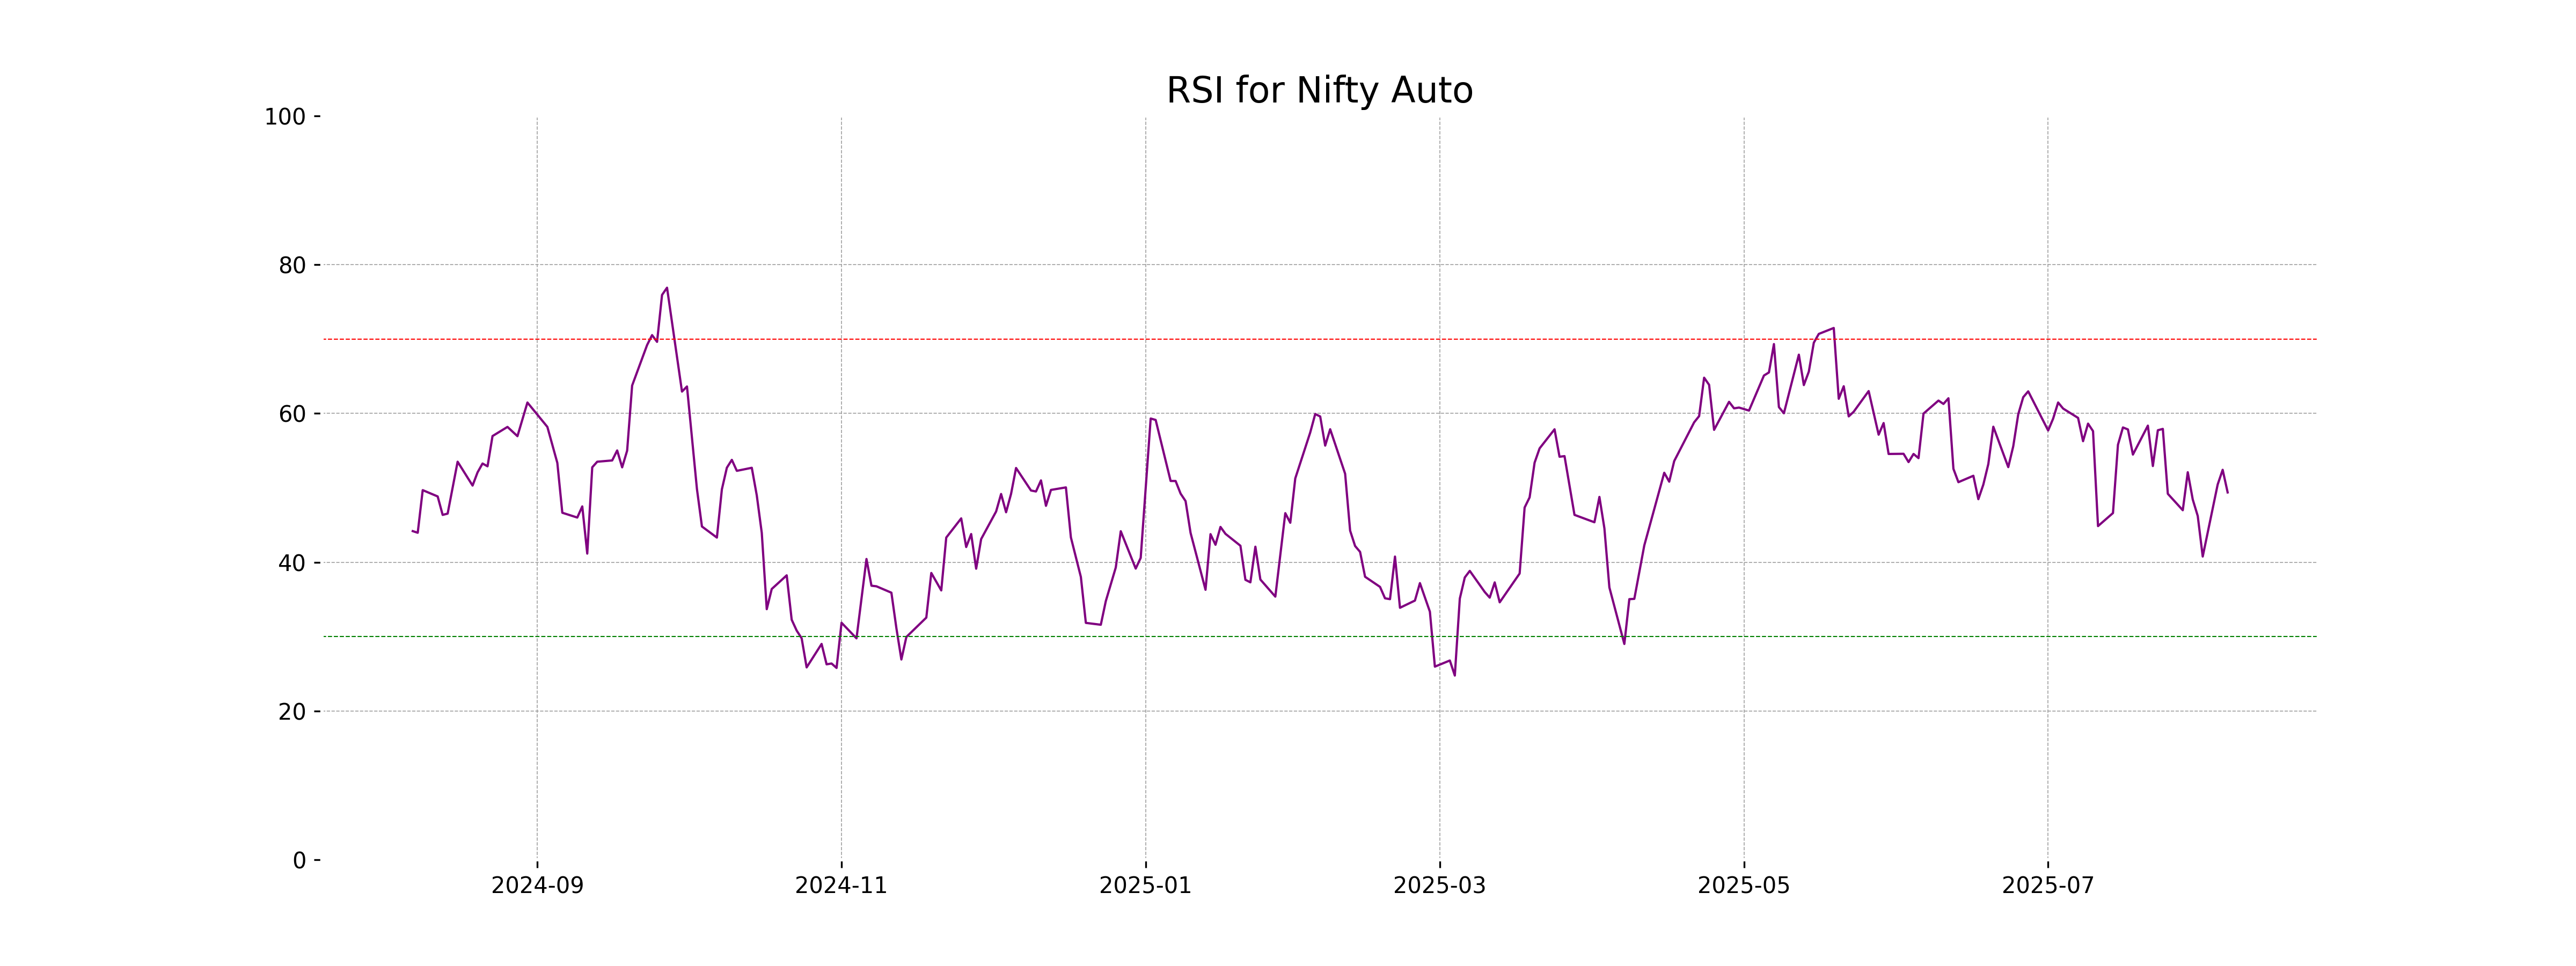
Analysis for Nifty Auto - August 06, 2025
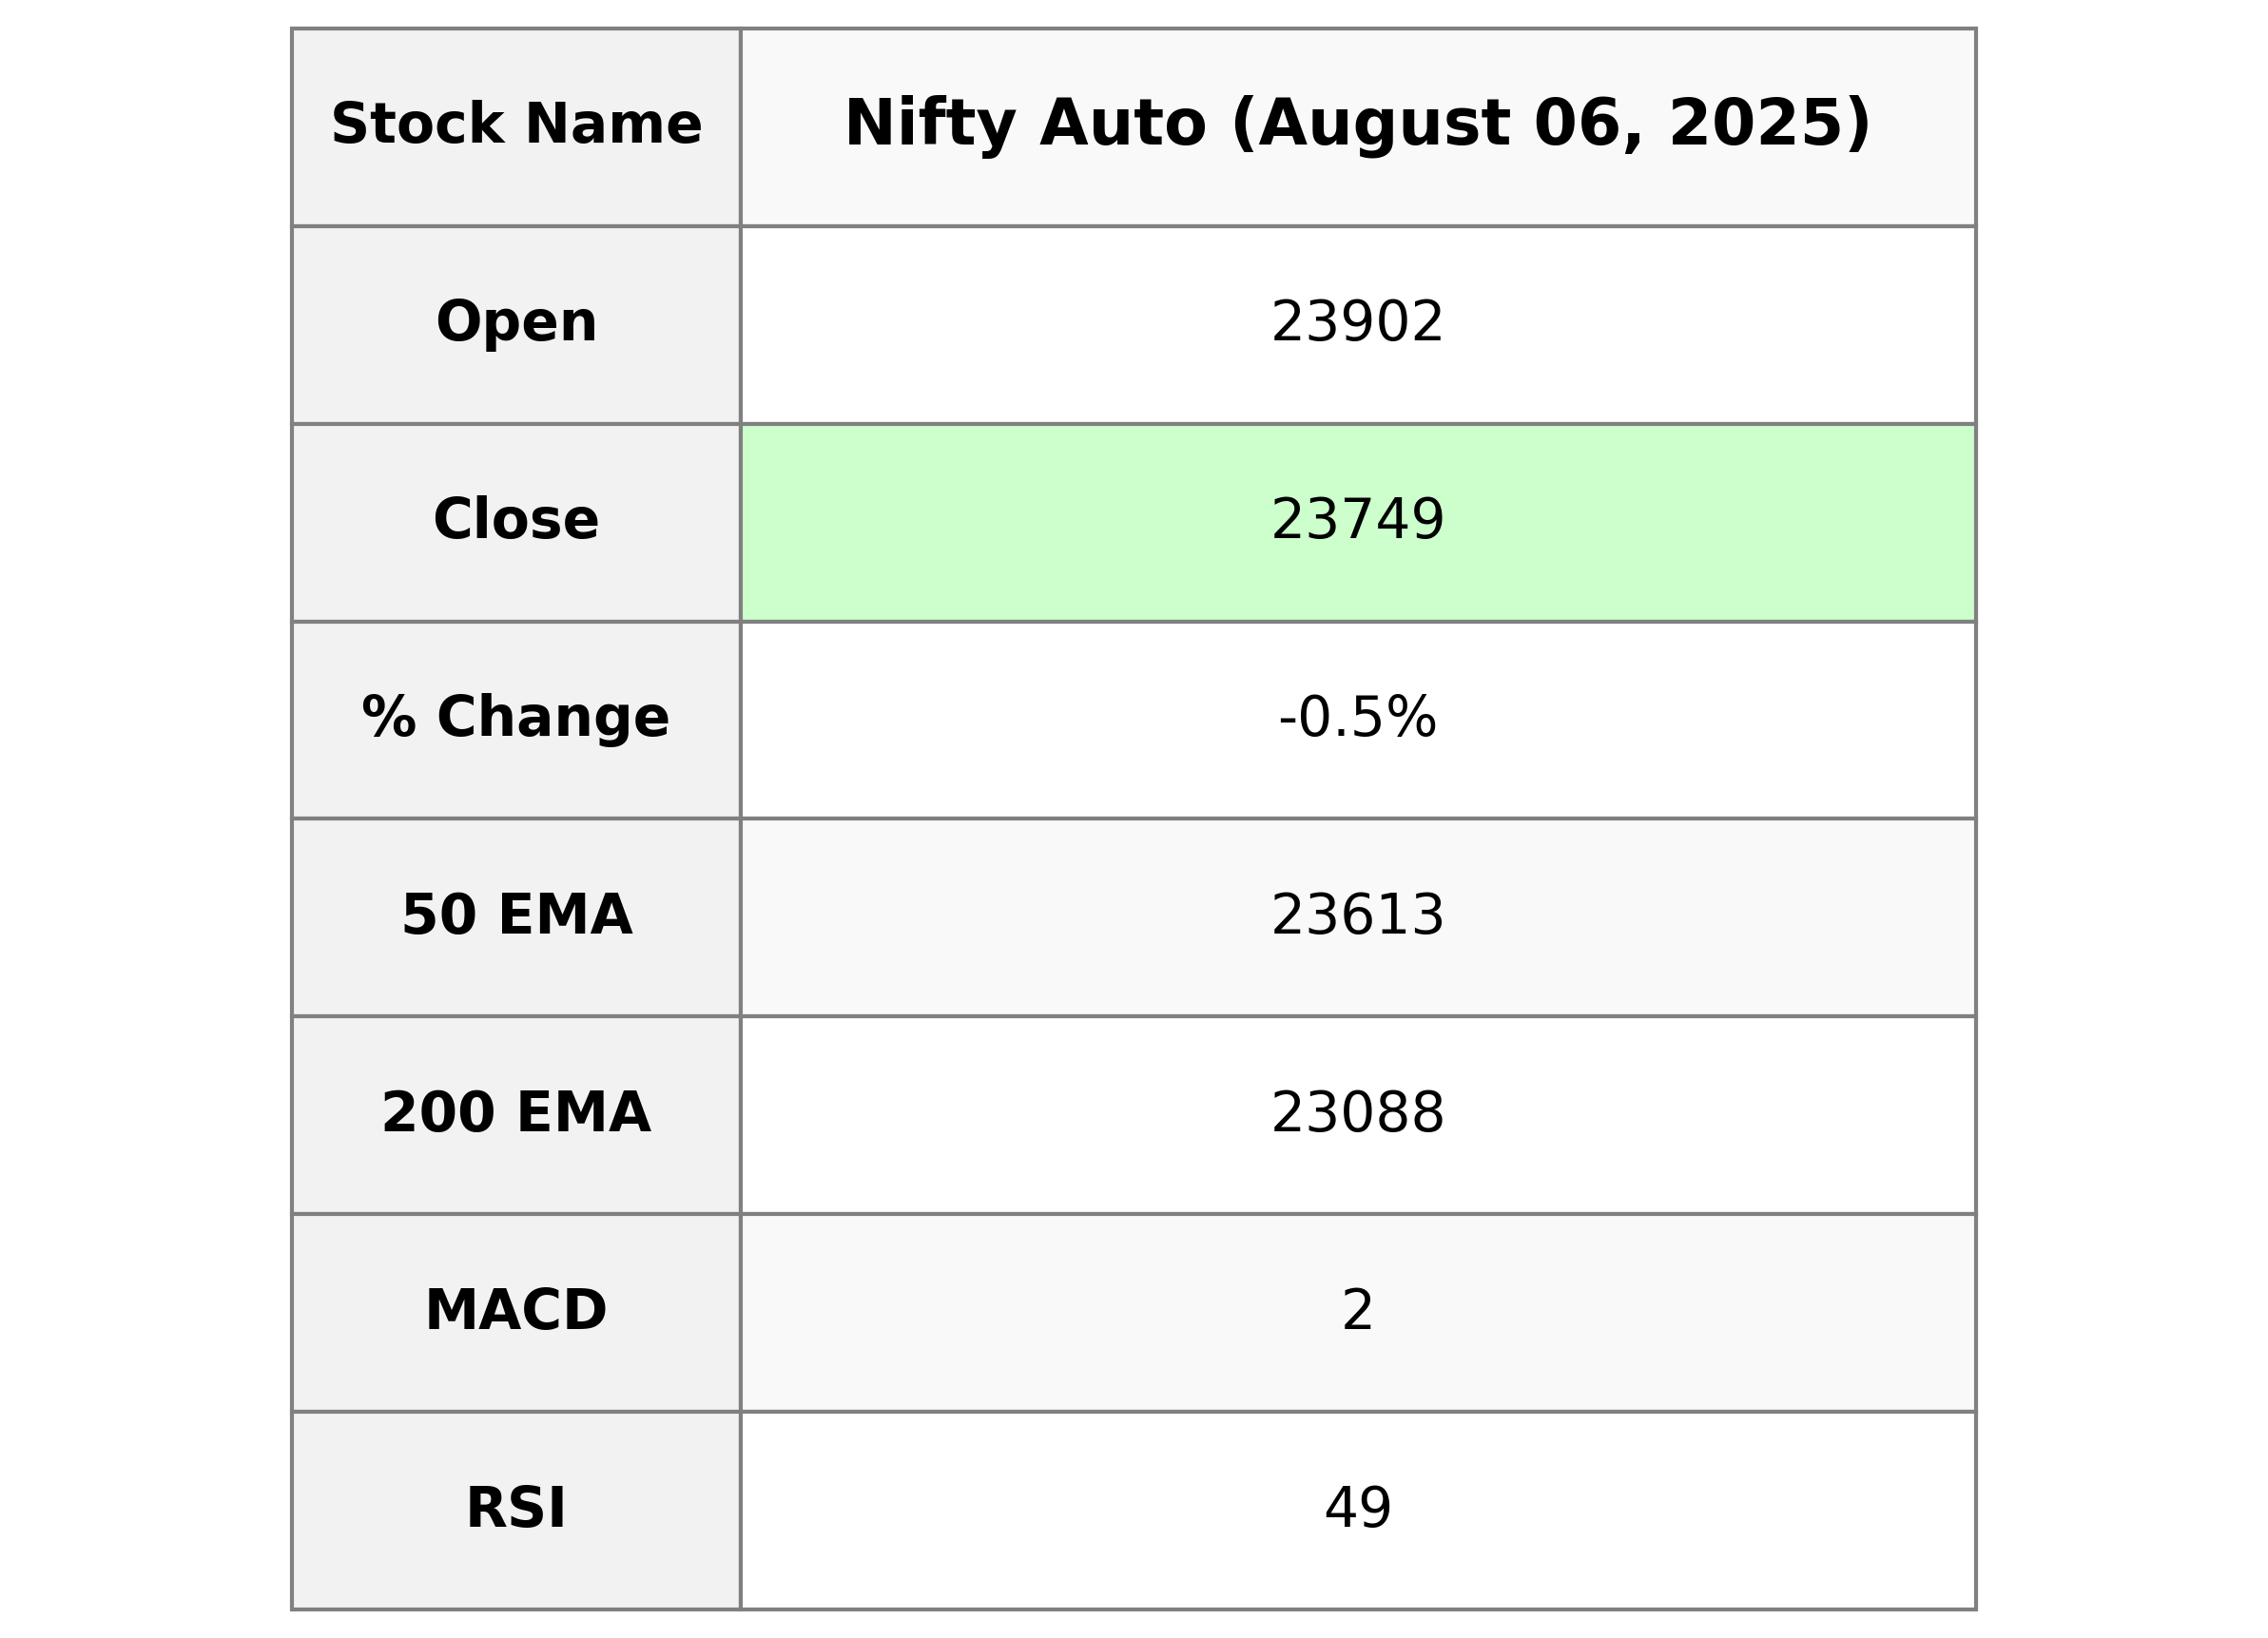
Nifty Auto Performance: Nifty Auto opened at 23,902.40 and closed at 23,748.85, reflecting a decrease of -0.53% with a points change of -127.45. The RSI is at 49.38, indicating a neutral momentum. The index is above its 50-day EMA but below its 10-day and 20-day EMAs, showing a mixed trend outlook.
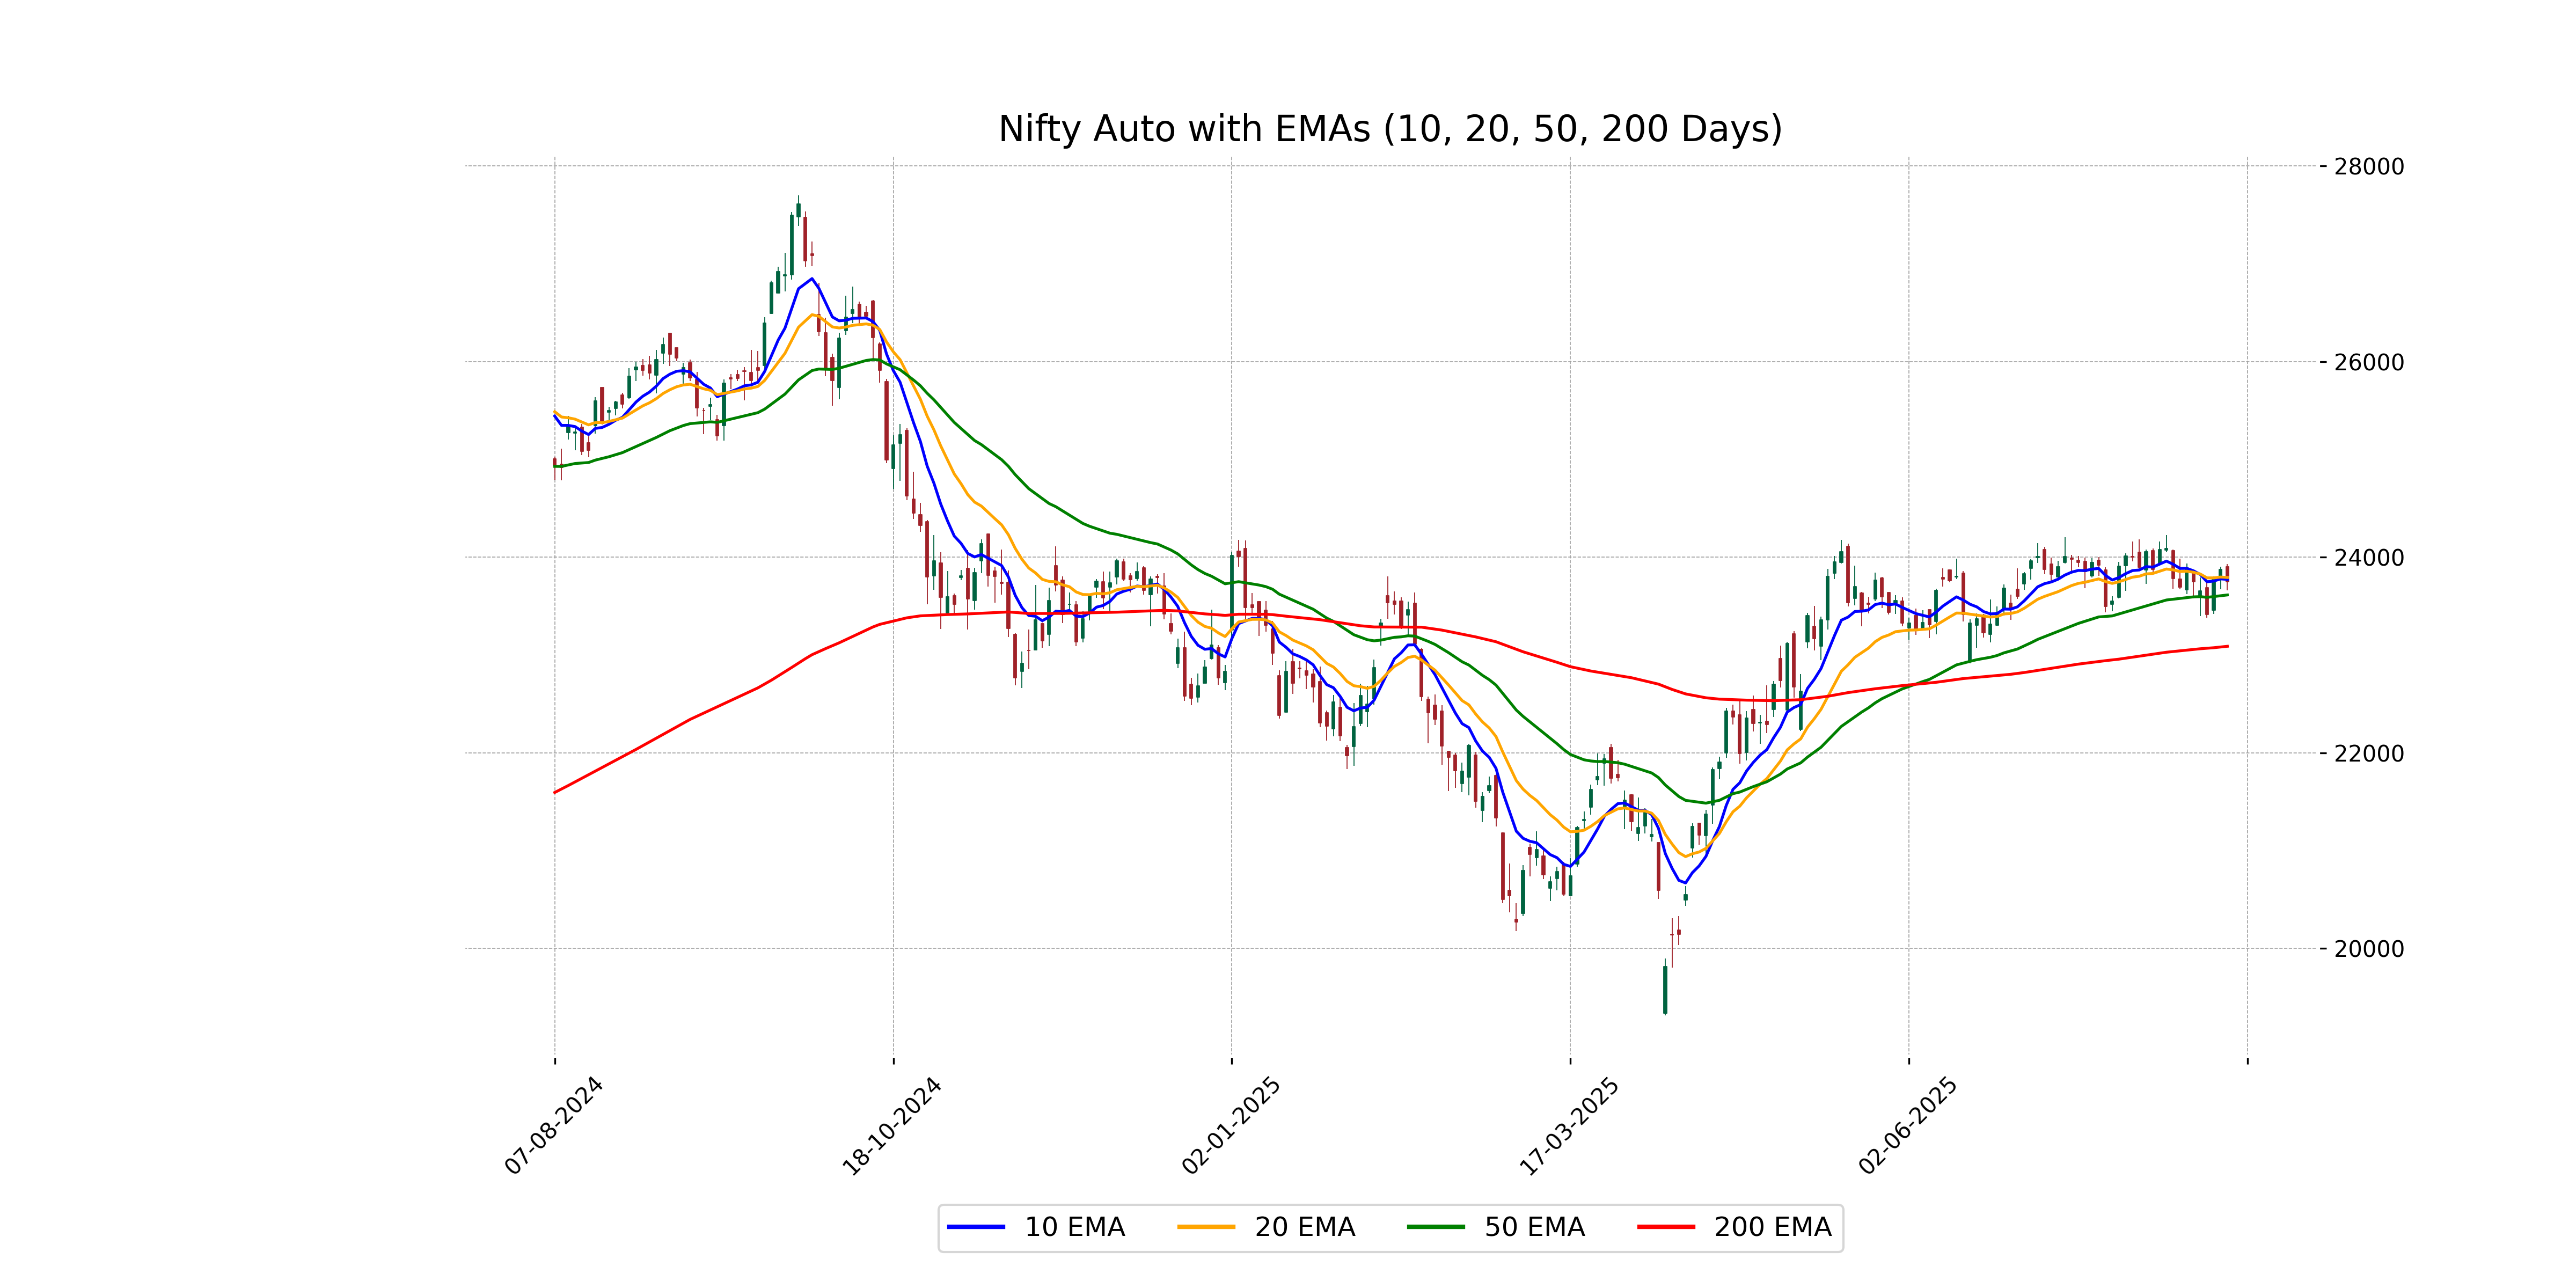
Relationship with Key Moving Averages
The closing price of Nifty Auto is 23748.85, which is above its 50-day EMA of 23612.71, but below both its 10-day EMA of 23771.91 and 20-day EMA of 23791.44. This indicates that while the short-term trend is slightly bearish, the long-term trend remains bullish.
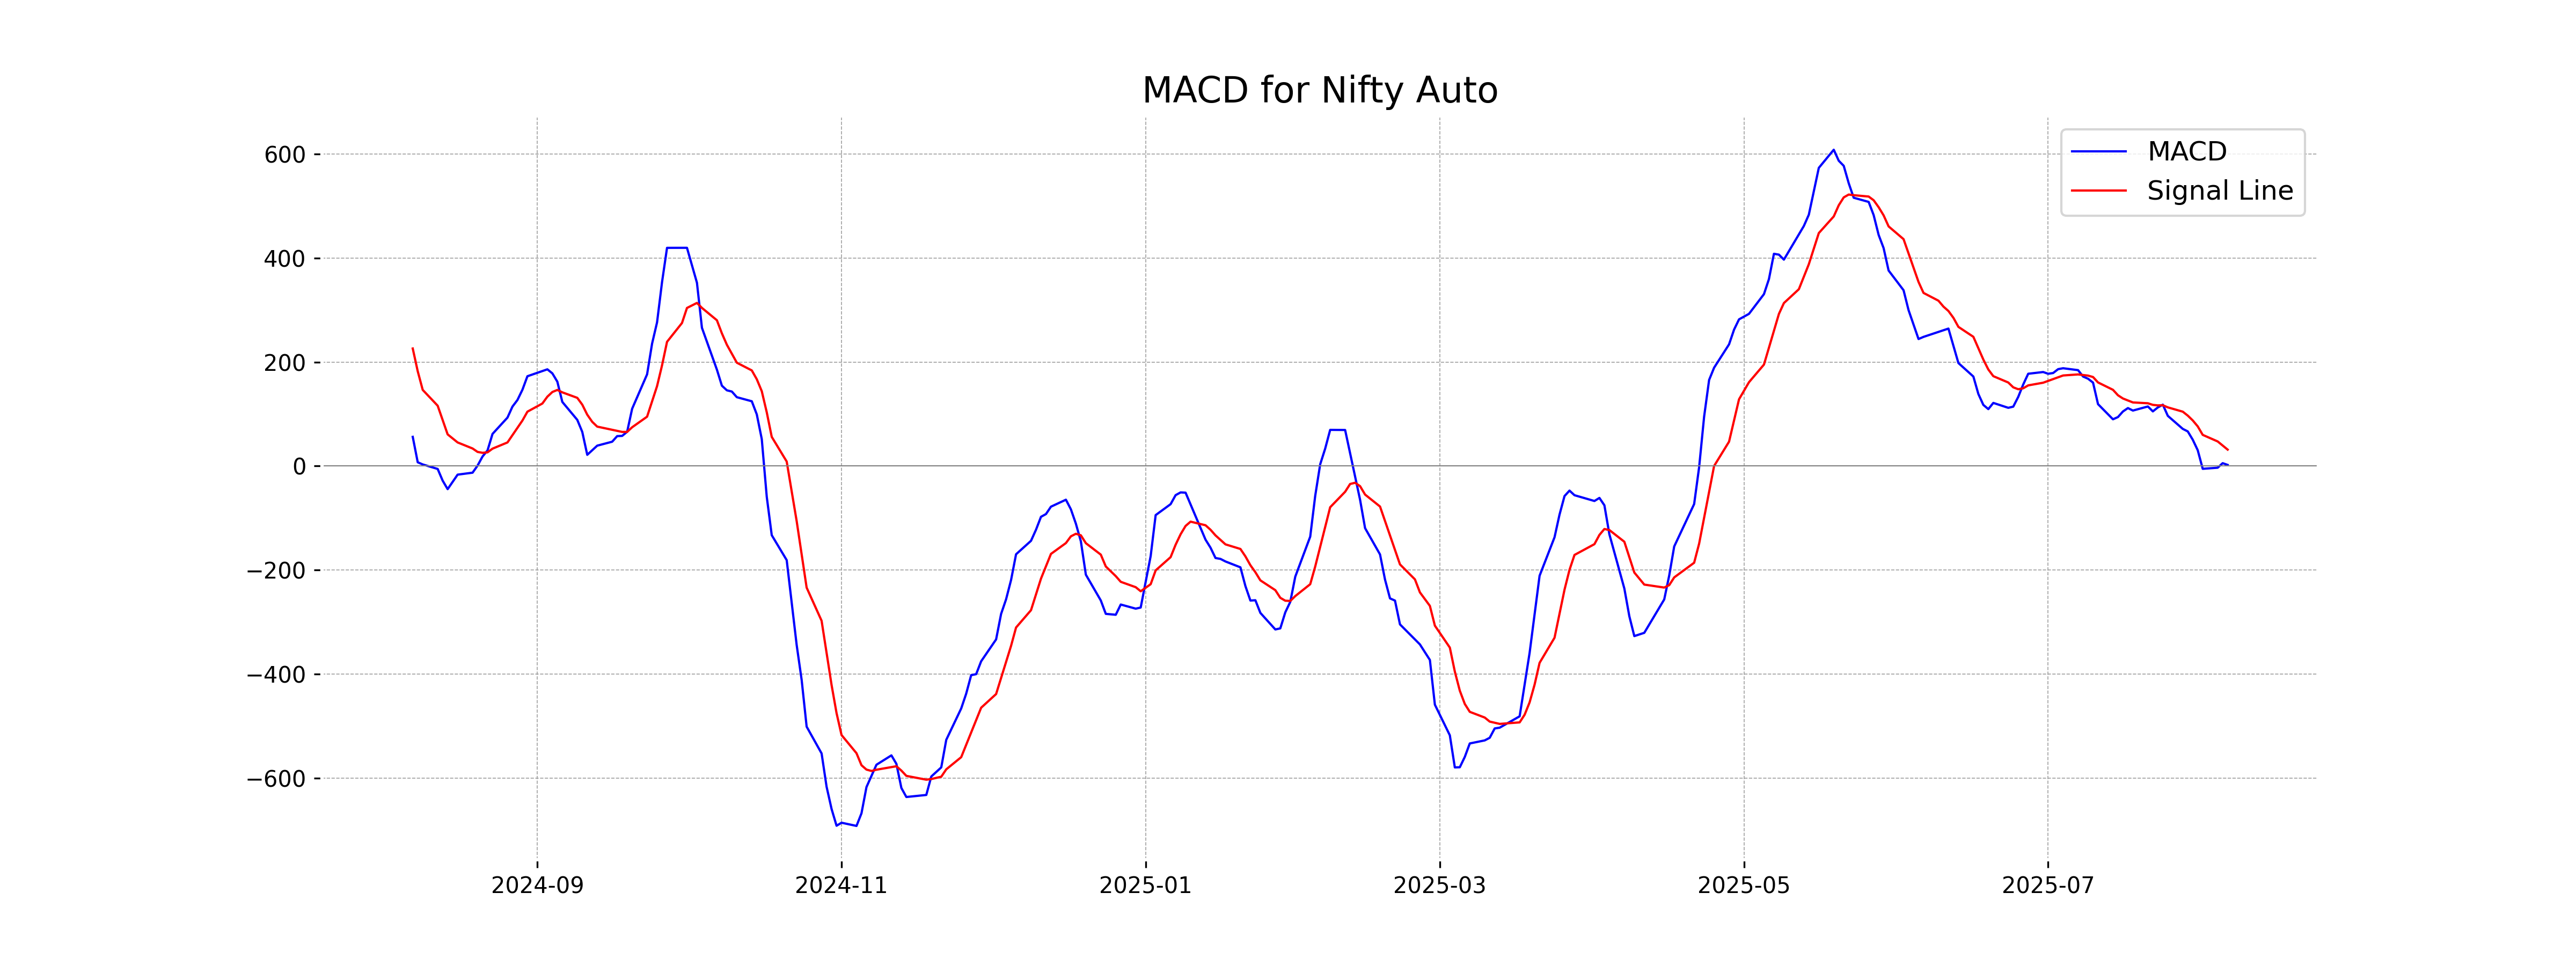
Moving Averages Trend (MACD)
The MACD value for Nifty Auto at 2.25 is below its MACD Signal line at 31.69, indicating a bearish momentum. This suggests that the stock is currently in a downward trend.
RSI Analysis
The RSI value for Nifty Auto is 49.38, which indicates that the stock is neither overbought nor oversold. An RSI near 50 generally suggests a neutral market sentiment and potential consolidation.
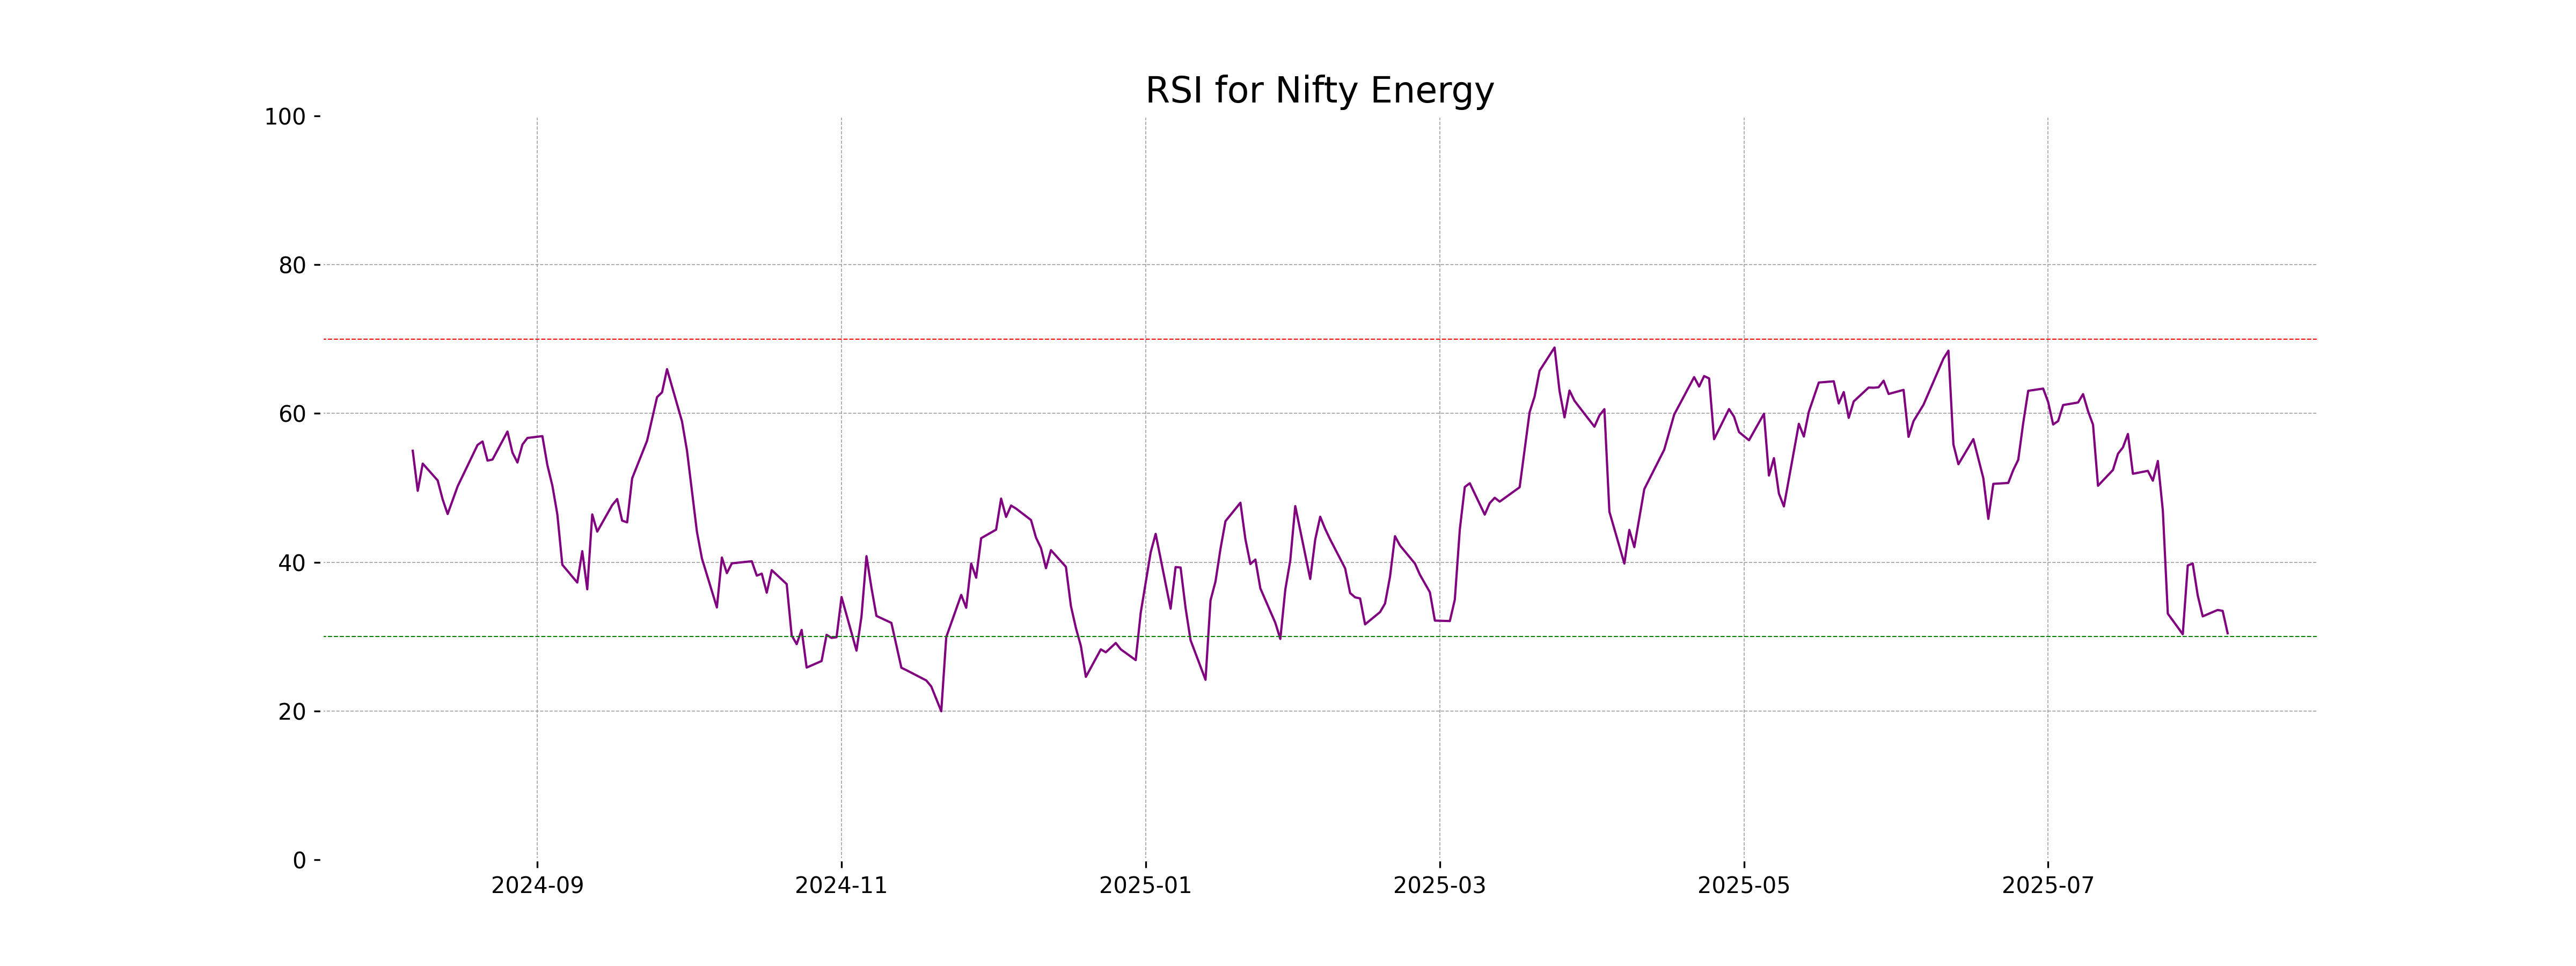
Analysis for Nifty Energy - August 06, 2025
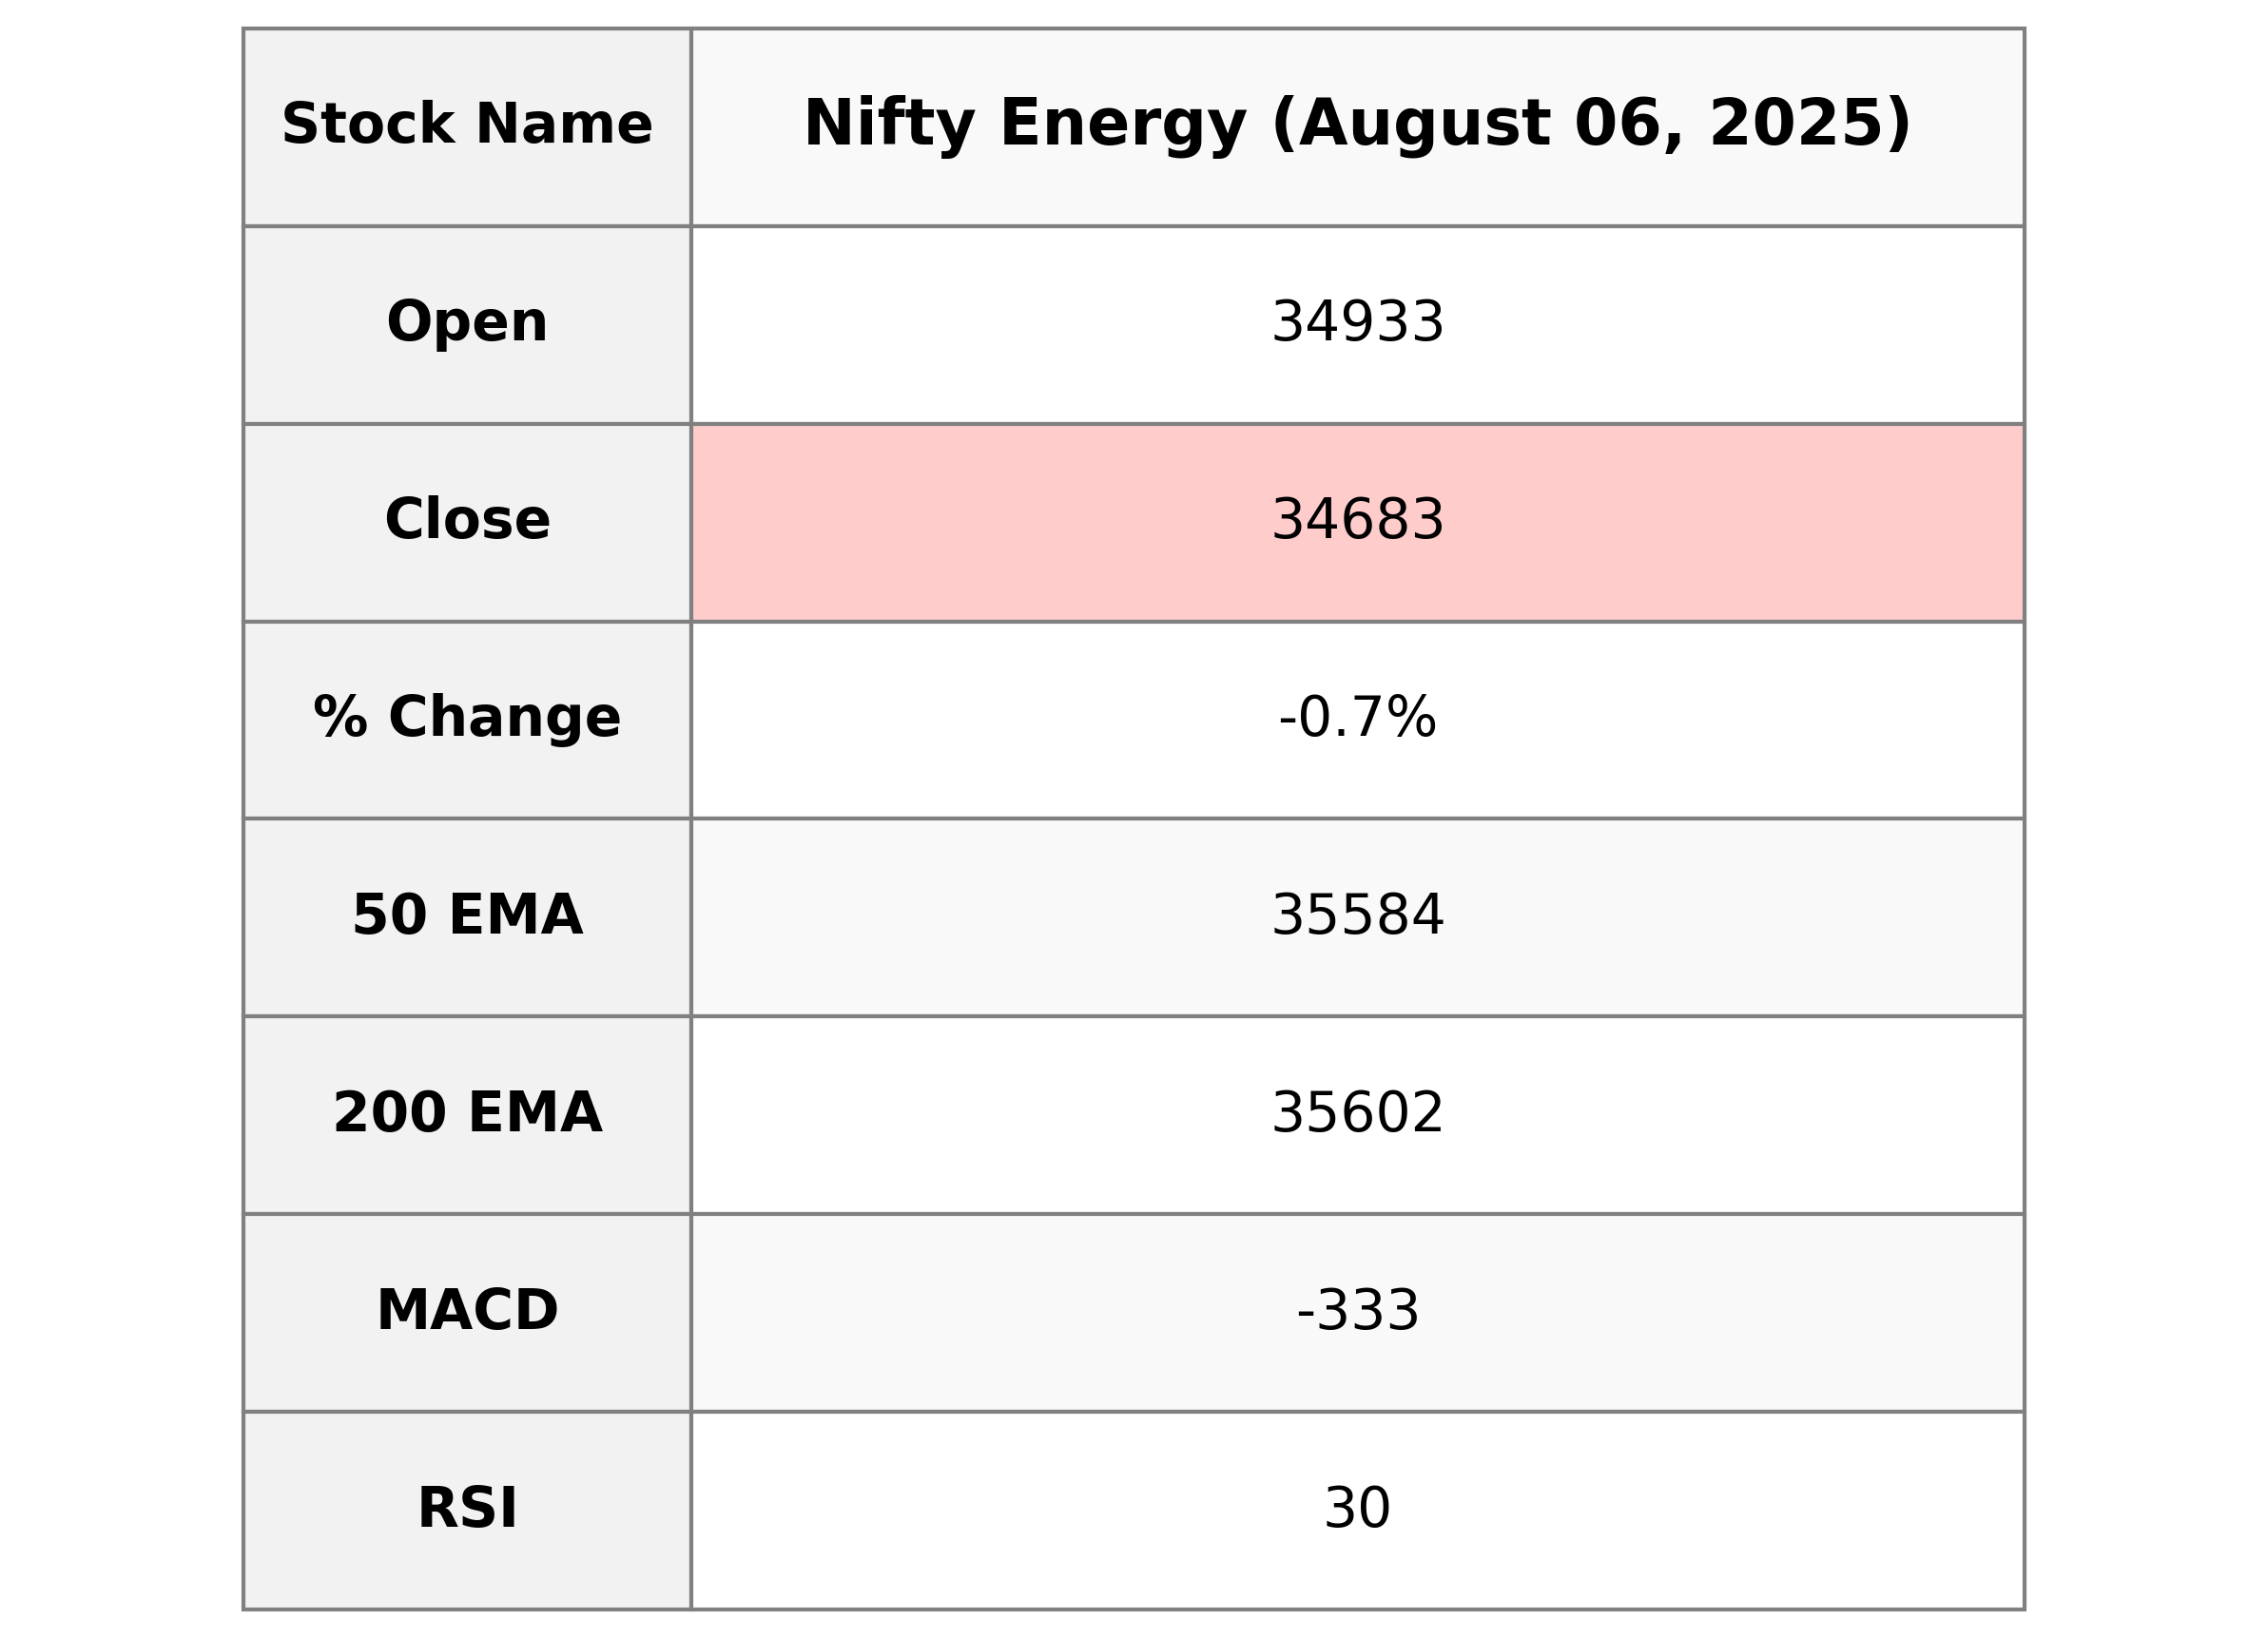
Nifty Energy opened at 34,932.95 and closed at 34,683.35, indicating a negative change of approximately -0.66% with a points change of -231.05. The RSI stands at 30.45, suggesting that the index might be approaching oversold levels. Additionally, the MACD indicates bearish momentum as it is currently below the signal line.
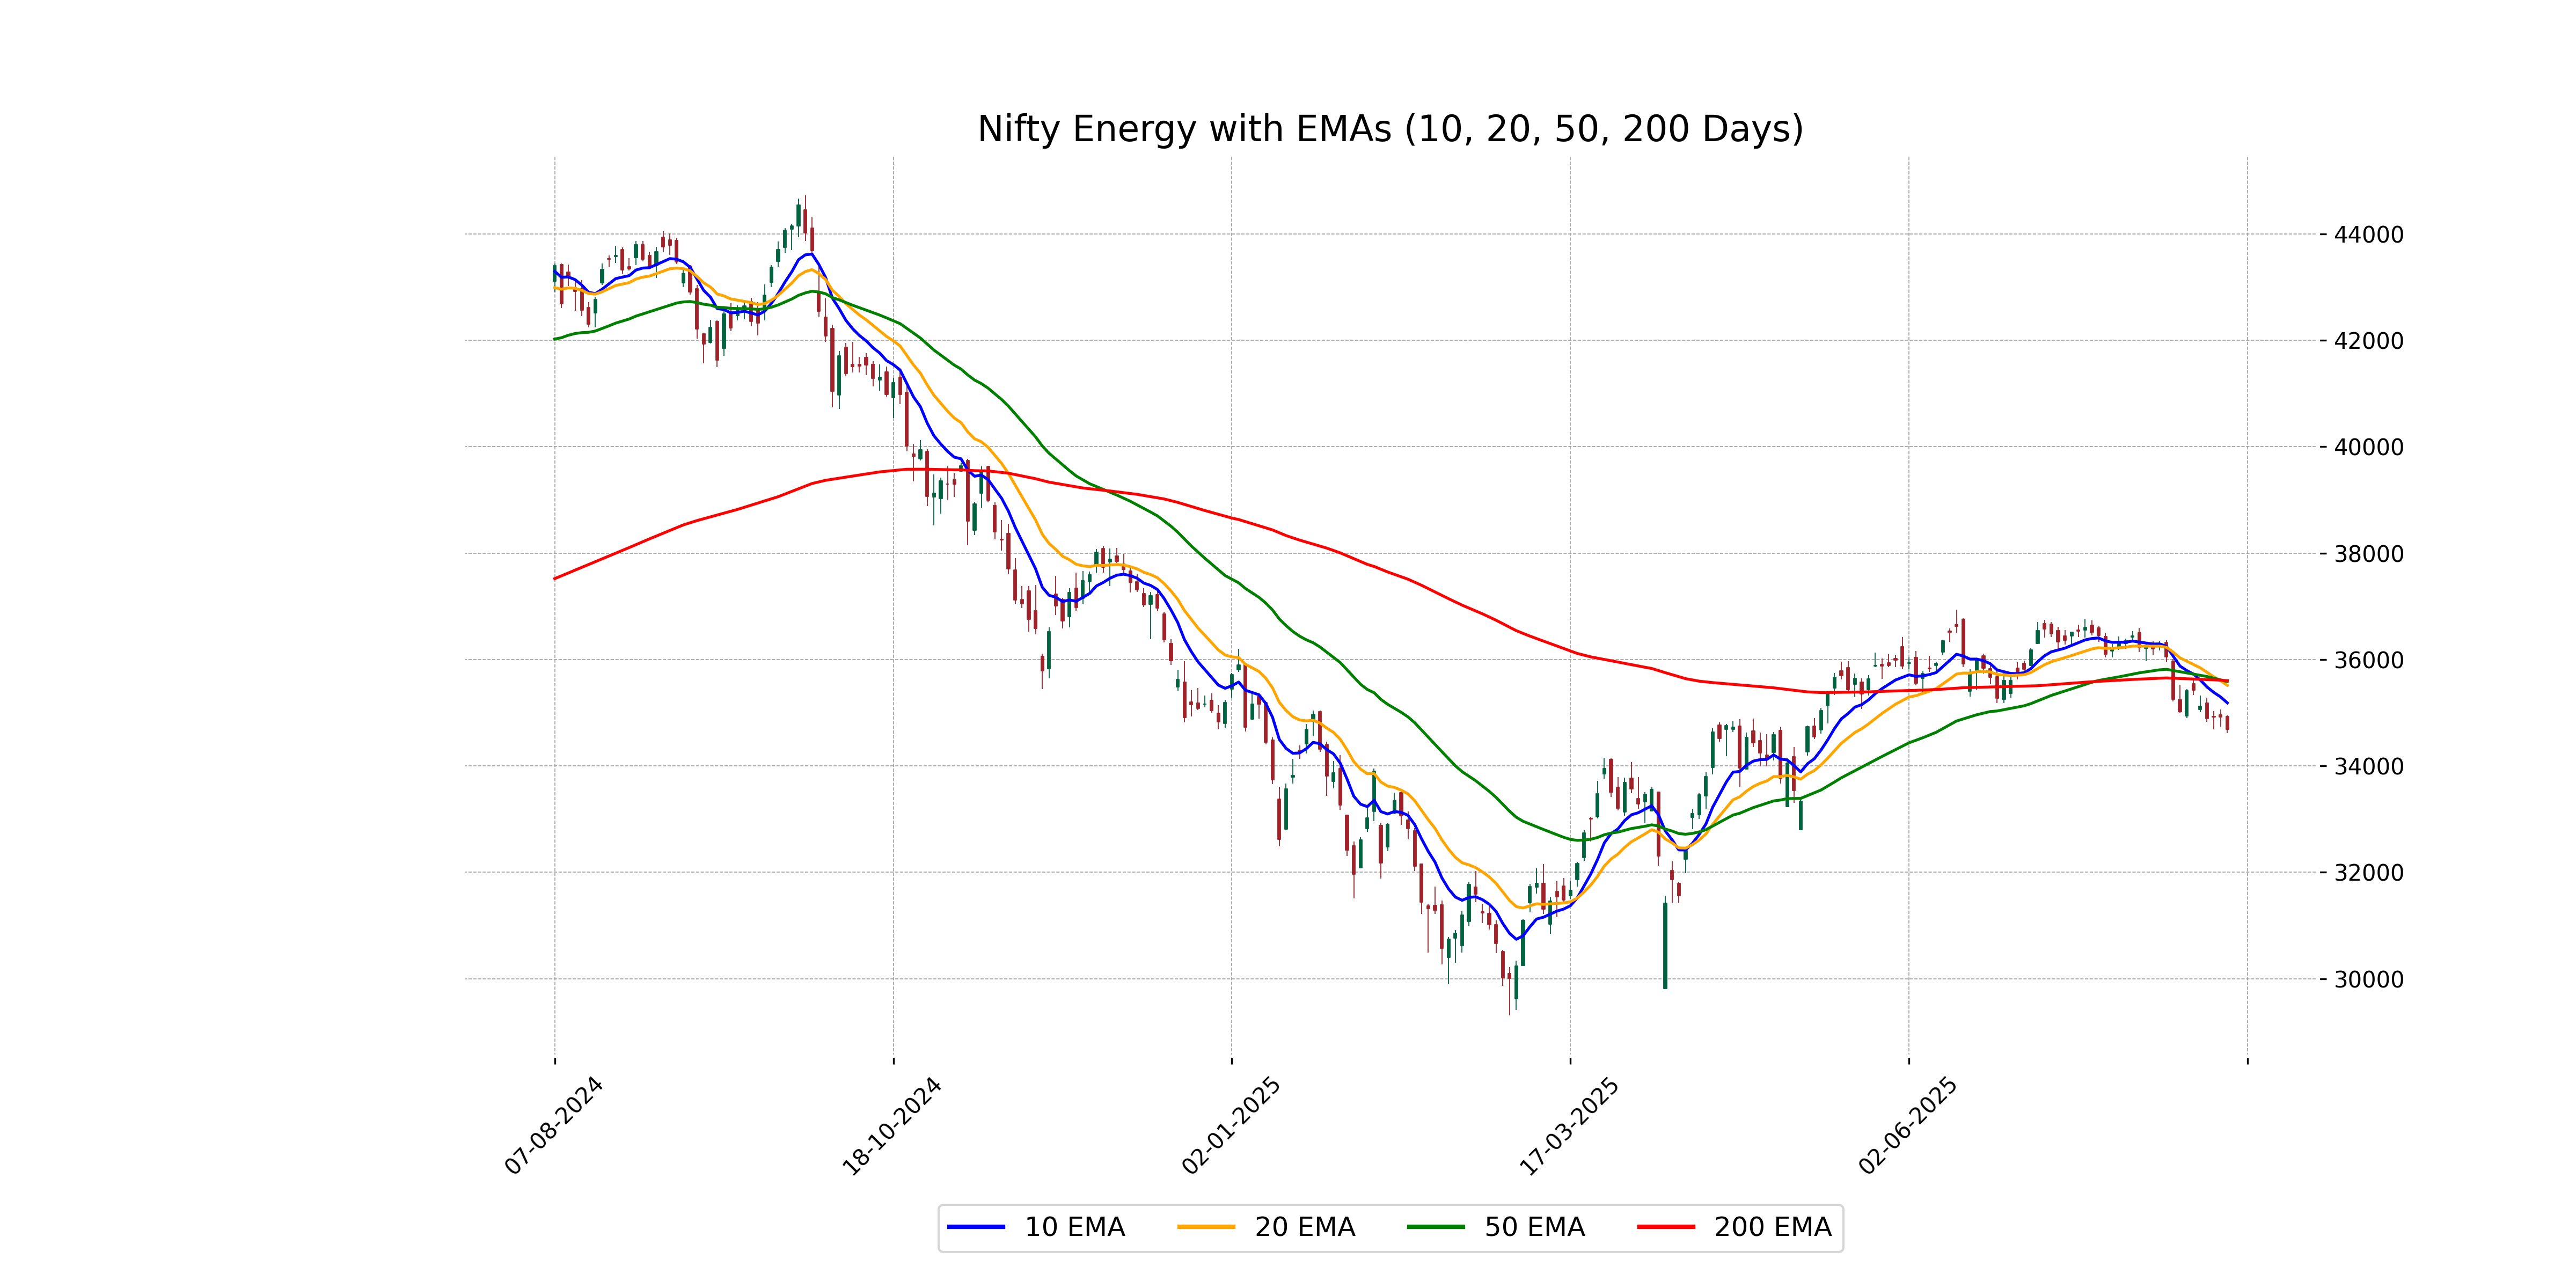
Relationship with Key Moving Averages
The Nifty Energy index closed at 34,683.35, which is below the 10-day EMA of 35,184.54, 20-day EMA of 35,513.53, 50-day EMA of 35,584.18, and 200-day EMA of 35,601.95. This suggests a bearish trend as the current price is below all key moving averages.
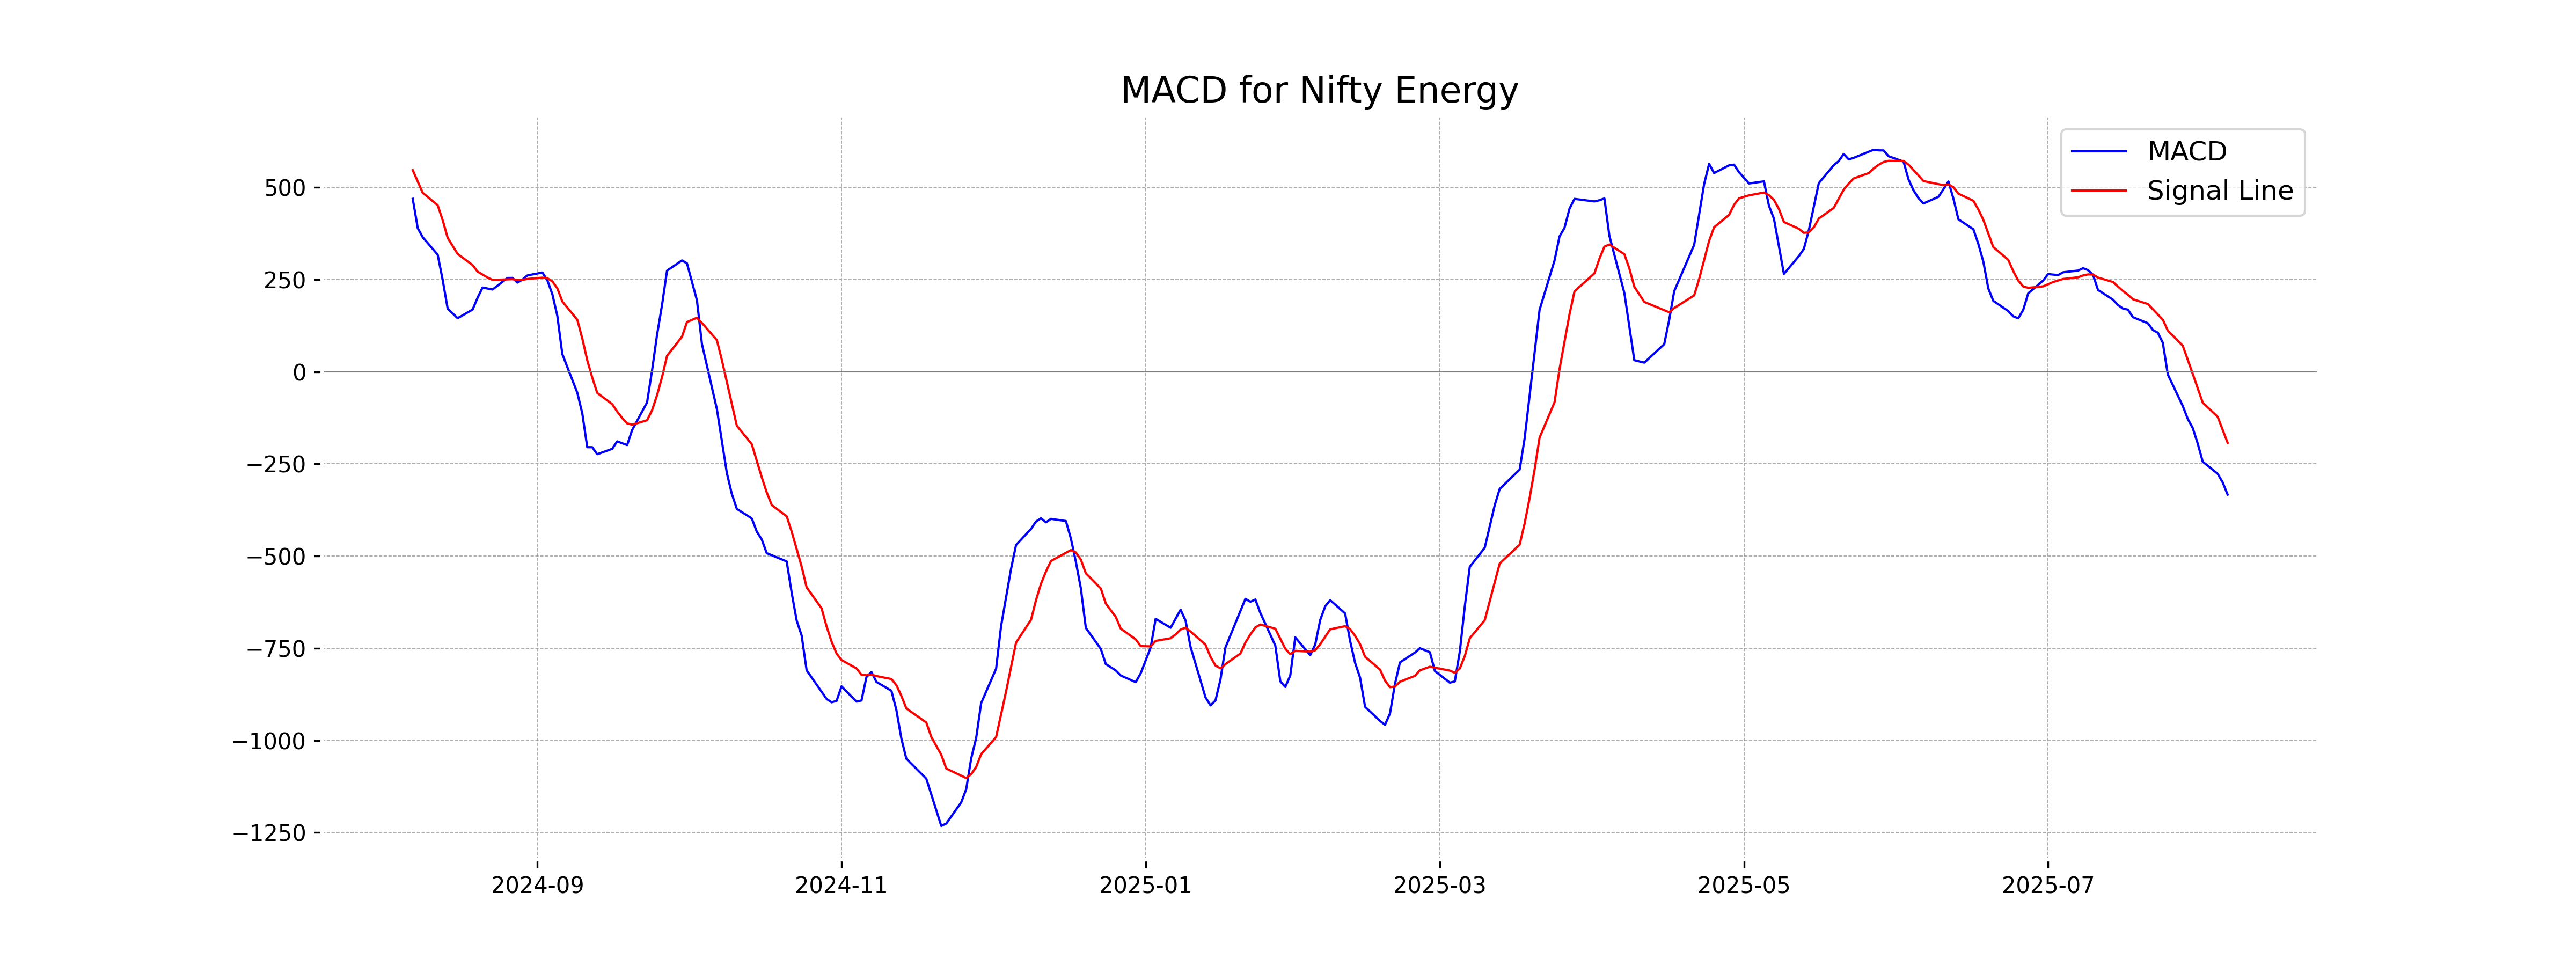
Moving Averages Trend (MACD)
MACD Analysis for Nifty Energy: The MACD value of -333.32 indicates a bearish momentum, as it is significantly below the signal line at -192.95. With the MACD being negative and lower than the signal line, it suggests a strong downward trend in the Nifty Energy index.
RSI Analysis
The RSI for Nifty Energy stands at 30.45, indicating that the index is approaching the oversold territory. This suggests potential buying interest might emerge if the RSI continues to drop further below 30, although caution is advised due to prevailing market conditions.
Analysis for Nifty FMCG - August 06, 2025

The Nifty FMCG index opened at 55,728.55 and closed at 55,230.80, experiencing a decline of approximately 0.90%, which translated to a points change of -502.90. The closing value was below important moving averages like the 50-day EMA at 55,499.67 and the 200-day EMA at 55,889.84, indicating potential bearish sentiment. The Relative Strength Index (RSI) was at 46.28, suggesting a neutral to slightly weak momentum.
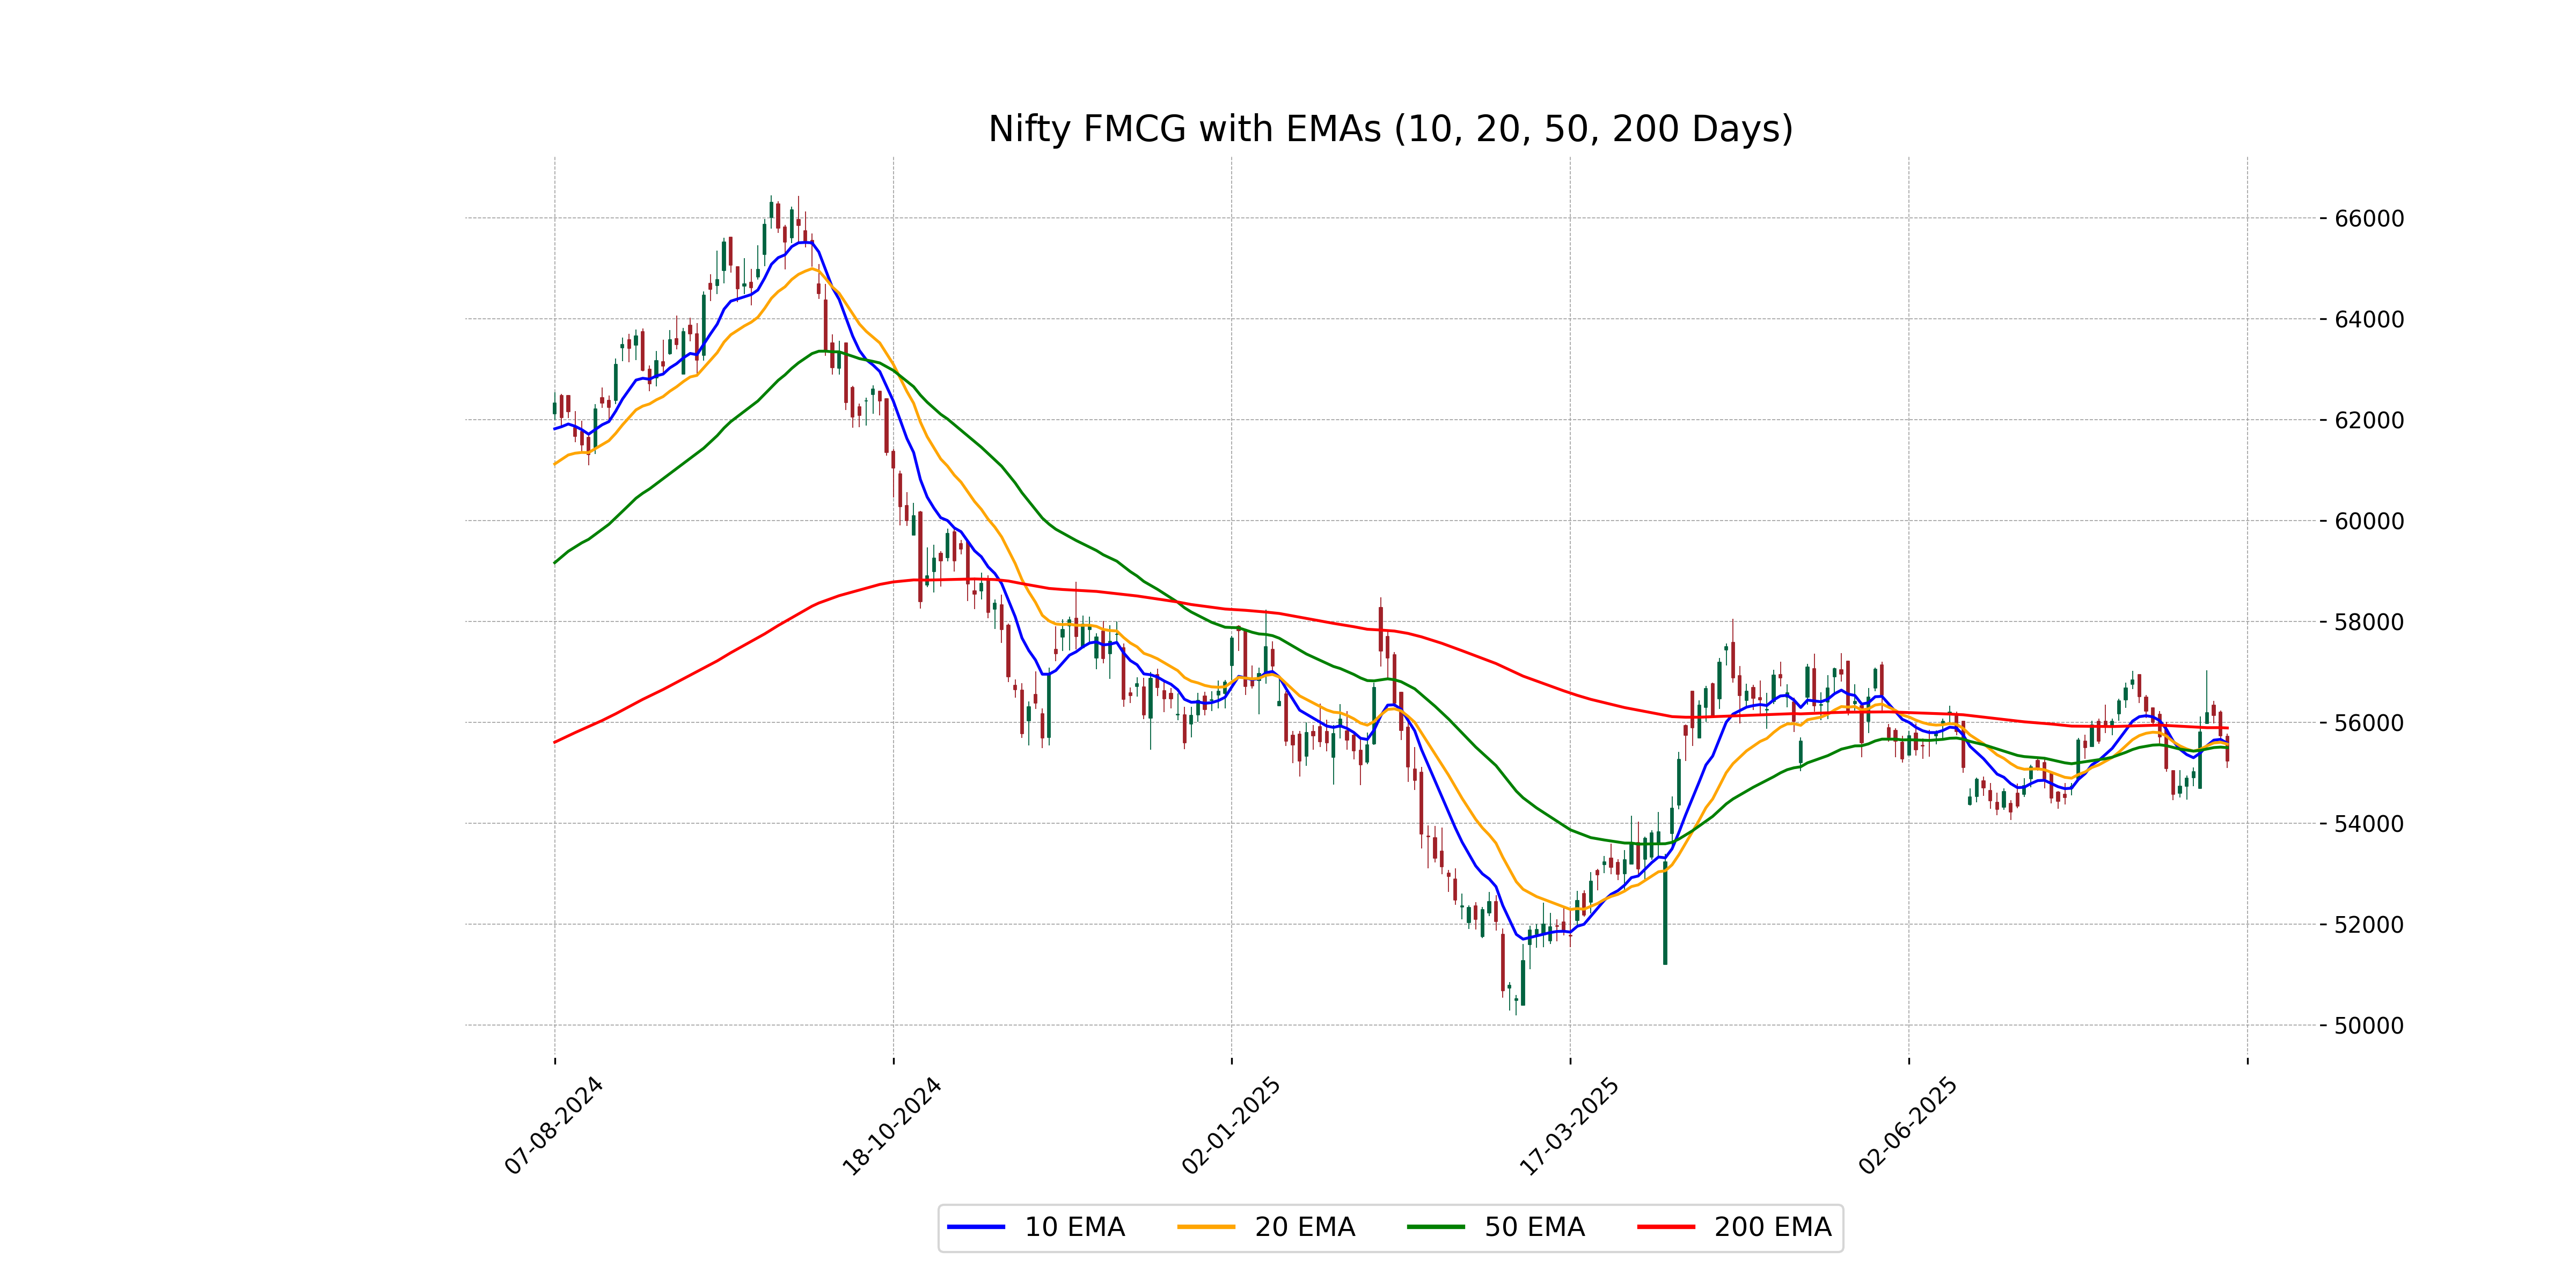
Relationship with Key Moving Averages
The closing price of Nifty FMCG at 55230.80 is currently below its 50-day EMA of 55499.67, 10-day EMA of 55585.36, and 20-day EMA of 55571.27, indicating a bearish trend. Additionally, the 200-day EMA at 55889.84 is also above the current closing price, reinforcing the downward movement relative to key moving averages.
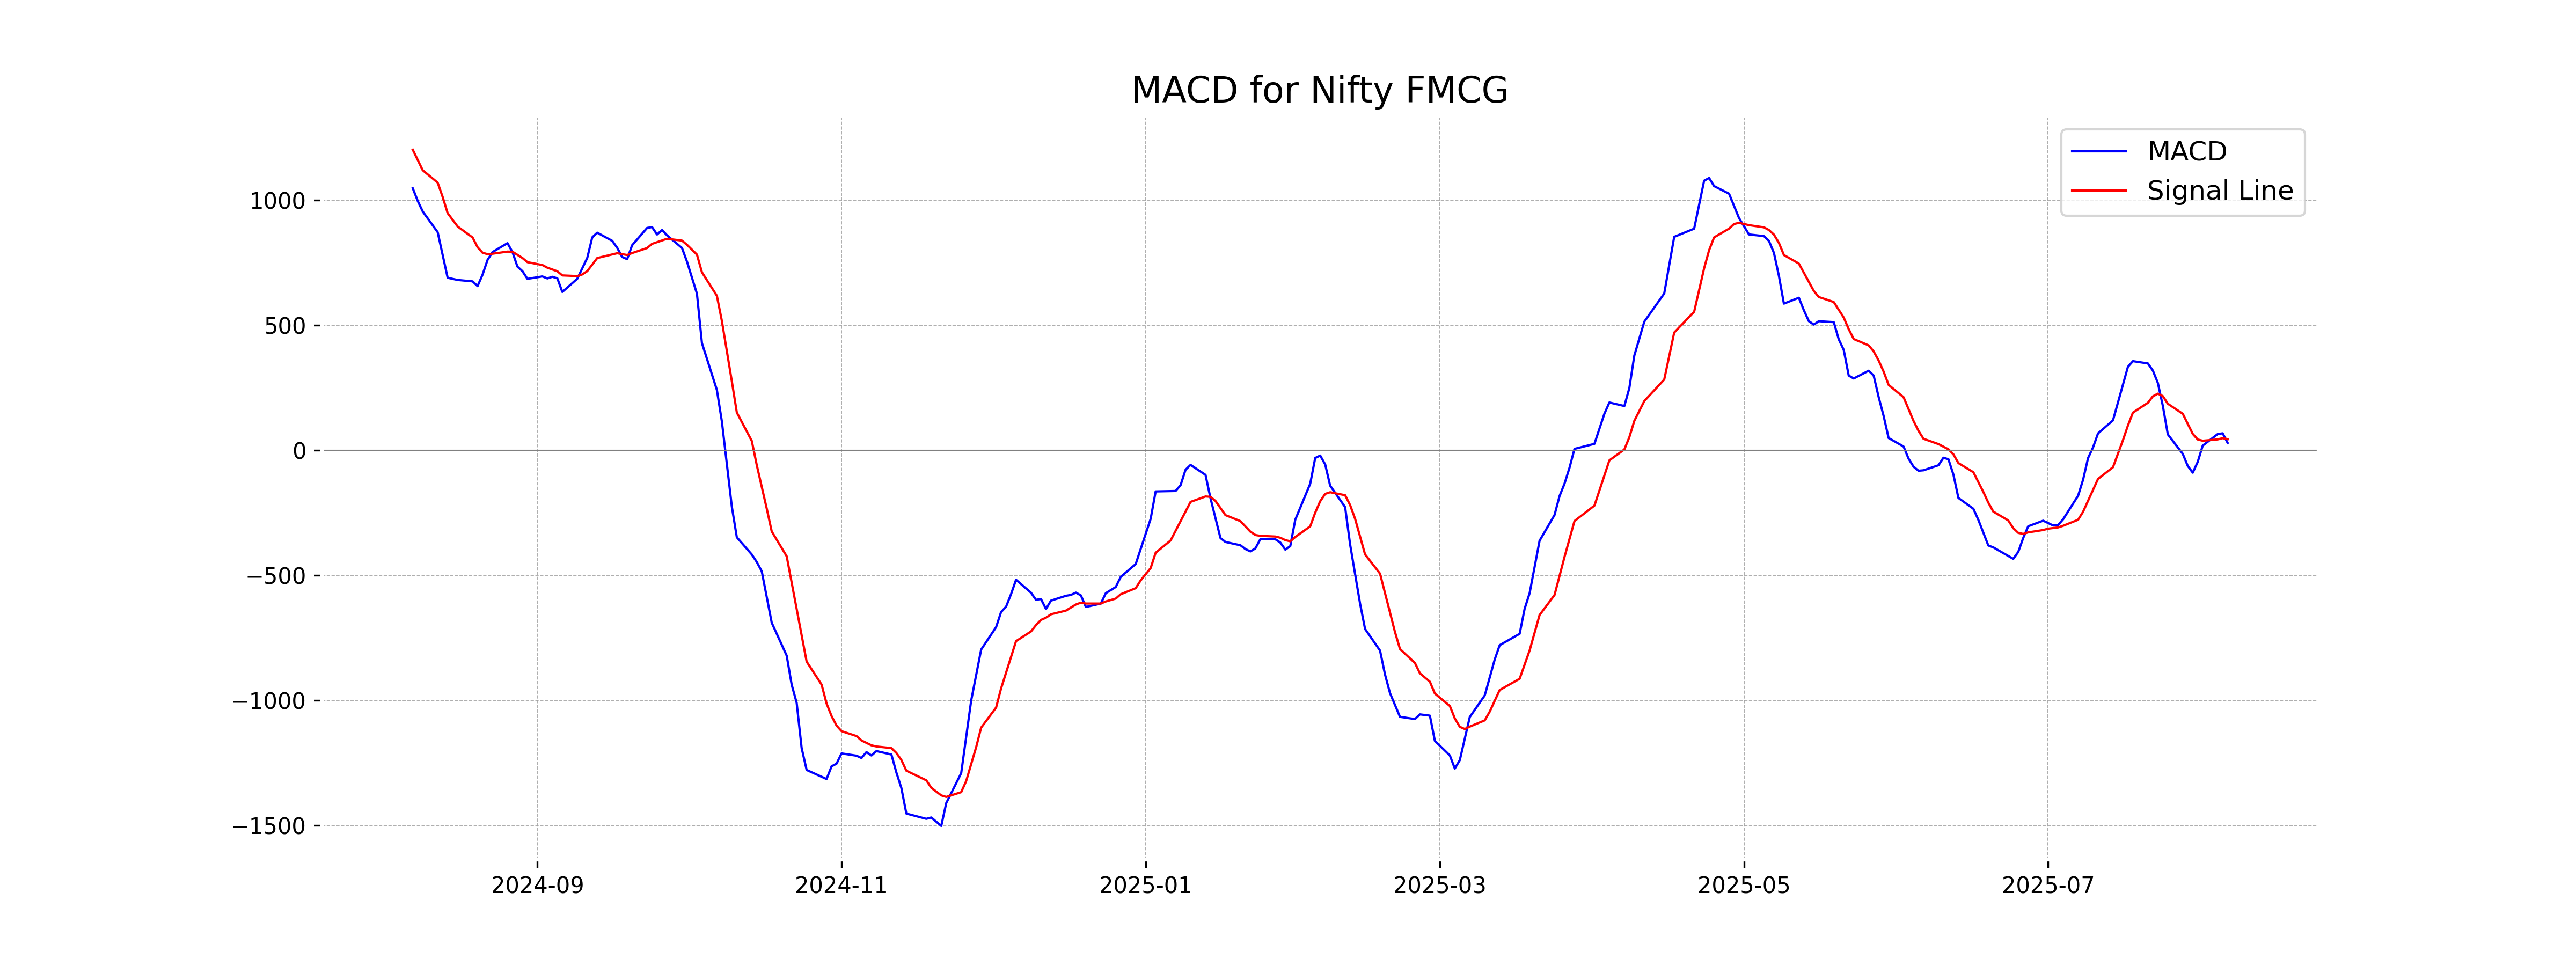
Moving Averages Trend (MACD)
The MACD for Nifty FMCG is 30.01, which is below the MACD Signal at 45.28, indicating a bearish momentum in the stock. The negative divergence suggests potential selling pressure and possibly a continued downward trend in the near term.
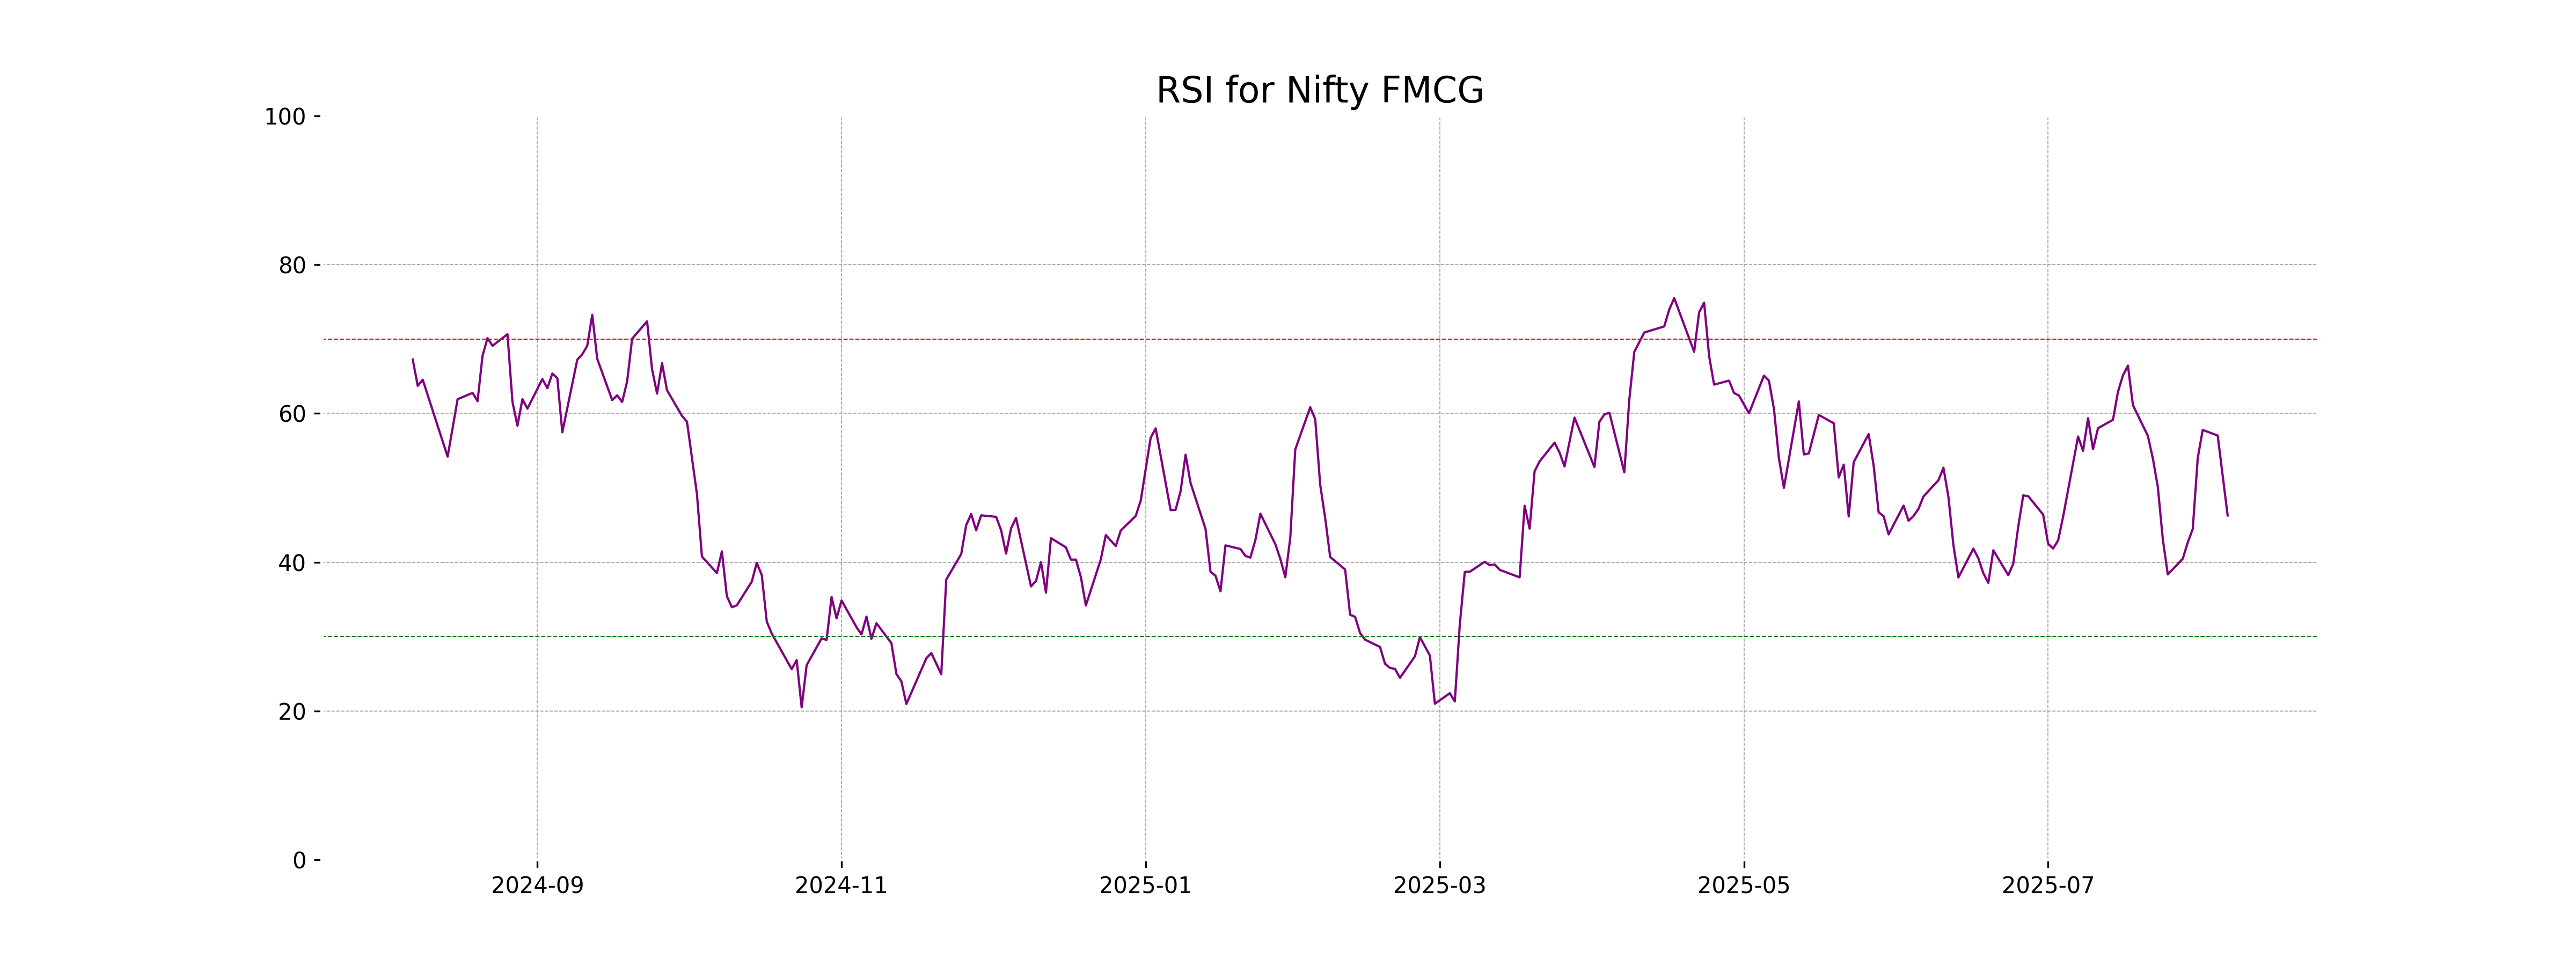
RSI Analysis
Based on the provided data, Nifty FMCG has an RSI of 46.28. An RSI below 50 typically indicates weakening momentum, suggesting that the index might be exhibiting bearish tendencies or is currently underperforming. However, it is not yet in the oversold territory, which is generally below 30.
Analysis for Nifty Infra - August 06, 2025
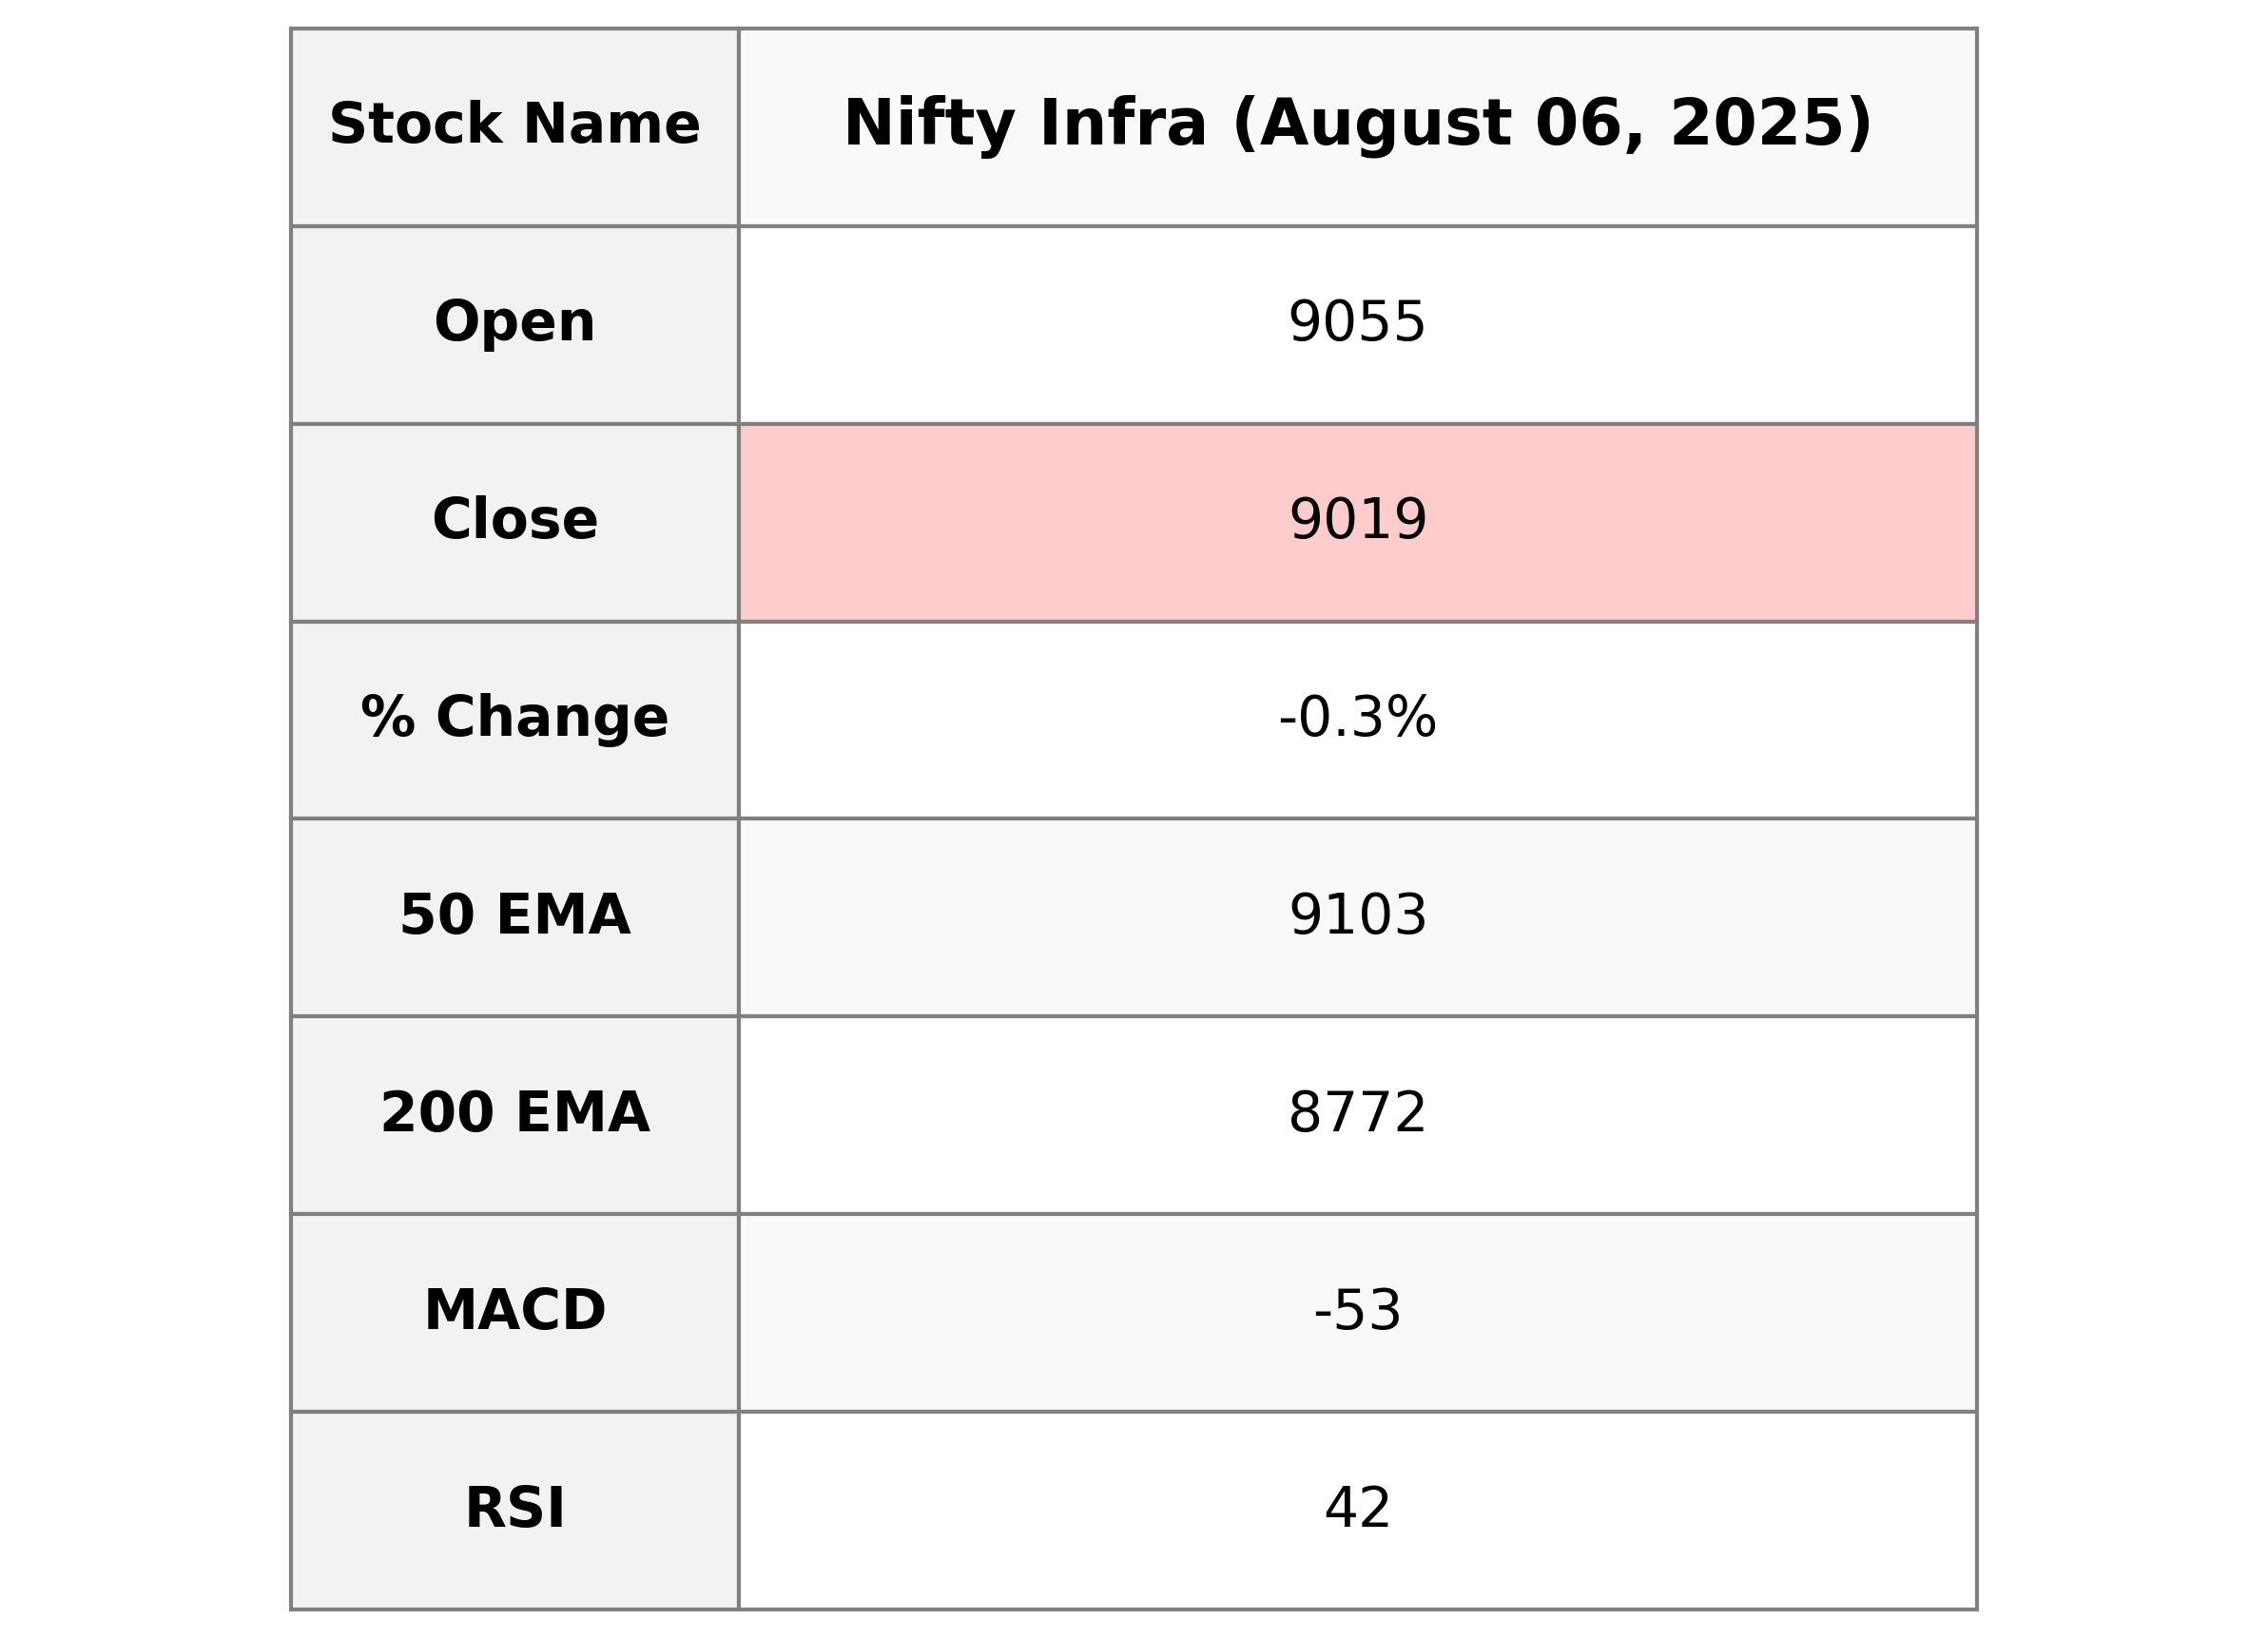
Nifty Infra opened at 9055.45, with a high of 9084.80 and a low of 9003.70, closing at 9018.80, which is a decrease of 0.27% or 24.10 points from the previous close of 9042.90. The RSI stands at 41.70, suggesting weaker momentum, and the MACD indicates a bearish trend. The stock is below its 10, 20, and 50-day EMAs, indicating short-term bearishness.
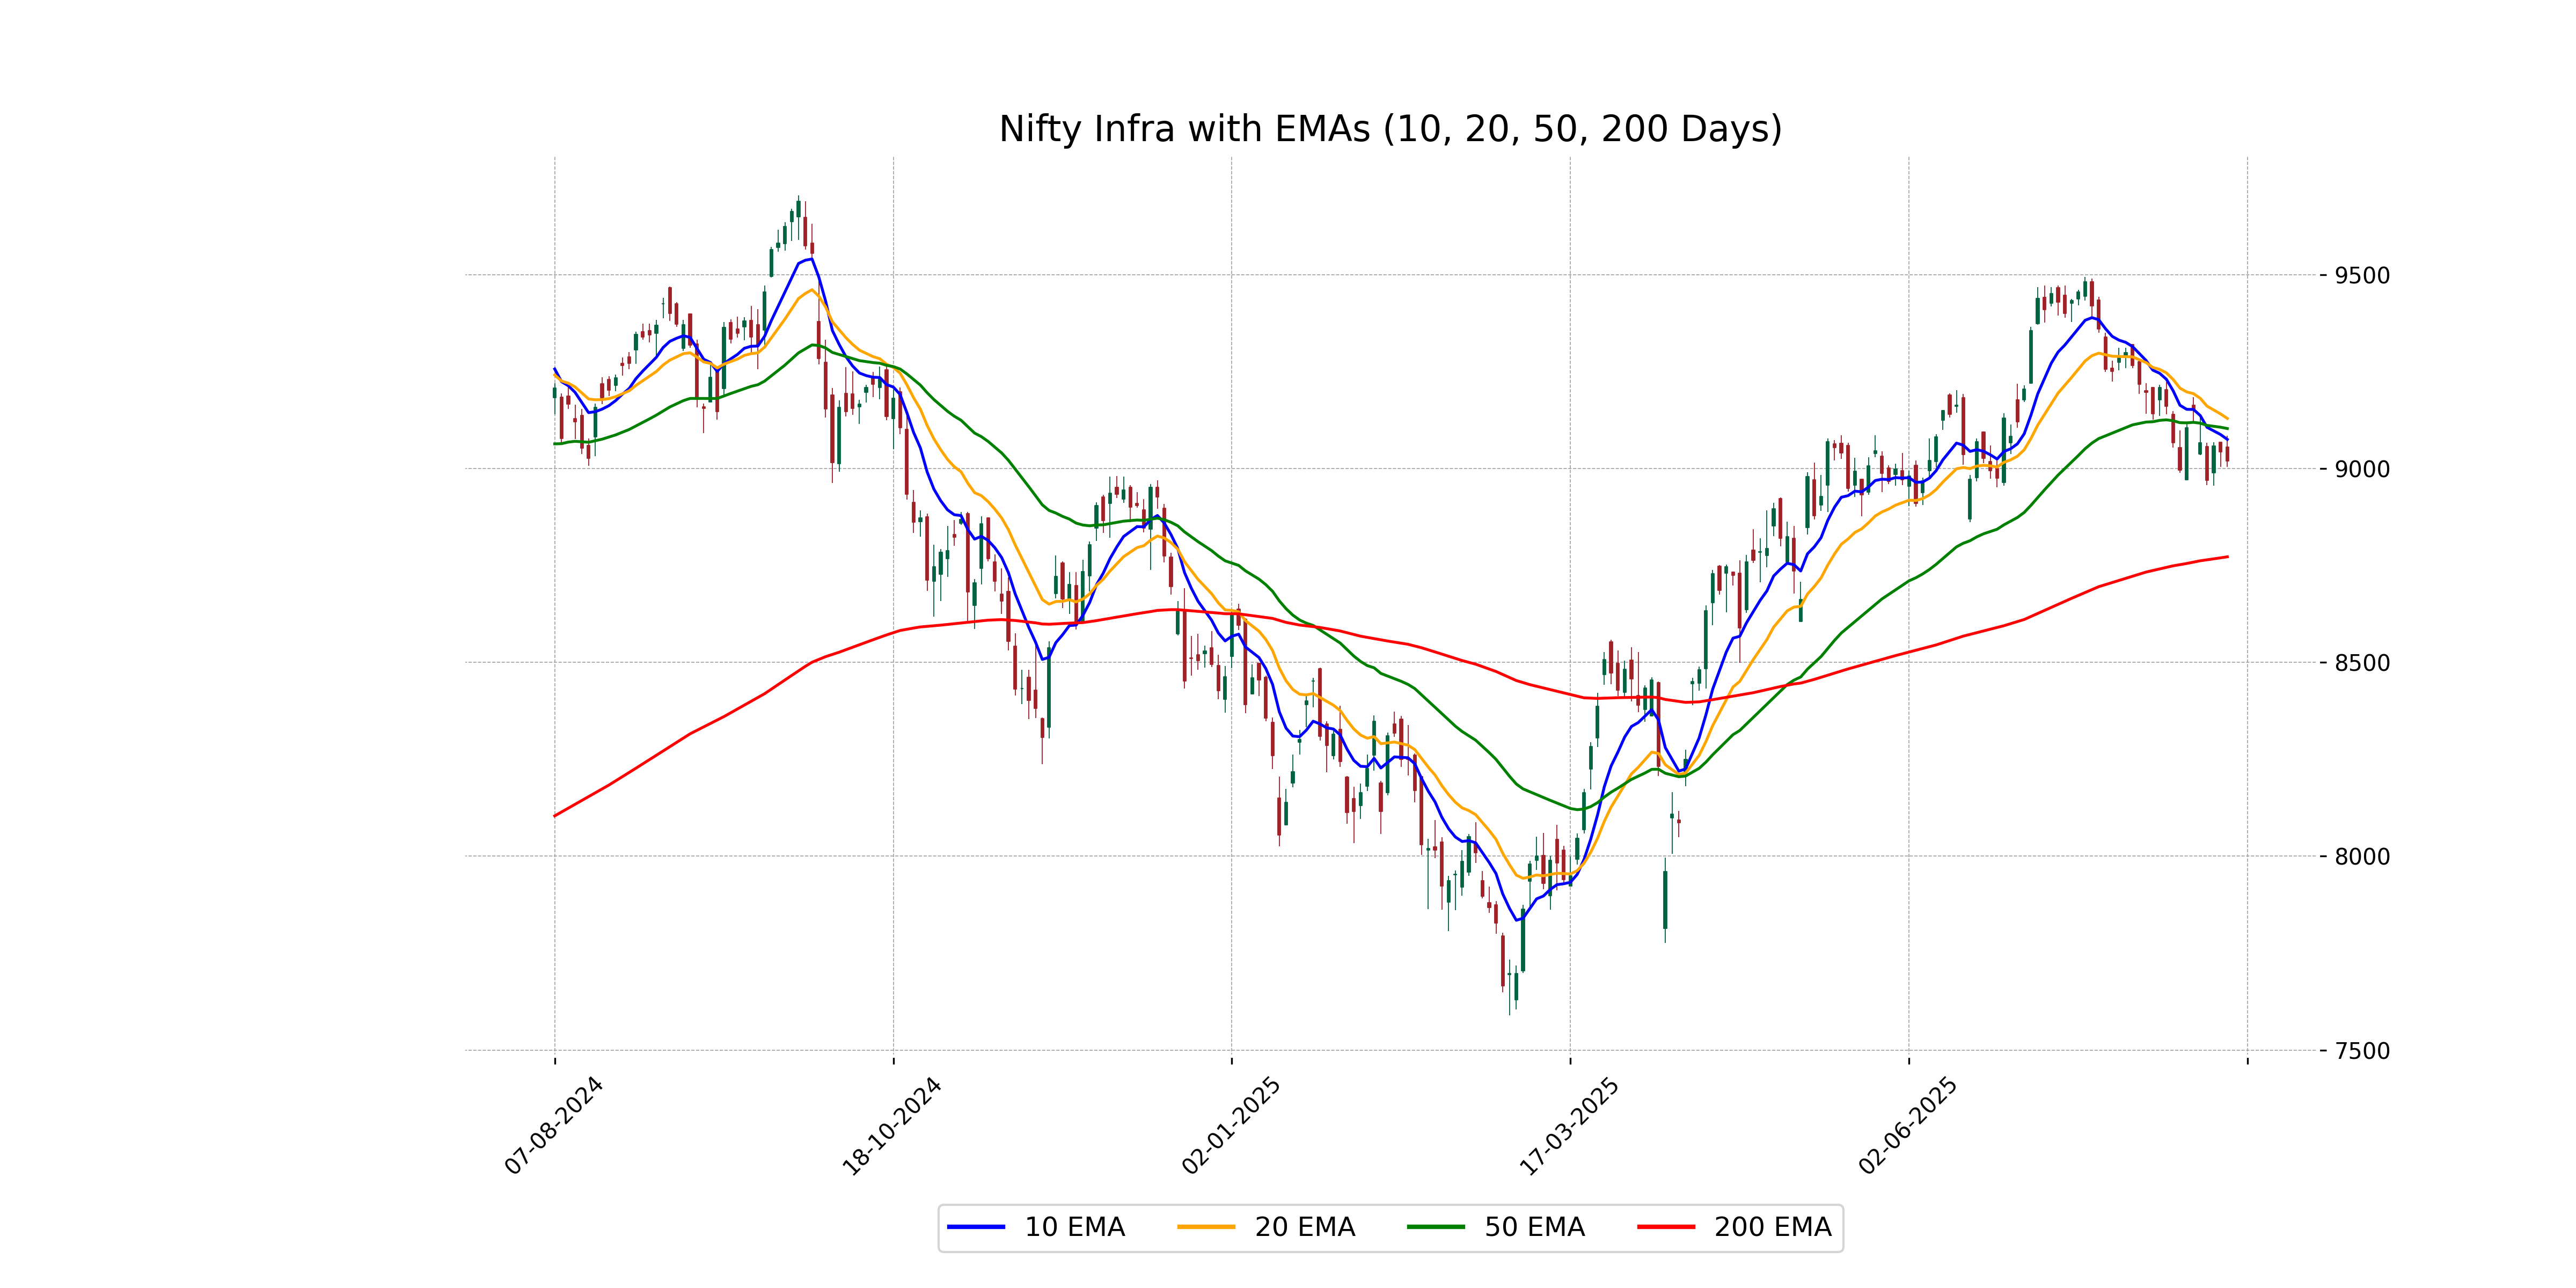
Relationship with Key Moving Averages
Nifty Infra closed at 9018.80, which is below its 10-day EMA of 9075.18 and its 50-day EMA of 9103.16, indicating short-term and medium-term bearishness. It is above its 200-day EMA of 8772.31, suggesting long-term bullishness.
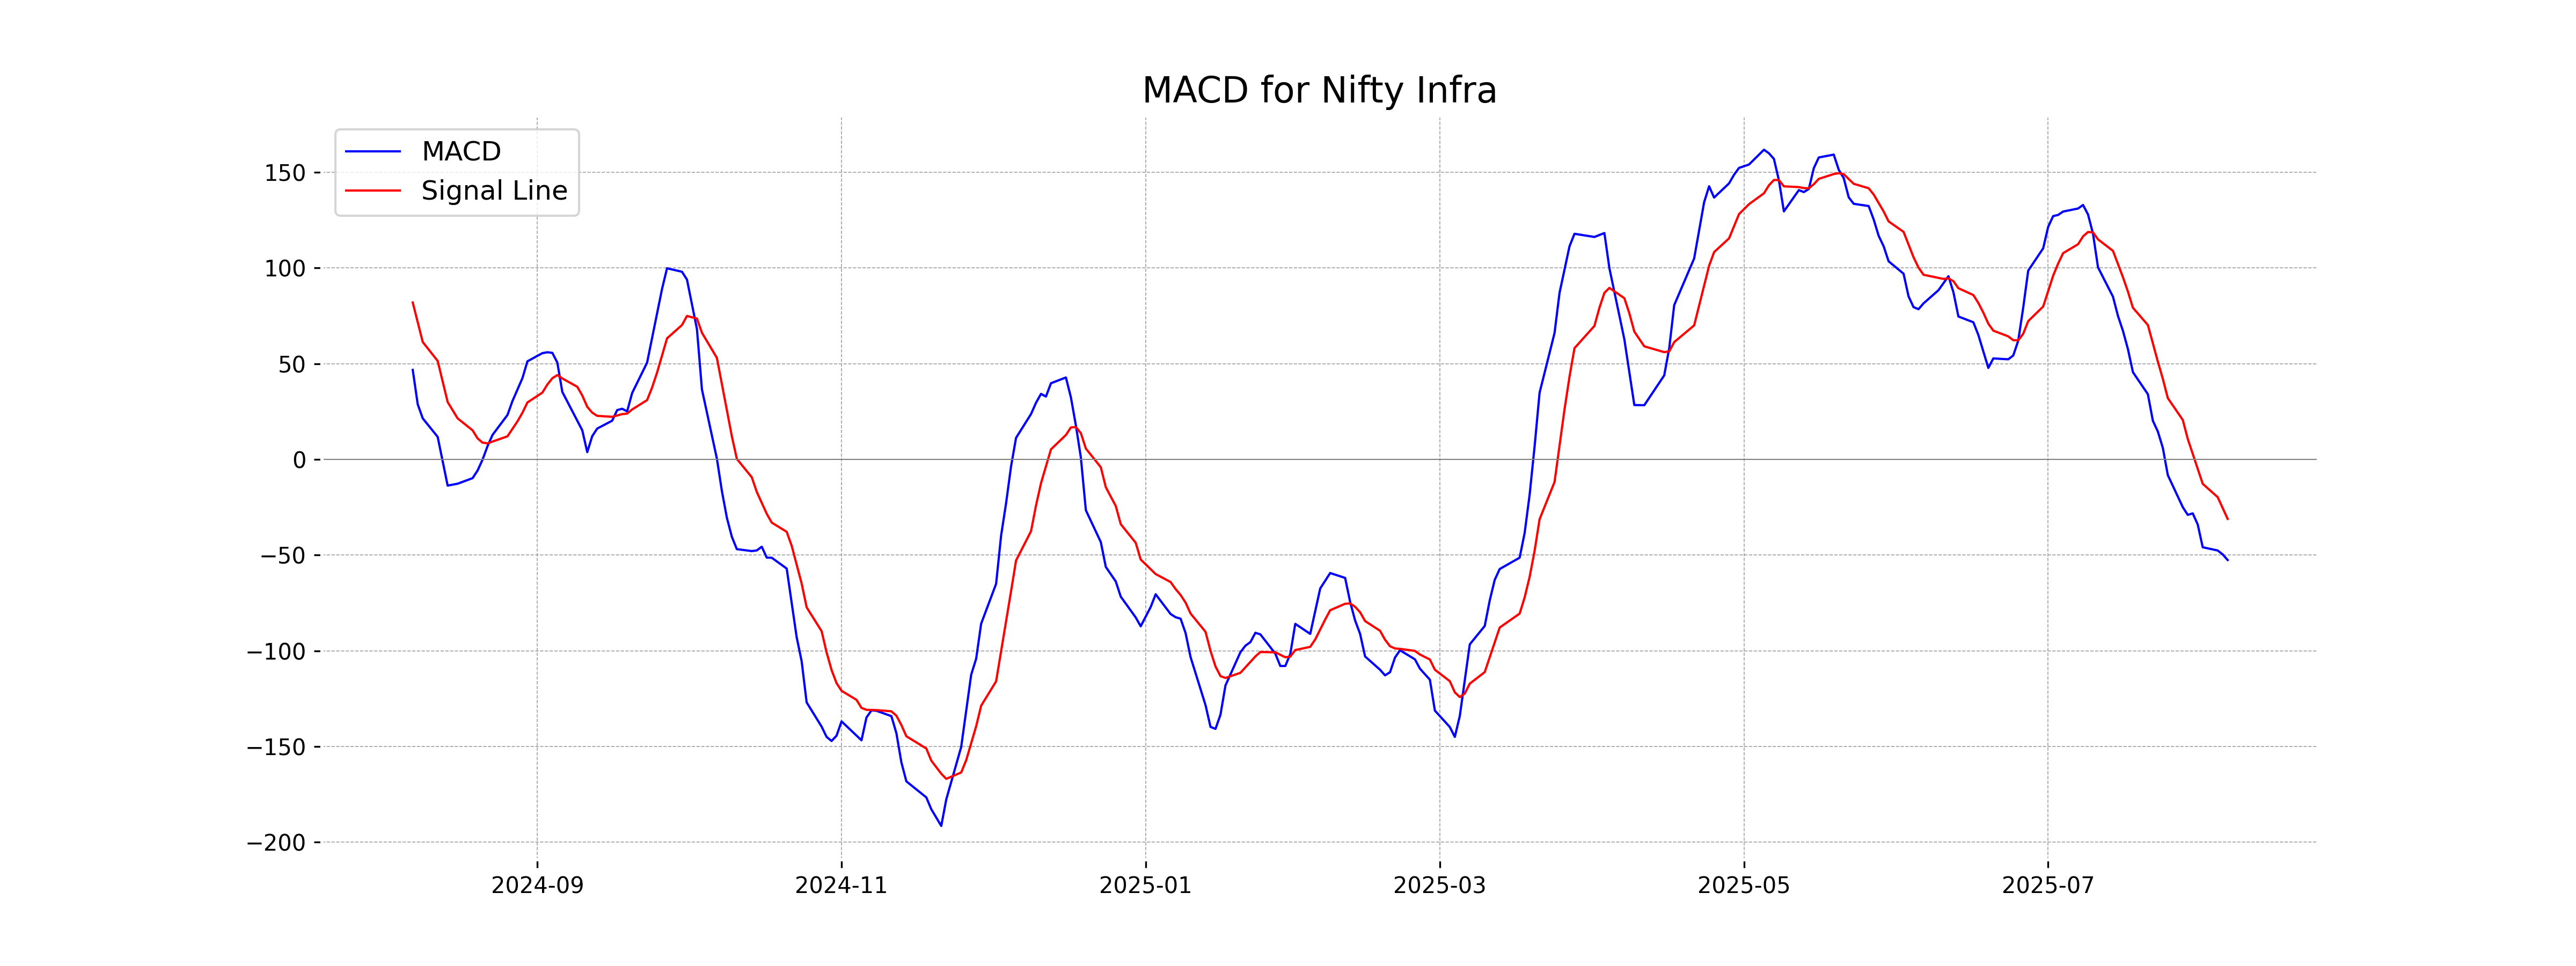
Moving Averages Trend (MACD)
Based on the provided data for Nifty Infra, the MACD is currently at -52.59, which is below the MACD Signal line of -31.10. This suggests a bearish trend, indicating that the stock may face downward pressure in the short term. Additionally, the RSI of 41.70 indicates that the stock is not in the overbought or oversold territory but is leaning towards the weaker side.
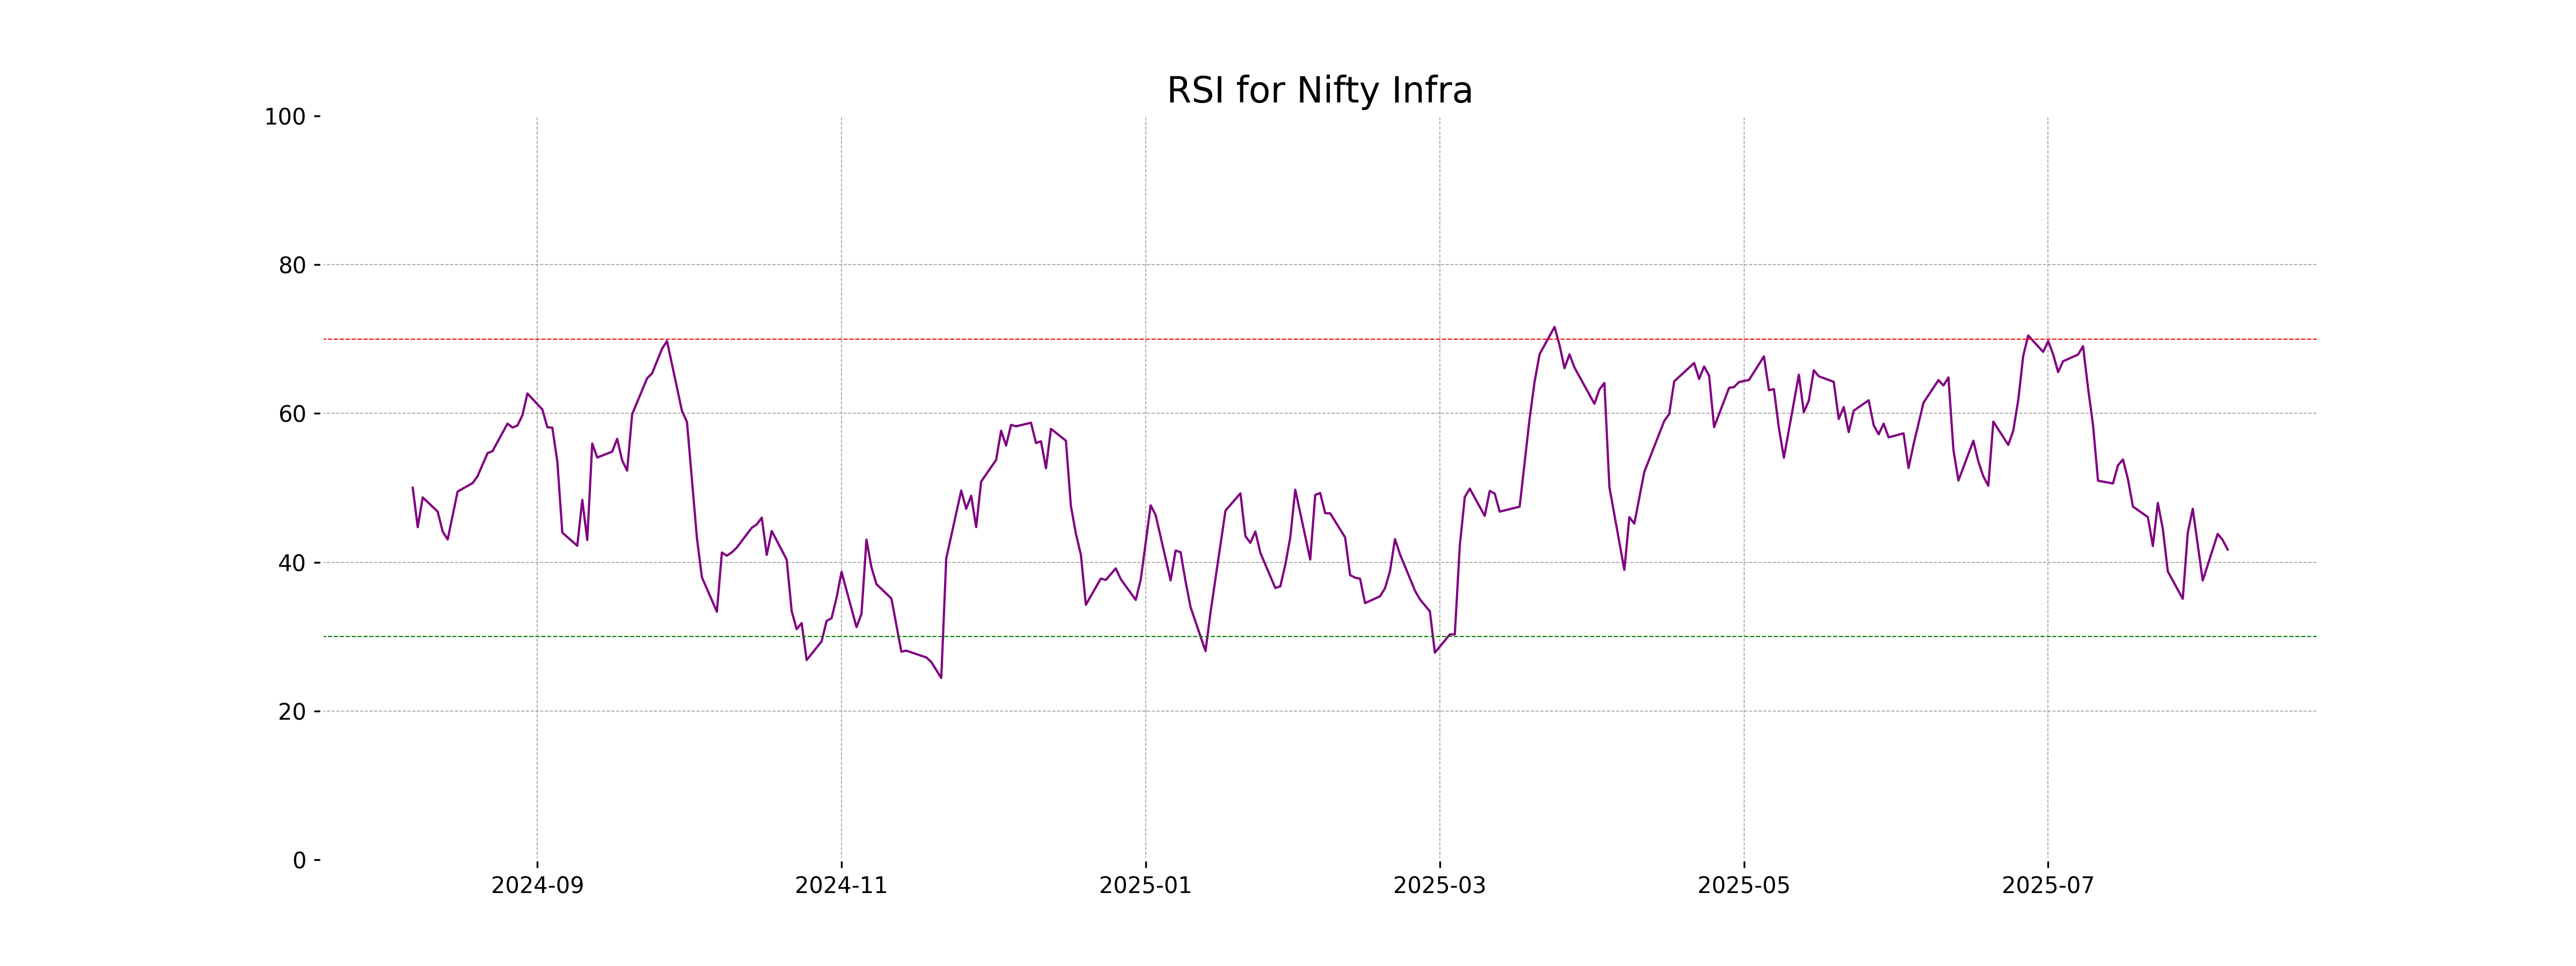
RSI Analysis
The RSI (Relative Strength Index) for Nifty Infra is 41.70, which indicates that the index is in a neutral zone. It is not currently overbought or oversold, suggesting a balanced momentum in the market.
Analysis for Nifty IT - August 06, 2025
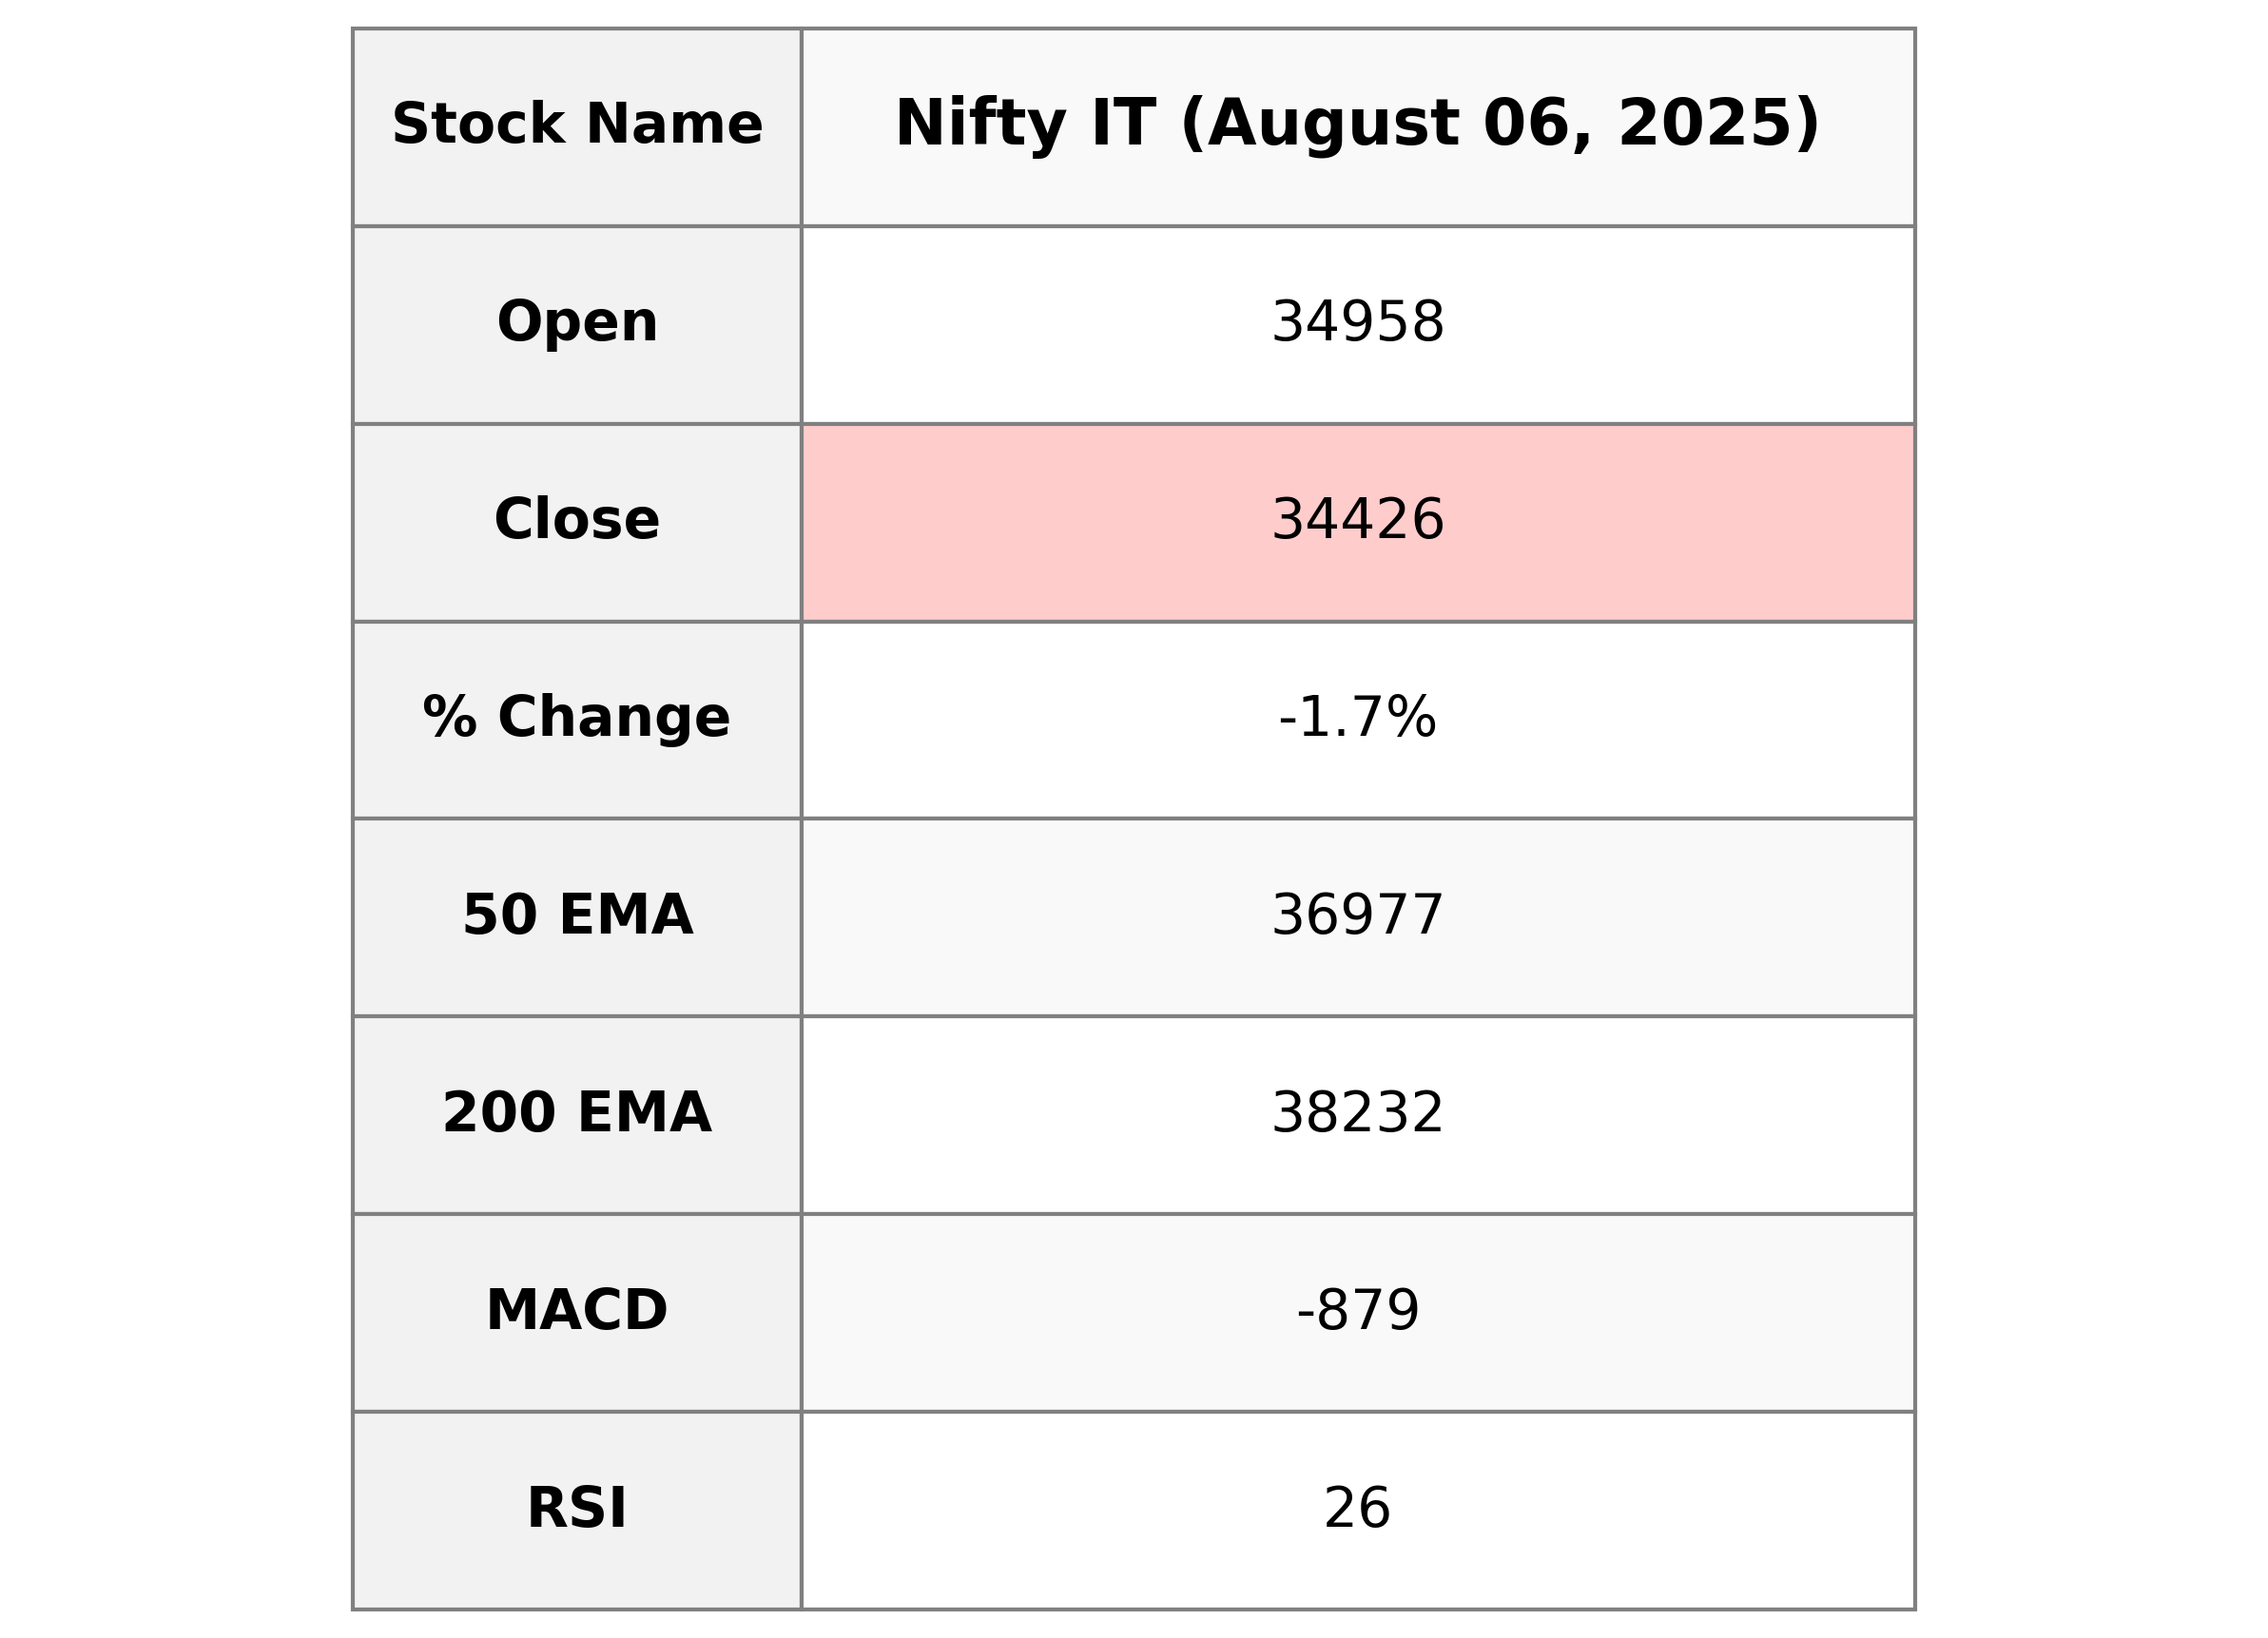
Nifty IT Performance Summary: The Nifty IT index opened at 34,957.95 and closed at 34,426.25, marking a decline of 1.74% with a points change of -608.25. The RSI is notably low at 25.76, suggesting that the index may be oversold. Additionally, the MACD indicates a bearish trend with a value of -878.65 relative to the signal line at -718.66.
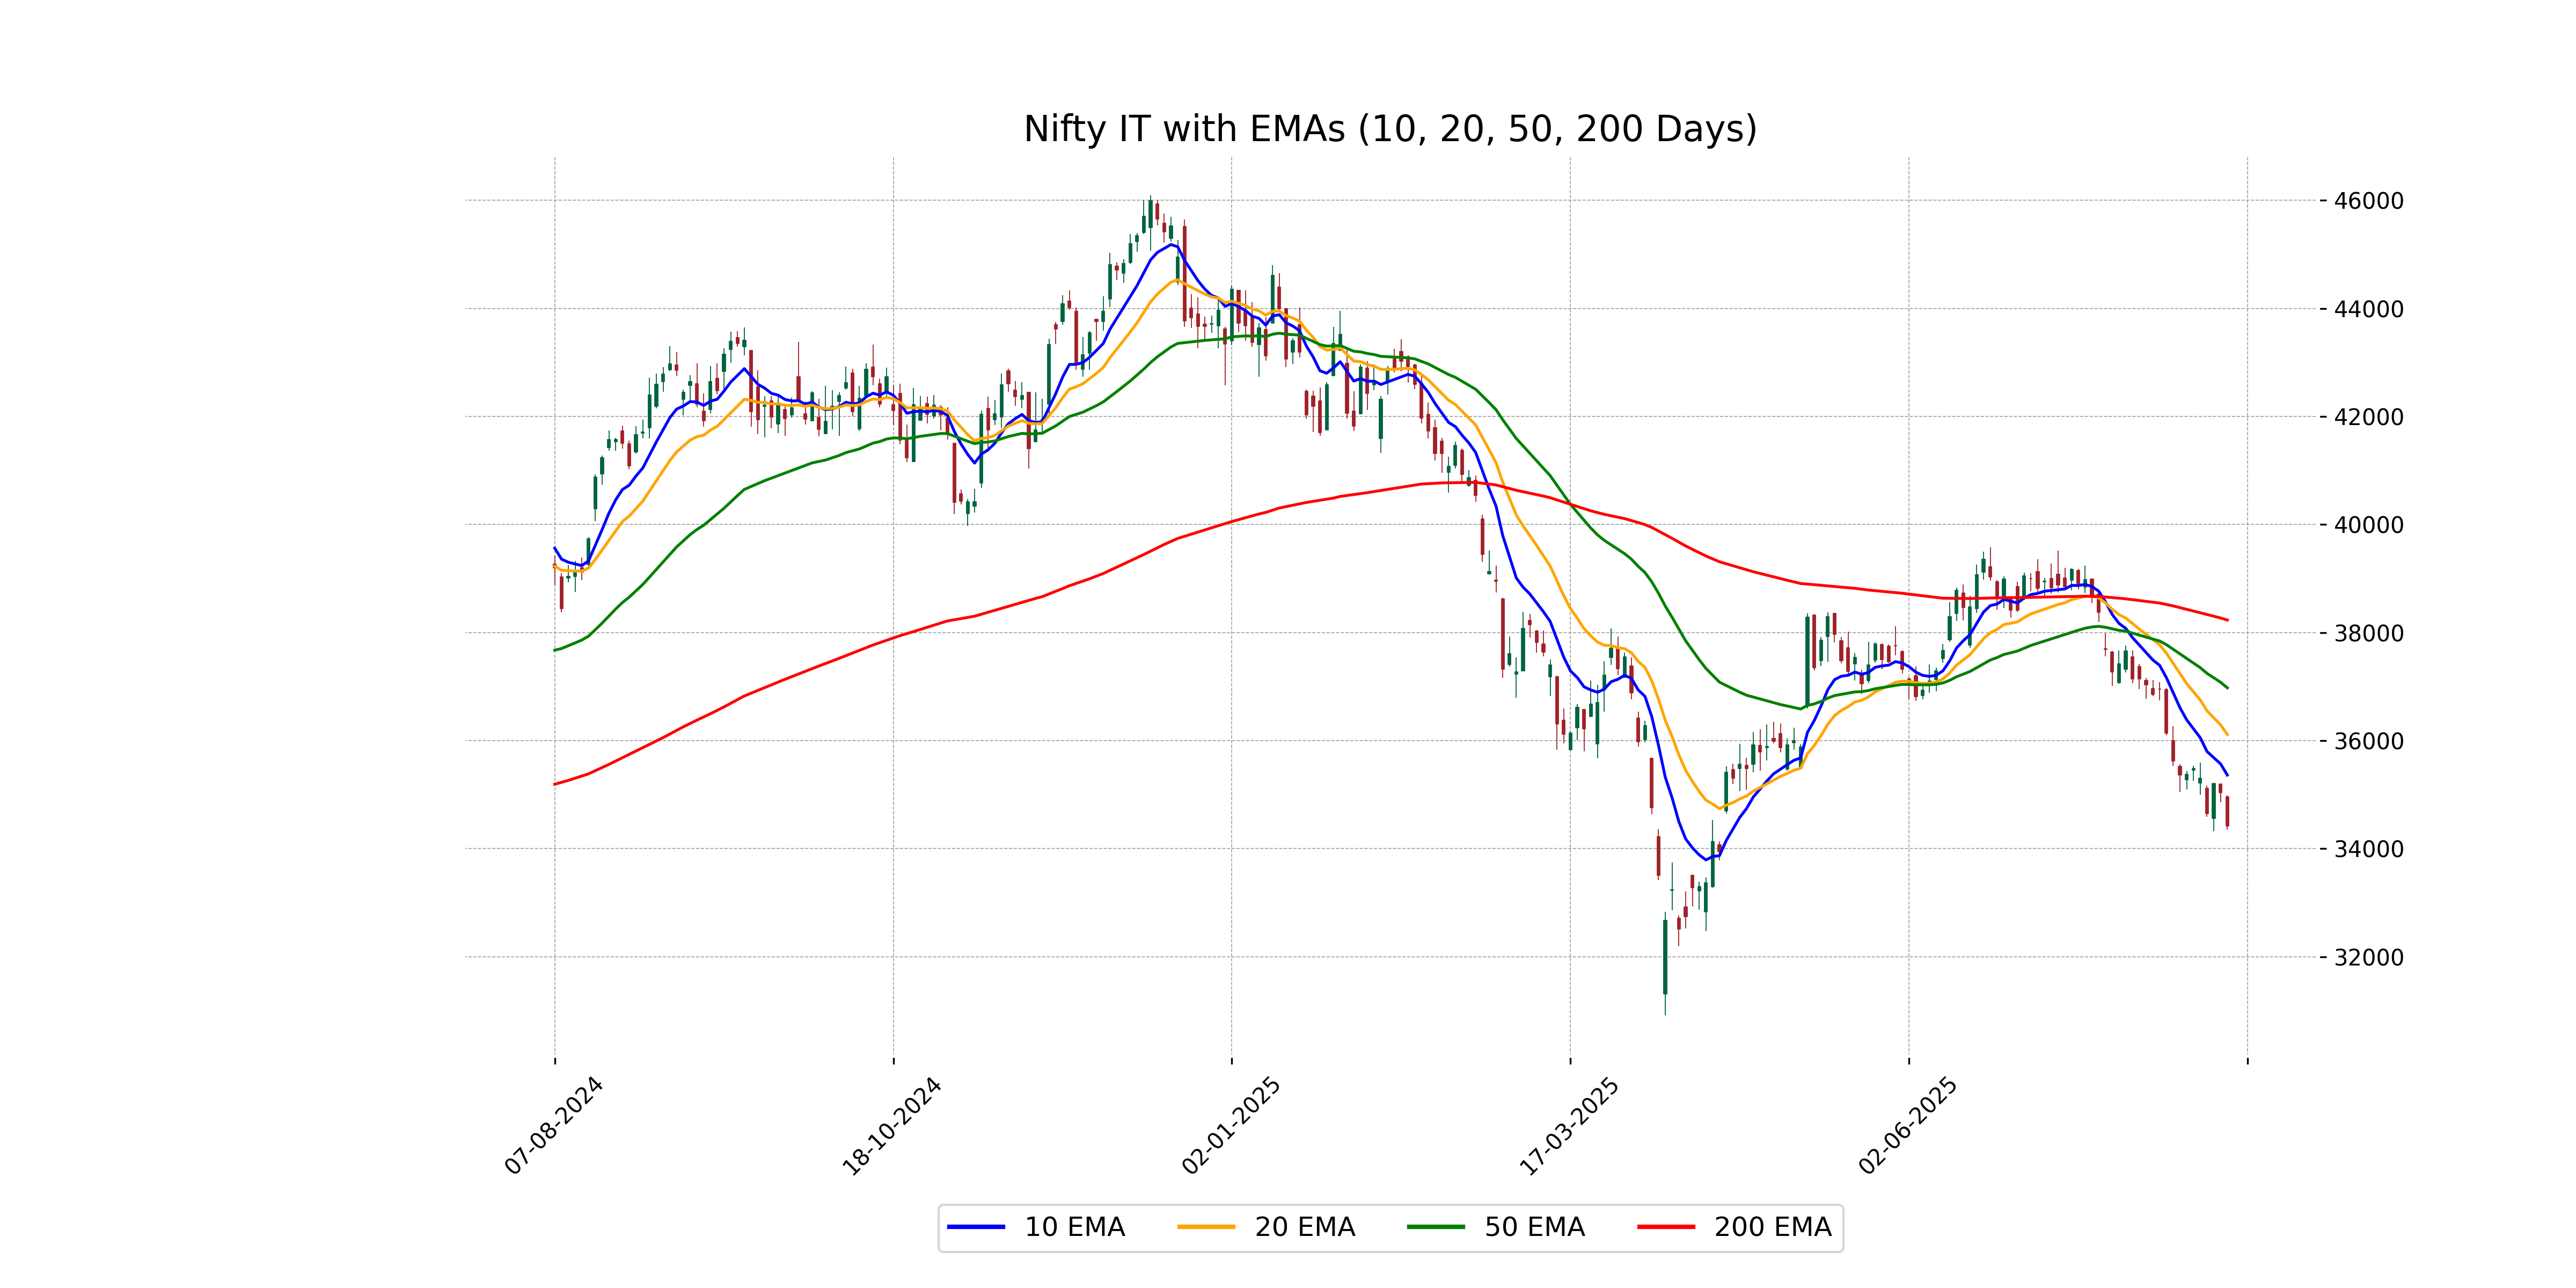
Relationship with Key Moving Averages
The closing price of Nifty IT at 34,426.25 is below key moving averages, specifically the 50 EMA at 36,976.84 and the 200 EMA at 38,232.42, indicating potential bearish pressure. Additionally, the 10 EMA and 20 EMA are also higher than the current close, suggesting a short-term downtrend.
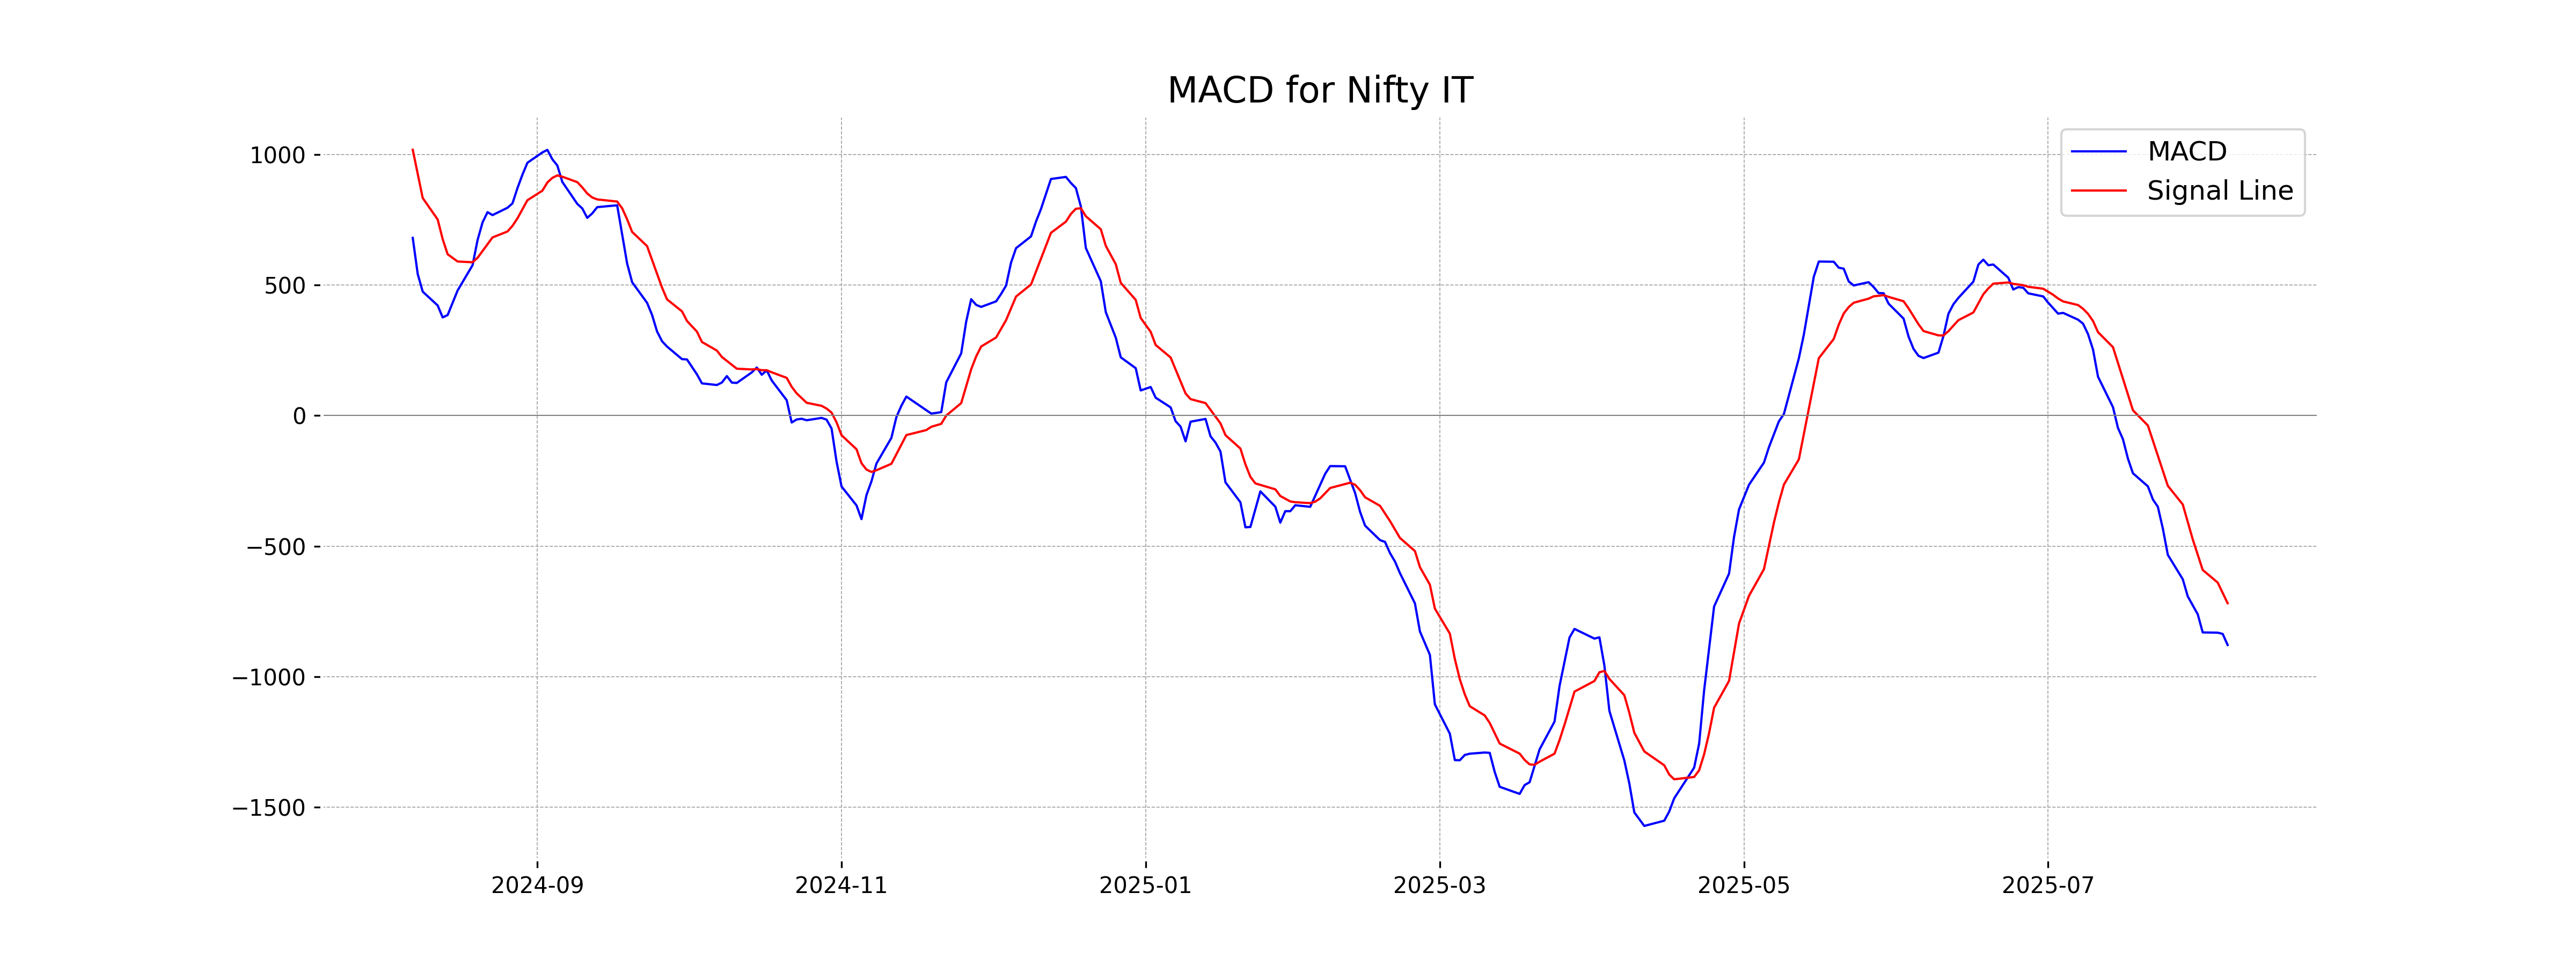
Moving Averages Trend (MACD)
Nifty IT is currently experiencing a bearish trend, as indicated by the MACD value of -878.65, which is well below both the MACD Signal line and zero. This suggests negative momentum and potential further downside unless there is a significant reversal in the market.
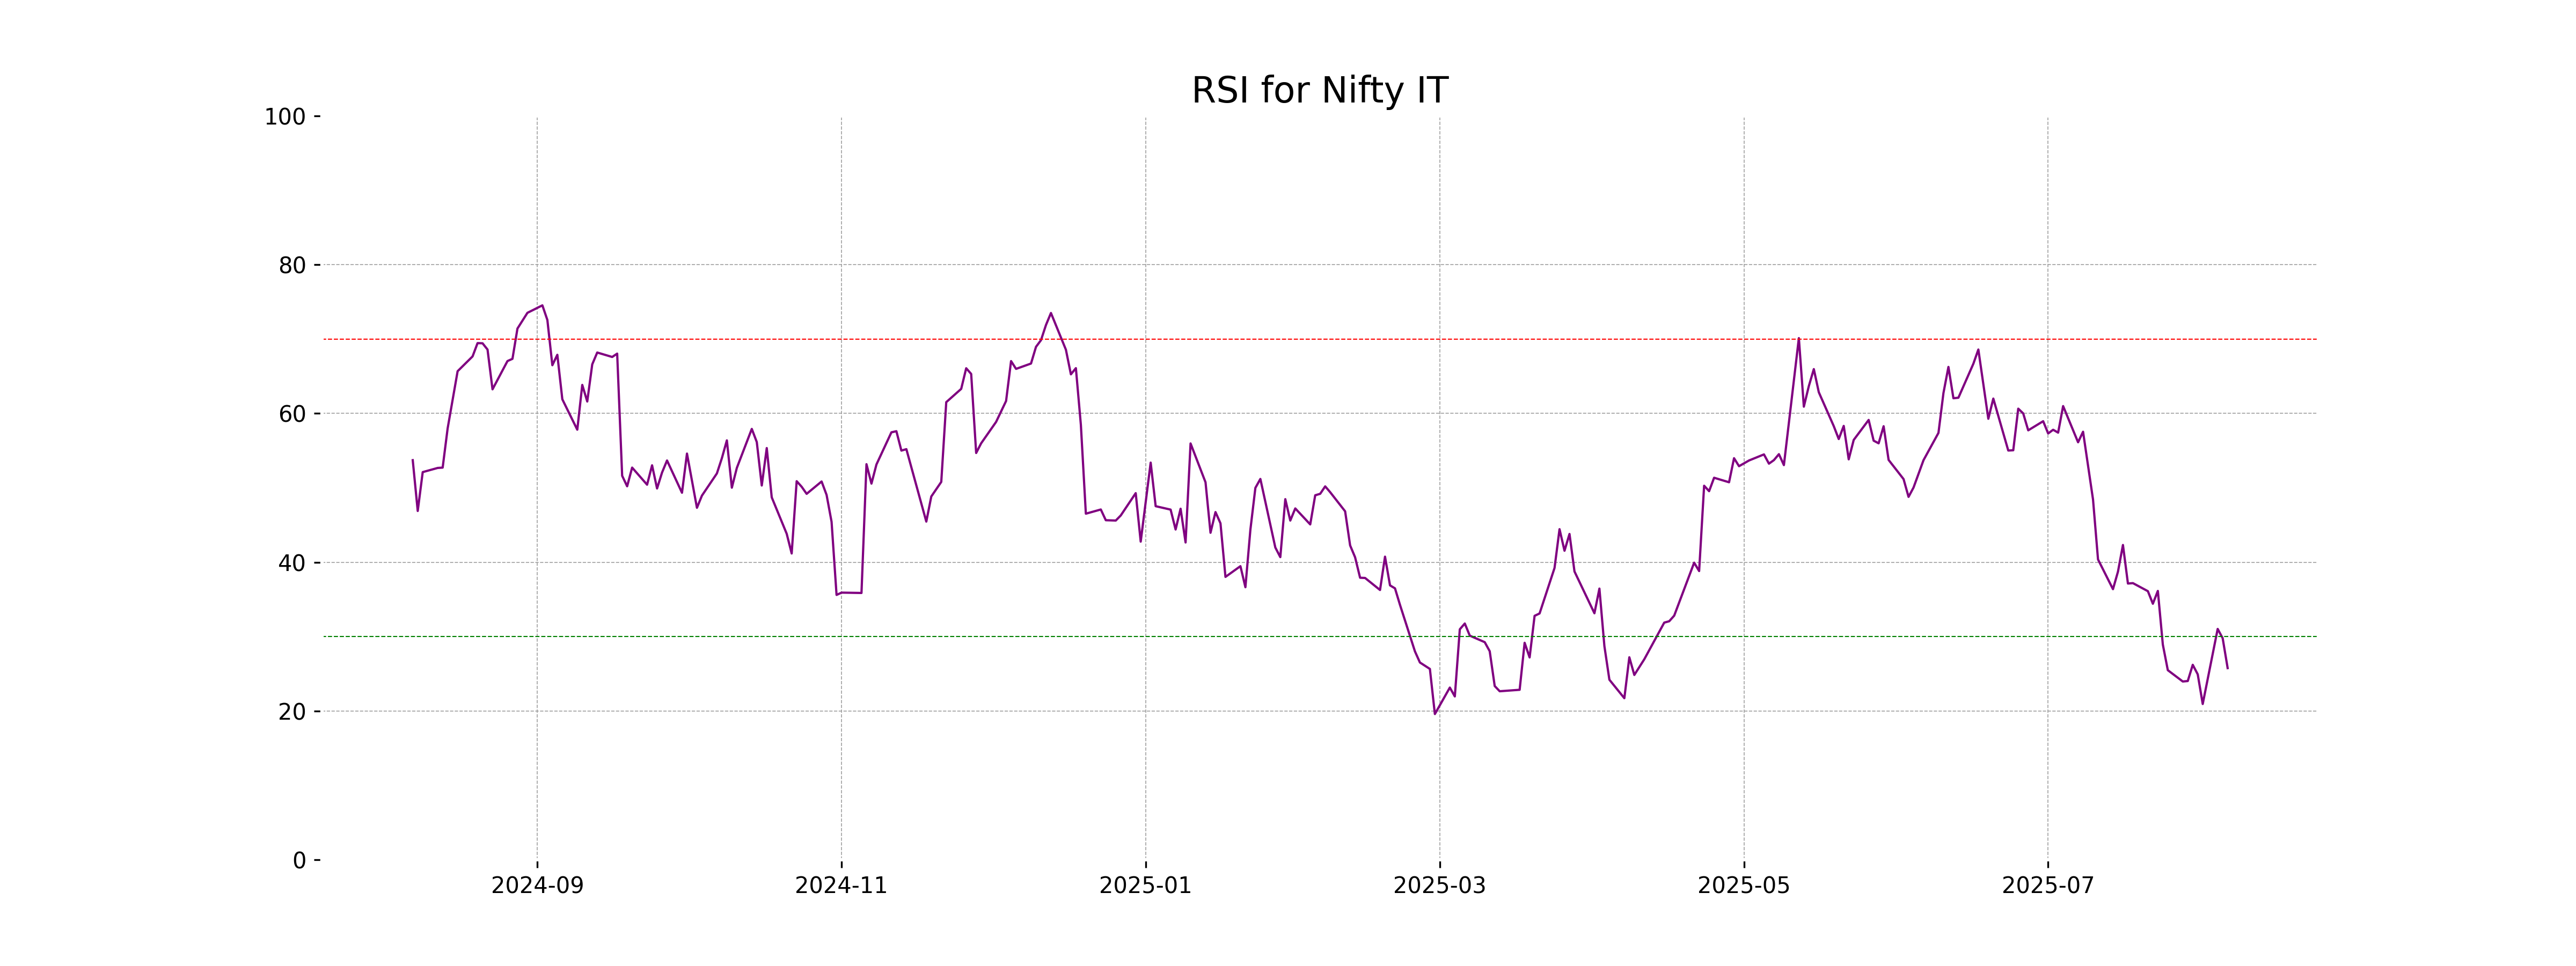
RSI Analysis
Based on the data, the RSI (Relative Strength Index) for Nifty IT stands at 25.76, which indicates the index is in the oversold territory. This suggests potential for a price reversal or a bounce-back in the near-term, as the RSI value is below the common oversold threshold of 30.
Analysis for Nifty Metal - August 06, 2025
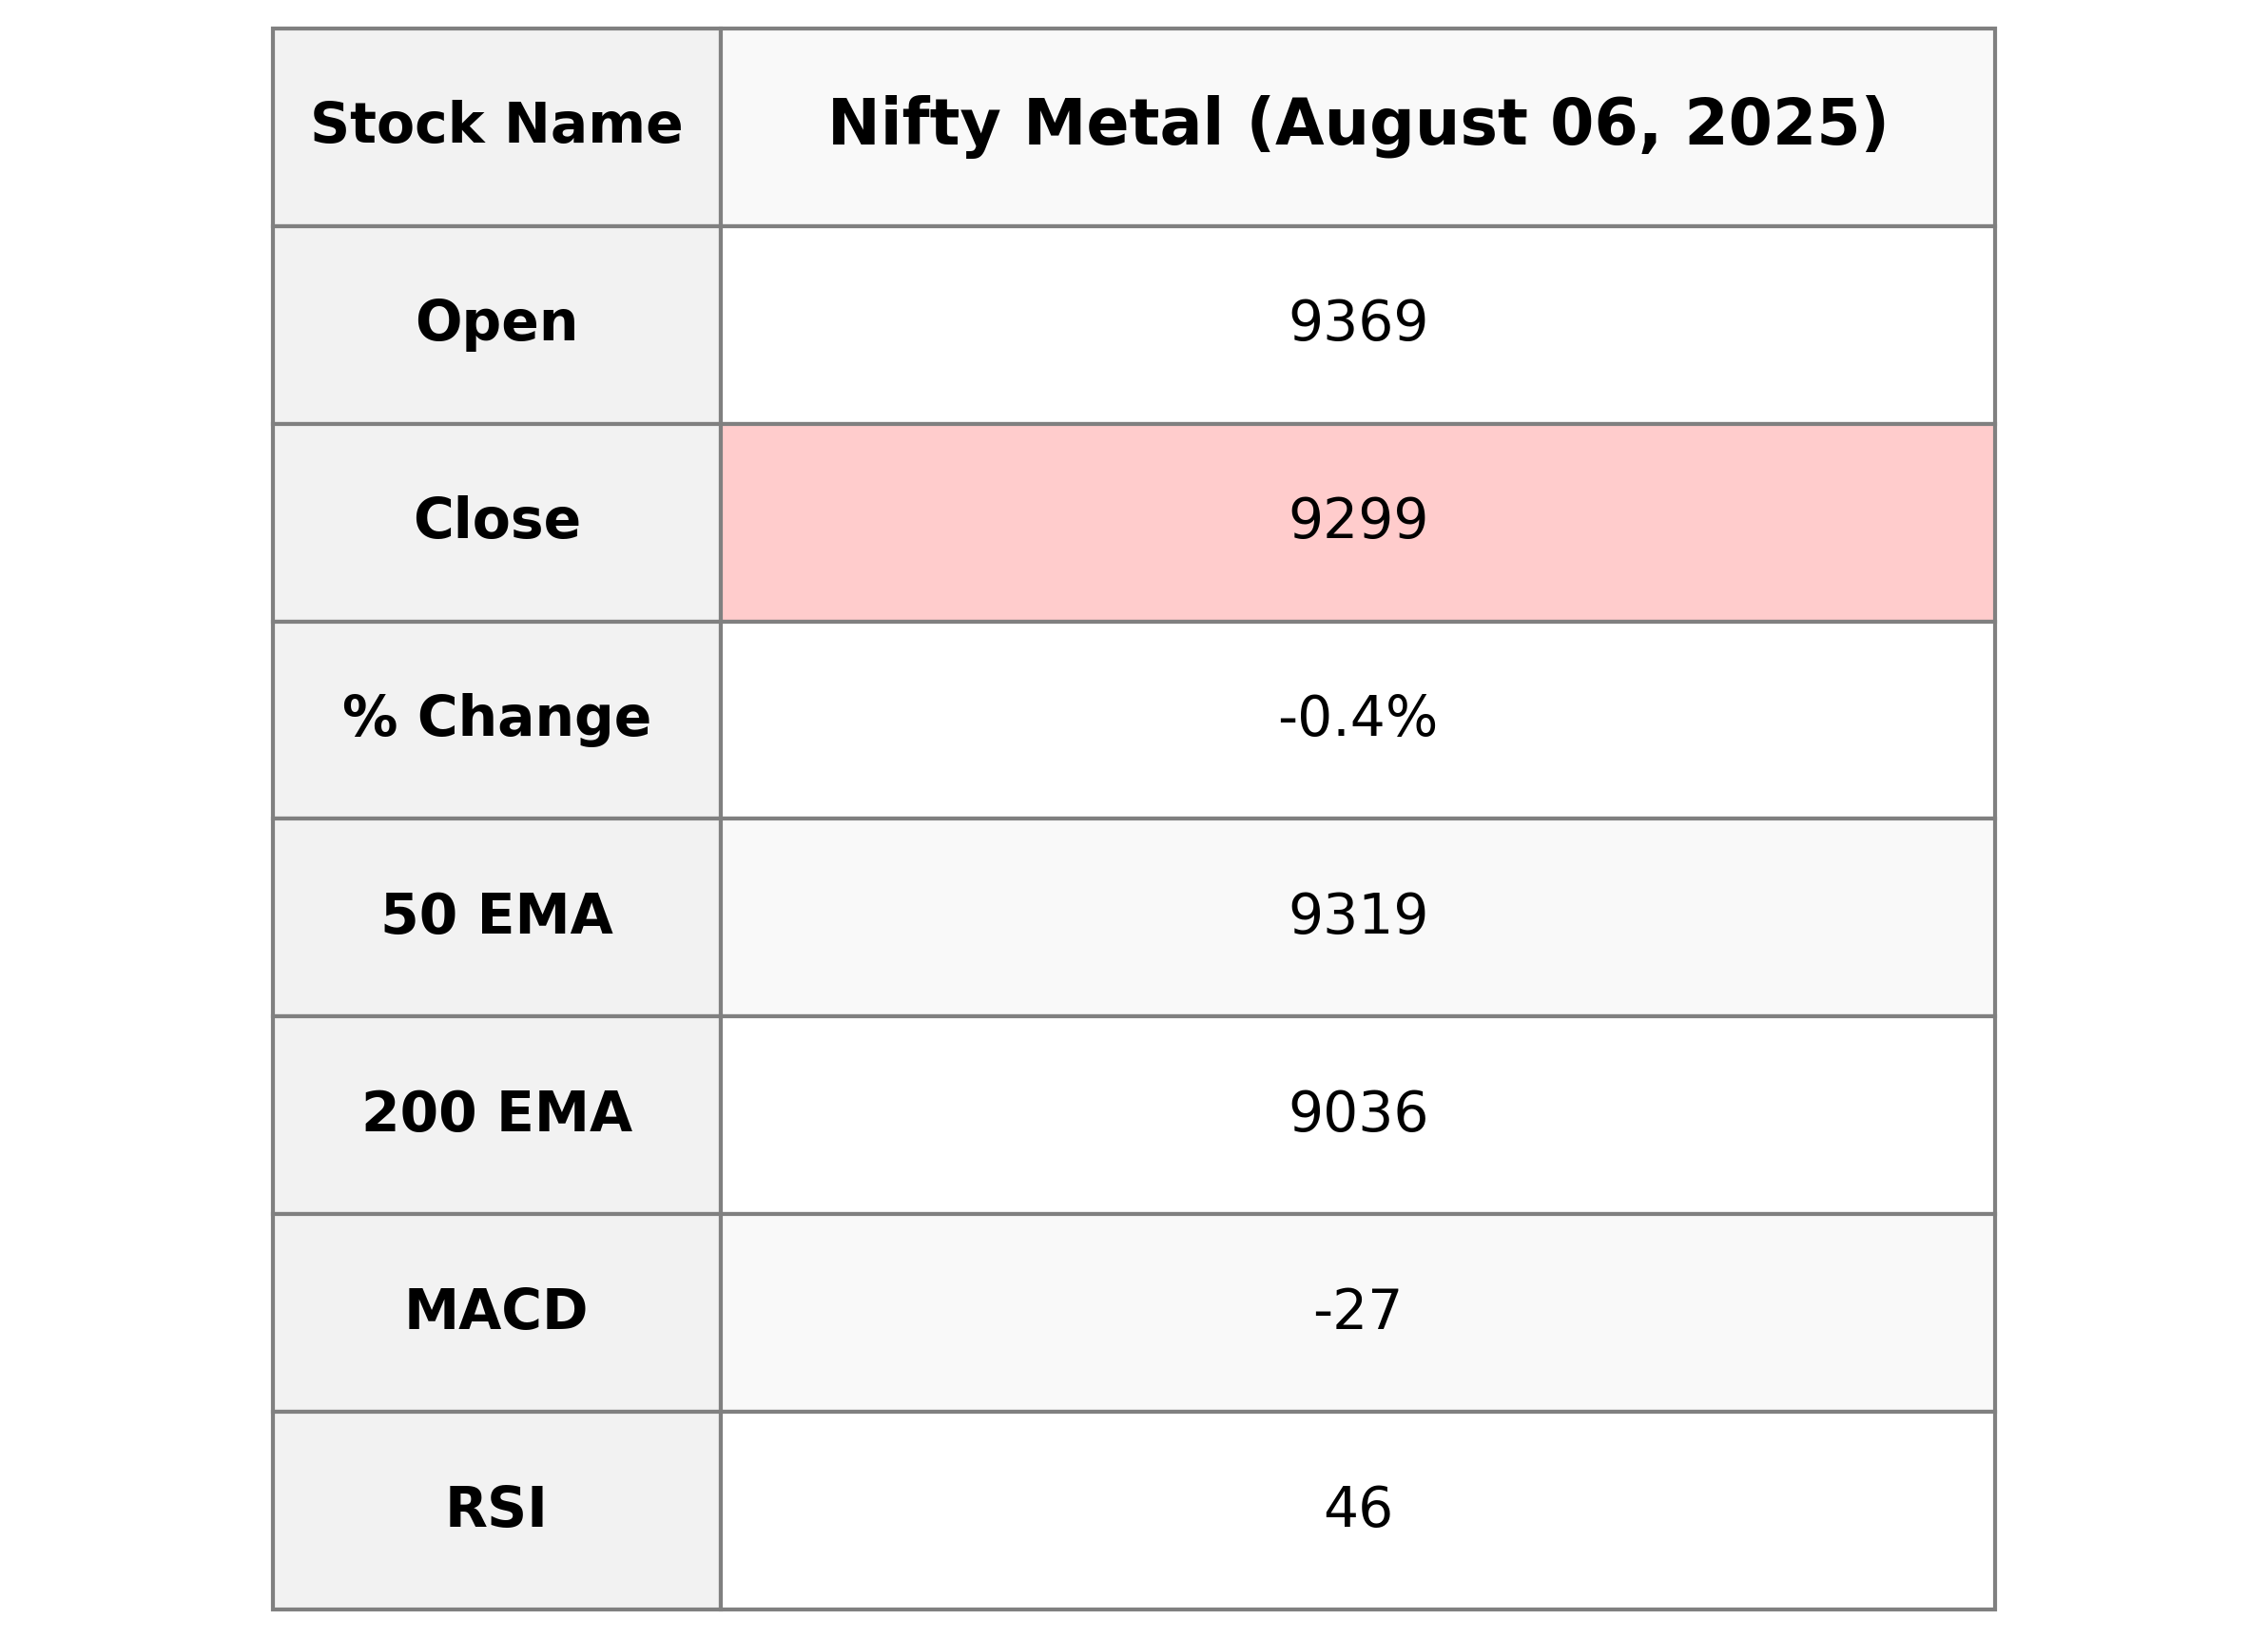
The Nifty Metal index opened at 9368.65 and closed lower at 9298.75, marking a decrease of 0.40% from the previous close of 9336.05. The technical indicators show a slight bearish trend with a negative MACD and an RSI of 46.14, suggesting potential weakening momentum in the market.
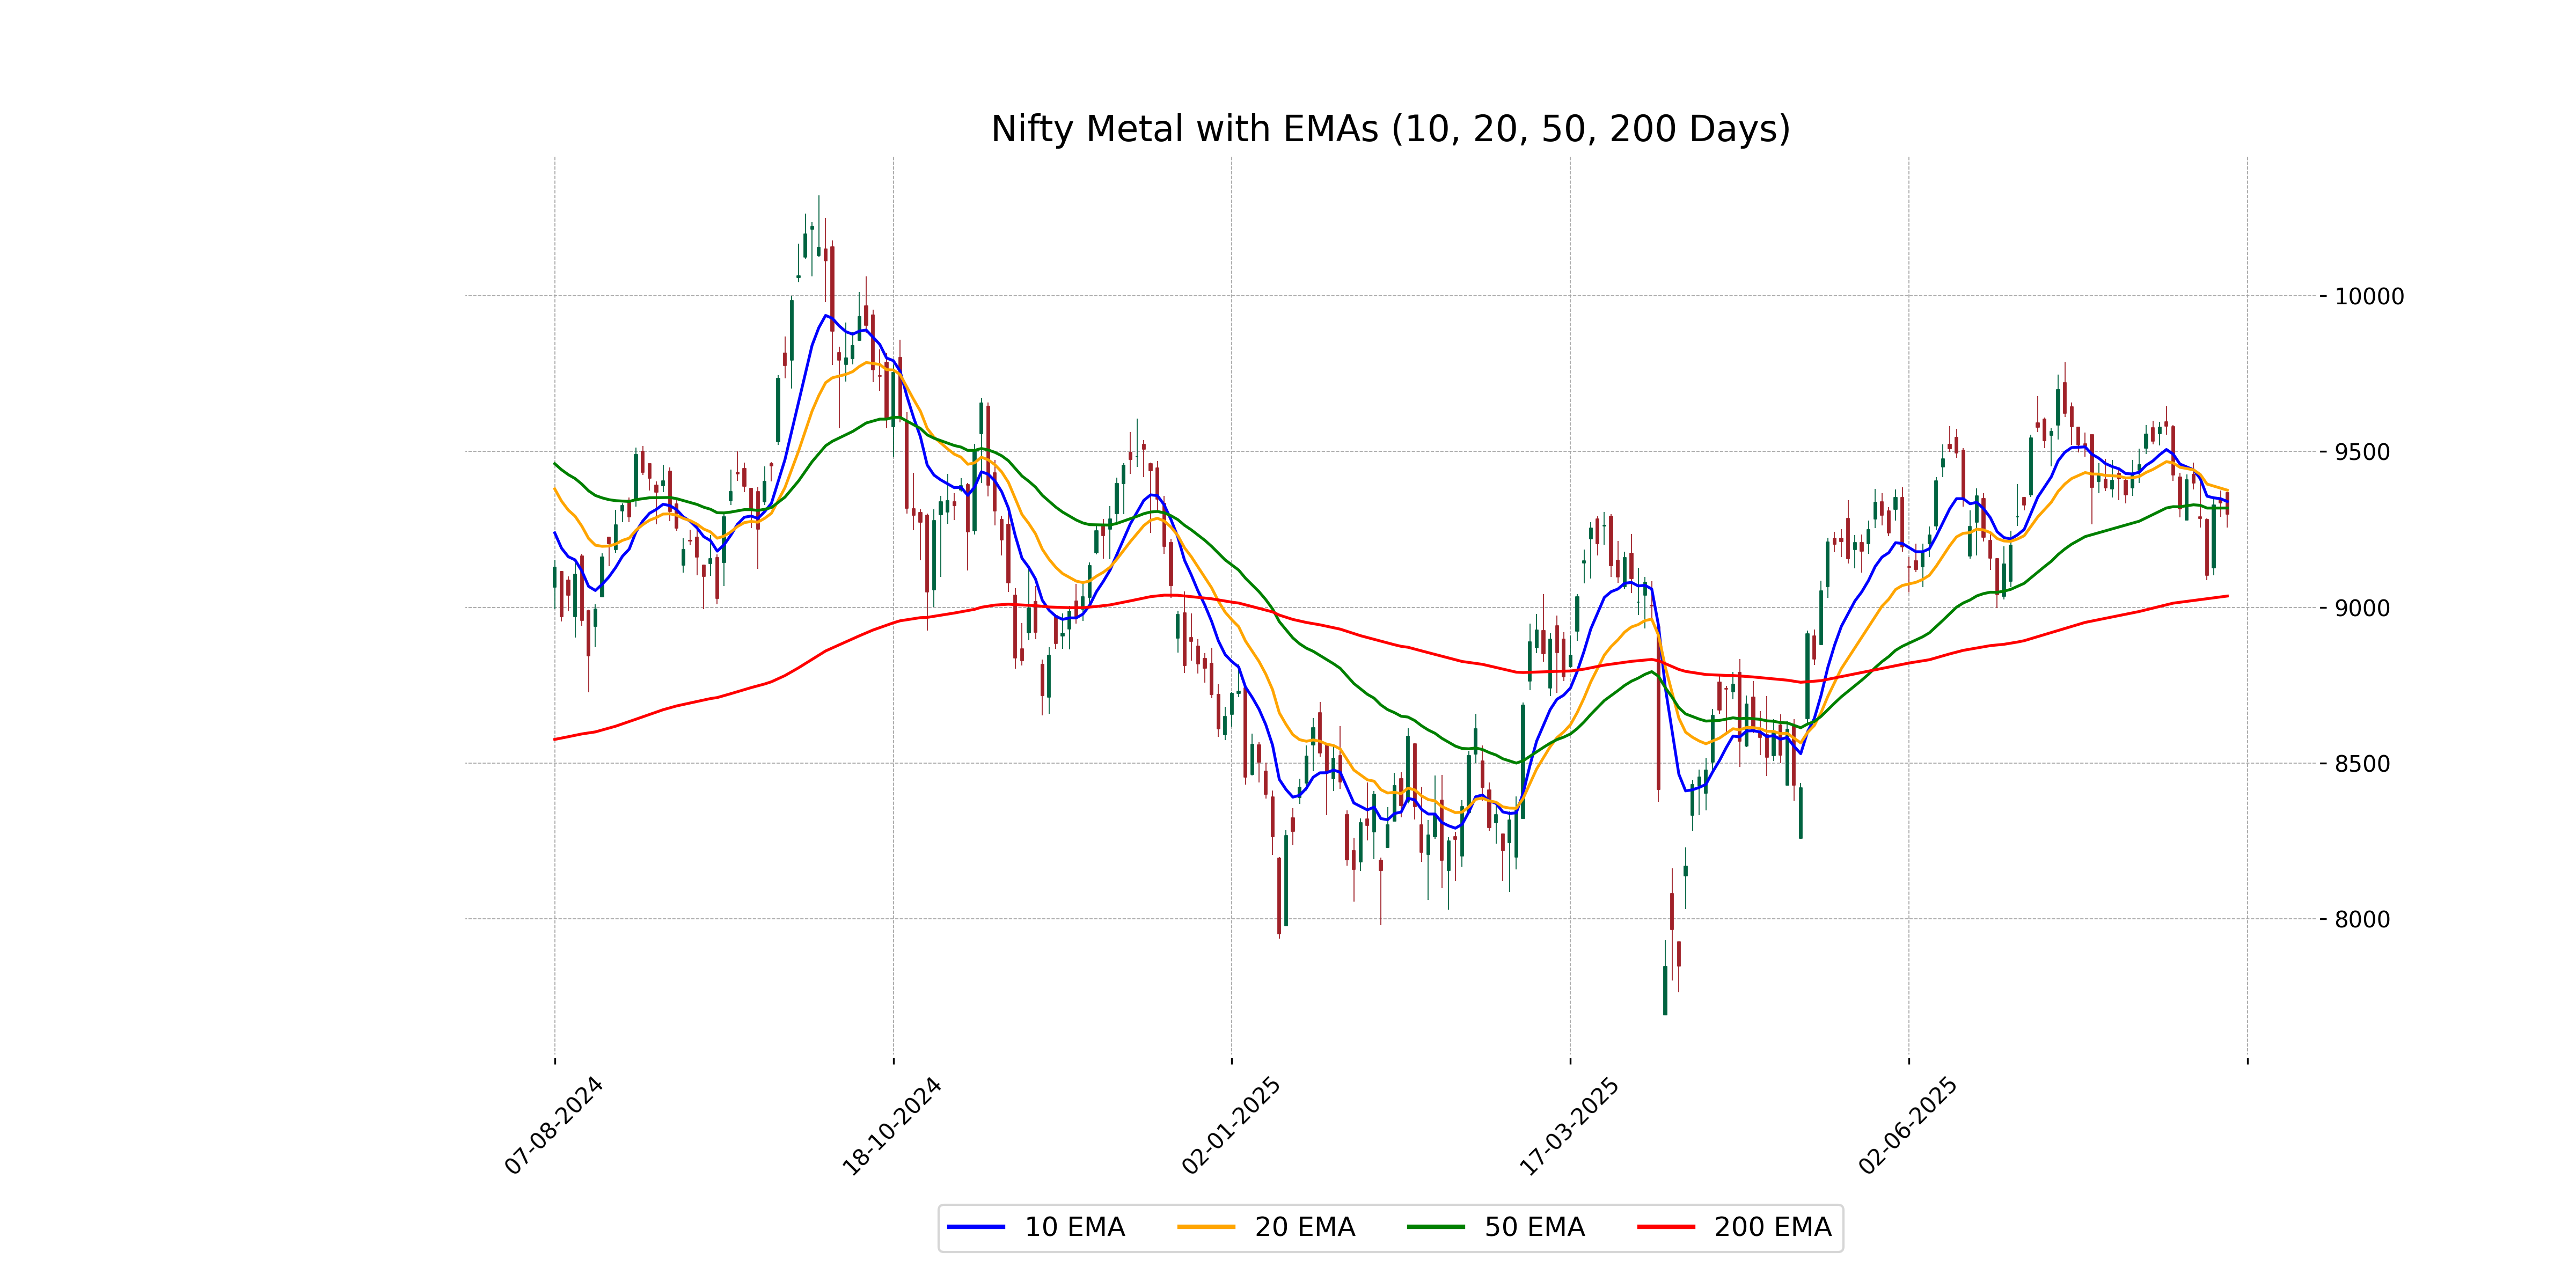
Relationship with Key Moving Averages
The Nifty Metal index closed below its 10-day and 20-day EMAs, indicating short-term bearish momentum, as well as below the 50-day EMA, suggesting ongoing pressure. The index remains above the 200-day EMA, signifying a long-term bullish trend.
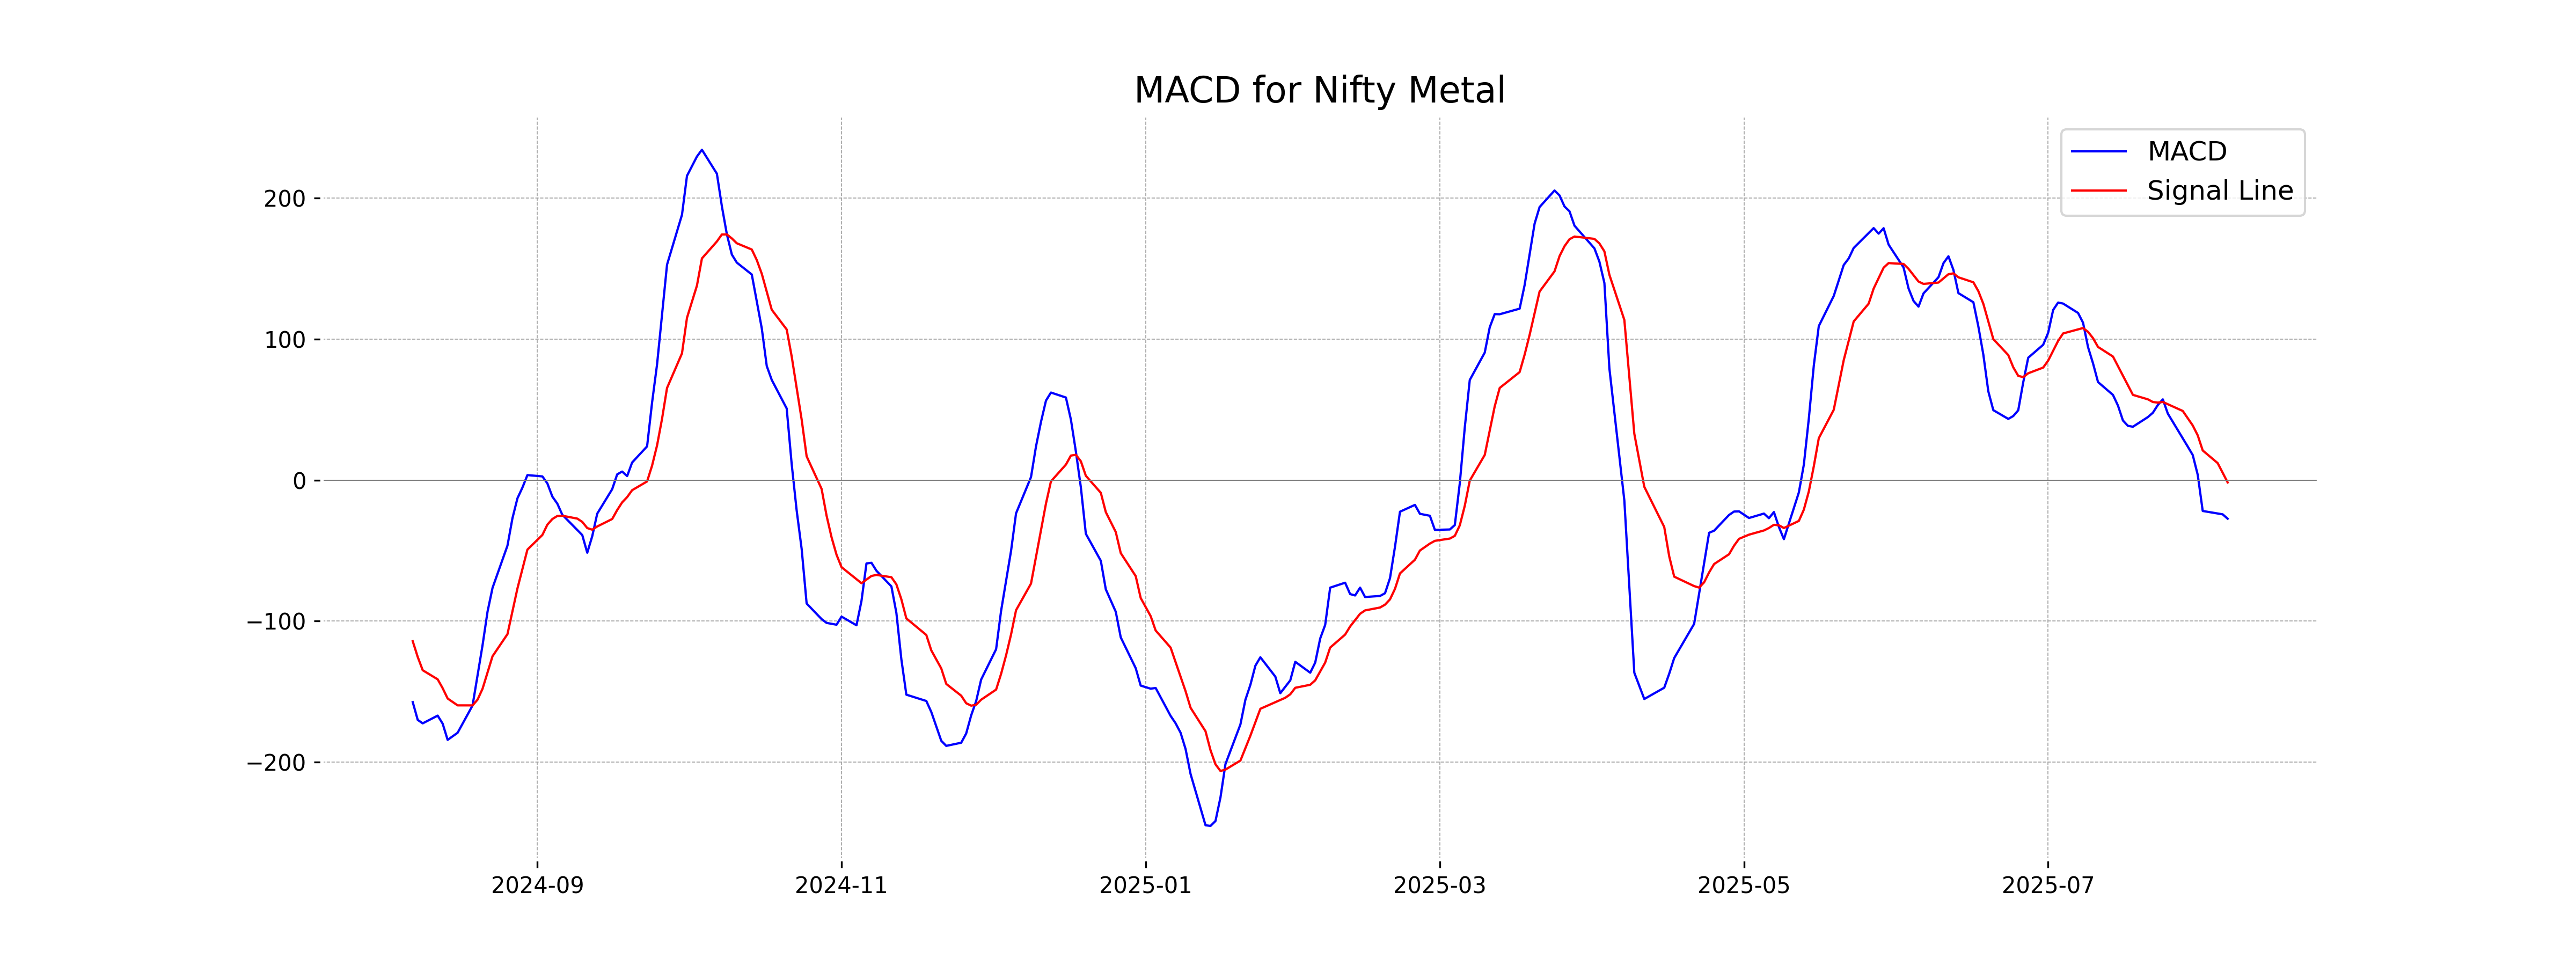
Moving Averages Trend (MACD)
The MACD for Nifty Metal is at -27.32 with a signal line of -1.58, indicating a bearish momentum. The negative MACD value suggests that the recent price declines have potentially accelerated, emphasizing a need for caution among traders.
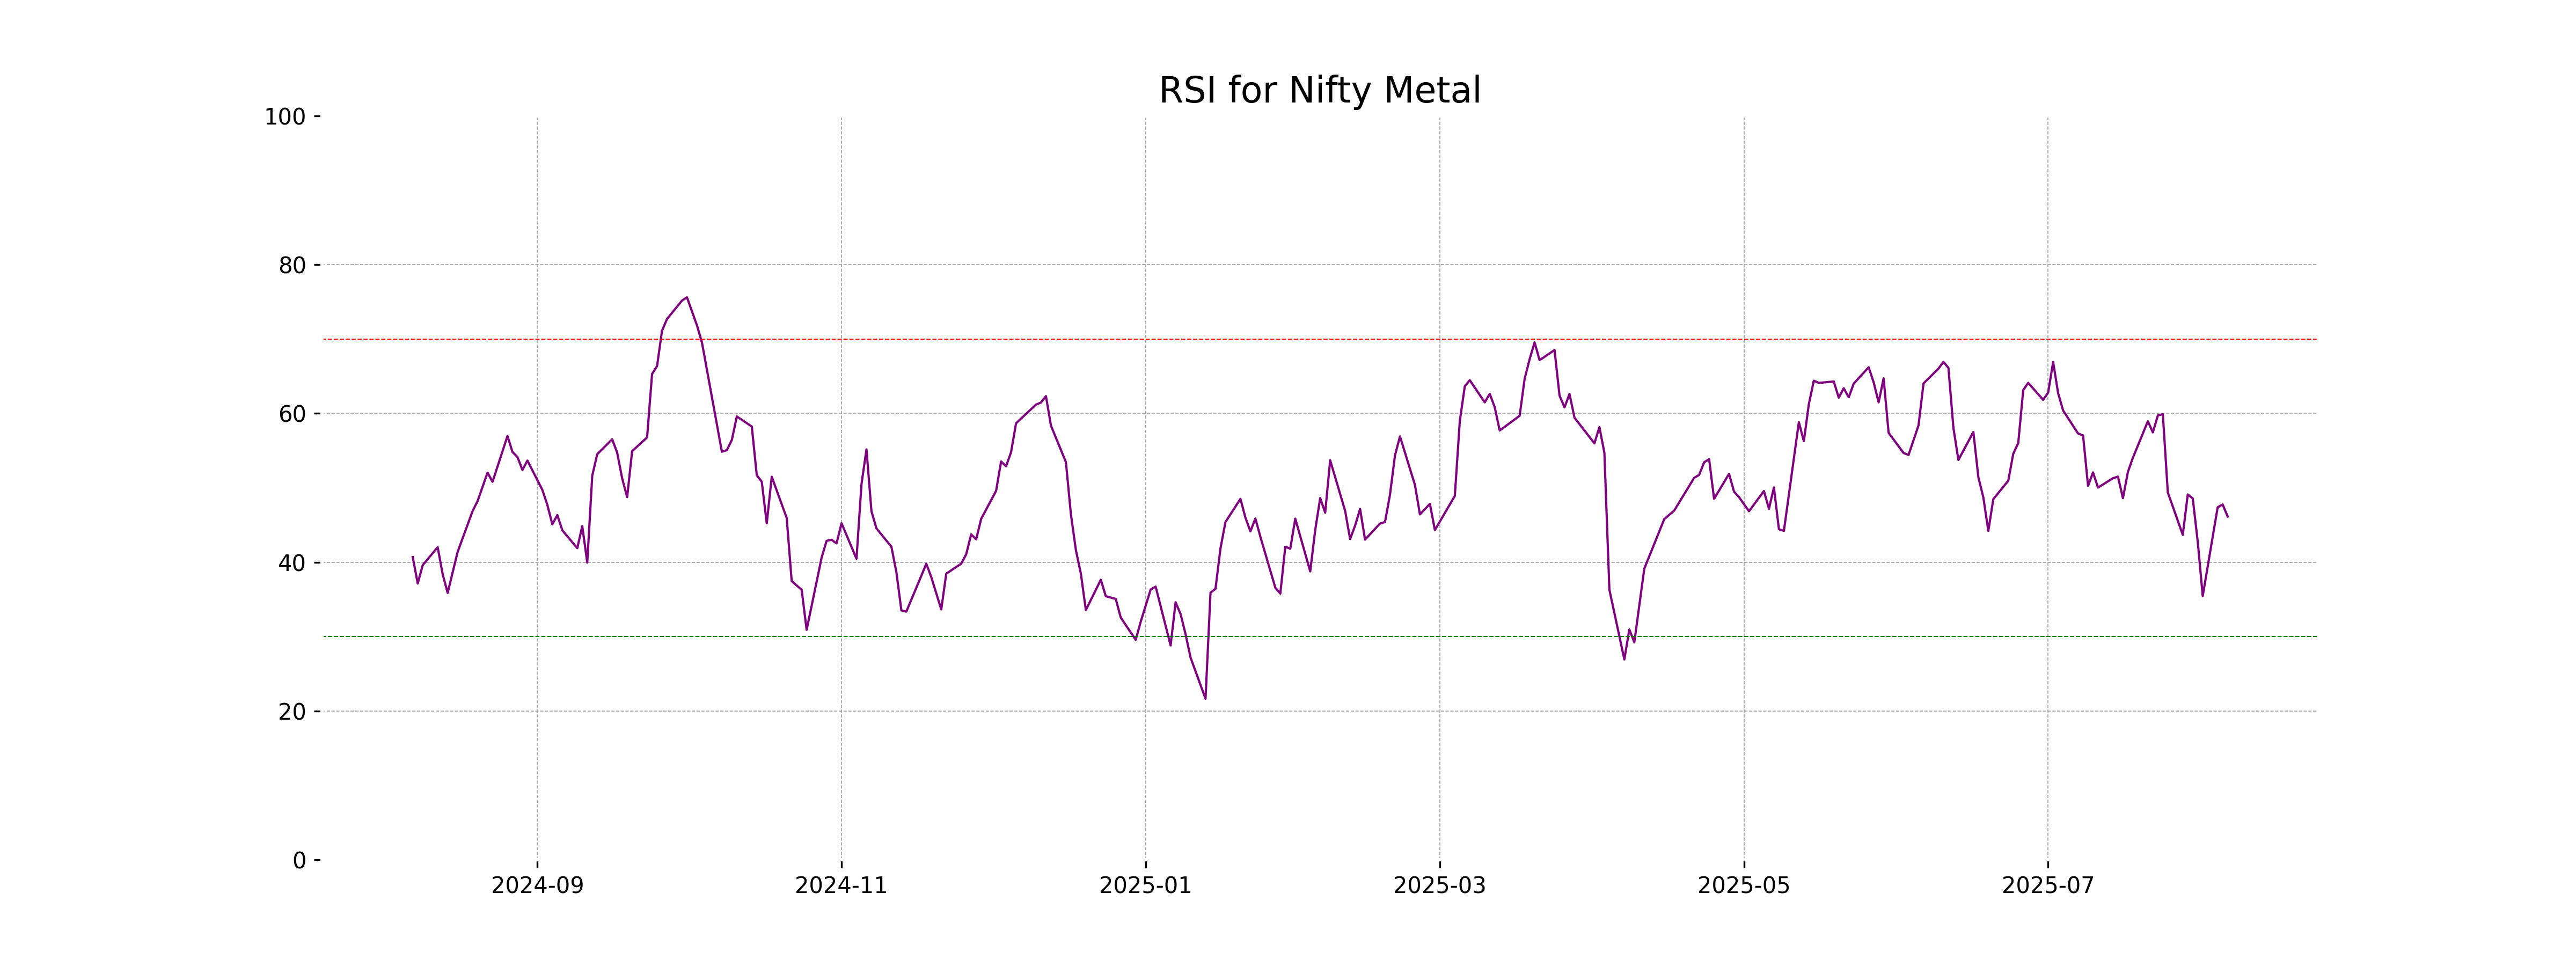
RSI Analysis
RSI Analysis for Nifty Metal: The Relative Strength Index (RSI) for Nifty Metal is 46.14, indicating a neutral momentum. This suggests that the index is neither overbought nor oversold, providing no strong directional signal.
Analysis for Nifty Bank - August 06, 2025
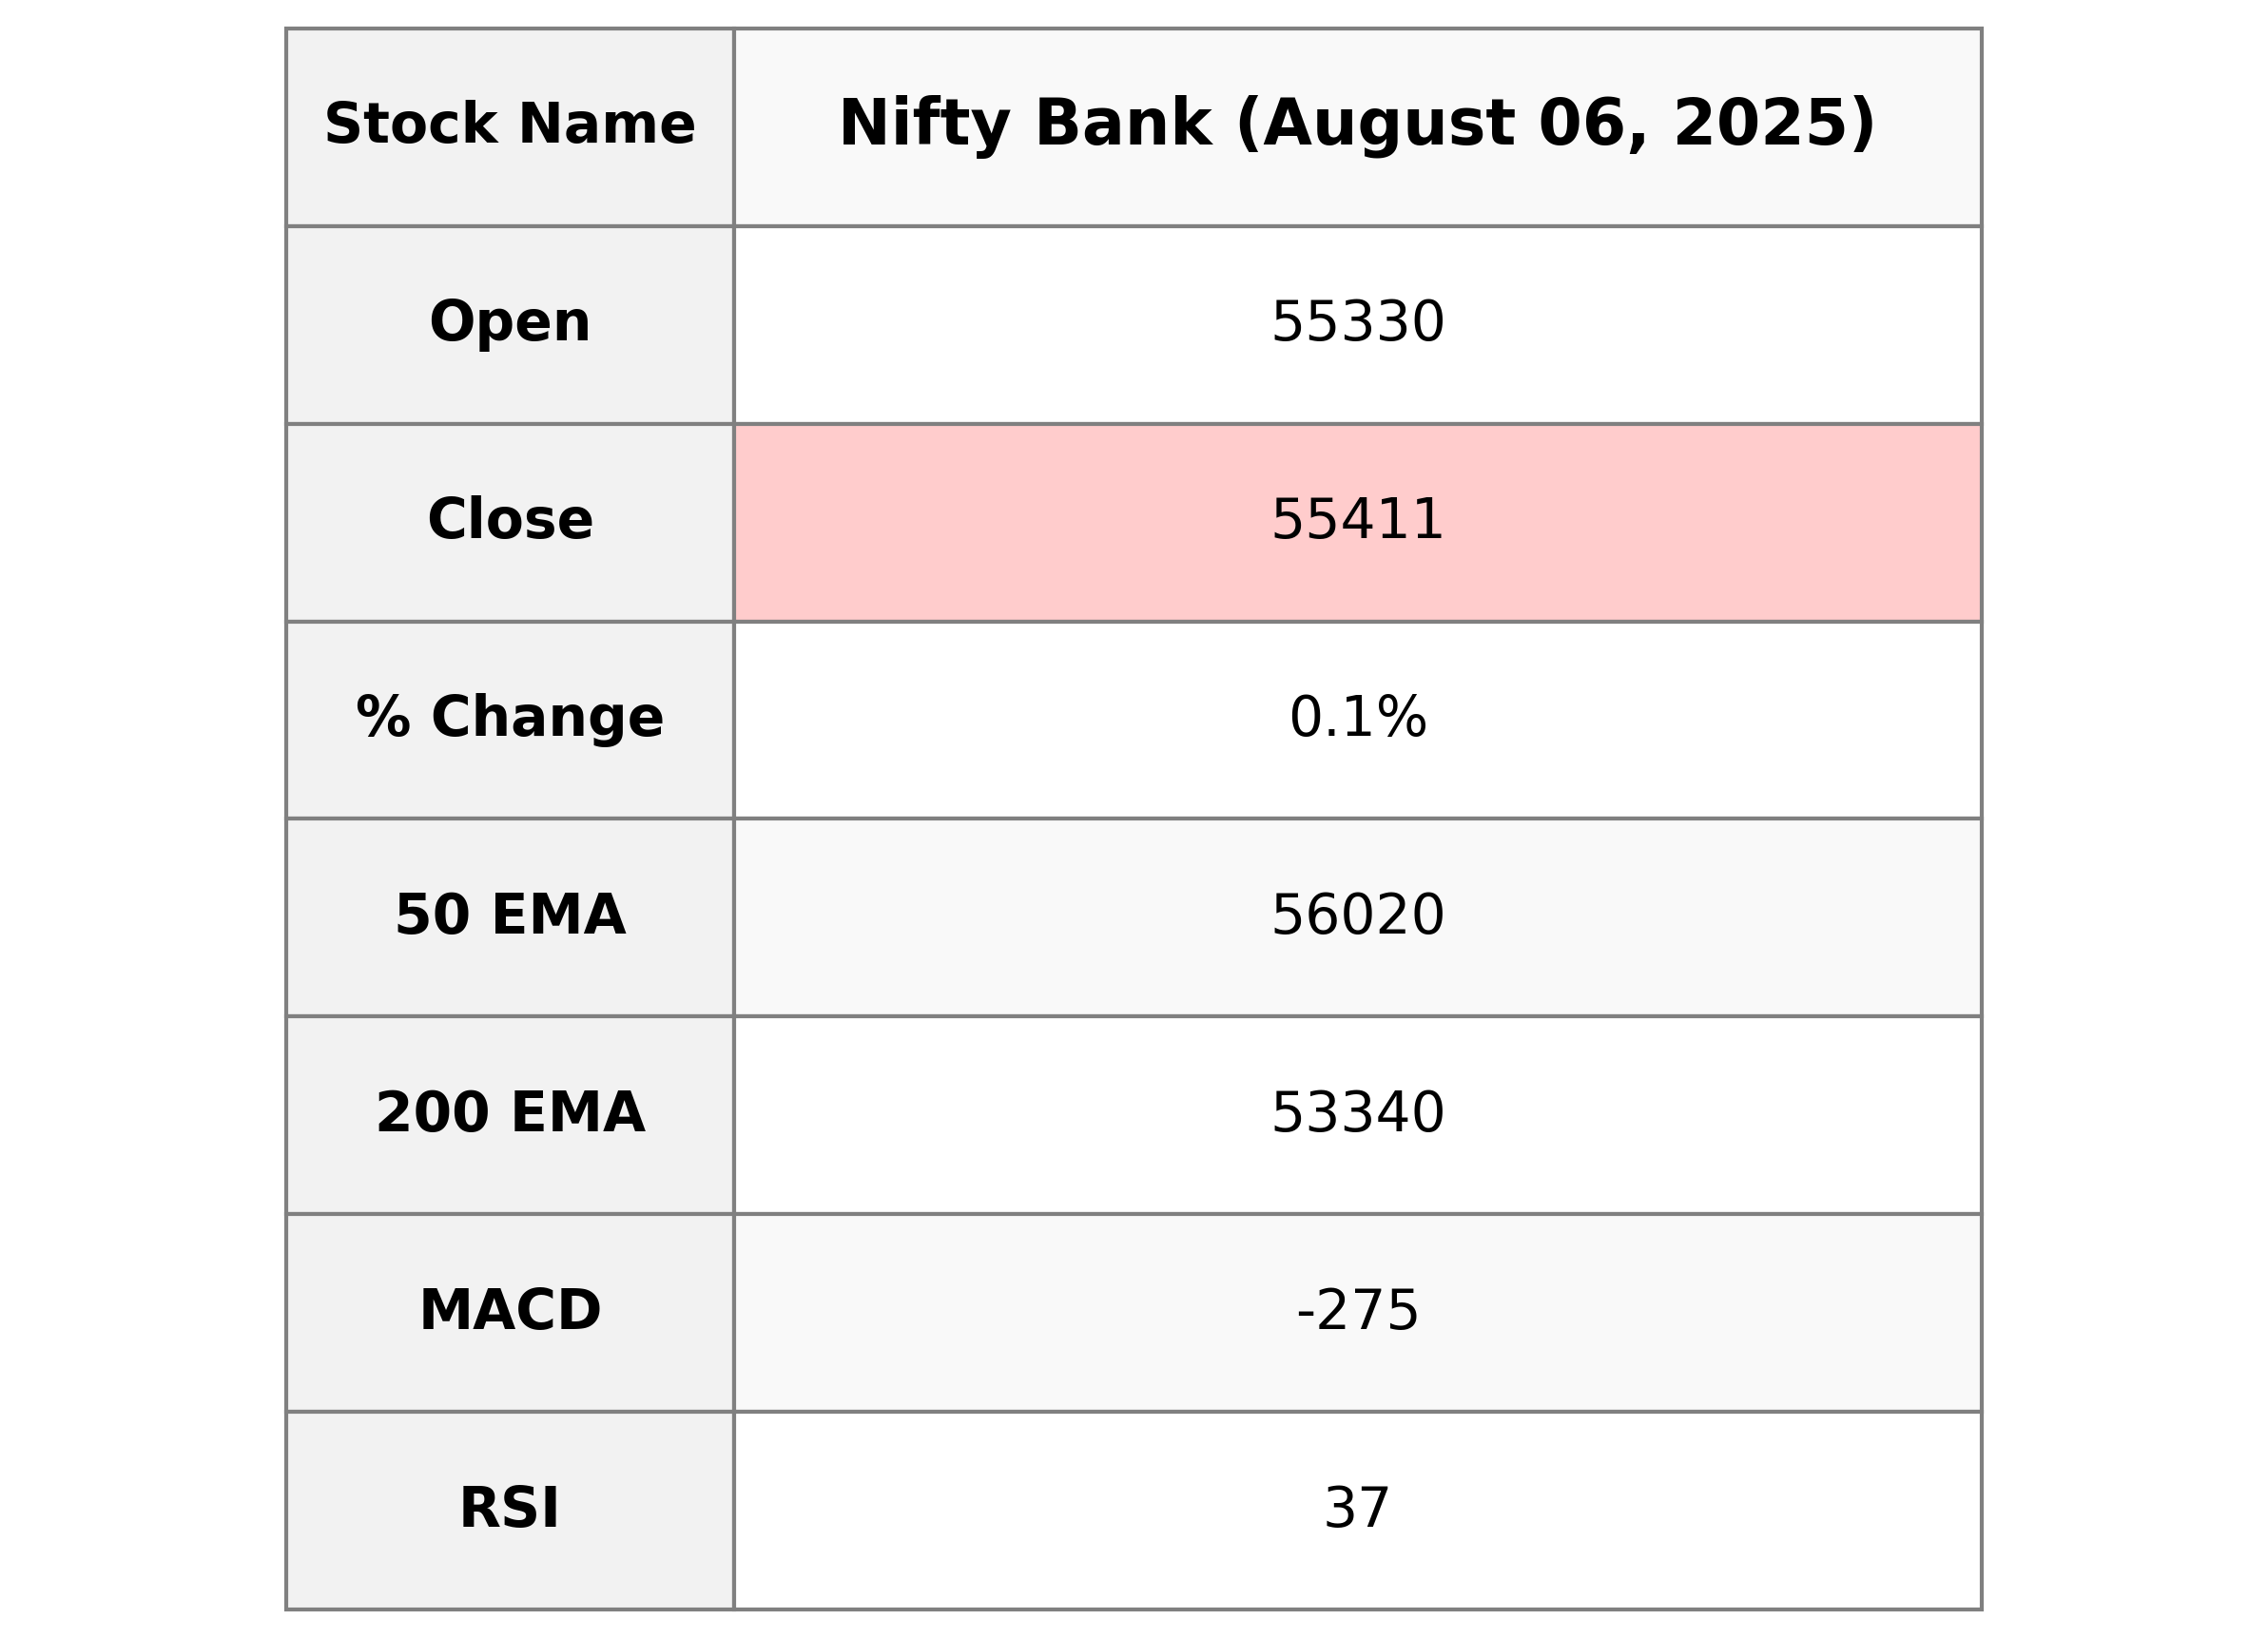
Nifty Bank opened at 55,329.80 and closed at 55,411.15, marking a slight increase with a % change of 0.09%, gaining 50.89 points. Despite a higher RSI suggesting potential undervaluation, the stock is trading below its key EMA averages, hinting at a bearish trend. The MACD is also negative, indicating downward momentum.
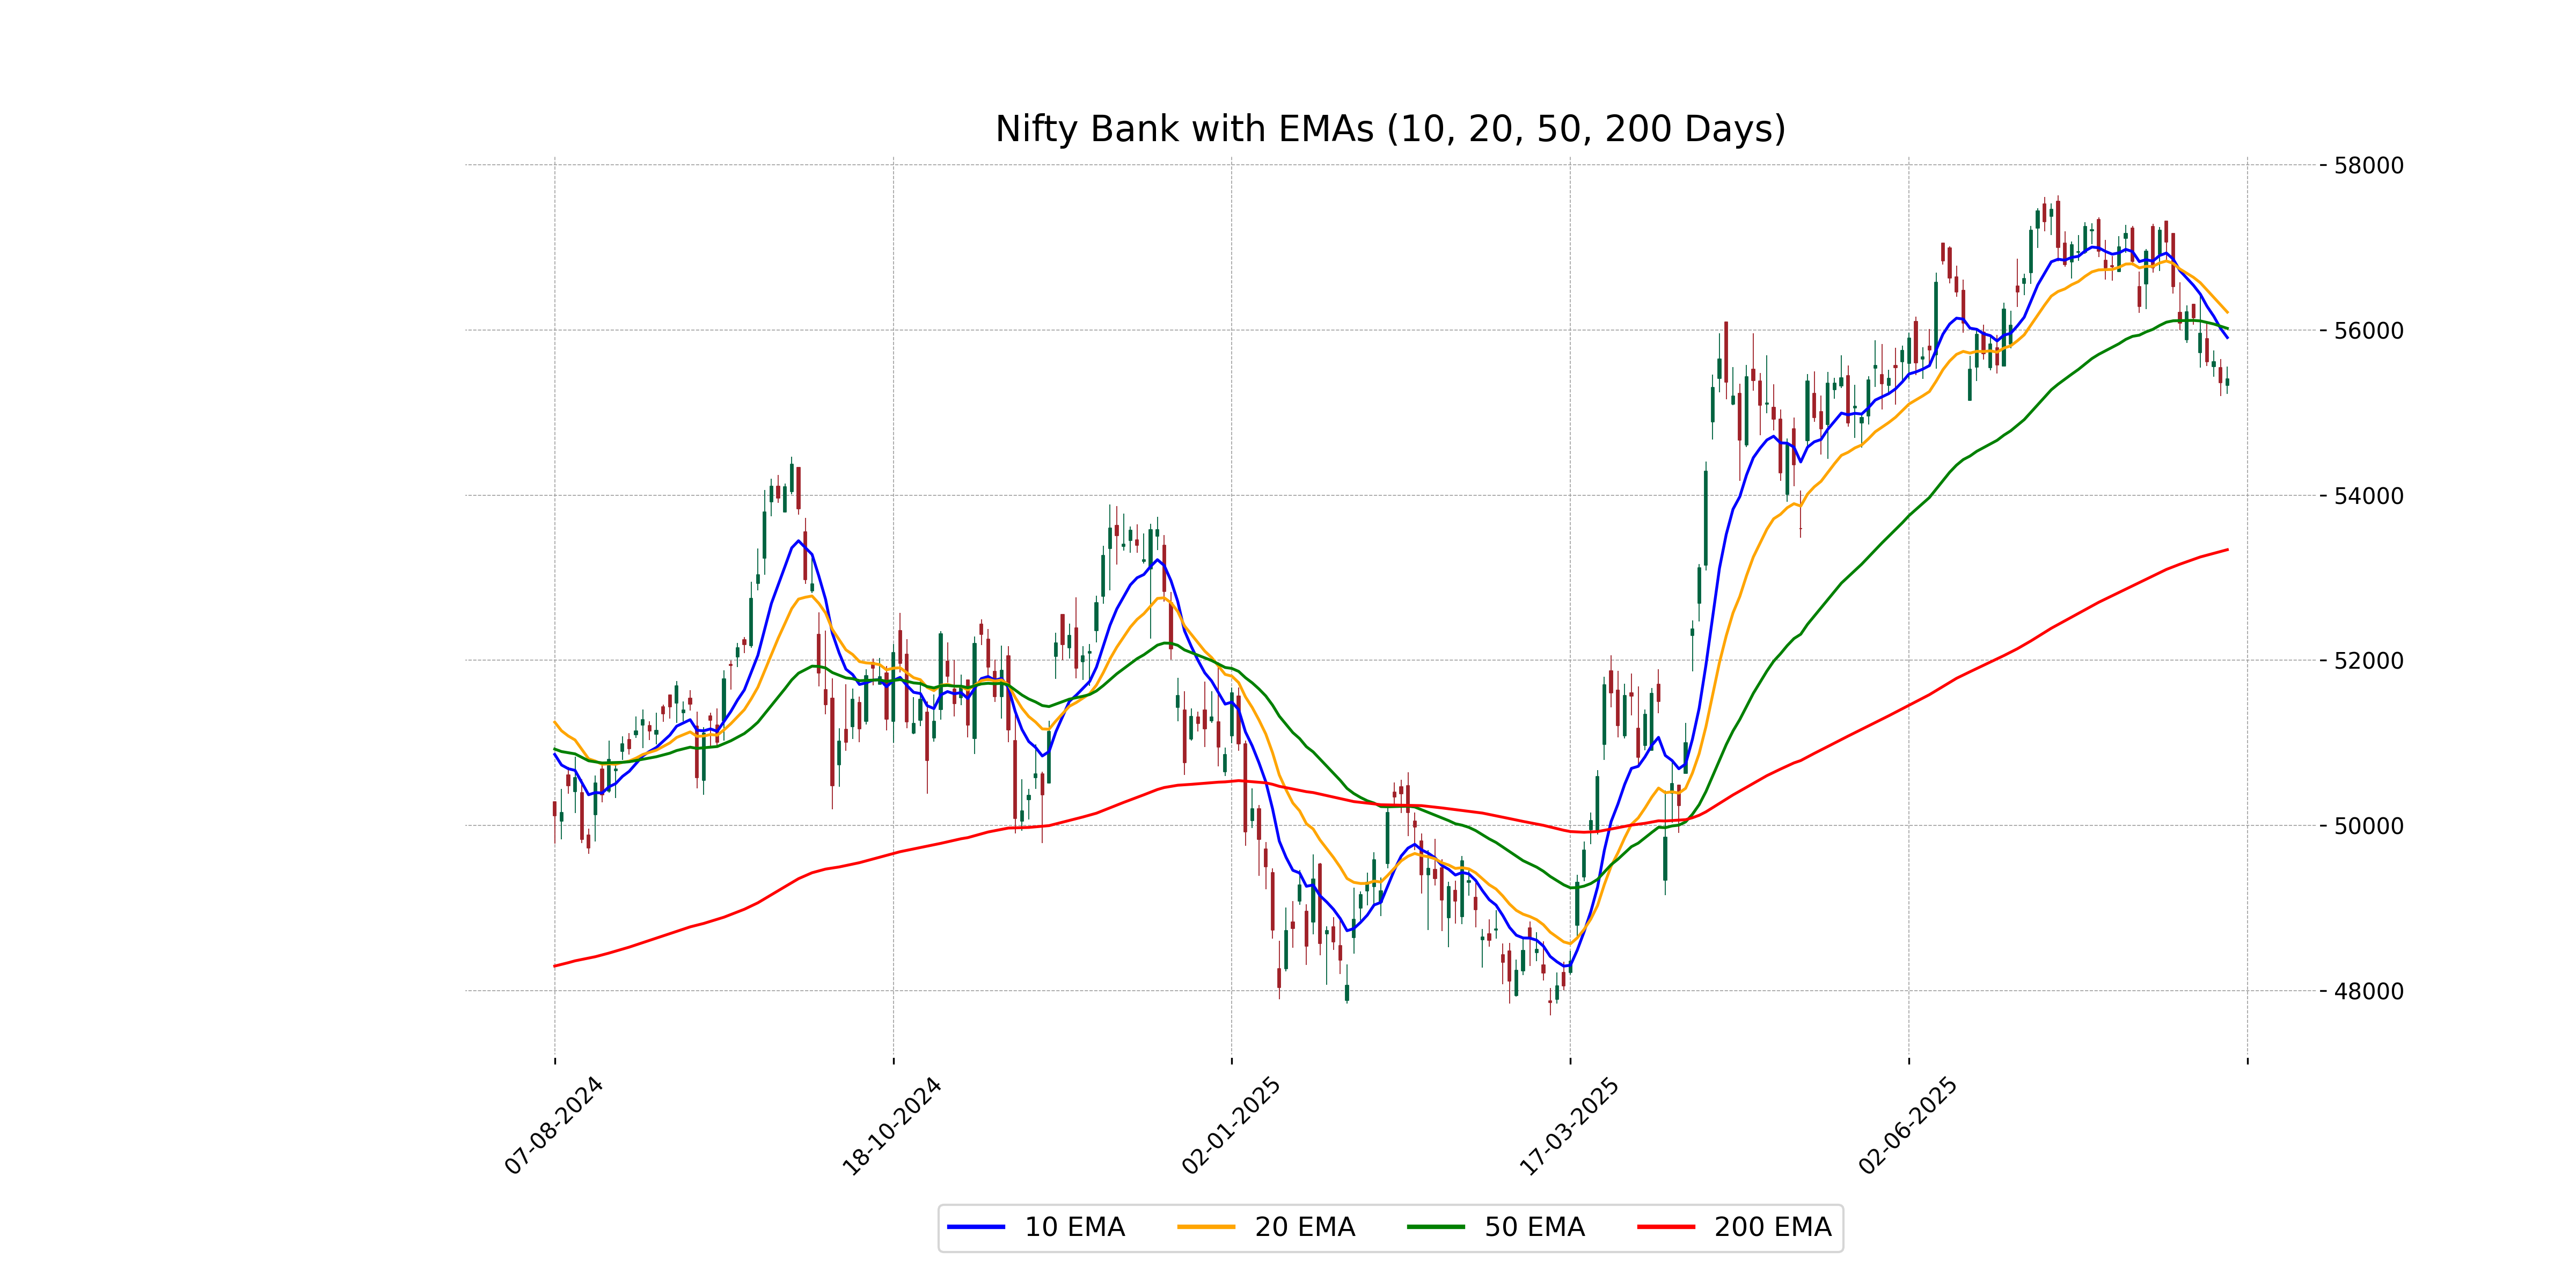
Relationship with Key Moving Averages
The Nifty Bank index closed slightly above its previous close with a % change of approximately 0.09%. It is currently trading below its 10 EMA, 20 EMA, and 50 EMA, indicating a bearish trend in the short to medium term. Additionally, the RSI is at 36.68, suggesting it is approaching oversold levels.
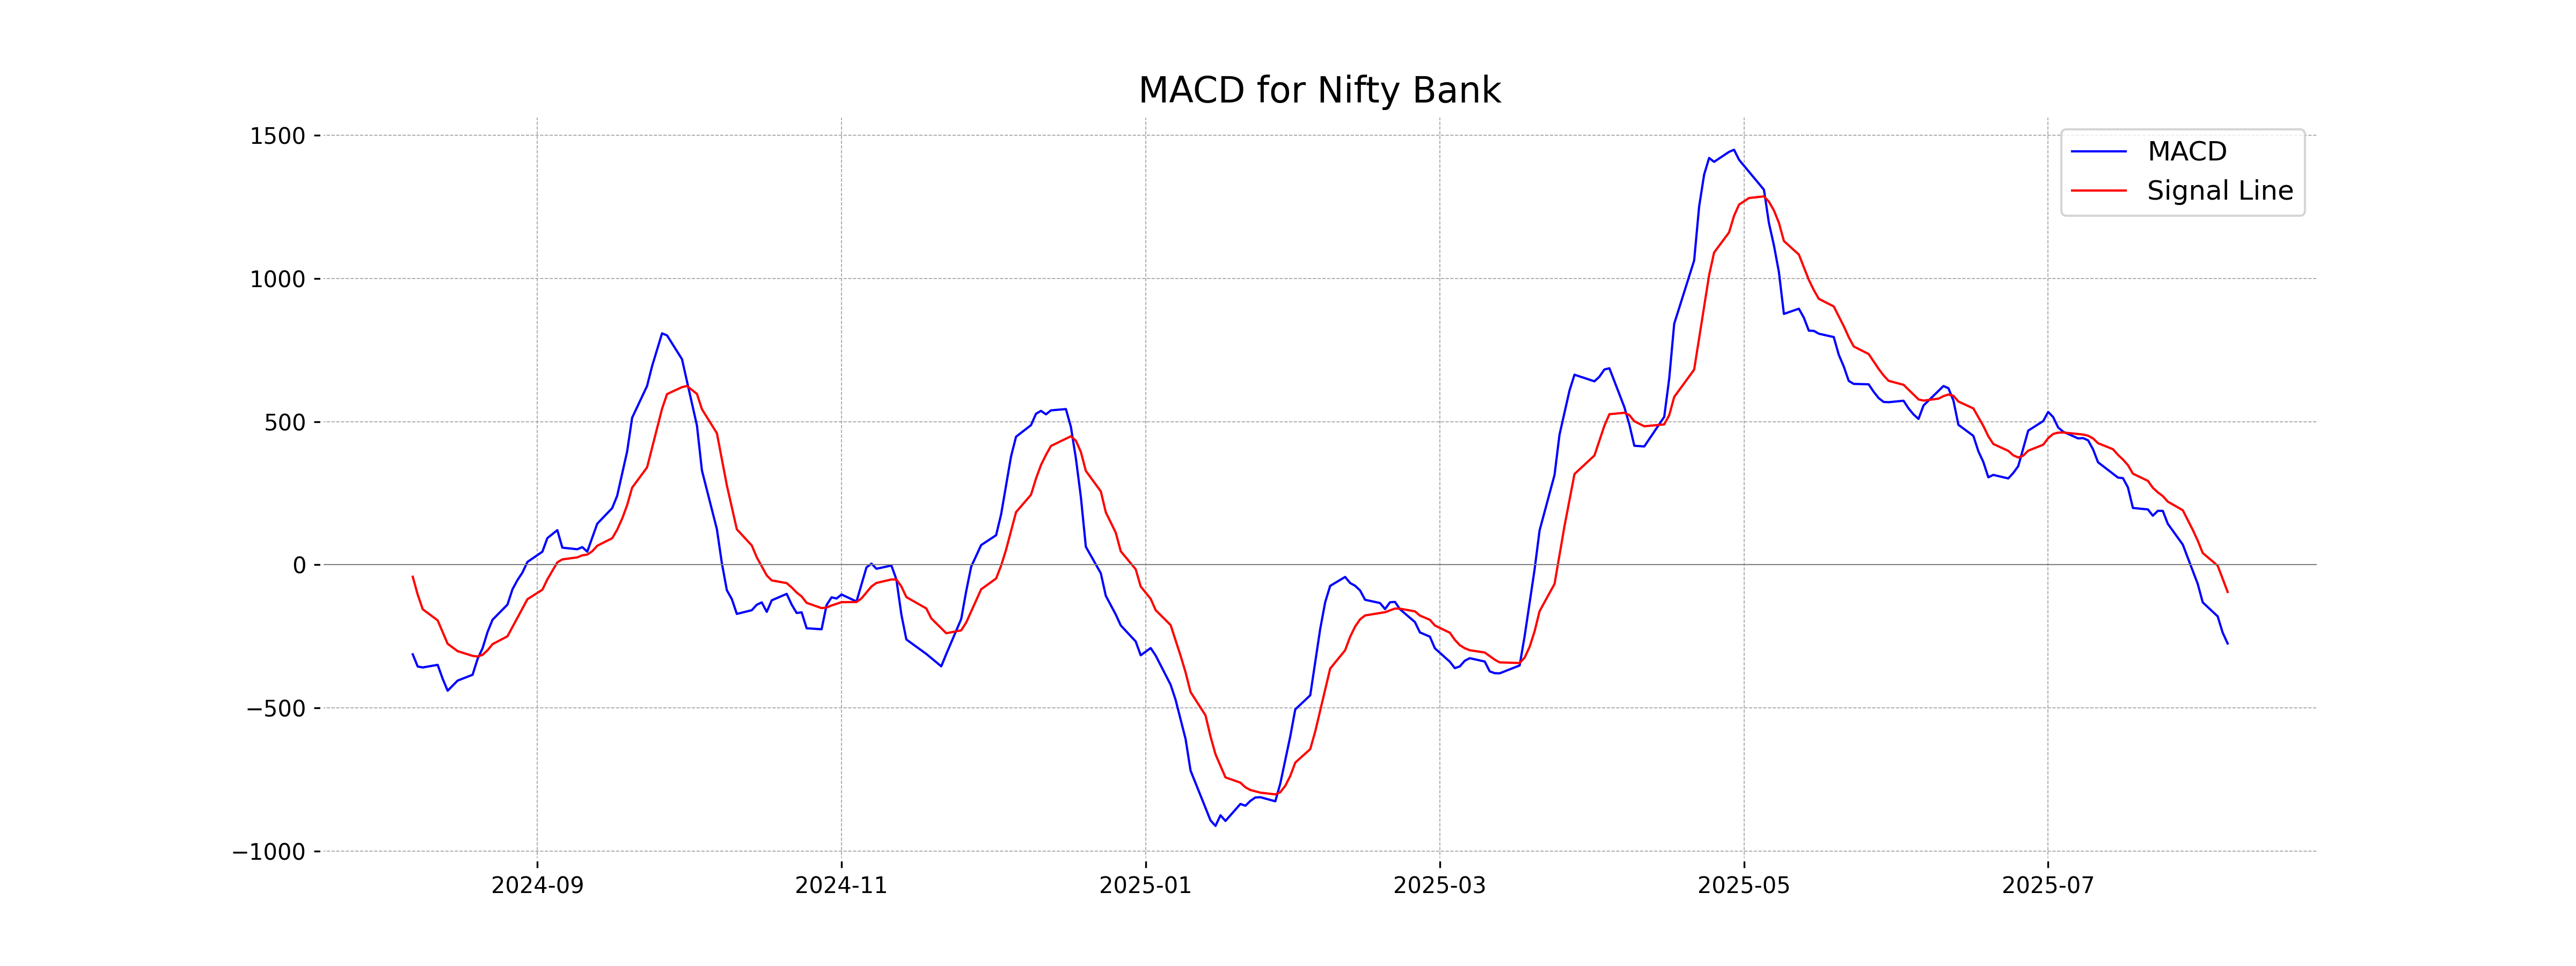
Moving Averages Trend (MACD)
MACD Analysis for Nifty Bank: The MACD value of -274.58, which is significantly below its signal line of -94.68, suggests a strong bearish trend. This indicates potential continued downward momentum in the Nifty Bank, as the MACD is in a negative territory pointing towards increased selling pressure.
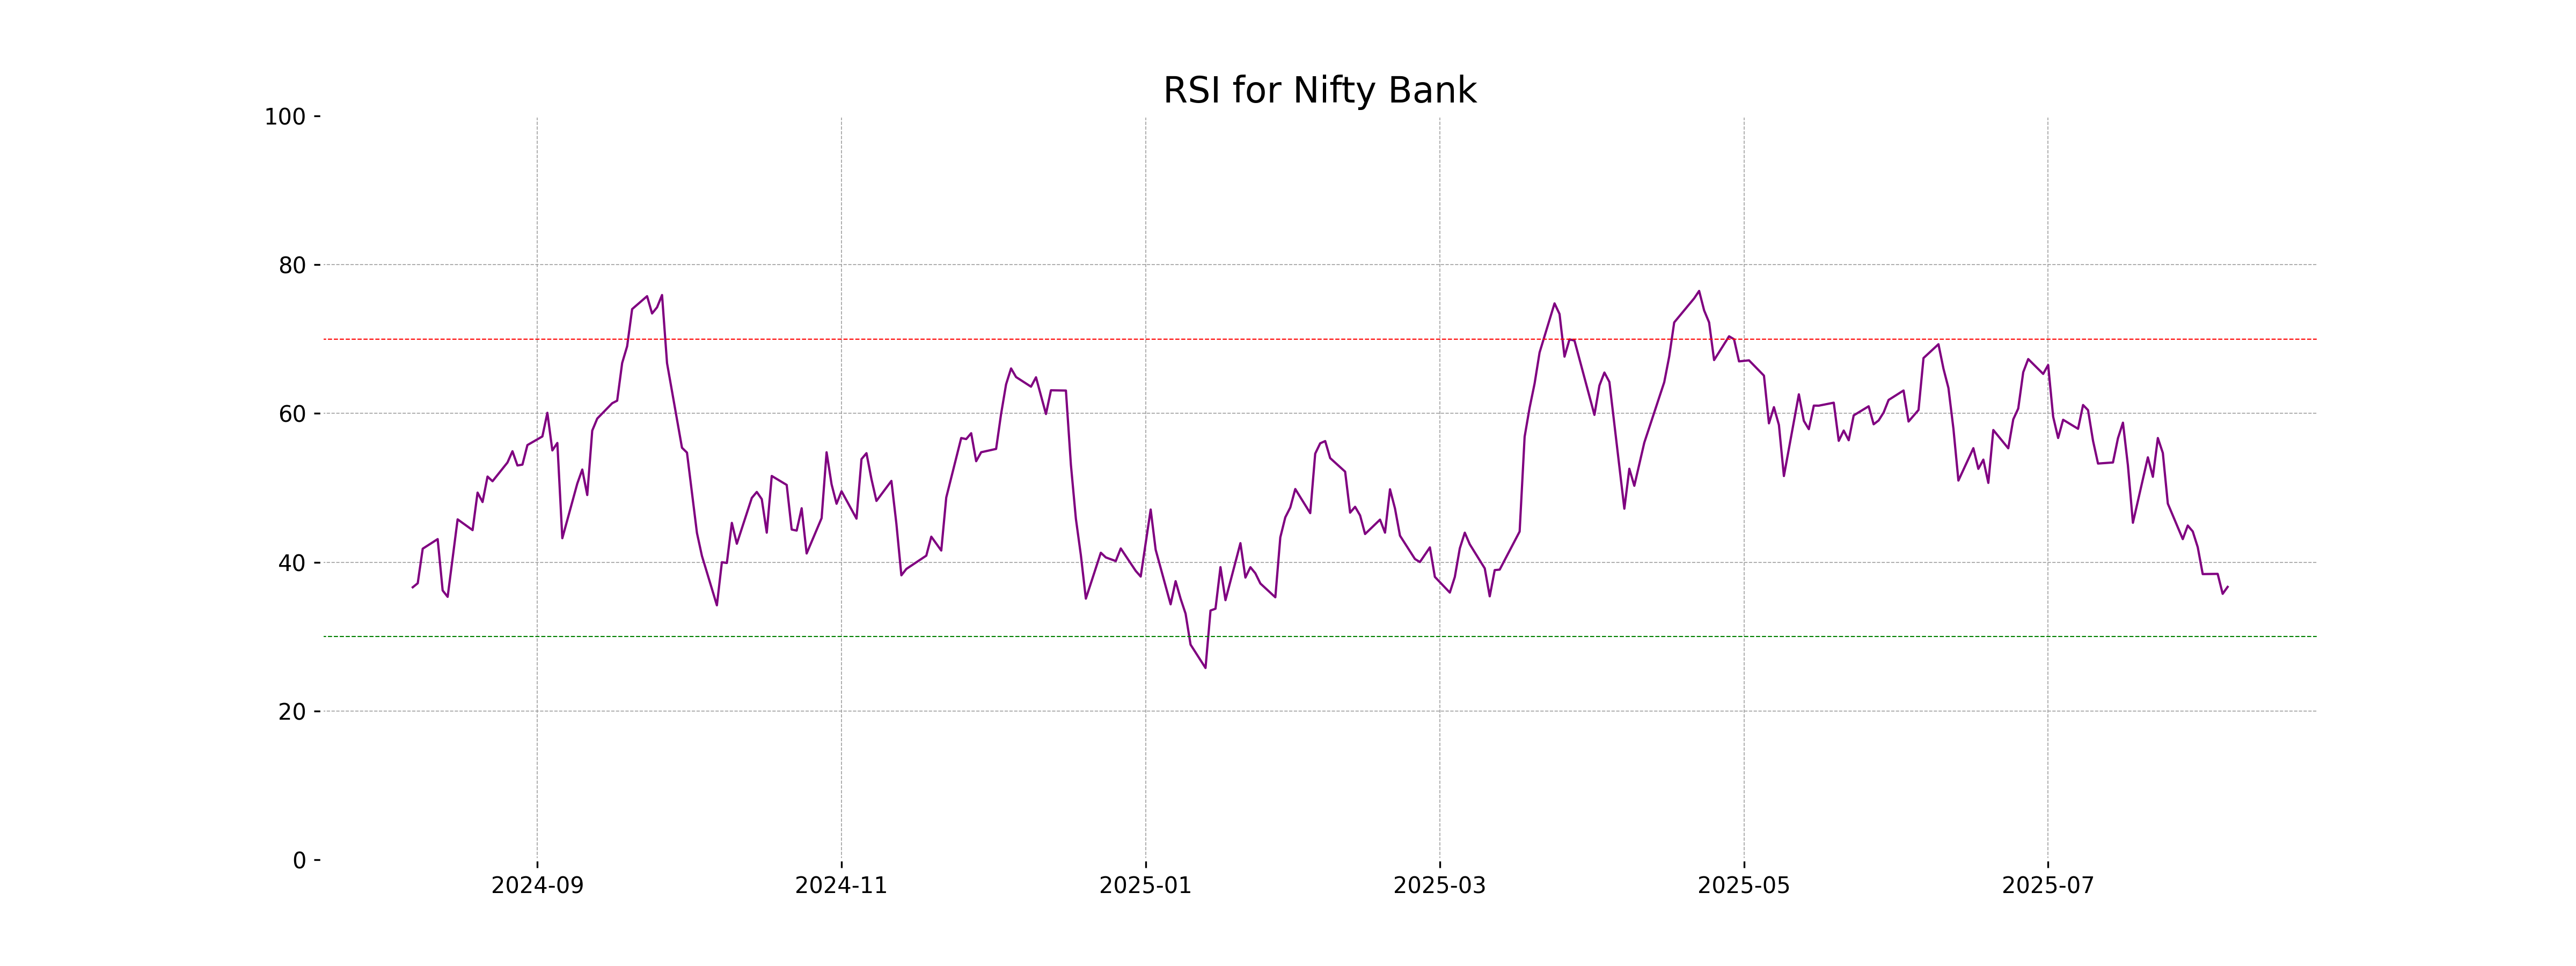
RSI Analysis
Nifty Bank's RSI is at 36.68, indicating that the index is nearing oversold conditions. This suggests potential for a reversal or bounce, as RSI levels below 30 typically indicate oversold opportunities. However, it's important to consider other indicators in conjunction with RSI for a comprehensive analysis.
Analysis for Nifty 50 - August 06, 2025
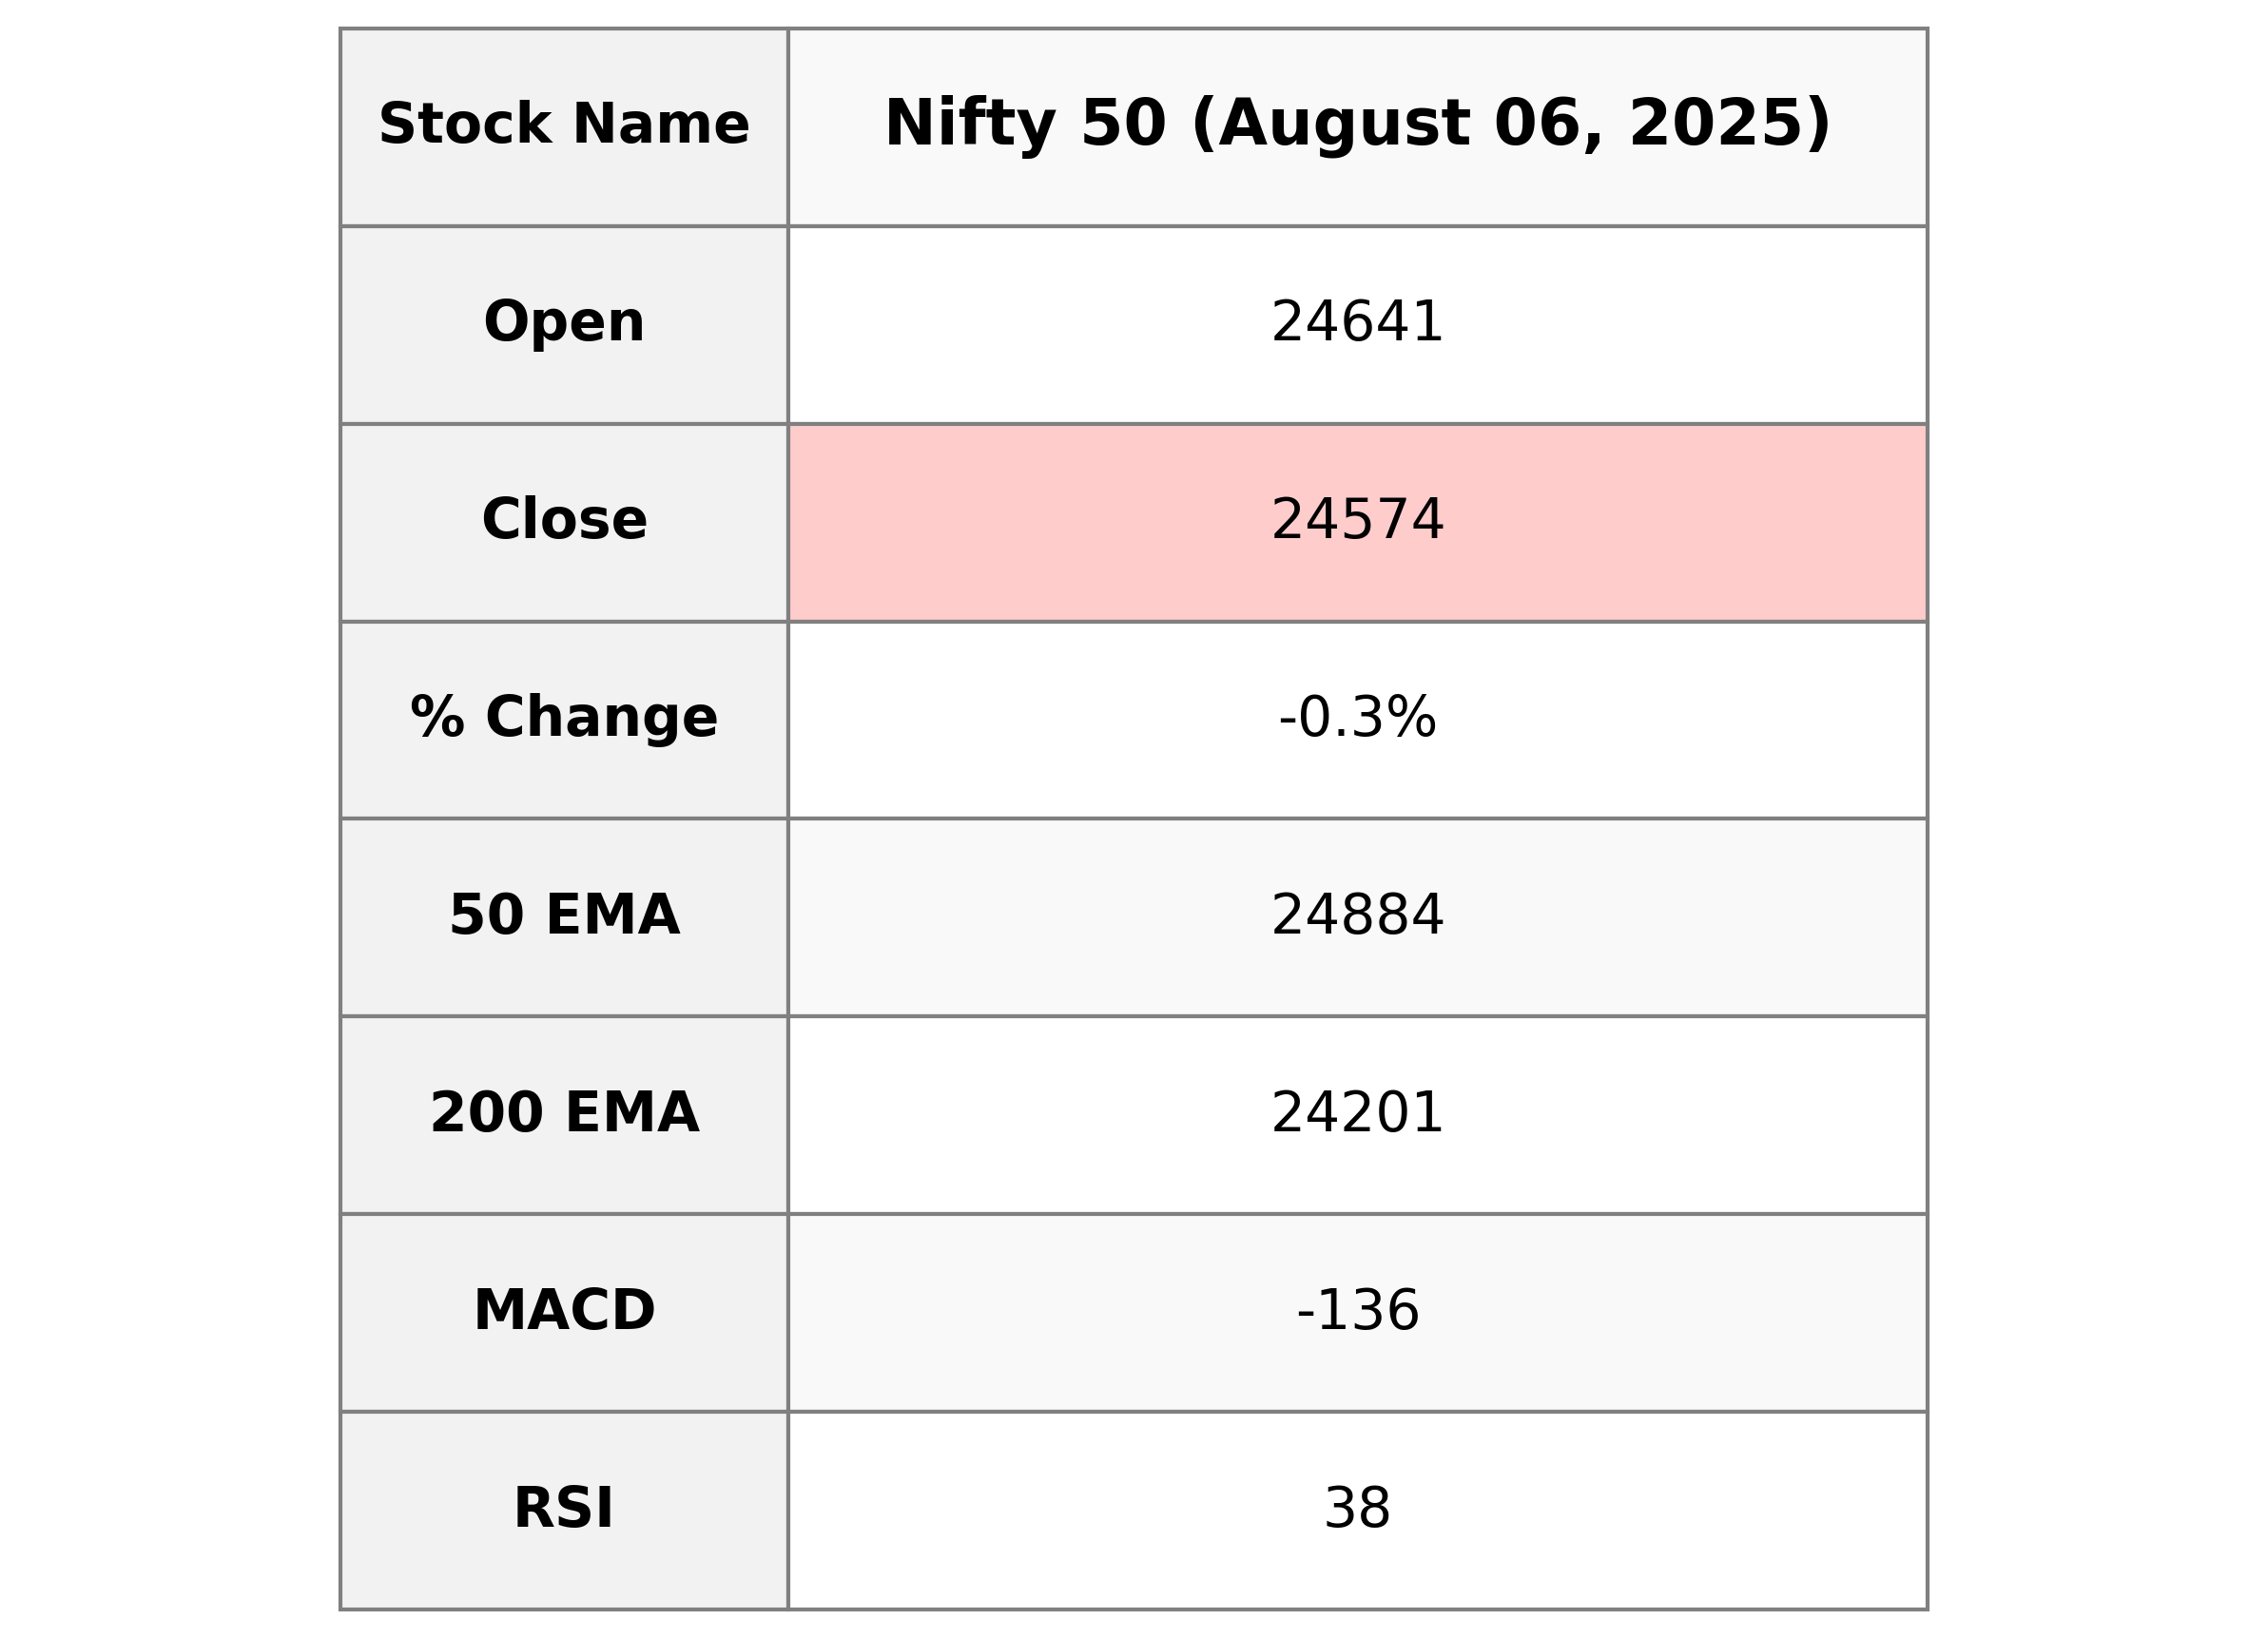
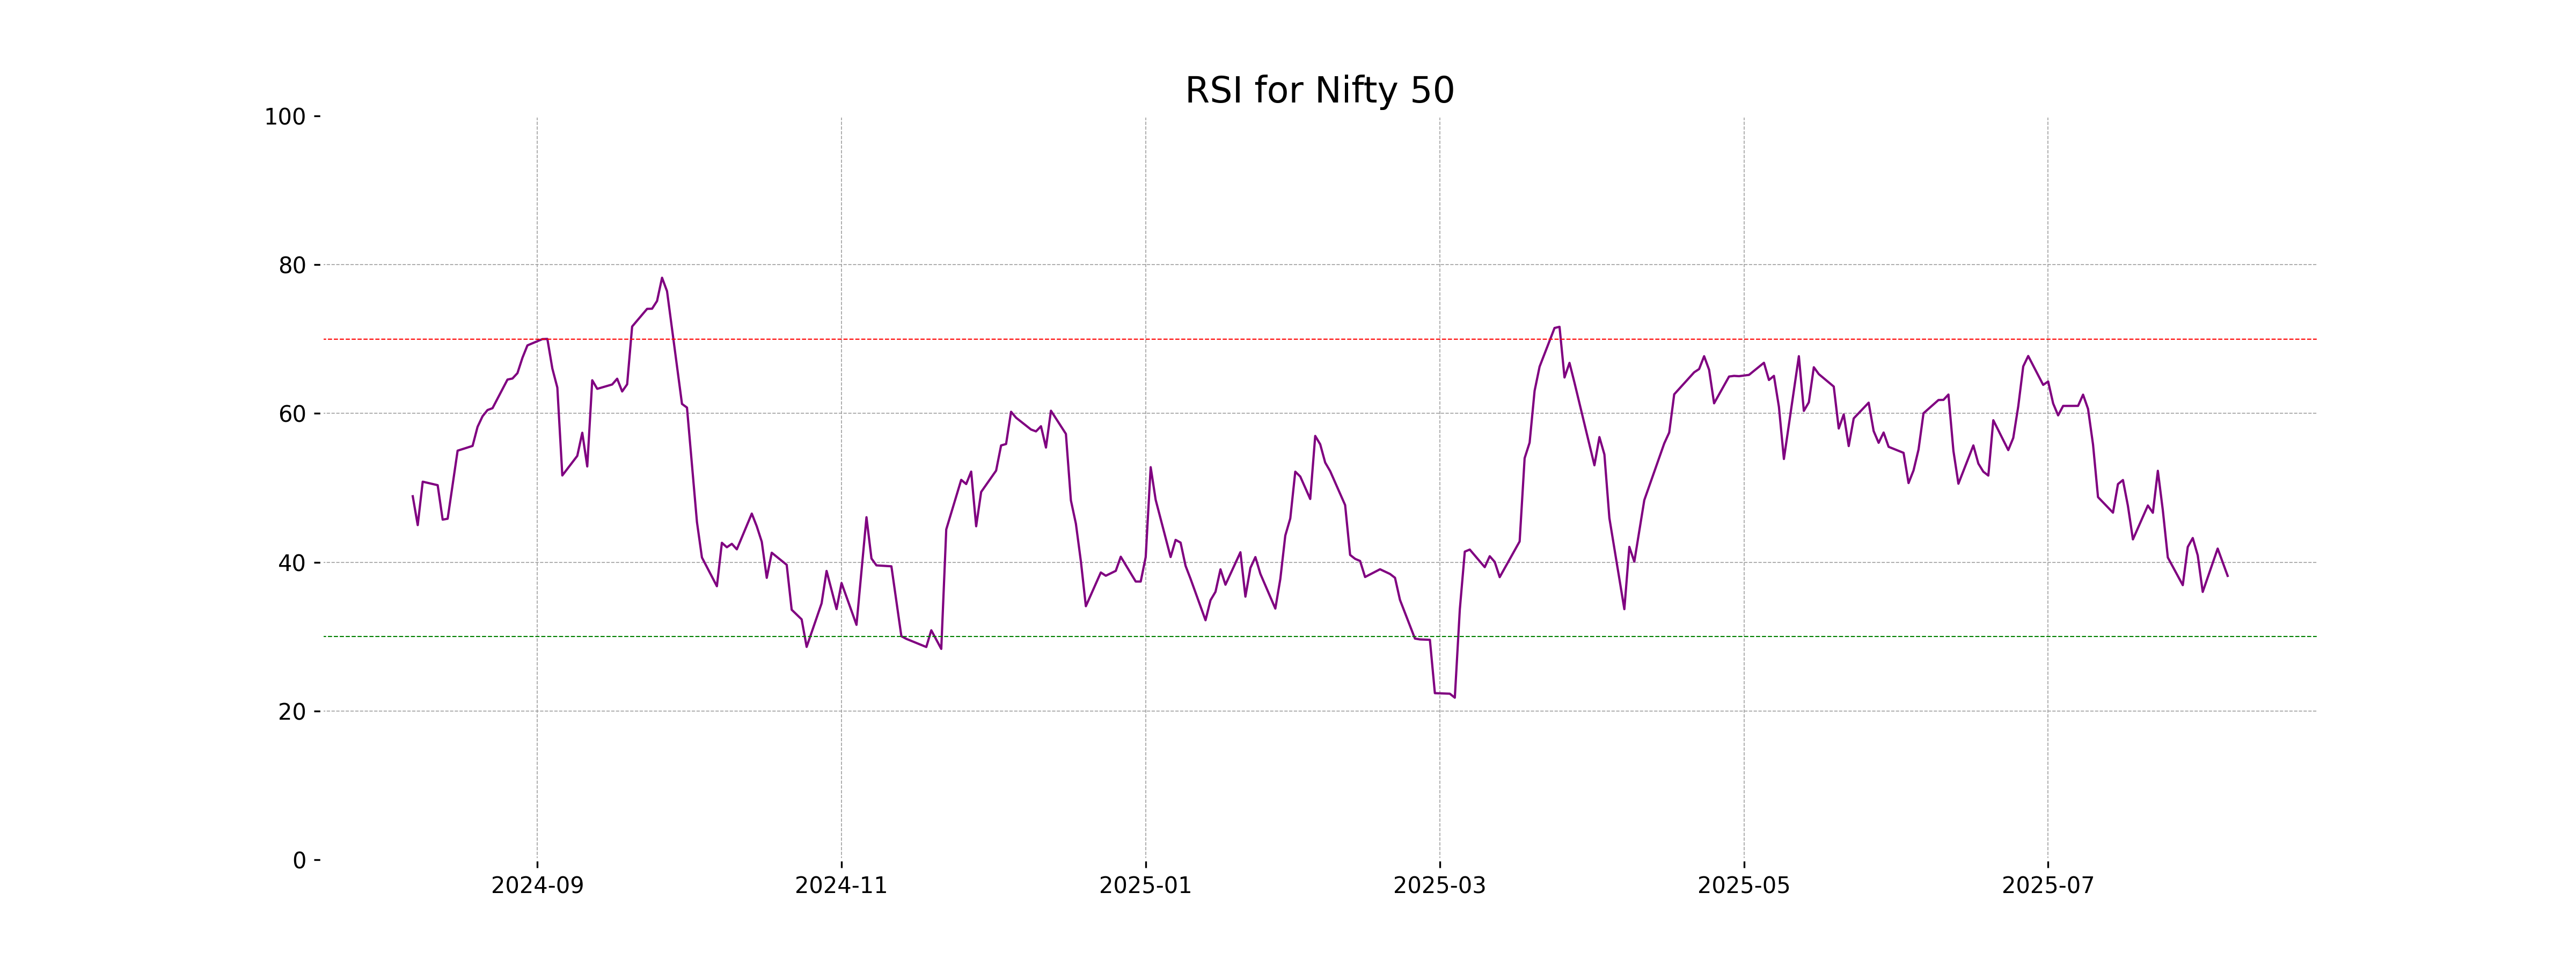
The Nifty 50 index opened at 24641.35 and closed at 24574.20, registering a decrease of 75.35 points or -0.31%. The Relative Strength Index (RSI) stands at 38.16, indicating a weaker market sentiment. The Moving Average Convergence Divergence (MACD) suggests a bearish trend, with the MACD line at -136.23, lower than the signal line at -84.40.
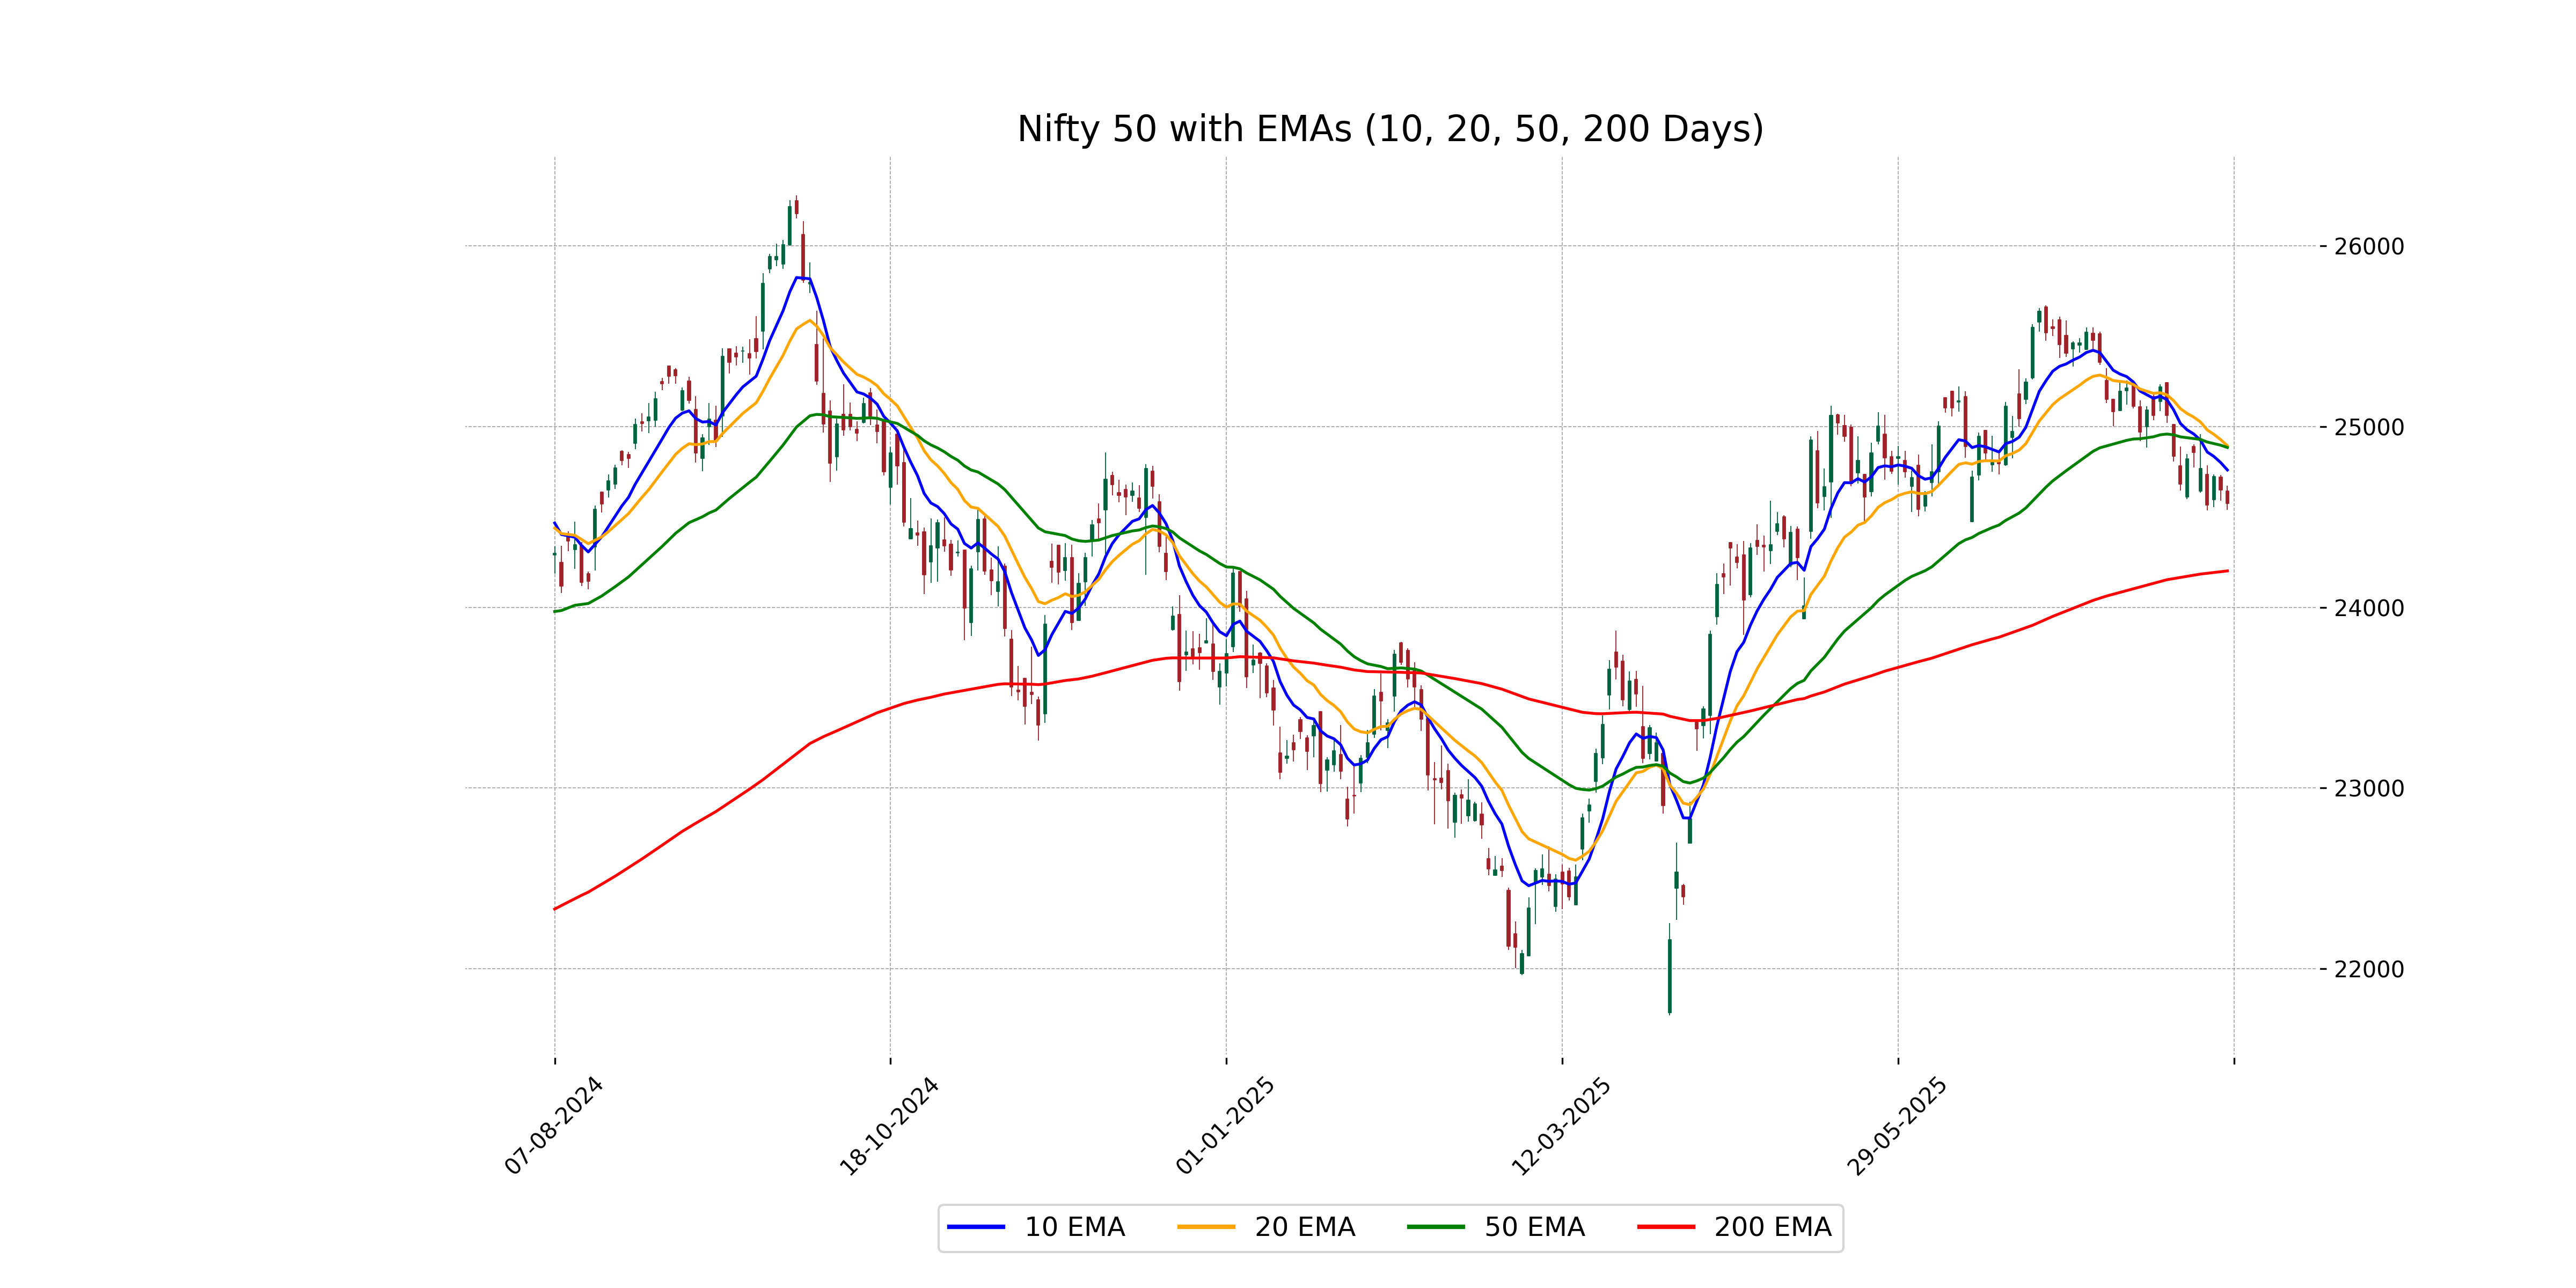
Relationship with Key Moving Averages
The Nifty 50 closed at 24,574.20, which is below all its key moving averages with the 50 EMA at 24,883.75, the 10 EMA at 24,759.27, and the 20 EMA at 24,893.40, indicating a bearish trend. The position of the price relative to these EMAs suggests potential downward momentum.
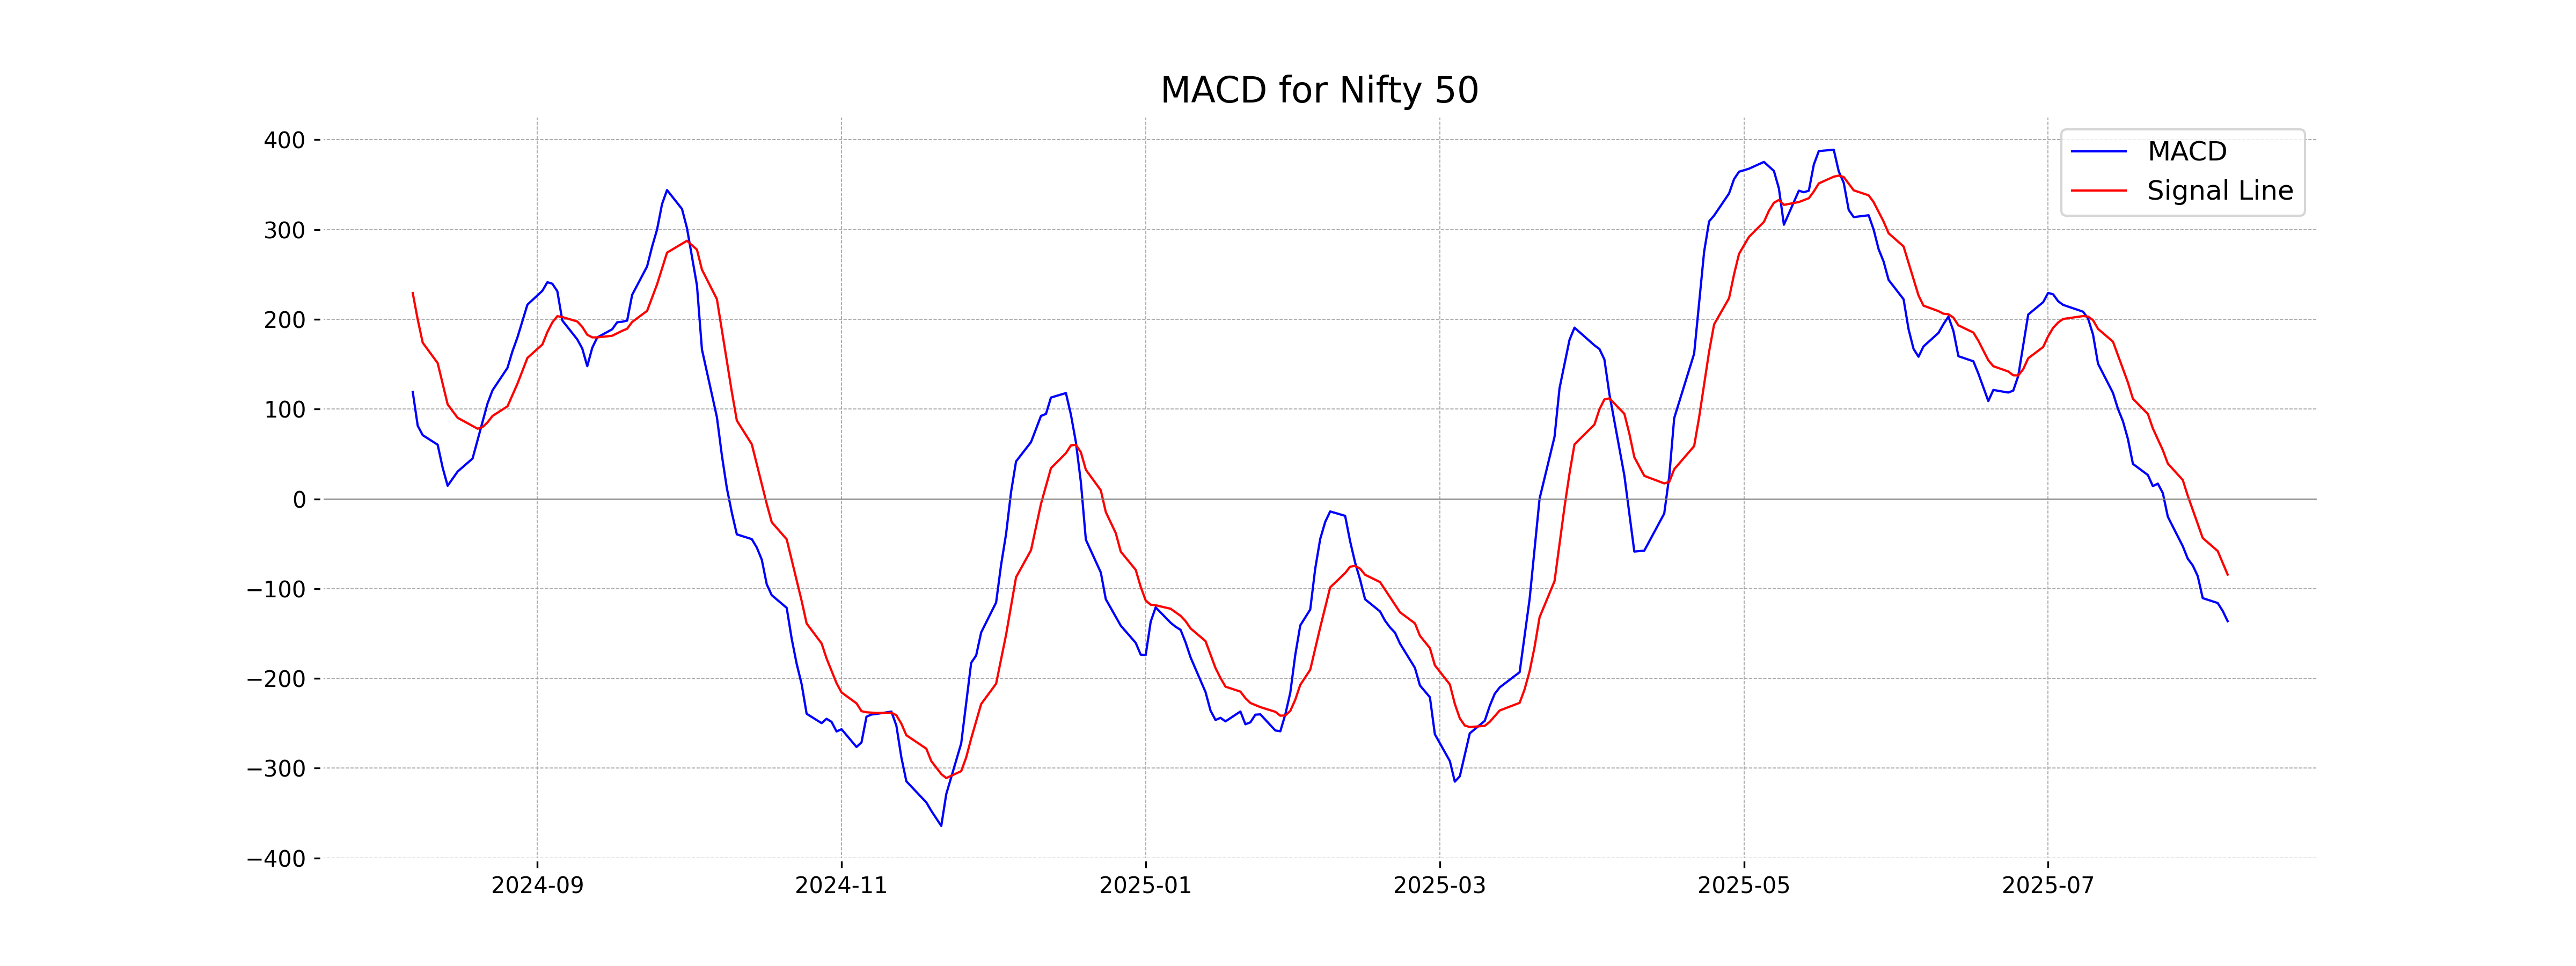
Moving Averages Trend (MACD)
The MACD analysis for Nifty 50 indicates a bearish momentum as the MACD line is below the signal line, with a value of -136.23 compared to the signal line at -84.40. This suggests a recent decline in the index's price, accompanied by bearish sentiment.
RSI Analysis
The relative strength index (RSI) for the Nifty 50 is 38.16. An RSI below 40 often suggests that the index is approaching oversold conditions, indicating potential for a price reversal or strengthening after a downward movement.