Indian stock market sector-wise performance today - April 29, 2025
The stock market on Tuesday (April 29, 2025) saw a mixture of performances across various sectors and indices.
The Nifty IT emerged as the standout performer with a notable increase of 1.23%. This positive movement indicates a strong interest and activity within the IT sector, possibly driven by positive earnings reports or strong forecasts from major IT firms.
The rise in Nifty IT contrasts with other sectors that faced challenges.
On the decline, the Nifty Metal experienced the most significant drop, falling by 0.95%. This decrease highlights the sector's struggle, possibly due to fluctuating commodity prices or weaker demand in the global markets affecting metal stocks.
The decline may also be attributed to broader concerns about economic slowdowns which typically impact industrial demand and commodity prices.
In parallel, the Nifty Energy and Nifty FMCG also recorded declines, with percentage changes of -0.29% and -0.26% respectively. While the Nifty Energy's dip may be influenced by volatile energy prices, the FMCG sector's decrease likely reflects cautious consumer spending.
The Nifty Bank reflected stability with a slight decrease of 0.07%, indicating a resilient performance amidst broader market fluctuations.
Similarly, the Nifty Infra maintained near stability with a minor positive change of 0.046%, suggesting confidence in infrastructural developments.
Despite varied performances, the Sensex (BSESN) exhibited marginal growth of 0.09%, demonstrating overall market resilience. Meanwhile, the auto sector, represented by Nifty Auto, dropped by 0.24%, perhaps impacted by uncertainties or subdued demand in the automotive market.
Overall, the mixed performance across sectors underscores the complex and dynamic nature of the stock market on this particular trading day.
The notable rise in the IT sector suggests that technological advancements and innovation continue to drive investor confidence, while the metal sector's sharp decline serves as a reminder of the challenges posed by external economic factors.

Analysis for Sensex - April 29, 2025

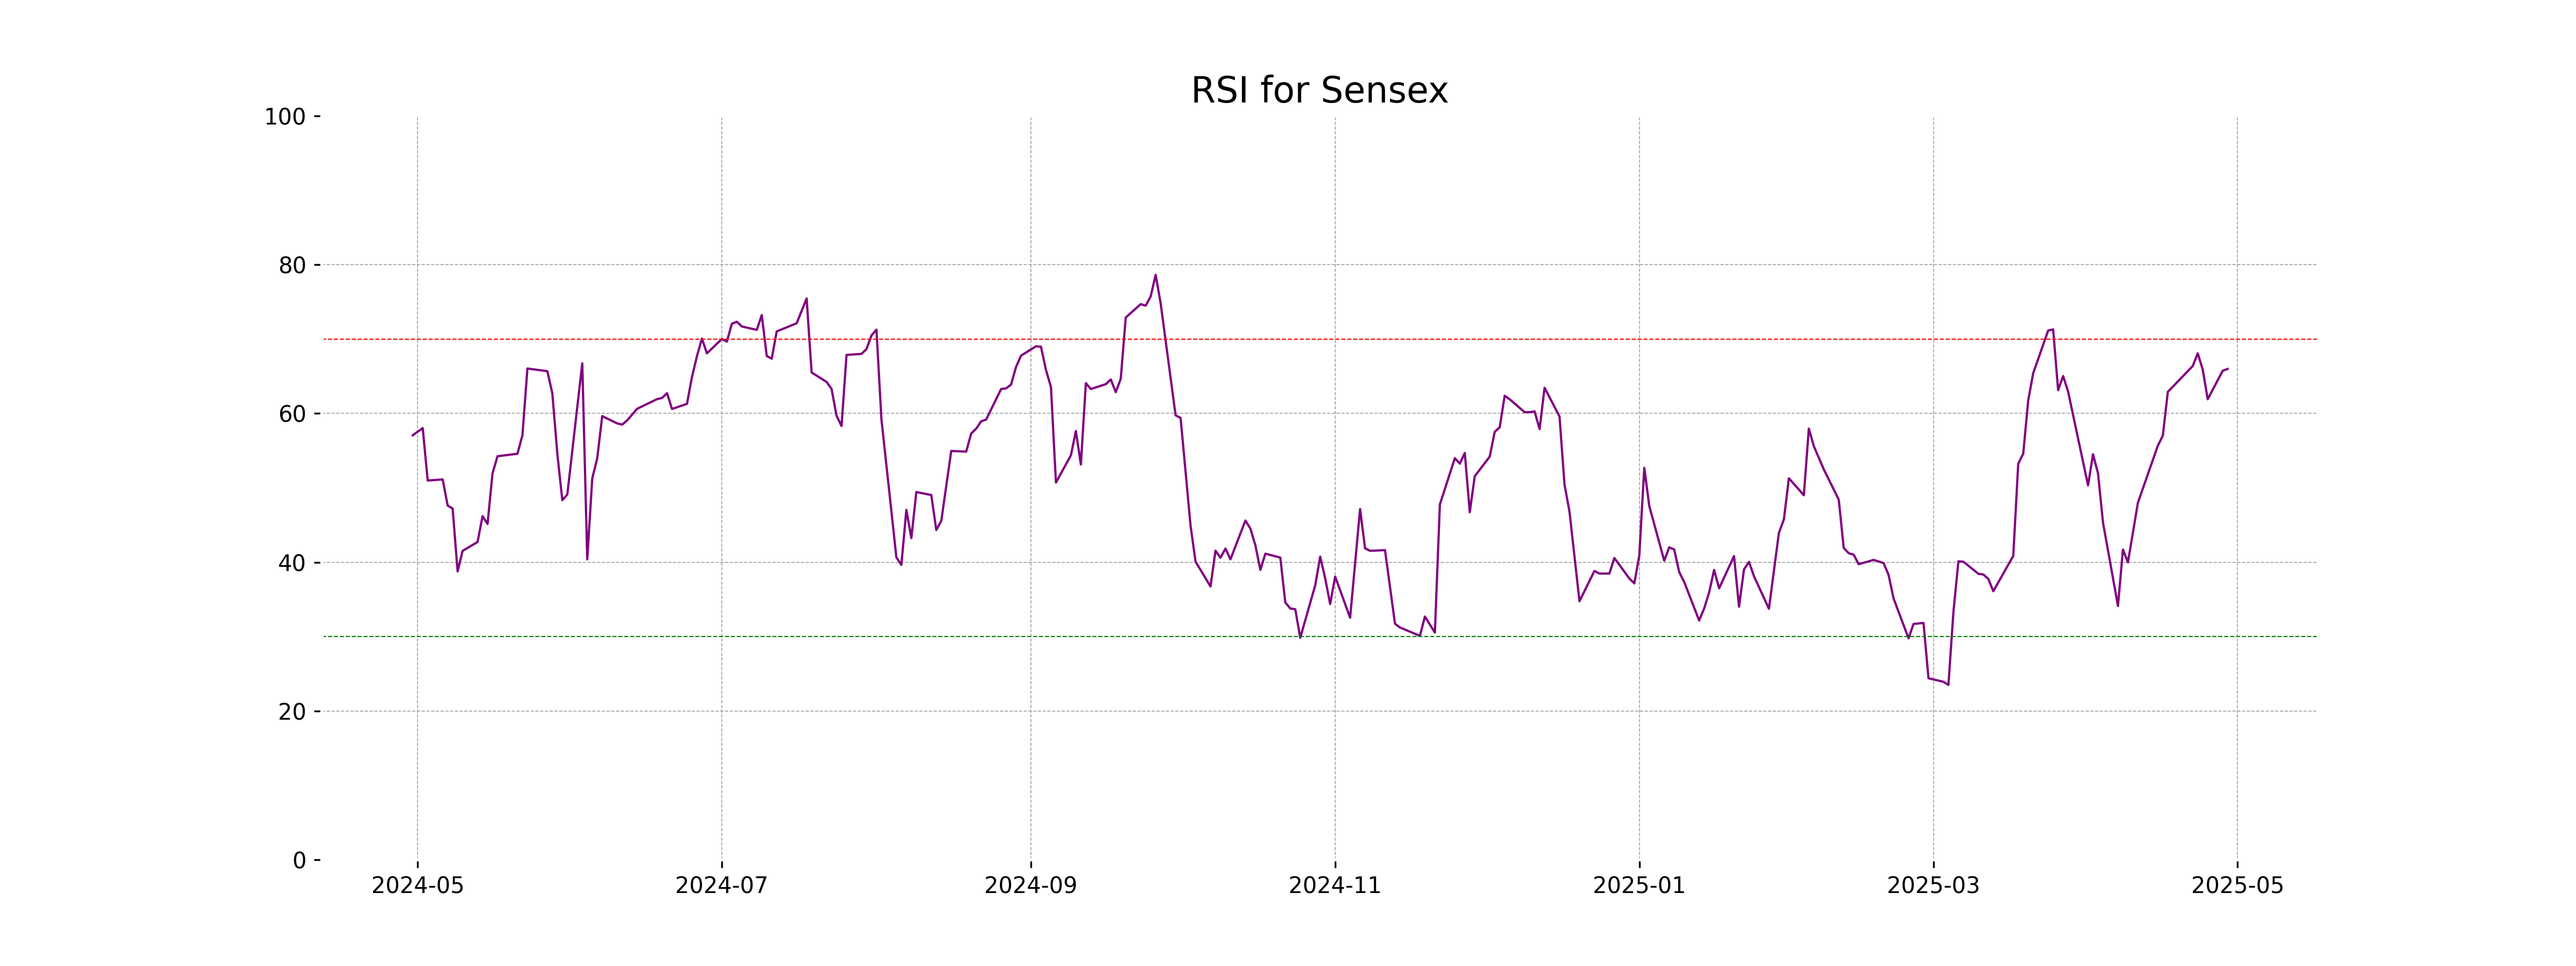
### Sensex Performance: The Sensex opened at 80,396.92 and closed slightly higher at 80,288.38, marking a marginal percentage change of 0.087% with a point gain of 70.02. The current RSI is 65.99, indicating momentum nearing an overbought region, while the MACD of 1175.36 suggests a bullish trend compared to its signal line at 797.72.

Relationship with Key Moving Averages
The current closing value of Sensex is above the 50 EMA, 200 EMA, 10 EMA, and 20 EMA, indicating a strong bullish trend in the short to long-term timeframes. The MACD is also above the MACD Signal line, suggesting continued positive momentum.
Moving Averages Trend (MACD)
MACD Analysis for Sensex: The MACD value of 1175.36 is significantly higher than the MACD Signal line value of 797.72, suggesting a bullish momentum for the Sensex. This indicates that the upward trend could continue in the near term.

RSI Analysis
The RSI for Sensex is 65.99, indicating that the market is approaching overbought conditions but is not yet in the overbought territory. This suggests that the stock price might continue to rise in the short term, although monitoring for any signs of an overbought reversal is advised.
Analysis for Nifty Auto - April 29, 2025

The Nifty Auto index closed at 22,299.05, marking a slight decrease of 0.24% compared to its previous close of 22,352.95, with a points change of -53.90. The index witnessed a high of 22,584.10 and a low of 22,216.55 during the trading session. Currently, key indicators such as the 50-day EMA stand at 21,653.53 and the 200-day EMA at 22,523.88. The RSI is positioned at 60.69, indicating moderate strength in momentum.

Relationship with Key Moving Averages
The closing price of Nifty Auto is positioned below the 200 EMA of 22523.88 but slightly above the 50 EMA of 21653.53, indicating a potential short-term bullish trend within a longer-term bearish context. The close is also above the 10 EMA and 20 EMA, suggesting short-term upward momentum.
Moving Averages Trend (MACD)
Nifty Auto's MACD stands at 262.41 with a MACD Signal of 90.07, indicating a positive momentum as the MACD is above its signal line. This suggests that the current trend might continue as the MACD is showing a bullish divergence.

RSI Analysis
Nifty Auto's Relative Strength Index (RSI) is at 60.69, indicating that the stock is currently in a neutral to moderately bullish zone. Typically, an RSI below 30 is considered oversold, while above 70 is considered overbought. With the current RSI, it suggests that the index is neither overbought nor oversold.

Analysis for Nifty Energy - April 29, 2025

Nifty Energy opened at 34,656.90, reaching a high of 34,889.55 and a low of 34,352.25, before closing at 34,438.75. Compared to the previous close of 34,538.85, the index saw a slight decline of 0.29% or 100.10 points. With a Relative Strength Index of 59.56, Nifty Energy seems to be in a relatively neutral position, neither oversold nor overbought, while the MACD indicates a bullish sentiment as it is above the signal line.

Relationship with Key Moving Averages
Nifty Energy closed at 34,438.75, situated between its 50-day EMA of 33,215.35 and its 200-day EMA of 35,492.01, indicating a short-term uptrend within a broader long-term downtrend. The 10-day EMA at 34,089.68 and the 20-day EMA at 33,611.93 suggest recent positive momentum, corroborated by a MACD of 561.64 which is above the MACD signal of 452.59.
Moving Averages Trend (MACD)
The MACD for Nifty Energy is 561.64, with a signal line of 452.59. This indicates a bullish trend, as the MACD line is above the signal line.

RSI Analysis
Based on an RSI of 59.56, Nifty Energy is in neutral territory. This indicates a balanced condition between bullish and bearish forces, suggesting no immediate overbought or oversold conditions.

Analysis for Nifty FMCG - April 29, 2025

Nifty FMCG opened at 56,693.80 and closed at 56,474.50, marking a decline of approximately 0.26% from its previous close of 56,620.30. The index experienced a daily high of 56,744.50 and a low of 56,246.30, with no recorded trading volume. The current price is slightly below both the 10 and 50-day Exponential Moving Averages, but above the 200-day EMA, indicating mixed short-term momentum. The Relative Strength Index (RSI) sits at 62.75, suggesting the index is neither overbought nor oversold.

Relationship with Key Moving Averages
Nifty FMCG closed at 56474.5, which is below its 50-day EMA of 54716.03 but above its 20-day EMA of 55535.36 and its 10-day EMA of 56333.65, indicating a short-term upward momentum. The index is also trading above its 200-day EMA of 56138.77, suggesting a bullish long-term trend.
Moving Averages Trend (MACD)
The MACD for Nifty FMCG shows a value of 979.49 with a MACD Signal of 905.37, indicating a bullish signal as the MACD line is above the signal line. This suggests positive momentum, although the percentage change is slightly negative.

RSI Analysis
The Relative Strength Index (RSI) for Nifty FMCG is 62.75, which suggests that the stock is approaching overbought levels but is not yet in an overbought condition. An RSI above 70 typically indicates an overbought scenario, so while the current level hints at strong momentum, it is not extreme enough to suggest an immediate reversal.

Analysis for Nifty Infra - April 29, 2025

Nifty Infra Performance The Nifty Infra index opened at 8789.60 and closed slightly higher at 8763.85, with a minimal change of 0.0457%. Despite the small points change, the RSI at 63.55 suggests bullish momentum, and the MACD indicator at 148.68 indicates positive sentiment in the market. The absence of values for volume and other financial metrics implies limited additional insights.

Relationship with Key Moving Averages
Nifty Infra's closing price of 8763.85 is above its 10 EMA of 8631.71, 20 EMA of 8507.43, and 50 EMA of 8358.00, suggesting a short-term bullish trend. However, the closing price is slightly above the 200 EMA of 8417.95, indicating potential support at this level for a bullish outlook over a longer timeframe.
Moving Averages Trend (MACD)
The MACD for Nifty Infra is currently at 148.68, while the MACD Signal is at 122.10. This suggests a positive momentum, as the MACD line is above the Signal line, indicating a bullish trend.

RSI Analysis
The RSI for Nifty Infra is 63.55, which is above the midpoint of 50. This suggests the index is gaining strength but is not yet in overbought territory, indicating a moderately bullish momentum.

Analysis for Nifty IT - April 29, 2025

Nifty IT opened at 35,565.75 and closed at 35,920.40, marking a percentage change of 1.23% and a points change of 437.45. The relative strength index is at 54, suggesting moderate momentum. Despite this, the MACD value indicates a bearish signal compared to the MACD signal line.
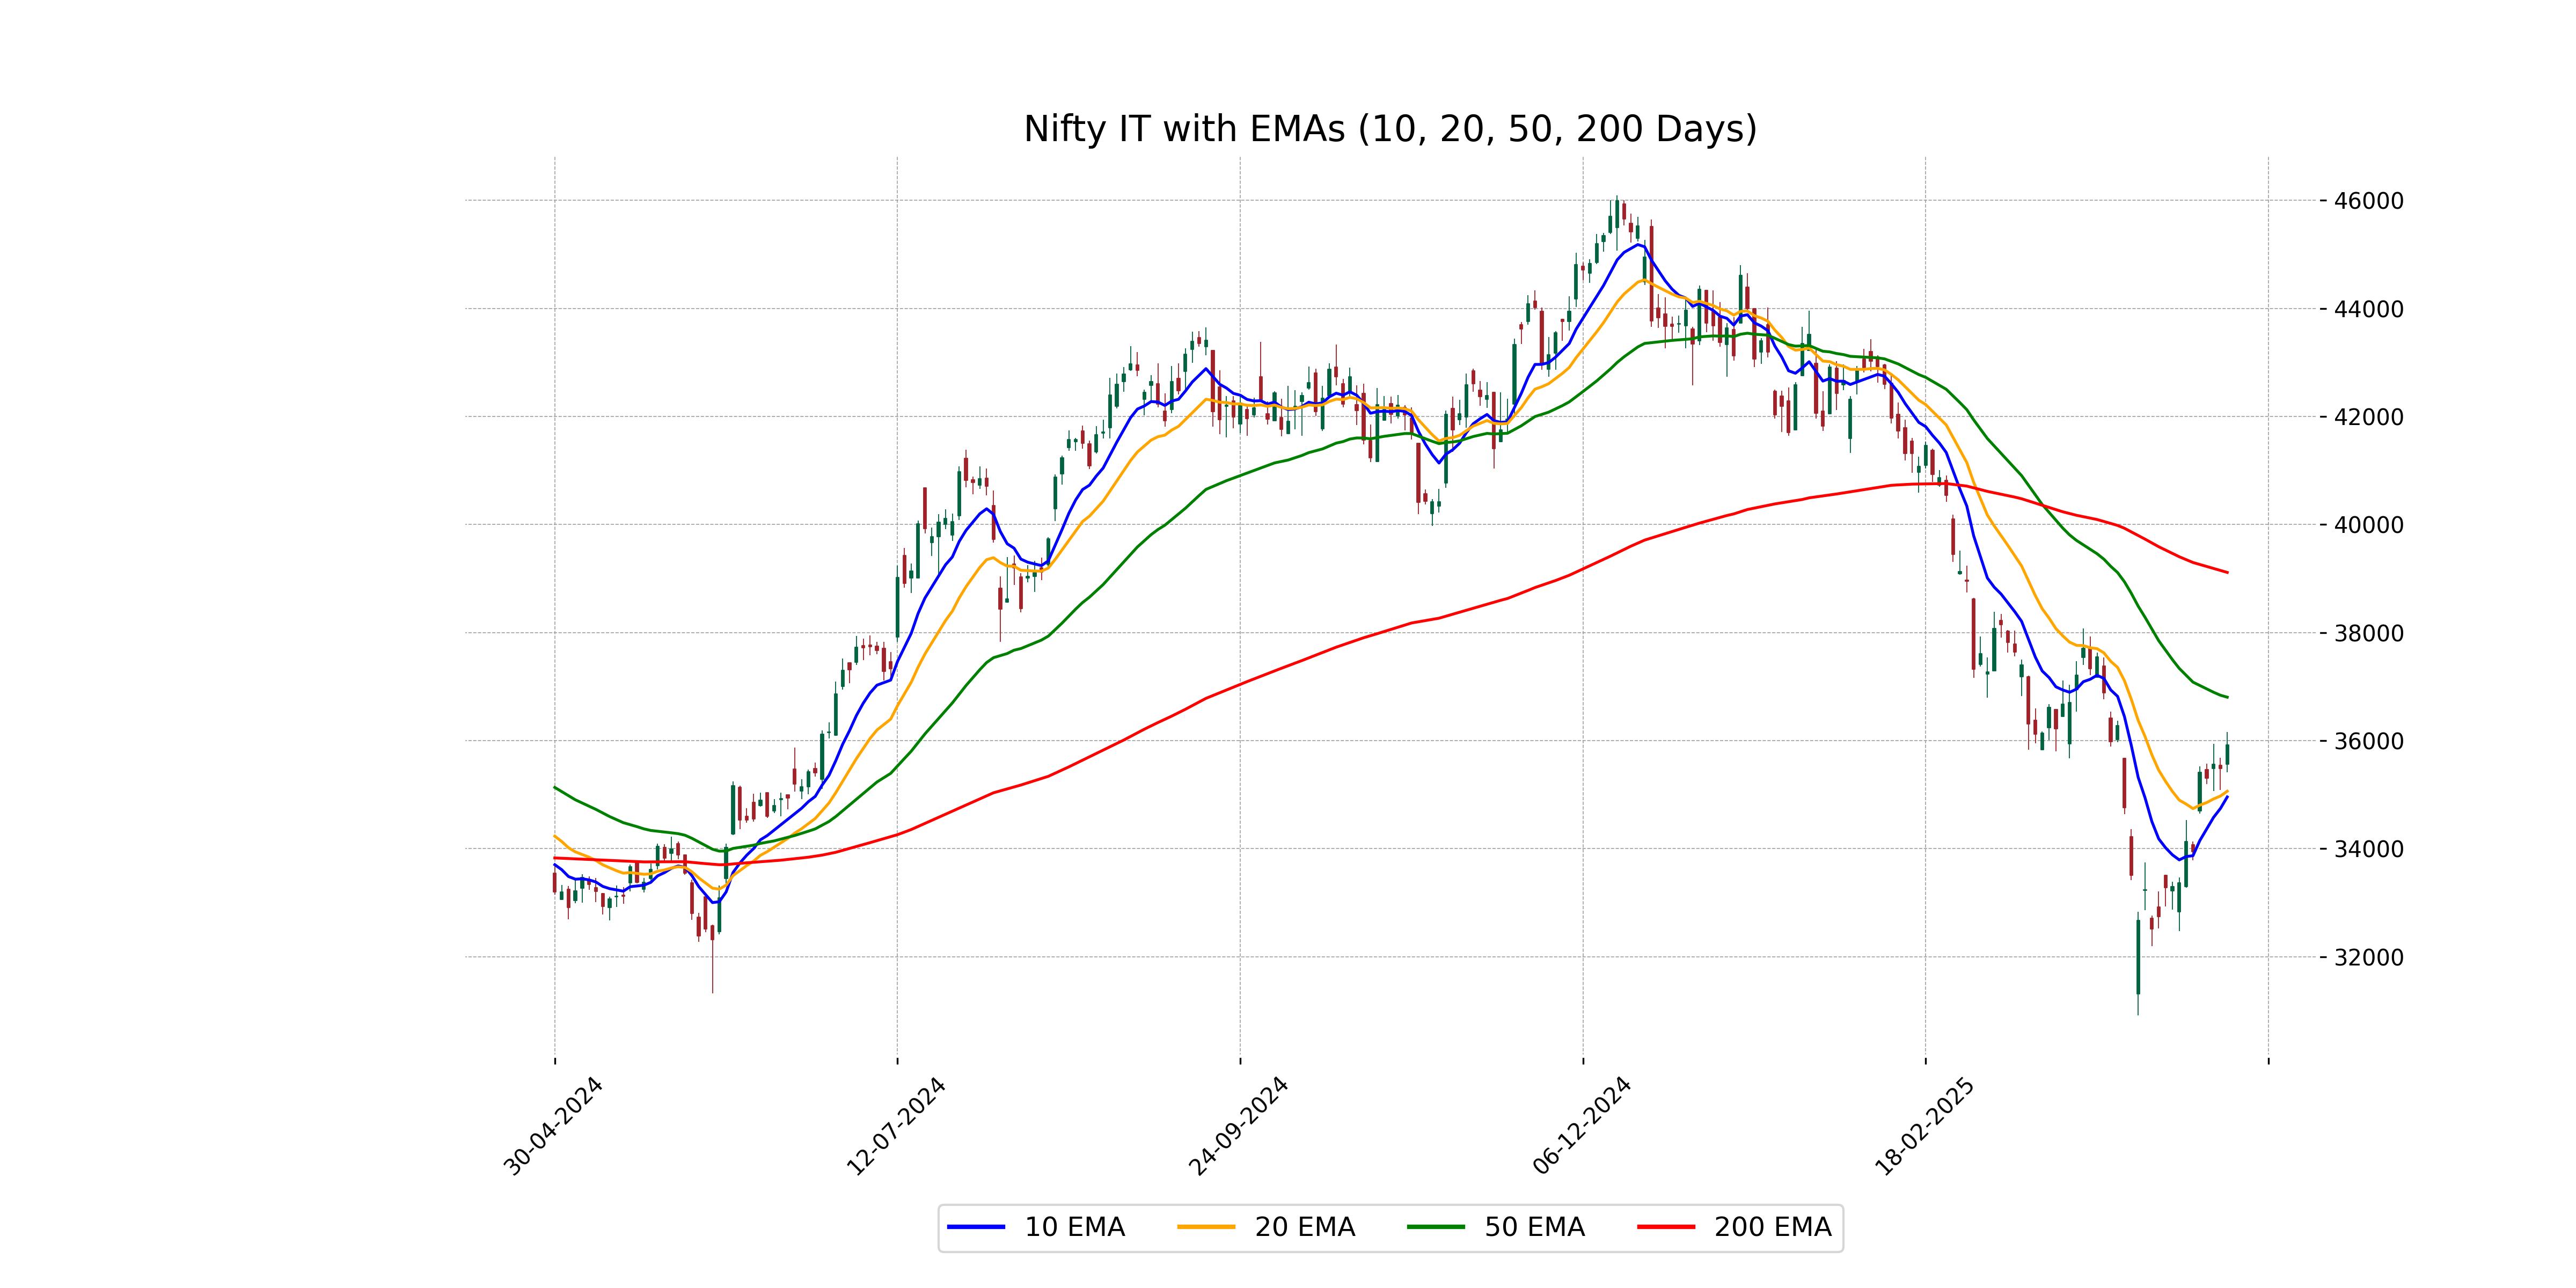
Relationship with Key Moving Averages
Nifty IT closed above its 10-day EMA (34957.92) and 20-day EMA (35064.75), suggesting short-term bullish momentum. However, the index remains below the 50-day EMA (36804.43) and 200-day EMA (39113.66), indicating that long-term sentiment is still bearish.
Moving Averages Trend (MACD)
The MACD value of -464.66, which is above the MACD Signal line of -905.78, suggests a bullish signal for Nifty IT. This indicates a potential upward momentum in the price trend. However, as the MACD is still negative, it suggests that the stock is still recovering from a previous downtrend.

RSI Analysis
The RSI for Nifty IT is 53.98, indicating a neutral position in terms of momentum. A reading near 50 suggests the index is neither overbought nor oversold, implying balanced momentum and potential for either upward or downward movement.

Analysis for Nifty Metal - April 29, 2025

Nifty Metal opened at 8711.30, reaching a high of 8762.40 and a low of 8596.05, before closing at 8607.15, which is a decrease of 0.95% or -82.75 points from the previous close of 8689.90. The performance indicators show the index slightly below its 50-day EMA and significantly below its 200-day EMA, with an RSI close to neutral at 49.49, indicating mild bearish momentum.

Relationship with Key Moving Averages
Nifty Metal closed at 8607.15, below its 50 EMA of 8642.51 and the 200 EMA of 8772.87, indicating a potential bearish trend. However, it is slightly above its 10 EMA of 8603.60 and slightly below the 20 EMA of 8613.44, suggesting short-term mixed sentiments.
Moving Averages Trend (MACD)
MACD Analysis for Nifty Metal: The MACD value for Nifty Metal is -22.24, while the MACD Signal value is -46.47, indicating a bearish trend as the MACD line is above the signal line but both are in negative territory. This suggests that the momentum is downward, and traders might look for further signs of reversal before considering buy positions.

RSI Analysis
Based on the given data for Nifty Metal, the RSI is 49.49, which indicates a neutral momentum, as it is close to 50. This suggests that the stock is neither overbought nor oversold and might continue to consolidate around current levels unless there is a significant market catalyst.

Analysis for Nifty Bank - April 29, 2025

The Nifty Bank index opened at 55524.35 and closed slightly lower at 55391.25, marking a modest decrease of 0.07%. With high levels of relative strength (RSI at 69.98) and a positive MACD, the index shows a strong momentum, though it faced a slight decline compared to the previous close.

Relationship with Key Moving Averages
The current close for Nifty Bank is 55391.25, which is above the 10 EMA of 54453.84, indicating recent bullish momentum. It is also significantly above both the 50 EMA at 51600.32 and the 200 EMA at 50499.91, suggesting a strong upward trend over medium and long-term periods.
Moving Averages Trend (MACD)
The MACD for Nifty Bank indicates a positive momentum with the MACD line at 1449.04 above the signal line at 1218.17, suggesting a bullish trend. The significant difference between the two lines supports the ongoing upward momentum.

RSI Analysis
The RSI for Nifty Bank is approximately 70, indicating the stock is near the overbought zone. This suggests that the price may be overvalued, and a trend reversal or pullback could be on the horizon. It's important to monitor the RSI, as values above 70 typically suggest caution for potential overvaluation.

Analysis for Nifty 50 - April 29, 2025

Nifty 50 opened at 24370.70 and closed at 24335.95, showing a slight positive change of 0.03% with a points increase of 7.45 from the previous close of 24328.50. The index demonstrated a moderate RSI of 65.04, indicating strong recent momentum, supported by a bullish MACD of 356.20 surpassing the signal line at 250.14.

Relationship with Key Moving Averages
The Nifty 50 closed at 24335.95, which is above its 50 EMA of 23366.07, indicating a strong position relative to this moving average. It also closed above its 200 EMA of 23429.82, suggesting a longer-term bullish trend. However, it is slightly below the 10 EMA of 23980.13, hinting at a potential short-term weakness.
Moving Averages Trend (MACD)
Nifty 50 MACD Analysis: The MACD value for Nifty 50 is 356.20, while the MACD Signal line is at 250.14. This indicates a positive difference, suggesting a bullish momentum in the current market trend.

RSI Analysis
The RSI value for Nifty 50 is 65.04, indicating that the stock is approaching overbought territory. Generally, an RSI above 70 suggests that the asset might be overbought, while below 30 indicates it might be oversold. This implies that while Nifty 50 is not yet overbought, it is nearing levels where traders should pay attention for potential price reversals.
