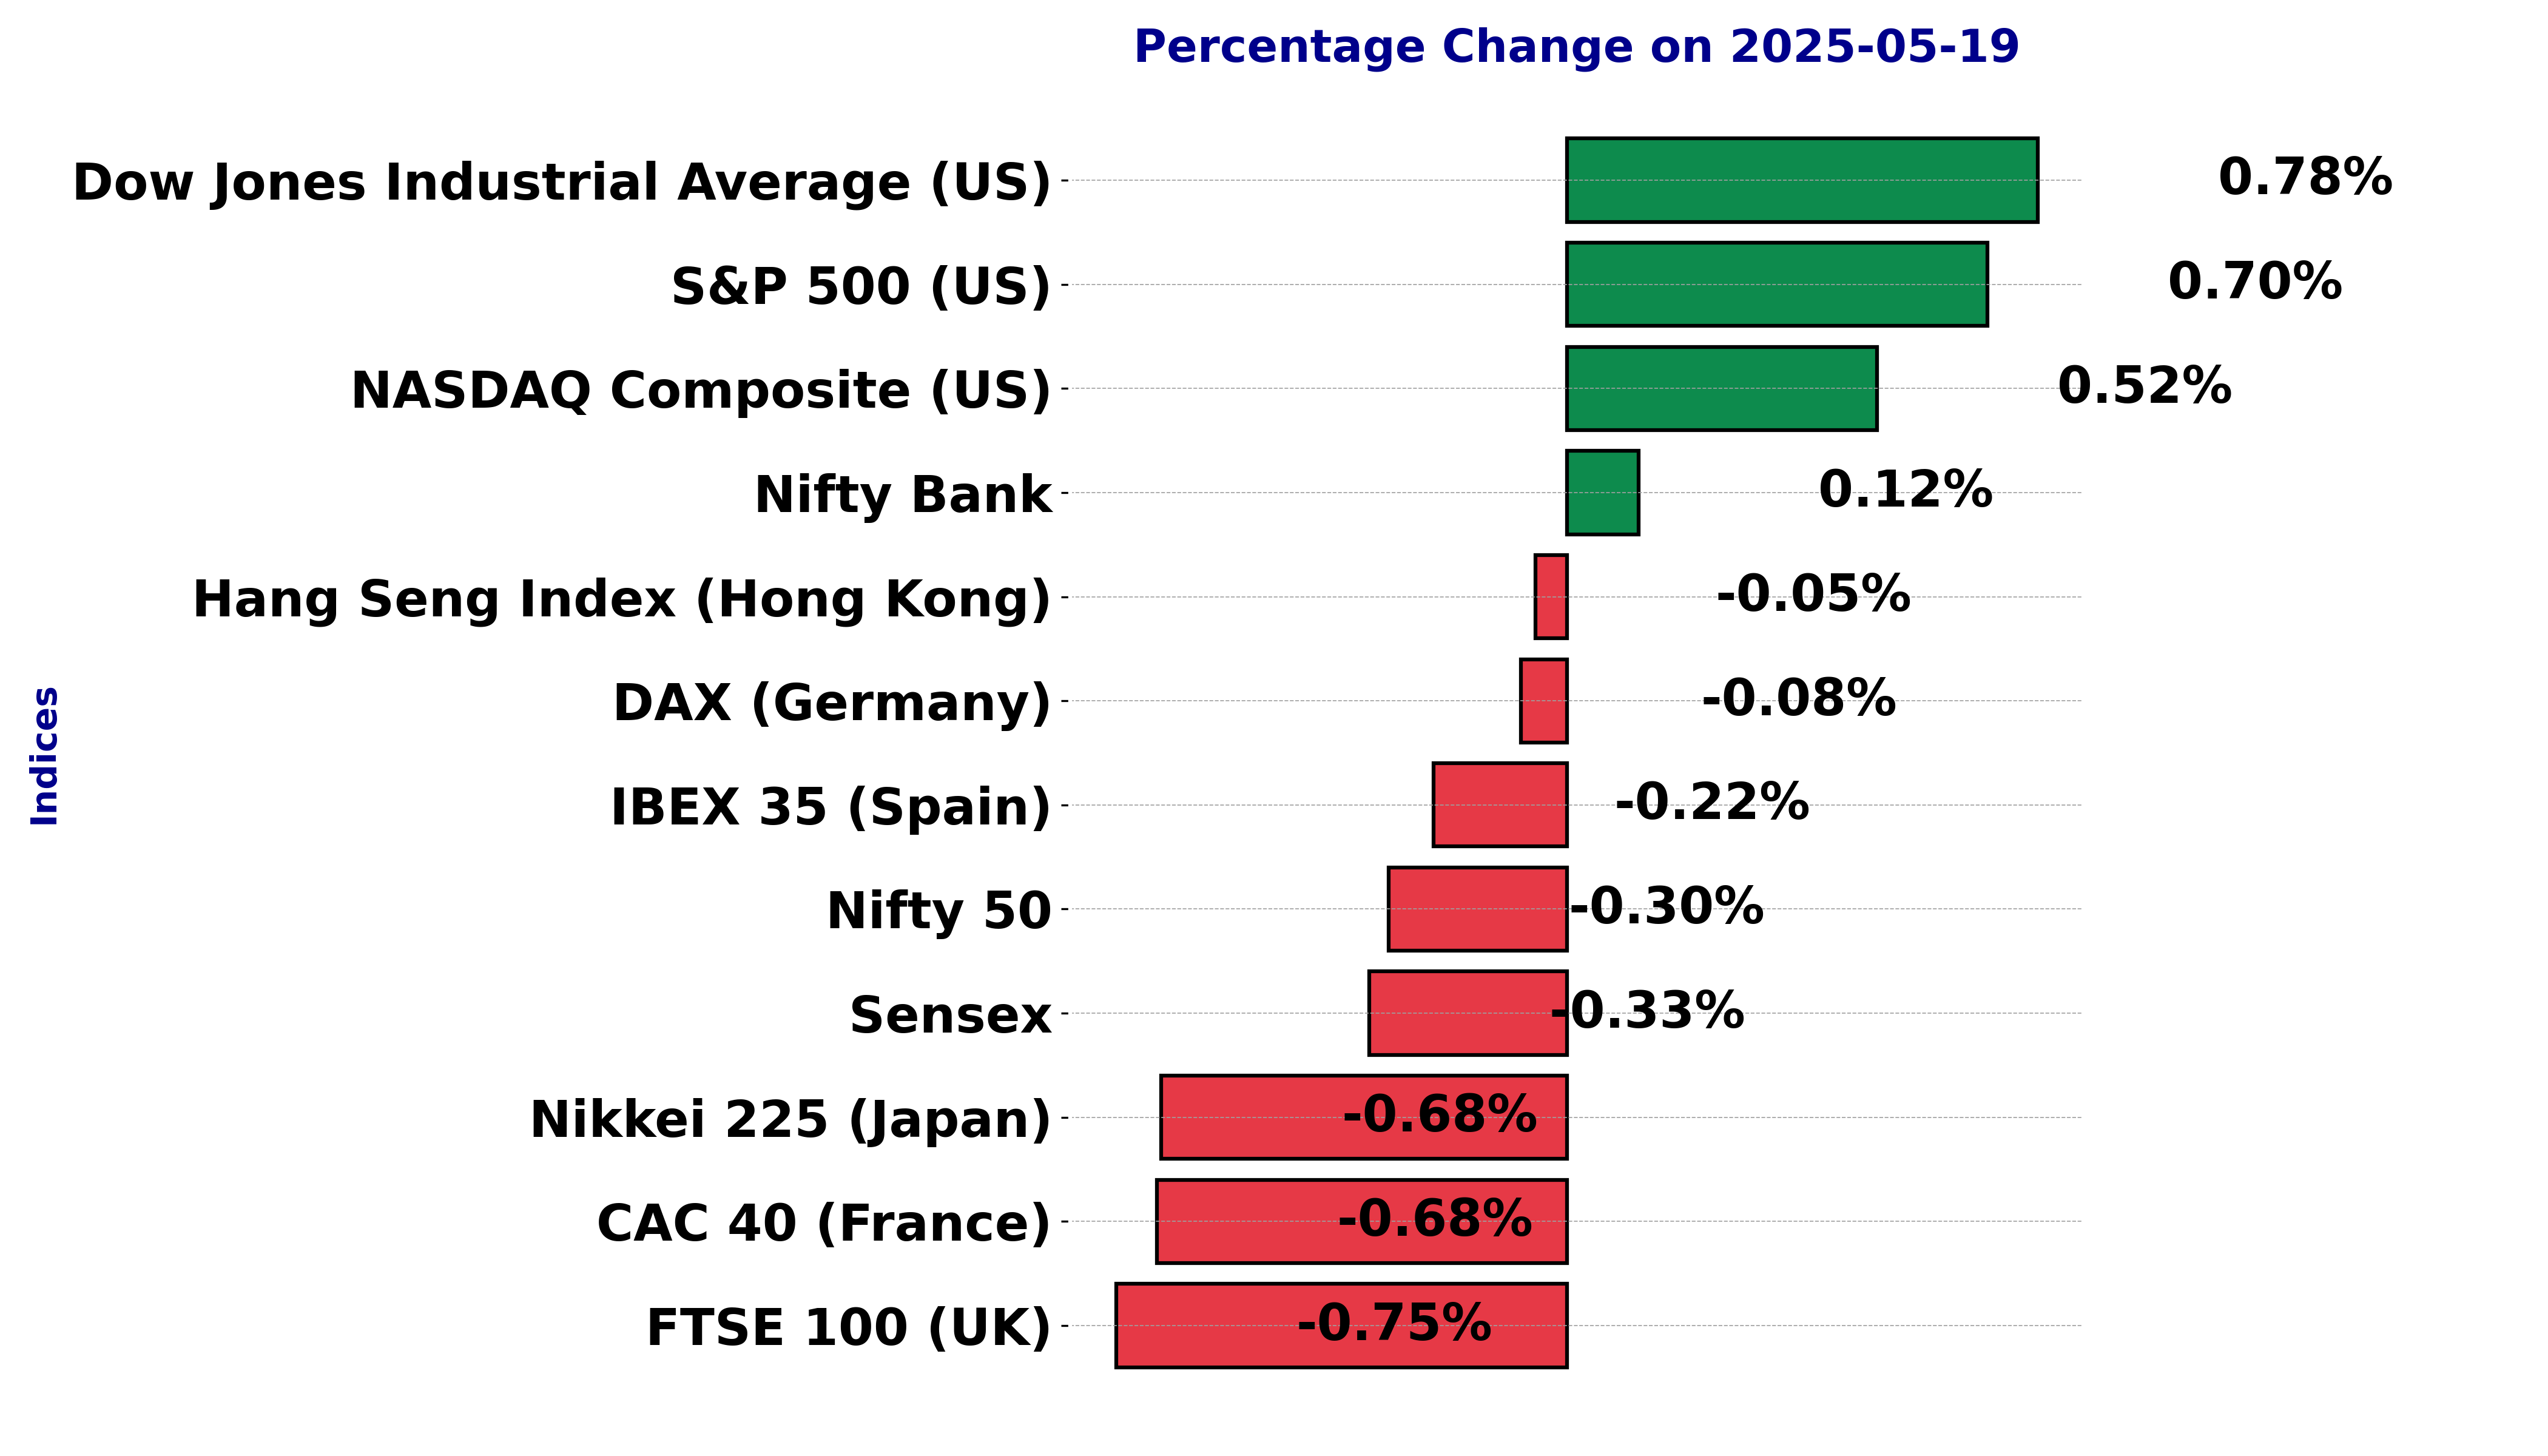
Global stock market indices: How the world markets performed today - 19 May 2025
The international stock market indices showed varied performances on May 19, 2025, reflecting the economic sentiment across different regions.
In this article, we analyze the performance of key global indices including the S&P 500, Dow Jones Industrial Average, NASDAQ Composite, FTSE 100, DAX, CAC 40, IBEX 35, Nikkei 225, Hang Seng, Nifty 50, and BSE Sensex.
Analysis for Sensex - May 19, 2025
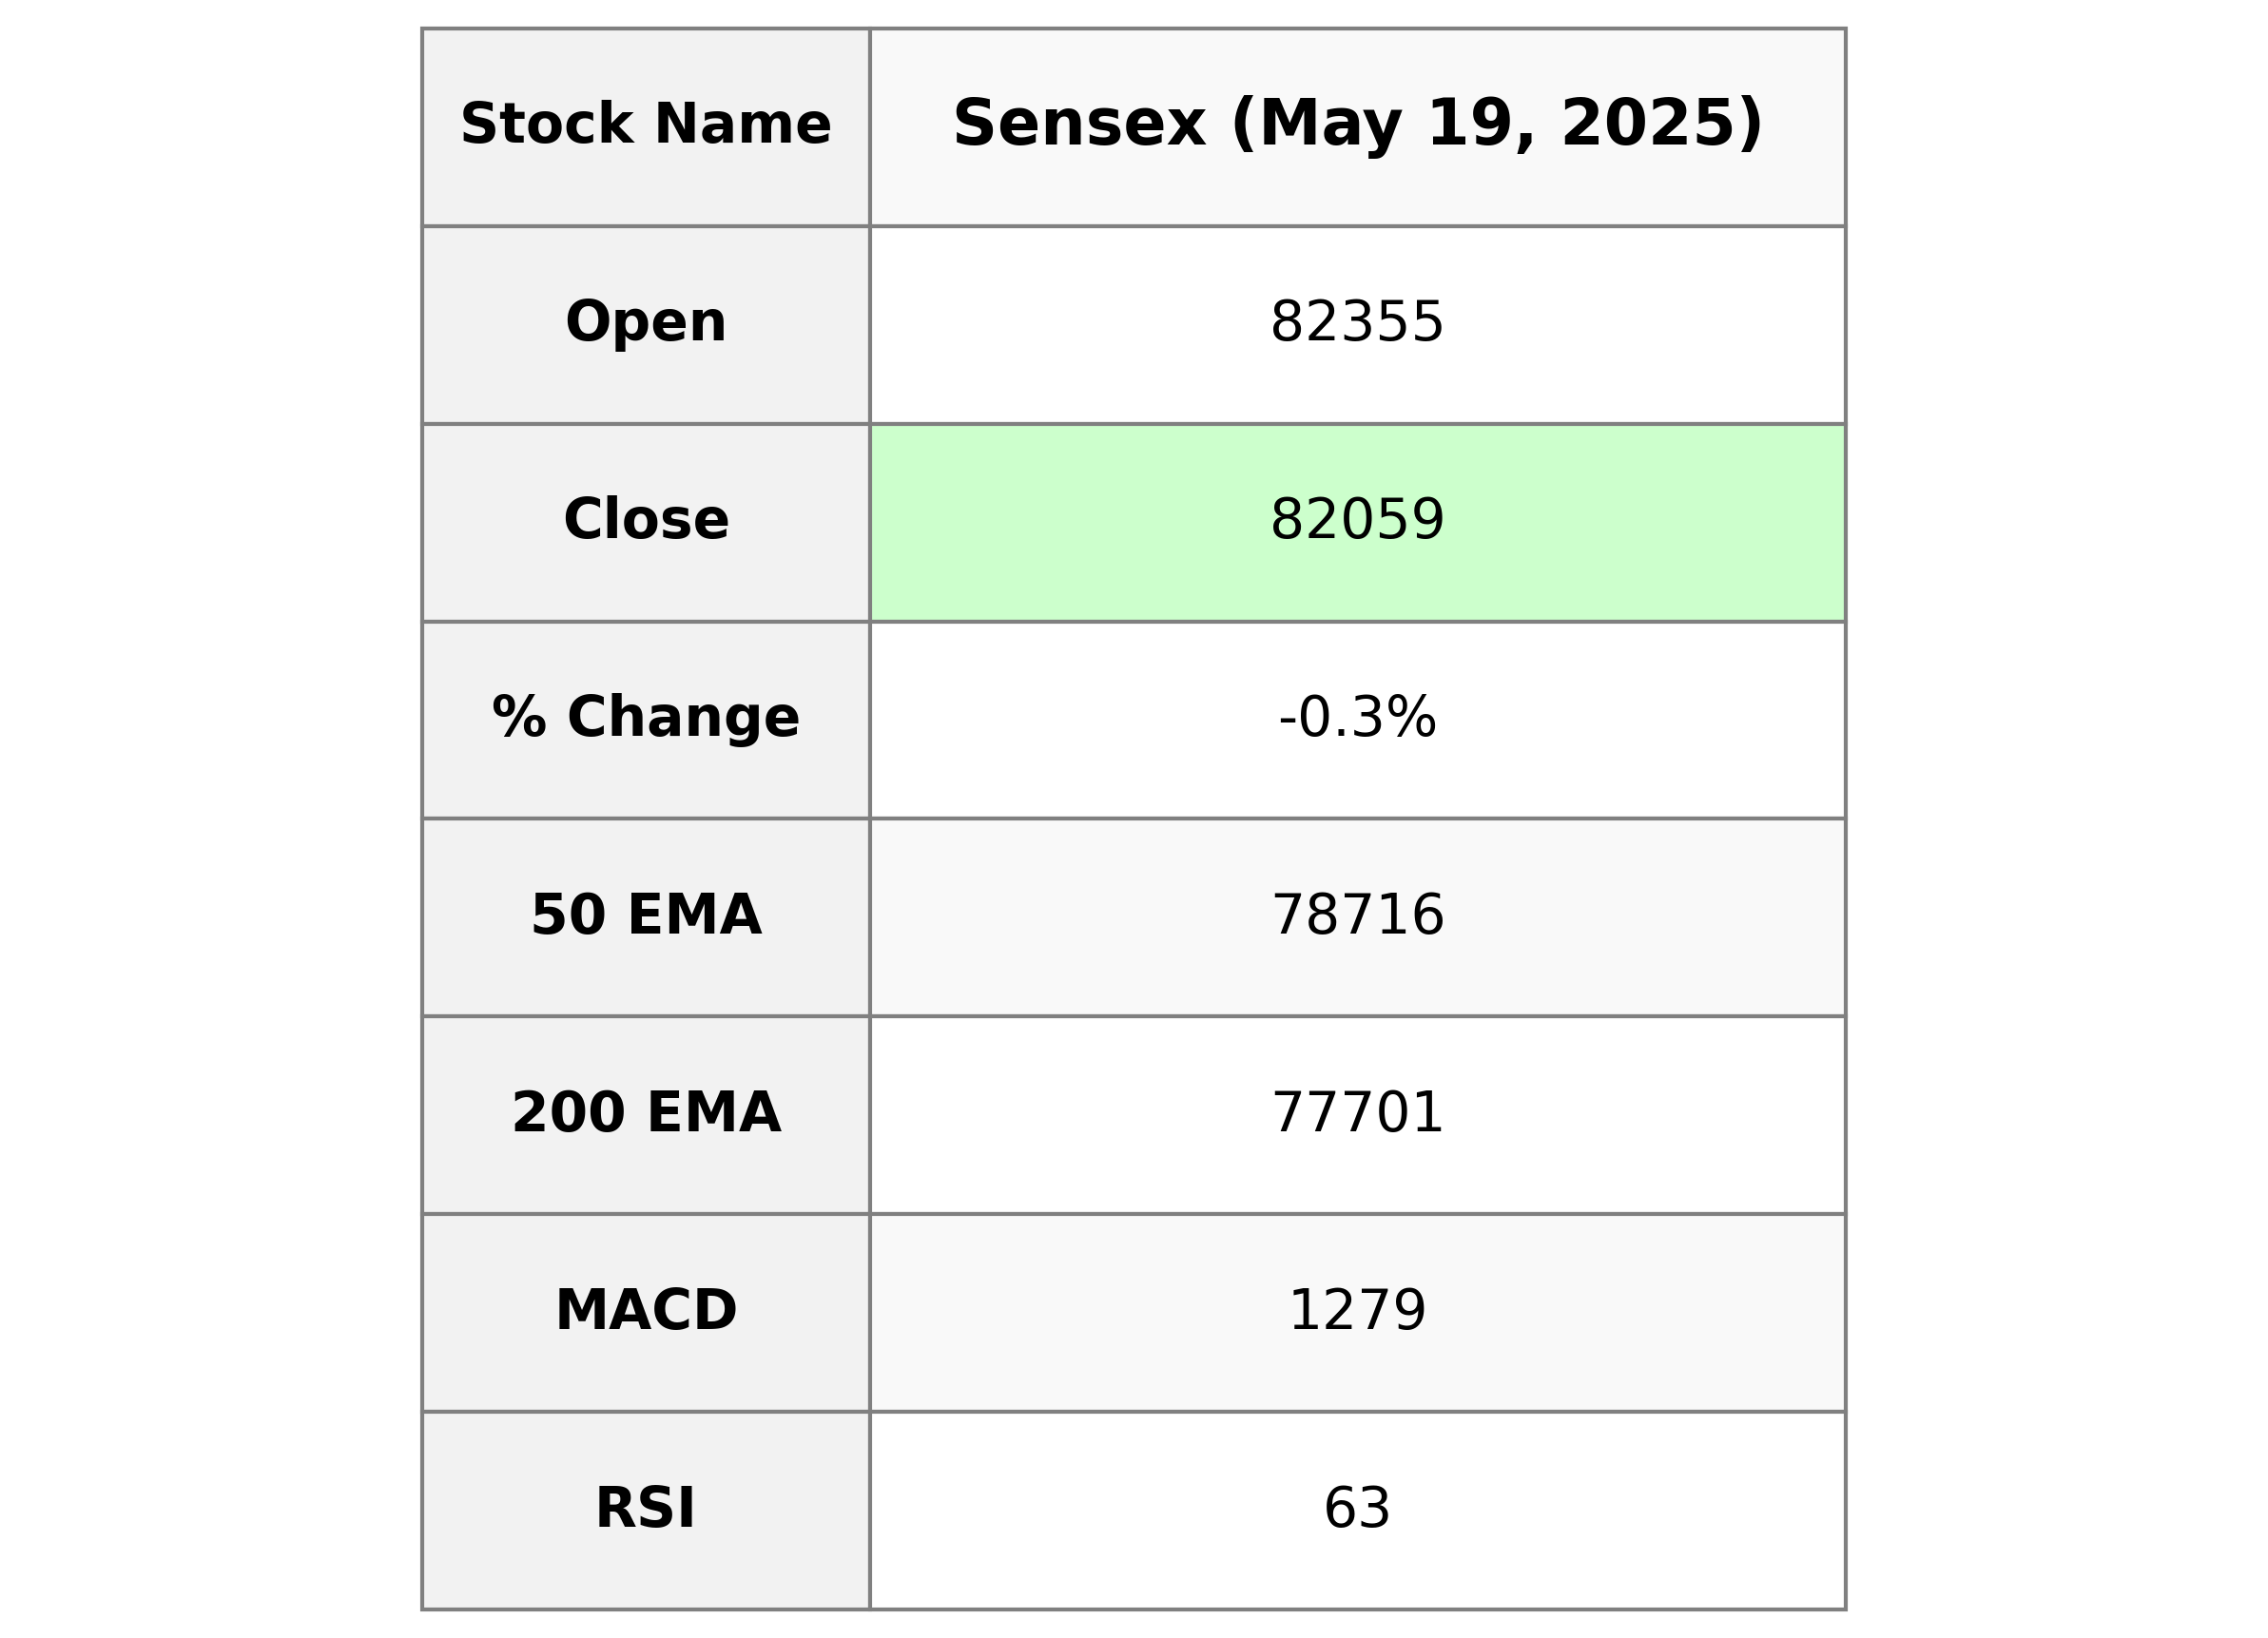
Sensex Performance: The Sensex opened at 82,354.92 and closed slightly lower at 82,059.42, marking a decrease of 0.33%. It experienced a high of 82,424.10 and a low of 81,964.57 throughout the trading session, resulting in a points change of -271.17. Despite this downturn, the index remains above crucial moving averages, with a 50-day EMA of 78,716.10 and a 200-day EMA of 77,701.10, while maintaining an RSI of 62.57, indicating a relatively strong market position.
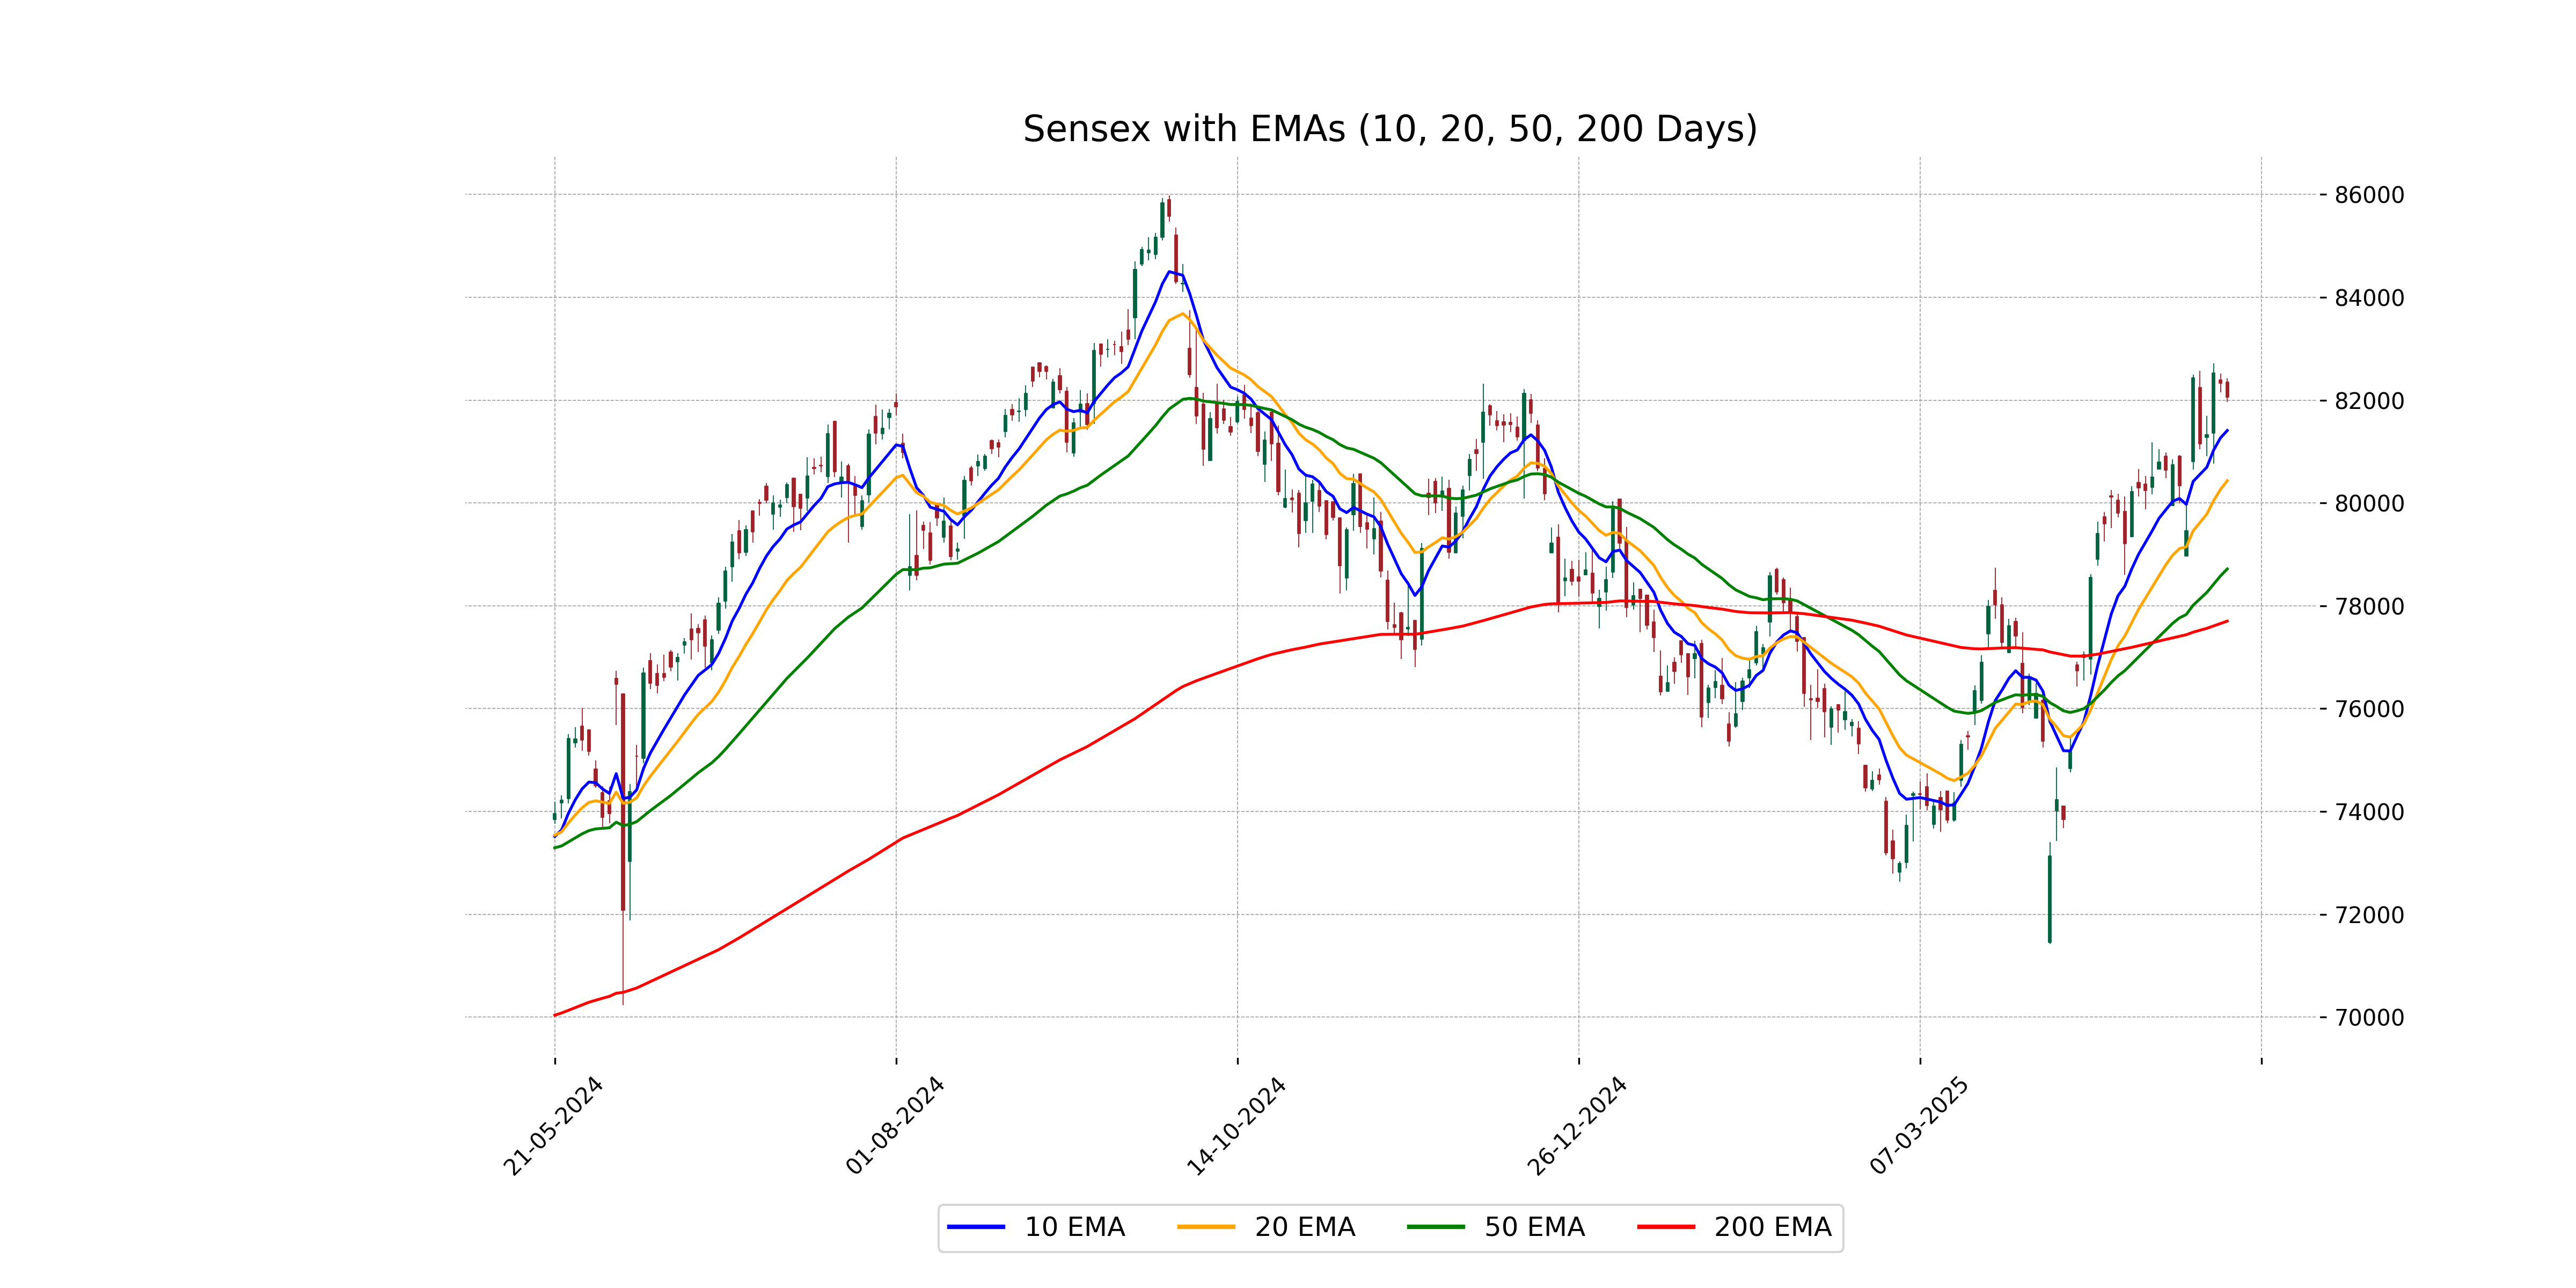
Relationship with Key Moving Averages
The Sensex closed at 82059.42, which is above its 50-day EMA of 78716.10 and 200-day EMA of 77701.10, indicating a generally bullish trend over a medium to long term. However, it is slightly below its 10-day EMA of 81408.74 and 20-day EMA of 80432.45, suggesting short-term bearish momentum.
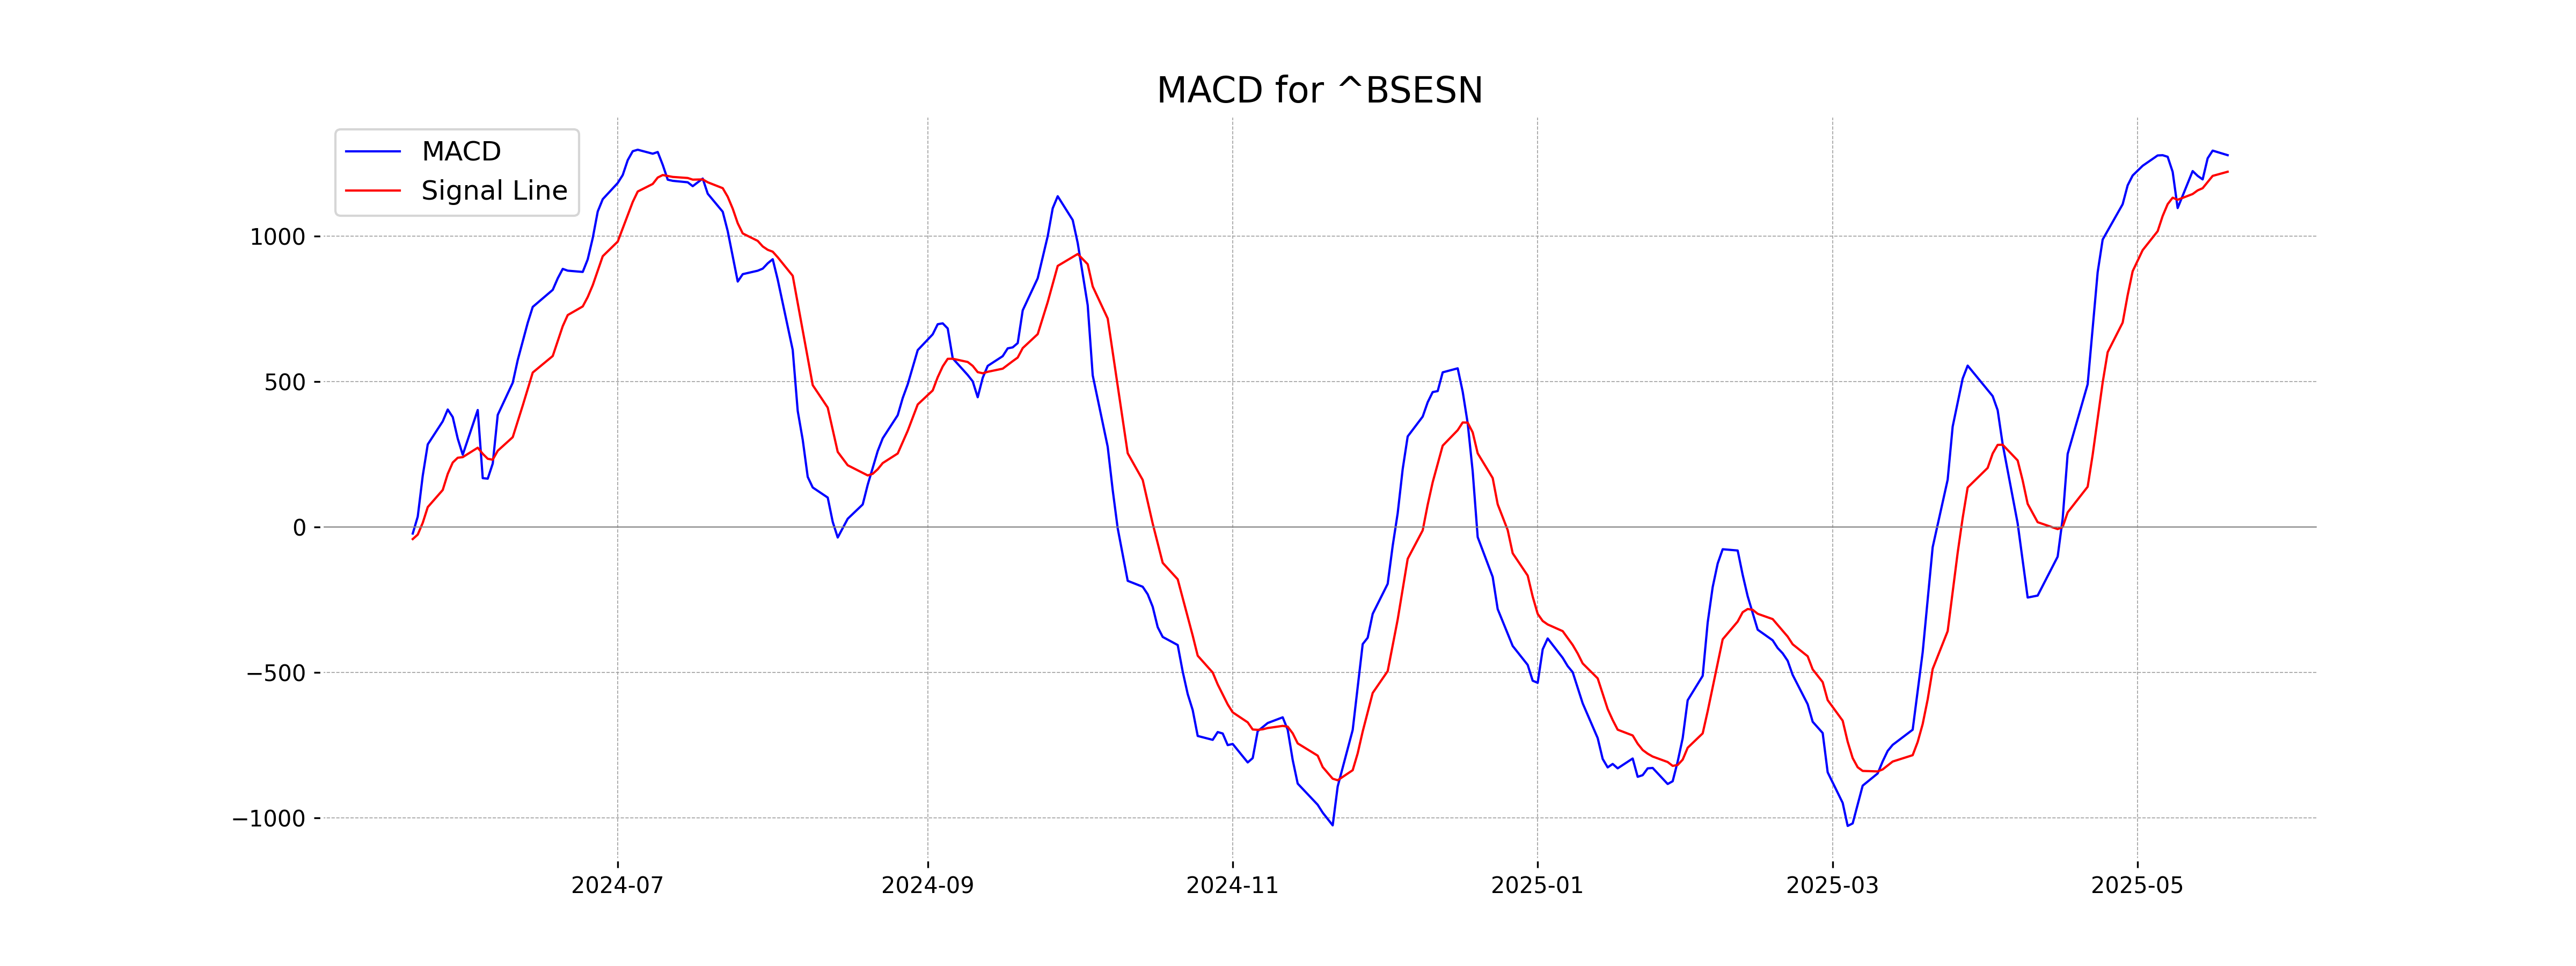
Moving Averages Trend (MACD)
MACD Analysis for Sensex: The MACD value of 1279.09 is above the MACD Signal of 1222.07, indicating a bullish trend. This suggests potential upward momentum in the Sensex.
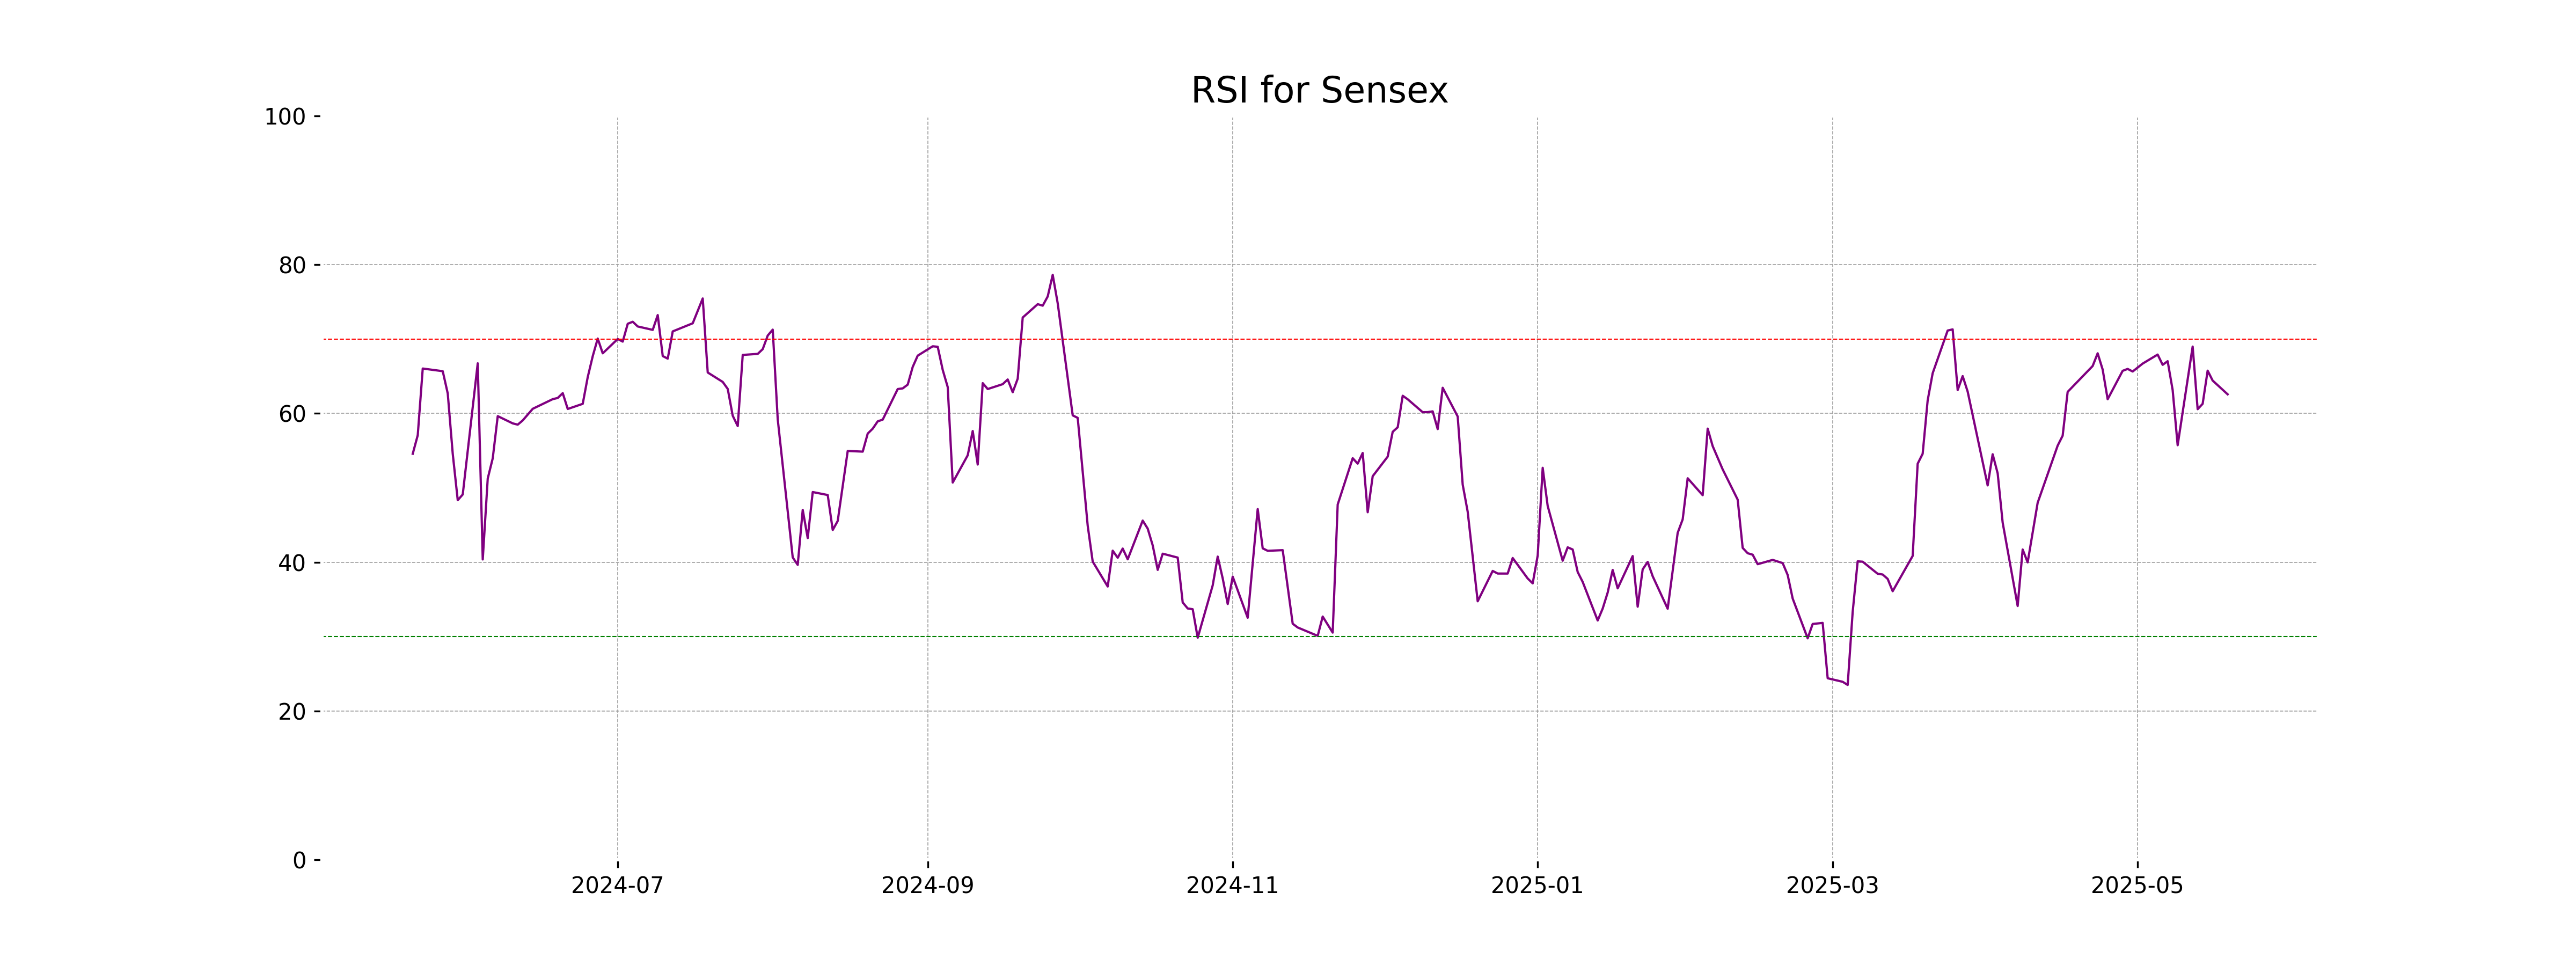
RSI Analysis
The current RSI for Sensex is 62.57, which suggests that the index is neither overbought nor oversold, but it is above the neutral 50 mark, indicating slightly more buying pressure. This suggests a continuation of a positive trend if other indicators support this momentum.
Analysis for Dow Jones Industrial Average (US) - May 19, 2025
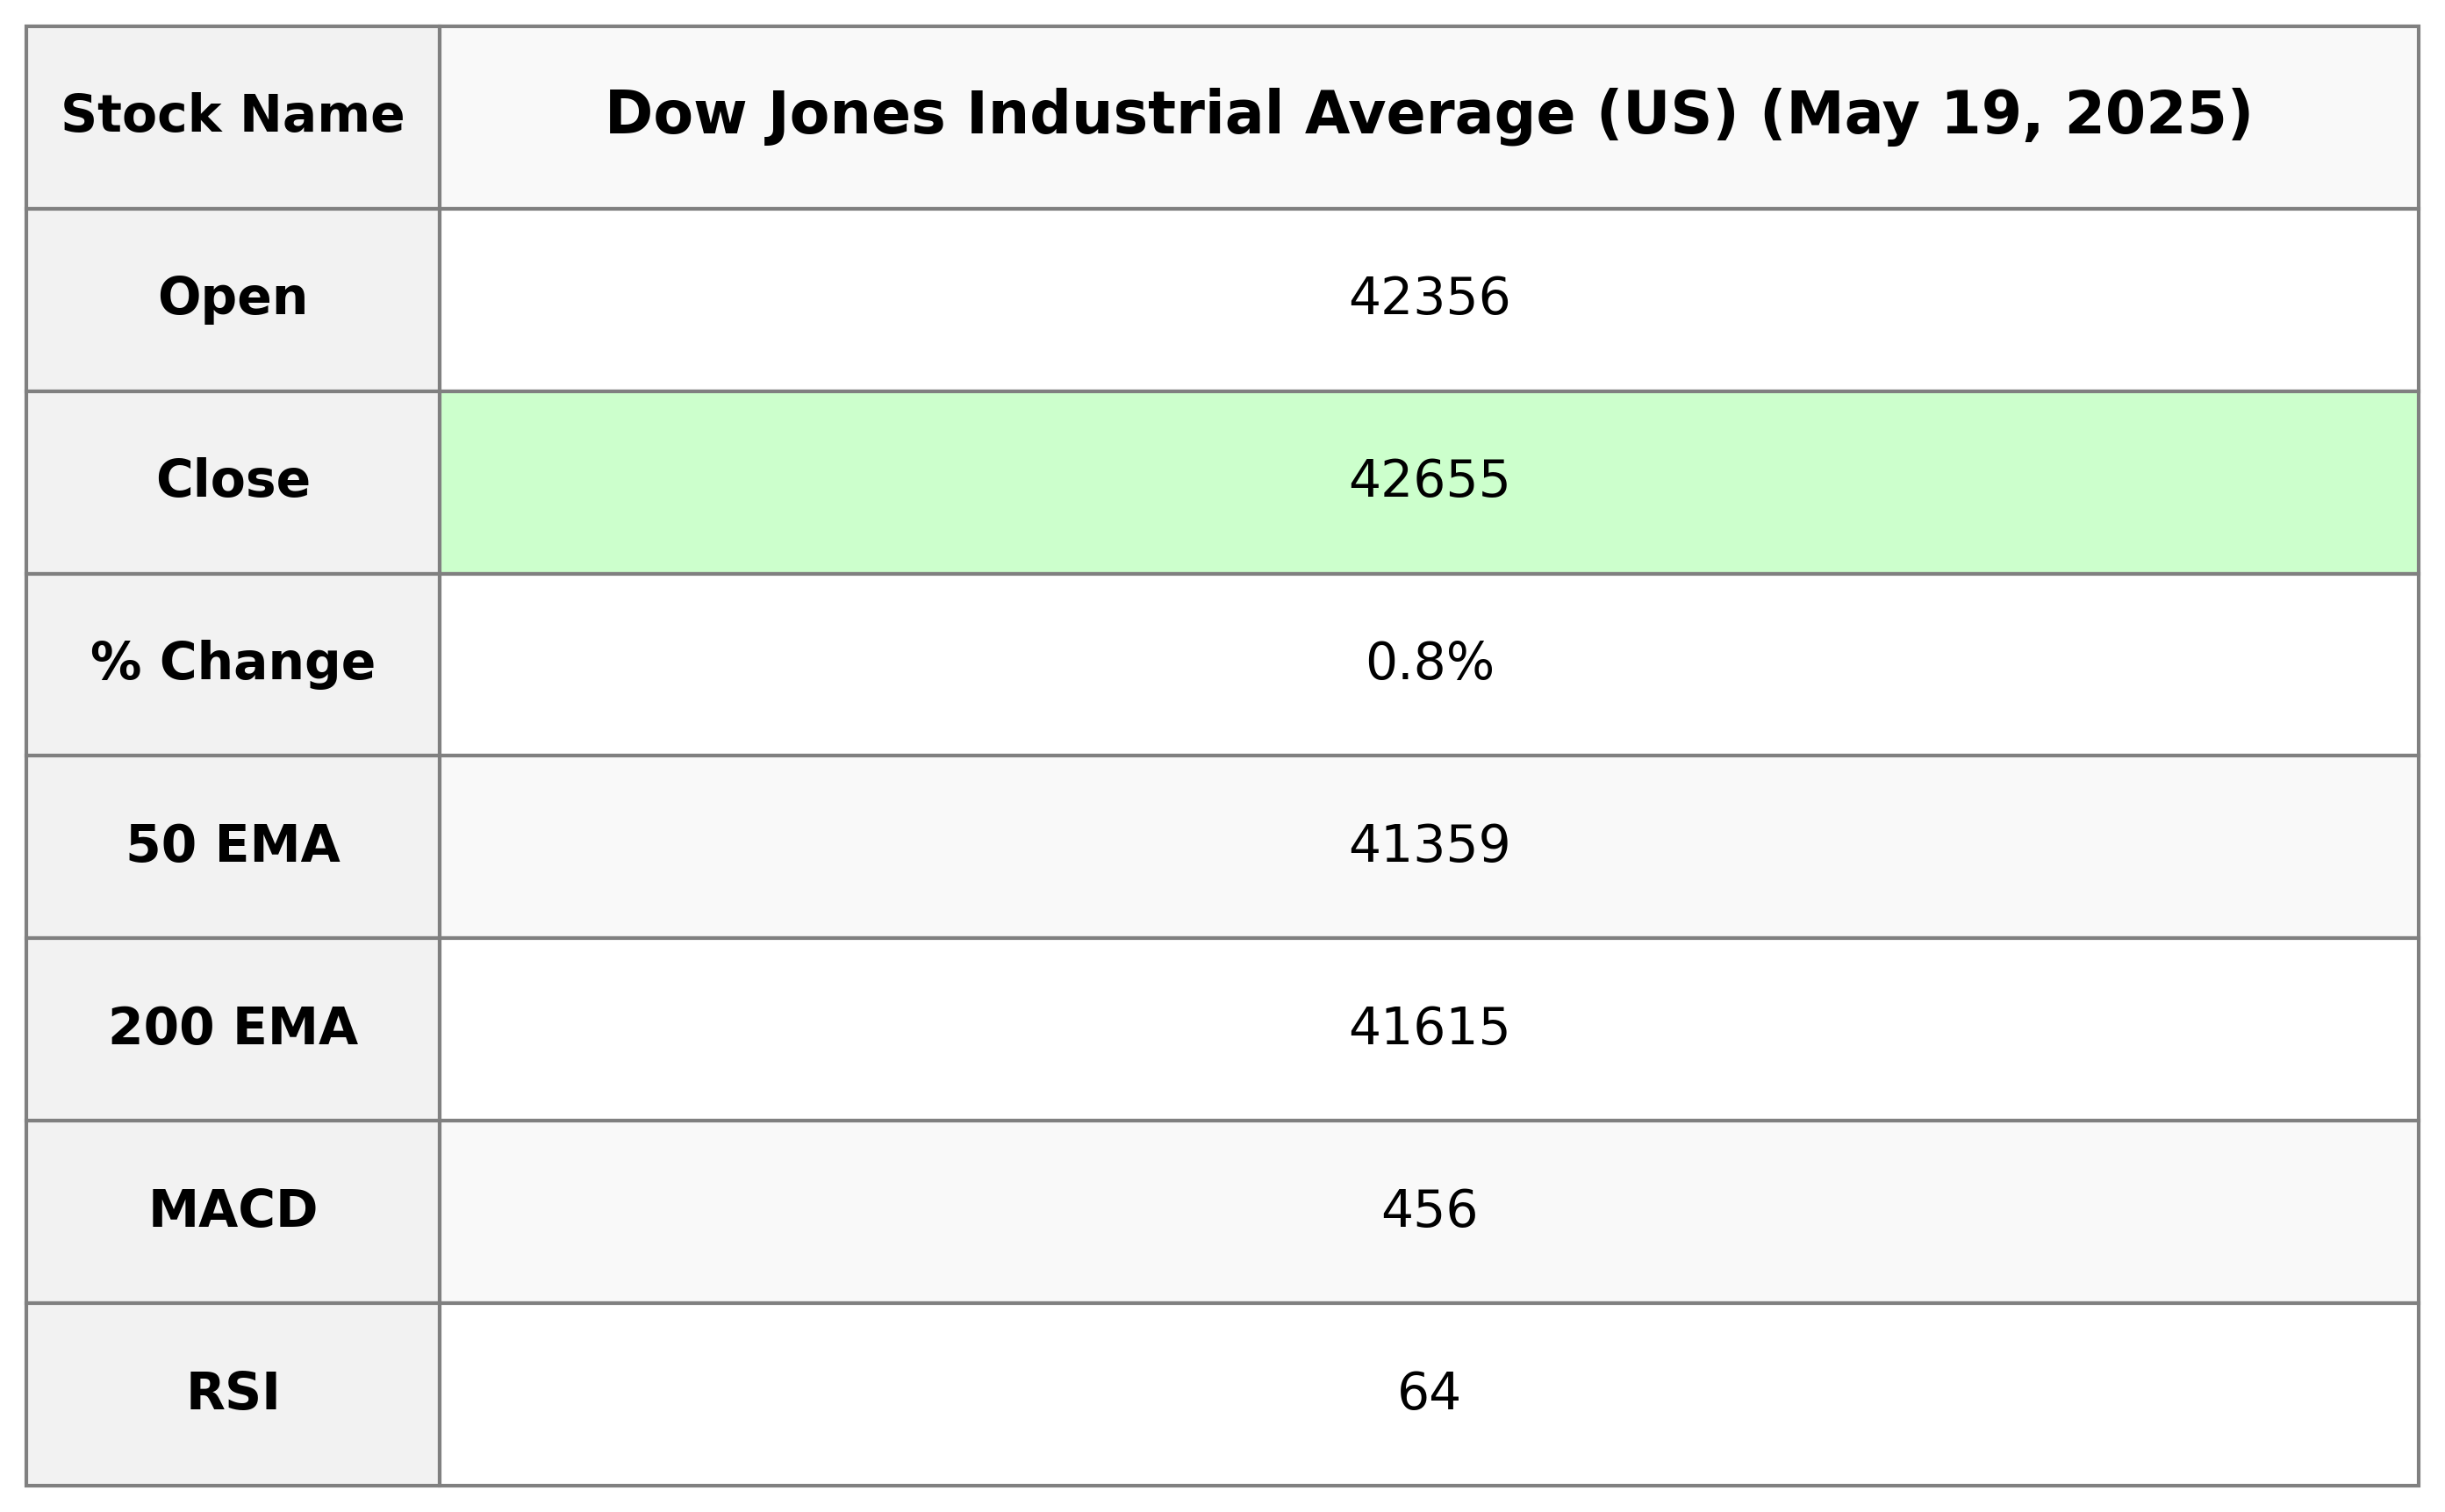
The Dow Jones Industrial Average (US) opened at 42,356.20 and closed higher at 42,654.74, reflecting a percentage change of 0.78% with a points increase of 331.99. The index experienced volatility with a high of 42,663.68 and a low of 42,232.56. Its RSI stands at 63.51, indicating a relatively strong market sentiment.
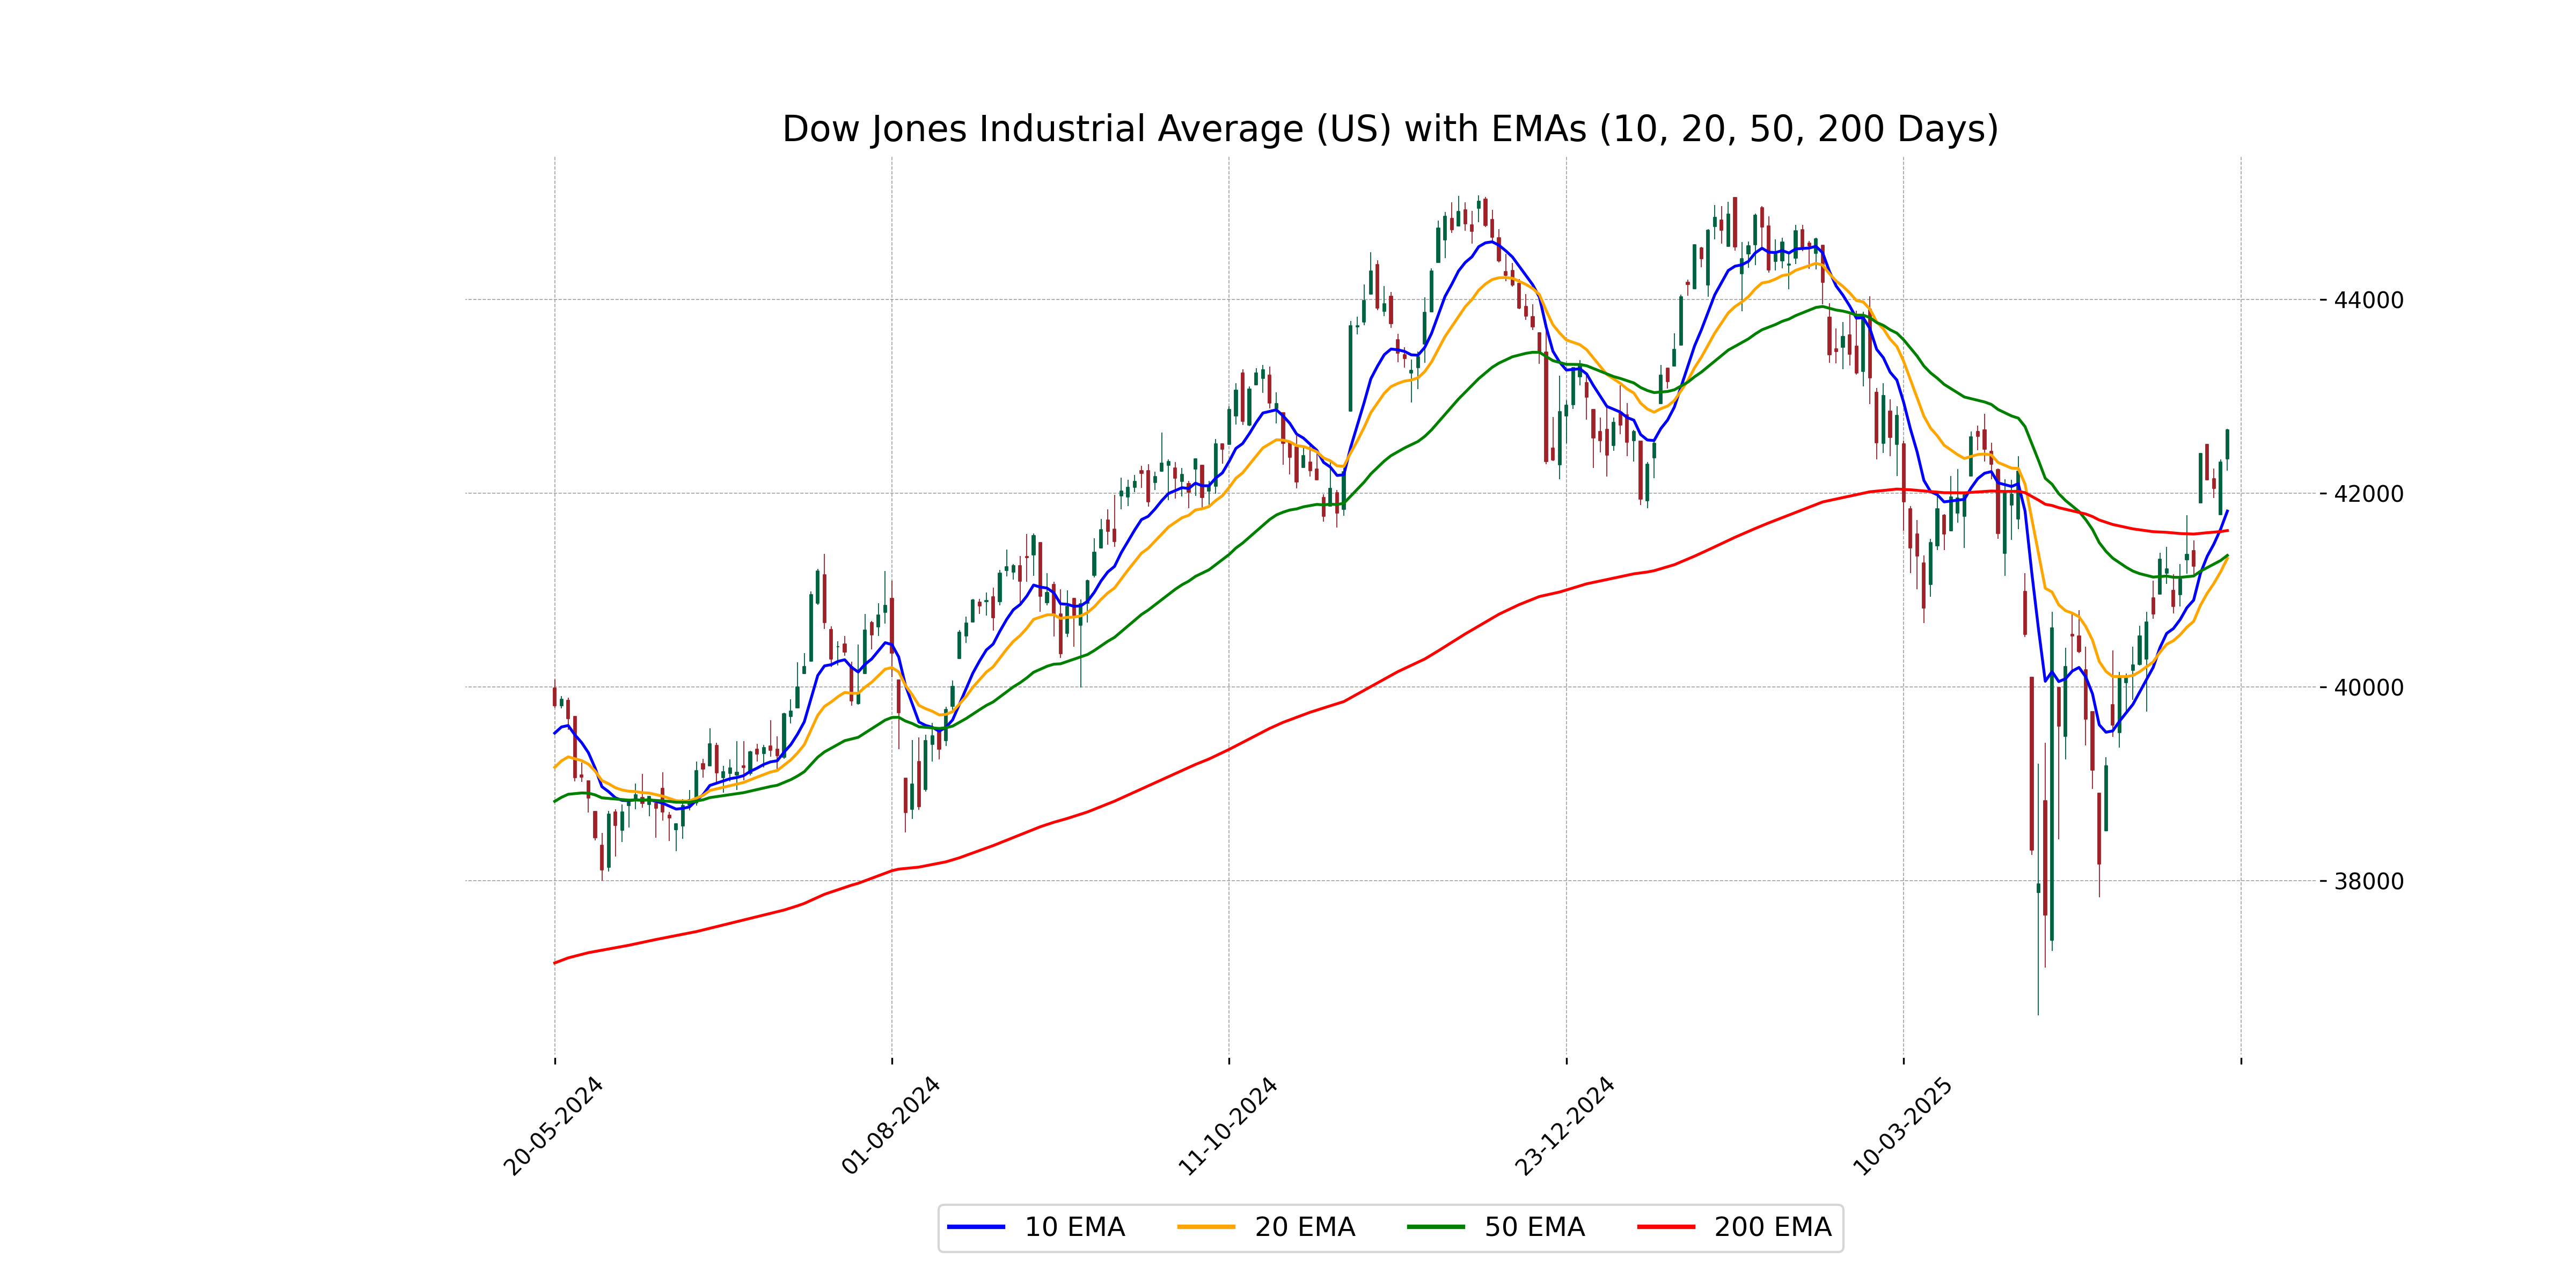
Relationship with Key Moving Averages
The Dow Jones Industrial Average opened at 42,356.20 and closed above its 50, 10, and 20-day EMAs, indicating a bullish position relative to these moving averages. With the close at 42,654.74, it is also above the 200-day EMA, suggesting a strong upward trend in the current market environment.
Moving Averages Trend (MACD)
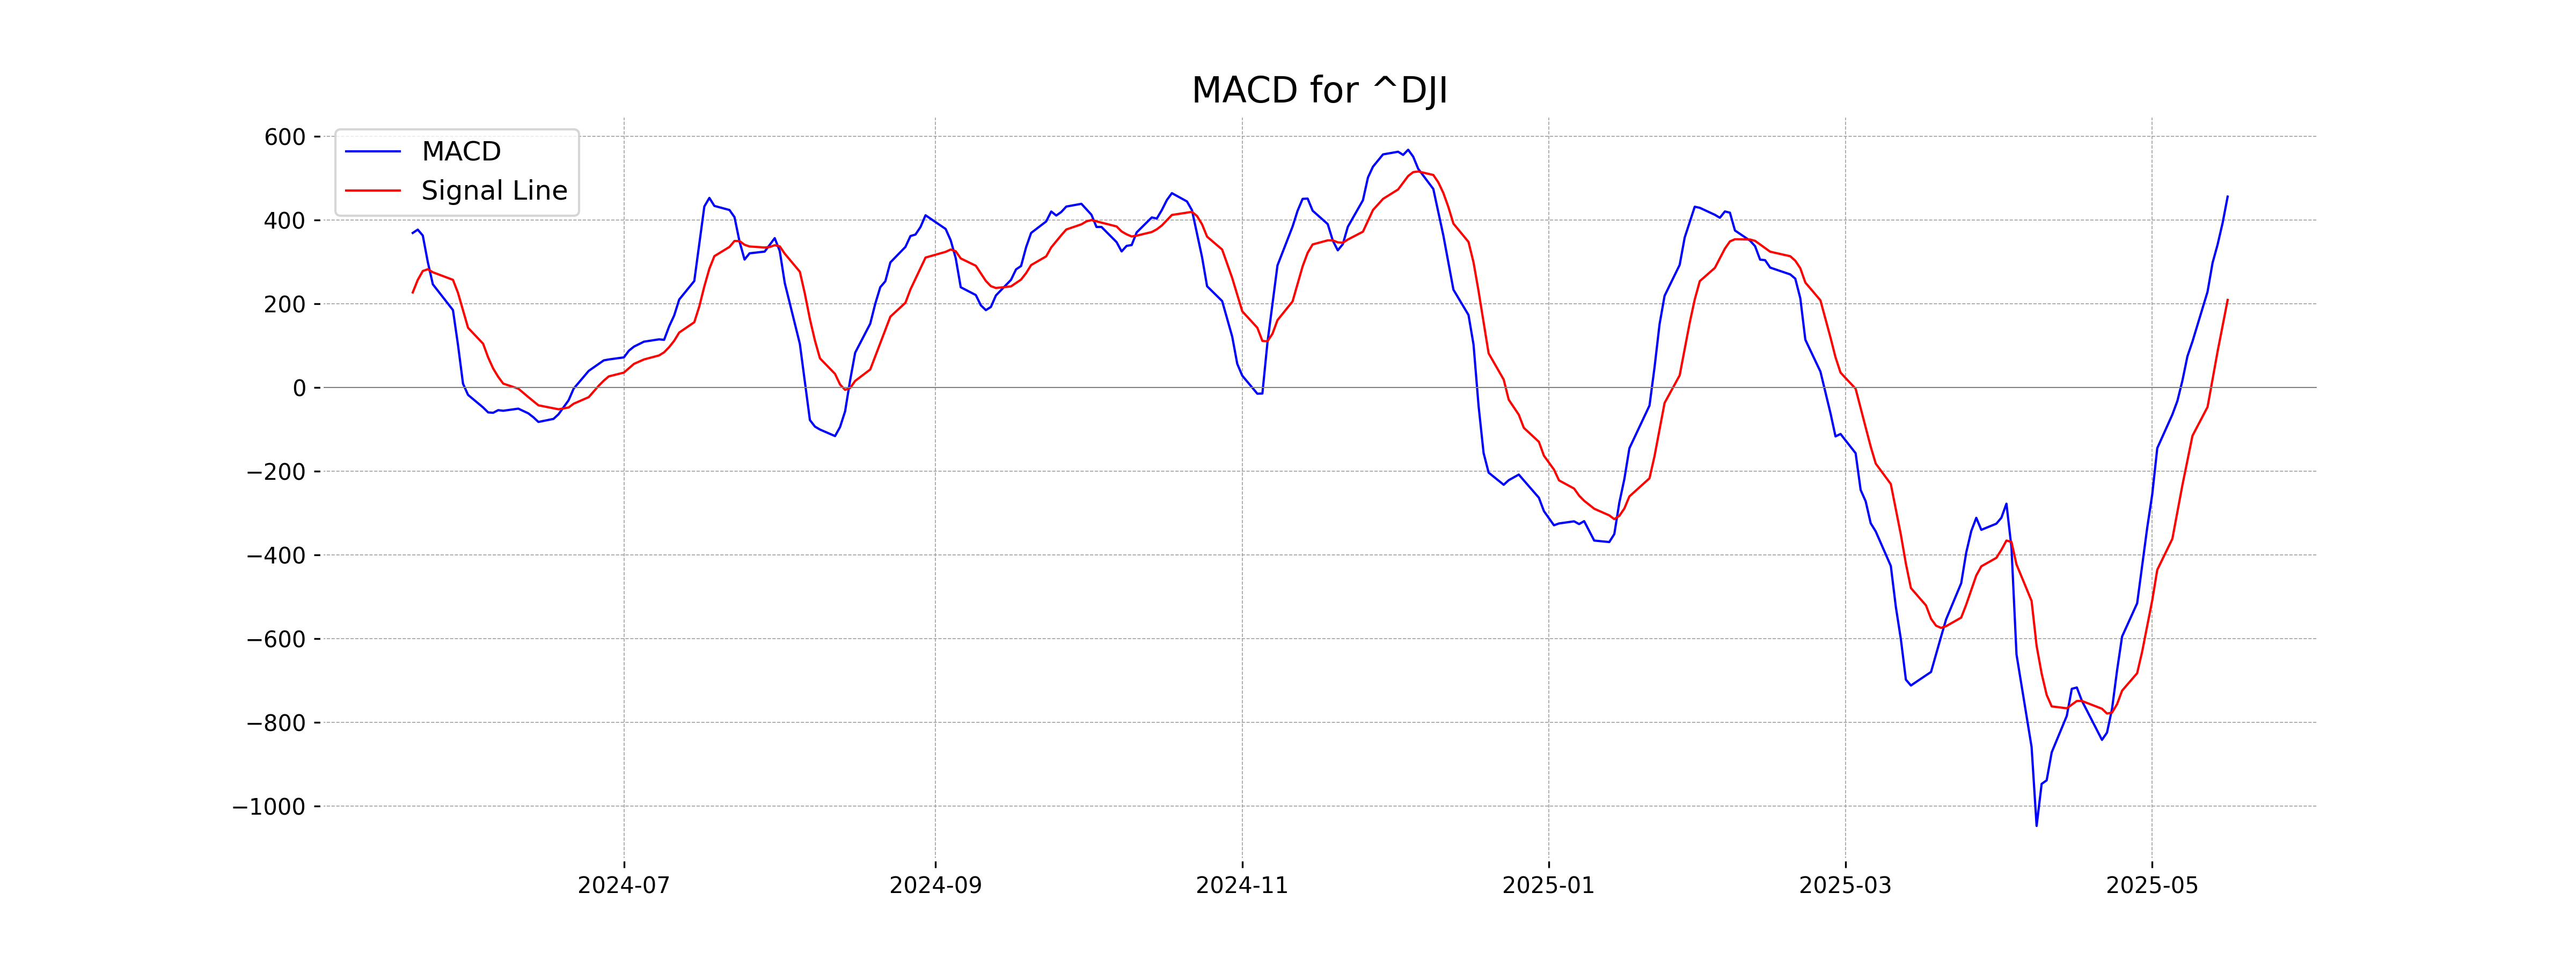
The MACD for the Dow Jones Industrial Average is significantly positive at 456.15, indicating a bullish trend, as it is well above the MACD Signal line of 209.46. This suggests strong upward momentum in the current market scenario.
RSI Analysis
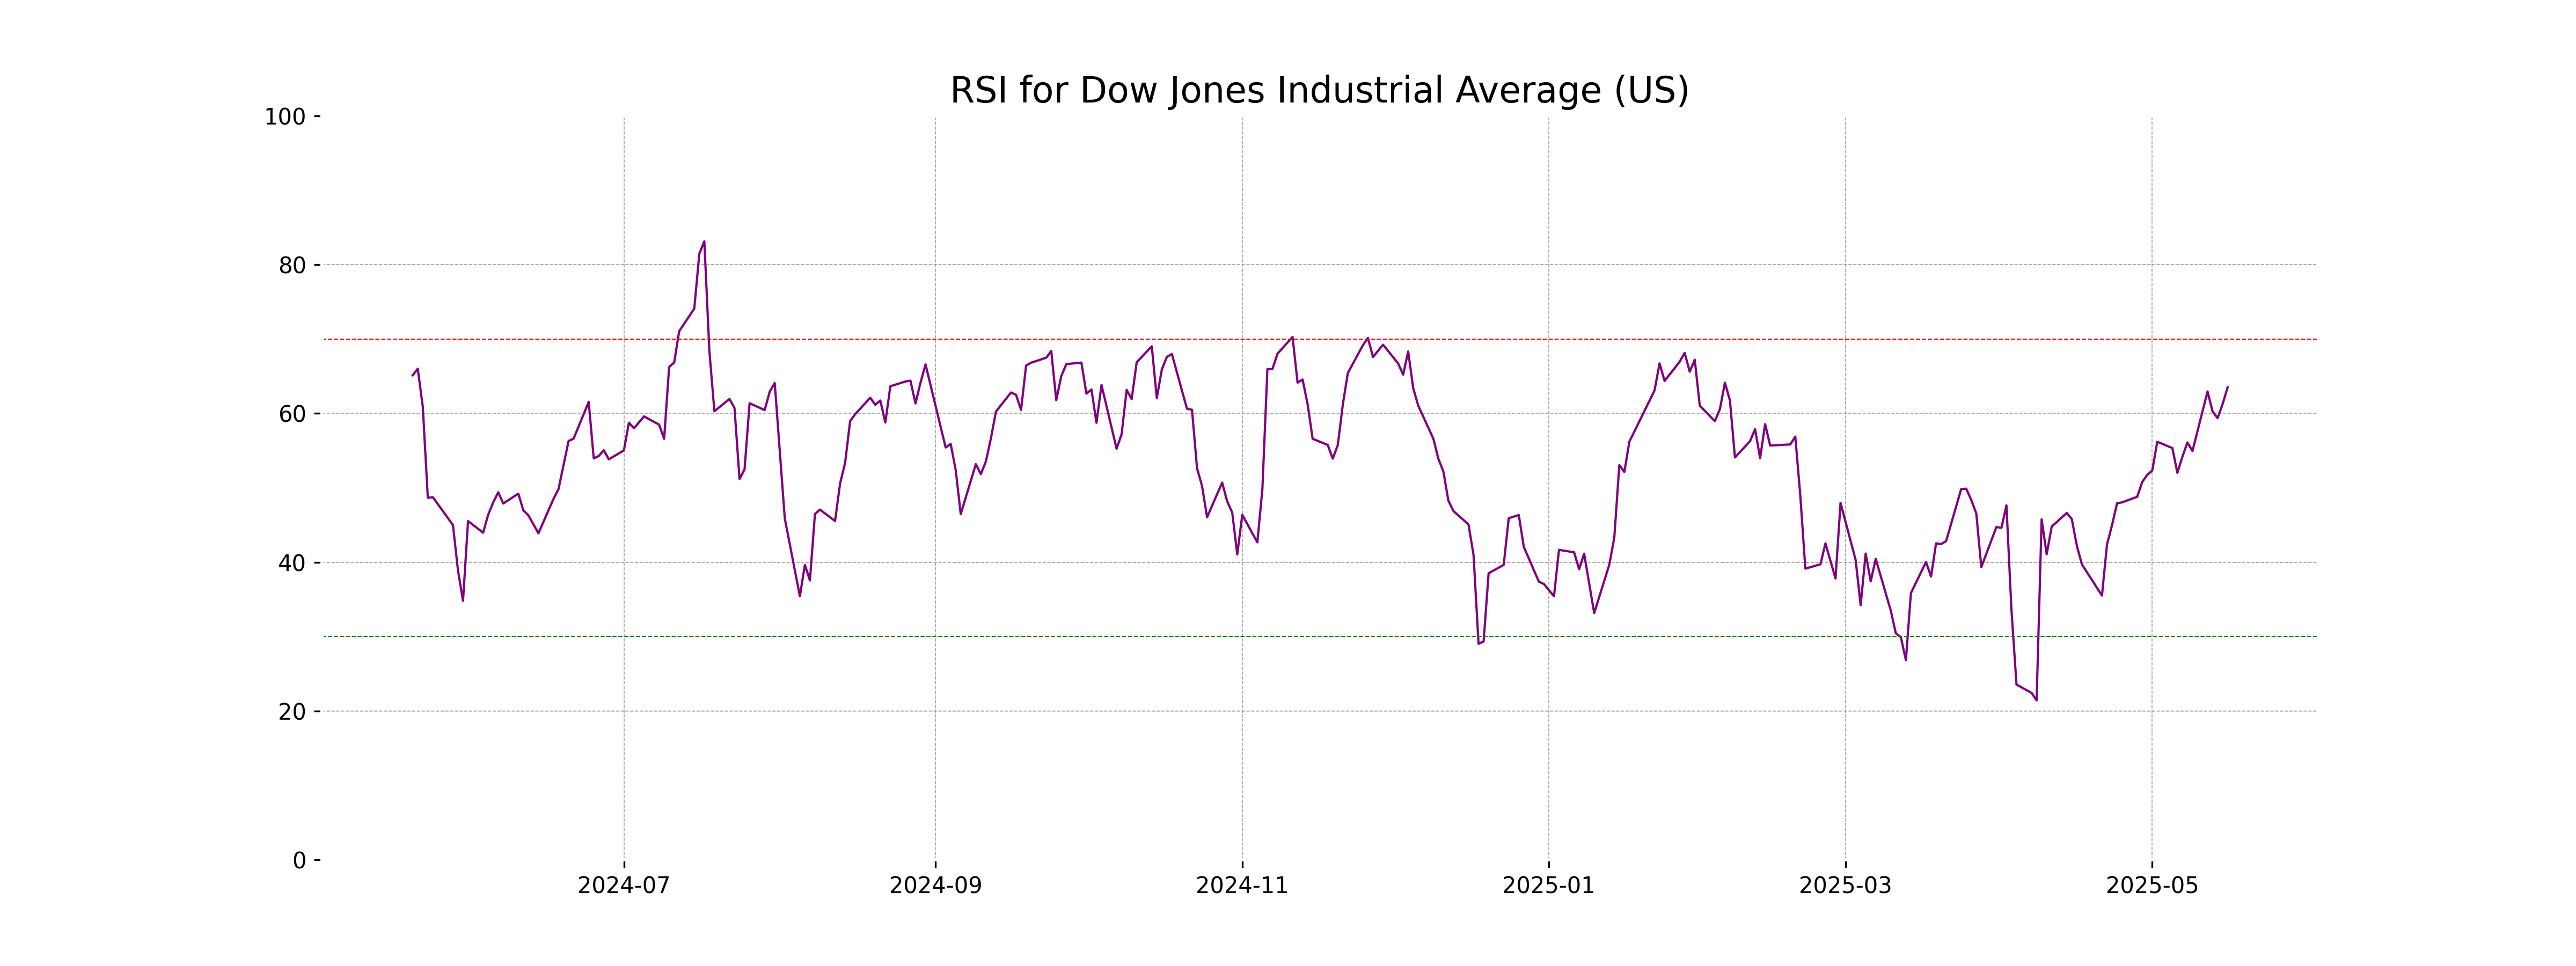
Dow Jones Industrial Average exhibits an RSI of 63.51, which suggests that the index is nearing an overbought condition. Typically, an RSI above 70 indicates overbought, and an RSI below 30 suggests oversold. As current RSI is above 60, caution may be needed for upward momentum continuation.
Analysis for CAC 40 (France) - May 19, 2025
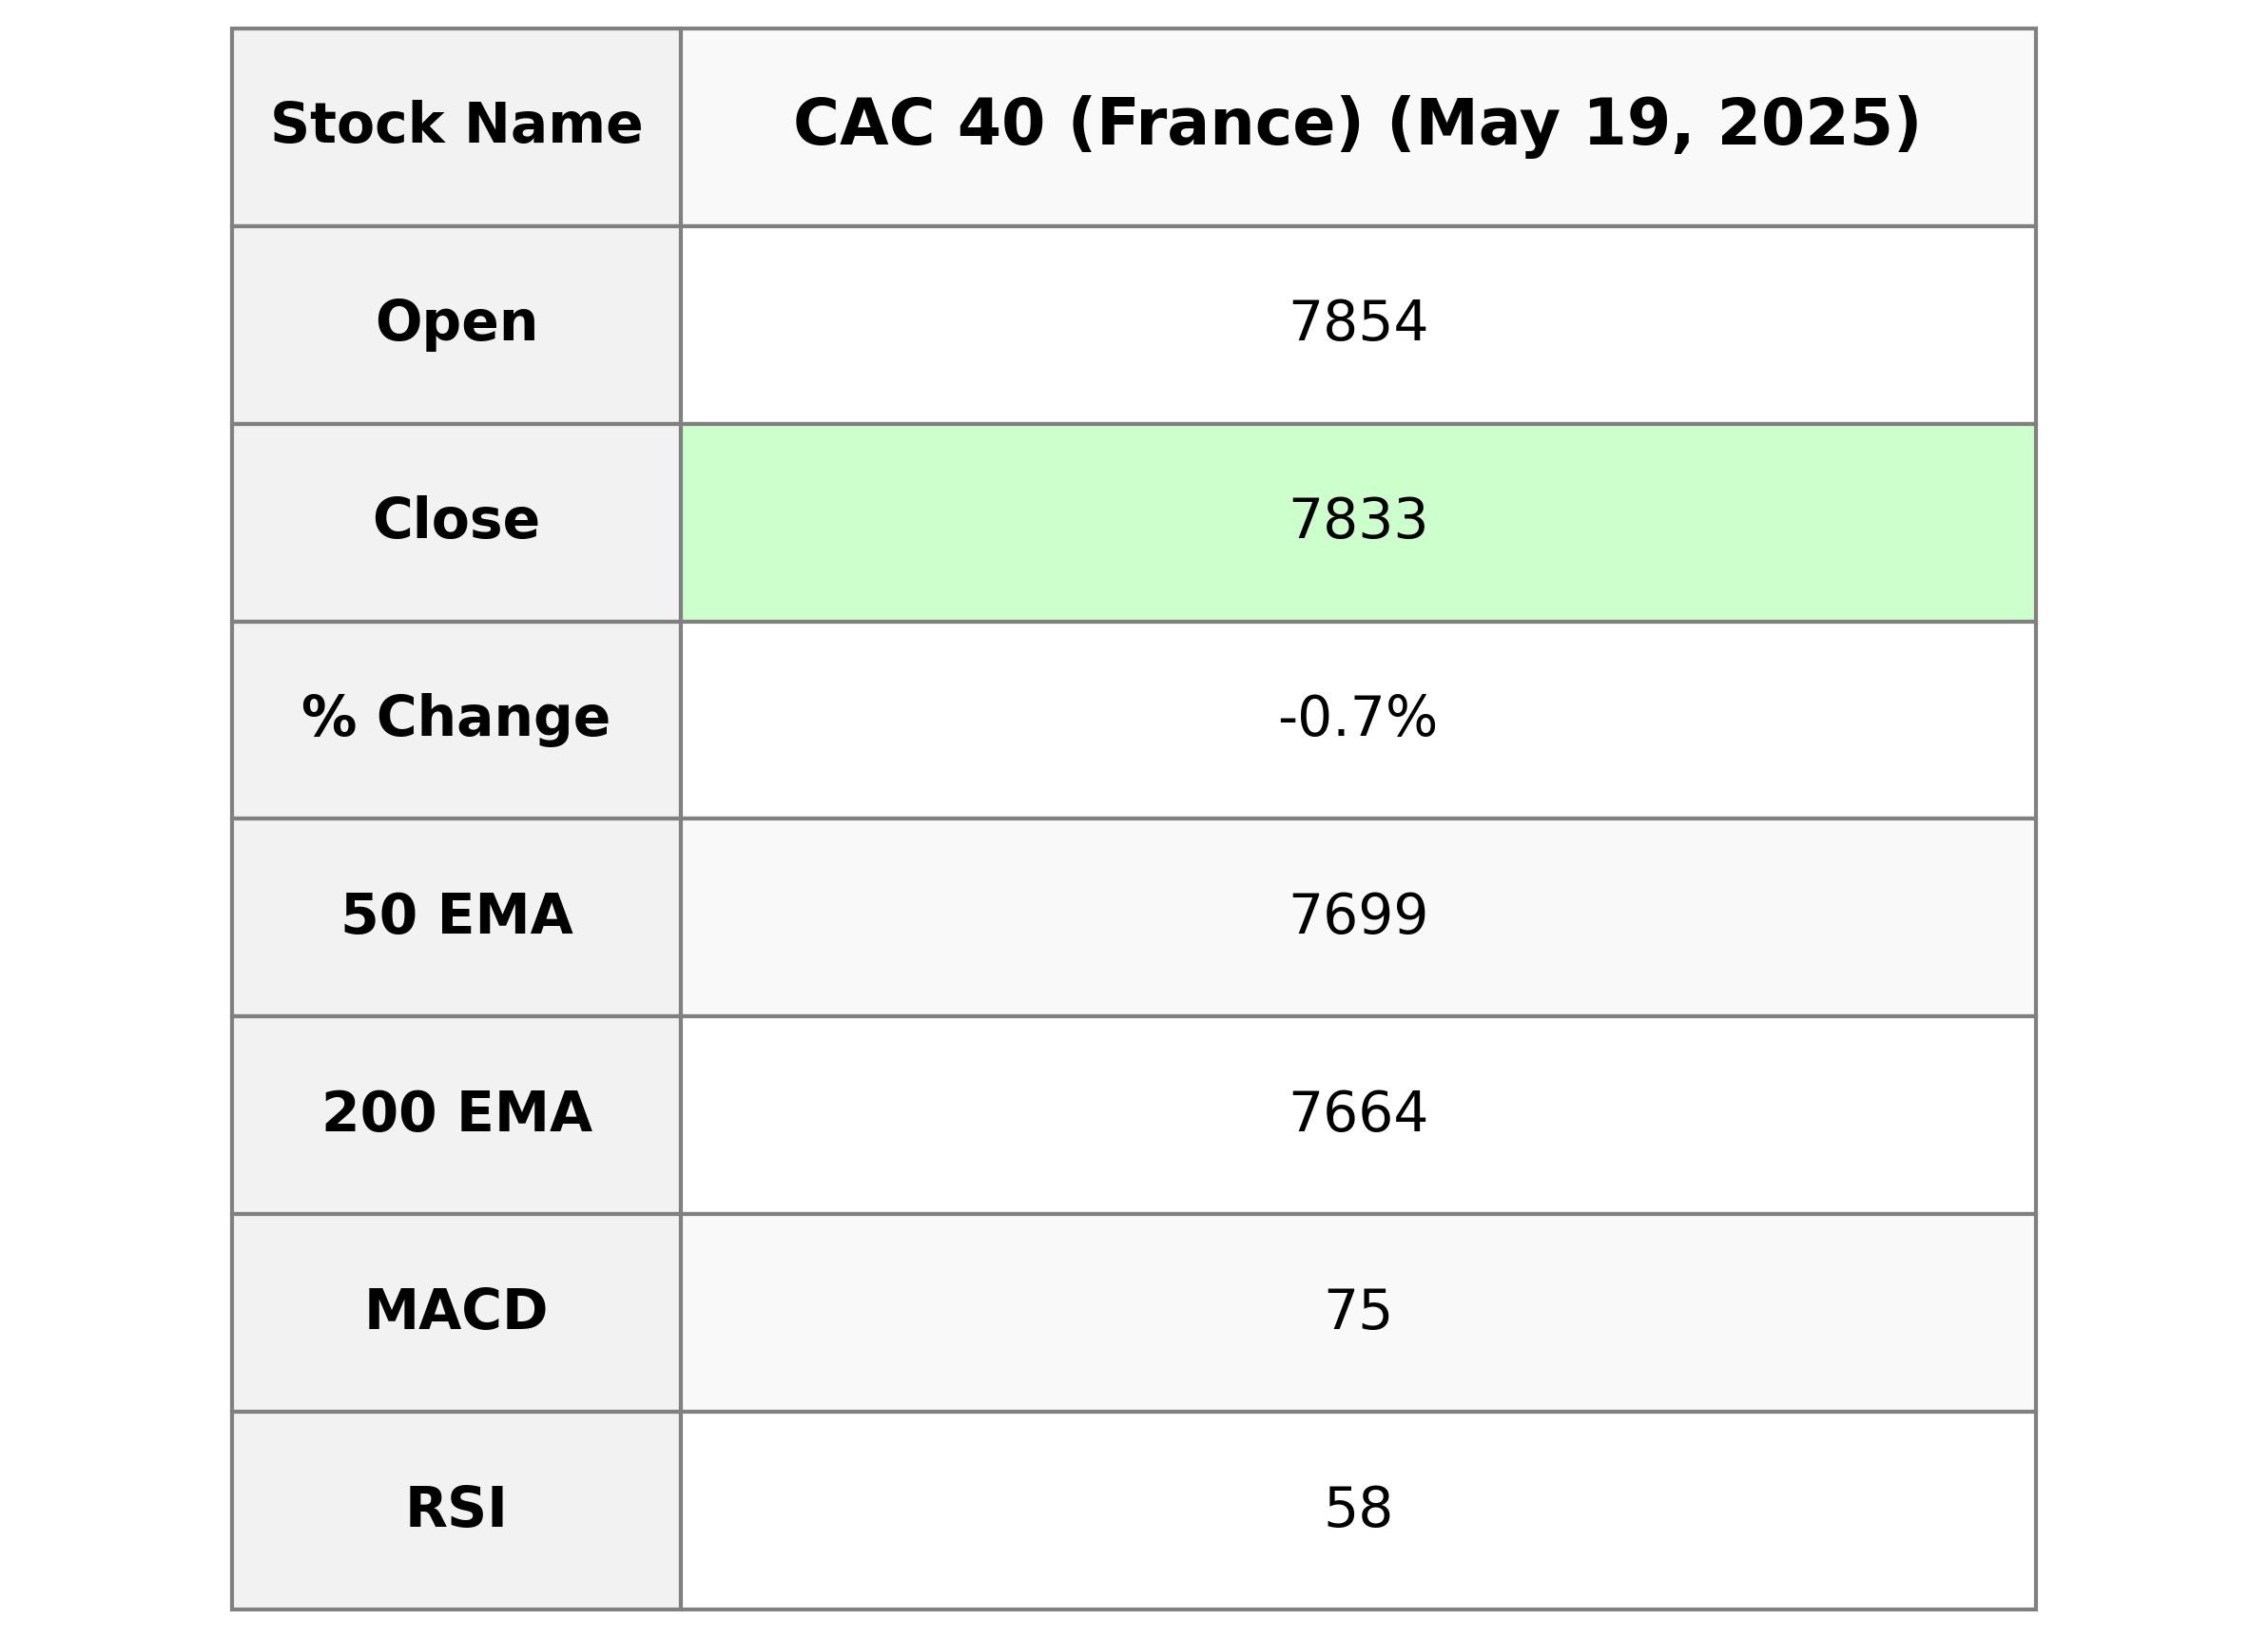
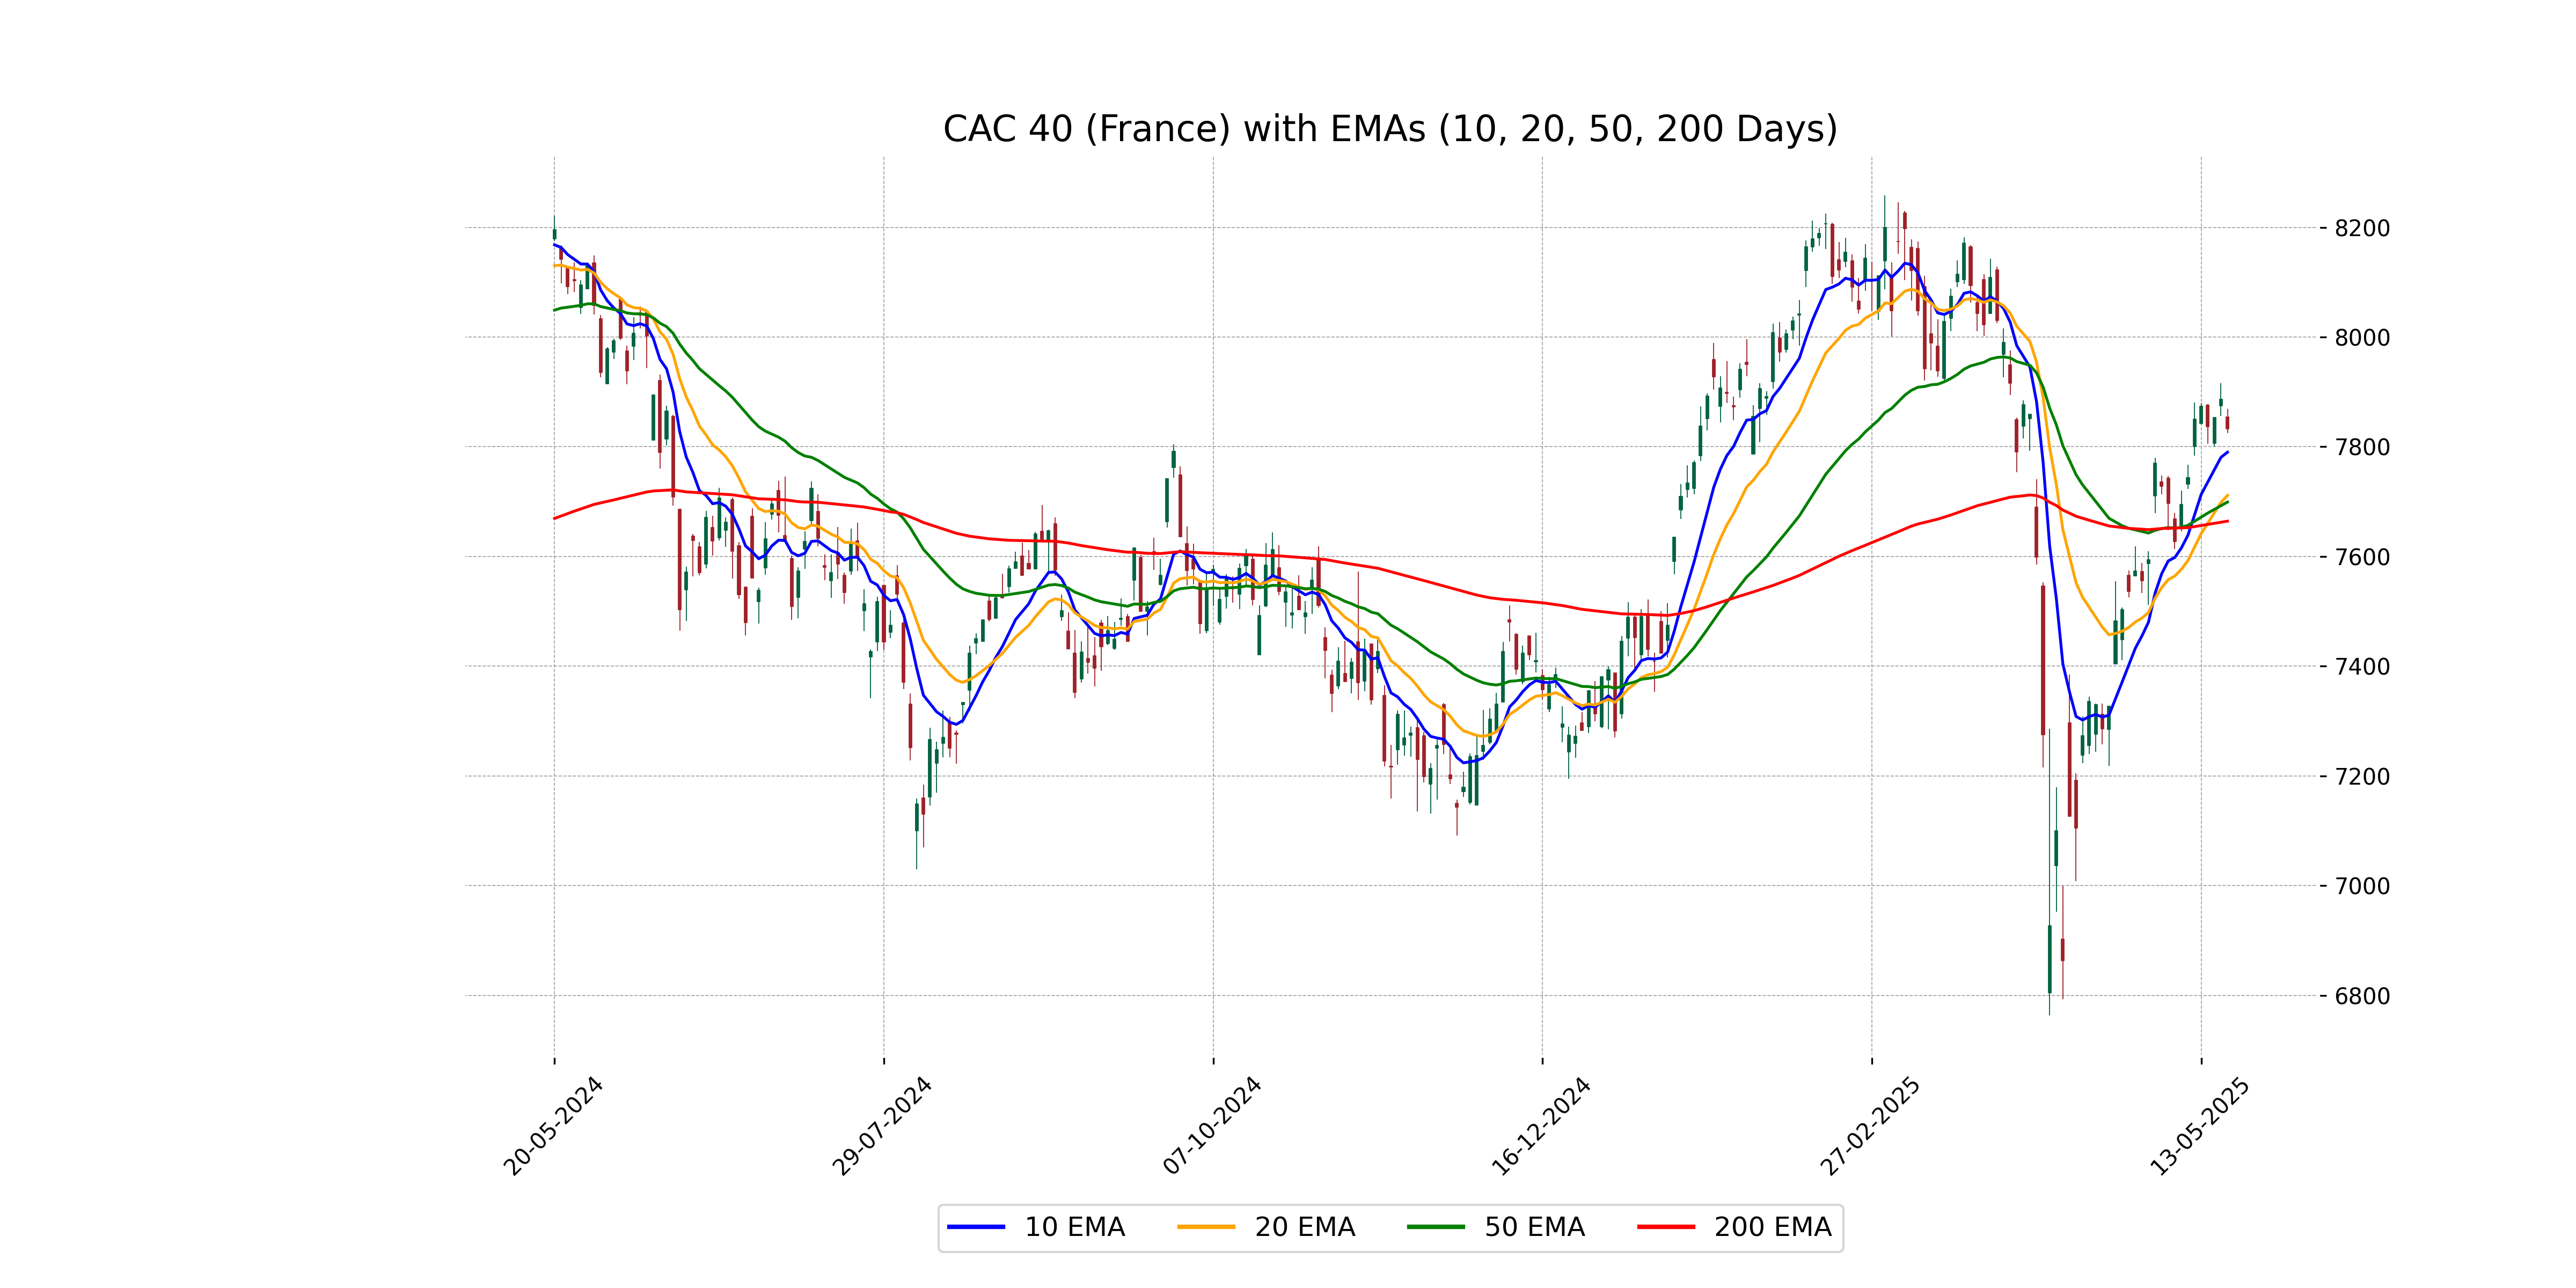
The CAC 40 (France) opened at 7854.11, reached a high of 7868.87, and closed at 7832.80, marking a decrease of 0.68% or 53.89 points from the previous close of 7886.69. The RSI is at 58.05, indicating a moderately strong market, with the MACD suggesting a bullish trend. The EMA indicators show the current trend is above both the 50-day and 200-day averages, with the 10-day EMA at 7790.08.
Relationship with Key Moving Averages
The closing value of CAC 40 is 7832.80, which is above the 50-day EMA of 7699.22 and the 200-day EMA of 7664.30, indicating a potential bullish trend. However, it is slightly above the 10-day EMA of 7790.08 and below the previous close, suggesting mixed short-term momentum.
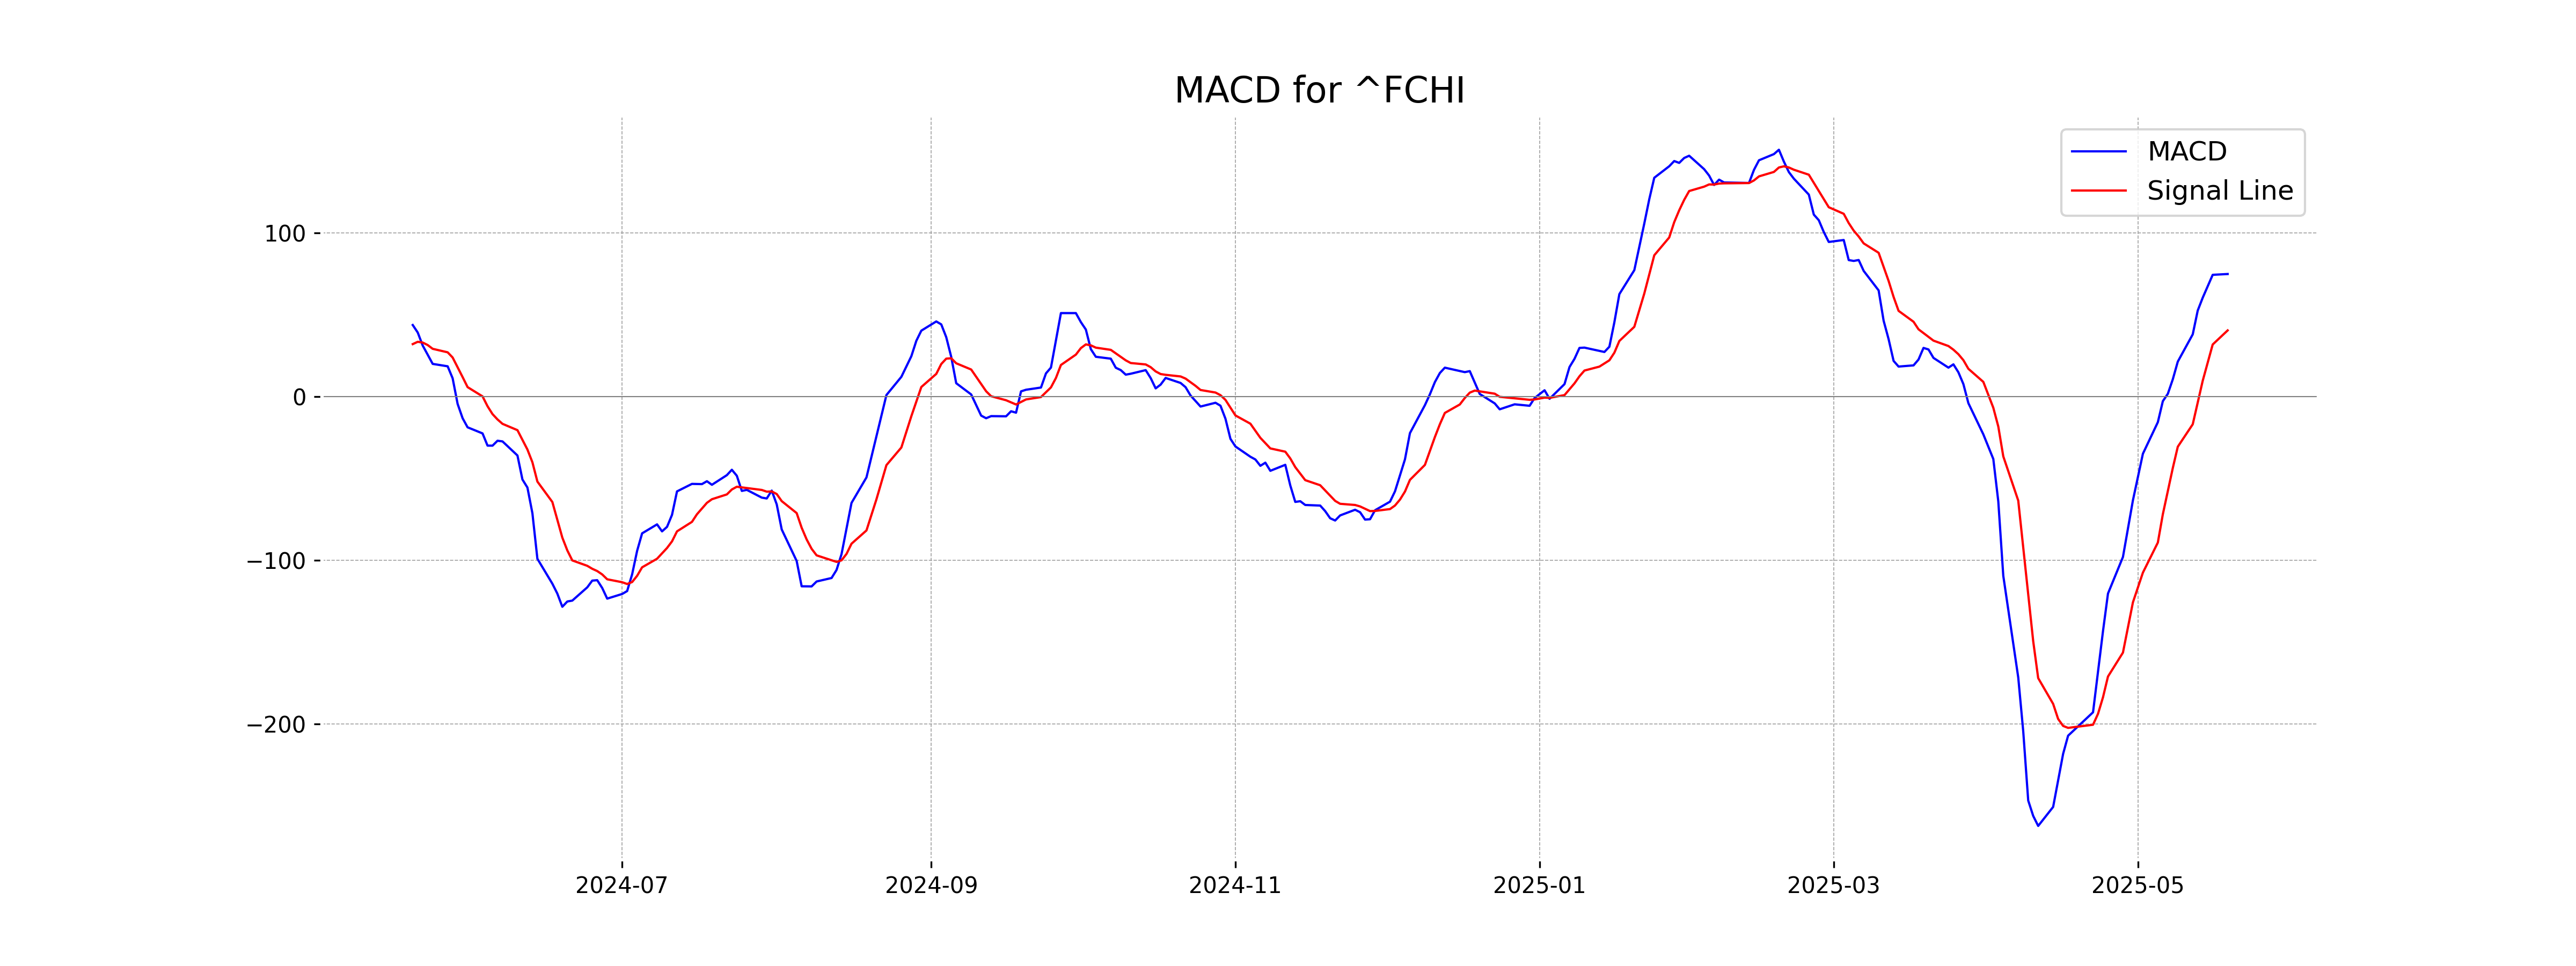
Moving Averages Trend (MACD)
The CAC 40 index shows a MACD value of 74.82, which is above the MACD Signal of 40.37, suggesting a bullish trend. This indicates possible upward momentum in the market.
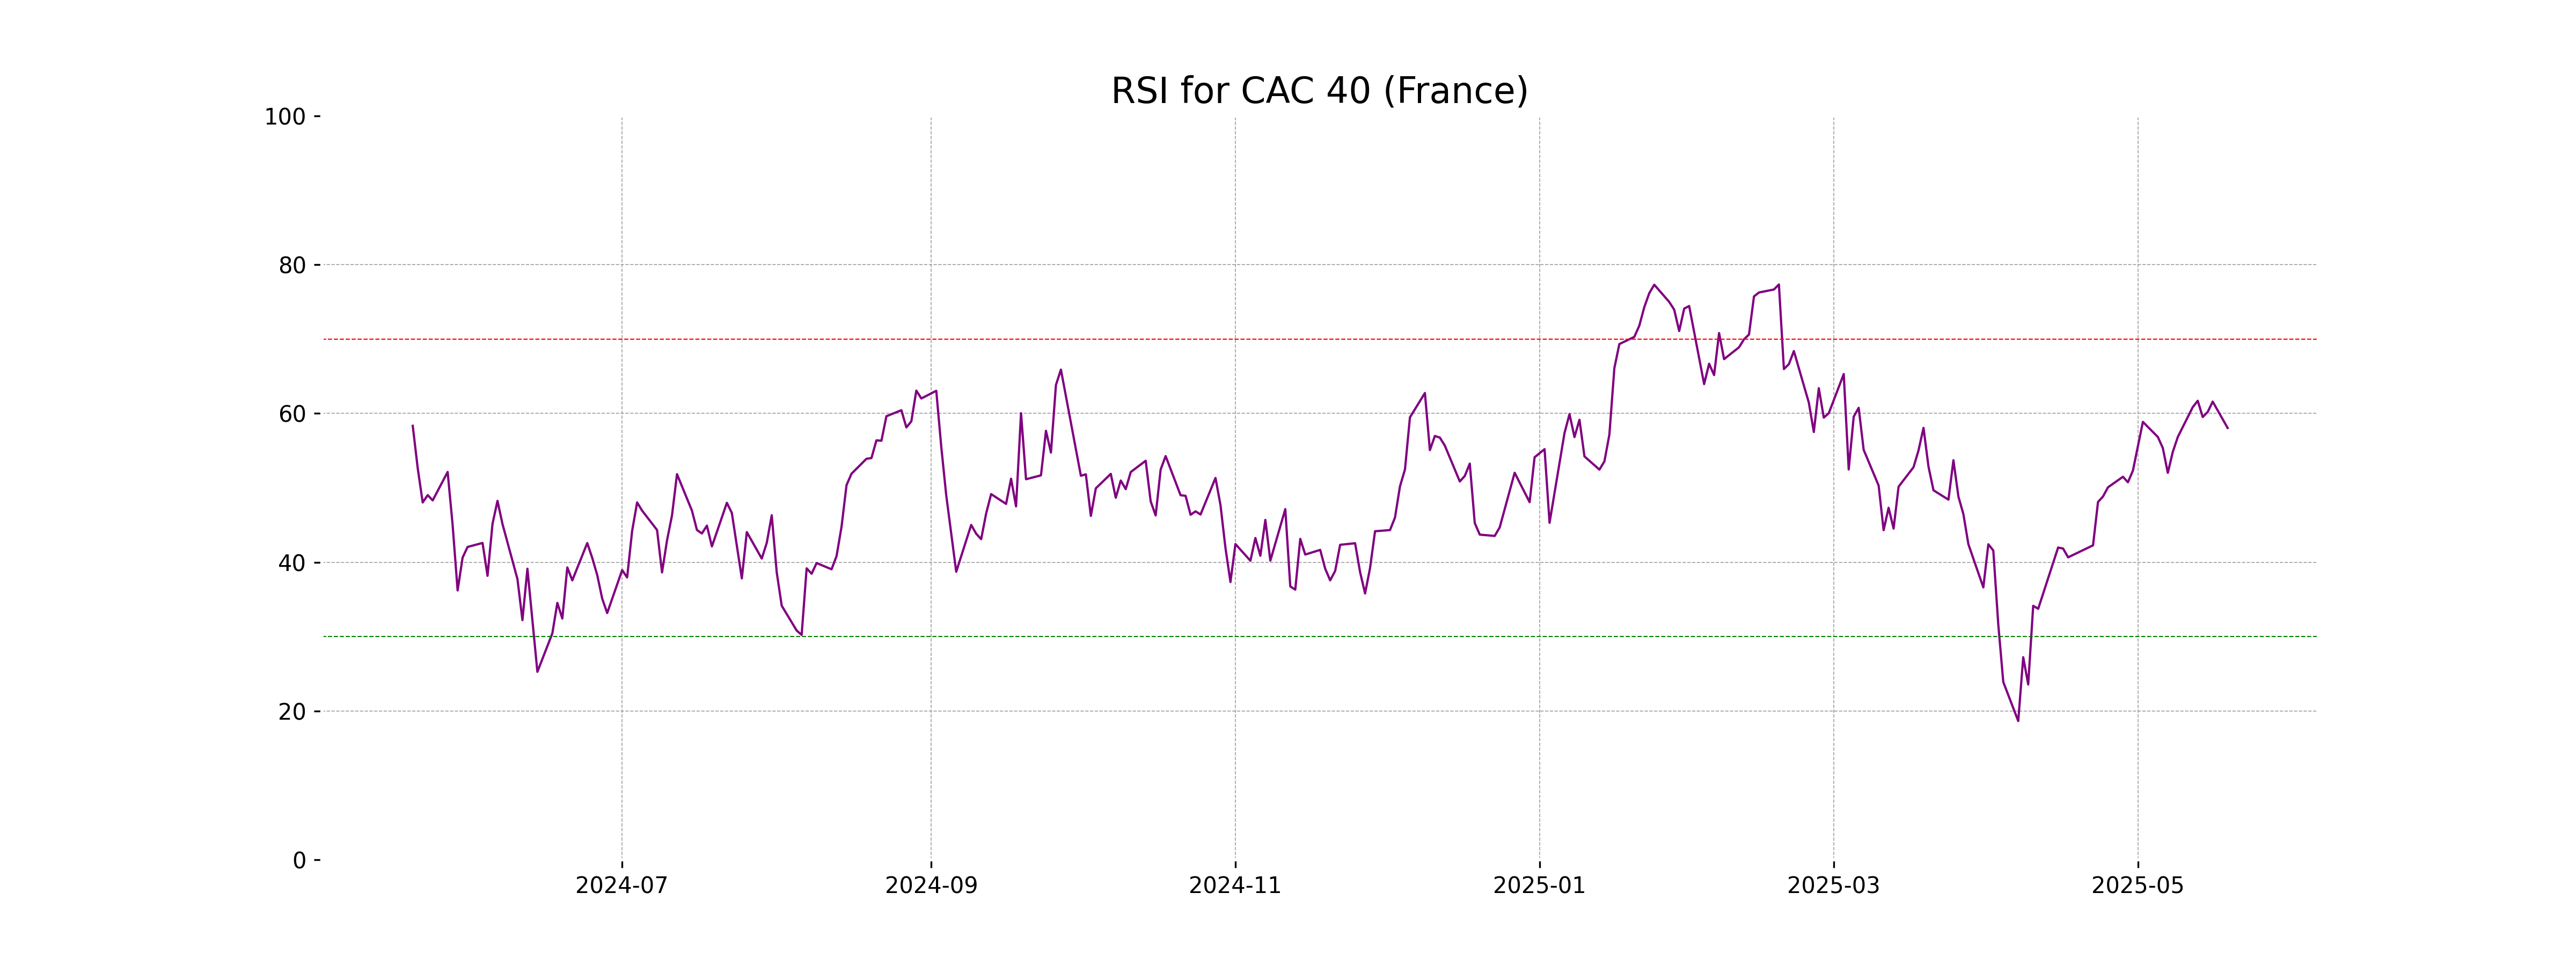
RSI Analysis
For CAC 40 (France), the RSI value is 58.05, which indicates a neutral position leaning towards slightly overbought conditions. An RSI value above 70 typically indicates overbought territory, while below 30 suggests oversold conditions, so the current level is reasonably balanced.
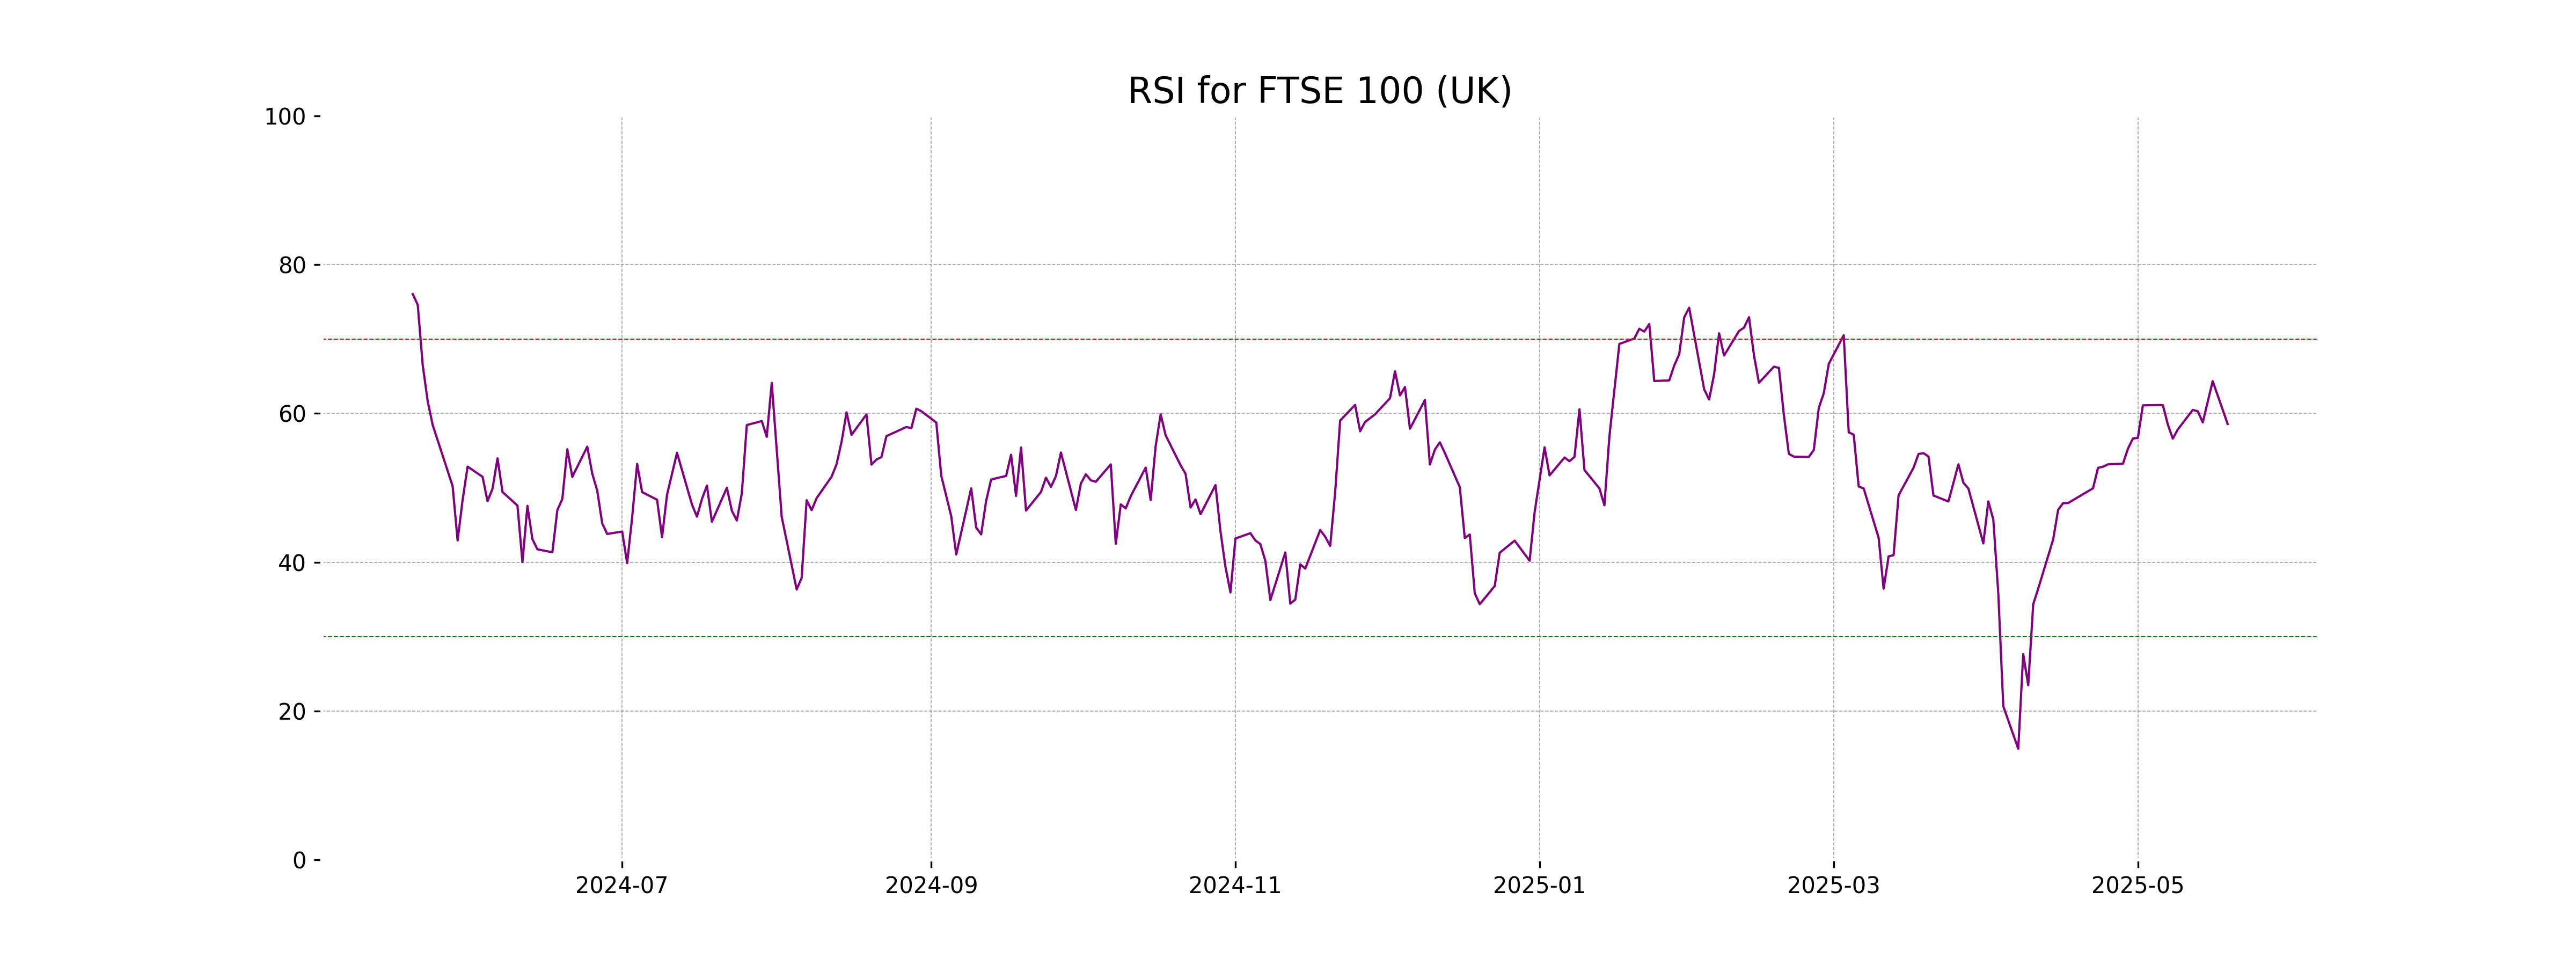
Analysis for FTSE 100 (UK) - May 19, 2025

FTSE 100 (UK) opened at 8684.56, reached a high of 8684.86 and a low of 8613.47, closing at 8619.41, which marks a decrease of 0.75%. The index experienced a points change of -65.19, with technical indicators showing a 50-day EMA of 8485.78 and an RSI of 58.58, indicating moderate momentum.
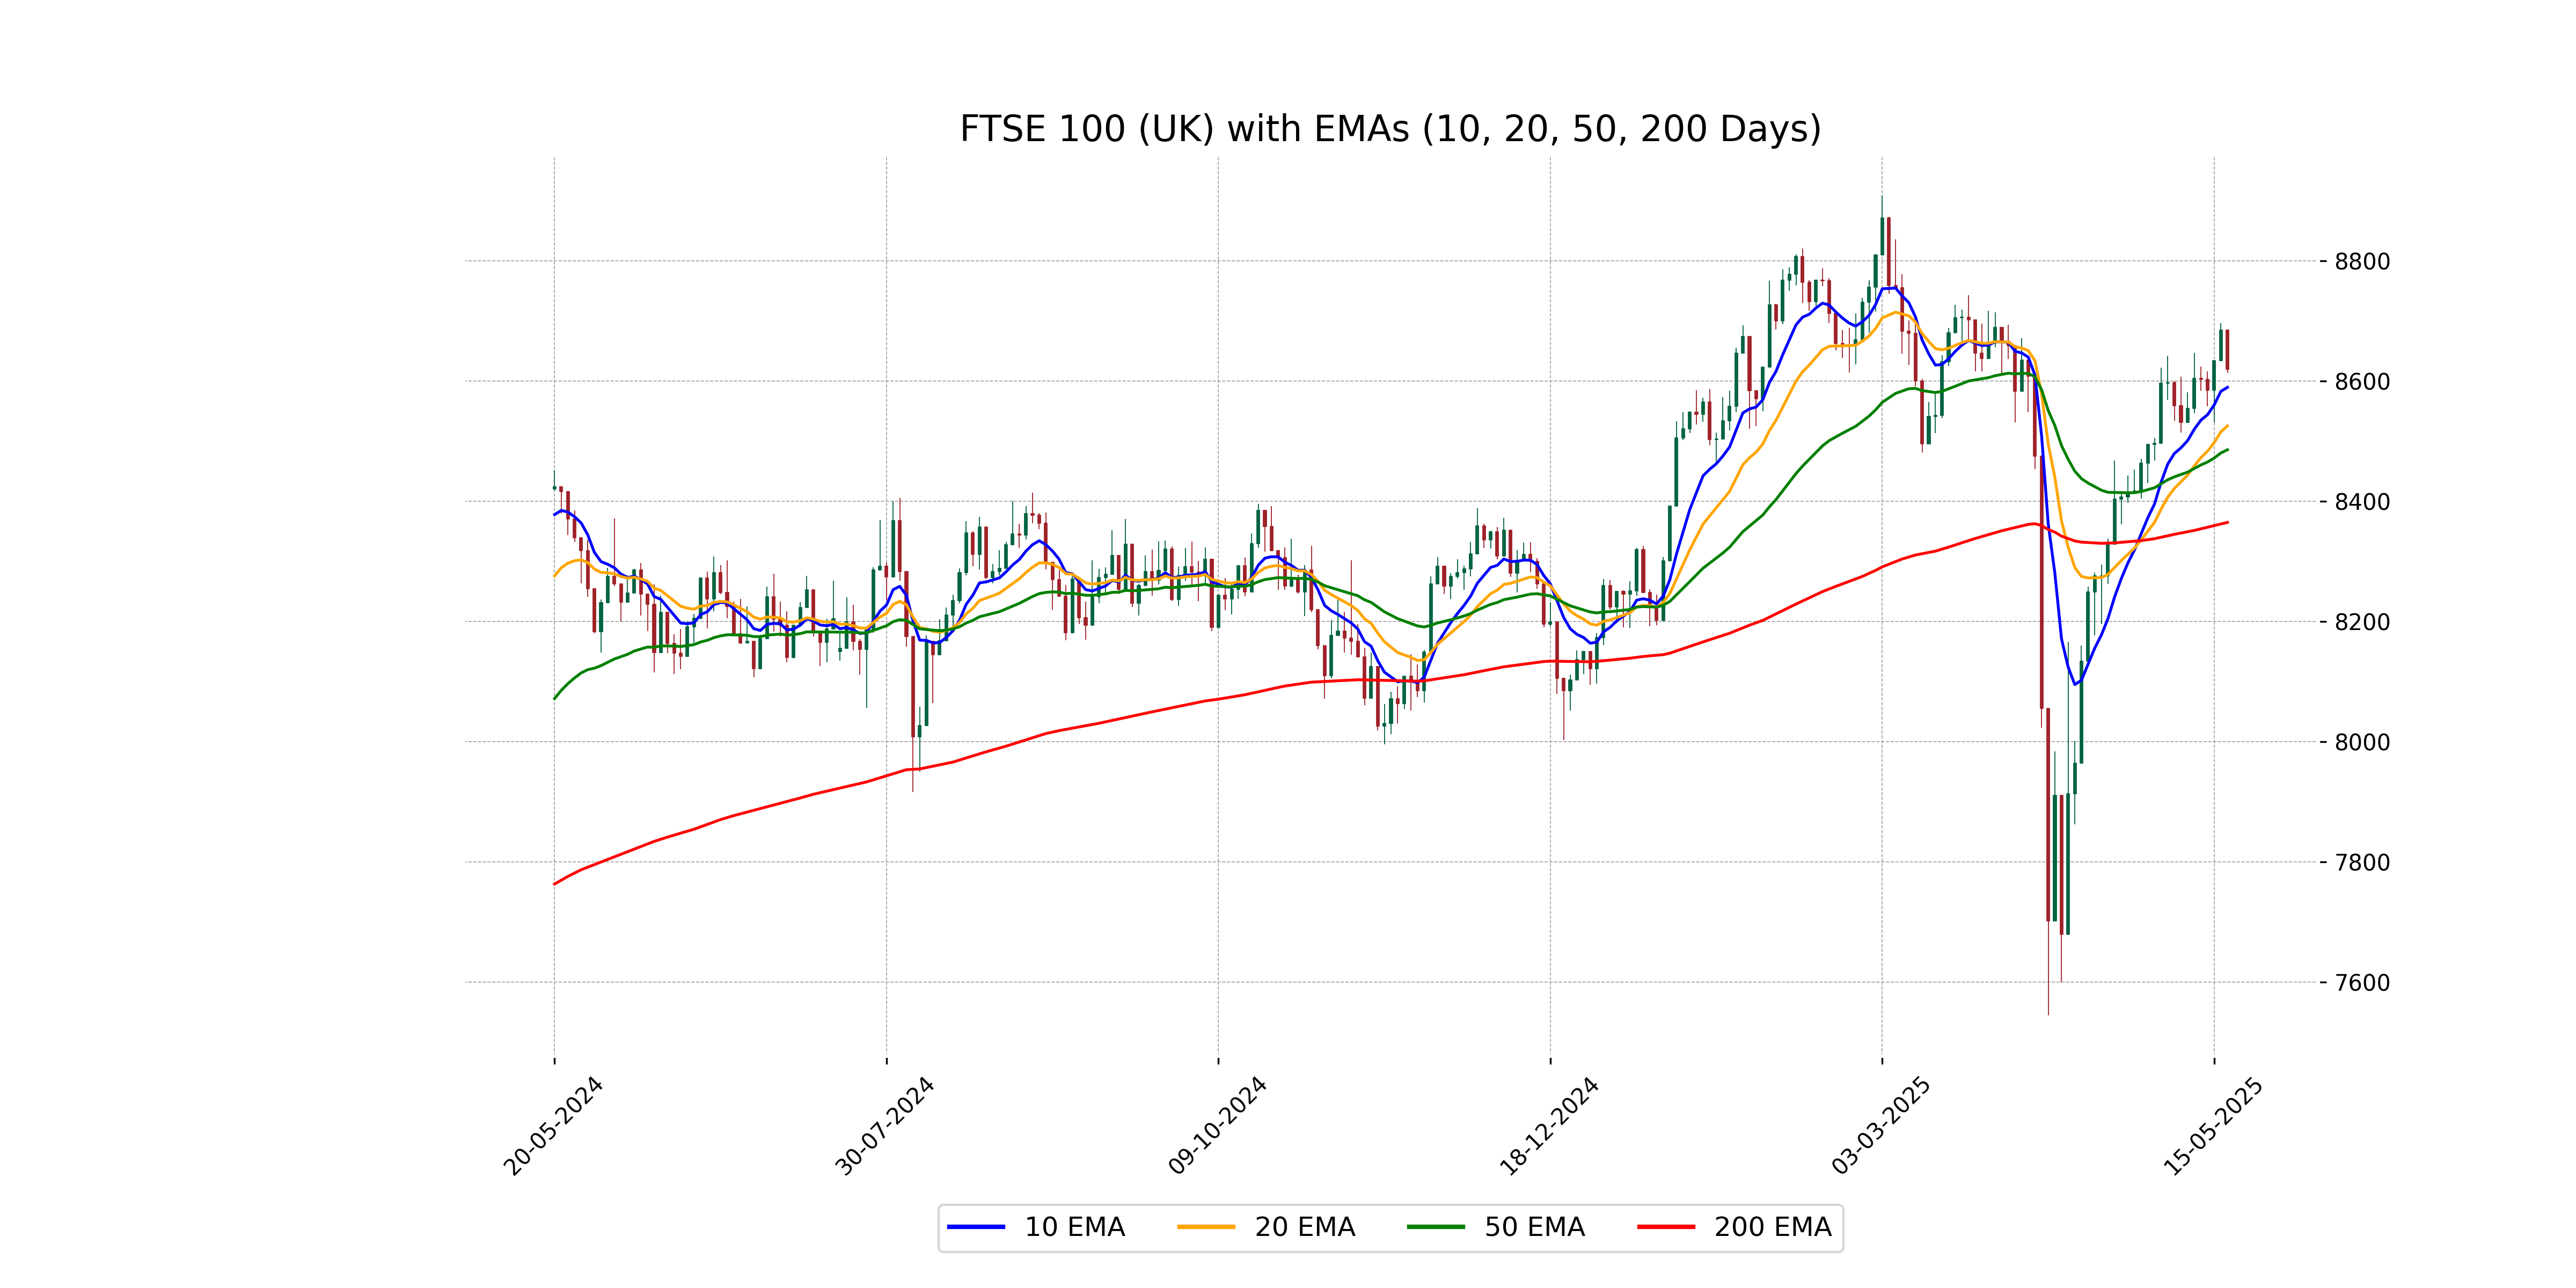
Relationship with Key Moving Averages
The FTSE 100 closed at 8619.41, which is above its 50-day EMA of 8485.78 and its 200-day EMA of 8364.87, indicating a bullish trend over both medium and long-term periods. However, the close is slightly above the 10-day EMA of 8589.61 and the daily change shows a decline, which might suggest recent selling pressure despite the overall upward trend.
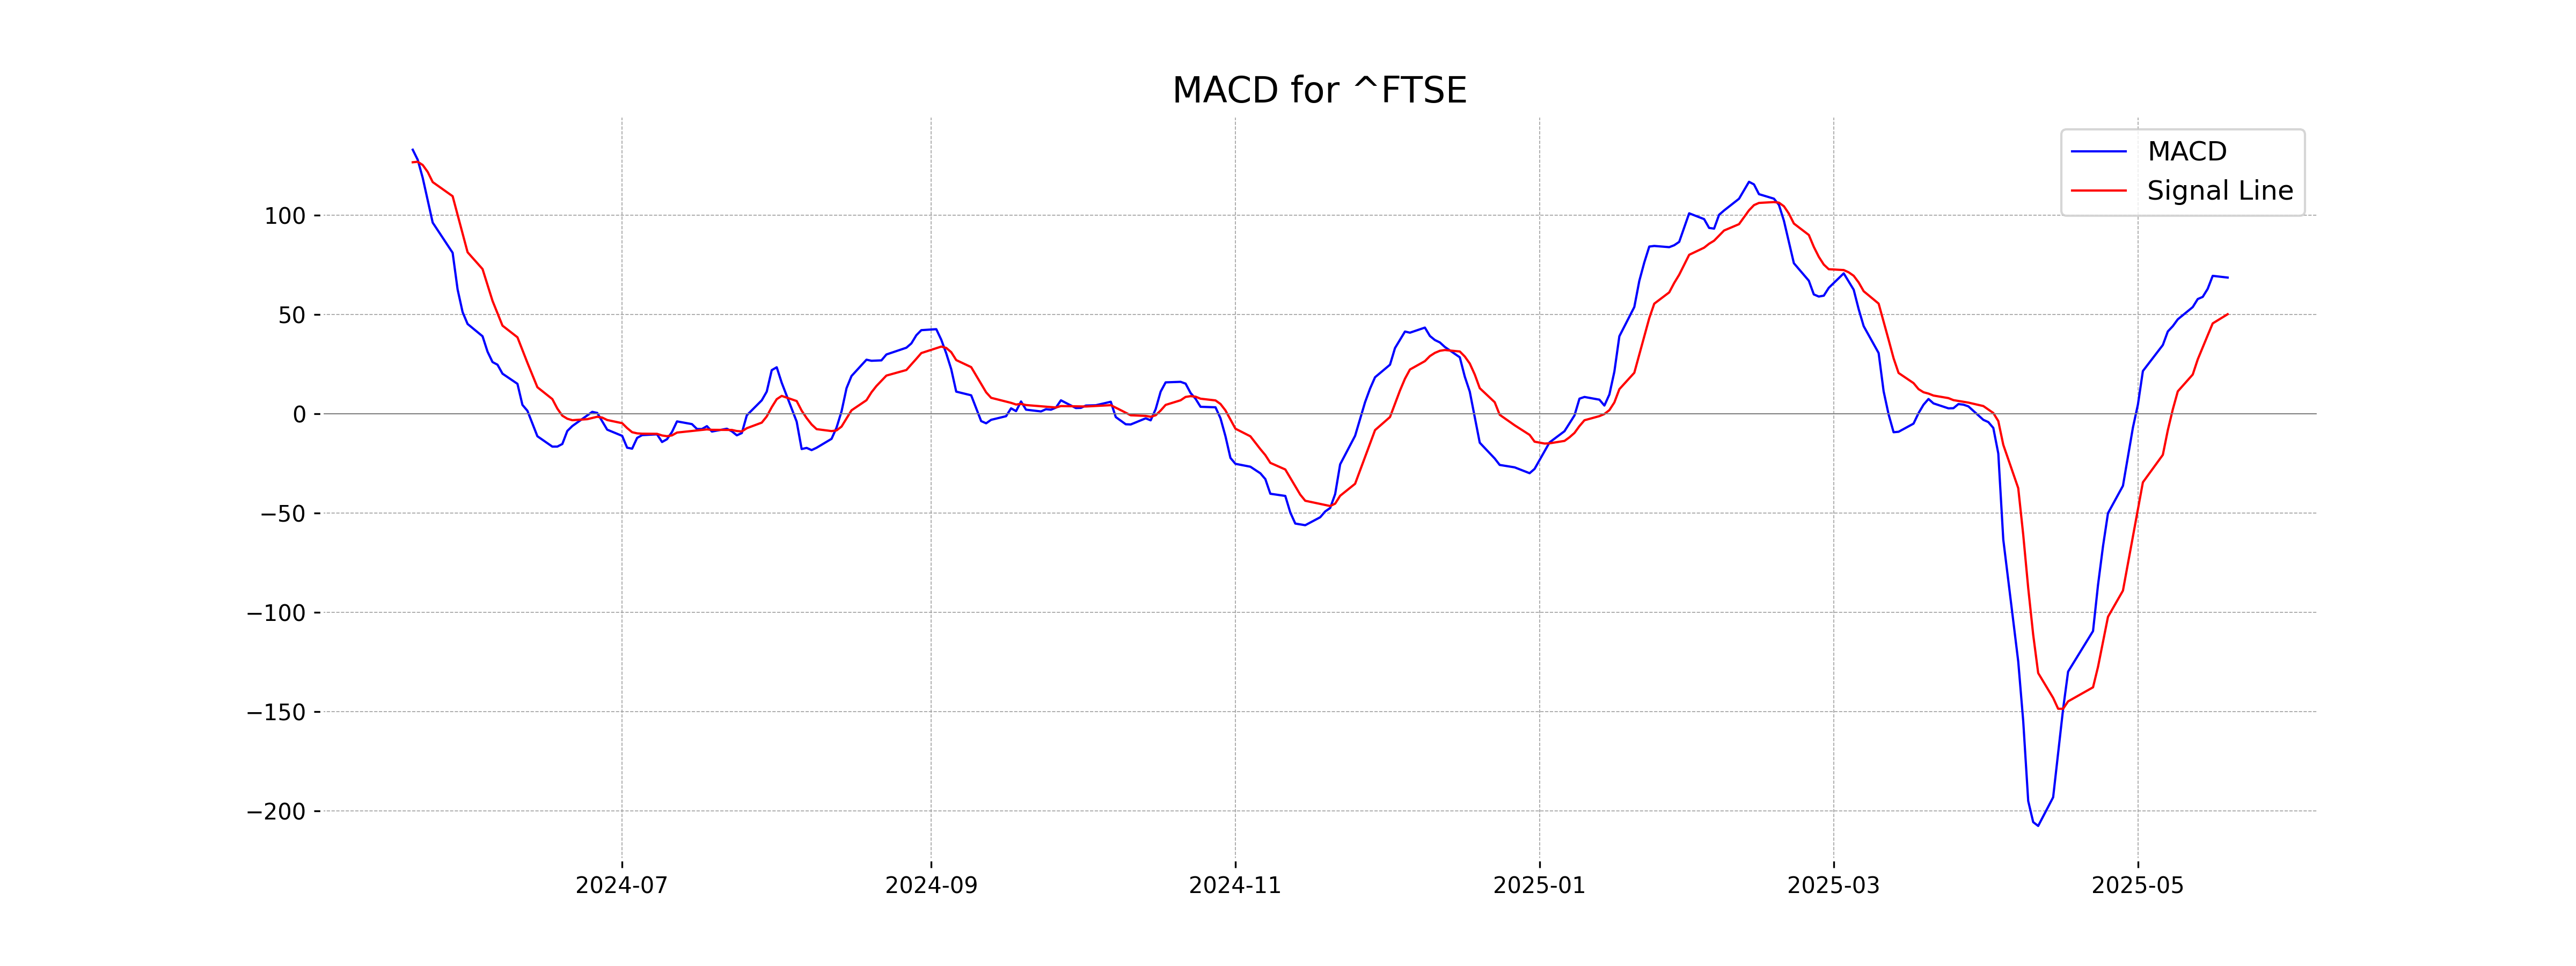
Moving Averages Trend (MACD)
FTSE 100 (UK): The MACD line is at 68.49, which is above the MACD Signal line at 50.03. This suggests a bullish signal indicating potential upward momentum in the current price trend.
RSI Analysis
The Relative Strength Index (RSI) for FTSE 100 is 58.58, indicating a neutral condition, as it is relatively in the middle of the typical range of 30-70. This suggests neither strongly overbought nor oversold levels, hinting at a potential stabilization or continuation of current market trends.
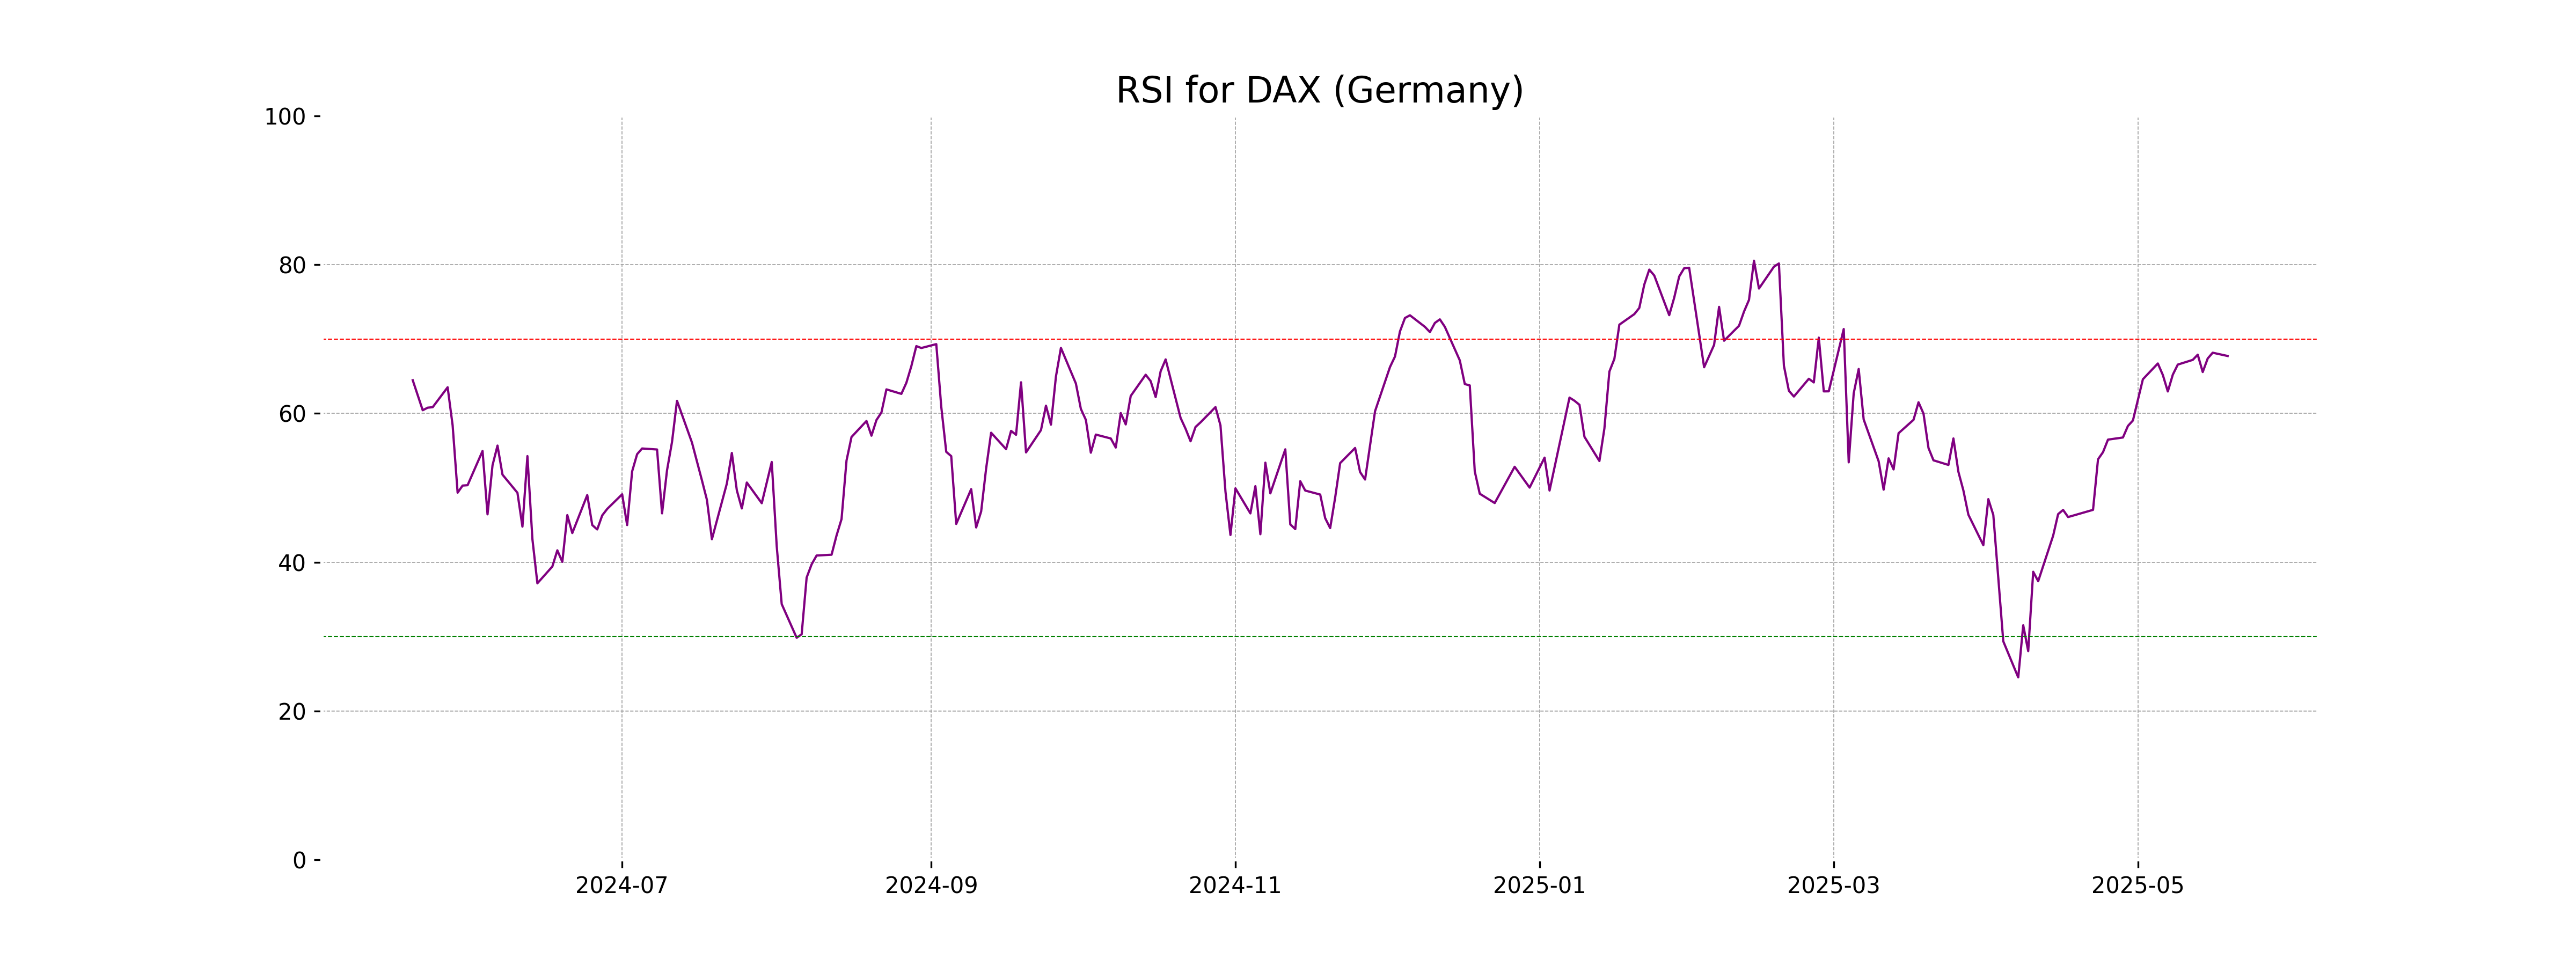
Analysis for DAX (Germany) - May 19, 2025
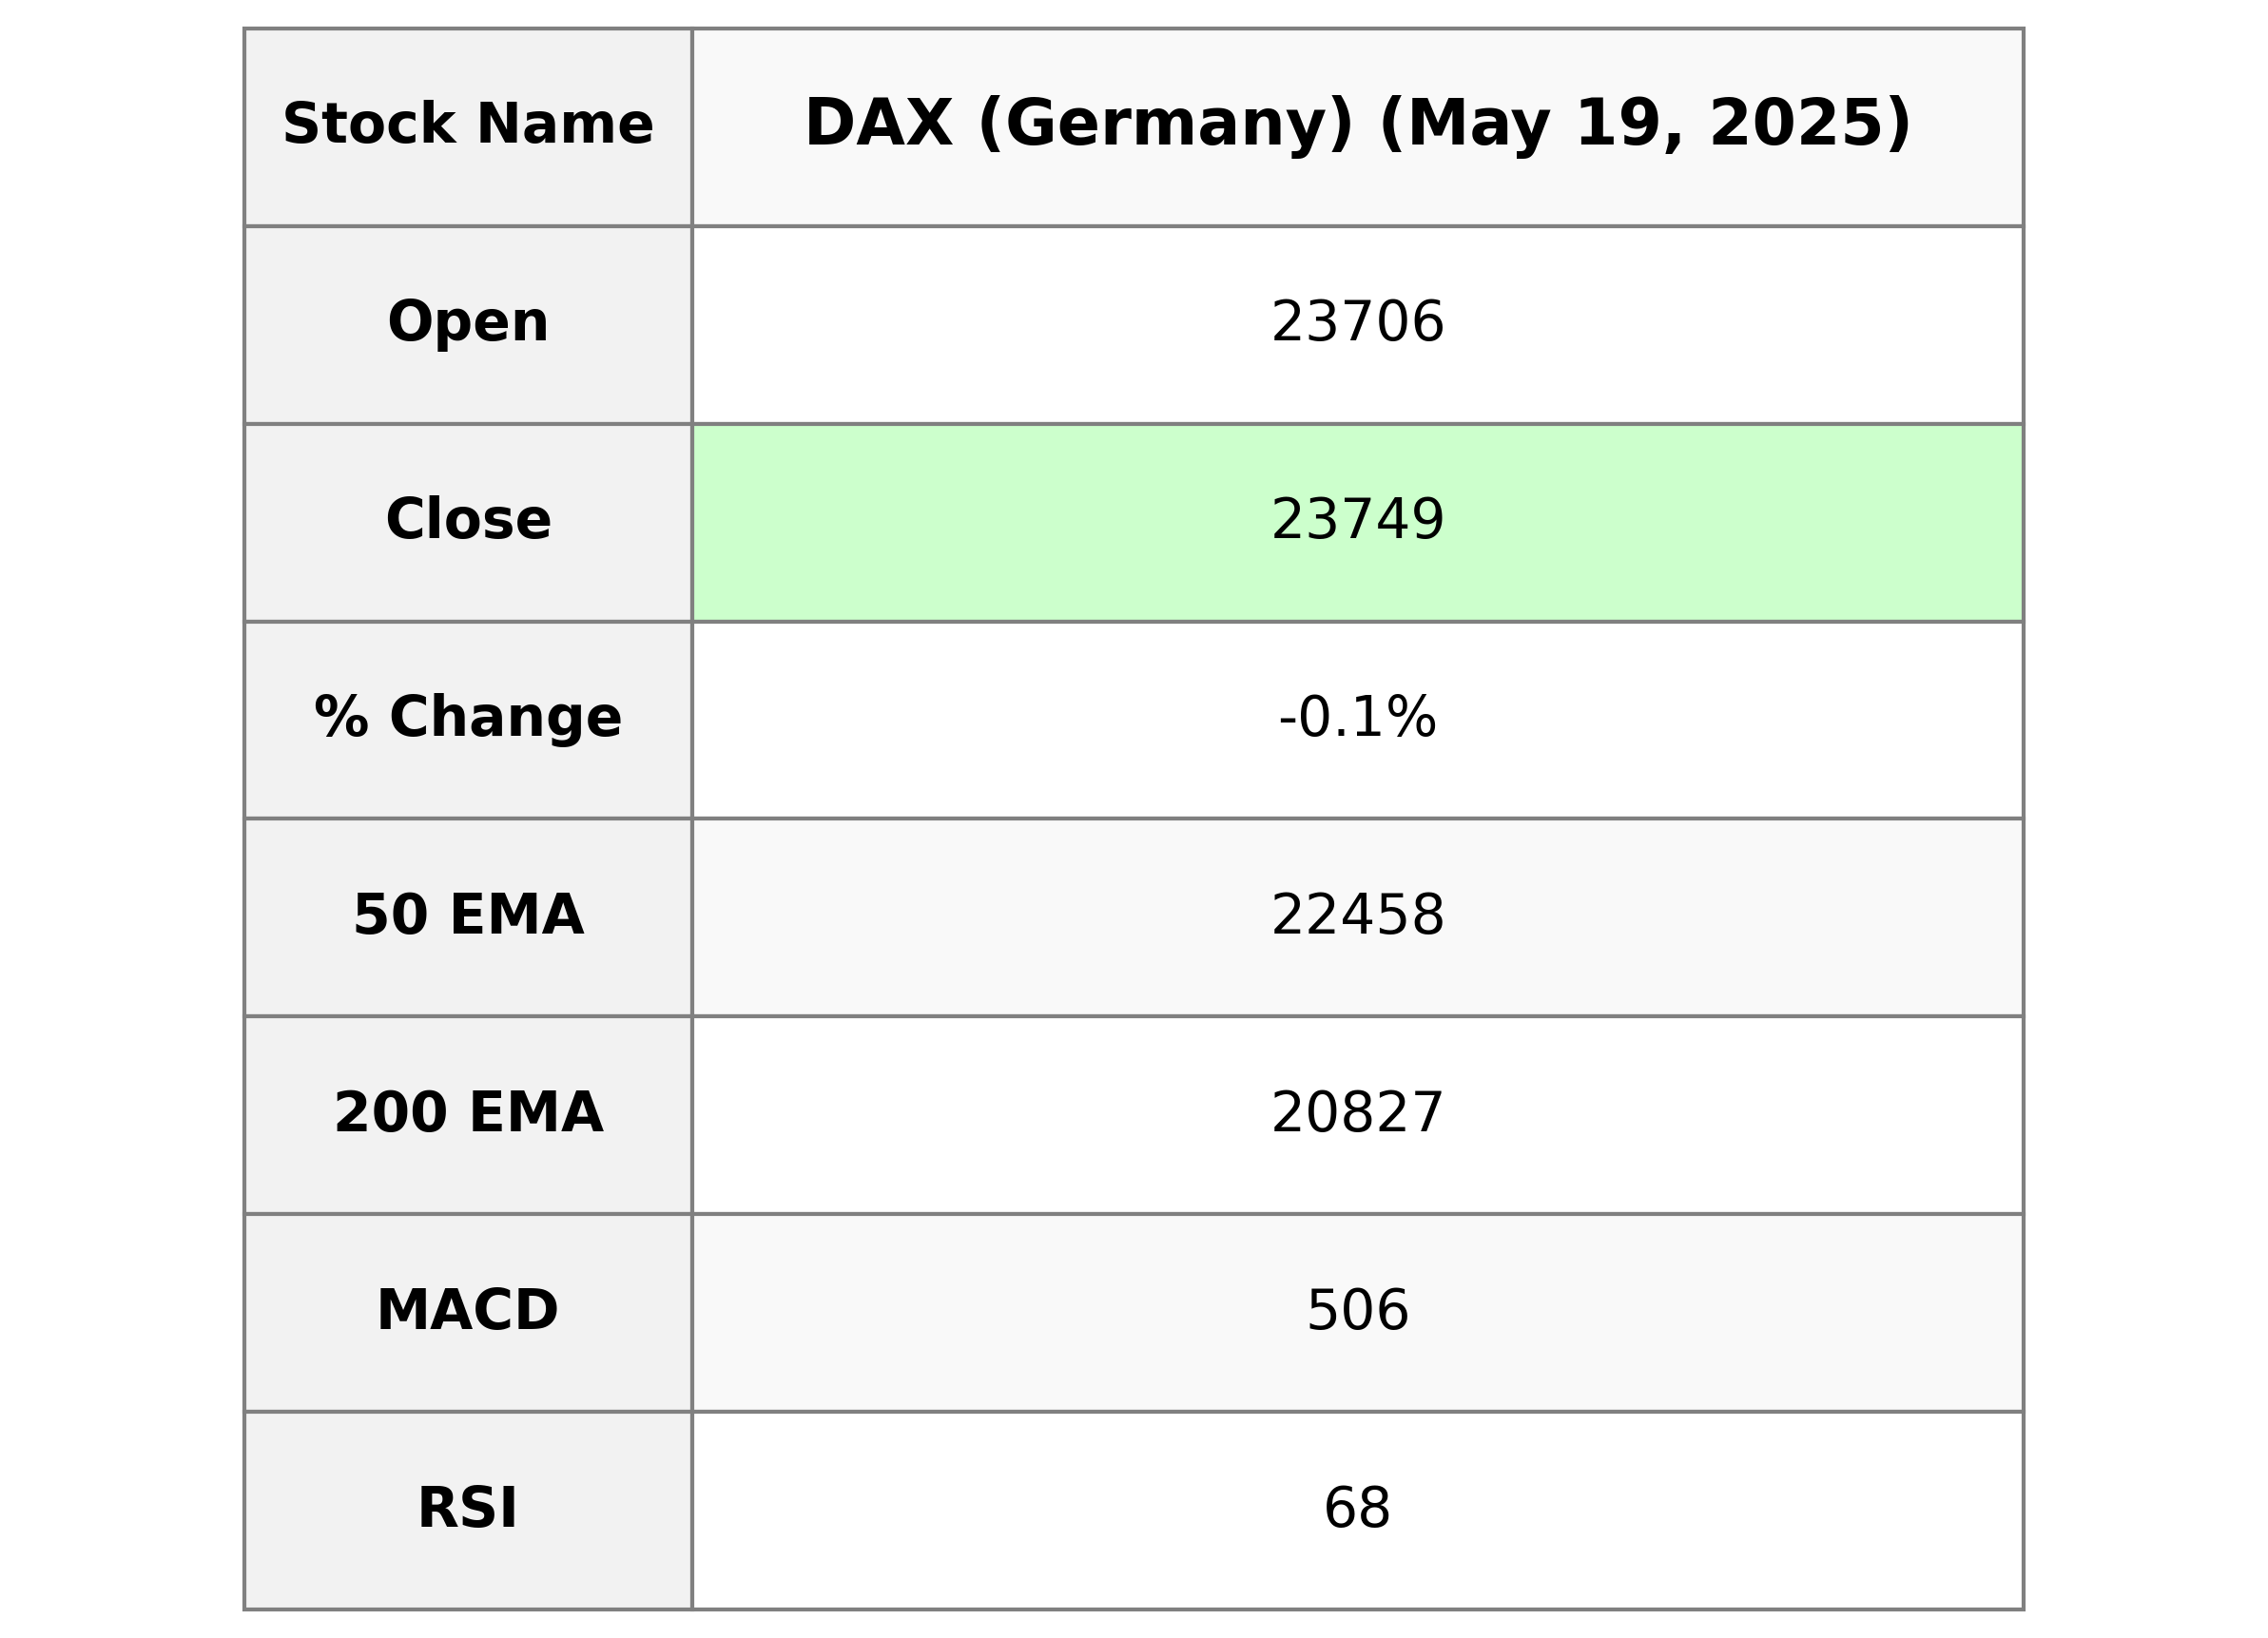
DAX (Germany) Performance Summary: The DAX index opened at 23705.93 and closed slightly lower at 23749.13, marking a minor decrease of approximately 0.08%, or 18.30 points, compared to the previous close of 23767.43. Technical indicators show a robust trend with a 50-day EMA of 22457.84 and a 200-day EMA of 20827.04, suggesting the index is performing above longer-term averages, and an RSI close to 68 indicates strengthened momentum.
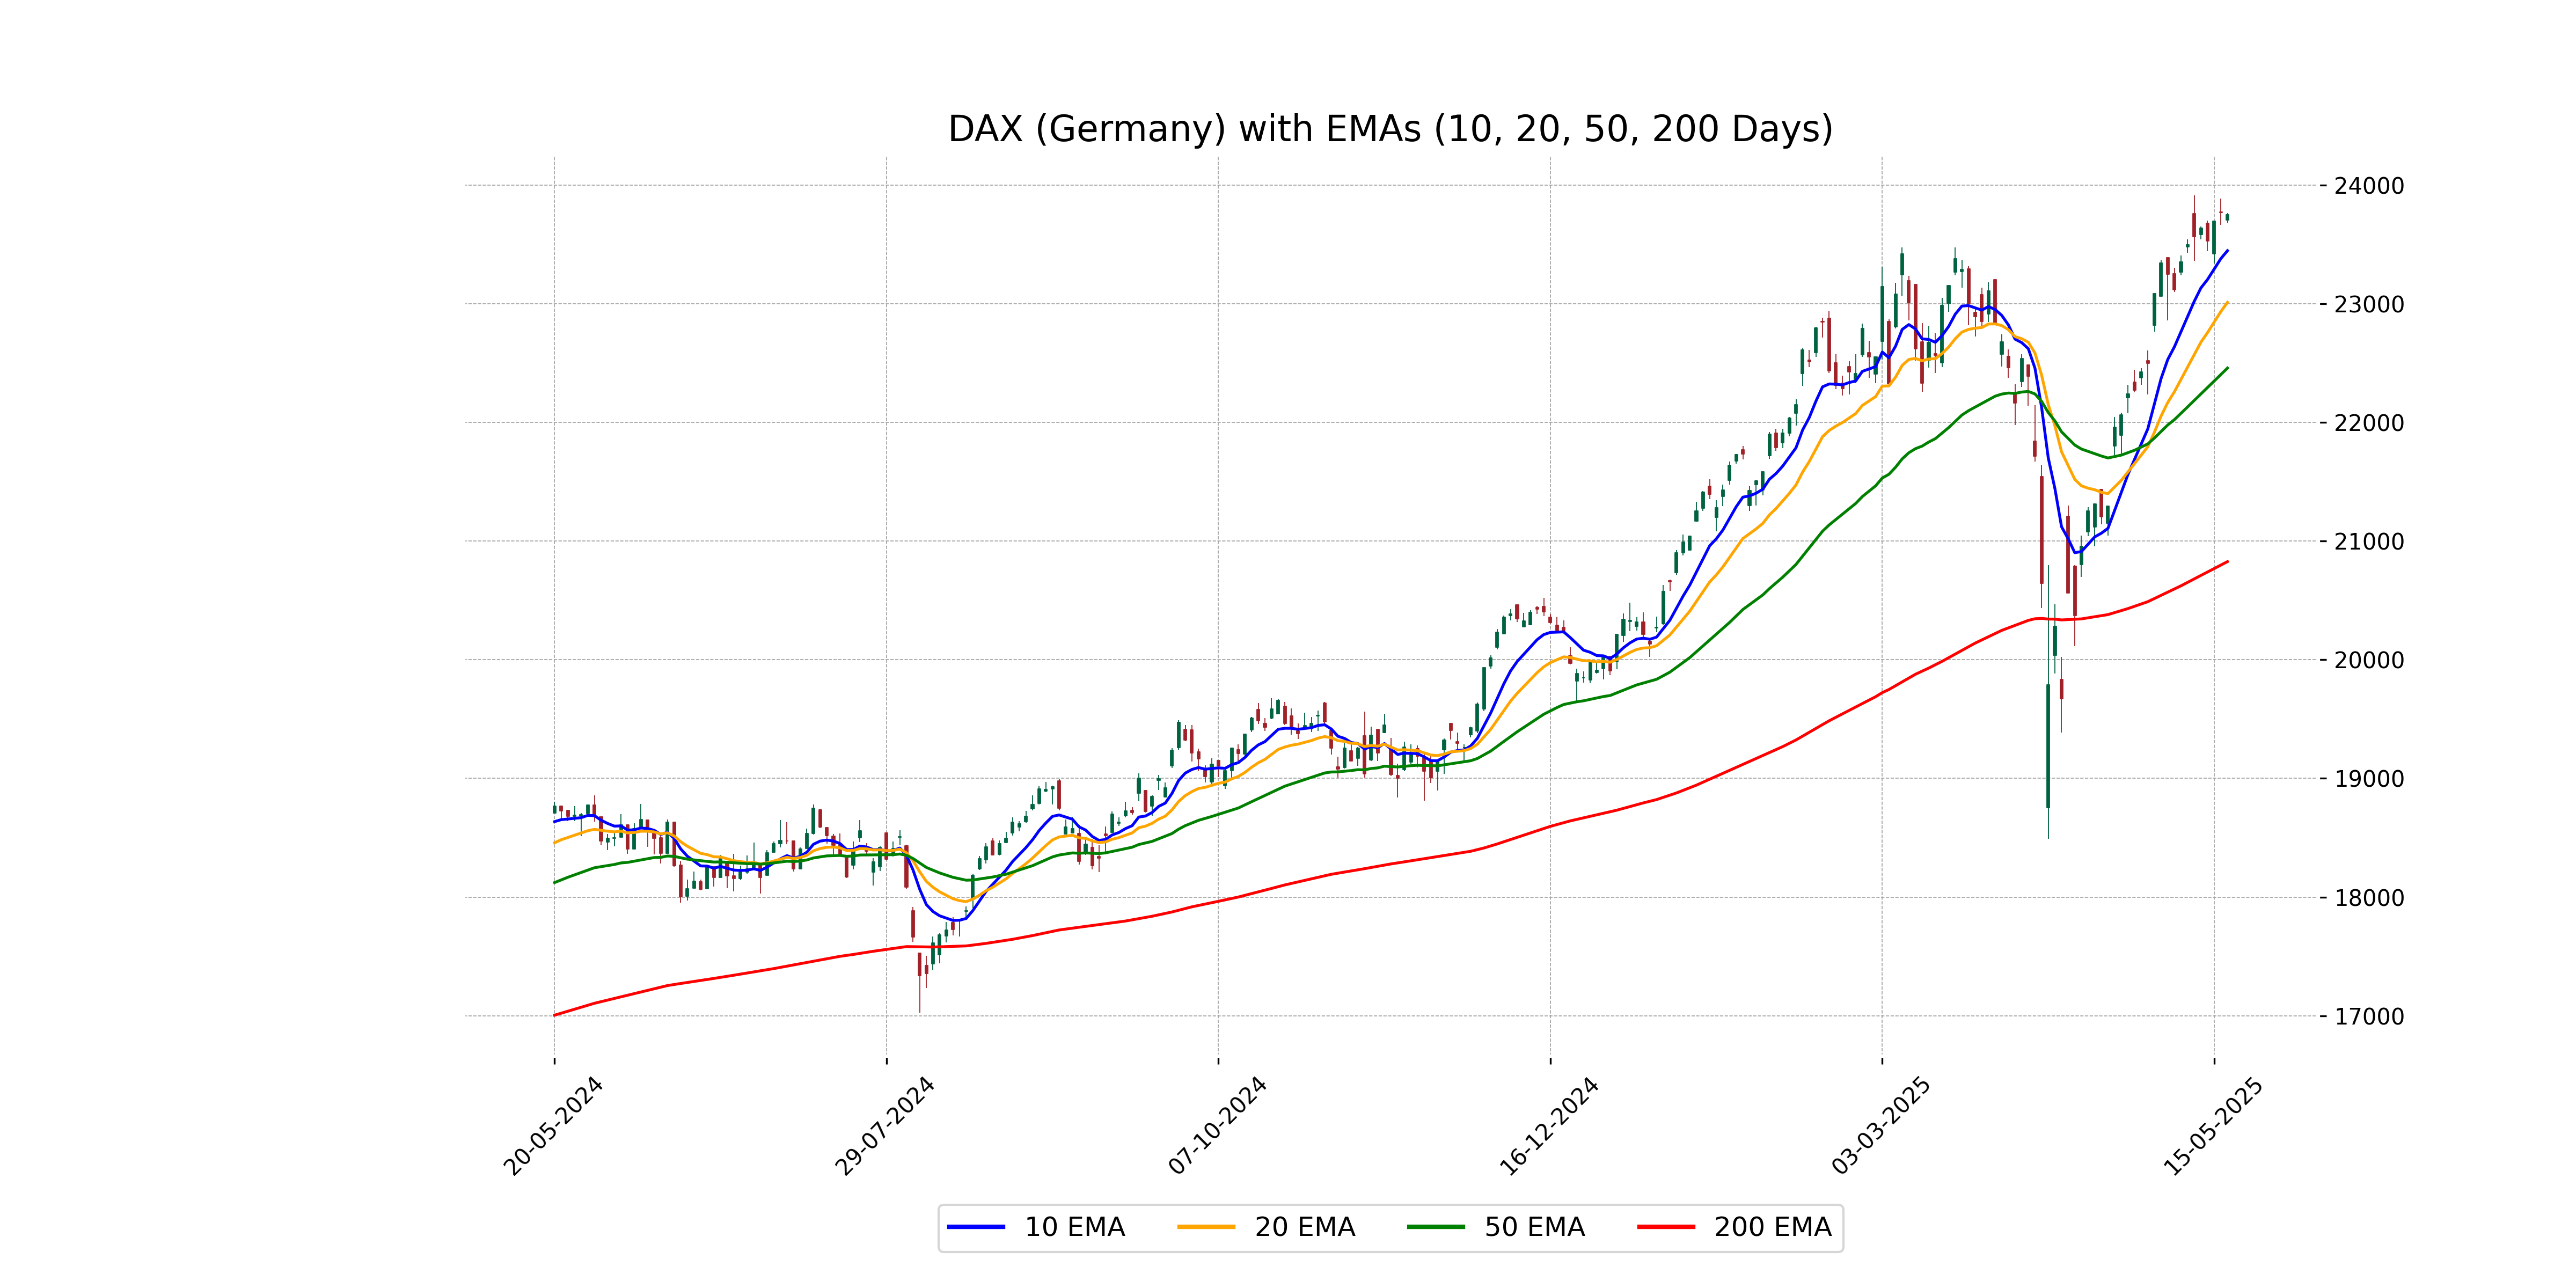
Relationship with Key Moving Averages
DAX (Germany) closed at 23,749.13, which is above its 50-day EMA of 22,457.84 and 200-day EMA of 20,827.03, indicating a bullish trend. However, the closing price is below the 10-day EMA of 23,447.27 and the 20-day EMA of 23,011.96, suggesting short-term weakness.
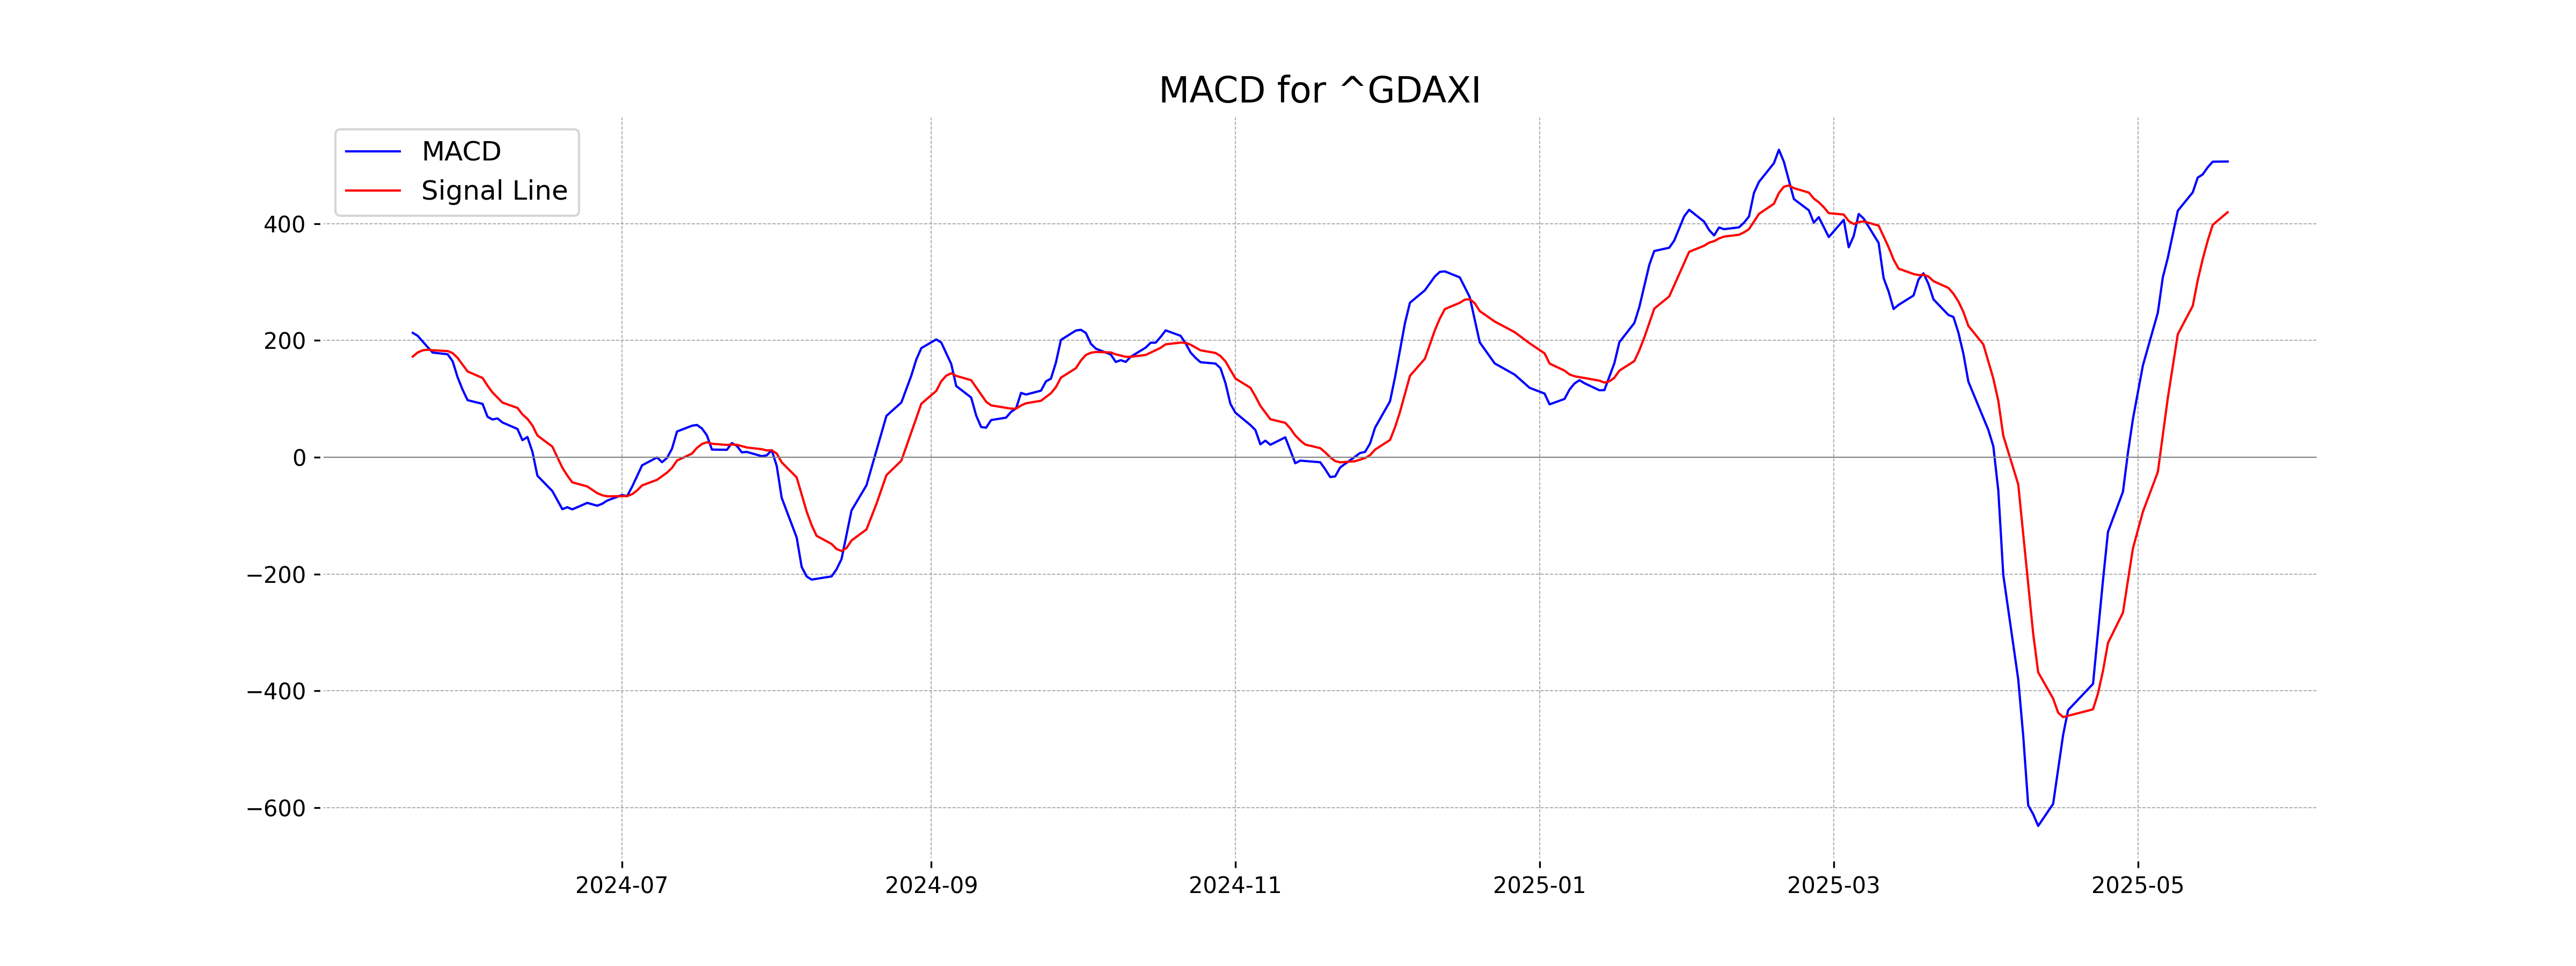
Moving Averages Trend (MACD)
The MACD analysis for DAX (Germany) indicates a bullish trend. The MACD value of 506.49 is above the MACD Signal line of 419.62, suggesting that the upward momentum might continue.
RSI Analysis
The RSI value for DAX (Germany) is 67.72, indicating that the stock is nearing the overbought territory, as RSI values above 70 are typically considered overbought. This suggests a potential for a price pullback or consolidation in the near term.
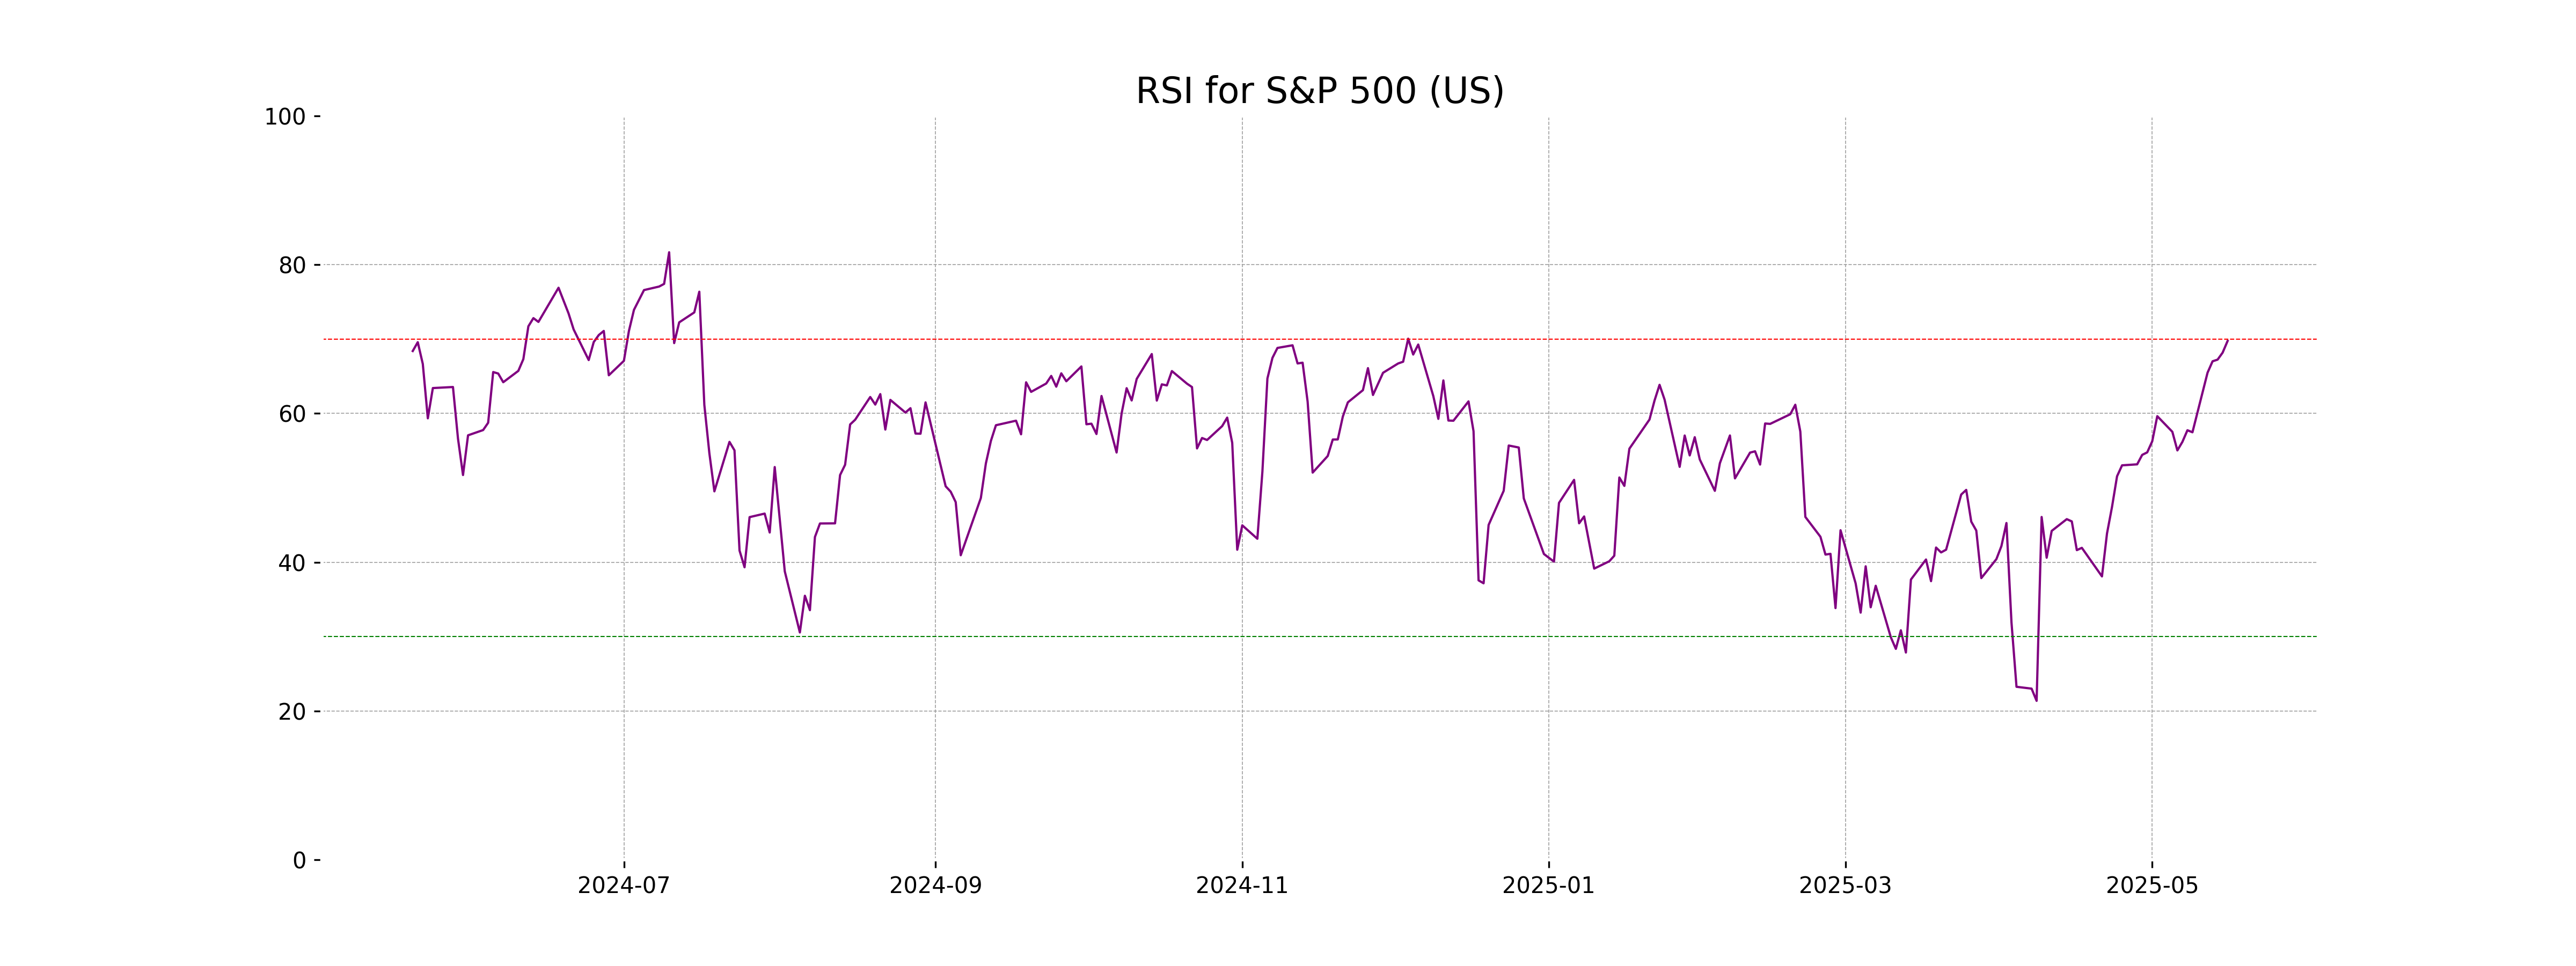
Analysis for S&P 500 (US) - May 19, 2025
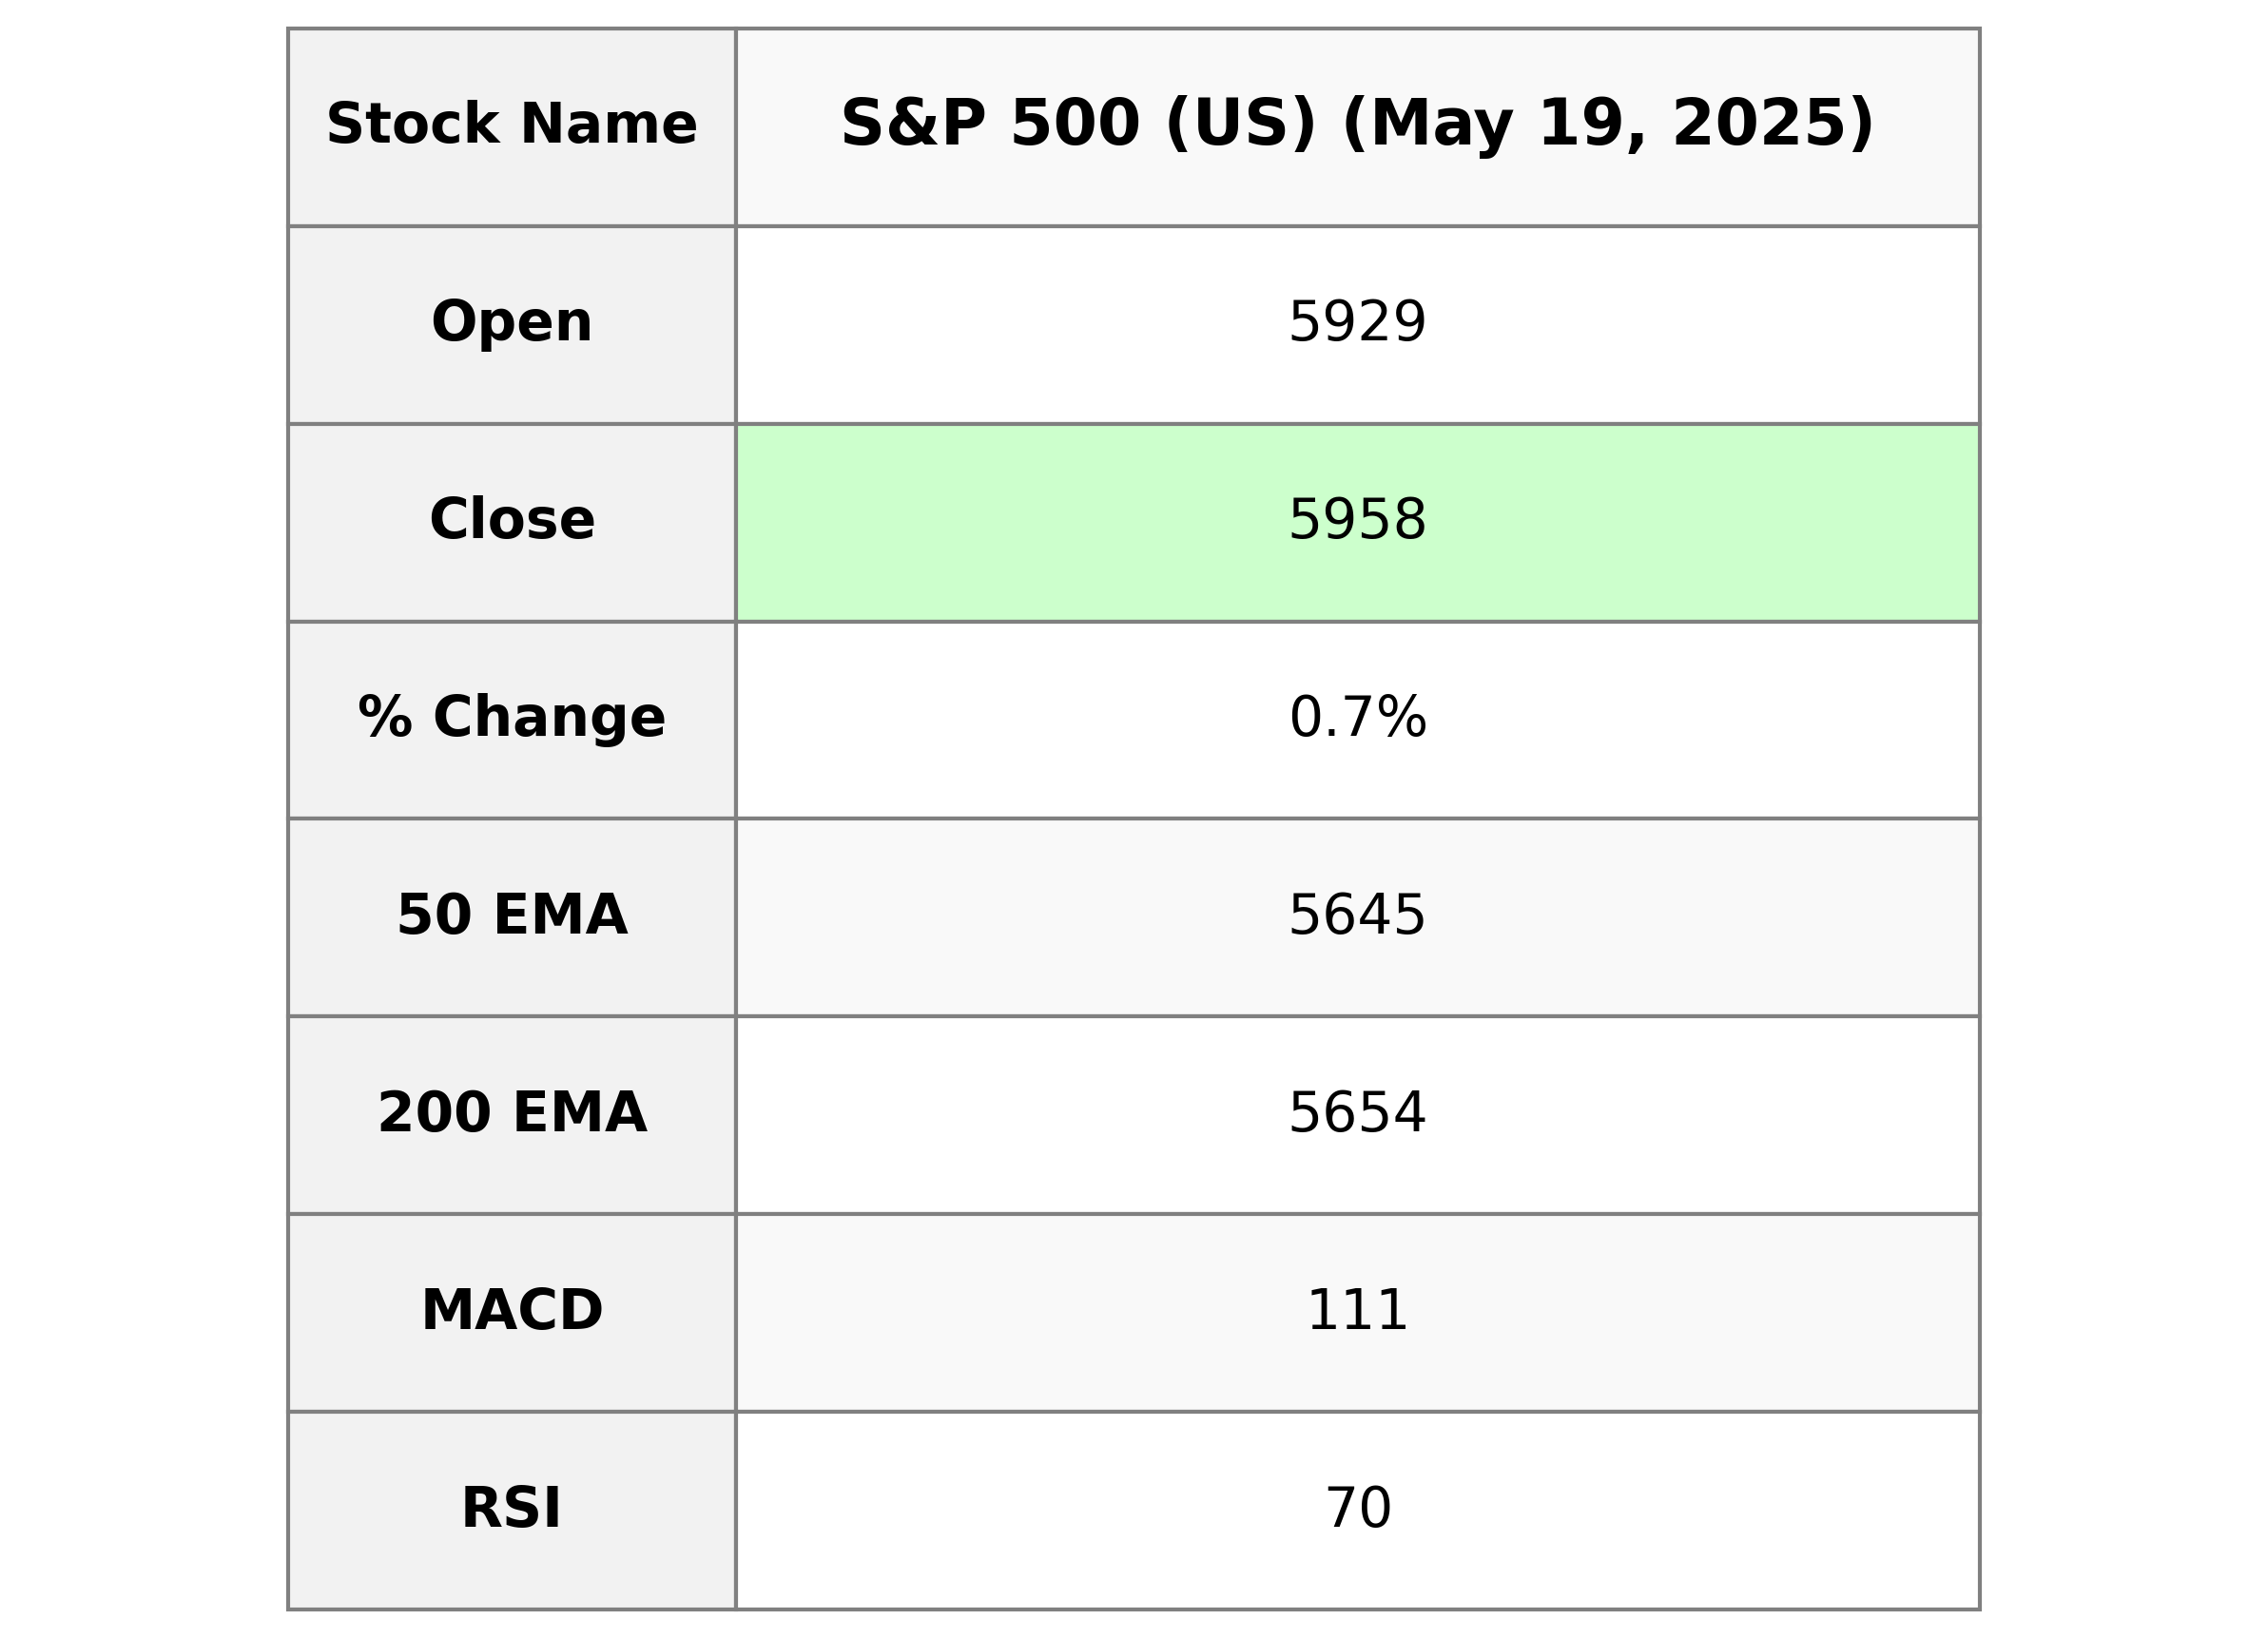
The S&P 500 (US) opened at 5929.09 and closed at 5958.38, reflecting a 0.70% increase and a point change of 41.45 from the previous close of 5916.93. The index's technical indicators show a relative strength index (RSI) of 69.76, approaching overbought levels, and a MACD of 111.11, signaling a bullish trend against a signal of 66.16.
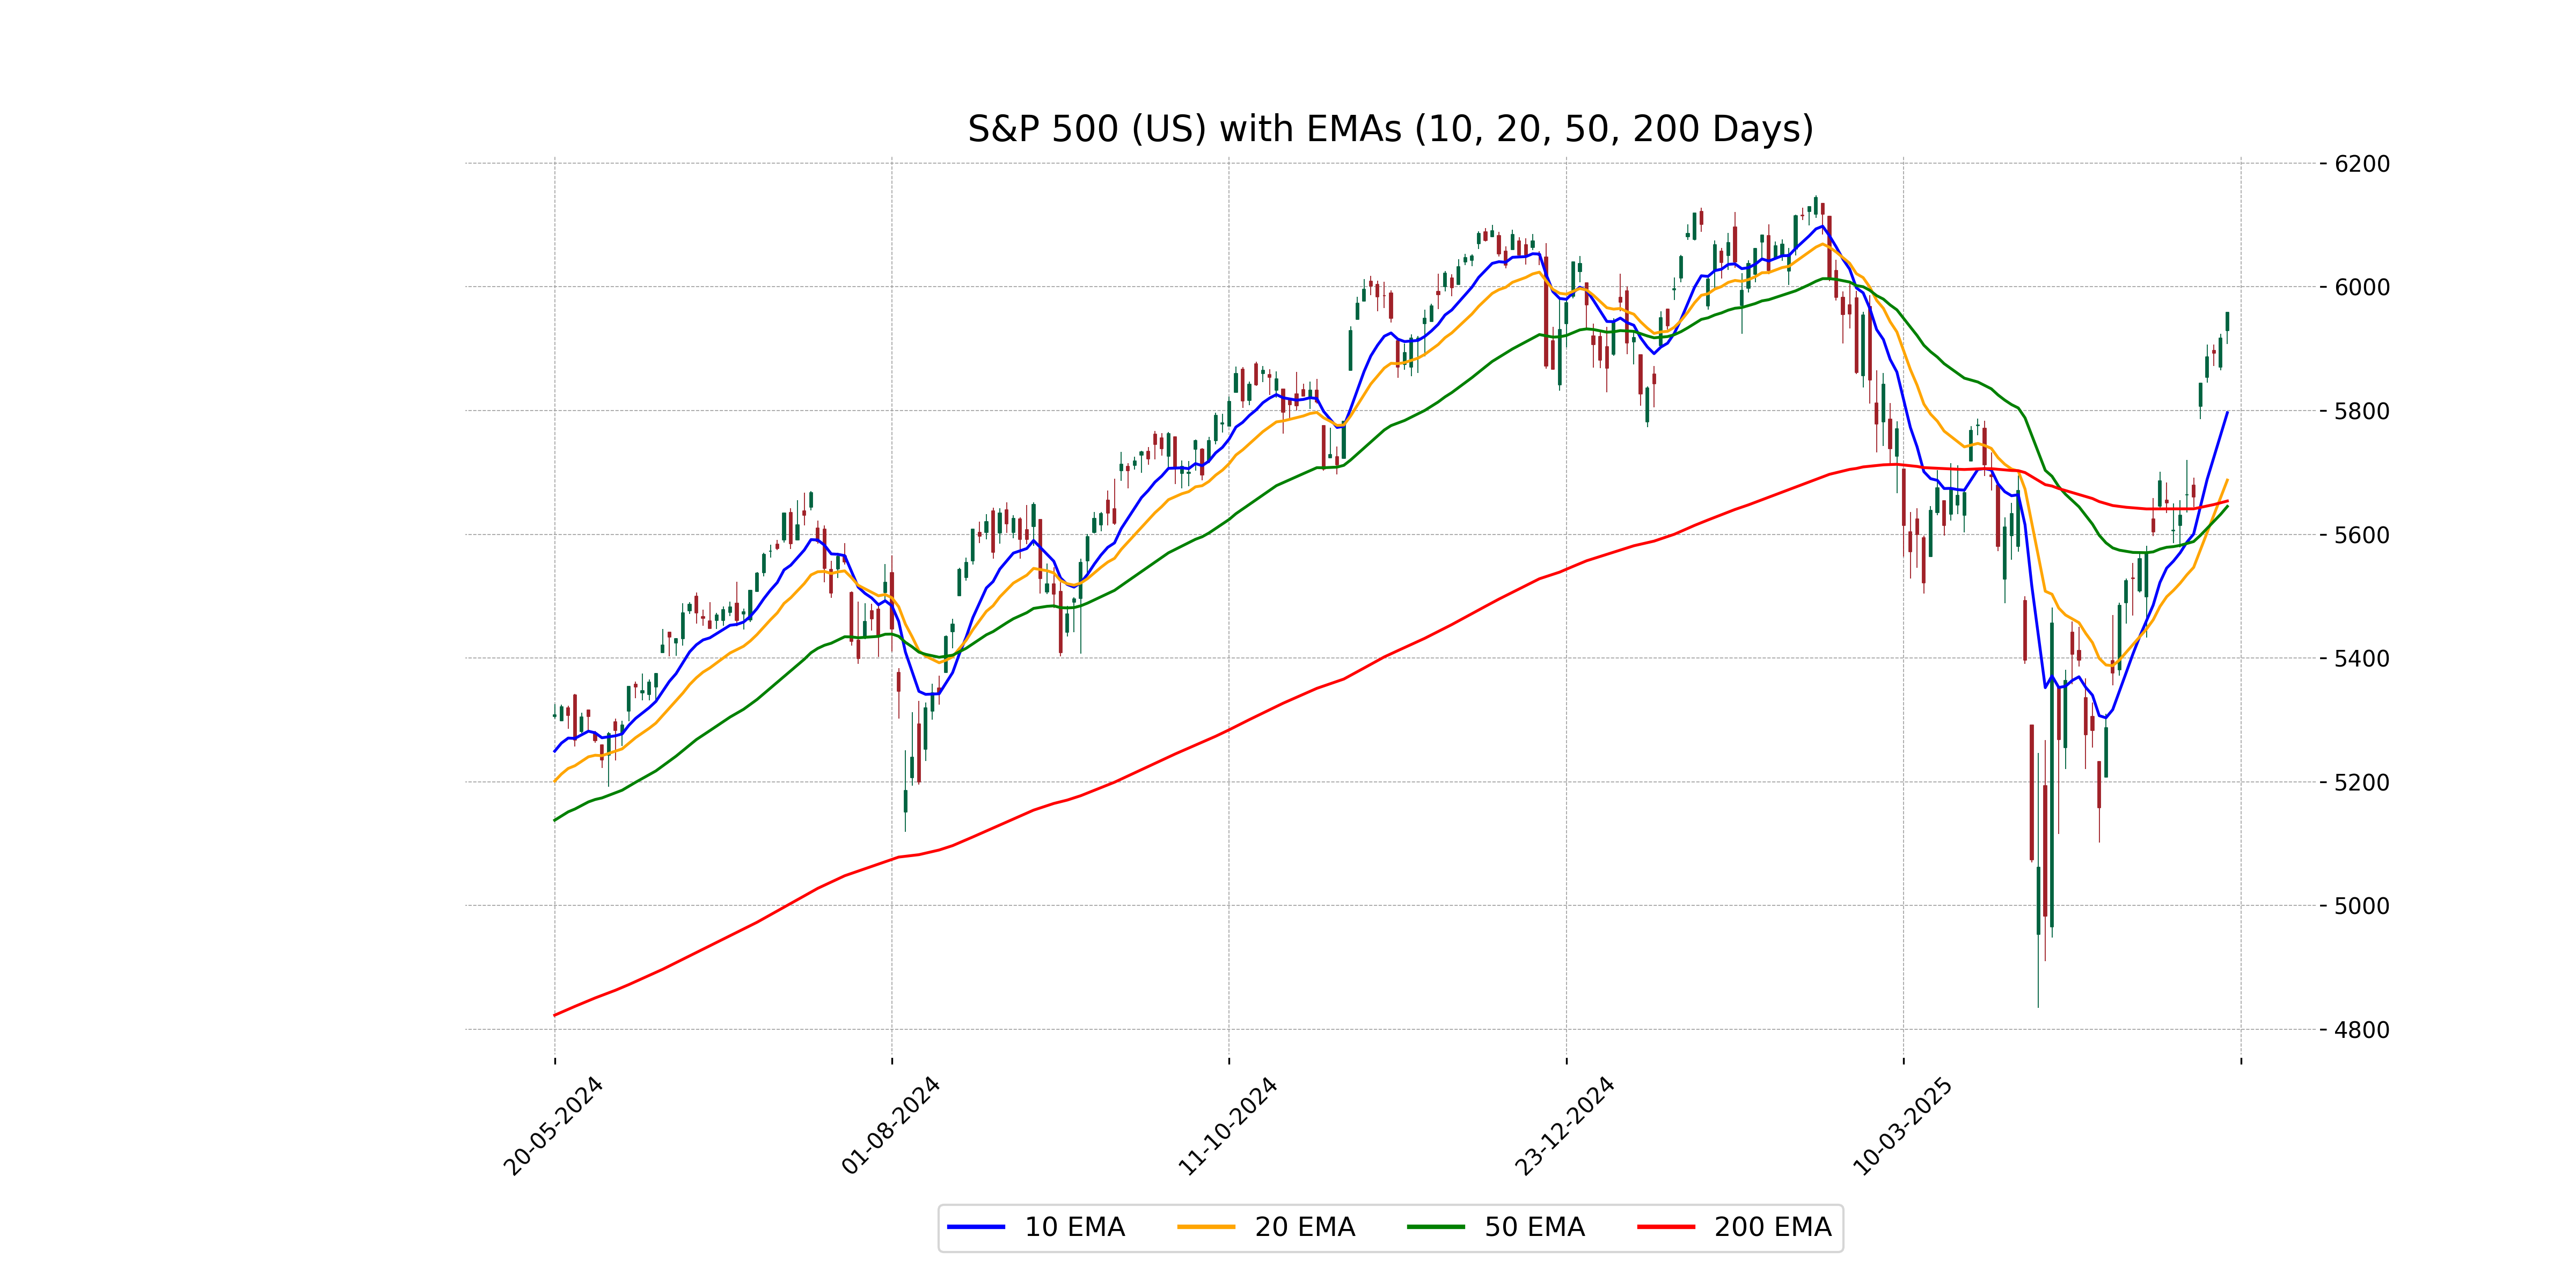
Relationship with Key Moving Averages
Relationship with Key Moving Averages for S&P 500 (US): The current closing price of 5958.38 is above all key moving averages, with a 50-day EMA at 5645.09, a 200-day EMA at 5653.80, a 10-day EMA at 5796.51, and a 20-day EMA at 5687.62, indicating a short-term bullish trend.
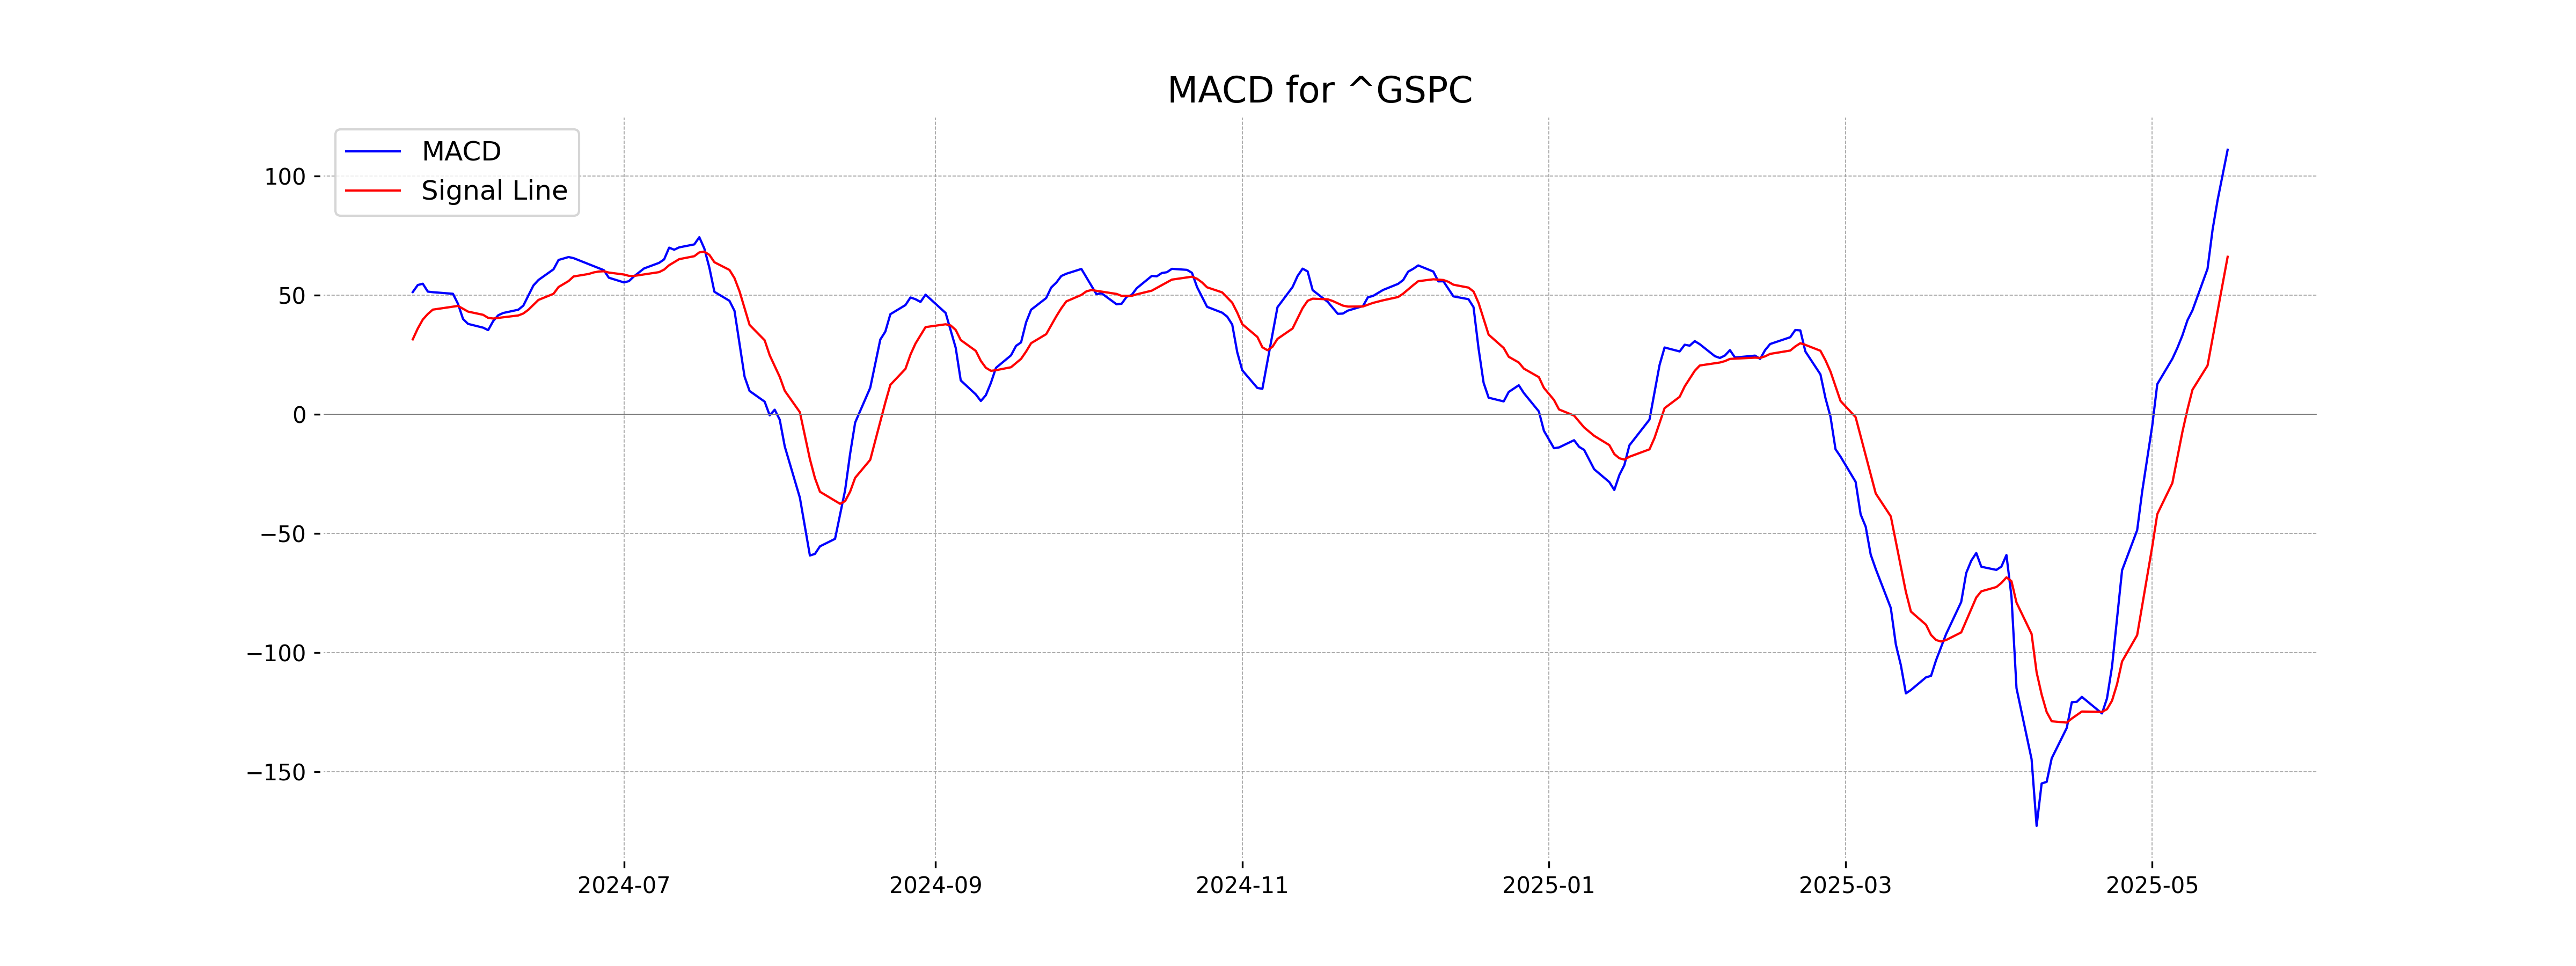
Moving Averages Trend (MACD)
MACD Analysis for S&P 500 (US): The MACD value of 111.11 is well above its signal line value of 66.16, indicating strong bullish momentum. This suggests a potential continuation of the current upward trend in the market.
RSI Analysis
The RSI for S&P 500 (US) is 69.76, indicating that the index is nearing overbought territory. Investors should monitor closely for potential price corrections or reversals.
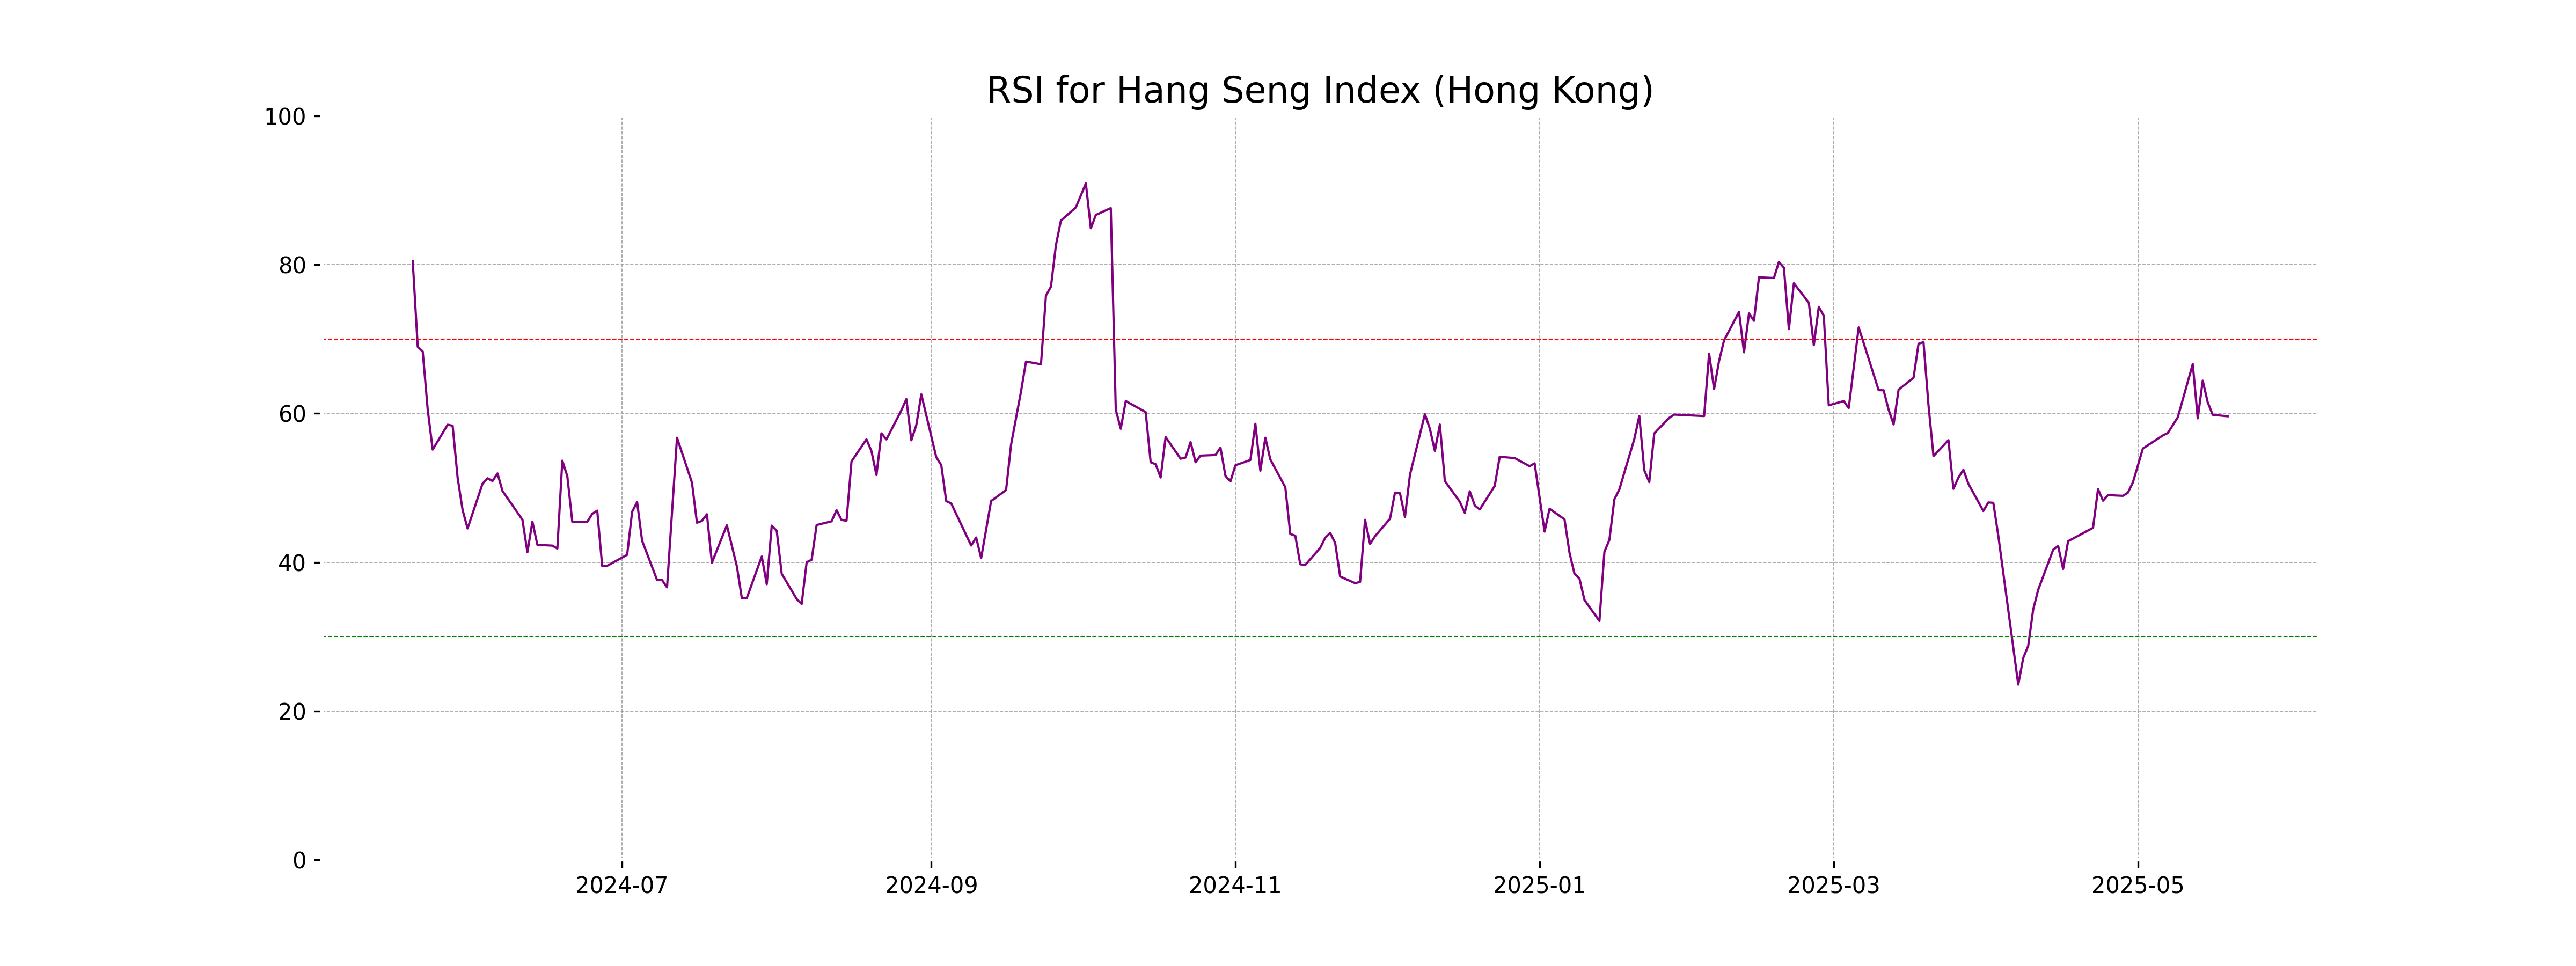
Analysis for Hang Seng Index (Hong Kong) - May 19, 2025
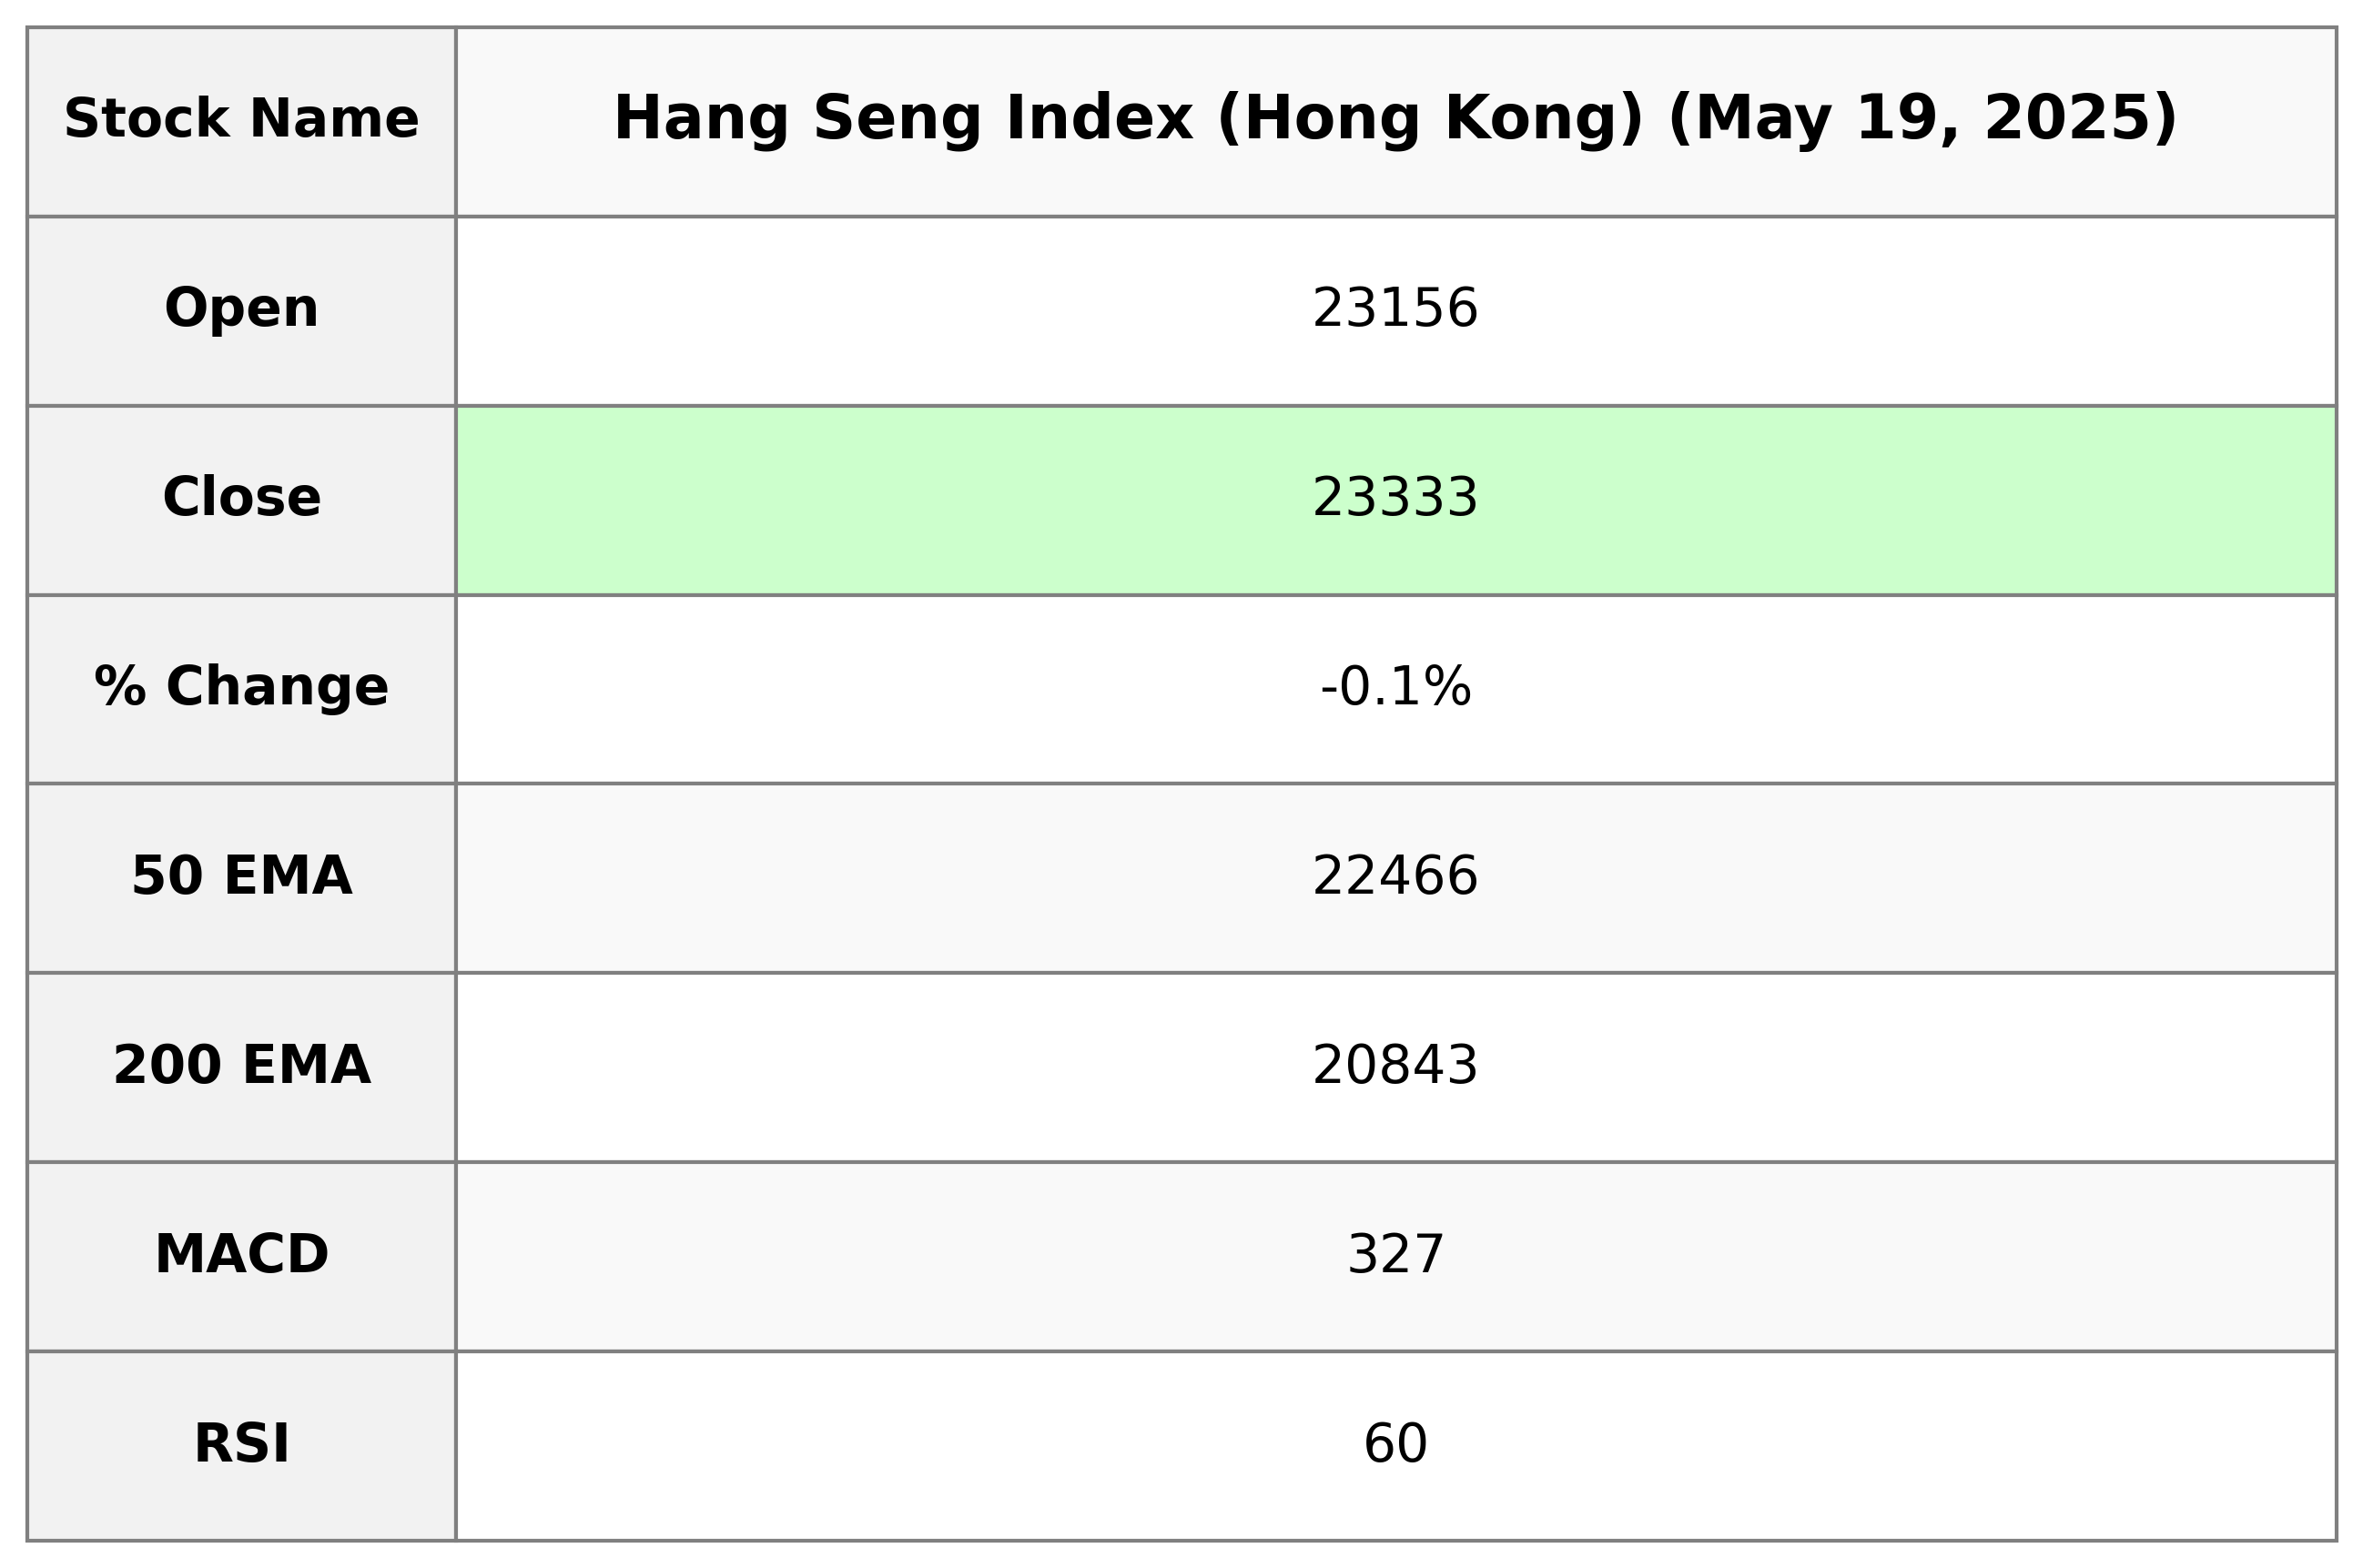
Hang Seng Index (Hong Kong) opened at 23,156.27 and closed slightly lower at 23,332.72, marking a small decline of 0.05% from the previous close. The index experienced modest volatility with a high of 23,402.20 and a low of 23,059.89. Relative Strength Index (RSI) stands at 59.62, indicating balanced momentum, while the MACD shows a positive divergence from its signal line.
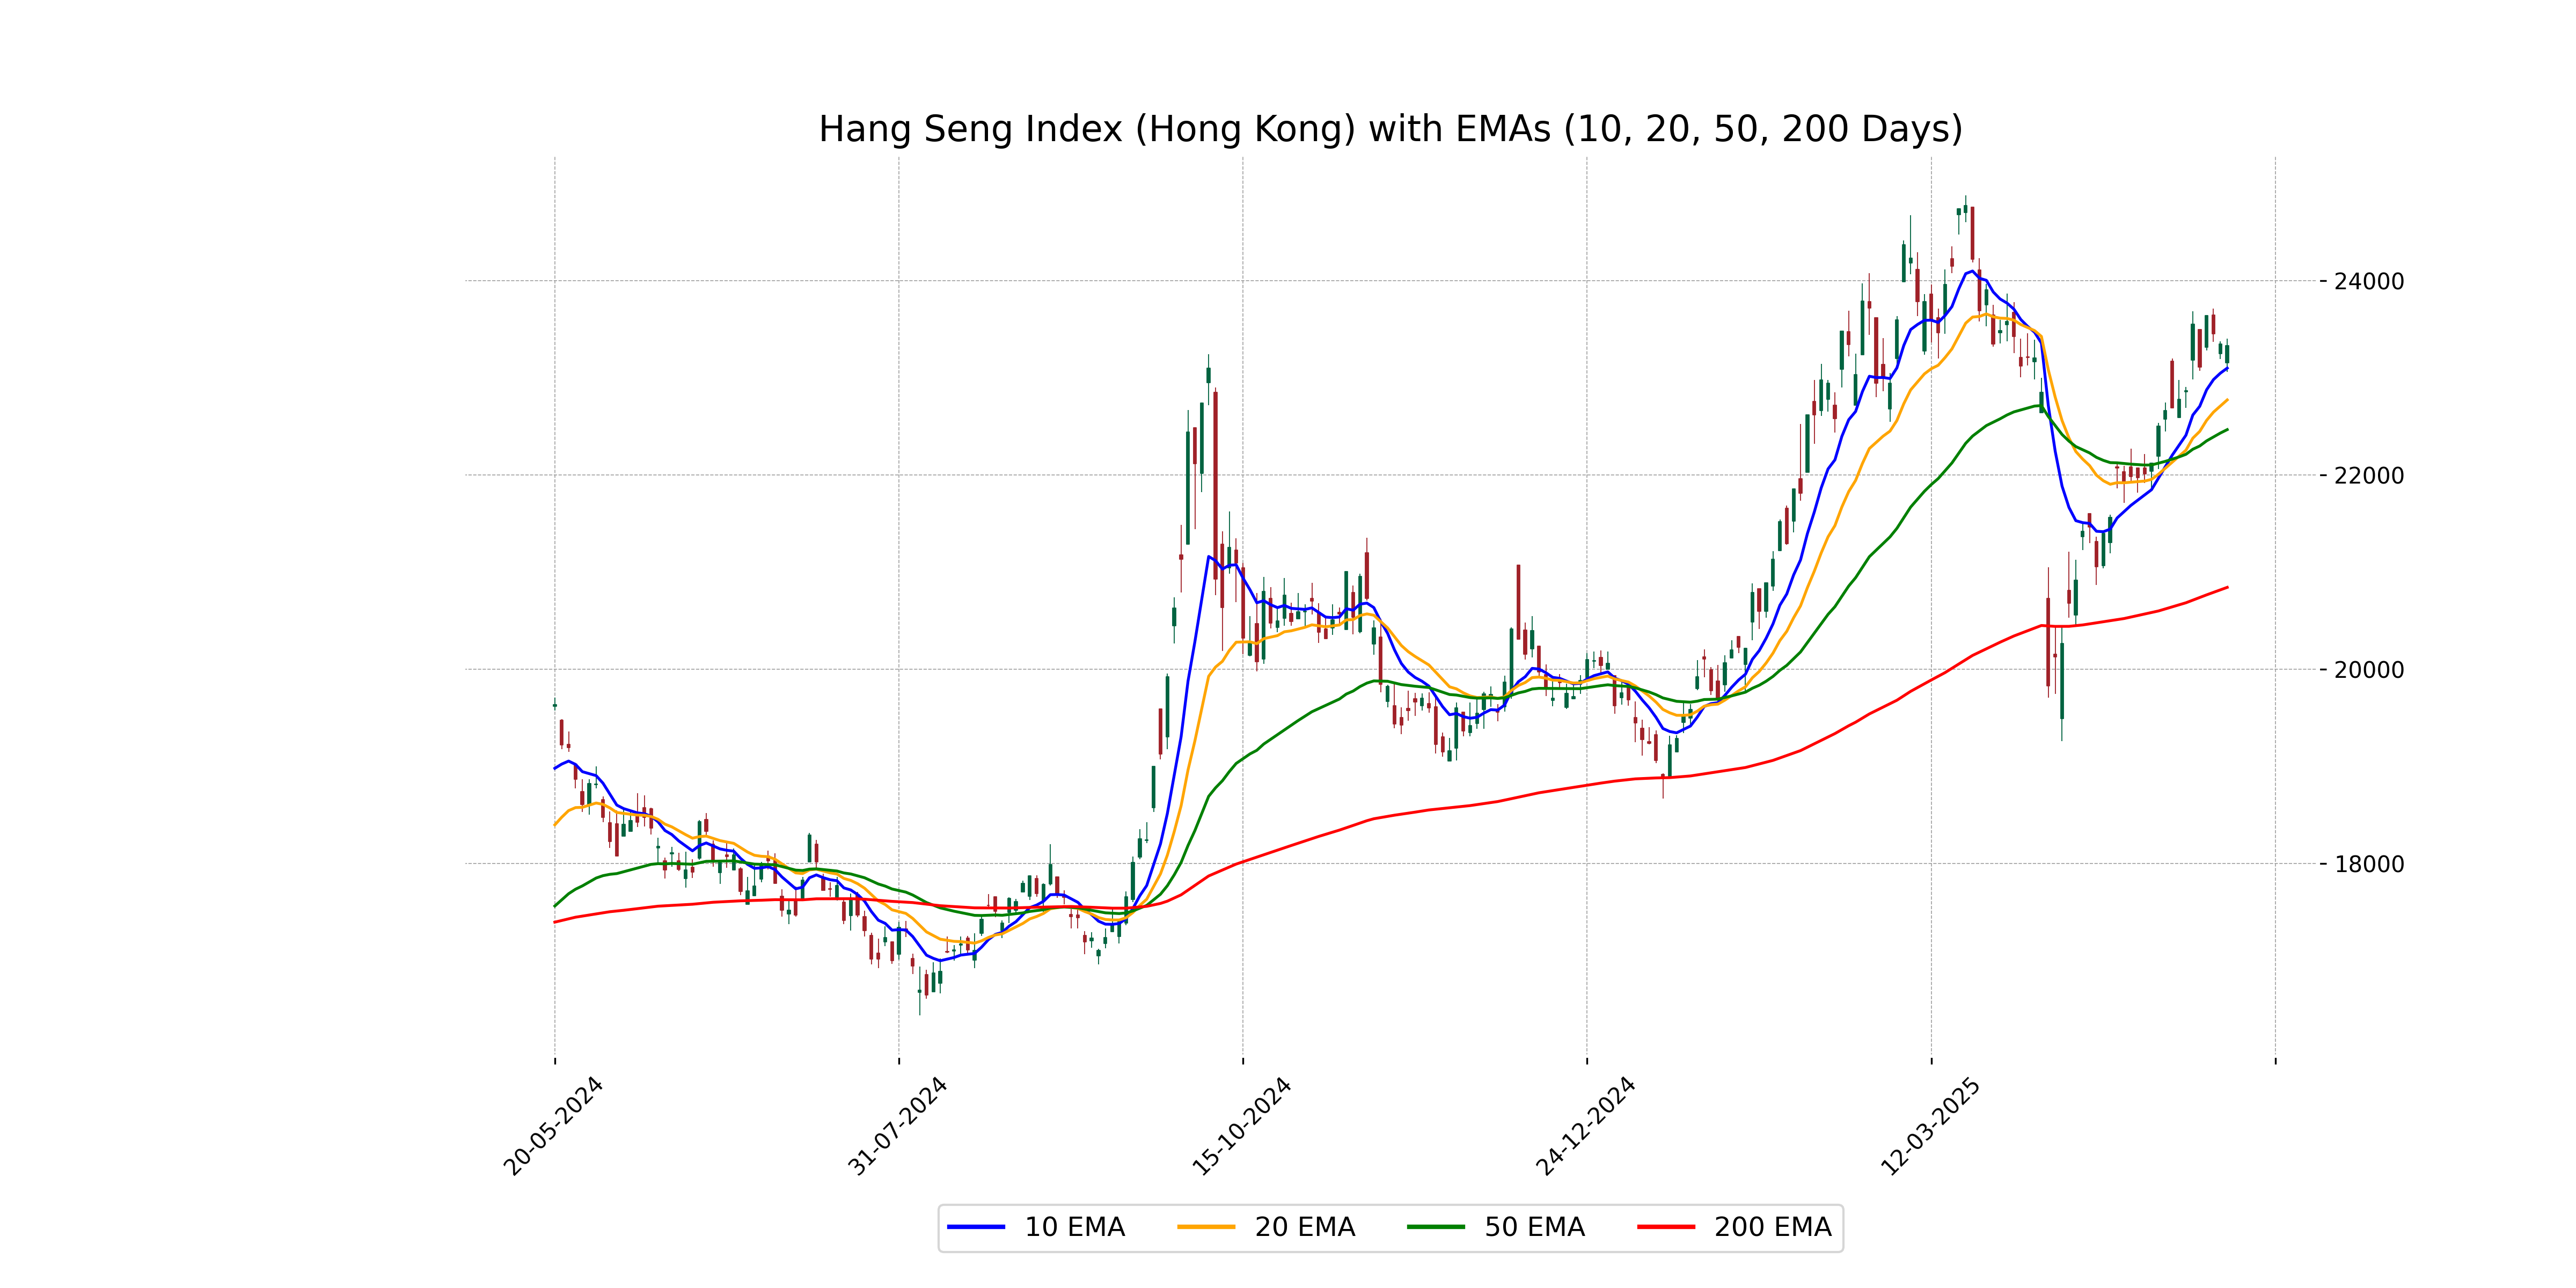
Relationship with Key Moving Averages
The Hang Seng Index opened above its 50-day and 200-day EMAs, indicating potential short-term bullish momentum compared to long-term trends. The index's close, combined with a positive MACD, suggests continued strength above the 10-day and 20-day EMAs, with the RSI suggesting a moderately strong uptrend.
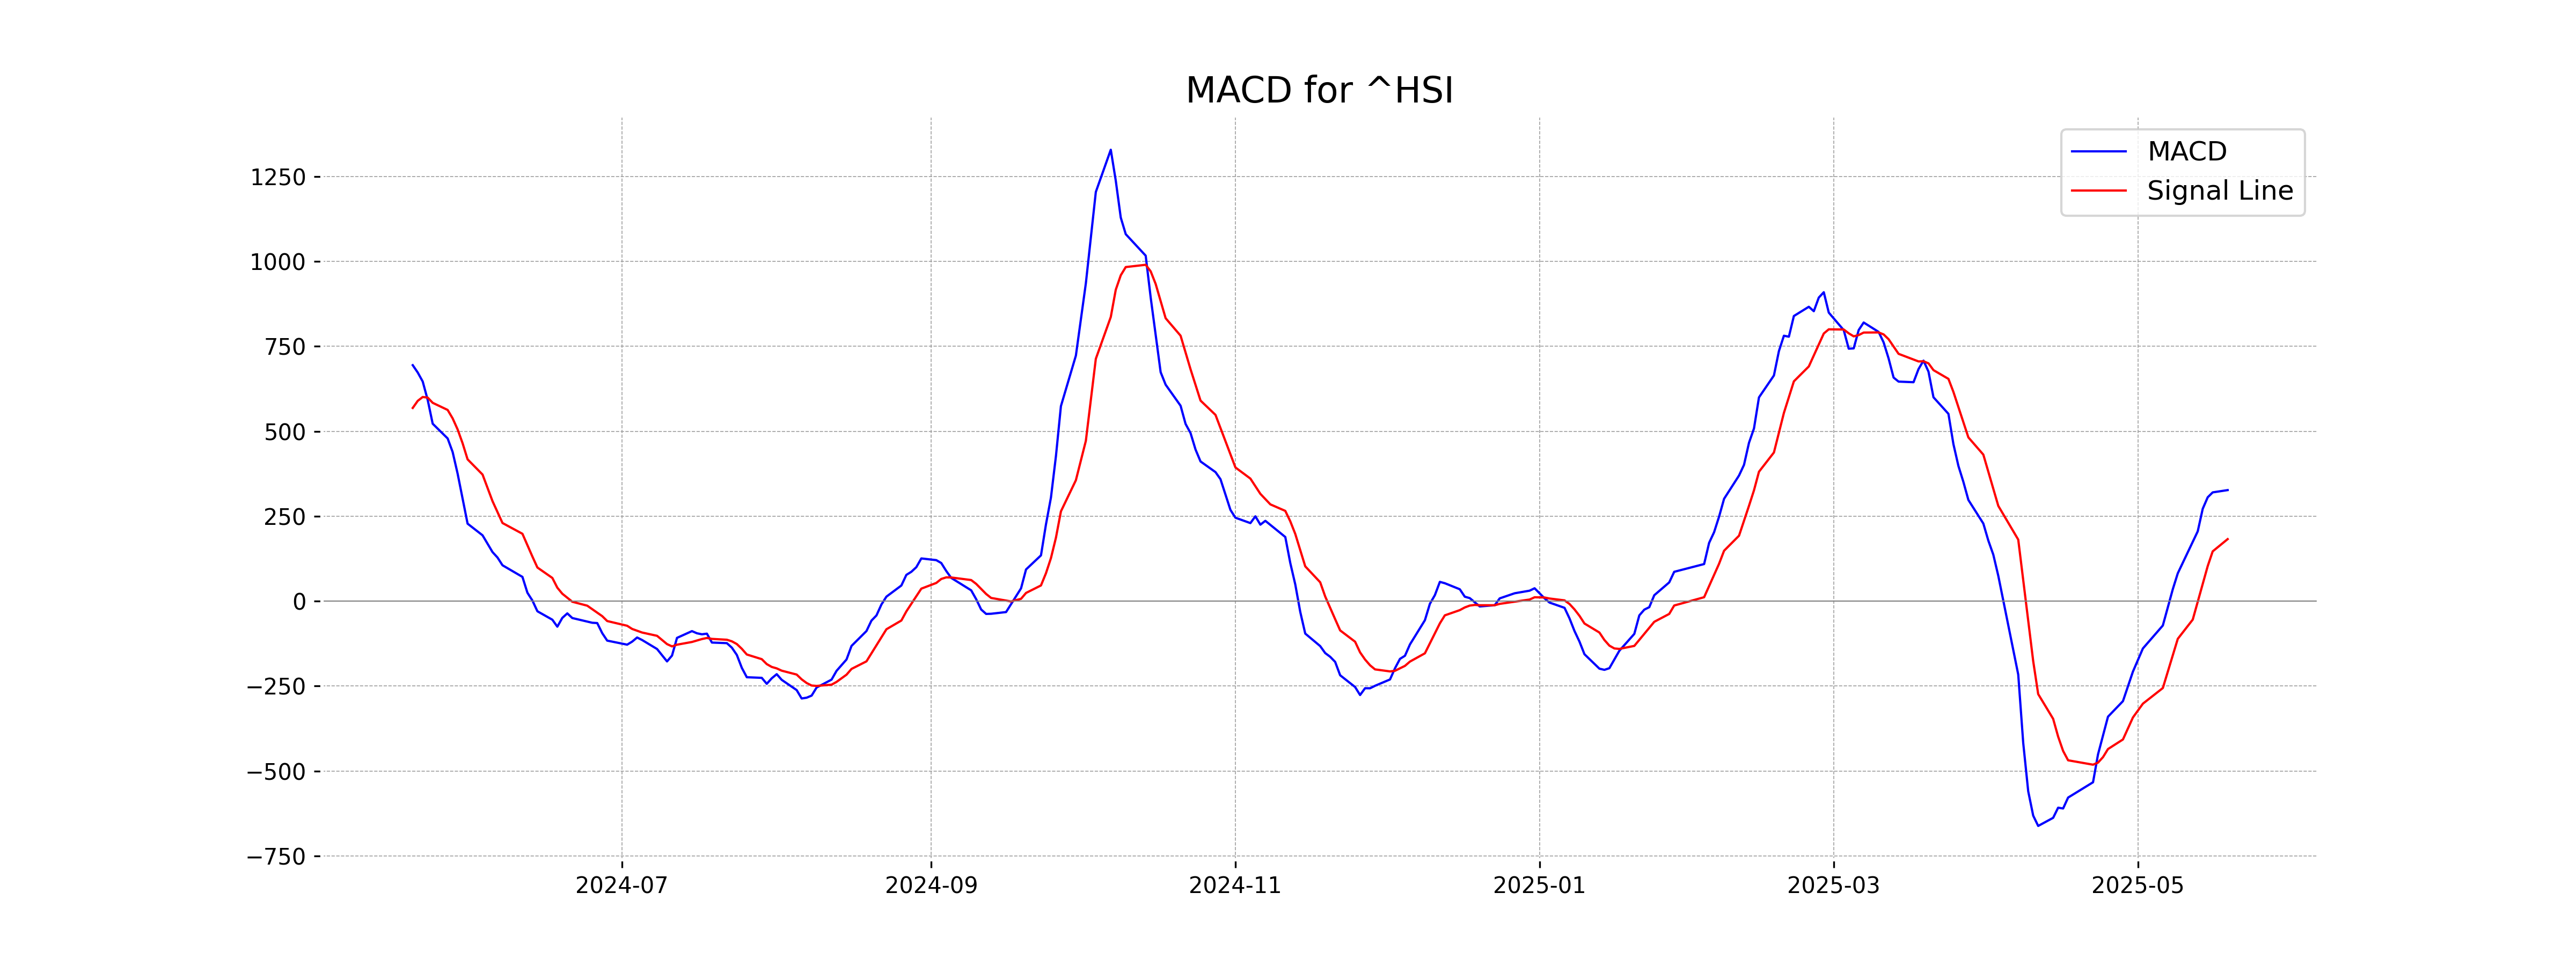
Moving Averages Trend (MACD)
Based on the stock data for Hang Seng Index (Hong Kong), the MACD value is 326.75, with a MACD Signal line at 182.47. This indicates a positive MACD crossover, suggesting a potential bullish momentum in the market trend.
RSI Analysis
The RSI for the Hang Seng Index is 59.62, indicating that the index is in neutral territory, neither overbought nor oversold. This suggests a balanced market sentiment, with no extreme buying or selling pressure.
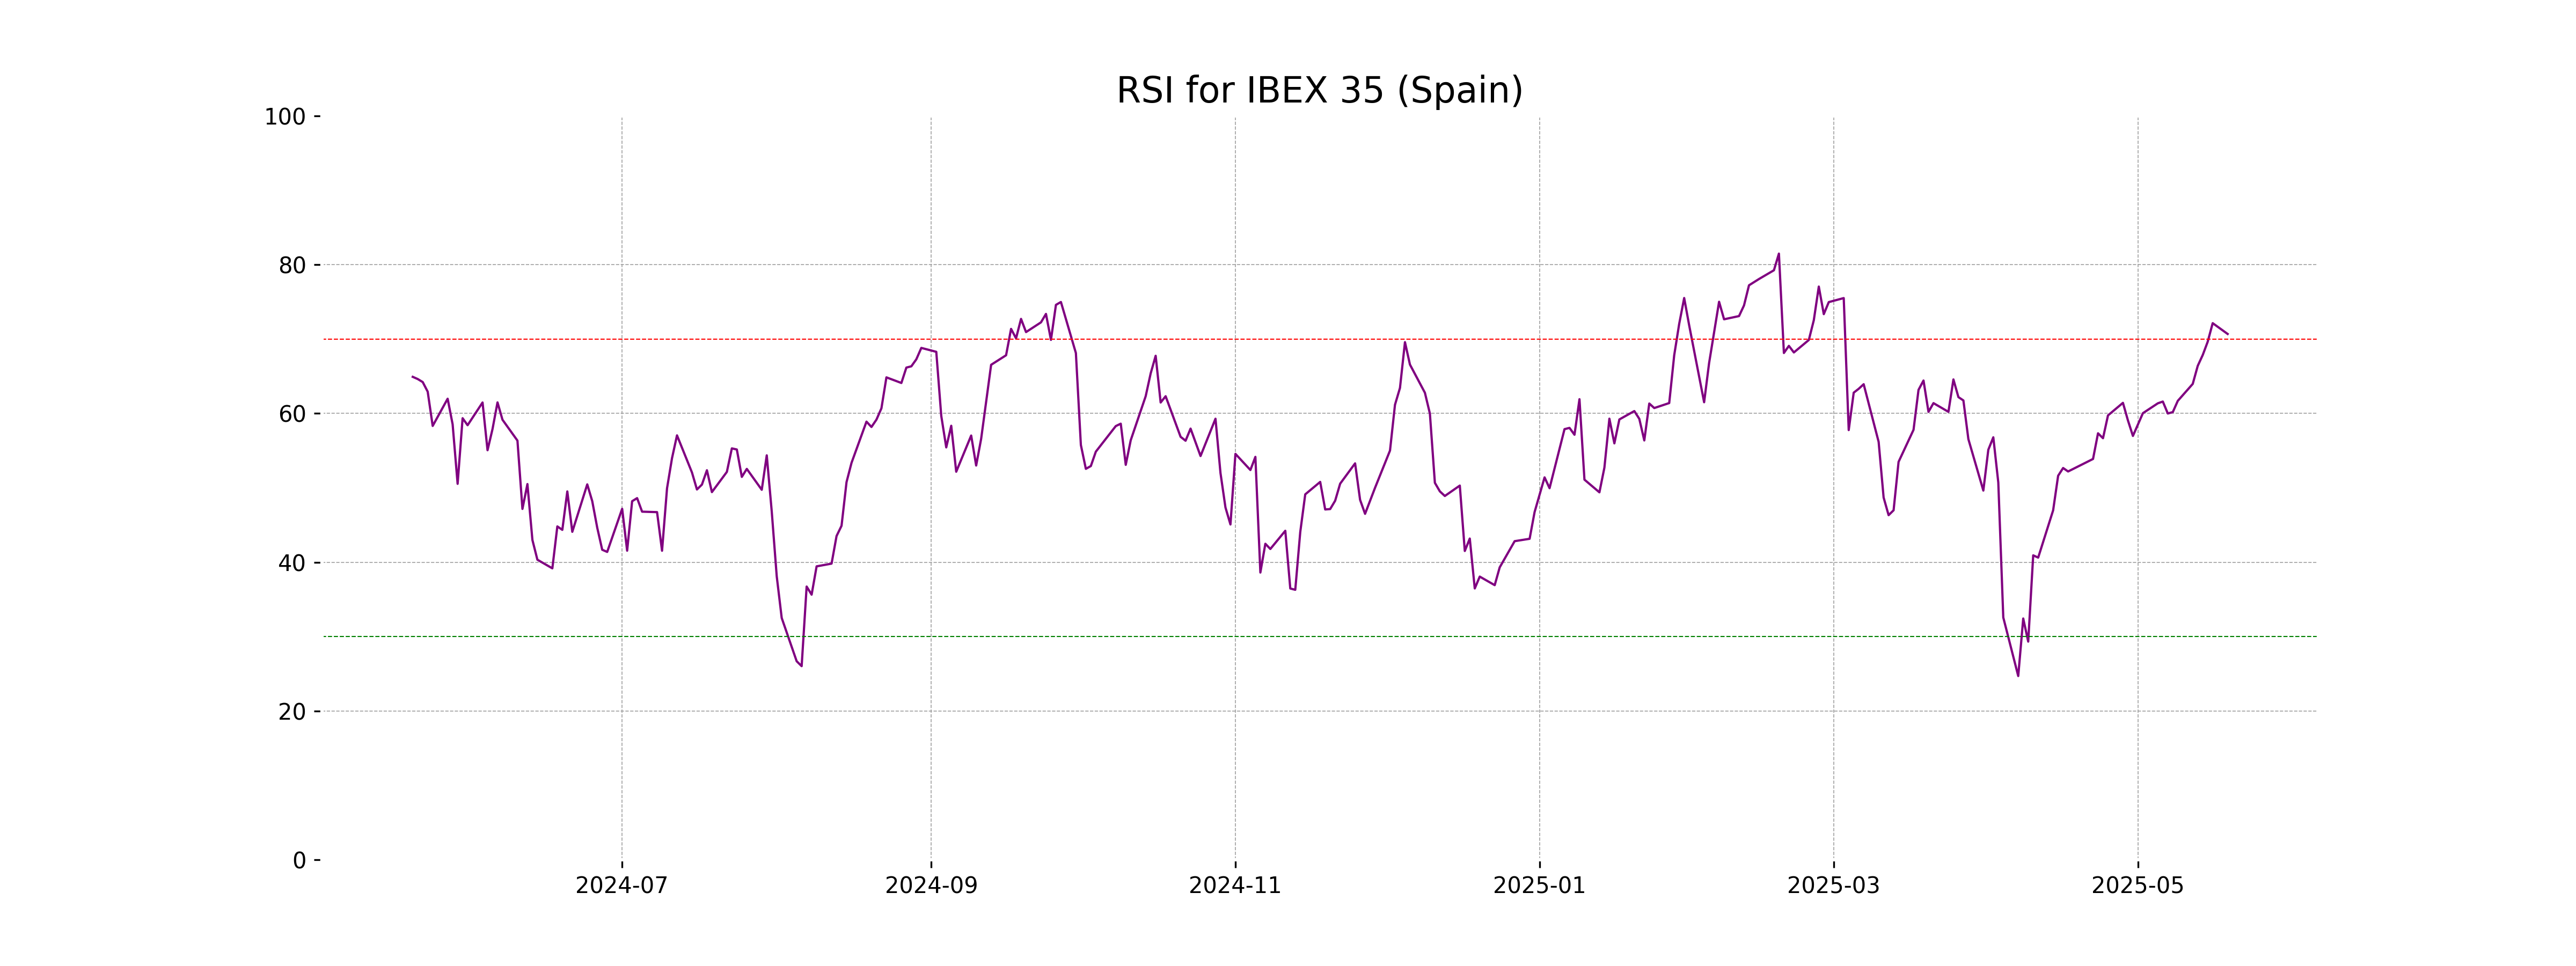
Analysis for IBEX 35 (Spain) - May 19, 2025
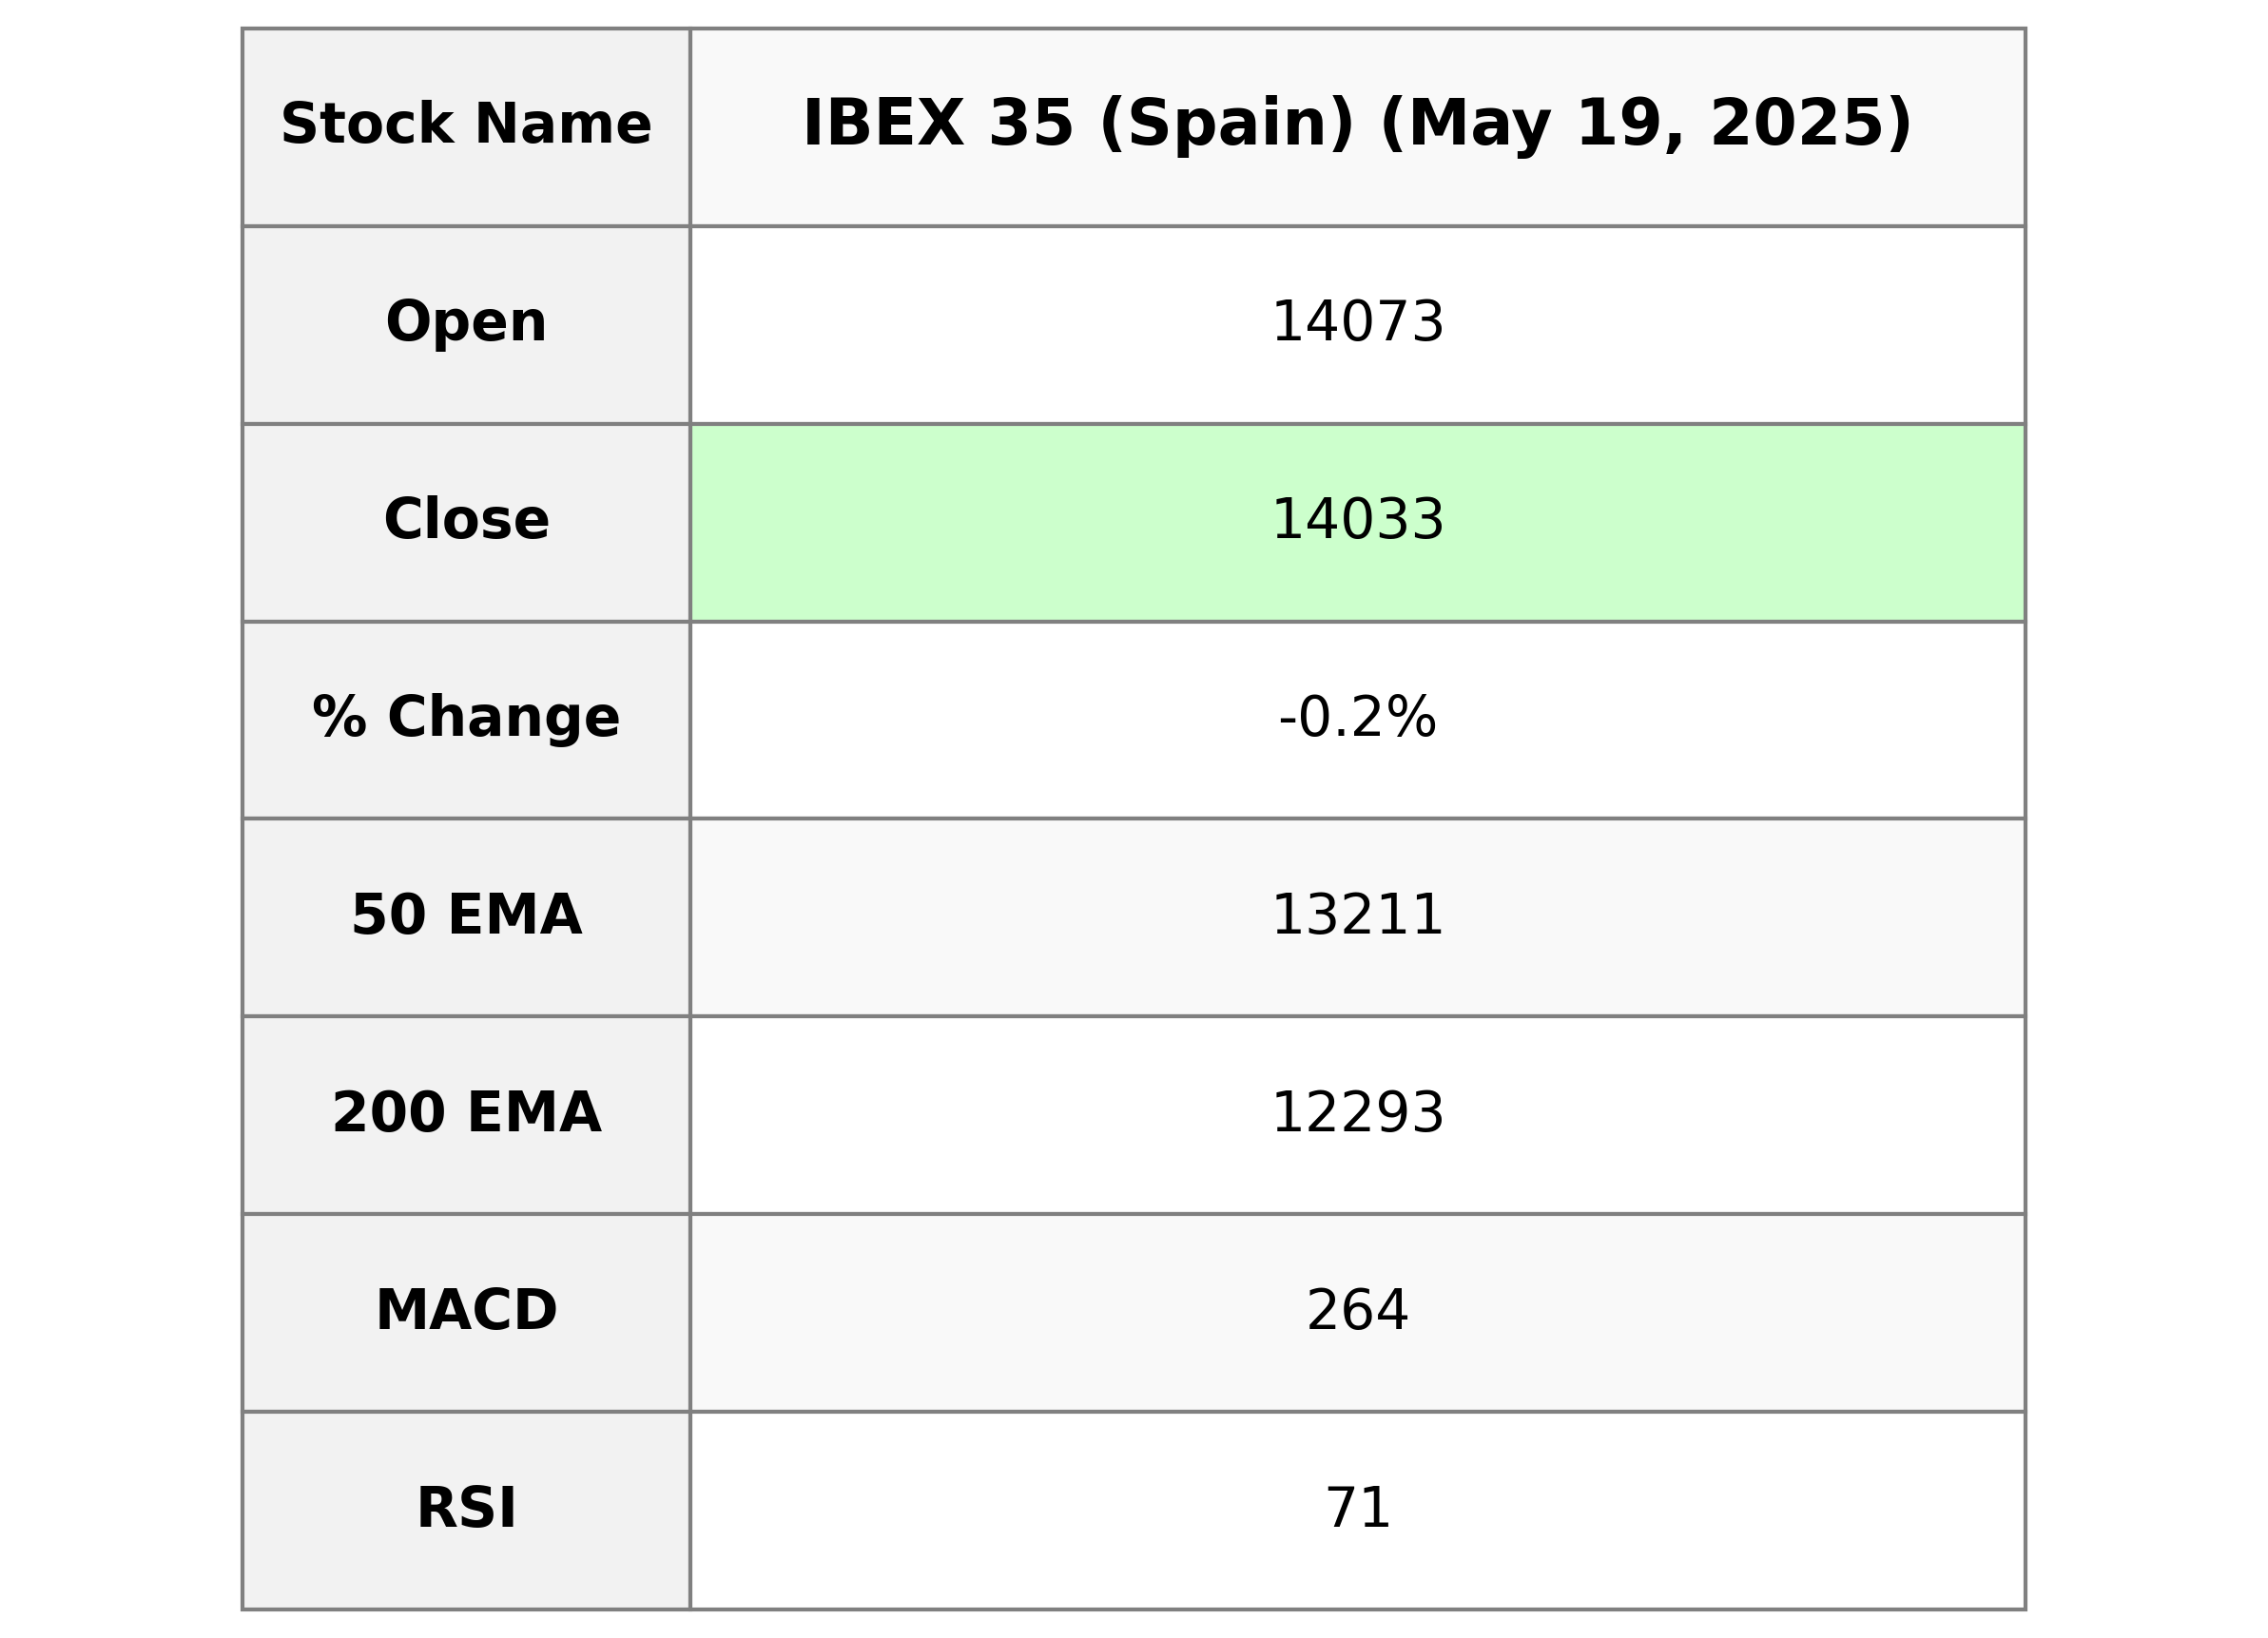
IBEX 35 (Spain) opened at 14,072.7, reaching a high of 14,082.5 and a low of 14,003.4, before closing at 14,033.3. The index experienced a decline, with a percentage change of -0.22% and a points change of -31.2. The RSI indicates strong bullish momentum at 70.69, while the MACD of 264.13 suggests positive market sentiment above the signal of 206.12.
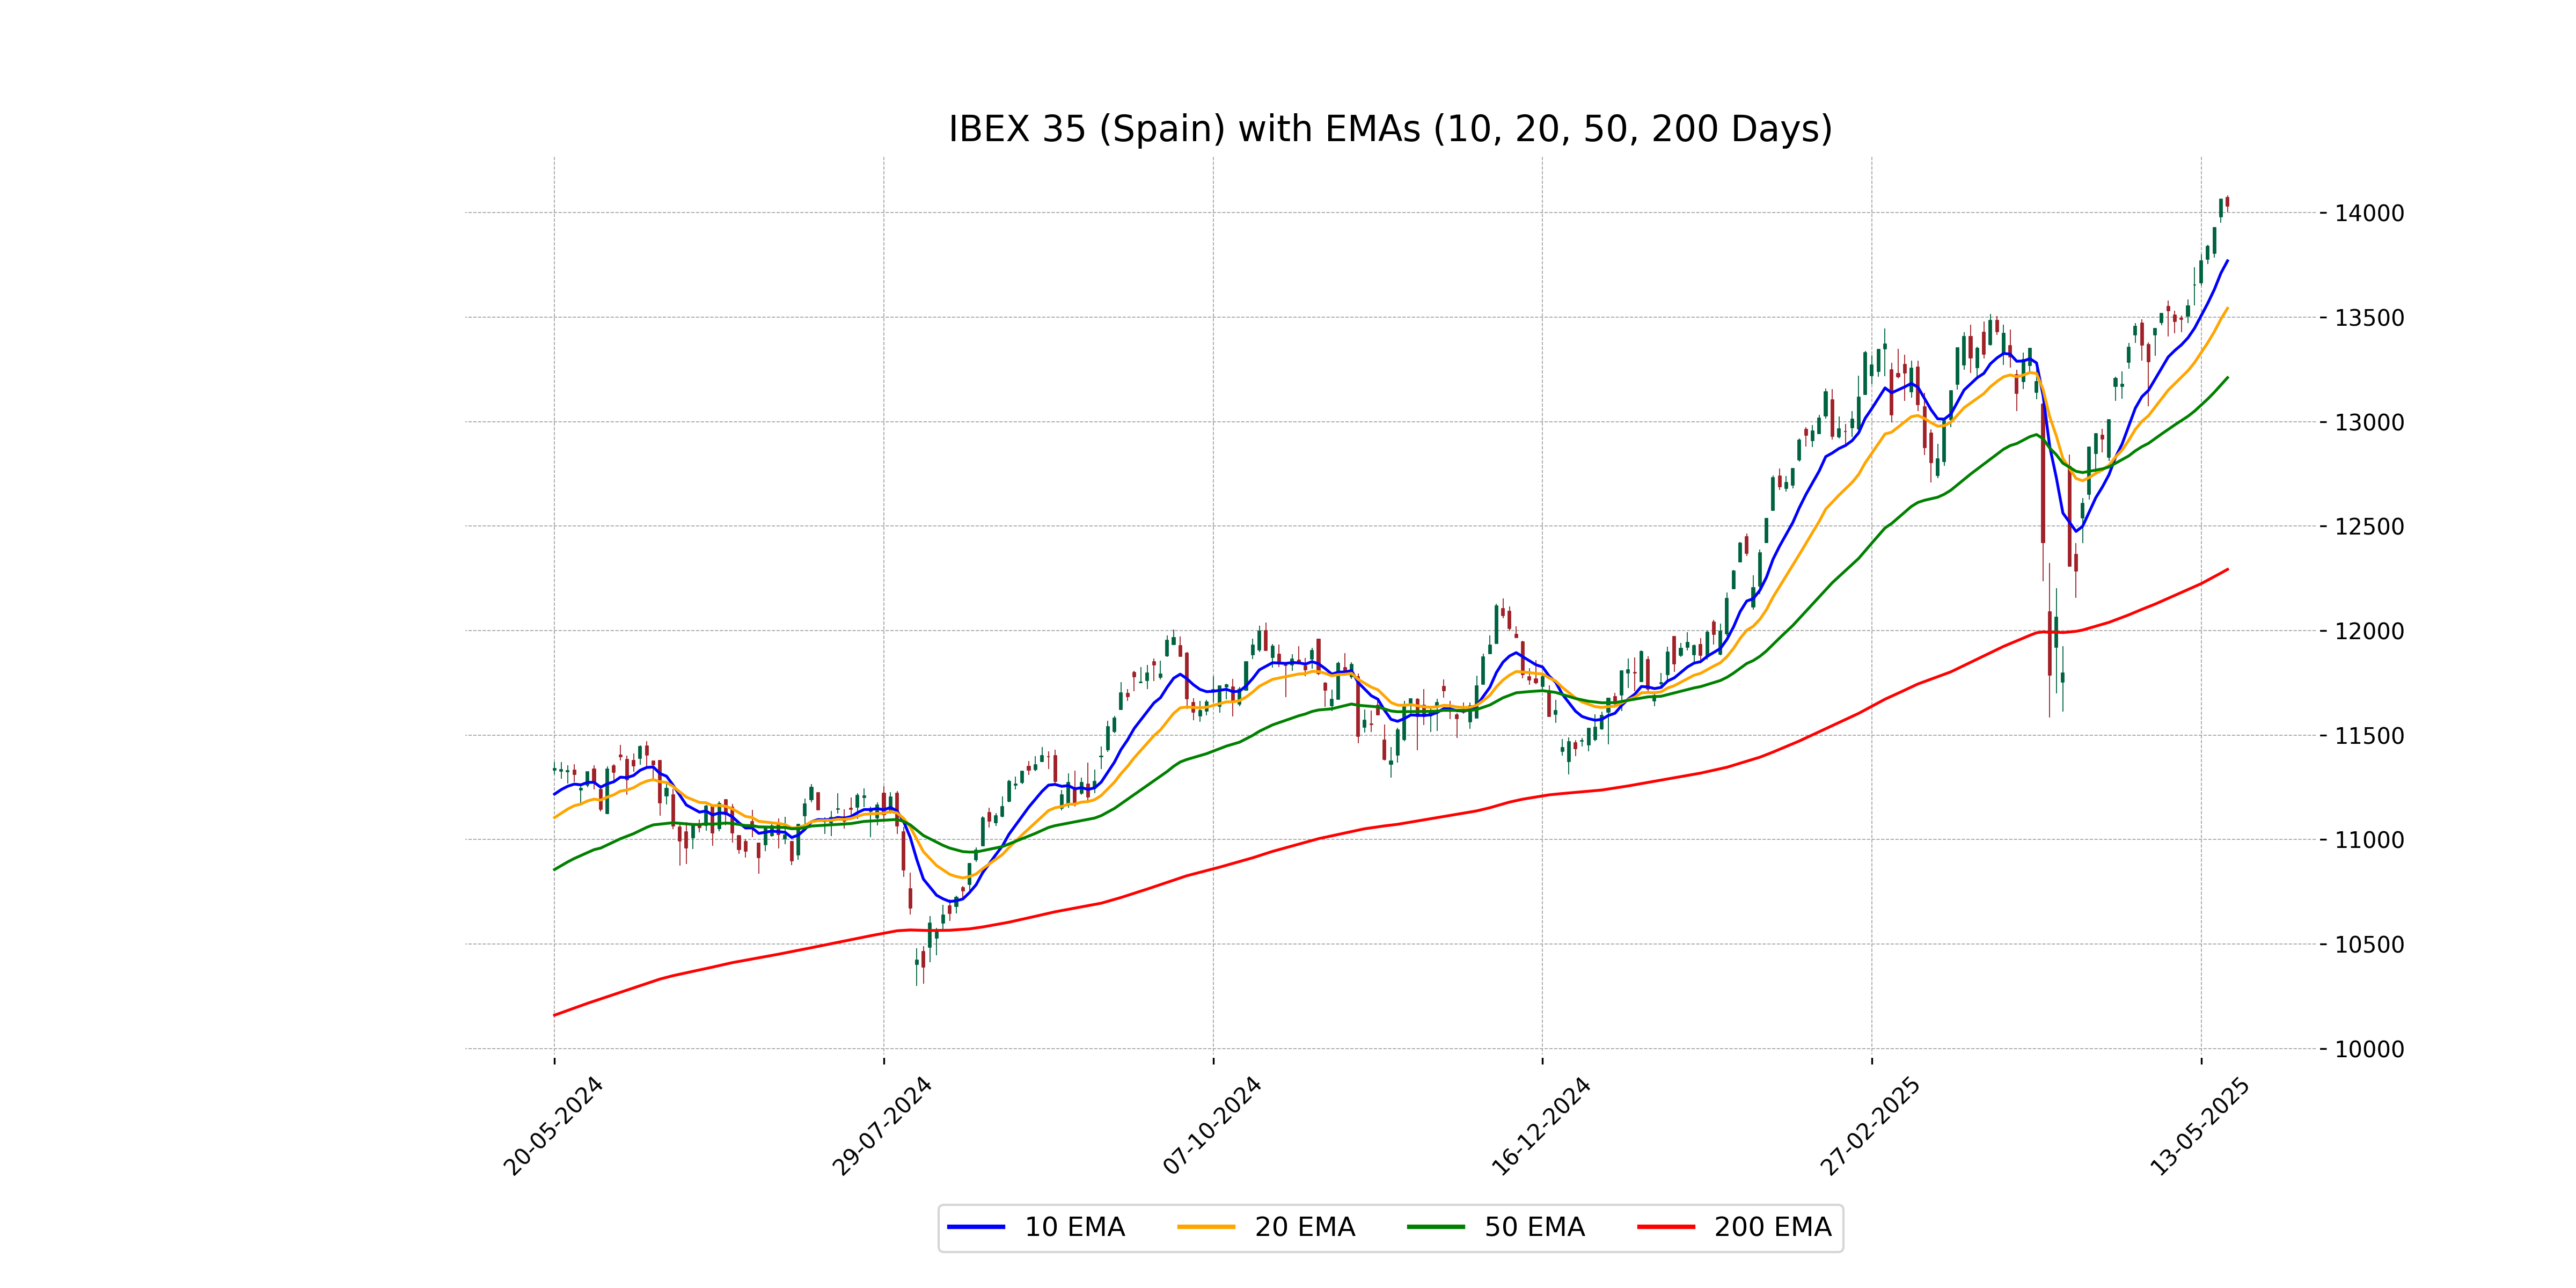
Relationship with Key Moving Averages
The current close of the IBEX 35 at 14033.30 is above its 50-day EMA of 13210.83, 200-day EMA of 12293.09, 10-day EMA of 13769.99, and 20-day EMA of 13542.88, indicating a strong bullish trend. The RSI of 70.69 suggests overbought conditions, while the MACD of 264.13 being above the MACD Signal of 206.12 supports continued upward momentum.
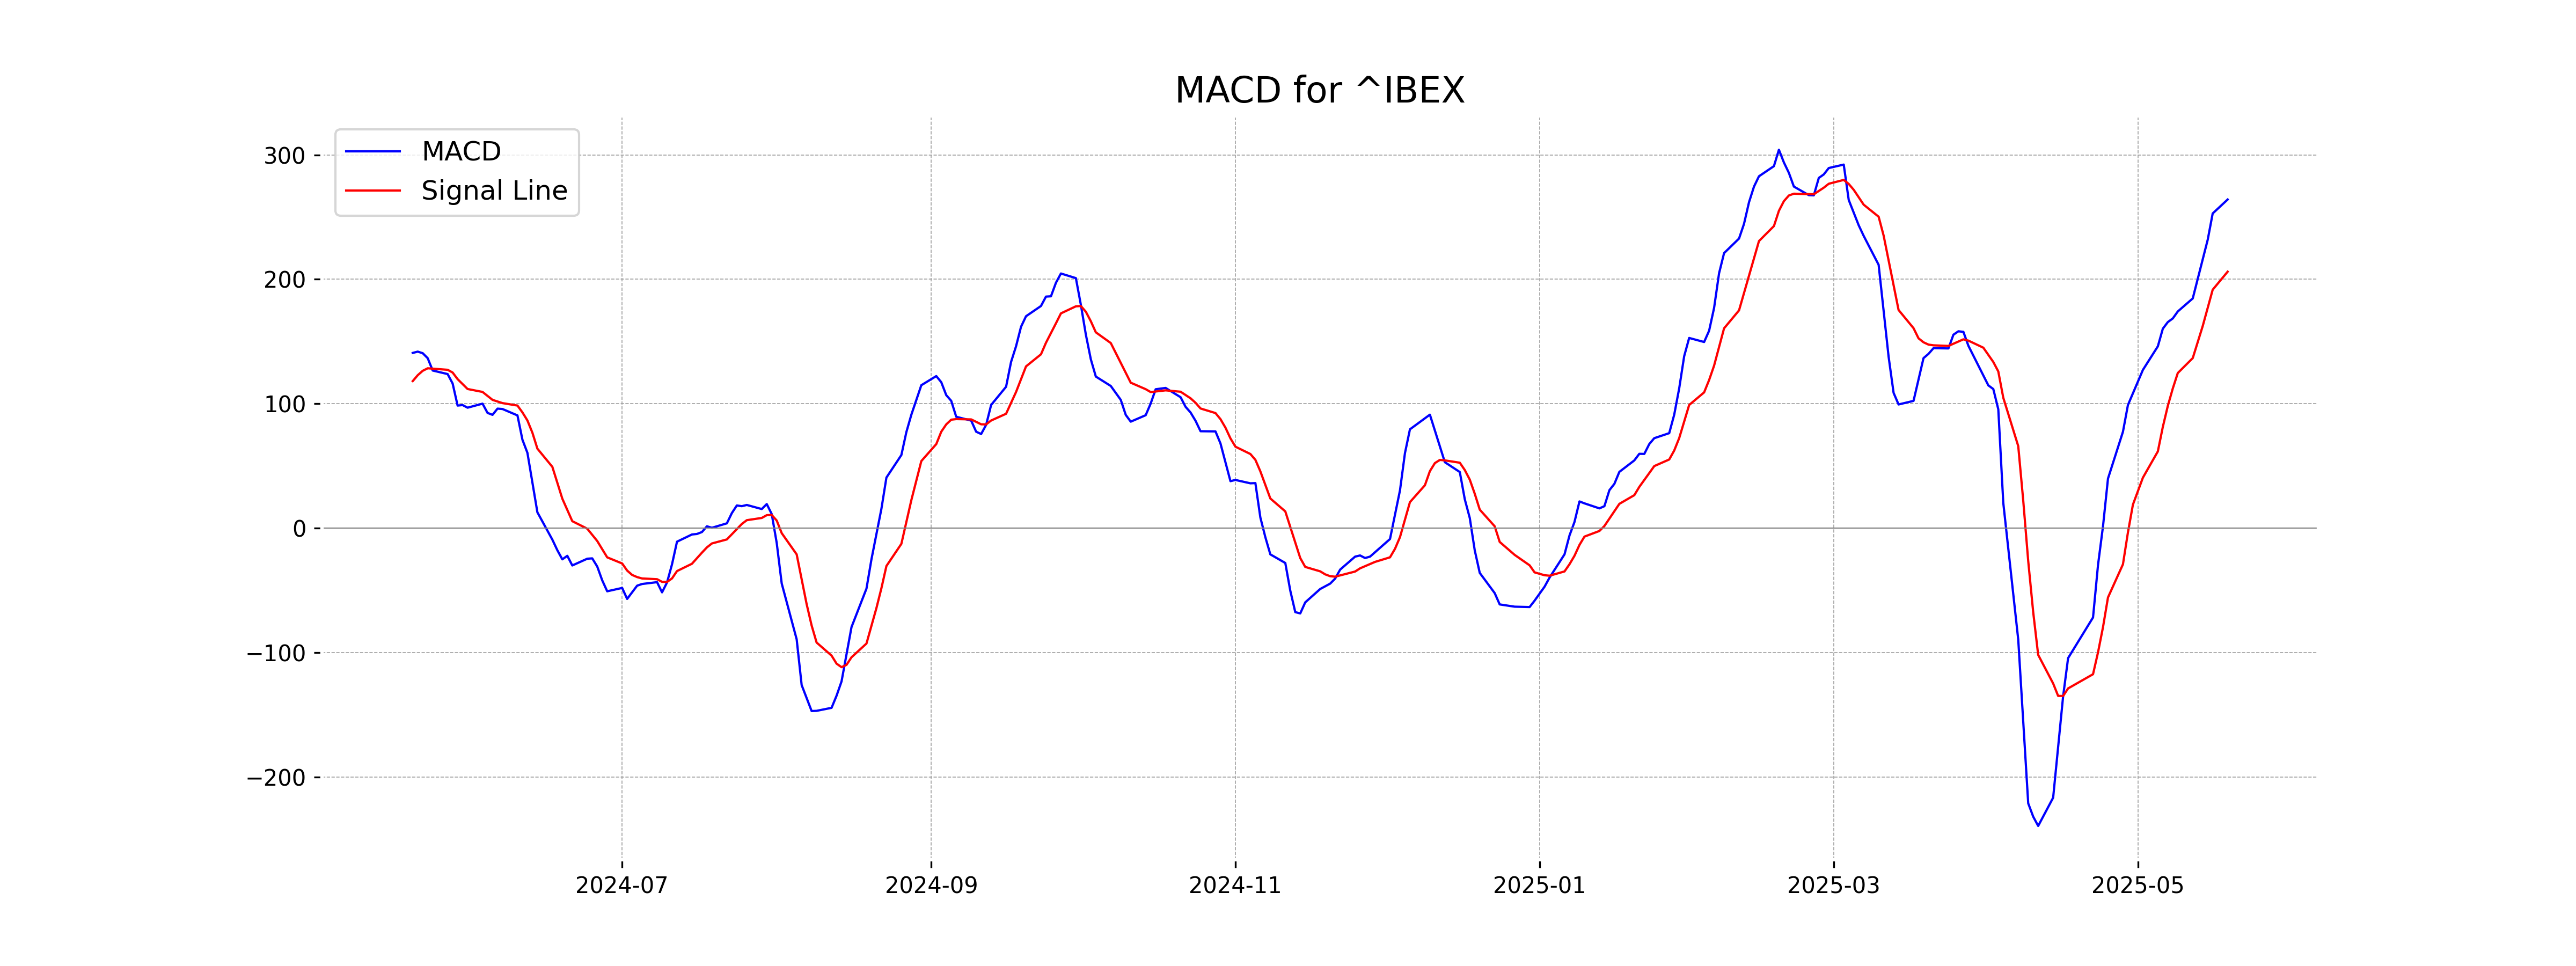
Moving Averages Trend (MACD)
The MACD for IBEX 35 is at 264.13, with a signal line at 206.12. This indicates a bullish signal as the MACD is above the signal line, suggesting upward momentum in the market.
RSI Analysis
IBEX 35 (Spain) RSI Analysis: The Relative Strength Index (RSI) for IBEX 35 stands at 70.69, indicating that the index is approaching overbought levels. This suggests potential caution for investors as it may signal a forthcoming price correction or a pullback.
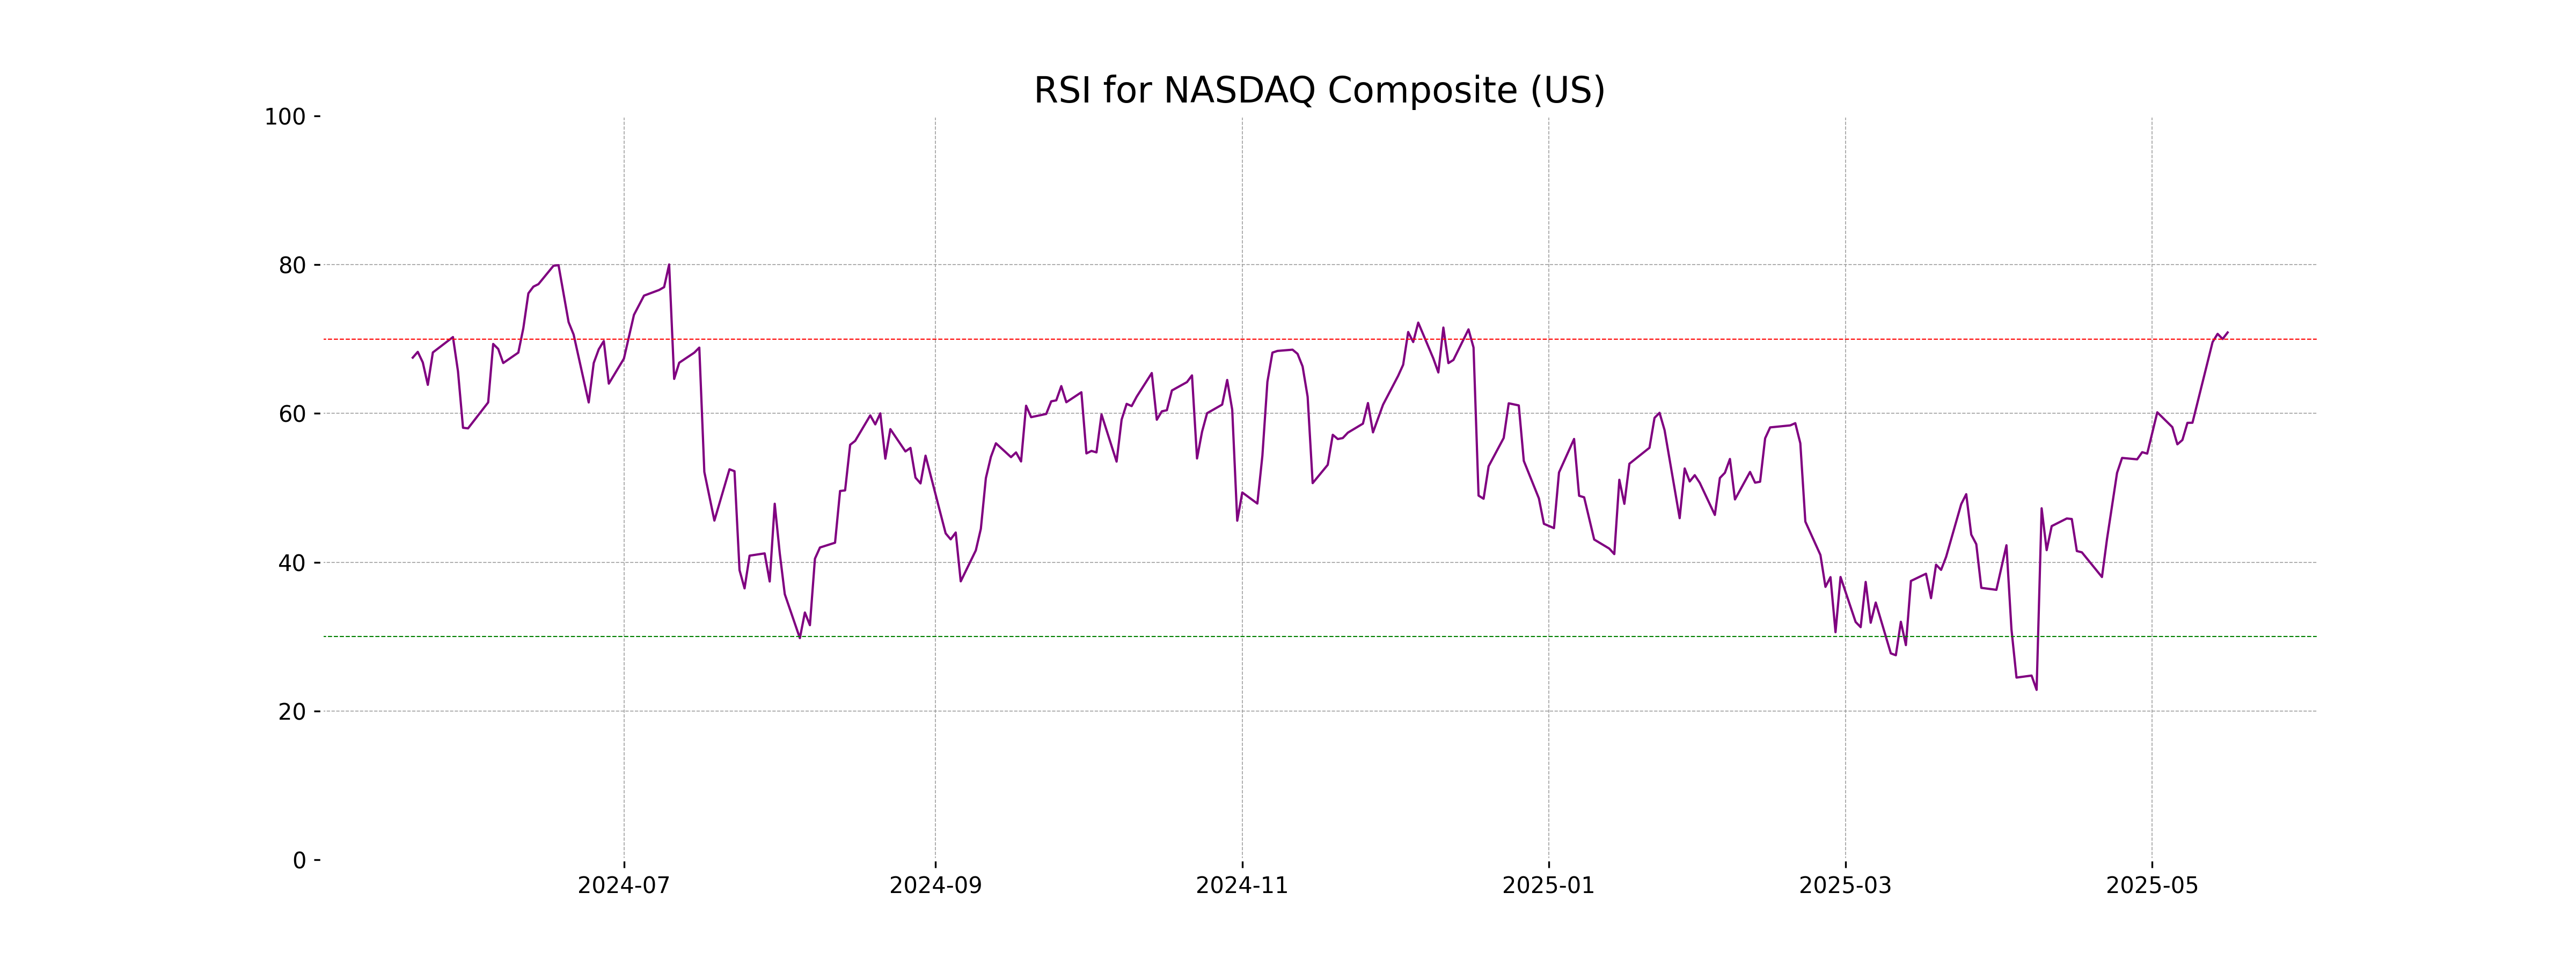
Analysis for NASDAQ Composite (US) - May 19, 2025
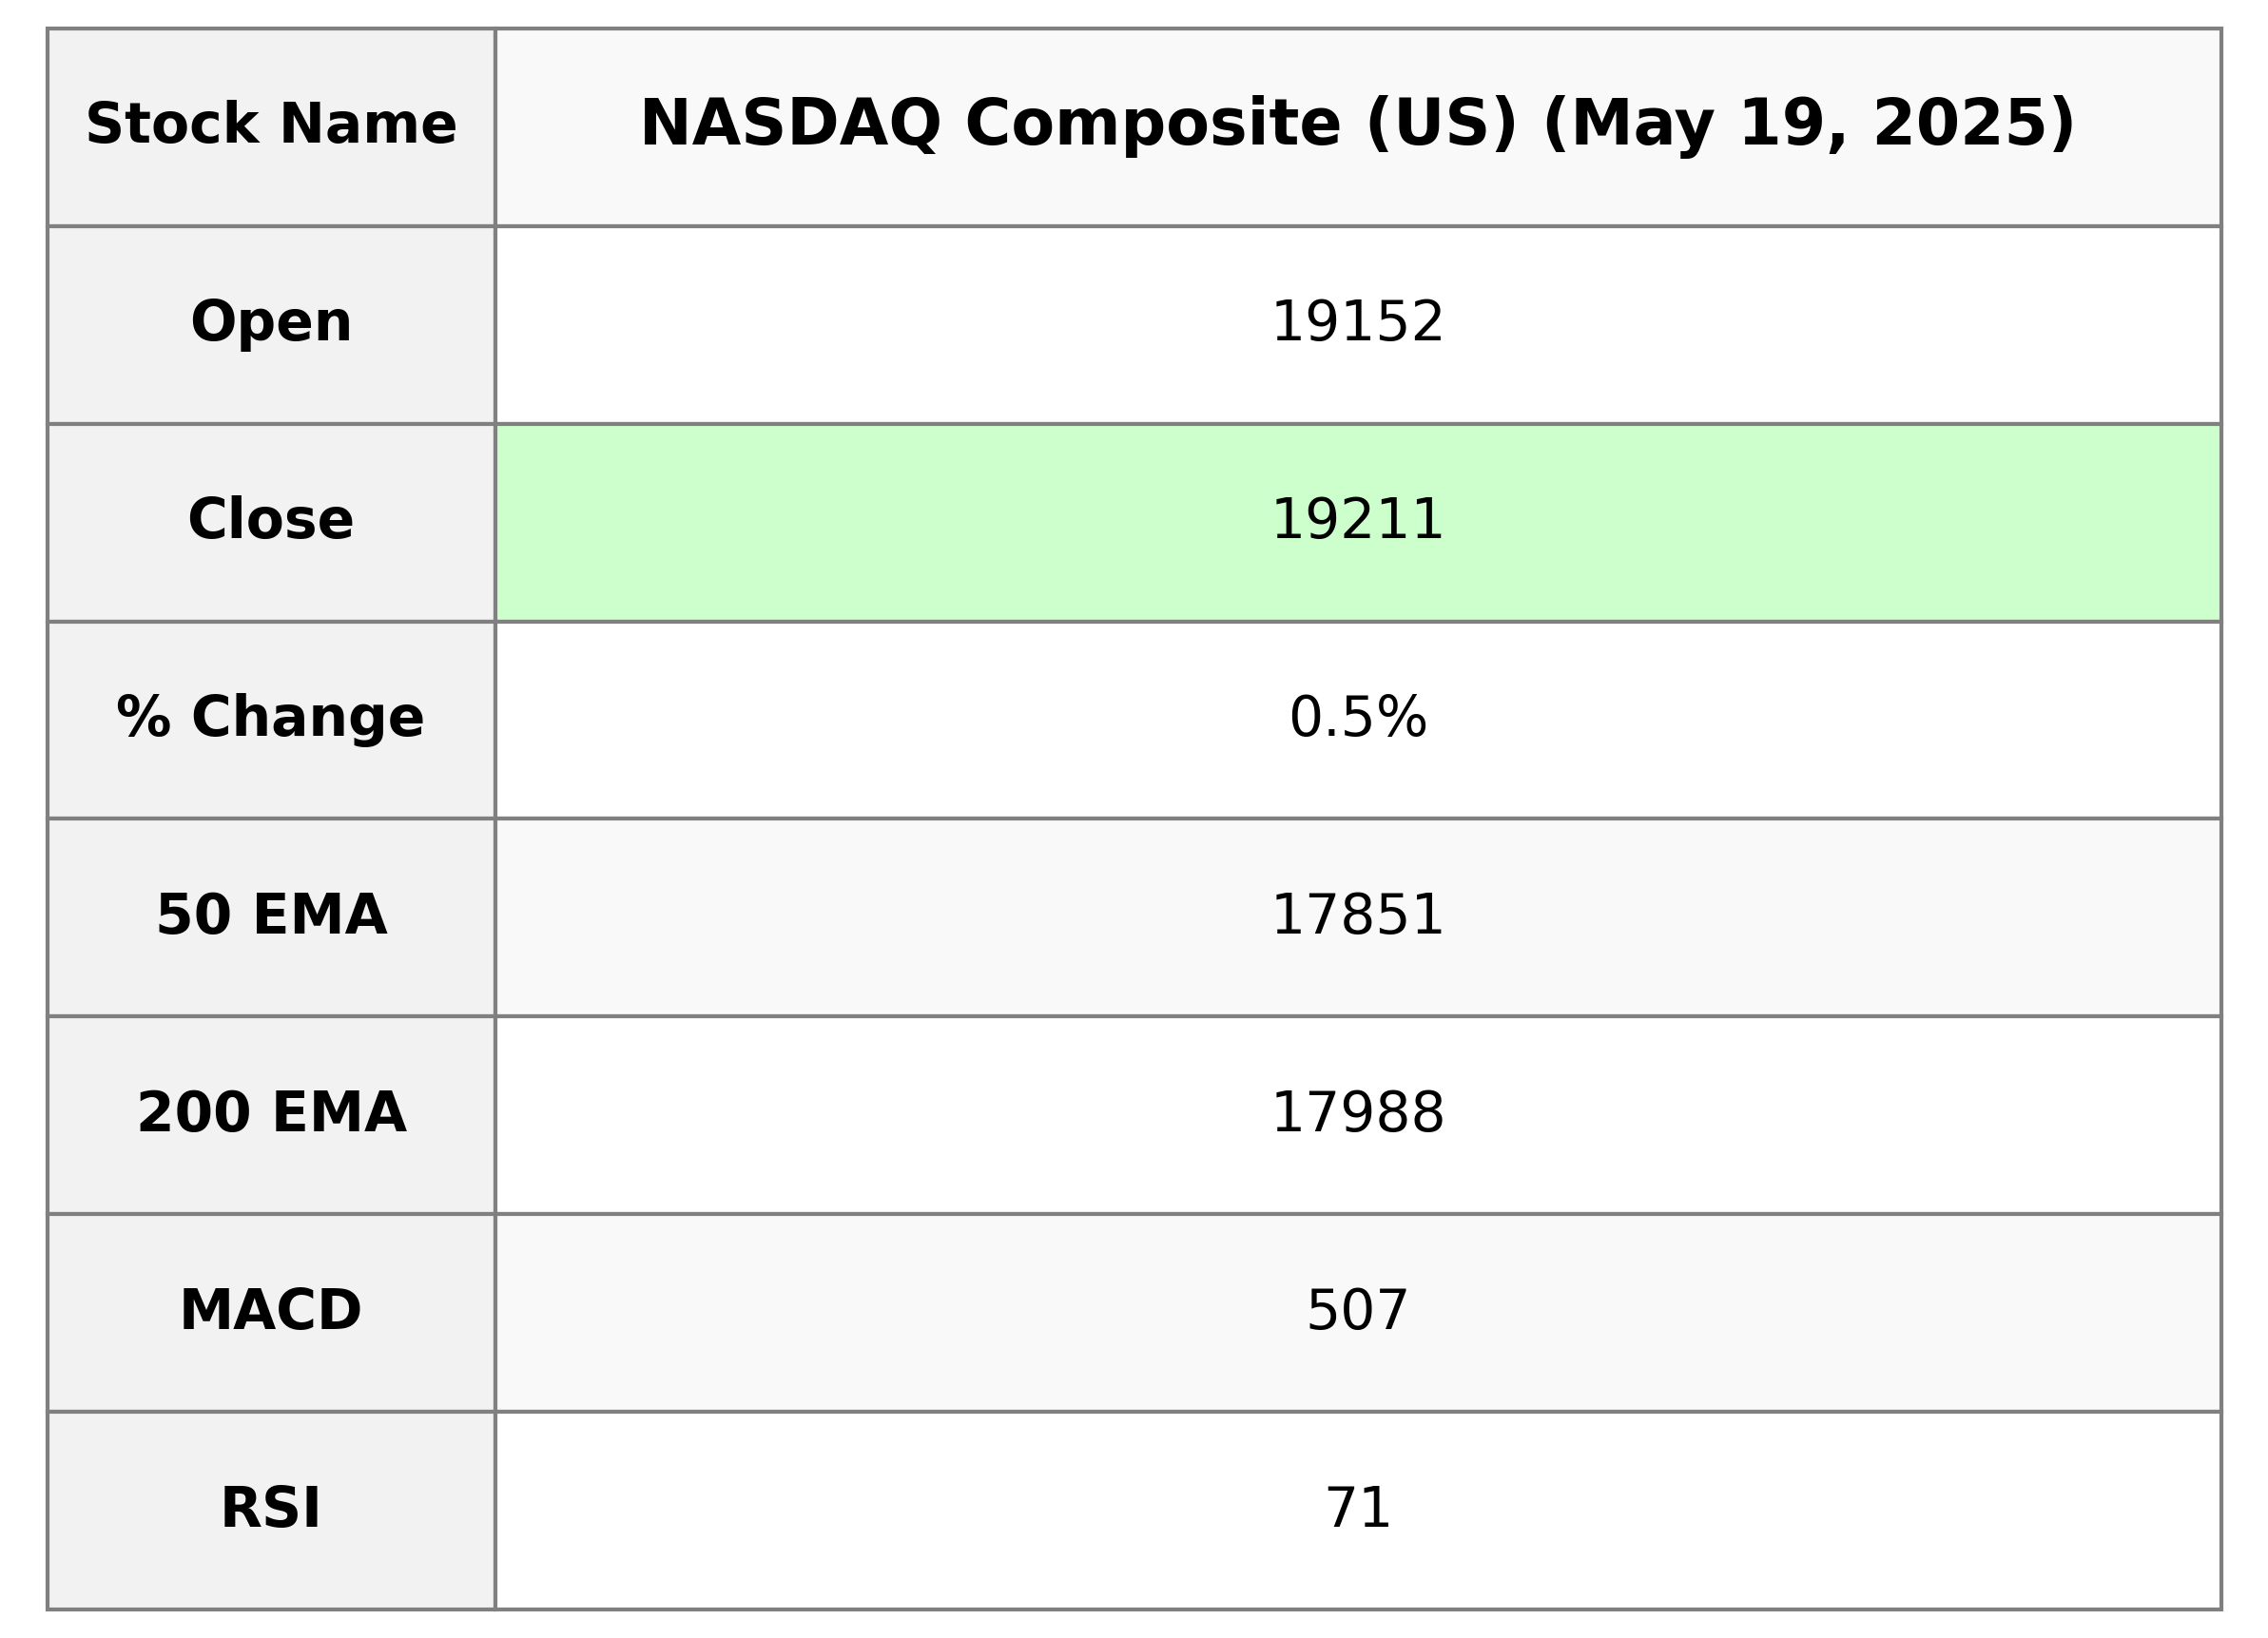
NASDAQ Composite (US) Performance: The NASDAQ Composite opened at 19,151.54 and closed at 19,211.10, marking a percentage change of 0.52% and a points gain of 98.78. The trading volume was 10,509,820,000. Notable indicators include an RSI of 70.89, suggesting an overbought condition, and a MACD of 507.17, indicating strong upward momentum.
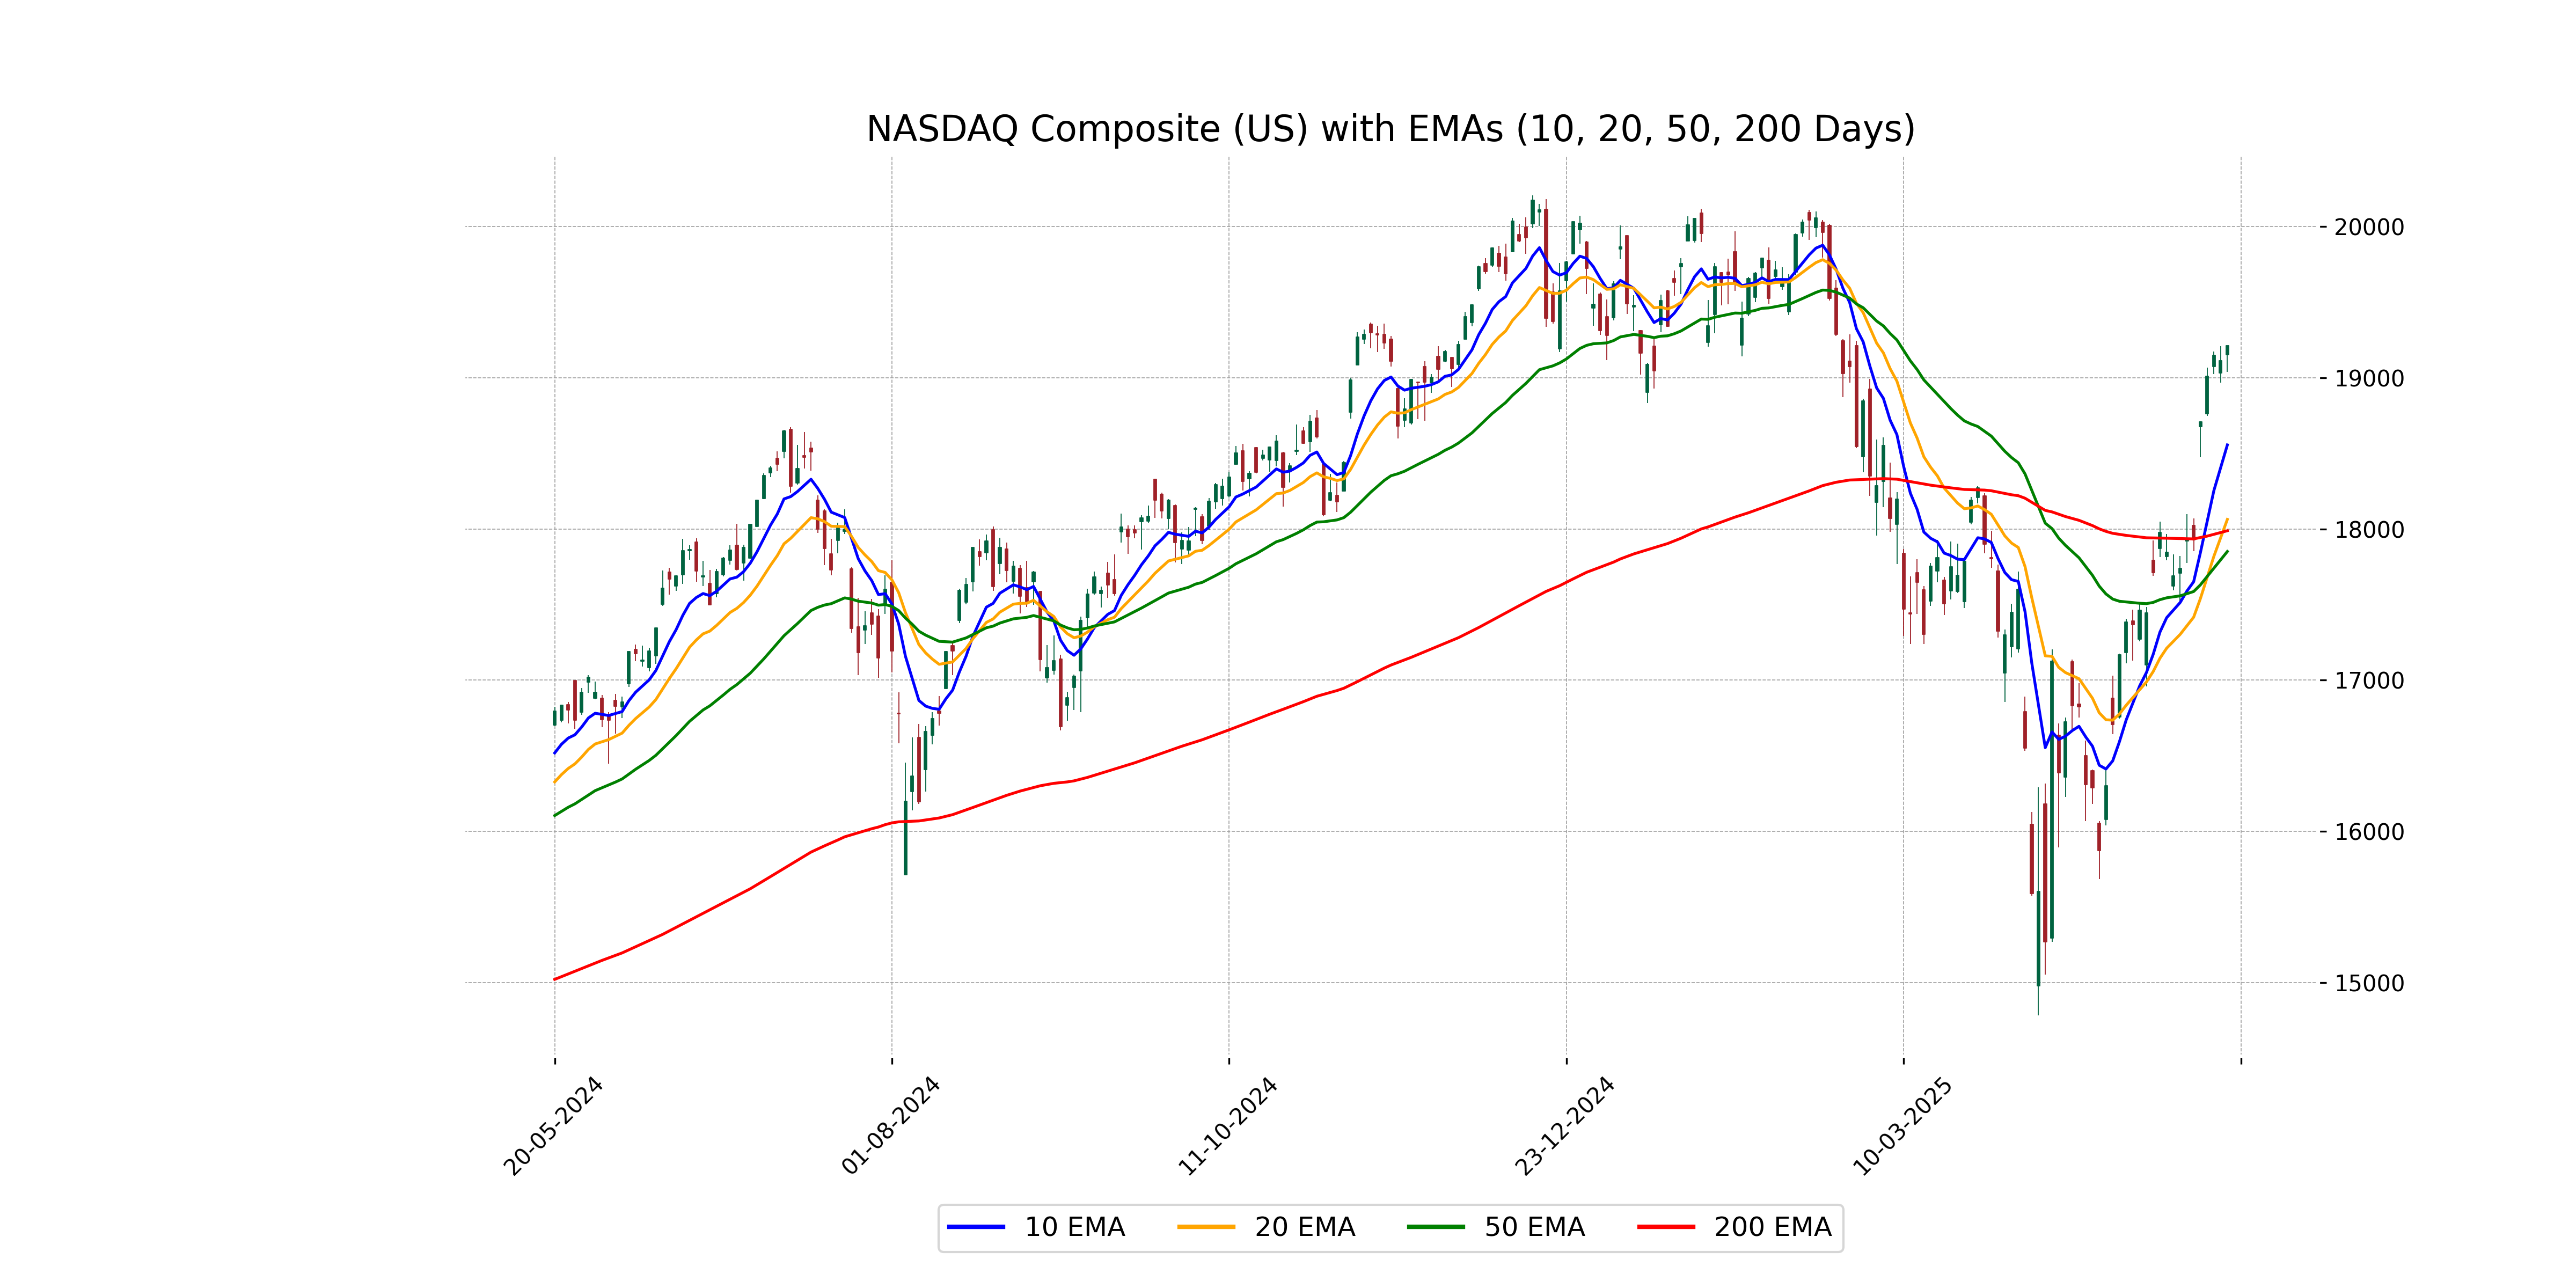
Relationship with Key Moving Averages
The Nasdaq Composite closed at 19,211.10, which is above its 50-day EMA of 17,850.62 and its 200-day EMA of 17,987.83, indicating a strong uptrend. It is also above the 10-day EMA of 18,555.42 and the 20-day EMA of 18,062.99, further supporting short-term bullish momentum.
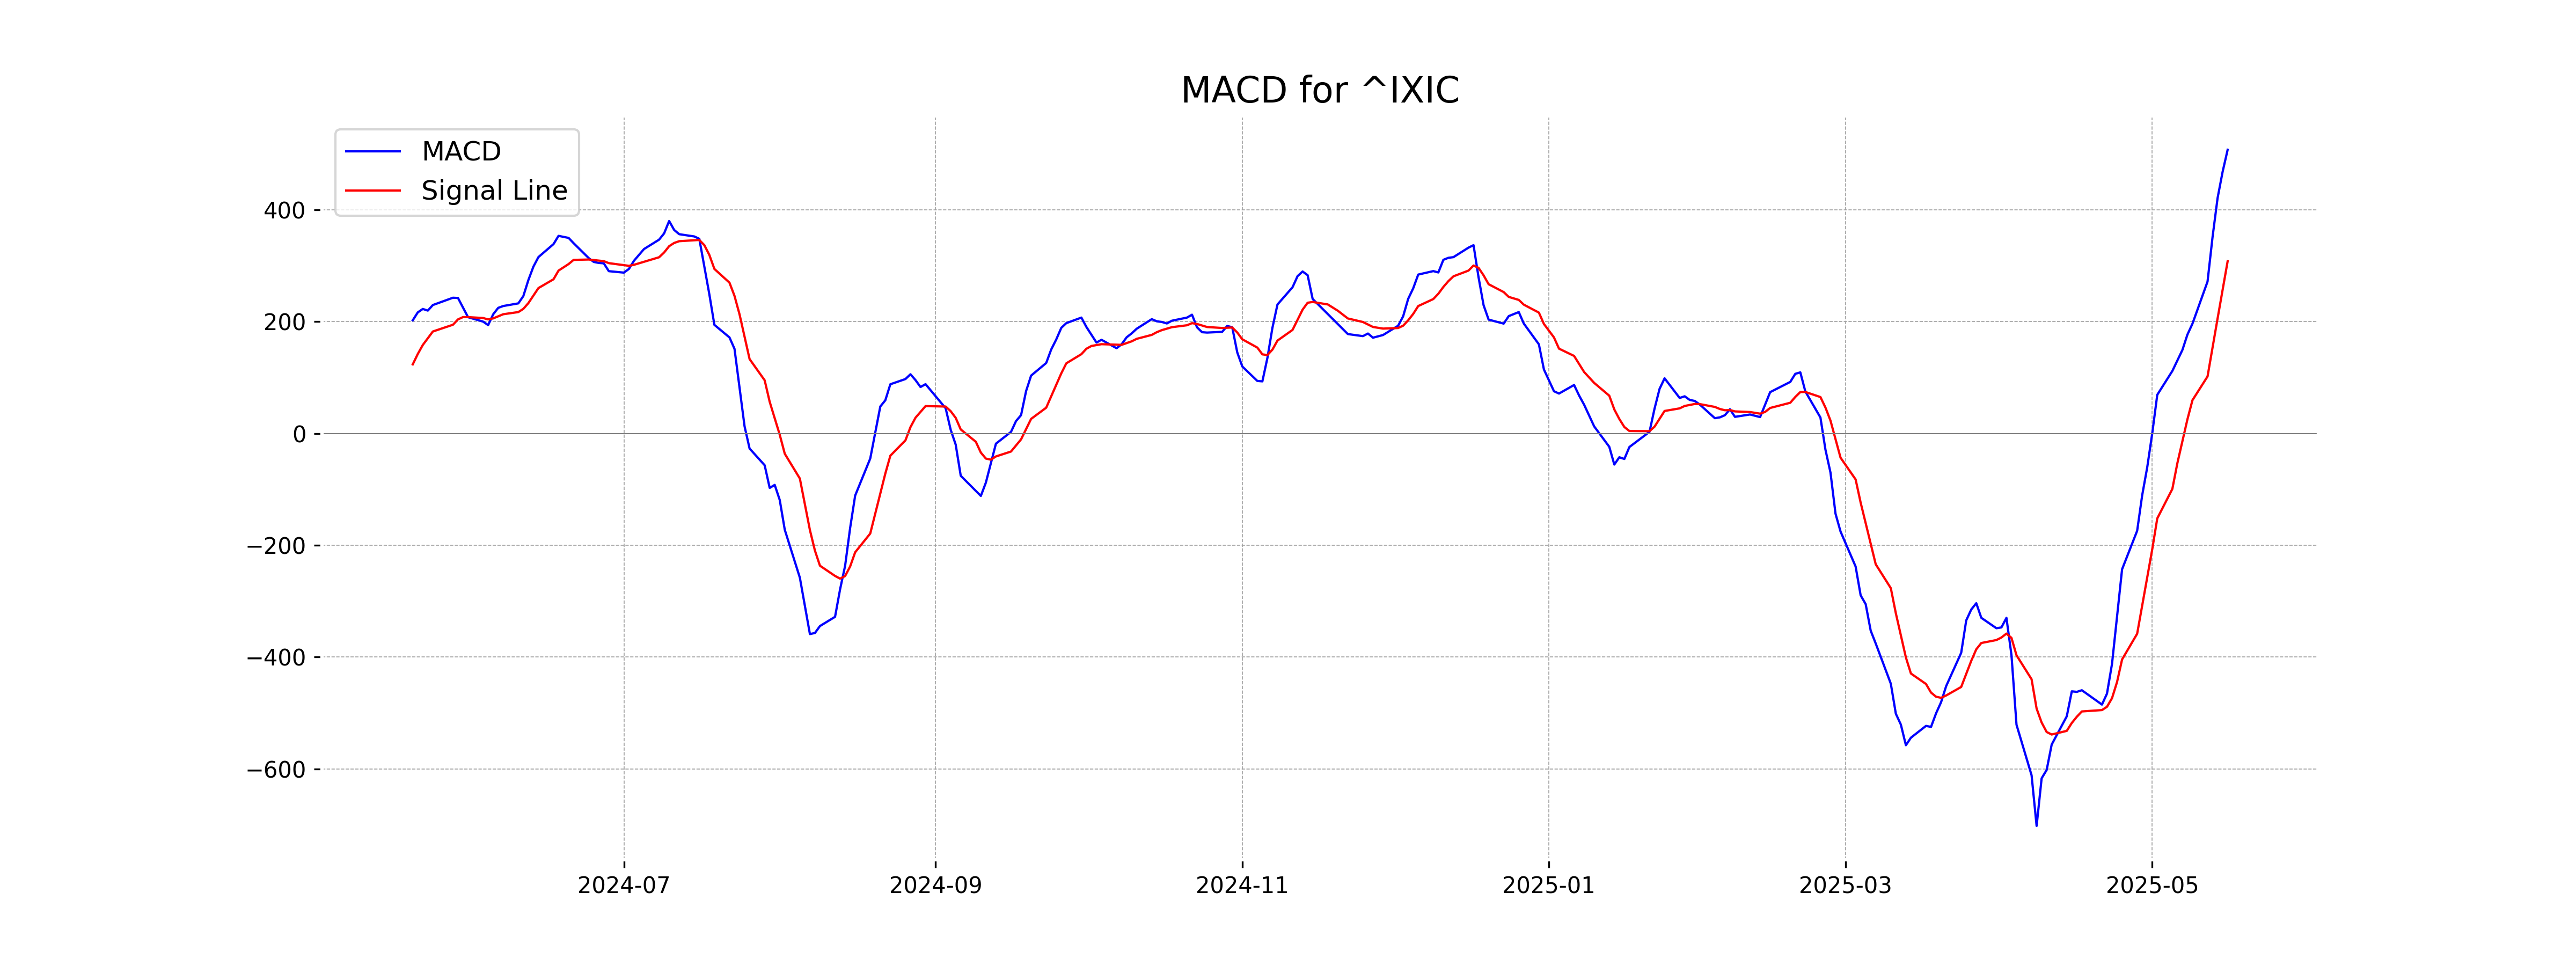
Moving Averages Trend (MACD)
MACD Analysis for NASDAQ Composite (US): The MACD value of 507.17 is significantly above the MACD Signal of 307.84, indicating a bullish trend. This suggests a strong upward momentum in the market, as the MACD line is moving away from the signal line.
RSI Analysis
NASDAQ Composite RSI Analysis The NASDAQ Composite's RSI is at 70.89, indicating the index is in overbought territory. This suggests the possibility of a potential price correction or consolidation in the near term, as the RSI value is above the typical overbought threshold of 70.
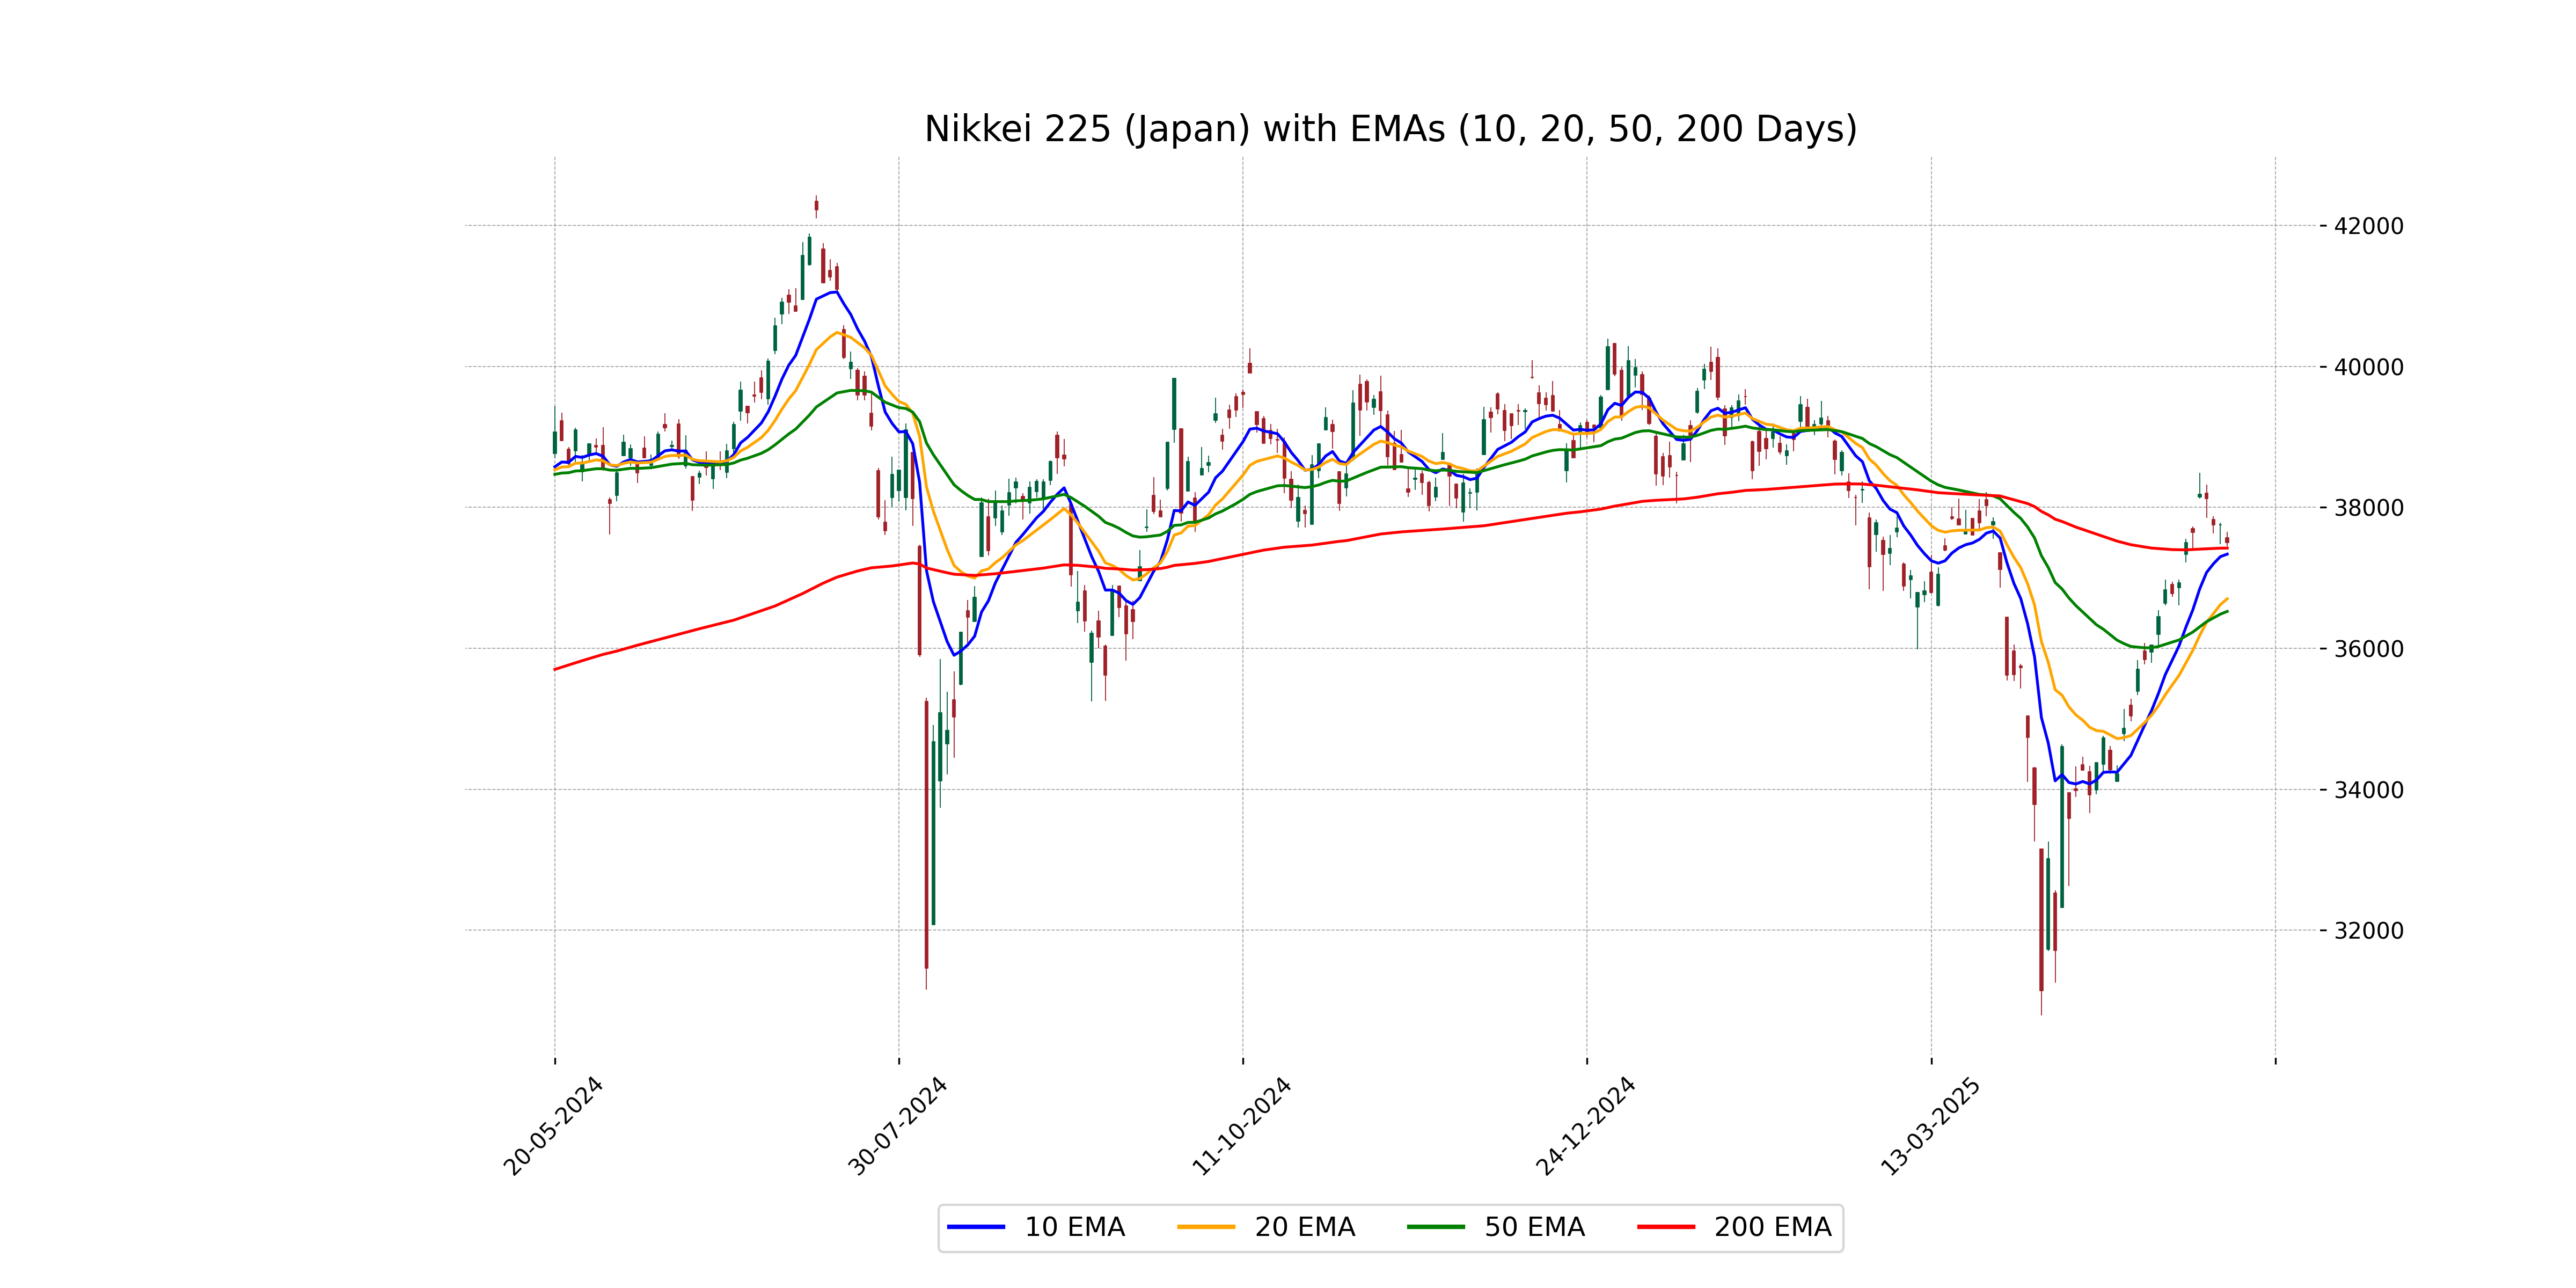
Analysis for Nikkei 225 (Japan) - May 19, 2025
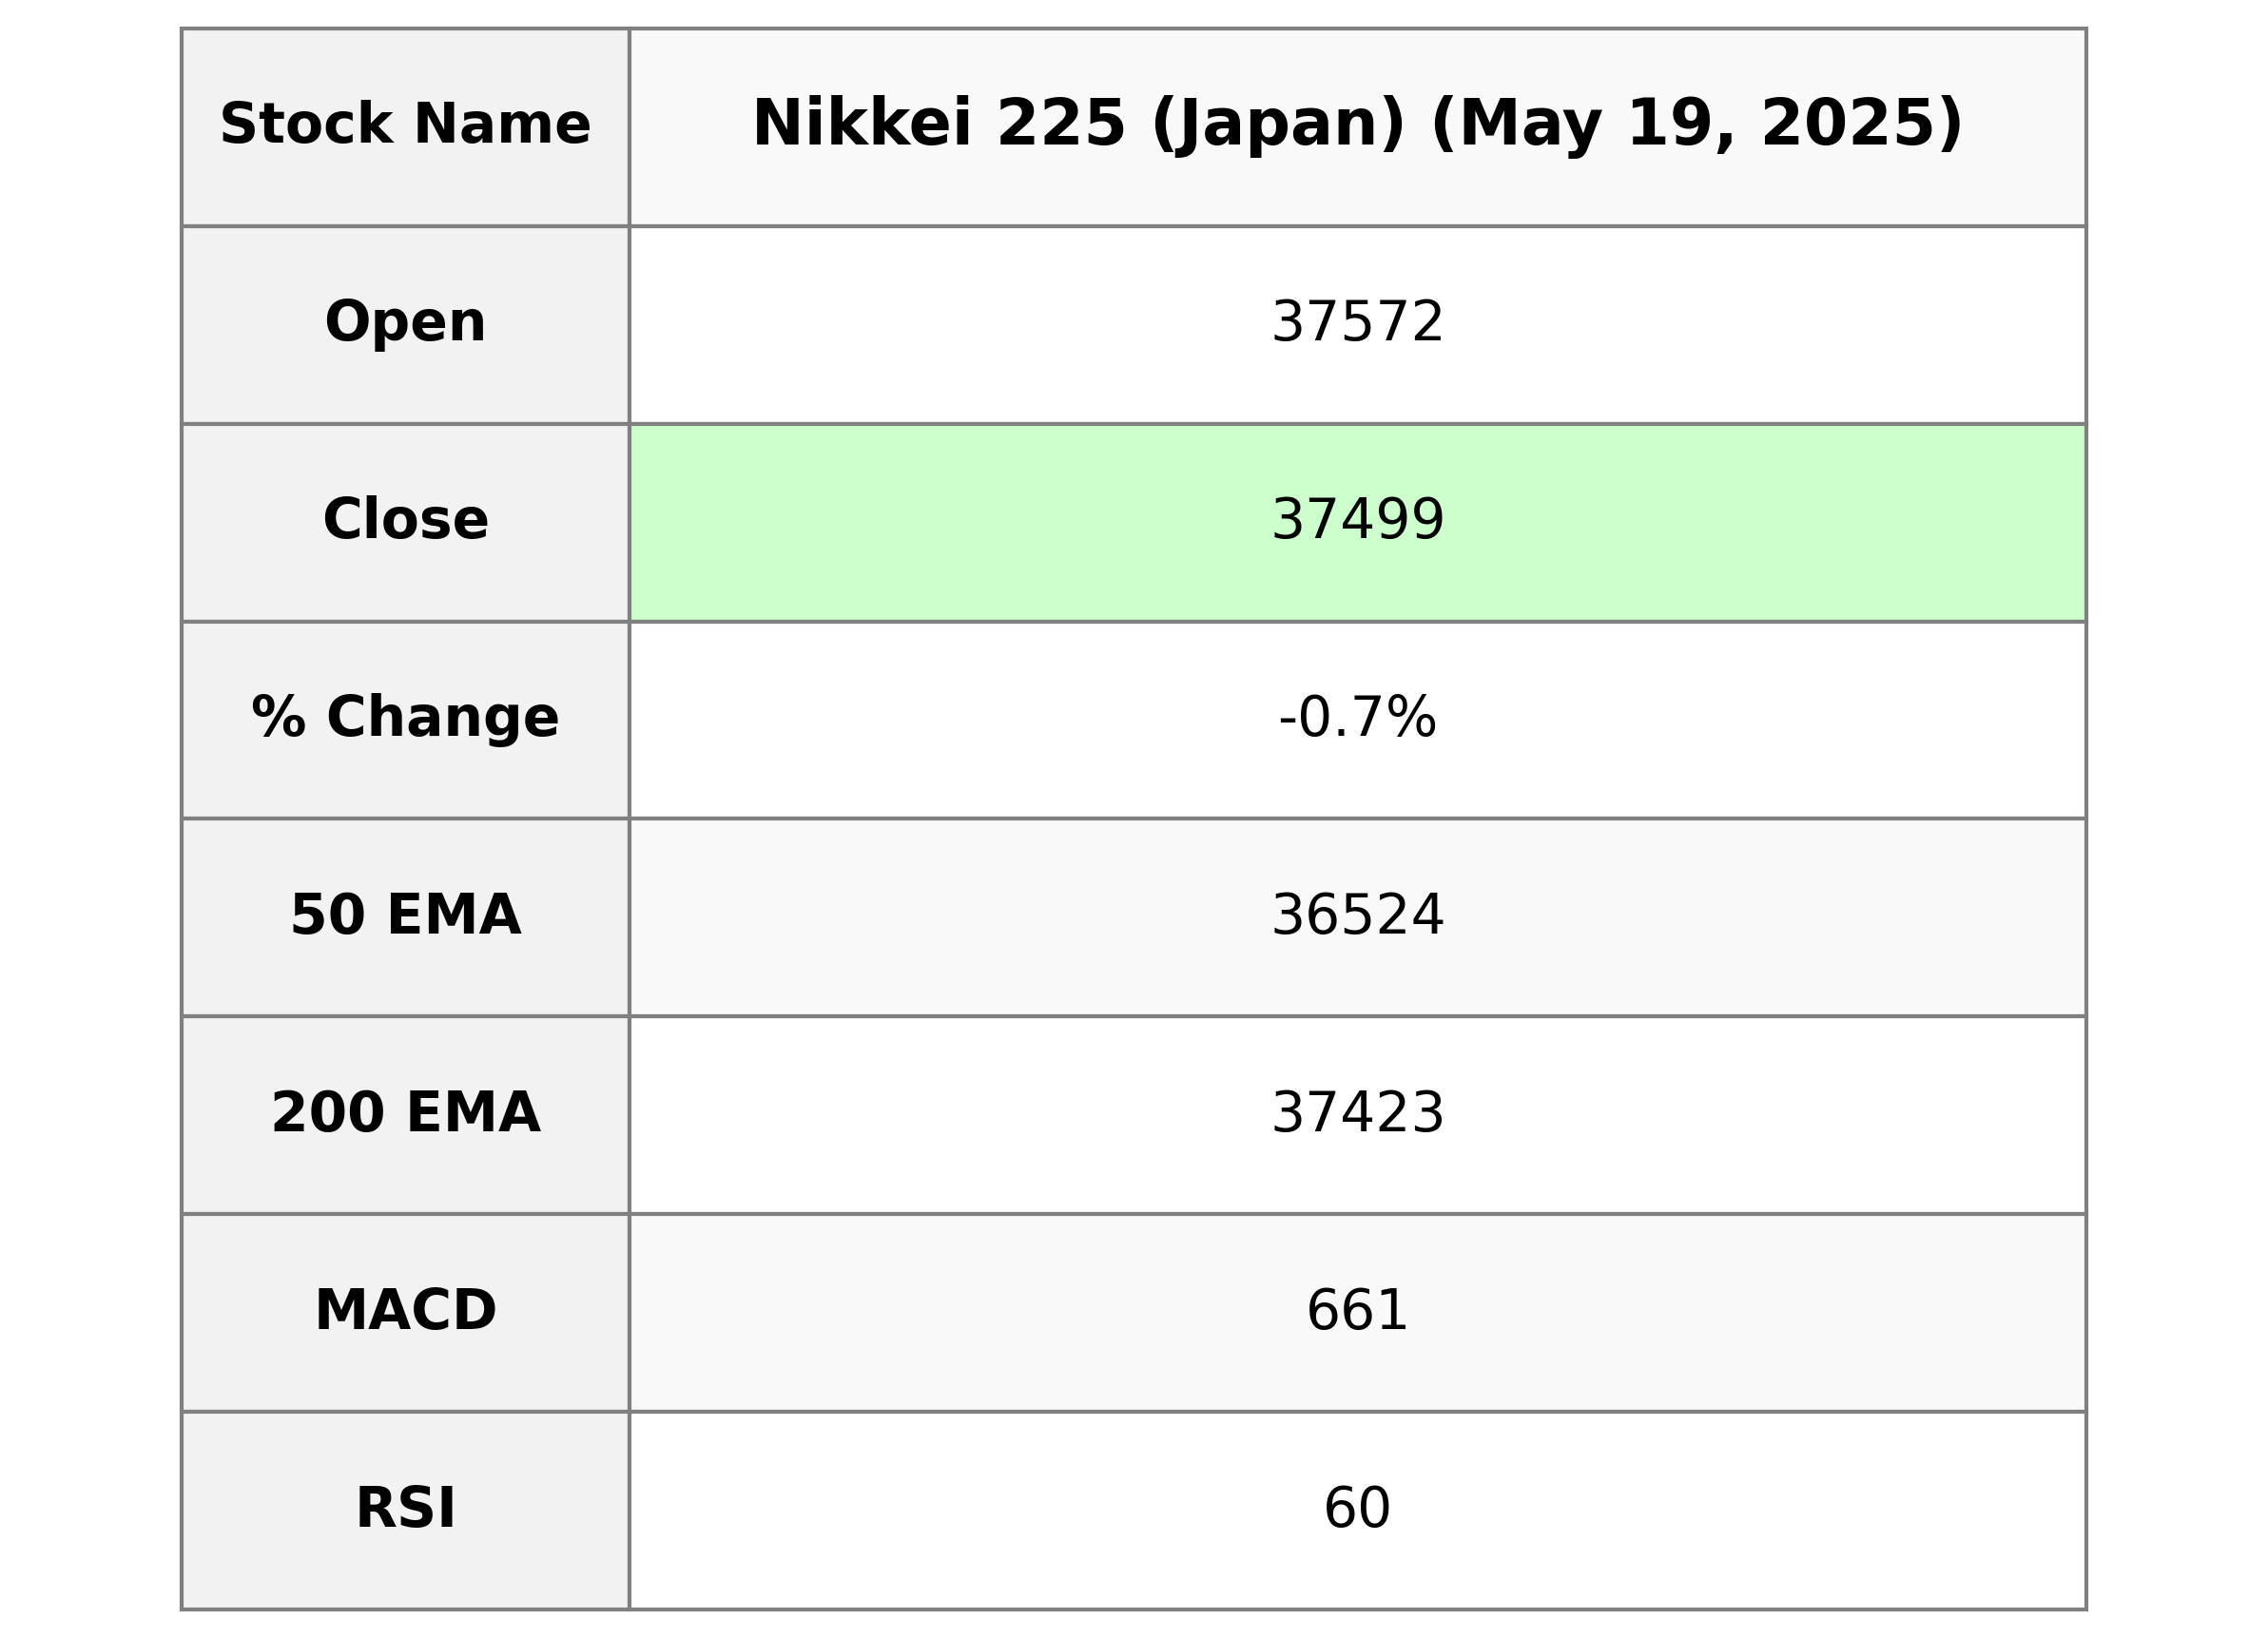
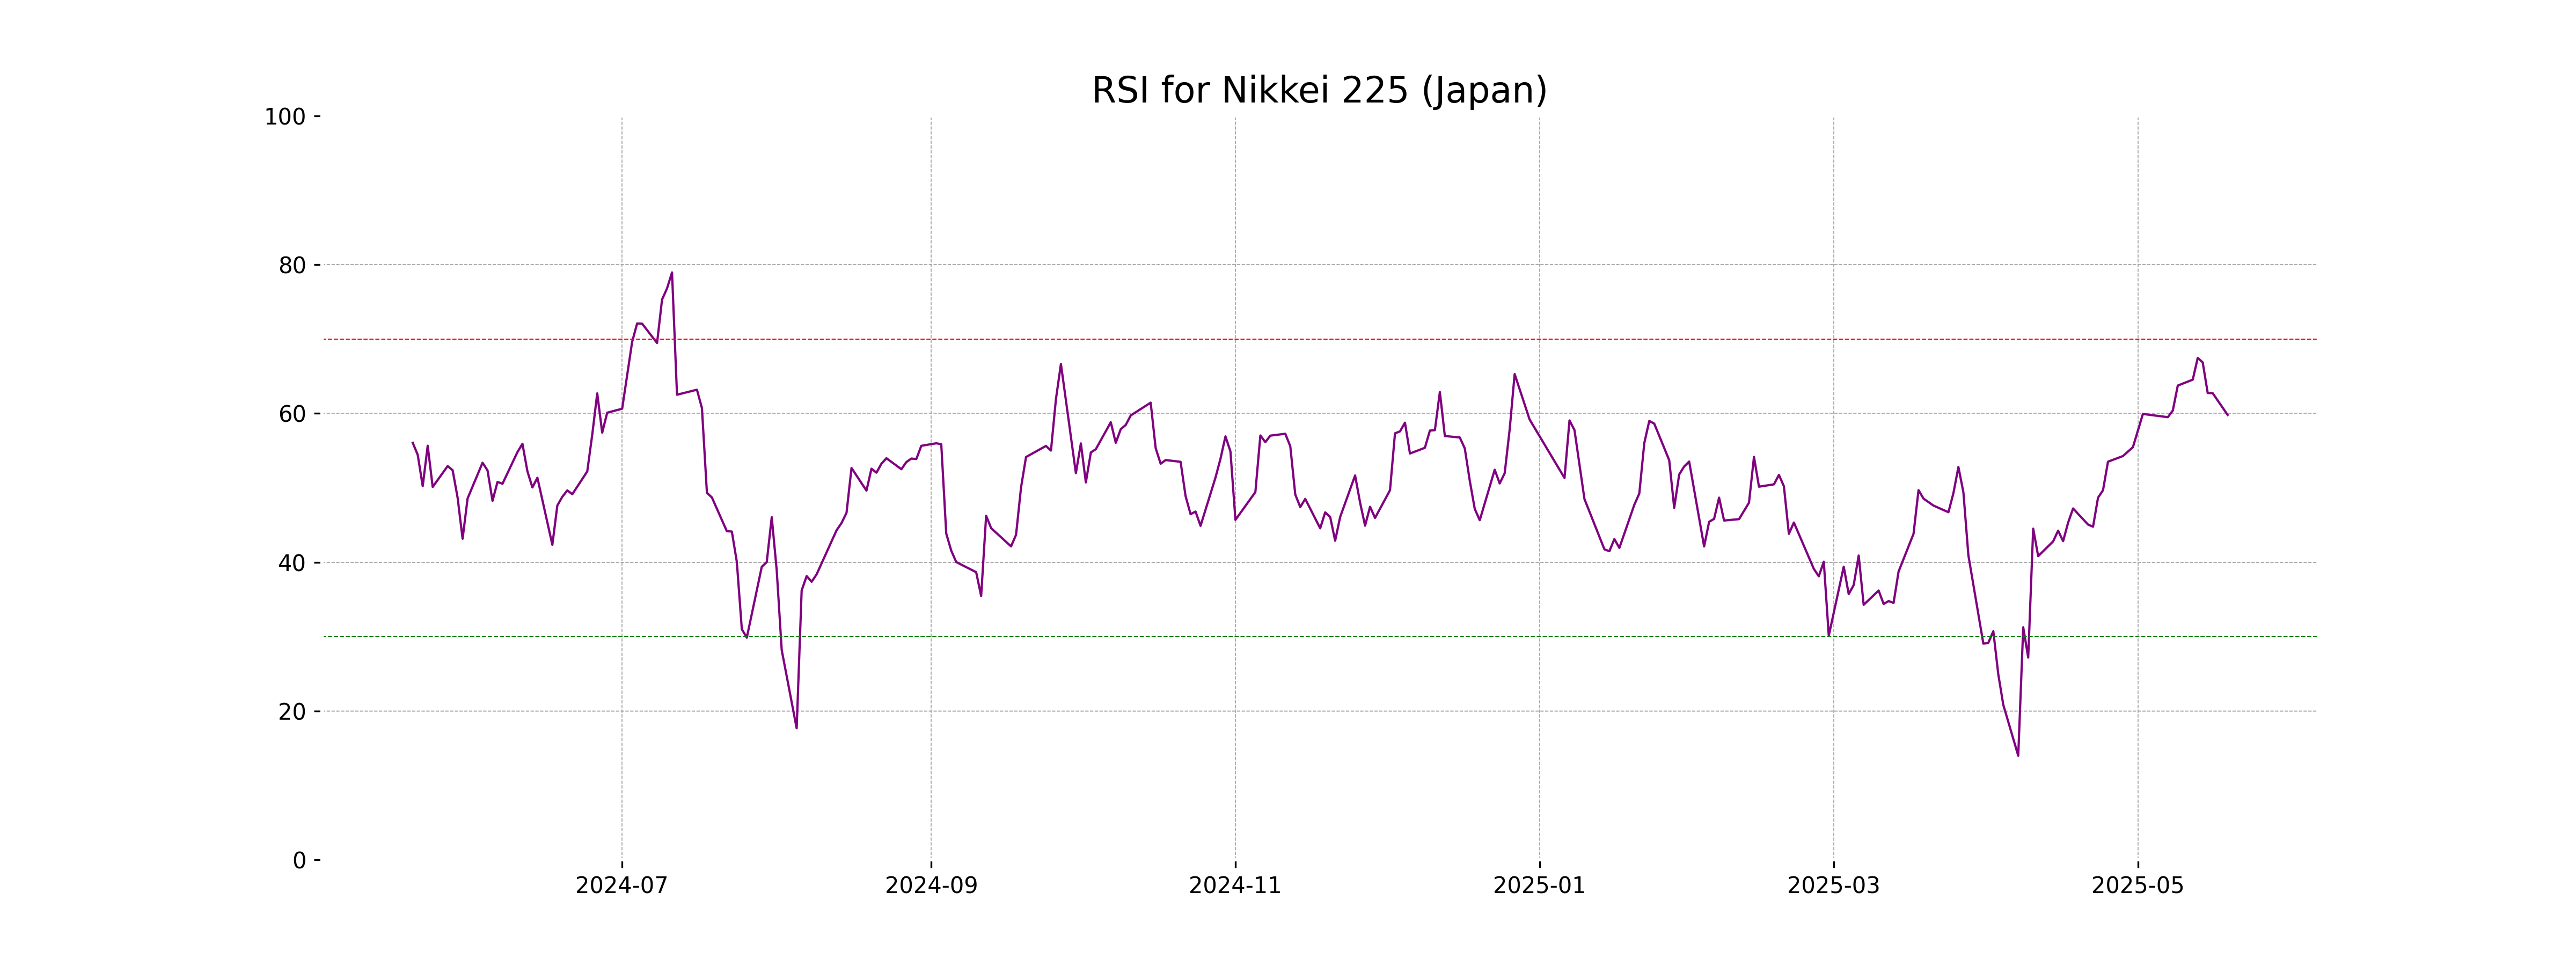
The Nikkei 225, representing Japan's stock market performance, closed at 37,498.63, showing a decline of 0.68% from the previous close of 37,753.72. Despite the day's volatility, reflected in a high of 37,656.23 and a low of 37,445.93, the index remains above its key moving averages, with an RSI of 59.80 indicating moderate momentum.
Relationship with Key Moving Averages
Nikkei 225 closed at 37498.63, which is above its 50-day EMA of 36524.28 and the 10-day EMA of 37337.02, indicating a potential short-term bullish trend. It also remains above the 200-day EMA of 37422.54, suggesting a continuation of the long-term uptrend.
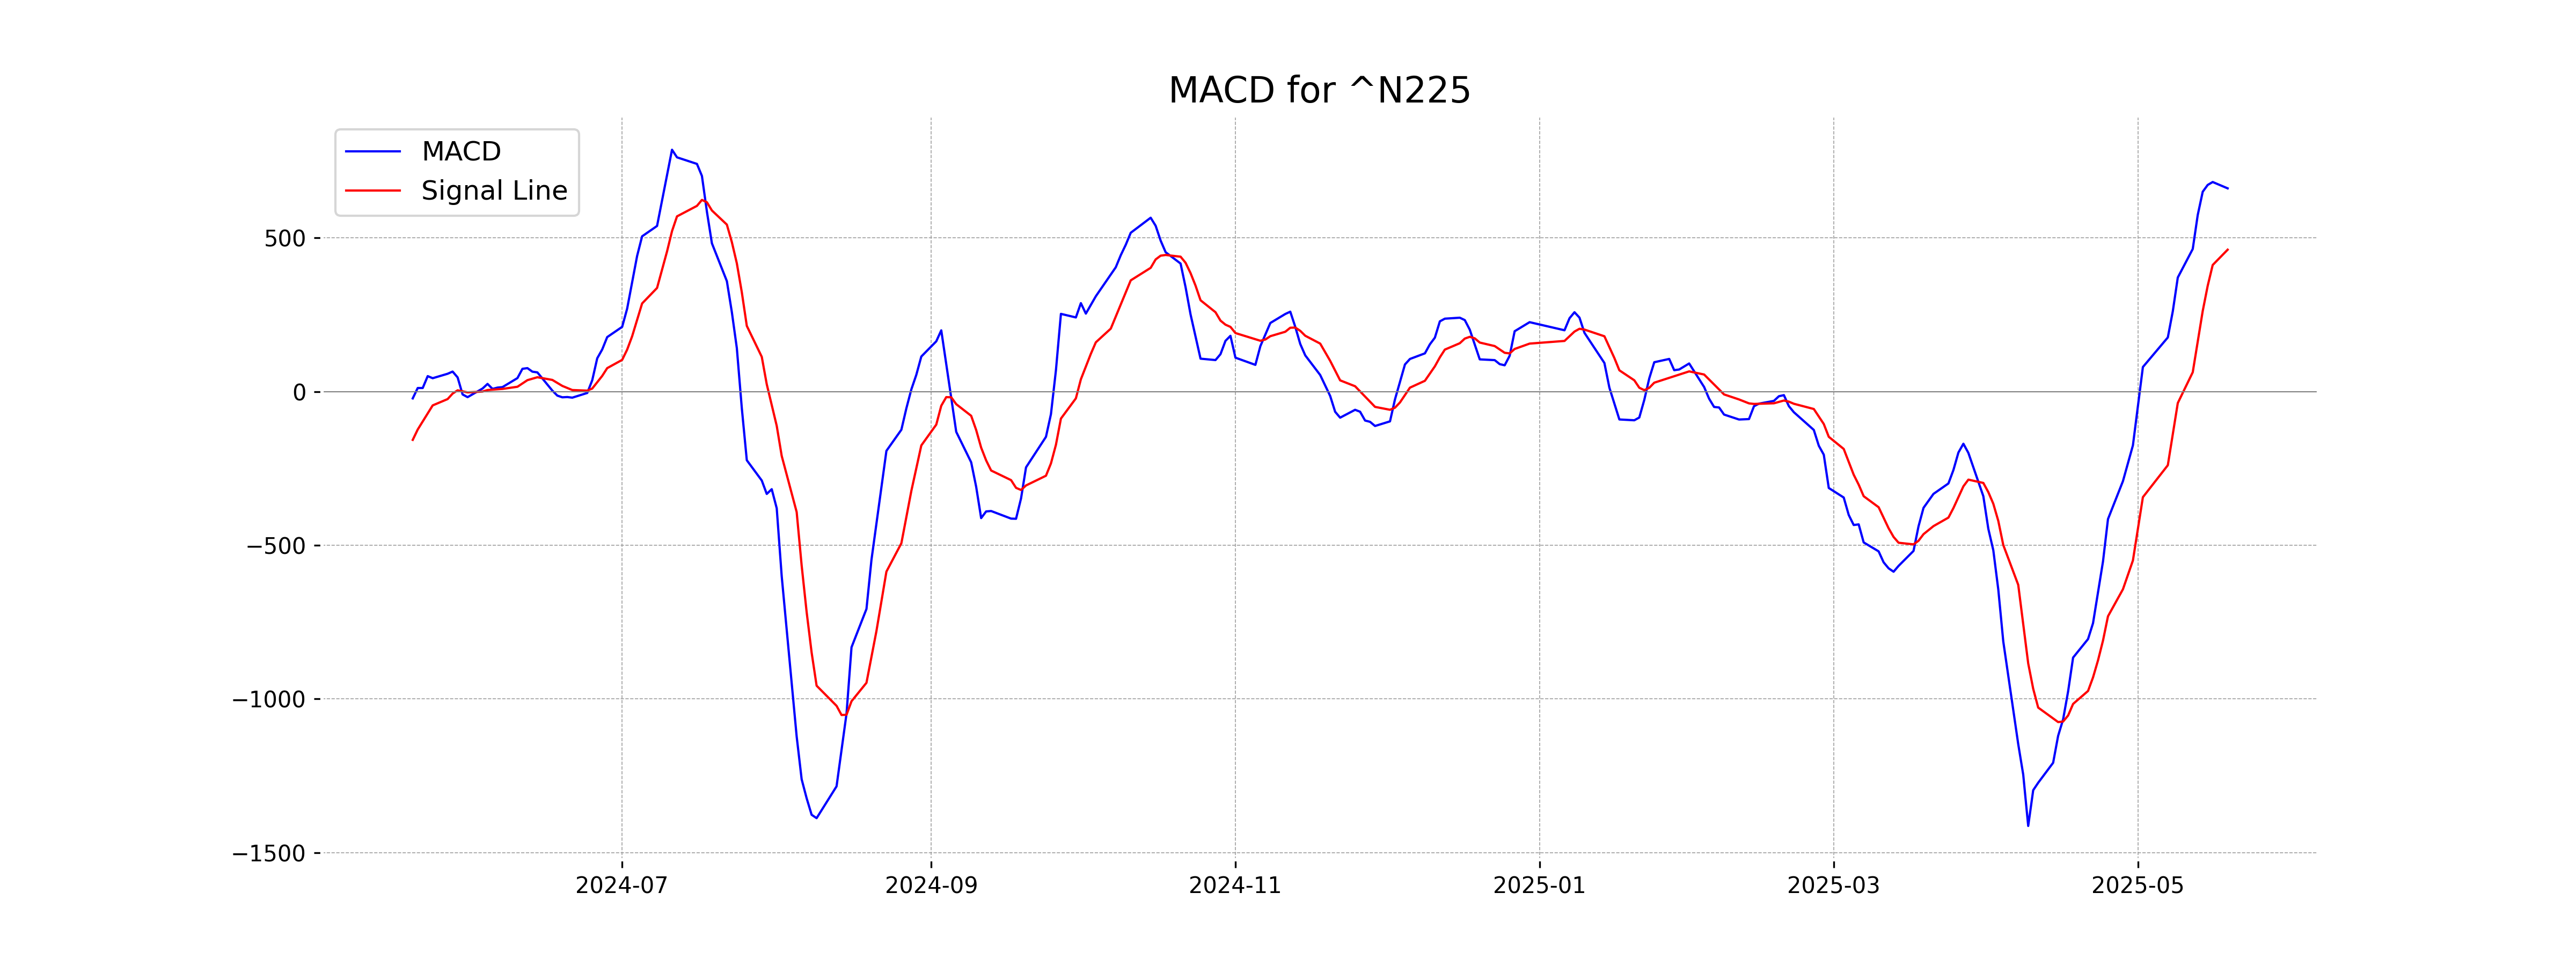
Moving Averages Trend (MACD)
- For Nikkei 225 (Japan), the MACD is at 661.21, which is above its Signal Line at 461.65, indicating a bullish trend. - The positive MACD suggests that the recent momentum is strong, supporting potential upward movement in the market.
RSI Analysis
The RSI for Nikkei 225 is currently 59.80, indicating a neutral market without being either overbought or oversold. Generally, RSI values above 70 may suggest overbought conditions, while below 30 might indicate the market is oversold. At this level, the index maintains a balanced momentum.
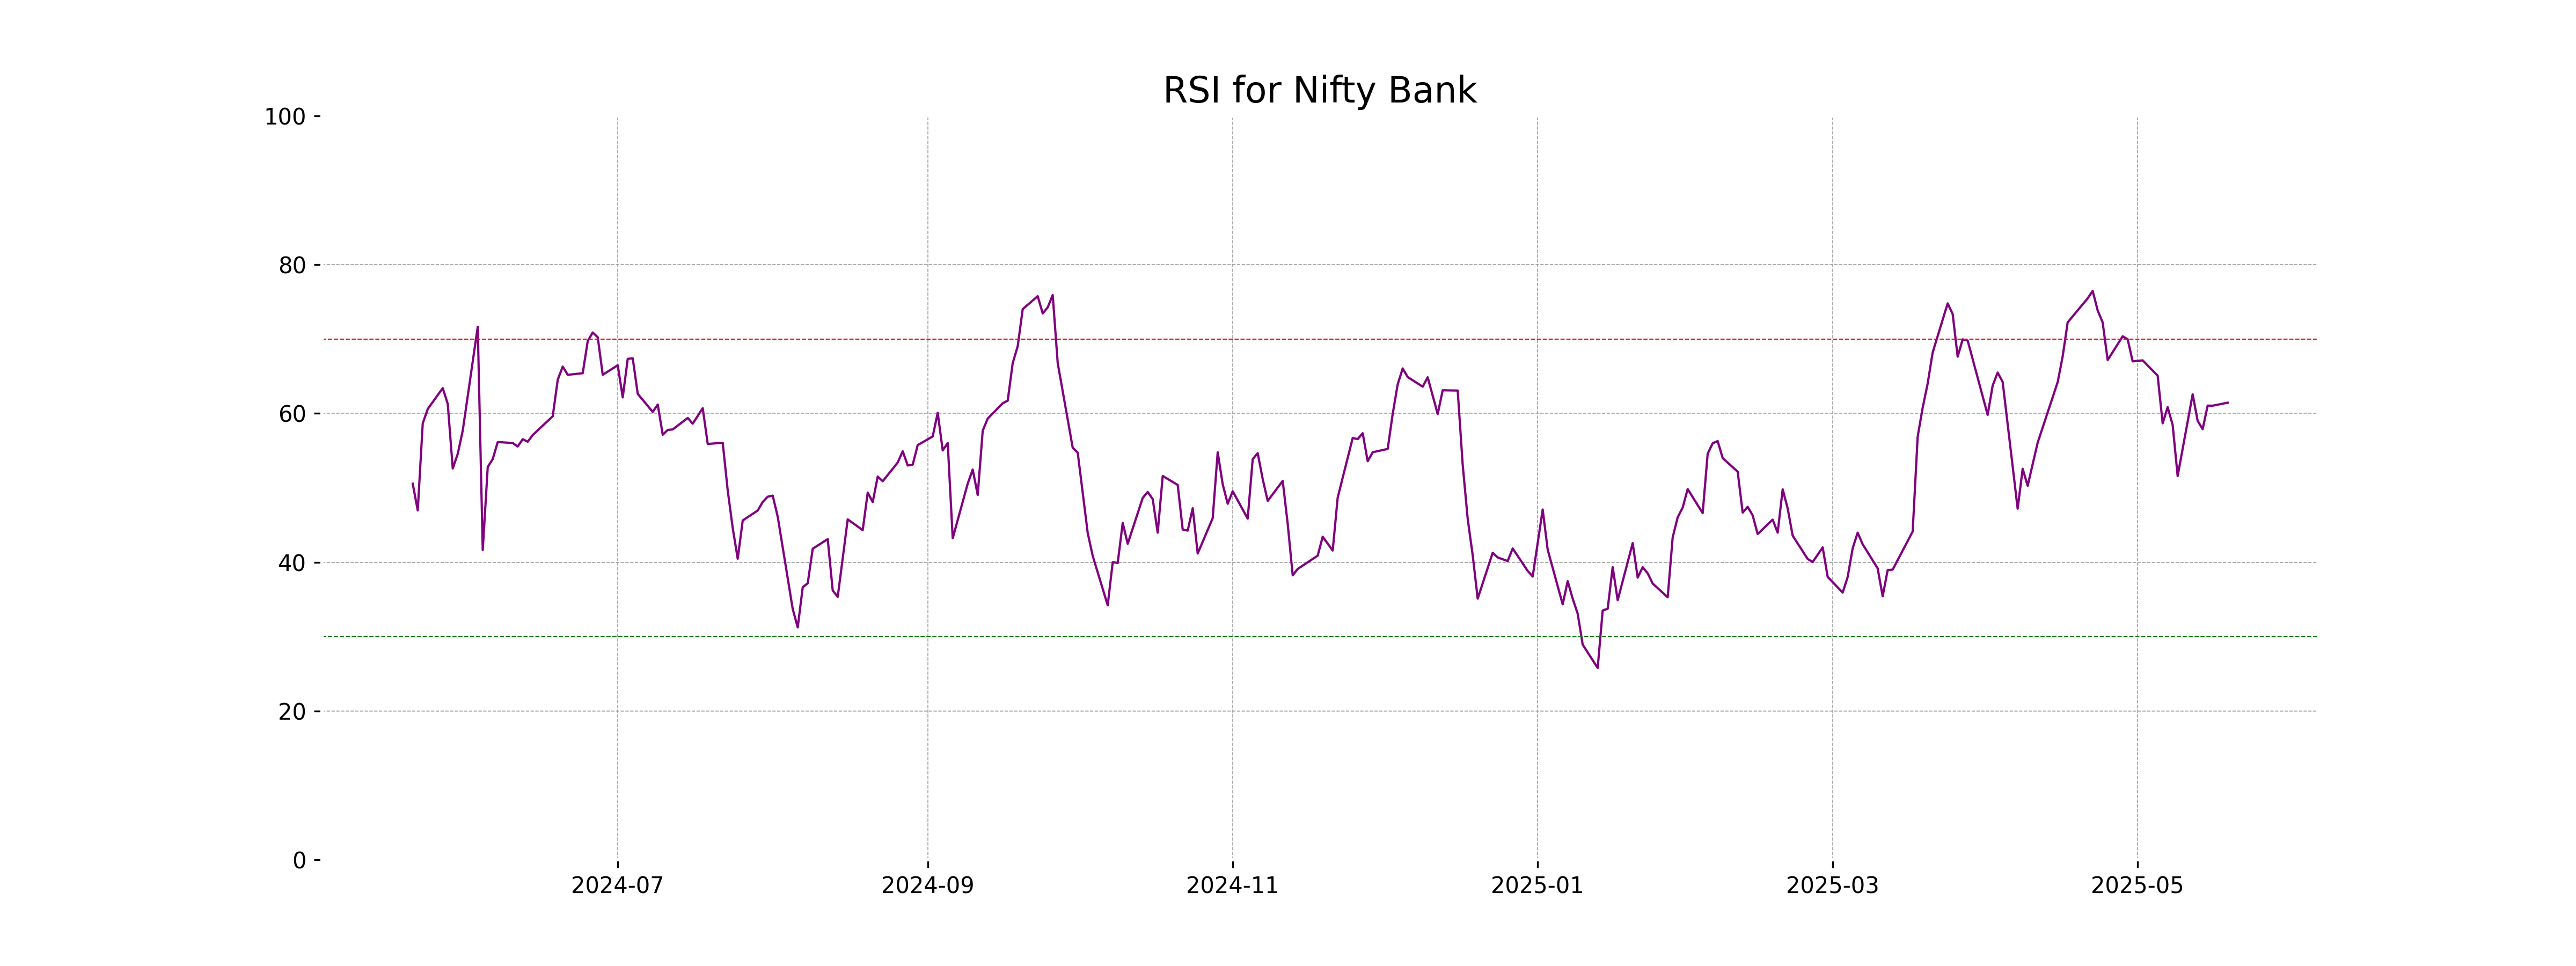
Analysis for Nifty Bank - May 19, 2025
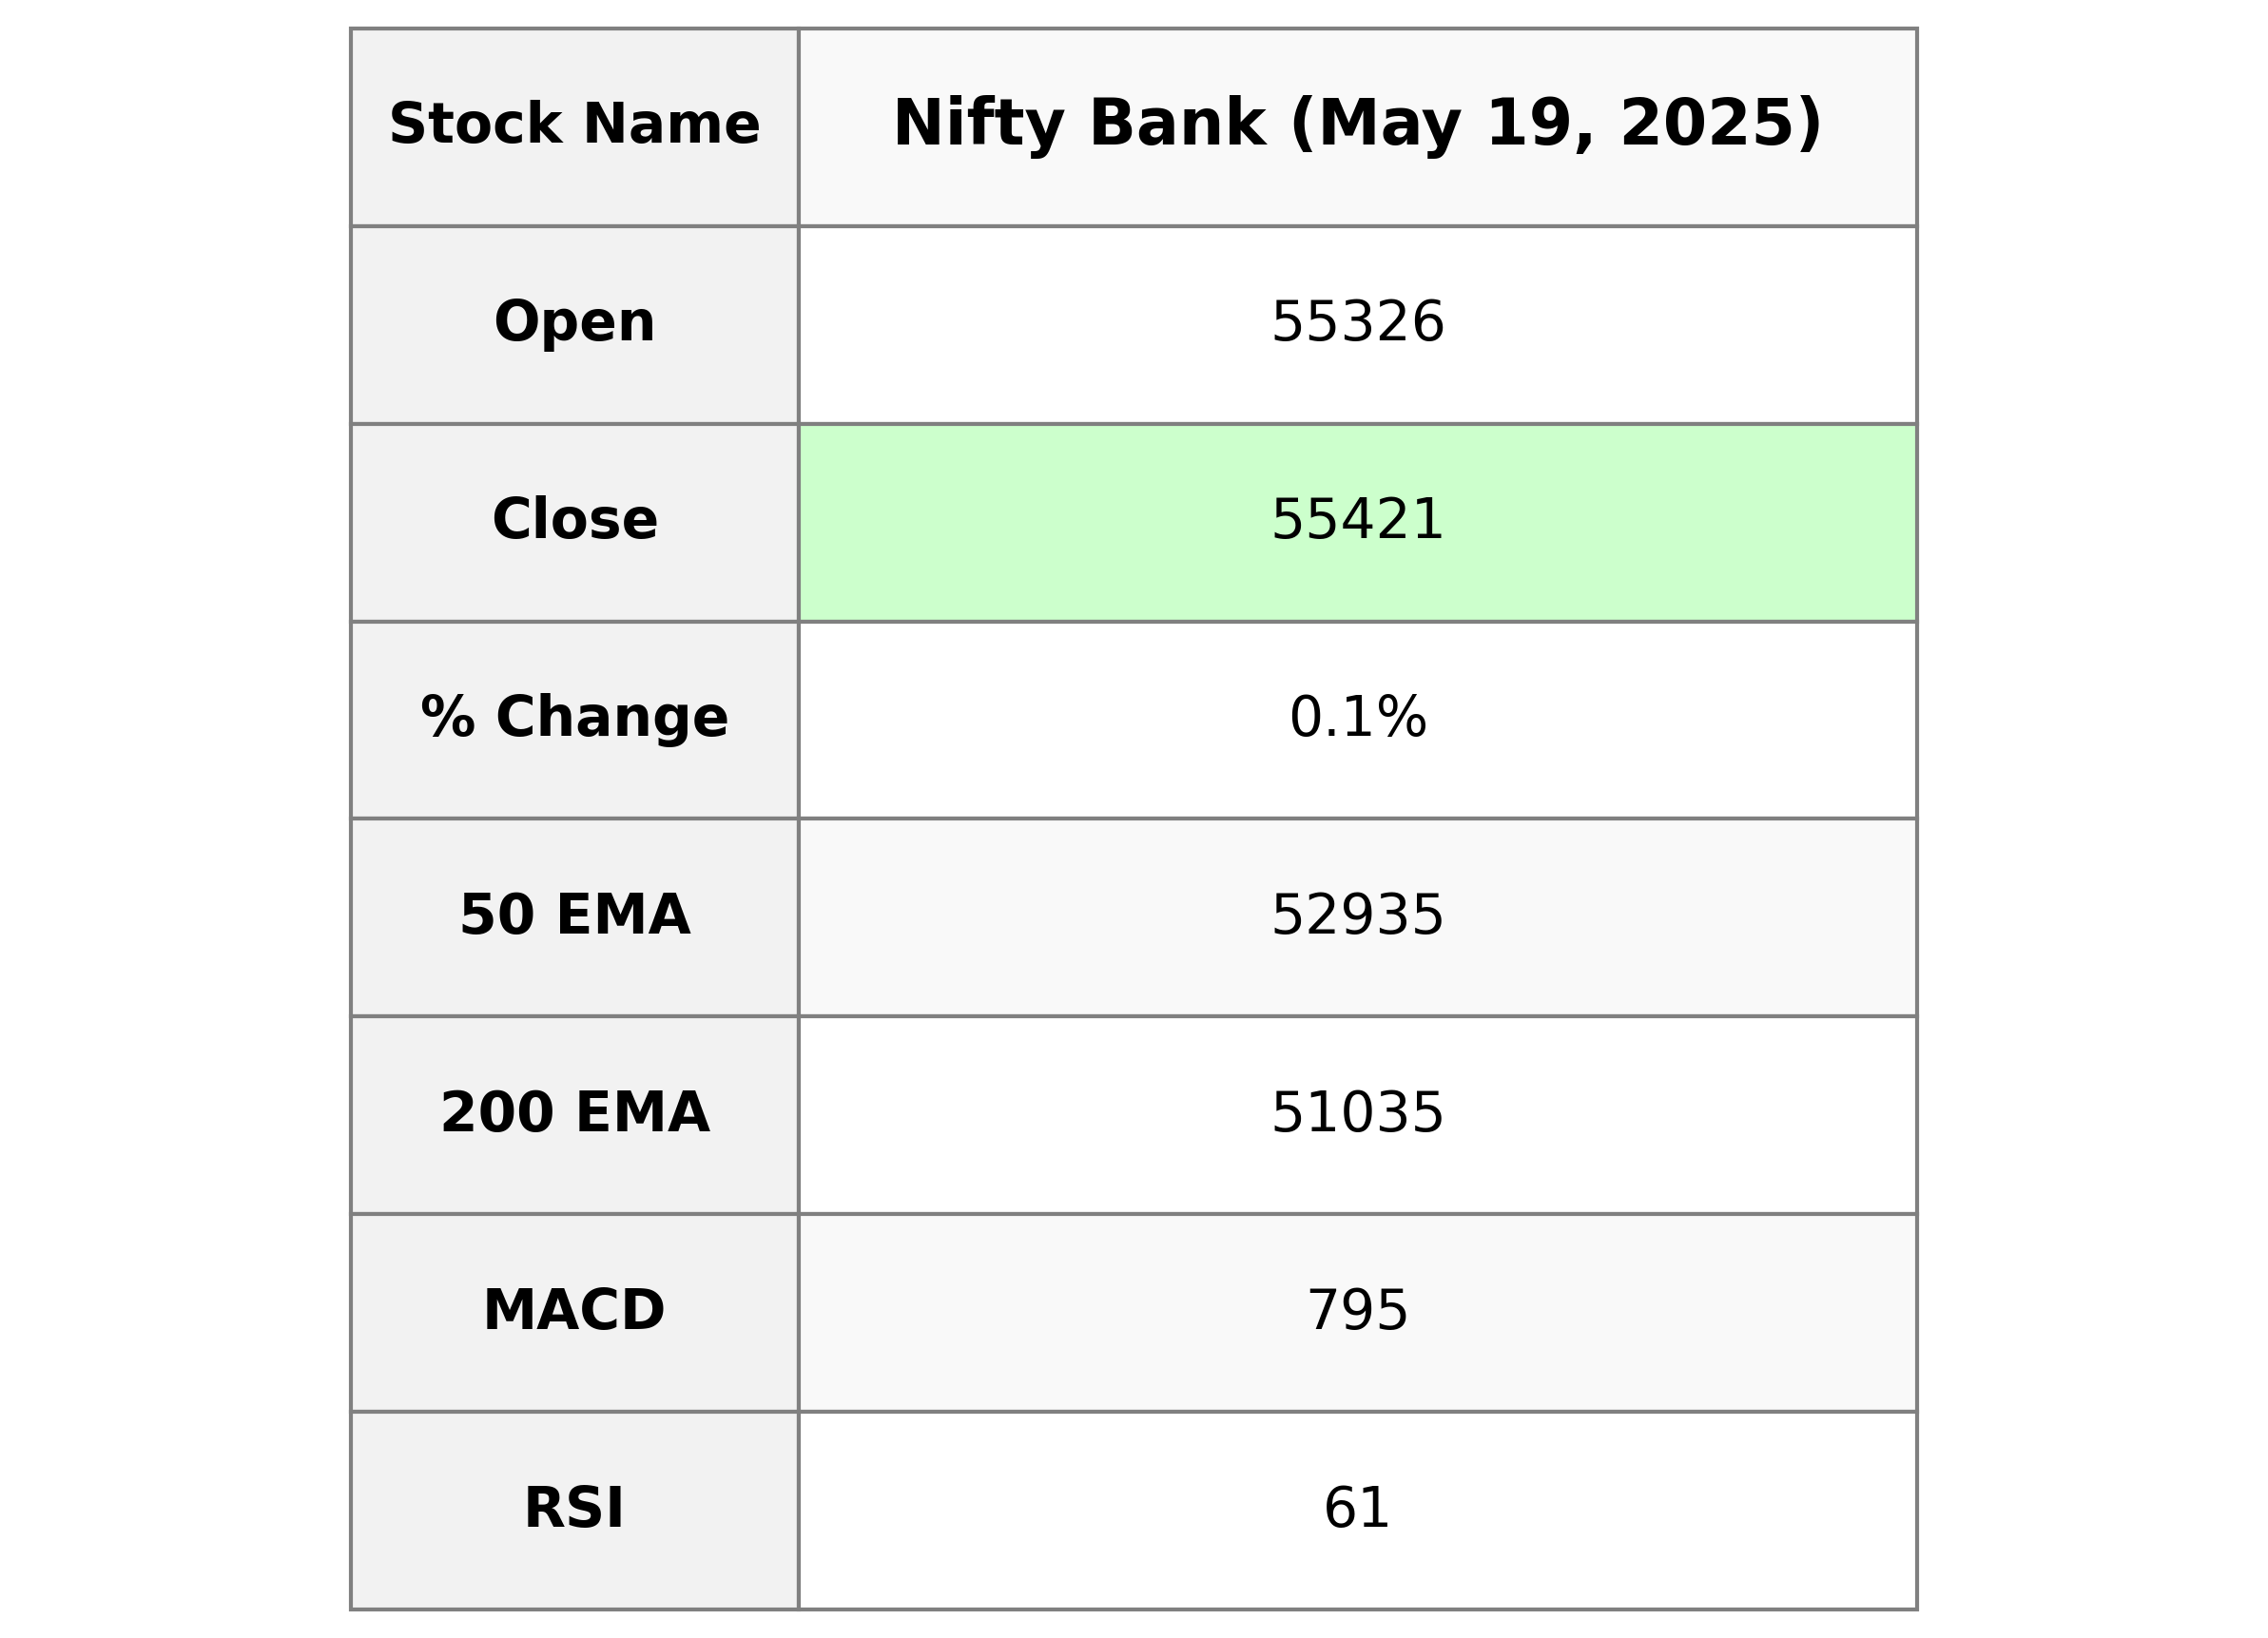
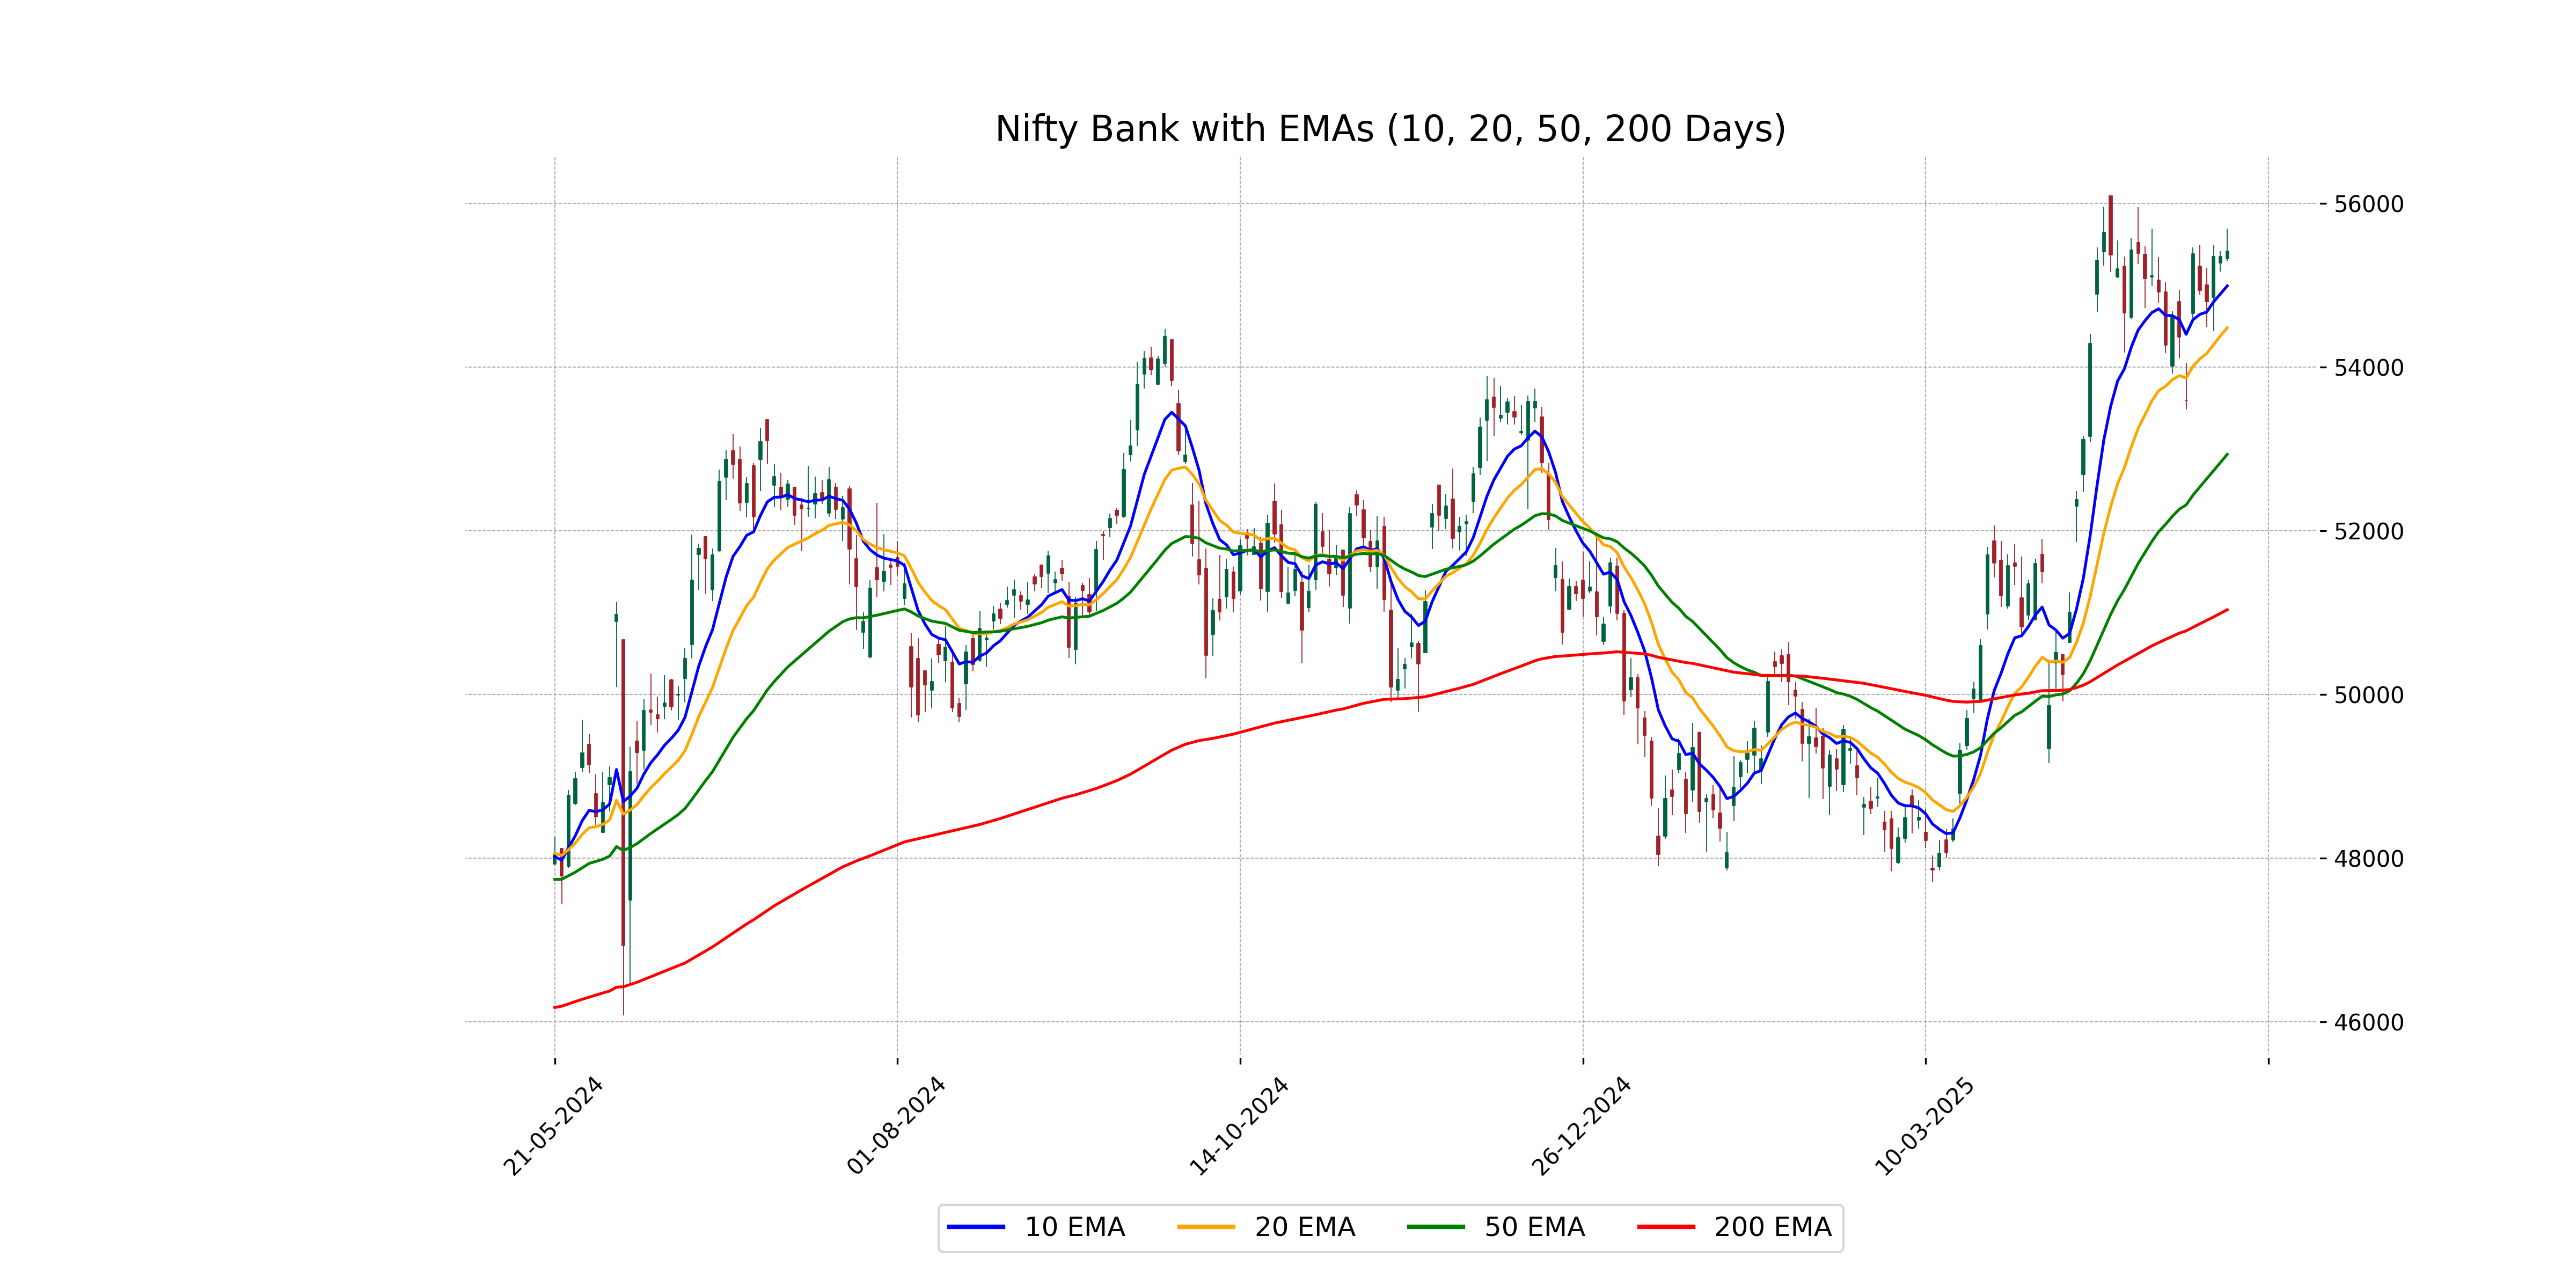
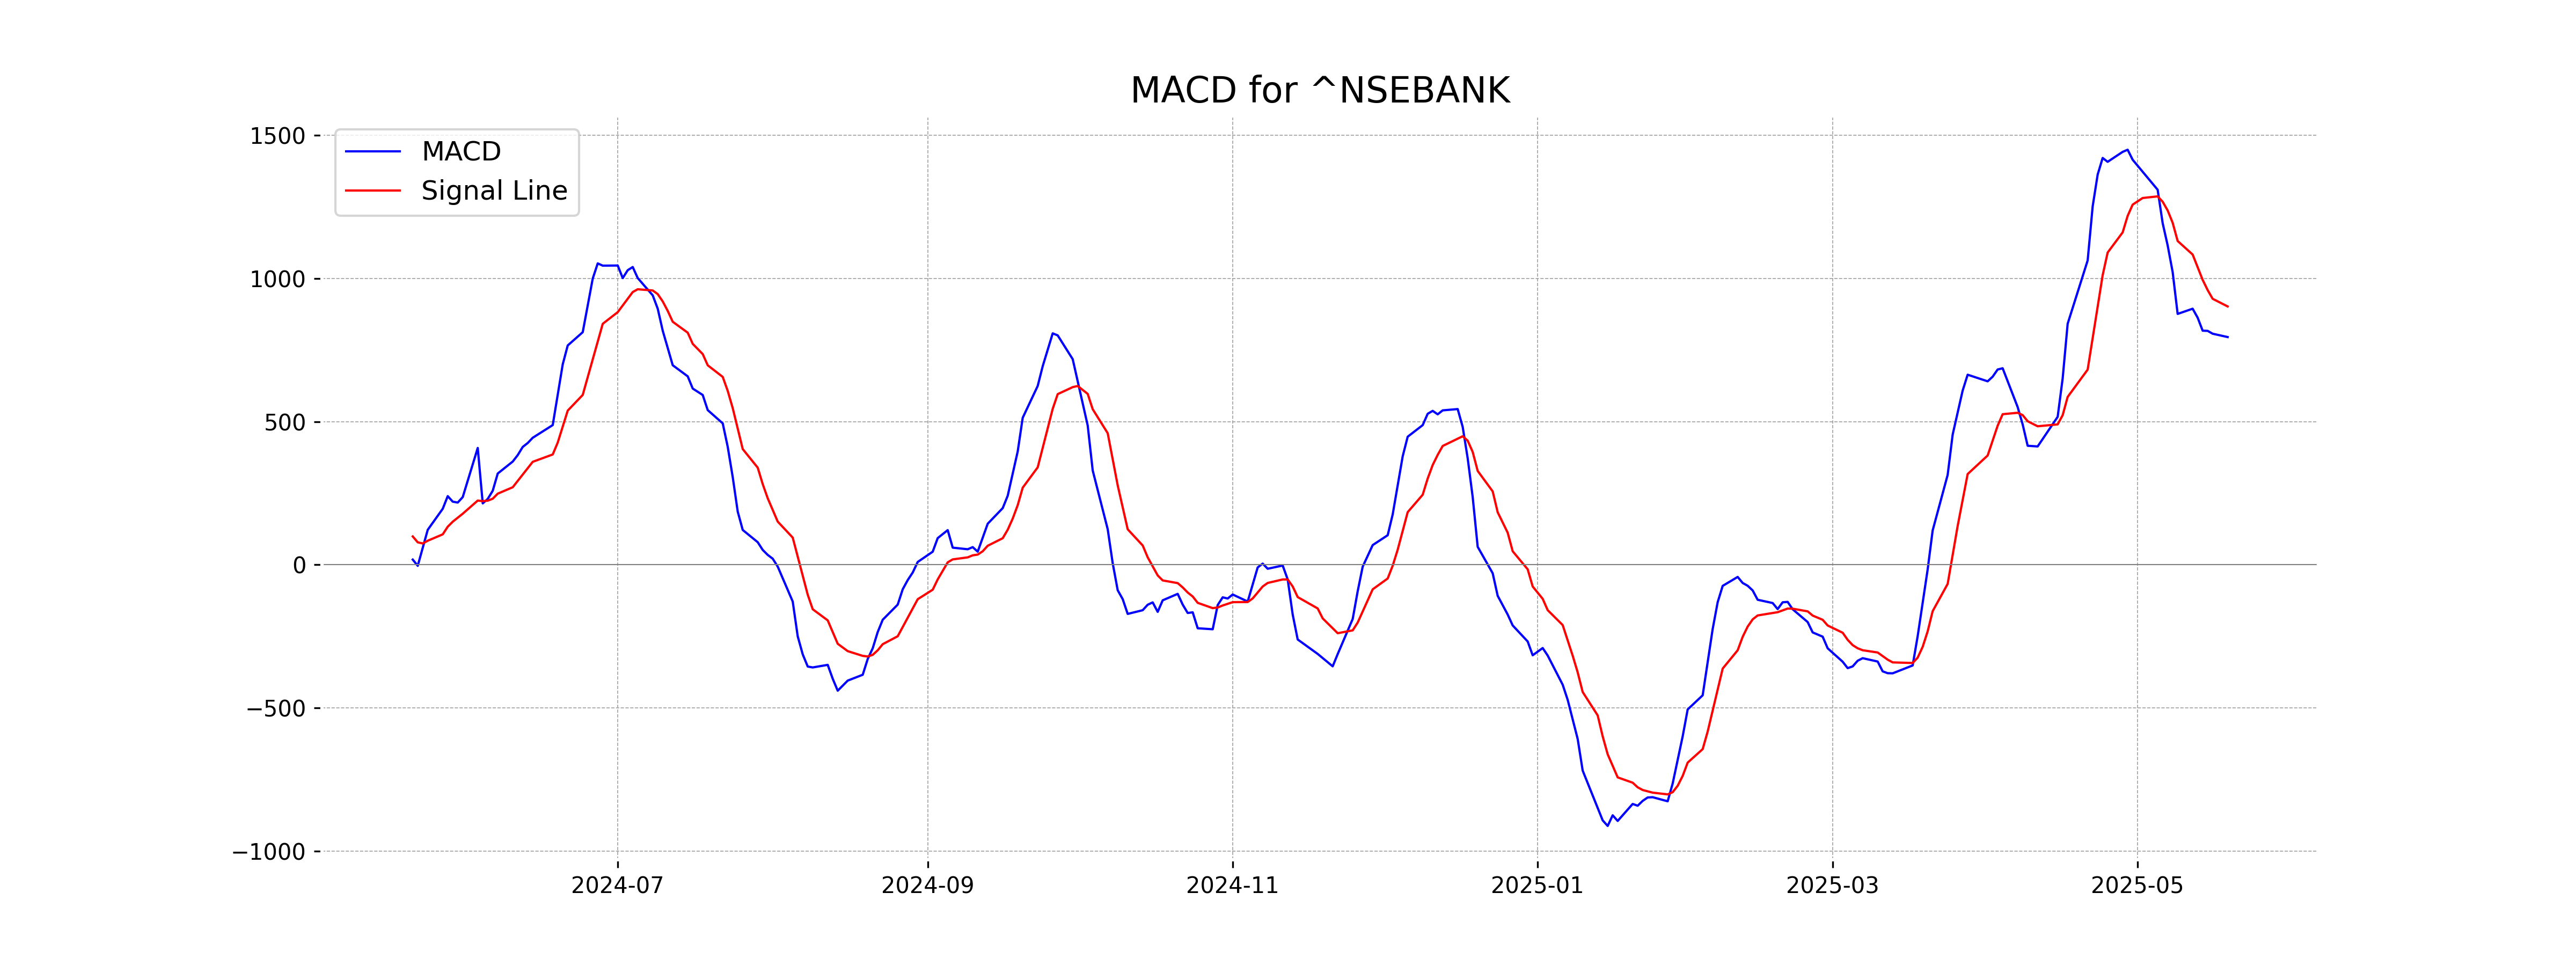
Nifty Bank opened at 55,326.05 and closed slightly higher at 55,420.70, marking a modest percentage change of 0.12%, equivalent to a points gain of 65.80. The Relative Strength Index (RSI) indicates a healthy level at 61.44, and the MACD value is below the MACD Signal, suggesting a cautious outlook for continued upward momentum. EMA indicators reflect a generally upward trend, with the 10, 20, 50, and 200 EMAs all supporting current levels.
Relationship with Key Moving Averages
Nifty Bank closed at 55,420.70, slightly above its 10 EMA of 54,994.13, indicating short-term strength. It is also well above its 50 EMA of 52,934.87 and 200 EMA of 51,034.94, suggesting a strong bullish trend in the medium to long term.
Moving Averages Trend (MACD)
The MACD for Nifty Bank is 795.1024, while the MACD Signal is 901.9651. This indicates a bearish signal, as the MACD Line is below the MACD Signal Line, suggesting potential downward momentum.
RSI Analysis
- Nifty Bank RSI Analysis: The Relative Strength Index (RSI) for Nifty Bank is currently at 61.44. This indicates that the stock is in a moderately bullish zone, though not yet overbought. An RSI above 70 would typically suggest overbought conditions, while an RSI below 30 would indicate oversold scenarios.
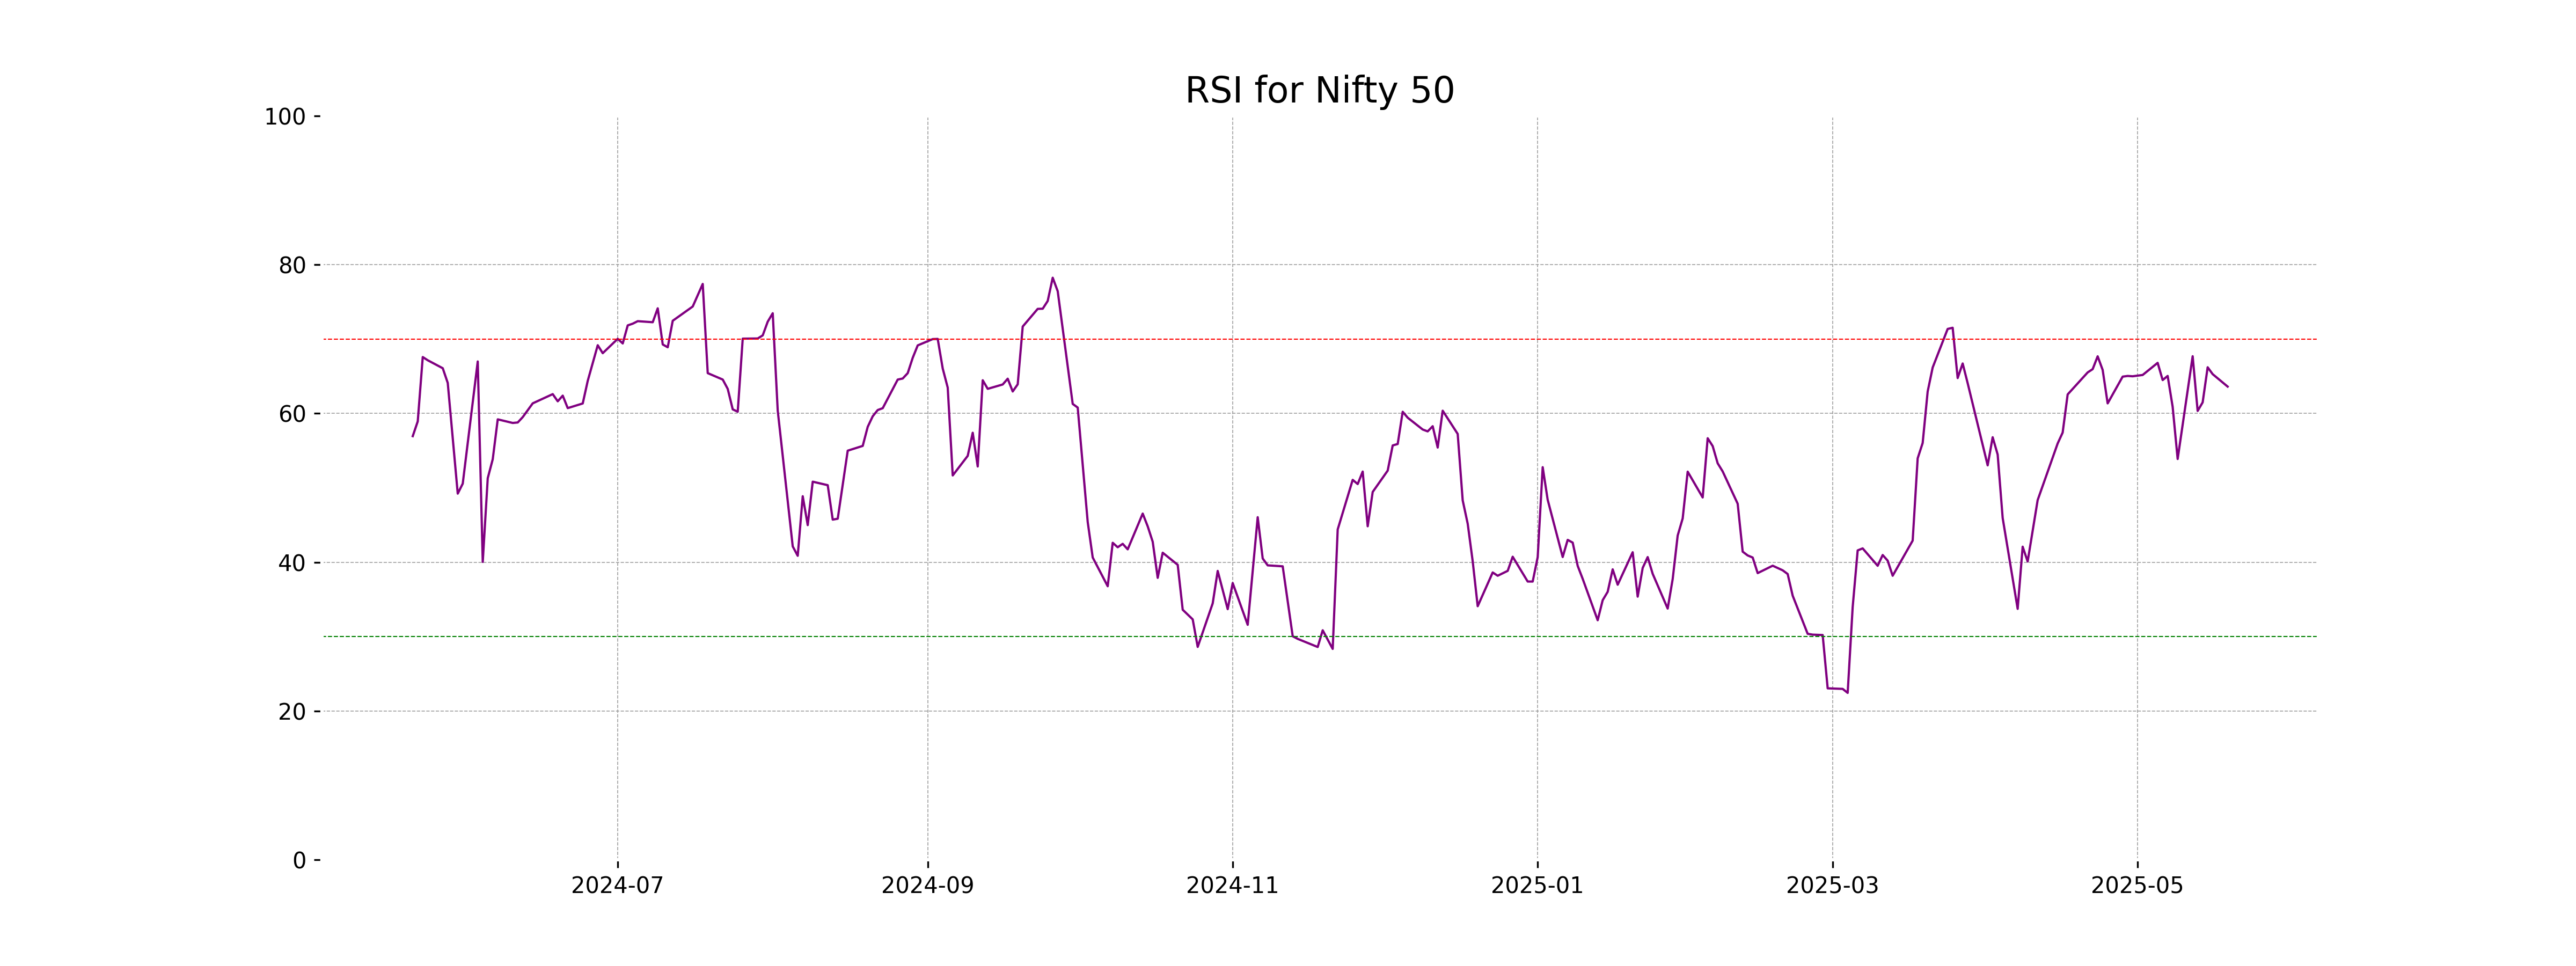
Analysis for Nifty 50 - May 19, 2025
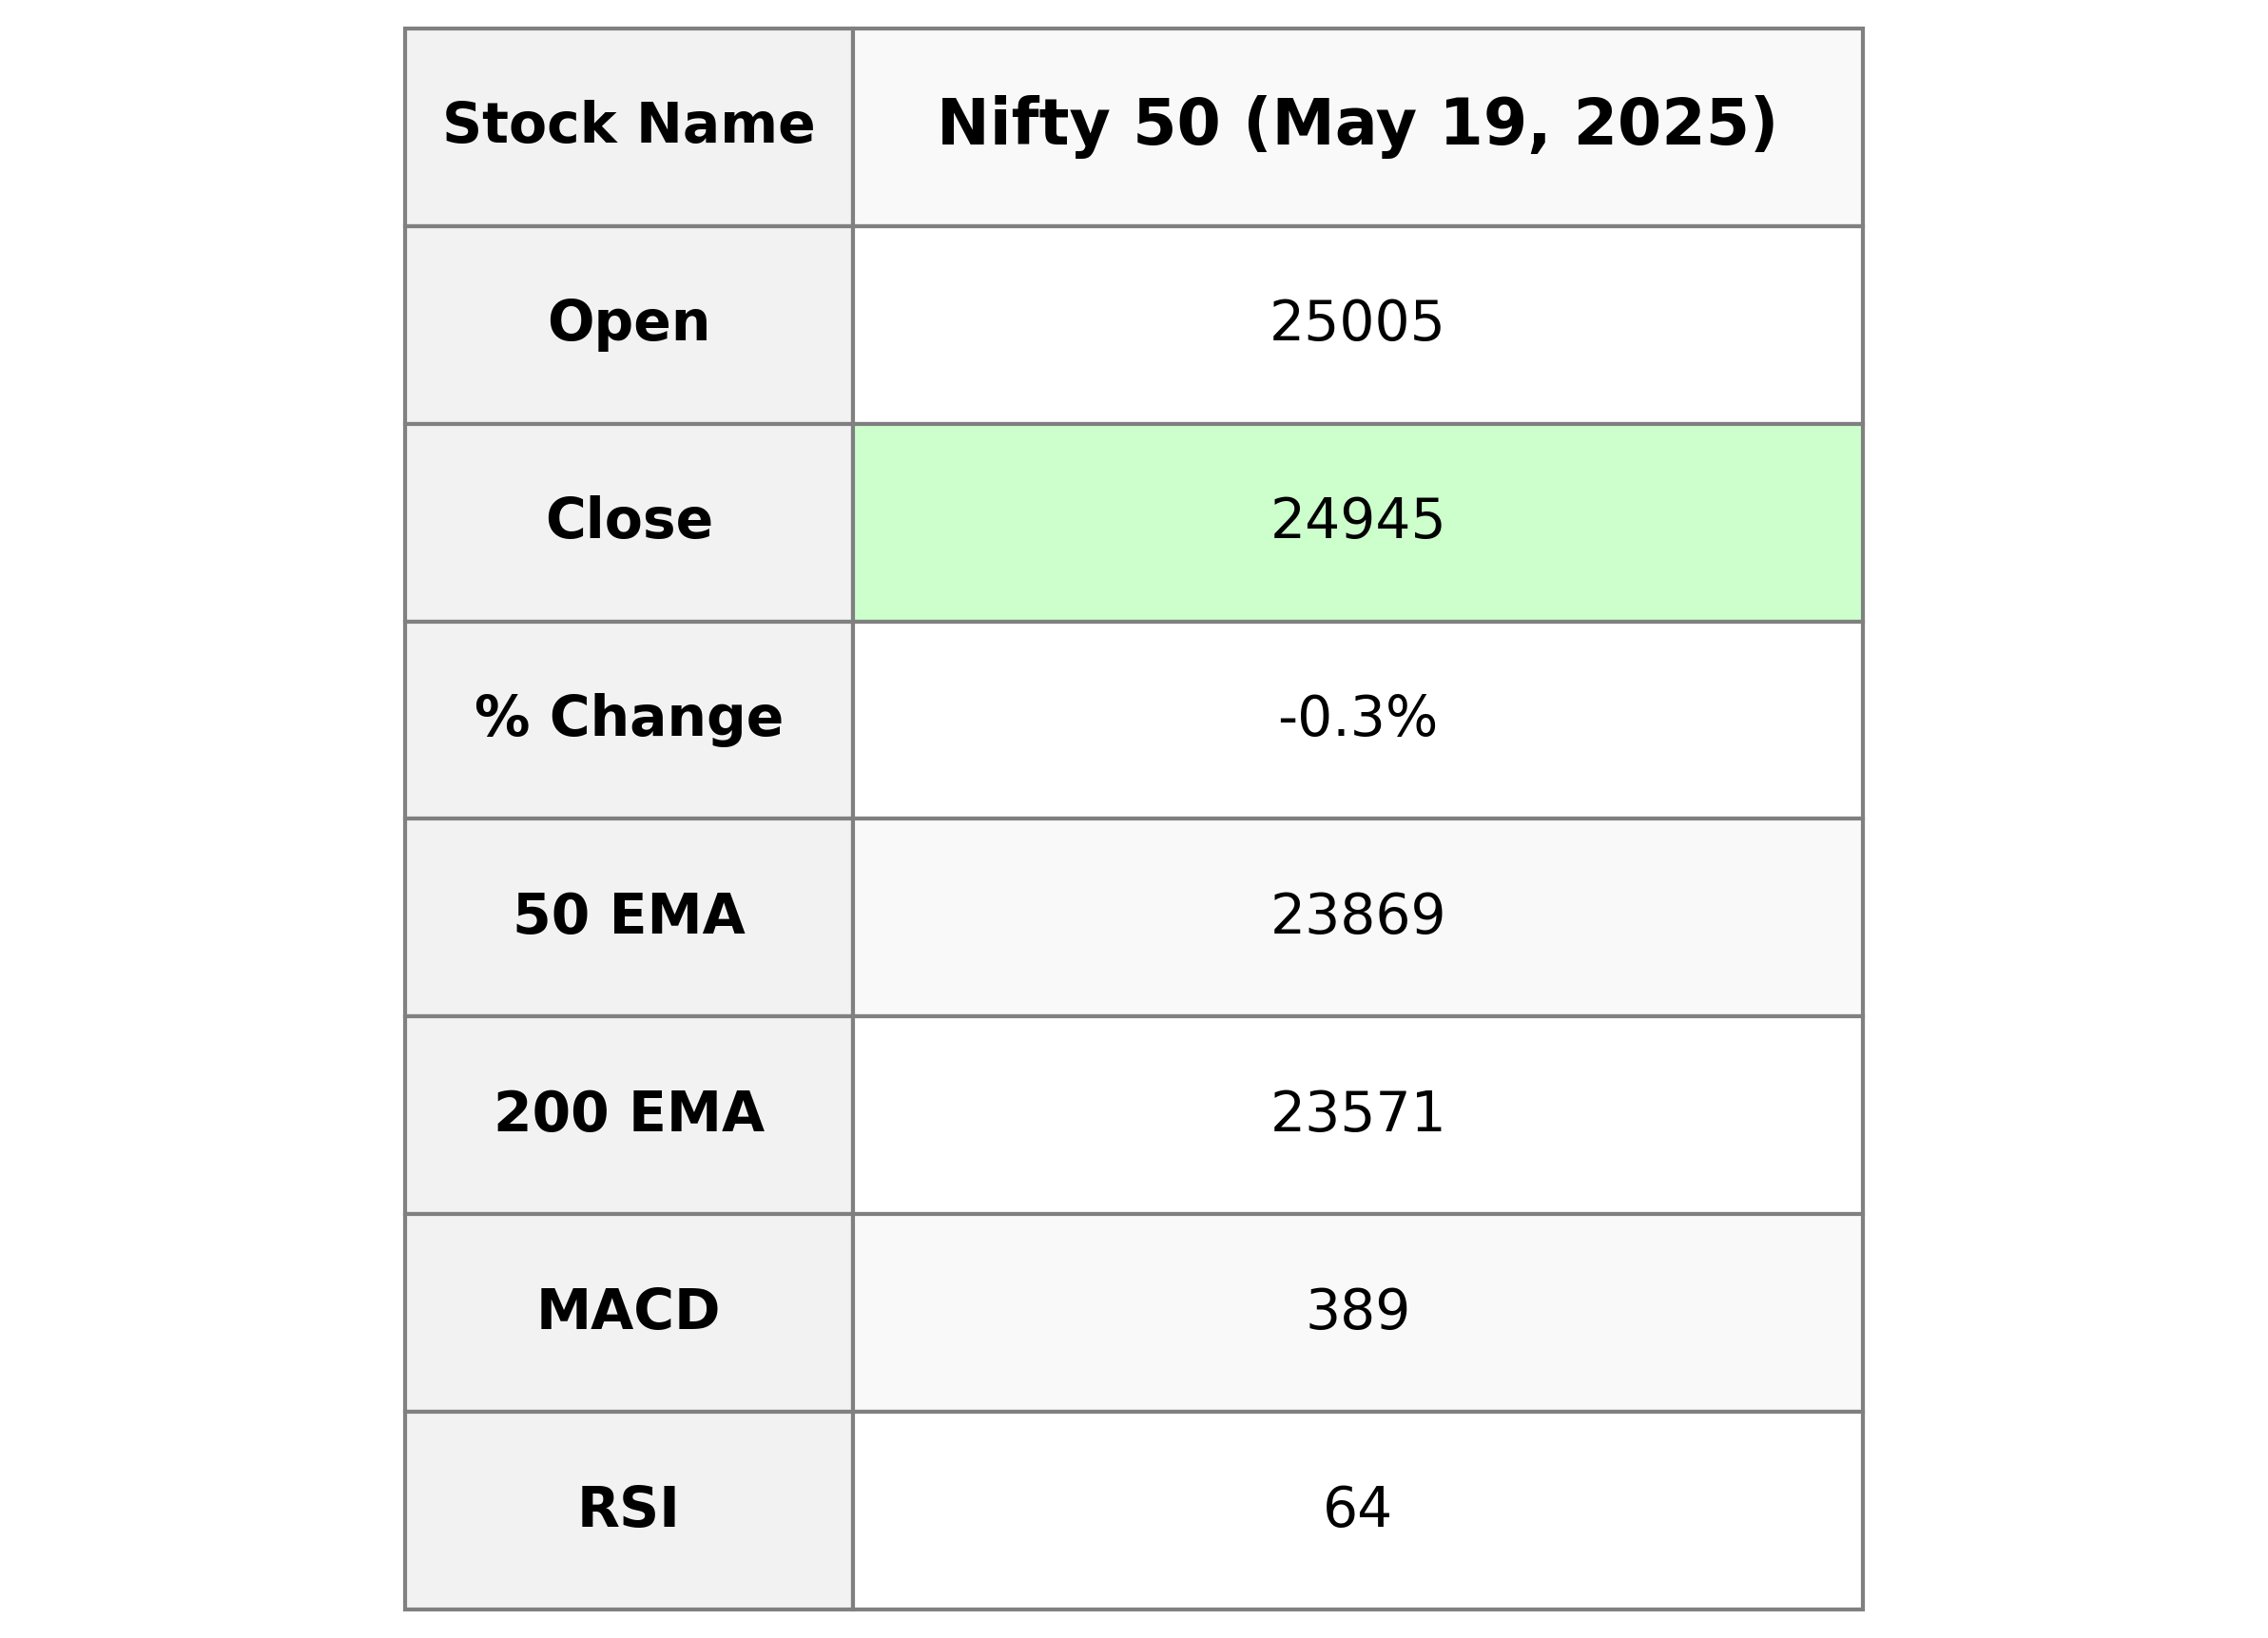
The Nifty 50 index opened at 25005.35 and closed slightly lower at 24945.45, marking a decline of 0.297%, equivalent to a drop of 74.35 points. The index has experienced some volatility, with a high of 25062.95 and a low of 24916.65. The RSI stands at 63.61, indicating bullish momentum, while the MACD is above the signal line, suggesting positive market sentiment.
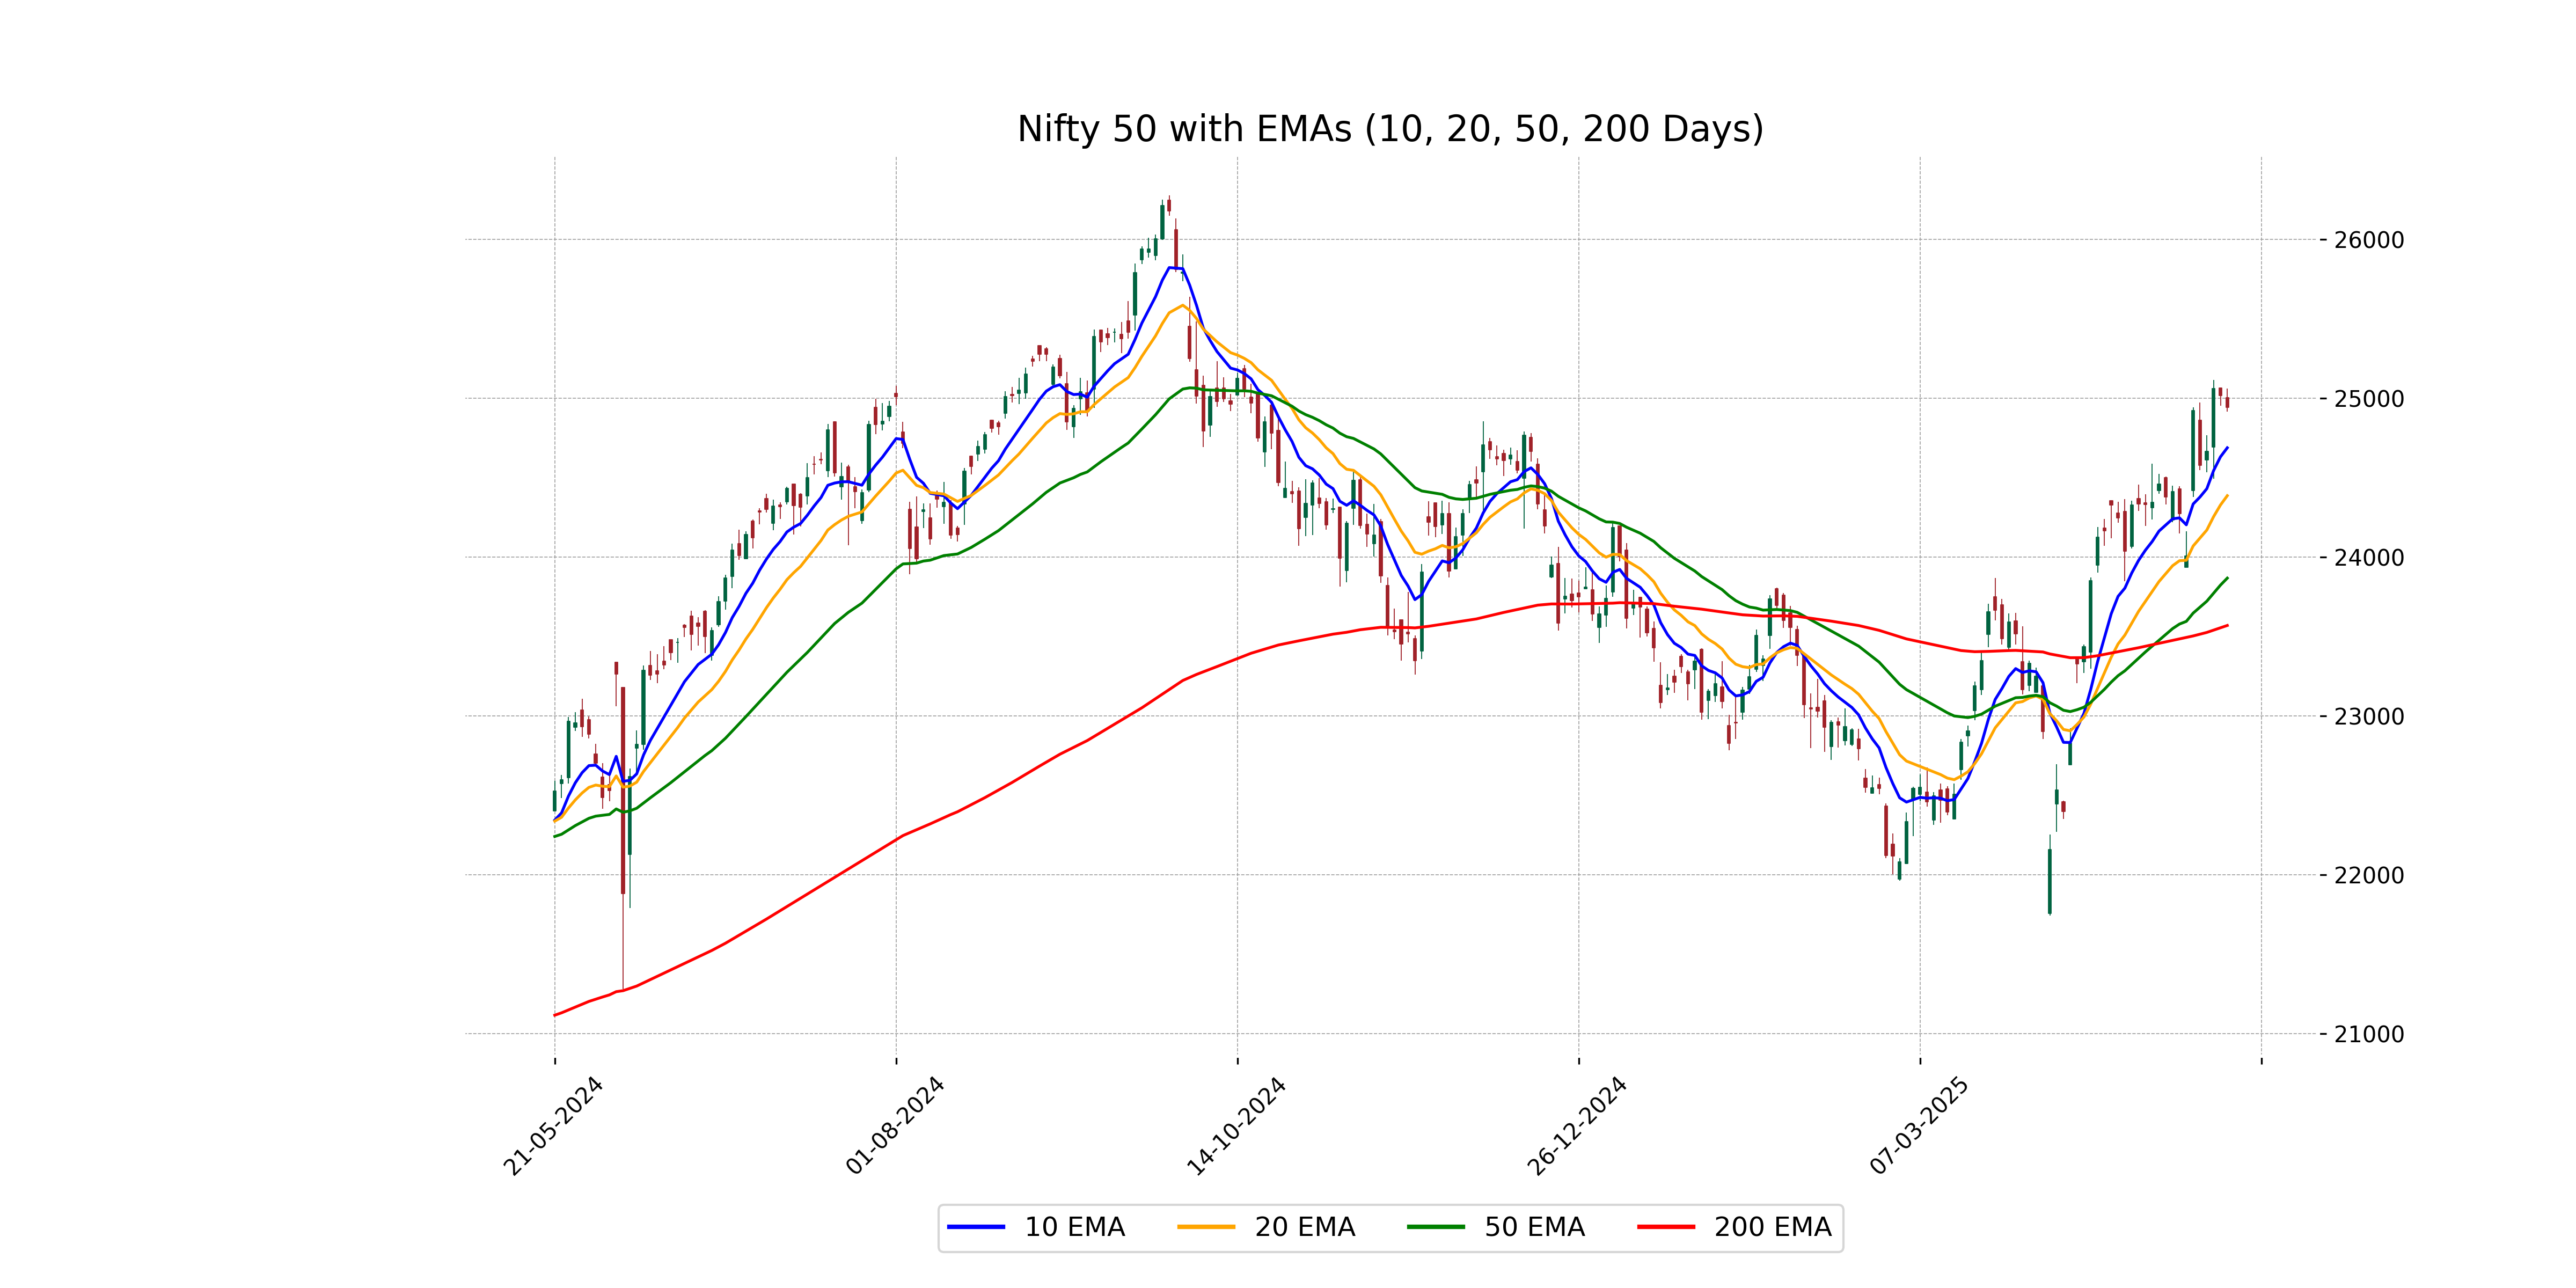
Relationship with Key Moving Averages
Nifty 50's closing price of 24,945.45 is above both the 50-day EMA (23,868.83) and the 200-day EMA (23,570.88), indicating a bullish trend on a longer-term basis. However, it's below the 10-day EMA (24,689.39) and 20-day EMA (24,387.82), suggesting a potential short-term bearish signal.
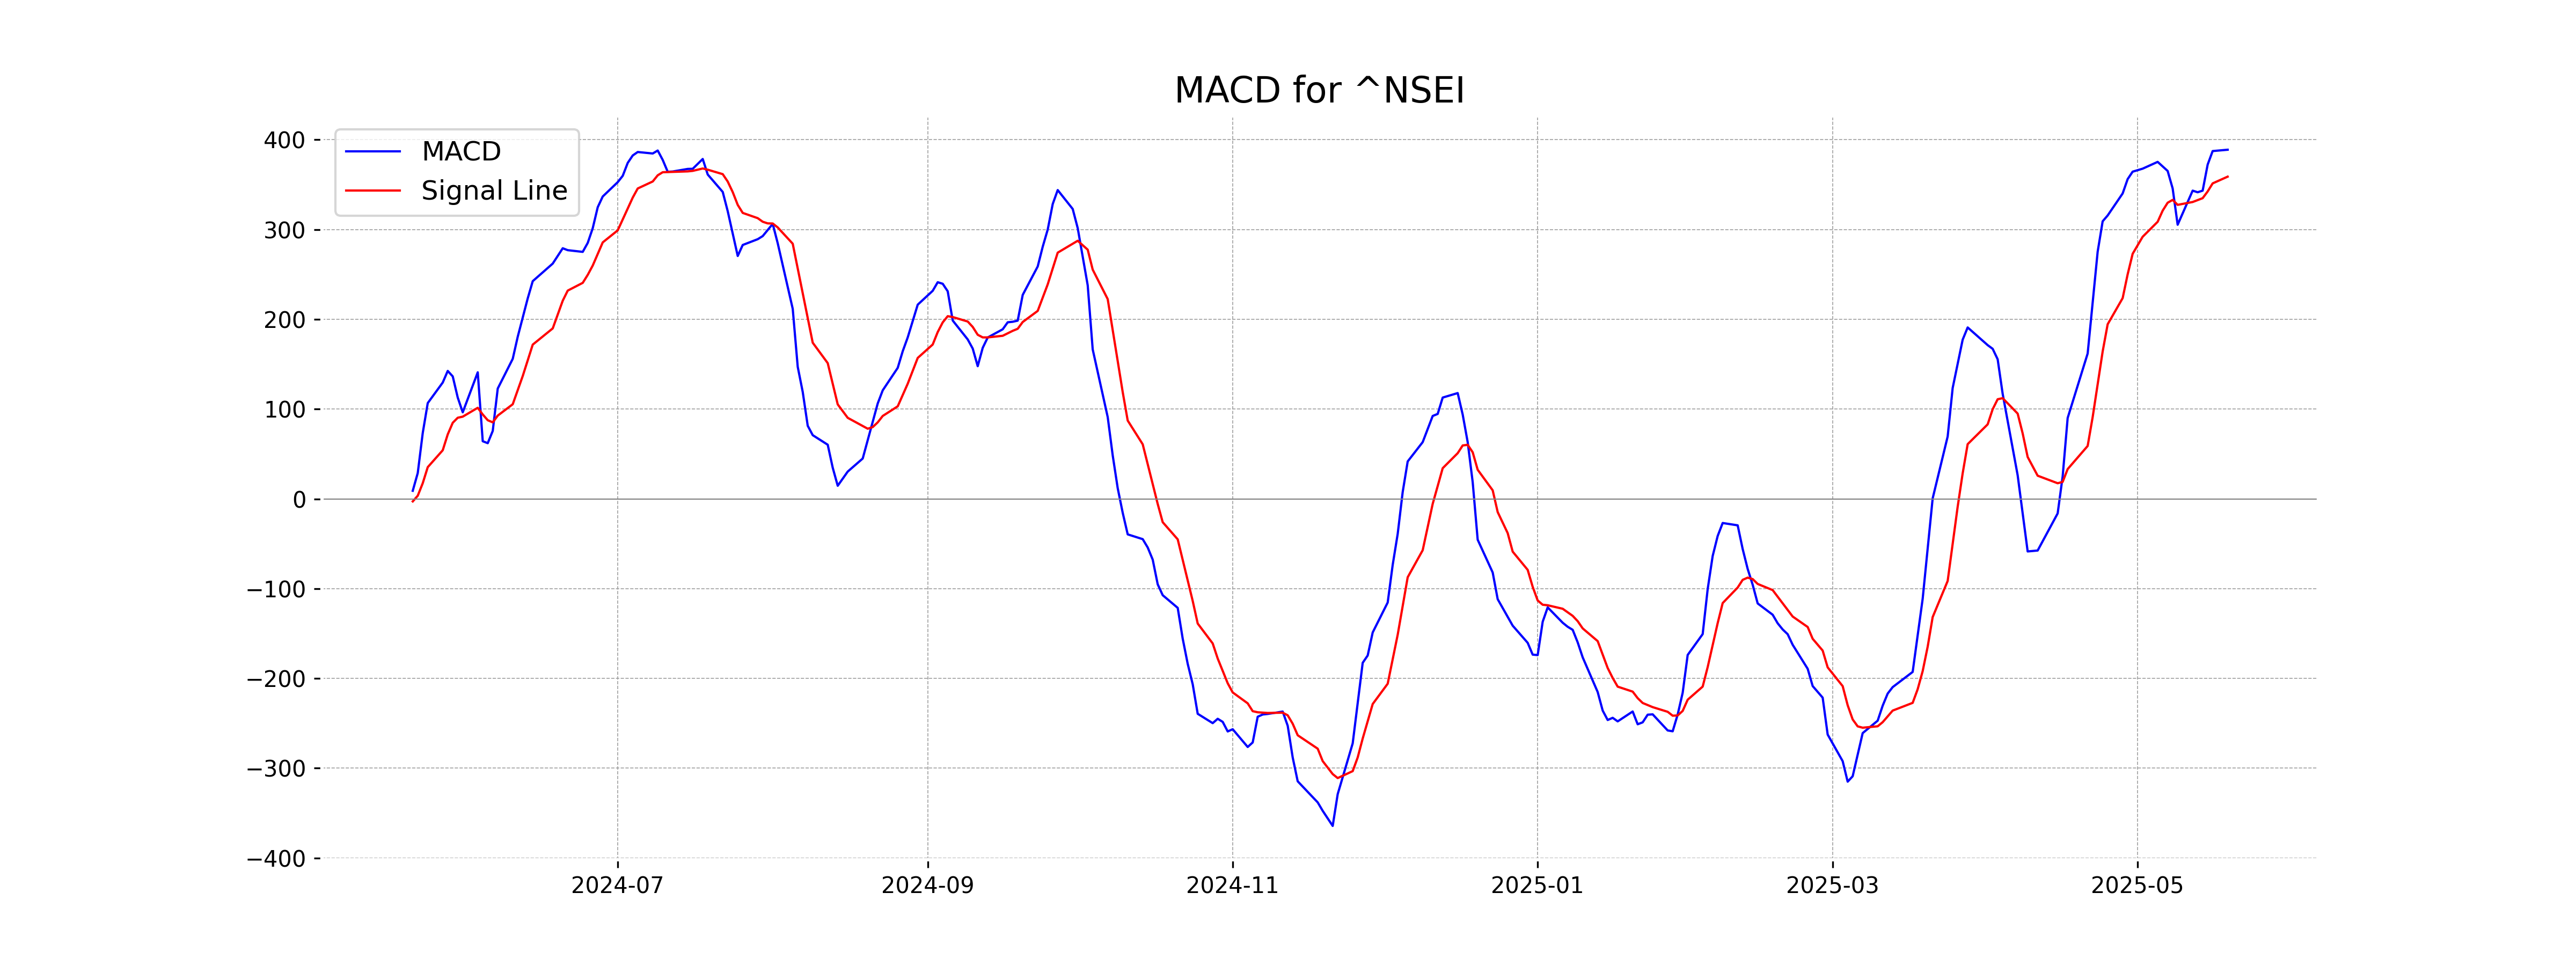
Moving Averages Trend (MACD)
The MACD value of 388.94 is above the MACD Signal line of 358.94, indicating a potential bullish trend for Nifty 50. The positive divergence suggests that the momentum may continue to be favorable for further gains. However, other indicators should also be considered for a comprehensive analysis.
RSI Analysis
- The RSI (Relative Strength Index) for Nifty 50 is currently at 63.61, which is above the neutral 50 level. - This suggests a bullish momentum as RSI values above 50 generally indicate increasing buying pressure. - However, being below 70 implies it is not yet in the overbought territory.