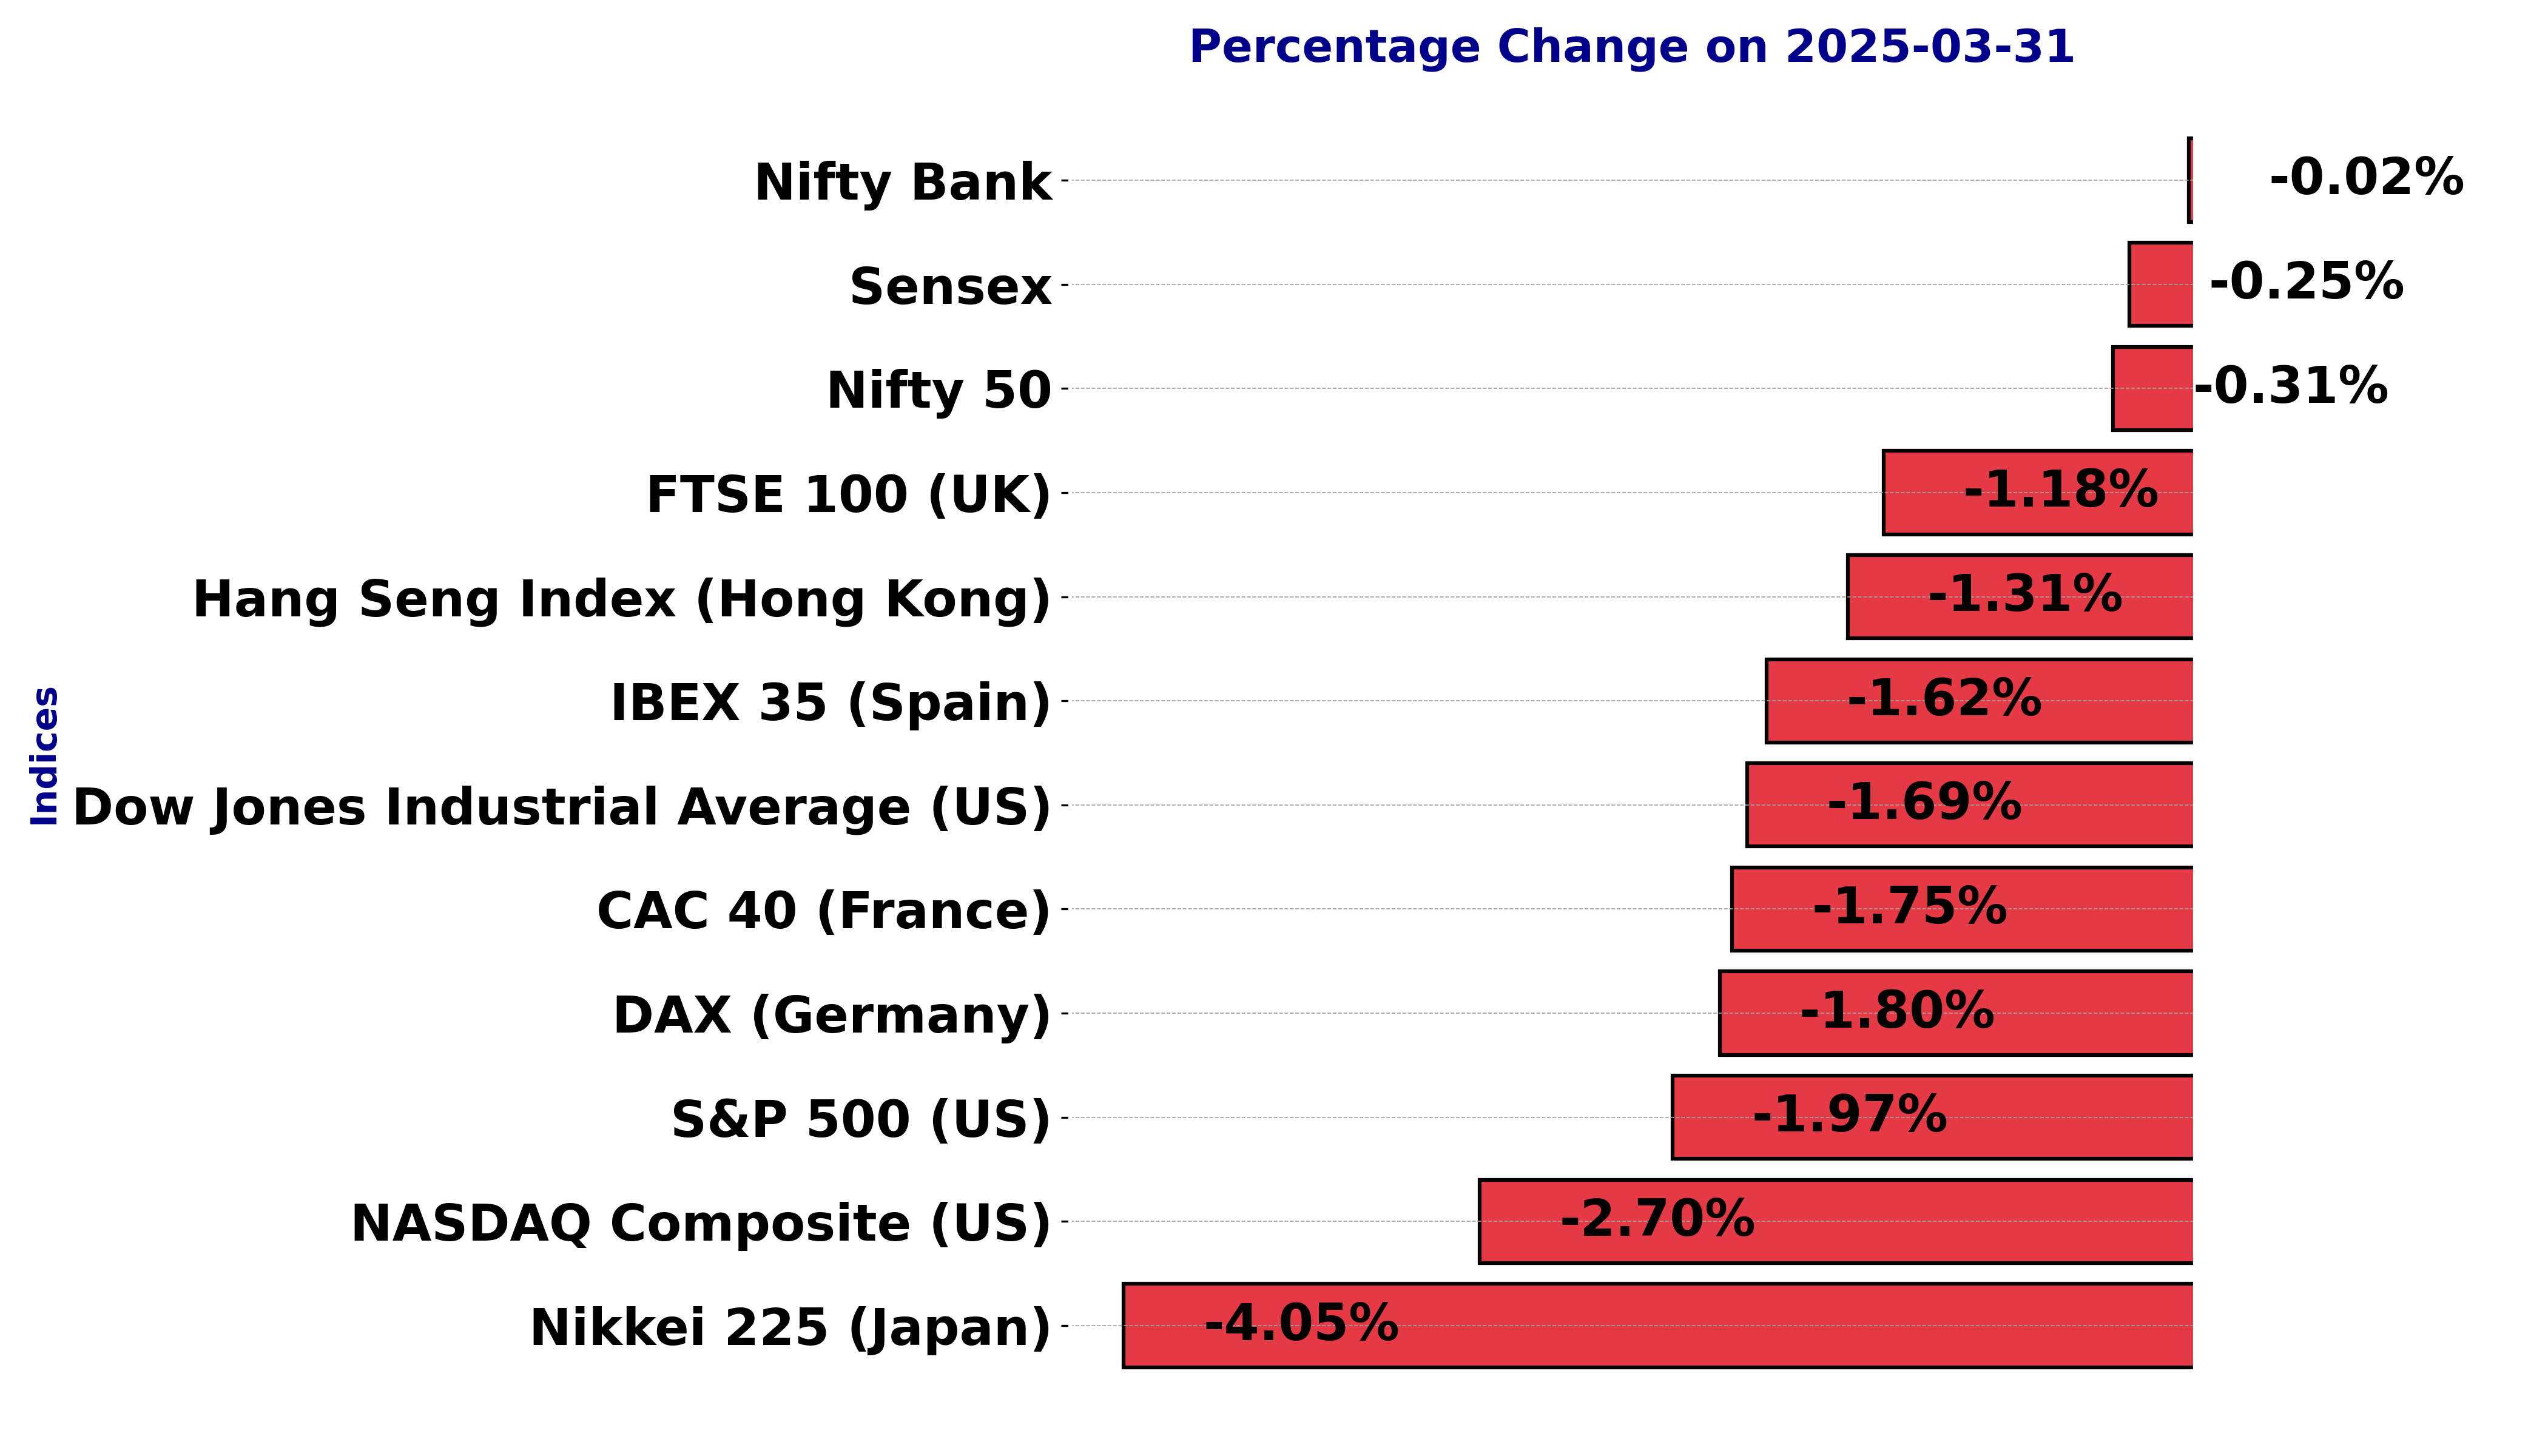
Global stock market indices: How the world markets performed today - 31 March 2025
The international stock market indices showed varied performances on March 31, 2025, reflecting the economic sentiment across different regions.
In this article, we analyze the performance of key global indices including the S&P 500, Dow Jones Industrial Average, NASDAQ Composite, FTSE 100, DAX, CAC 40, IBEX 35, Nikkei 225, Hang Seng, Nifty 50, and BSE Sensex.
Analysis for Sensex - March 31, 2025
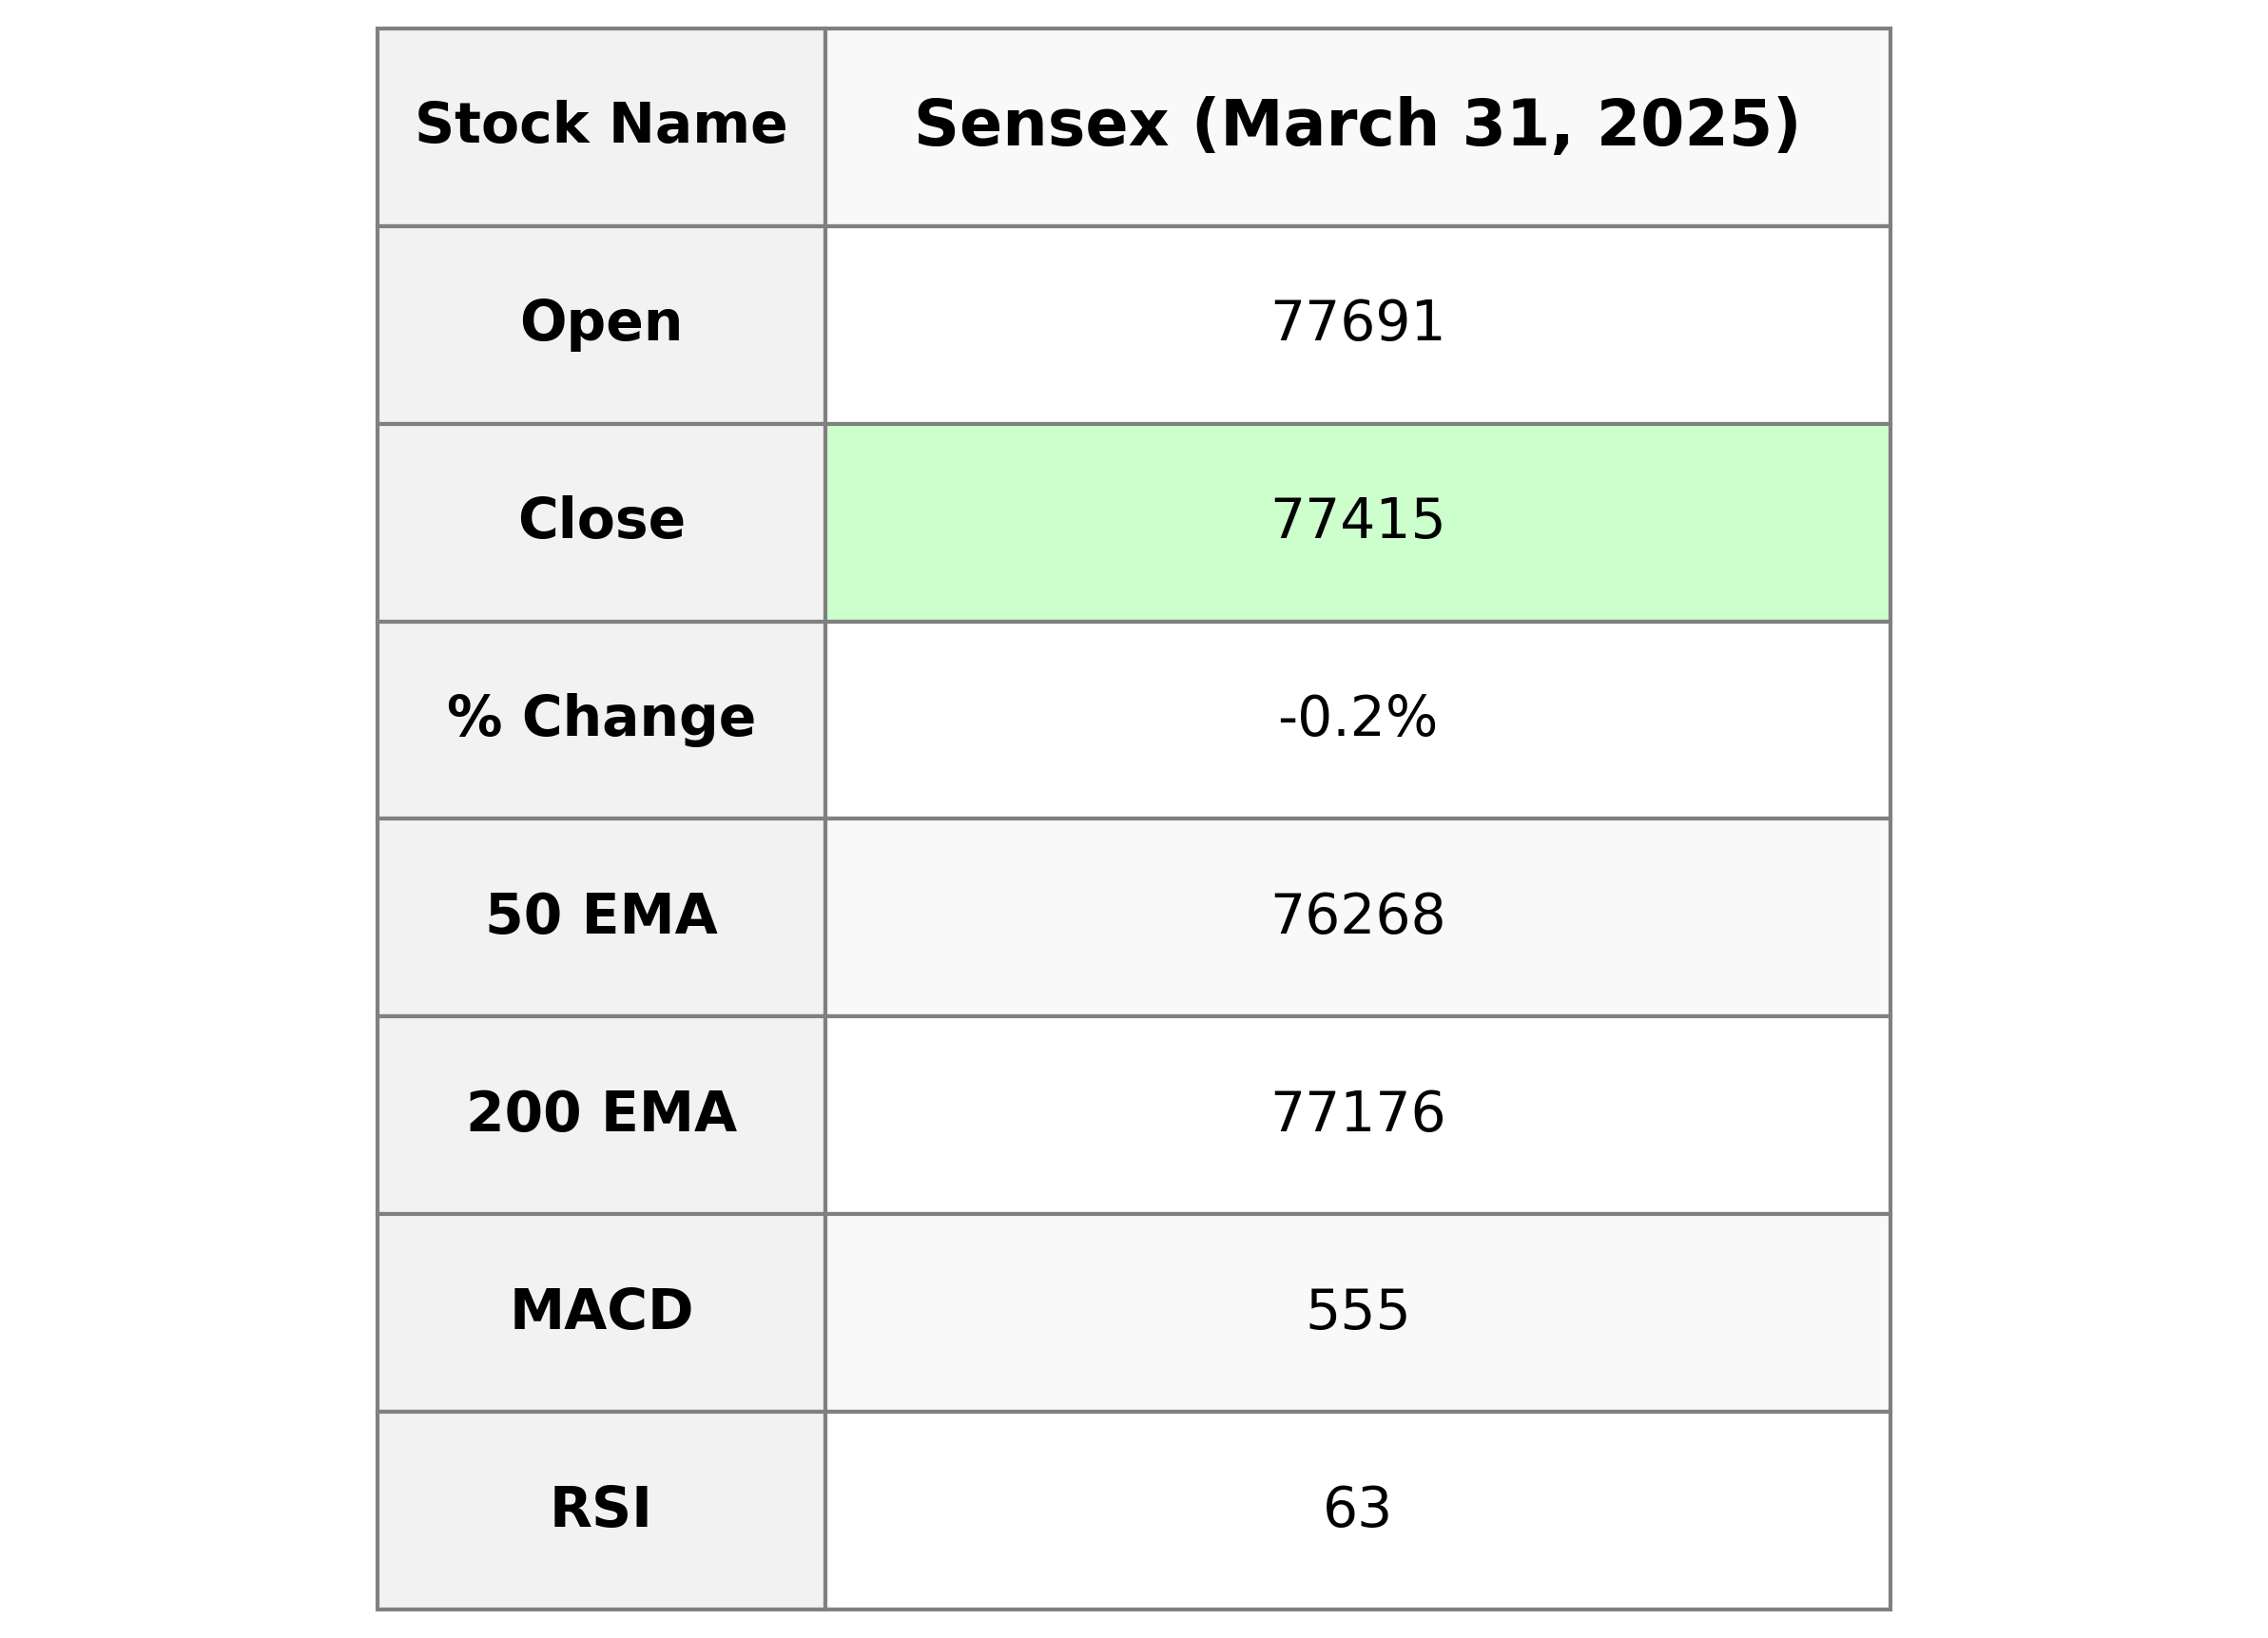
The Sensex opened at 77,690.69 and closed slightly lower at 77,414.92, experiencing a drop of 0.25% or 191.51 points from its previous close. The Relative Strength Index (RSI) is at 62.94, suggesting a moderately strong performance, while the MACD indicates a positive trend with a value above the signal. The volume traded is 16,700, with the 50-day EMA at 76,268.15, showing a potential bullish sentiment since it's above the 200-day EMA of 77,175.66.
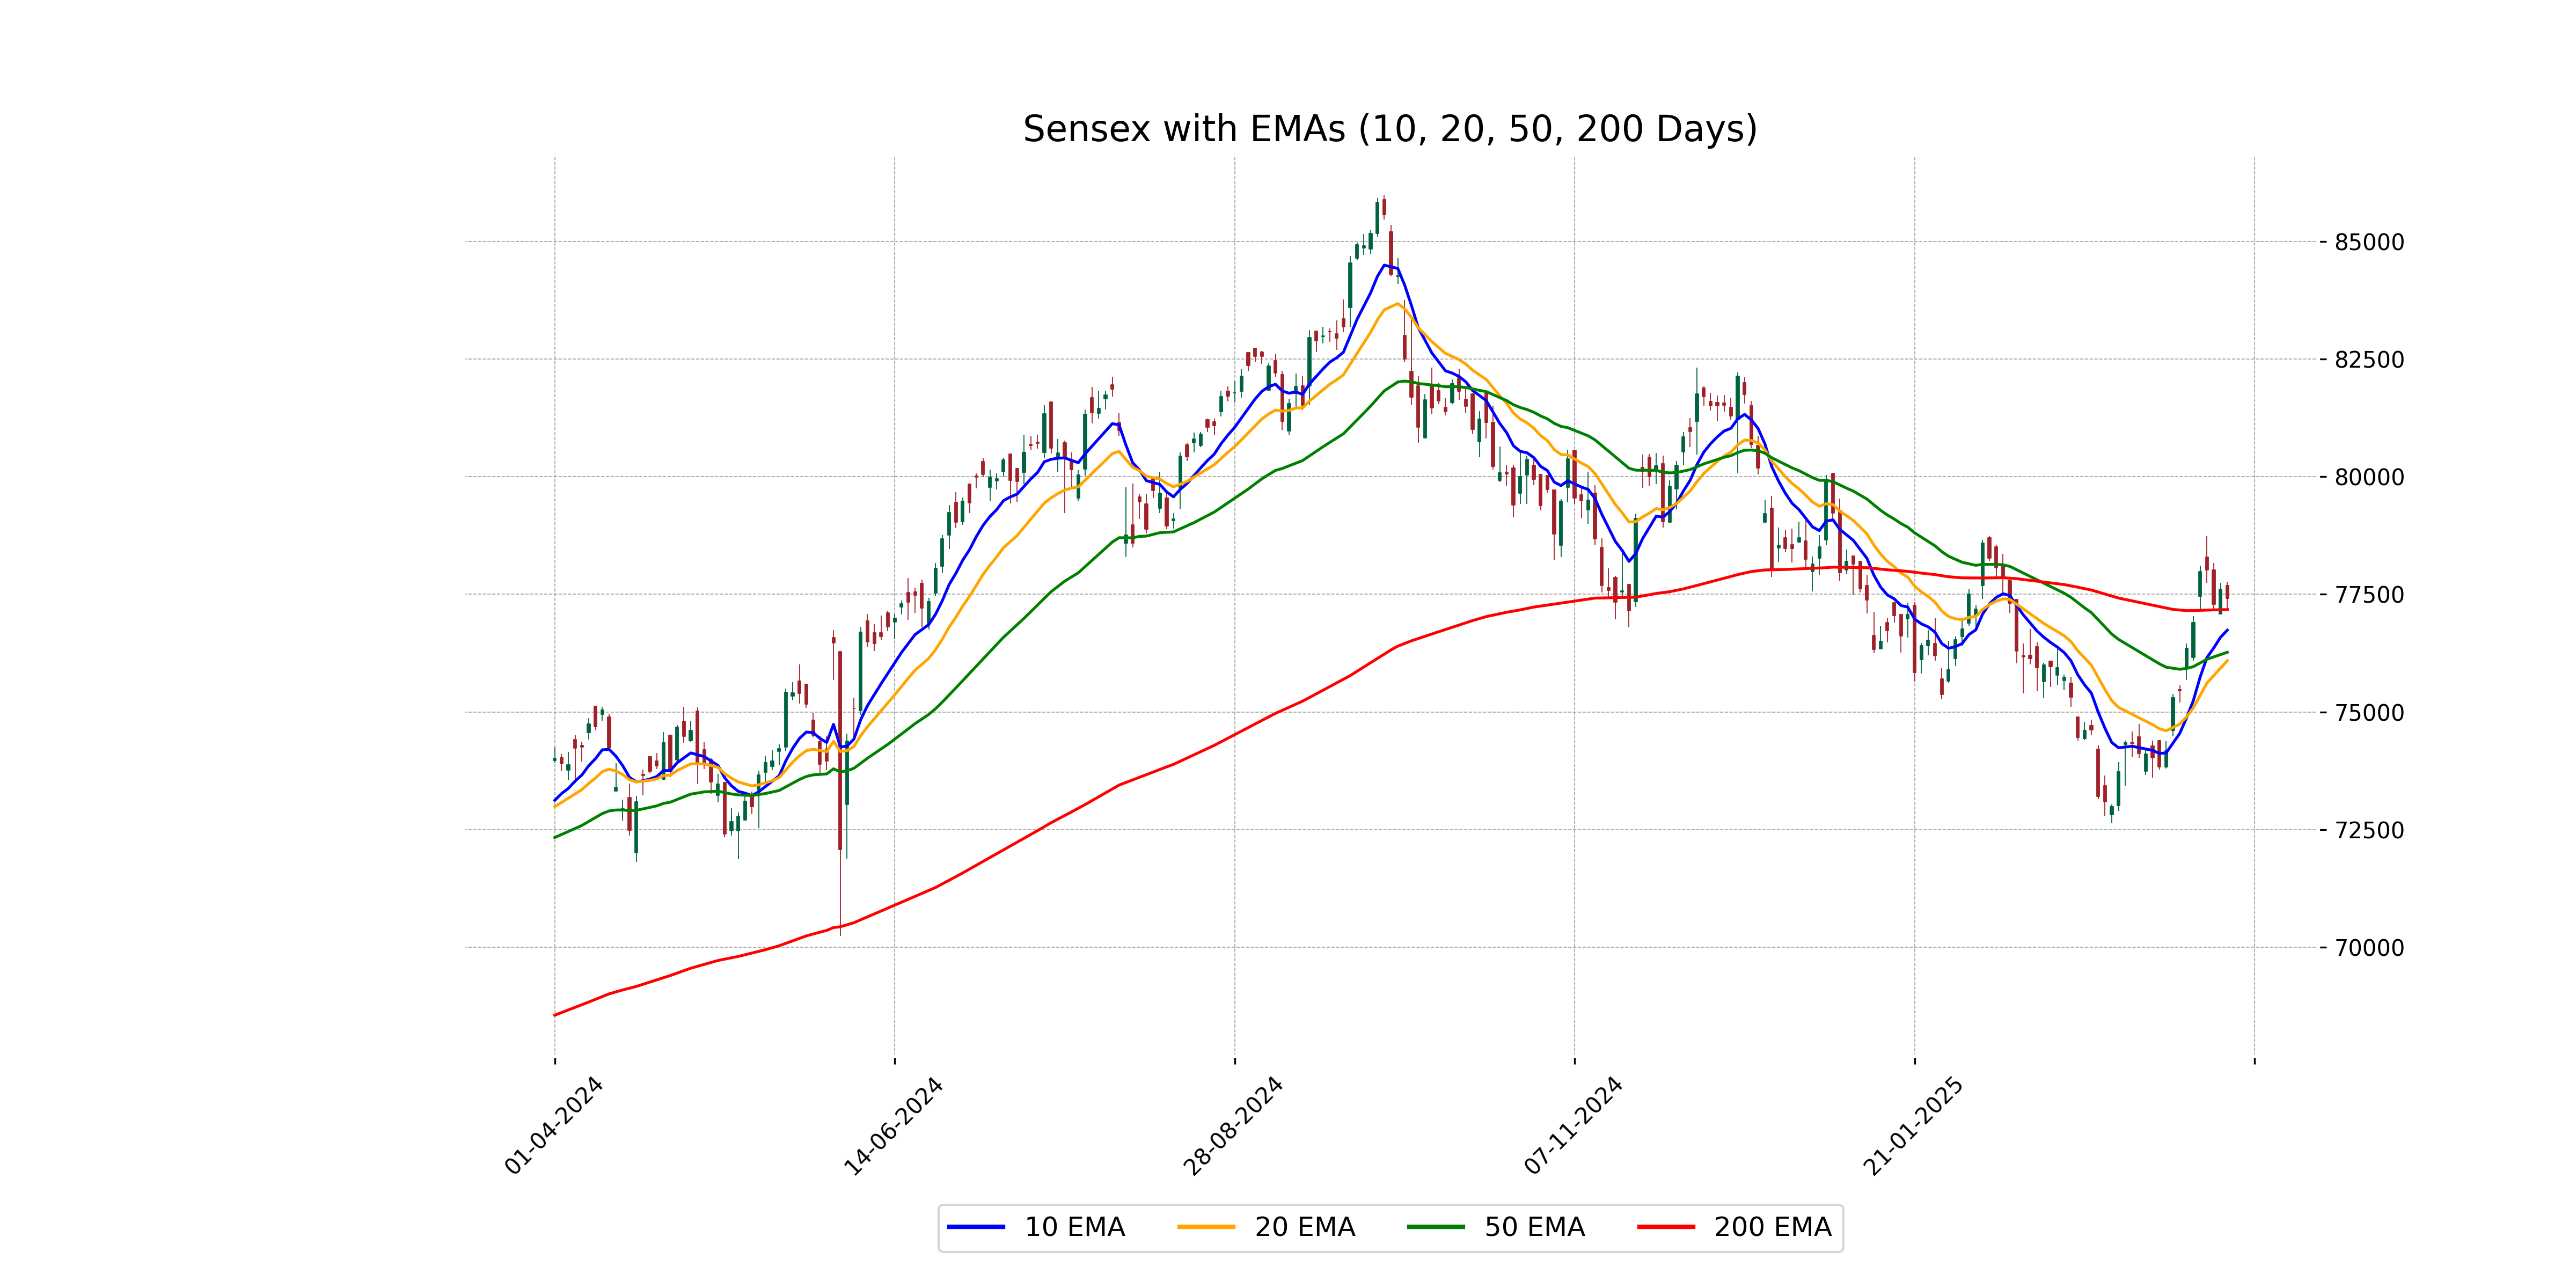
Relationship with Key Moving Averages
The Sensex closed at 77414.92, which is above its 10-day EMA of 76737.22 and 50-day EMA of 76268.15, indicating a short-term bullish trend. However, it is slightly above the 200-day EMA of 77175.66, suggesting cautious optimism in the longer term.
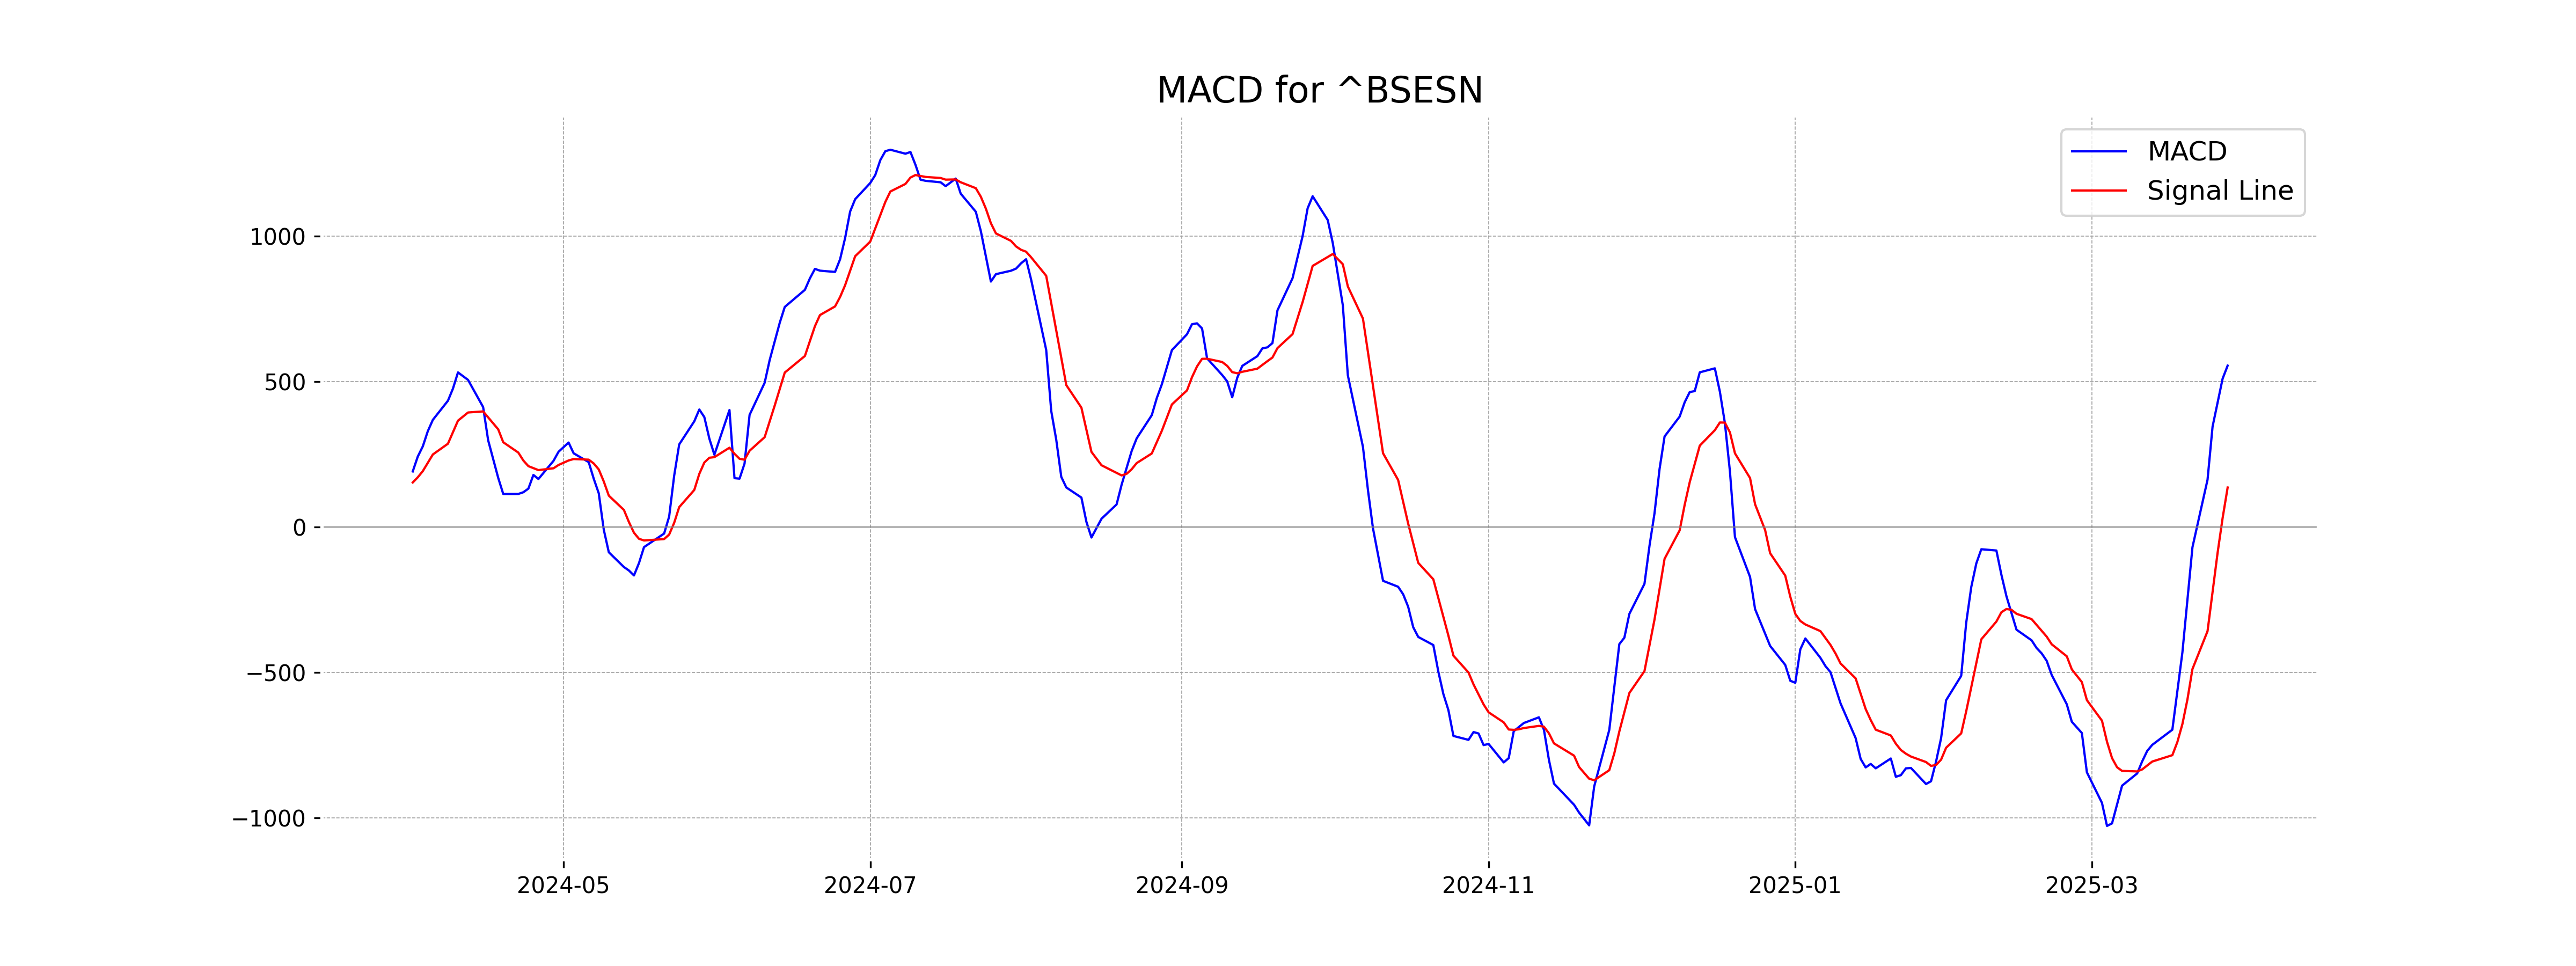
Moving Averages Trend (MACD)
The MACD value for Sensex is 555.44, which is above the MACD Signal line at 136.41, indicating a bullish trend. This suggests that the stock is gaining upward momentum.
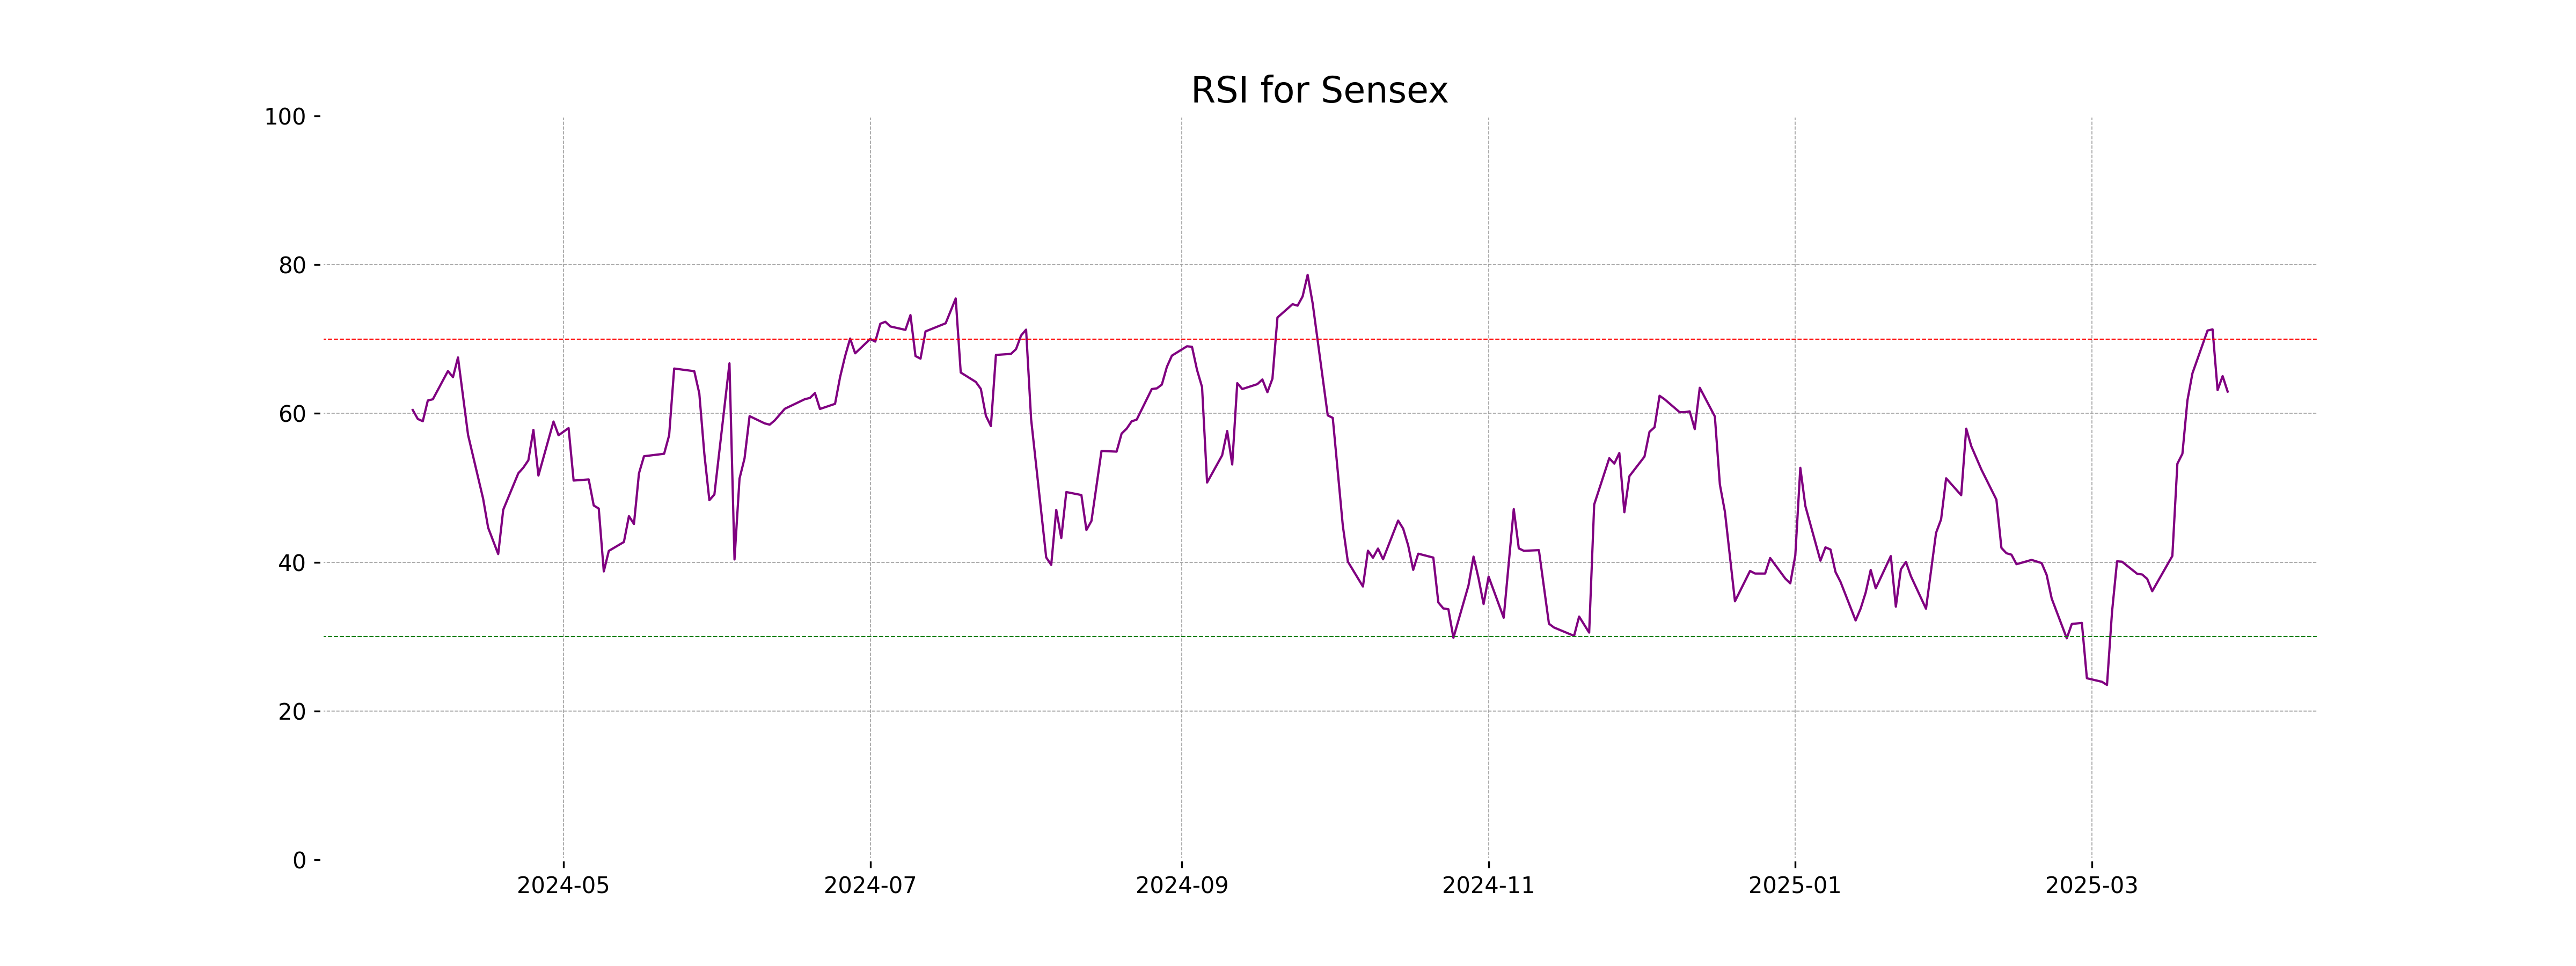
RSI Analysis
The Relative Strength Index (RSI) for Sensex is at 62.94, which suggests a moderately overbought condition. An RSI above 70 typically indicates that a stock may be overbought, while an RSI below 30 suggests it may be oversold. With the current RSI above 60, Sensex is leaning towards the higher end of its range, but not yet in the extreme overbought territory.
Analysis for Dow Jones Industrial Average (US) - March 31, 2025
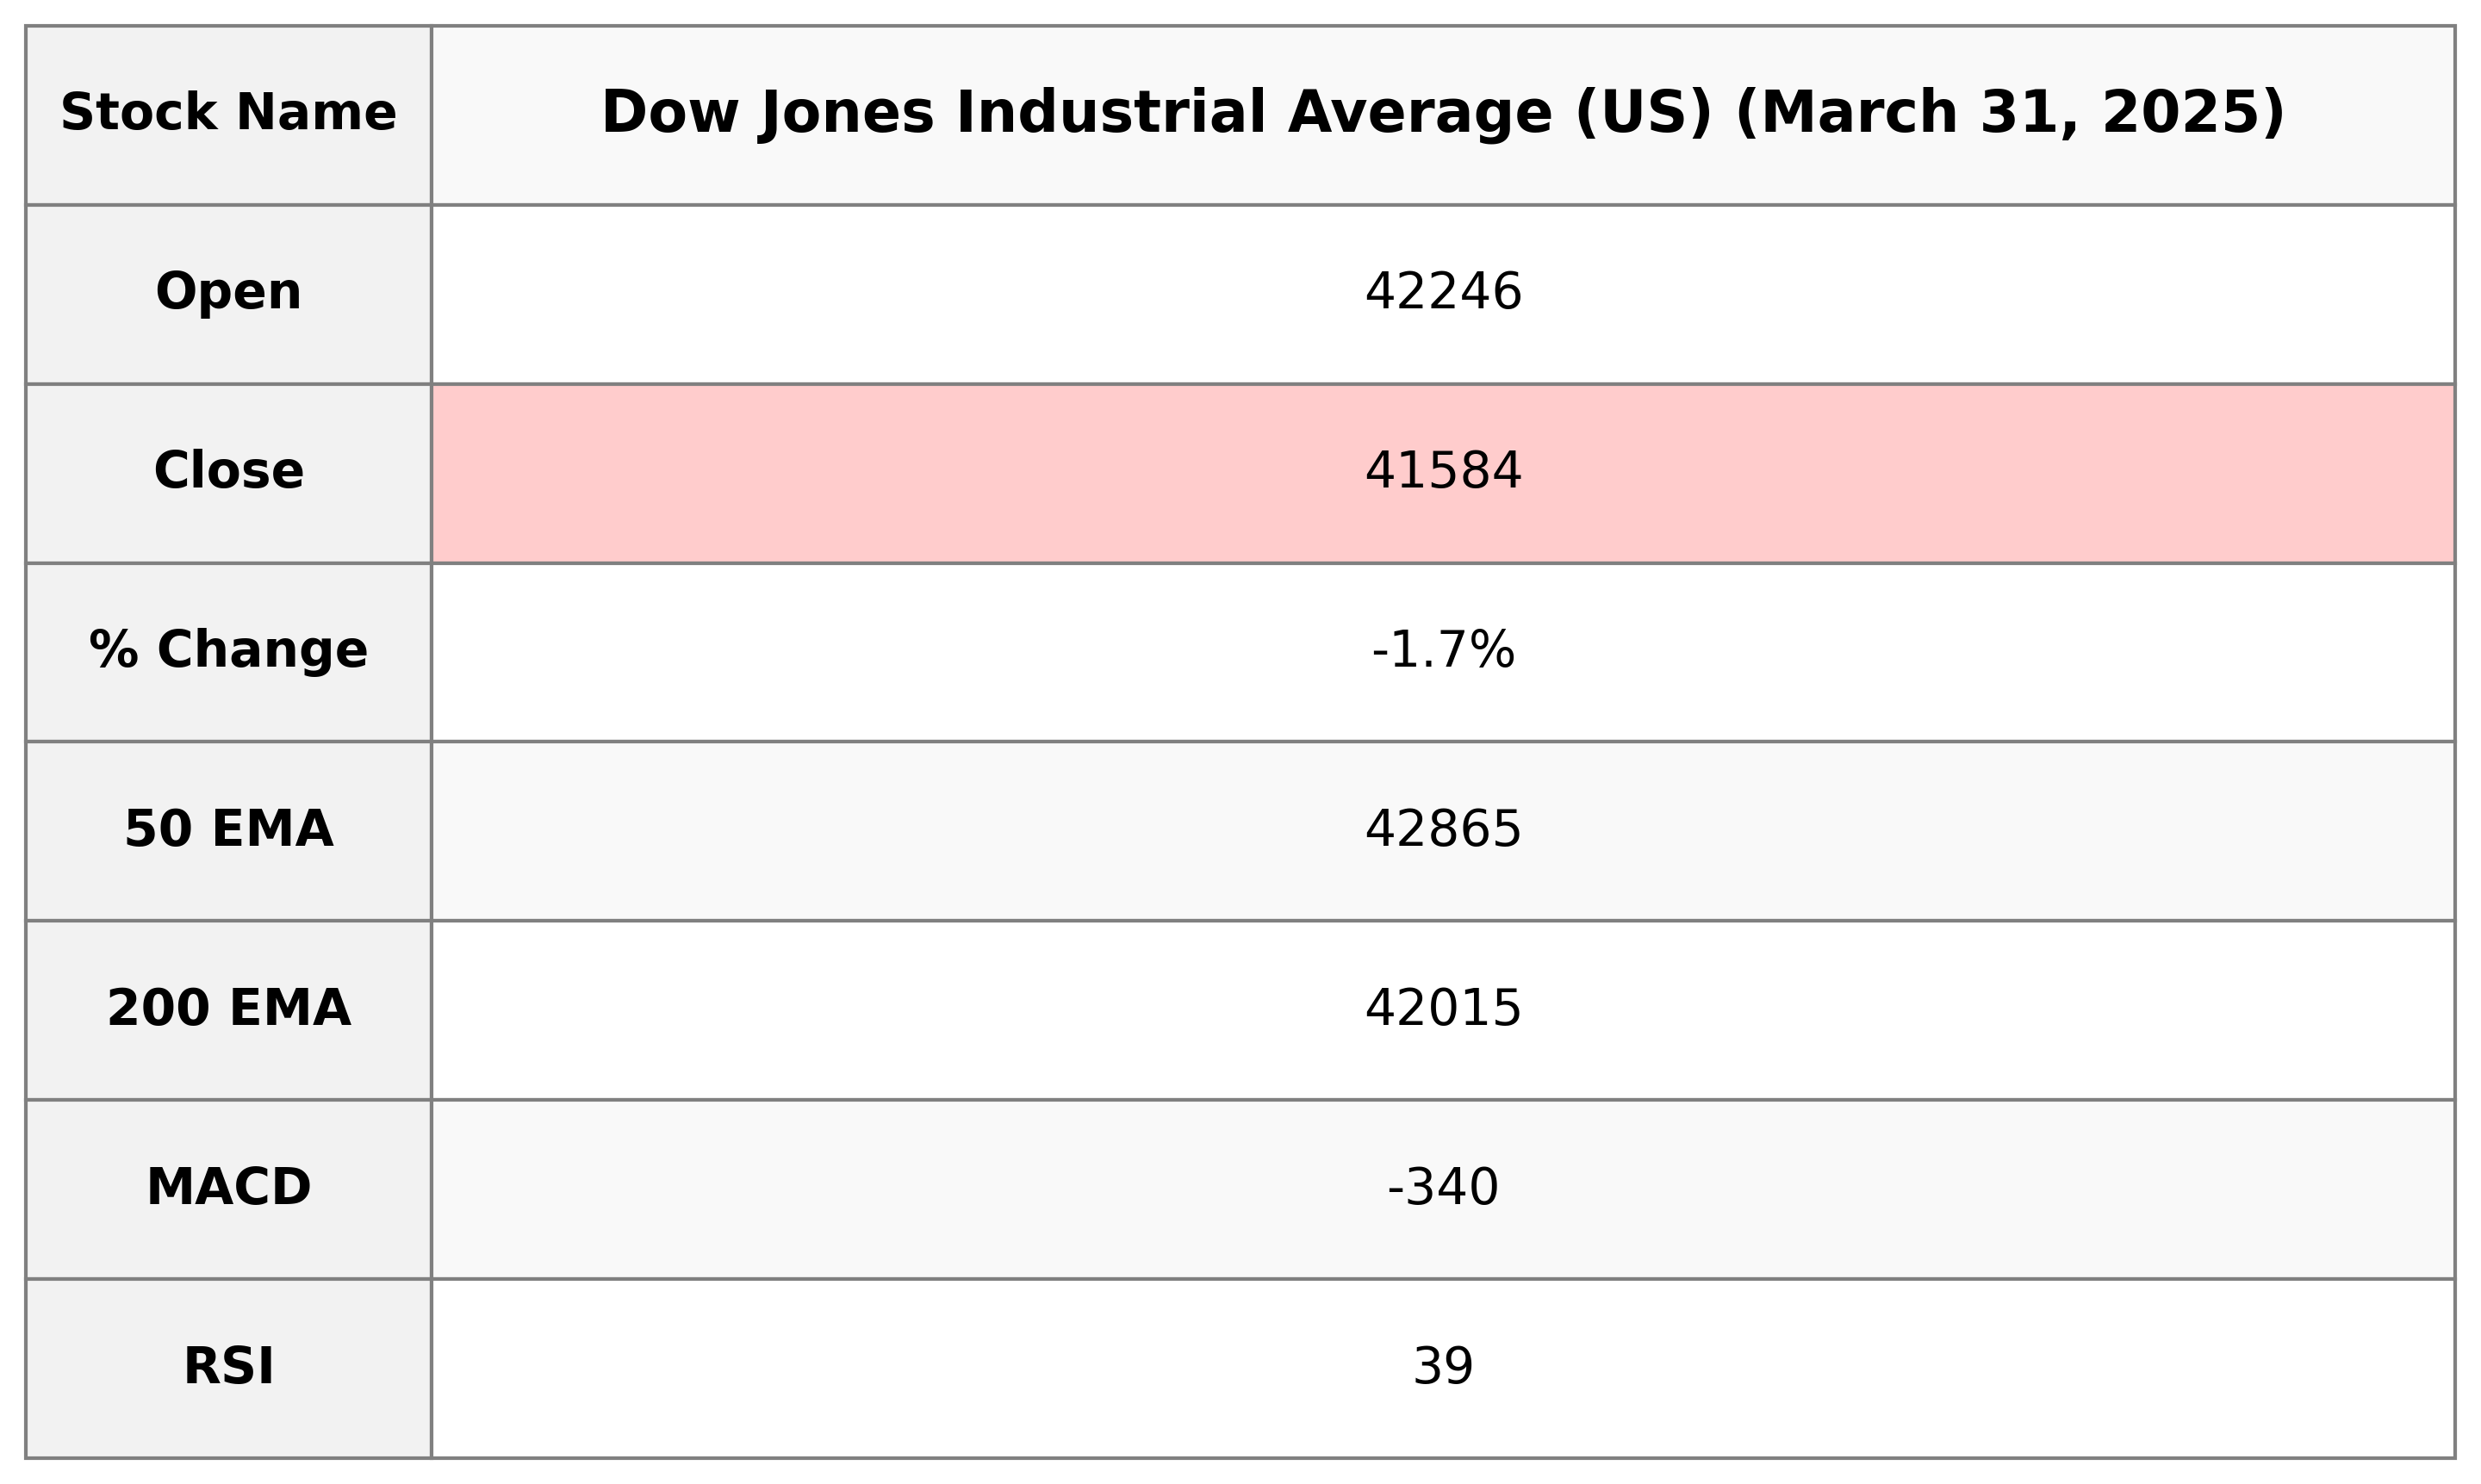
The Dow Jones Industrial Average opened at 42,245.82 and closed at 41,583.90, experiencing a significant drop of 715.80 points (or -1.69%). The RSI stands at 39.34, indicating a potentially oversold condition. The 50-day EMA is above the current trading price, reflecting a short-term downward trend.
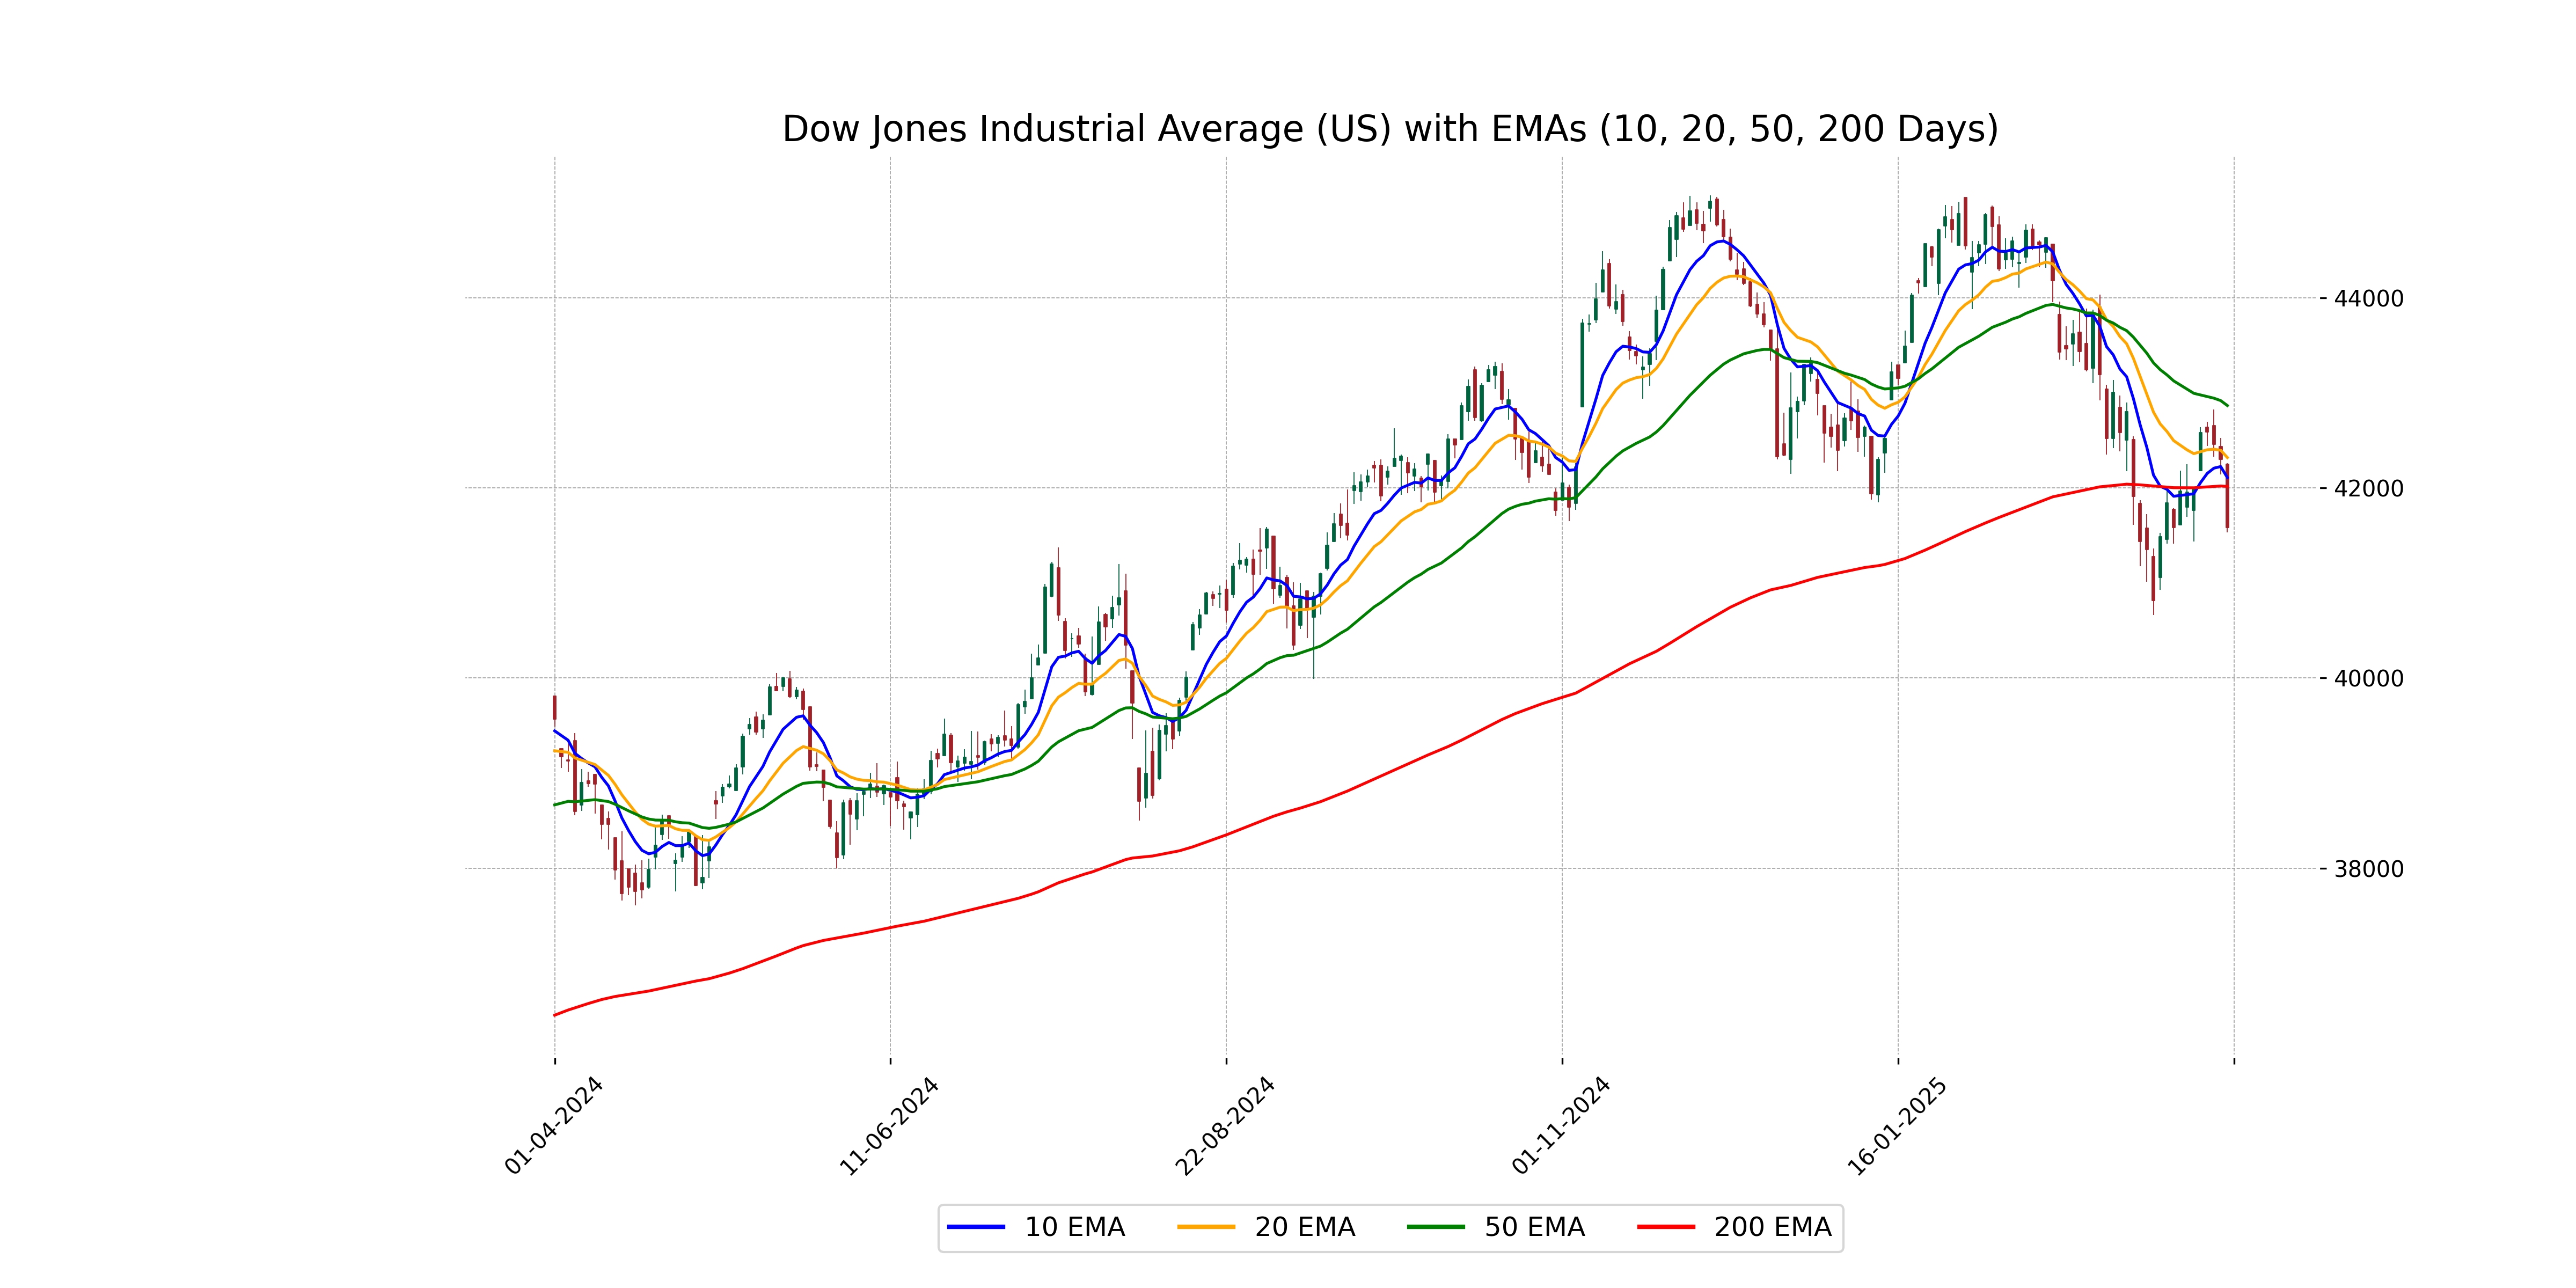
Relationship with Key Moving Averages
The Dow Jones Industrial Average is trading below its 50-day EMA of 42,864.97 and its 20-day EMA of 42,318.18, indicating bearish momentum. However, it remains above the 200-day EMA of 42,014.80, suggesting longer-term support might hold.
Moving Averages Trend (MACD)
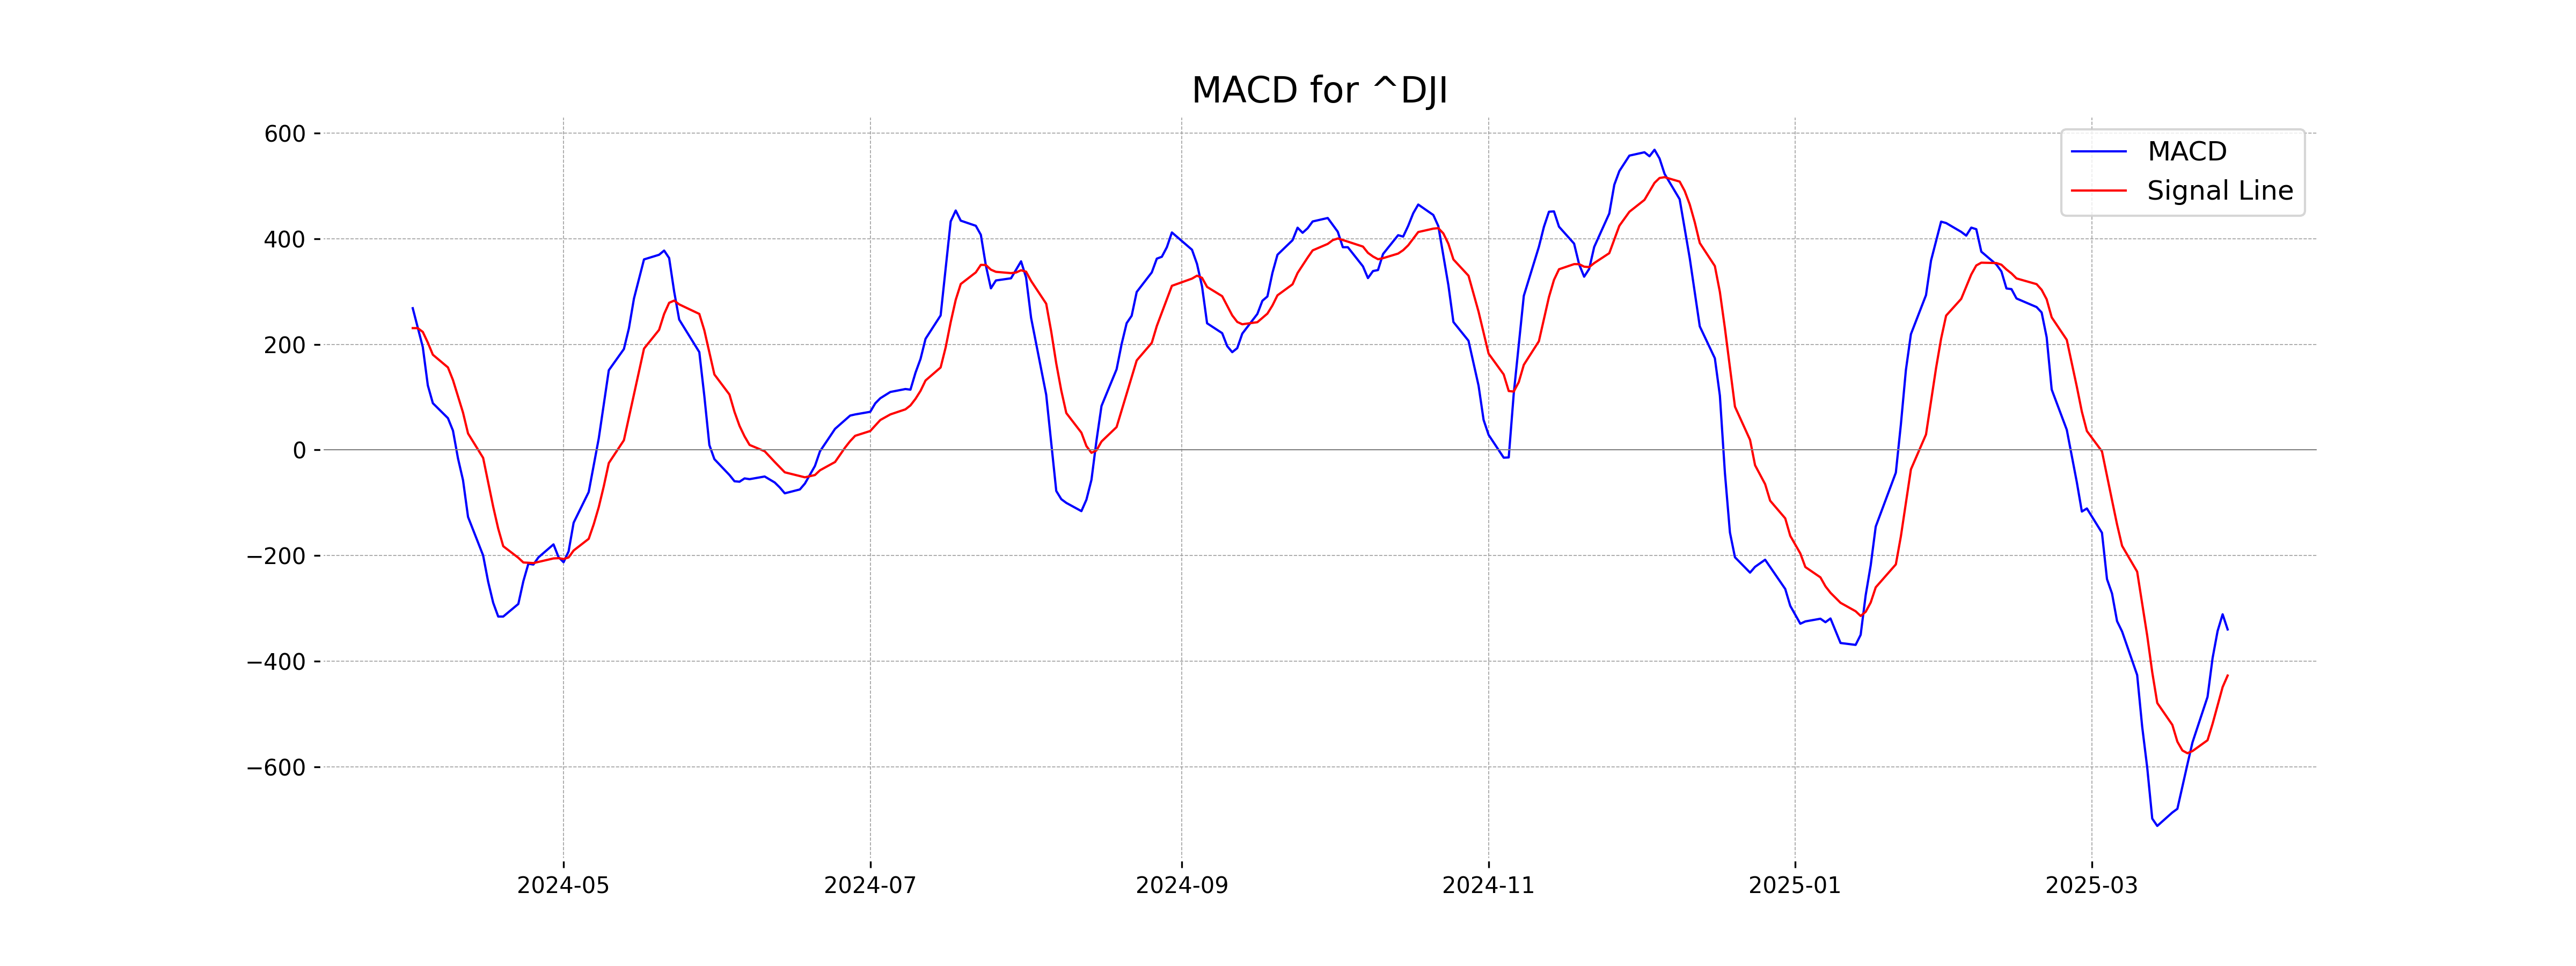
The Dow Jones Industrial Average's MACD value of -339.67, compared to its MACD Signal of -426.86, indicates a bullish crossover as the MACD is above the Signal line. This could suggest potential upward momentum, even though the index experienced a recent decline.
RSI Analysis
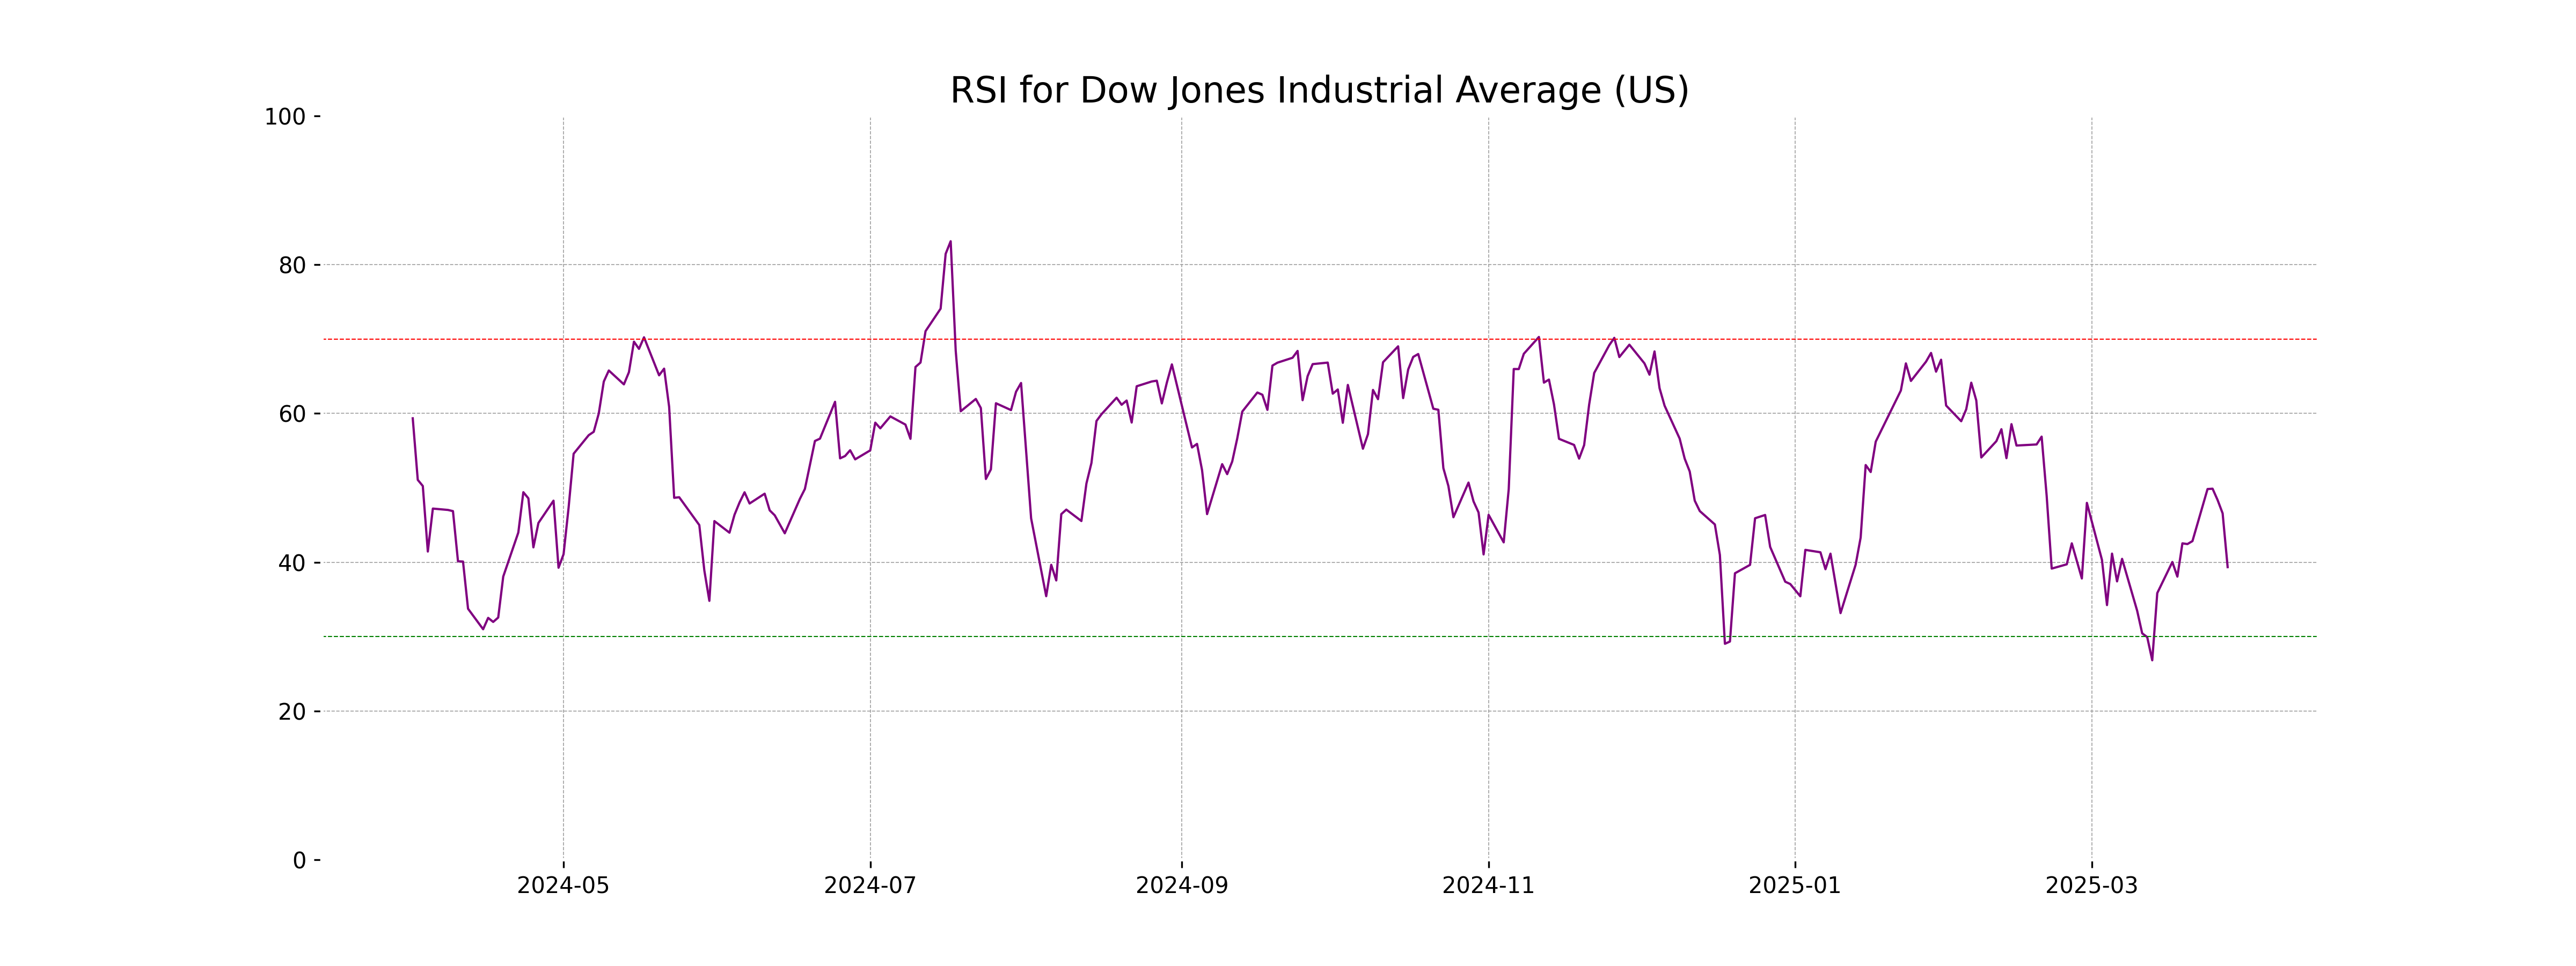
The Relative Strength Index (RSI) for the Dow Jones Industrial Average is 39.34, indicating that the index is nearing oversold territory. Generally, an RSI below 30 suggests that an asset may be undervalued and could be due for a price reversal, so the current index value suggests caution with a potential for a reversal if the RSI decreases further.
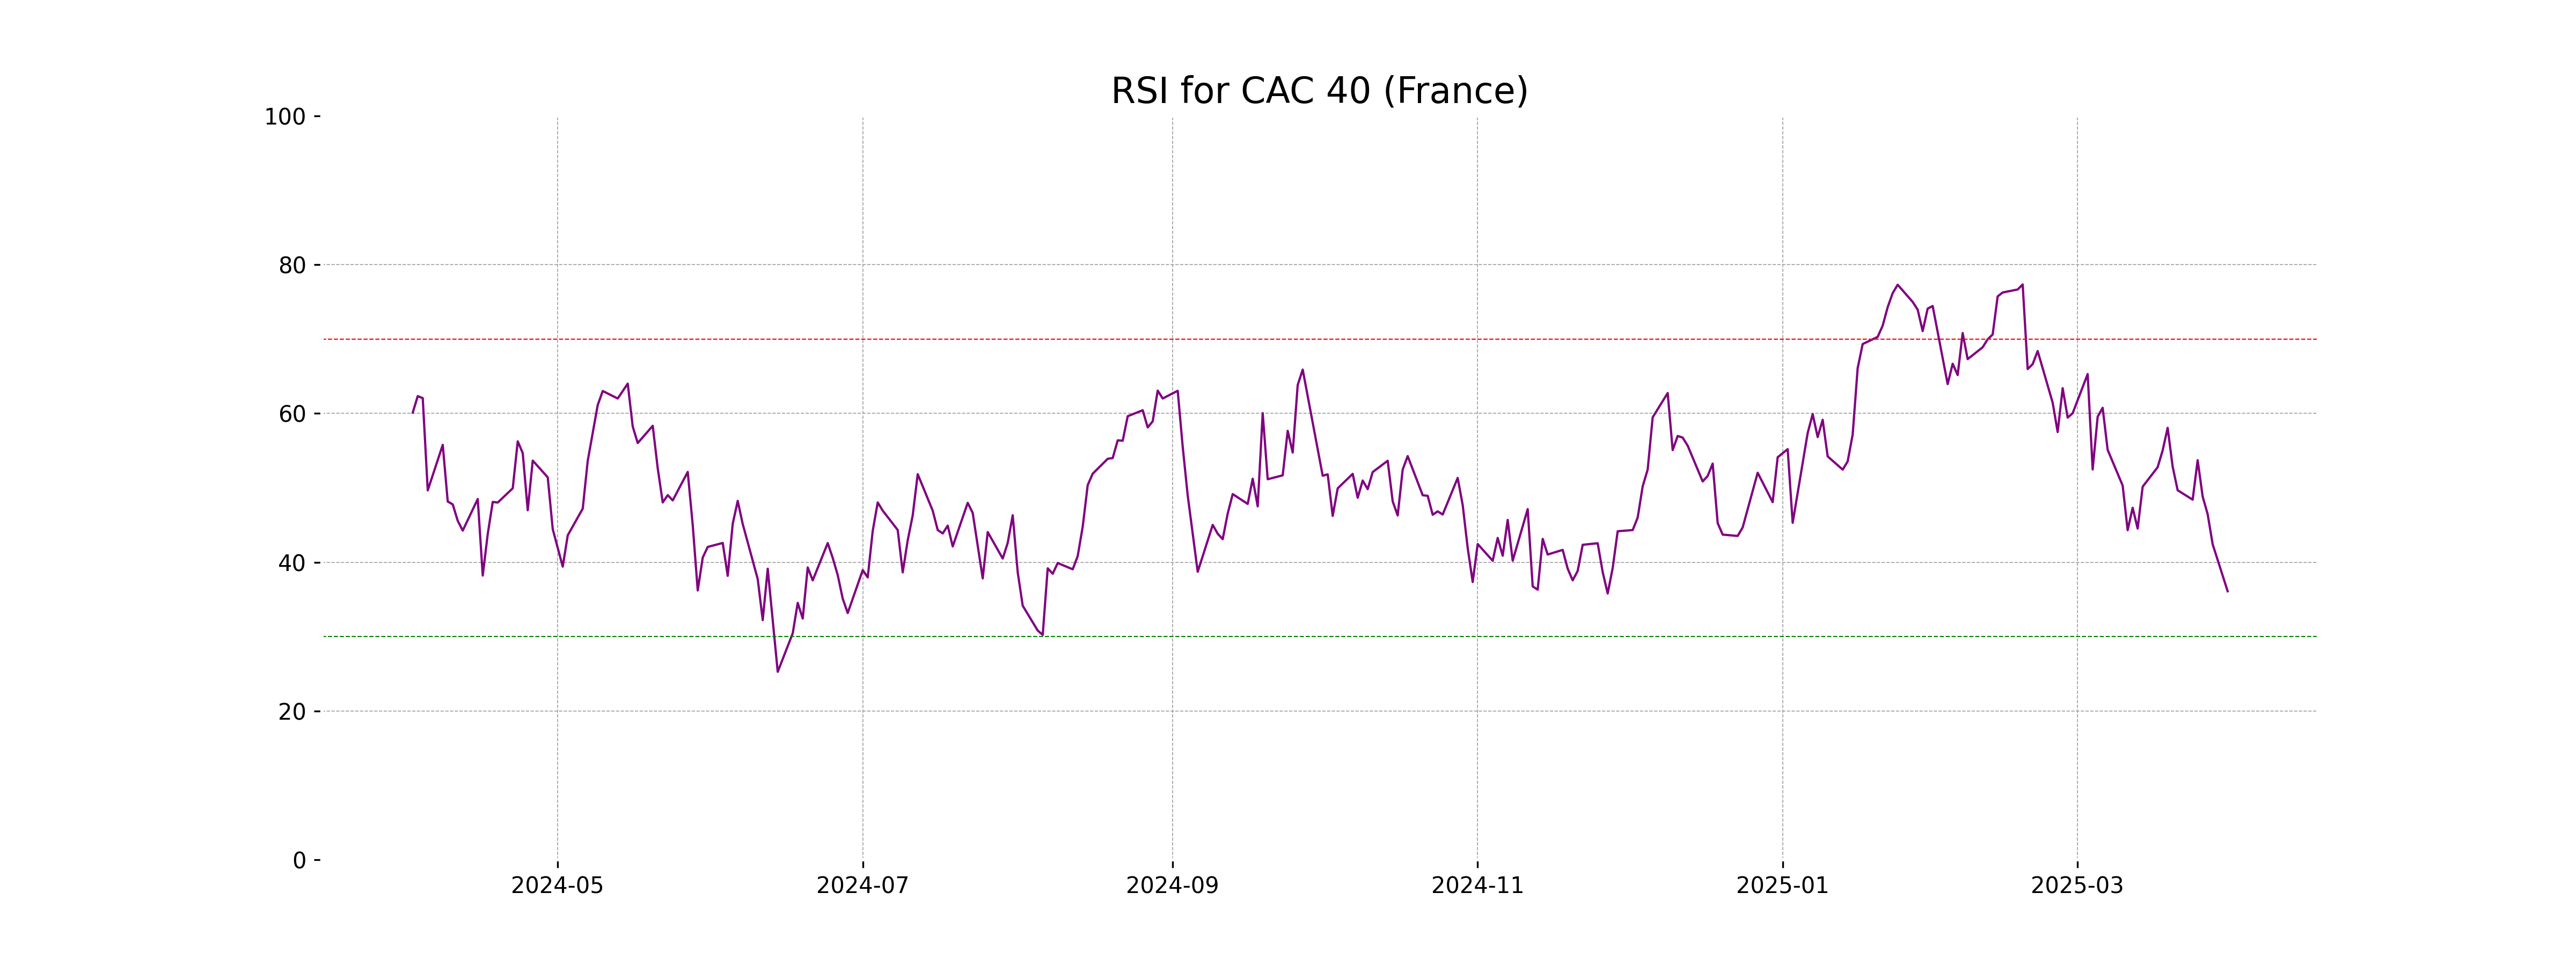
Analysis for CAC 40 (France) - March 31, 2025

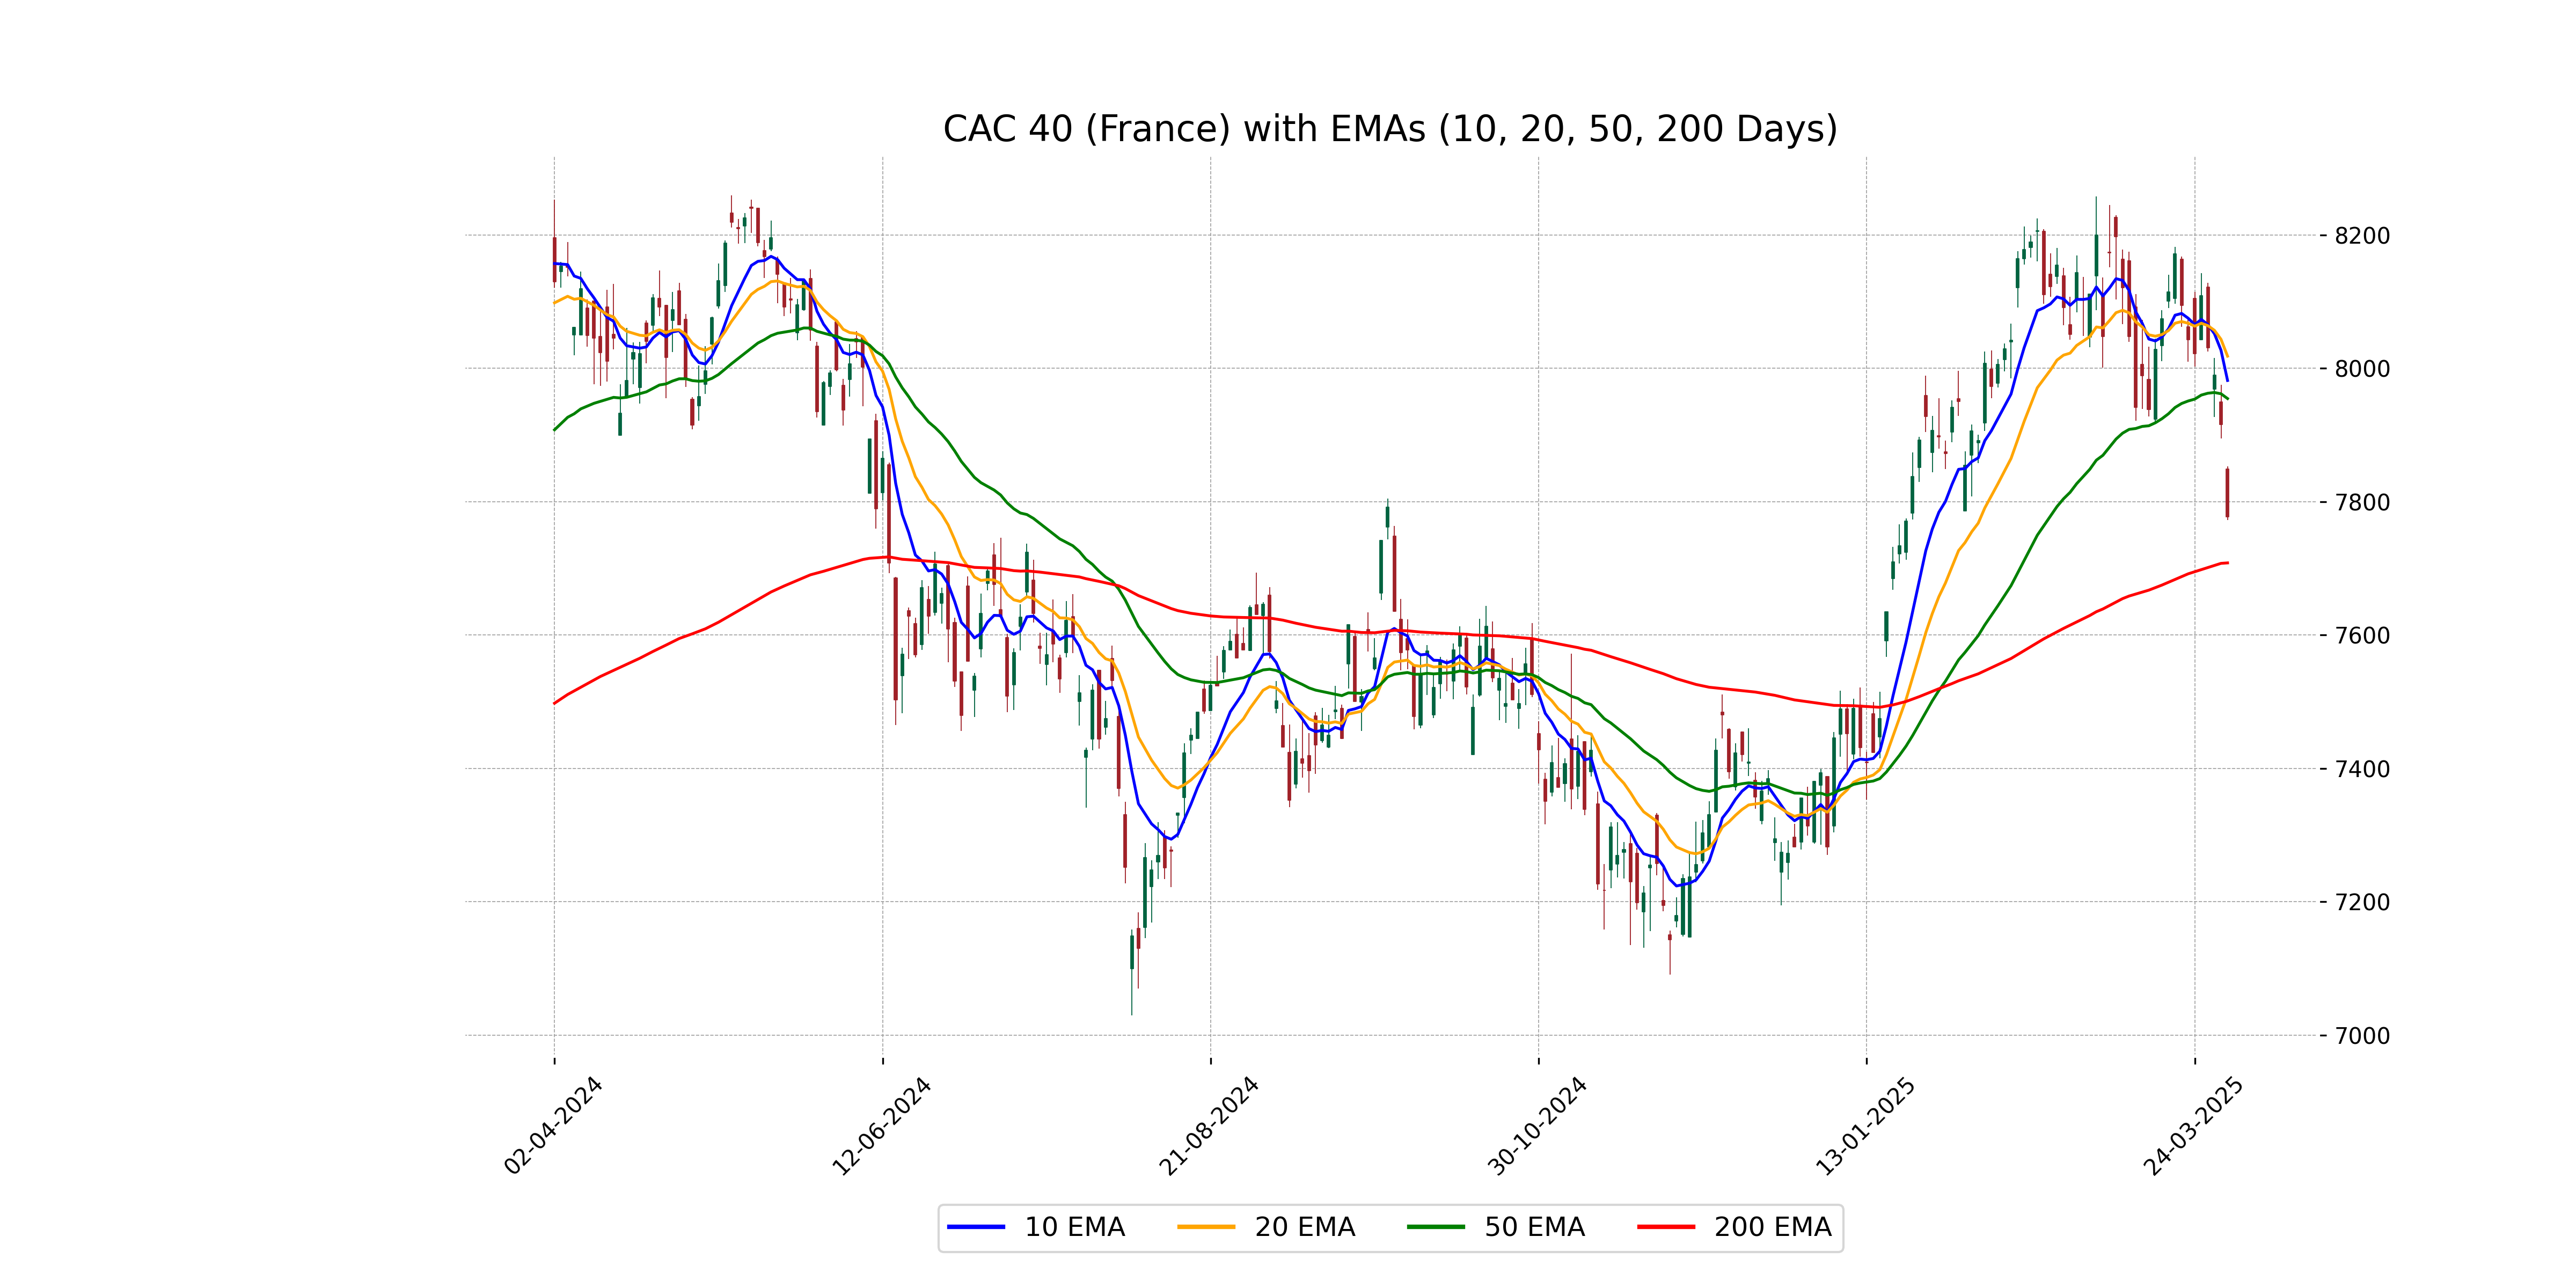
CAC 40 (France) Performance Overview: The CAC 40 index opened at 7849.32, reaching a high of 7853.21 and closing lower at 7777.68. This represents a decrease of 1.75% or a points change of -138.40 from the previous close of 7916.08. With a 10 EMA of 7981.84 and a 200 EMA of 7708.23, the index shows a current weakness as indicated by an RSI of 36.10 and a negative MACD of -24.20, suggesting bearish momentum.
Relationship with Key Moving Averages
For CAC 40 (France), the current close of 7777.68 is below all key moving averages (50 EMA: 7954.69, 200 EMA: 7708.23, 10 EMA: 7981.84, 20 EMA: 8018.30), indicating a bearish trend. The fact that the 200 EMA is lower than the short-term EMAs could suggest long-term support.
Moving Averages Trend (MACD)
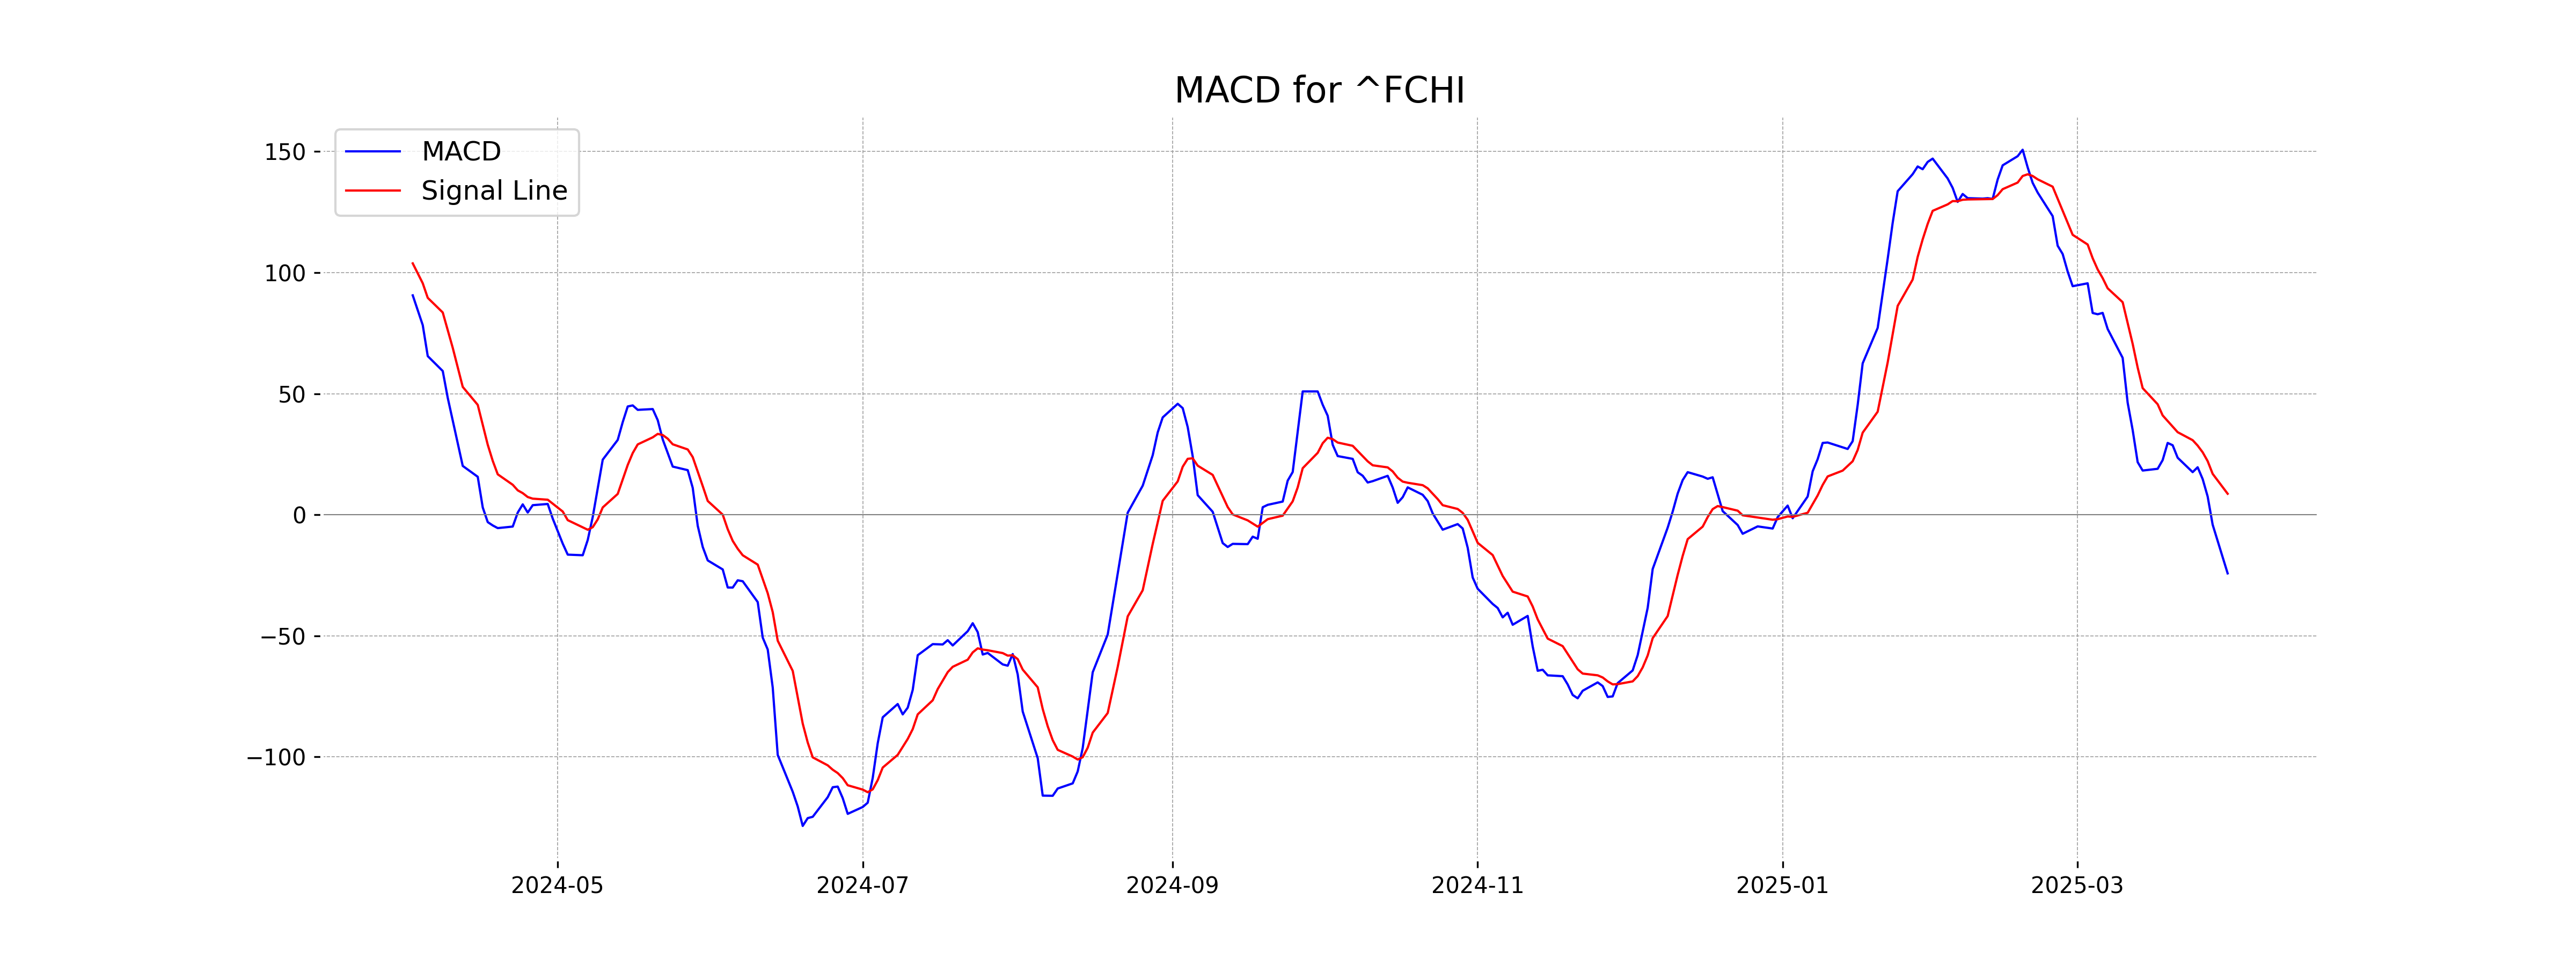
The MACD for CAC 40 (France) is -24.204, indicating bearish momentum as it is below its MACD Signal of 8.688. This suggests that the recent trend is downward, reflecting selling pressure in the market.
RSI Analysis
The RSI value for CAC 40 (France) is 36.10, indicating that the index is closer to the oversold territory, which typically begins at 30. This suggests that the index might be undervalued, and a potential upward reversal could be anticipated if the trend continues.
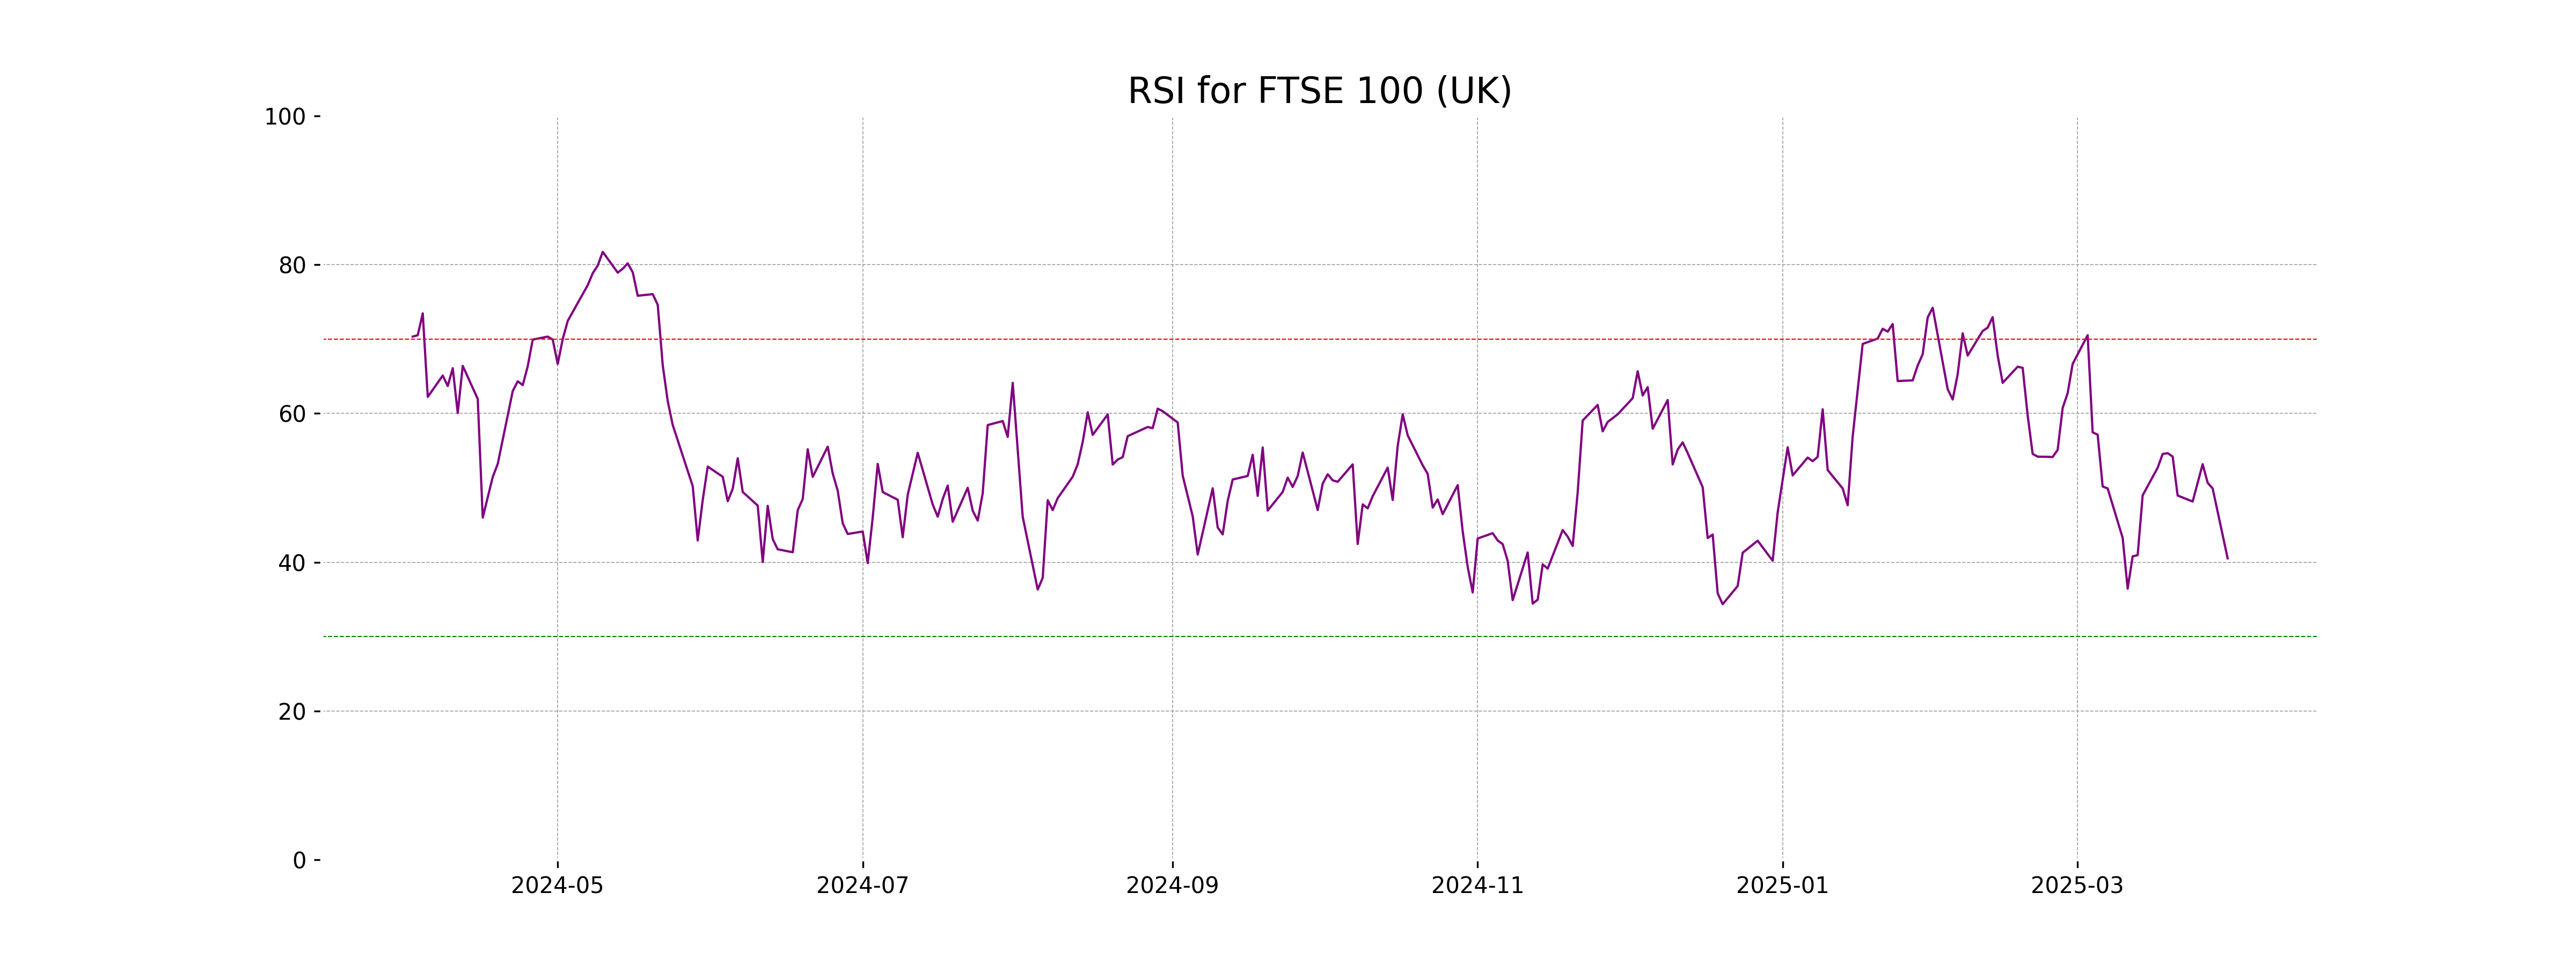
Analysis for FTSE 100 (UK) - March 31, 2025
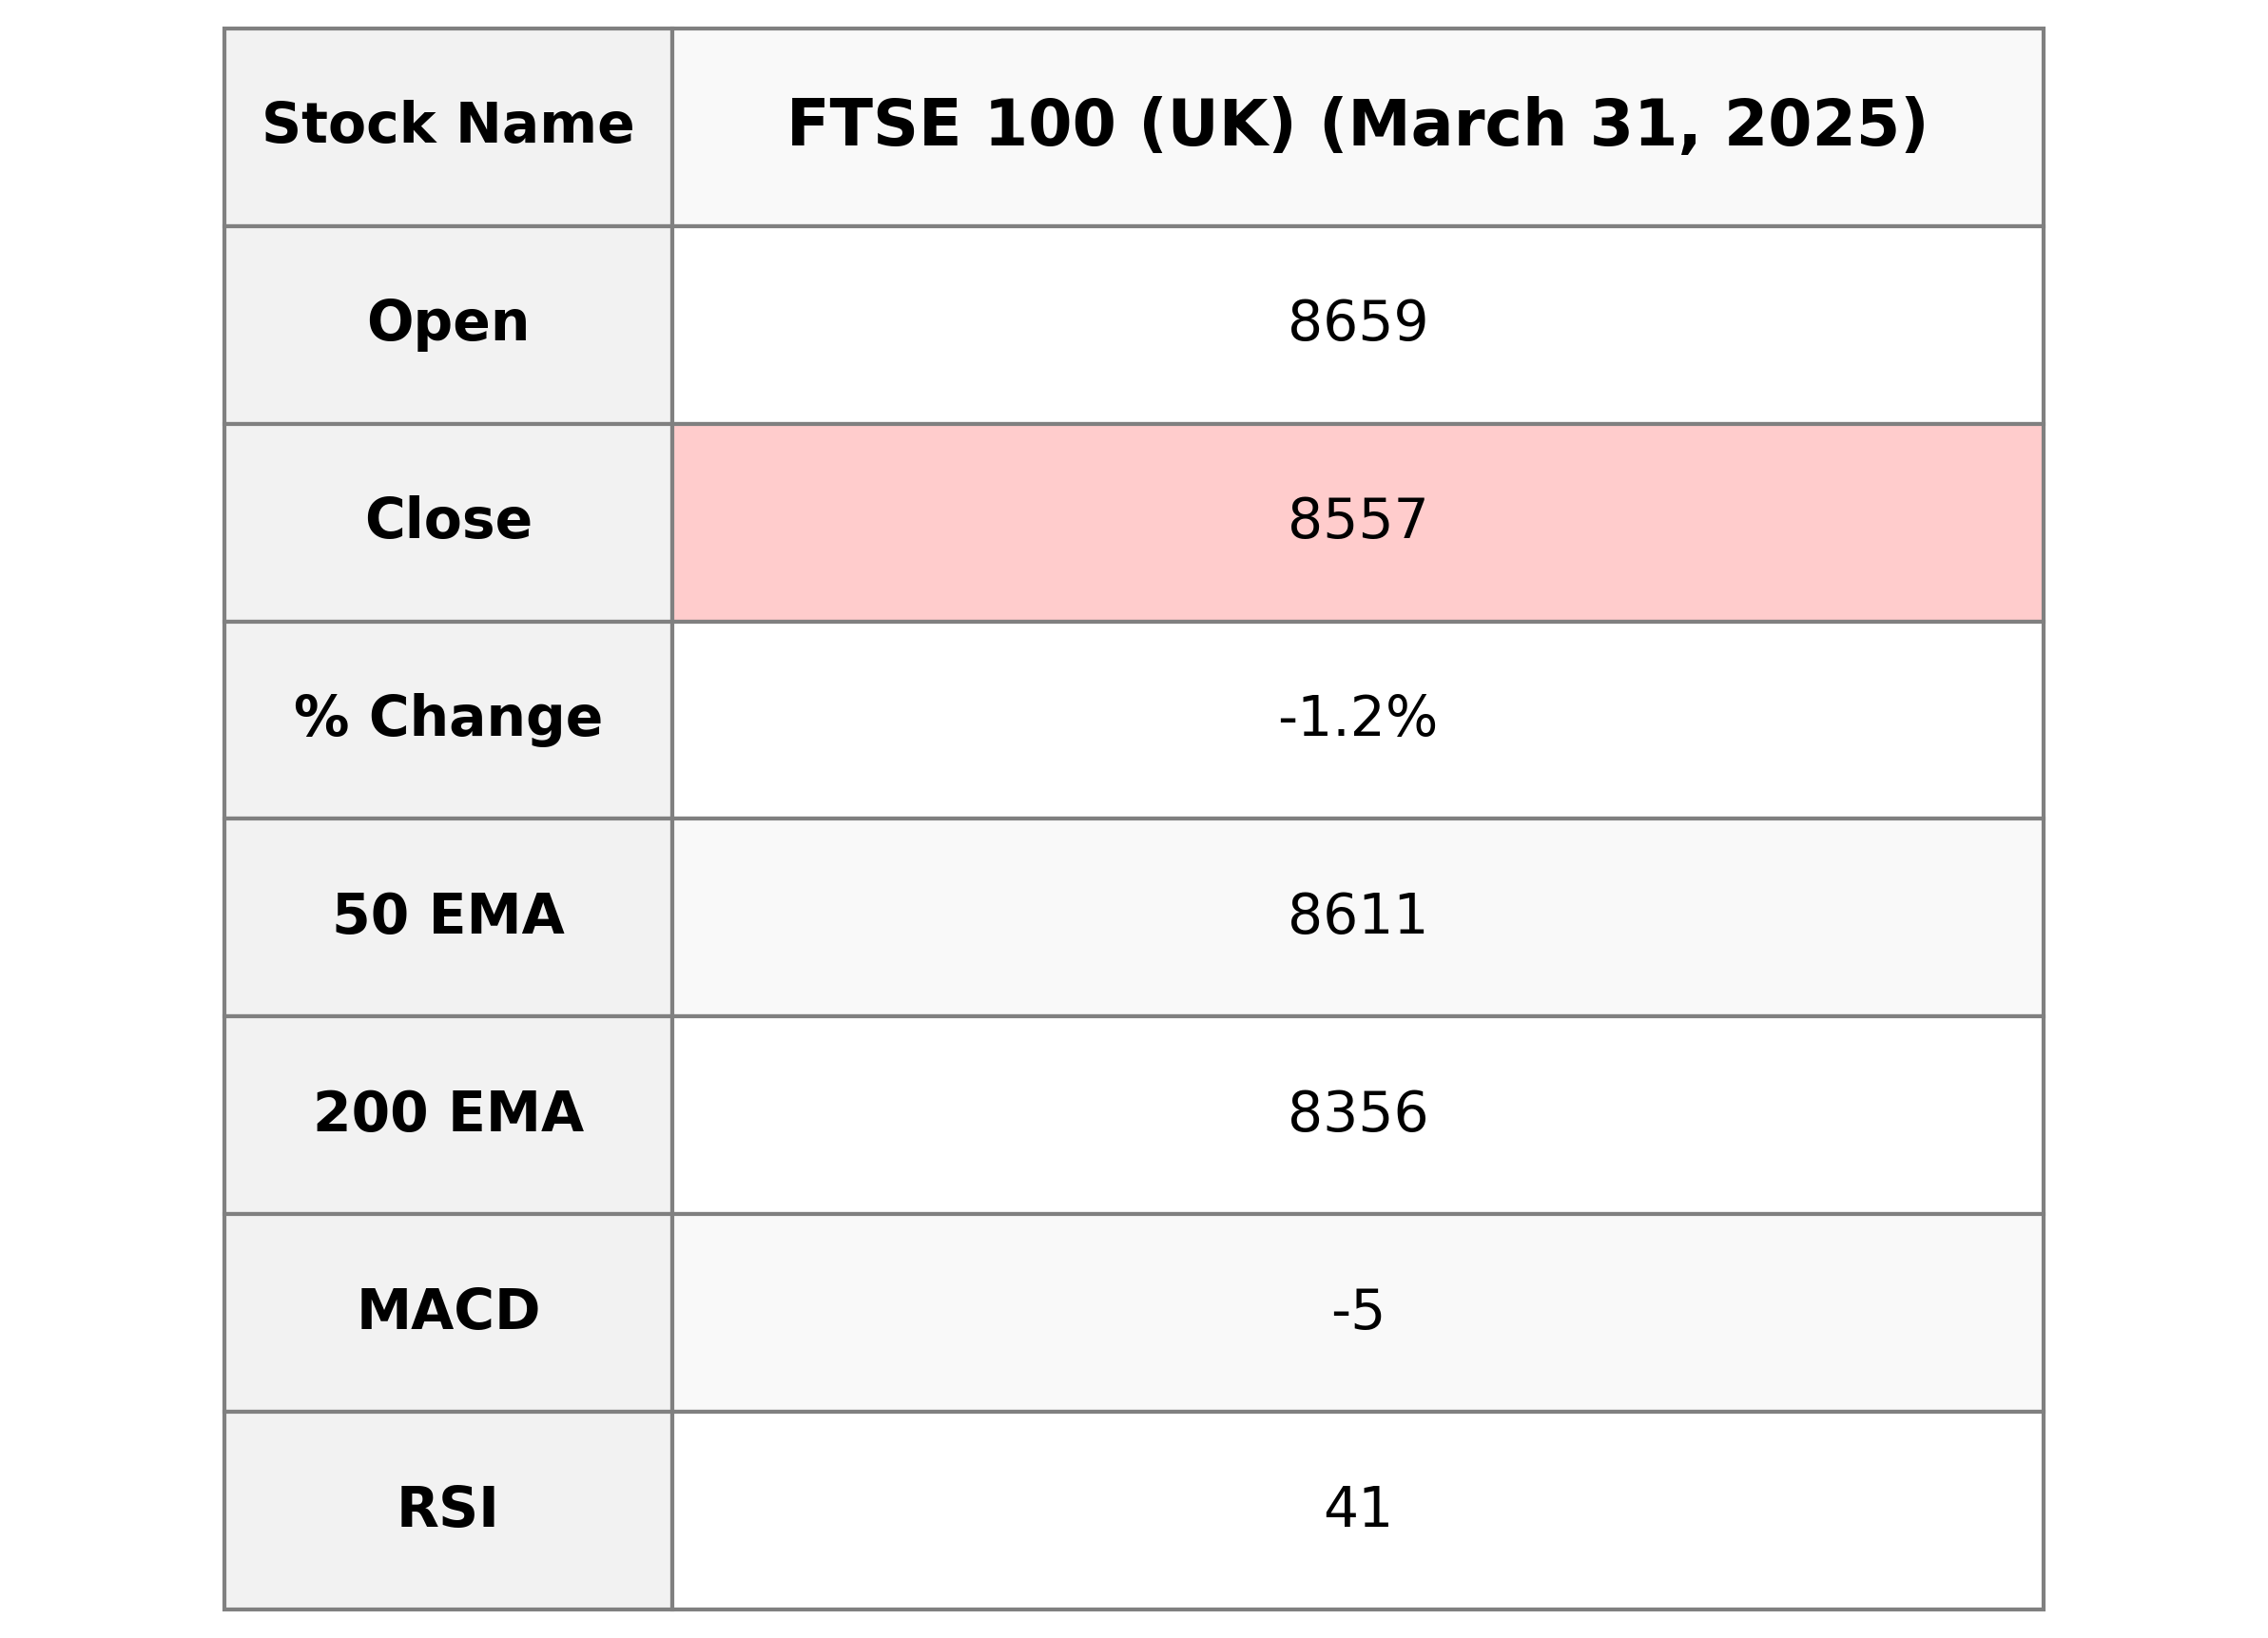
FTSE 100 (UK) opened at 8658.85 and closed lower at 8557.11, registering a decline of 1.18% or 101.79 points. The RSI is at 40.52, indicating the index is approaching oversold levels, while the MACD of -5.20 suggests bearish momentum.
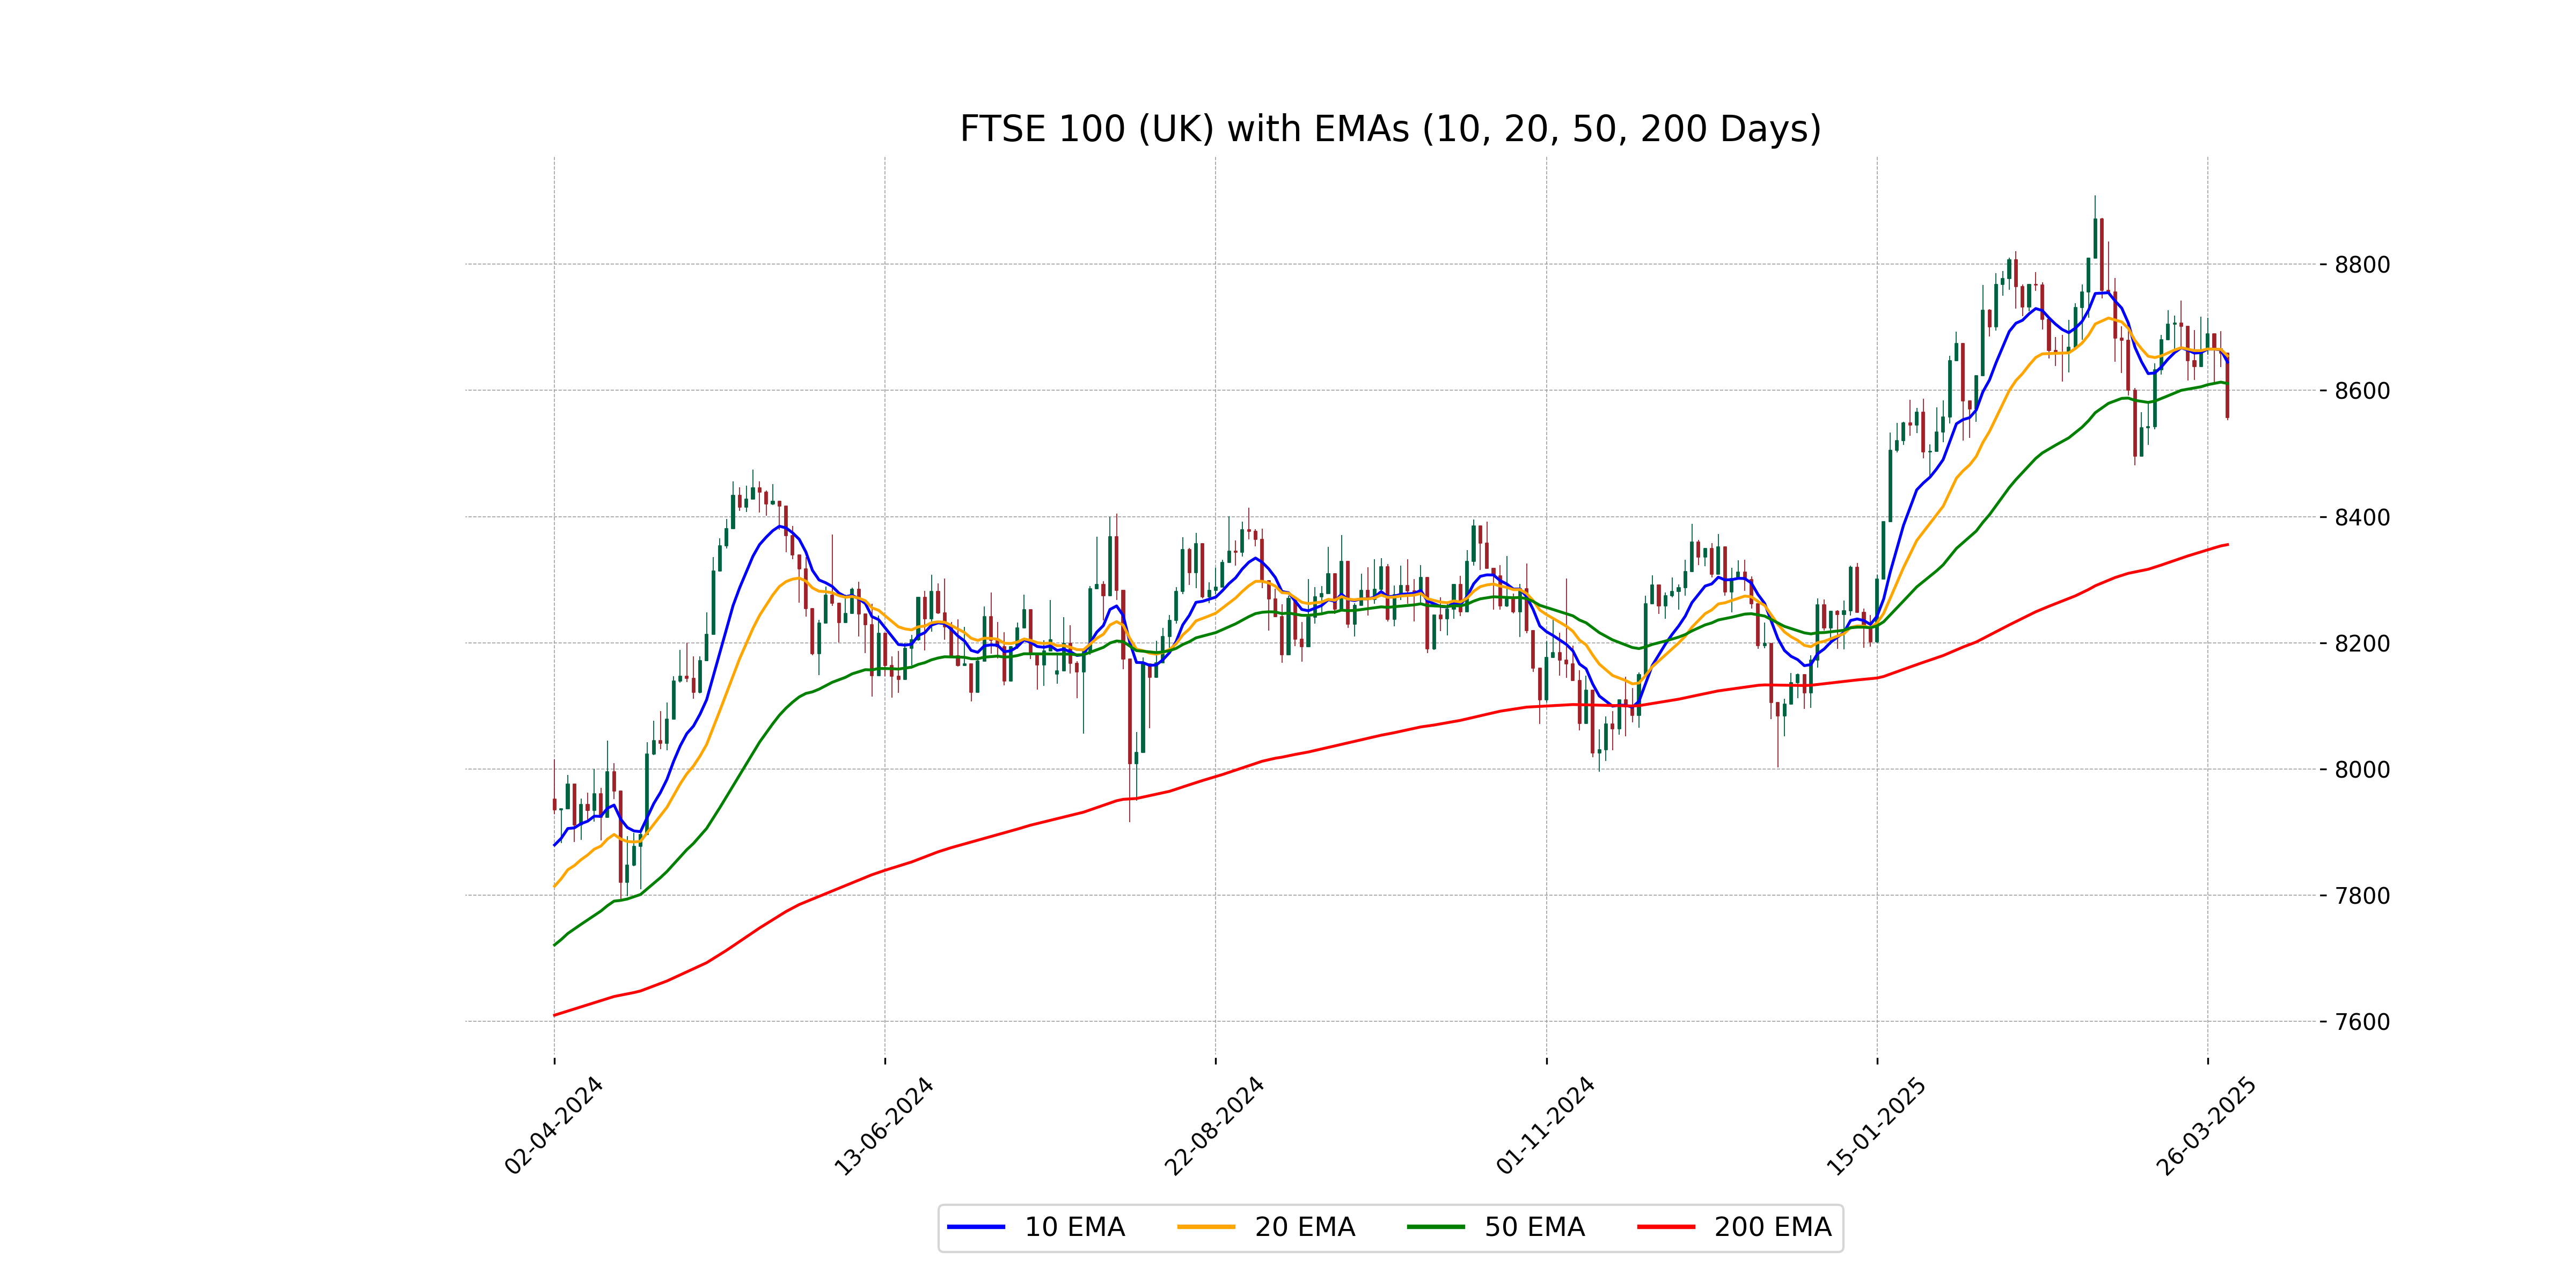
Relationship with Key Moving Averages
FTSE 100 (UK) closed below its 10-day, 20-day, and 50-day EMAs, indicating a short-term bearish trend. The price of 8557.11 is lower than the 50 EMA of 8610.95, 10 EMA of 8644.81, and 20 EMA of 8654.76, suggesting a negative momentum relative to these moving averages. The RSI of 40.52 also reflects weaker strength in the market.
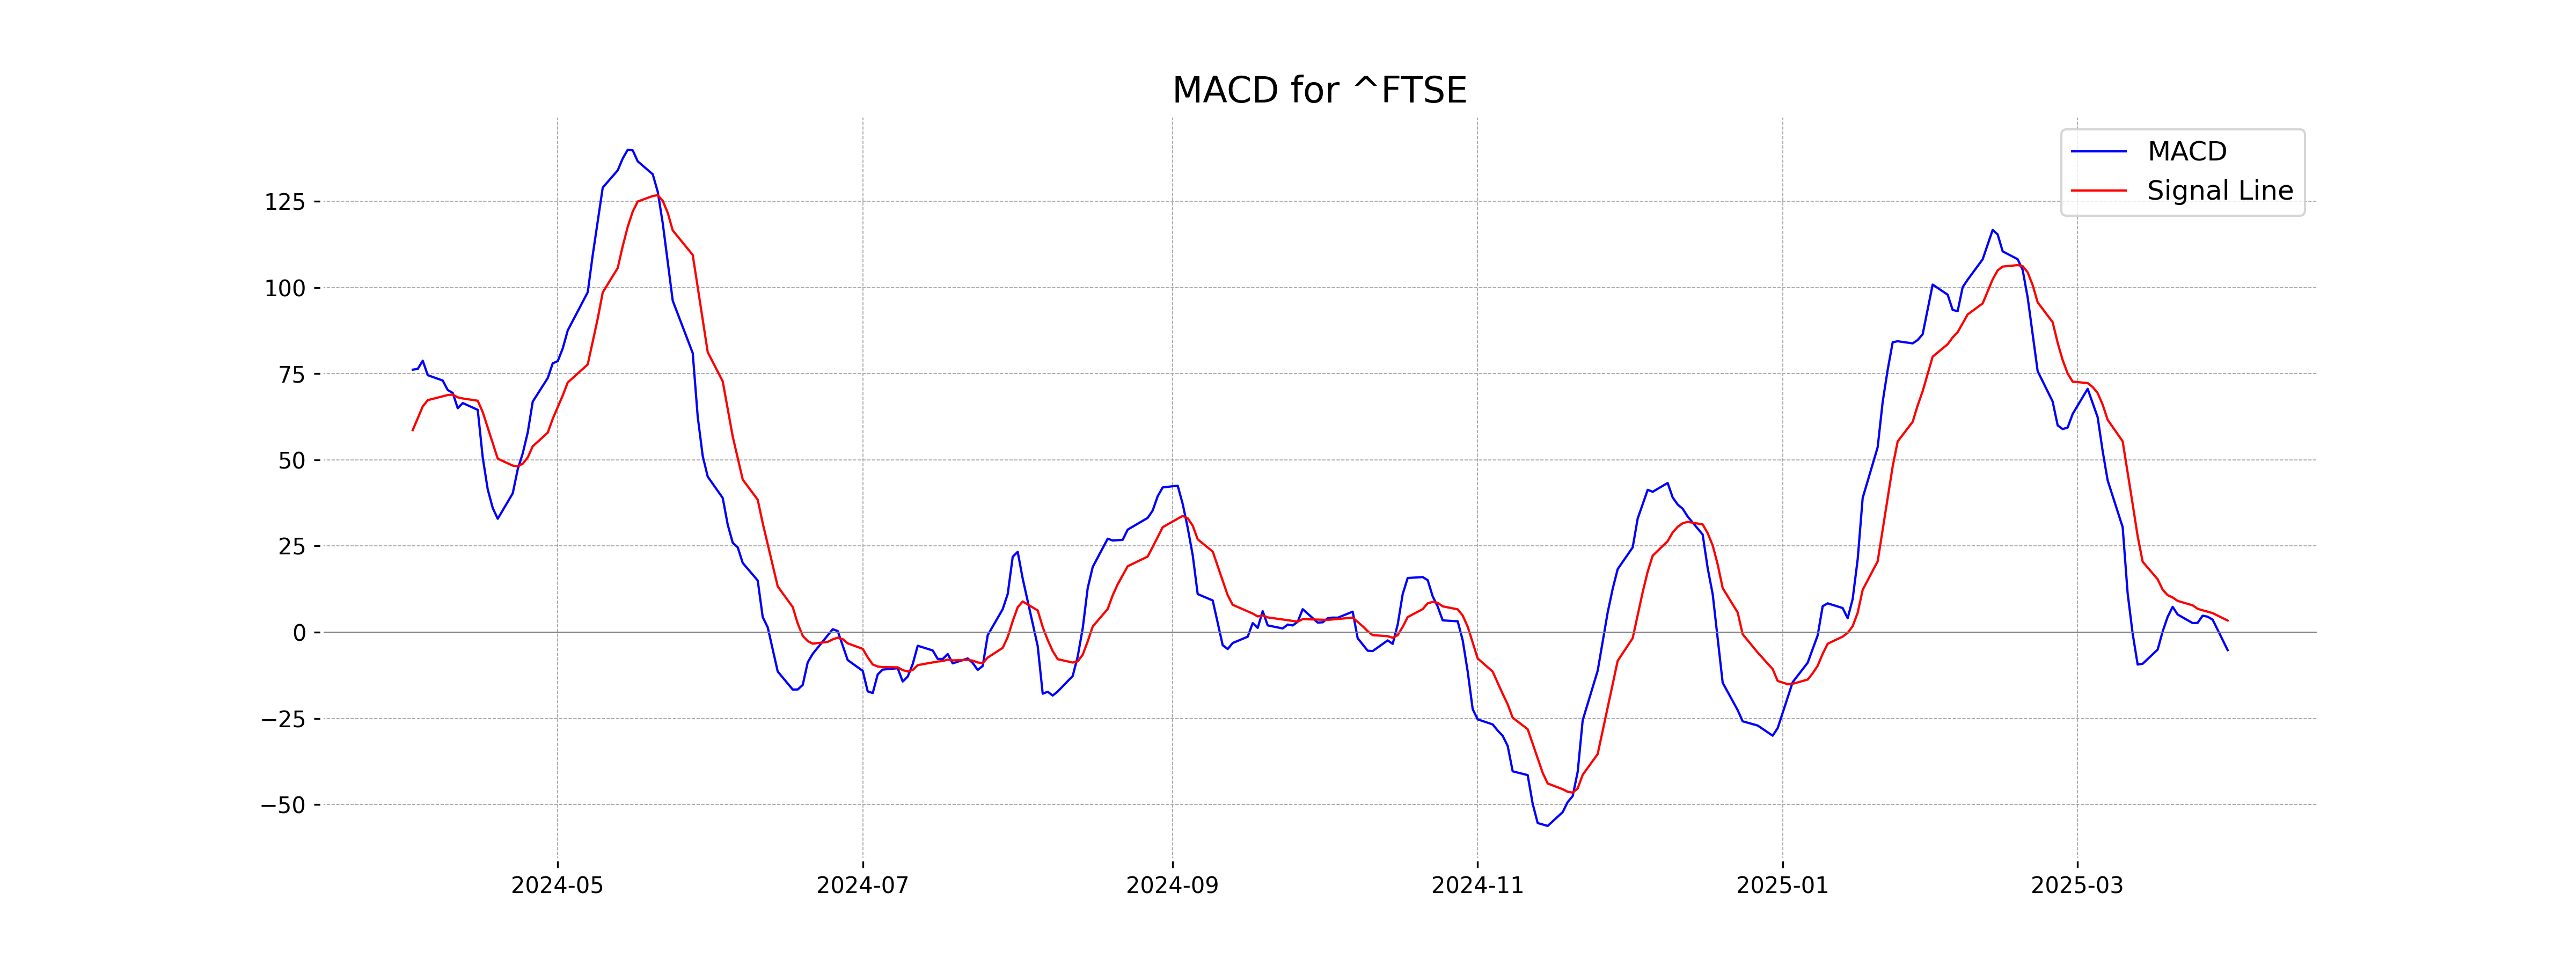
Moving Averages Trend (MACD)
FTSE 100 (UK) MACD Analysis: The MACD is currently at -5.20, below the Signal line of 3.38, indicating a bearish momentum. This suggests potential continued downward movement in the short term.
RSI Analysis
The current Relative Strength Index (RSI) for FTSE 100 is 40.52, indicating that the index is nearing an oversold condition as it approaches the 30-mark threshold. This suggests increased selling pressure and potential undervaluation, which might lead to a possible reversal or consolidation phase.
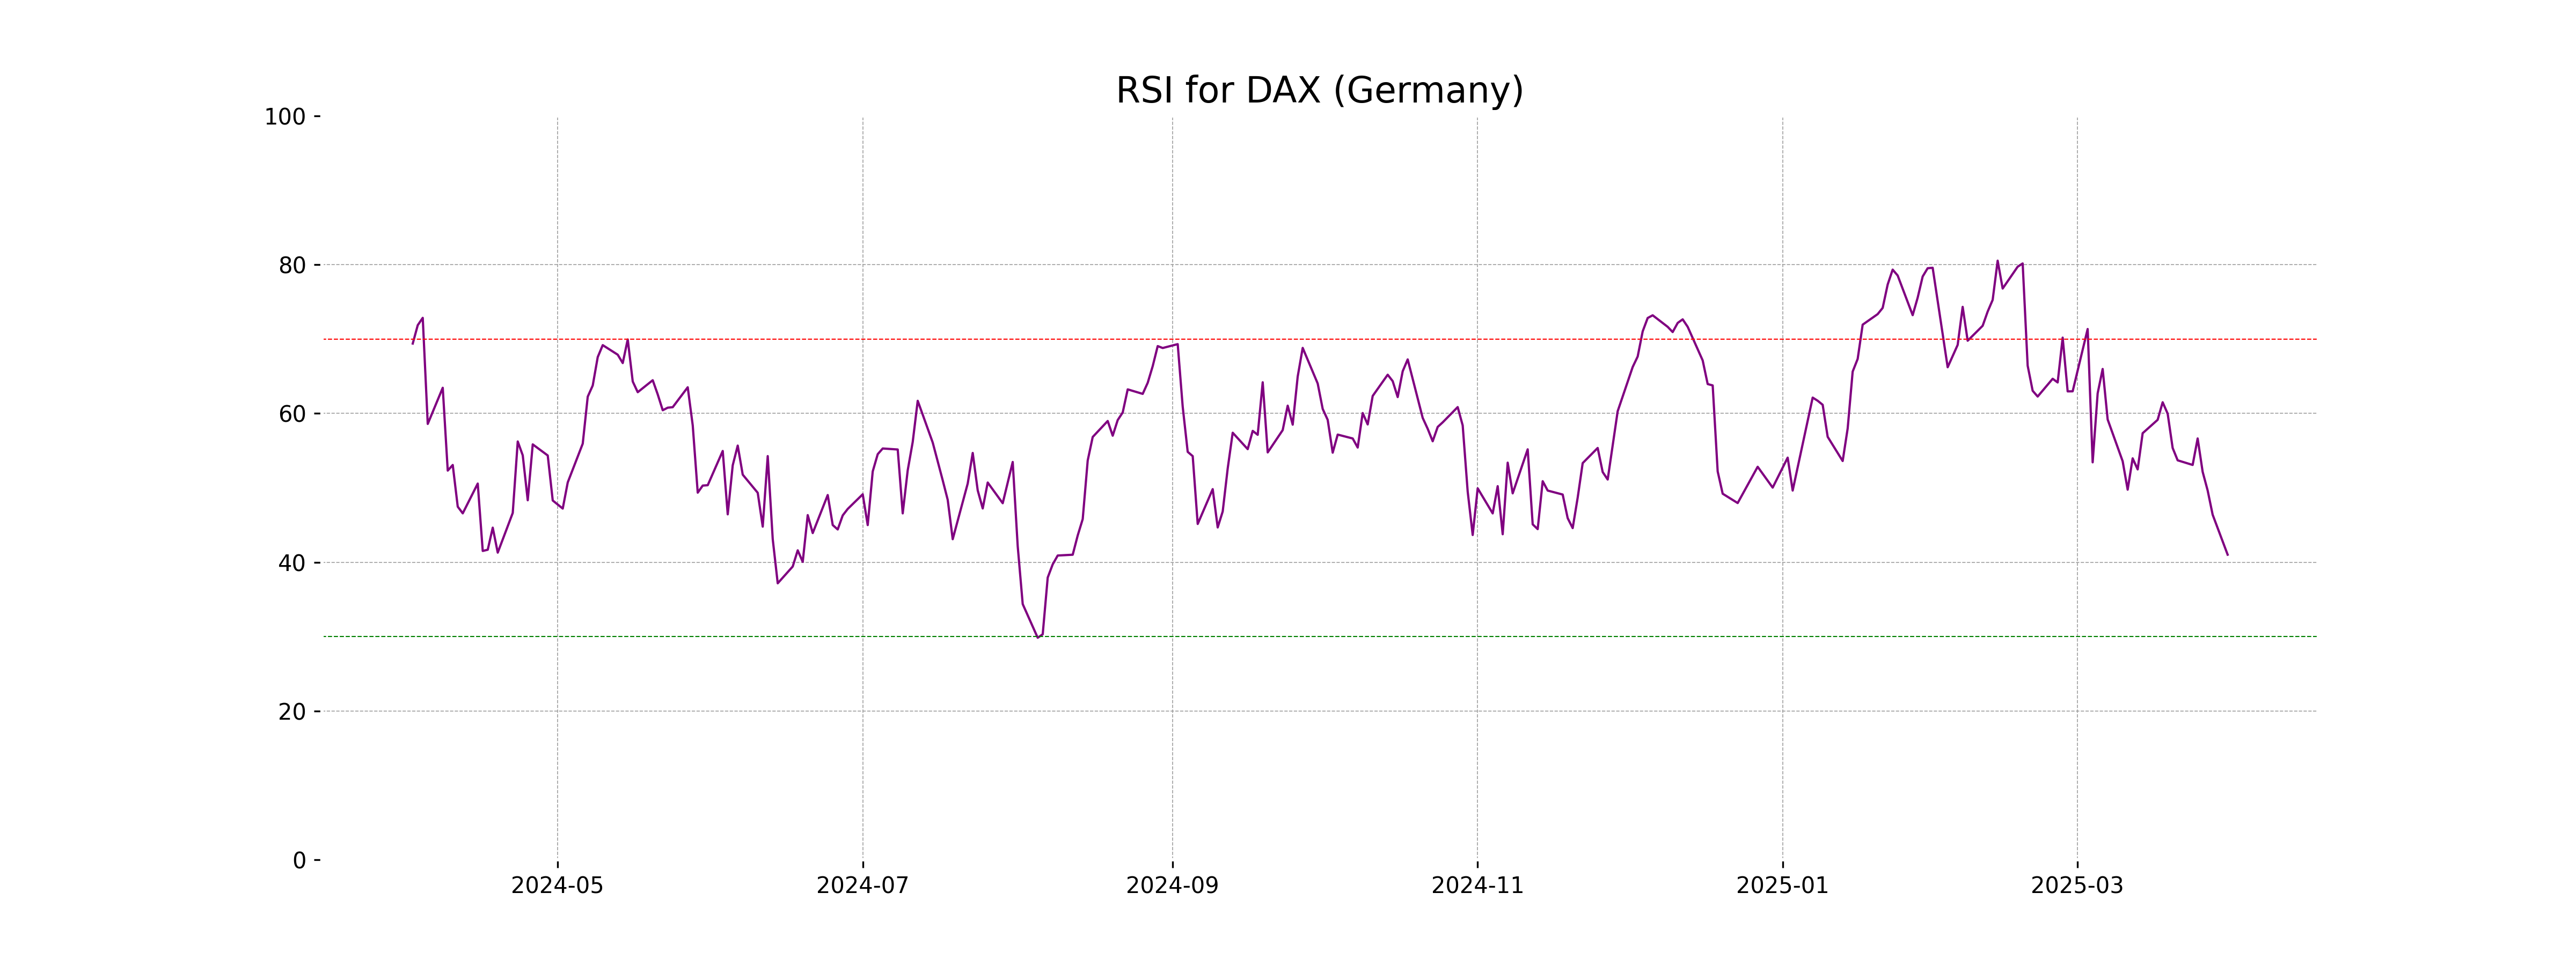
Analysis for DAX (Germany) - March 31, 2025
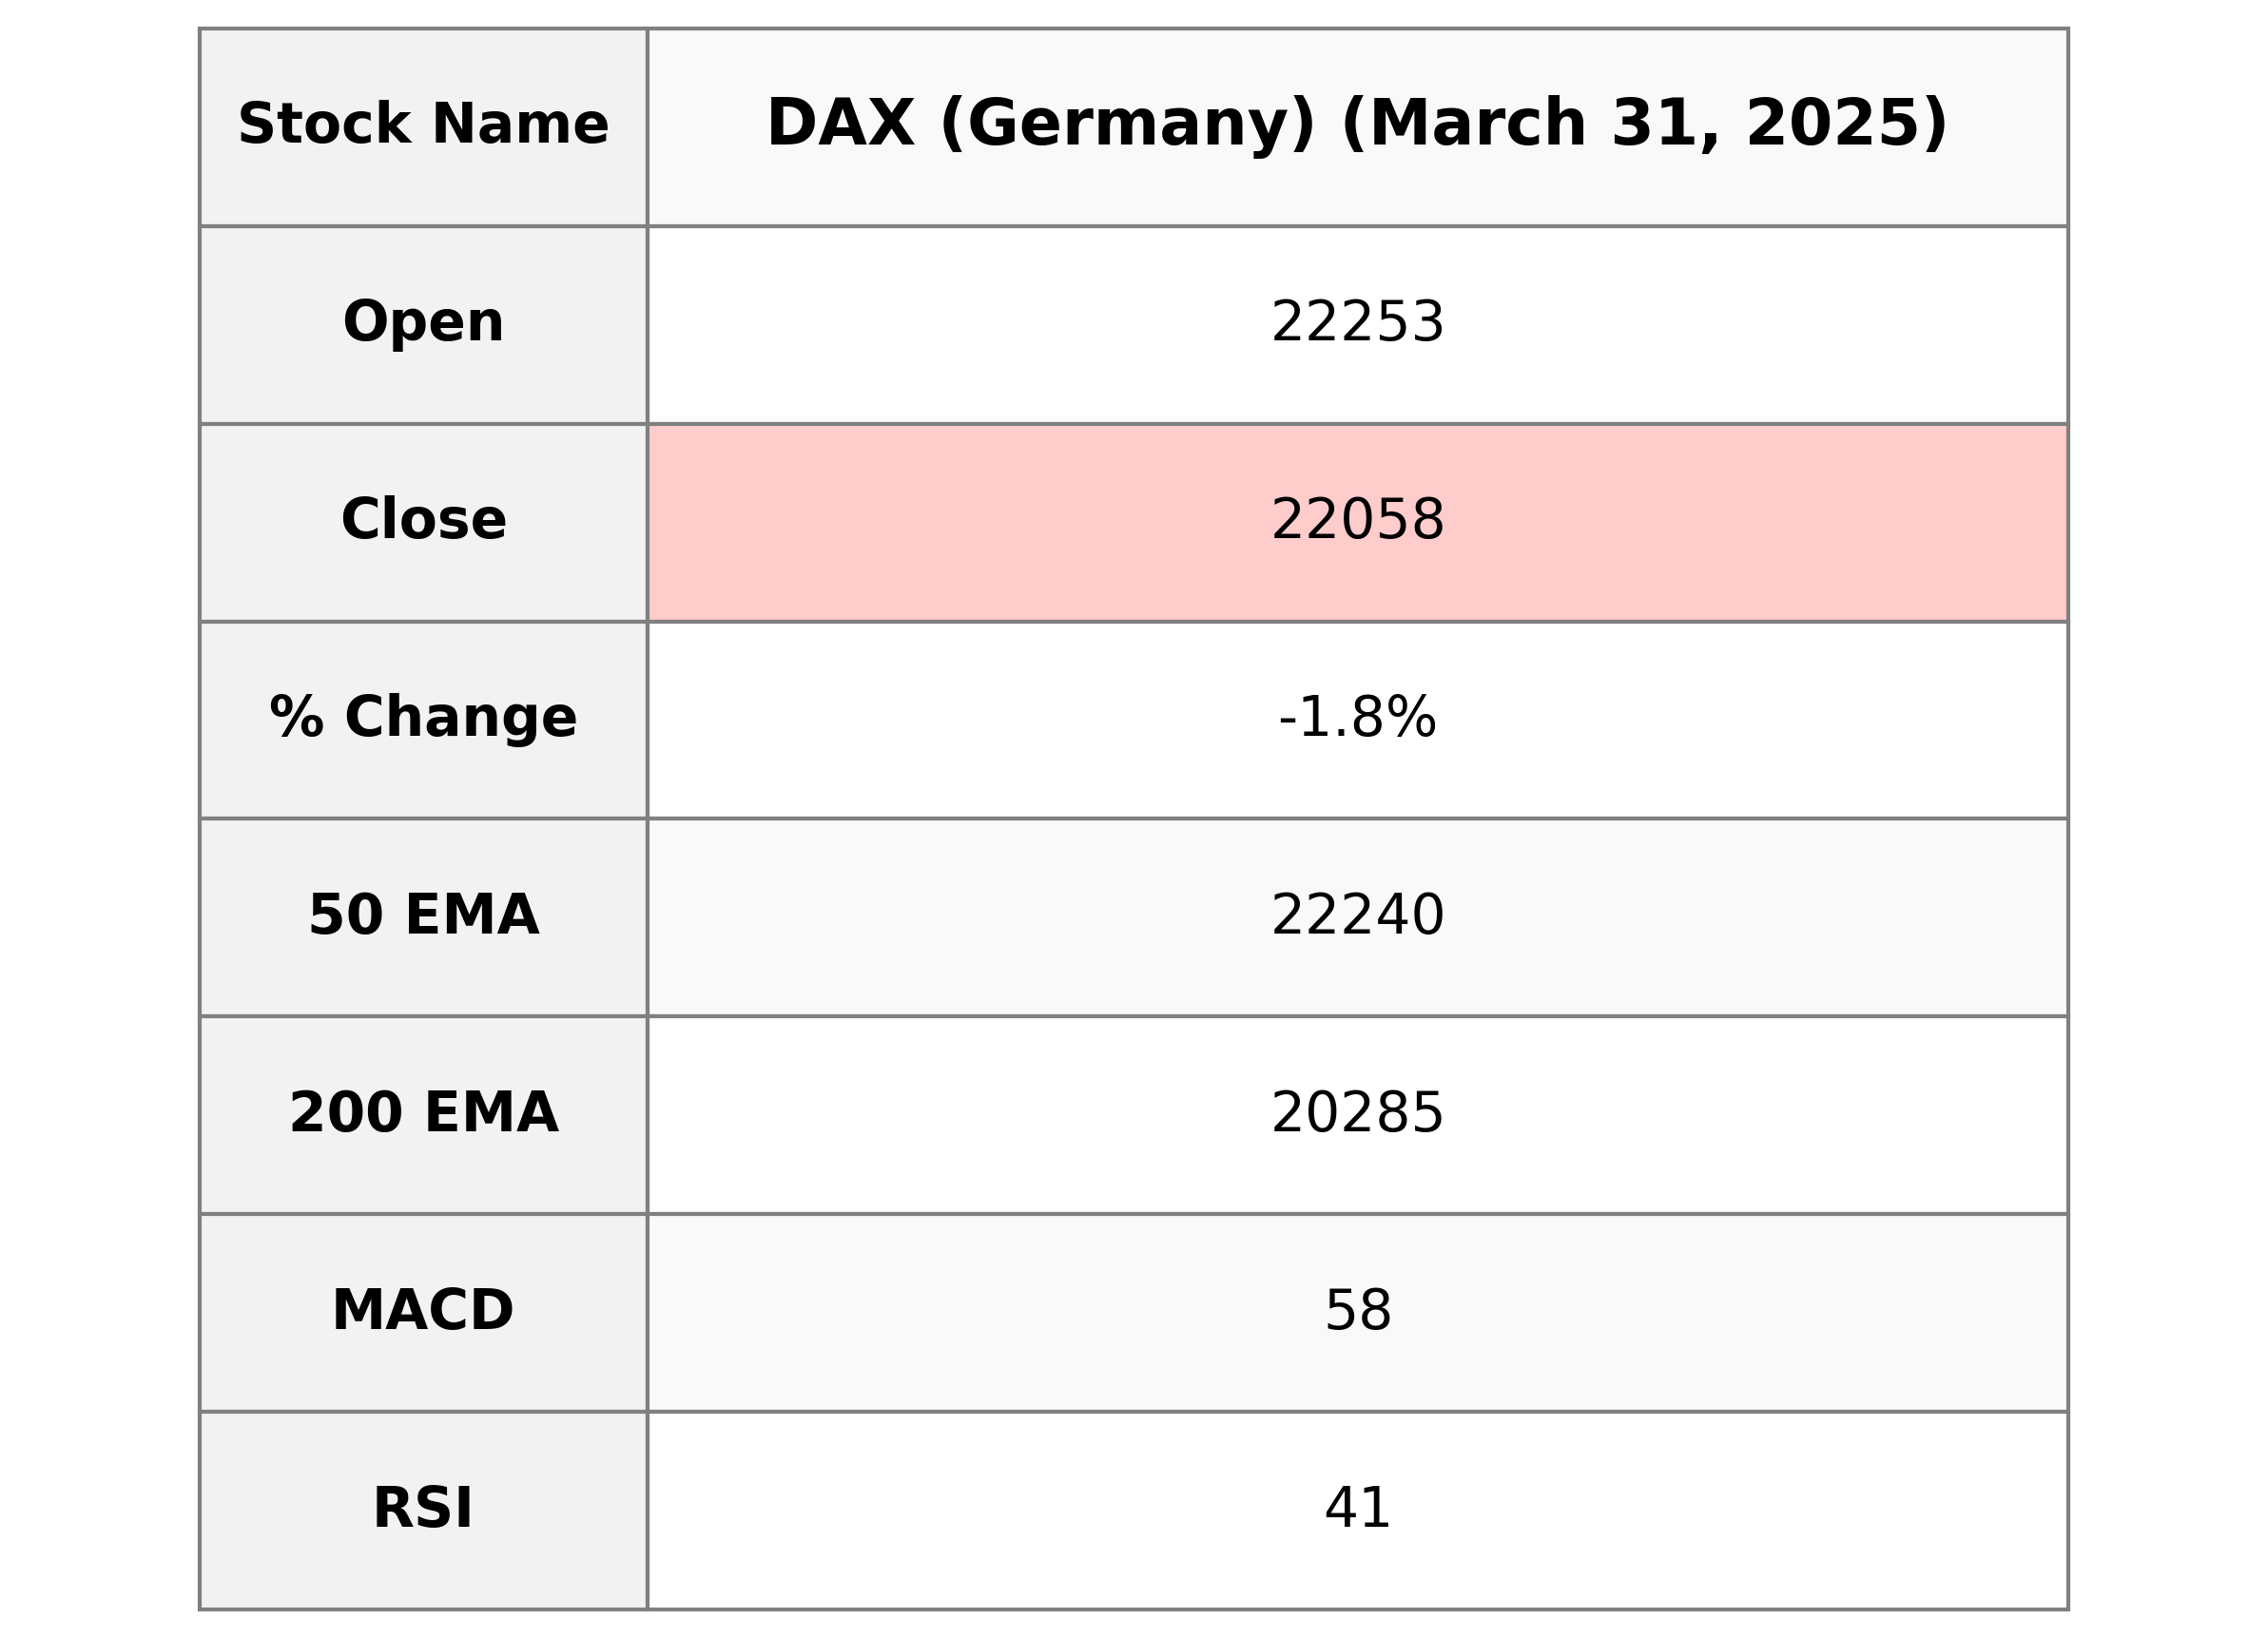
The DAX index opened at 22,253.05 and closed at 22,058.26, marking a significant decrease with a percentage change of -1.80% and a points change of -403.26. The index's RSI is at 41.01, indicating a slight bearish momentum, while the MACD is positive but below the MACD Signal, suggesting potential weakness. Current moving averages suggest a price trending below recent averages, with the 10 EMA and 20 EMA above the 50 EMA.
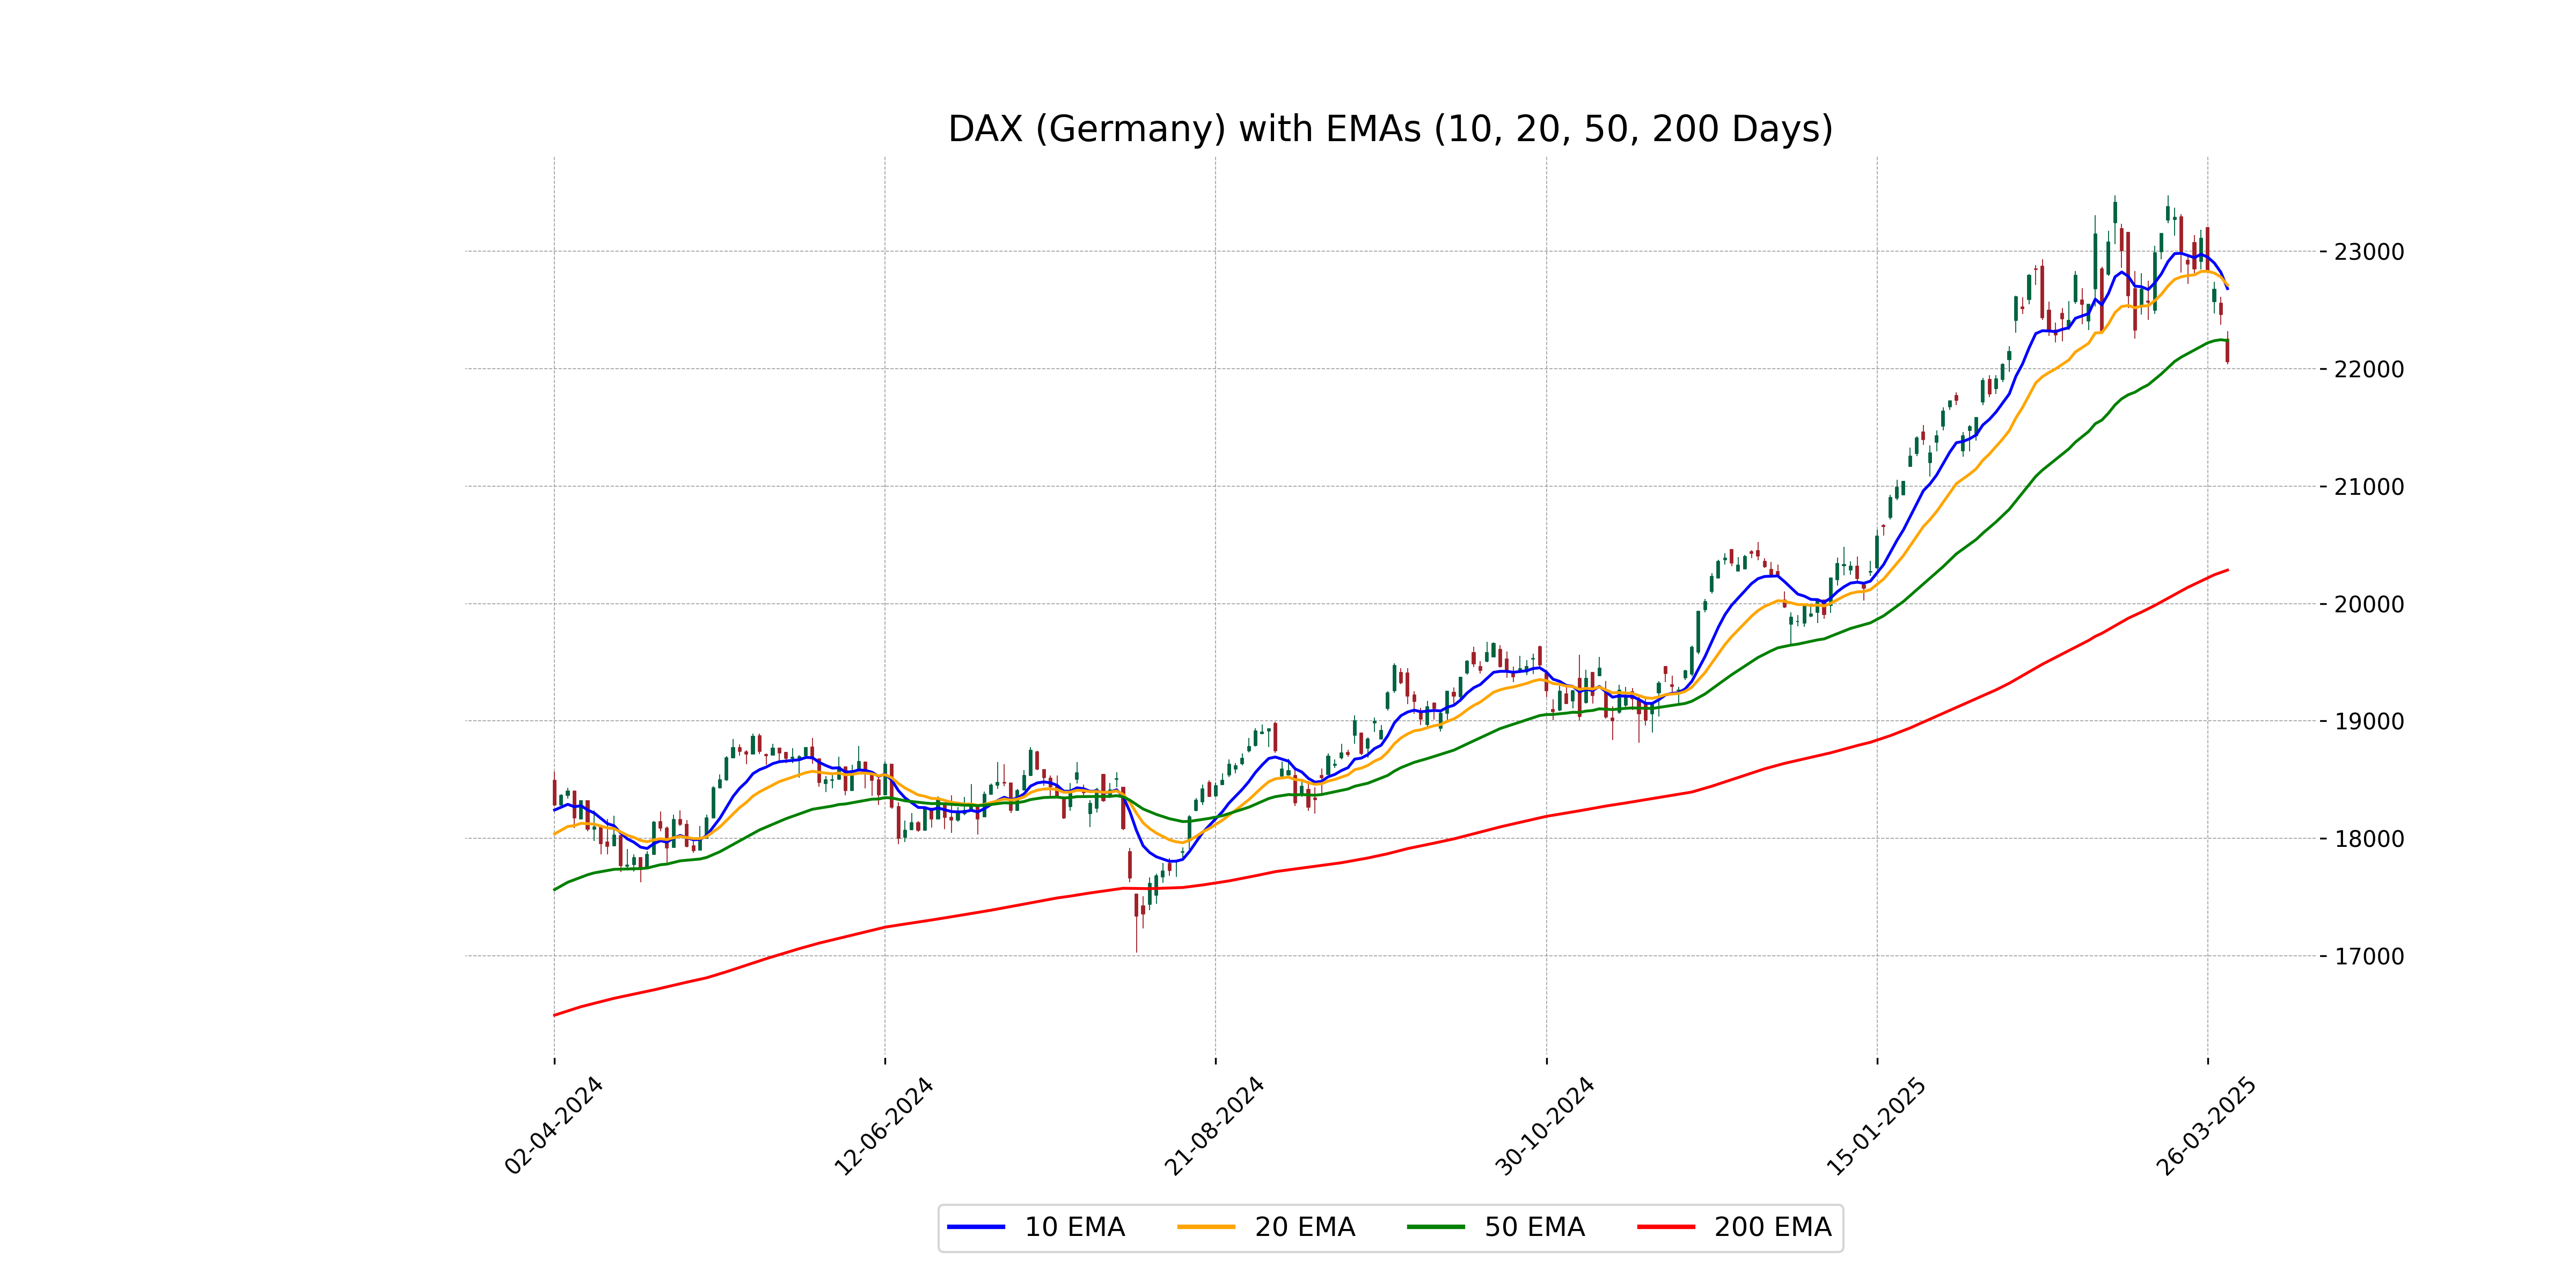
Relationship with Key Moving Averages
The DAX (Germany) index closed at 22058.26, which is below its 50-day EMA of 22240.24, and significantly below its 10-day EMA of 22682.88, indicating potential short- to medium-term bearish momentum. The index is still above its 200-day EMA of 20284.77, suggesting a longer-term bullish trend despite recent declines. The % change of -1.80% also indicates a significant downward movement from the previous close.
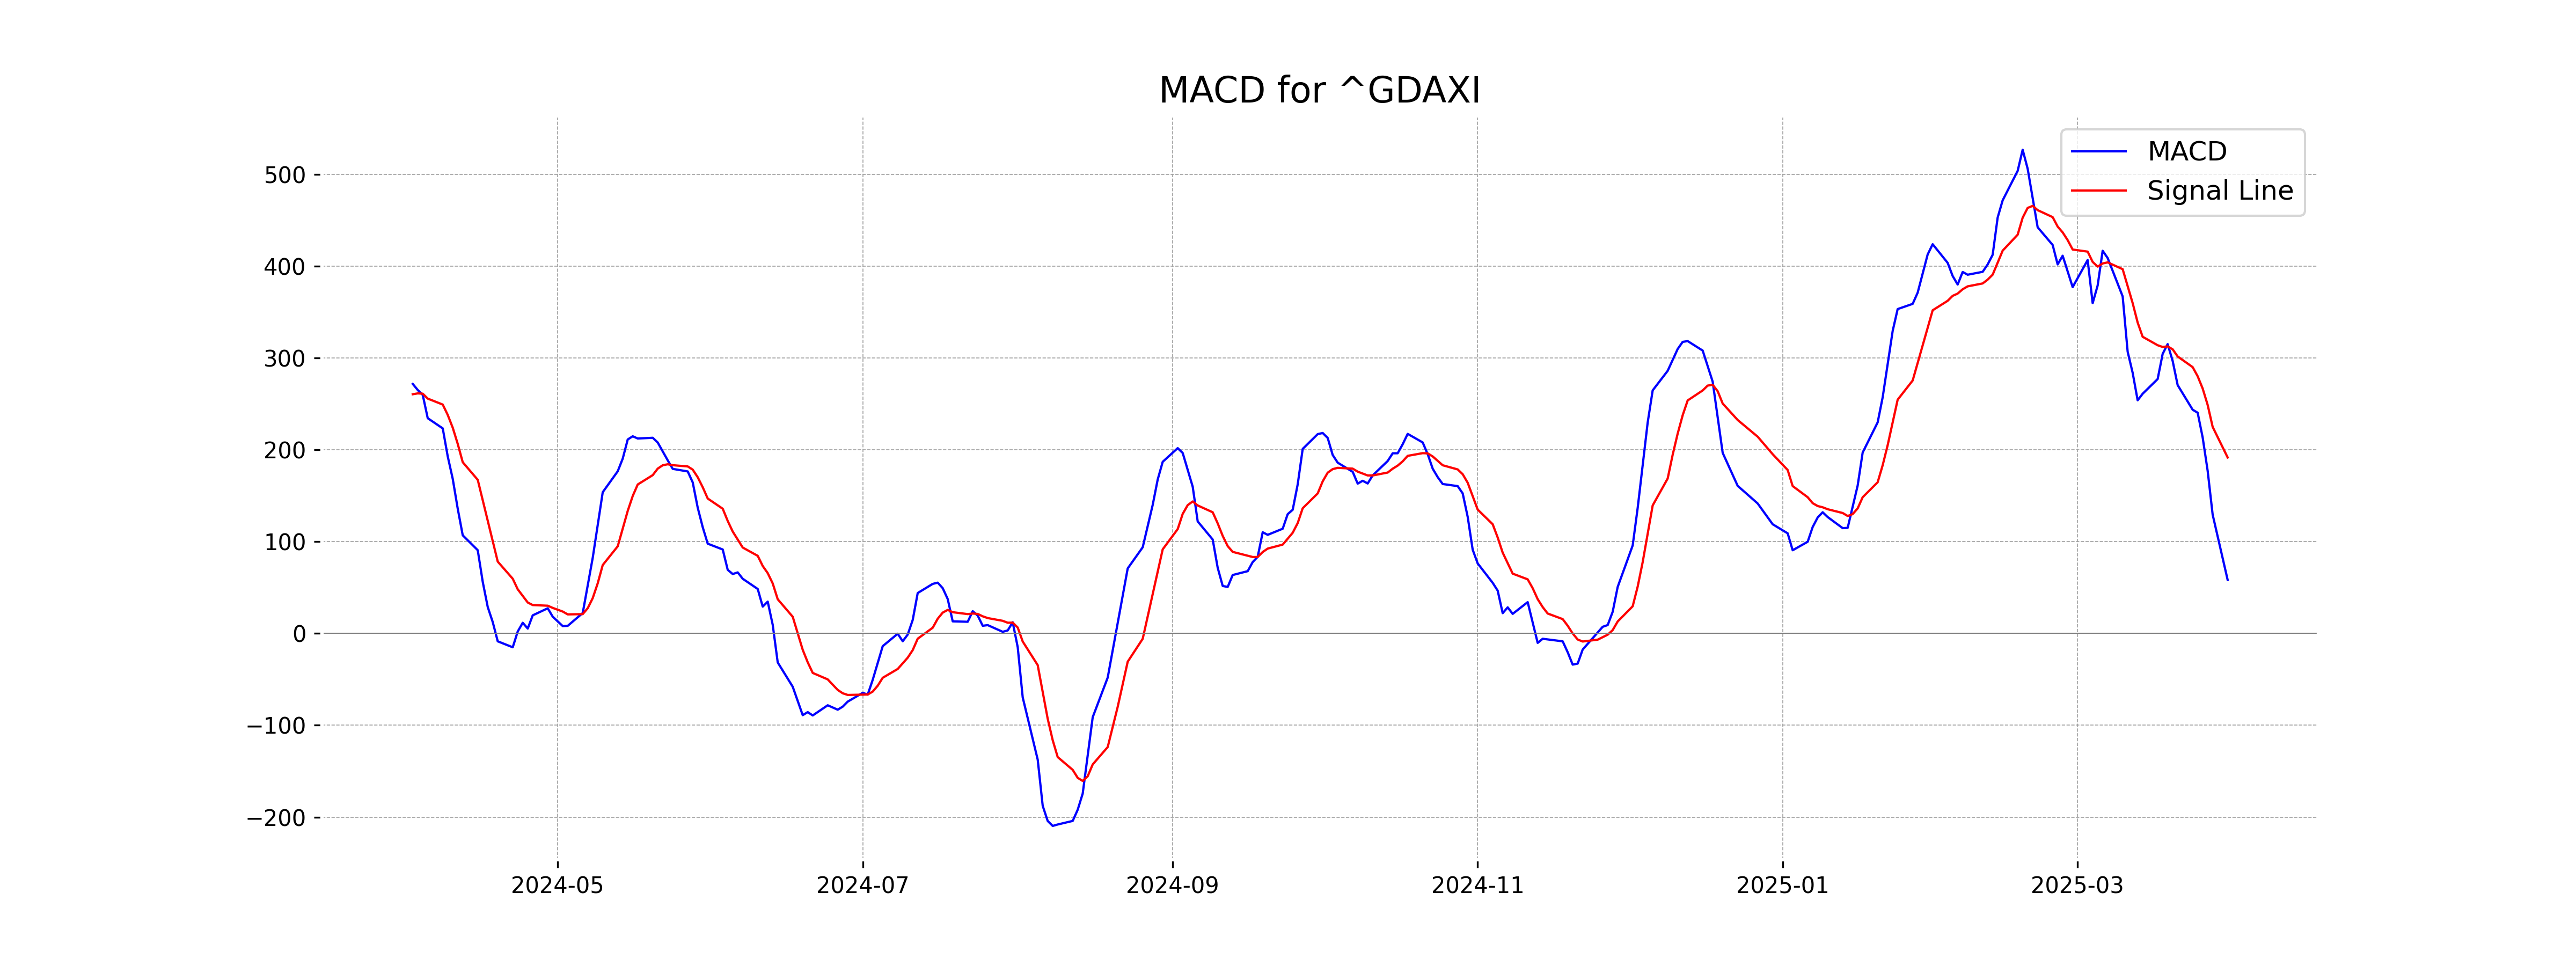
Moving Averages Trend (MACD)
The MACD value for DAX is 58.28, which is below the MACD Signal of 191.58. This suggests a bearish trend, indicating potential downward momentum in the market.
RSI Analysis
The RSI for DAX (Germany) is 41.01, which is below the neutral level of 50. This suggests that the index may be approaching oversold conditions, indicating potential buying opportunities if the trend reverses.
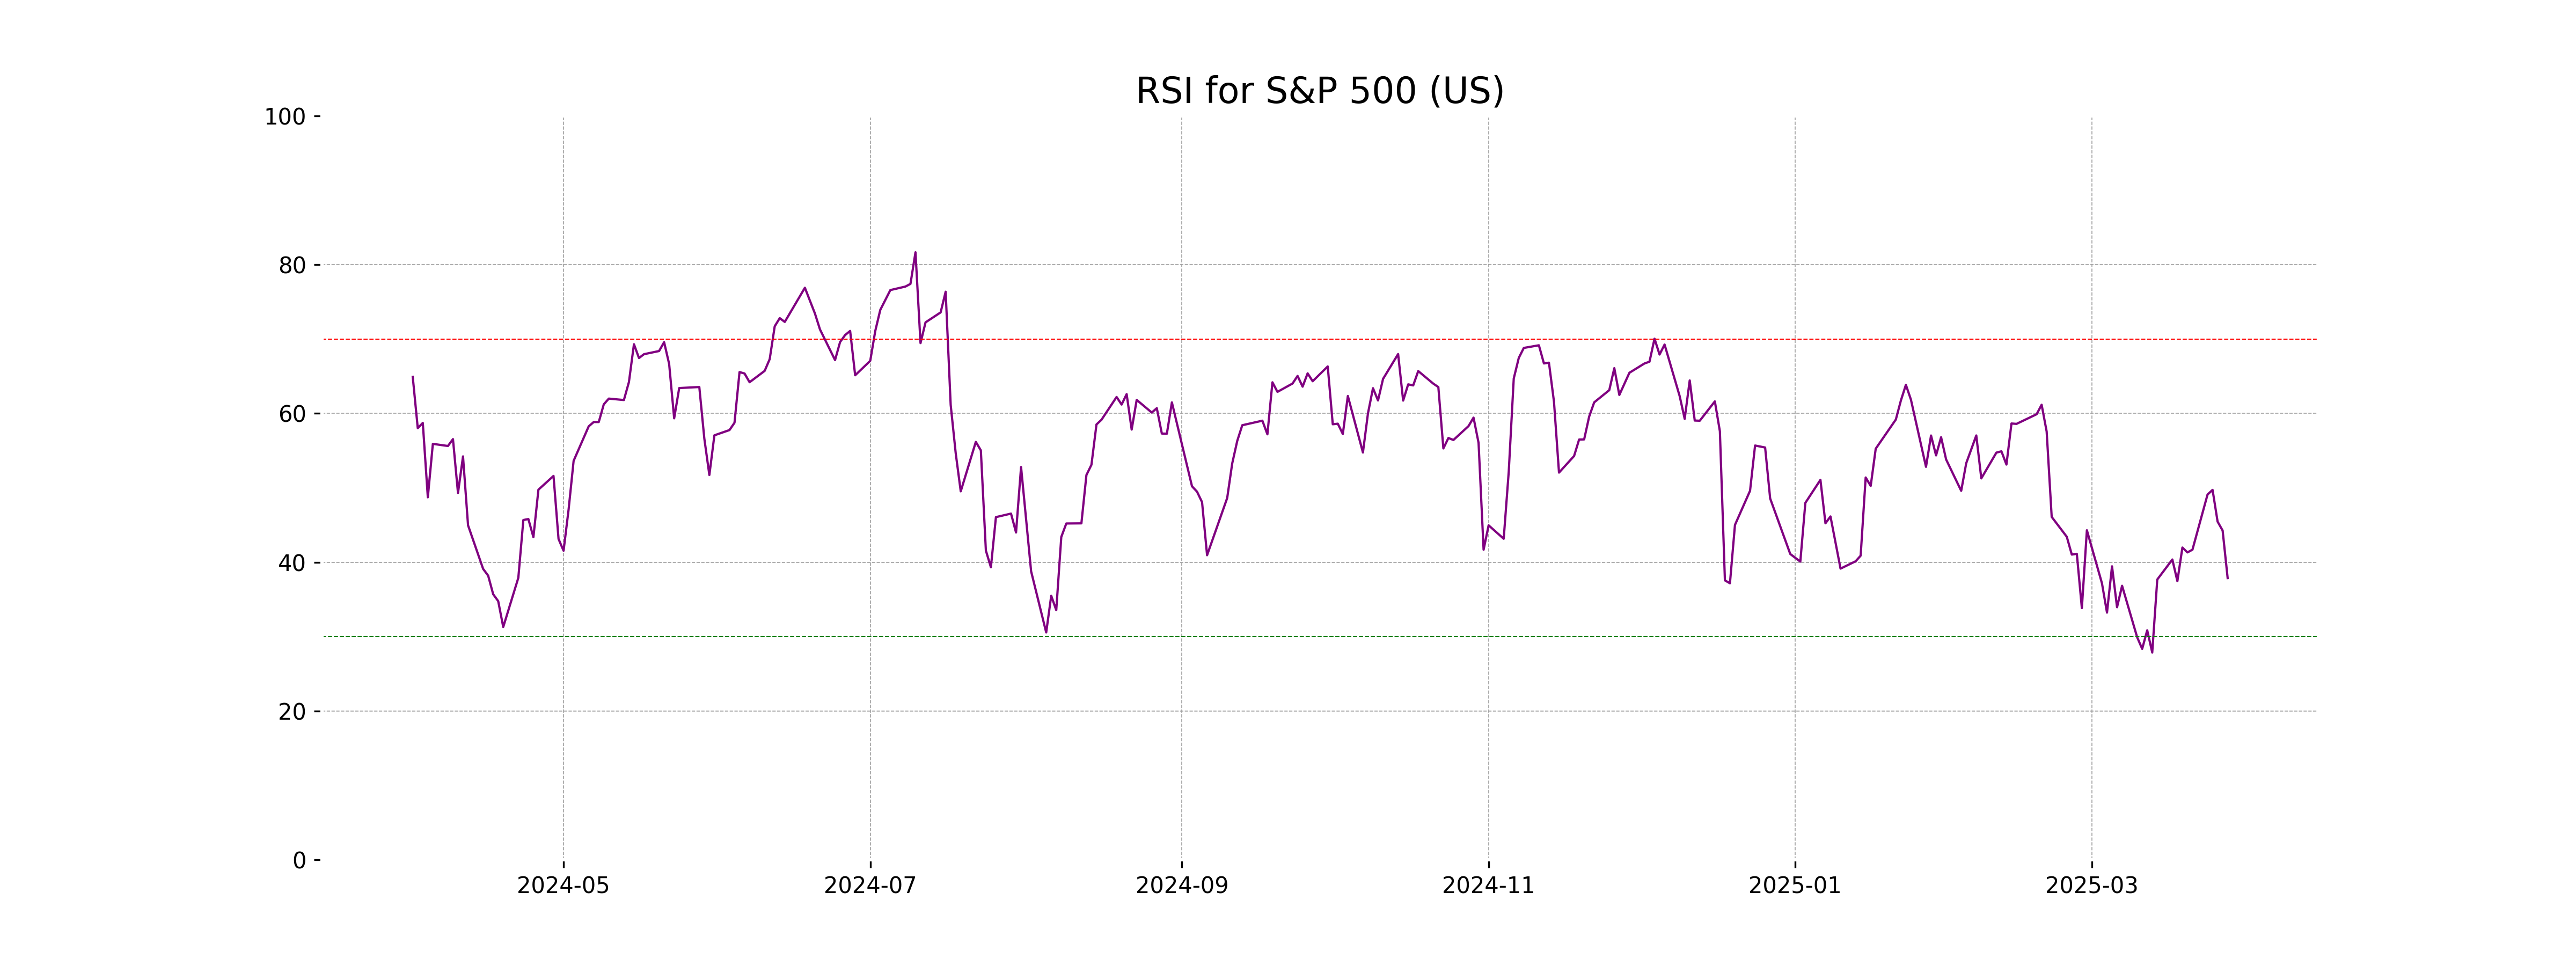
Analysis for S&P 500 (US) - March 31, 2025
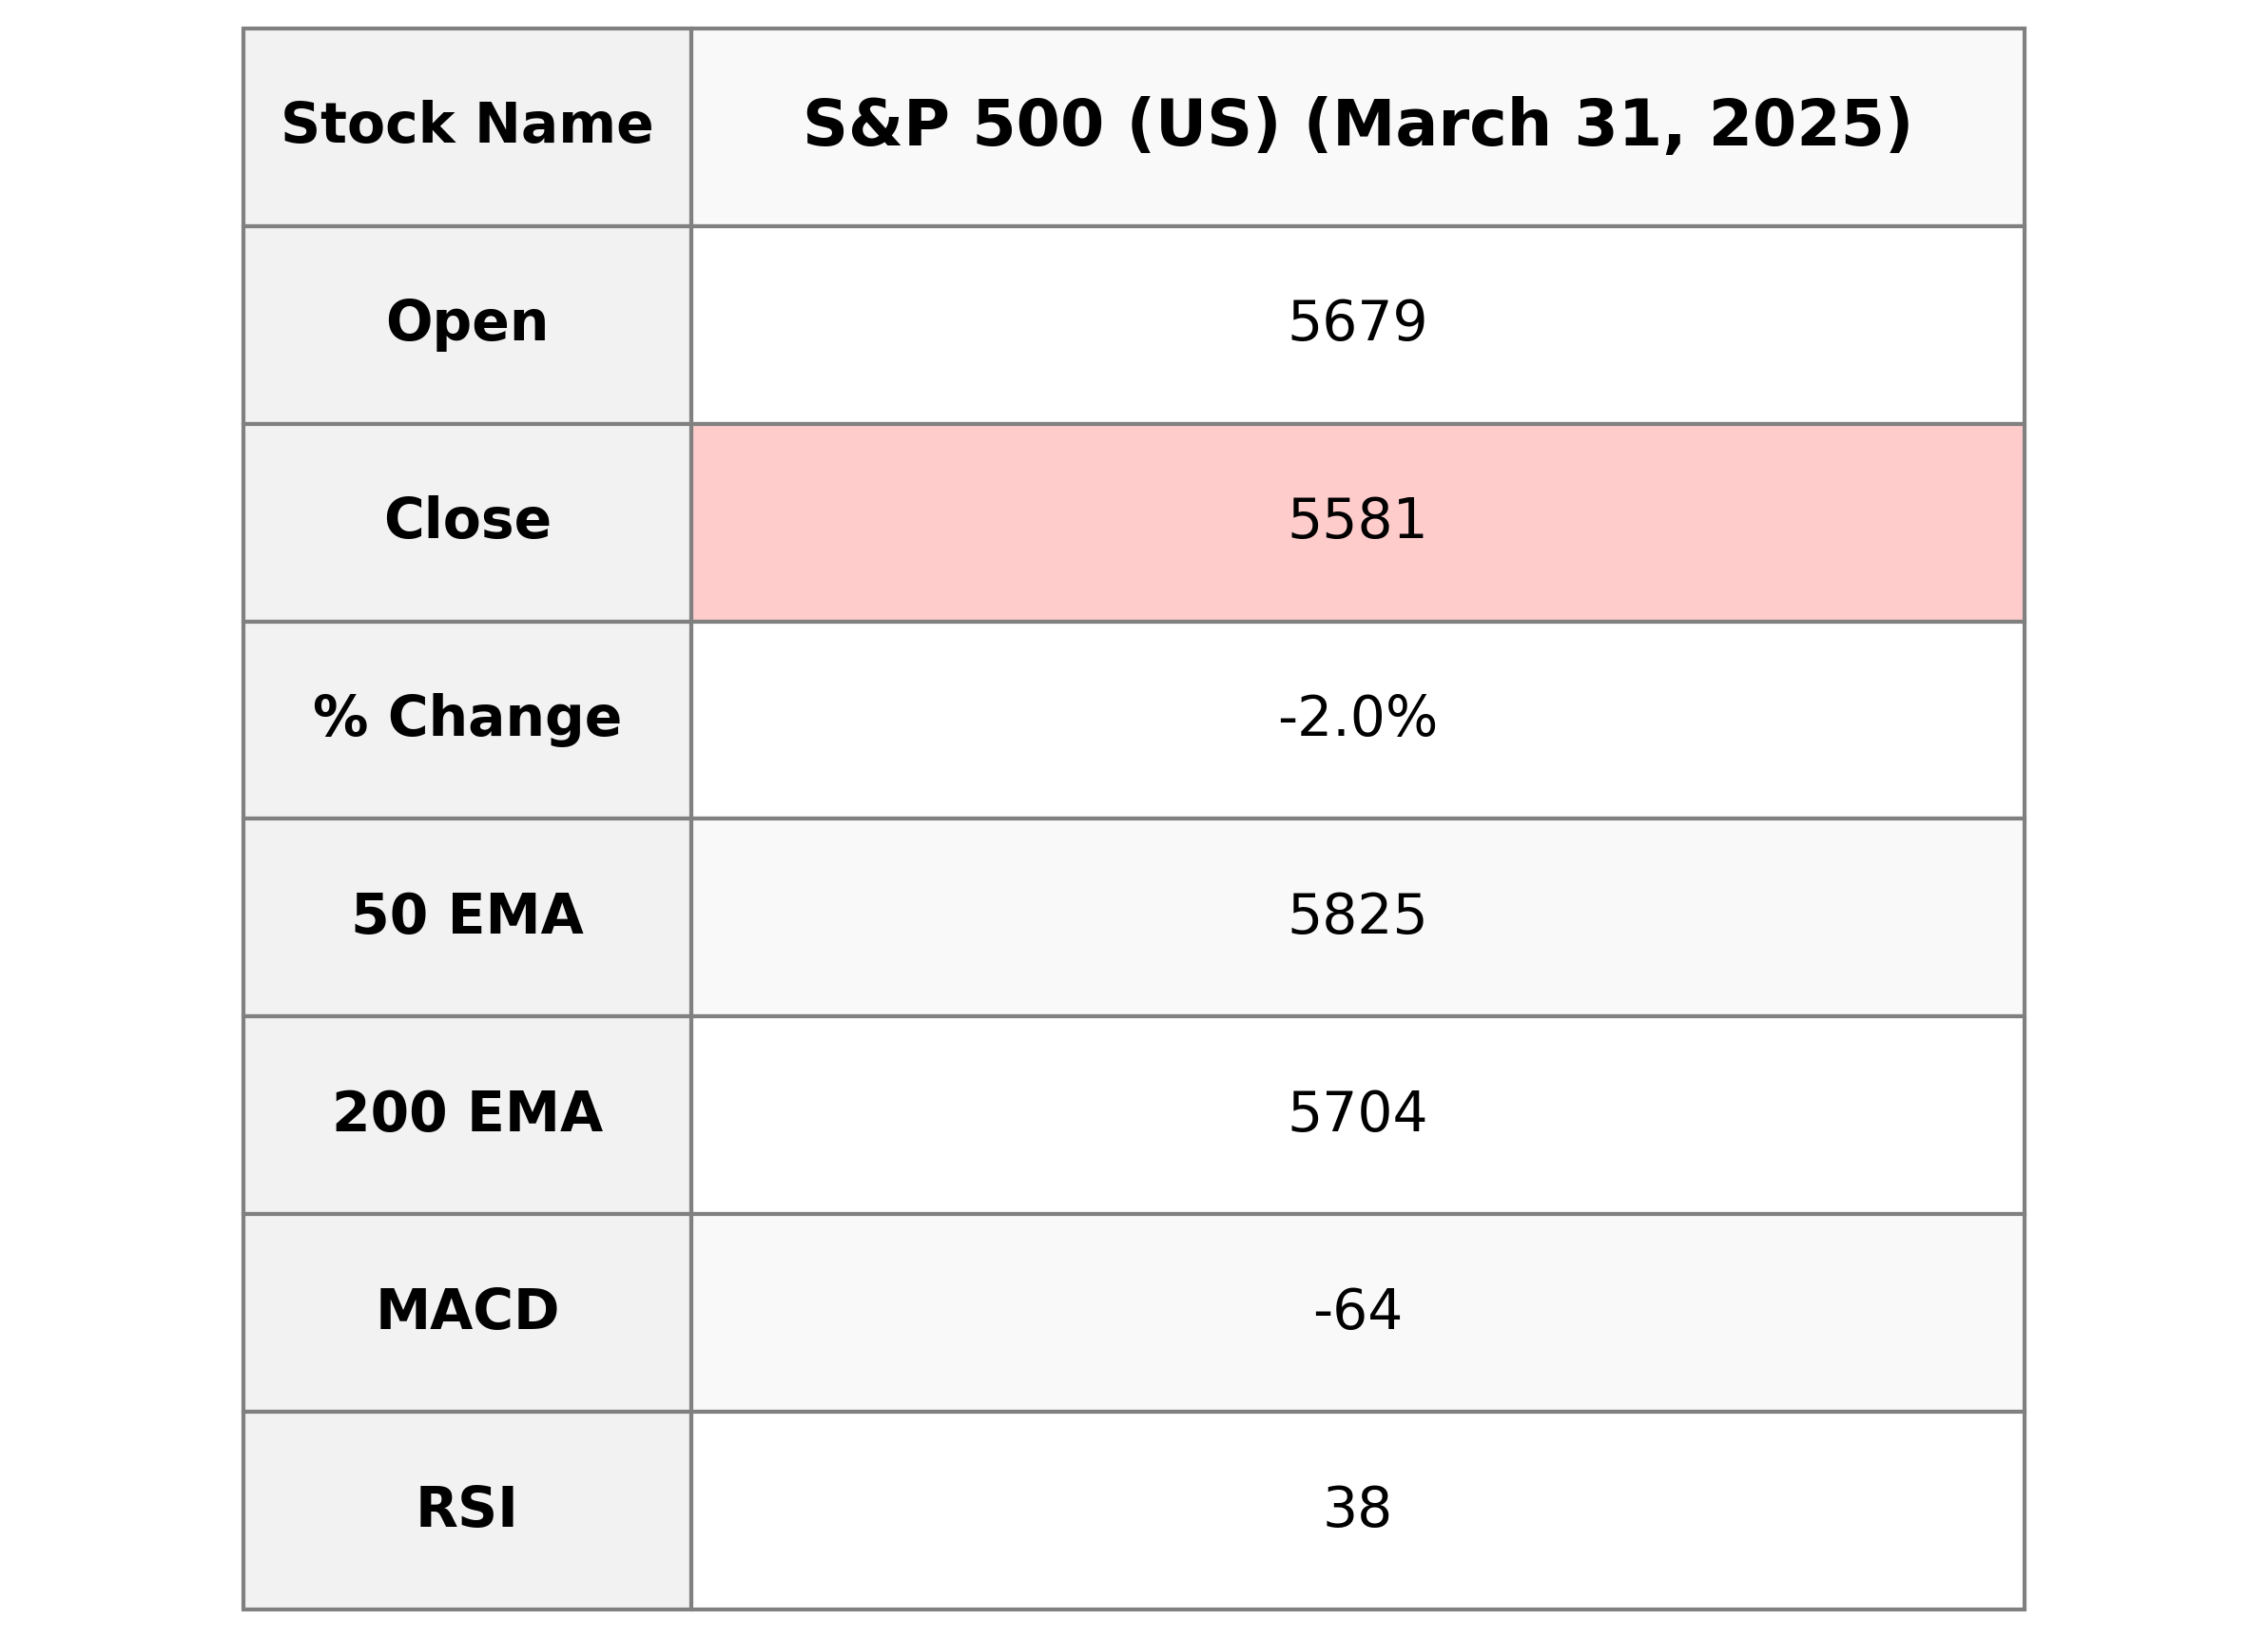
S&P 500 (US) opened at 5679.20 and closed at 5580.94, indicating a decrease of 1.97% or 112.37 points from the previous close of 5693.31. The trading volume was 4,513,330,000, while the index's RSI is at 37.86, suggesting weaker momentum.
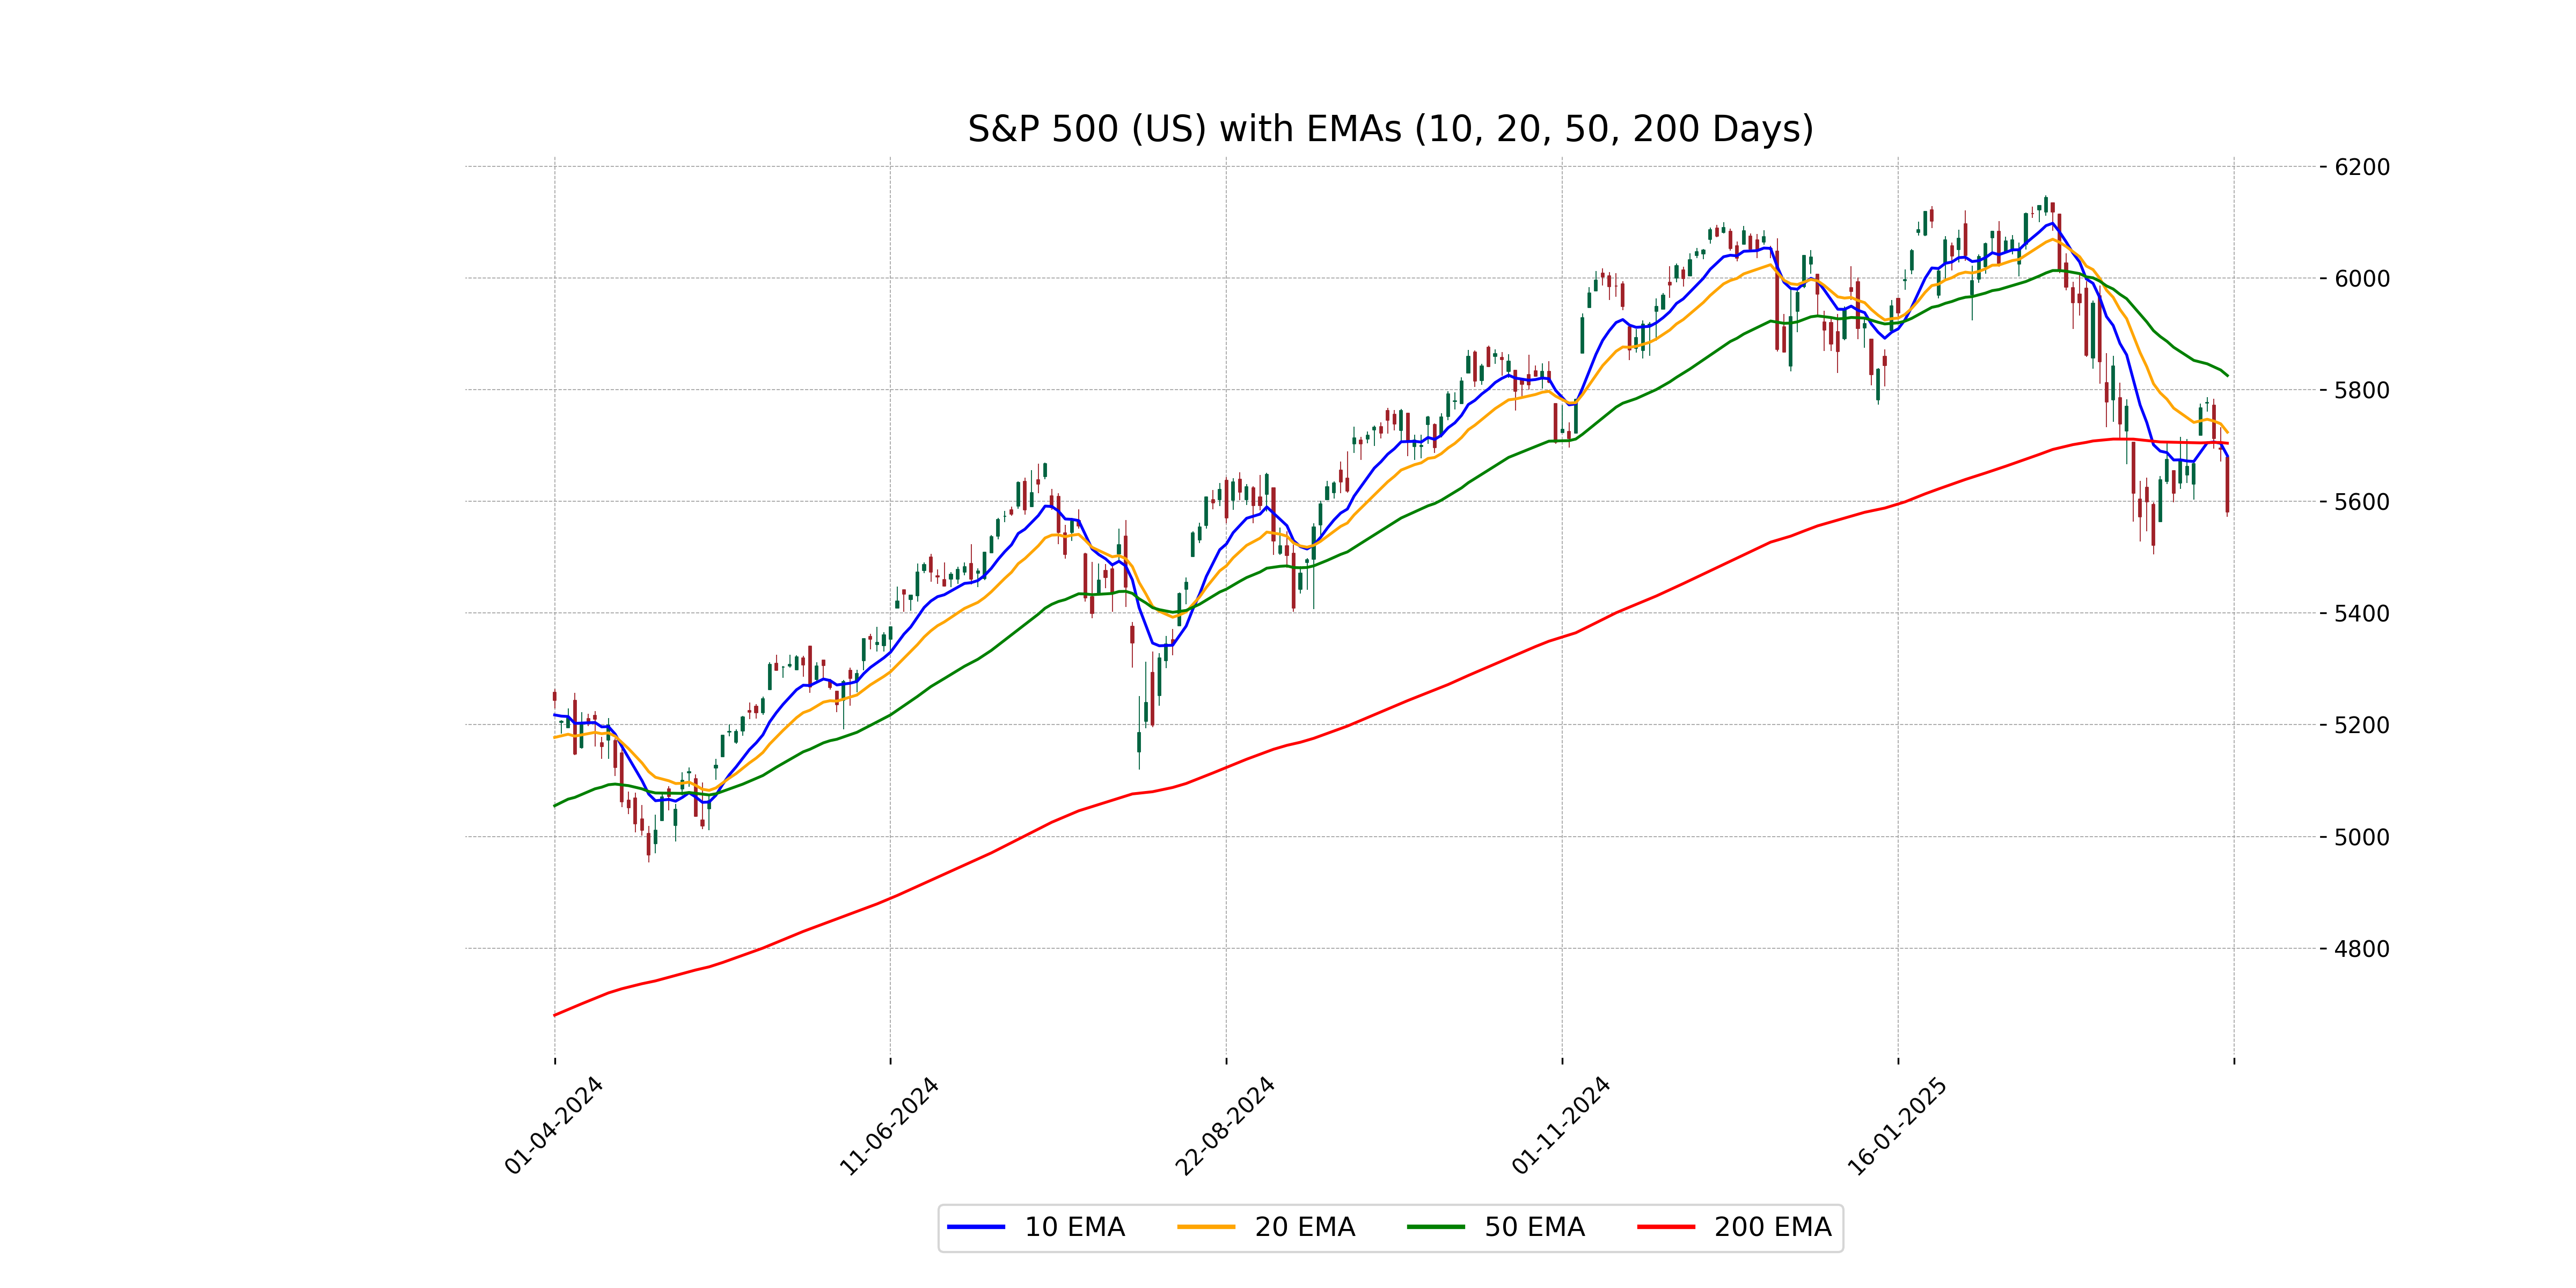
Relationship with Key Moving Averages
The S&P 500 closed below key moving averages, such as the 50 EMA (5825.15), 200 EMA (5704.04), 10 EMA (5681.47), and 20 EMA (5723.76), indicating a bearish trend. The close of 5580.94, coupled with an RSI of 37.86, suggests potential oversold conditions.
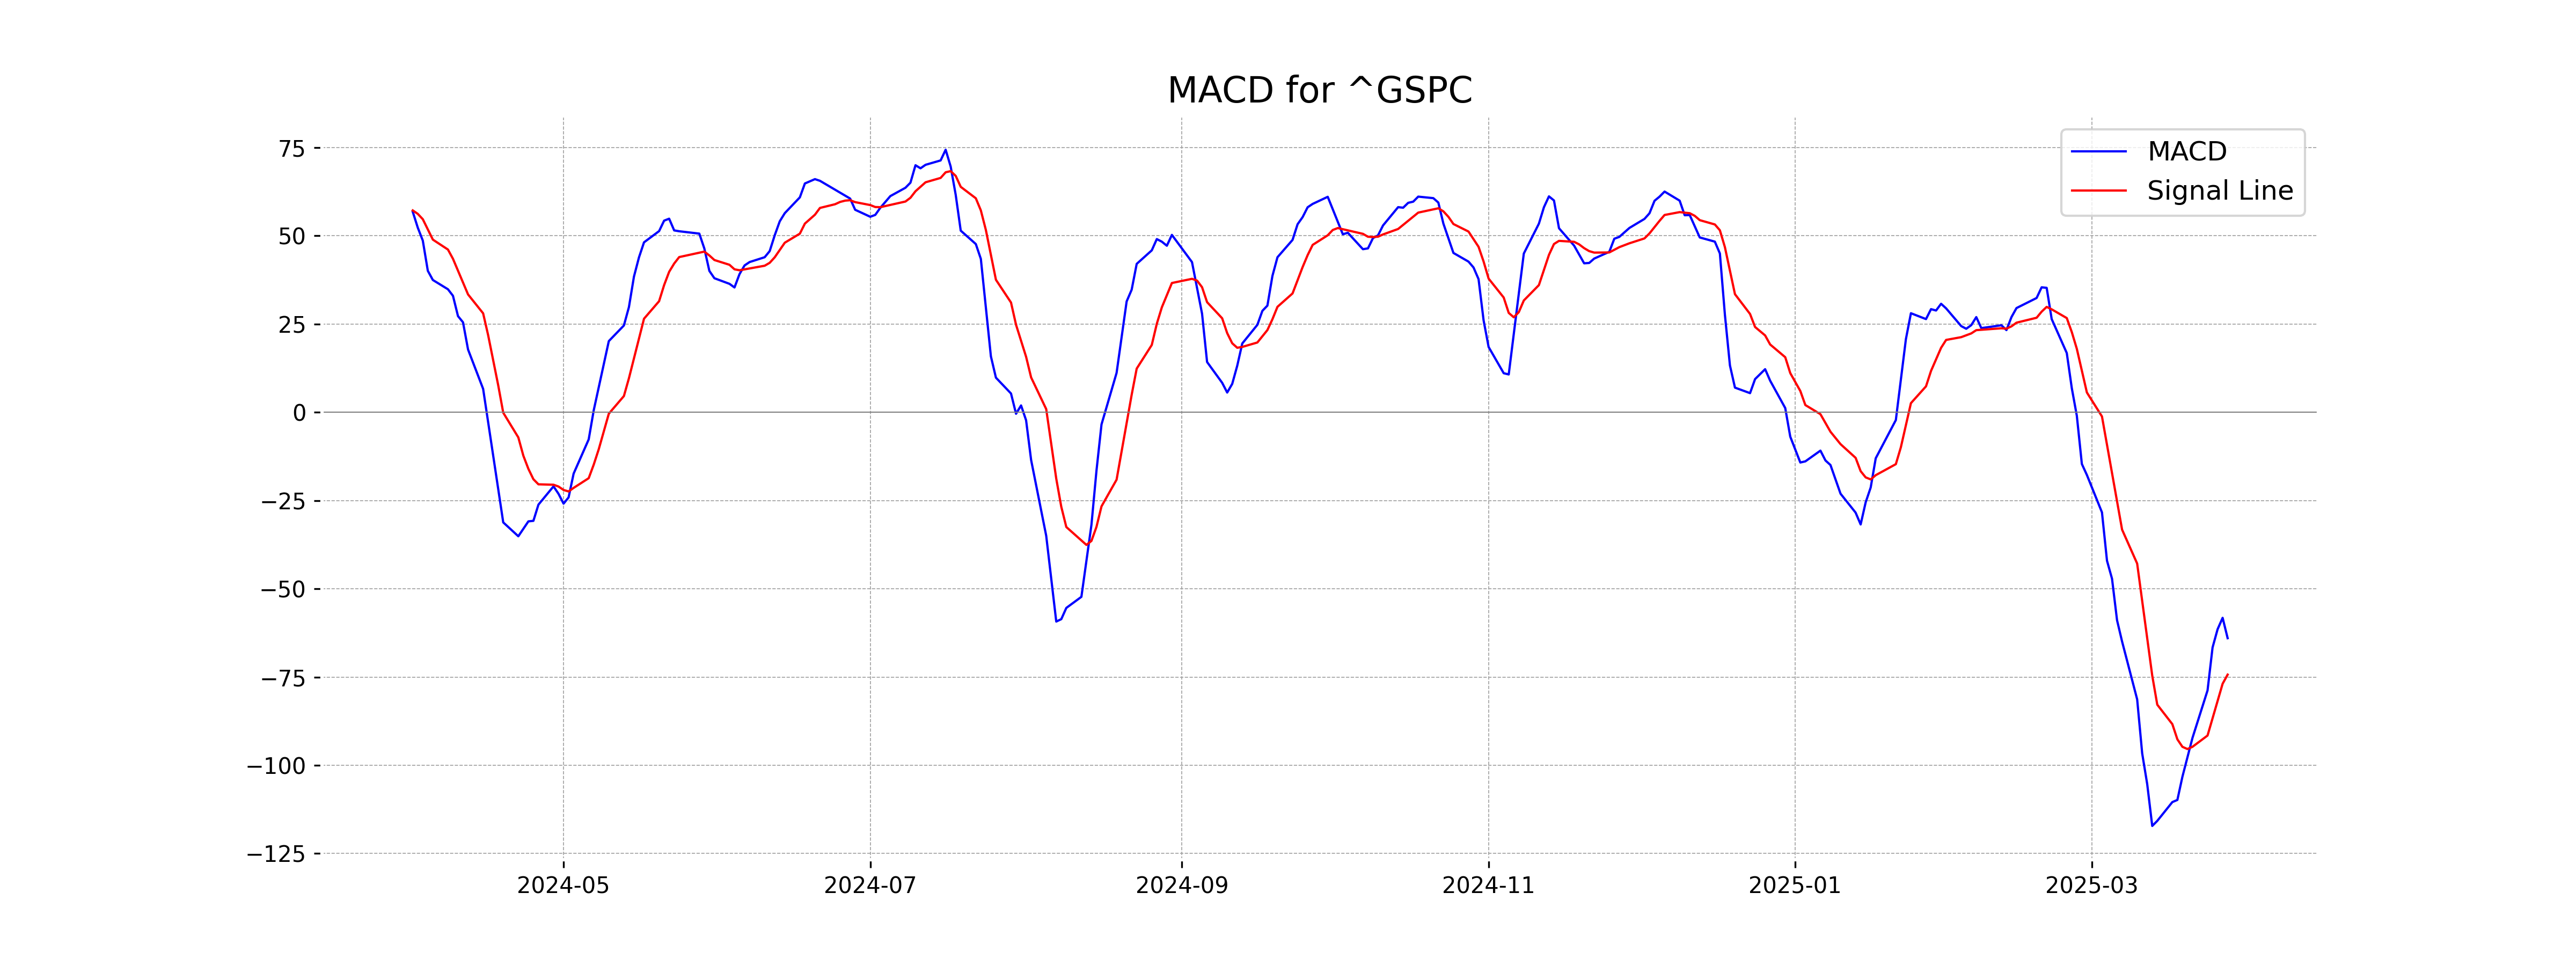
Moving Averages Trend (MACD)
The MACD for S&P 500 (US) is currently at -63.99, which is below the MACD Signal of -74.31, indicating a bearish trend. This suggests potential downward pressure on the stock index, as the market may be in a phase of selling or consolidation.
RSI Analysis
The Relative Strength Index (RSI) for S&P 500 (US) is 37.86, indicating that the index may be nearing oversold conditions. An RSI below 30 is typically considered oversold, so the current value suggests a potential opportunity for buyers if the index continues to decline.
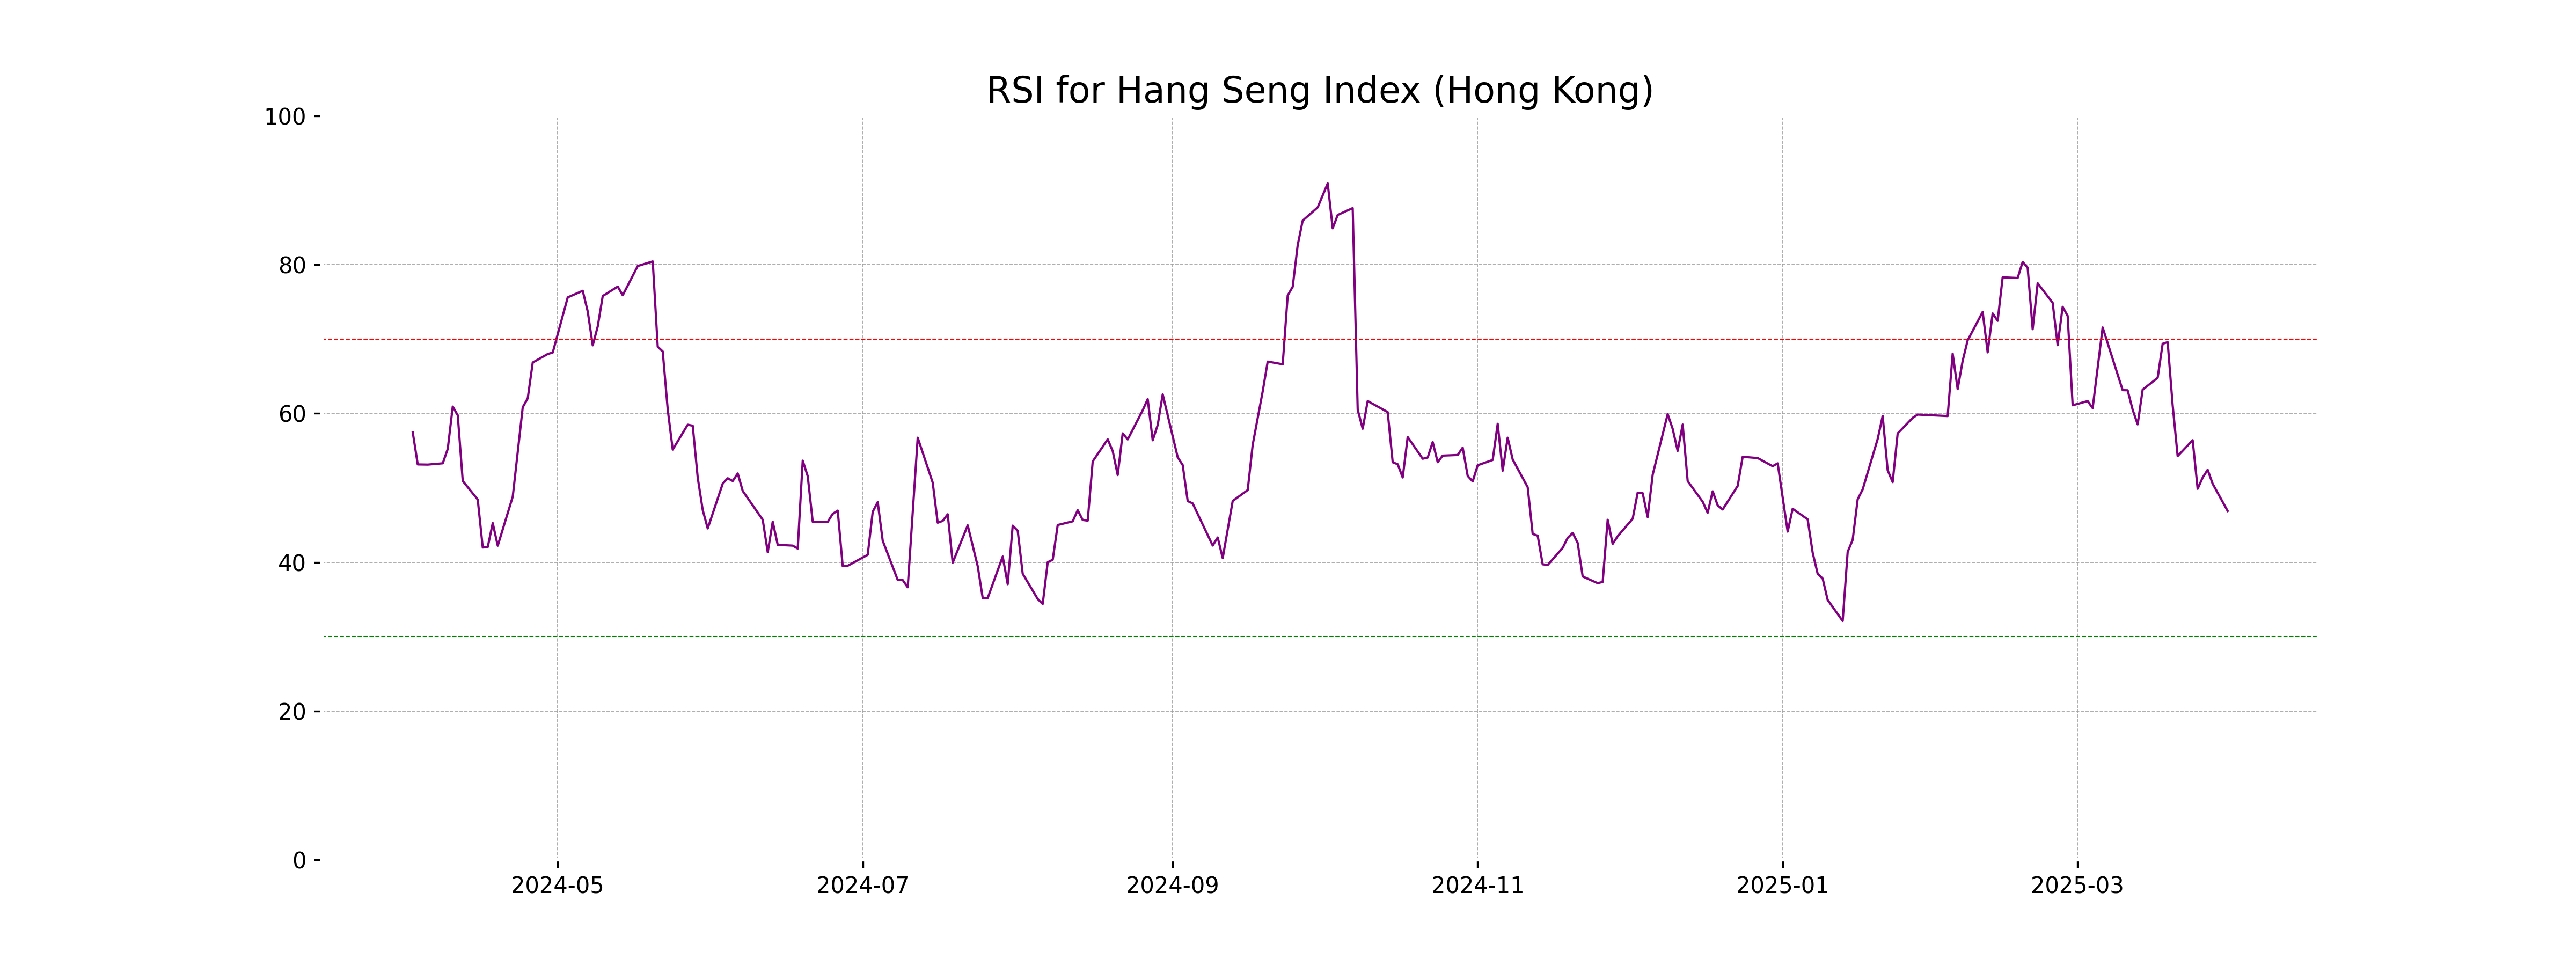
Analysis for Hang Seng Index (Hong Kong) - March 31, 2025
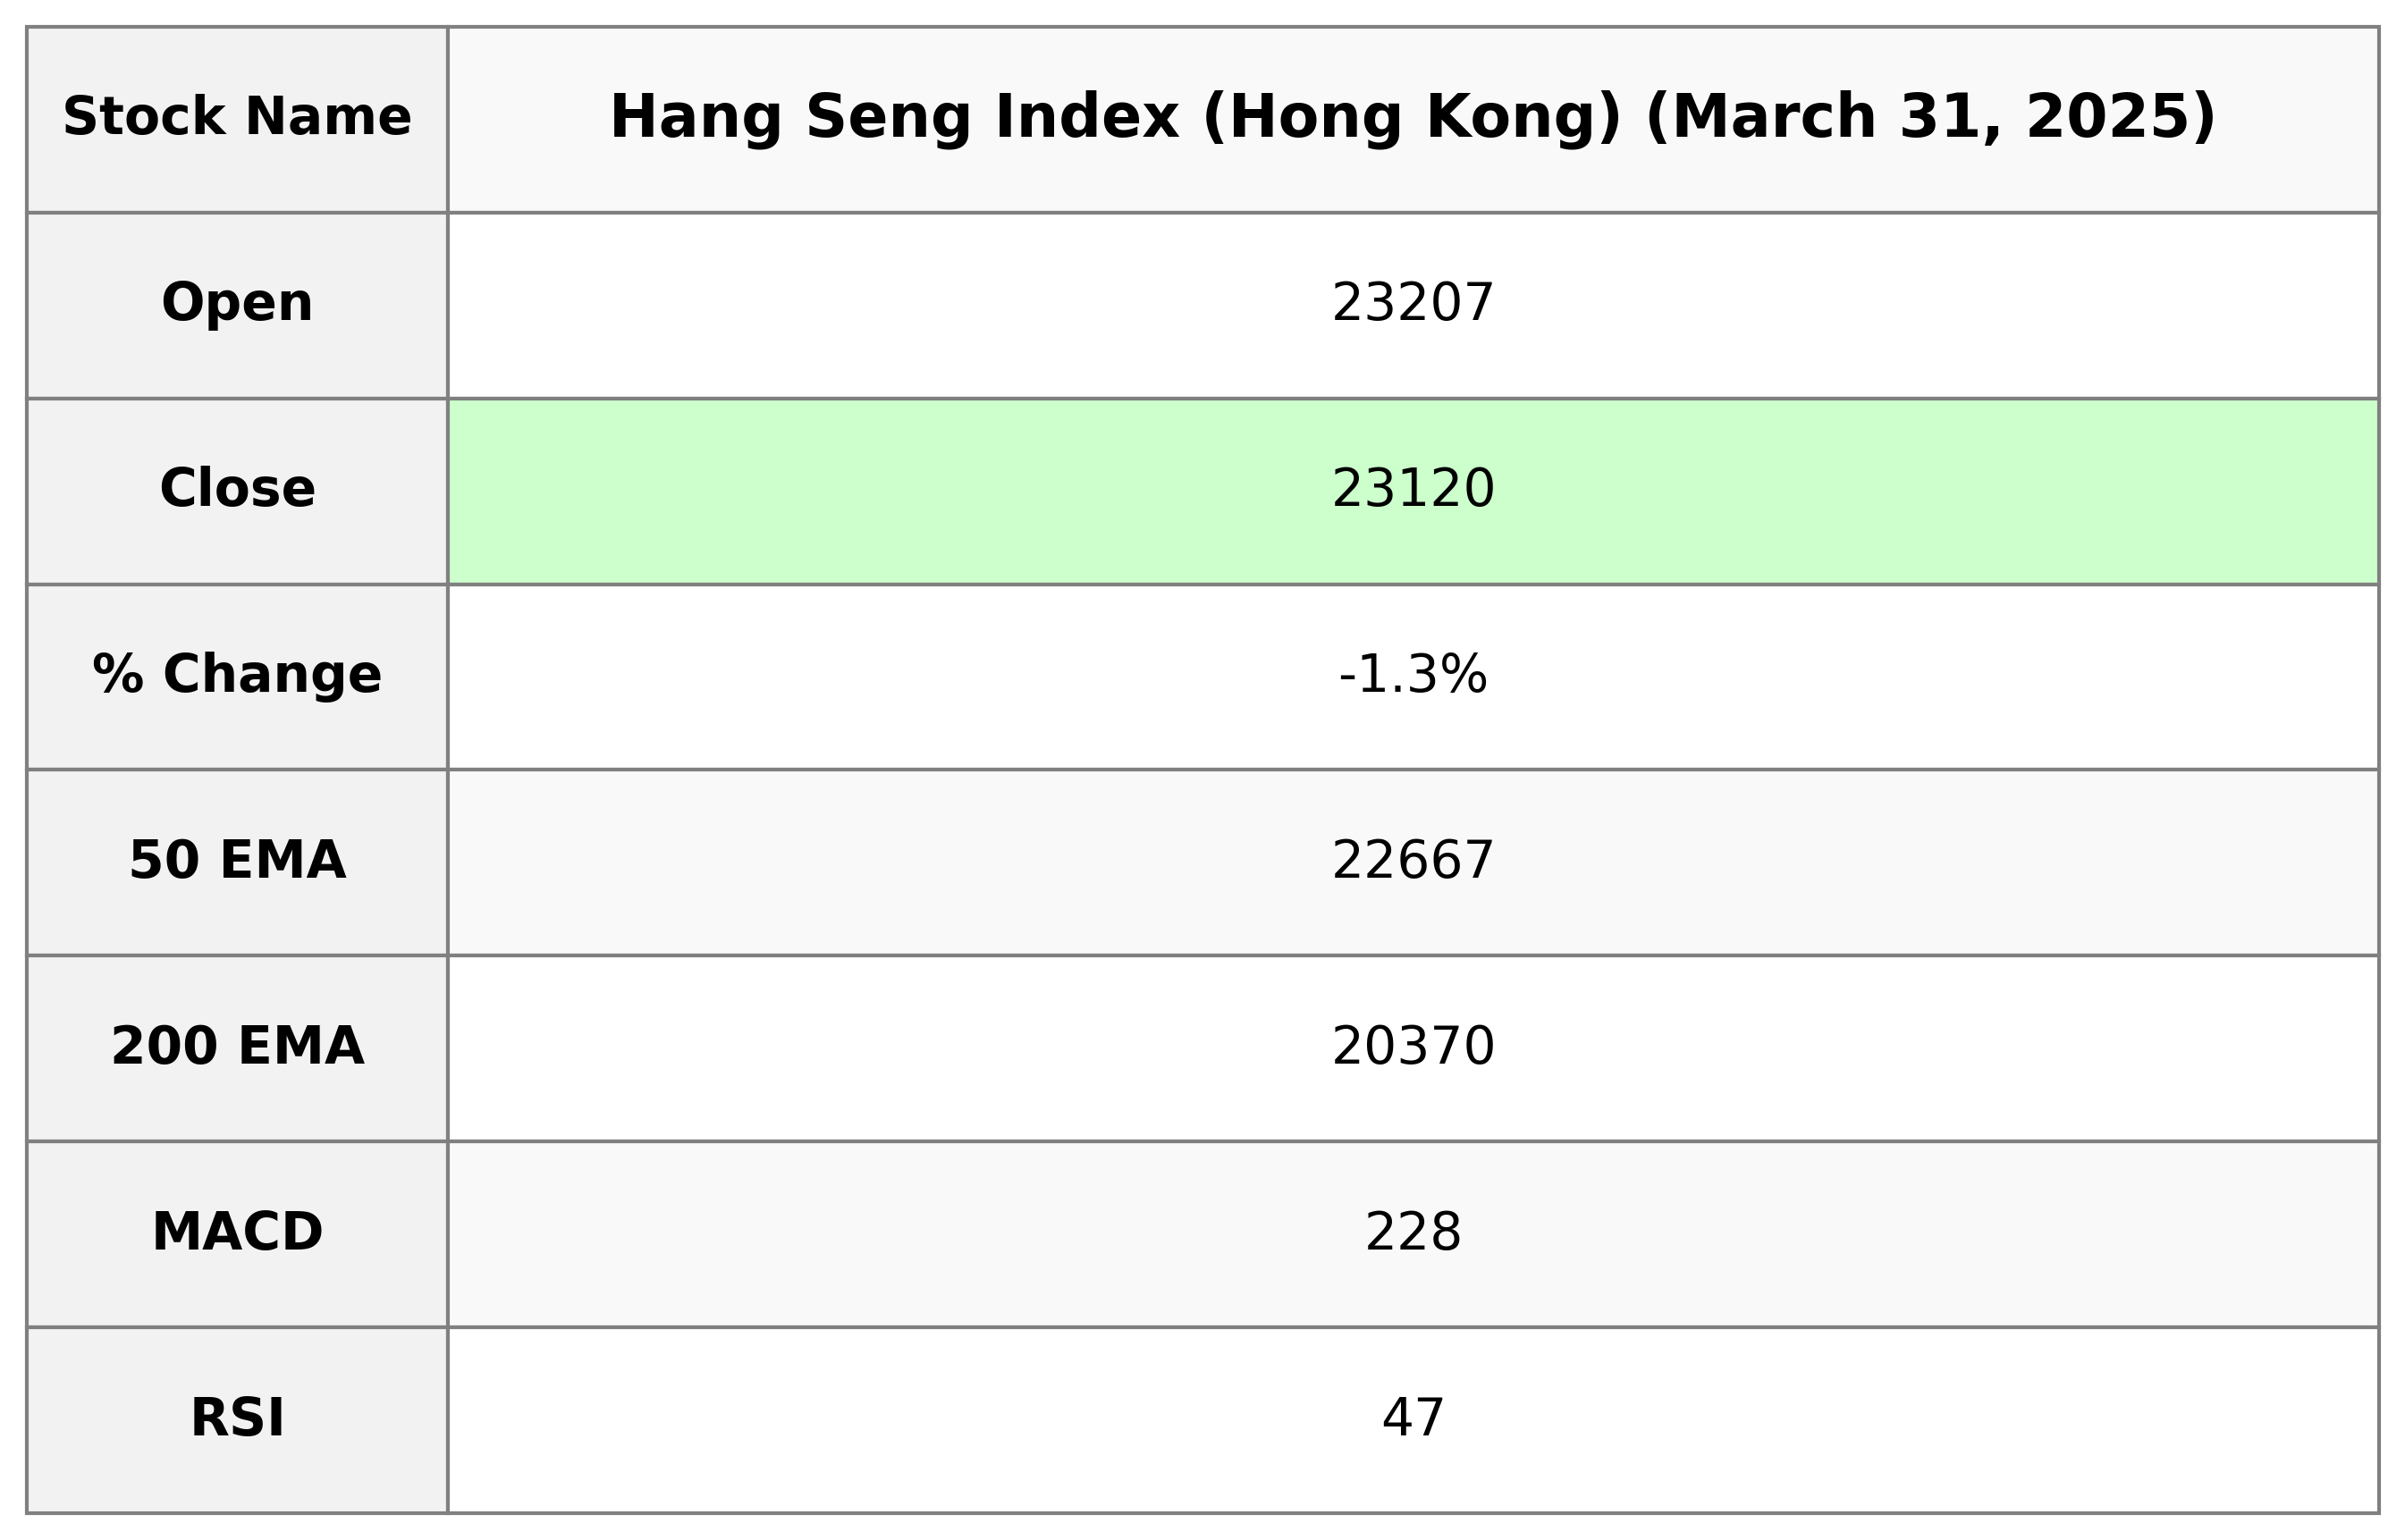
Hang Seng Index (Hong Kong) opened at 23,207.07 and closed at 23,119.58, experiencing a decrease of -1.31% or a drop of 307.02 points. The index's Relative Strength Index (RSI) is at 46.89, indicating a neutral momentum. Despite its 10-EMA (23,599.29) and 20-EMA (23,547.46) being higher than the current close, the index remains below its 50-EMA (22,666.84) and 200-EMA (20,370.48).
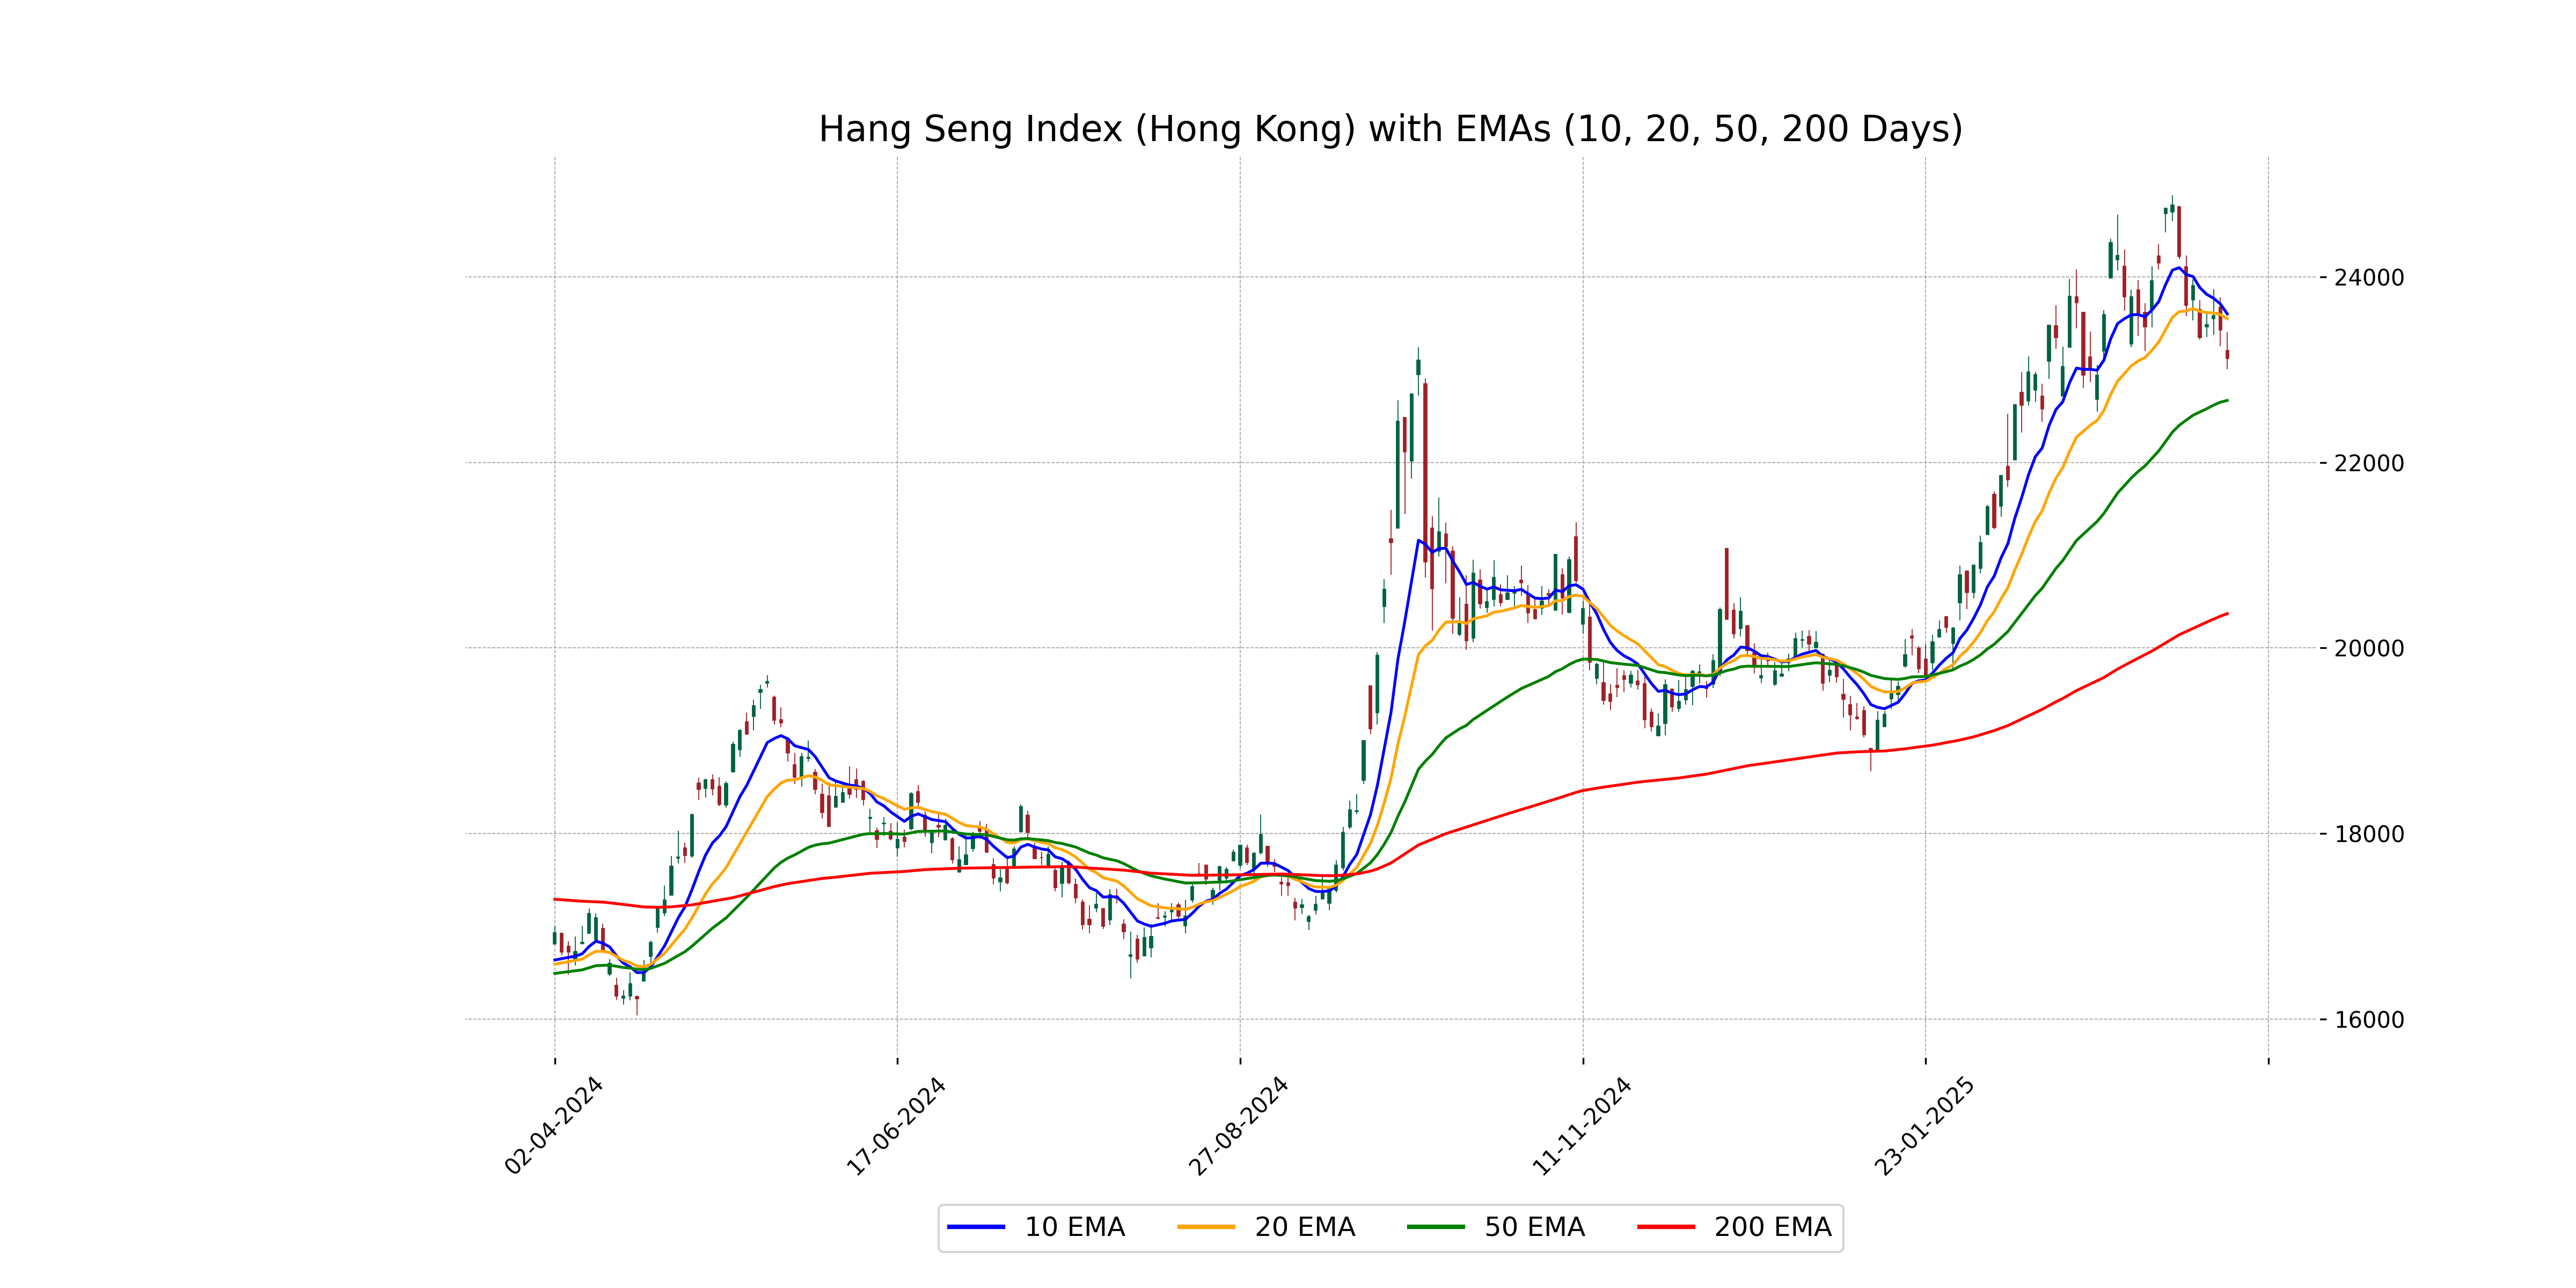
Relationship with Key Moving Averages
The Hang Seng Index closed at 23,119.58, below its 10 EMA of 23,599.29 and its 20 EMA of 23,547.46, indicating short-term bearish momentum. However, it remains above the 50 EMA of 22,666.84 and significantly above the 200 EMA of 20,370.48, which suggests a longer-term uptrend.
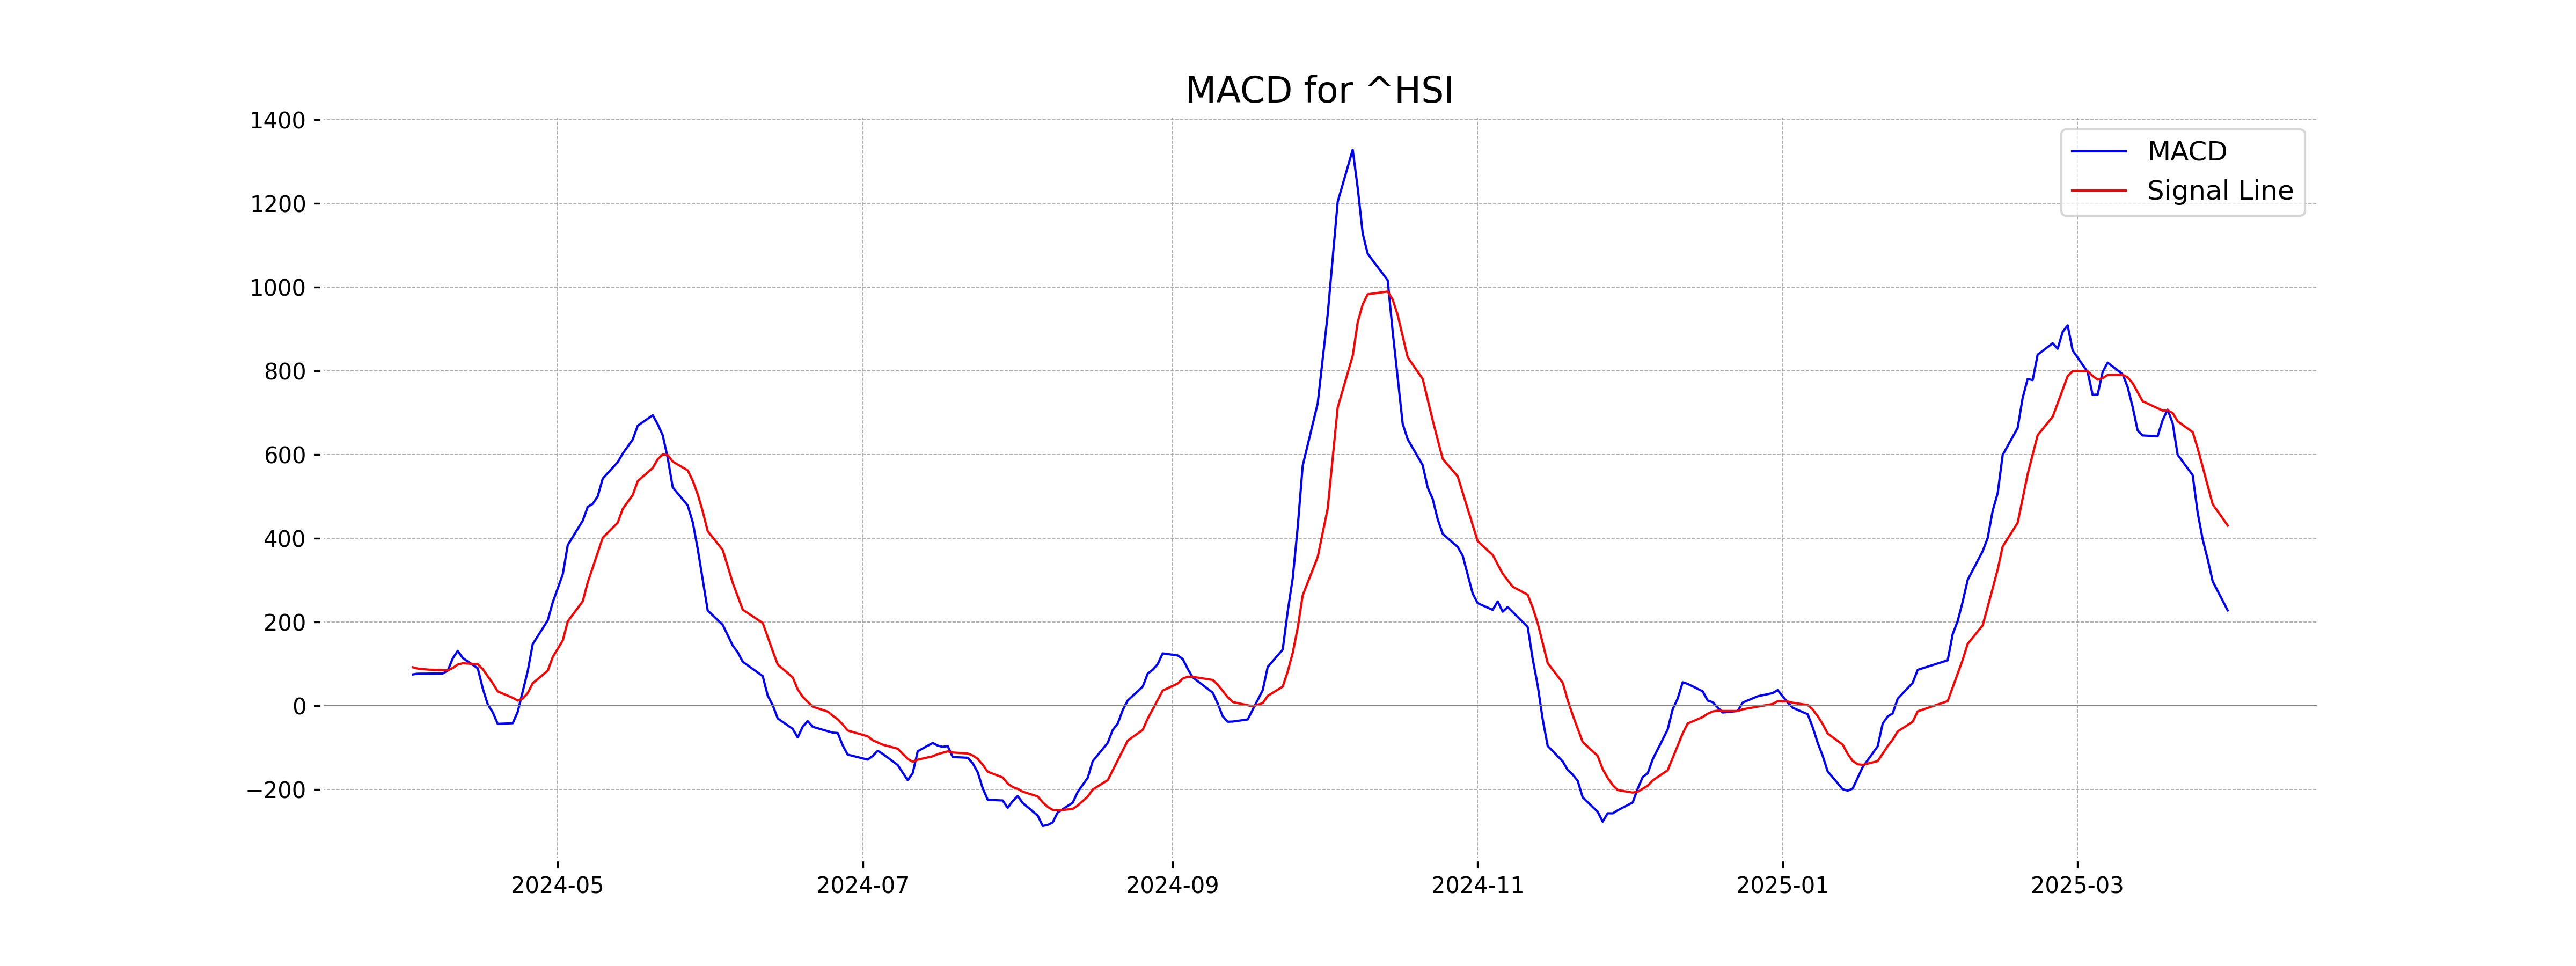
Moving Averages Trend (MACD)
The MACD for the Hang Seng Index is negative, as the MACD value (228.29) is below the MACD Signal line (431.17). This suggests a bearish momentum in the index. The RSI at 46.89 further corroborates a weak bearish trend as it is below the neutral level of 50.
RSI Analysis
The Hang Seng Index has a Relative Strength Index (RSI) of 46.89, indicating that it is currently neither overbought nor oversold and may exhibit neutral momentum. An RSI below 50 often suggests a bearish sentiment, but there isn't a strong indication of either extreme at this level.
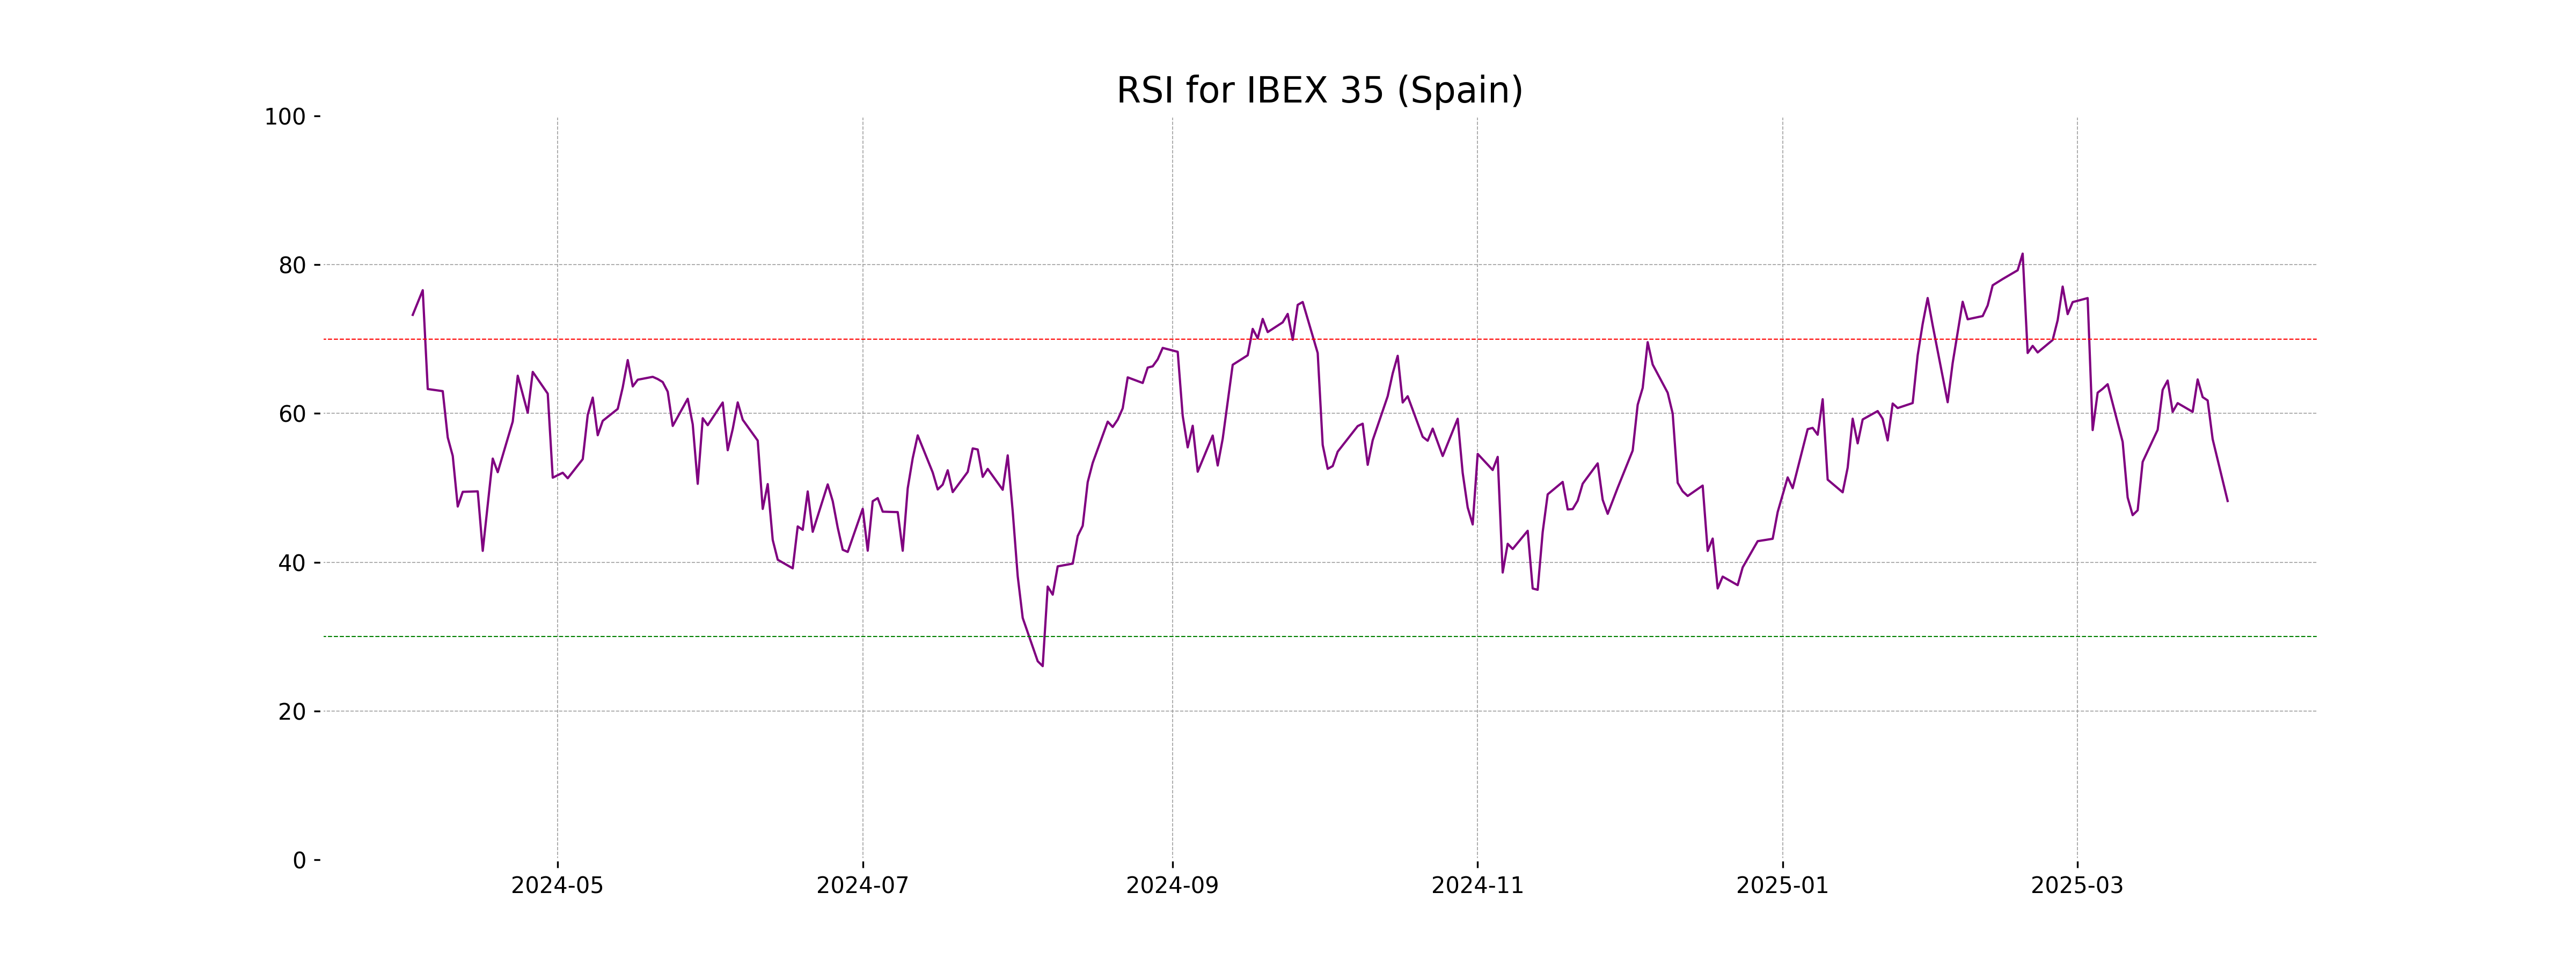
Analysis for IBEX 35 (Spain) - March 31, 2025
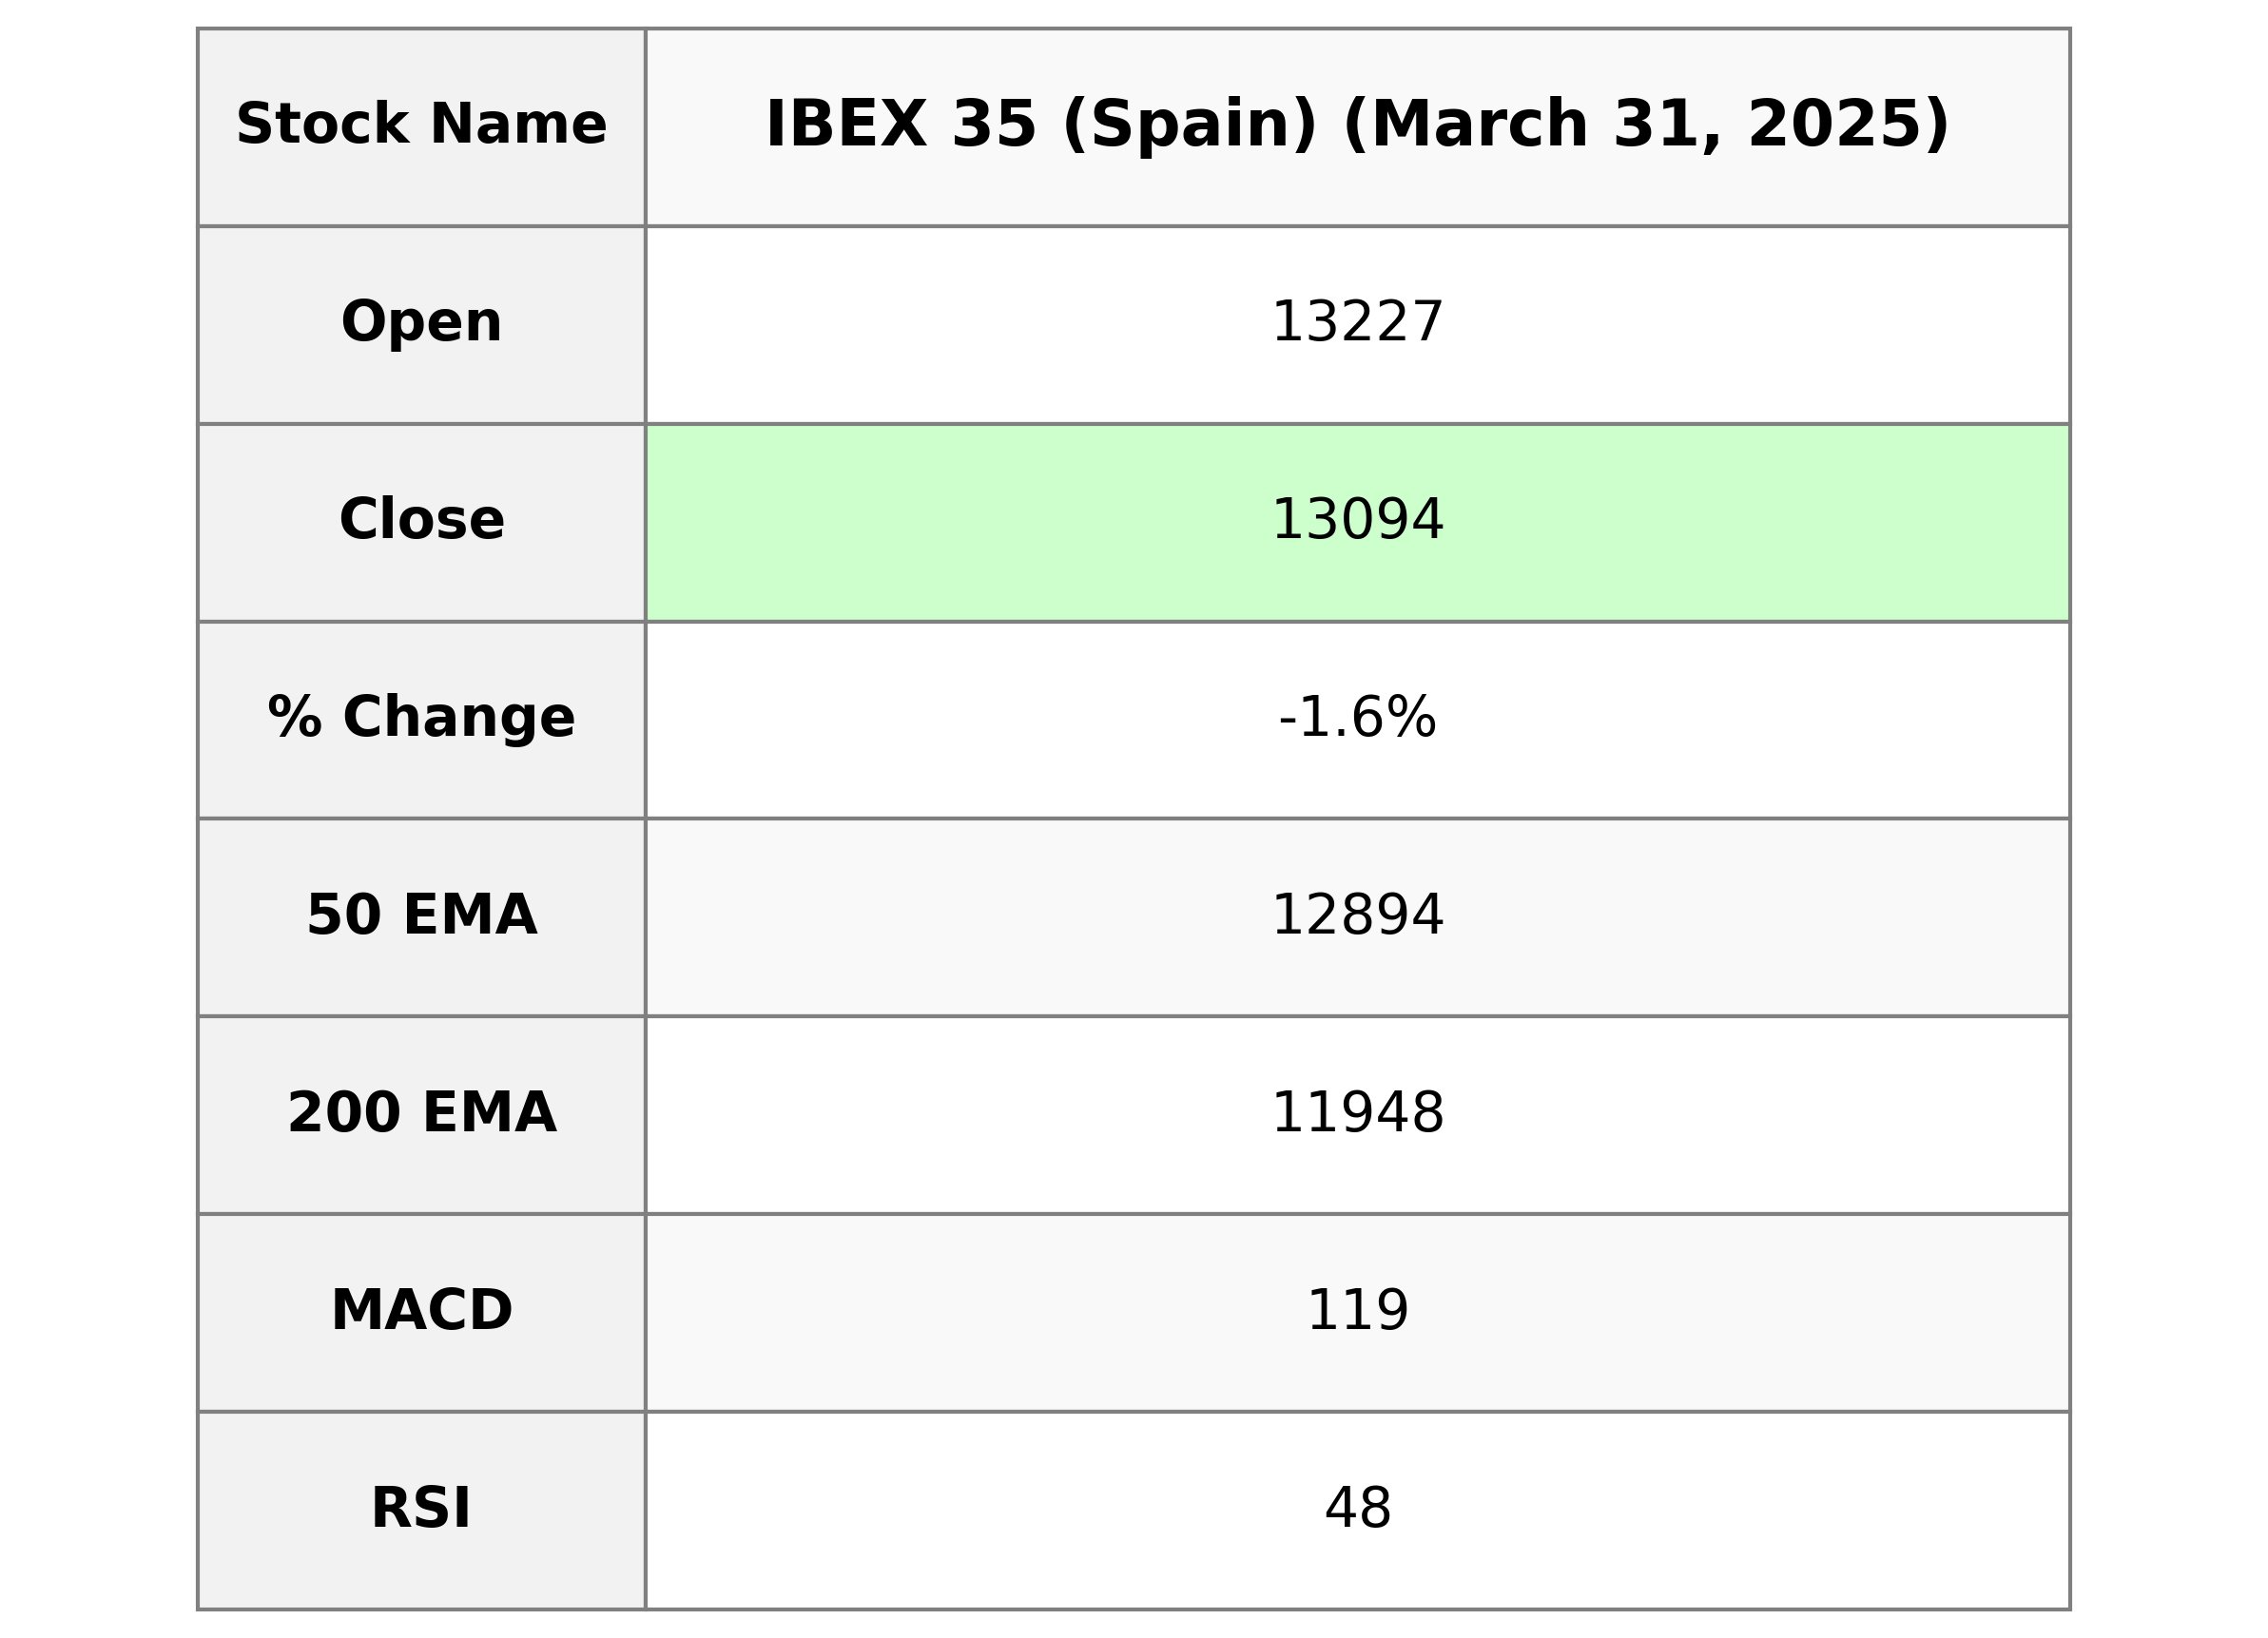
IBEX 35 (Spain) opened at 13,226.60, reaching a high of 13,249.40 and a low of 13,070.30, closing at 13,094.00. This represents a decline of approximately 1.62% from the previous close of 13,309.30, with a points change of -215.30. The volume for the session was 59,054,100. The index's 50-day EMA is at 12,893.74, while the 200-day EMA is at 11,948.45. The RSI stands at 48.23, and the MACD is 118.98 against a signal of 144.36.
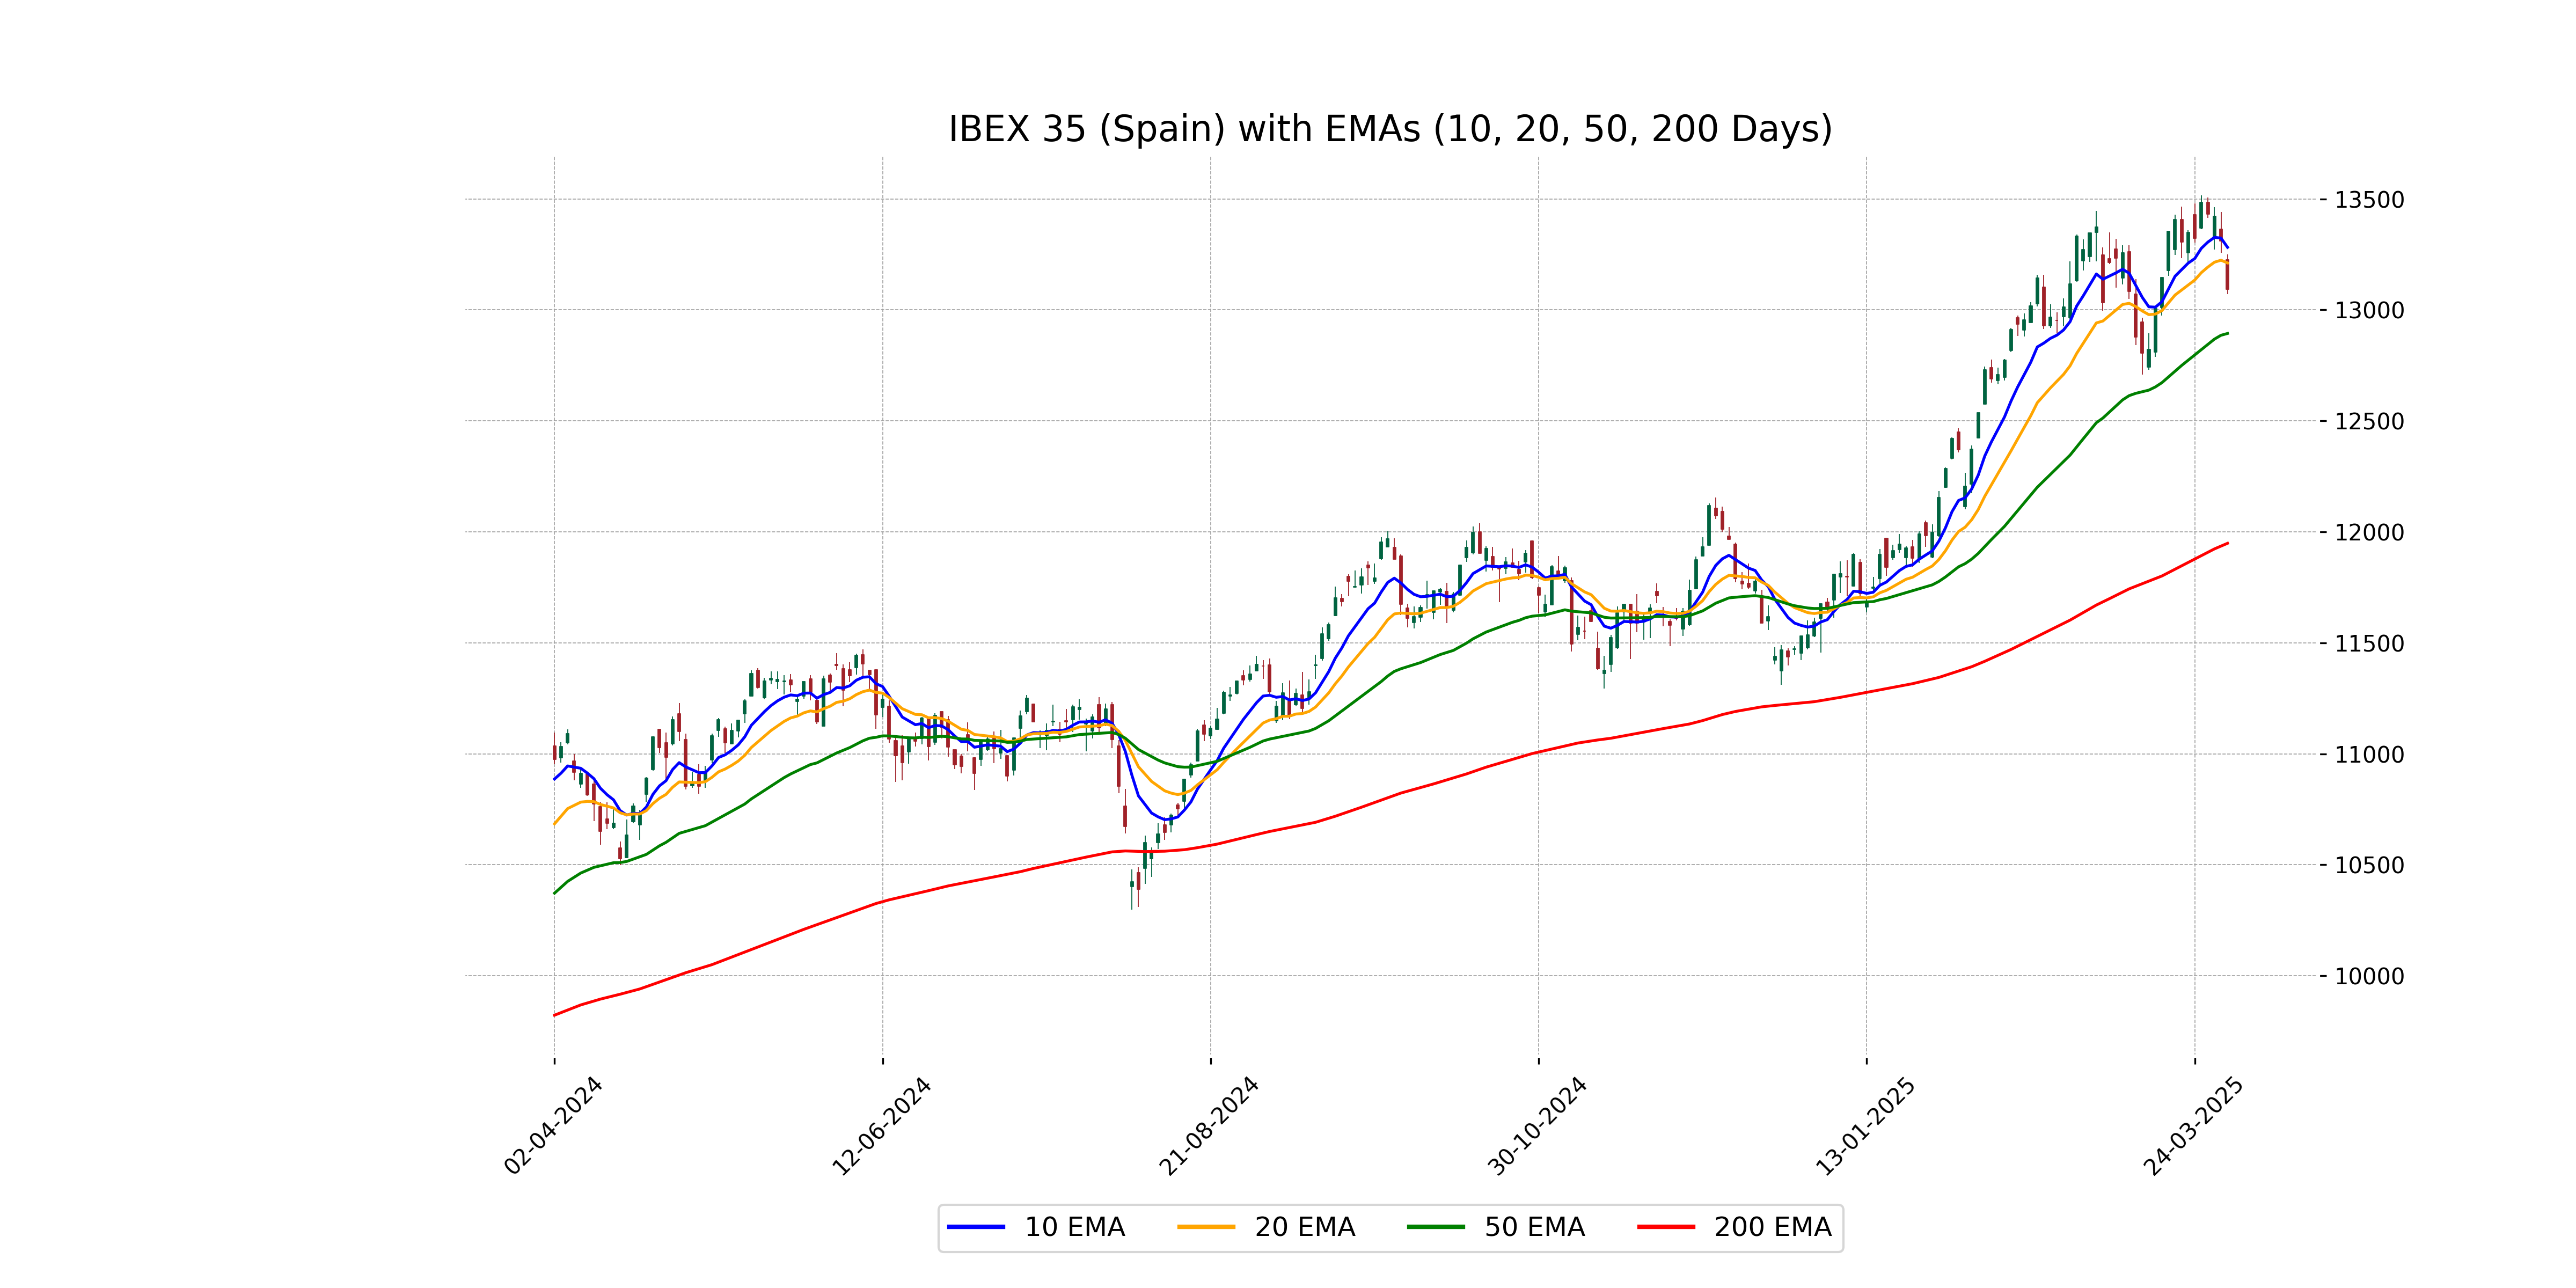
Relationship with Key Moving Averages
The IBEX 35 closed at 13,094, which is below the 10-day EMA of 13,281.80 and the 20-day EMA of 13,211.42, indicating short-term downward momentum. However, it stays above the 50-day EMA of 12,893.74 and the 200-day EMA of 11,948.45, suggesting long-term support remains intact.
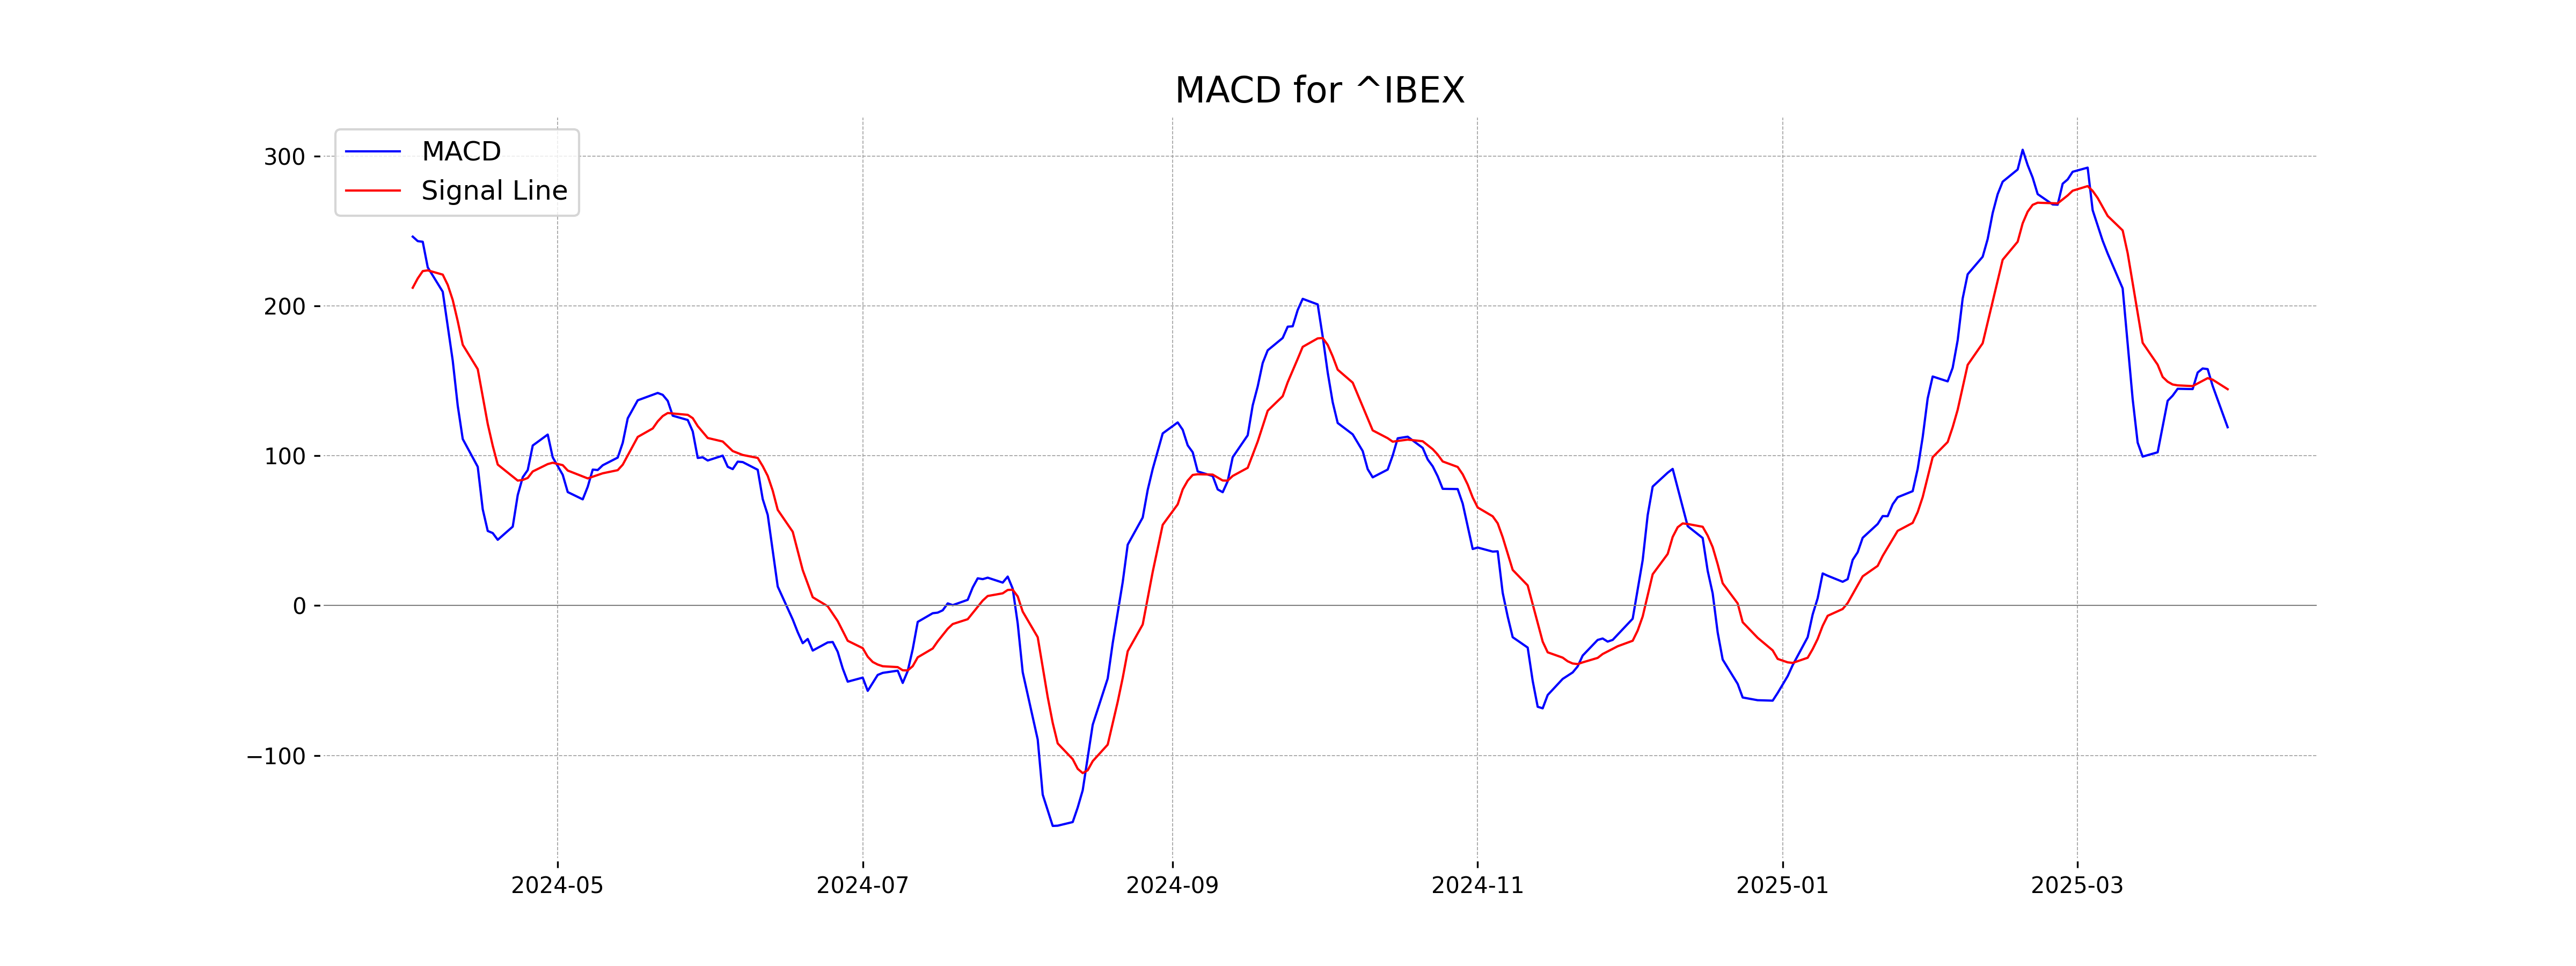
Moving Averages Trend (MACD)
The IBEX 35's MACD value is 118.98, which is below the MACD Signal line of 144.36. This indicates a potential bearish momentum, as the MACD line crossing below the signal line often suggests a potential sell signal. Caution is advised, as the RSI is relatively neutral at 48.23.
RSI Analysis
The RSI (Relative Strength Index) for IBEX 35 is 48.23, which suggests that the index is in a neutral zone. An RSI within the range of 30 to 70 implies that the index is neither overbought nor oversold, indicating a balanced momentum at this time.
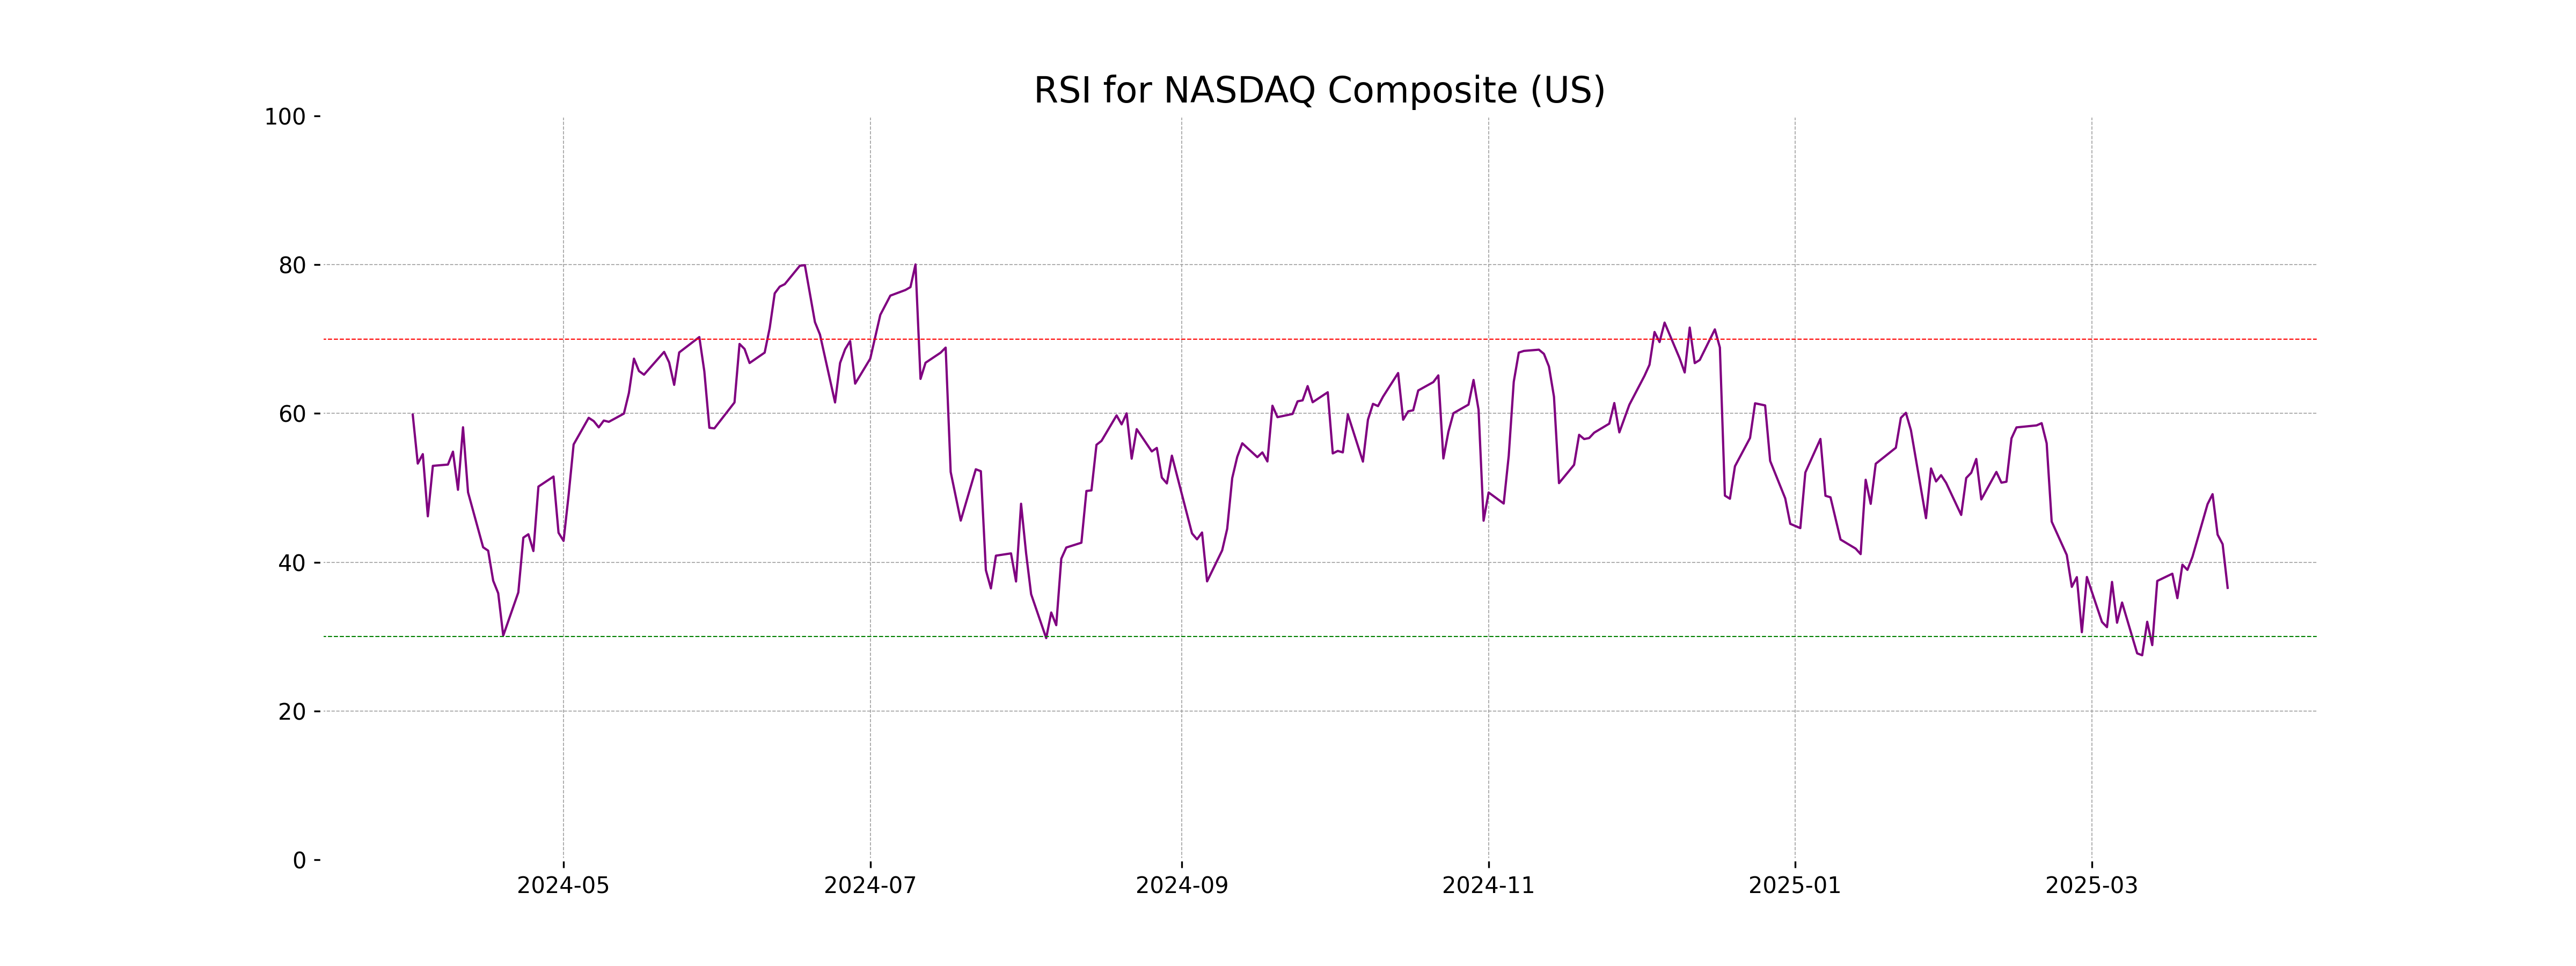
Analysis for NASDAQ Composite (US) - March 31, 2025
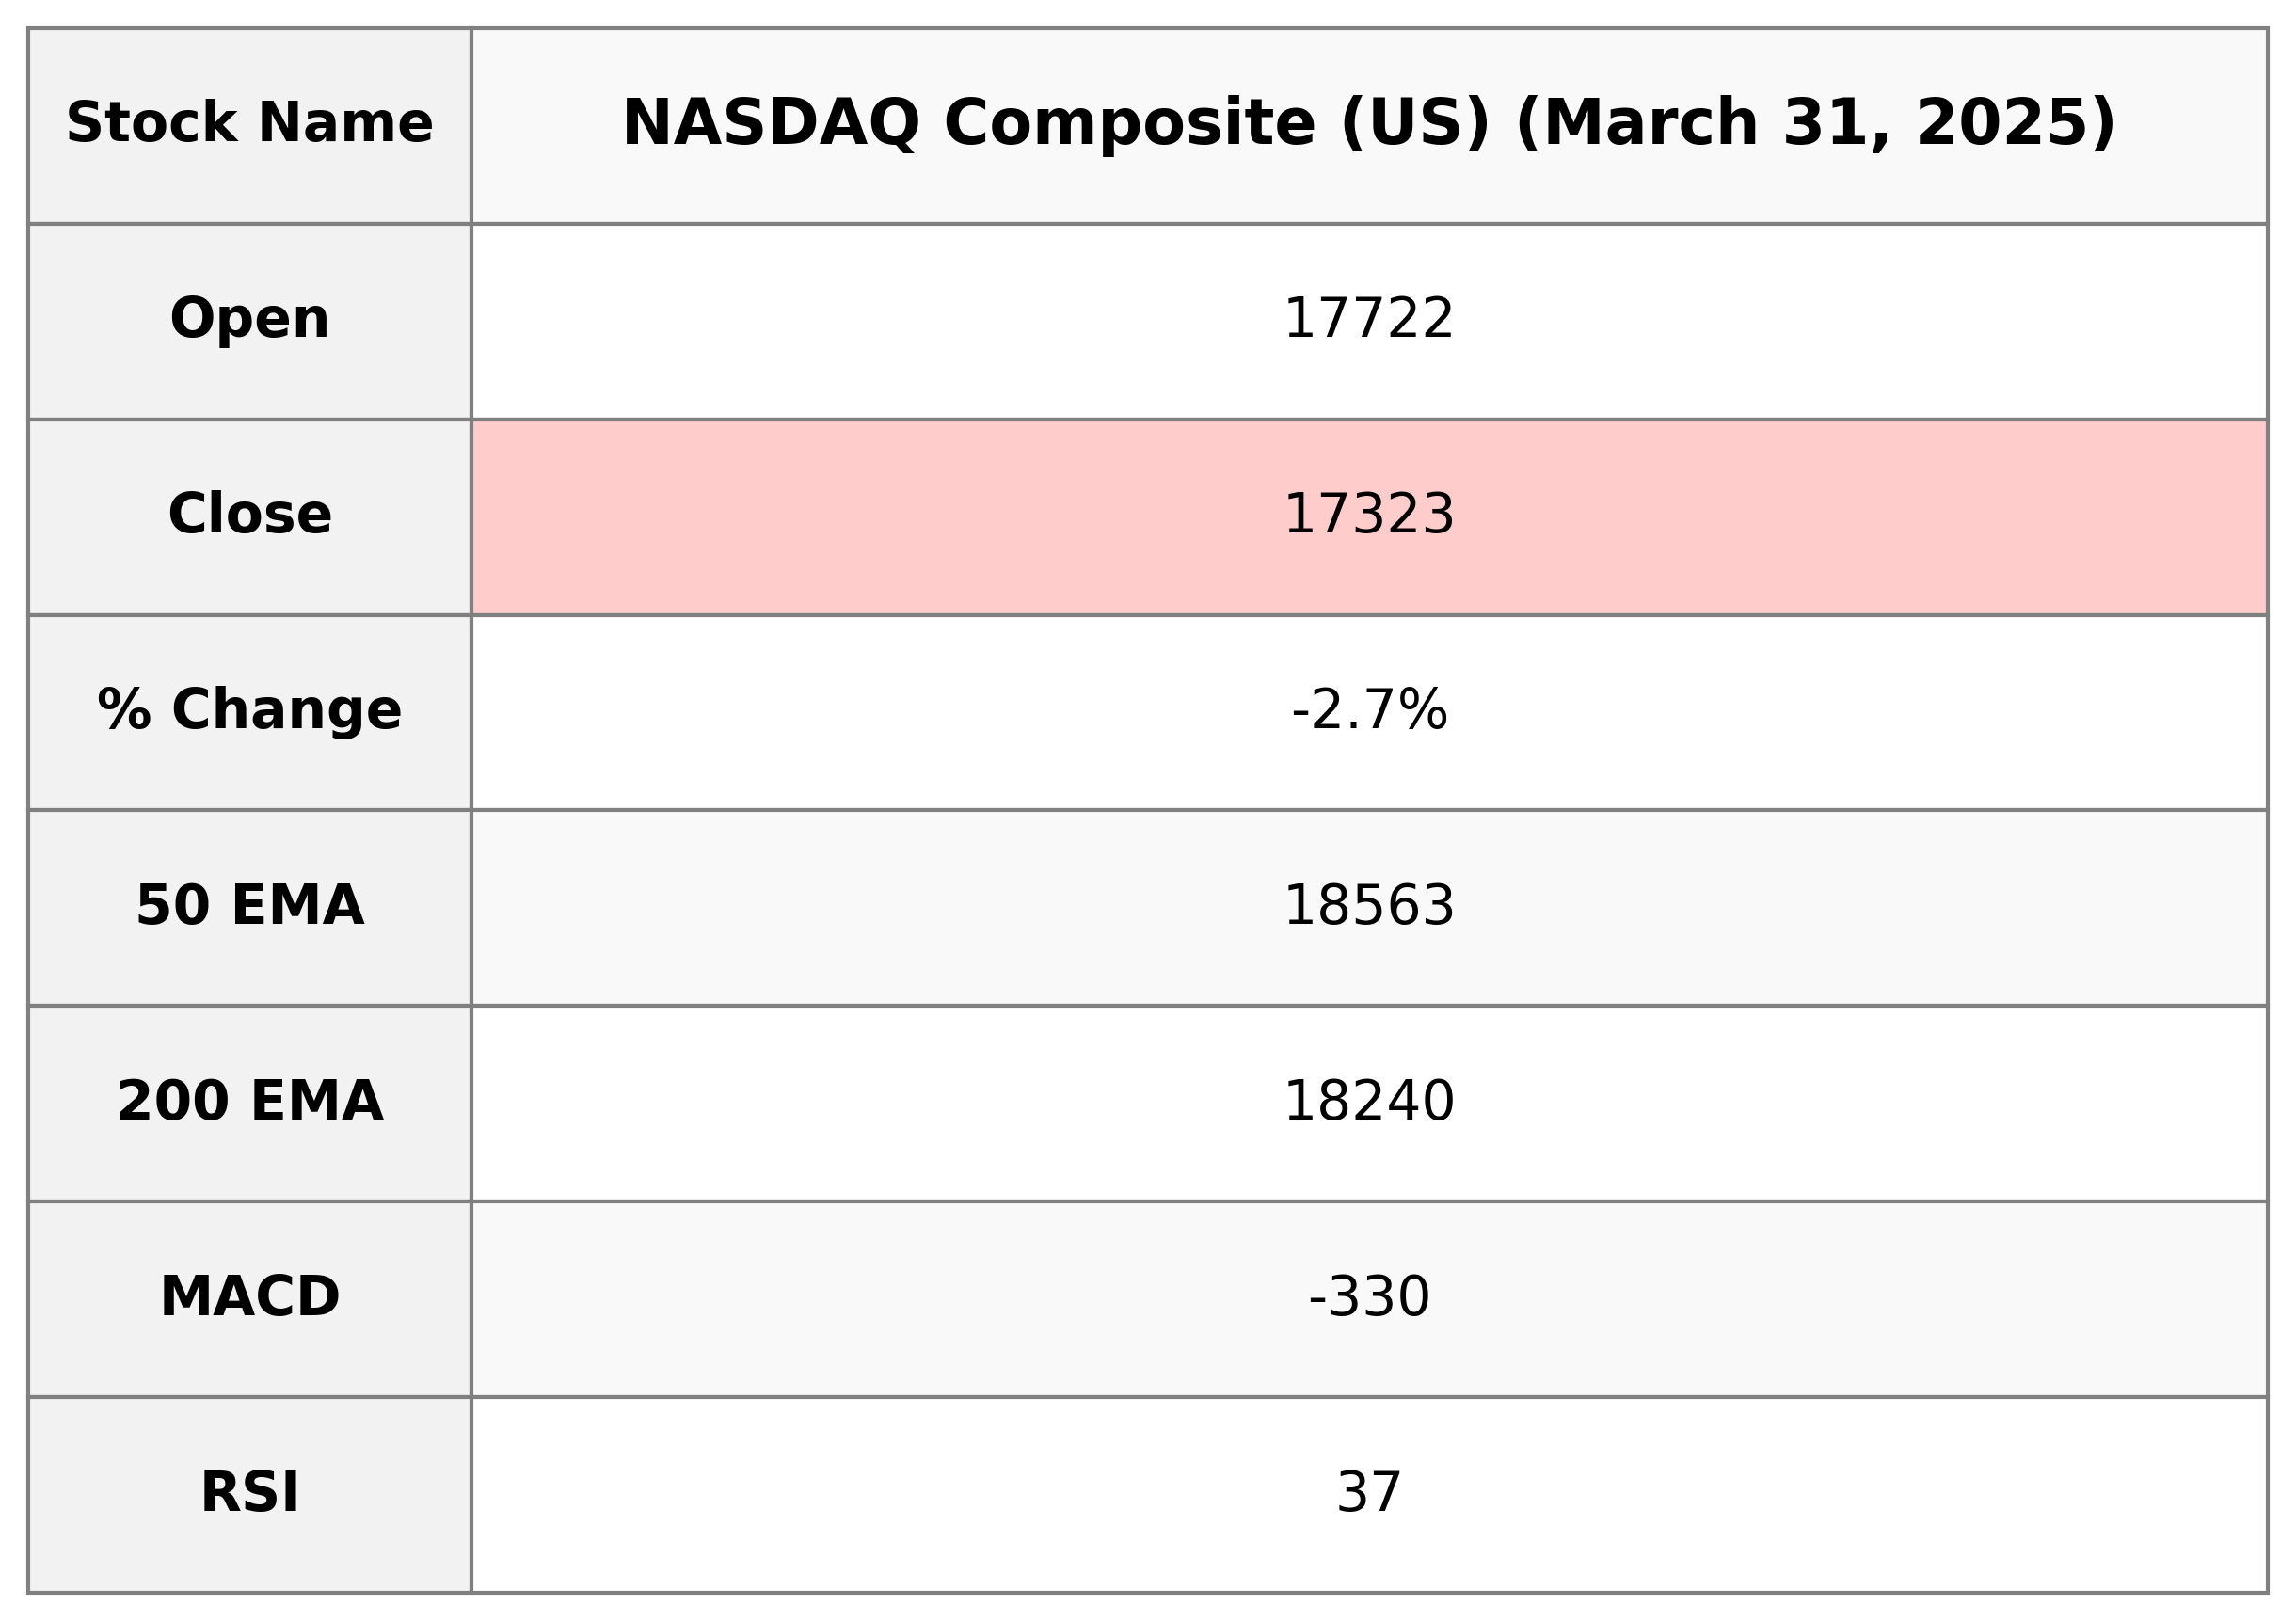
The NASDAQ Composite experienced a significant decline with a closing value of 17,322.99, showing a decrease of 2.70% from the previous close. The trading volume was notably high at 7,015,410,000. The technical indicators reveal a low RSI at 36.55, suggesting potential oversold conditions, and a negative MACD, implying a bearish trend.
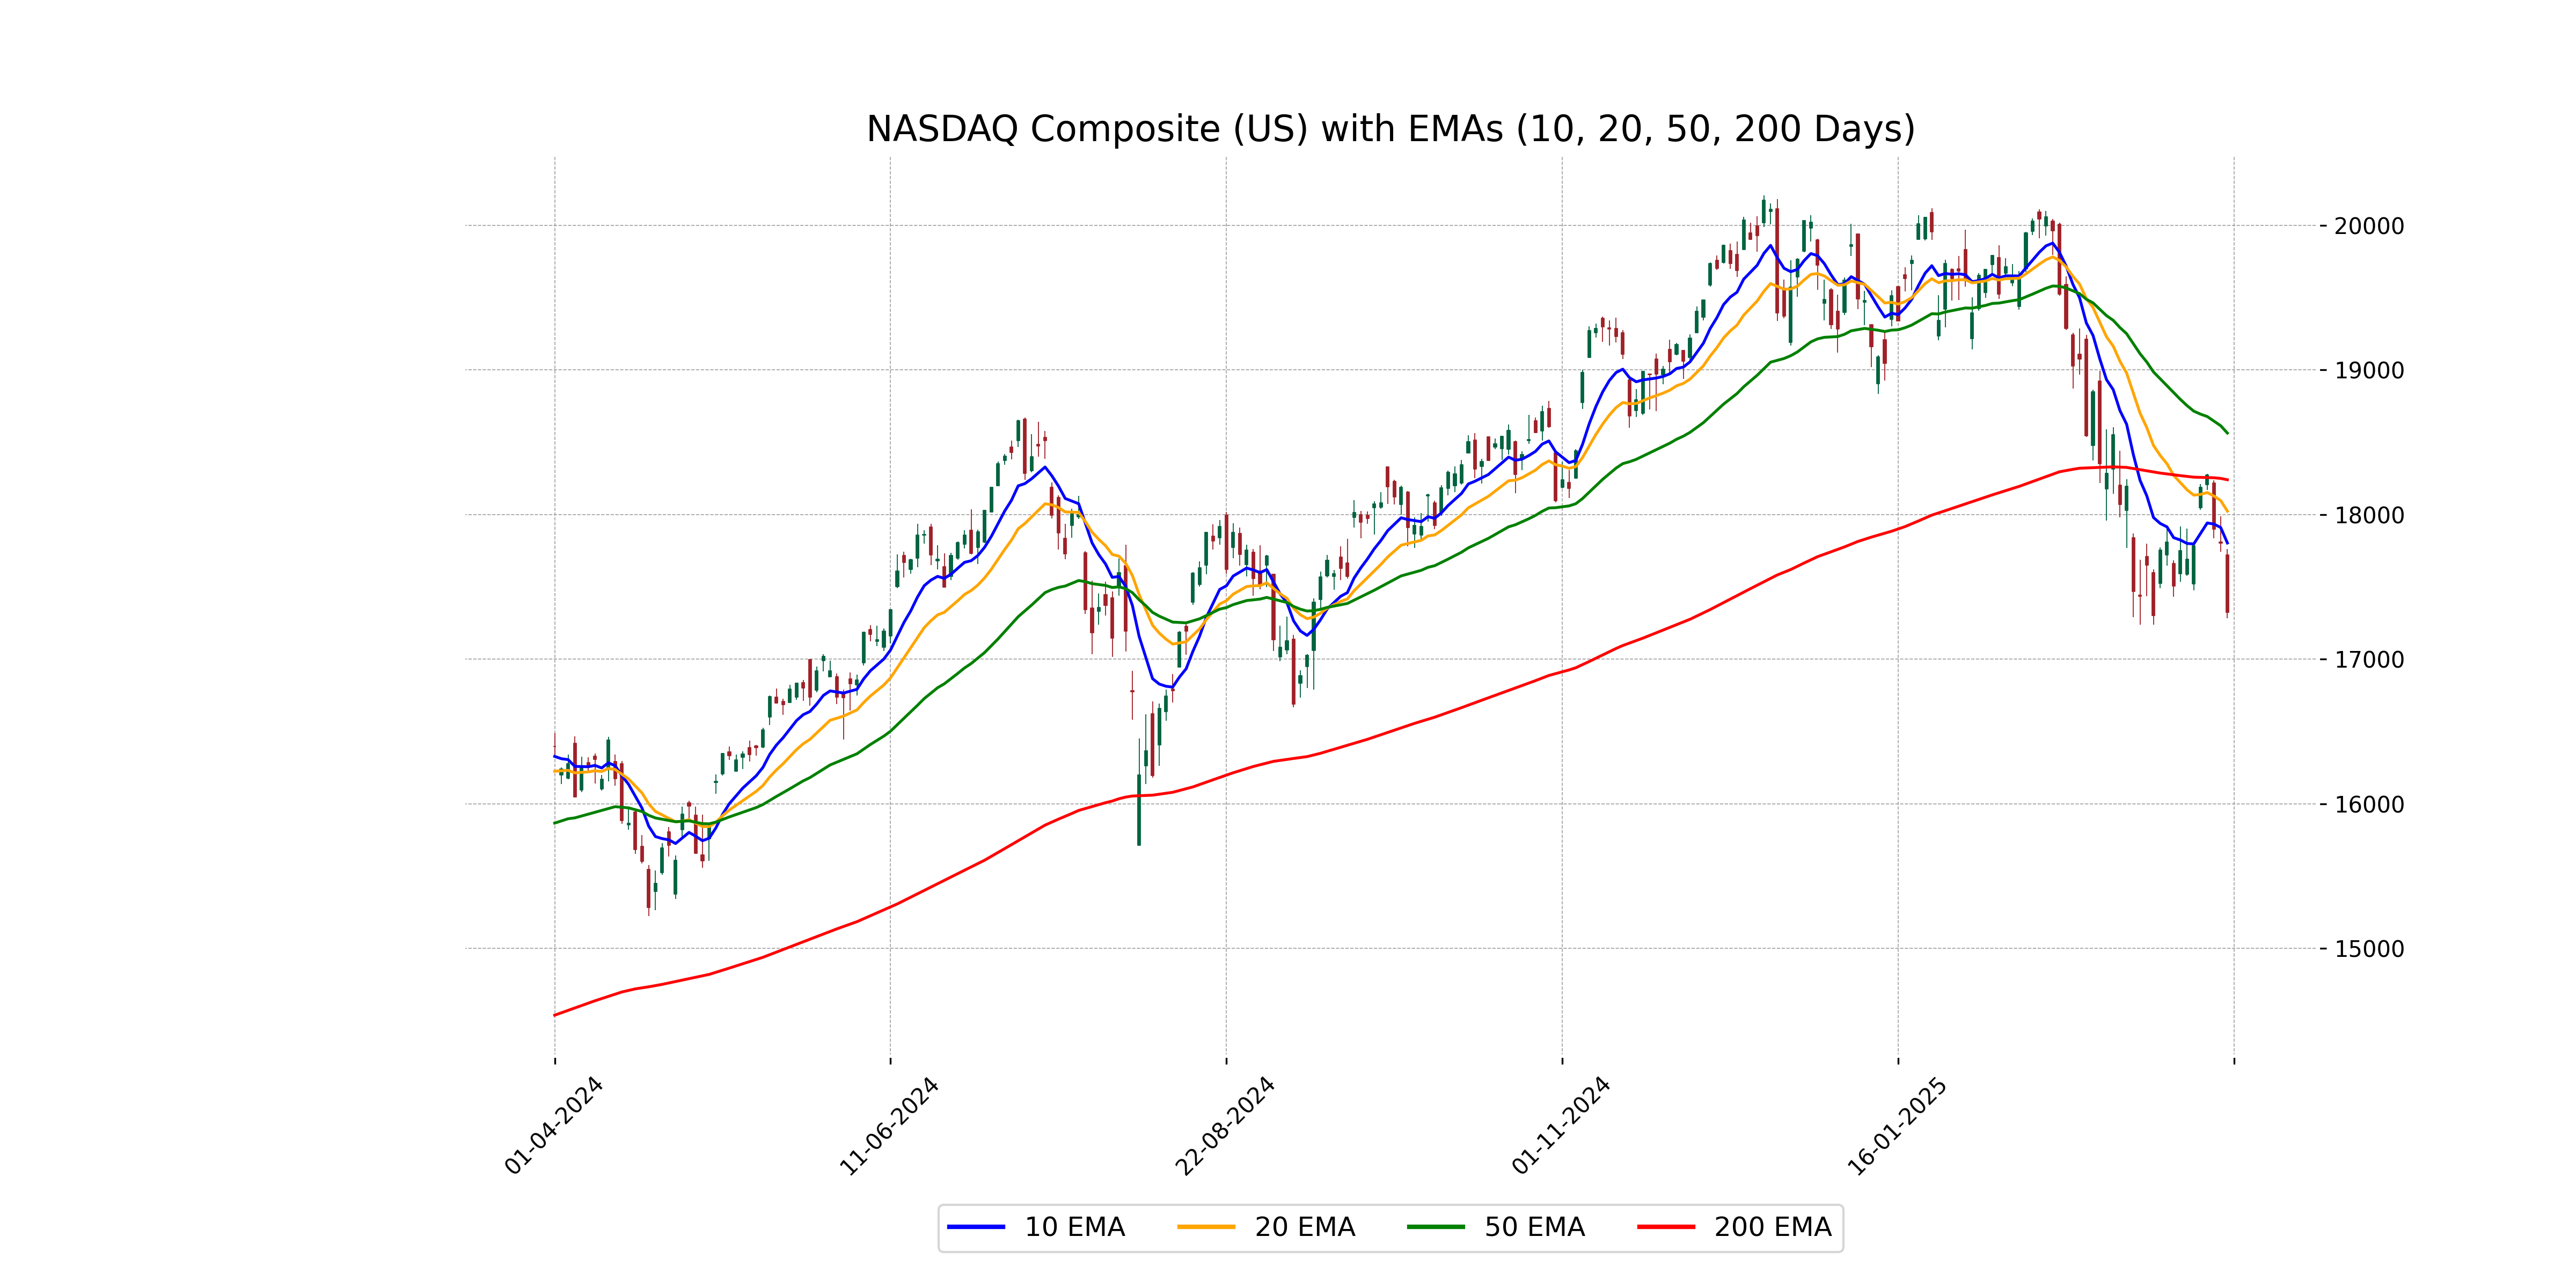
Relationship with Key Moving Averages
The NASDAQ Composite's current closing price of 17322.99 is below its 10-day EMA of 17803.42, 20-day EMA of 18022.998, 50-day EMA of 18562.981, and 200-day EMA of 18240.265, indicating a bearish trend. Additionally, the RSI is at 36.55, which approaches an oversold condition.
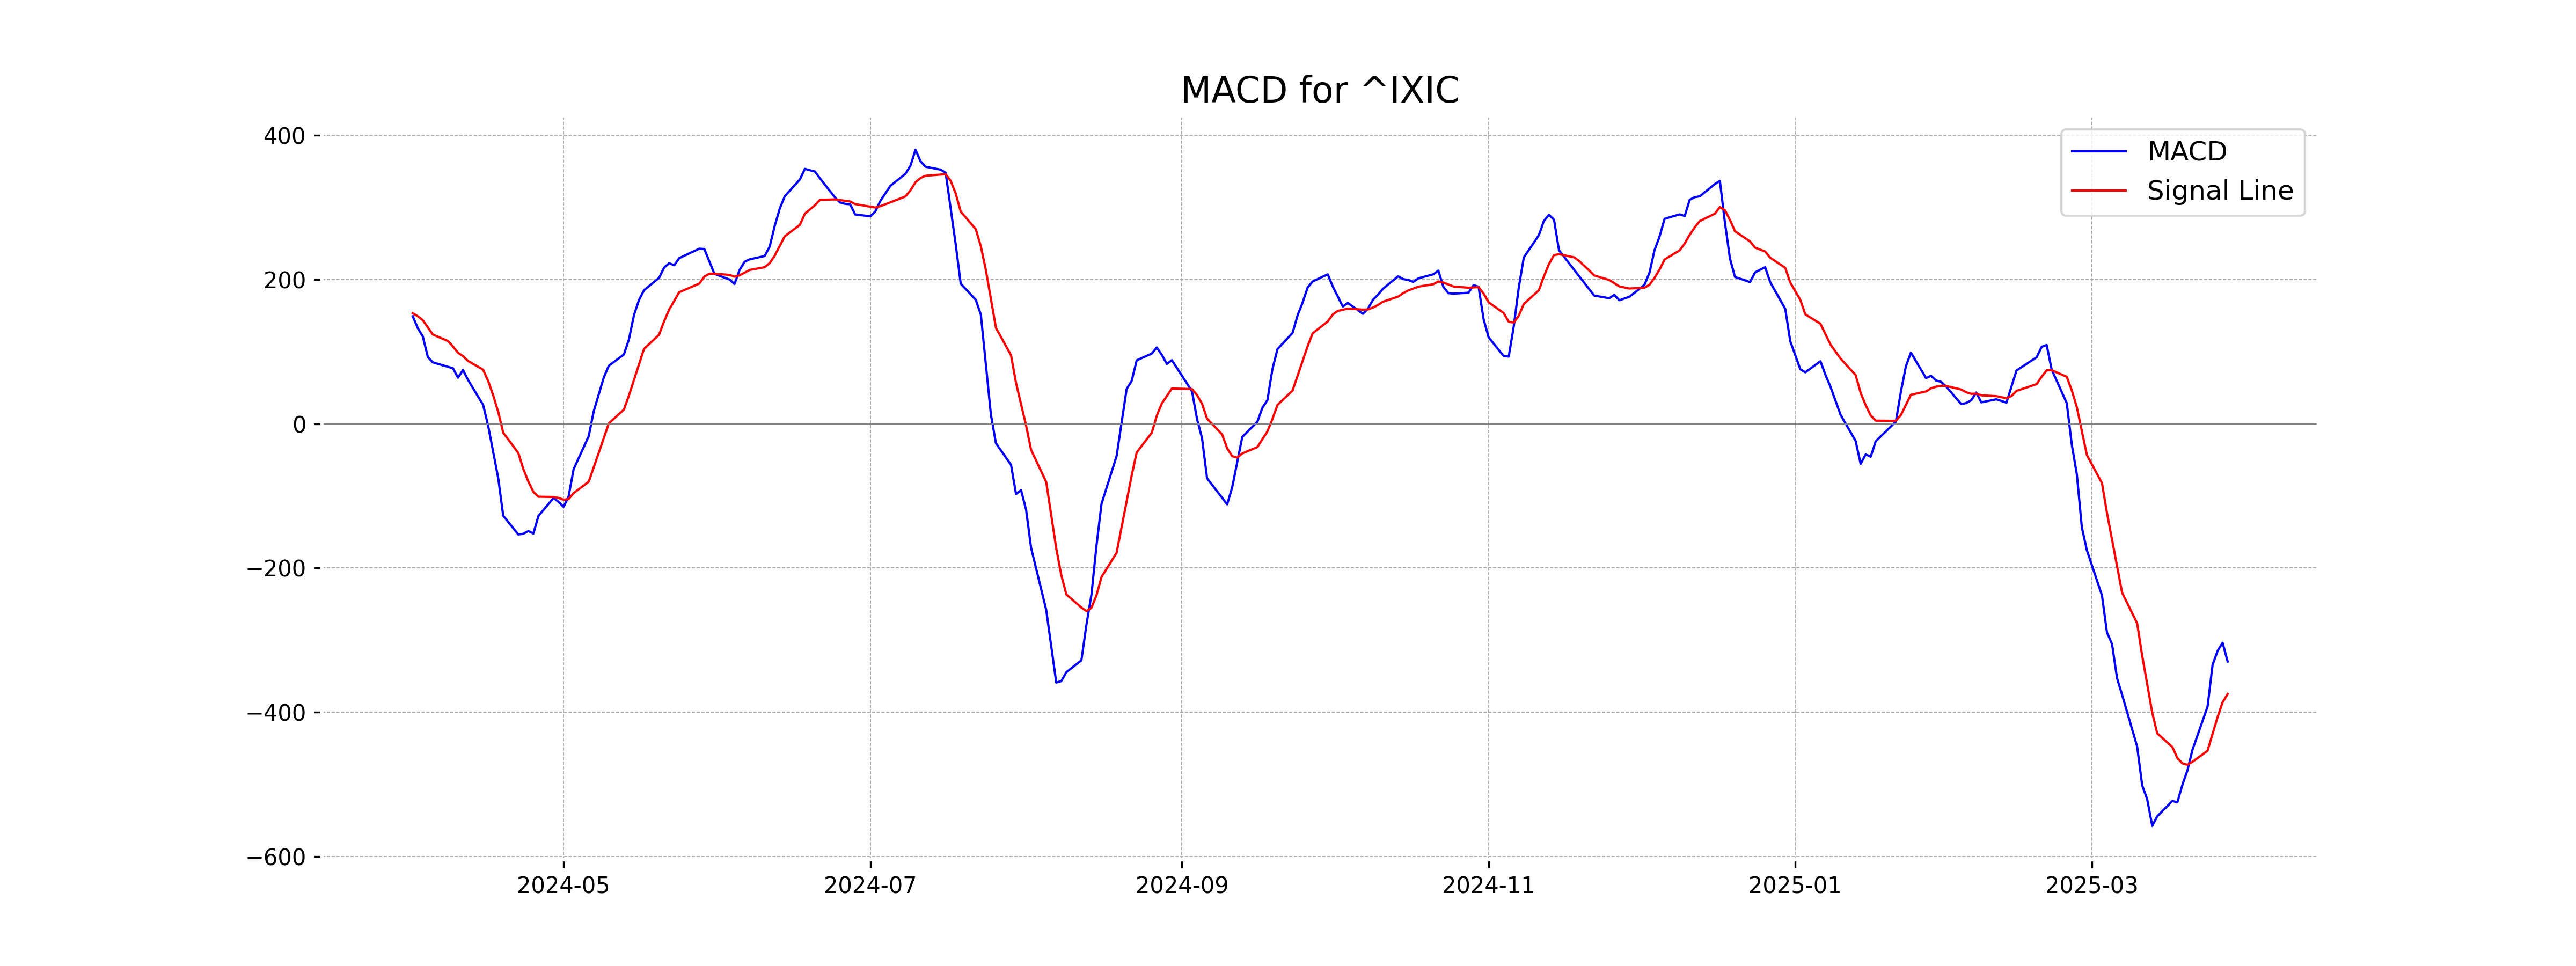
Moving Averages Trend (MACD)
NASDAQ Composite (US) is currently experiencing bearish momentum, as indicated by the MACD value of -329.72 being below the MACD Signal of -374.74. The negative MACD suggests a downward trend, which may continue unless there's a significant change in market conditions.
RSI Analysis
The RSI for NASDAQ Composite is at 36.55, indicating that the market is approaching oversold conditions, as values below 30 generally signal oversold levels. Investors may watch for a potential rebound or further declines depending on market conditions.
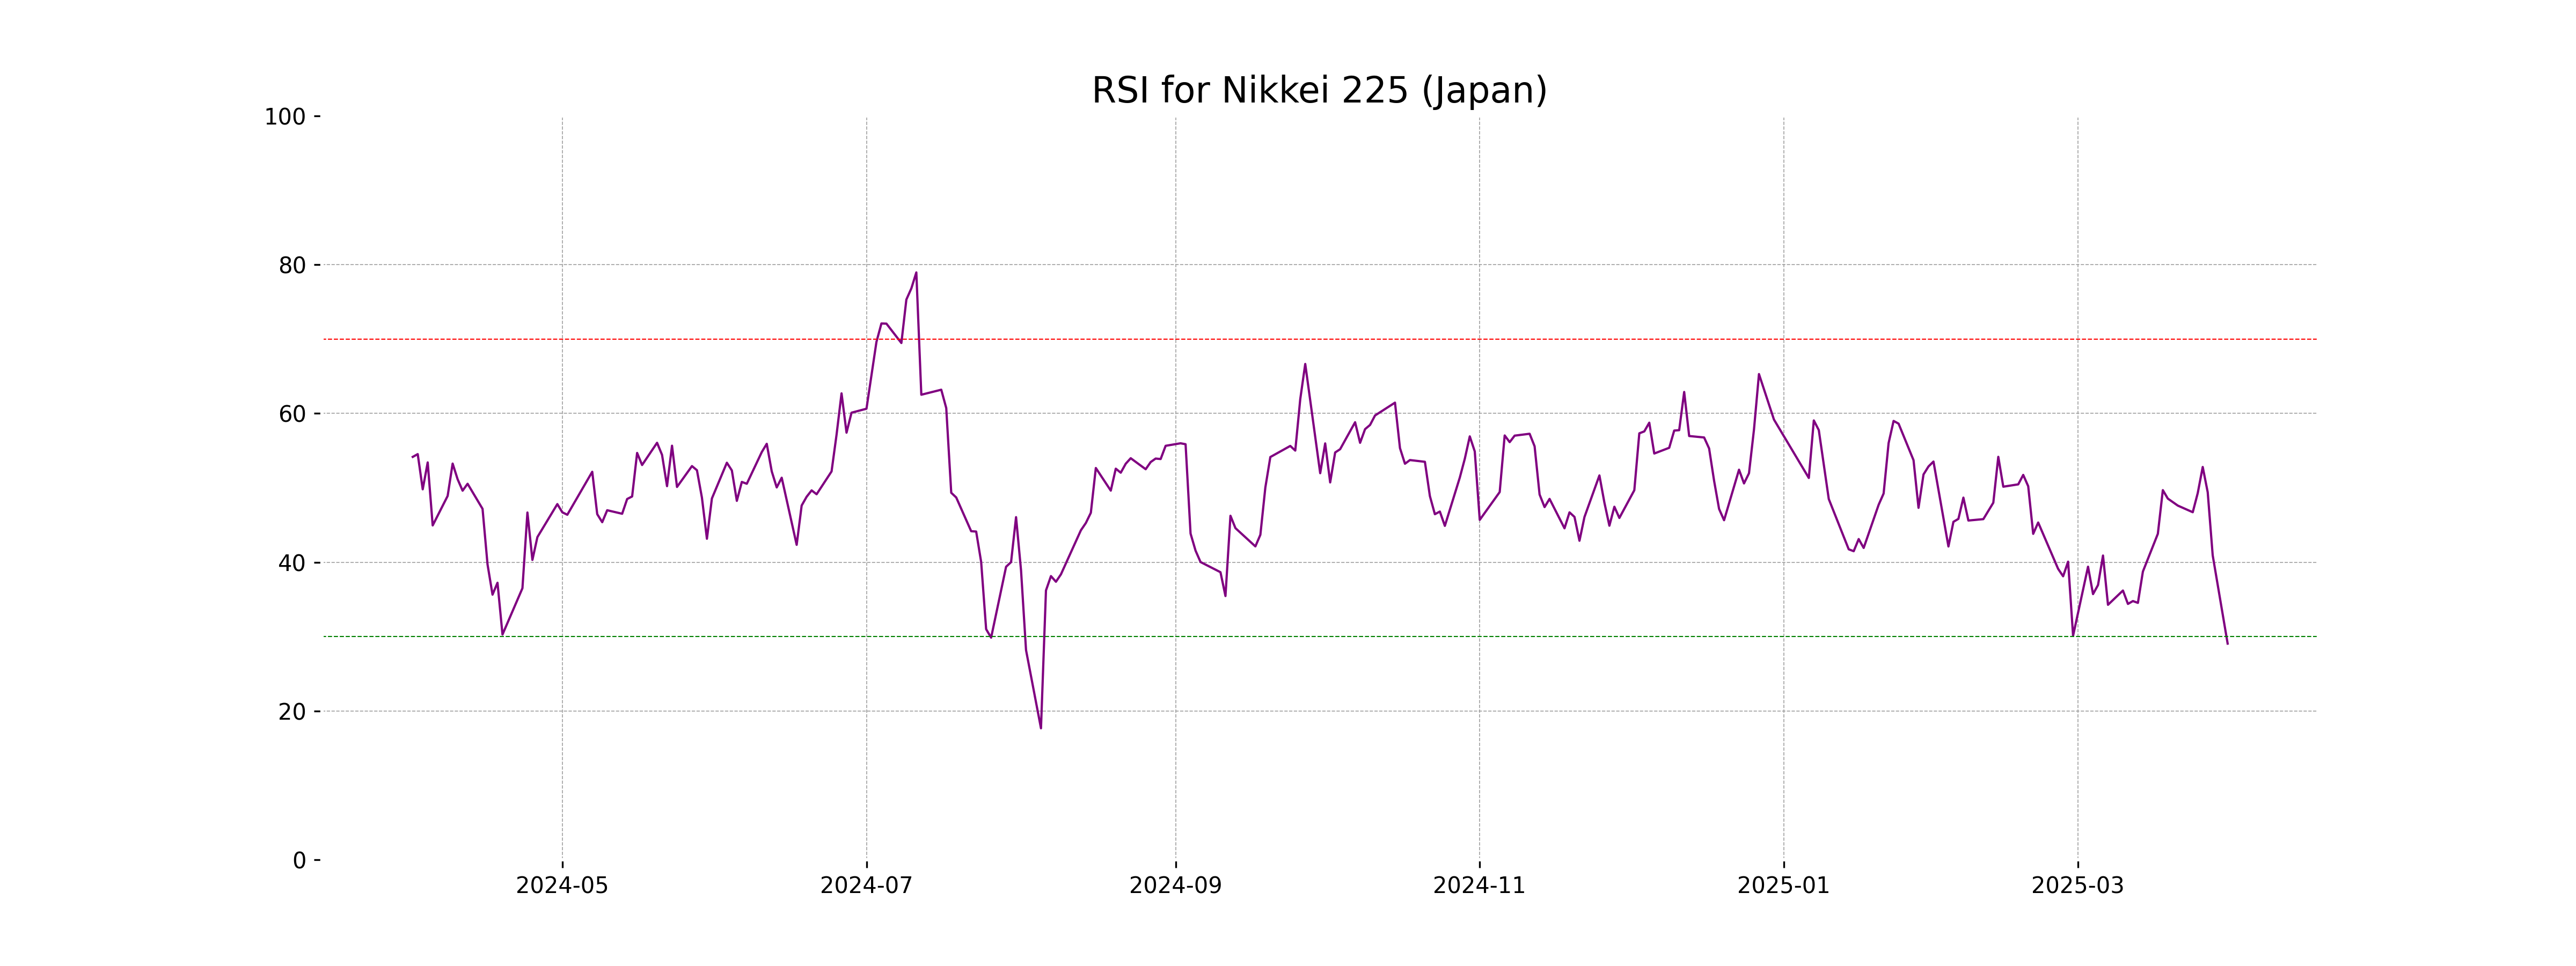
Analysis for Nikkei 225 (Japan) - March 31, 2025
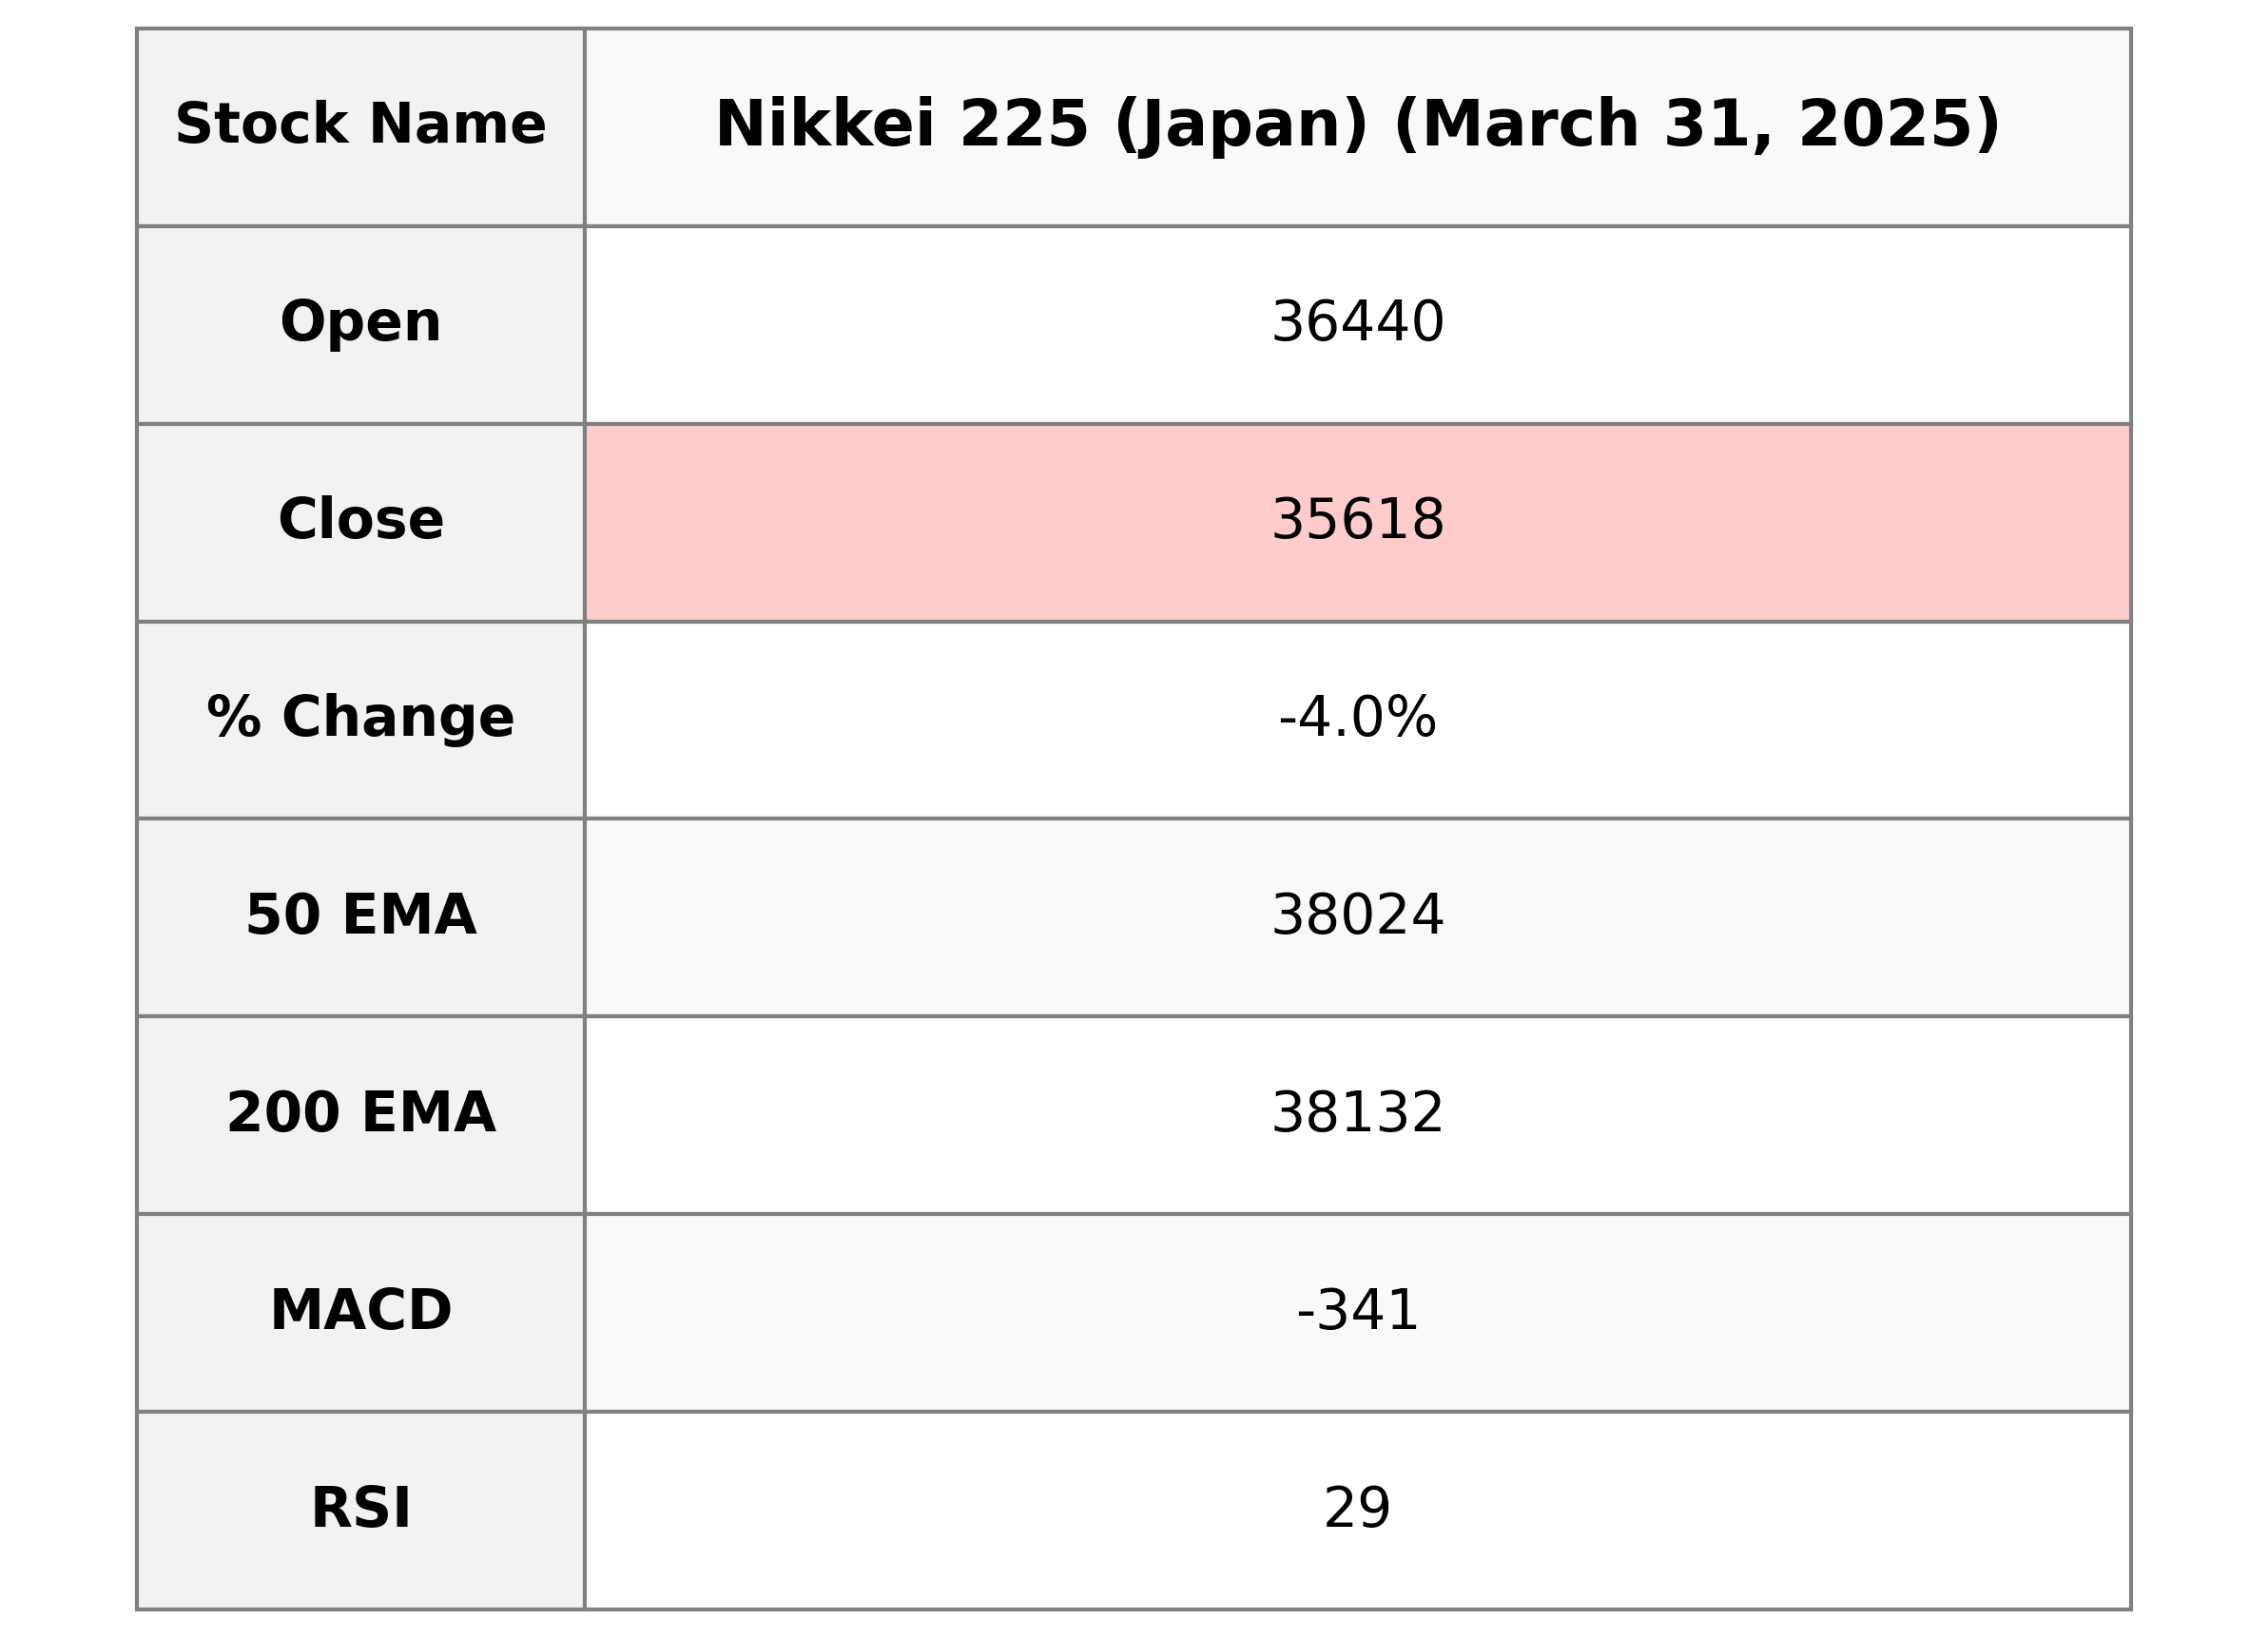
The Nikkei 225 (Japan) index opened at 36440.18, reaching a high of the same value, and closed at 35617.56, representing a percentage change of -4.05% from the previous close of 37120.33. With an RSI of 29.06 indicating oversold conditions, the index also shows a MACD of -340.53 which is below its signal line, reflecting a bearish trend.
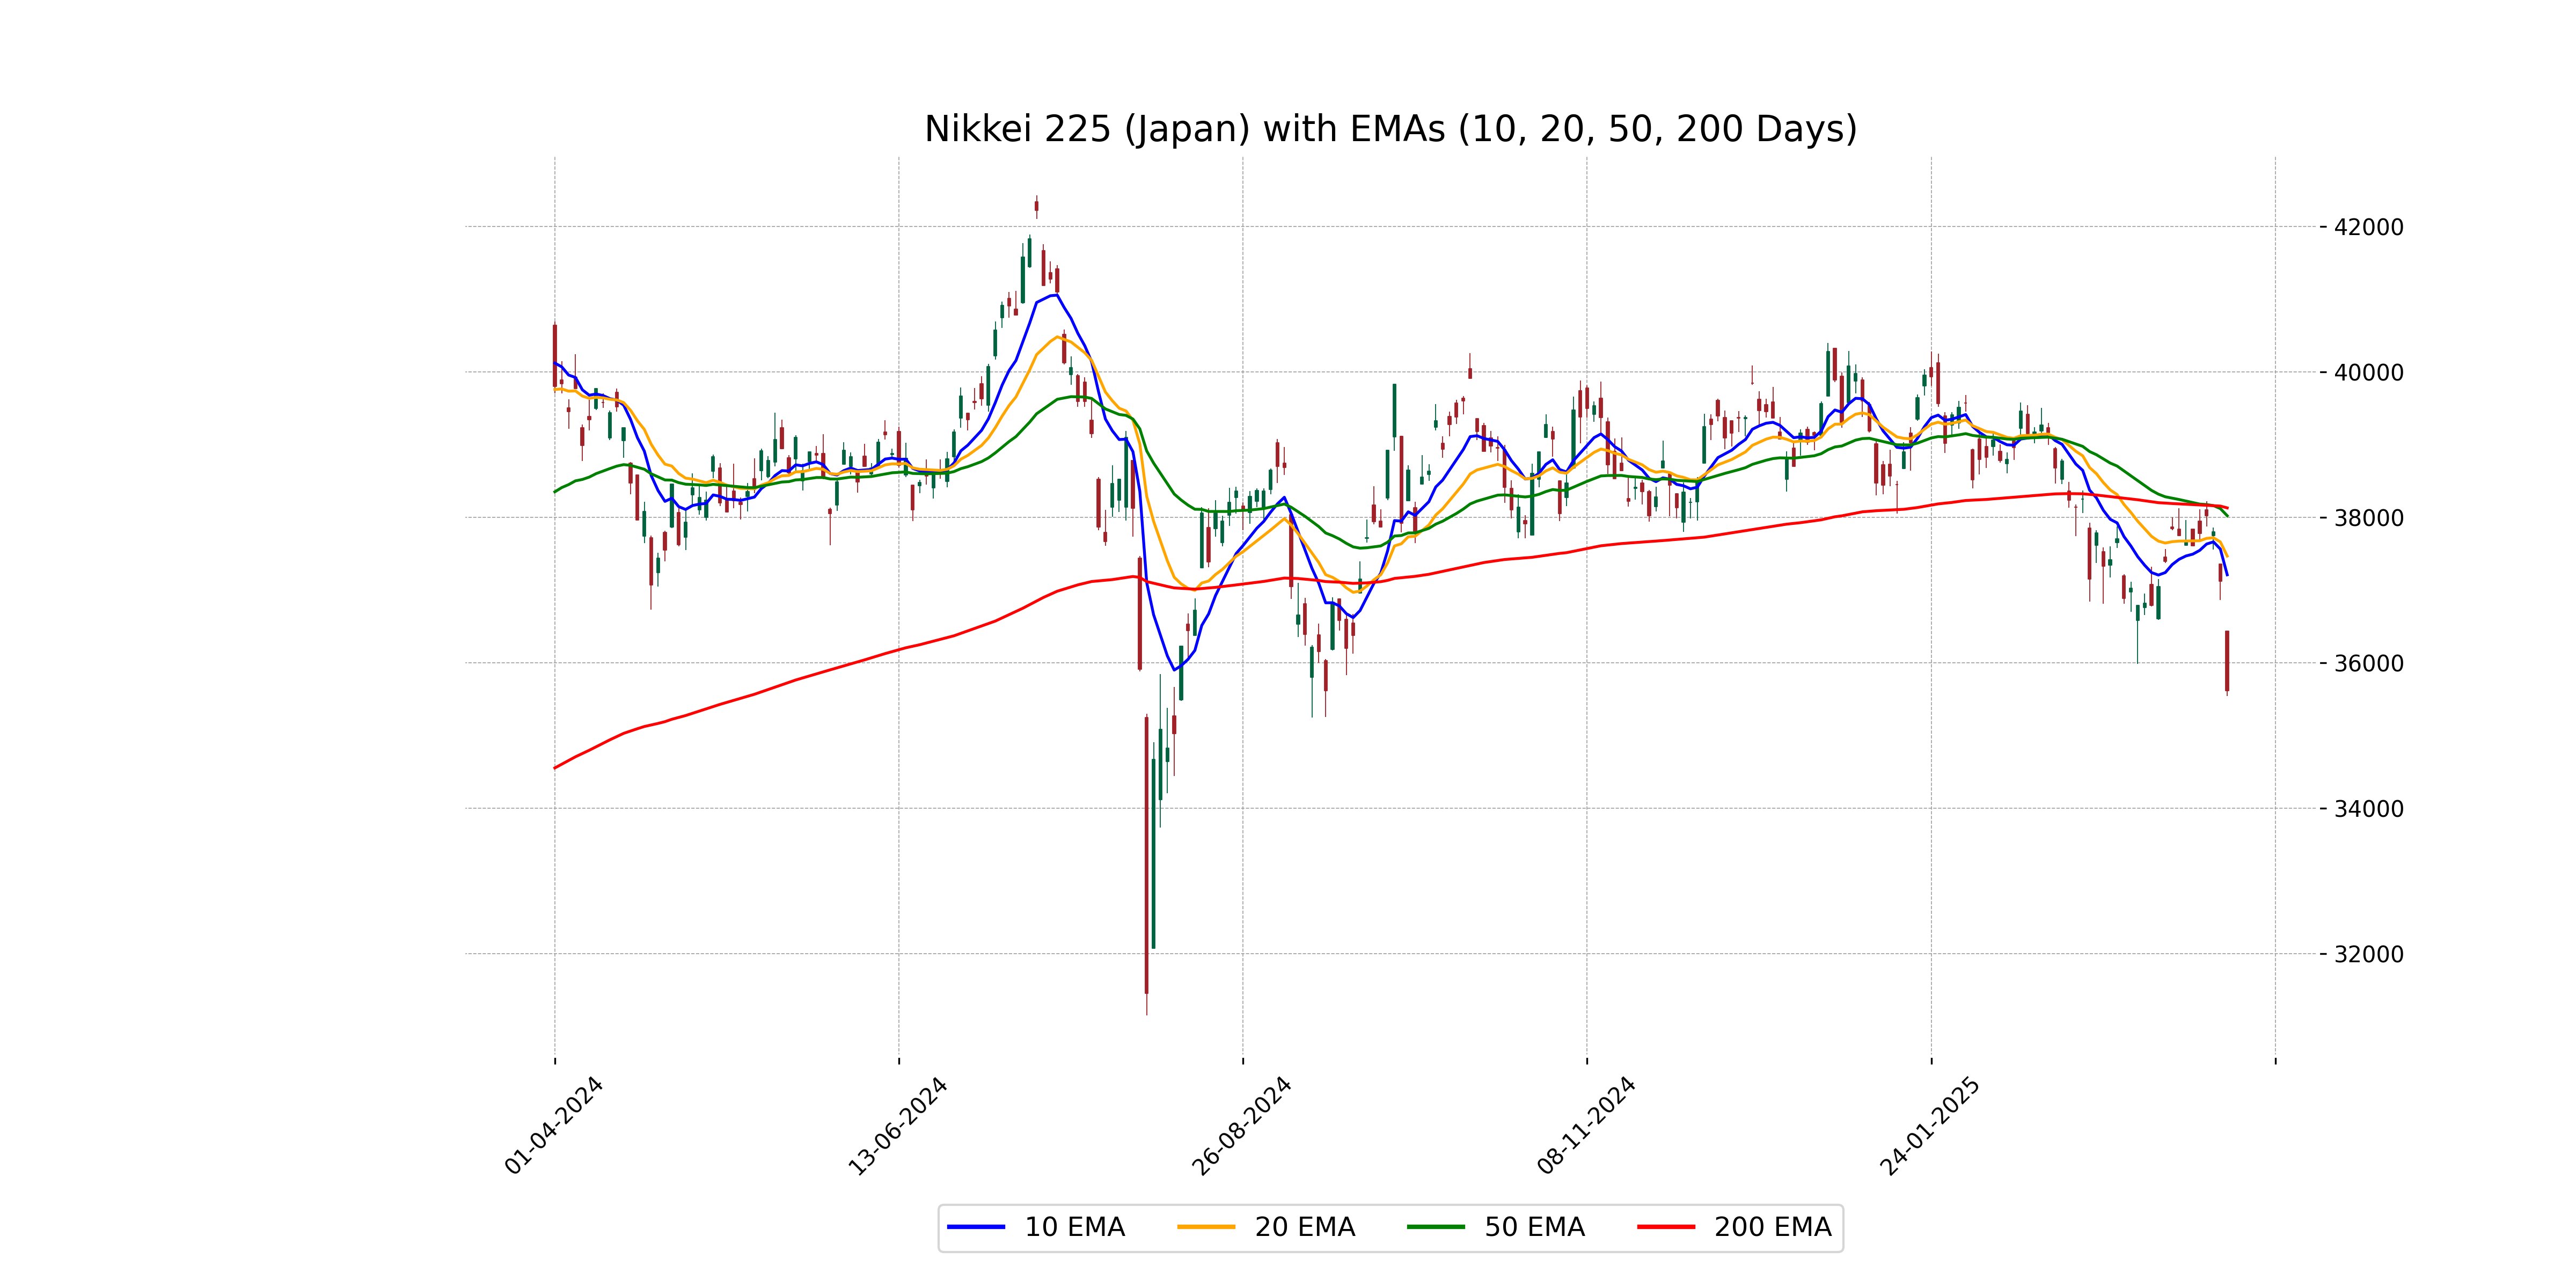
Relationship with Key Moving Averages
The Nikkei 225 is trading below its 50-day EMA (38,023.94), 200-day EMA (38,131.74), 10-day EMA (37,211.57), and 20-day EMA (37,468.94), indicating a bearish trend. Additionally, the RSI value of 29.06 suggests the index is in oversold territory.
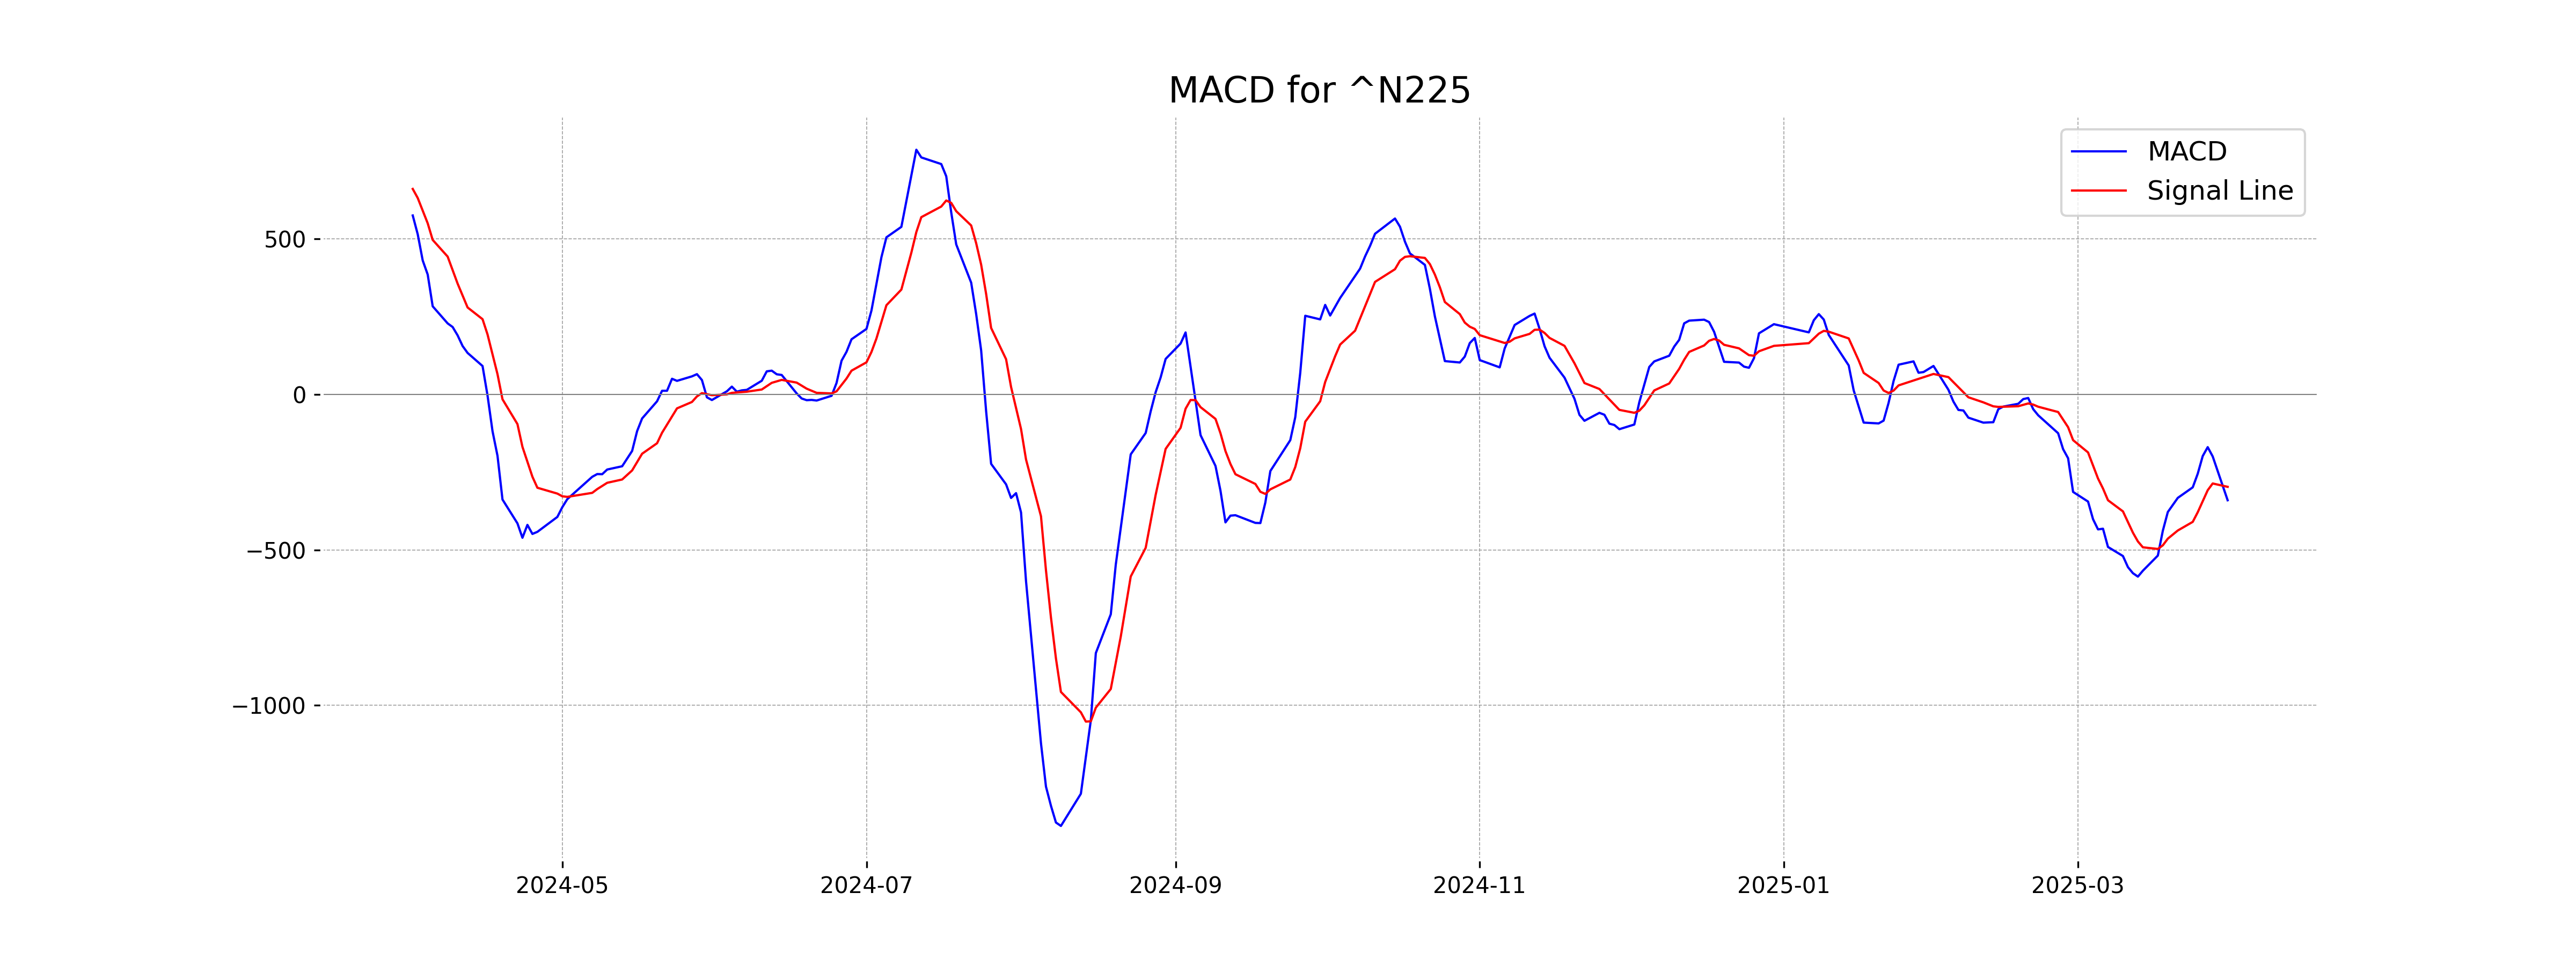
Moving Averages Trend (MACD)
The MACD for Nikkei 225 shows a bearish signal with a value of -340.53, which is below the MACD Signal line at -297.36. This indicates potential downward momentum as the MACD line is further diverging from the signal.
RSI Analysis
The RSI of Nikkei 225 (Japan) is 29.06, which suggests that the index is in the oversold territory, typically indicating a potential for a price reversal or a relief rally. However, further analysis and confirmation from other indicators are recommended before making any trading decisions.
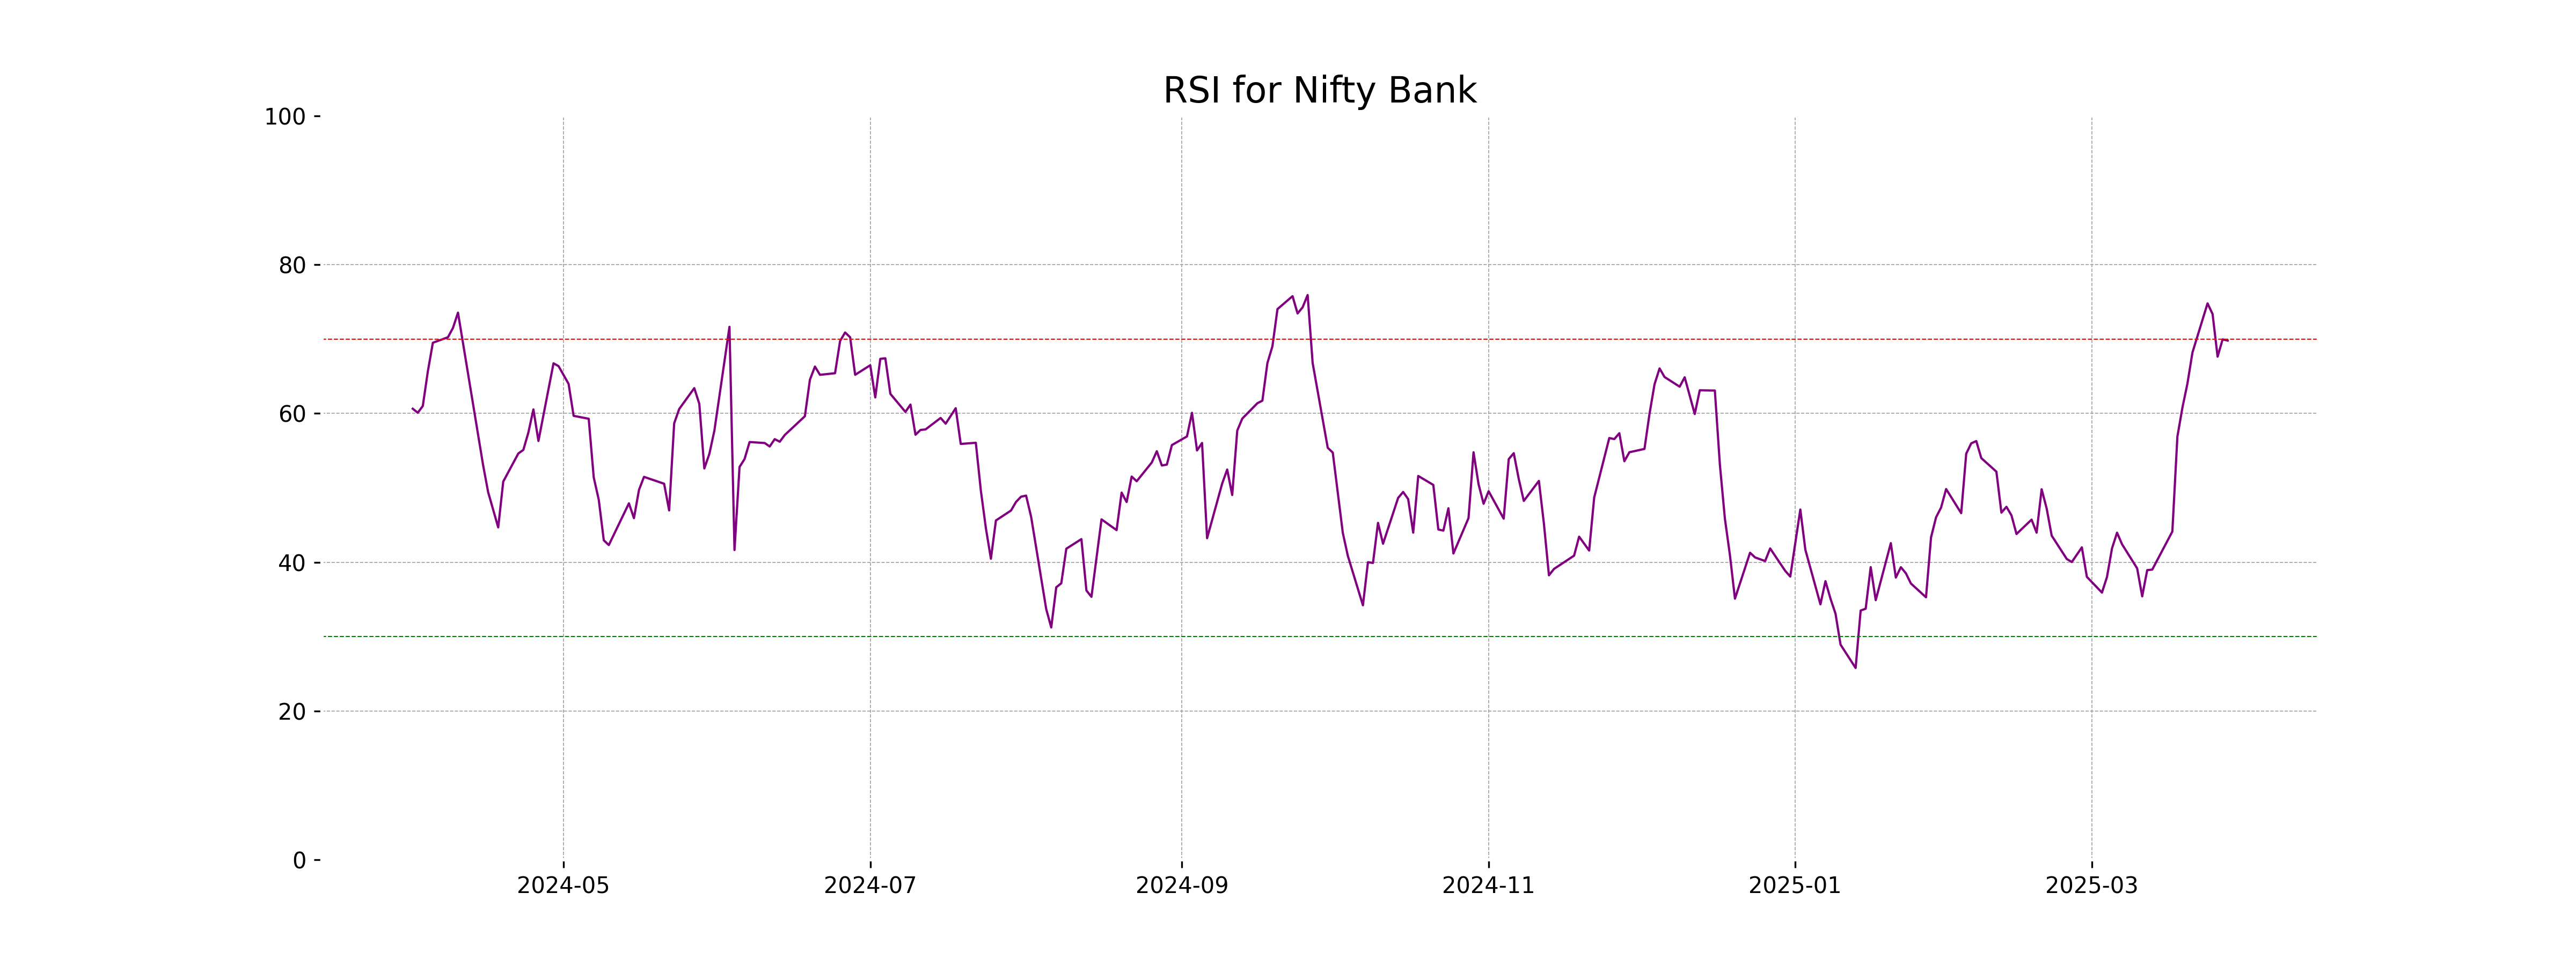
Analysis for Nifty Bank - March 31, 2025
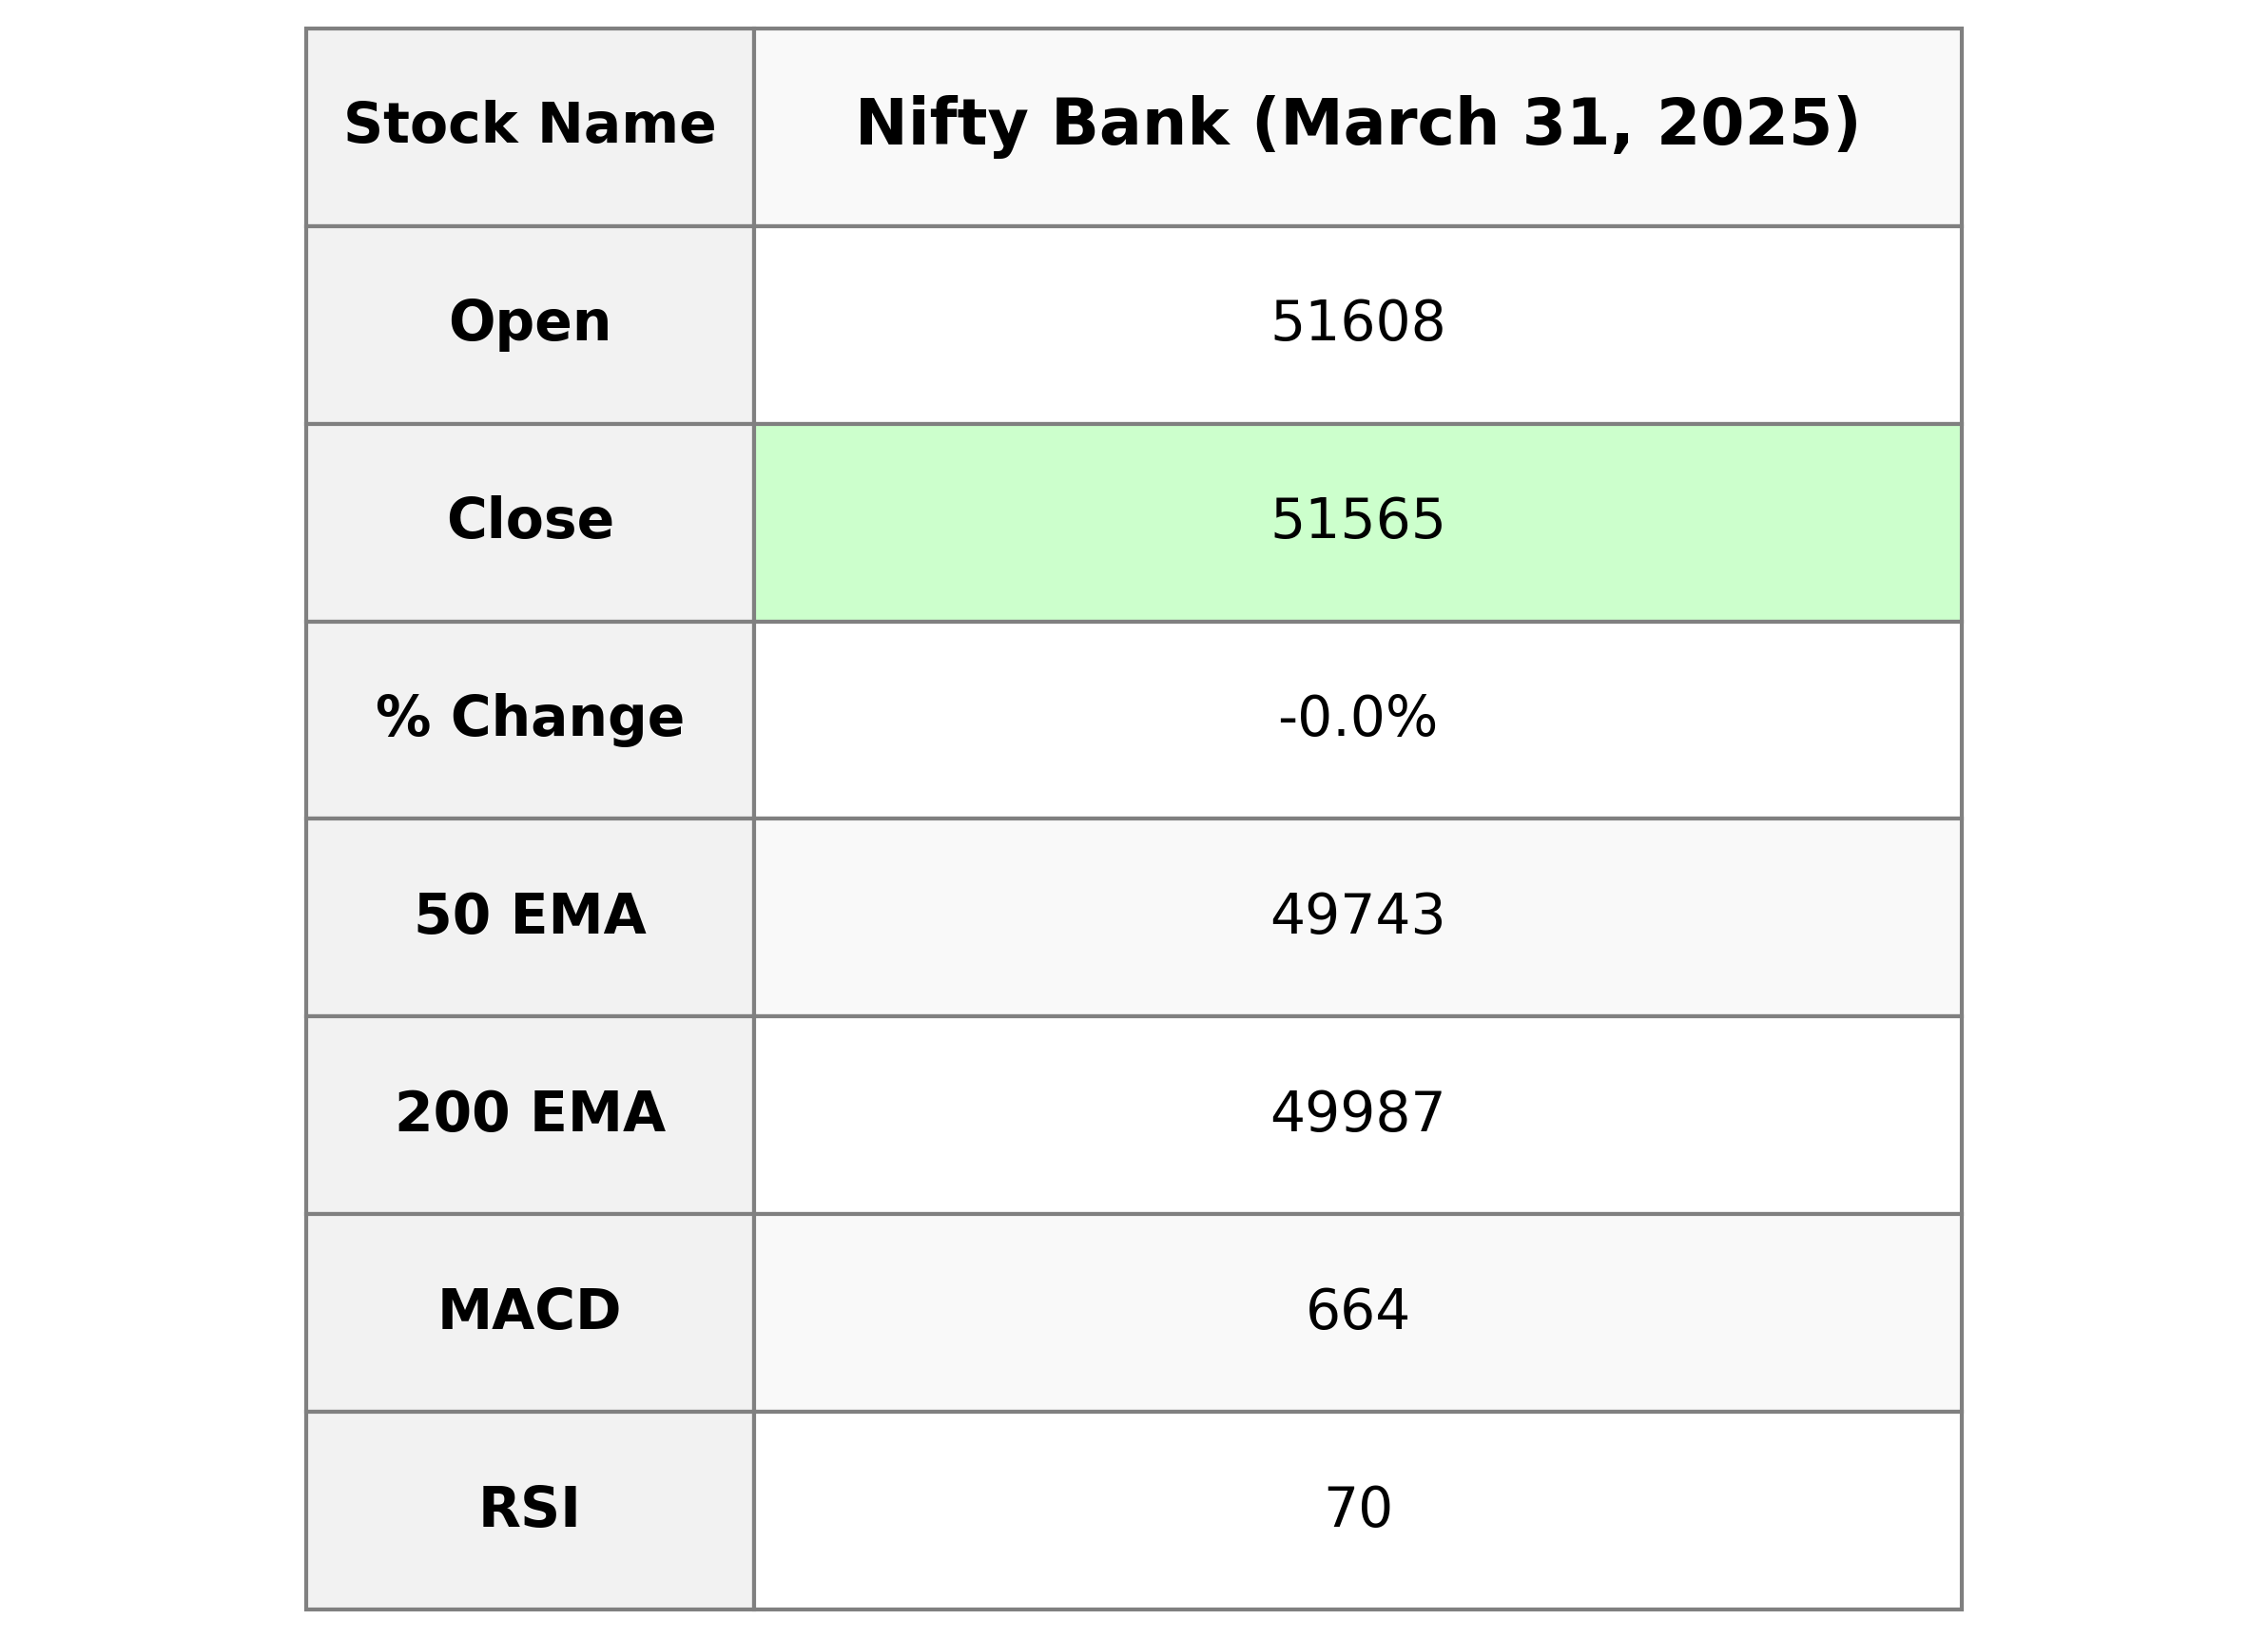
The Nifty Bank index opened at 51608.40 and closed slightly lower at 51564.85 with a minor decrease of 0.02%, reflecting a points change of -11. The RSI is at 69.80, indicating a strong momentum, while the MACD stands at 663.67, higher than the MACD Signal of 316.90, suggesting a positive trend. The volume observed was 171,200, and the index is trading above its 50, 20, and 10-day EMAs, showing a bullish sentiment.
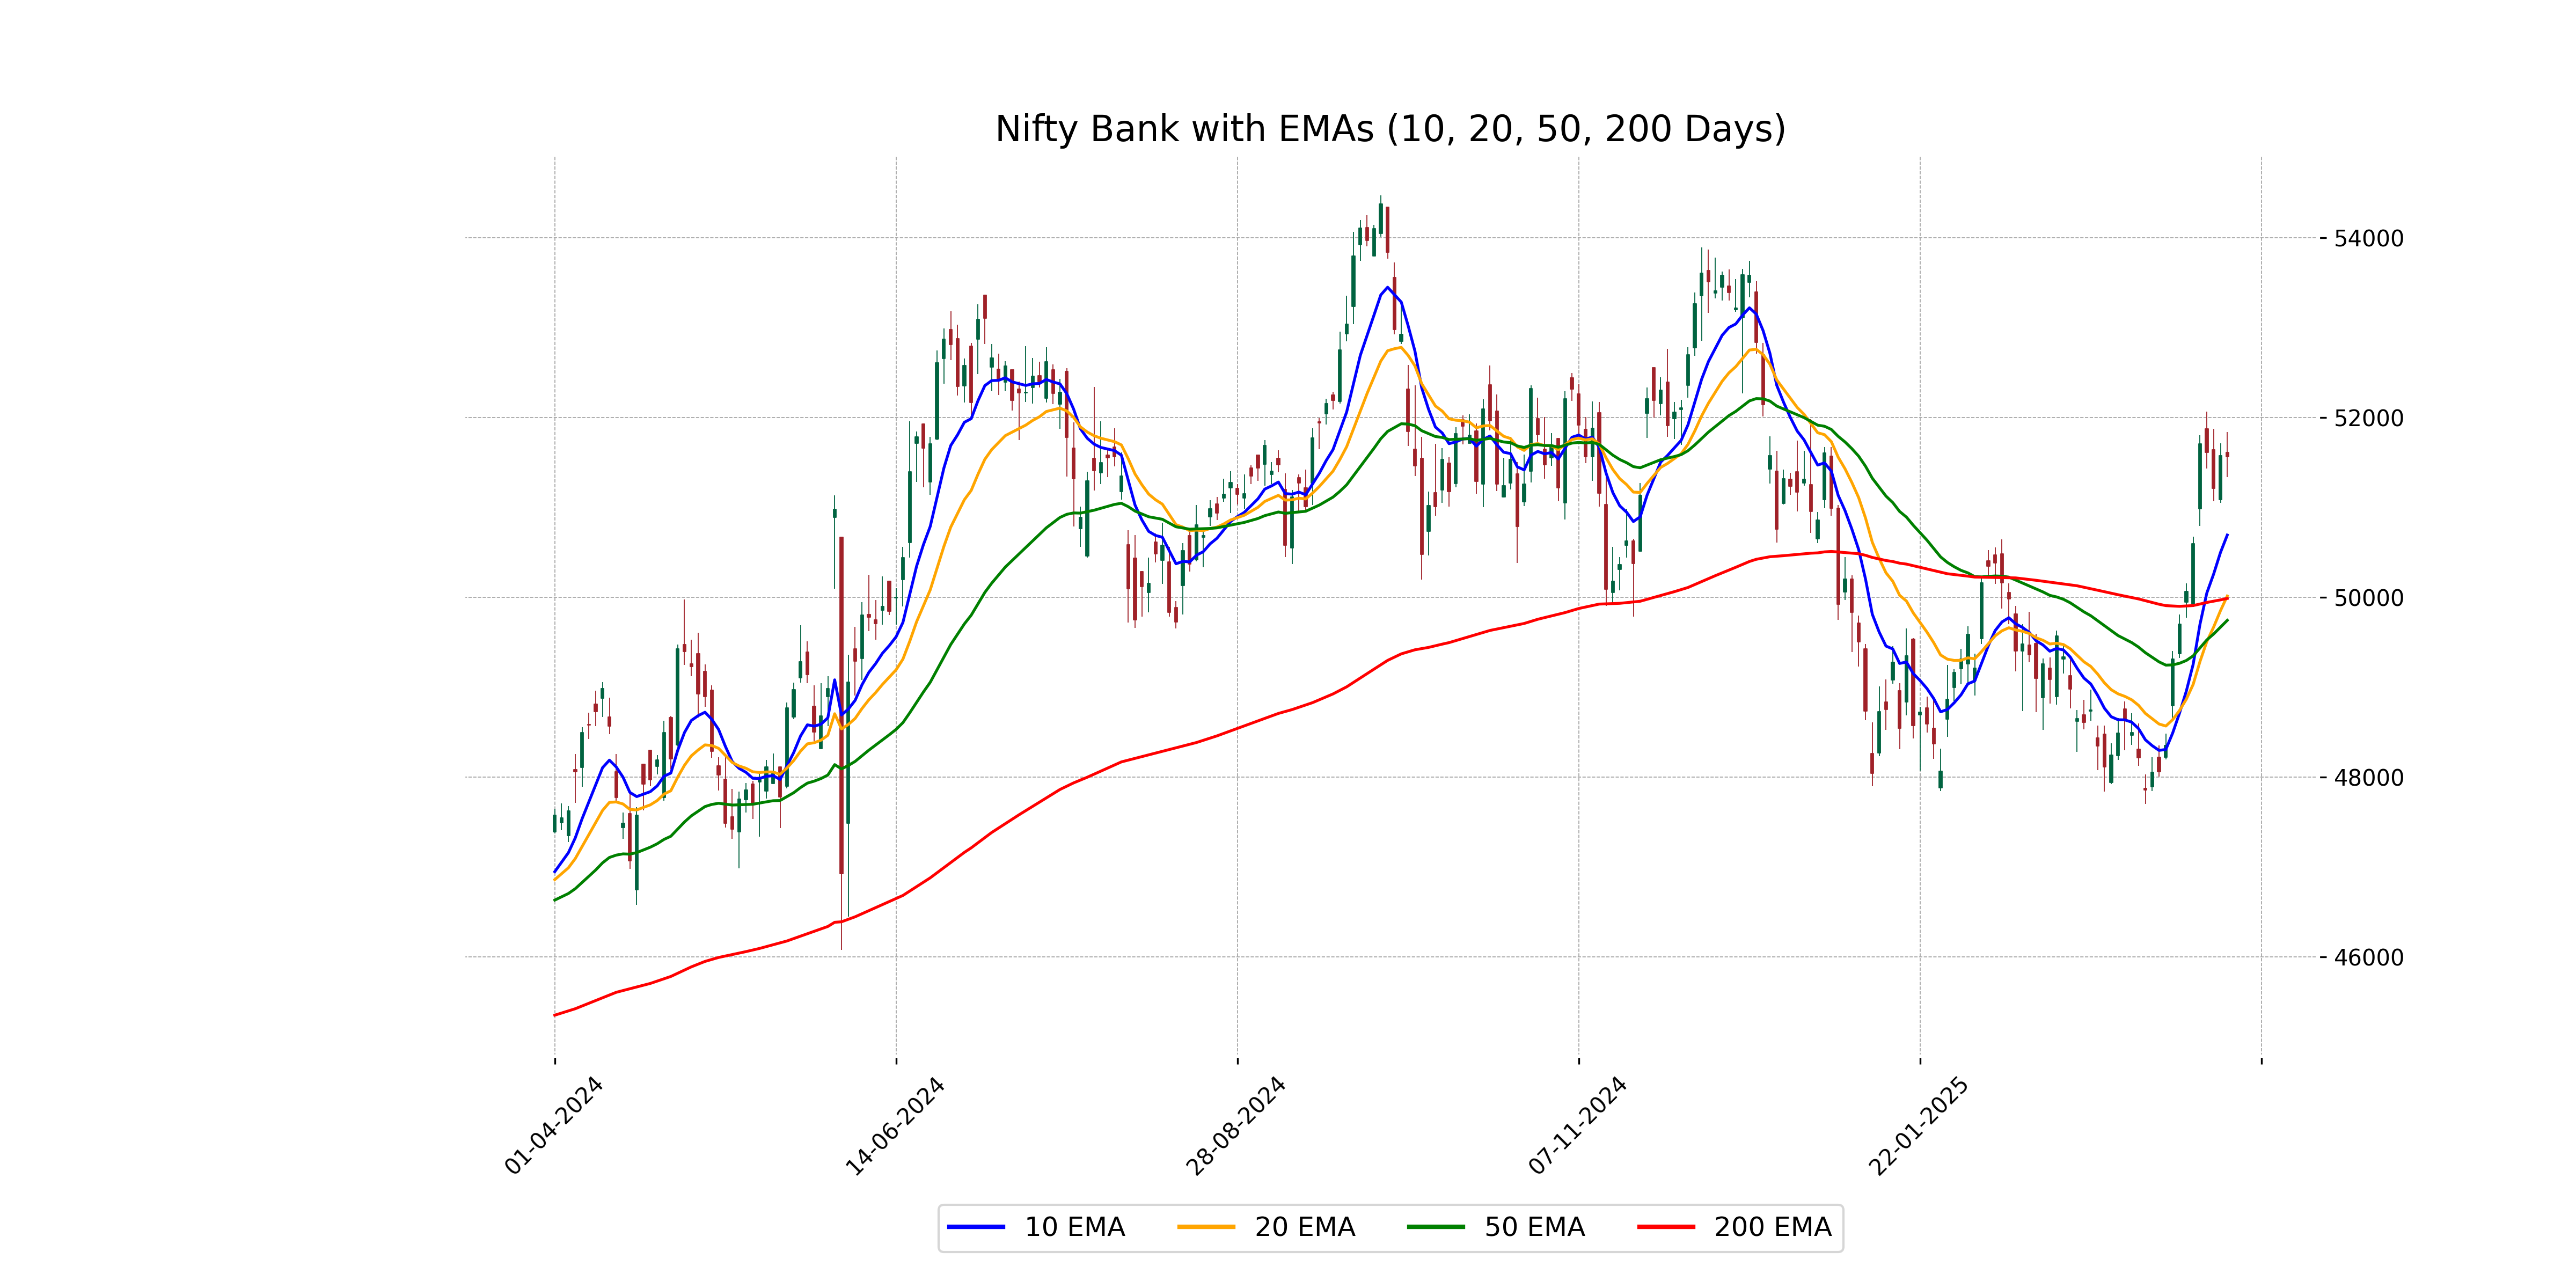
Relationship with Key Moving Averages
Nifty Bank closed at 51,564.85, near its 10-day EMA of 50,691.73, indicating potential upward momentum. It remains above both the 50-day EMA of 49,743.46 and the 200-day EMA of 49,986.79, suggesting a strong bullish trend.
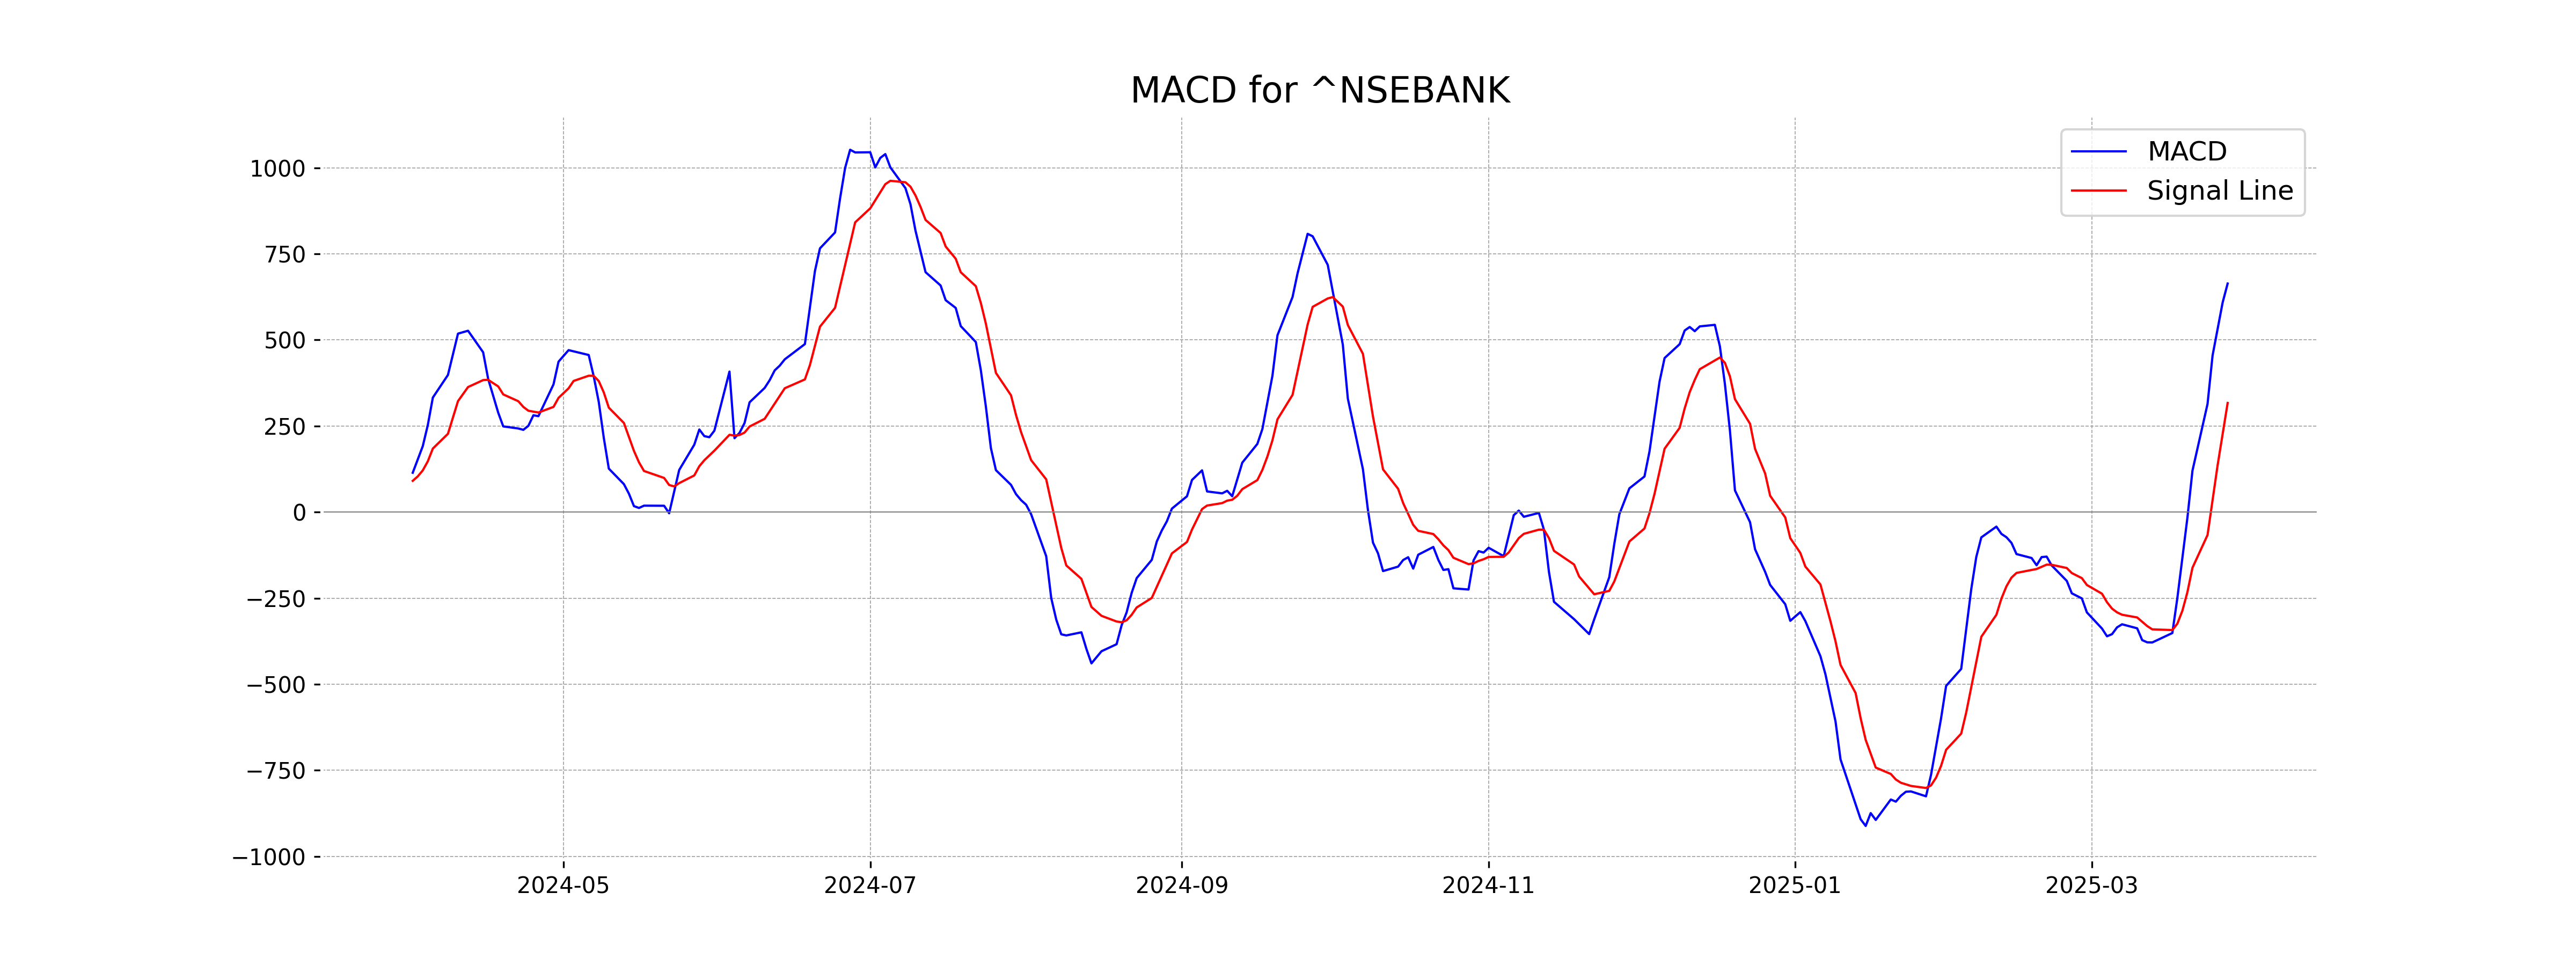
Moving Averages Trend (MACD)
Nifty Bank shows a positive MACD value of 663.67, which is above the MACD Signal of 316.90, suggesting a bullish momentum. The MACD histogram indicates that the upward momentum might continue, but the slight decrease in closing price suggests caution.
RSI Analysis
The RSI for Nifty Bank is 69.80, which is close to the overbought threshold of 70. This suggests that the index could be nearing overbought conditions, indicating potential for a downward correction or consolidation in the near future.
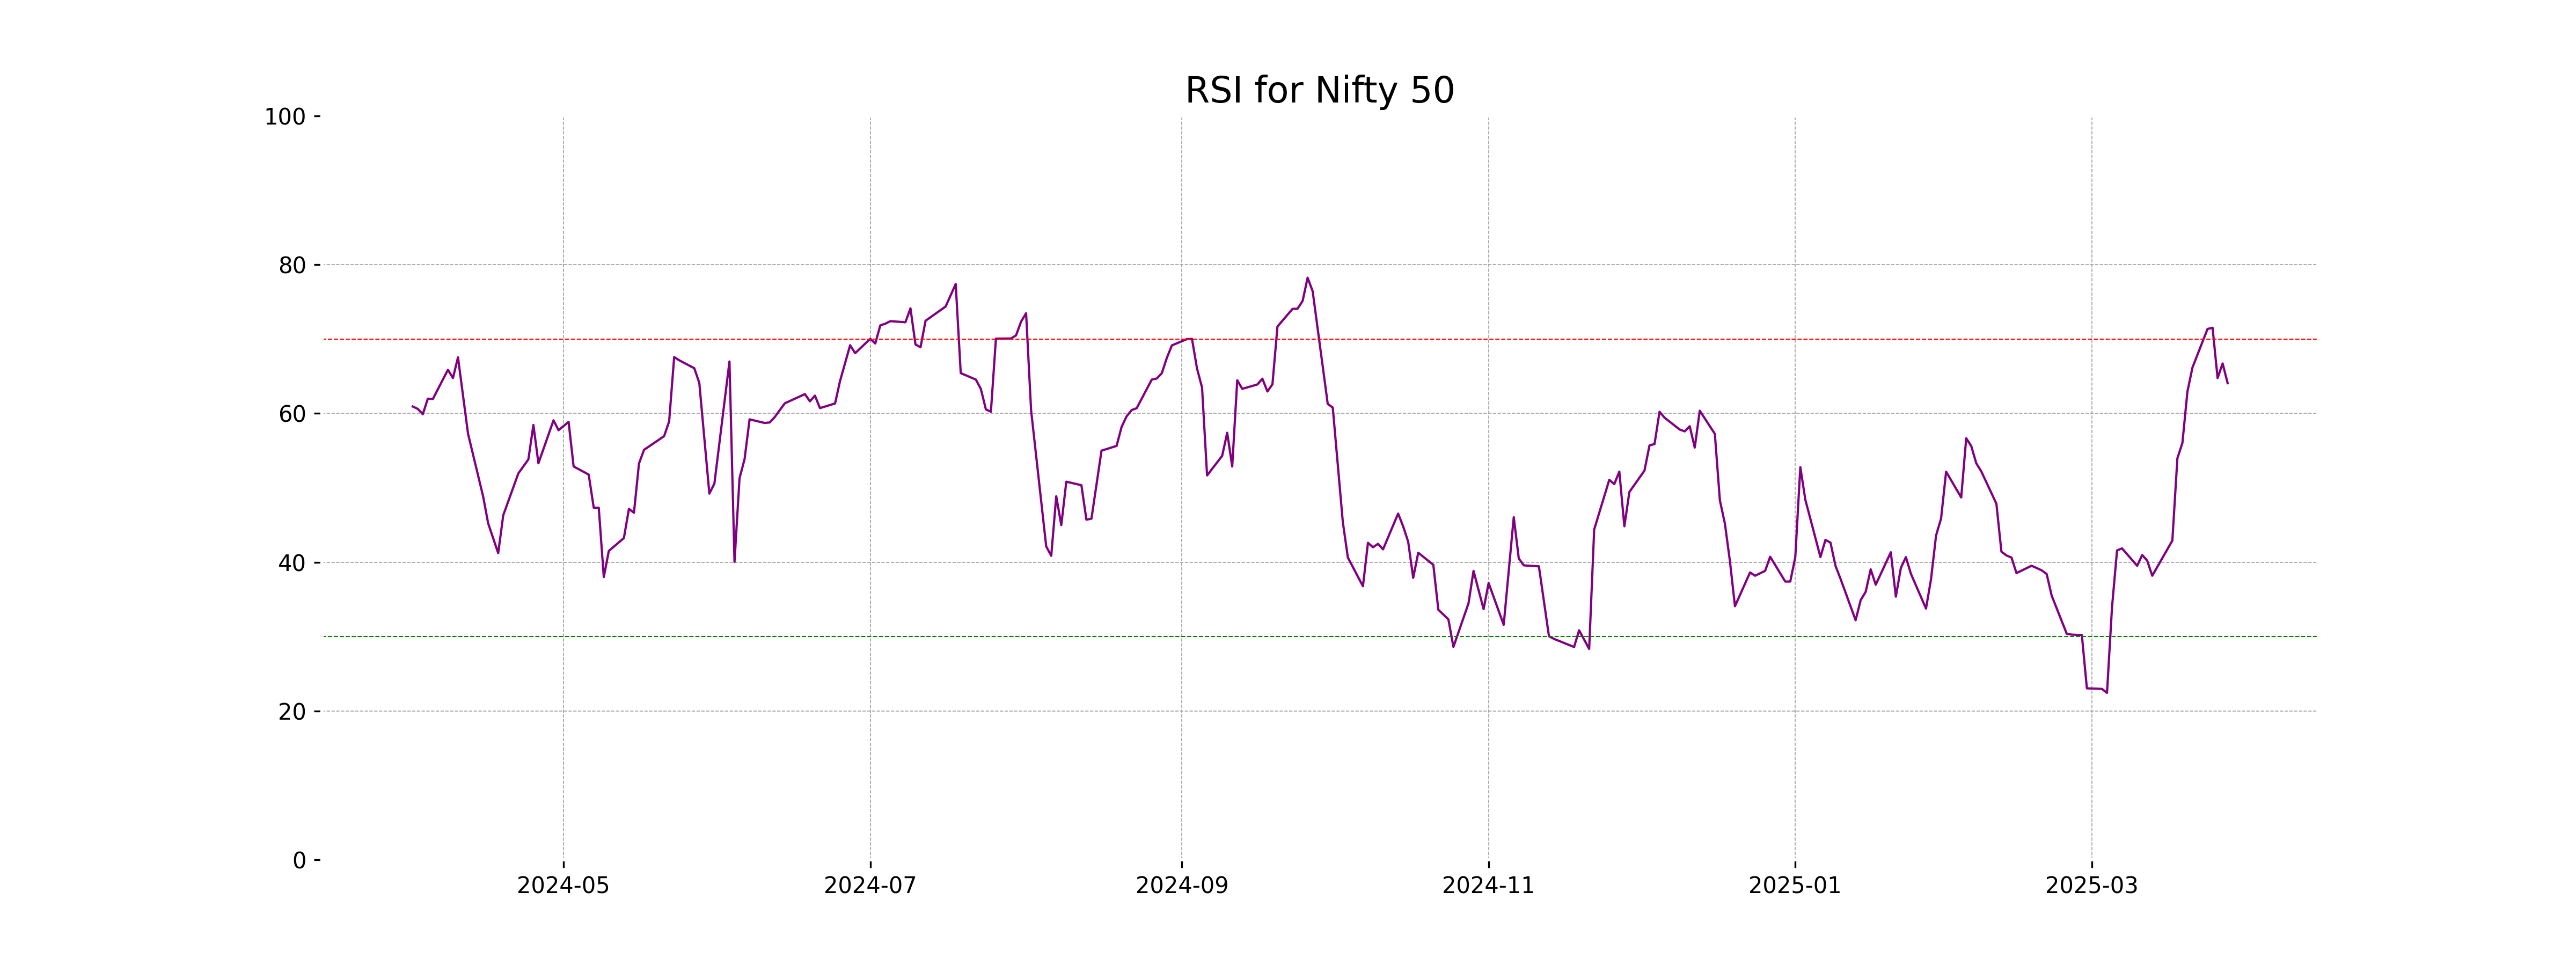
Analysis for Nifty 50 - March 31, 2025

Nifty 50 opened at 23,600.40, reached a high of 23,649.20, and closed slightly lower at 23,519.35, marking a decrease of 0.31% from the previous close. Despite the current drop, the 50 EMA is above 23,115, and the 200 EMA suggests moderate strength at 23,410, with a healthy RSI of 64.07 indicating bullish momentum.
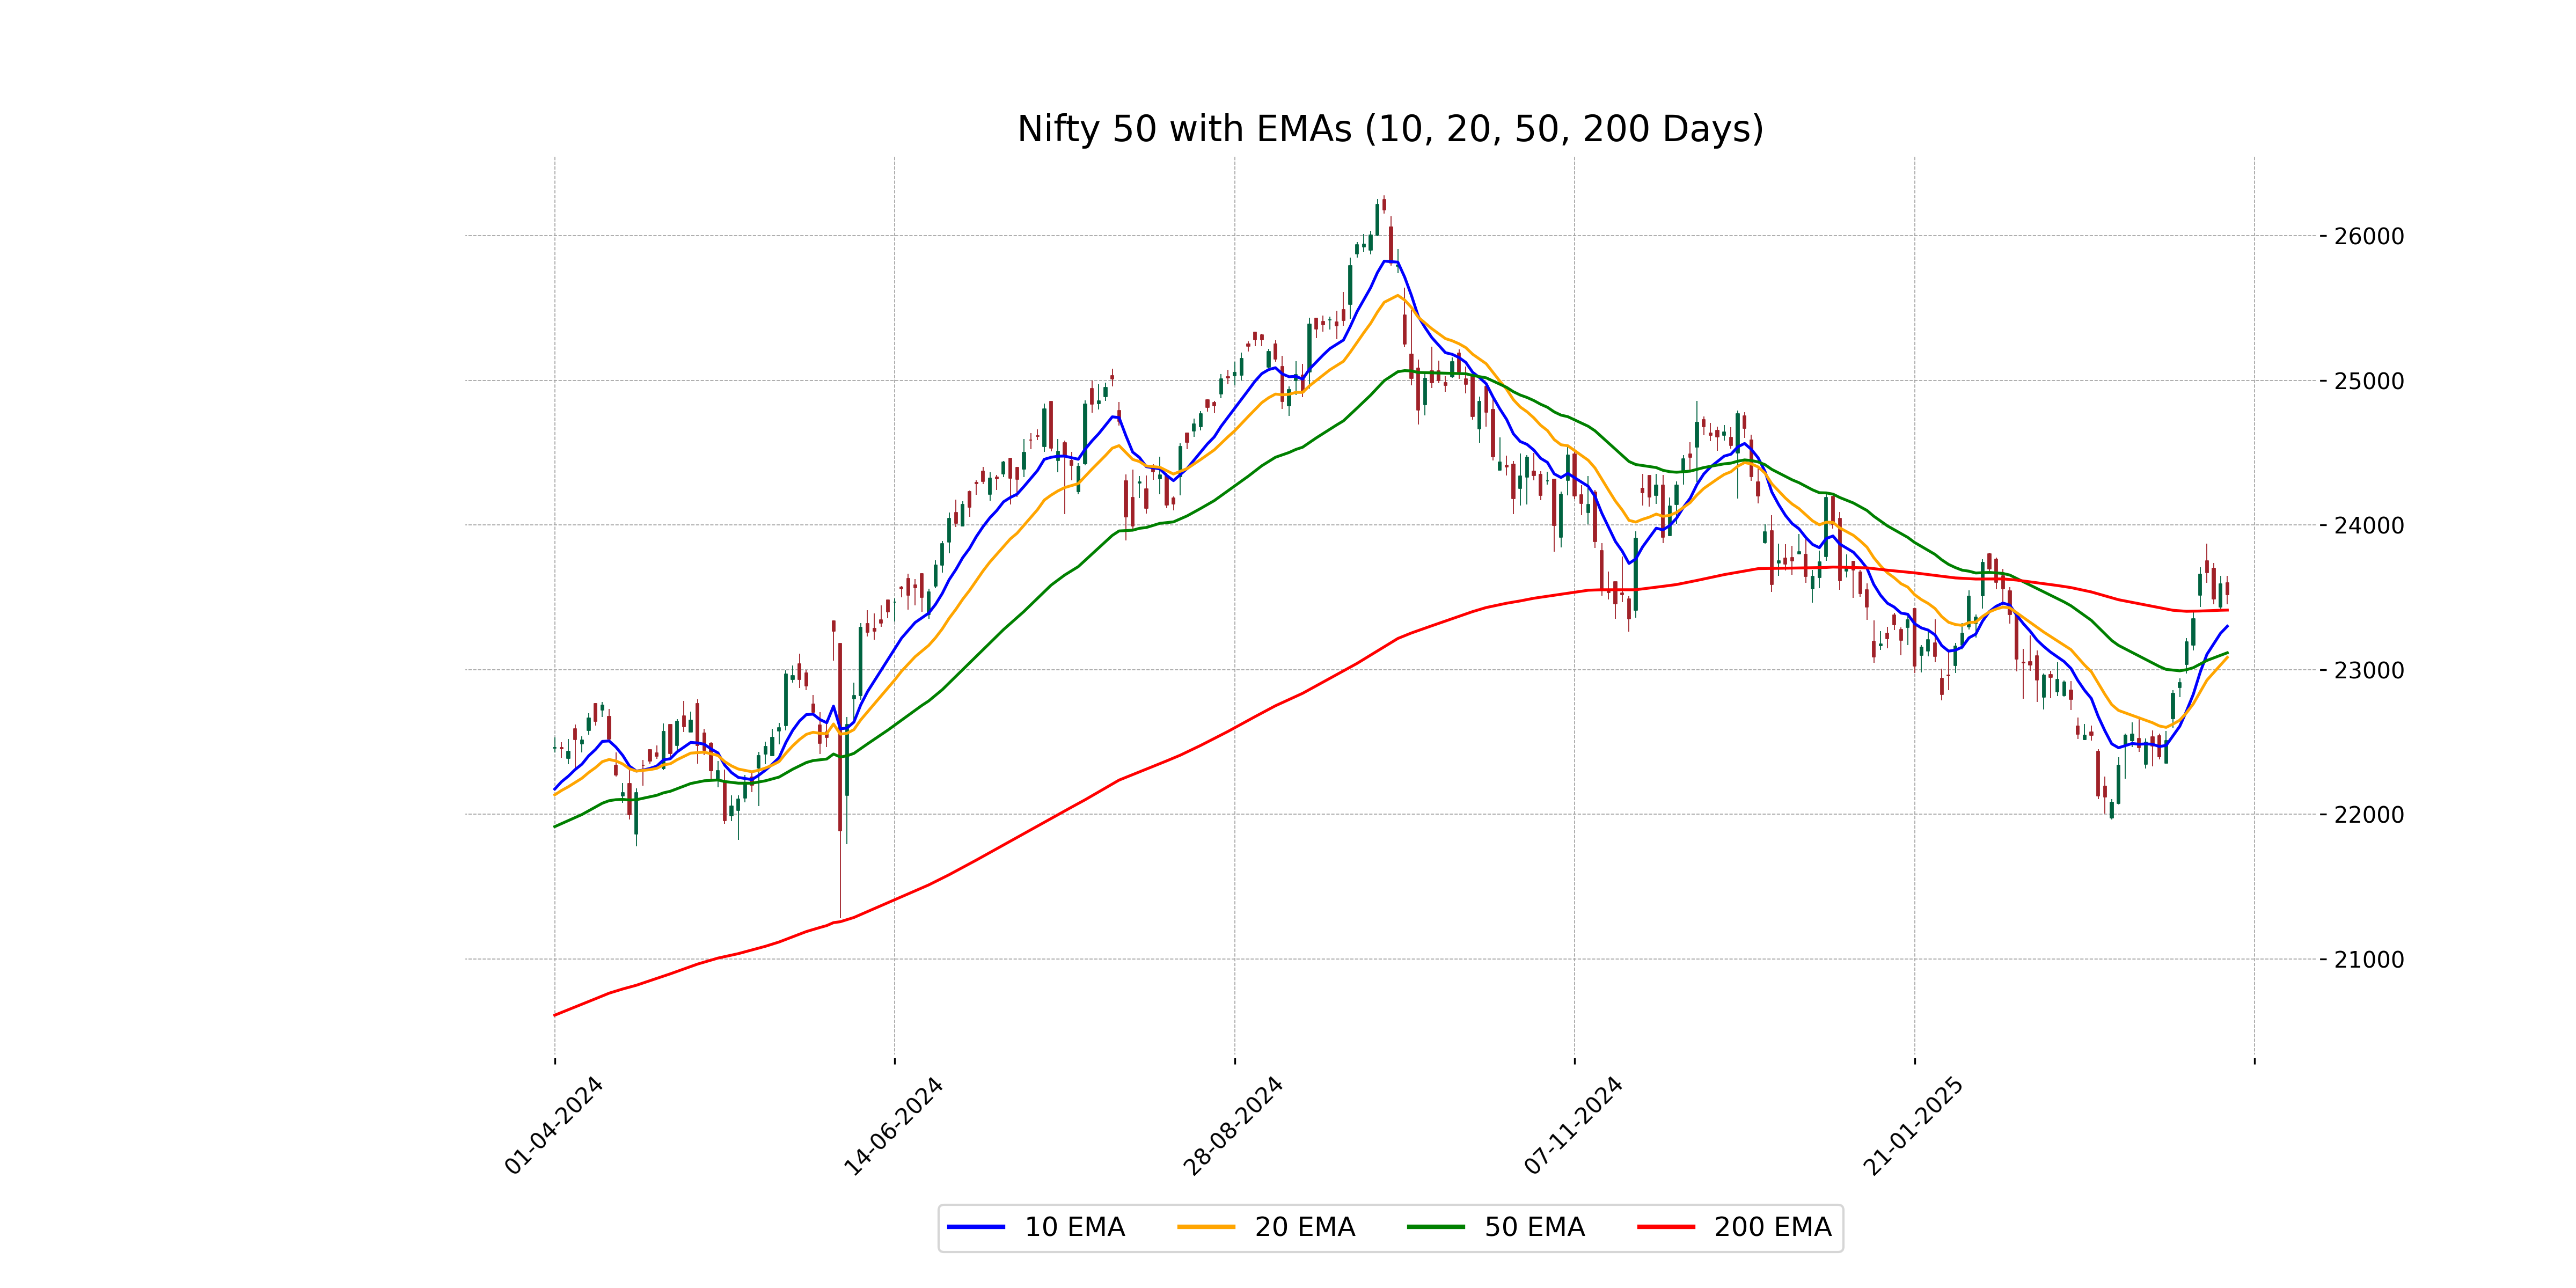
Relationship with Key Moving Averages
The Nifty 50's current close of 23,519.35 is above its 20-day EMA of 23,083.91 and the 10-day EMA of 23,299.32, indicating a short-term positive trend. However, it is close to the 50-day EMA of 23,115.95, suggesting a consolidation phase. Additionally, it remains above the 200-day EMA of 23,410.94, which signifies a potential long-term bullish trend.
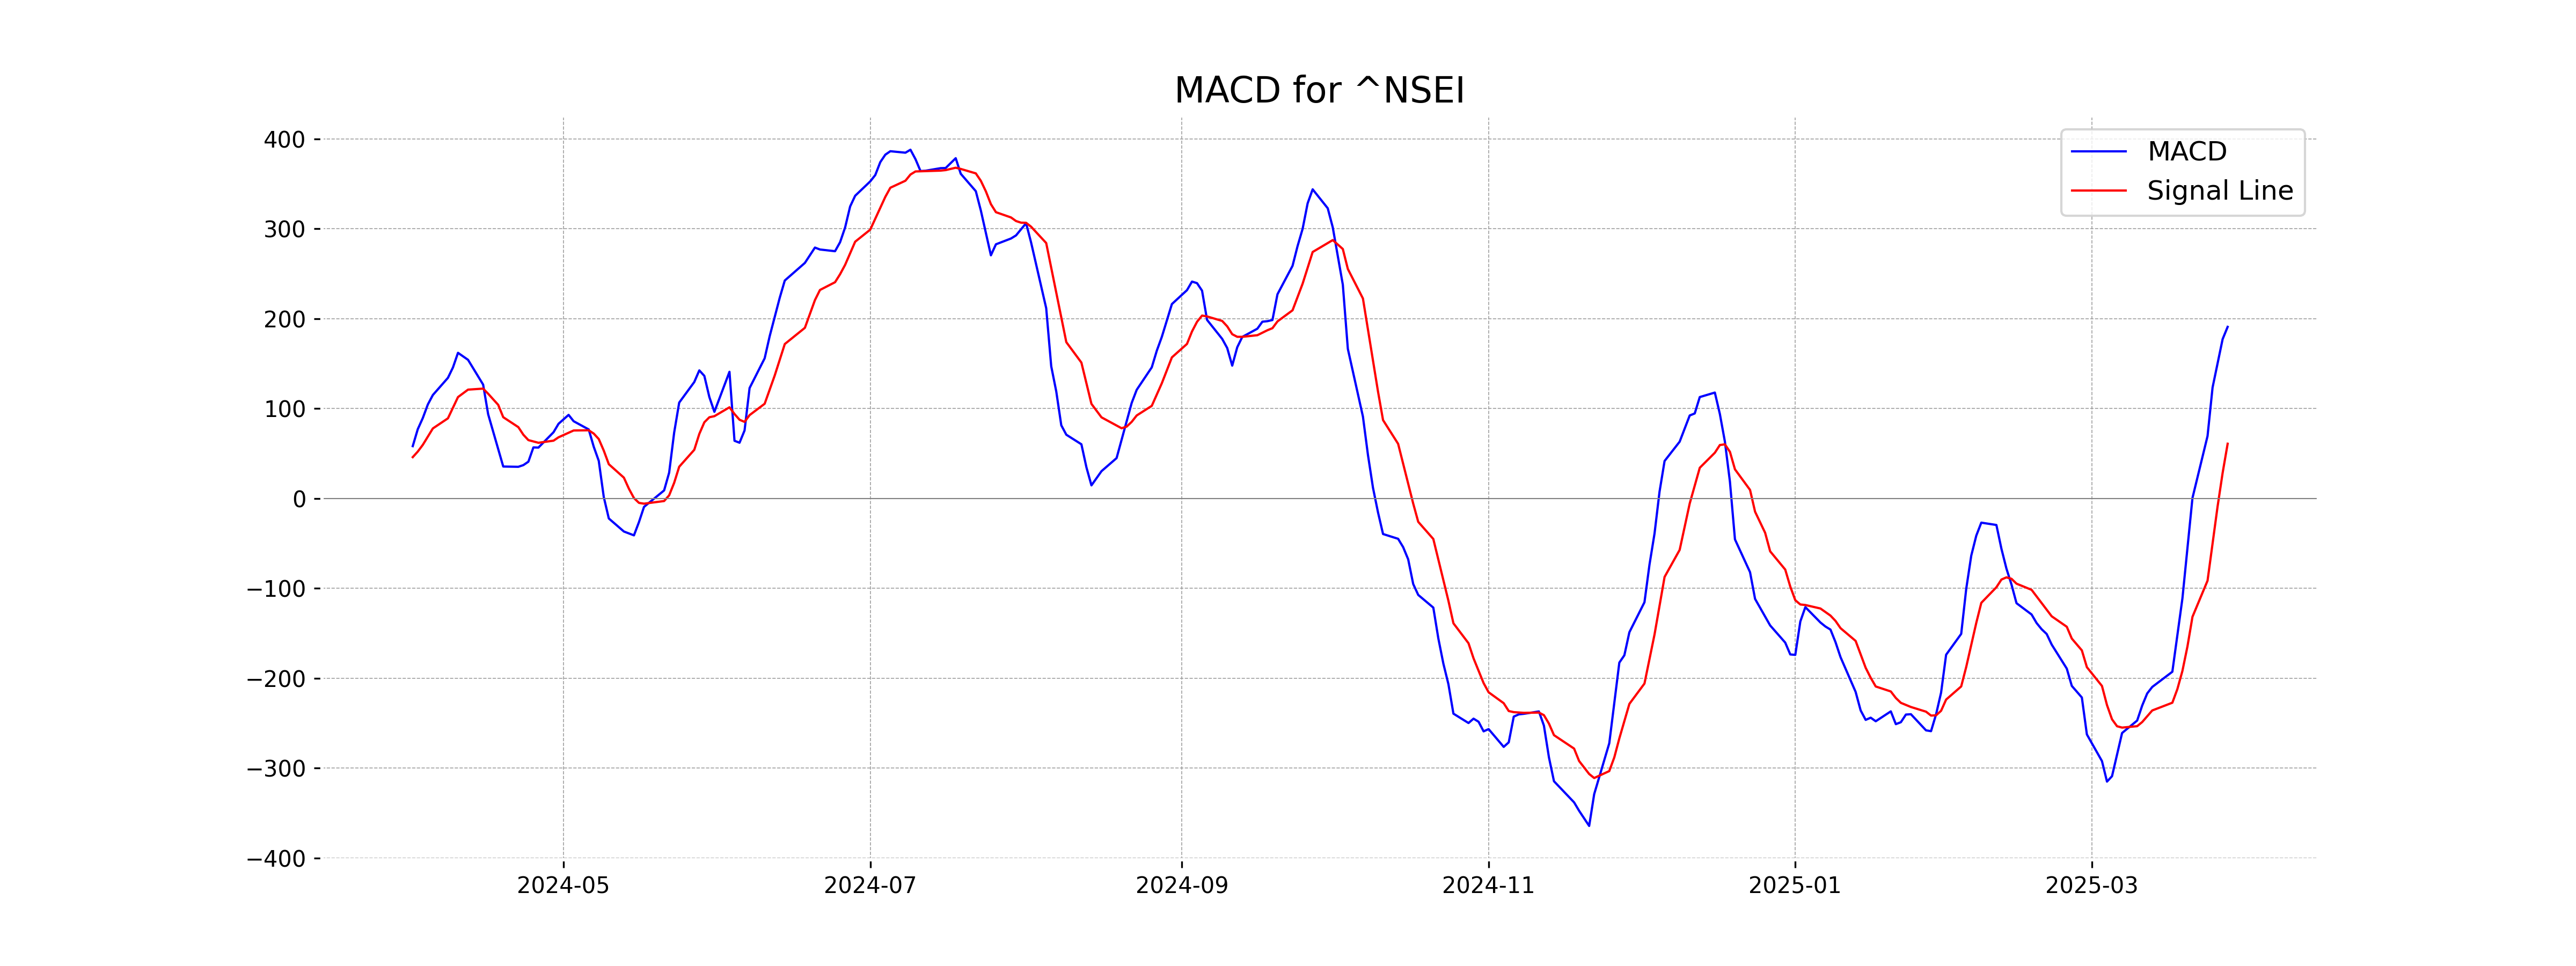
Moving Averages Trend (MACD)
The MACD for Nifty 50 is 190.96, significantly above the signal line of 60.93, indicating bullish momentum. This suggests that upward momentum is strong, and the recent trend may continue.
RSI Analysis
Nifty 50 is currently exhibiting an RSI value of 64.07. This indicates a potentially overbought condition, suggesting possible bullish momentum, but it is approaching levels where a reversal or consolidation might occur. Traders should monitor closely for any signs of a trend reversal.