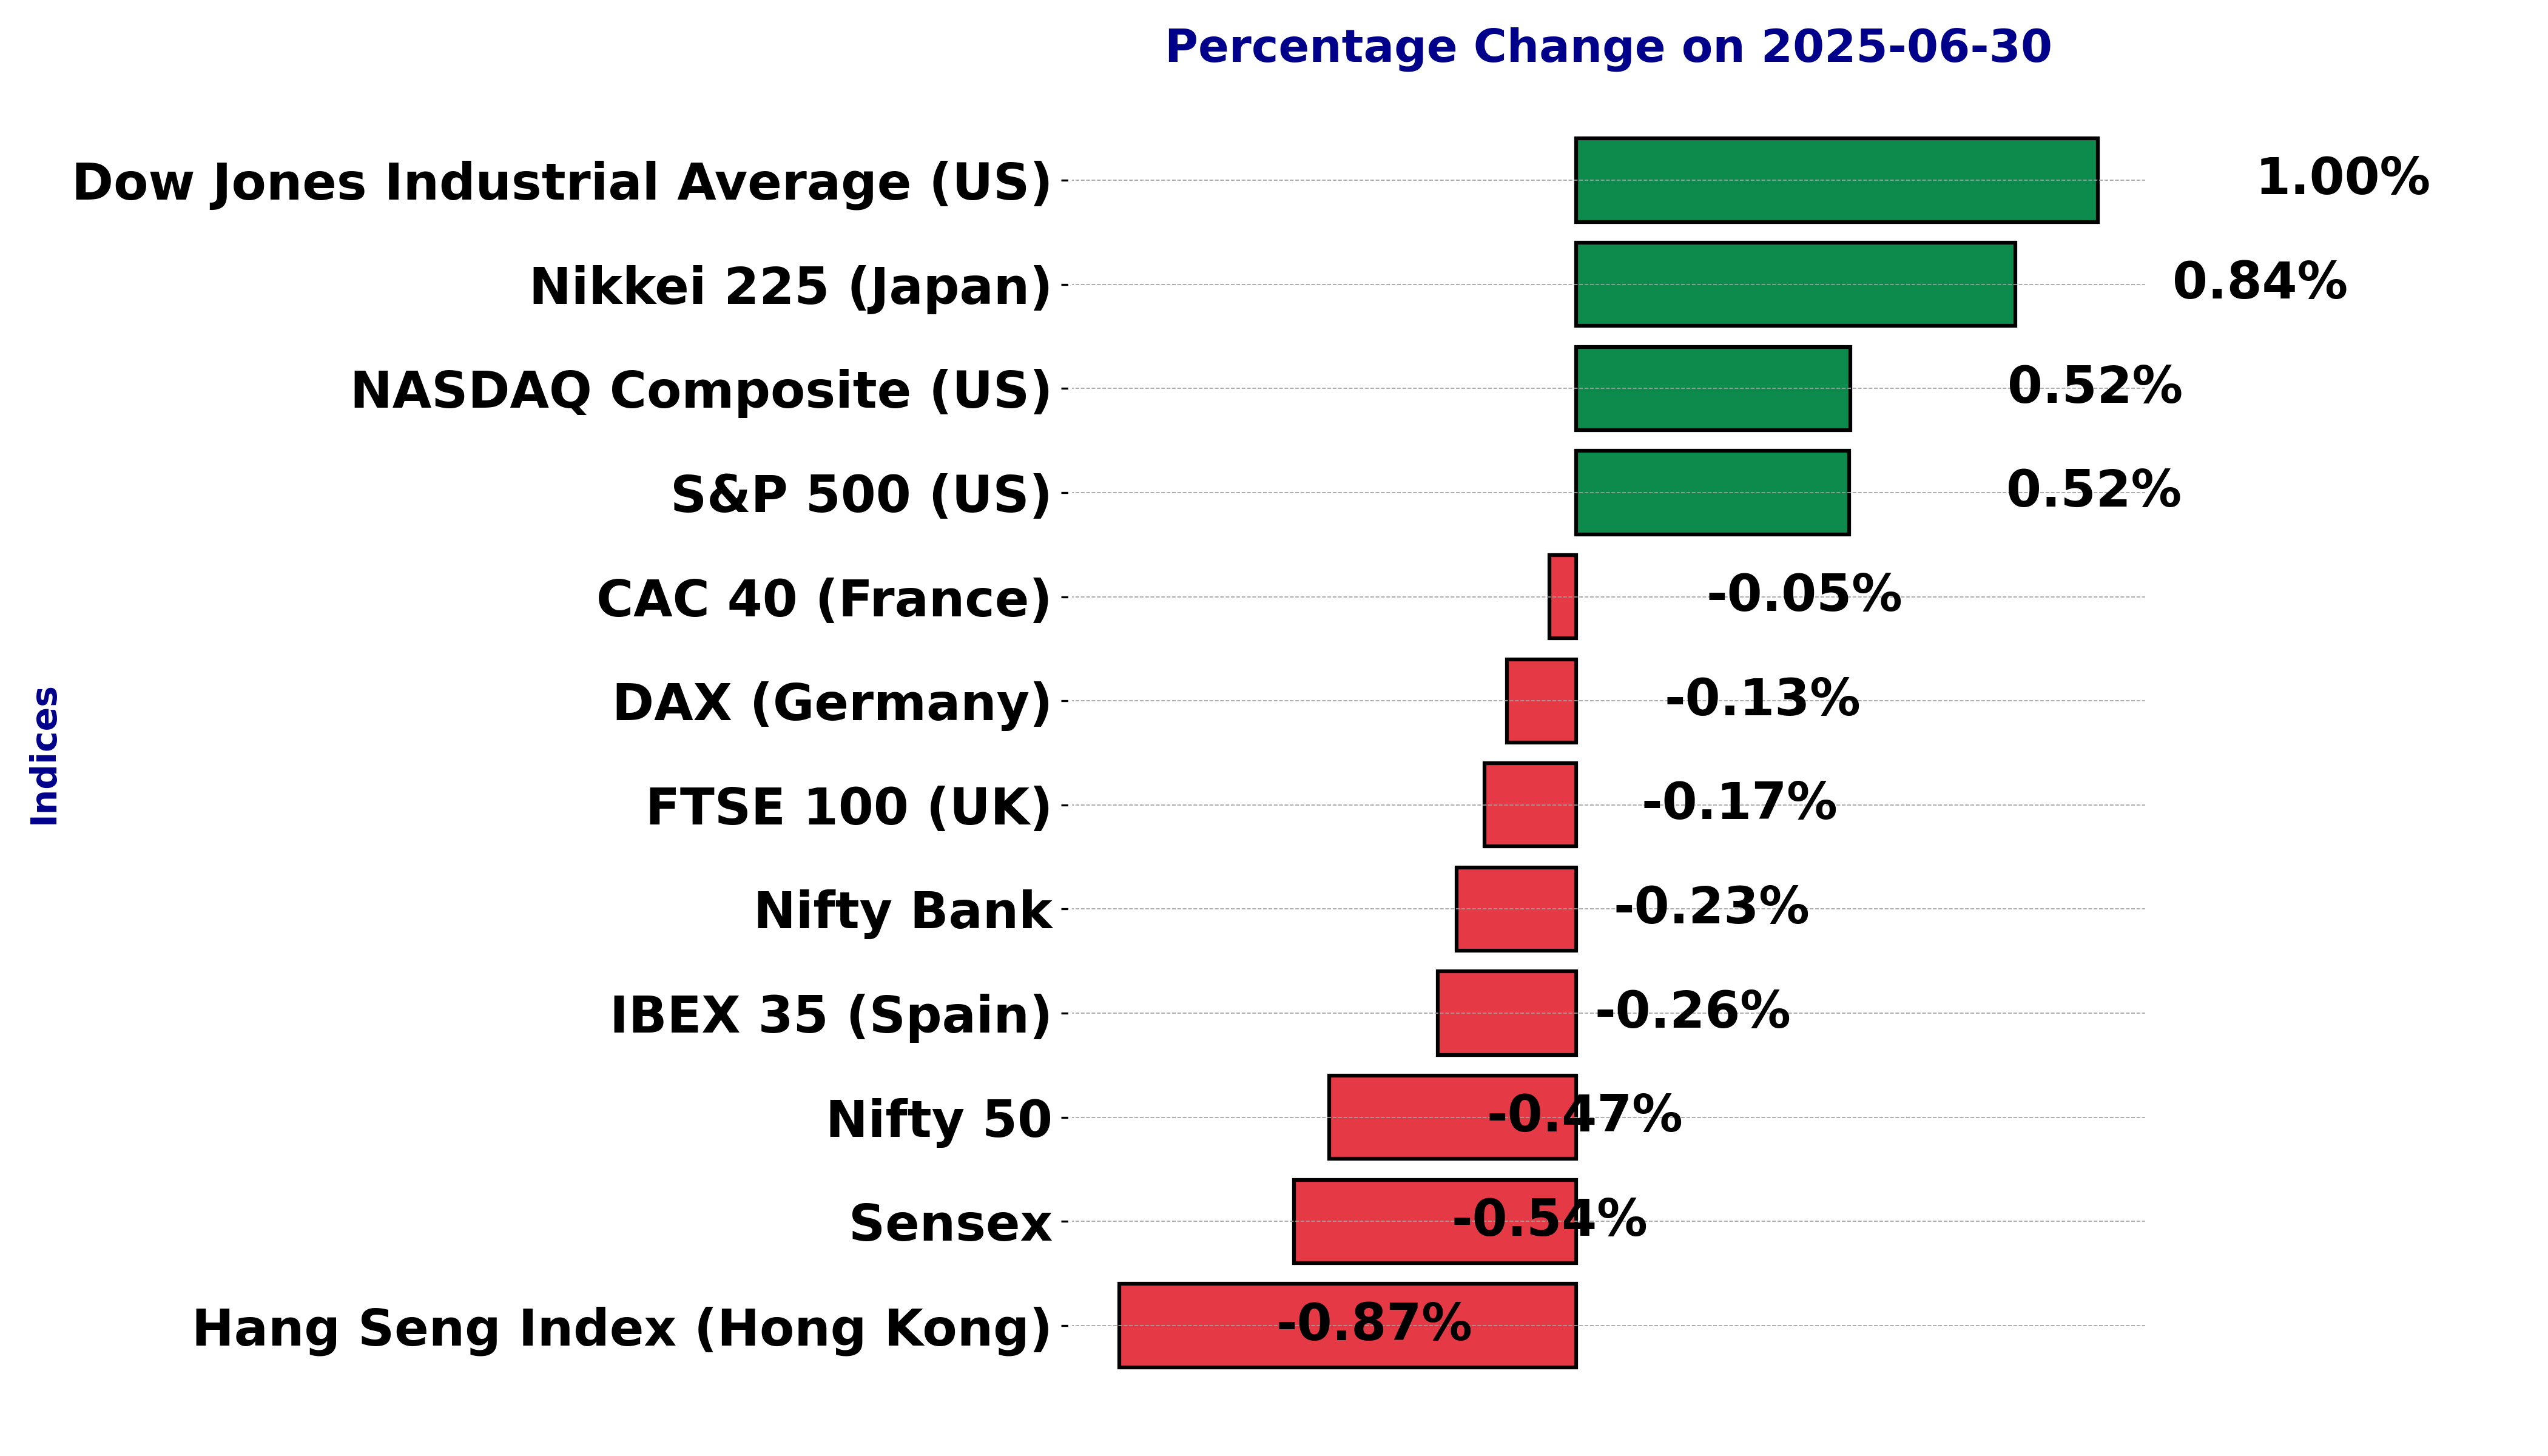
Global stock market indices: How the world markets performed today - 30 June 2025
The international stock market indices showed varied performances on June 30, 2025, reflecting the economic sentiment across different regions.
In this article, we analyze the performance of key global indices including the S&P 500, Dow Jones Industrial Average, NASDAQ Composite, FTSE 100, DAX, CAC 40, IBEX 35, Nikkei 225, Hang Seng, Nifty 50, and BSE Sensex.
Analysis for Sensex - June 30, 2025
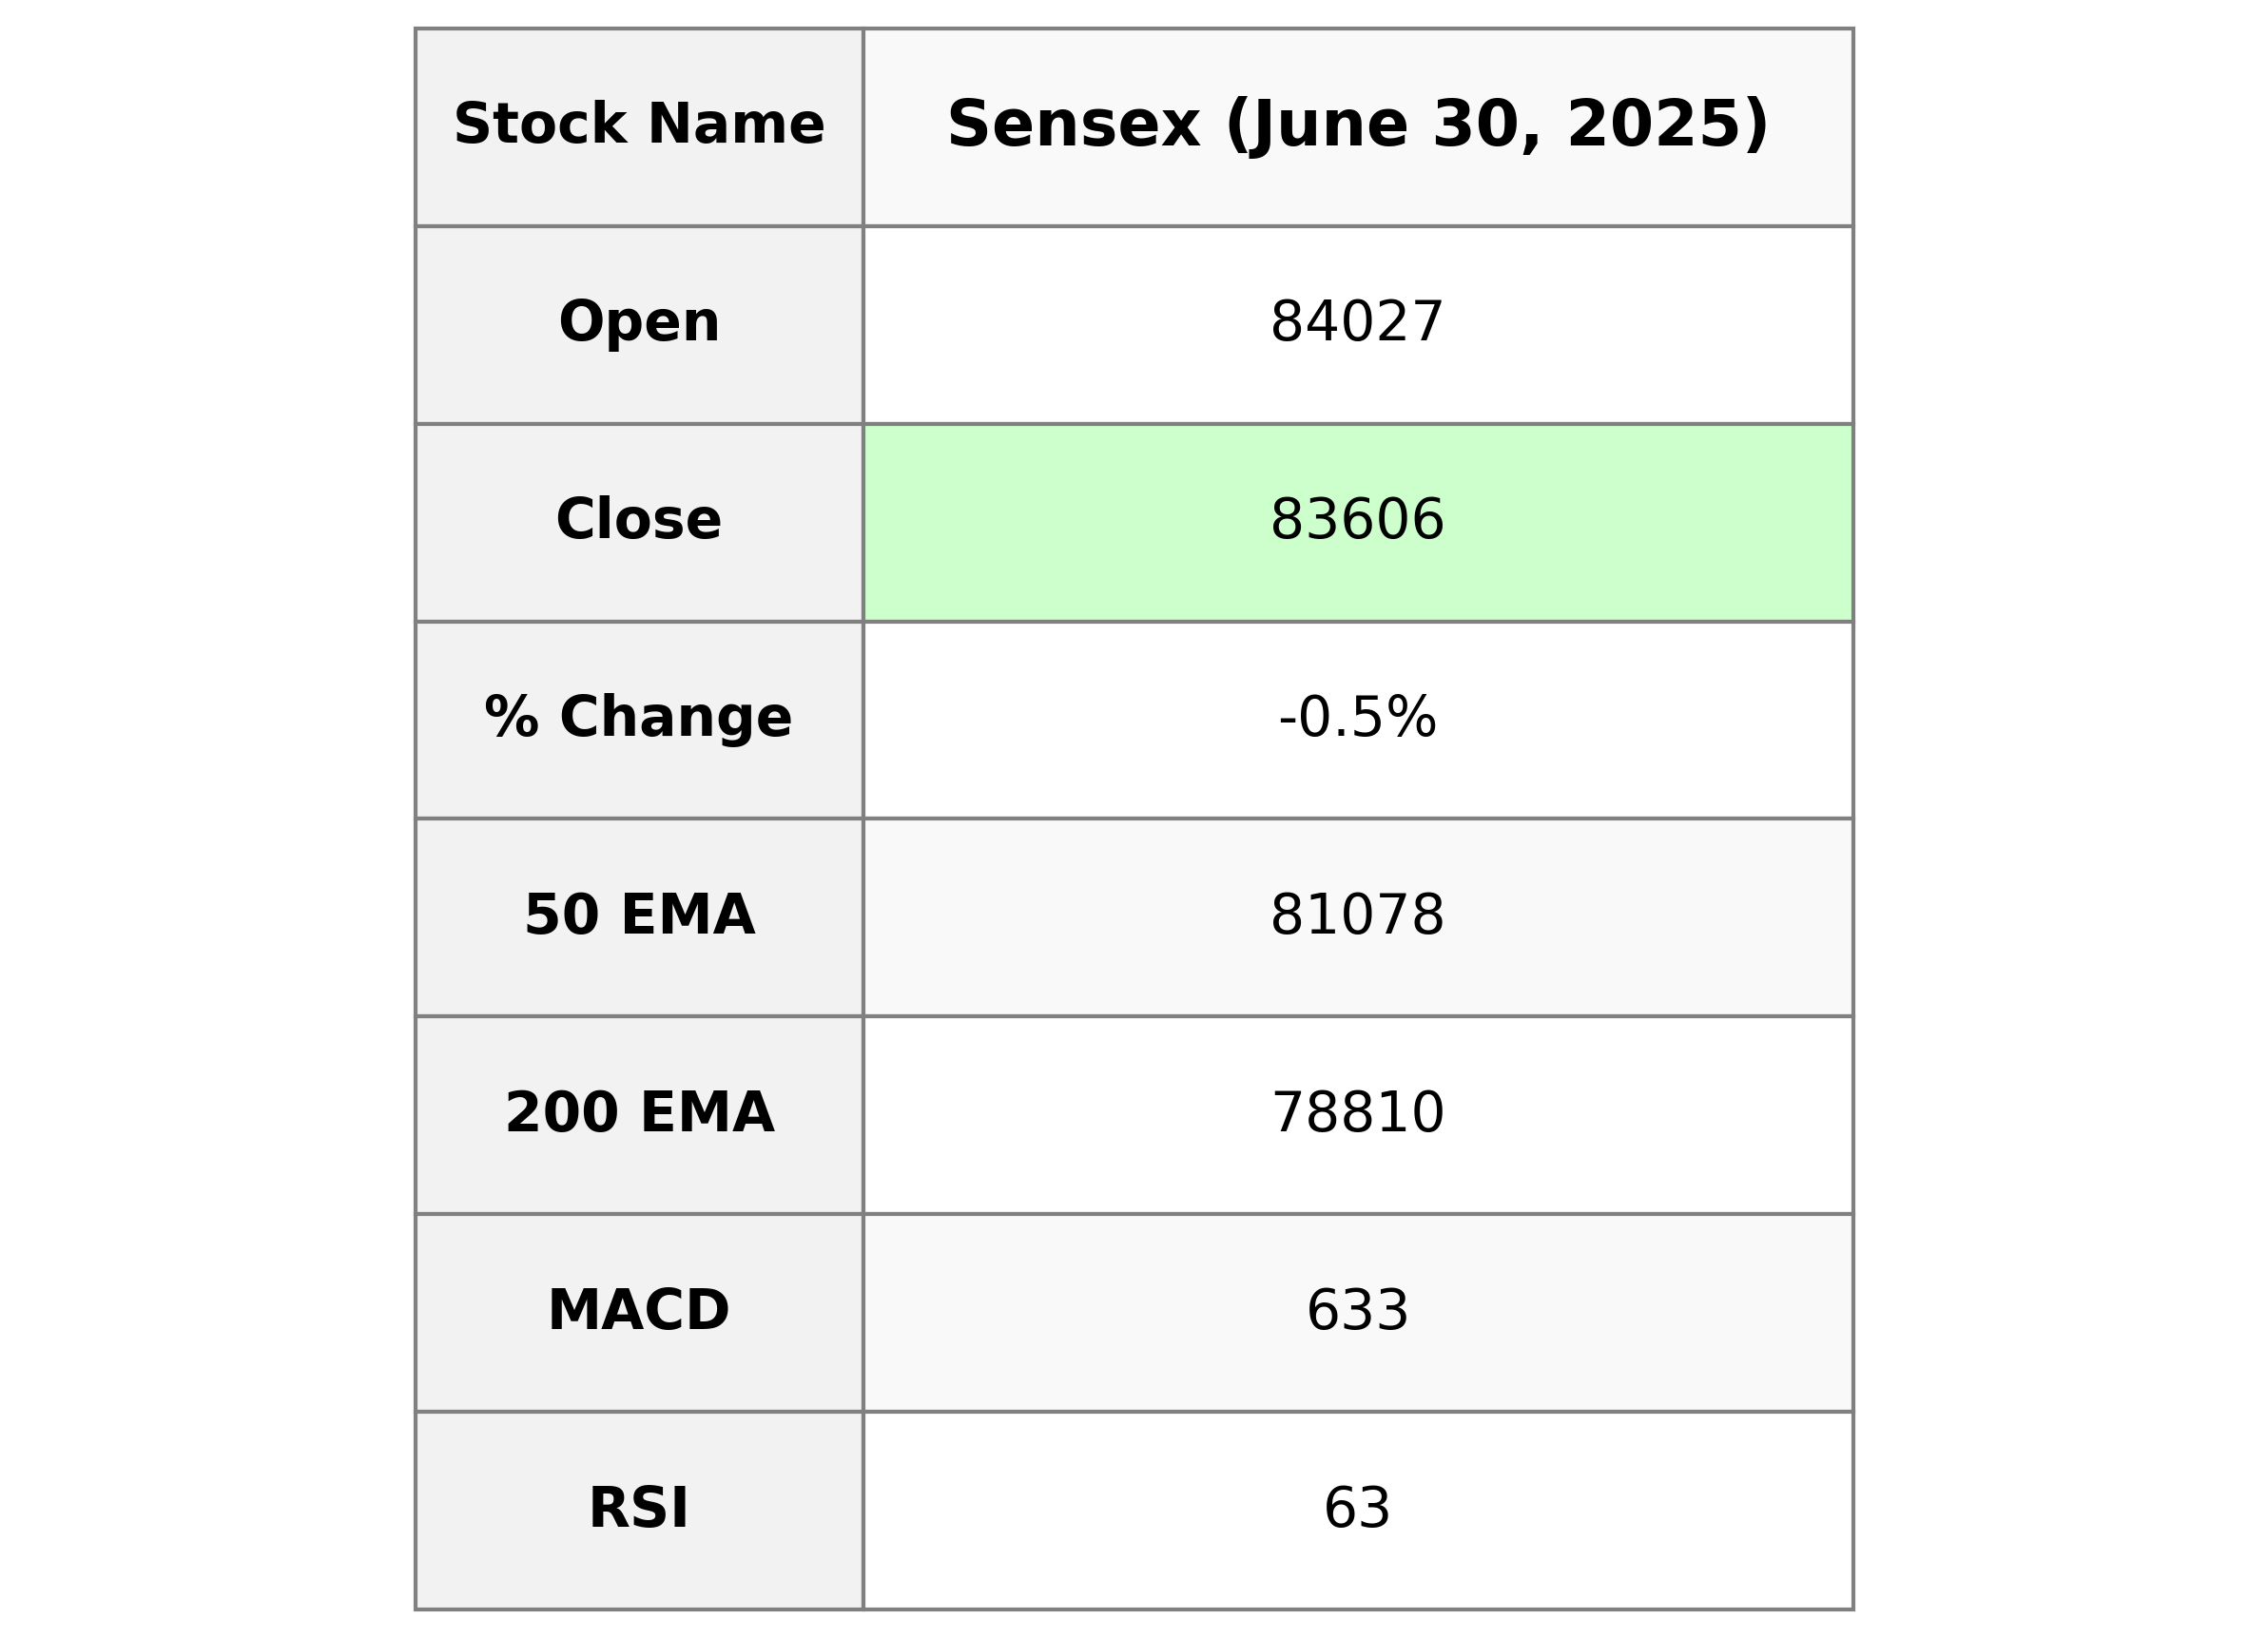
The Sensex opened at 84027.33, reaching a high of 84099.53 and a low of 83482.13, closing at 83606.46. The index saw a decline of 0.54% from the previous close, with a points change of -452.44. Despite the downturn, technical indicators like RSI and MACD suggest the index is experiencing moderate momentum.
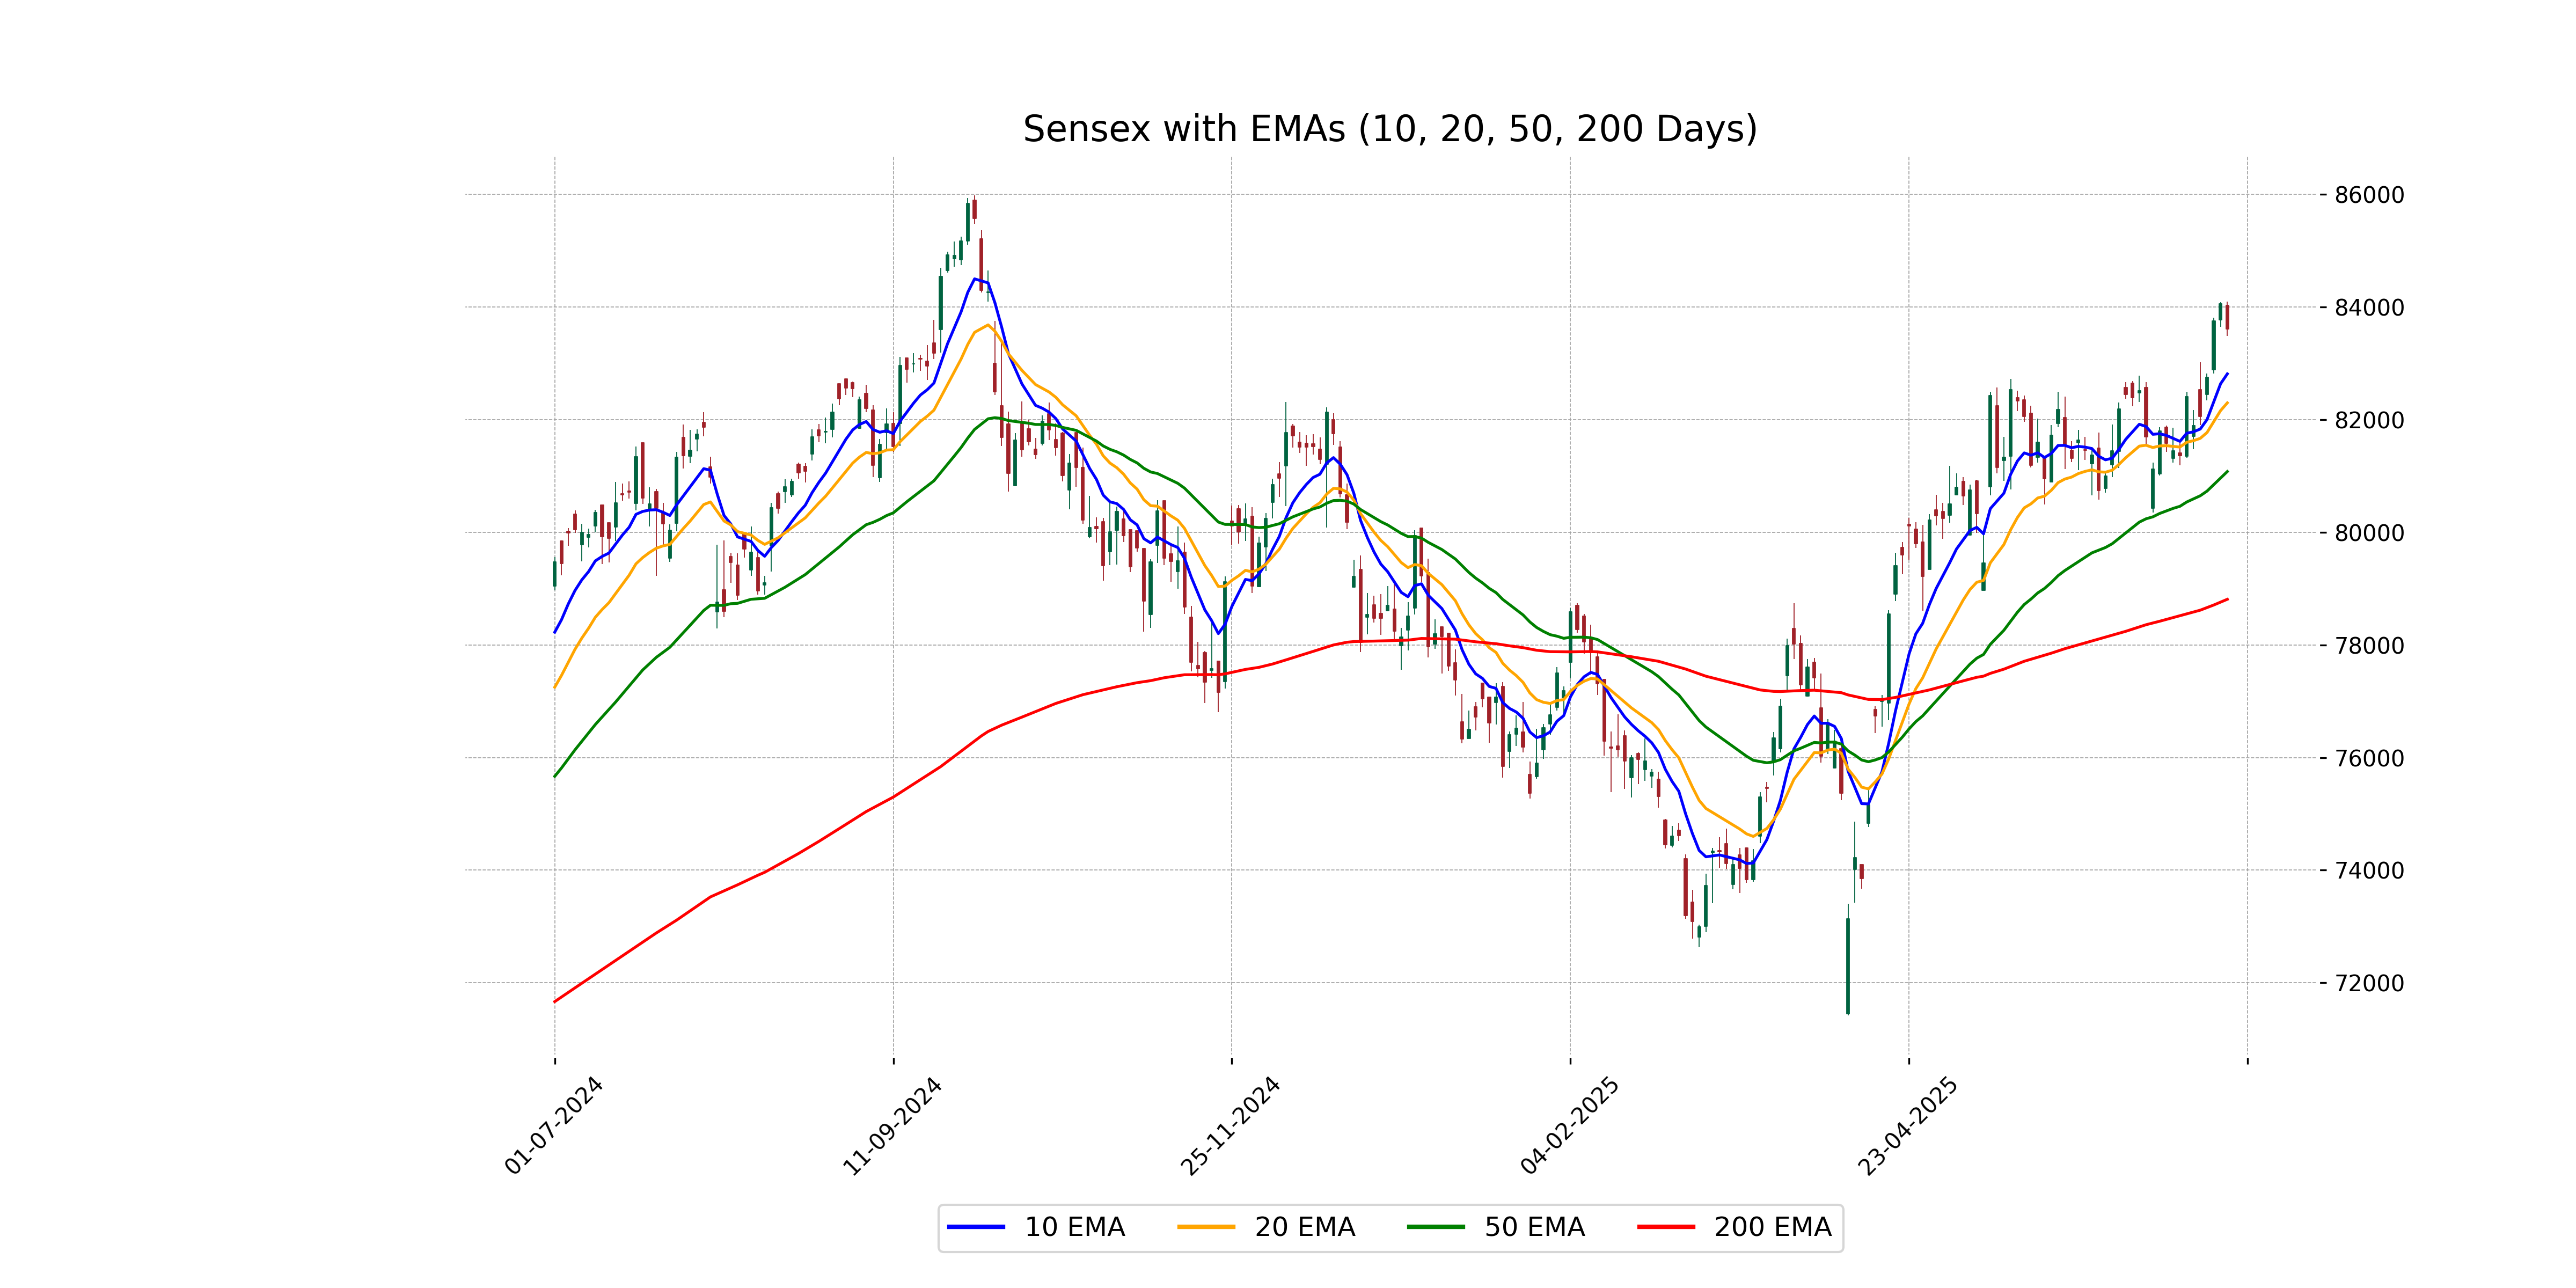
Relationship with Key Moving Averages
The Sensex closed at 83,606.46, which is above both its 50-day EMA of 81,078.09 and its 200-day EMA of 78,809.86, indicating a potential bullish trend in the longer-term context. However, it is below the 10-day EMA of 82,812.28 and the 20-day EMA of 82,297.33, suggesting short-term weakness.
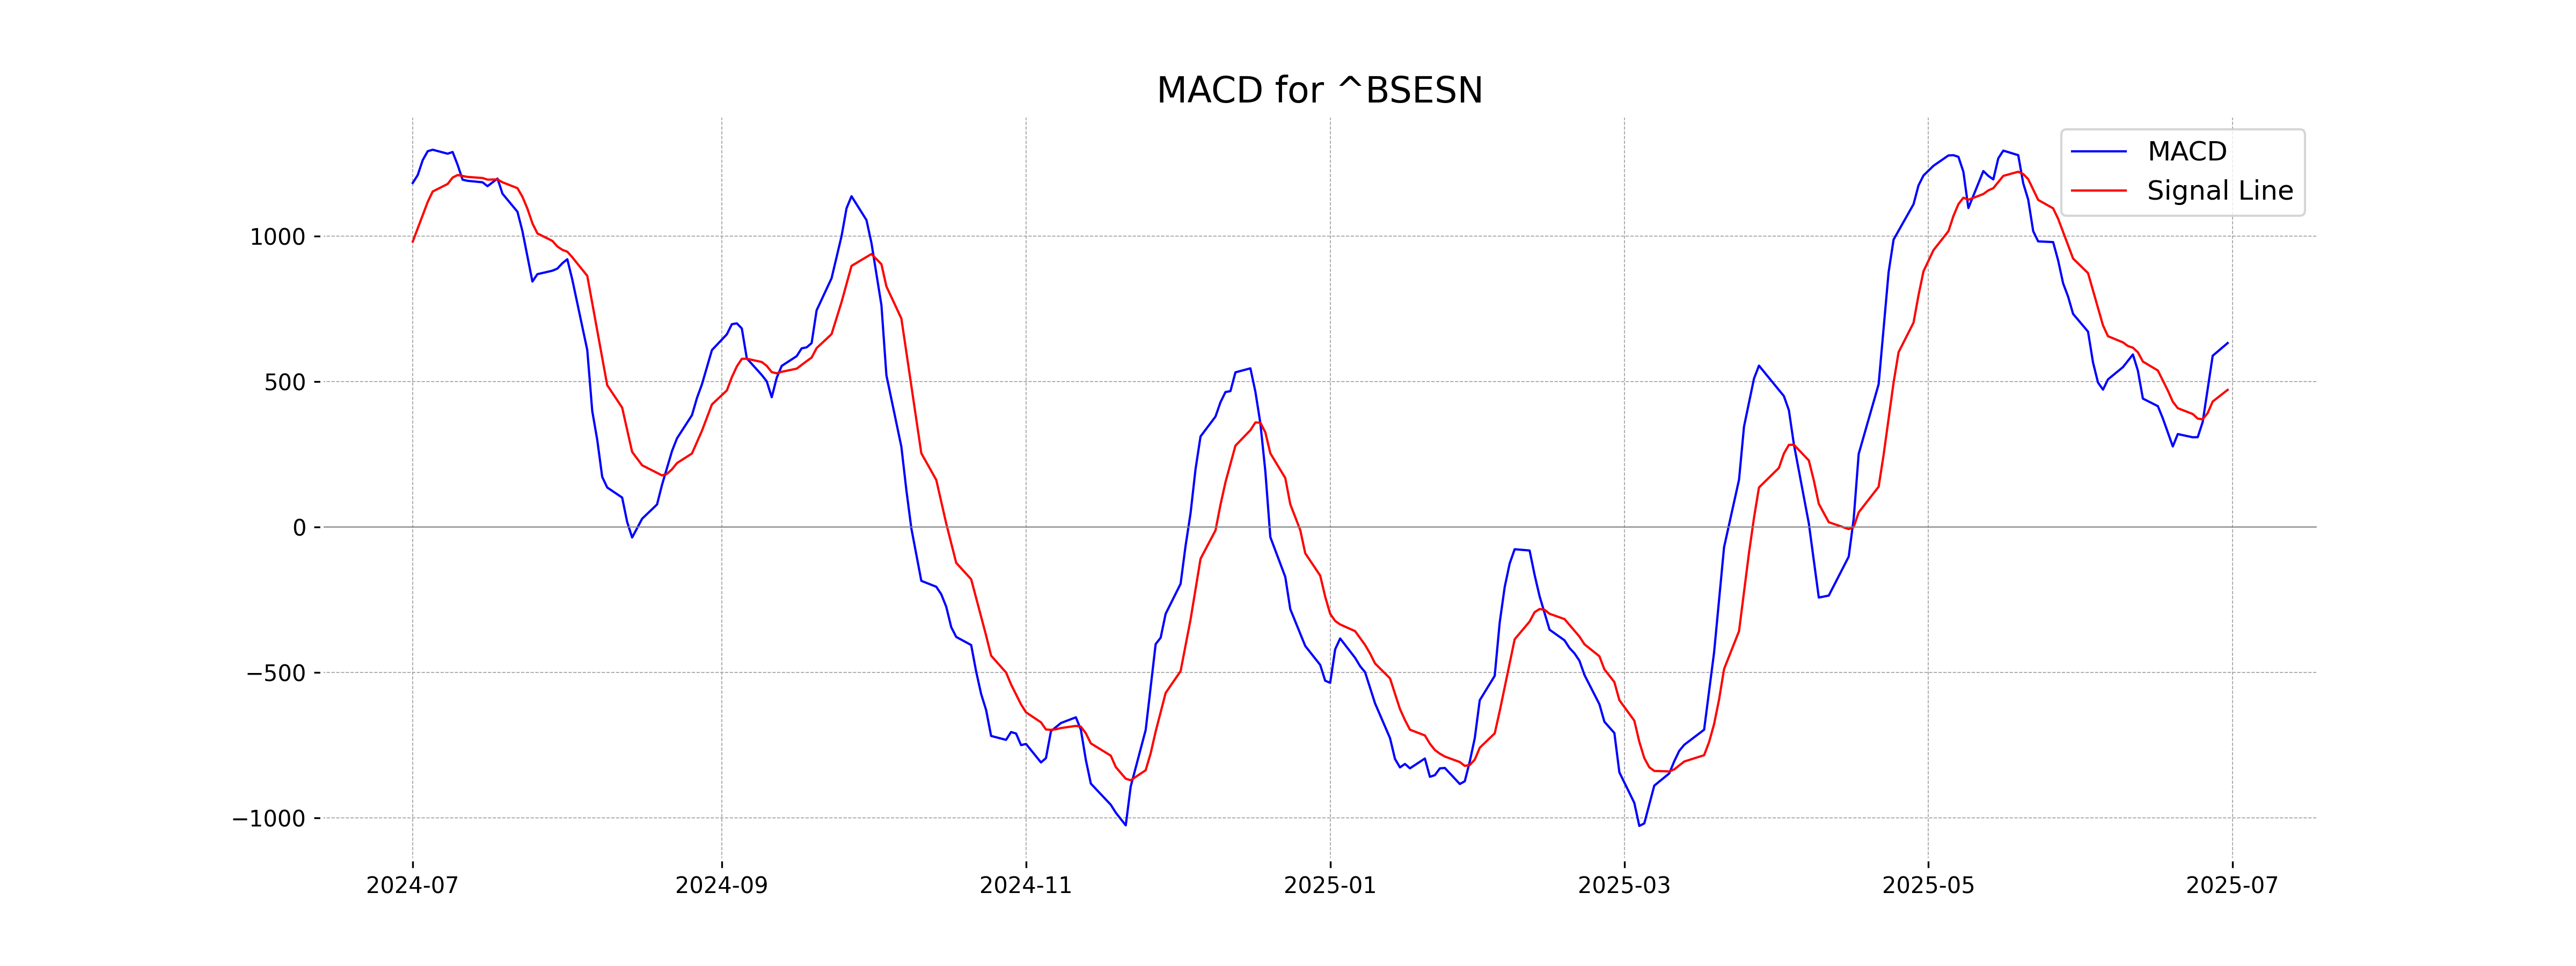
Moving Averages Trend (MACD)
The MACD for Sensex is 633.07, which is above the MACD Signal of 472.18, suggesting a bullish trend. Despite the negative percentage change in the stock price, the MACD indicates potential upward momentum.
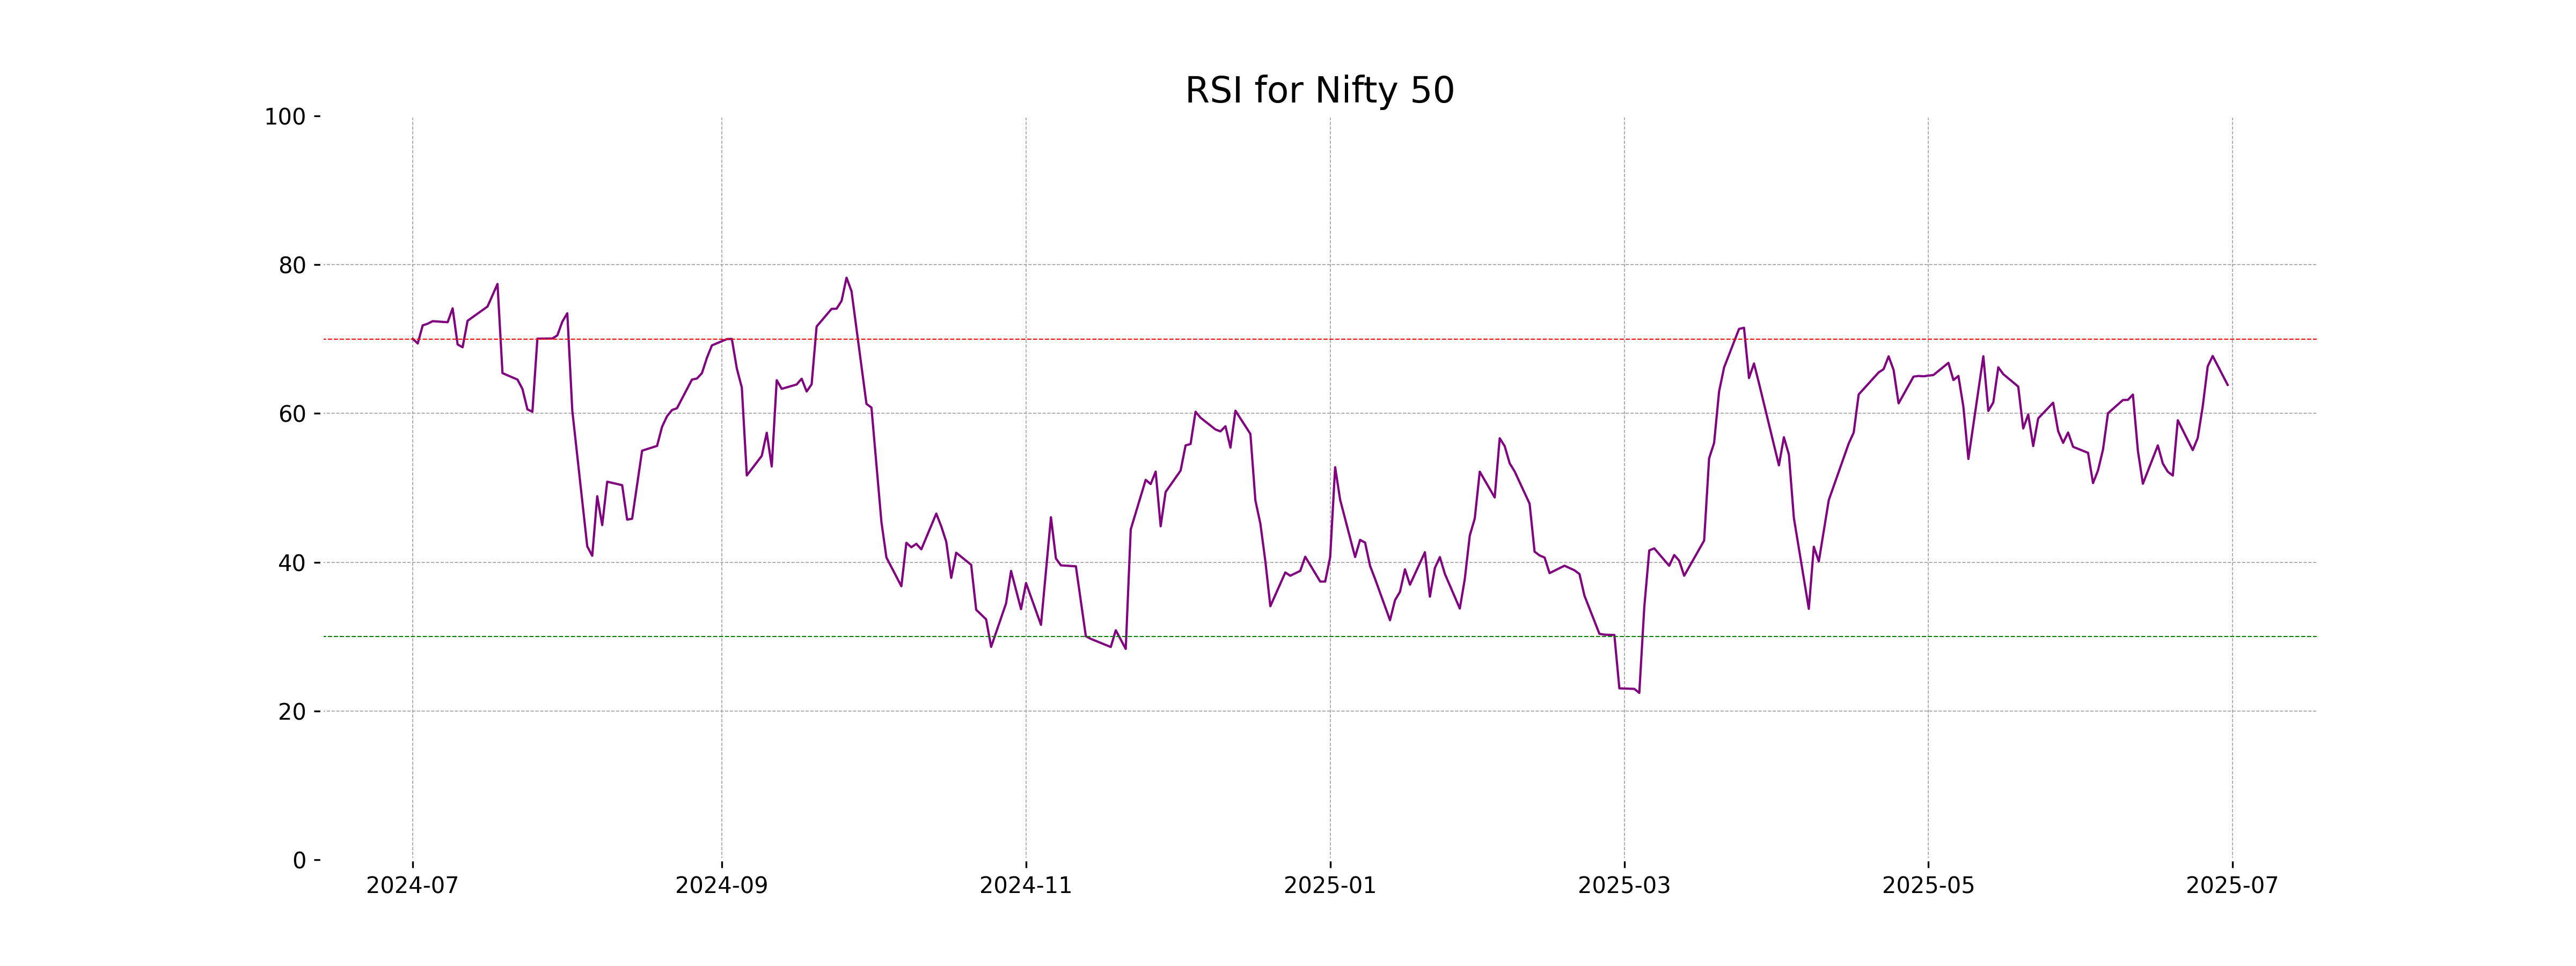
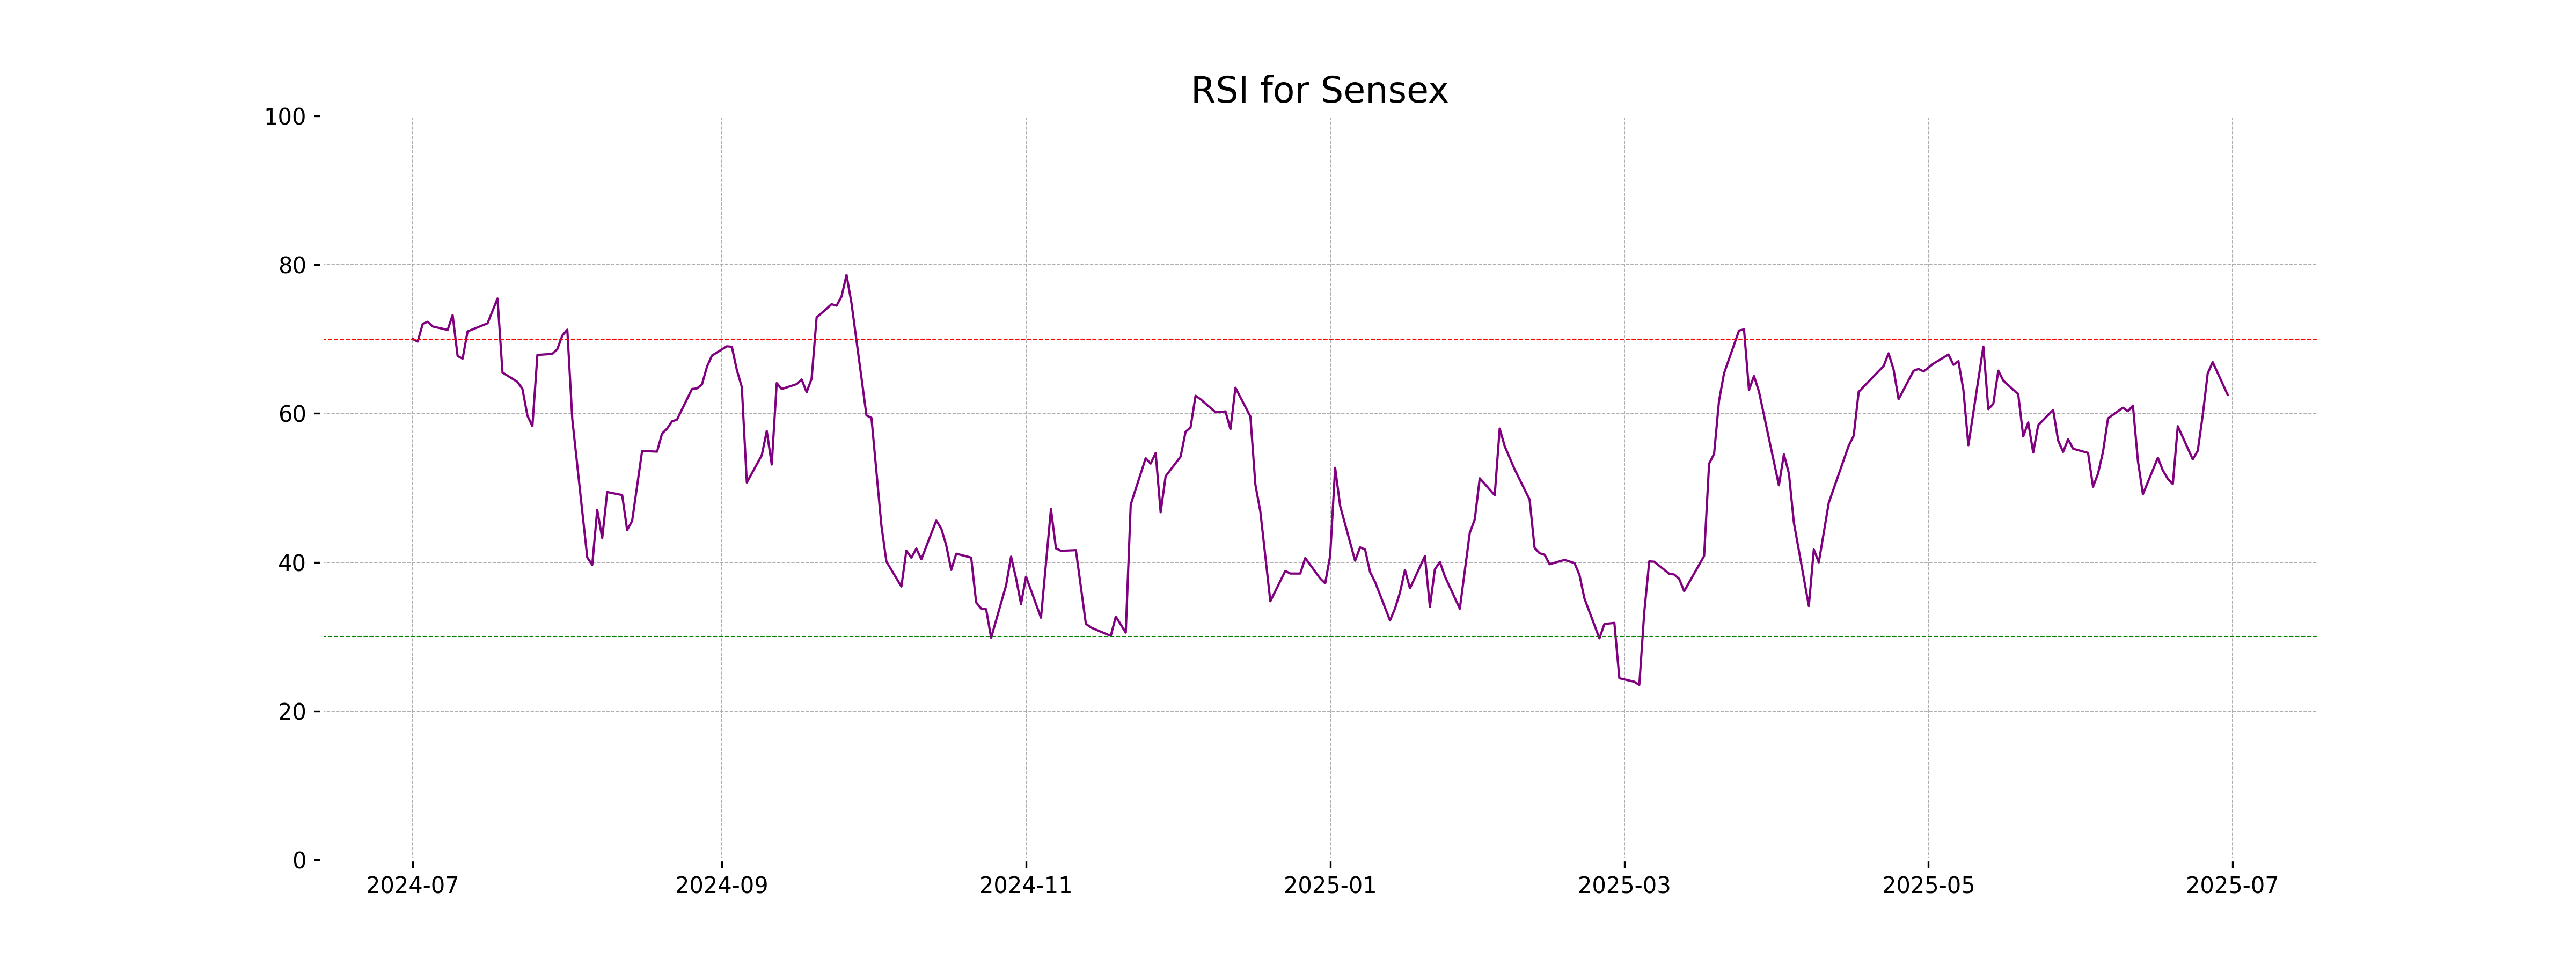
RSI Analysis
The RSI for Sensex is 62.51, suggesting that the index is in a moderately strong position, close to overbought levels, but not yet in the overbought zone of above 70. This indicates a potentially strong upward momentum but also warrants caution for possible pullbacks.
Analysis for Dow Jones Industrial Average (US) - June 30, 2025
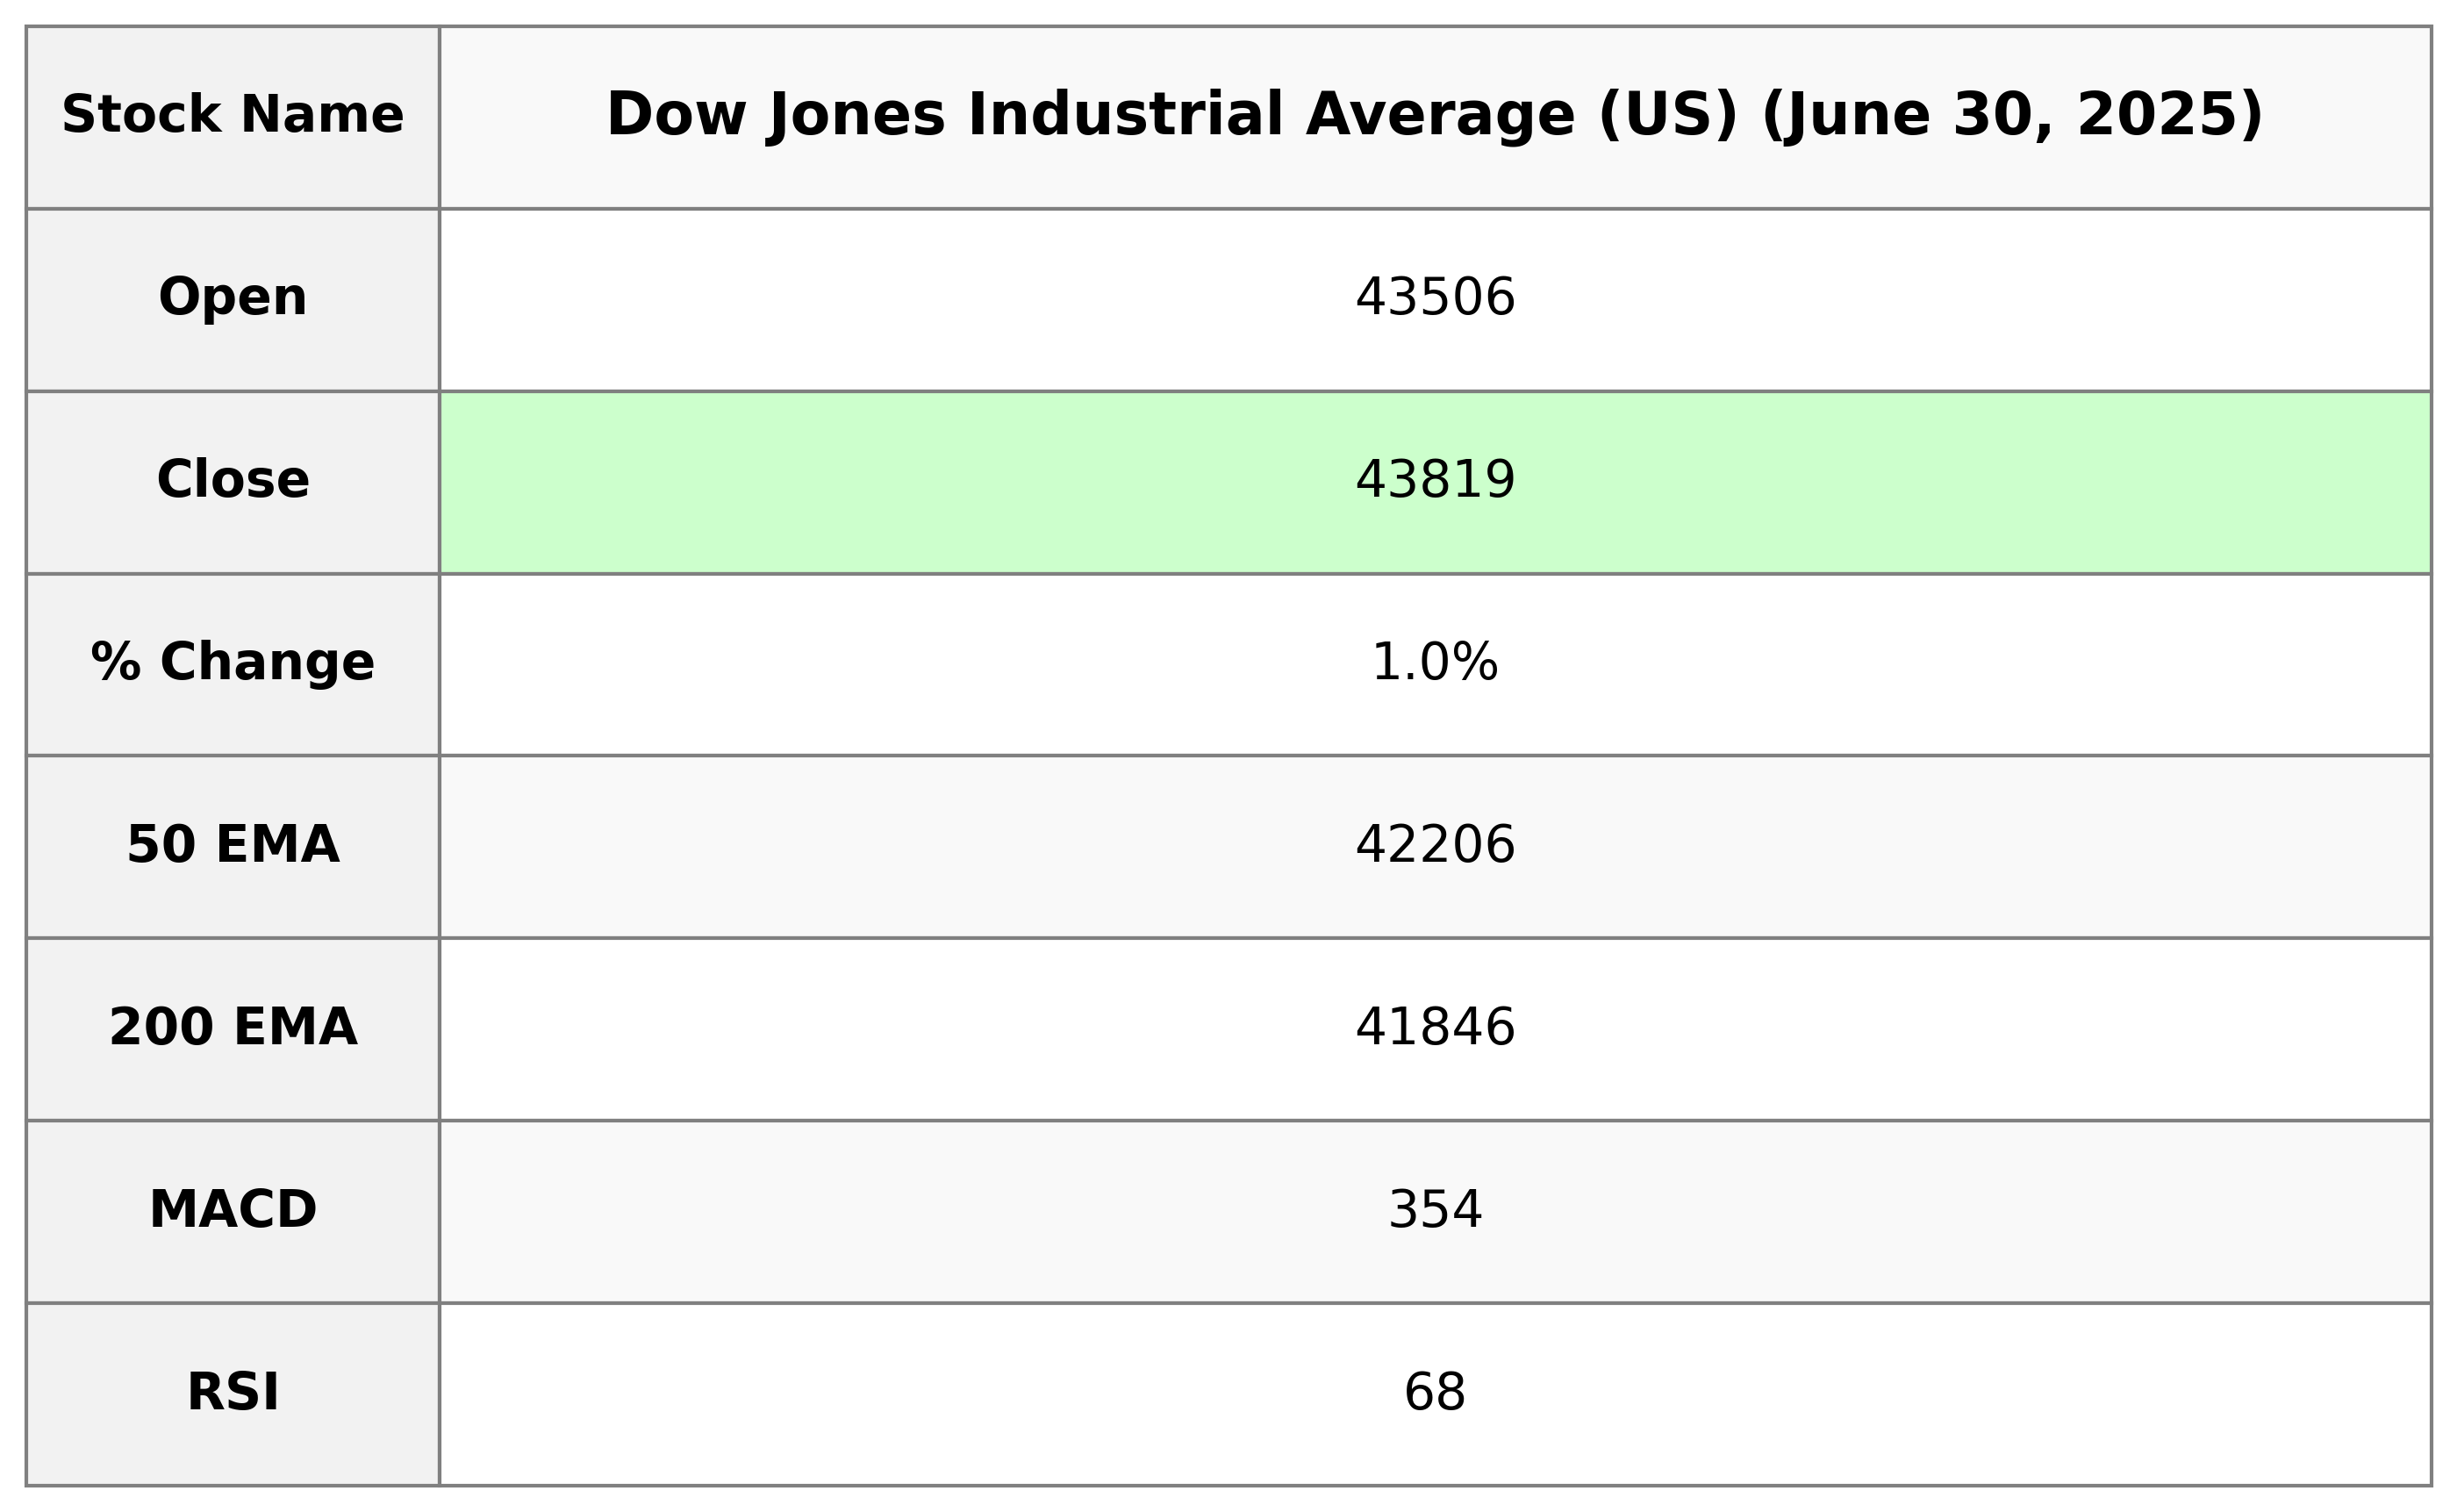
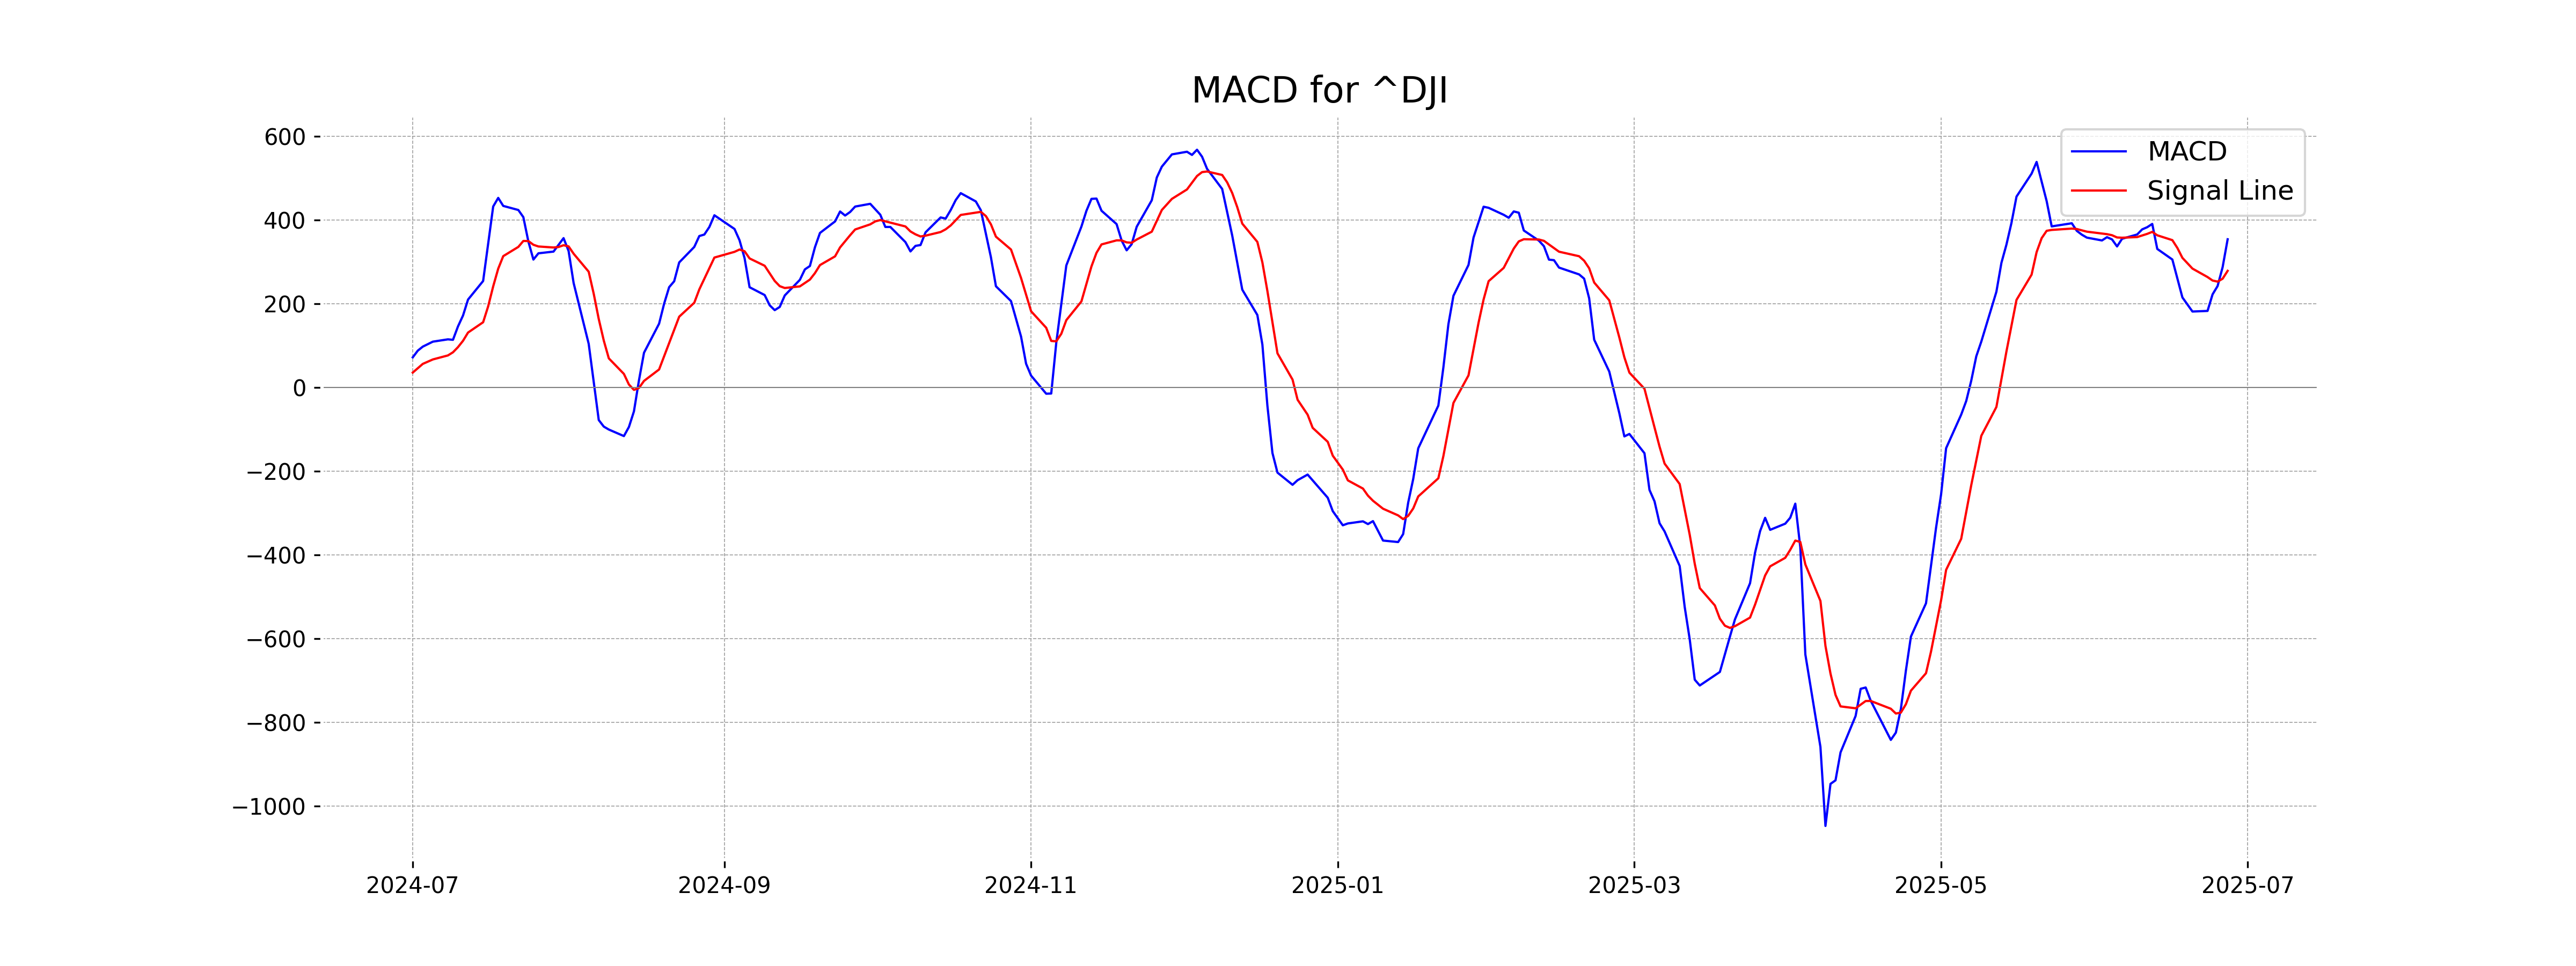
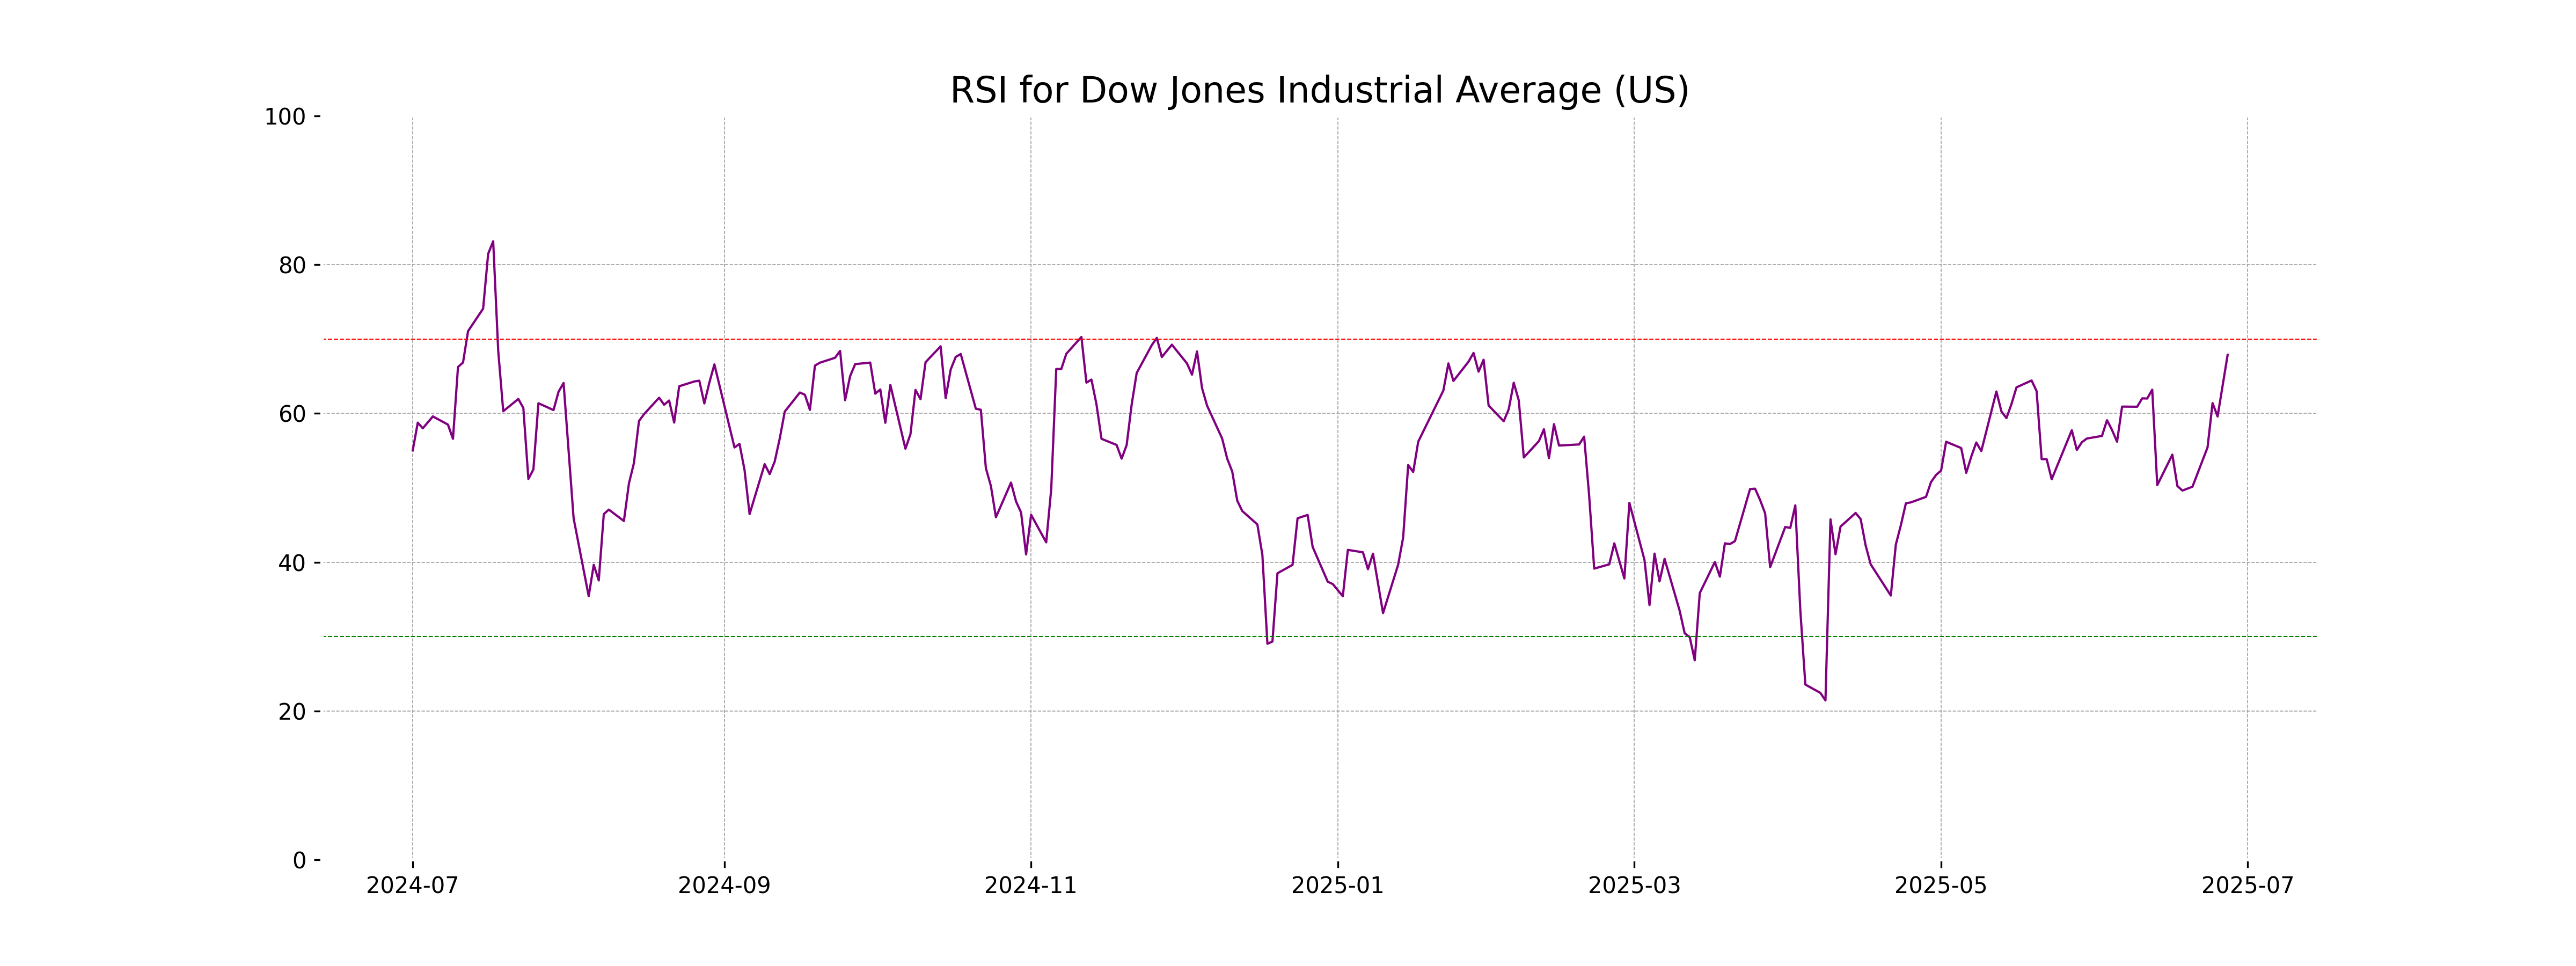
The Dow Jones Industrial Average (US) opened at 43,505.60, and closed at 43,819.27, marking a positive change of 0.99% or 432.43 points from the previous close of 43,386.84. The RSI stands at 67.89, indicating a strong trend, and the MACD value of 354.28 suggests bullish momentum compared to the signal line of 278.90.
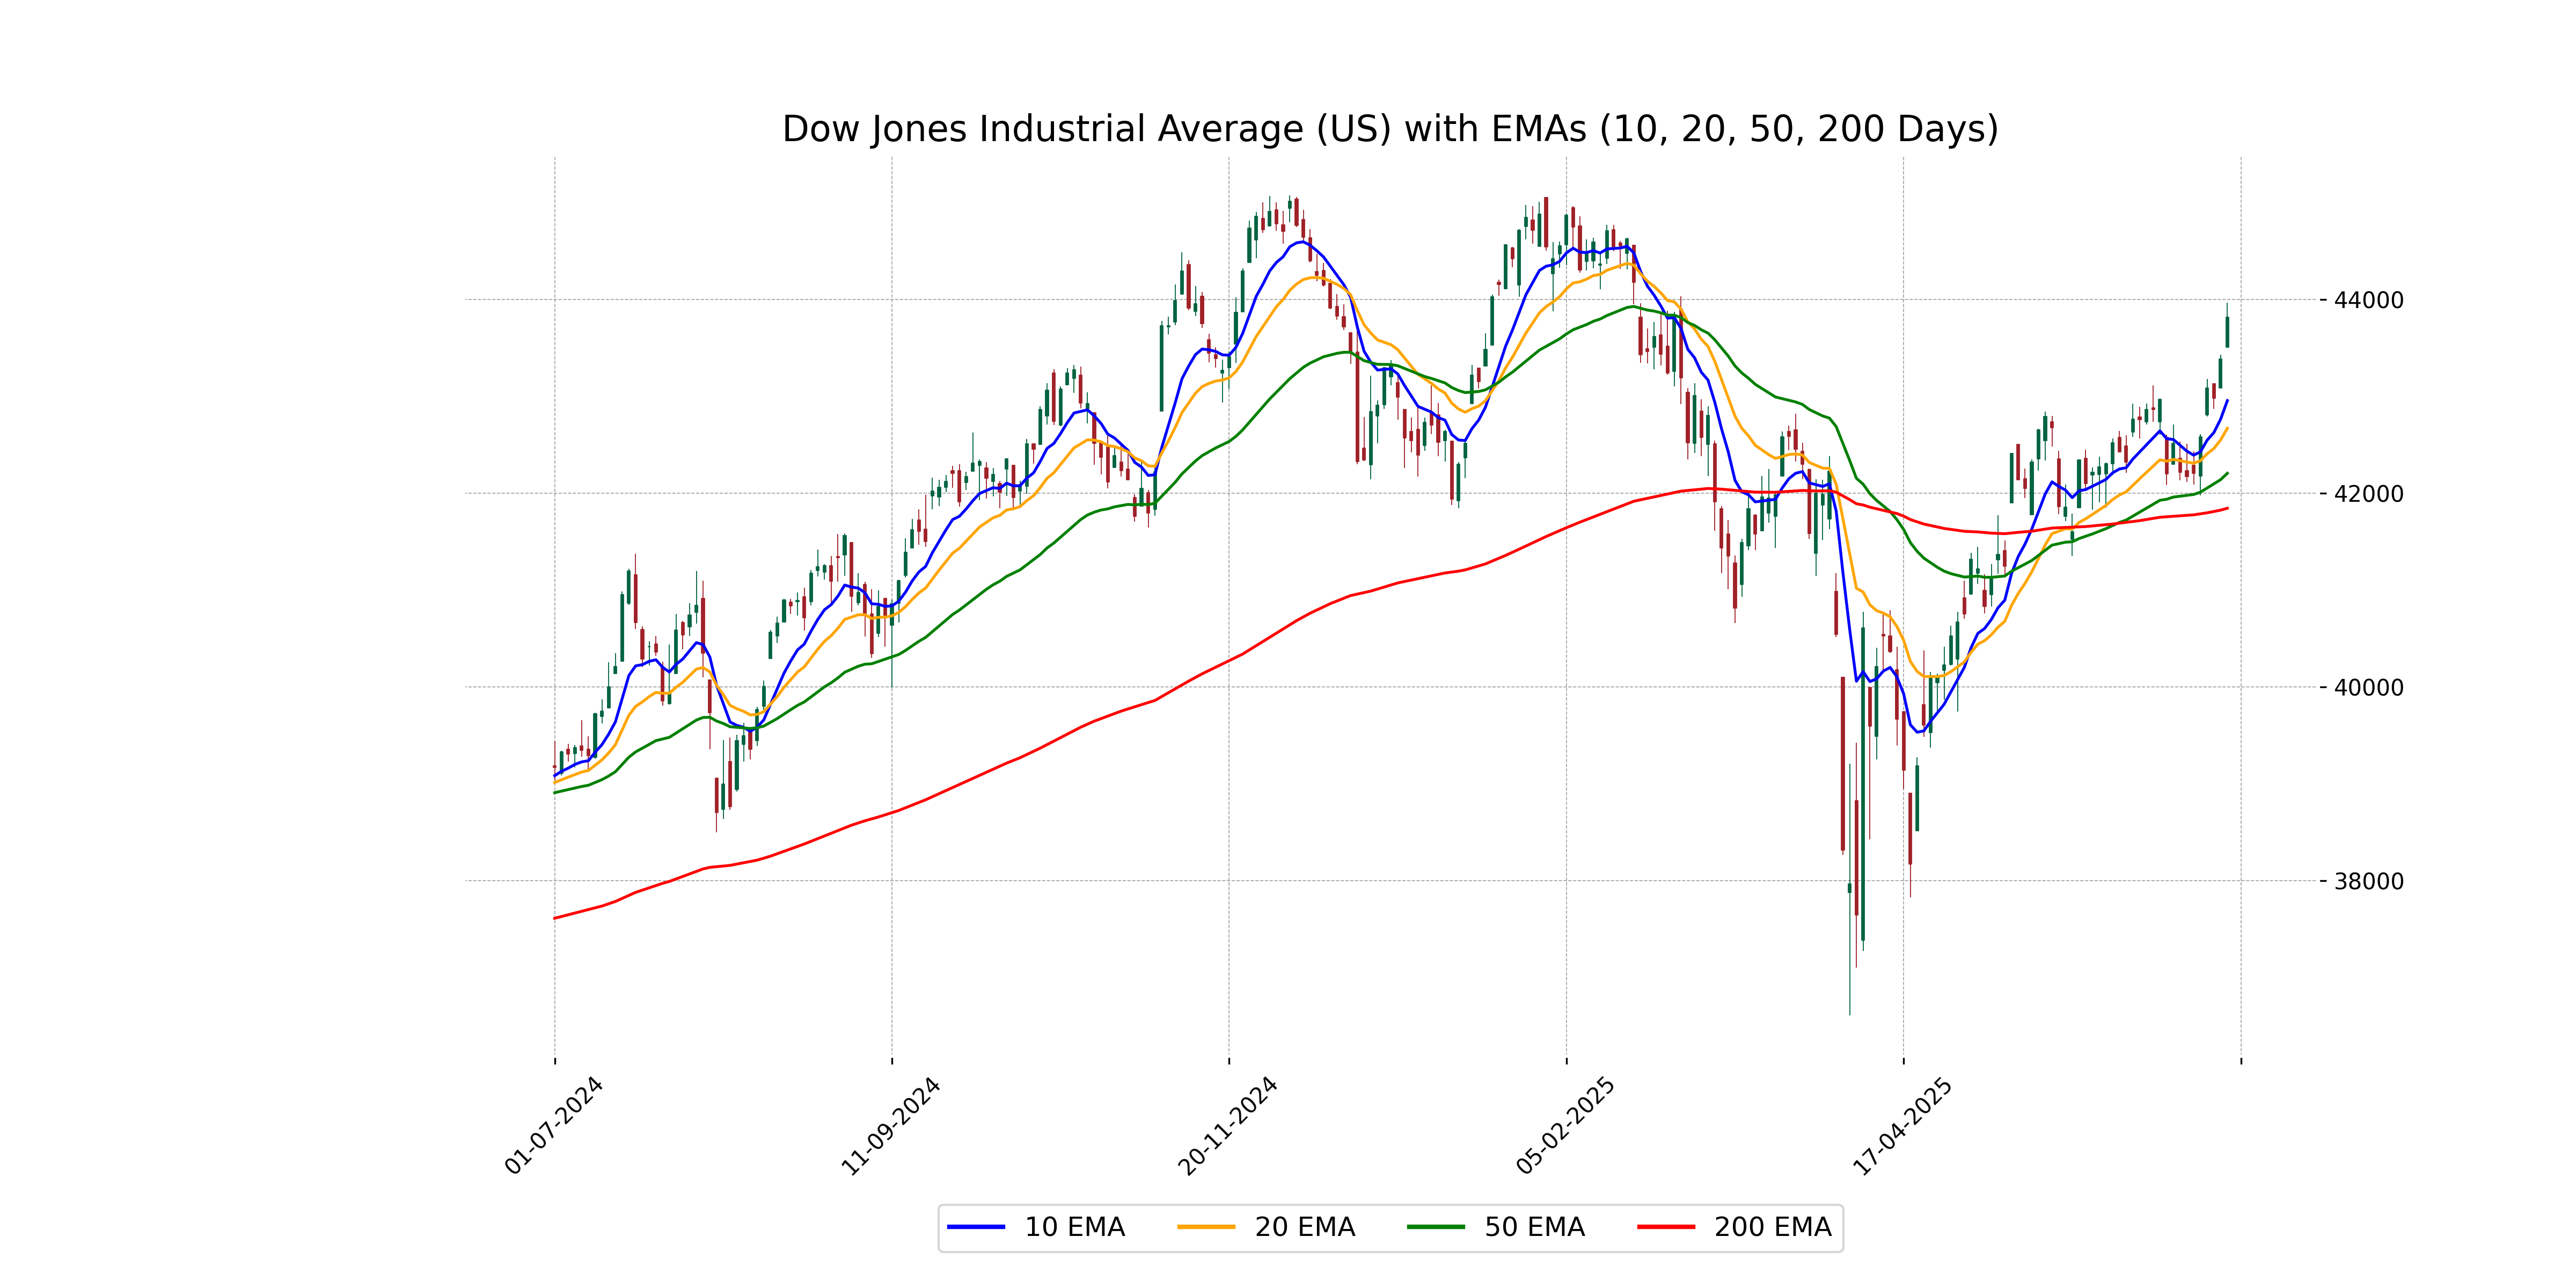
Relationship with Key Moving Averages
The Dow Jones Industrial Average opened above its 10, 20, 50, and 200 EMA indicators, reflecting a strong bullish sentiment with a notable percentage change of 0.997% and a close above all these key averages. The current RSI of 67.89 and a positive MACD value suggest momentum is favoring buyers, while the volume stands at 921,330,000.
Moving Averages Trend (MACD)
The moving average convergence divergence (MACD) for the Dow Jones Industrial Average is 354.28, with a MACD Signal of 278.90. The positive MACD indicates a potential bullish trend as it is currently above the signal line, suggesting upward momentum in the index.
RSI Analysis
The RSI (Relative Strength Index) for the Dow Jones Industrial Average stands at 67.89, suggesting that the index is approaching overbought territory, as RSI values above 70 typically indicate overbought conditions. This could imply potential resistance or a price pullback if upward momentum is not sustained.
Analysis for CAC 40 (France) - June 30, 2025
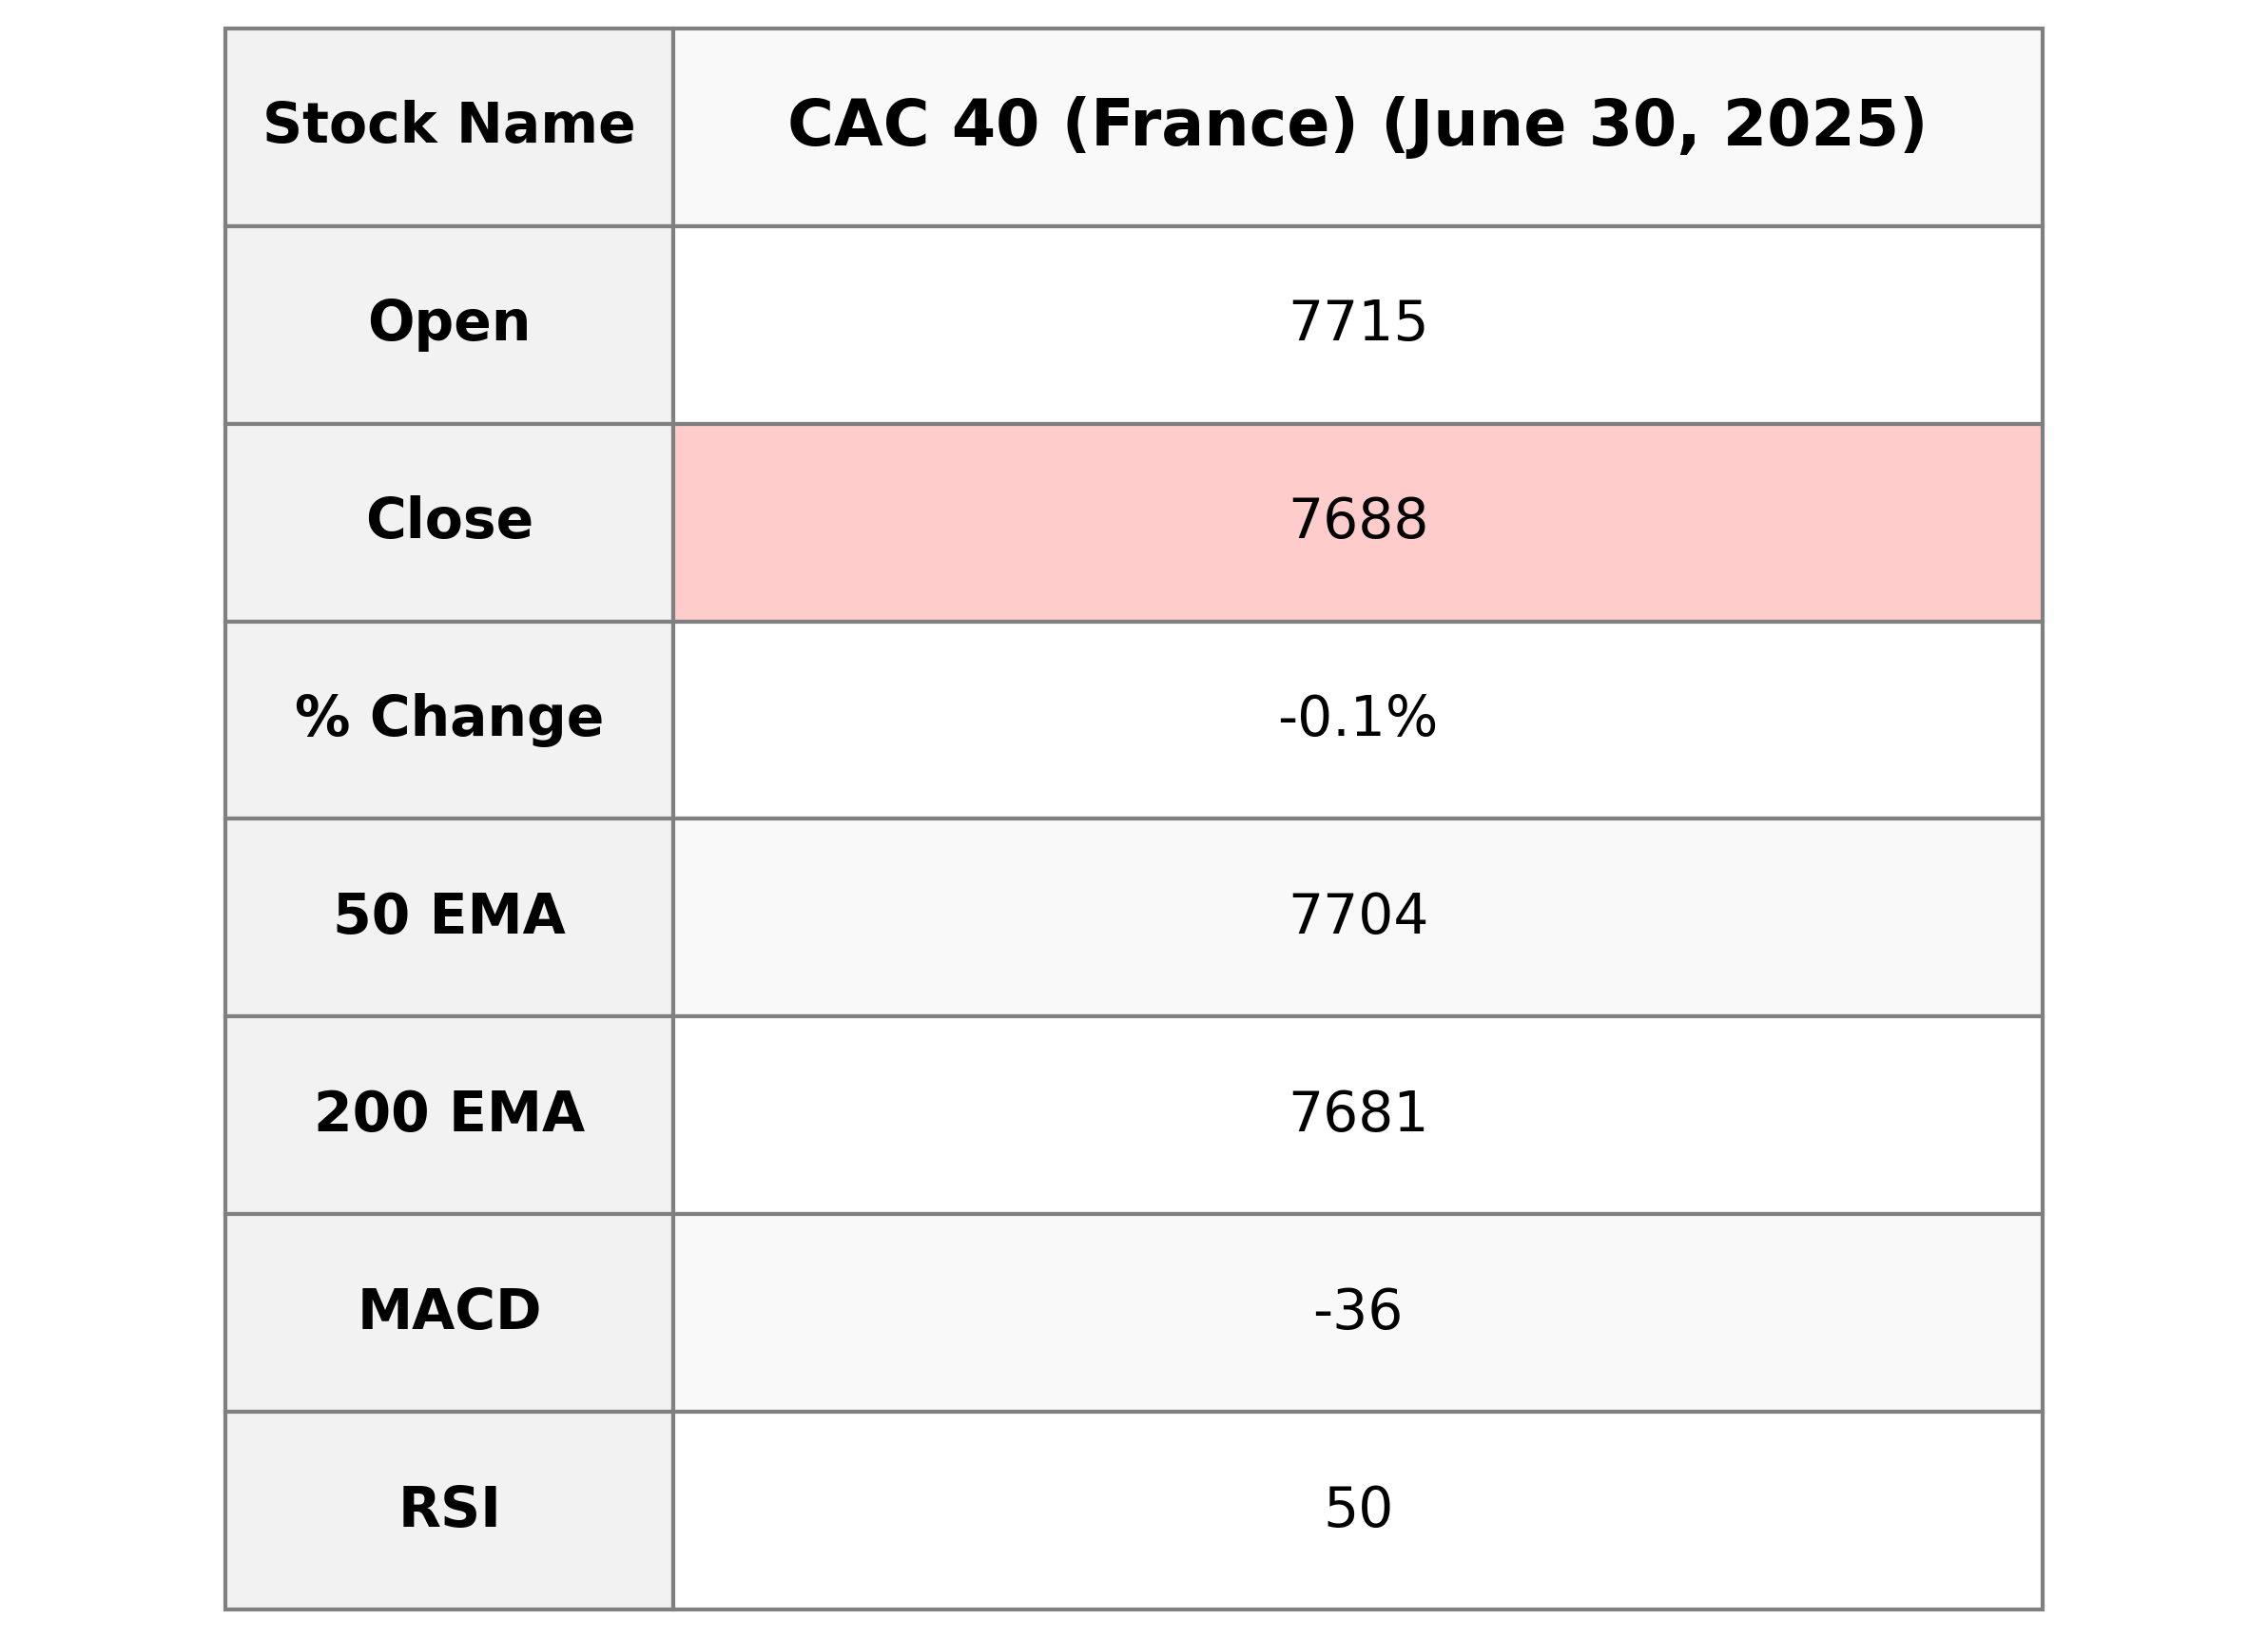
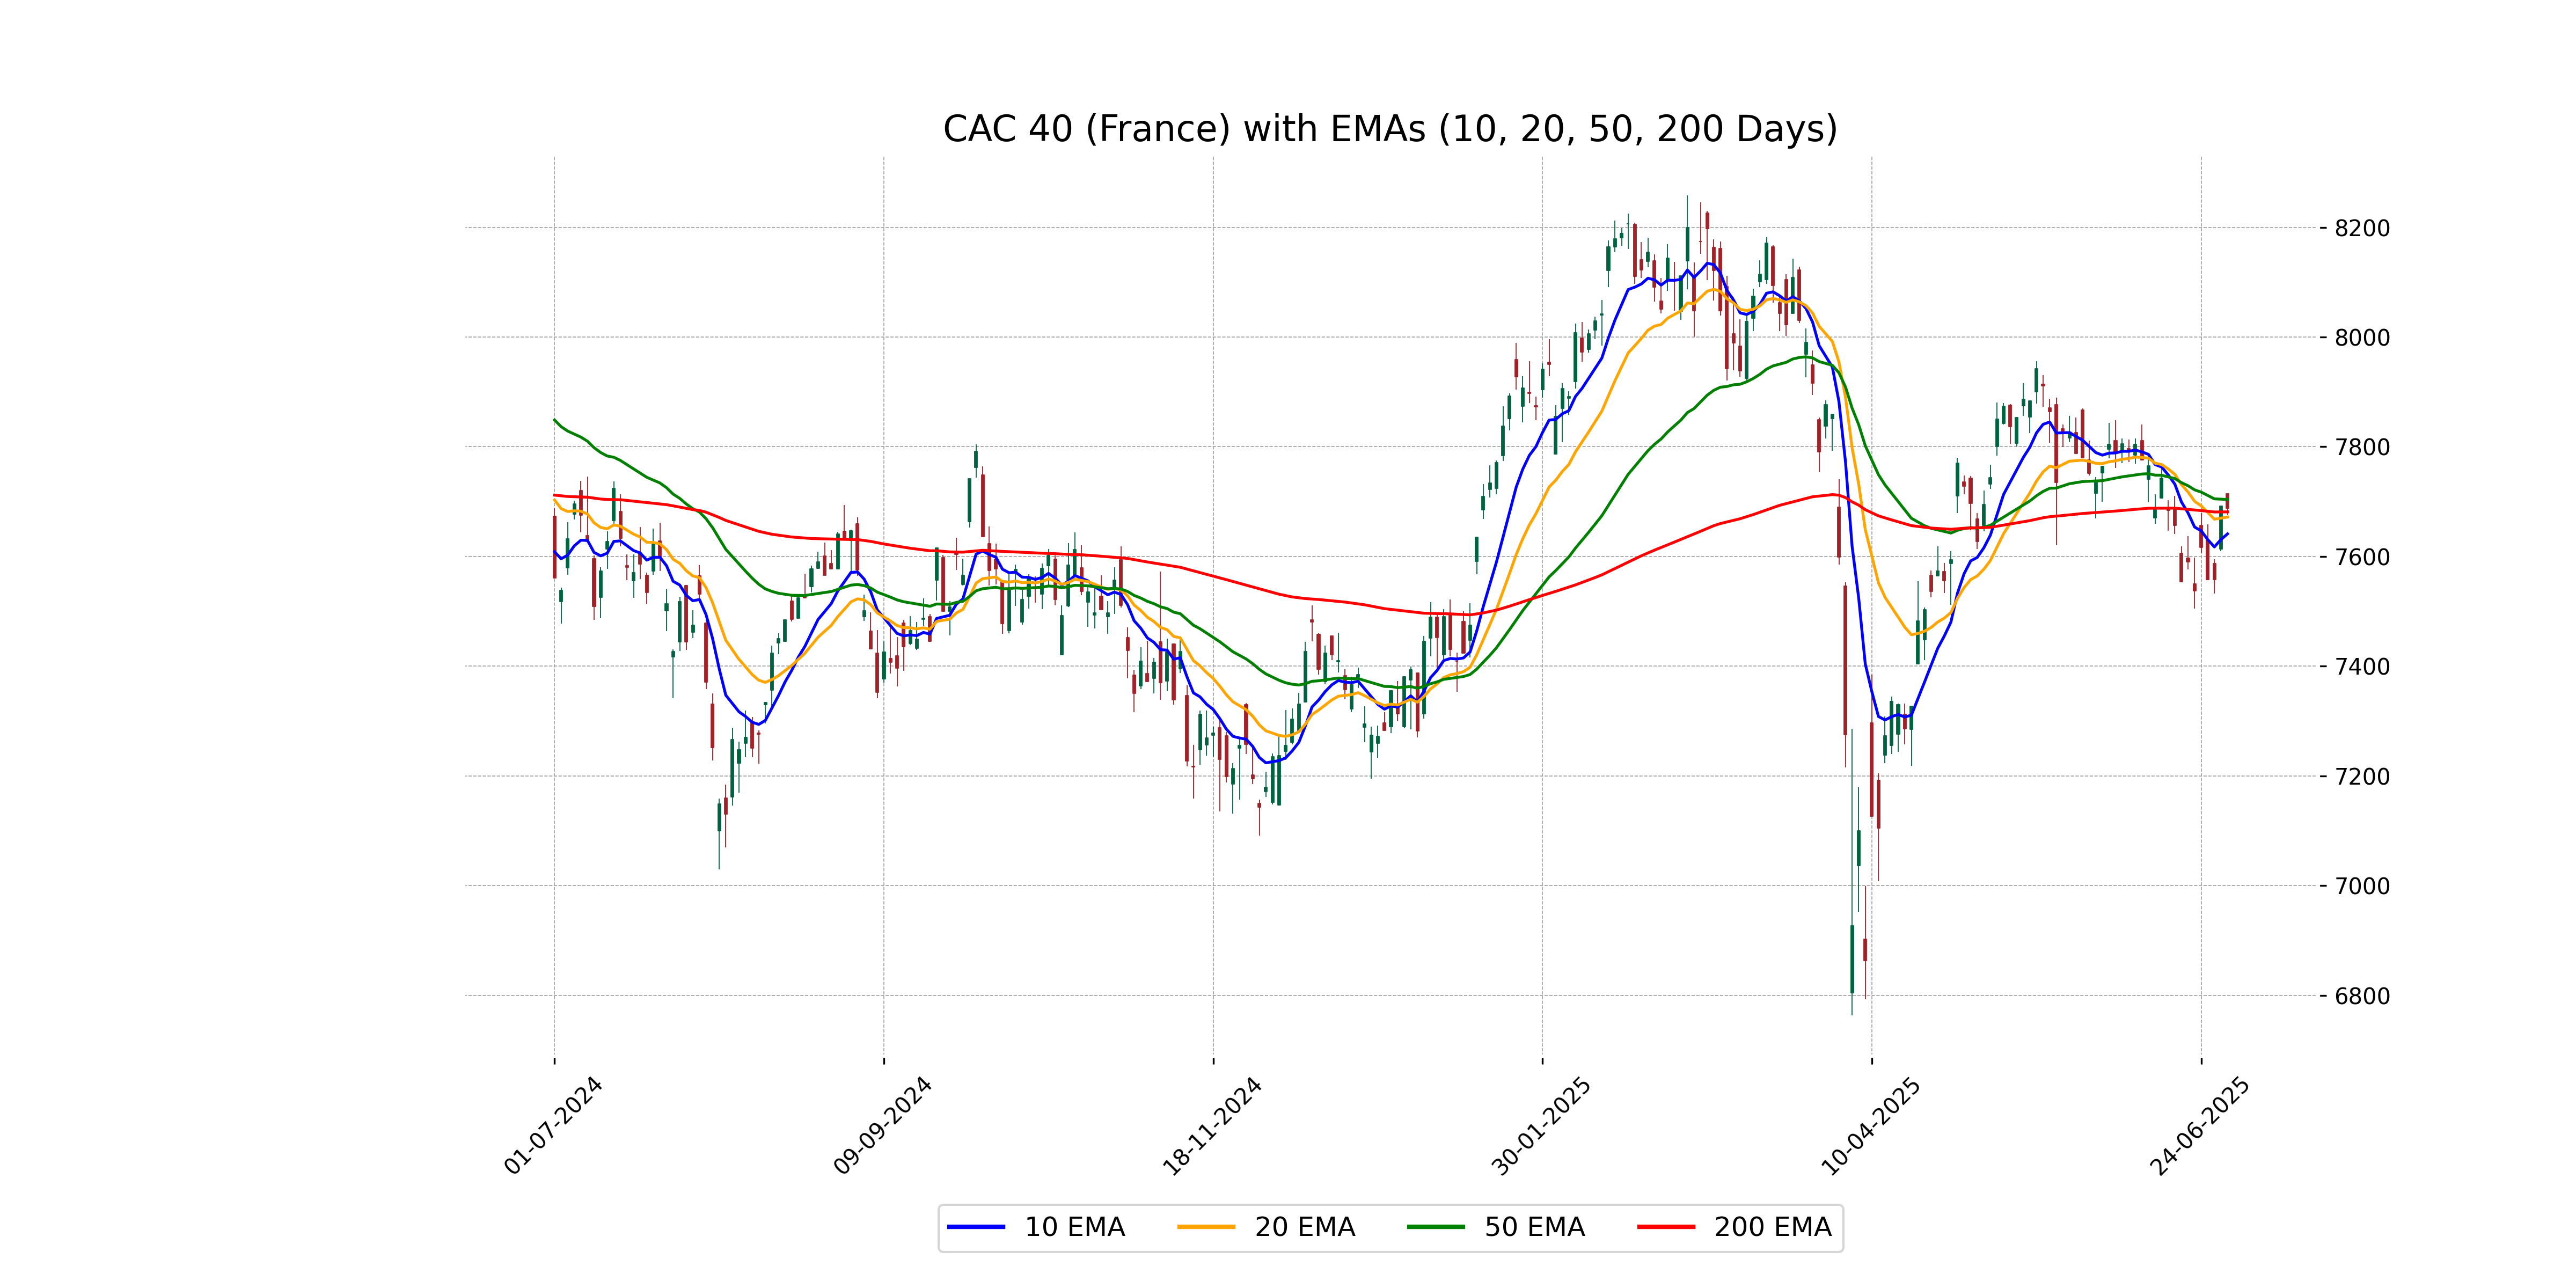
CAC 40 (France) Performance: The CAC 40 index opened at 7714.56 and experienced a slight decline to close at 7687.62, marking a minor percentage change of -0.05%. The market's volatility is reflected in the MACD value of -35.61, indicating a bearish trend, with the RSI at 50.24 showing neither overbought nor oversold conditions. The 50-day EMA of 7703.80 is slightly above the closing value, demonstrating that recent price movements deviate slightly from the short-term trend.
Relationship with Key Moving Averages
CAC 40 (France) closed slightly below its 50-EMA of 7703.80 and above its 200-EMA of 7681.22, indicating mixed momentum. The index is above its 10-EMA and close to its 20-EMA, suggesting recent short-term bullishness may be waning.
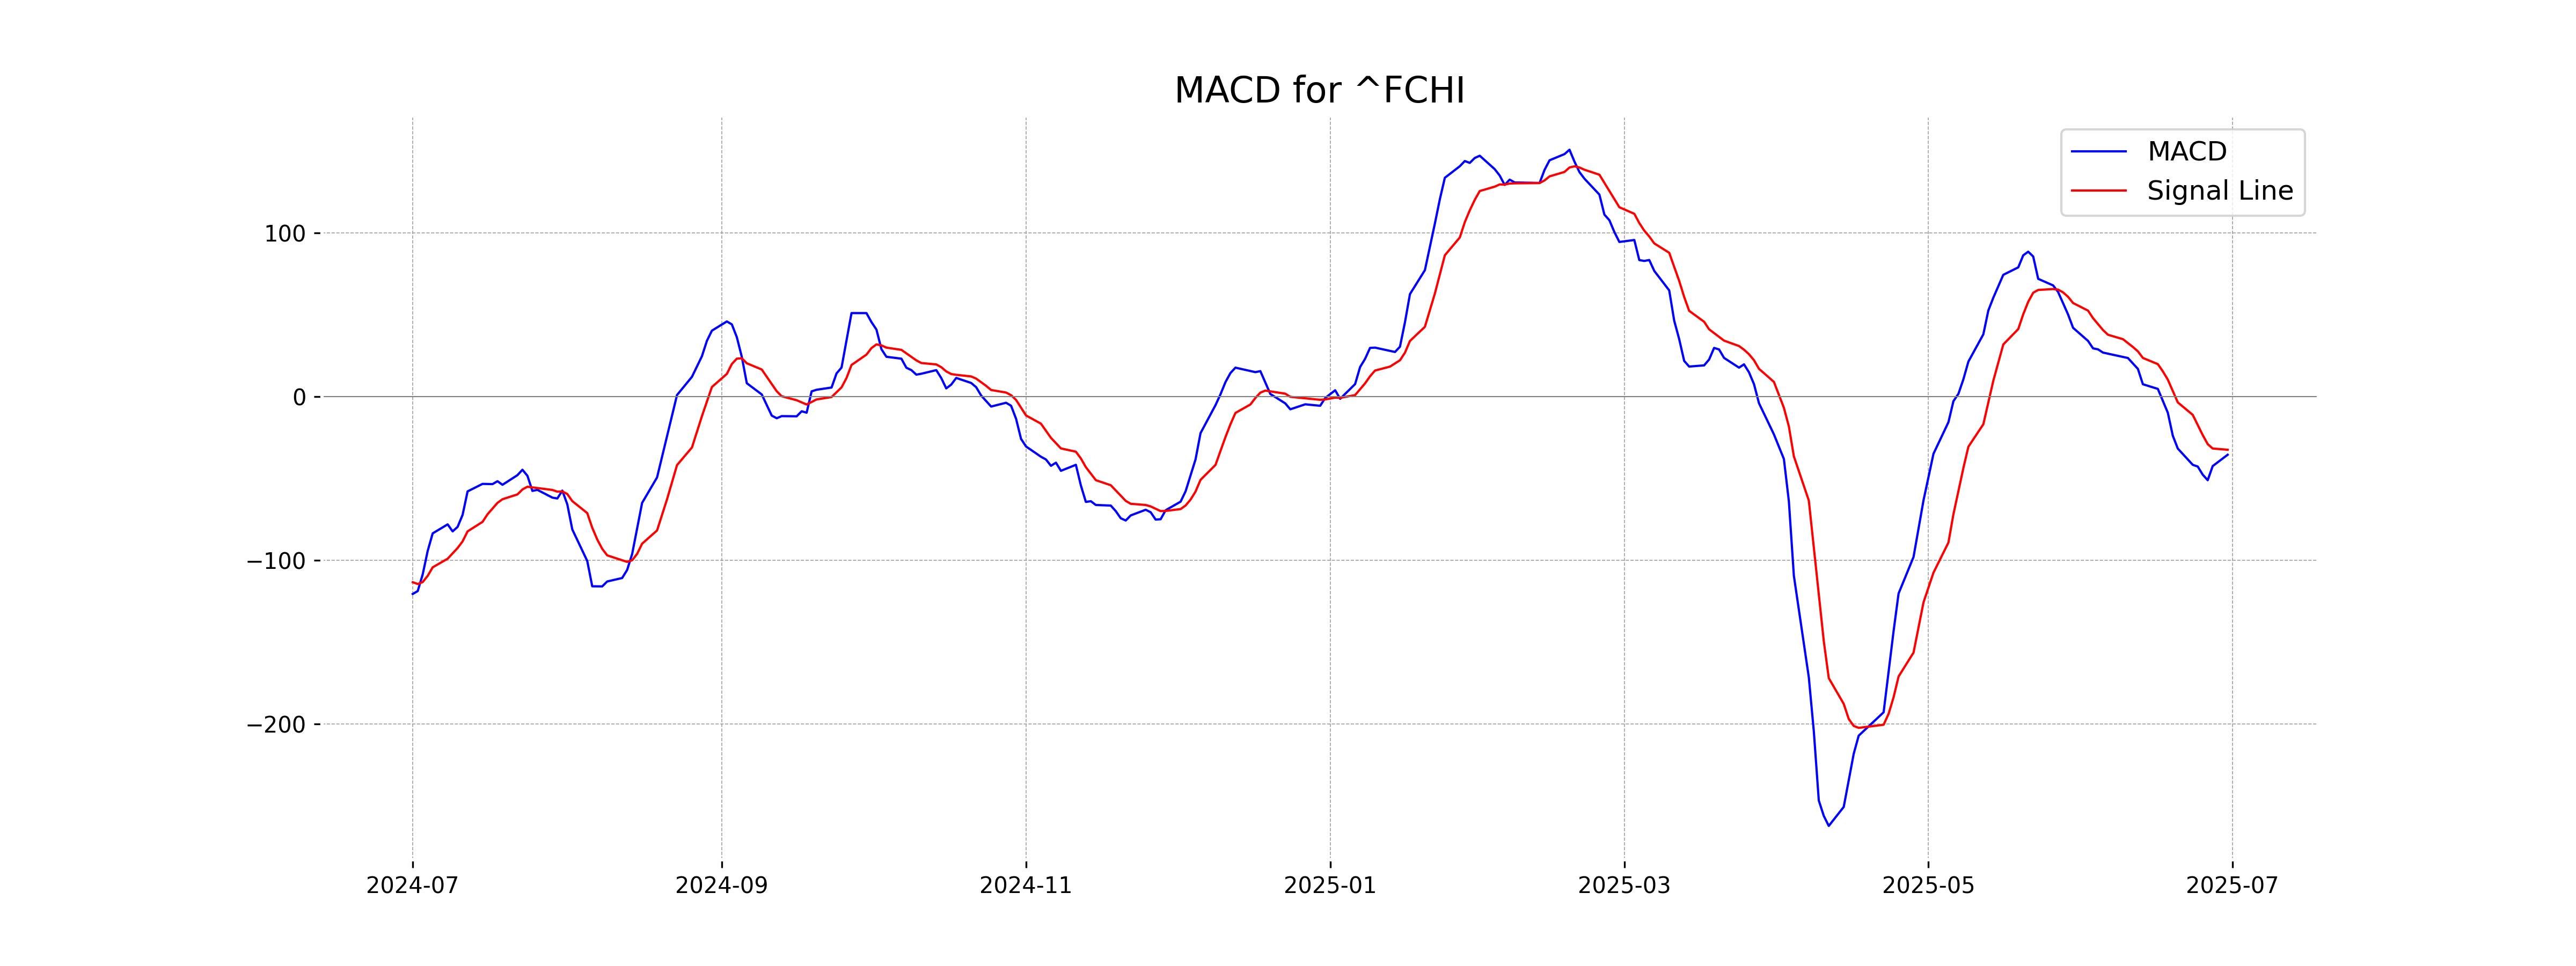
Moving Averages Trend (MACD)
The current MACD level for the CAC 40 index (France) is -35.612, which is below its MACD Signal of -32.562. This suggests a bearish sentiment in the short term, indicating potential downward momentum in the index.
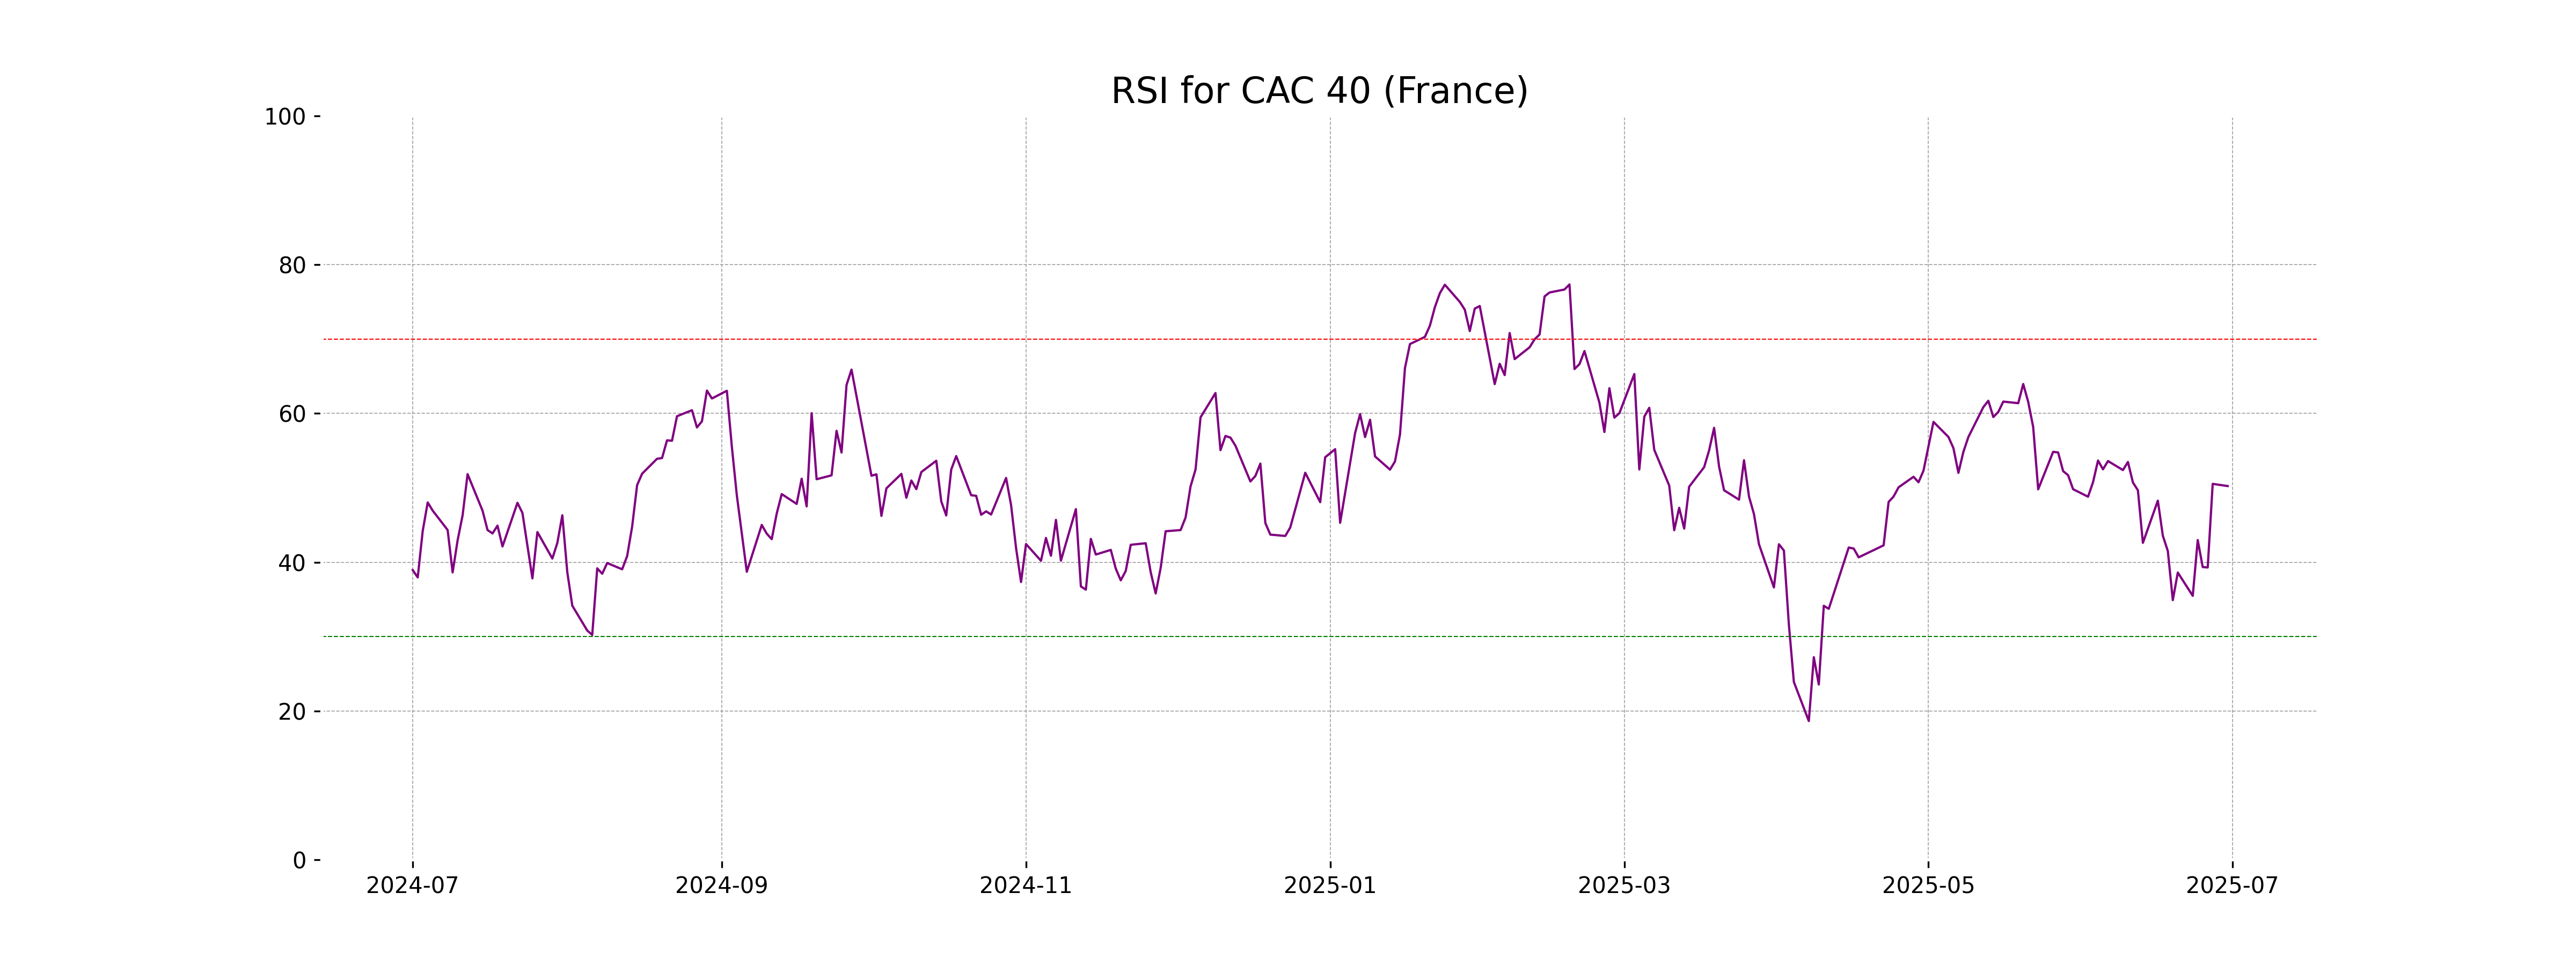
RSI Analysis
The current RSI for CAC 40 (France) is 50.24, indicating a neutral position. RSI values around 50 suggest that the market is neither overbought nor oversold, implying a balanced momentum at present.
Analysis for FTSE 100 (UK) - June 30, 2025
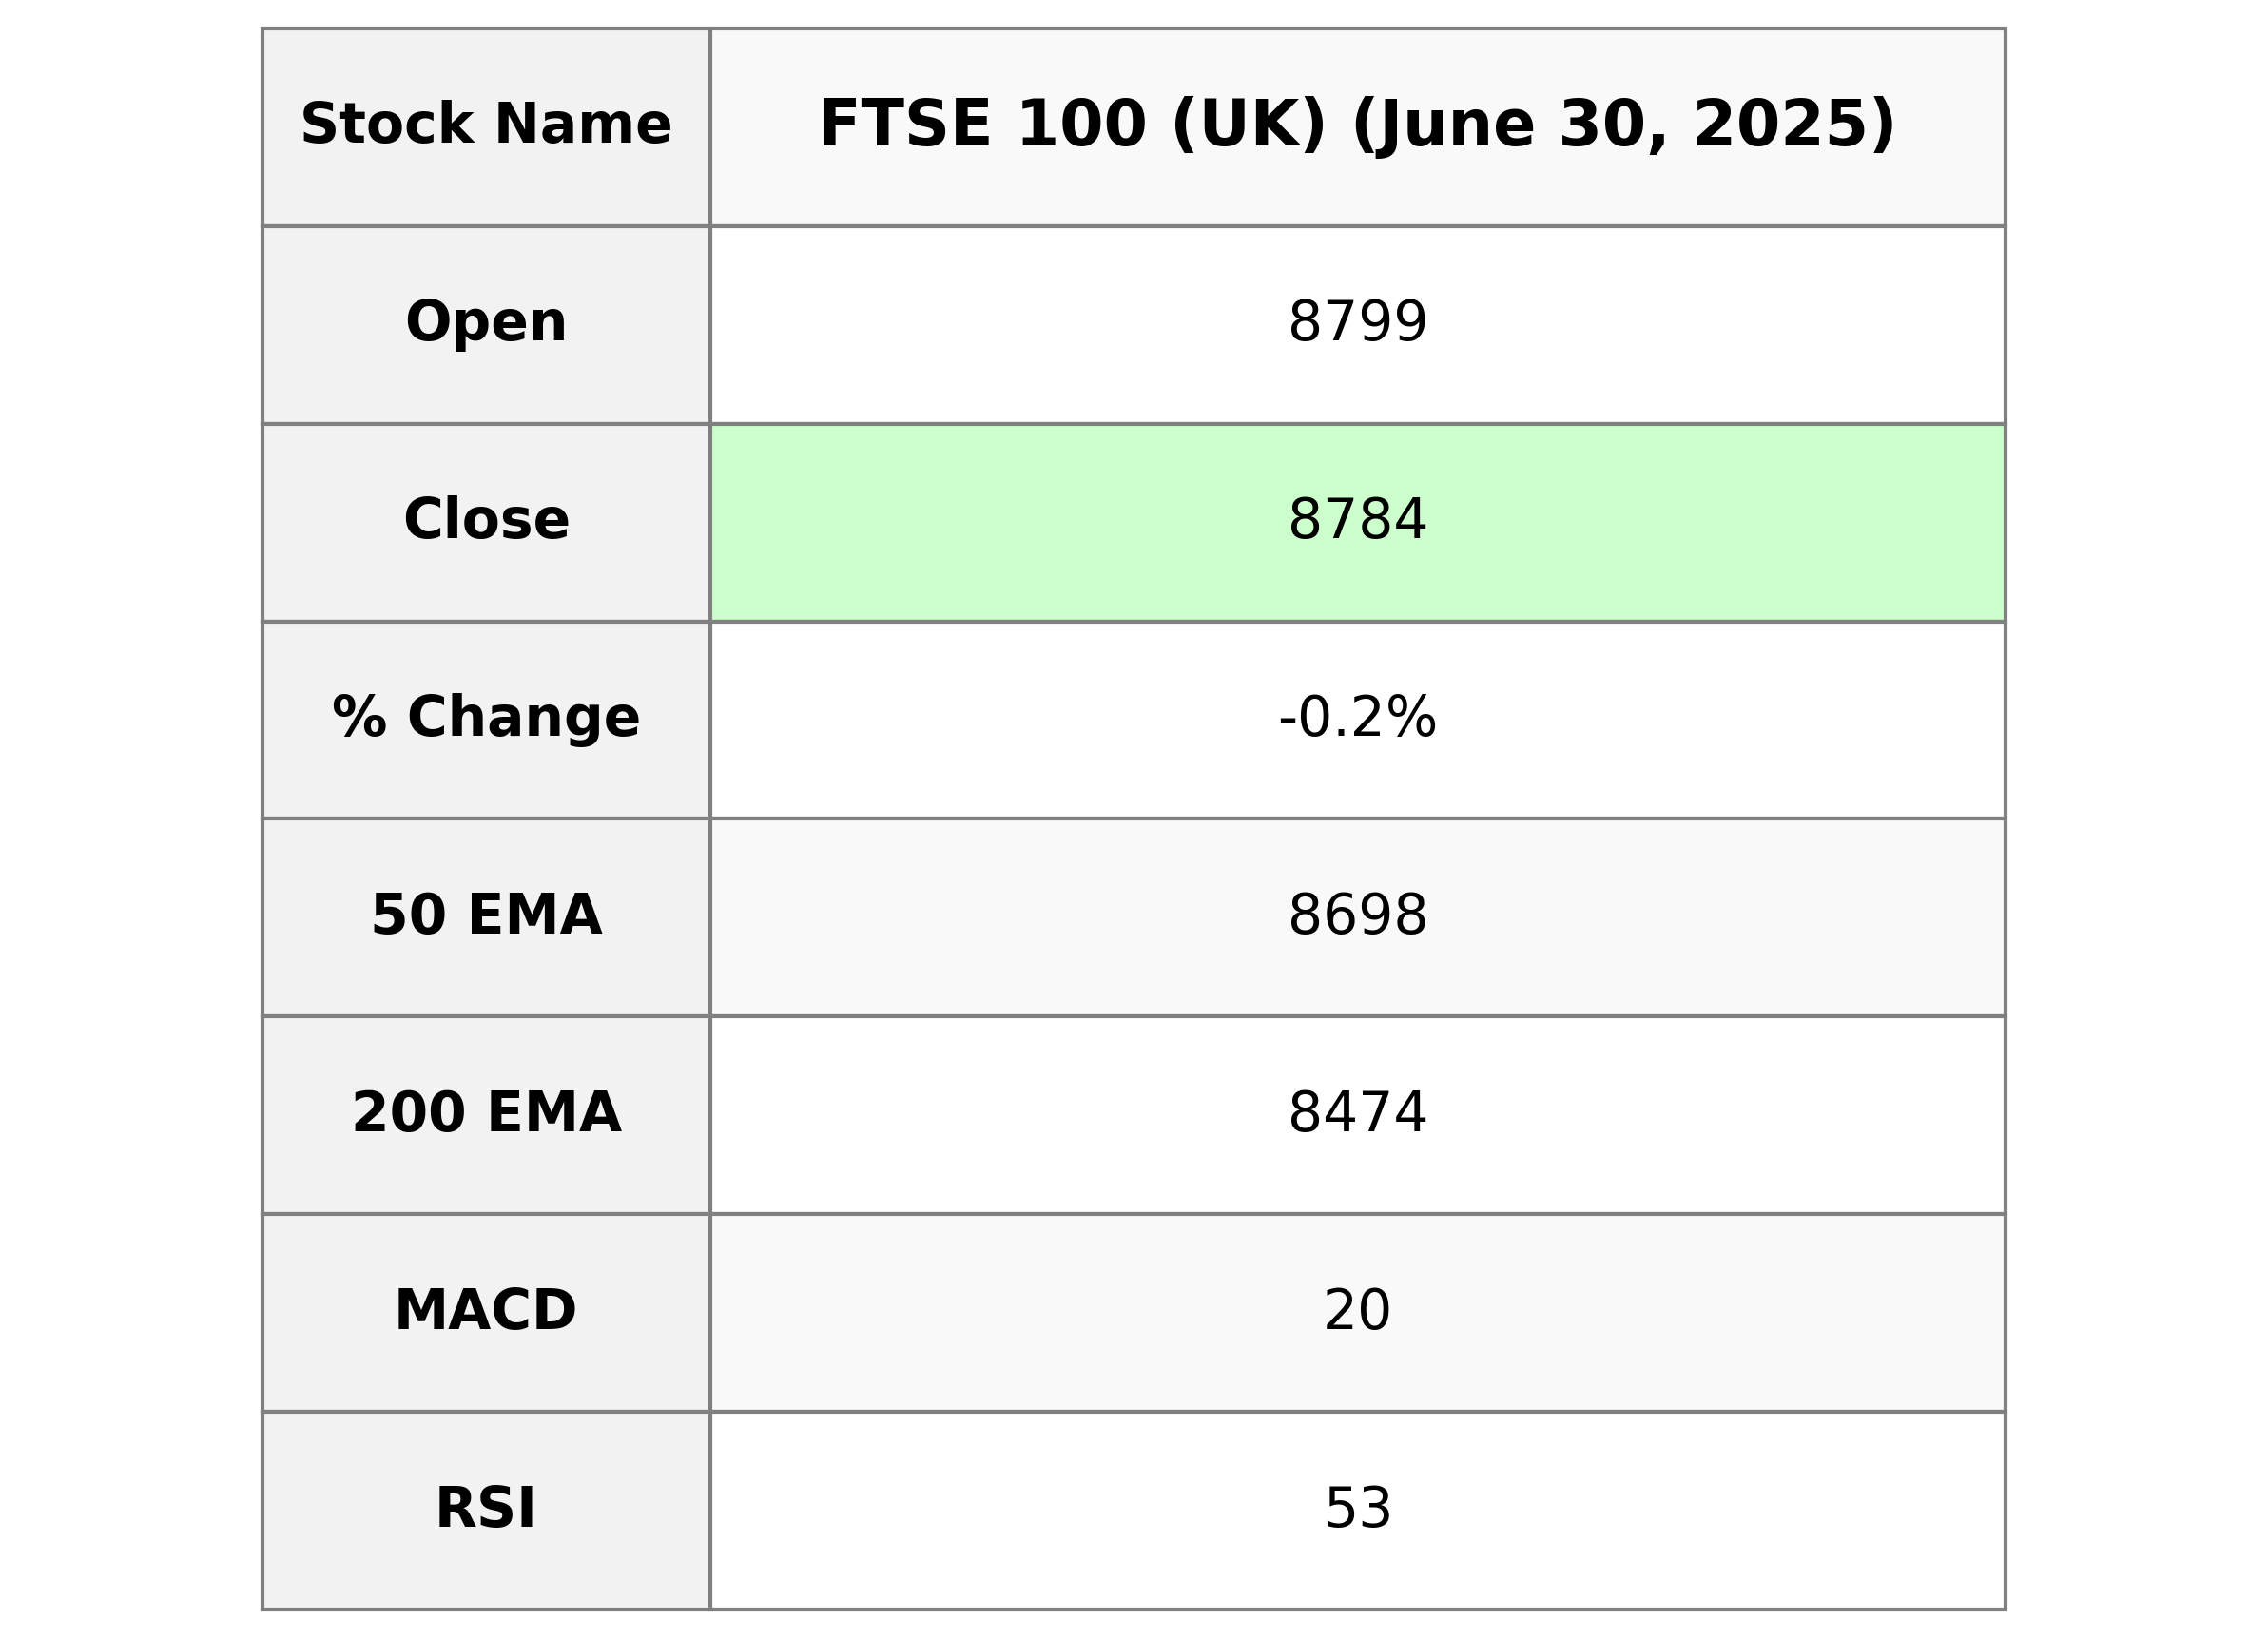
FTSE 100 (UK) opened at 8798.91 and closed slightly lower at 8783.52, representing a decrease of 0.17% from the previous close. Despite the slight drop, the index remains above its 50-day and 200-day EMAs, with a neutral RSI of 53.19, indicating a stable market performance.
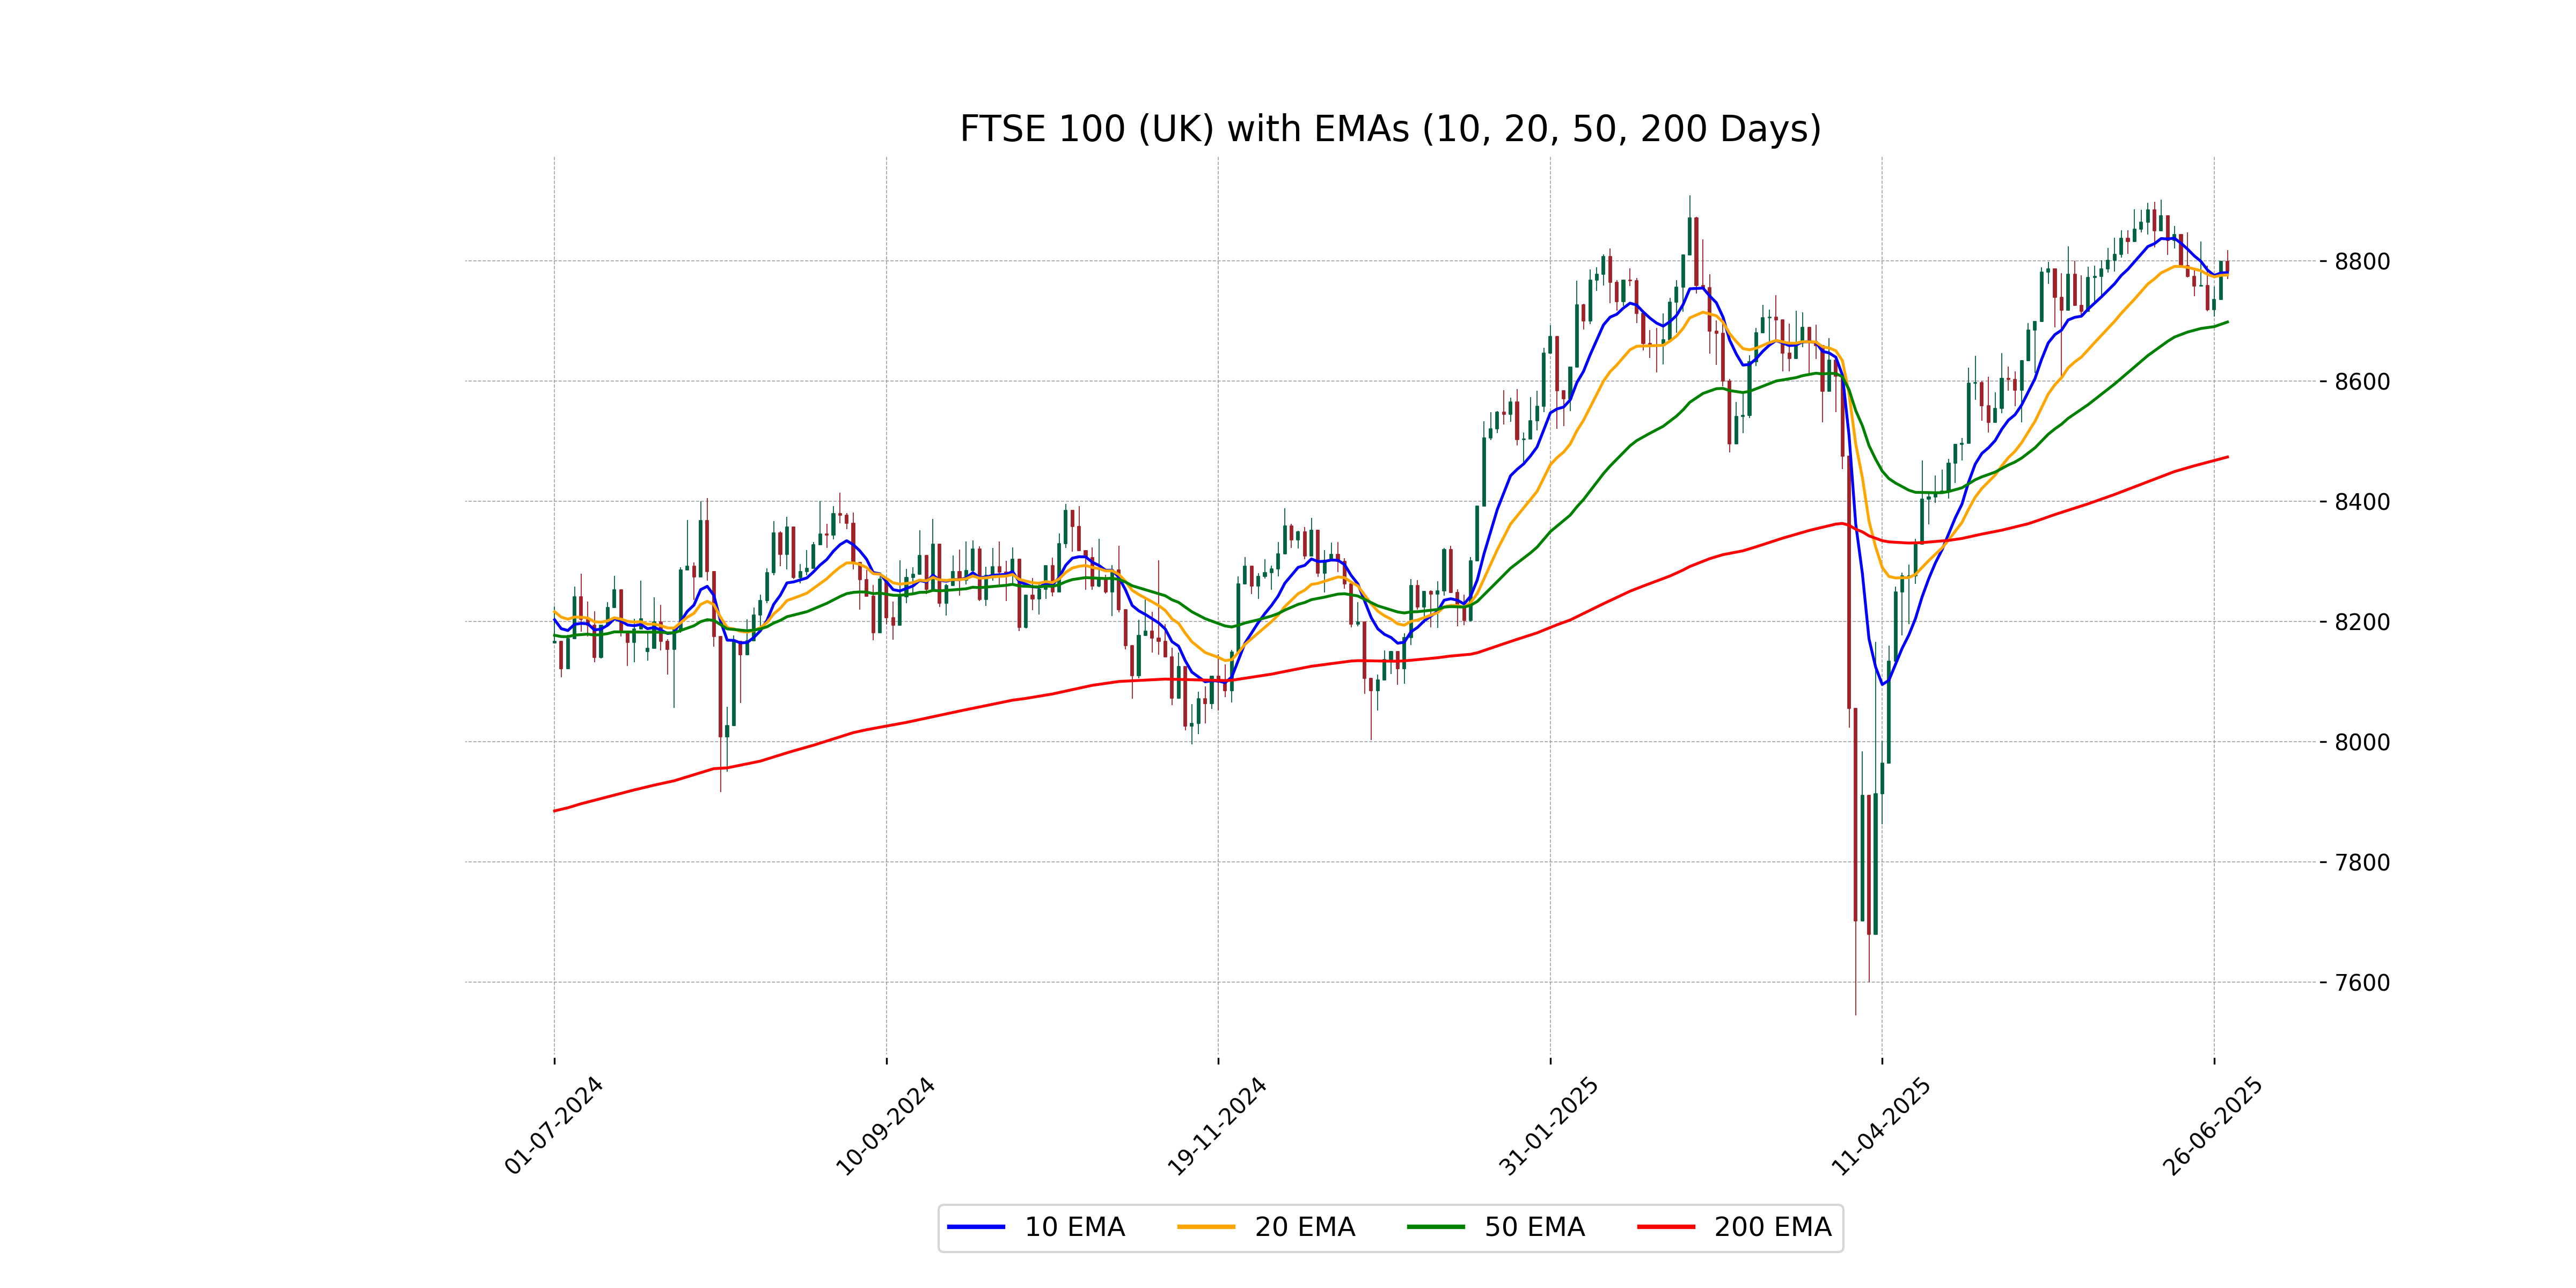
Relationship with Key Moving Averages
For the FTSE 100, the current close is 8783.52, positioned above the 50 EMA at 8698.36 and the 200 EMA at 8473.70, indicating a bullish trend over the medium and long term. However, it's slightly above the 10 EMA at 8780.63 and the 20 EMA at 8776.69, suggesting short-term consolidation.
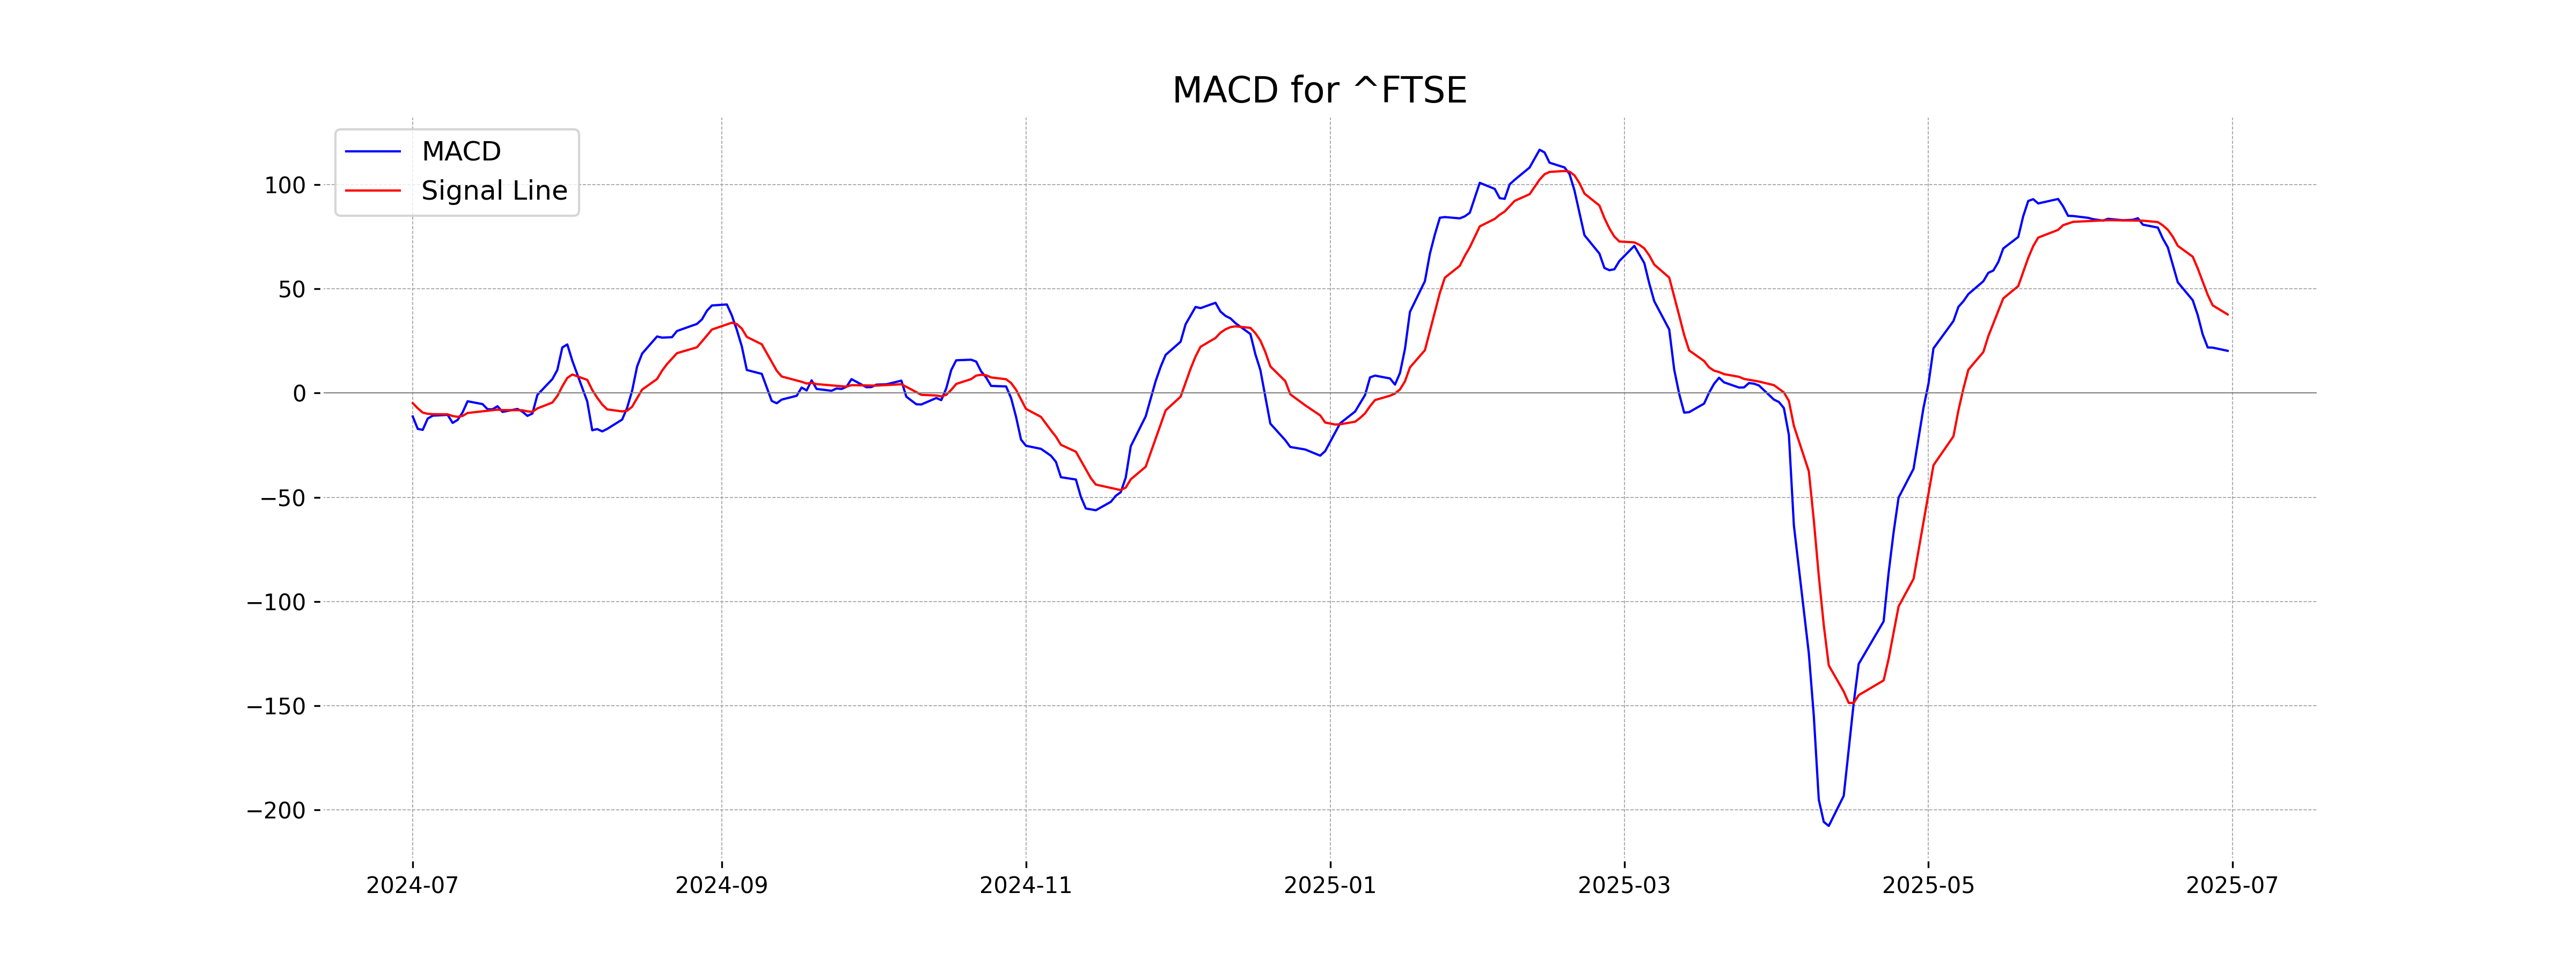
Moving Averages Trend (MACD)
The MACD of the FTSE 100 is currently 20.25, which is below the MACD Signal line at 37.70. This suggests a bearish signal as the MACD has crossed below the Signal line, indicating potential downward momentum.
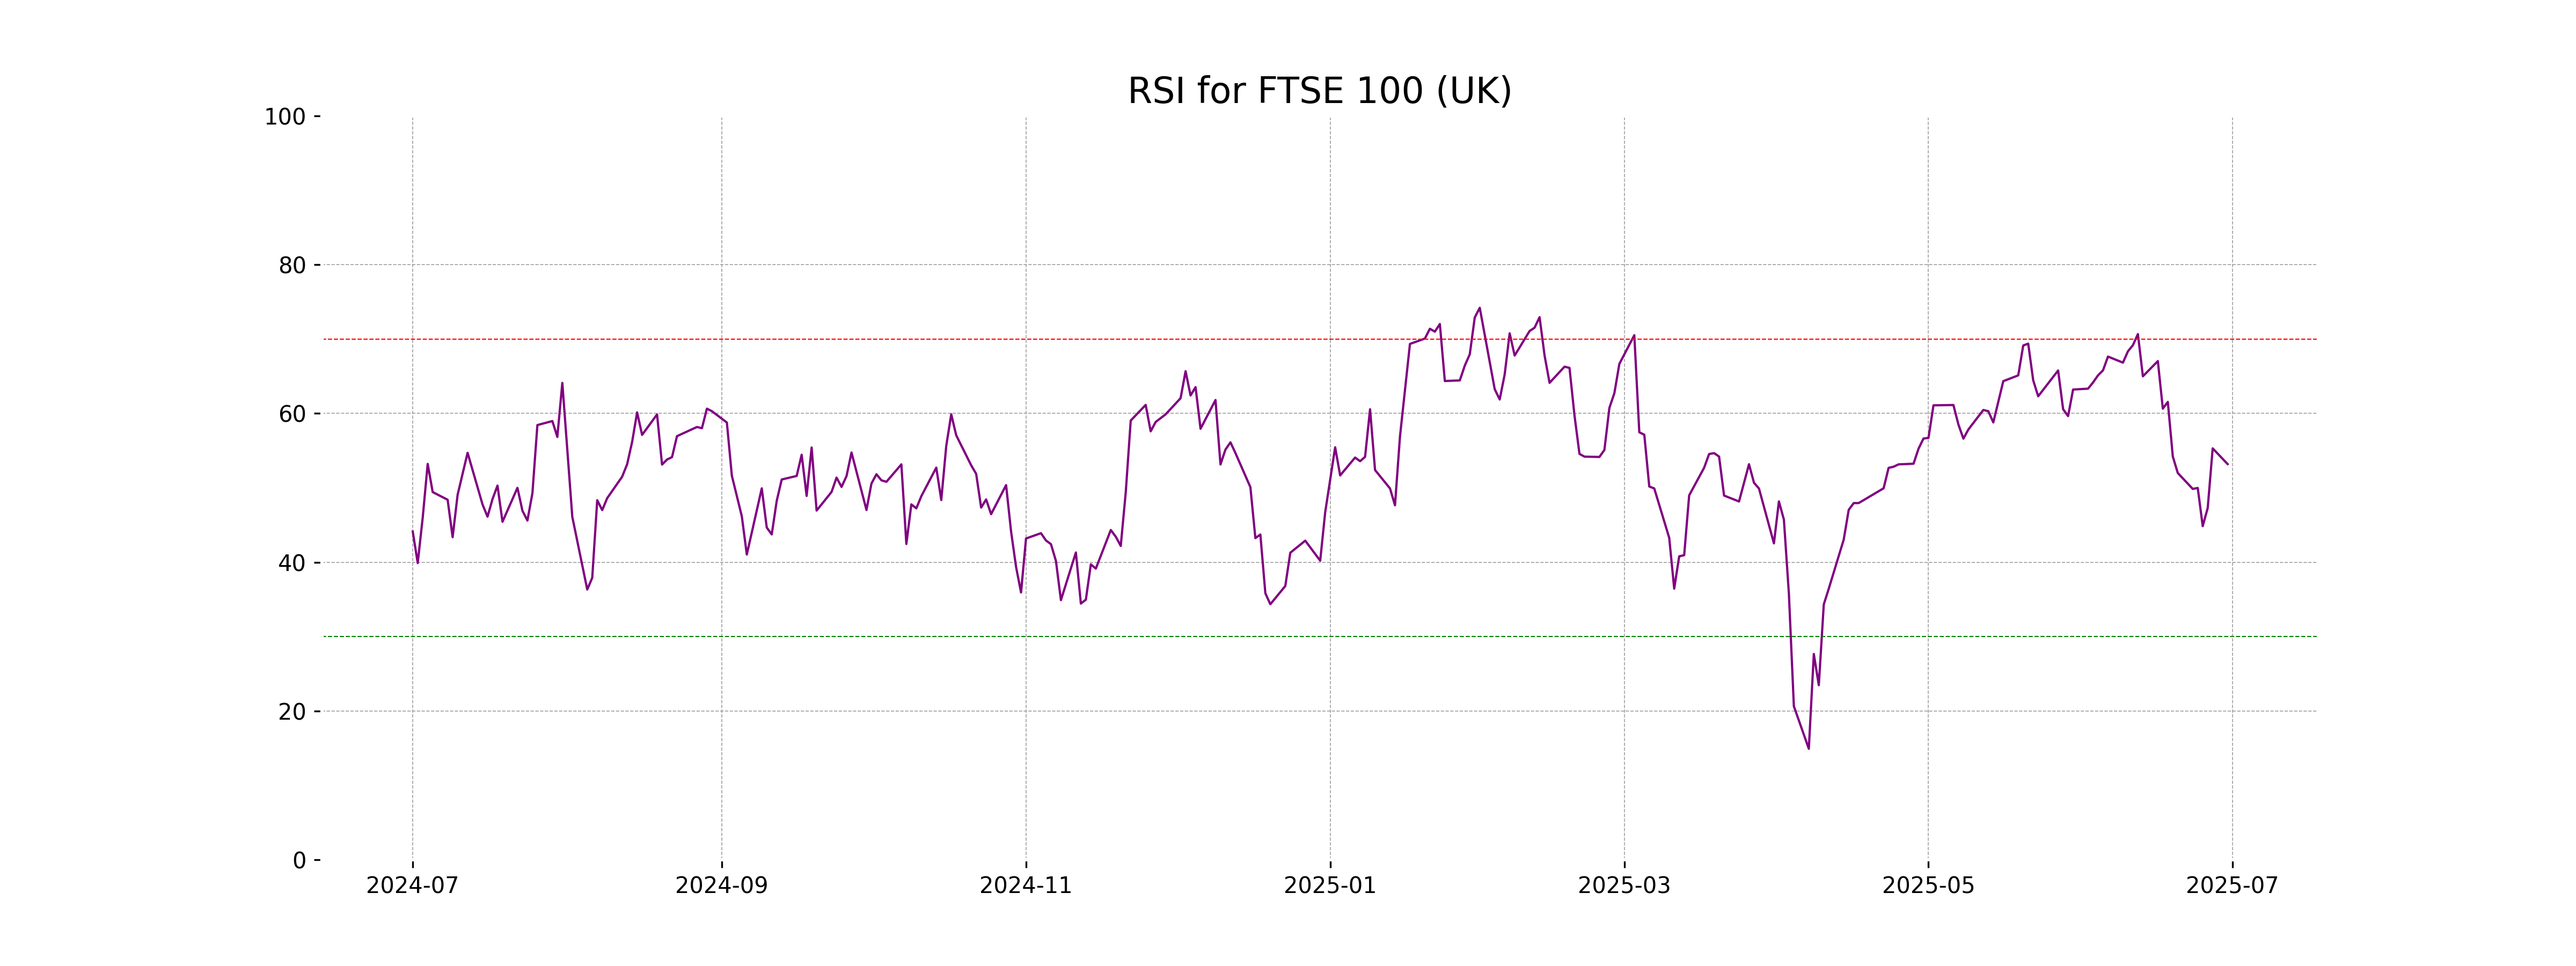
RSI Analysis
The Relative Strength Index (RSI) for the FTSE 100 is approximately 53.19, indicating a neutral market sentiment. An RSI in the range of 30 to 70 suggests that the index is neither overbought nor oversold, reflecting a balanced trading environment.
Analysis for DAX (Germany) - June 30, 2025
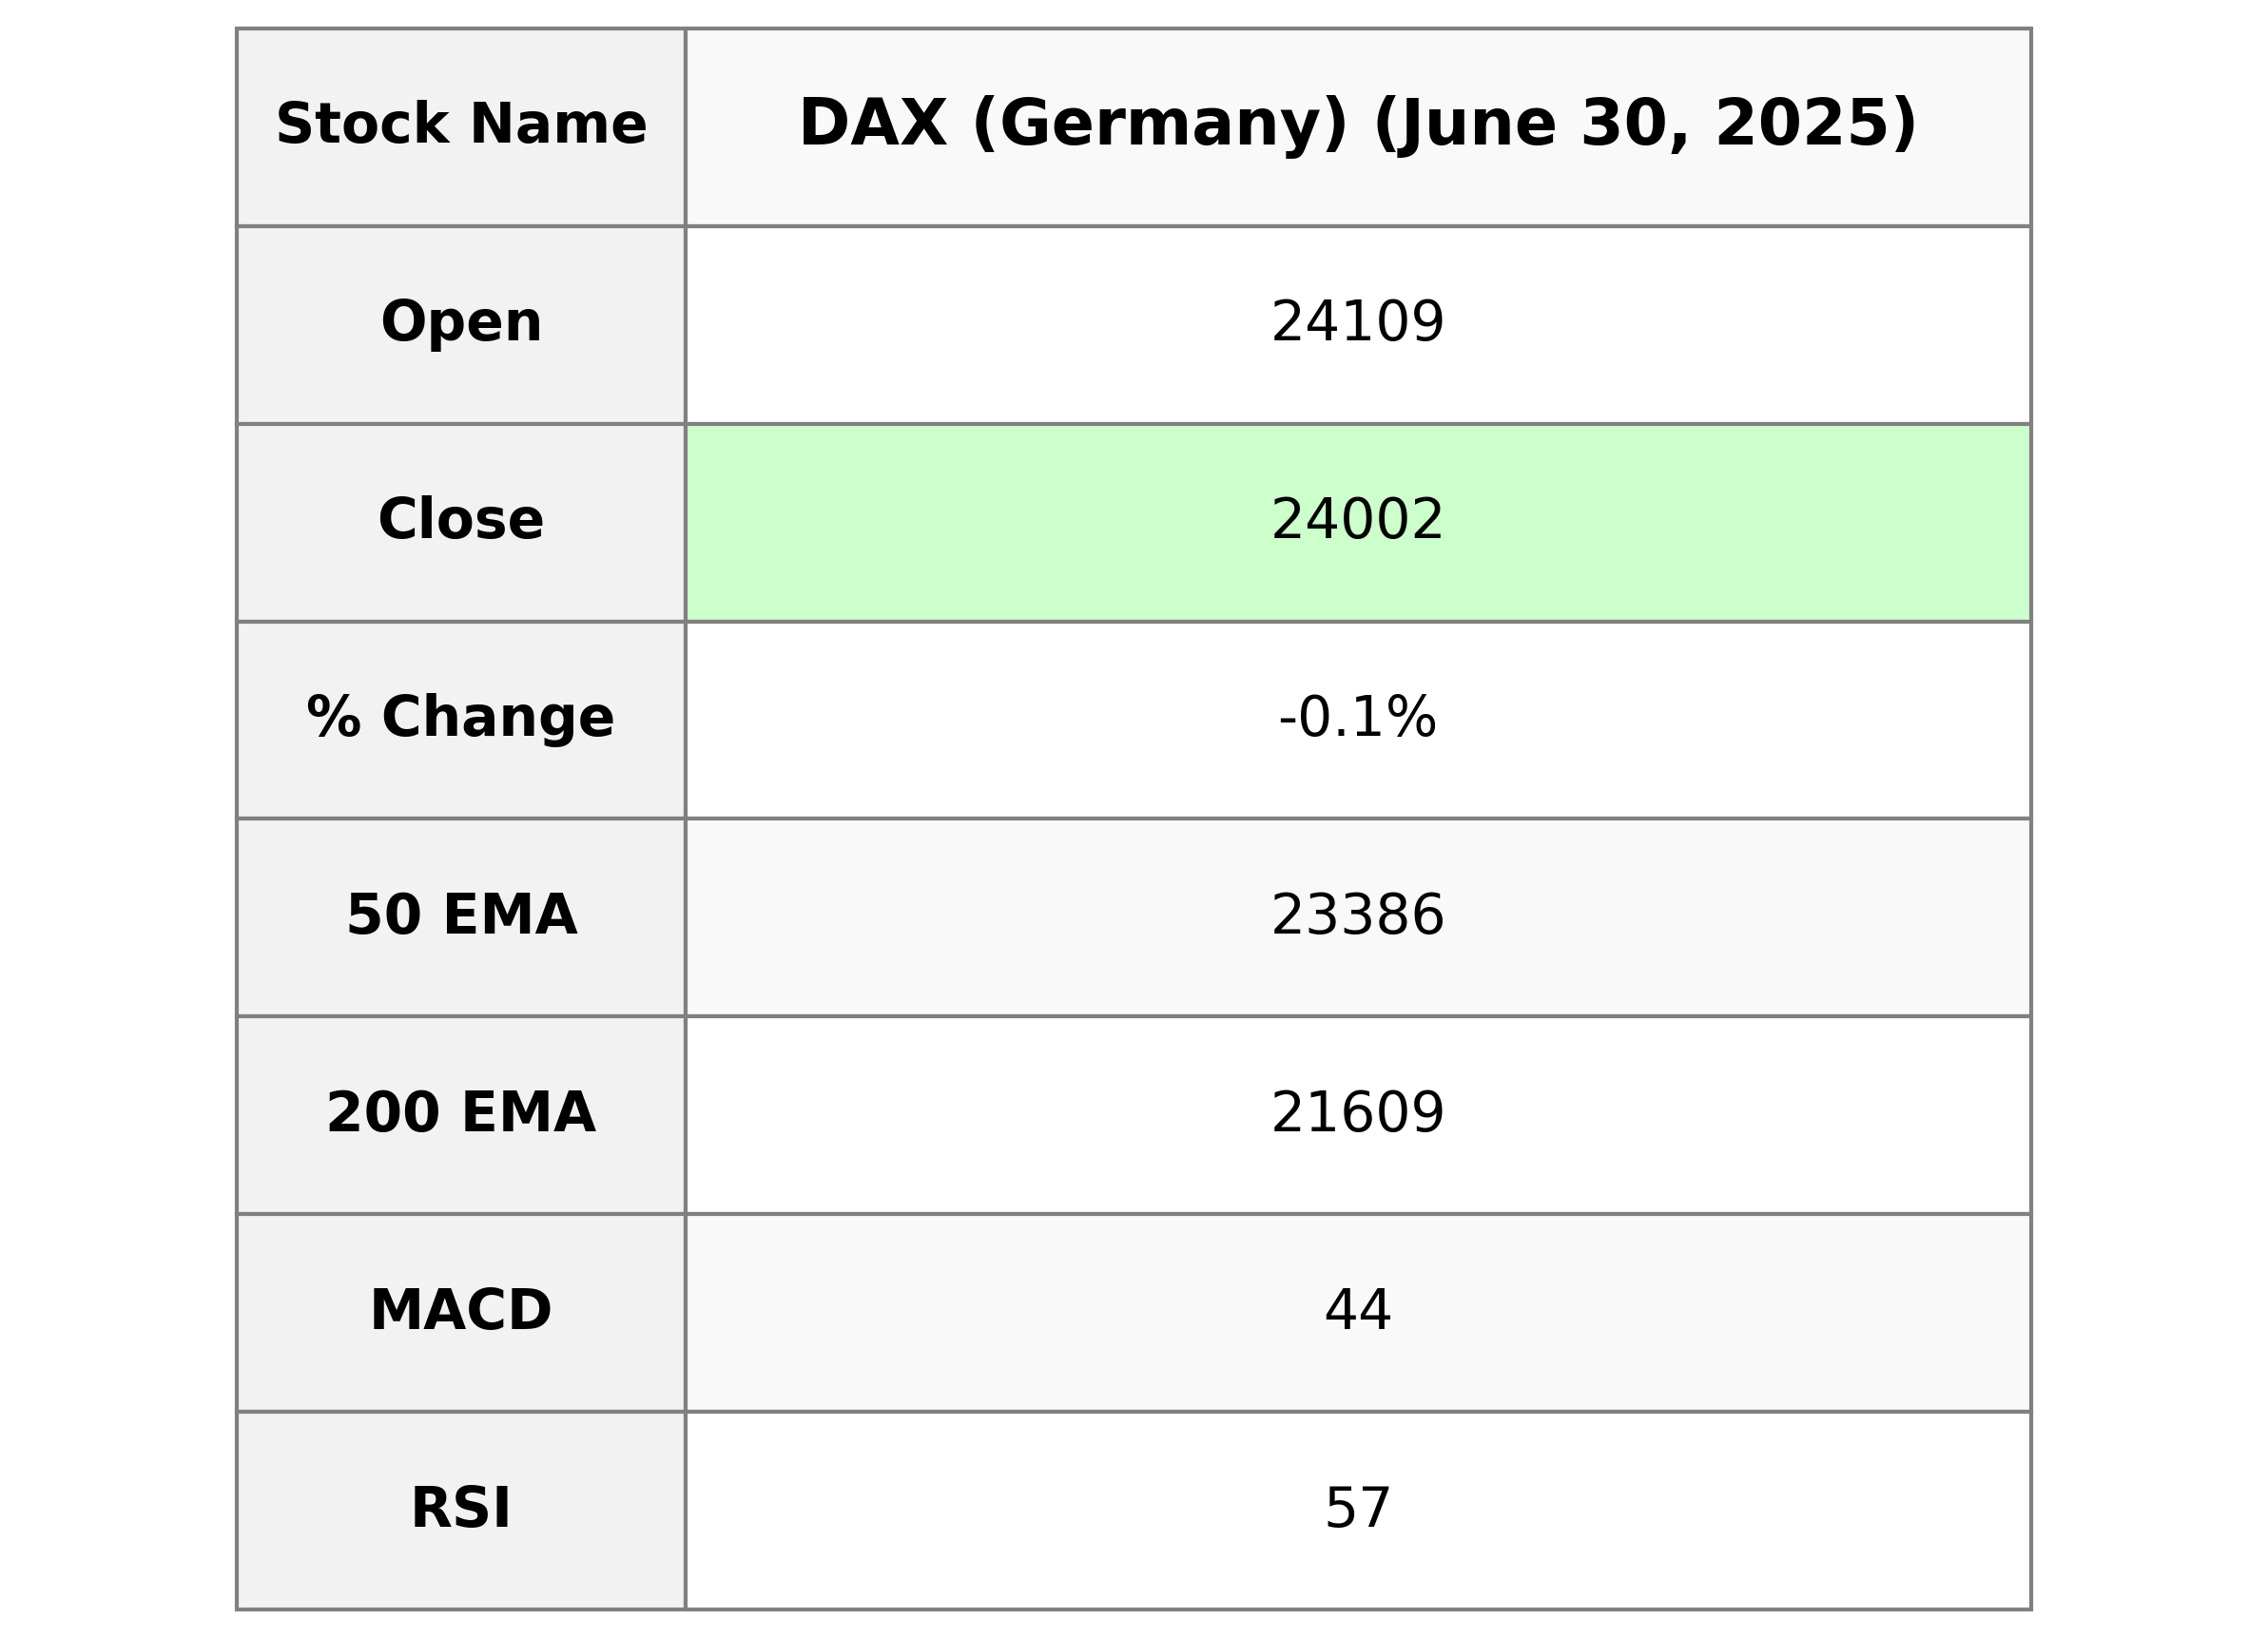
The DAX (Germany) opened at 24,109.15 and closed slightly lower at 24,001.54, marking a decrease of -0.13%. The market experienced a high of 24,120.82 and a low of 23,965.90 during the trading session. The technical indicators suggest the index is above its 50-, 20-, and 10-day EMAs, with an RSI of 57.42 indicating moderate strength.
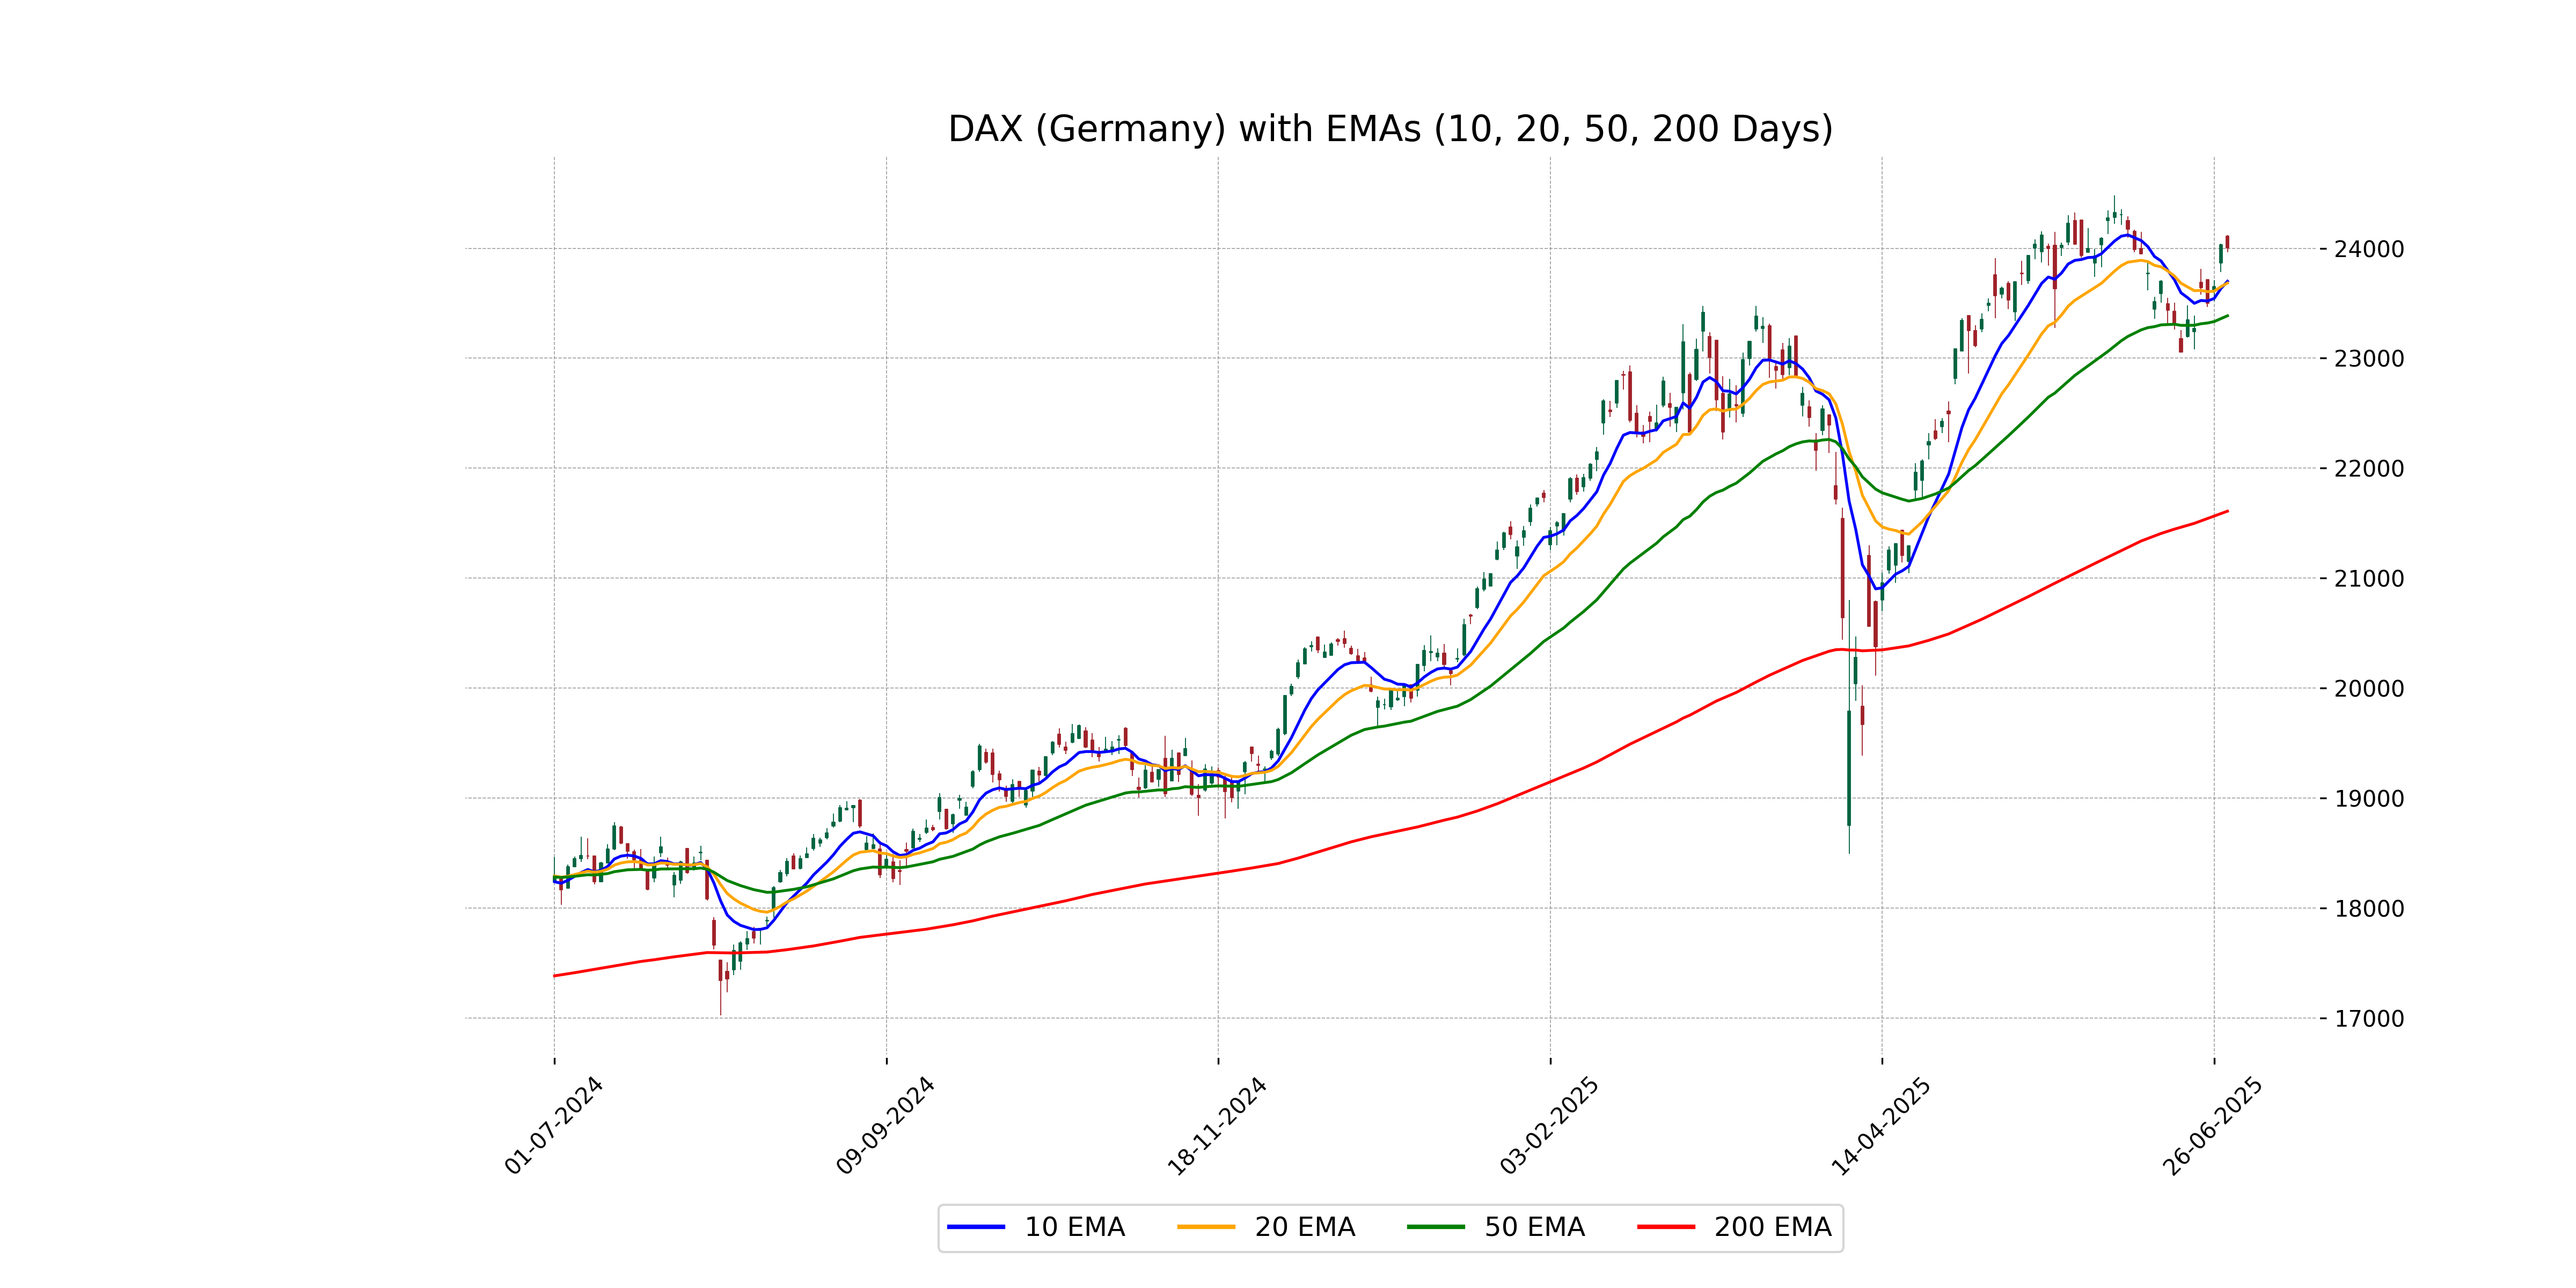
Relationship with Key Moving Averages
The DAX (Germany) is trading above its 50-day EMA of 23,385.84 and significantly above its 200-day EMA of 21,608.75, indicating a current bullish trend. However, it is below its 10-day EMA of 23,699.76 and slightly below its 20-day EMA of 23,683.46, suggesting some recent short-term weakness.
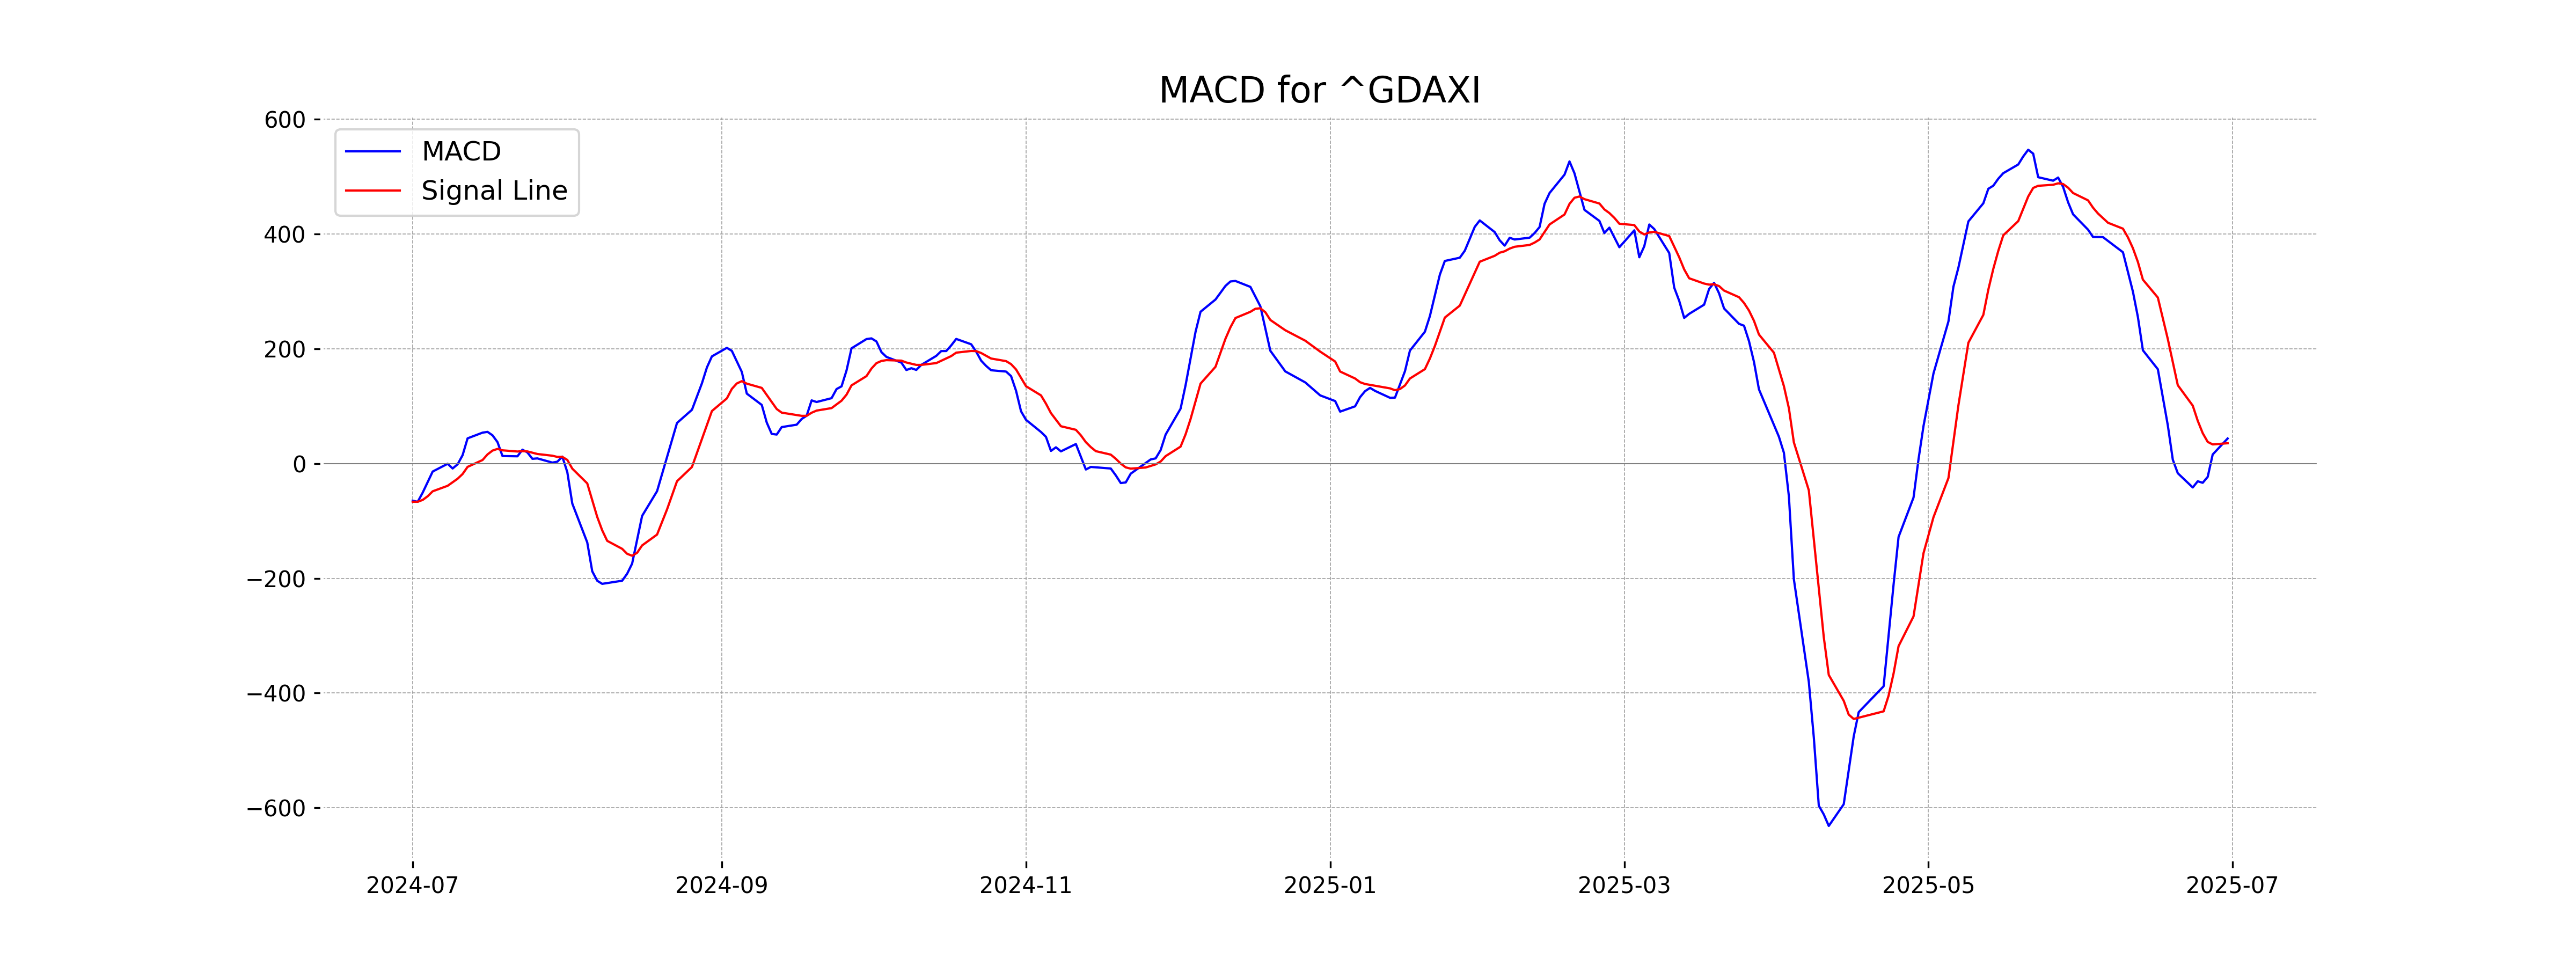
Moving Averages Trend (MACD)
The MACD for the DAX indicates a positive momentum, as the MACD line (43.74) is above the MACD Signal line (35.47). This suggests that the market may experience bullish behavior in the short term, although the slight negative change in closing price indicates caution may still be warranted.
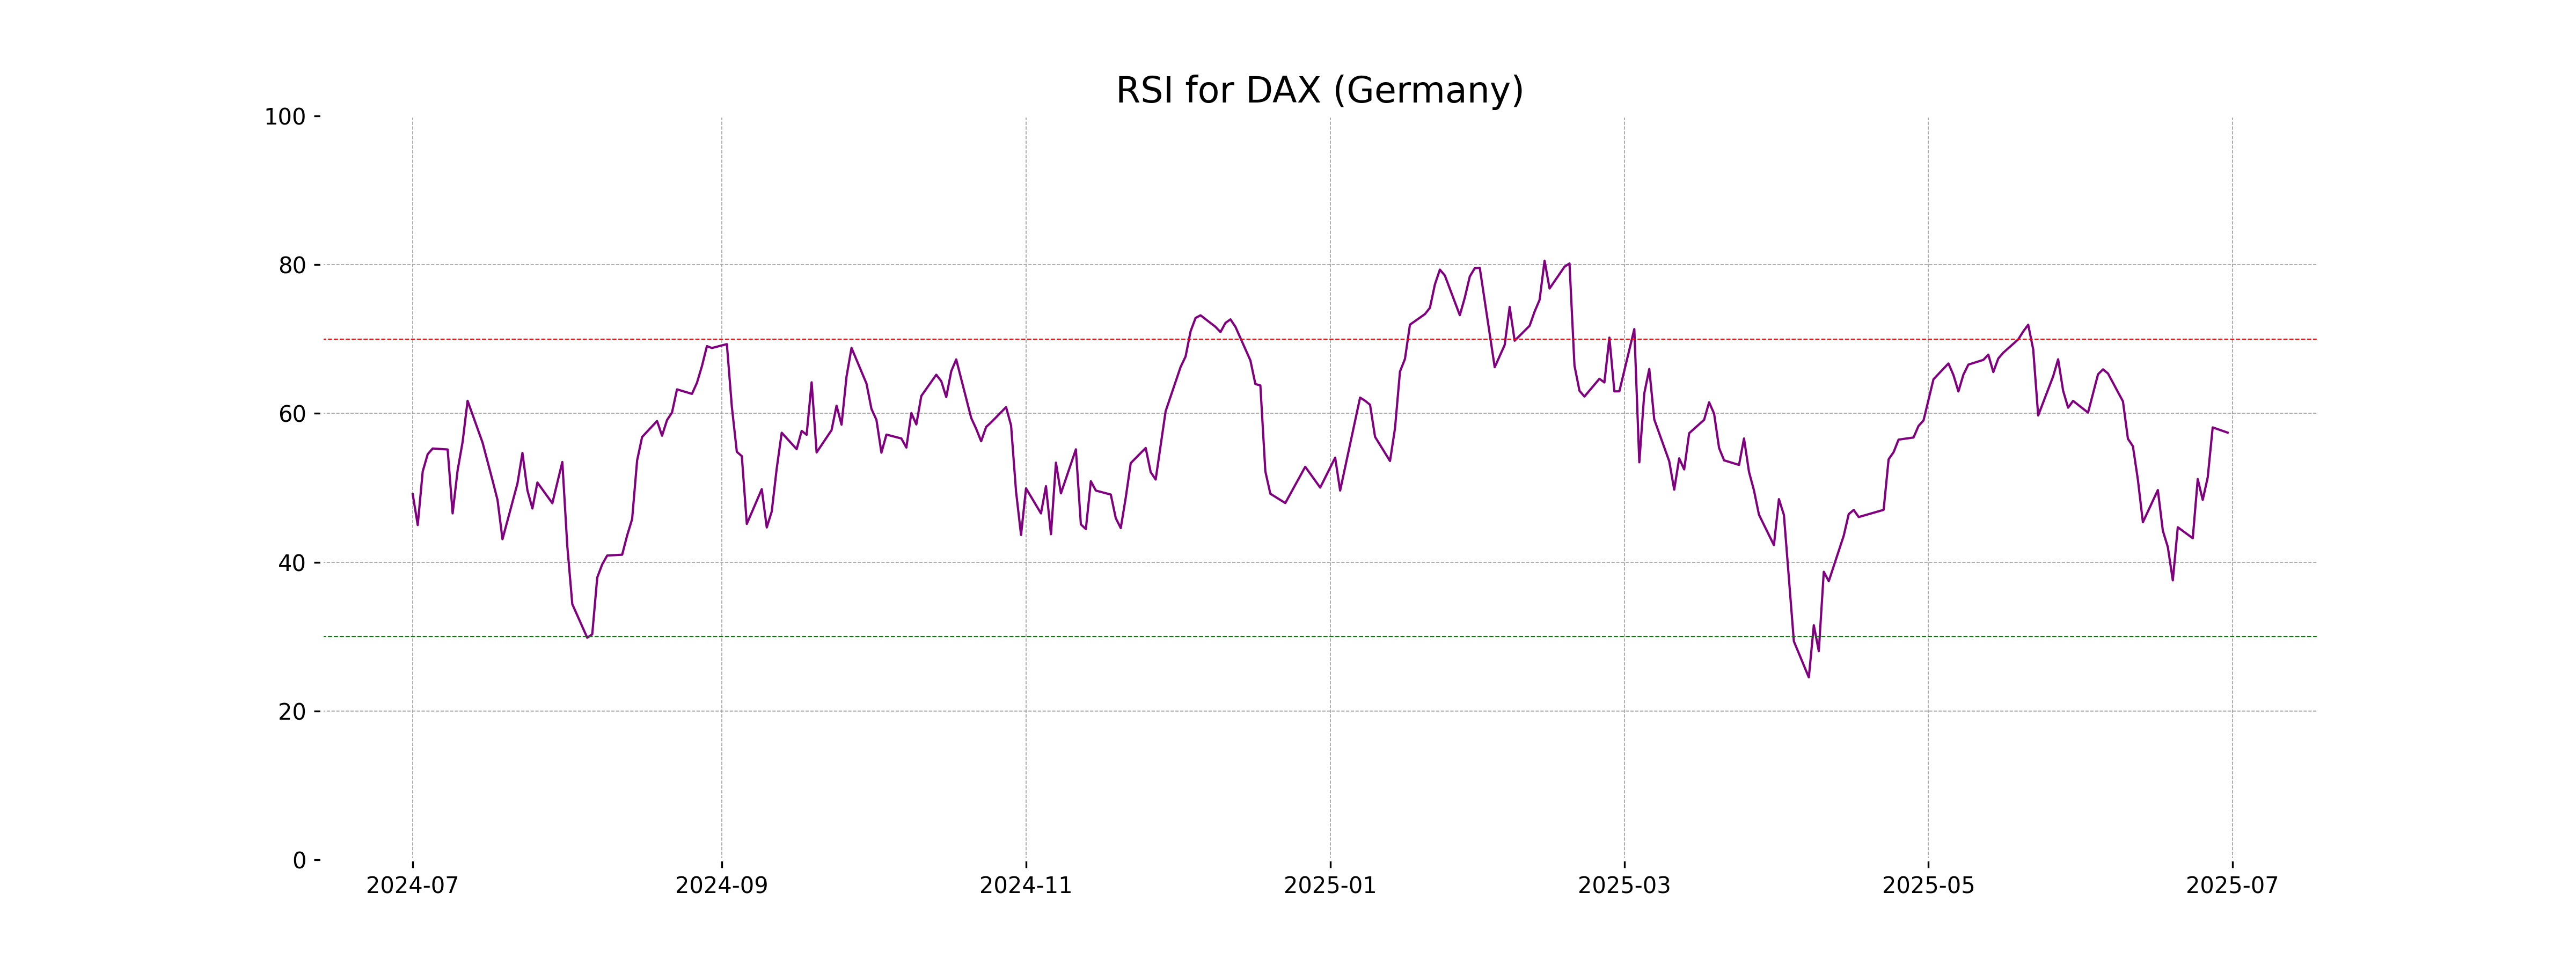
RSI Analysis
Based on the stock data for DAX (Germany), the Relative Strength Index (RSI) is 57.42. This indicates a neutral market condition, as RSI values between 30 and 70 typically suggest neither overbought nor oversold conditions. However, it is closer to being overbought, so continued monitoring is advisable if the RSI trends upwards.
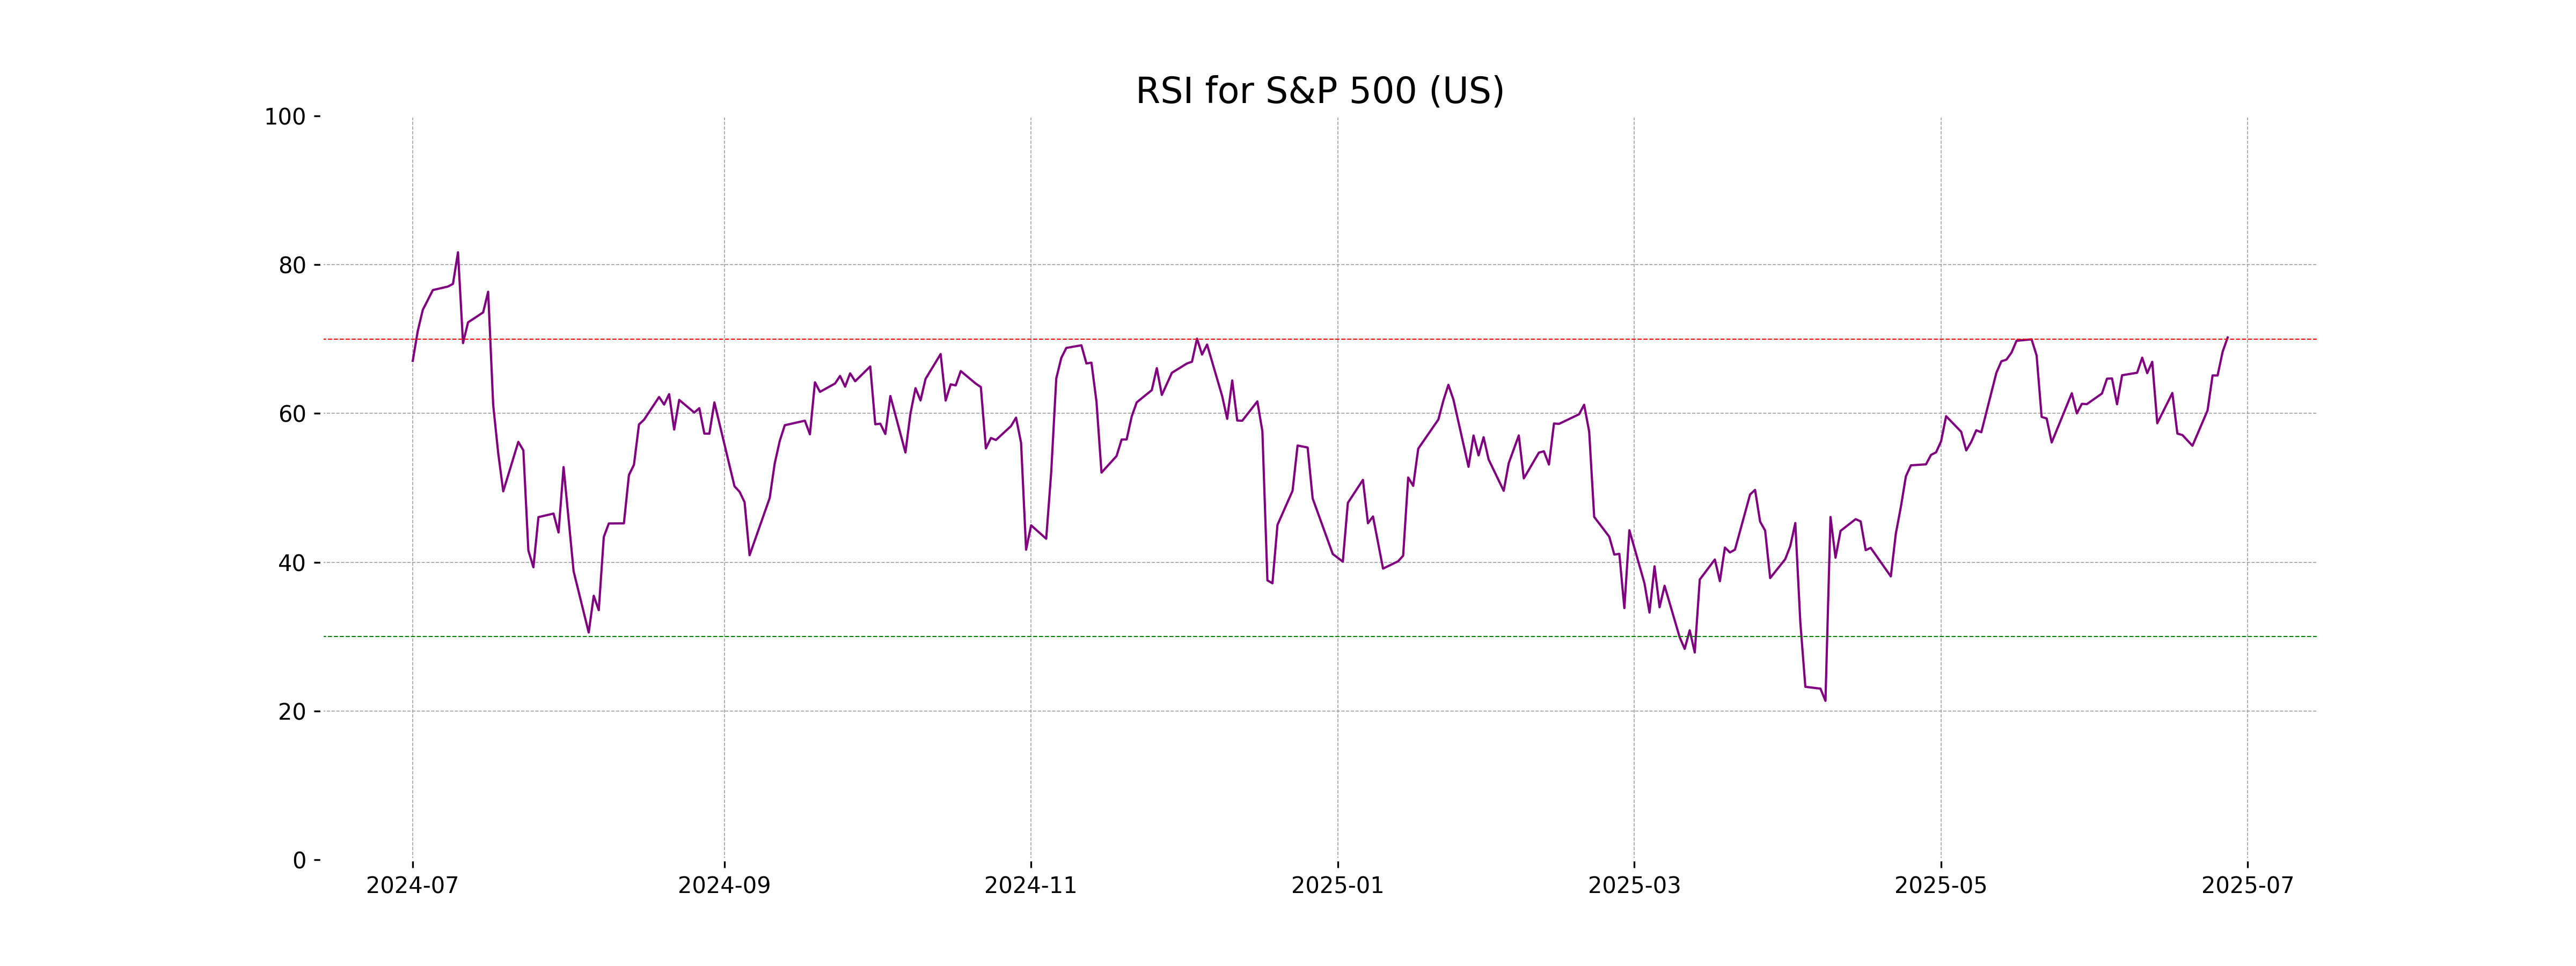
Analysis for S&P 500 (US) - June 30, 2025

The S&P 500 (US) opened at 6150.70 and closed at 6173.07, marking a percentage change of approximately 0.52% with a points change of 32.05. The RSI is at 70.21, suggesting the index is in overbought territory, while the MACD indicates a bullish trend with a value of 77.76 compared to the signal line at 72.73. The traded volume was notably high at 7.89 billion.
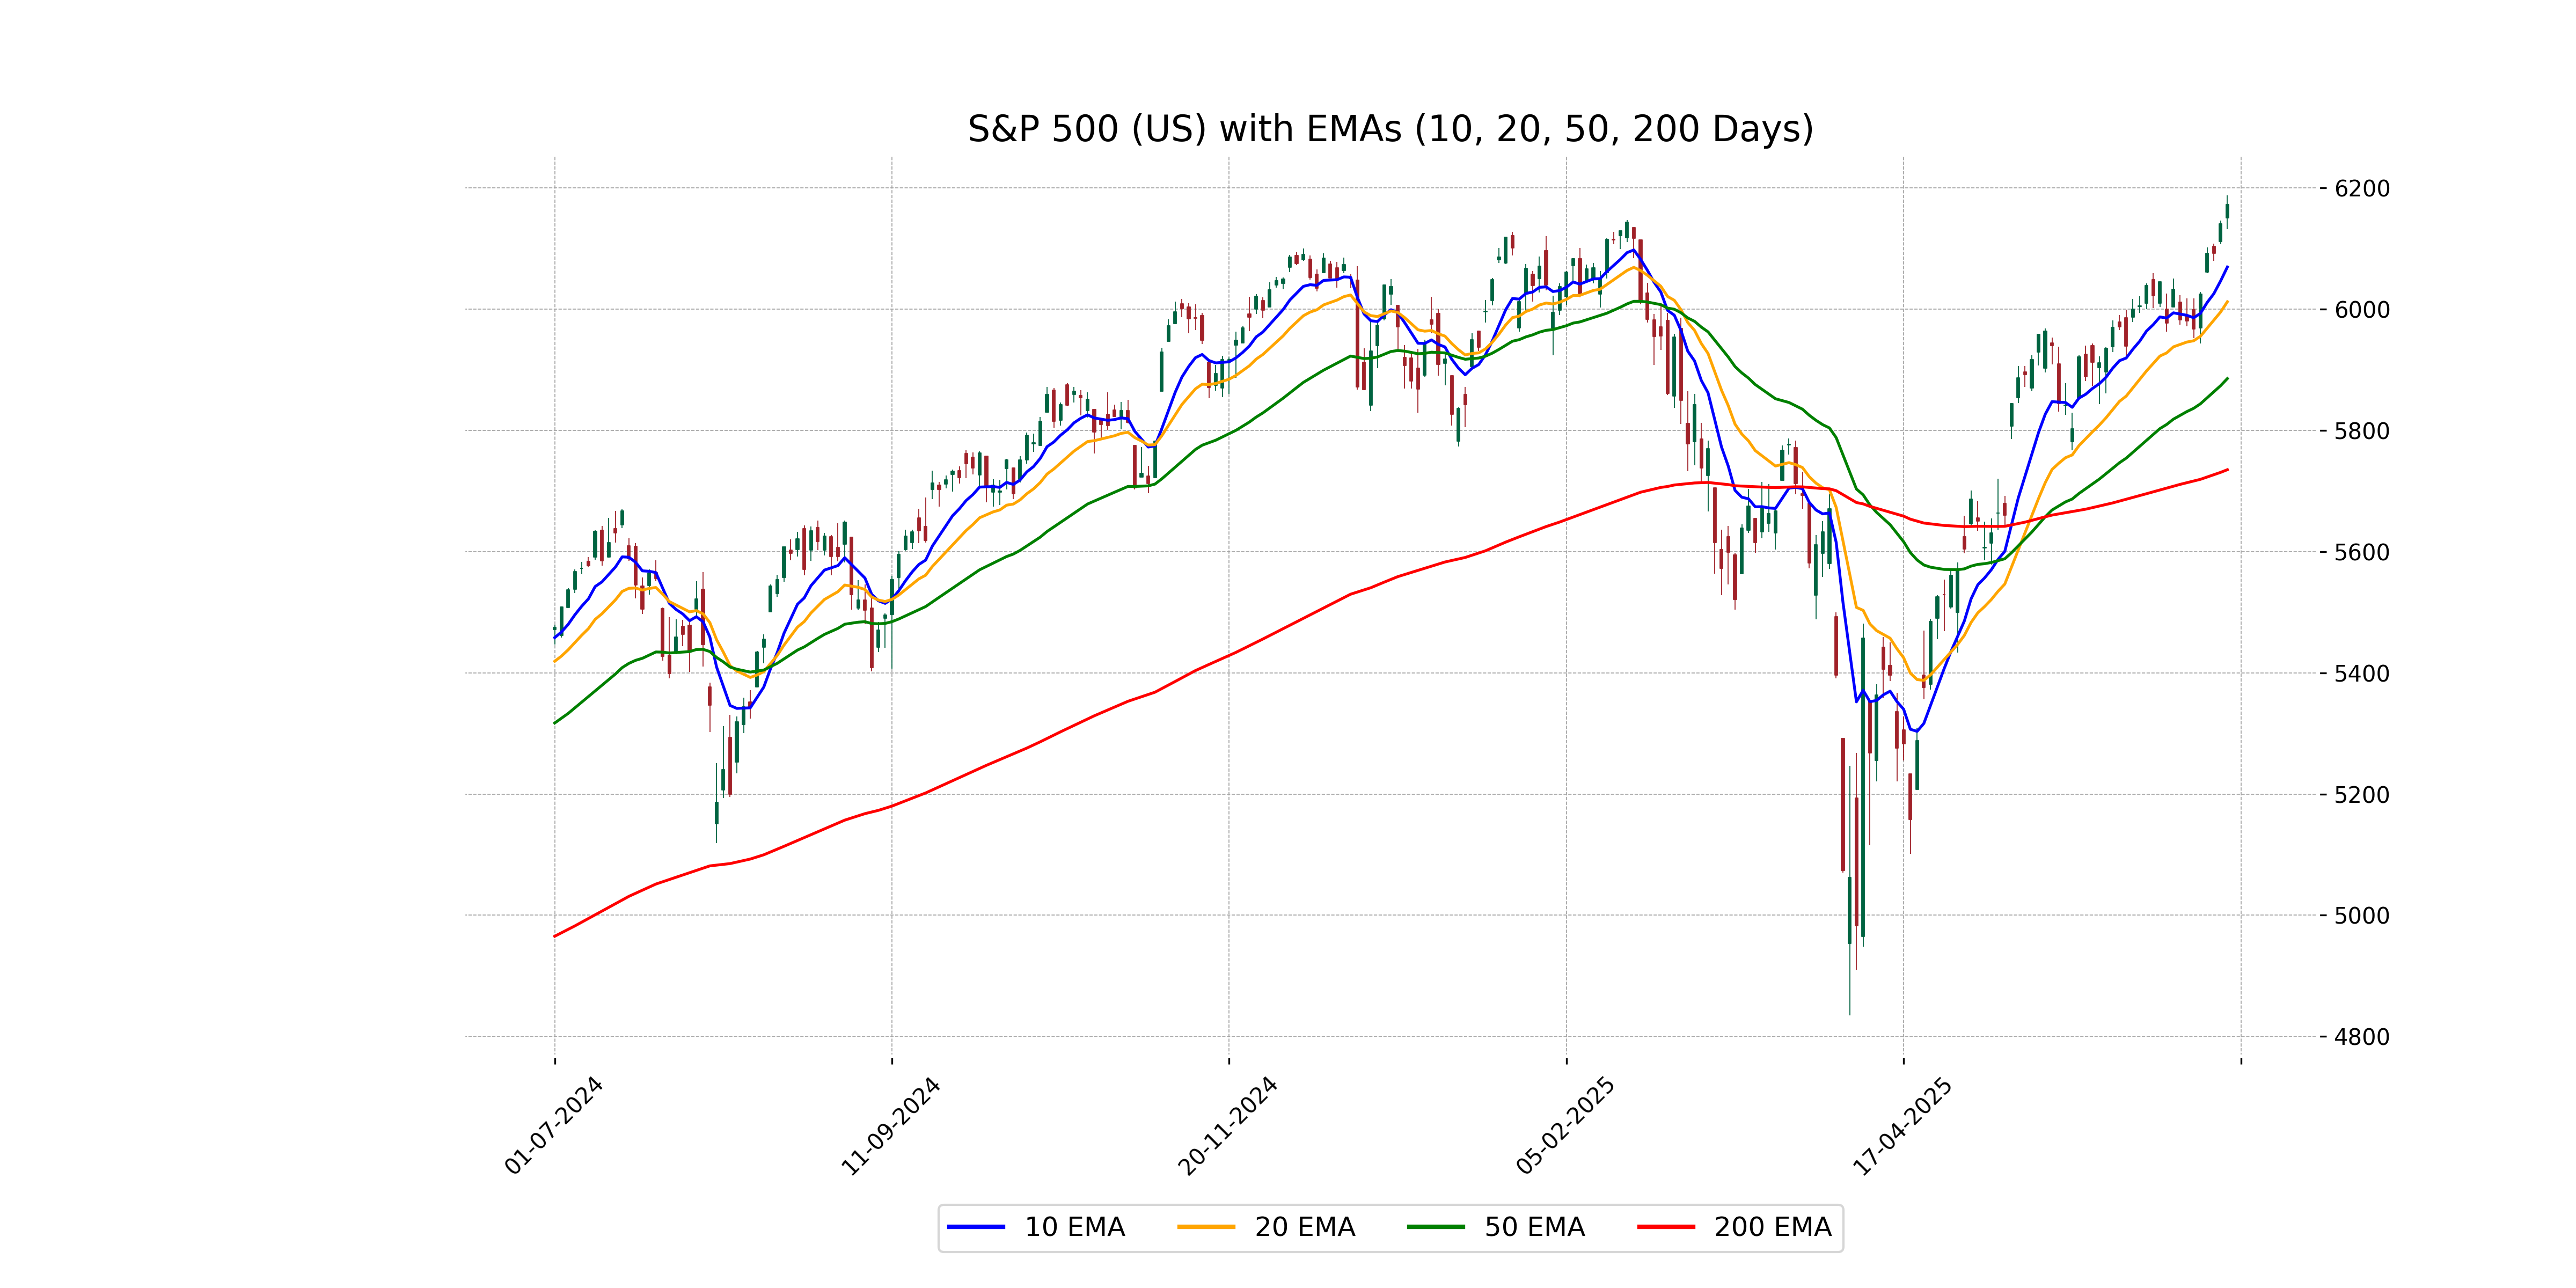
Relationship with Key Moving Averages
The S&P 500 (US) closed at 6173.07, which is above its 50-day EMA of 5885.66, 200-day EMA of 5735.25, 10-day EMA of 6069.76, and 20-day EMA of 6012.40, indicating a strong upward trend. The current RSI at 70.21 suggests the index is in overbought territory.
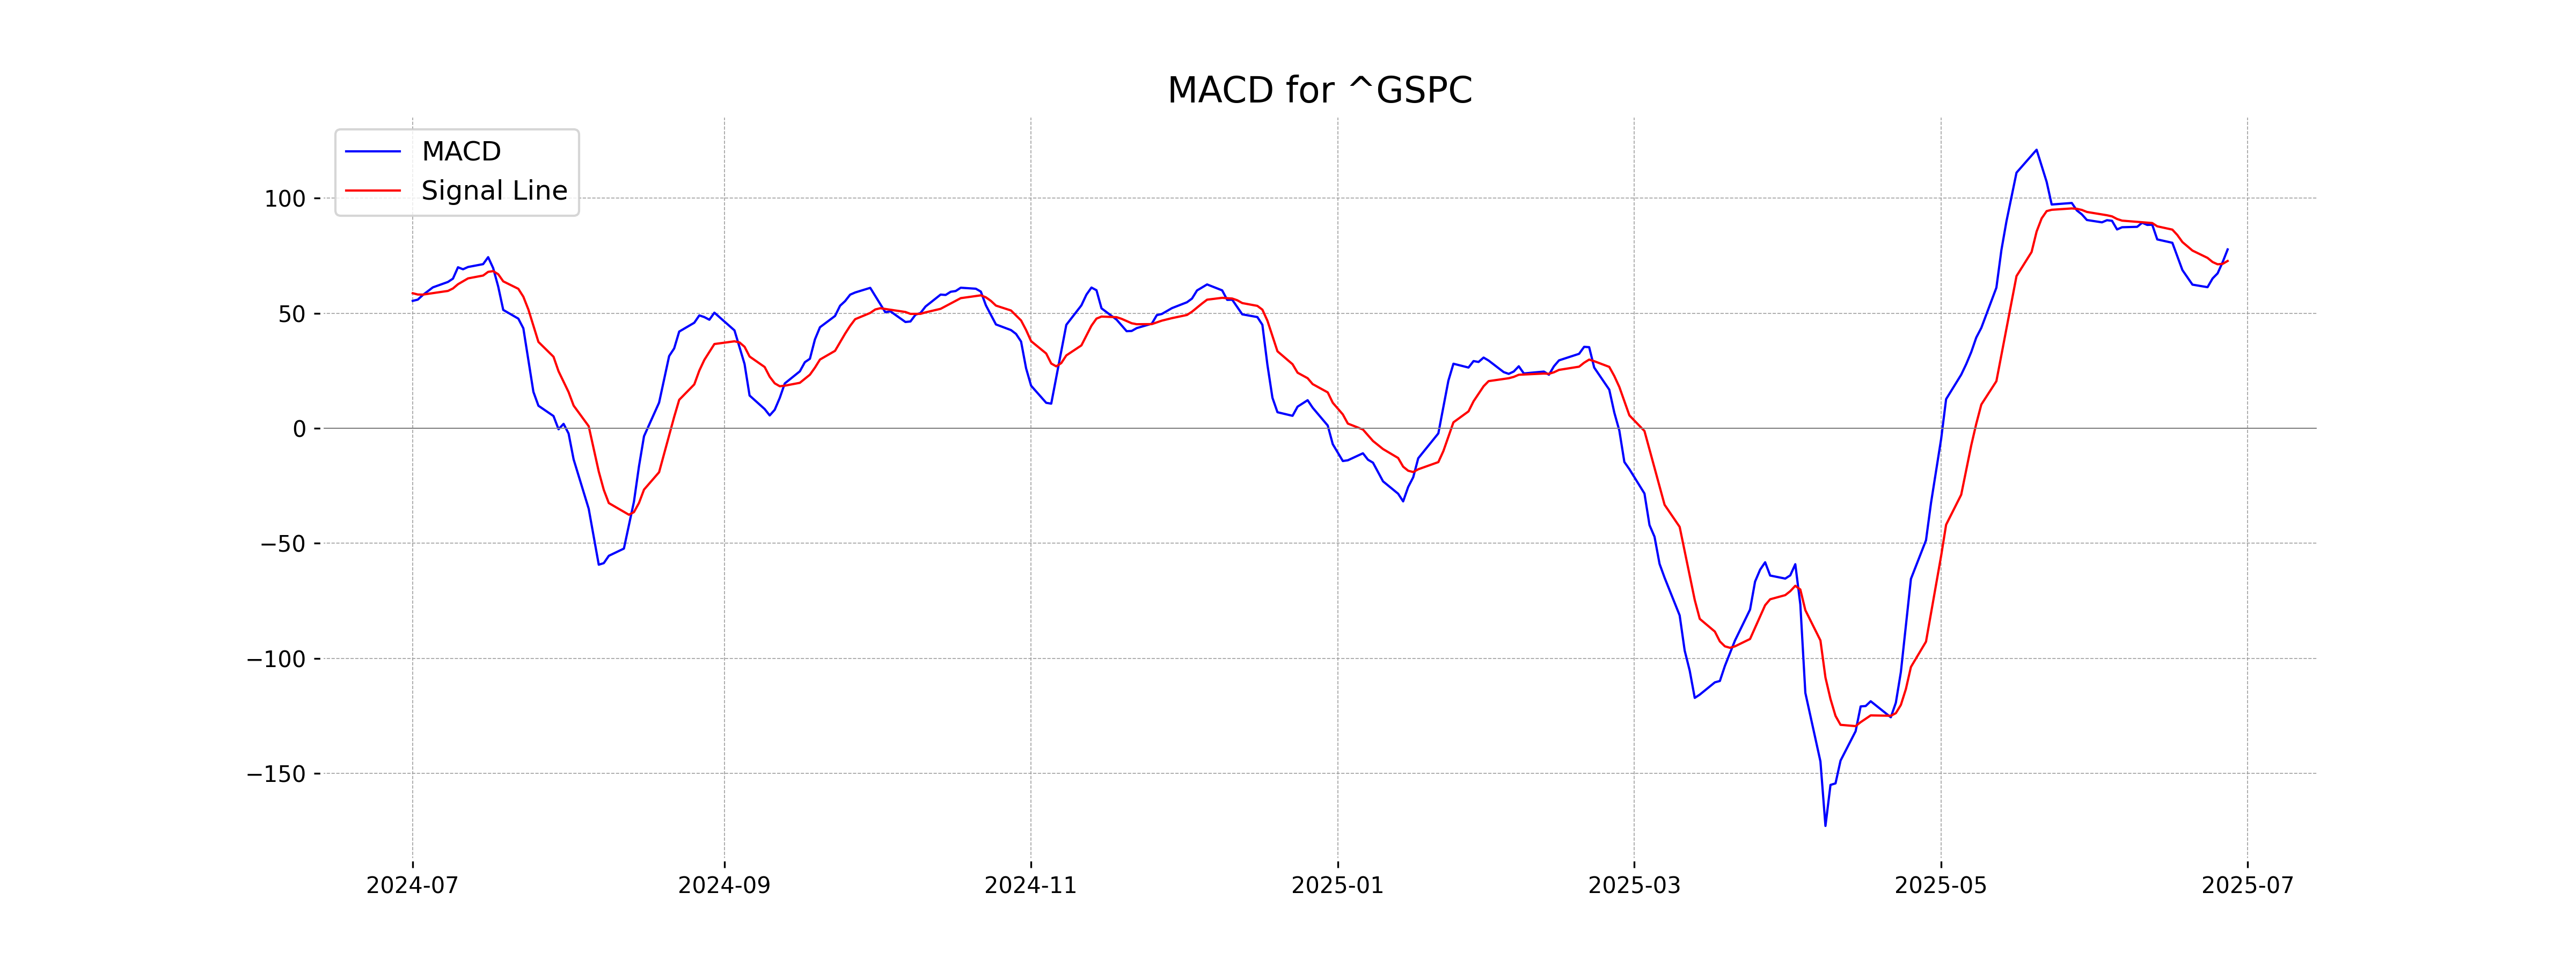
Moving Averages Trend (MACD)
Based on the given stock data for S&P 500 (US), the MACD is currently at 77.76, above the MACD Signal which is at 72.73. This indicates a bullish momentum in the market, suggesting that upward price movement could continue if this trend persists.
RSI Analysis
Based on the stock data for S&P 500 (US), the RSI value is 70.21. This indicates that the index is in the overbought territory, suggesting a potential for a price pullback or consolidation.
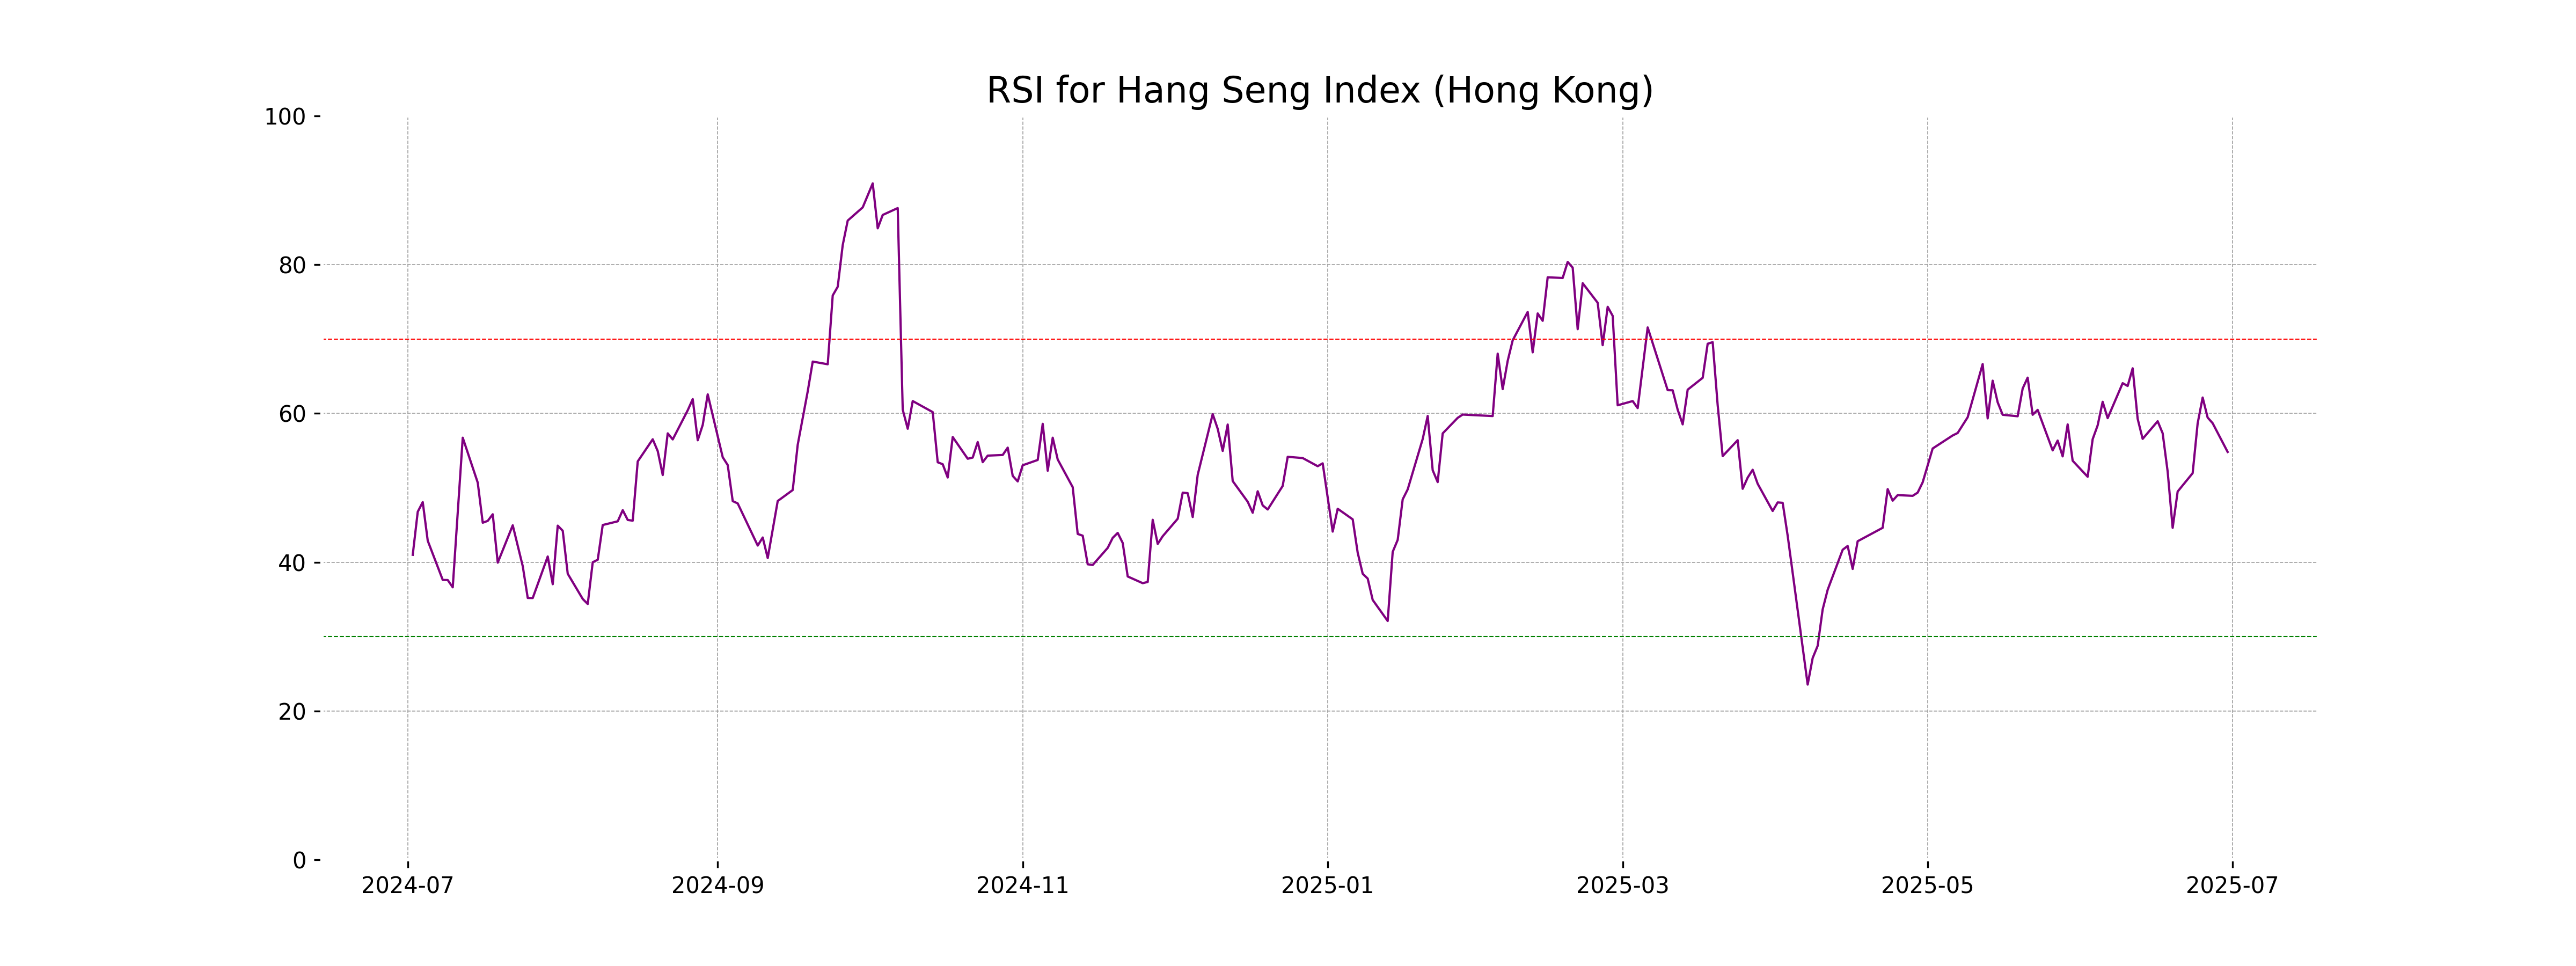
Analysis for Hang Seng Index (Hong Kong) - June 30, 2025
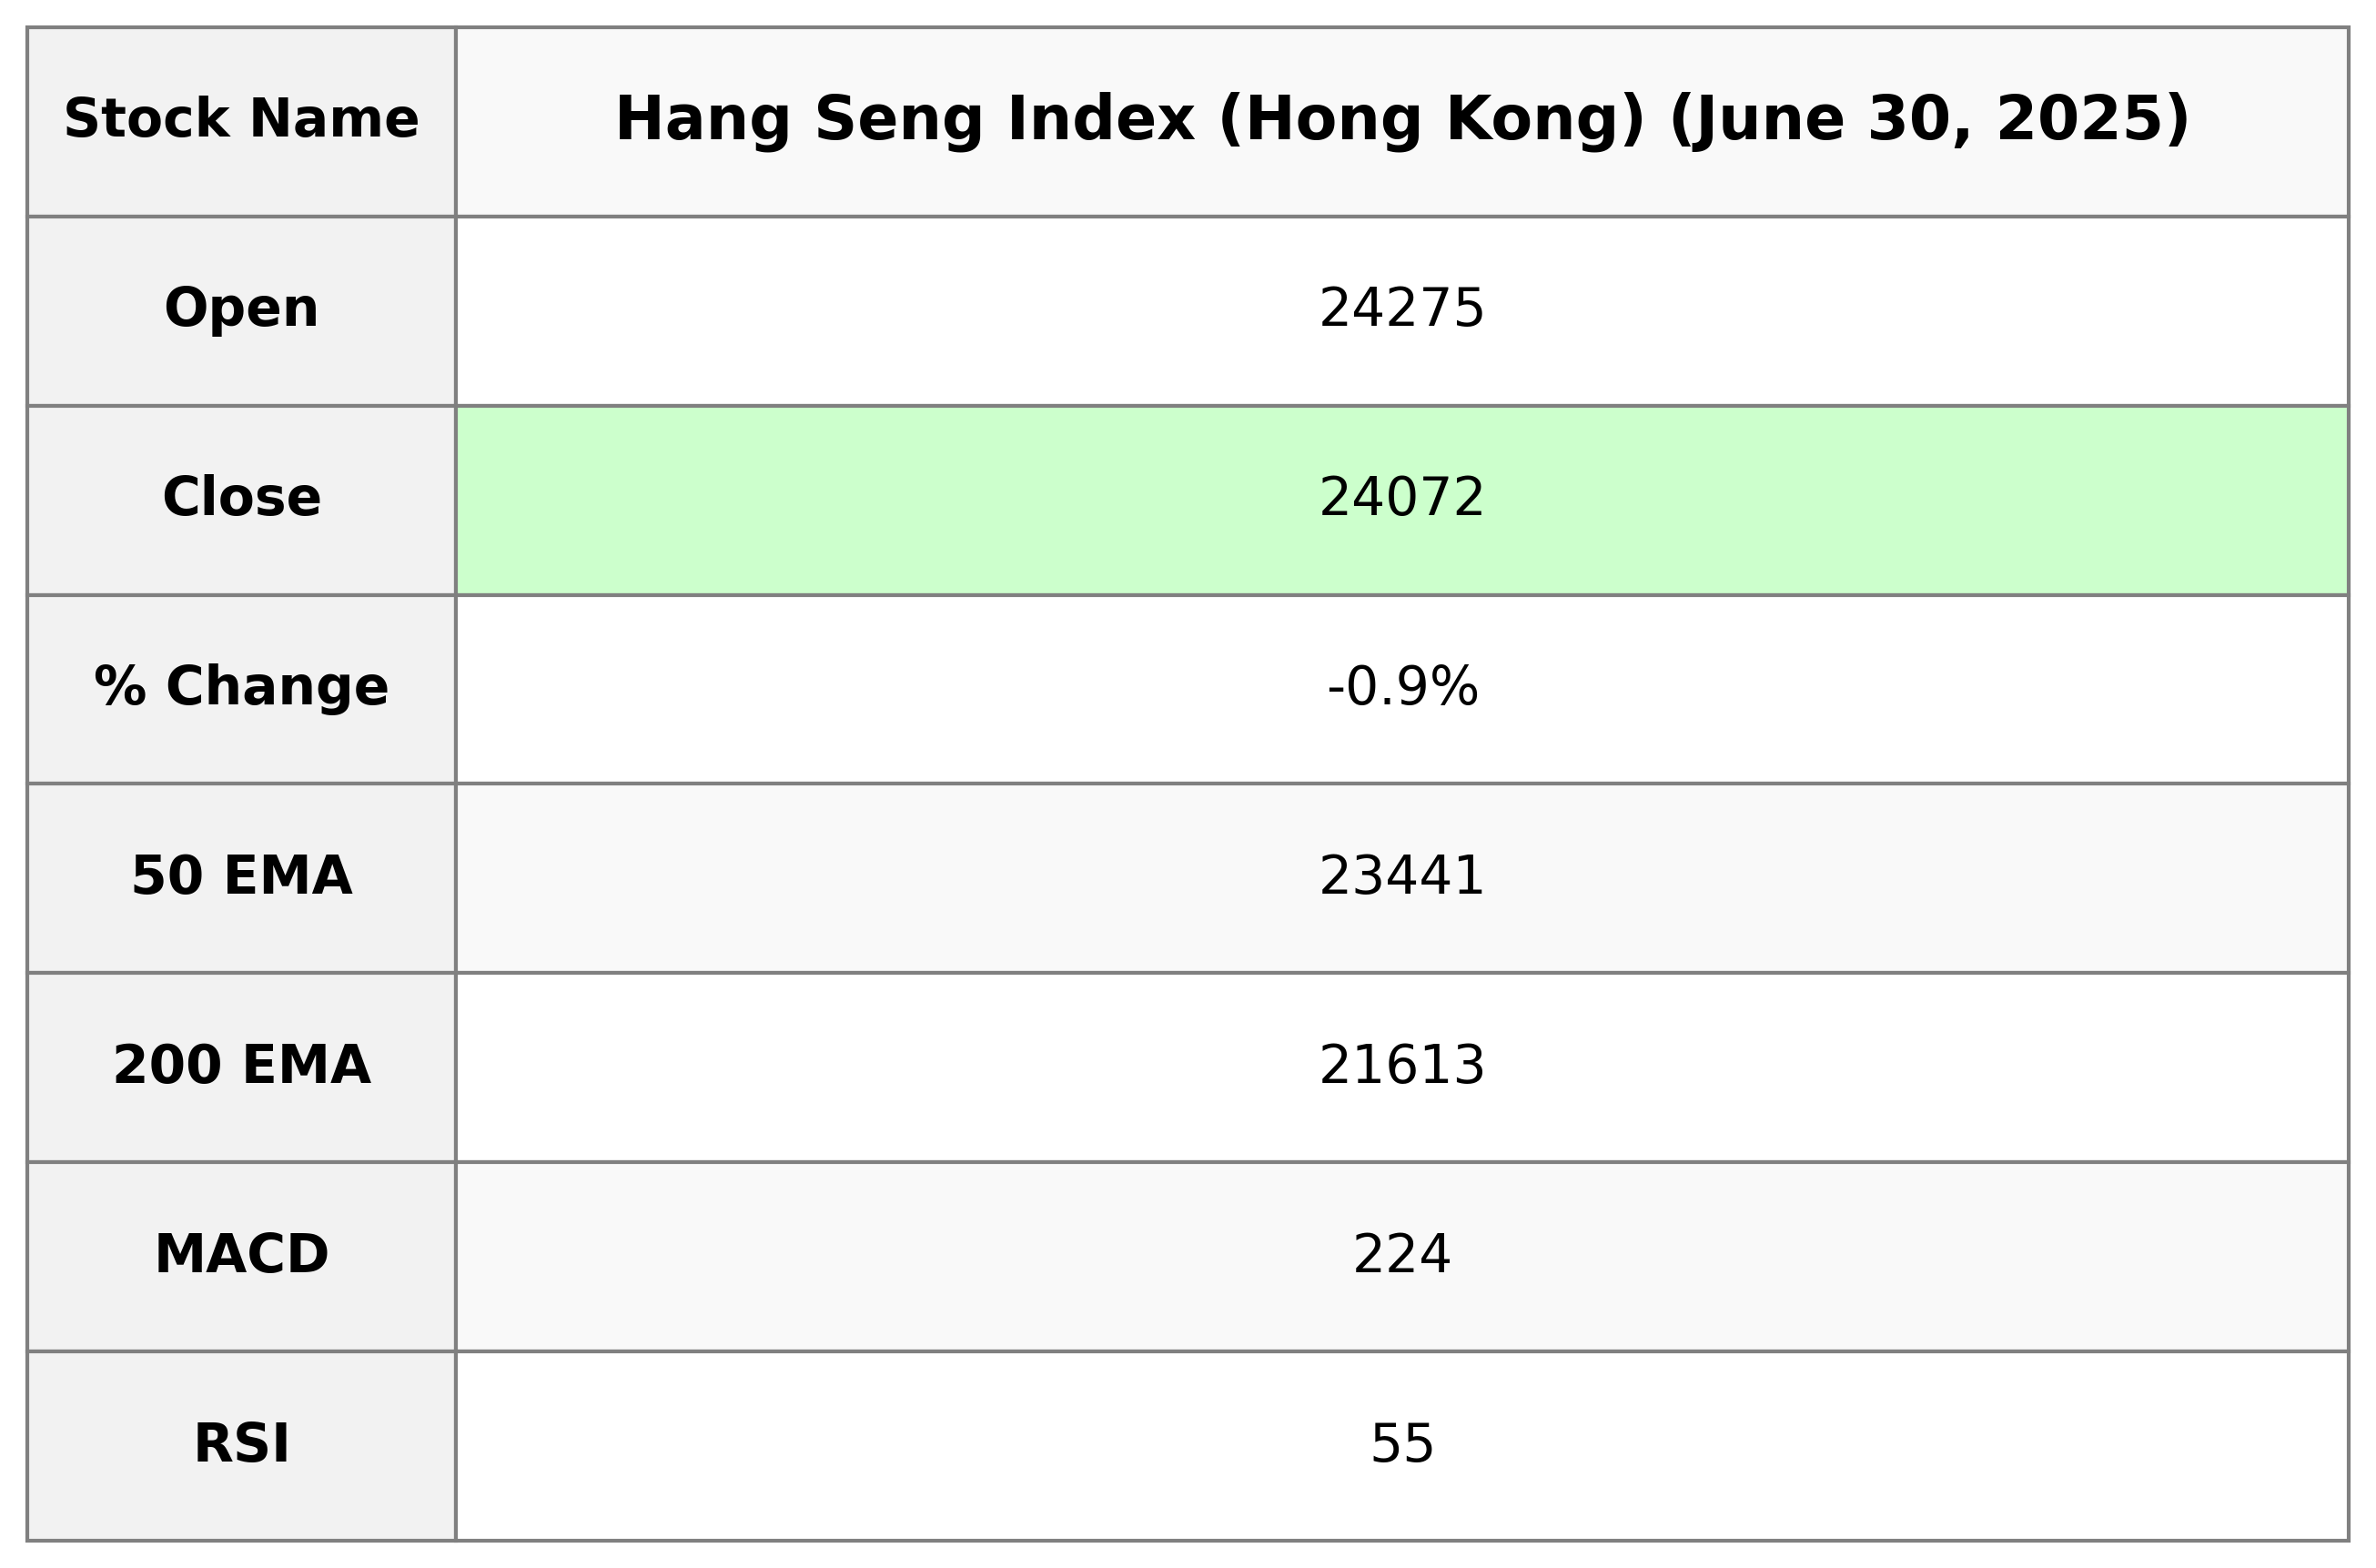
The Hang Seng Index (Hong Kong) opened at 24,275 and closed at 24,072, reflecting a decrease of 211.87 points or -0.87% from the previous close of 24,284. The RSI value of 54.82 indicates a neutral market sentiment, while the MACD suggests a slight bullish trend with a value of 224.02 slightly above the MACD Signal of 223.46. The index's 50 EMA and 200 EMA values are 23,441 and 21,613, respectively, denoting longer-term bullish momentum.
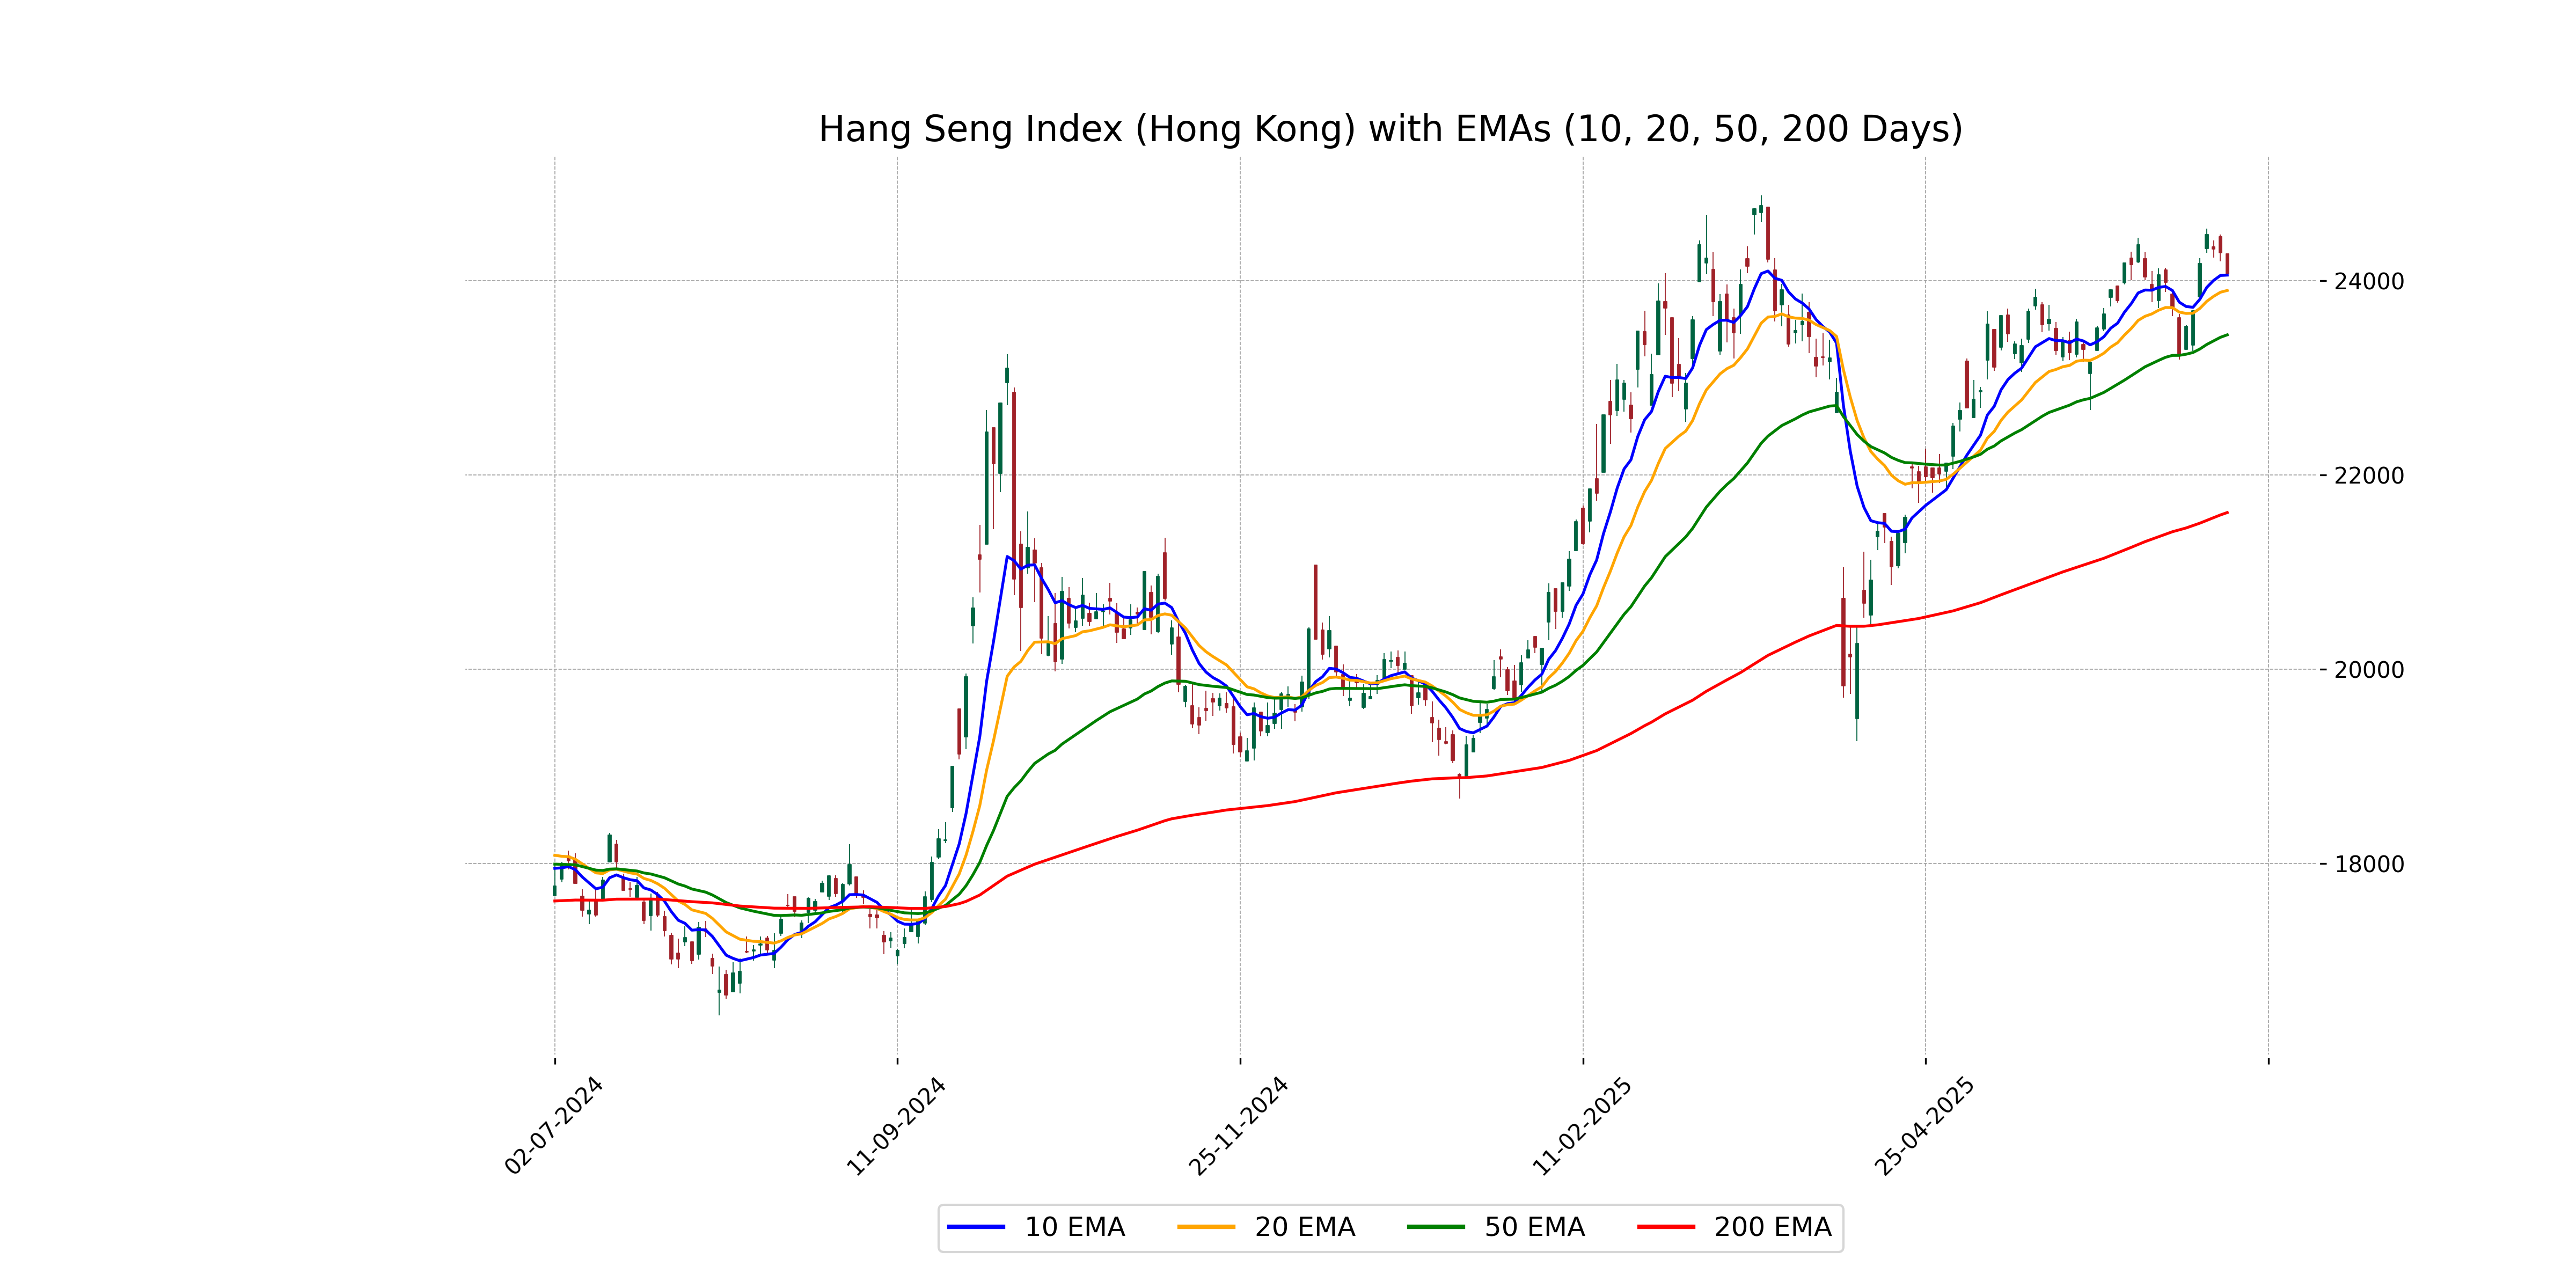
Relationship with Key Moving Averages
The Hang Seng Index is currently trading close to its 10-day EMA at 24,072.28, suggesting short-term momentum is slightly above this moving average. It is considerably above the 50-day EMA (23,441.42) and well above the 200-day EMA (21,612.86), indicating a longer-term upward trend. The RSI of 54.82 suggests the index is in a neutral position regarding overbought or oversold conditions.
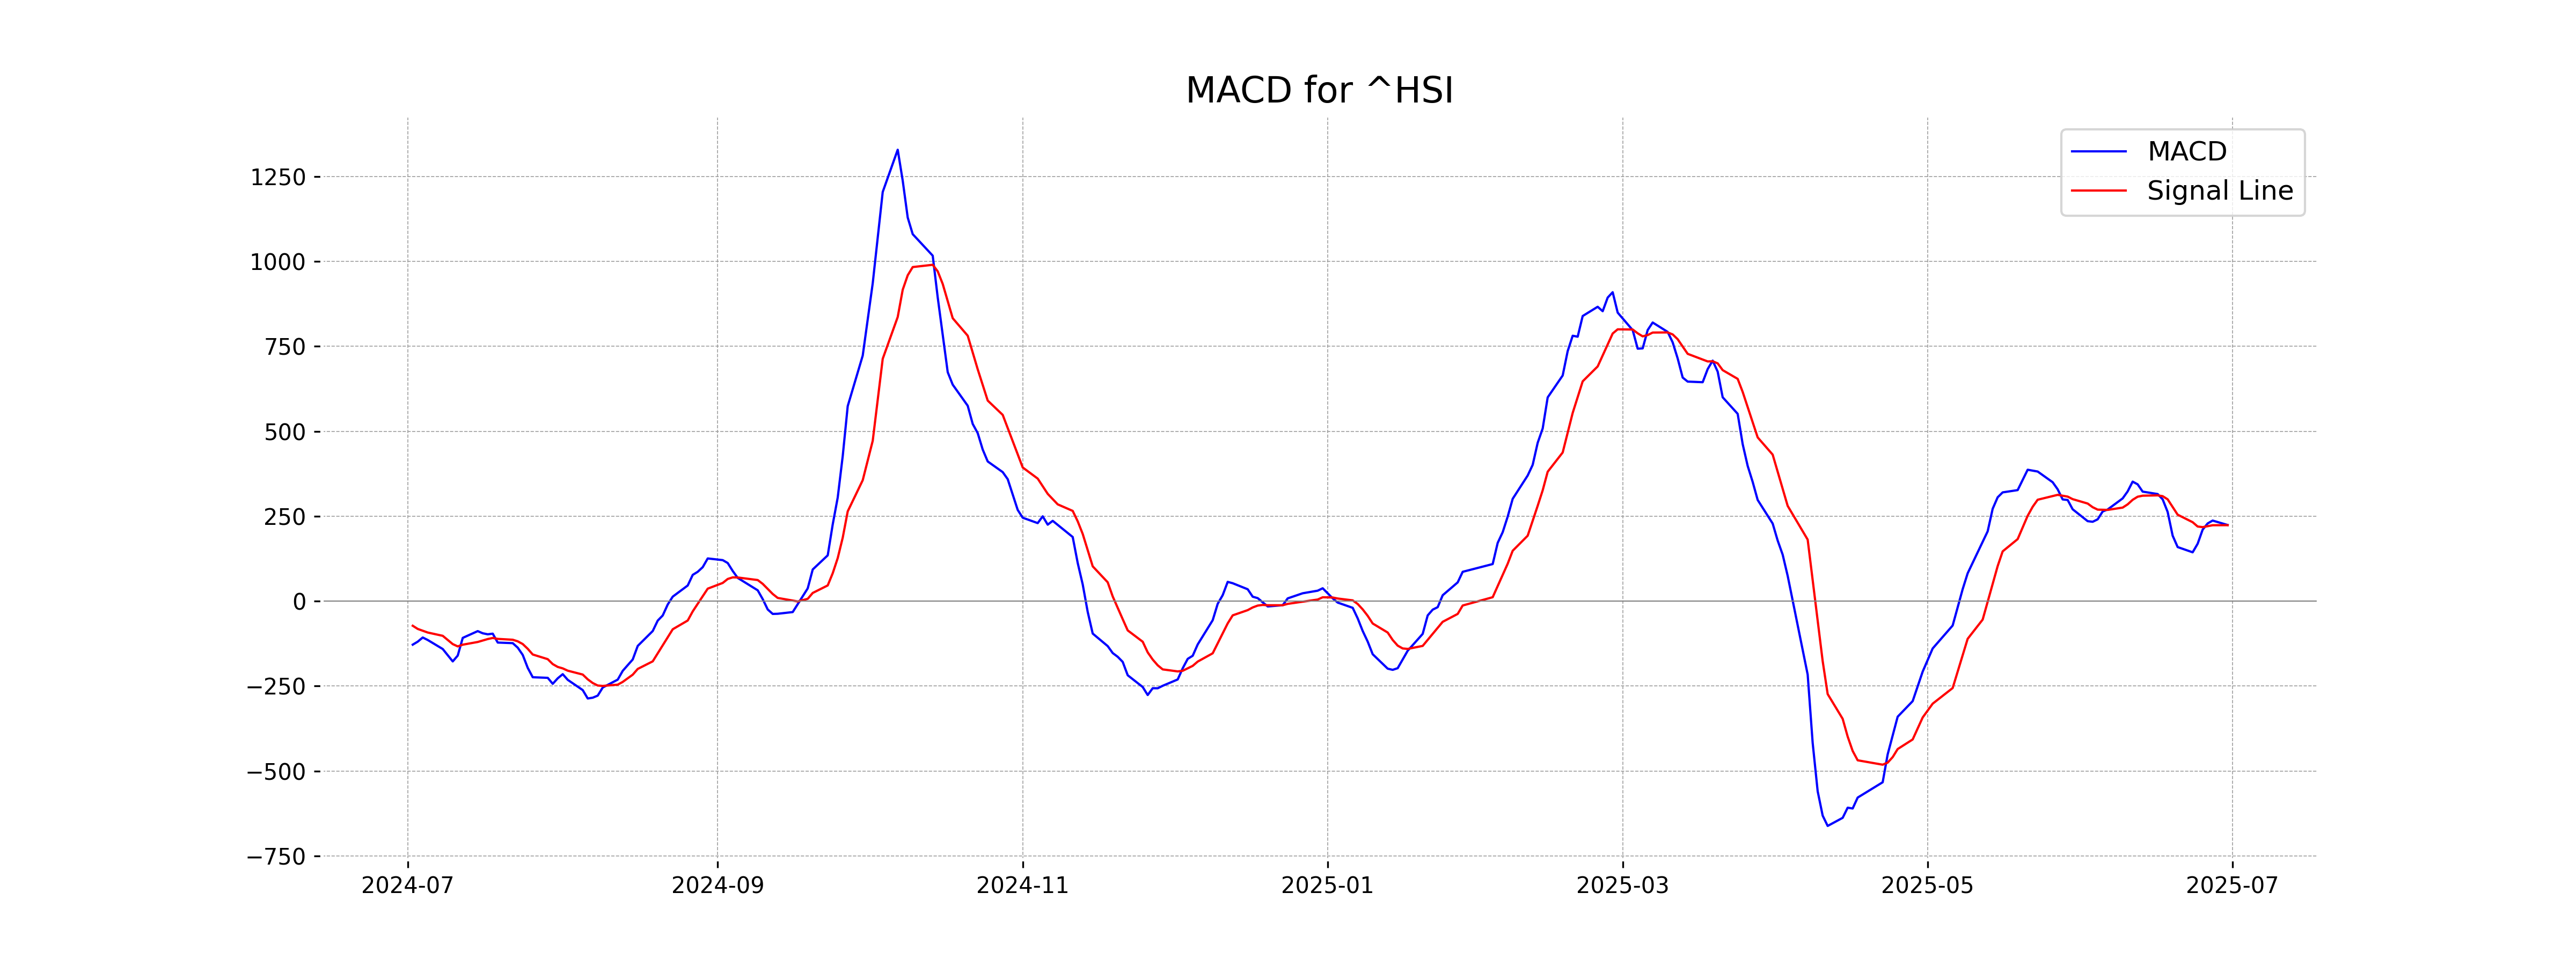
Moving Averages Trend (MACD)
Hang Seng Index (Hong Kong) MACD Analysis: The MACD value is 224.02 with the signal line at 223.46, indicating a slightly bullish sentiment as the MACD is above the signal line. This could suggest potential upward momentum, but further confirmation from other indicators would be beneficial.
RSI Analysis
RSI Analysis for Hang Seng Index (Hong Kong): The RSI of the Hang Seng Index is 54.82, indicating a relatively neutral position. This suggests that the index is neither overbought nor oversold, reflecting a balance in buying and selling pressures at this time.
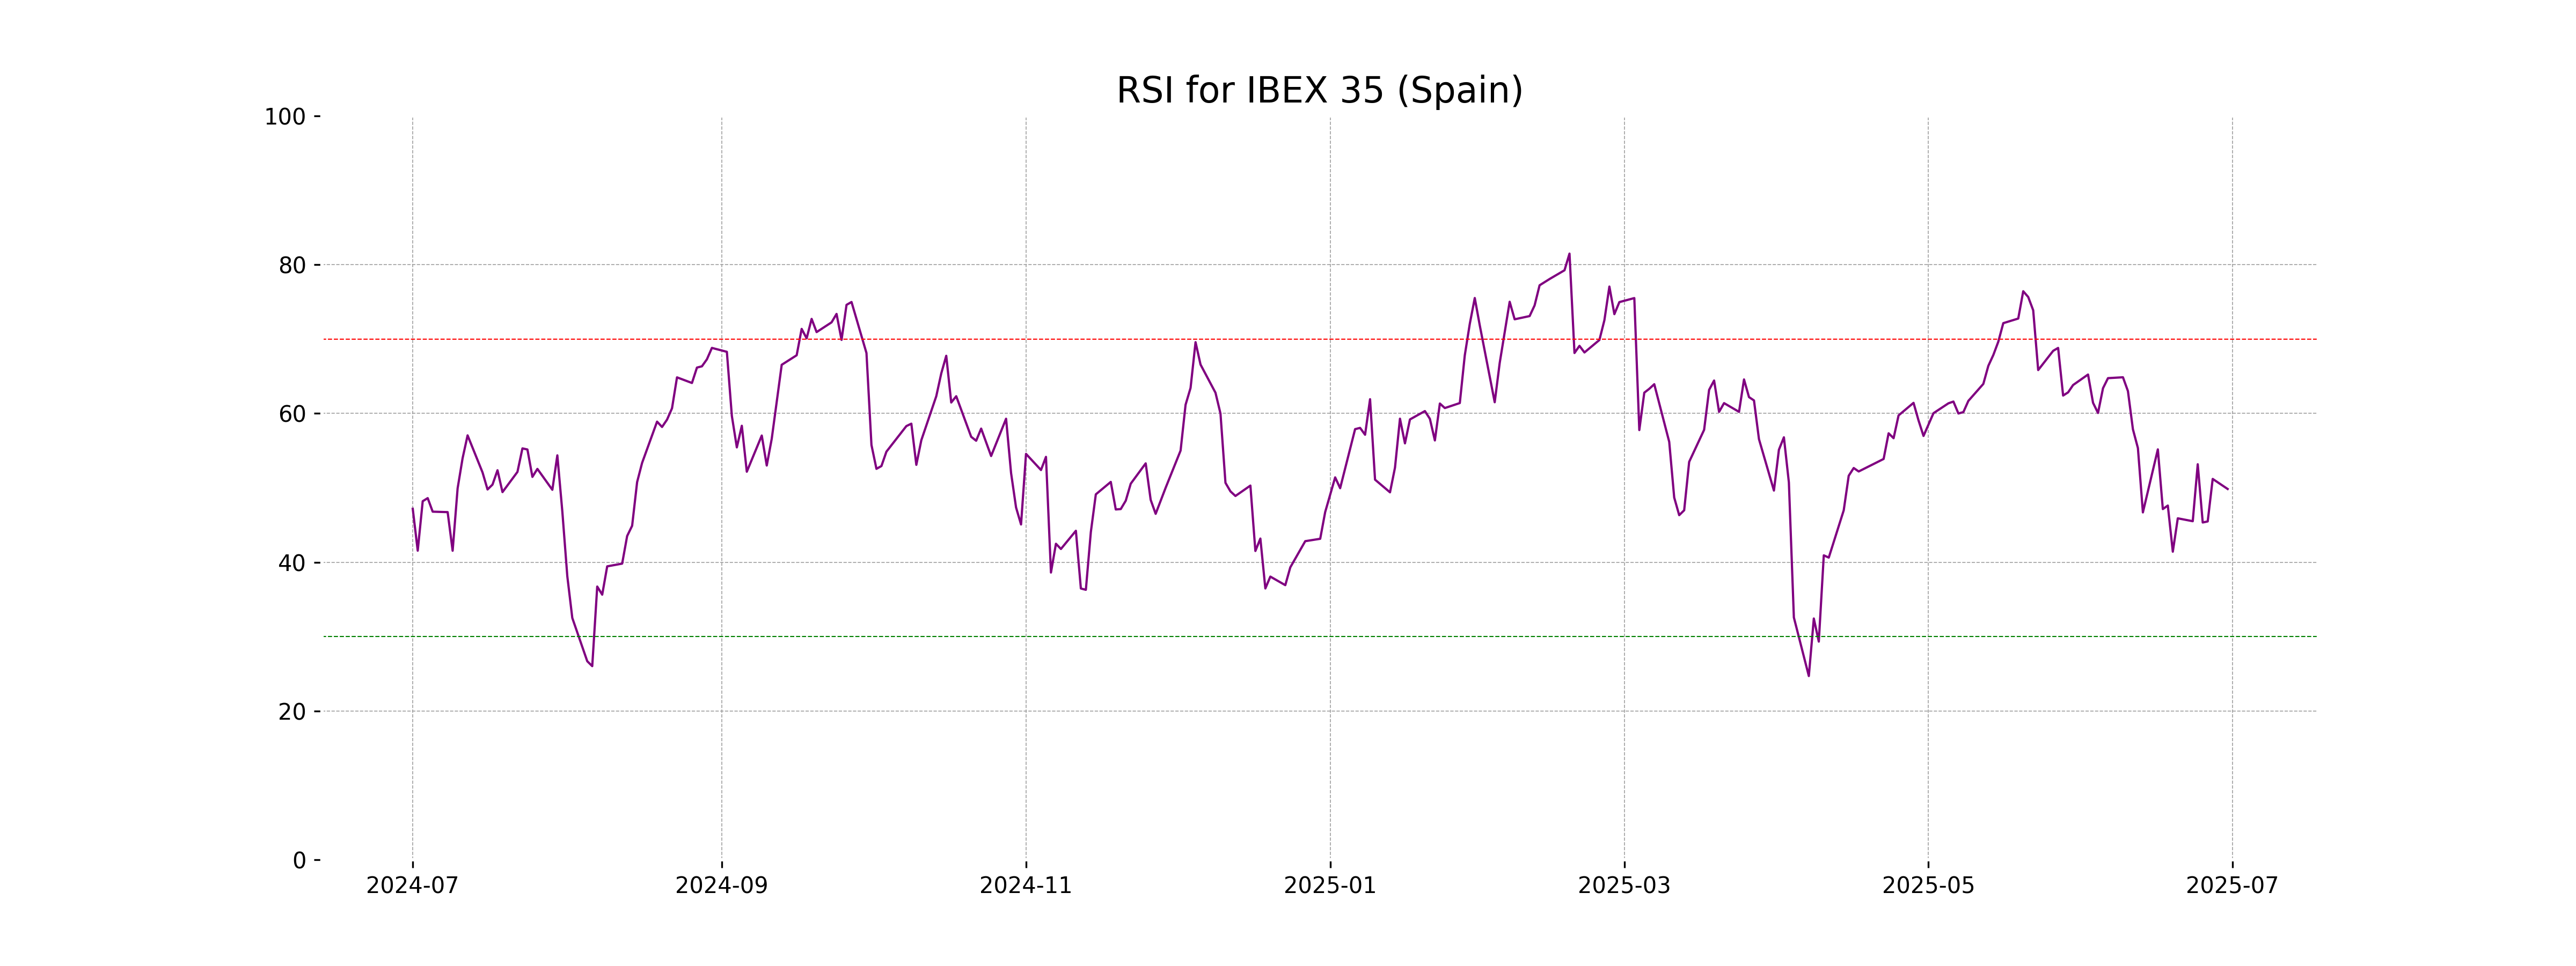
Analysis for IBEX 35 (Spain) - June 30, 2025
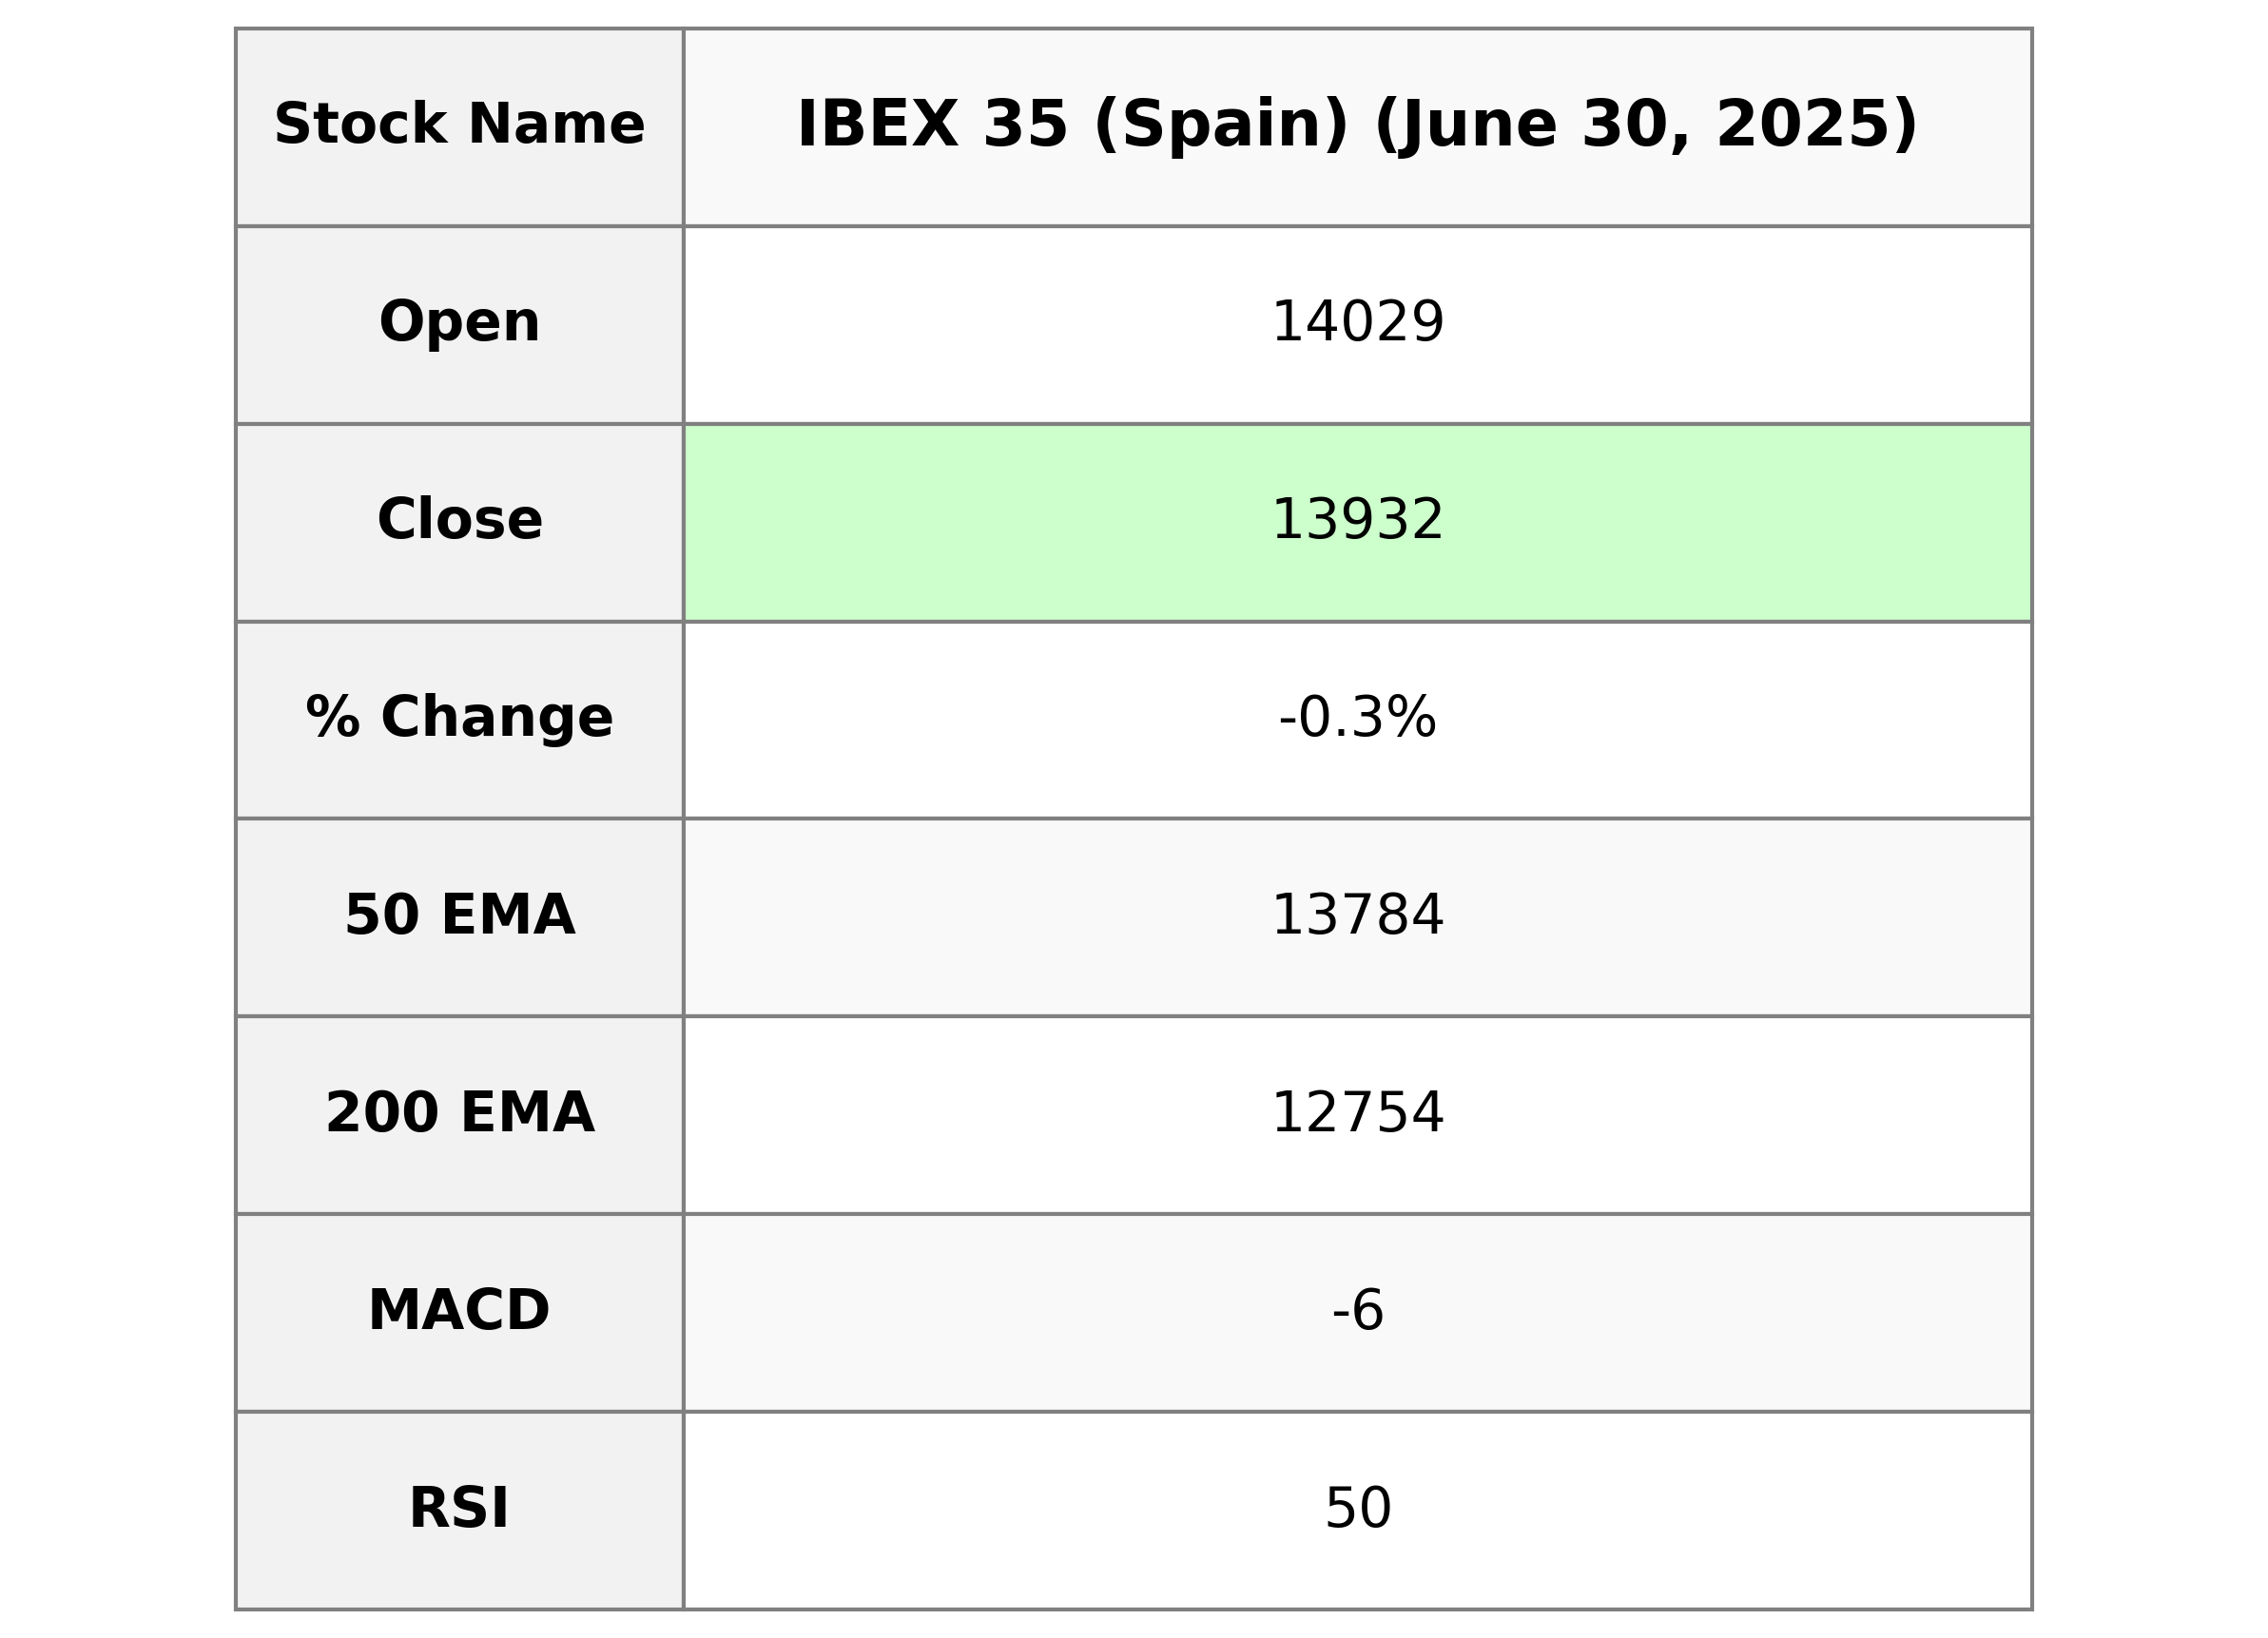
IBEX 35 (Spain) saw a slight decline with the closing price at 13,932.10, down by 0.26% from the previous close of 13,969. The index had a trading volume of 25,034,655 and is currently showing an RSI of 49.84, indicating a relatively neutral momentum. The MACD is at -5.88, suggesting a bearish trend when compared to the MACD Signal of 23.78.
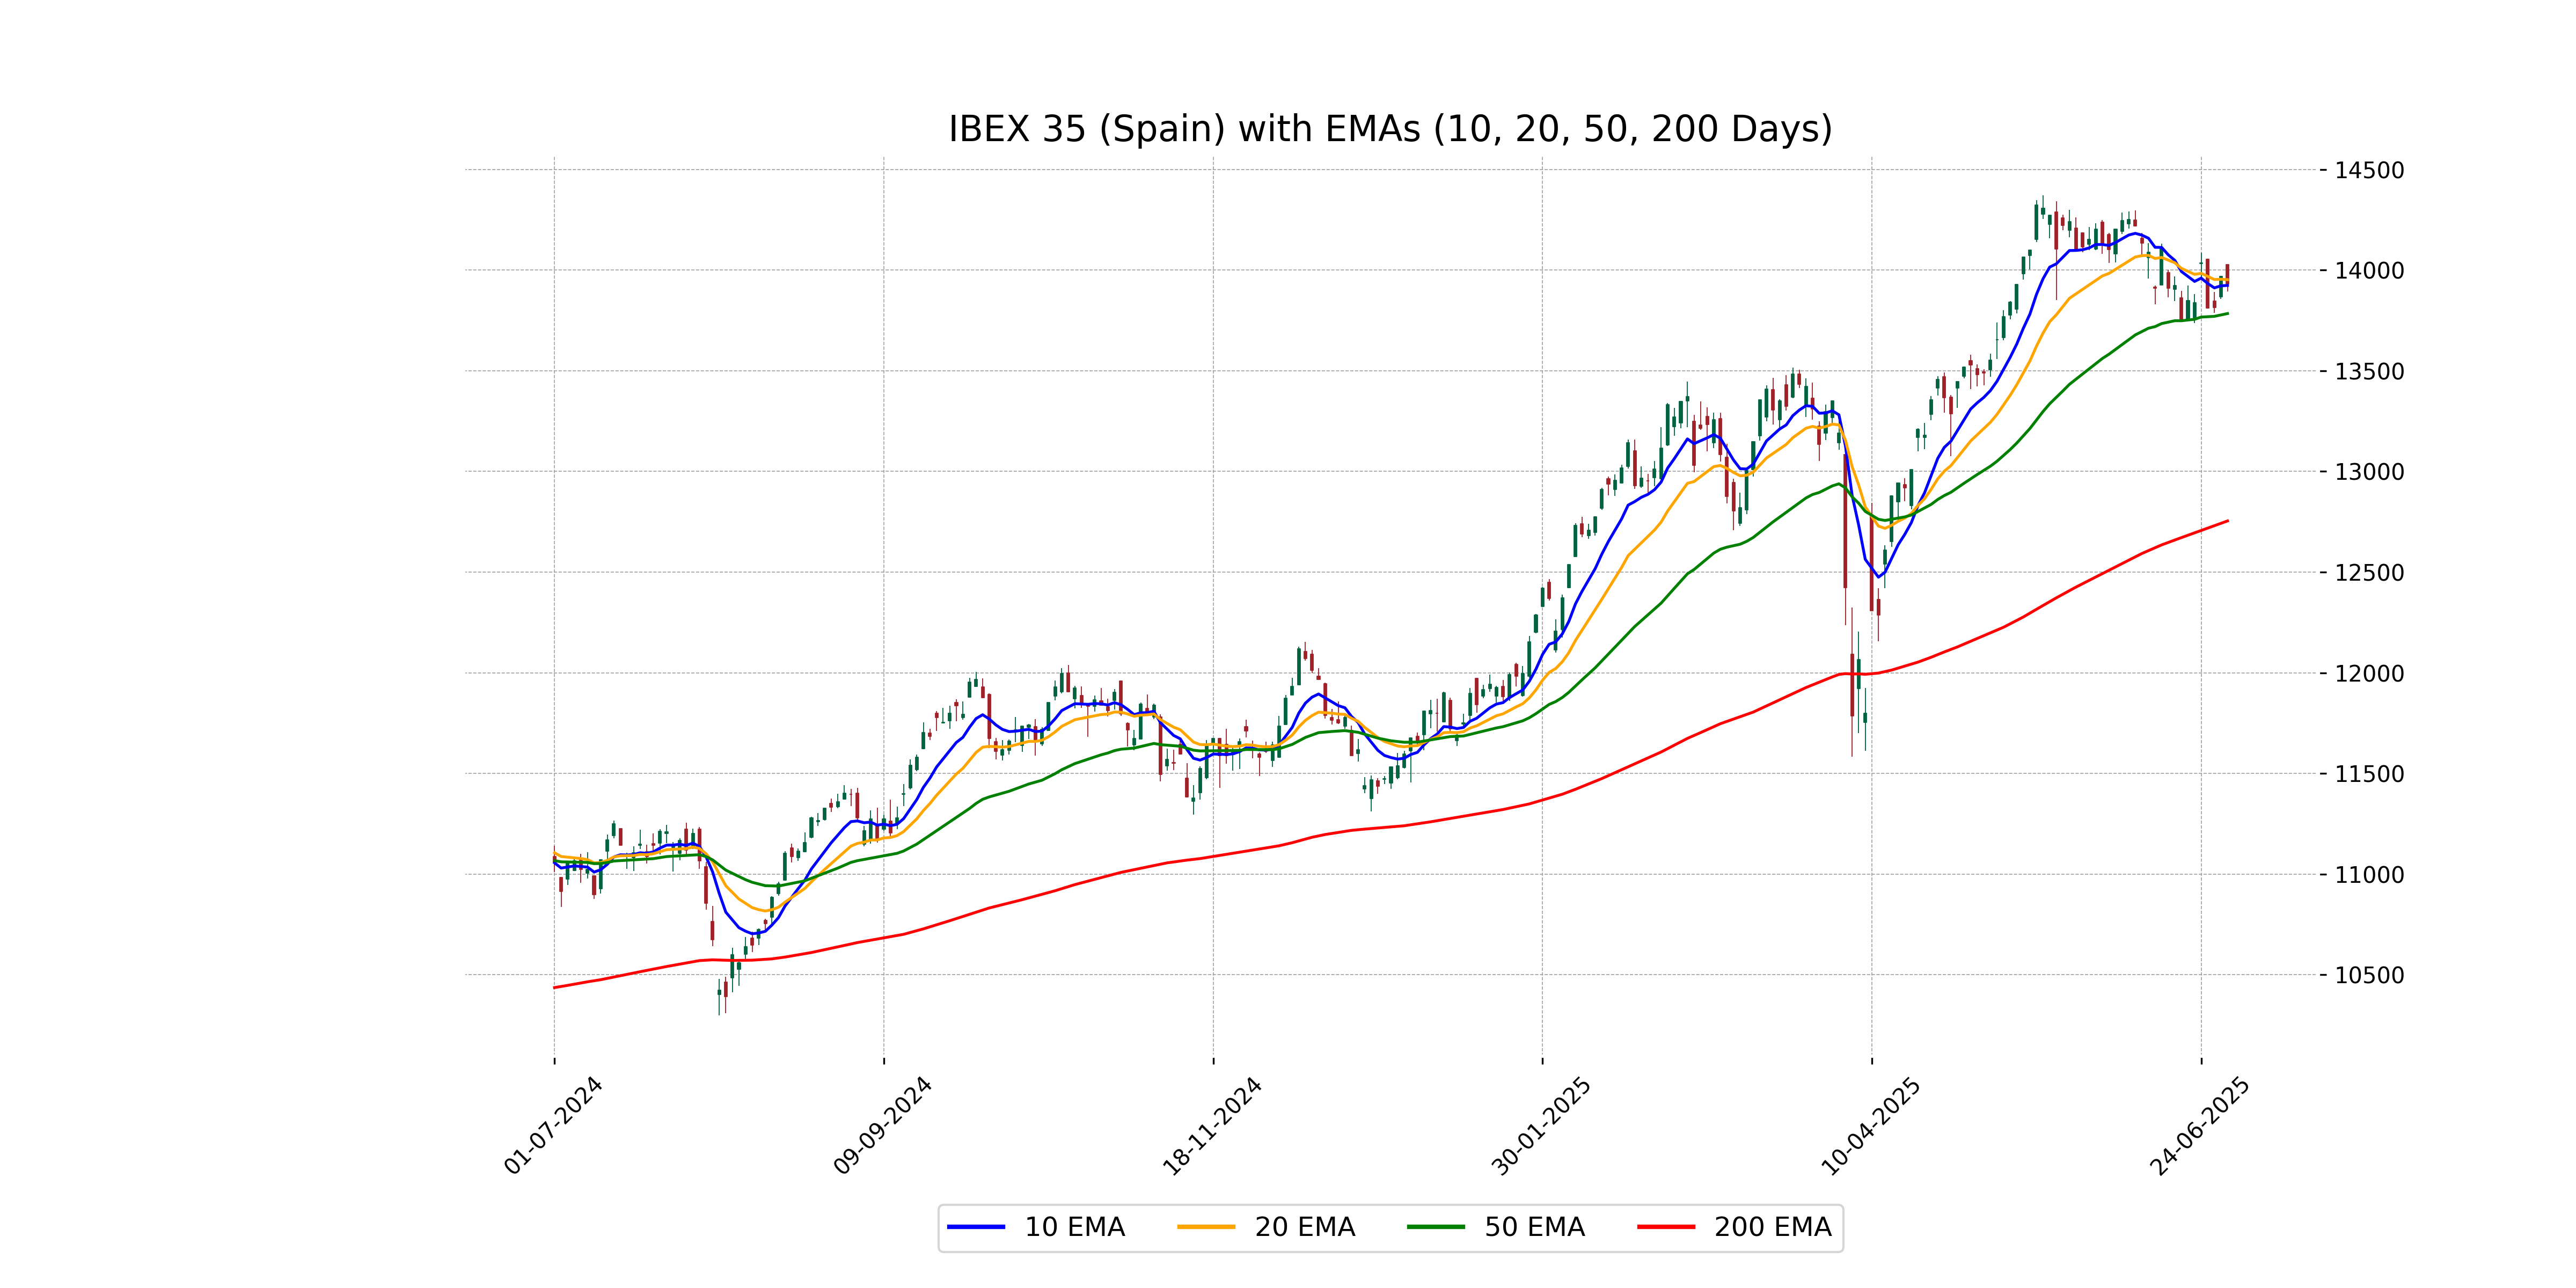
Relationship with Key Moving Averages
The IBEX 35 closed at 13,932.10, which is above its 50-day EMA of 13,784.45 but below its 20-day EMA of 13,952.81, indicating a short-term bearish trend. It is significantly above the 200-day EMA of 12,754.12, suggesting a long-term bullish outlook despite recent declines.
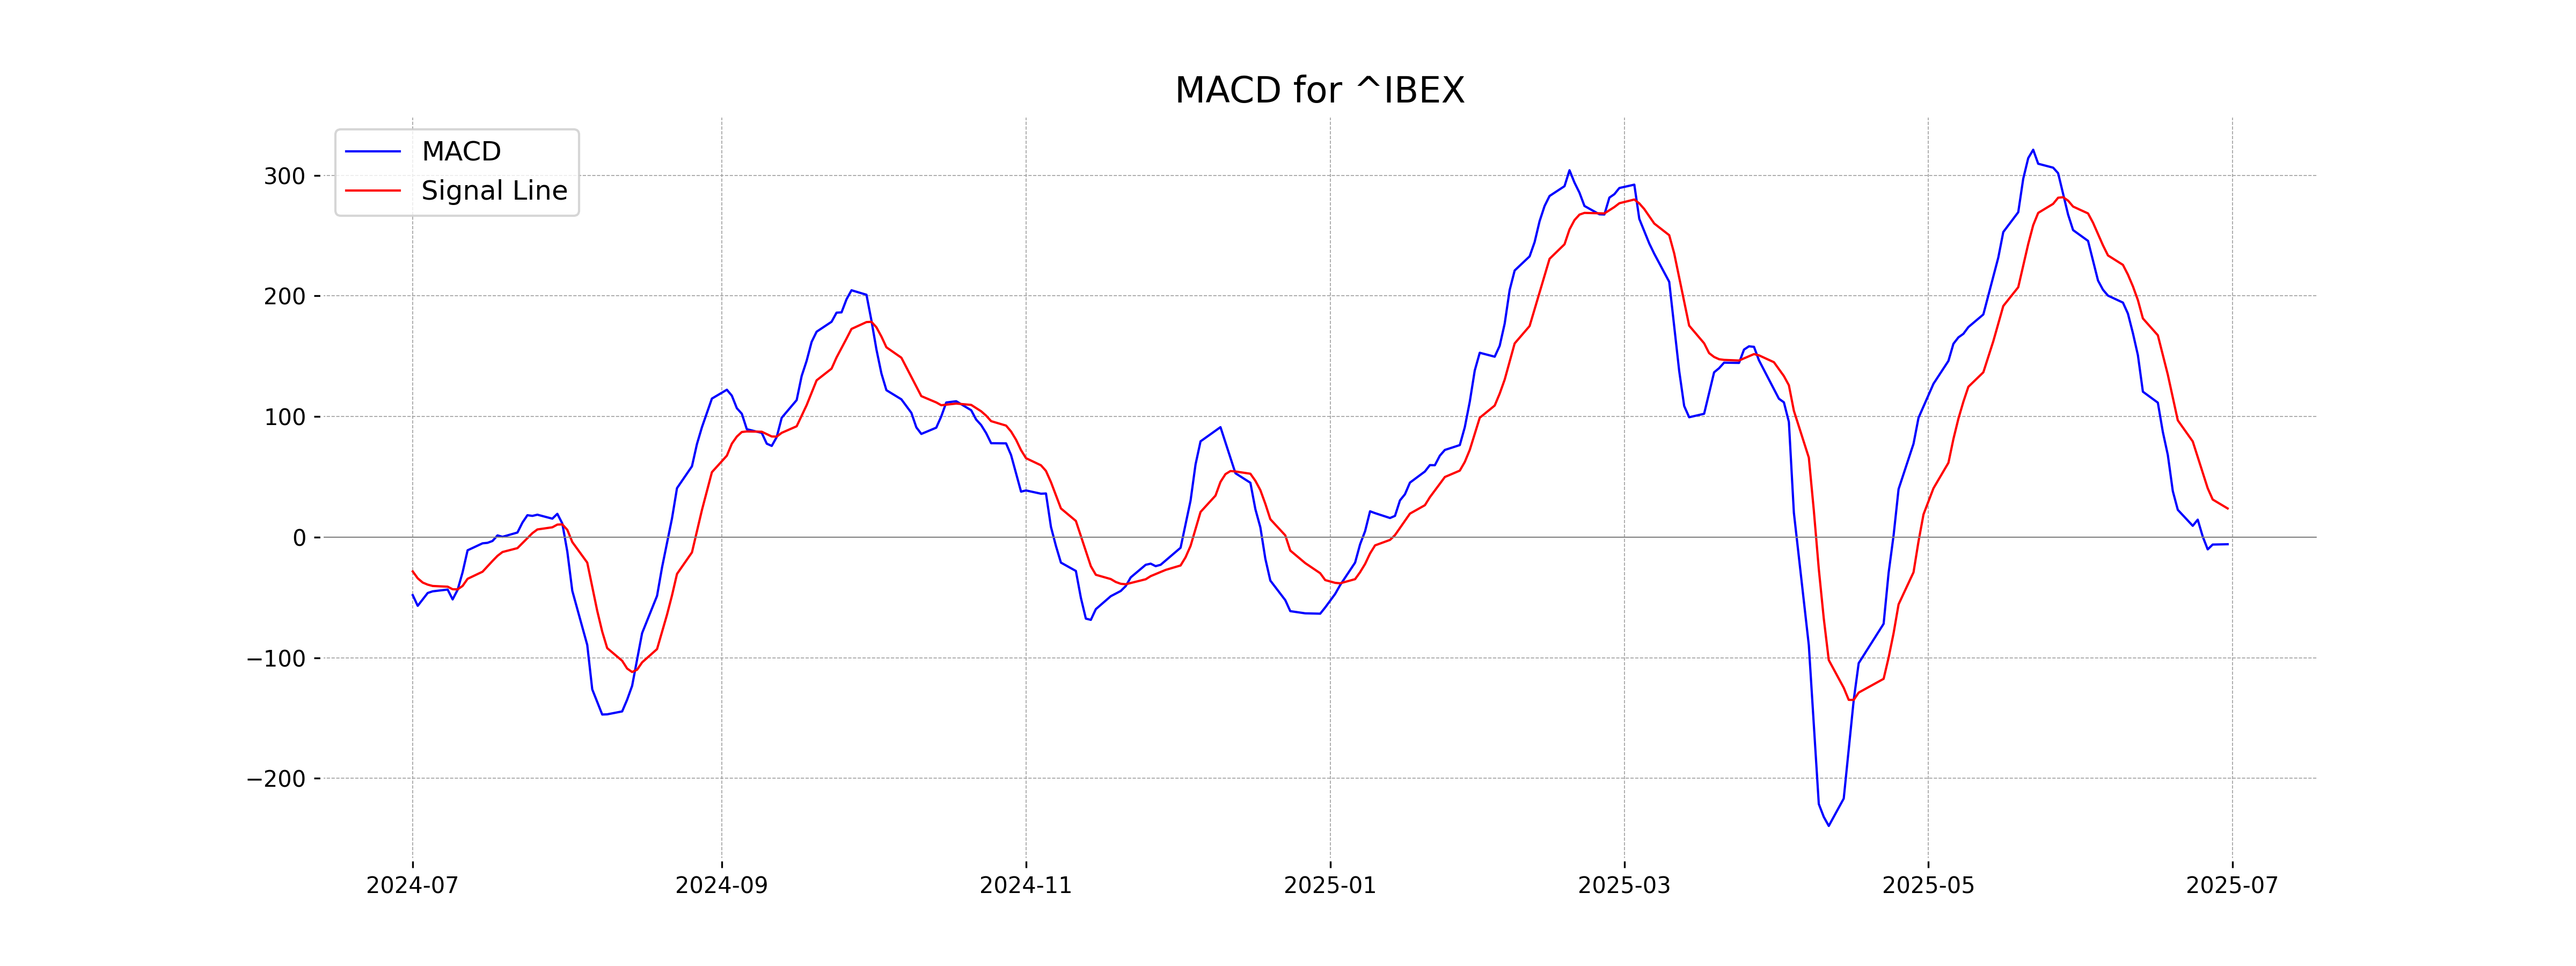
Moving Averages Trend (MACD)
The MACD for IBEX 35 shows a value of -5.88, which is below its Signal line at 23.78, suggesting a bearish sentiment in the short-term. This indicates that the index may be experiencing a downward trend or selling pressure.
RSI Analysis
The RSI for IBEX 35 is 49.84, suggesting a neutral position as it's close to the midpoint of 50. This indicates that the index does not currently show signs of being overbought or oversold.
Analysis for NASDAQ Composite (US) - June 30, 2025
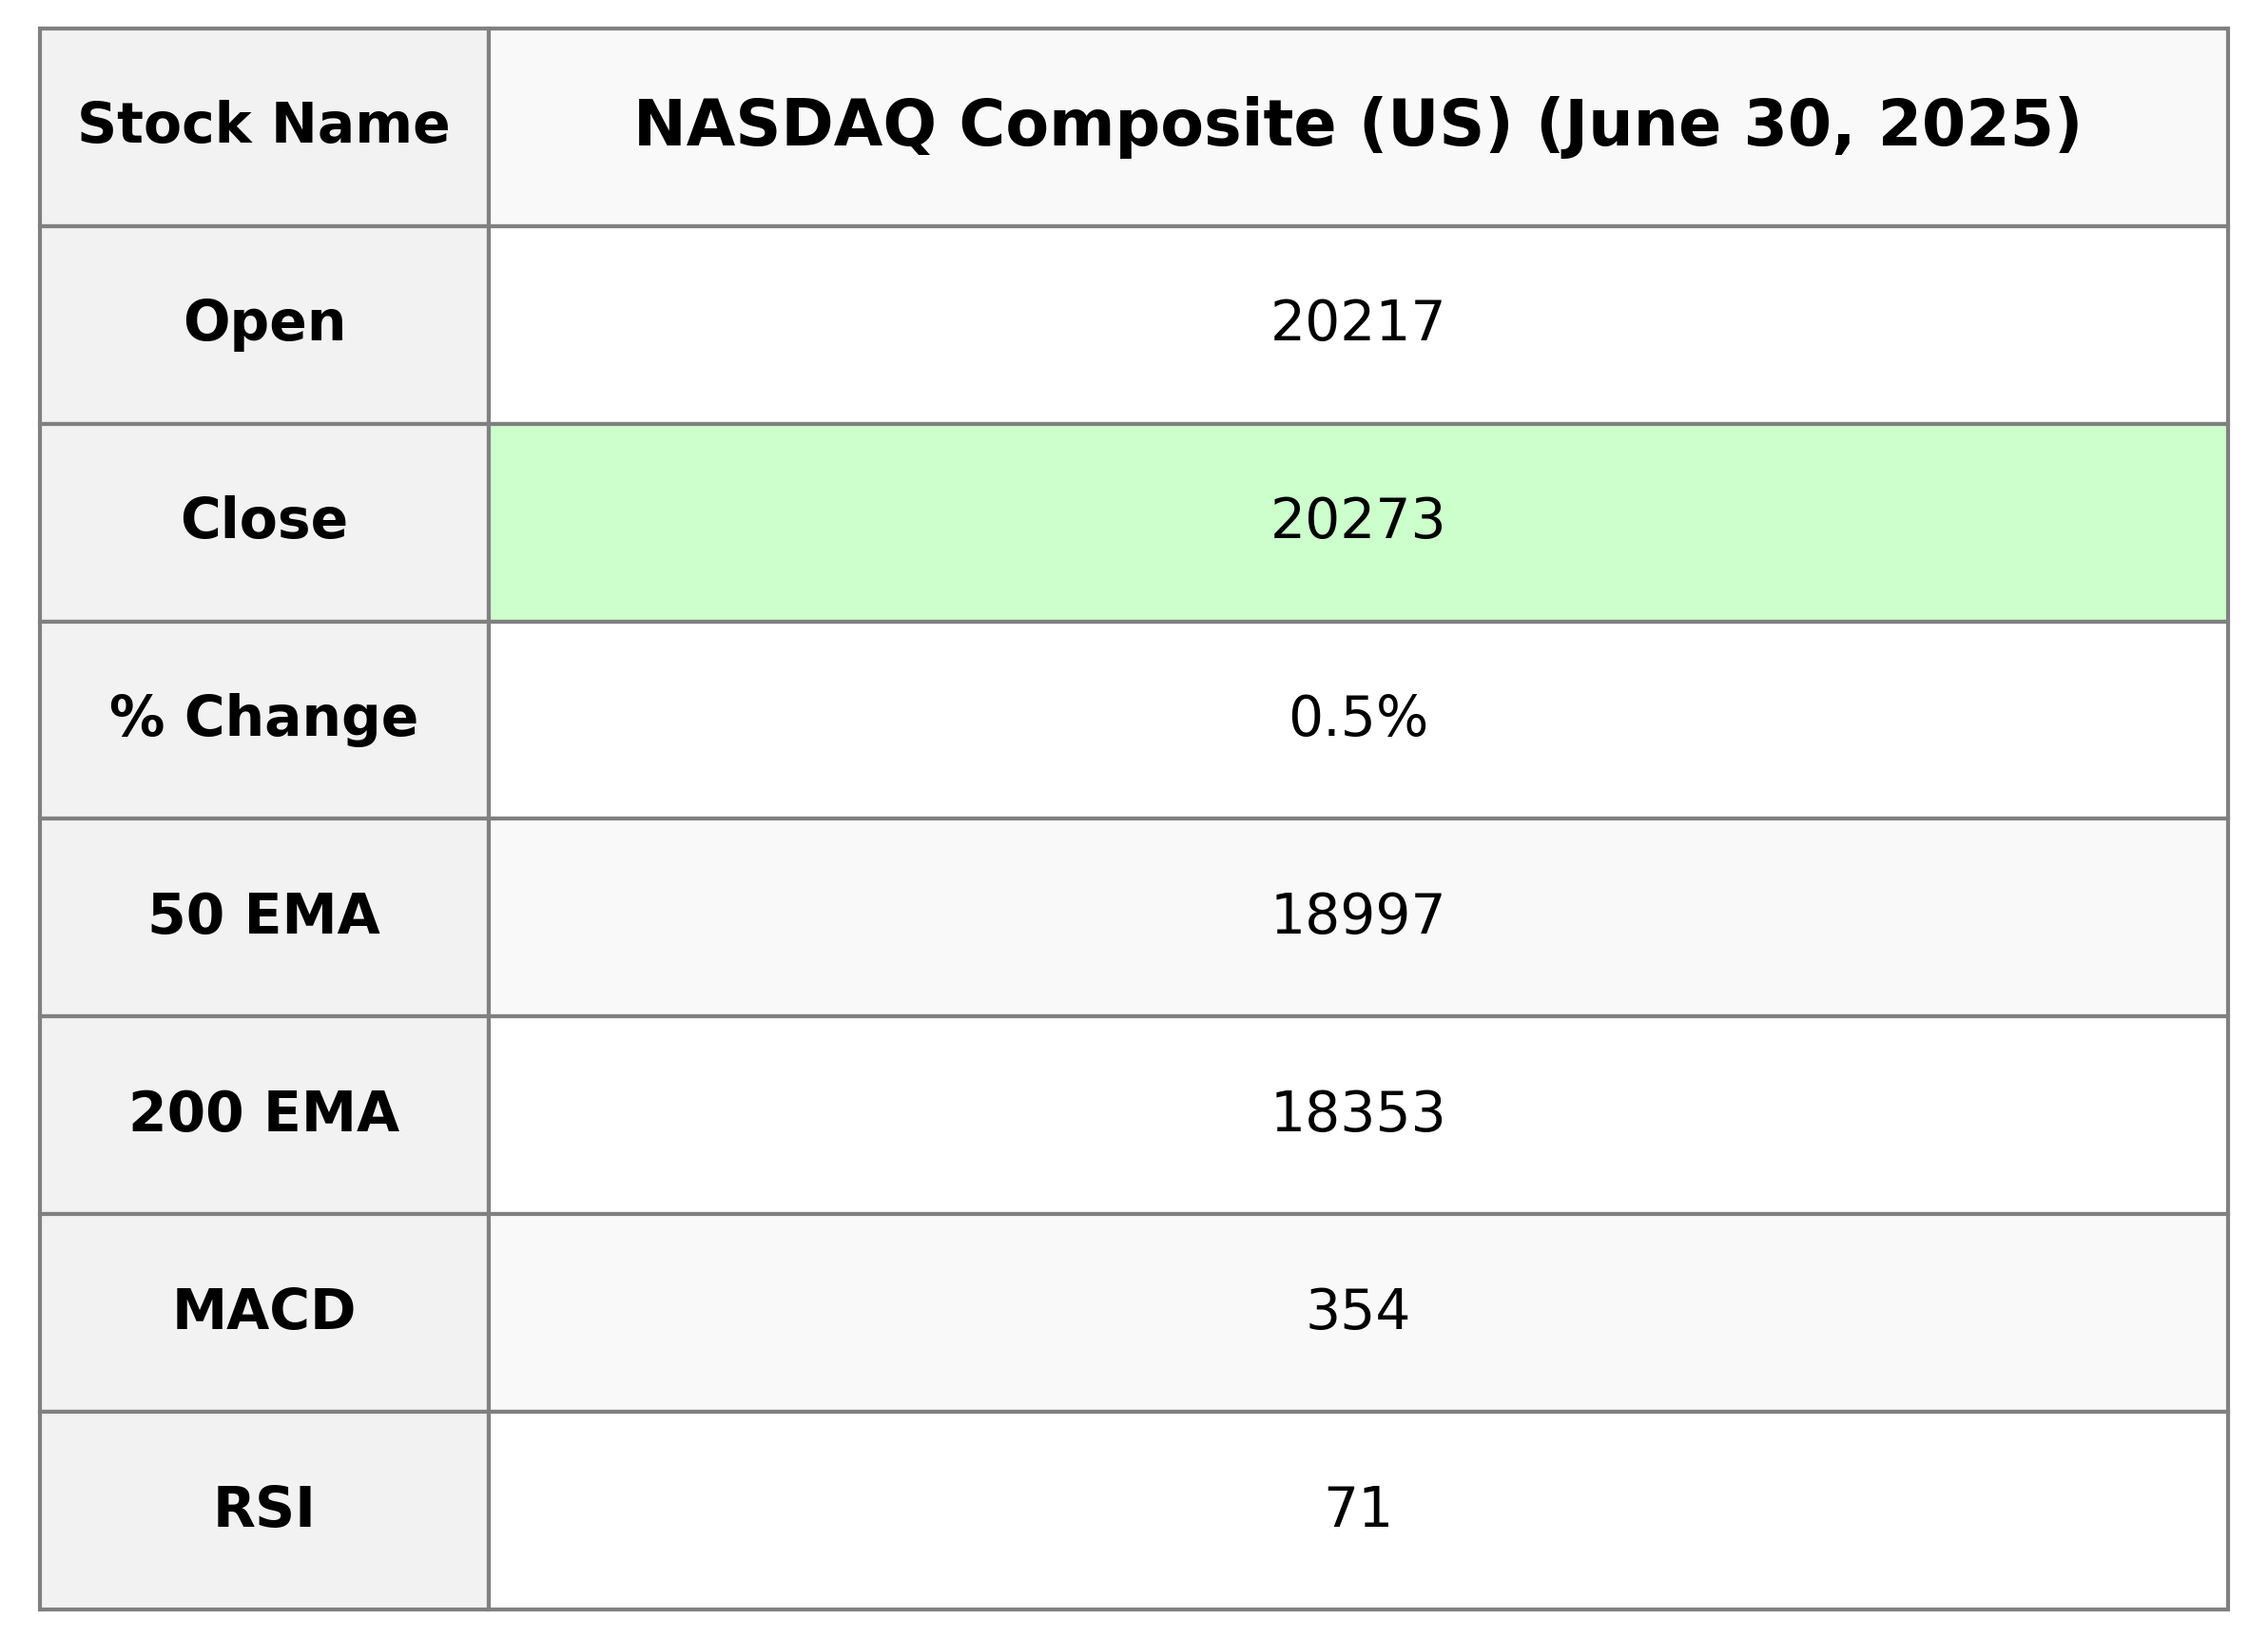
NASDAQ Composite (US) opened at 20217.26, reached a high of 20311.51, and closed at 20273.46, marking a 0.52% increase from the previous close with a points change of 105.55. The index shows a strong trend with RSI at 70.74 and a positive MACD indicating potential bullish momentum. Volume stood at 10,951,070,000, showcasing active trading.
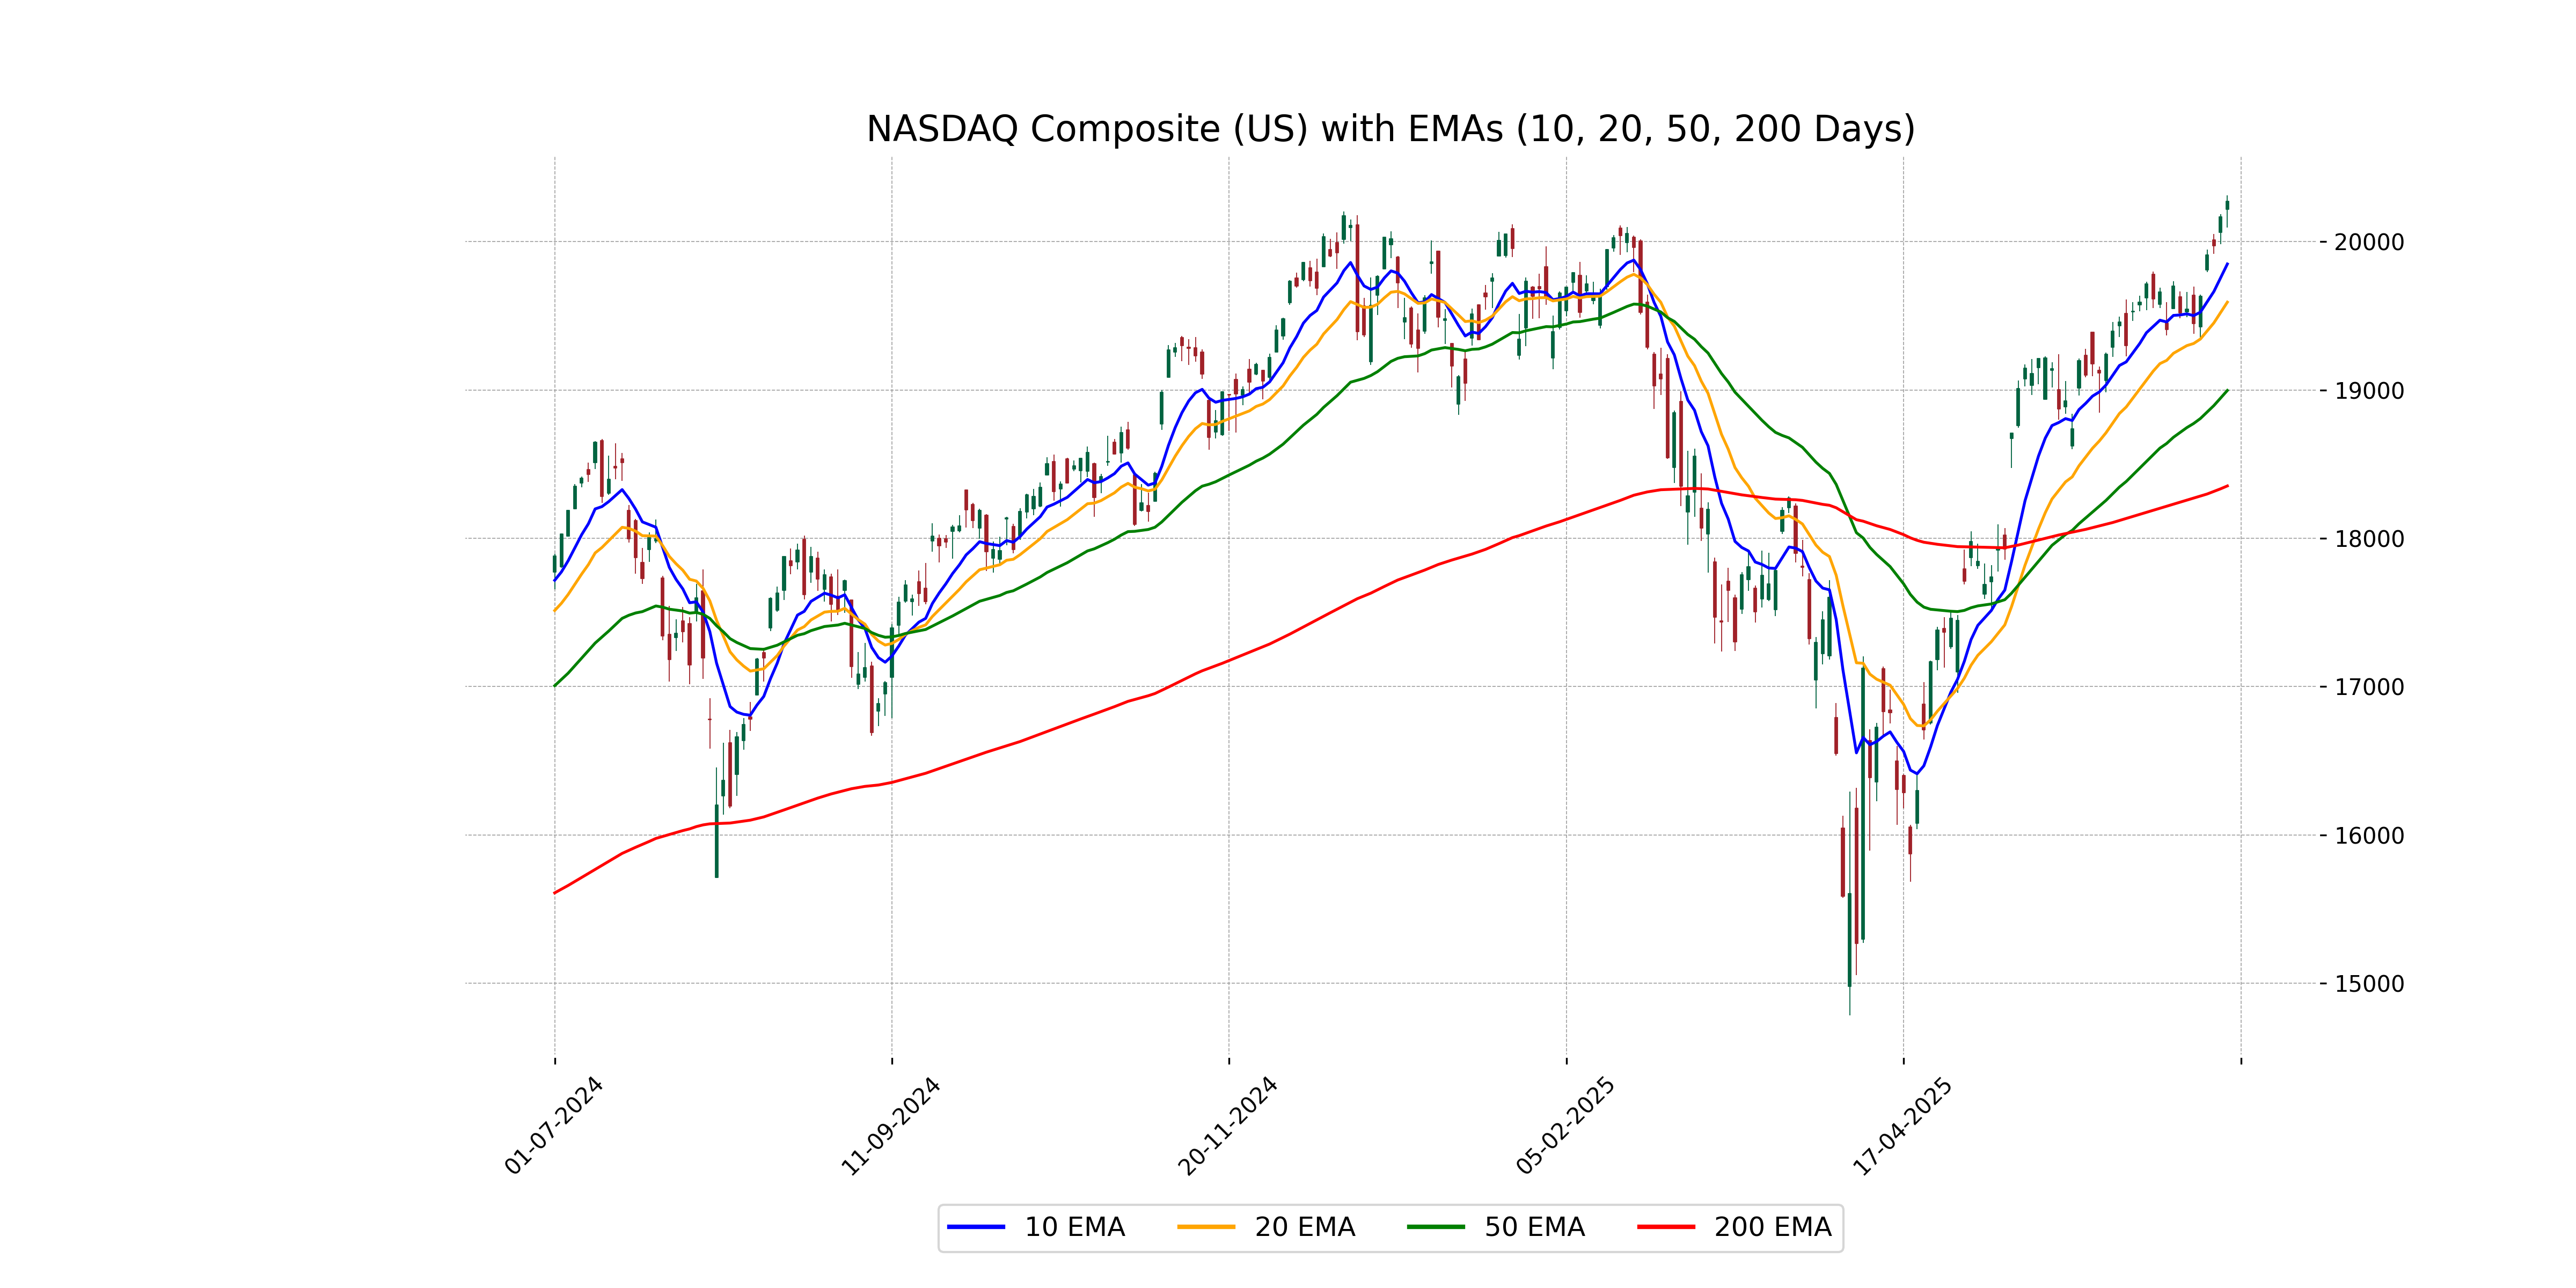
Relationship with Key Moving Averages
The NASDAQ Composite is trading above its key moving averages, with the current close of 20273.46 surpassing the 10 EMA at 19849.96, the 20 EMA at 19592.60, the 50 EMA at 18997.20, and the 200 EMA at 18353.17, indicating a bullish trend. The RSI of 70.74 also suggests a strong upward momentum.
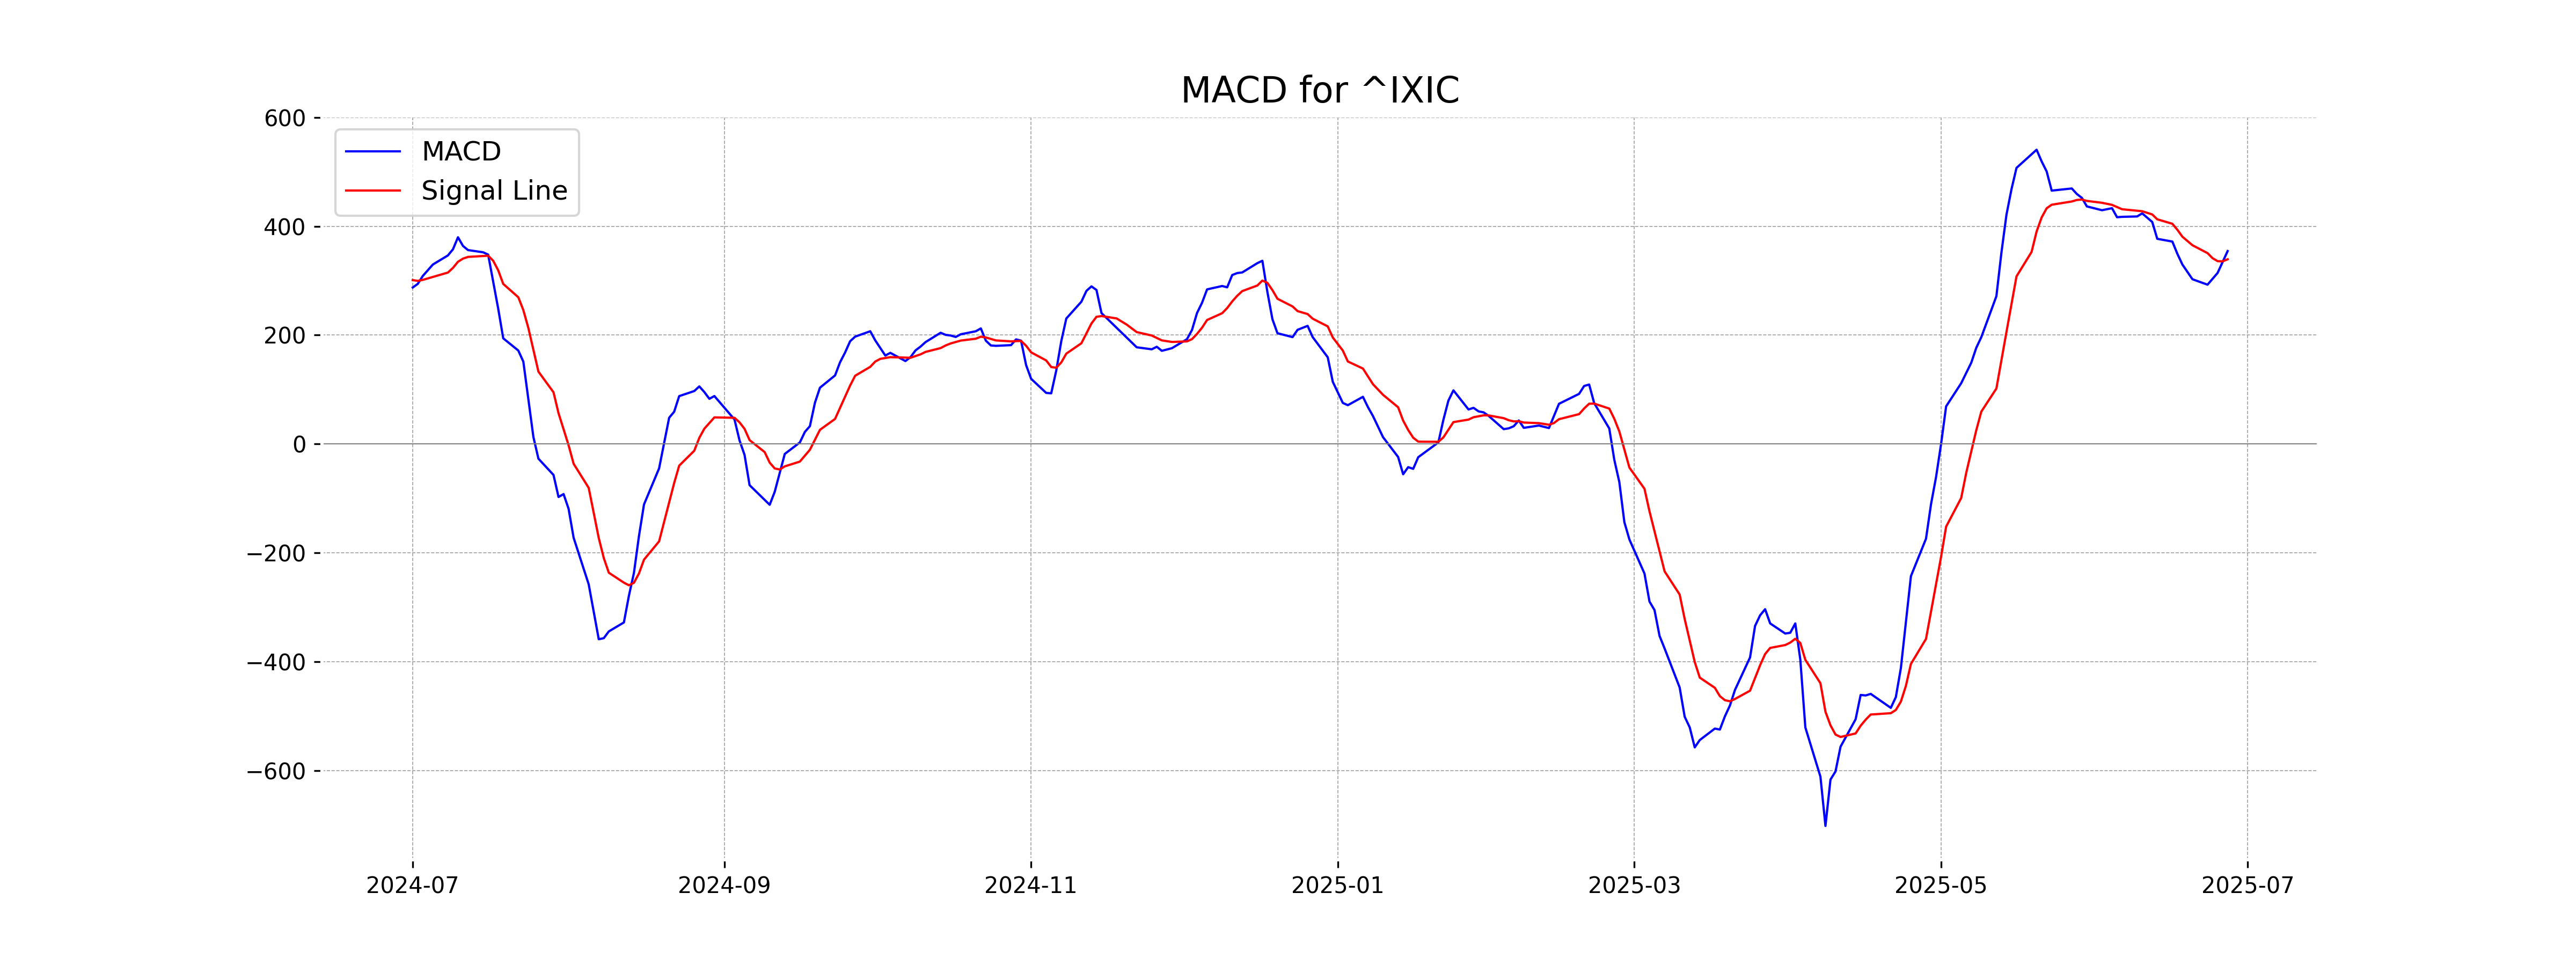
Moving Averages Trend (MACD)
The NASDAQ Composite shows a positive MACD of 354.38, with the MACD line above the signal line at 339.27. This indicates a bullish momentum, suggesting potential upward movement.
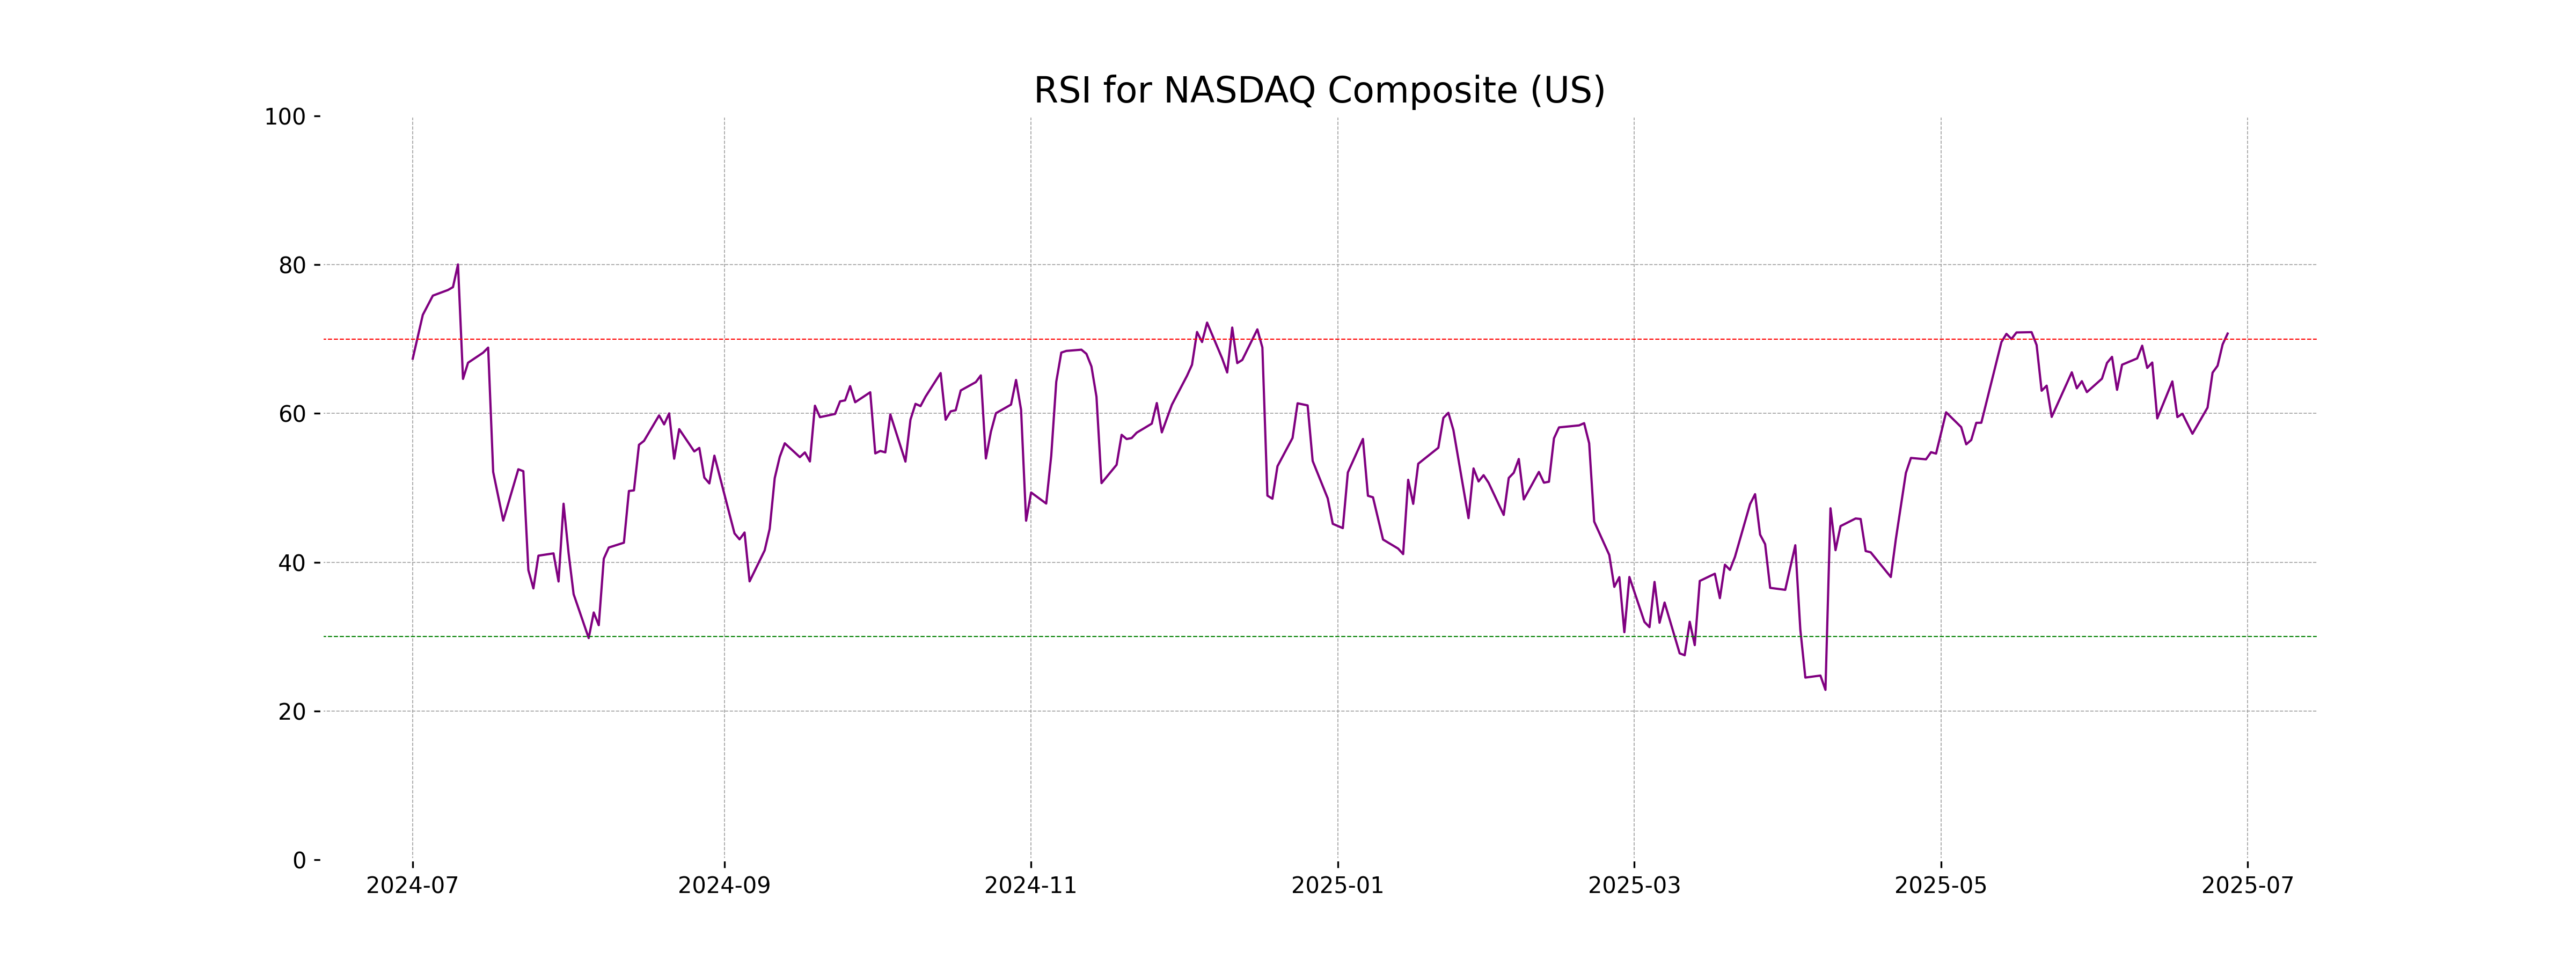
RSI Analysis
The NASDAQ Composite's RSI stands at 70.74, indicating that the index is in overbought territory. This suggests that the market may be due for a correction or pullback in the near term. Investors should exercise caution, as high RSI levels can often precede a reversal or a slowdown in upward momentum.
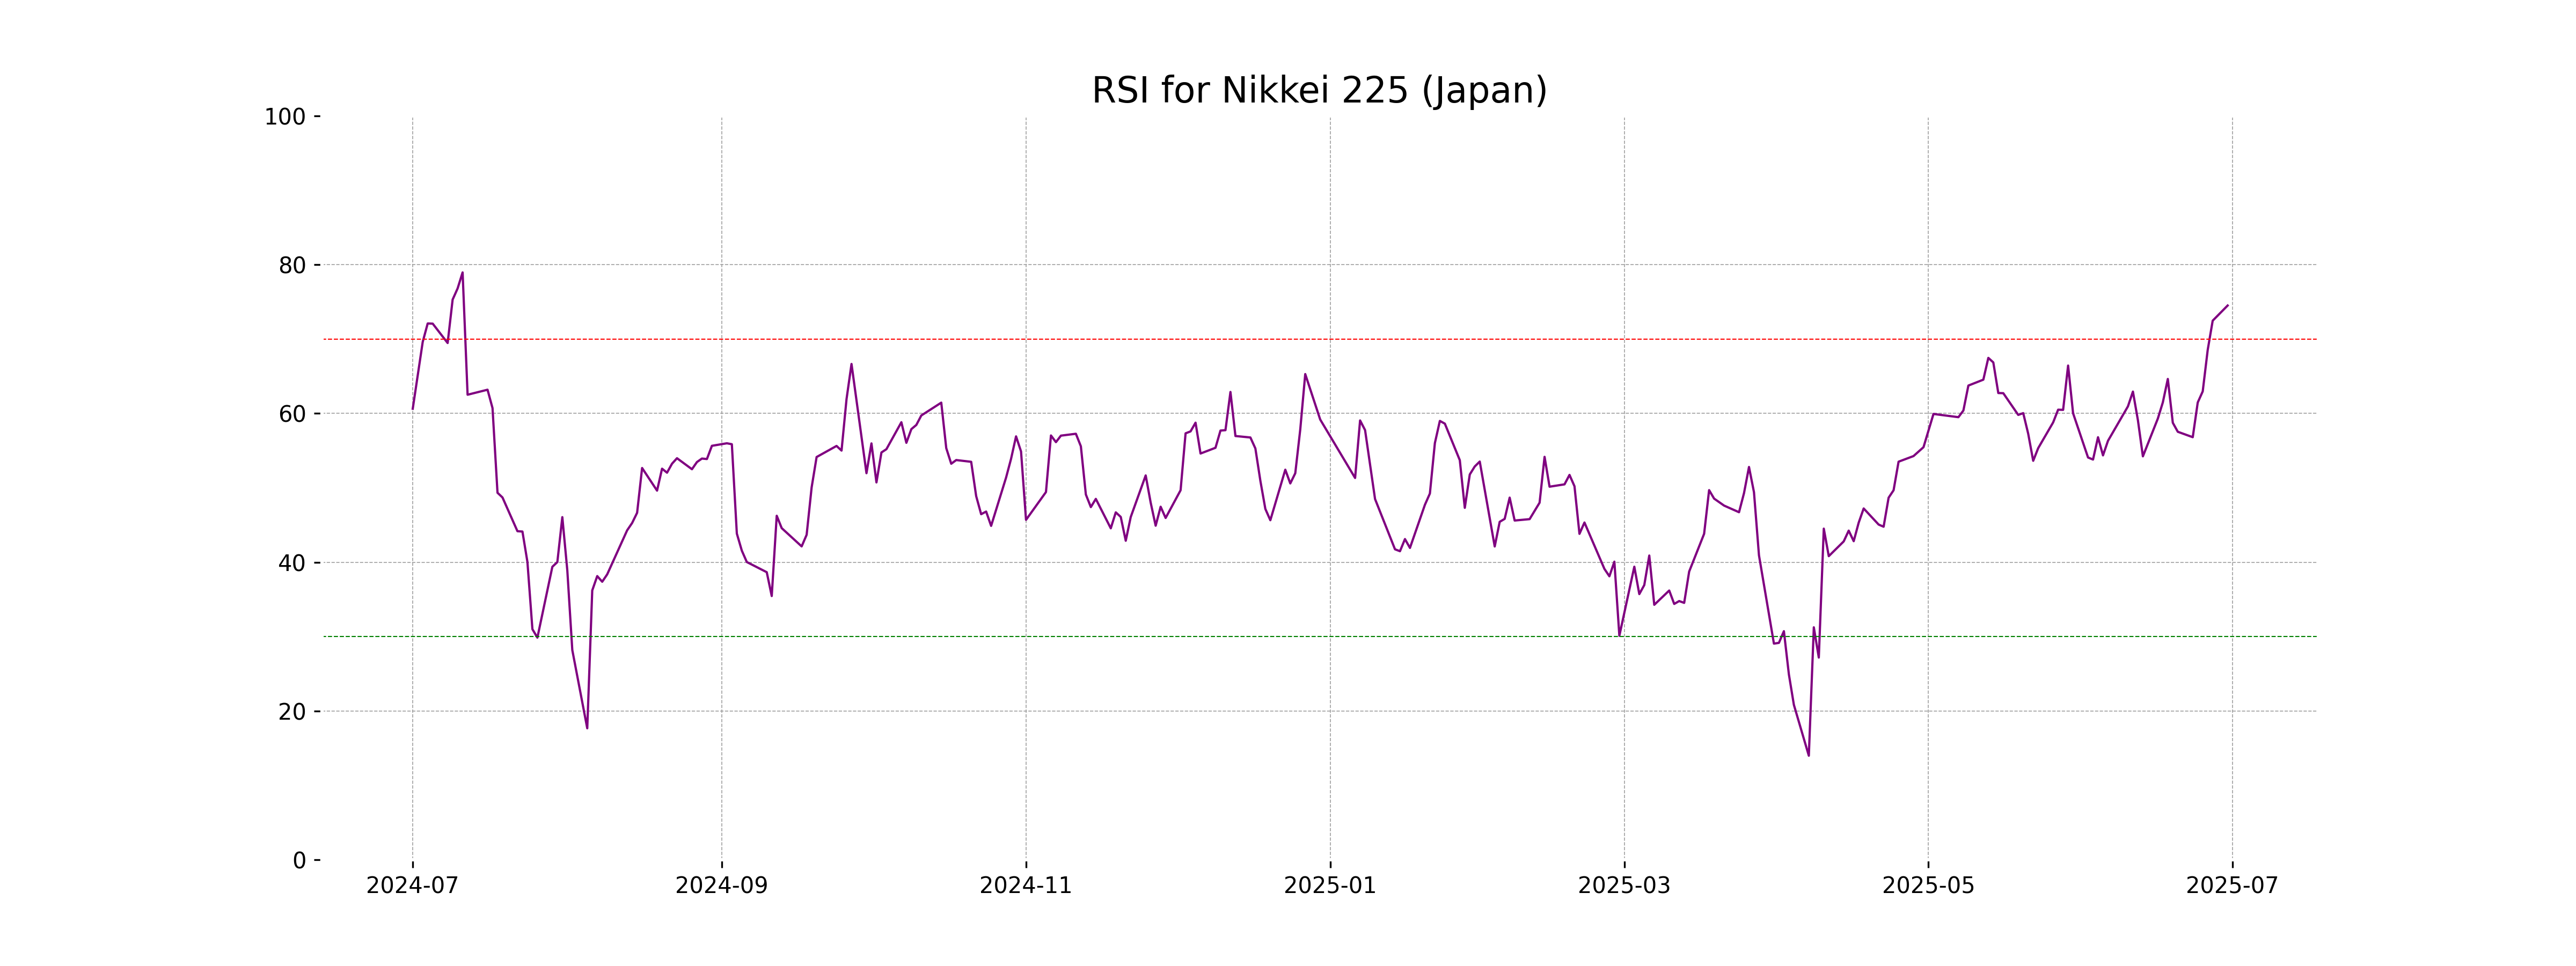
Analysis for Nikkei 225 (Japan) - June 30, 2025
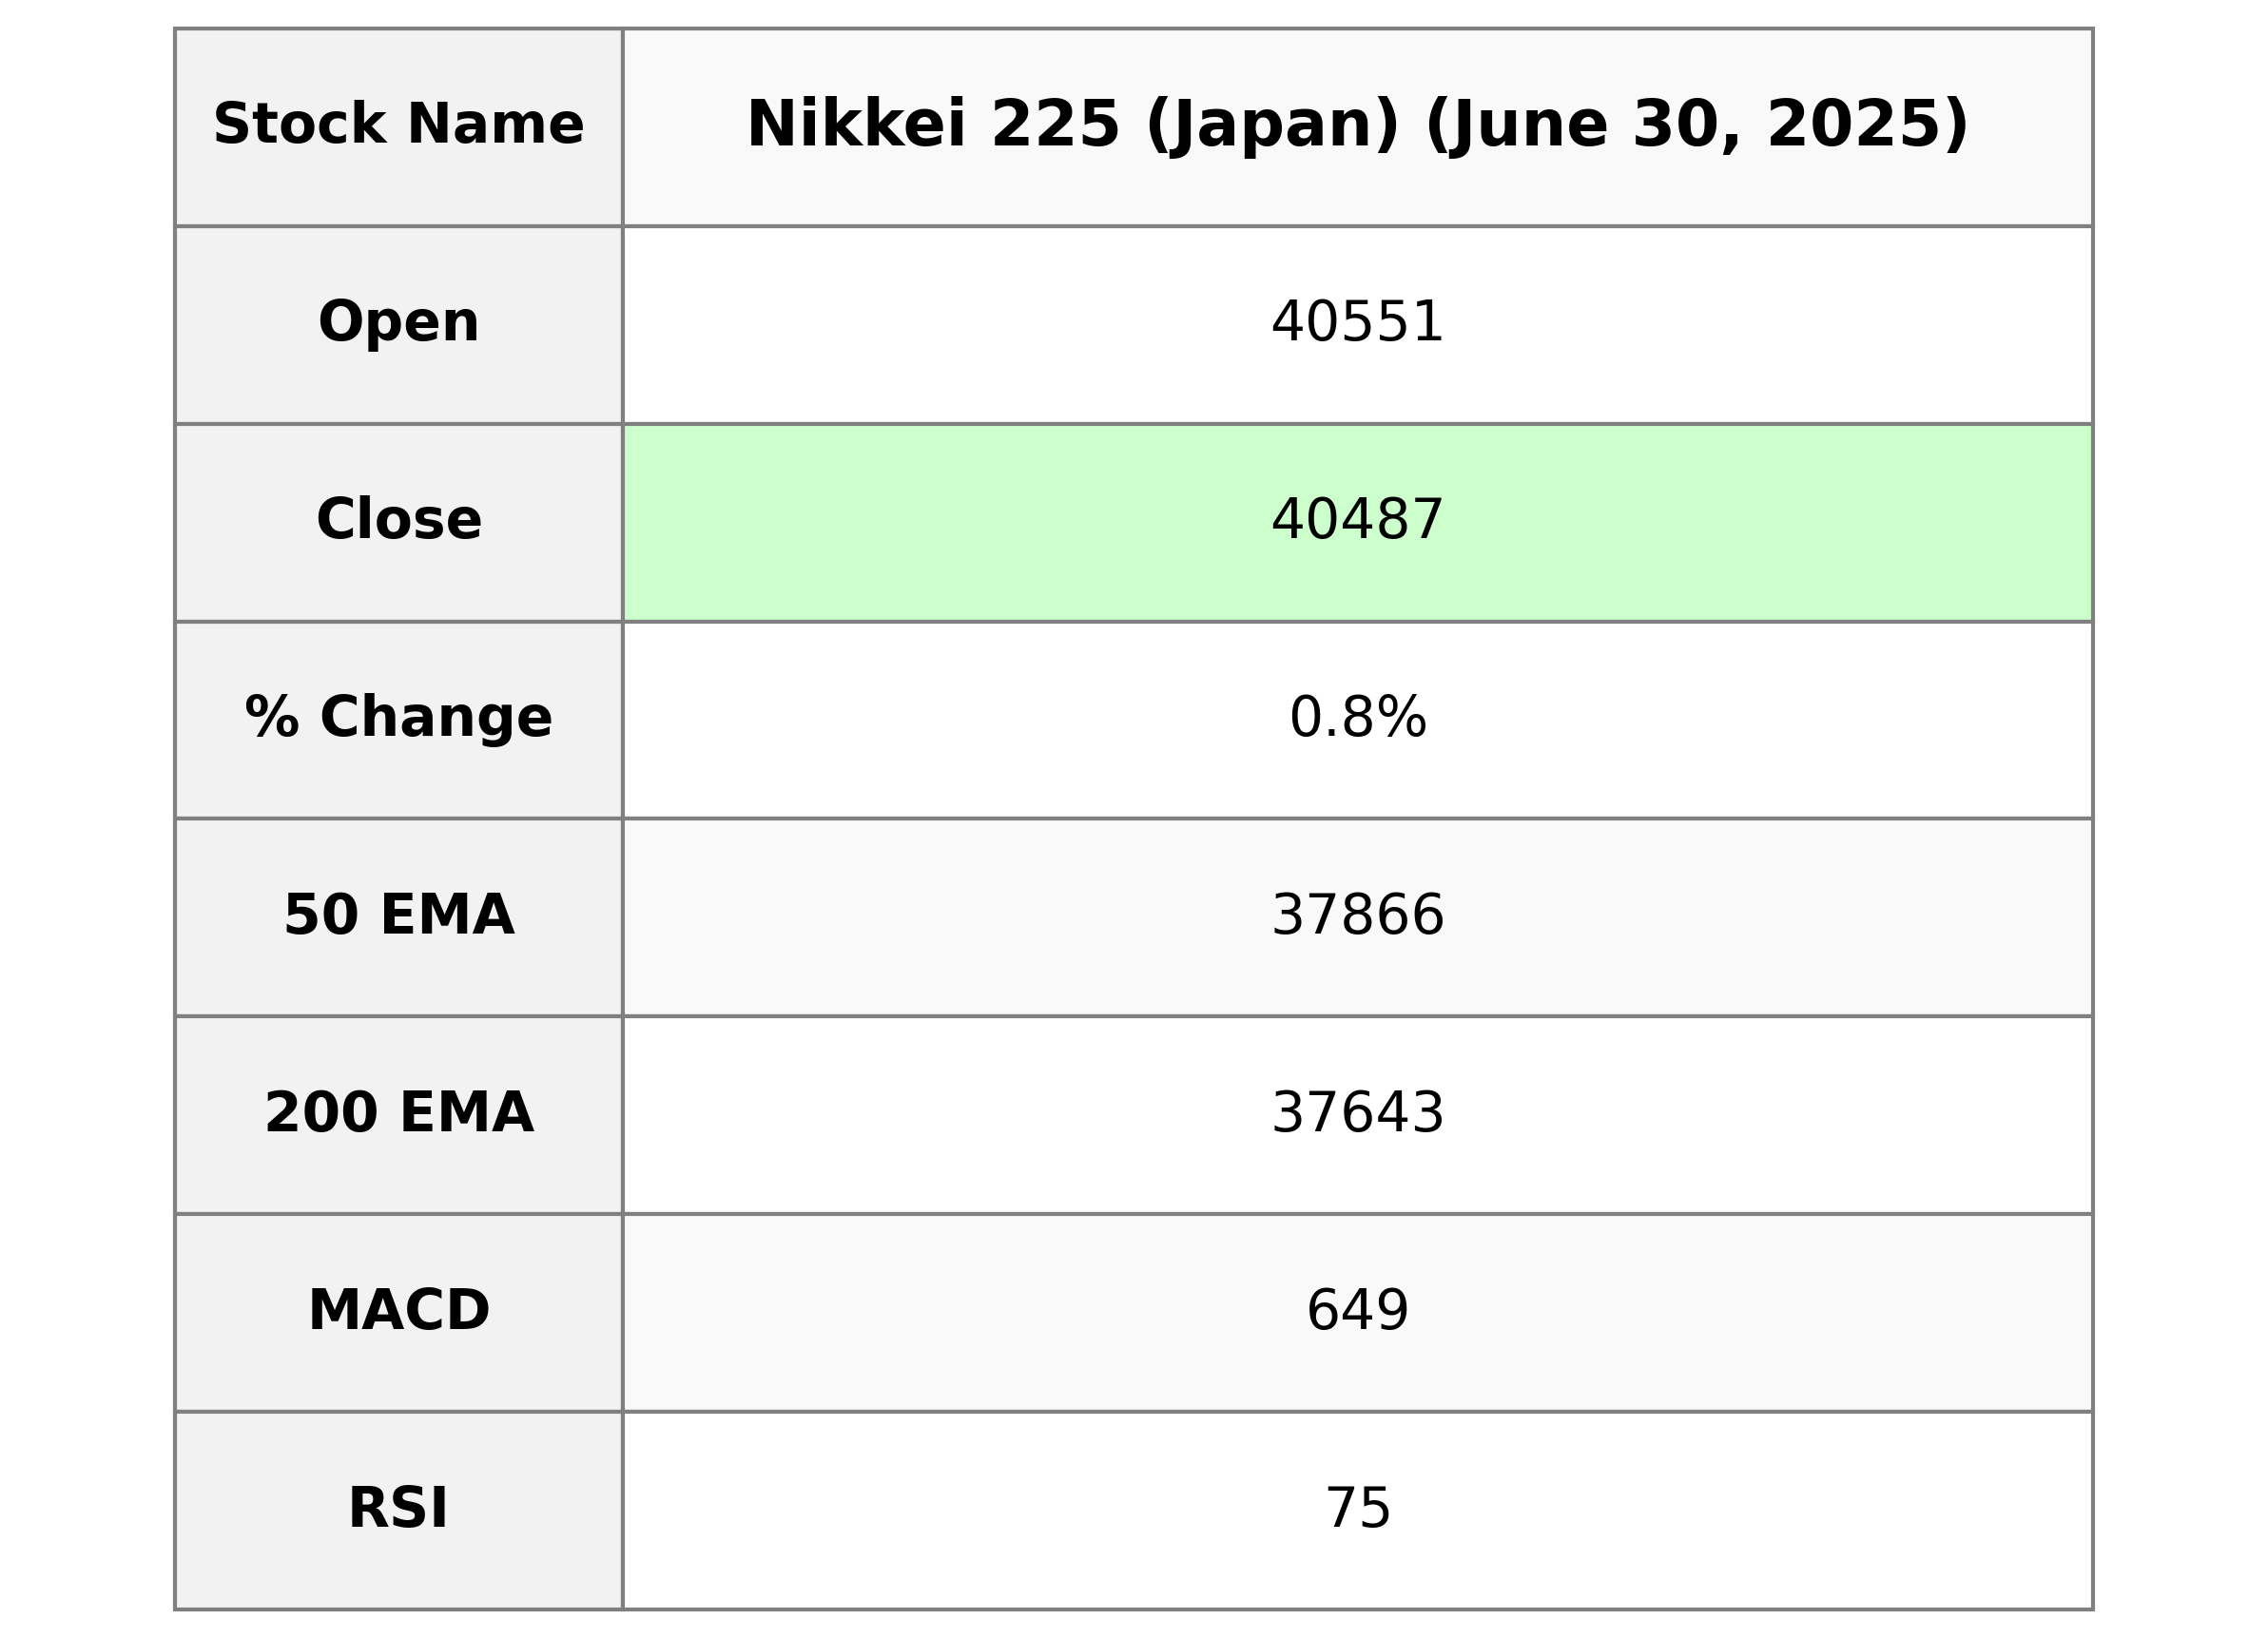
Nikkei 225 (Japan) opened at 40,550.79 and closed at 40,487.39, marking an increase of 0.84% or 336.60 points from its previous close. The index showed strong momentum with a Relative Strength Index (RSI) of 74.51, indicating potential overbought conditions. The current closing price remains above the 50-day and 200-day EMA, signifying an upward trend.
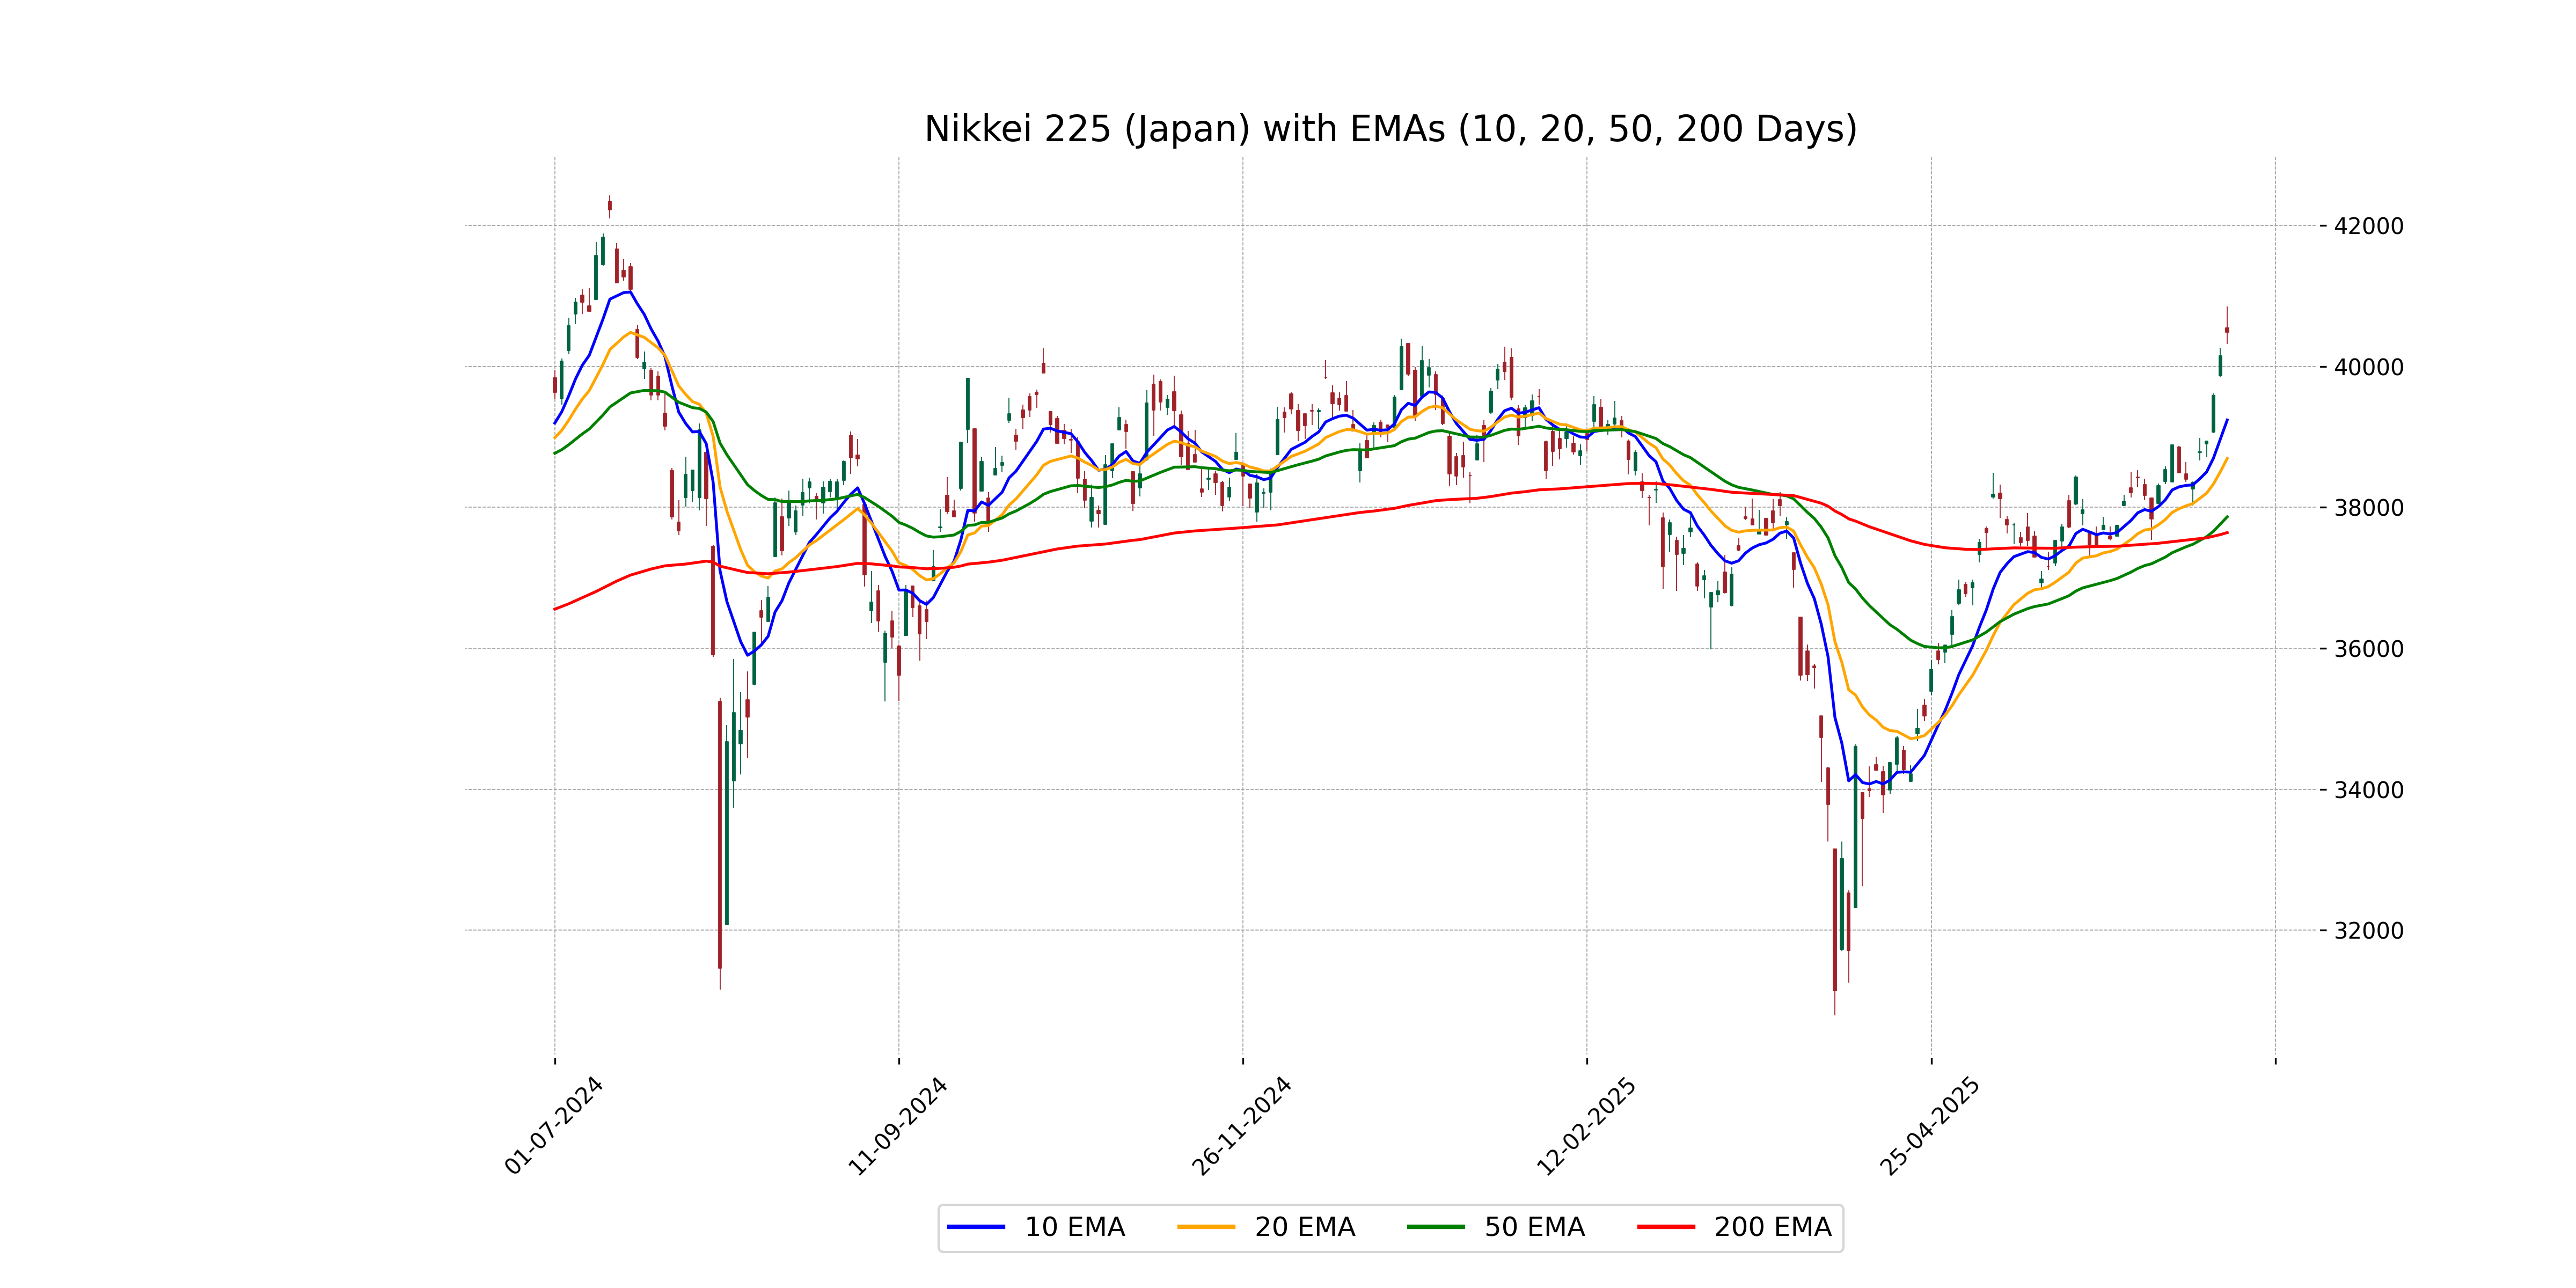
Relationship with Key Moving Averages
The Nikkei 225 is trading above its 50-day and 200-day EMAs, with a current close of 40,487.39 compared to a 50 EMA of 37,866.39 and a 200 EMA of 37,642.64. This suggests a strong upward trend as the index is also above the 10-day and 20-day EMAs of 39,240.56 and 38,695.05, respectively.
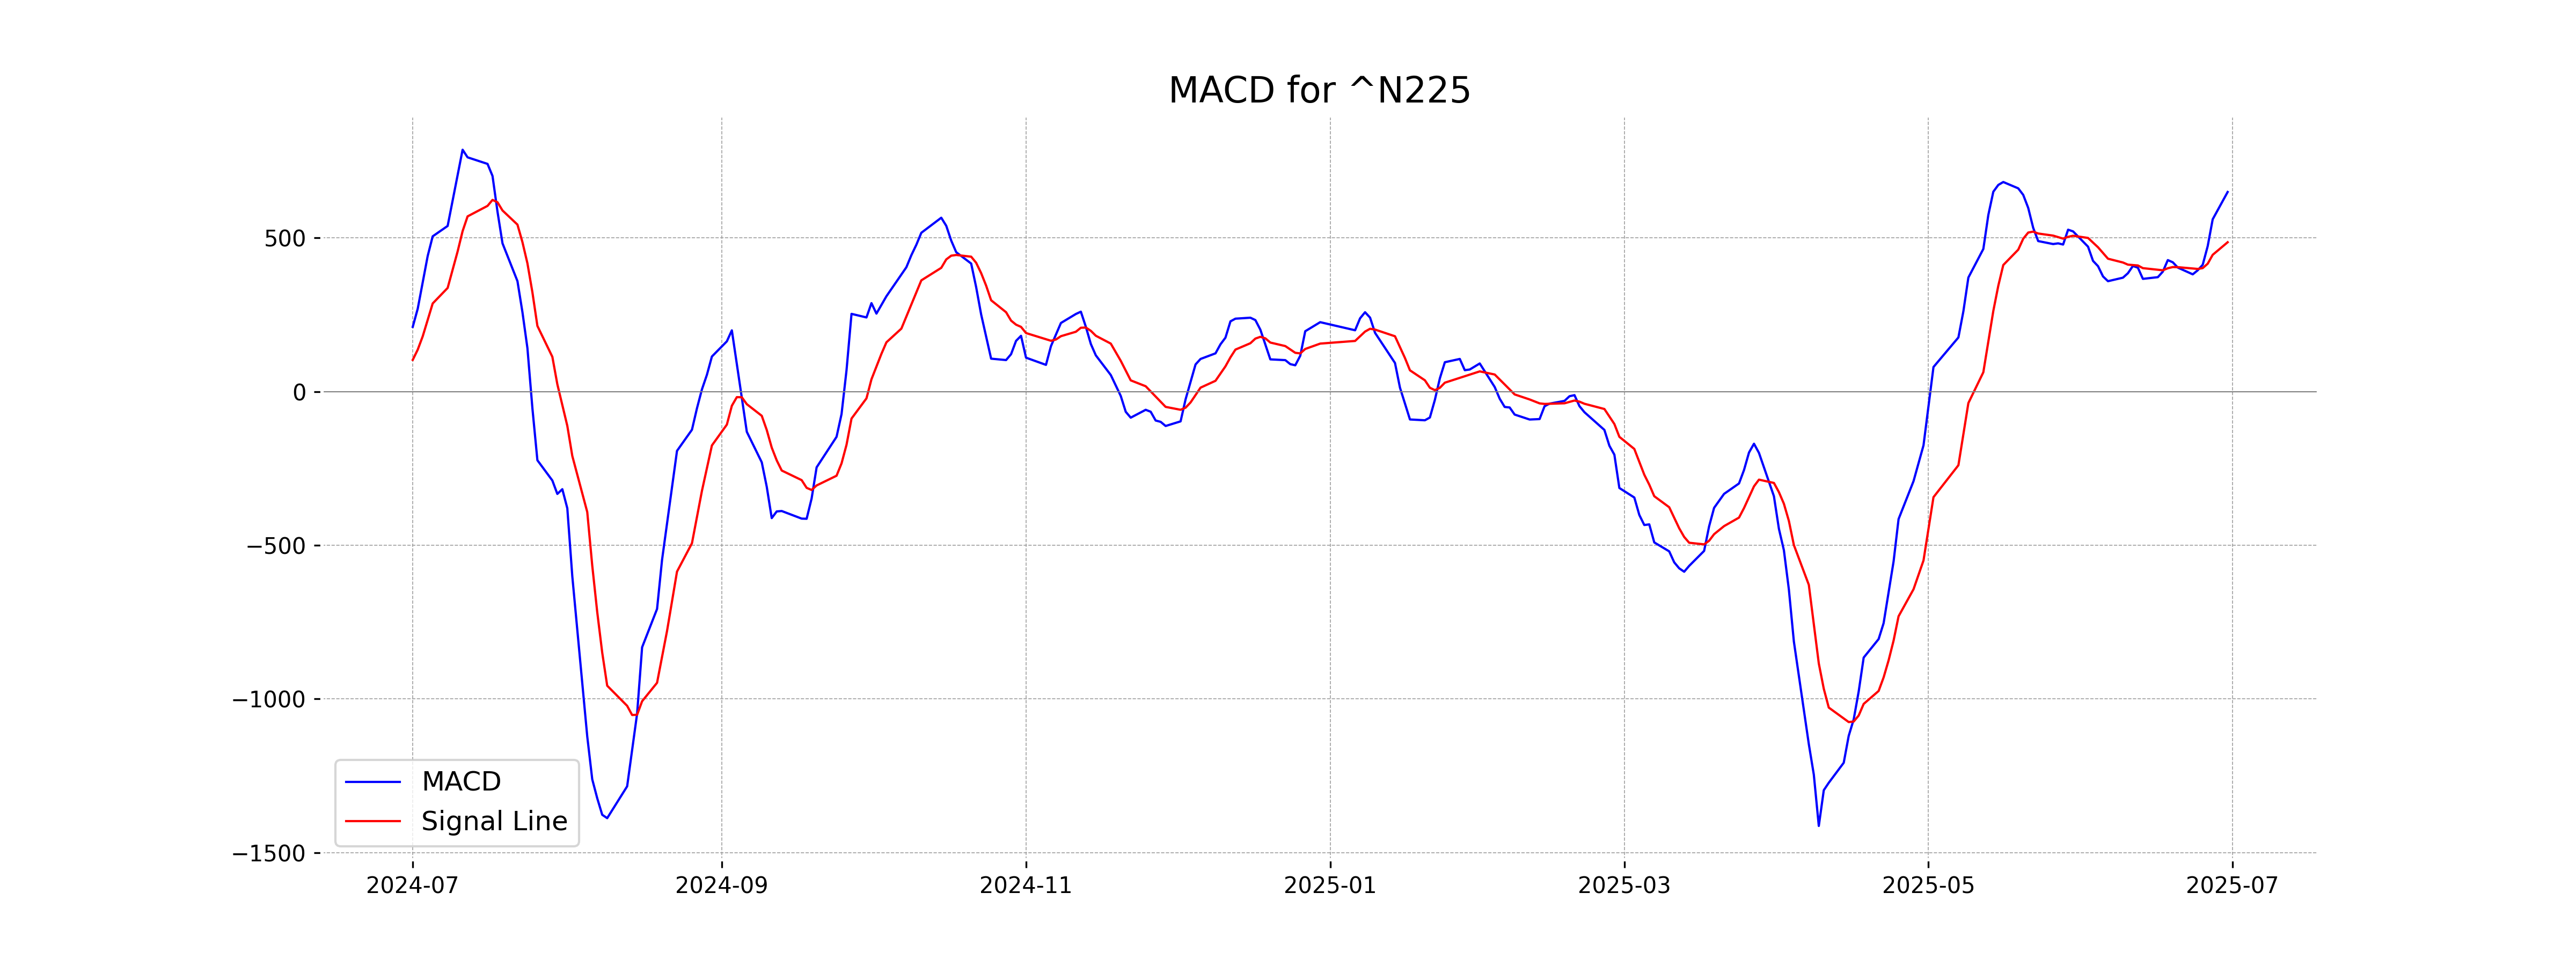
Moving Averages Trend (MACD)
The current MACD value for Nikkei 225 is 649.38, which is above the MACD Signal line of 485.83, indicating a bullish trend. With an RSI of 74.51, the index appears to be in overbought territory, suggesting the potential for a near-term pullback despite the positive MACD crossover.
RSI Analysis
The Relative Strength Index (RSI) for Nikkei 225 is 74.51, which indicates that the index is in an overbought condition. This suggests that the recent buying momentum might slow down, and there could be a potential for a price pullback or correction.
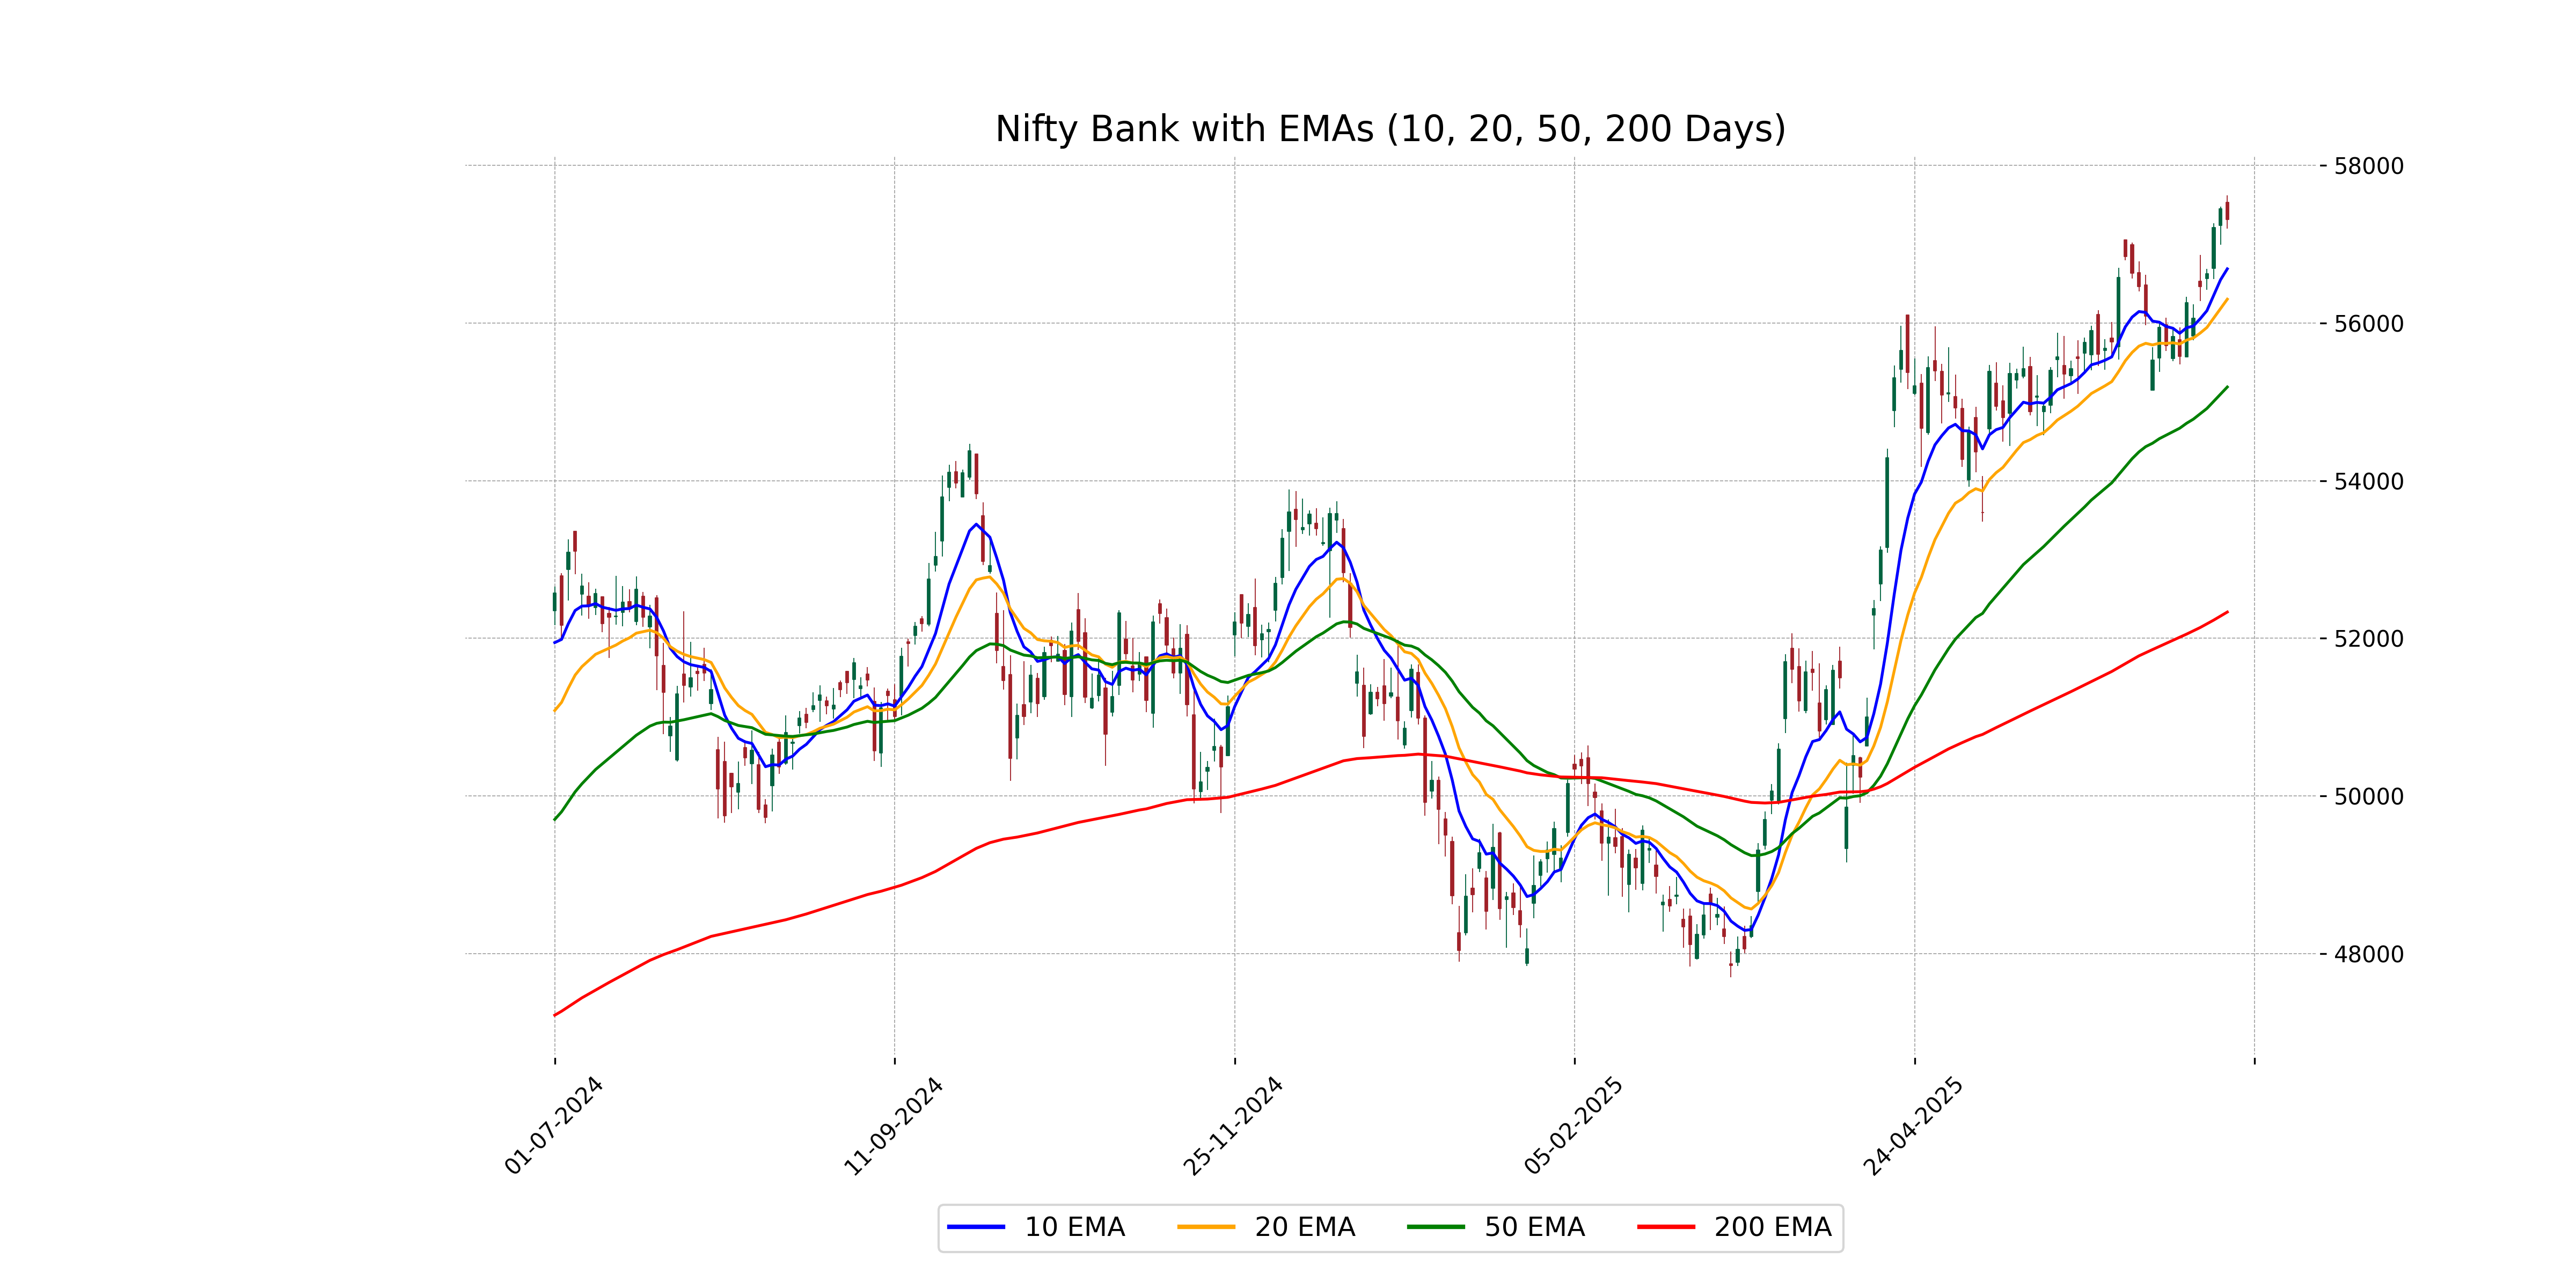
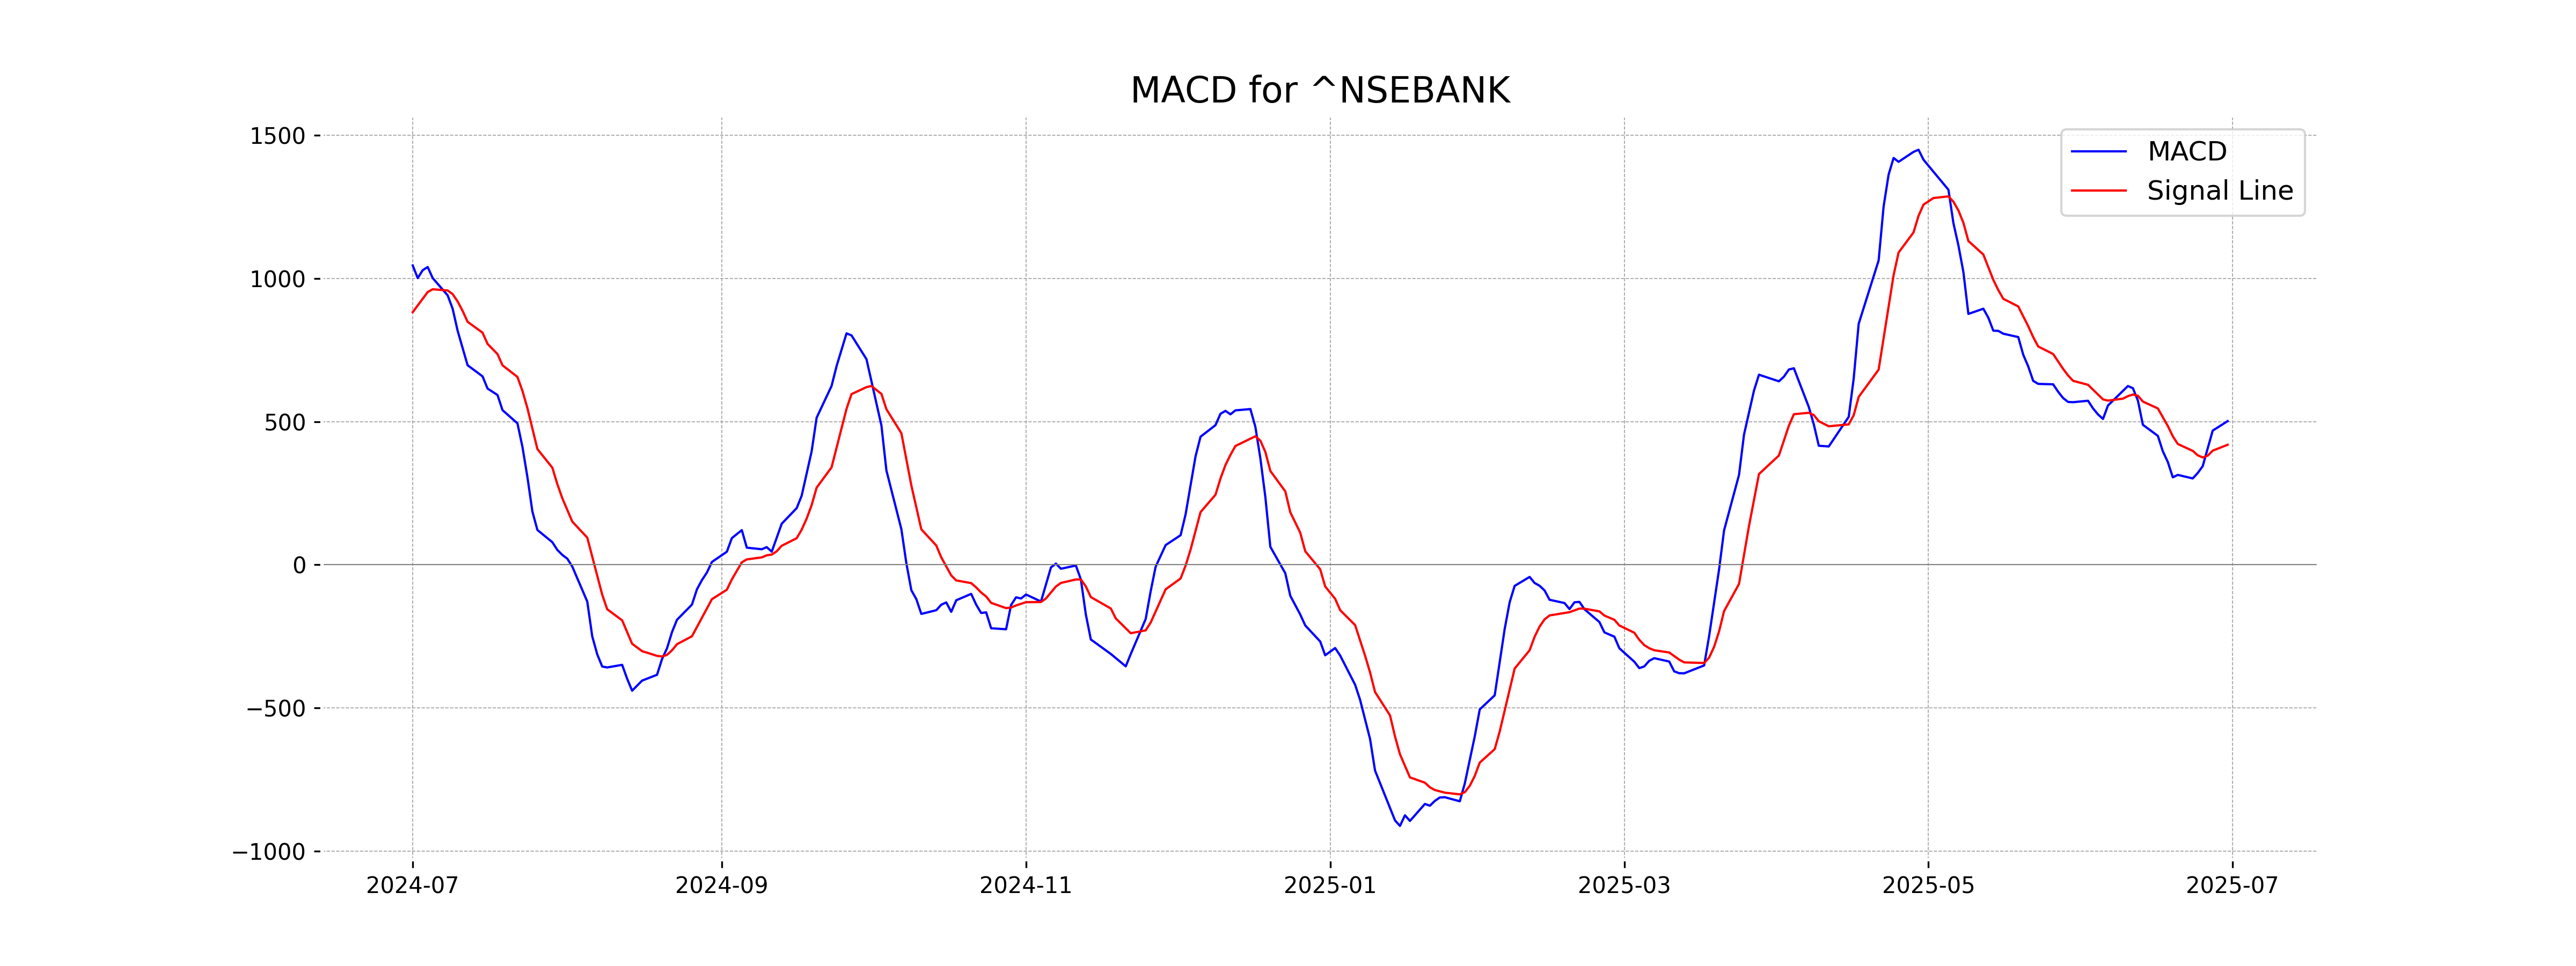
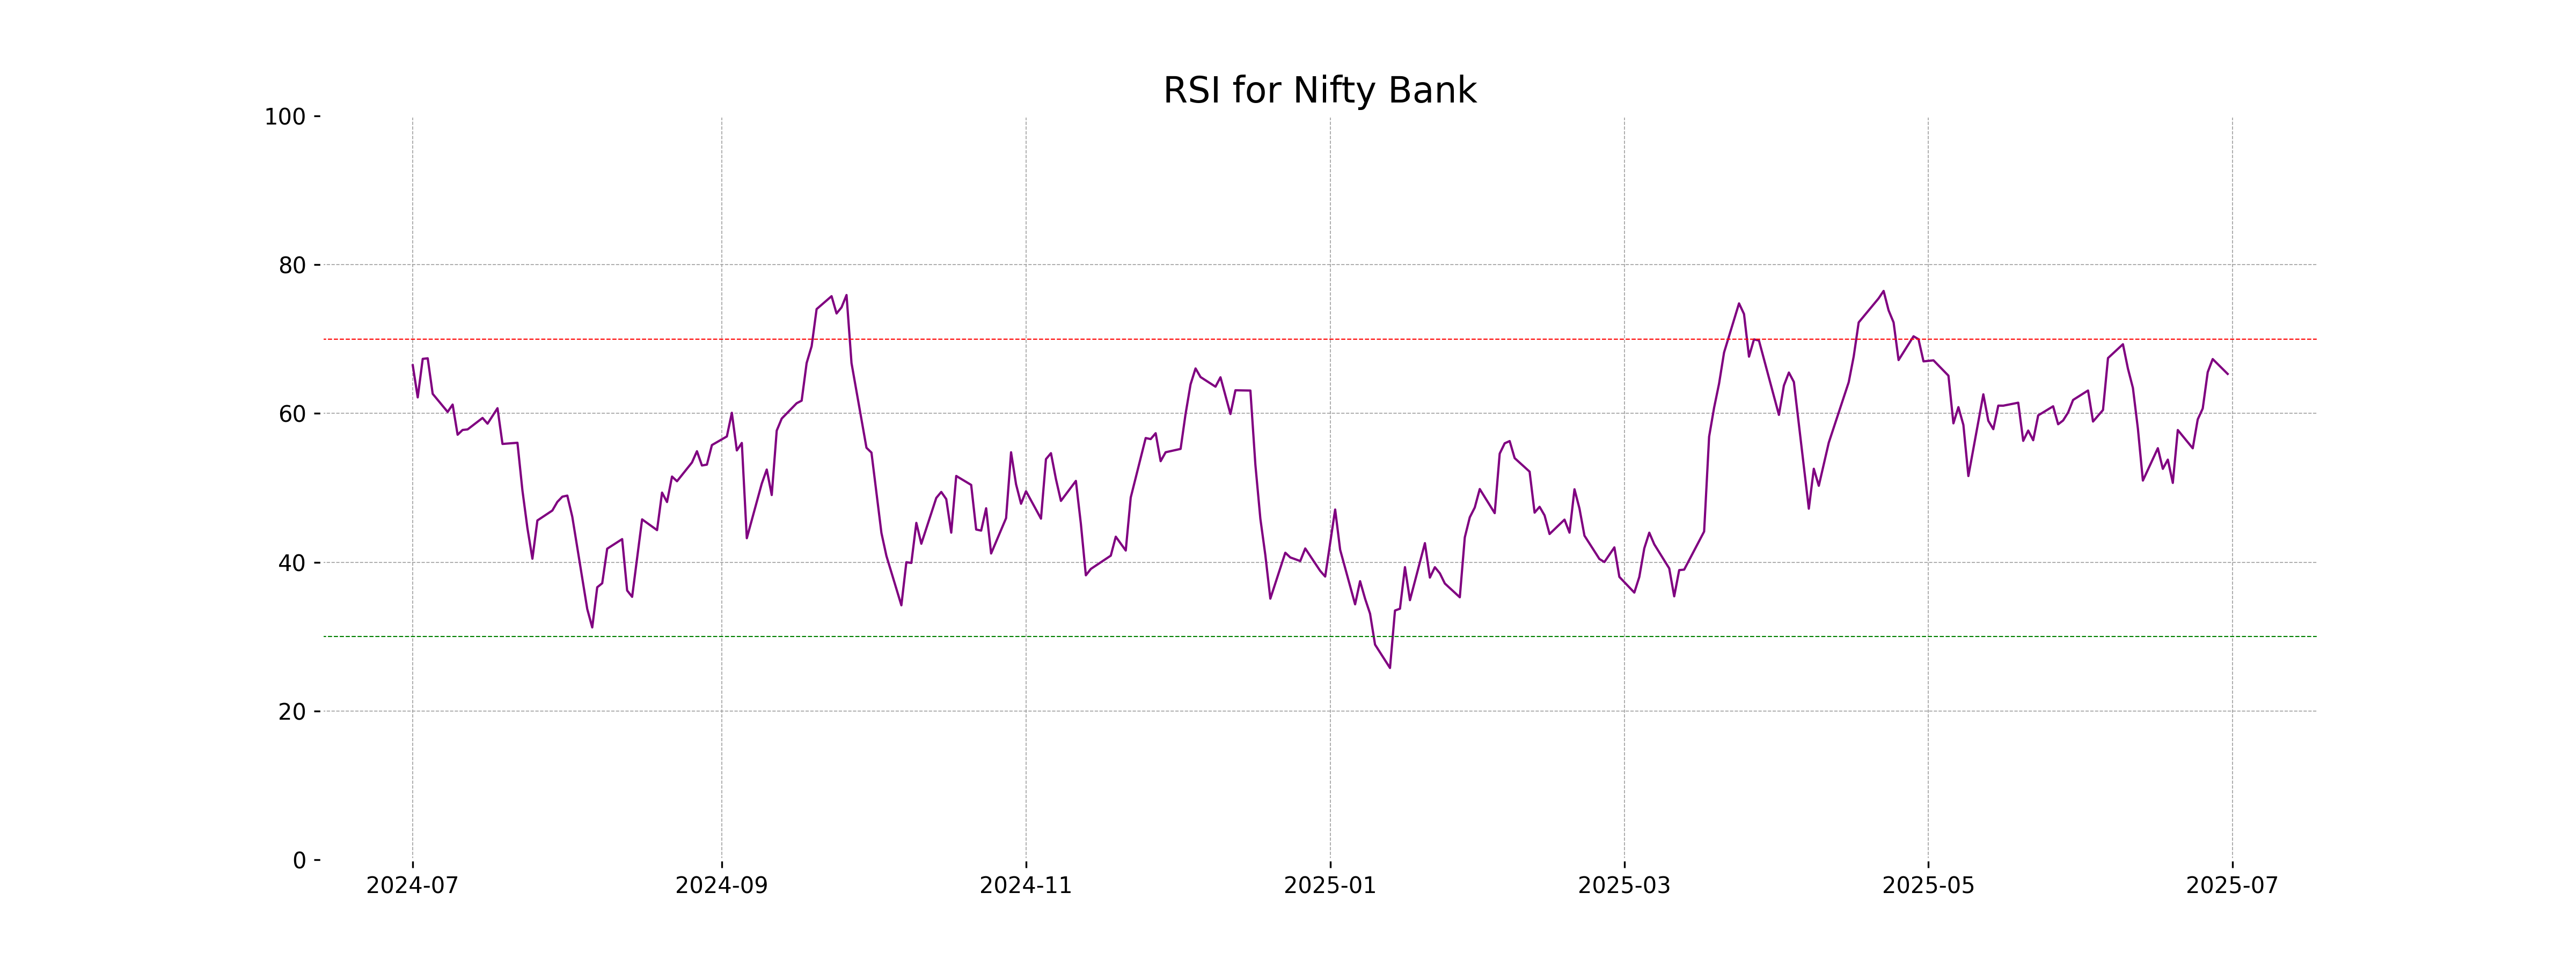
Analysis for Nifty Bank - June 30, 2025
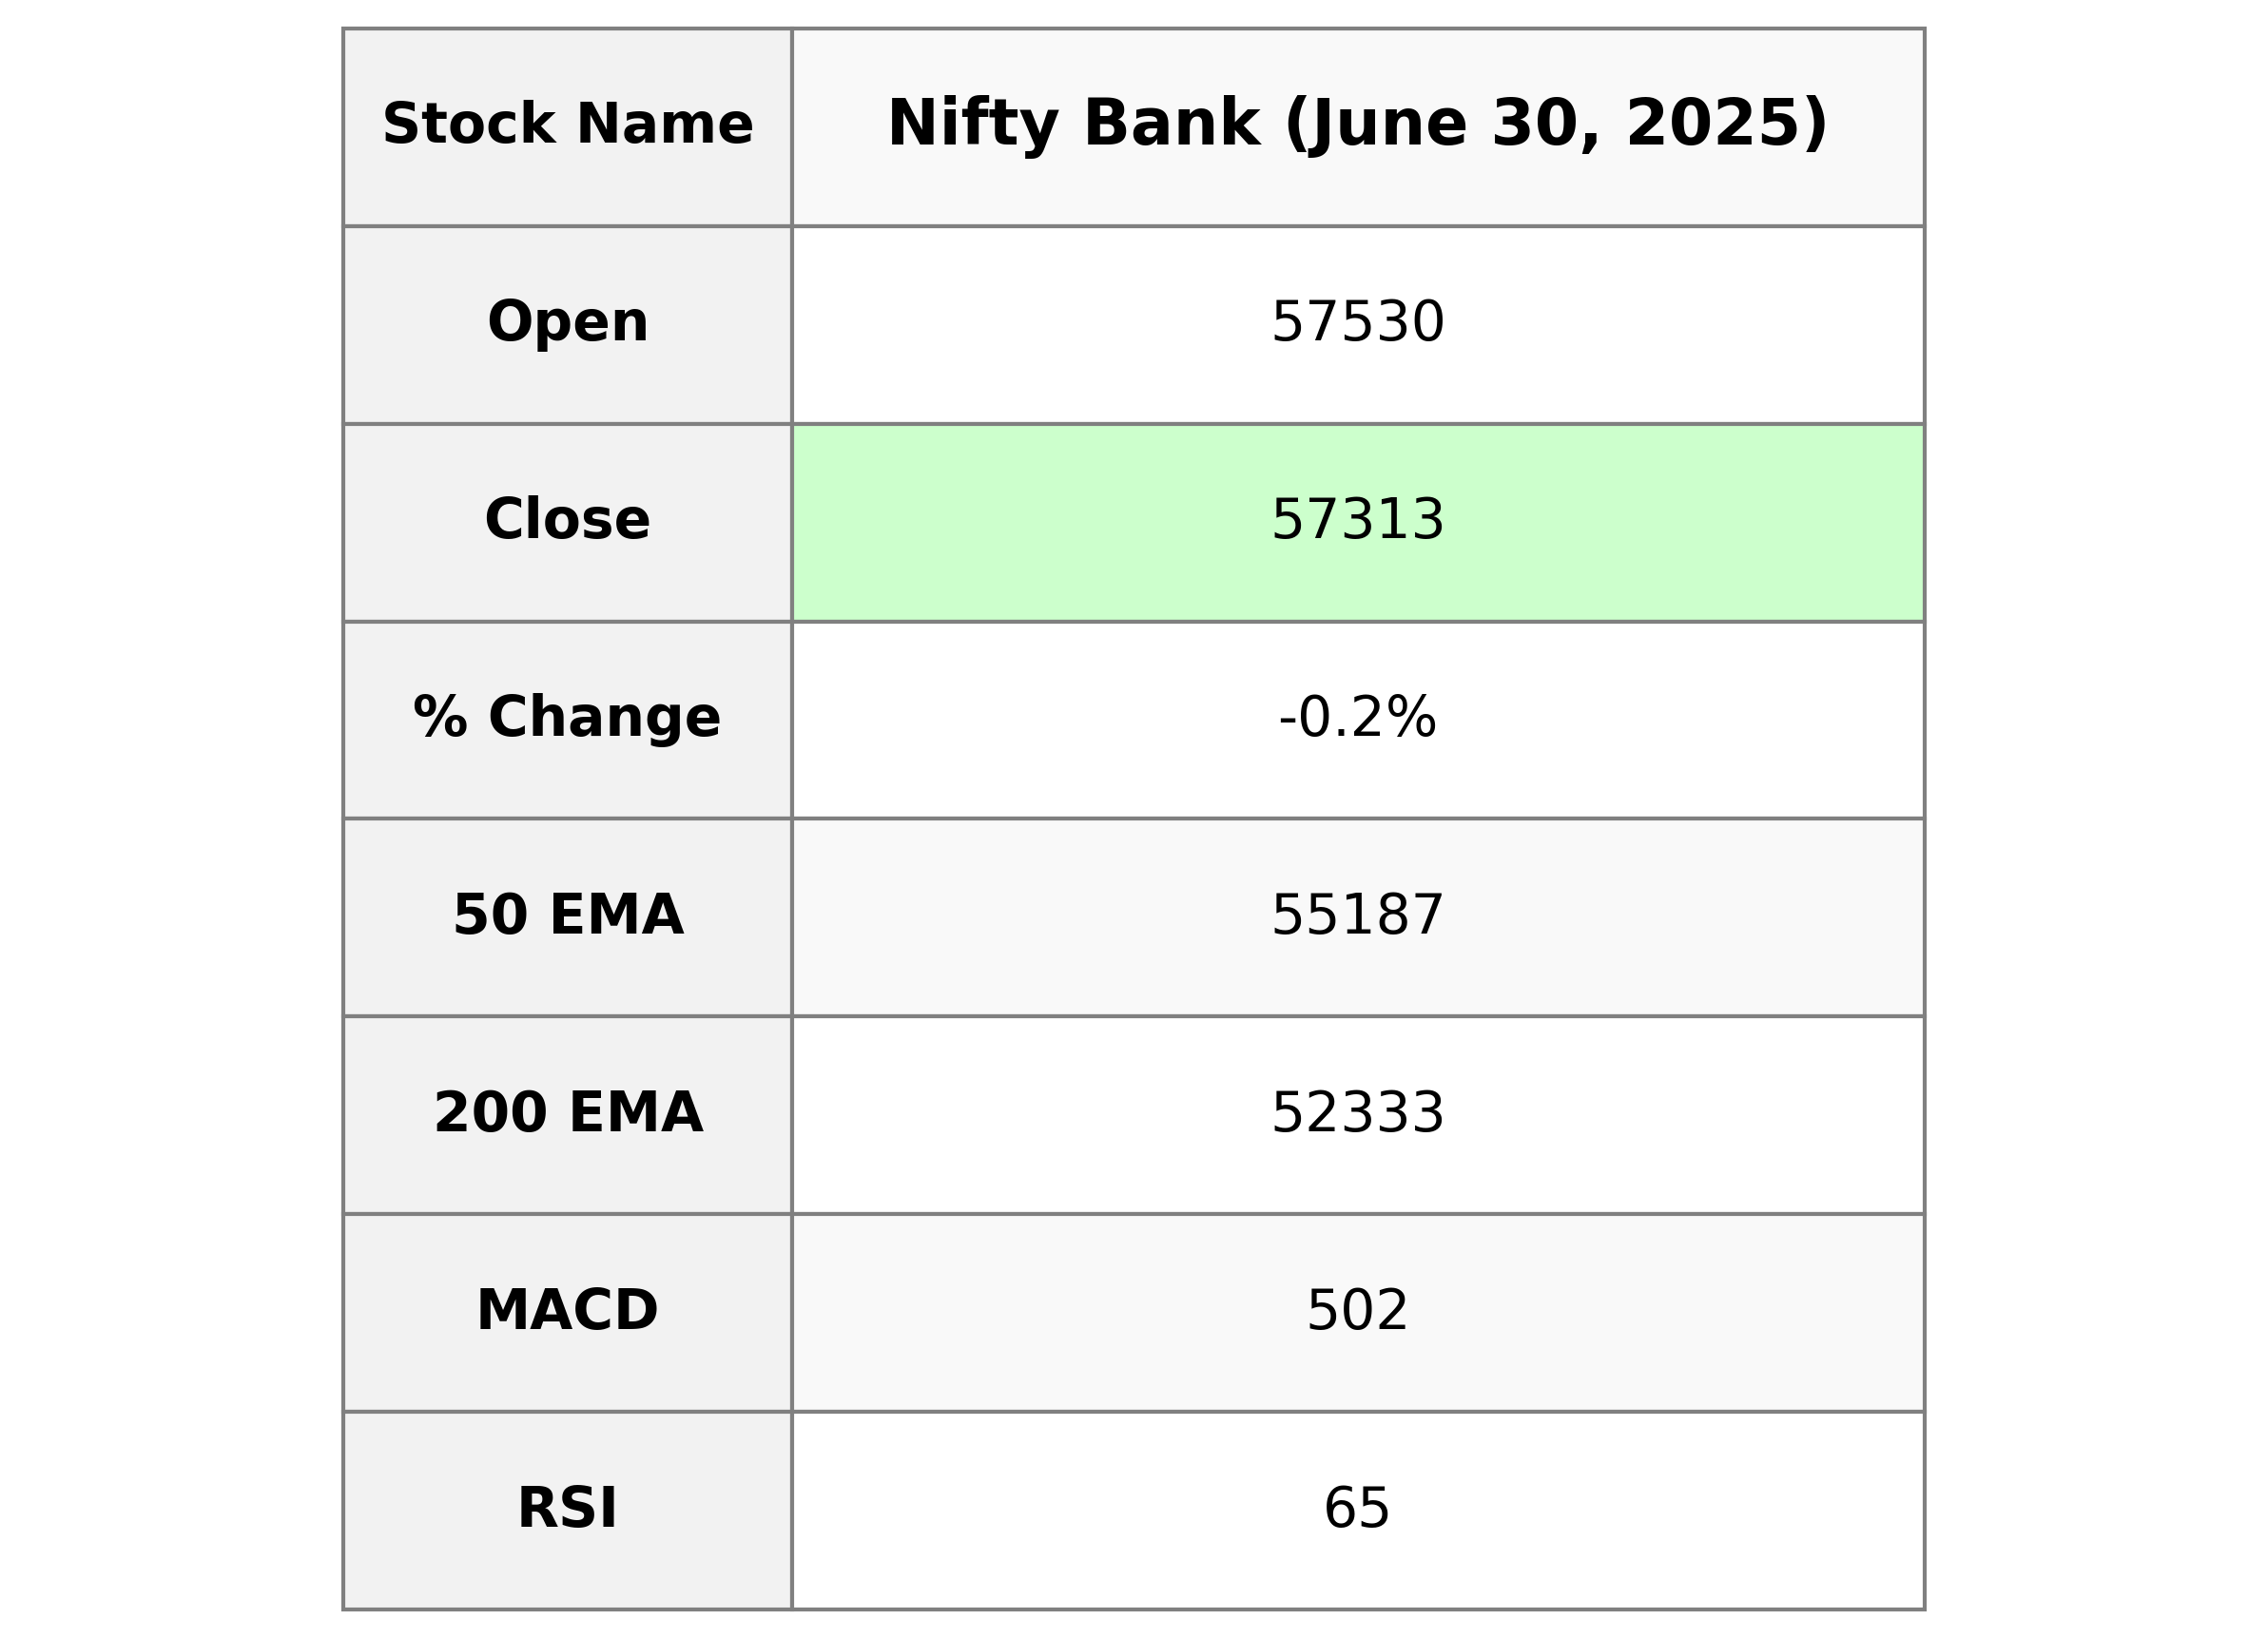
Nifty Bank opened at 57529.95 and closed at 57312.75, reflecting a slight decline of 0.23%. The index's MACD value of 501.69 is above the signal line of 419.17, suggesting a potential bullish momentum, while its RSI of 65.32 indicates that it is near overbought conditions. The 50, 200, and 10-day EMAs are at 55186.85, 52333.44, and 56685.06, respectively, highlighting a prevailing upward trend.
Relationship with Key Moving Averages
The Nifty Bank's current close of 57312.75 is above its 50-day EMA (55186.85) and 200-day EMA (52333.44), indicating an overall upward trend. However, it is below the 10-day EMA (56685.06) and 20-day EMA (56300.20), suggesting short-term weakness within an otherwise bullish context.
Moving Averages Trend (MACD)
Nifty Bank's MACD value is 501.69, which is above its signal line at 419.17, indicating potential bullish momentum. This suggests a positive trend might continue if the momentum sustains. However, investors should also consider other indicators for a comprehensive analysis.
RSI Analysis
The RSI for Nifty Bank is 65.32, which indicates a moderately overbought condition. Typically, an RSI above 70 suggests overbought conditions, while below 30 indicates oversold conditions. At this level, Nifty Bank might experience some resistance, but it is not excessively overbought yet.
Analysis for Nifty 50 - June 30, 2025
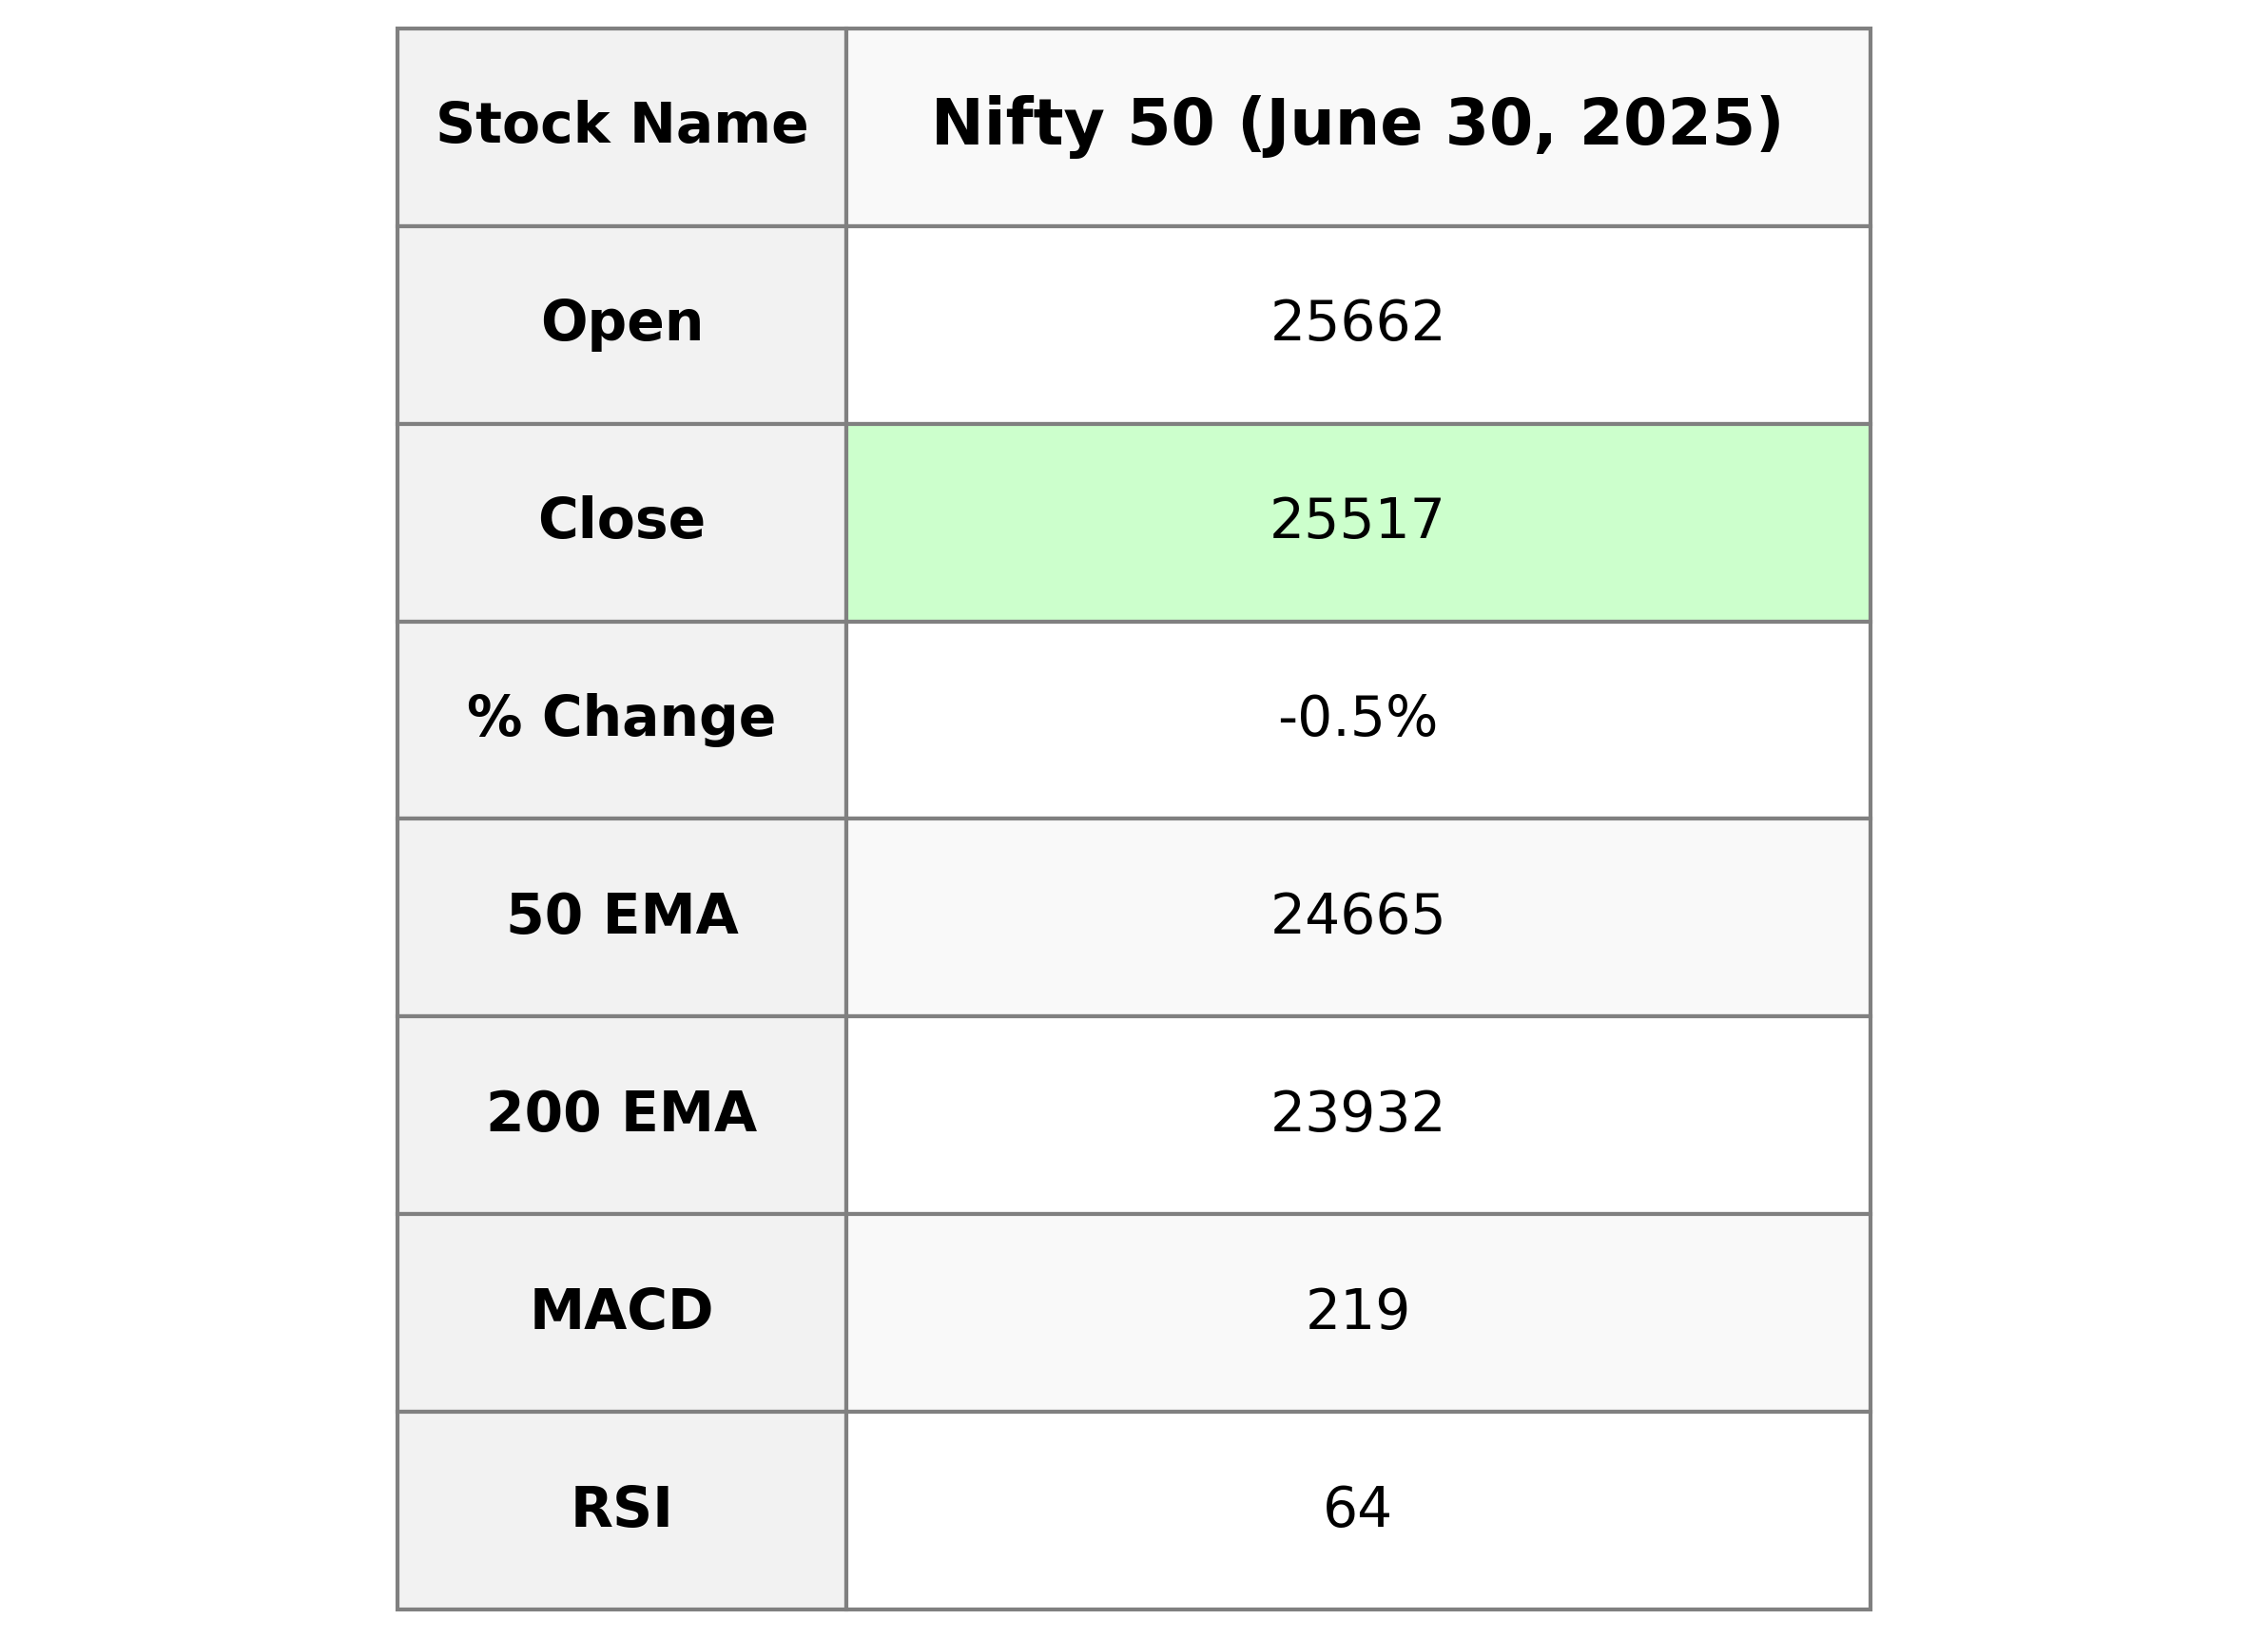
The Nifty 50 opened at 25,661.65, reached a high of 25,669.35, and closed lower at 25,517.05, marking a decline of 0.47% or 120.75 points from the previous close of 25,637.80. The RSI value stands at 63.84, indicating a potentially strong market, with MACD showing a positive divergence over its signal line.
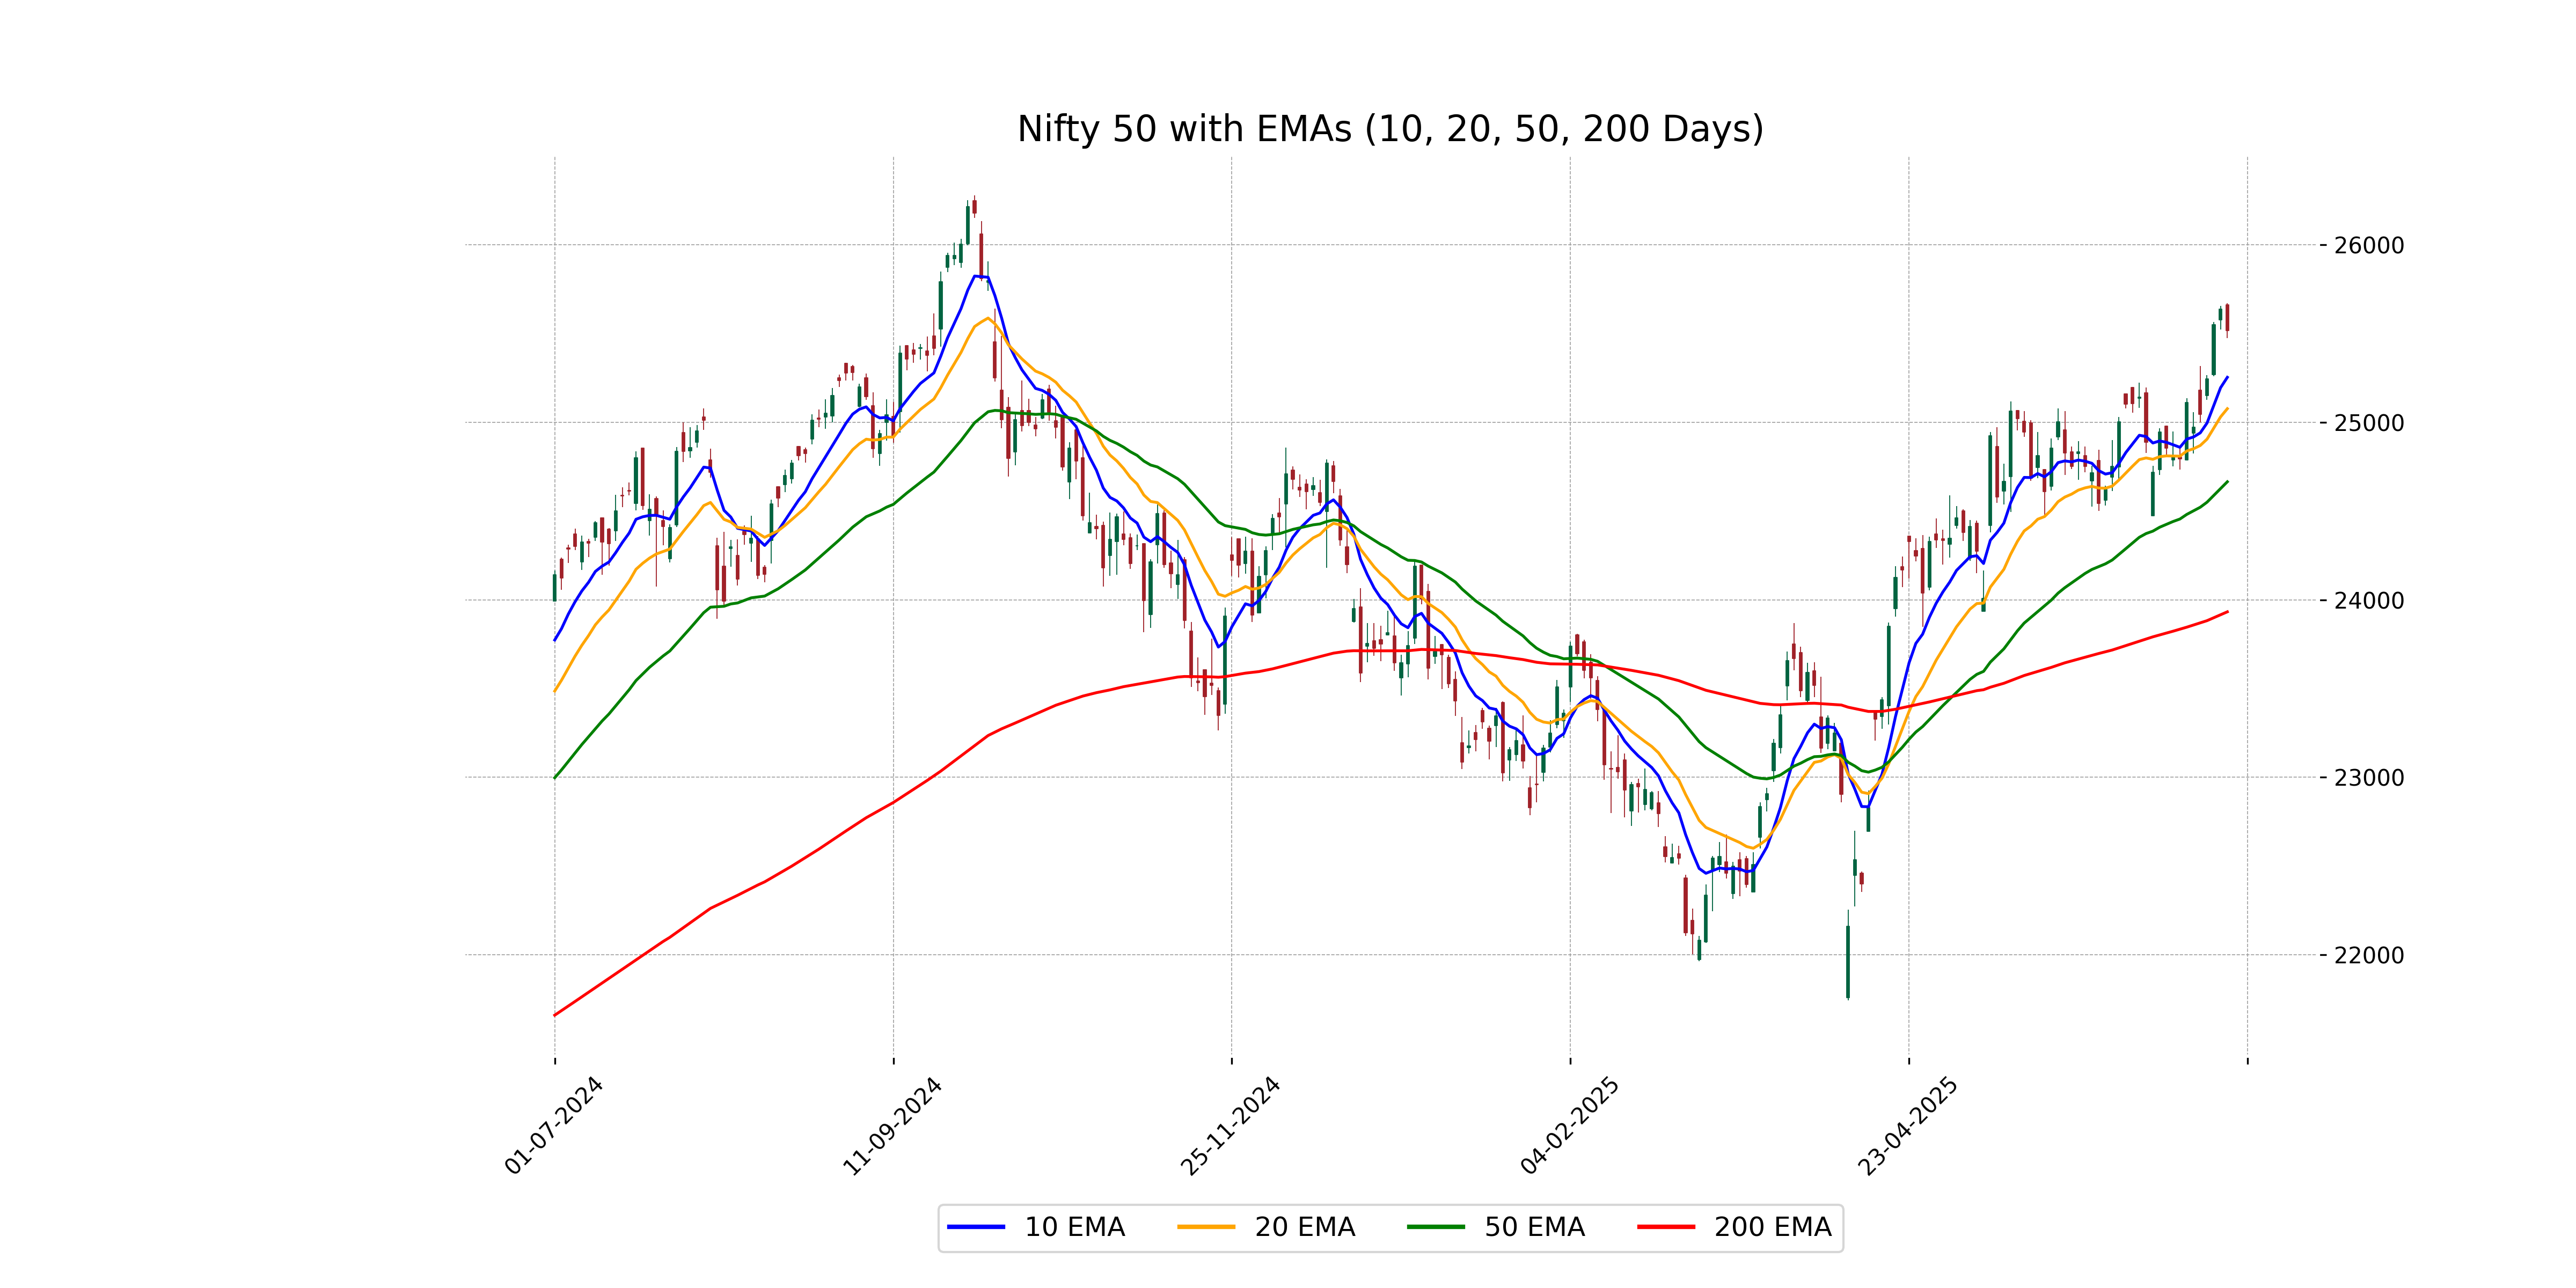
Relationship with Key Moving Averages
Nifty 50 closed at 25,517.05, which is above both its 50-day EMA of 24,664.82 and 200-day EMA of 23,932.15, indicating a potential uptrend. However, the close is slightly above the 10-day EMA of 25,253.33 and 20-day EMA of 25,076.62, suggesting recent strength in price movement.
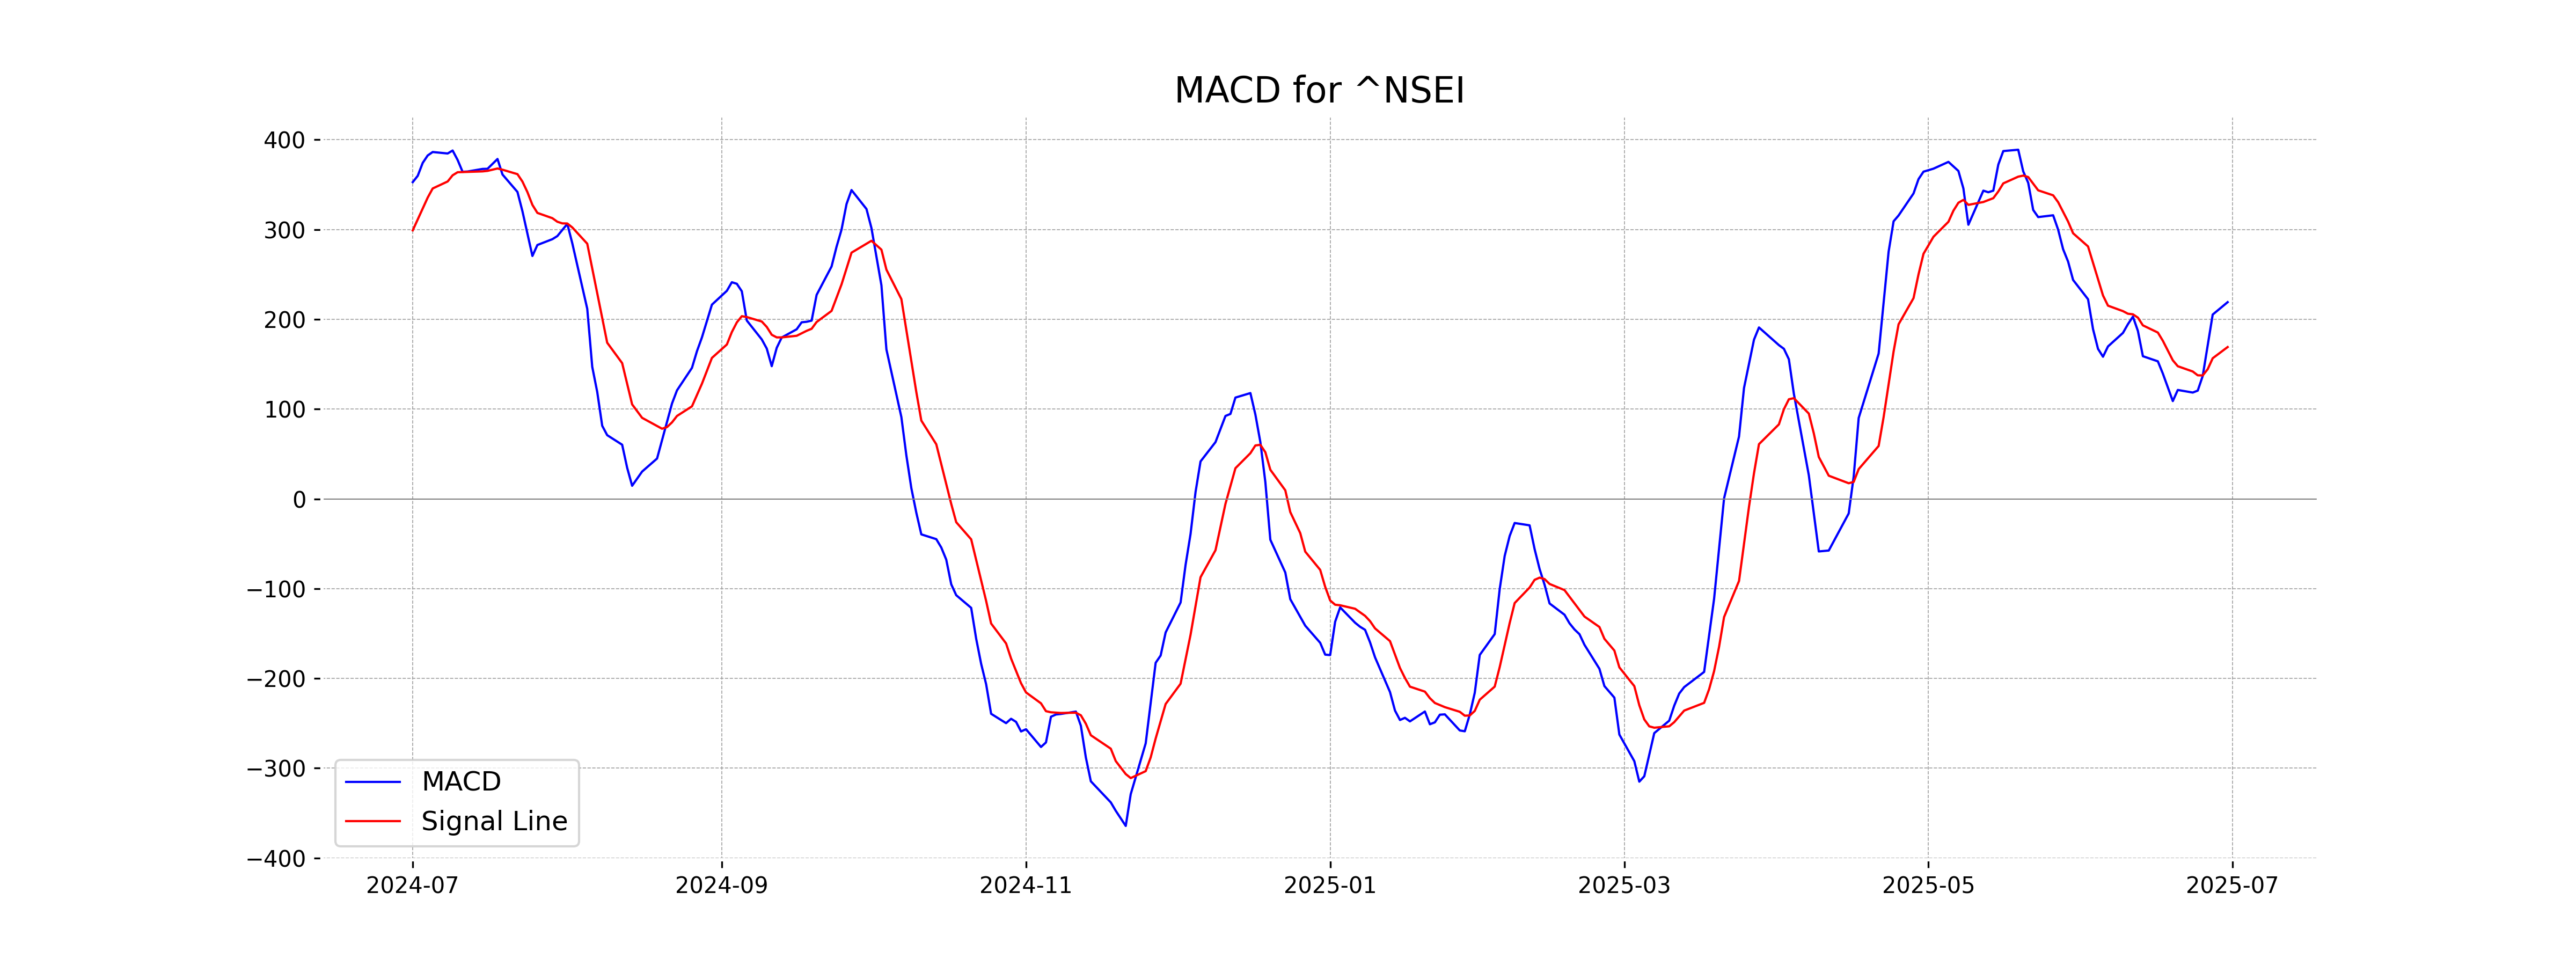
Moving Averages Trend (MACD)
MACD Analysis for Nifty 50: The MACD value for Nifty 50 is 219.13, which is above the MACD Signal of 169.13. This indicates a potential bullish trend as the MACD line is above the signal line, suggesting upward momentum.
RSI Analysis
The RSI value for Nifty 50 is 63.84, which indicates that the market is nearing overbought conditions. Typically, an RSI above 70 suggests overbought conditions, while an RSI below 30 indicates oversold conditions. As it stands, traders might monitor for potential price corrections if RSI continues to rise.