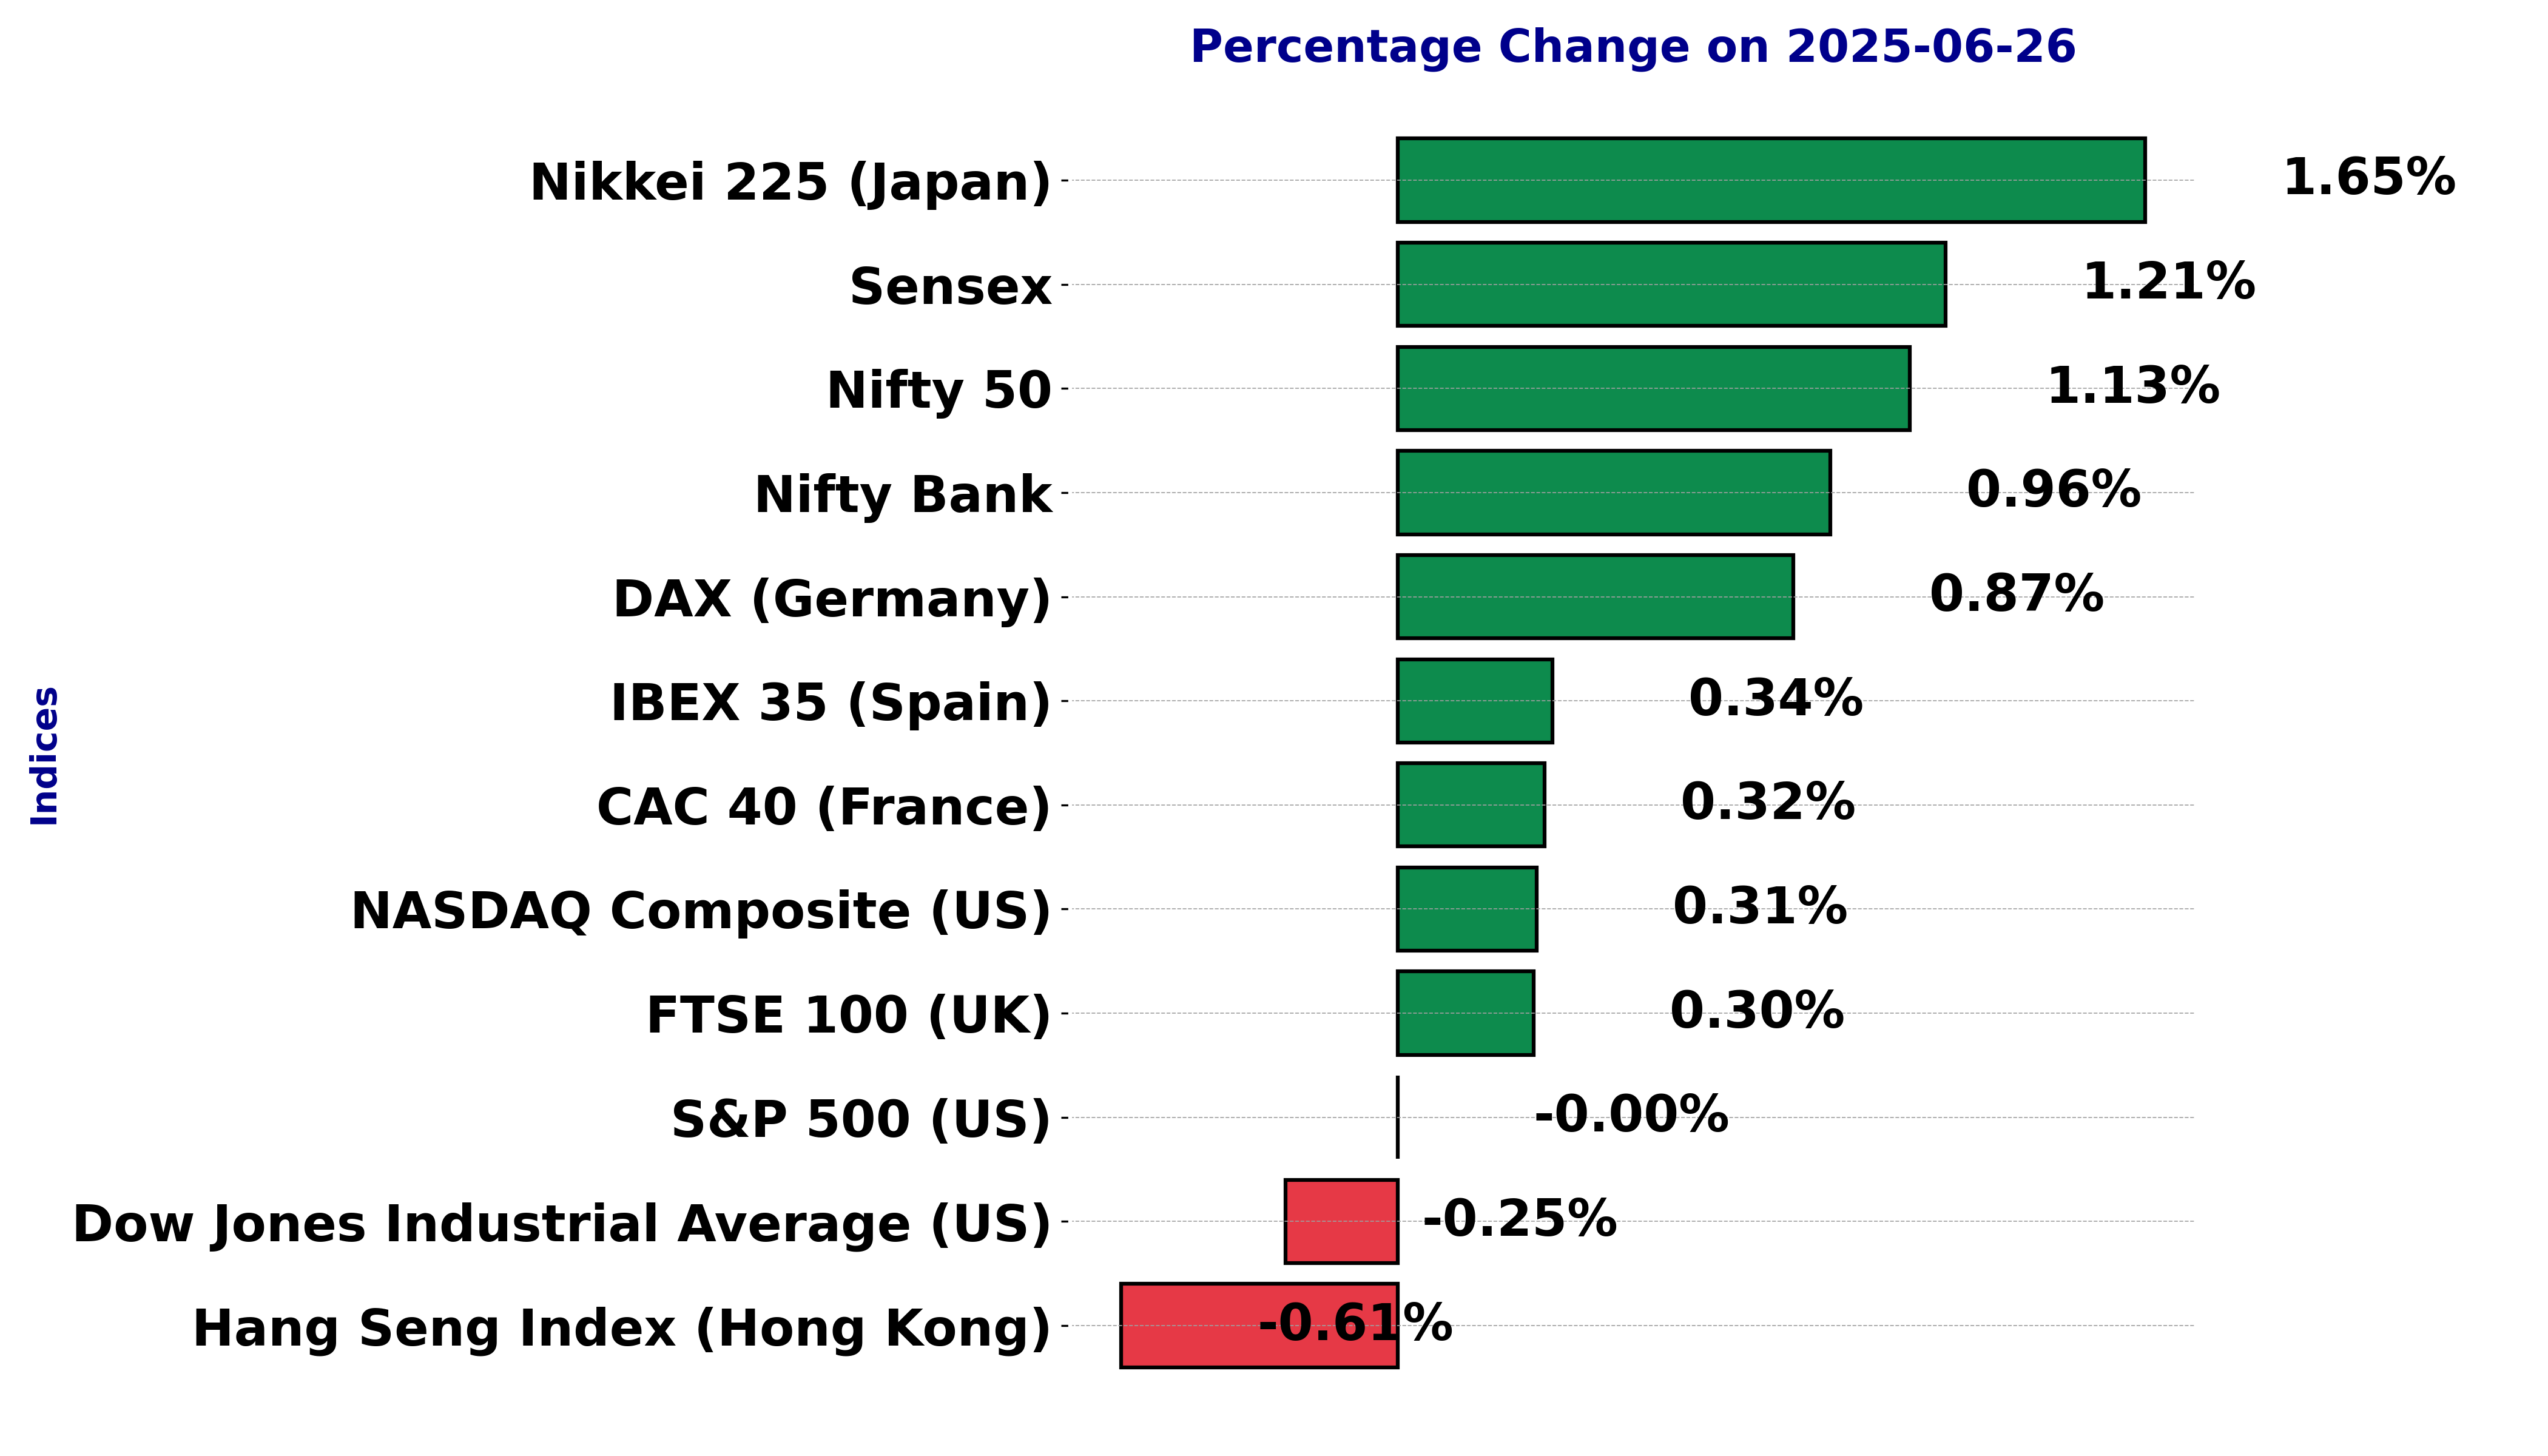
Global stock market indices: How the world markets performed today - 26 June 2025
The international stock market indices showed varied performances on June 26, 2025, reflecting the economic sentiment across different regions.
In this article, we analyze the performance of key global indices including the S&P 500, Dow Jones Industrial Average, NASDAQ Composite, FTSE 100, DAX, CAC 40, IBEX 35, Nikkei 225, Hang Seng, Nifty 50, and BSE Sensex.
Analysis for Sensex - June 26, 2025
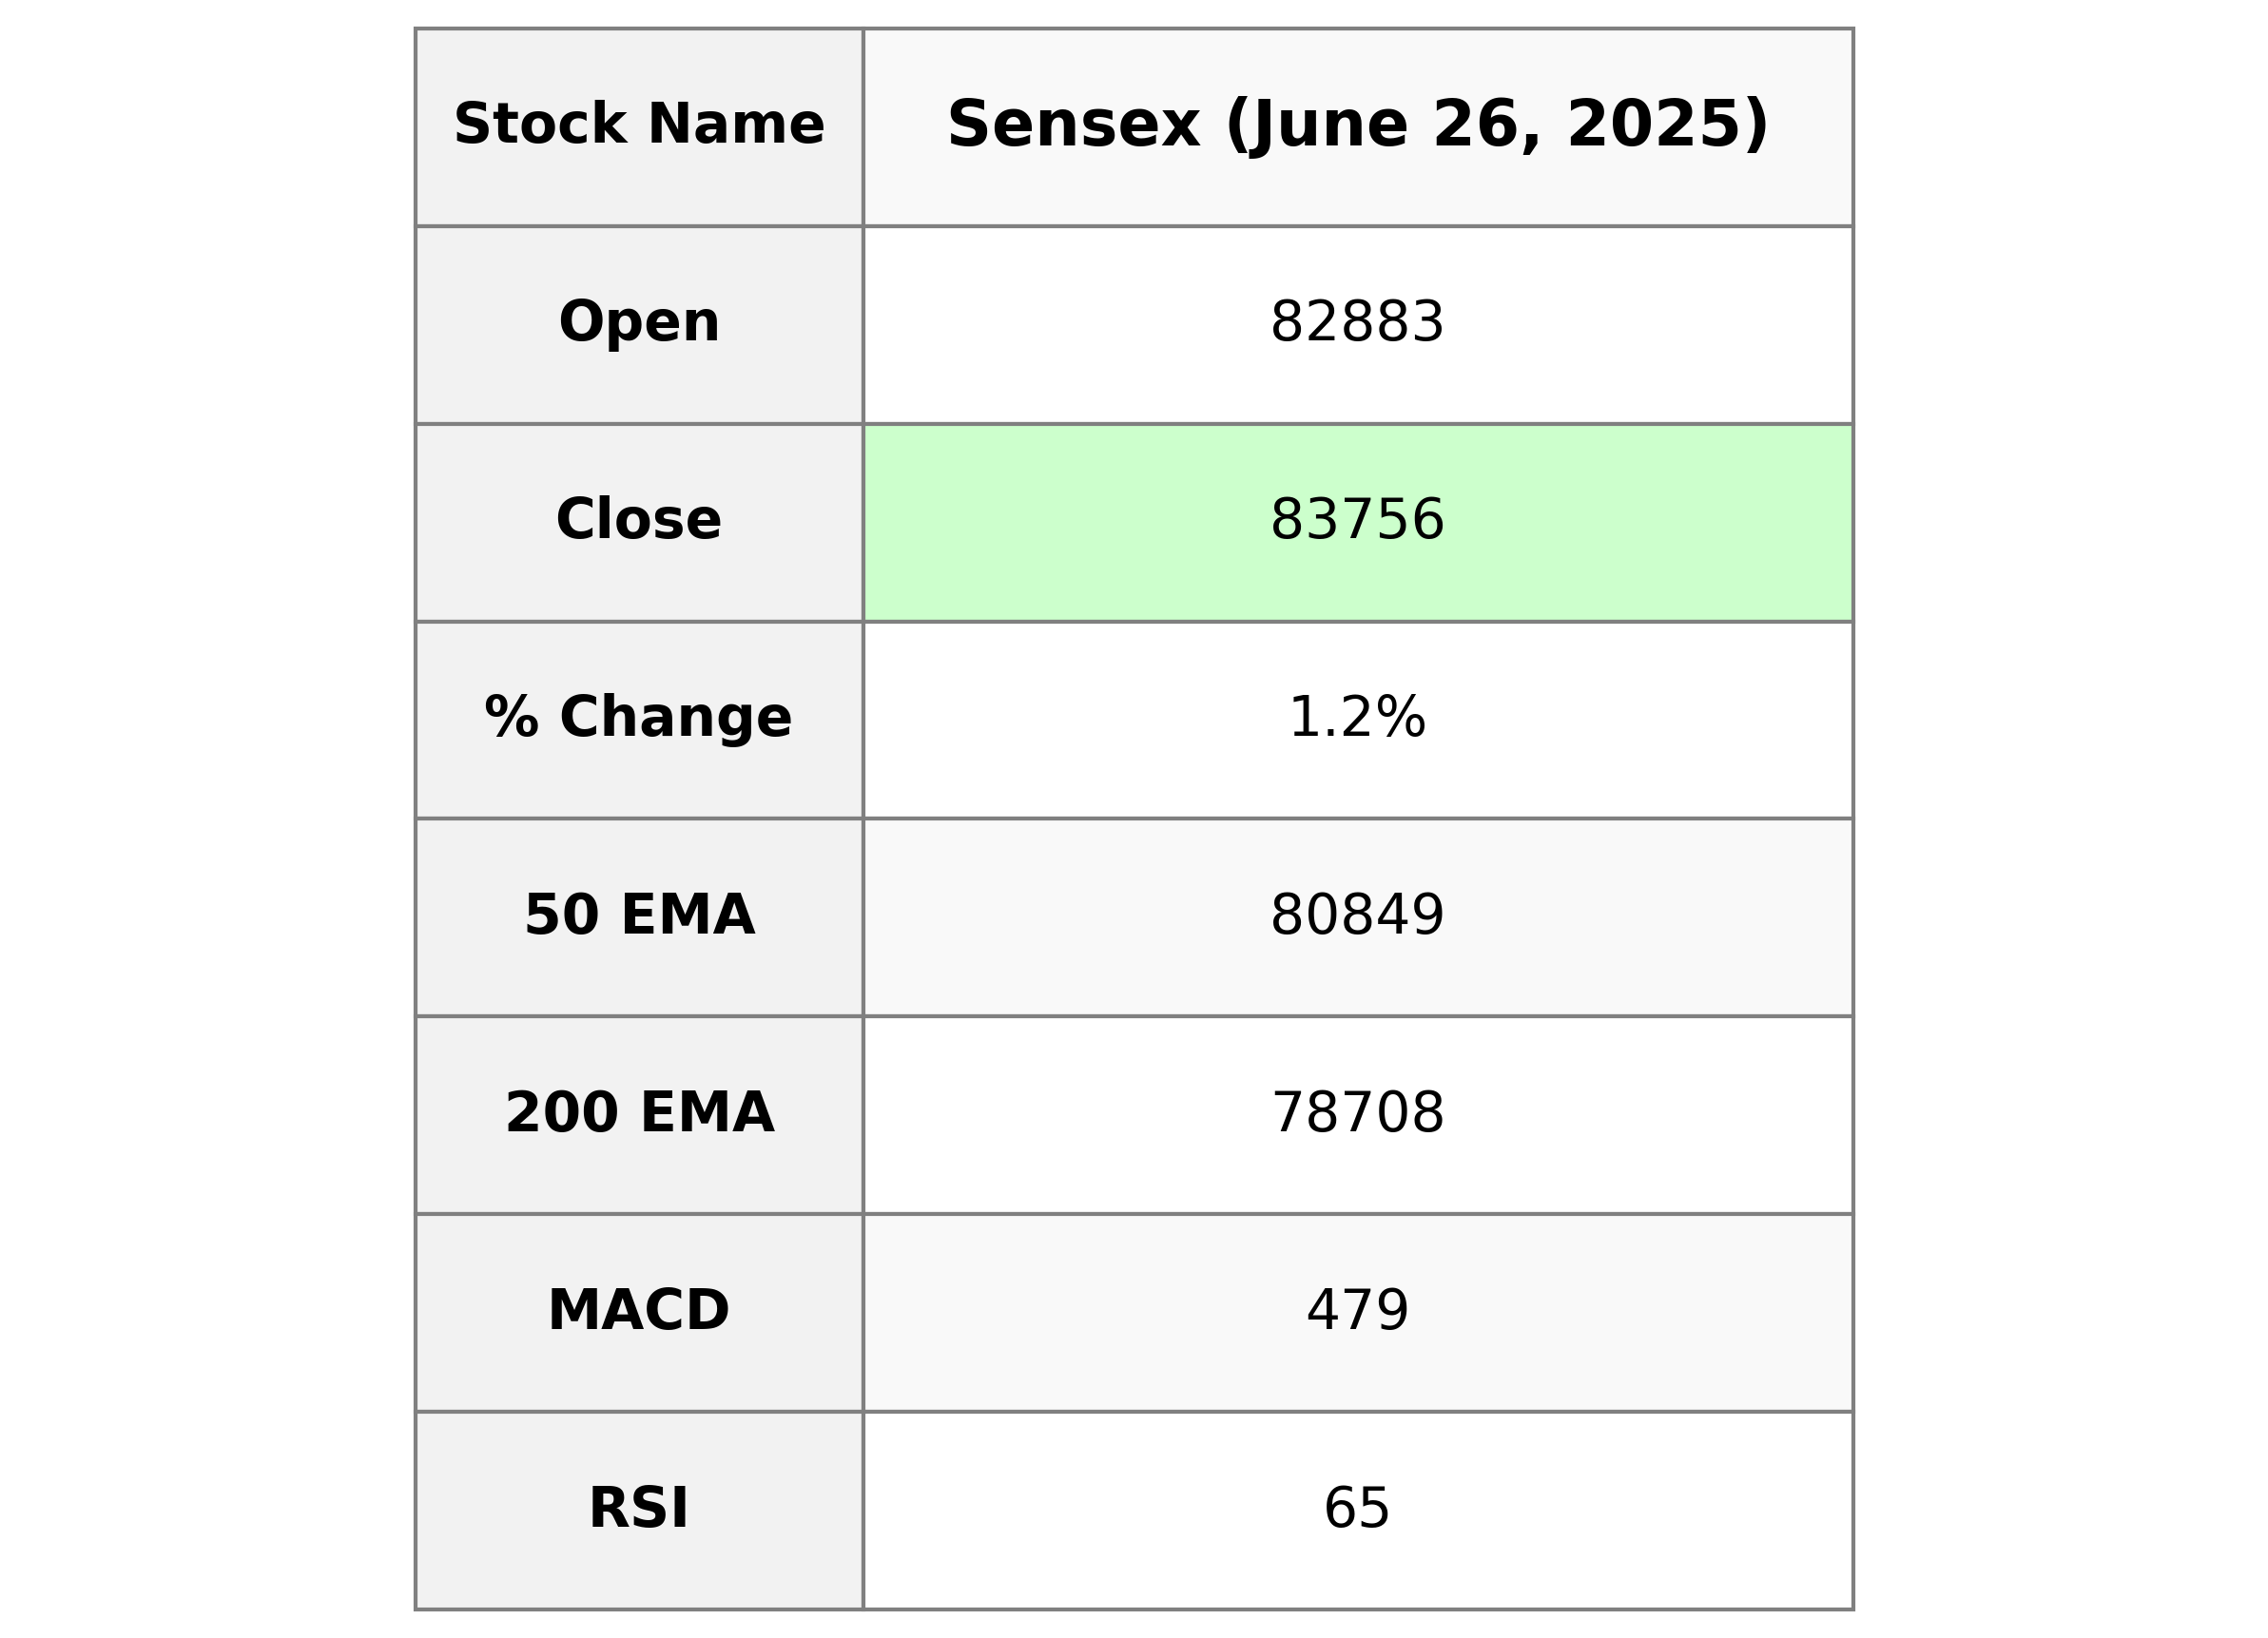
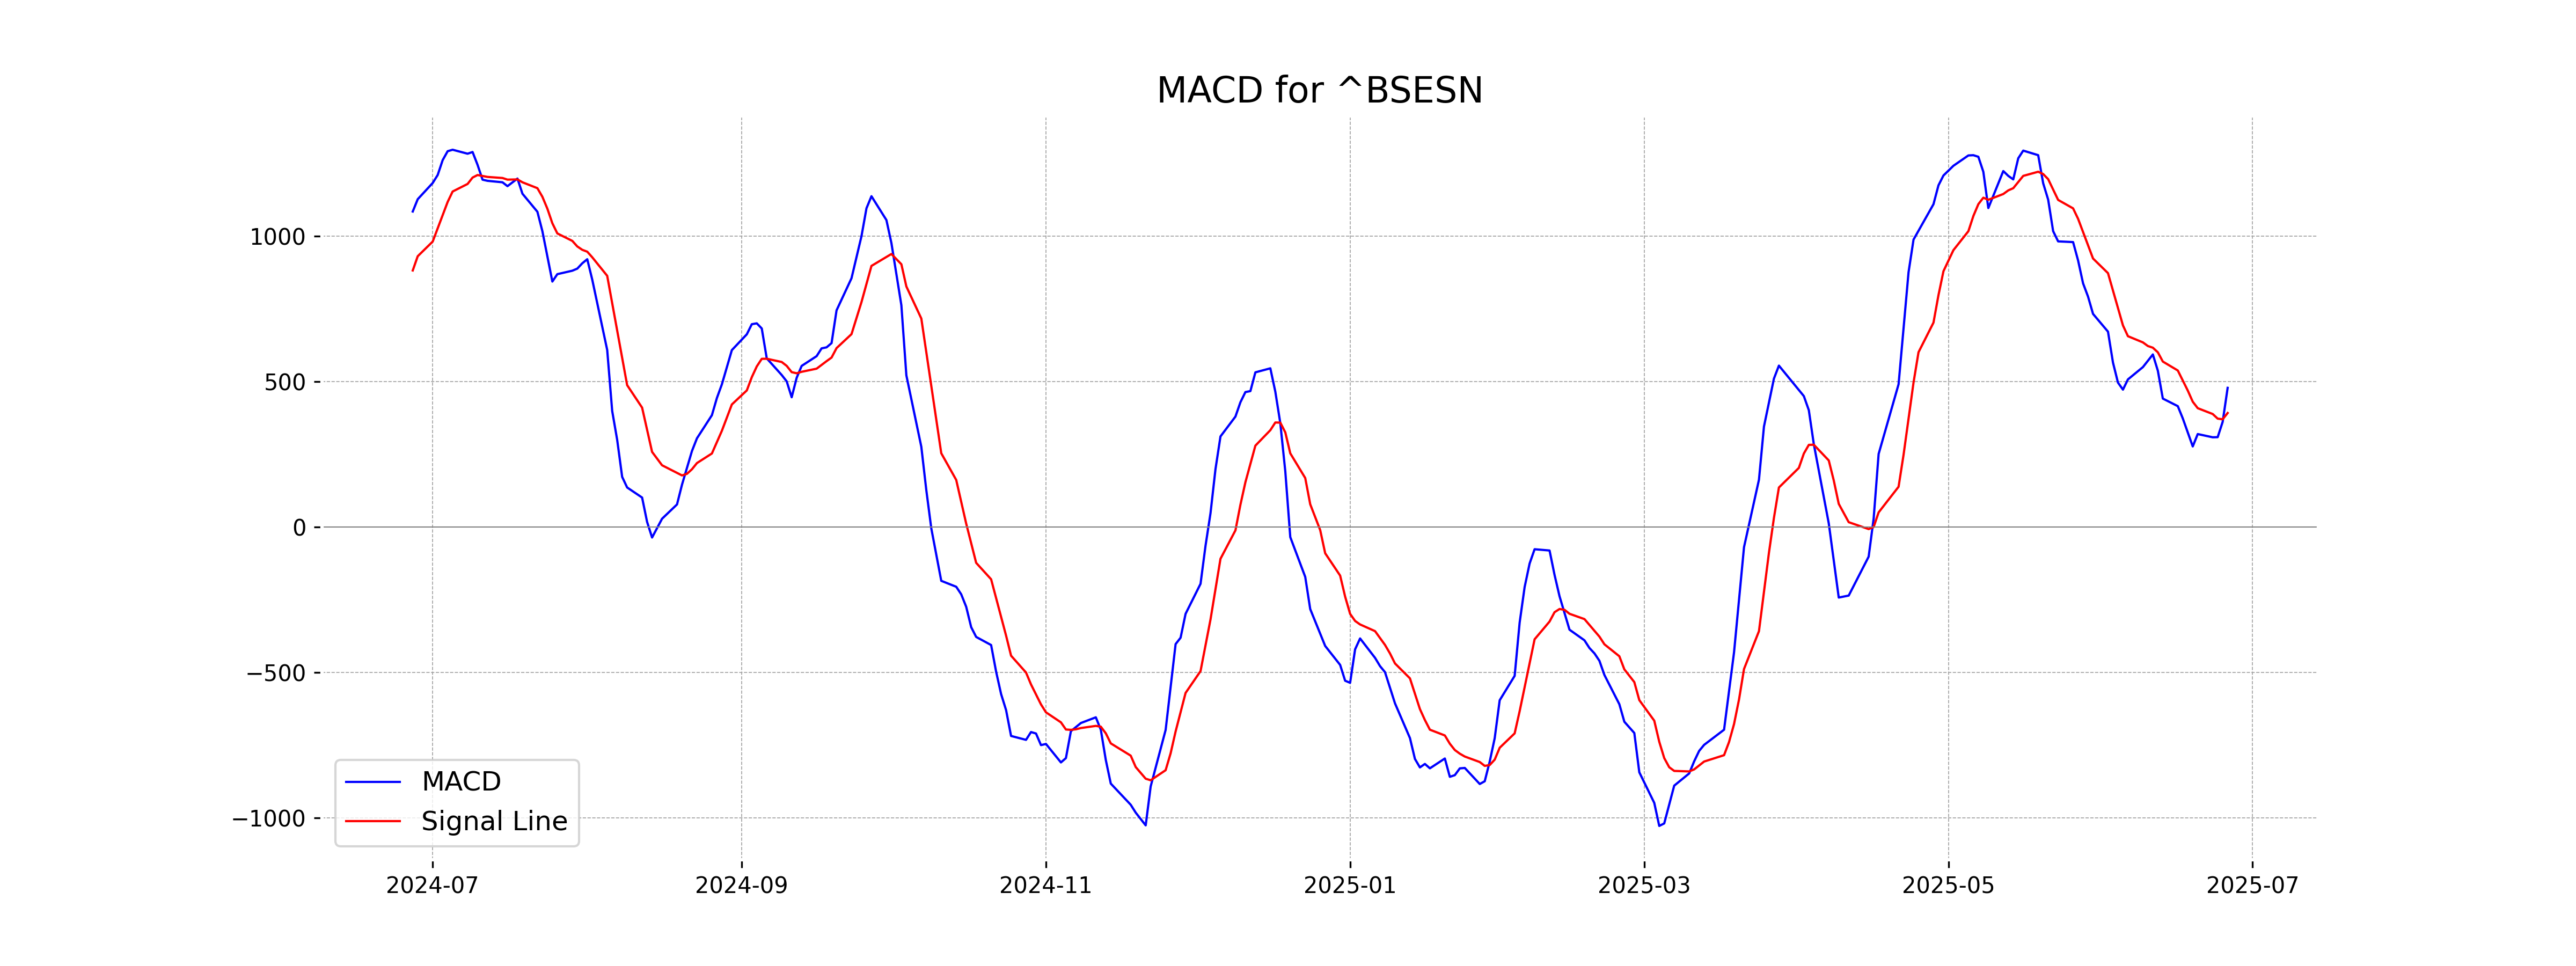
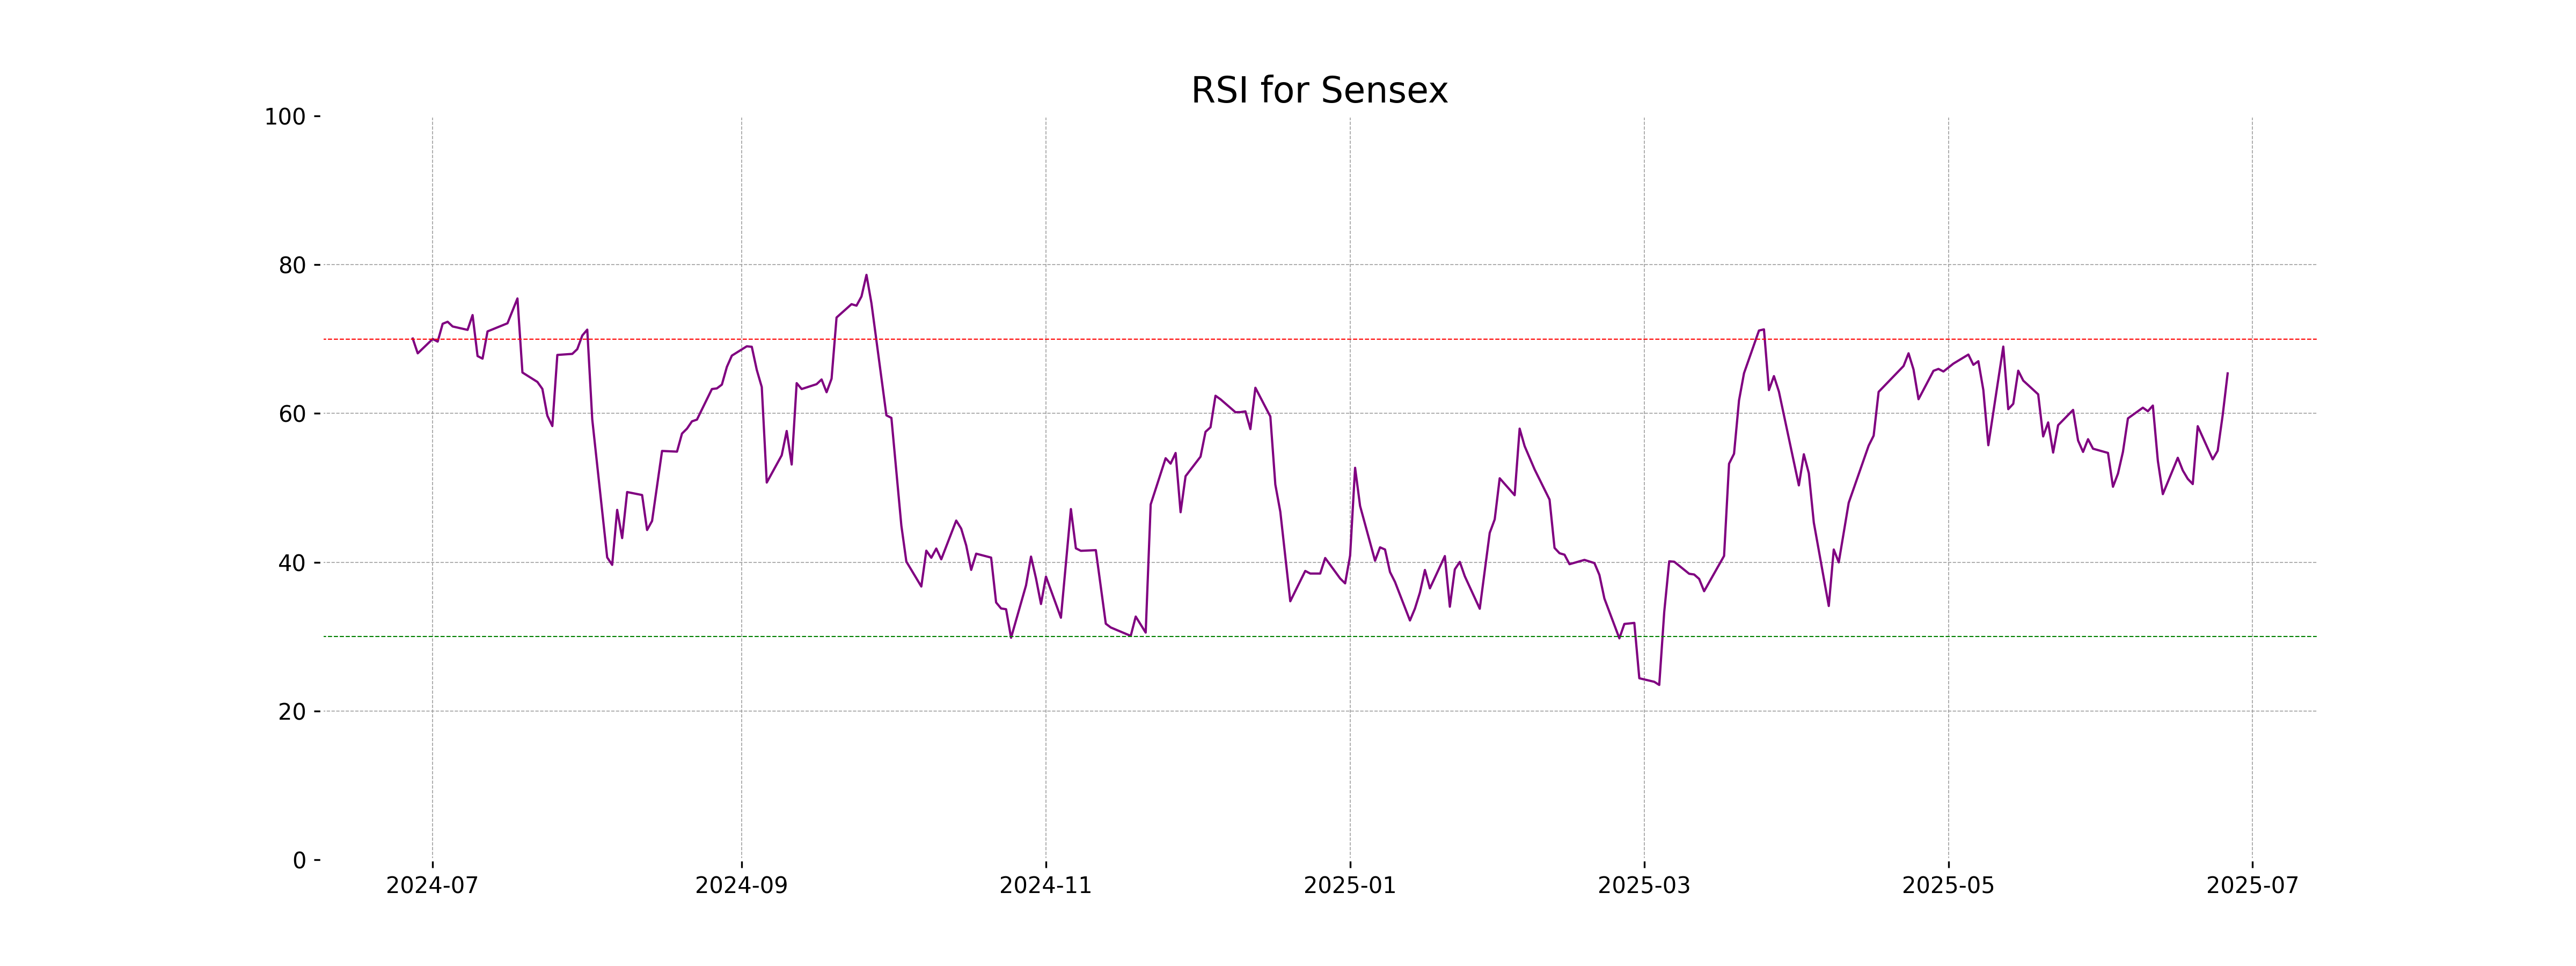
Sensex opened at 82,883 and closed at 83,756, showing a gain with a 1.21% increase. The index experienced a high of 83,805 and a low of 82,816. Technical indicators show a relatively strong RSI of 65.39, suggesting a bullish trend, and a positive MACD of 479.10 compared to its signal line.
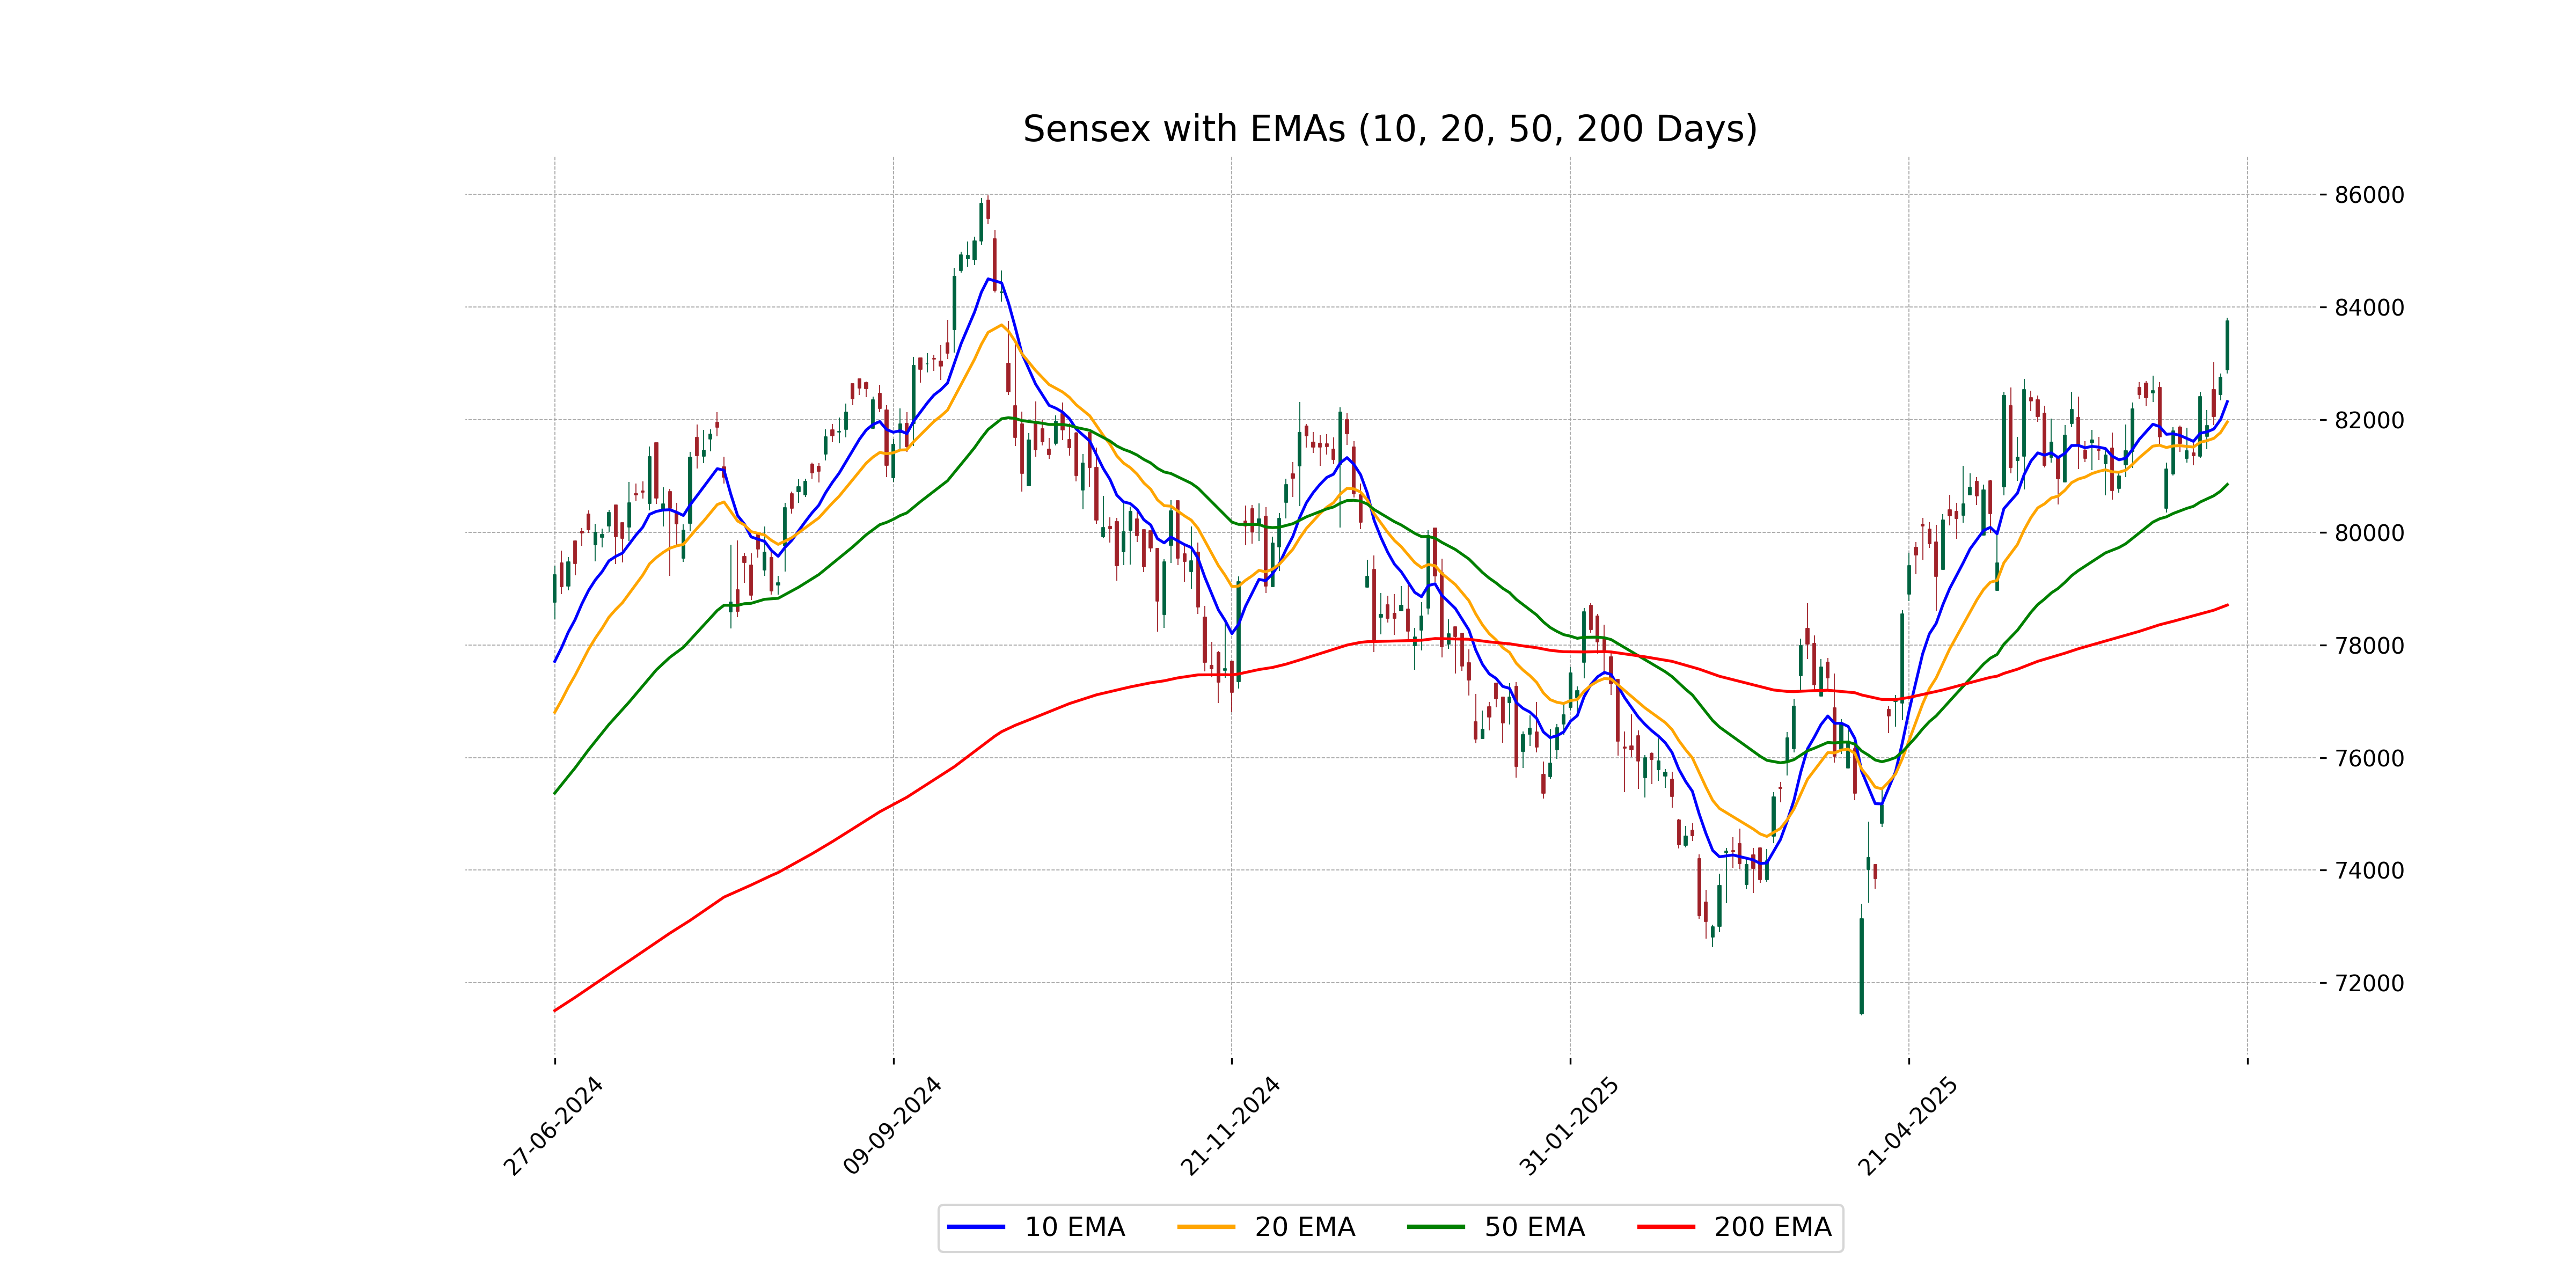
Relationship with Key Moving Averages
The Sensex closed at 83,755.87, which is above its 50-day EMA of 80,849.01 and 200-day EMA of 78,707.76, indicating a bullish trend. It is also higher than the 10-day EMA of 82,319.54 and the 20-day EMA of 81,959.59, suggesting short-term upward momentum.
Moving Averages Trend (MACD)
The current MACD for Sensex is 479.10, while the MACD Signal is 392.59. The positive MACD value and the MACD line being above the signal line indicate a bullish trend. This suggests potential upward momentum in the market.
RSI Analysis
The RSI value for Sensex stands at 65.39, suggesting it is approaching overbought territory. Typically, an RSI above 70 indicates an overbought condition, which could lead to a potential price correction. Investors may want to monitor this level closely for any indications of a trend reversal.
Analysis for Dow Jones Industrial Average (US) - June 26, 2025
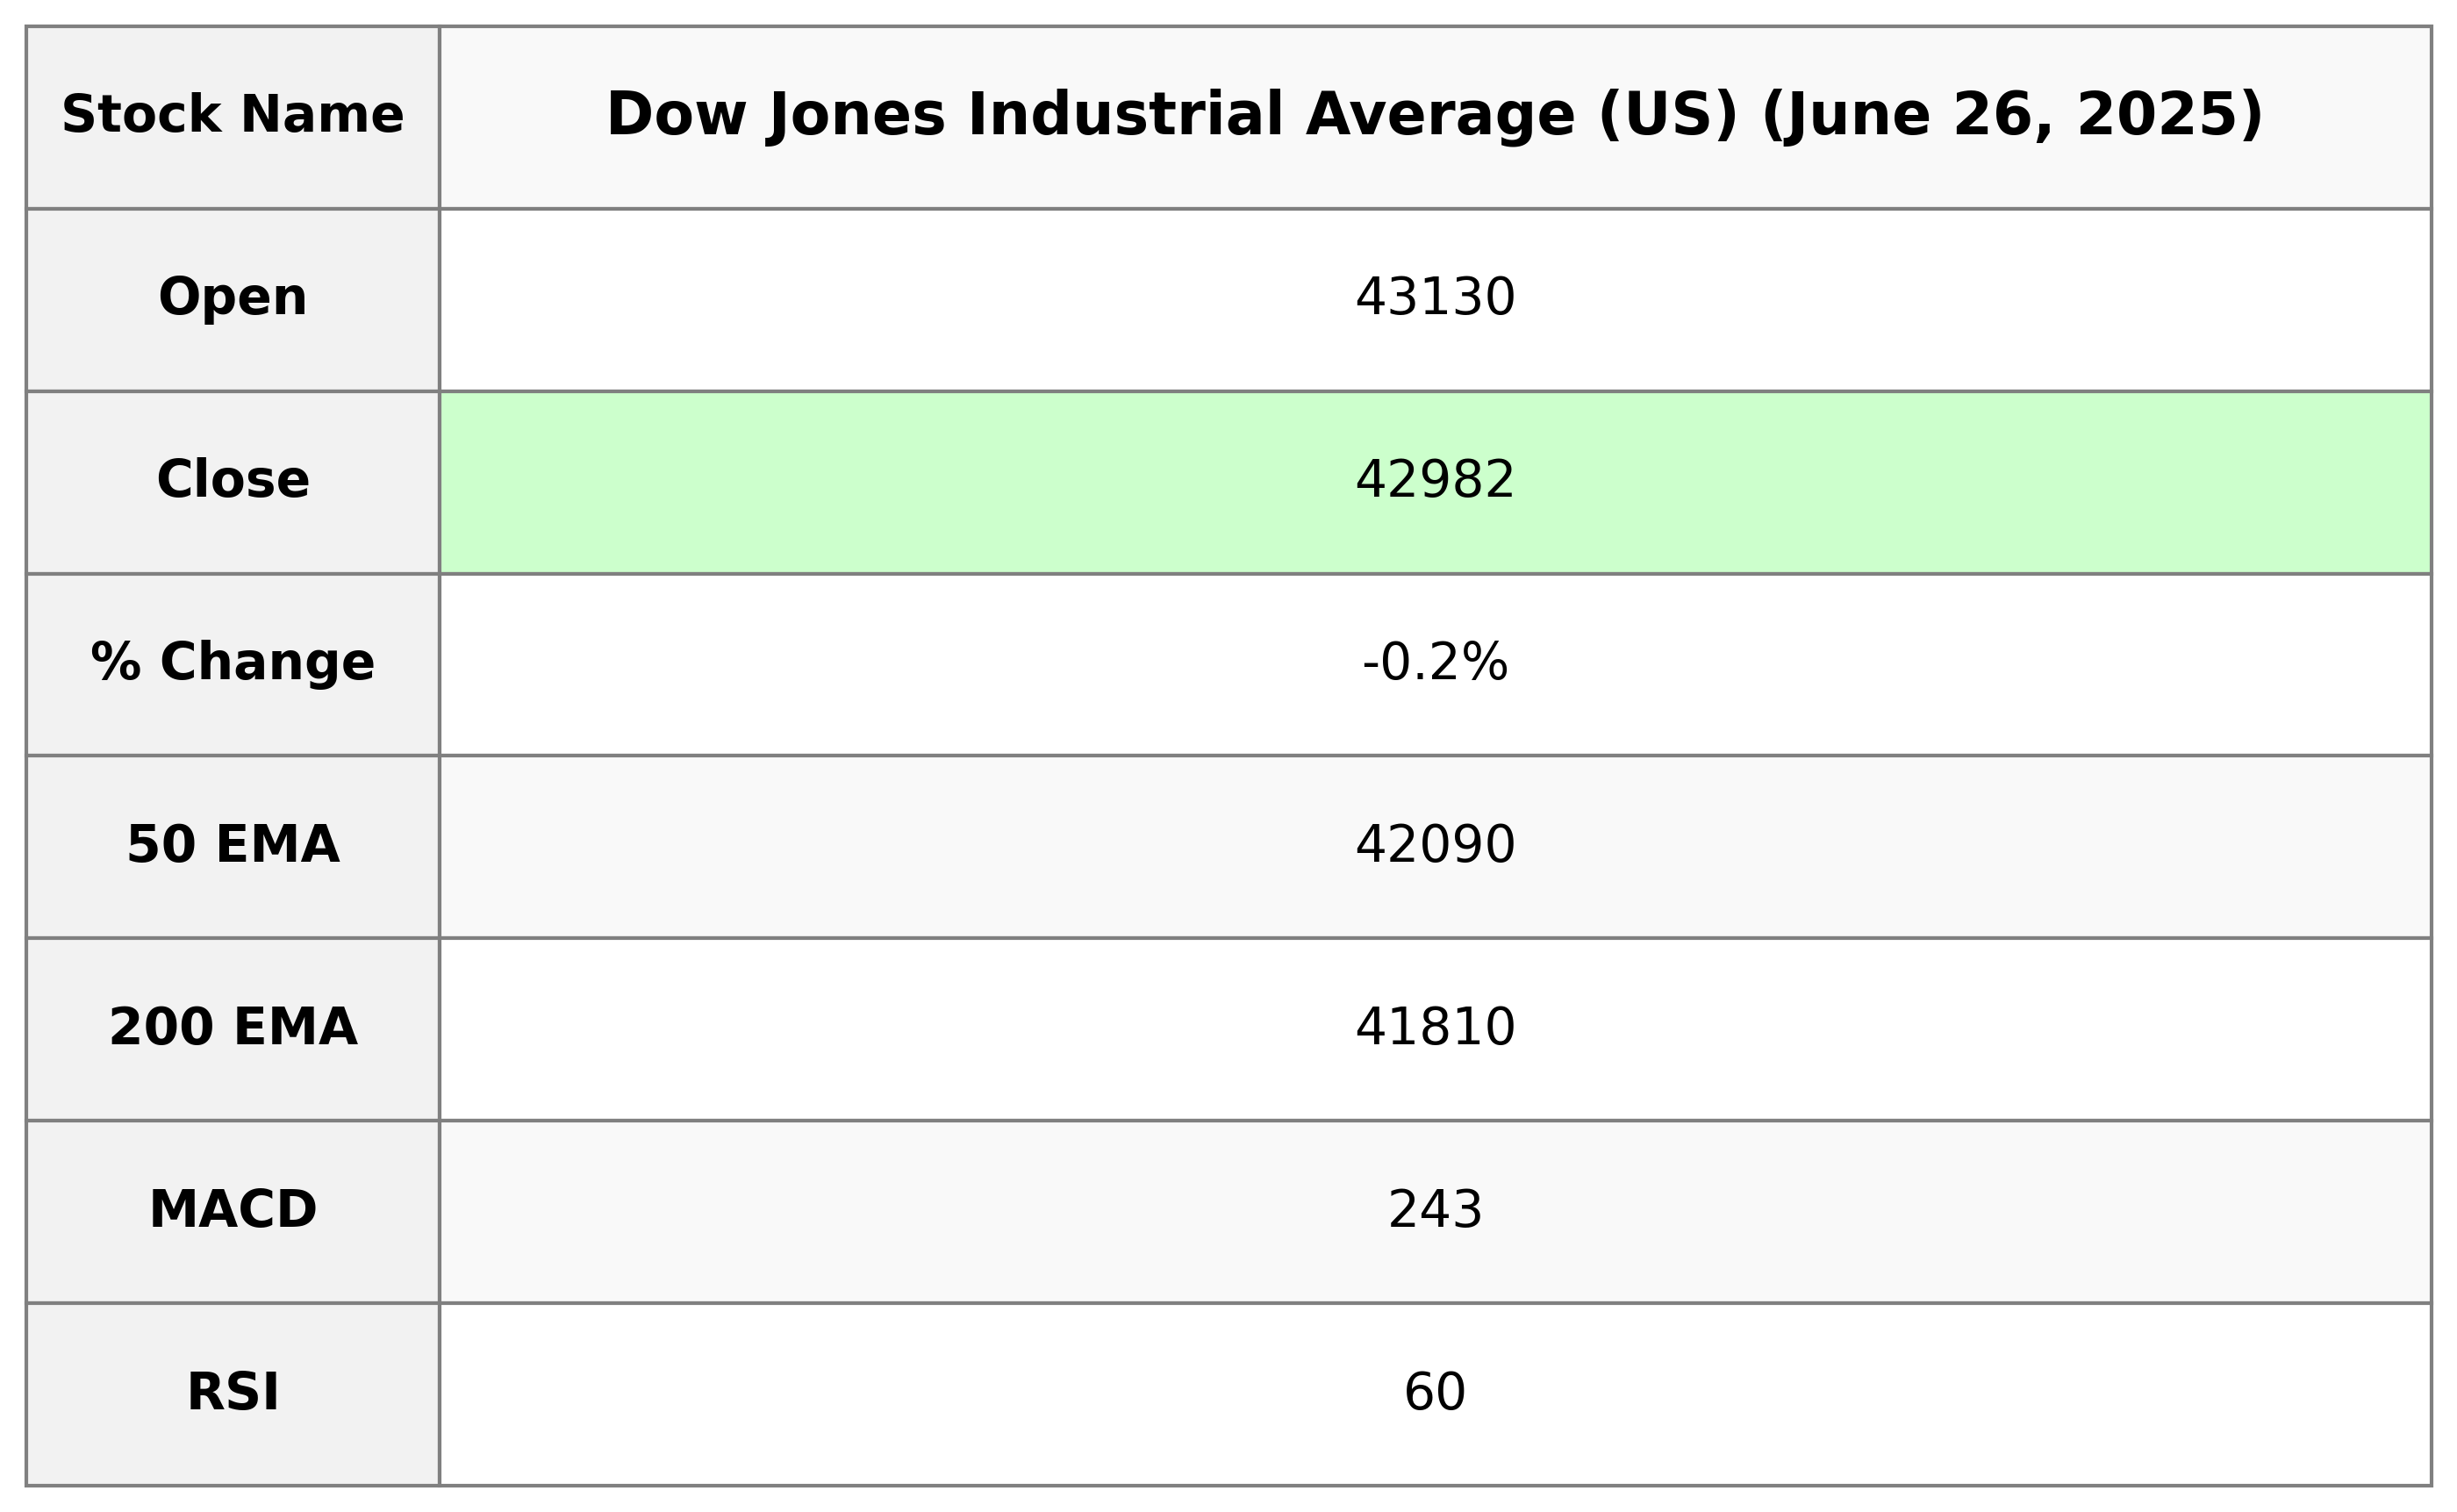
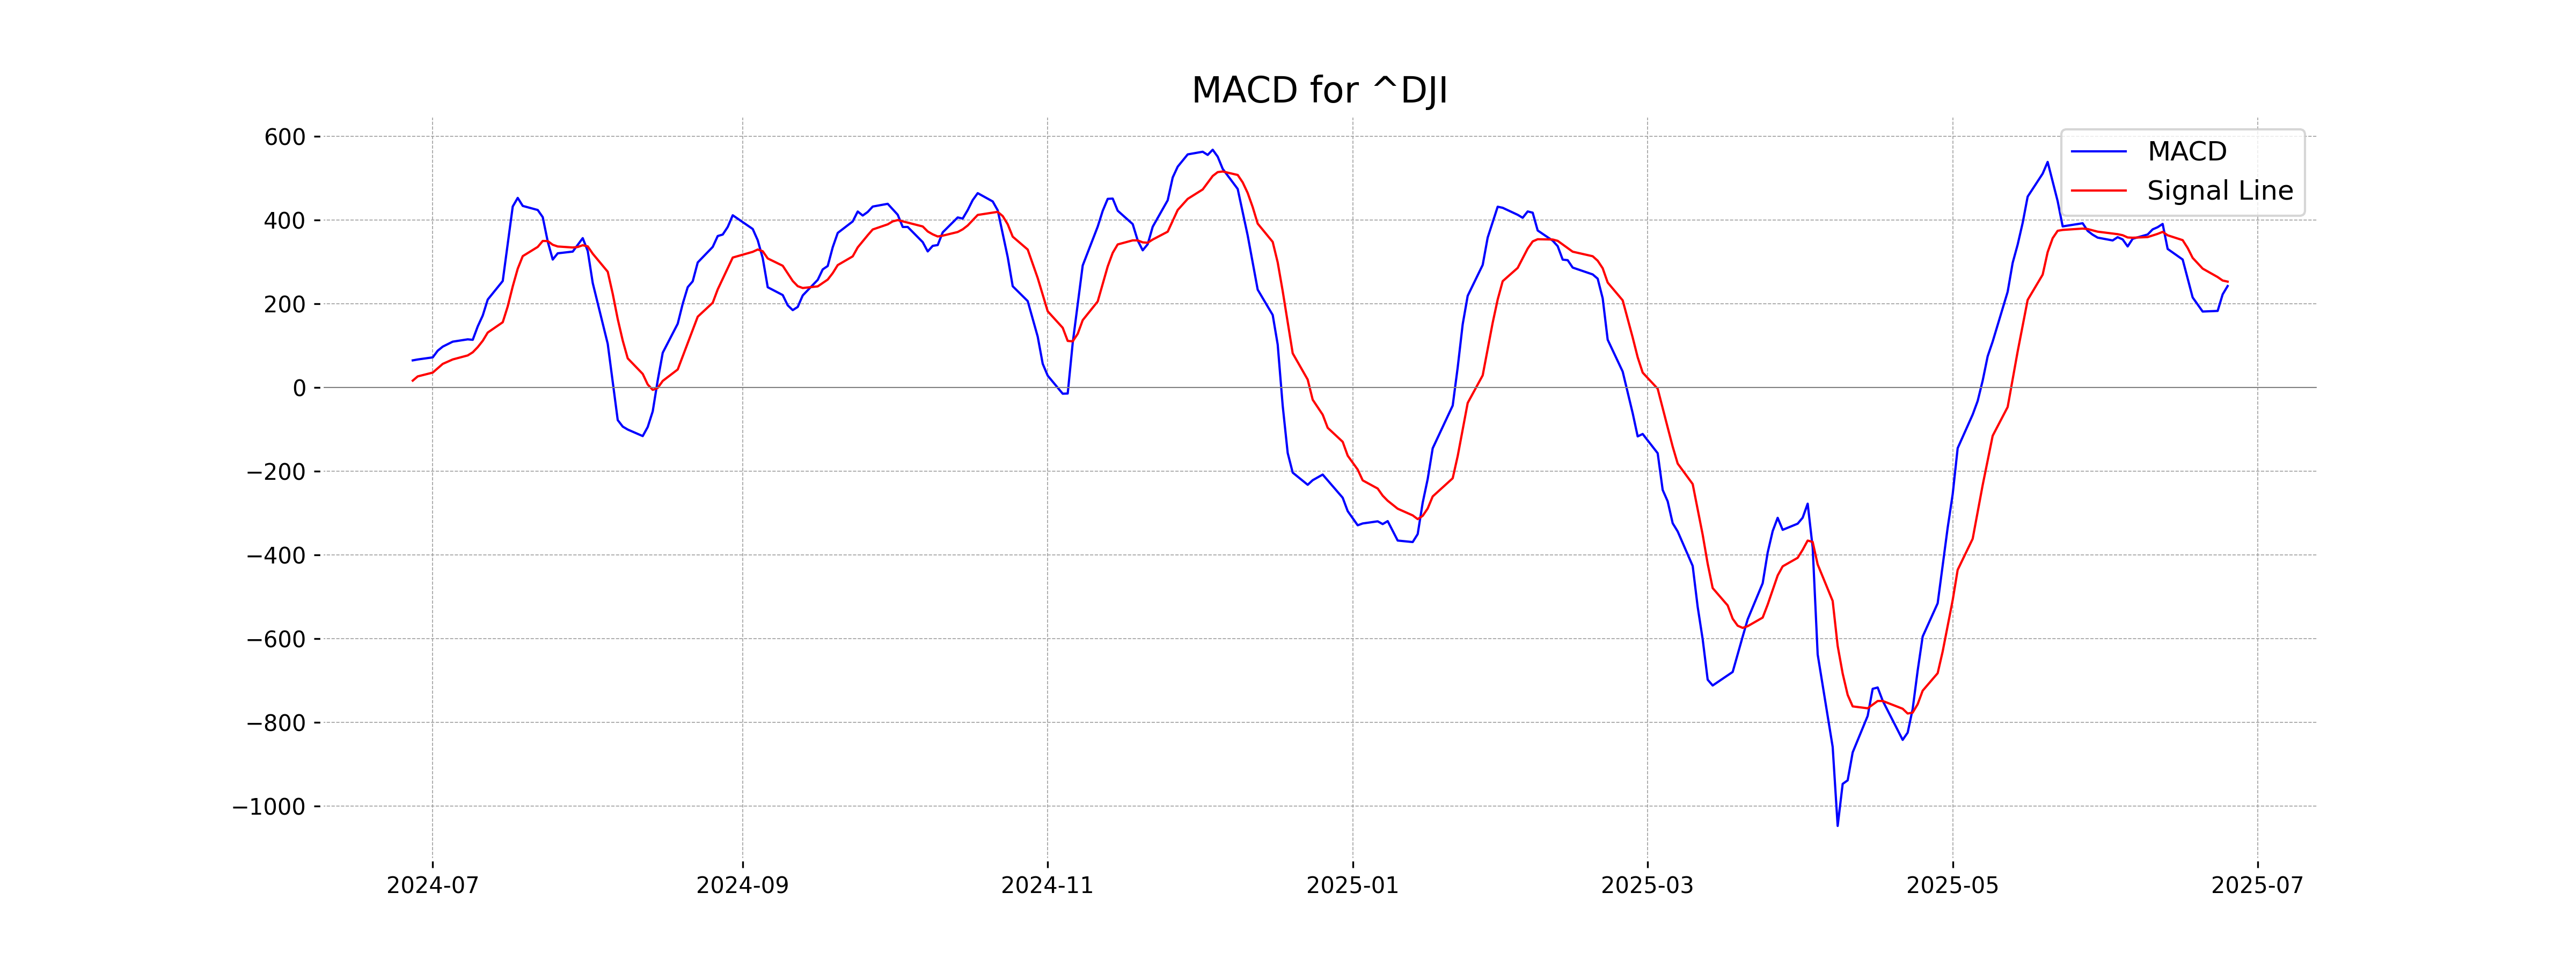
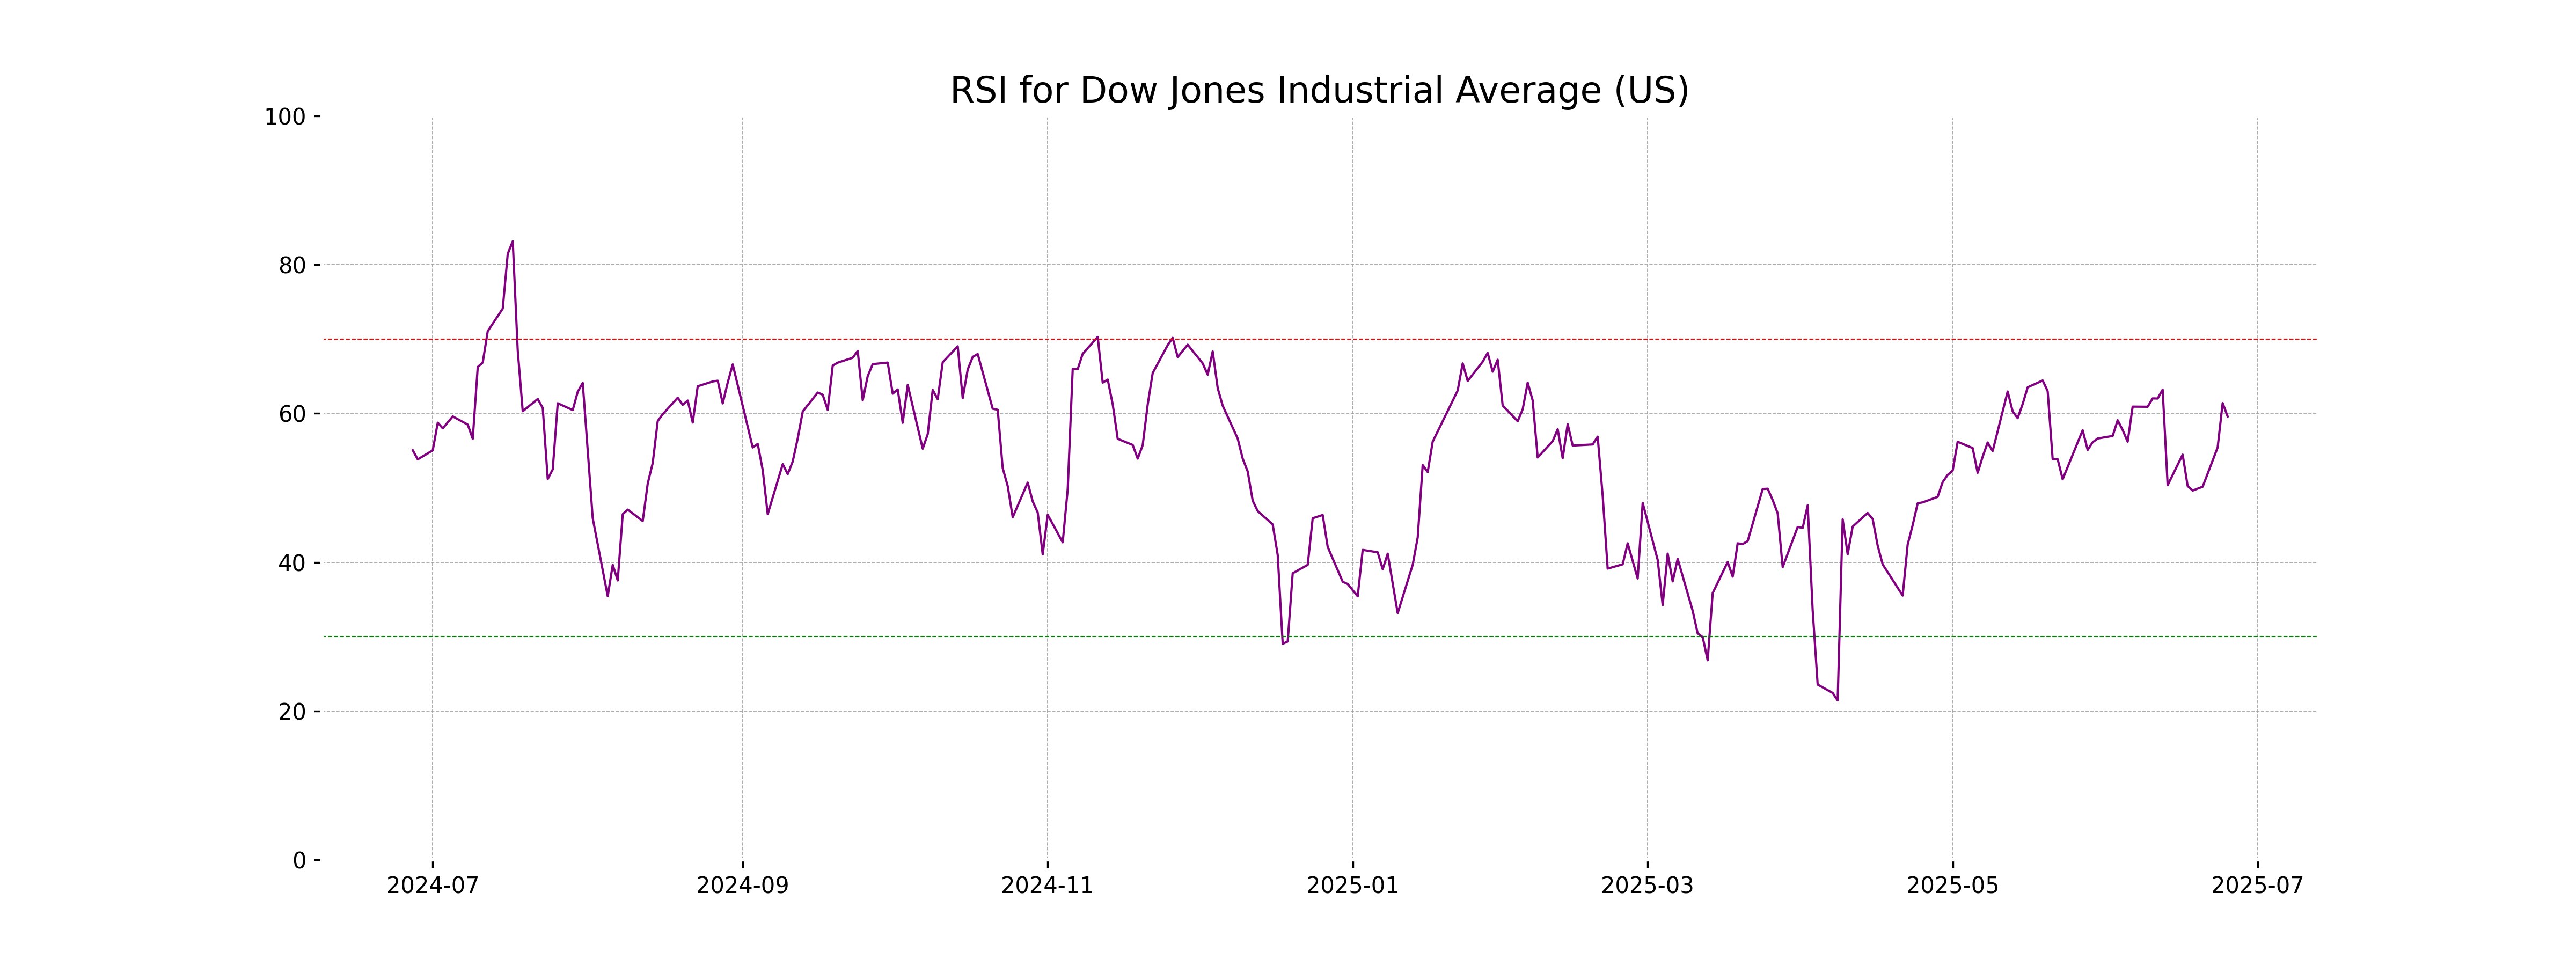
The Dow Jones Industrial Average opened at 43,130.33 and closed at 42,982.43, marking a decrease of 0.25% or a drop of 106.59 points from the previous close of 43,089.02. The RSI is at 59.59, indicating a neutral stance with potential bullish momentum, as reflected by the positive MACD of 242.61 although it is below the MACD Signal of 253.14.
Relationship with Key Moving Averages
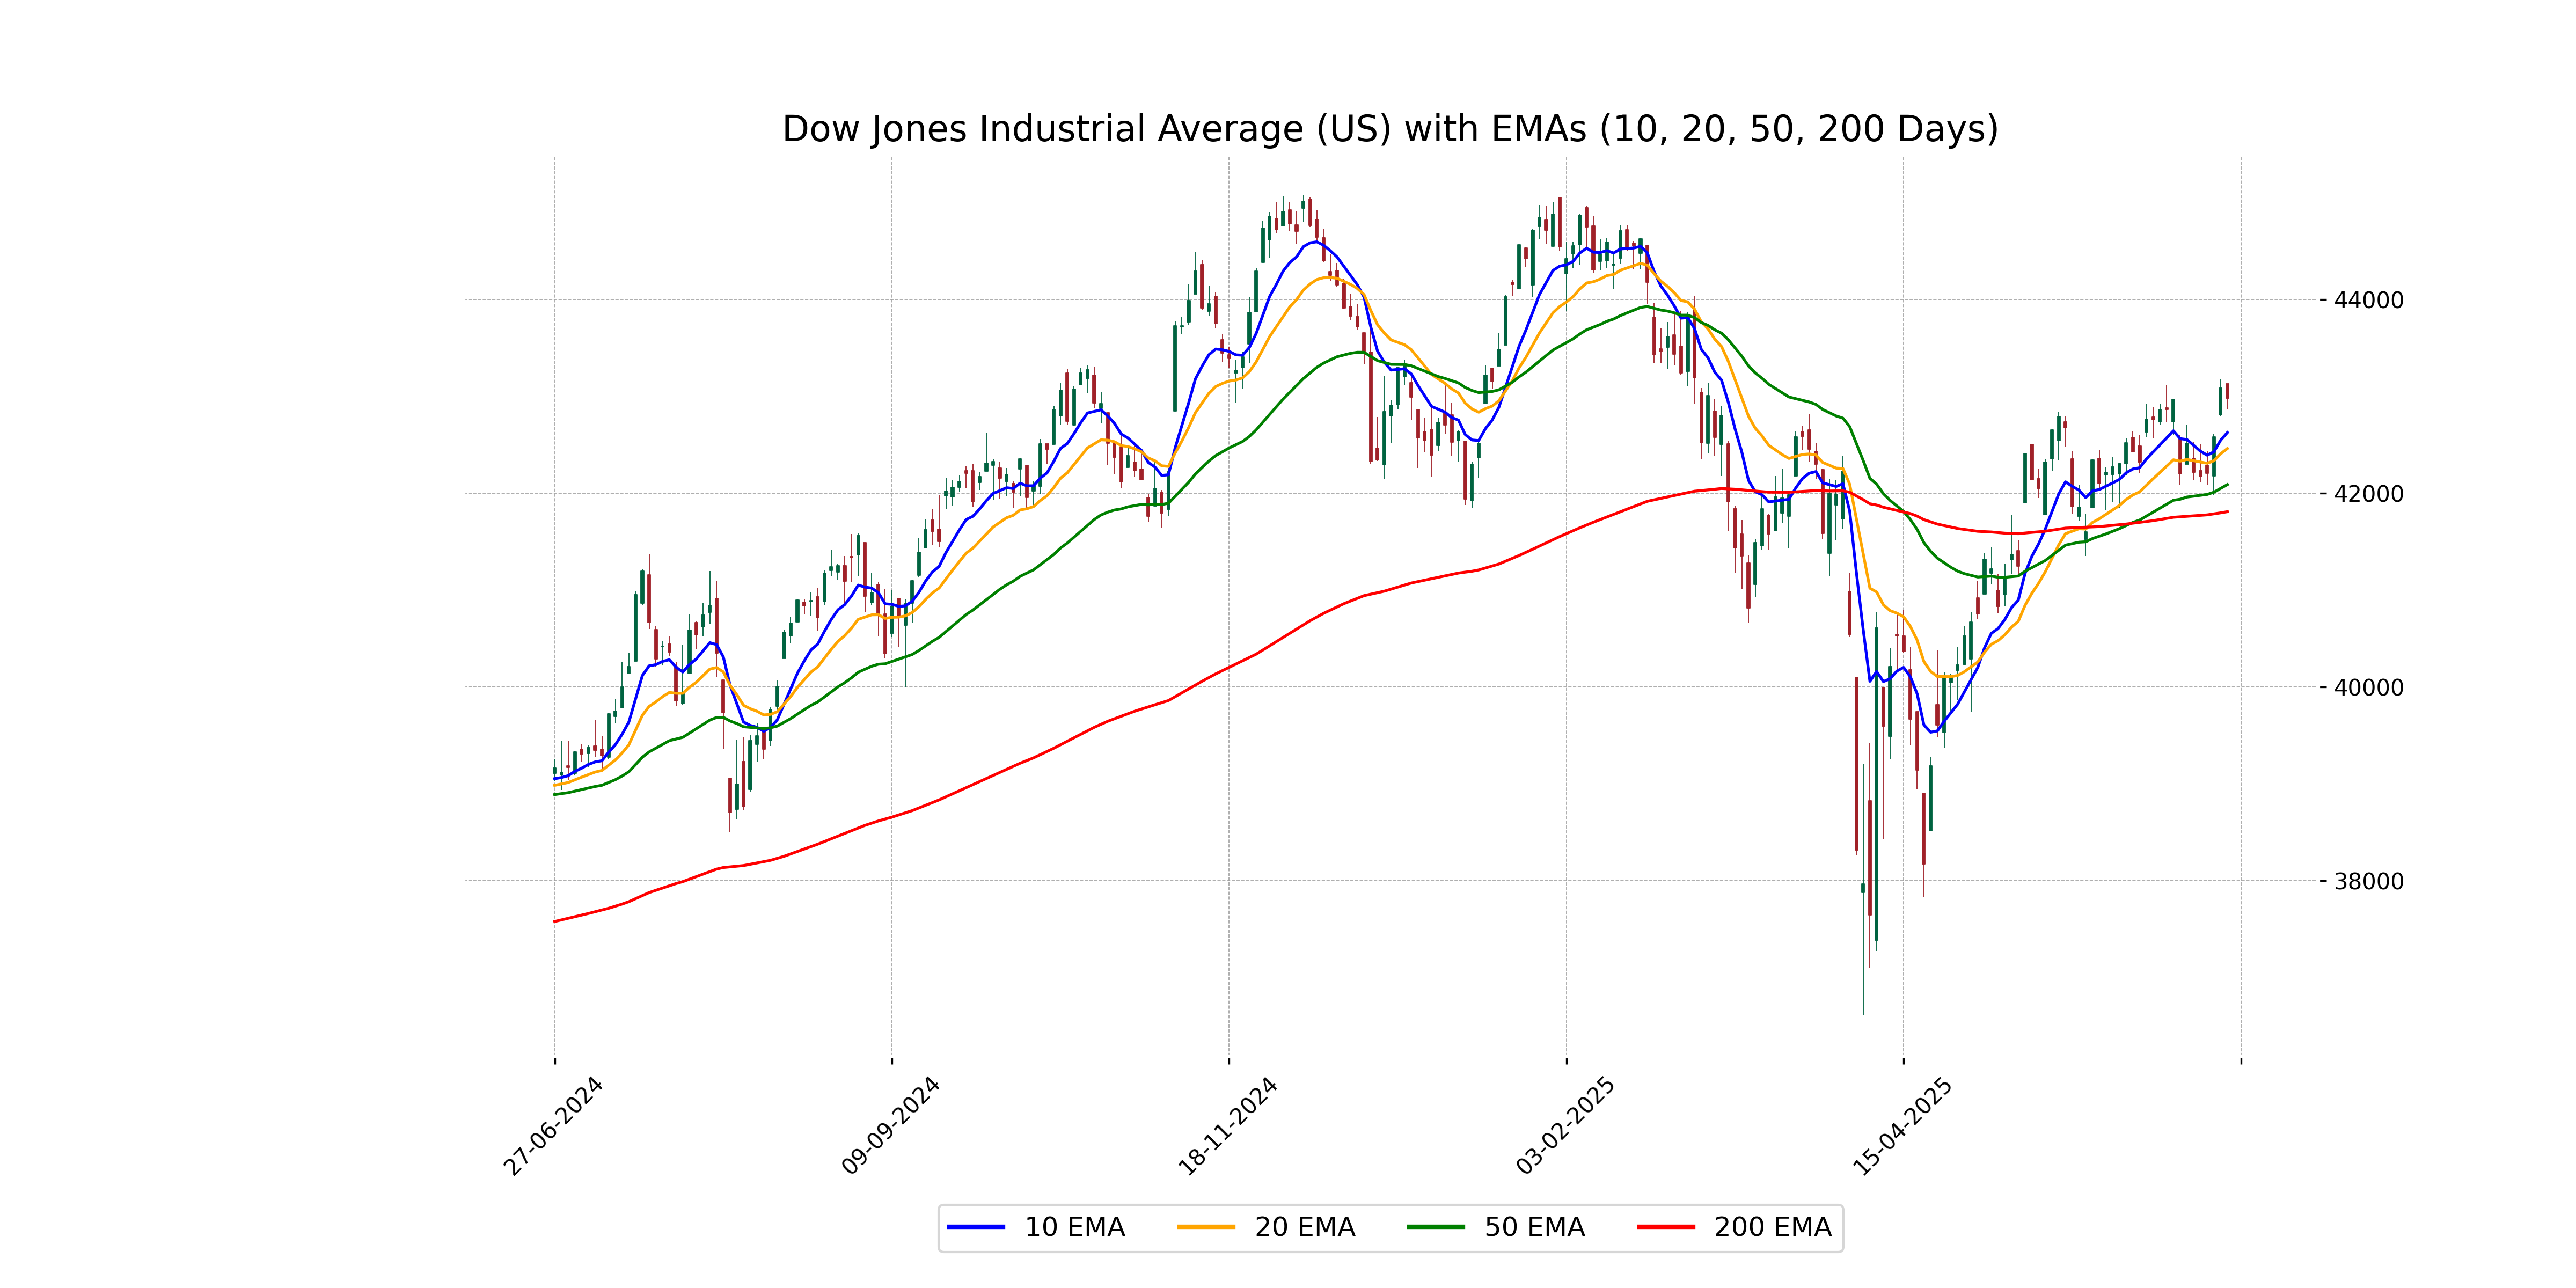
The Dow Jones Industrial Average opened and reached the same high at 43130.33 while closing at 42982.43, showing a negative movement below all key EMAs: 50, 200, 10, and 20-day. This indicates bearish sentiment, with a current RSI of 59.59 suggesting the market is approaching overbought levels.
Moving Averages Trend (MACD)
The MACD value for the Dow Jones Industrial Average is 242.61, which is below its MACD Signal value of 253.14. This indicates a potential bearish trend as the MACD line is below the signal line, suggesting possible downward momentum.
RSI Analysis
RSI Analysis for Dow Jones Industrial Average (US): The Relative Strength Index (RSI) is at 59.59, indicating the index is approaching the overbought zone but is still within a neutral range. An RSI between 50 and 70 typically suggests that the market is gaining momentum, with potential for continued upward movement if the trend persists.
Analysis for CAC 40 (France) - June 26, 2025
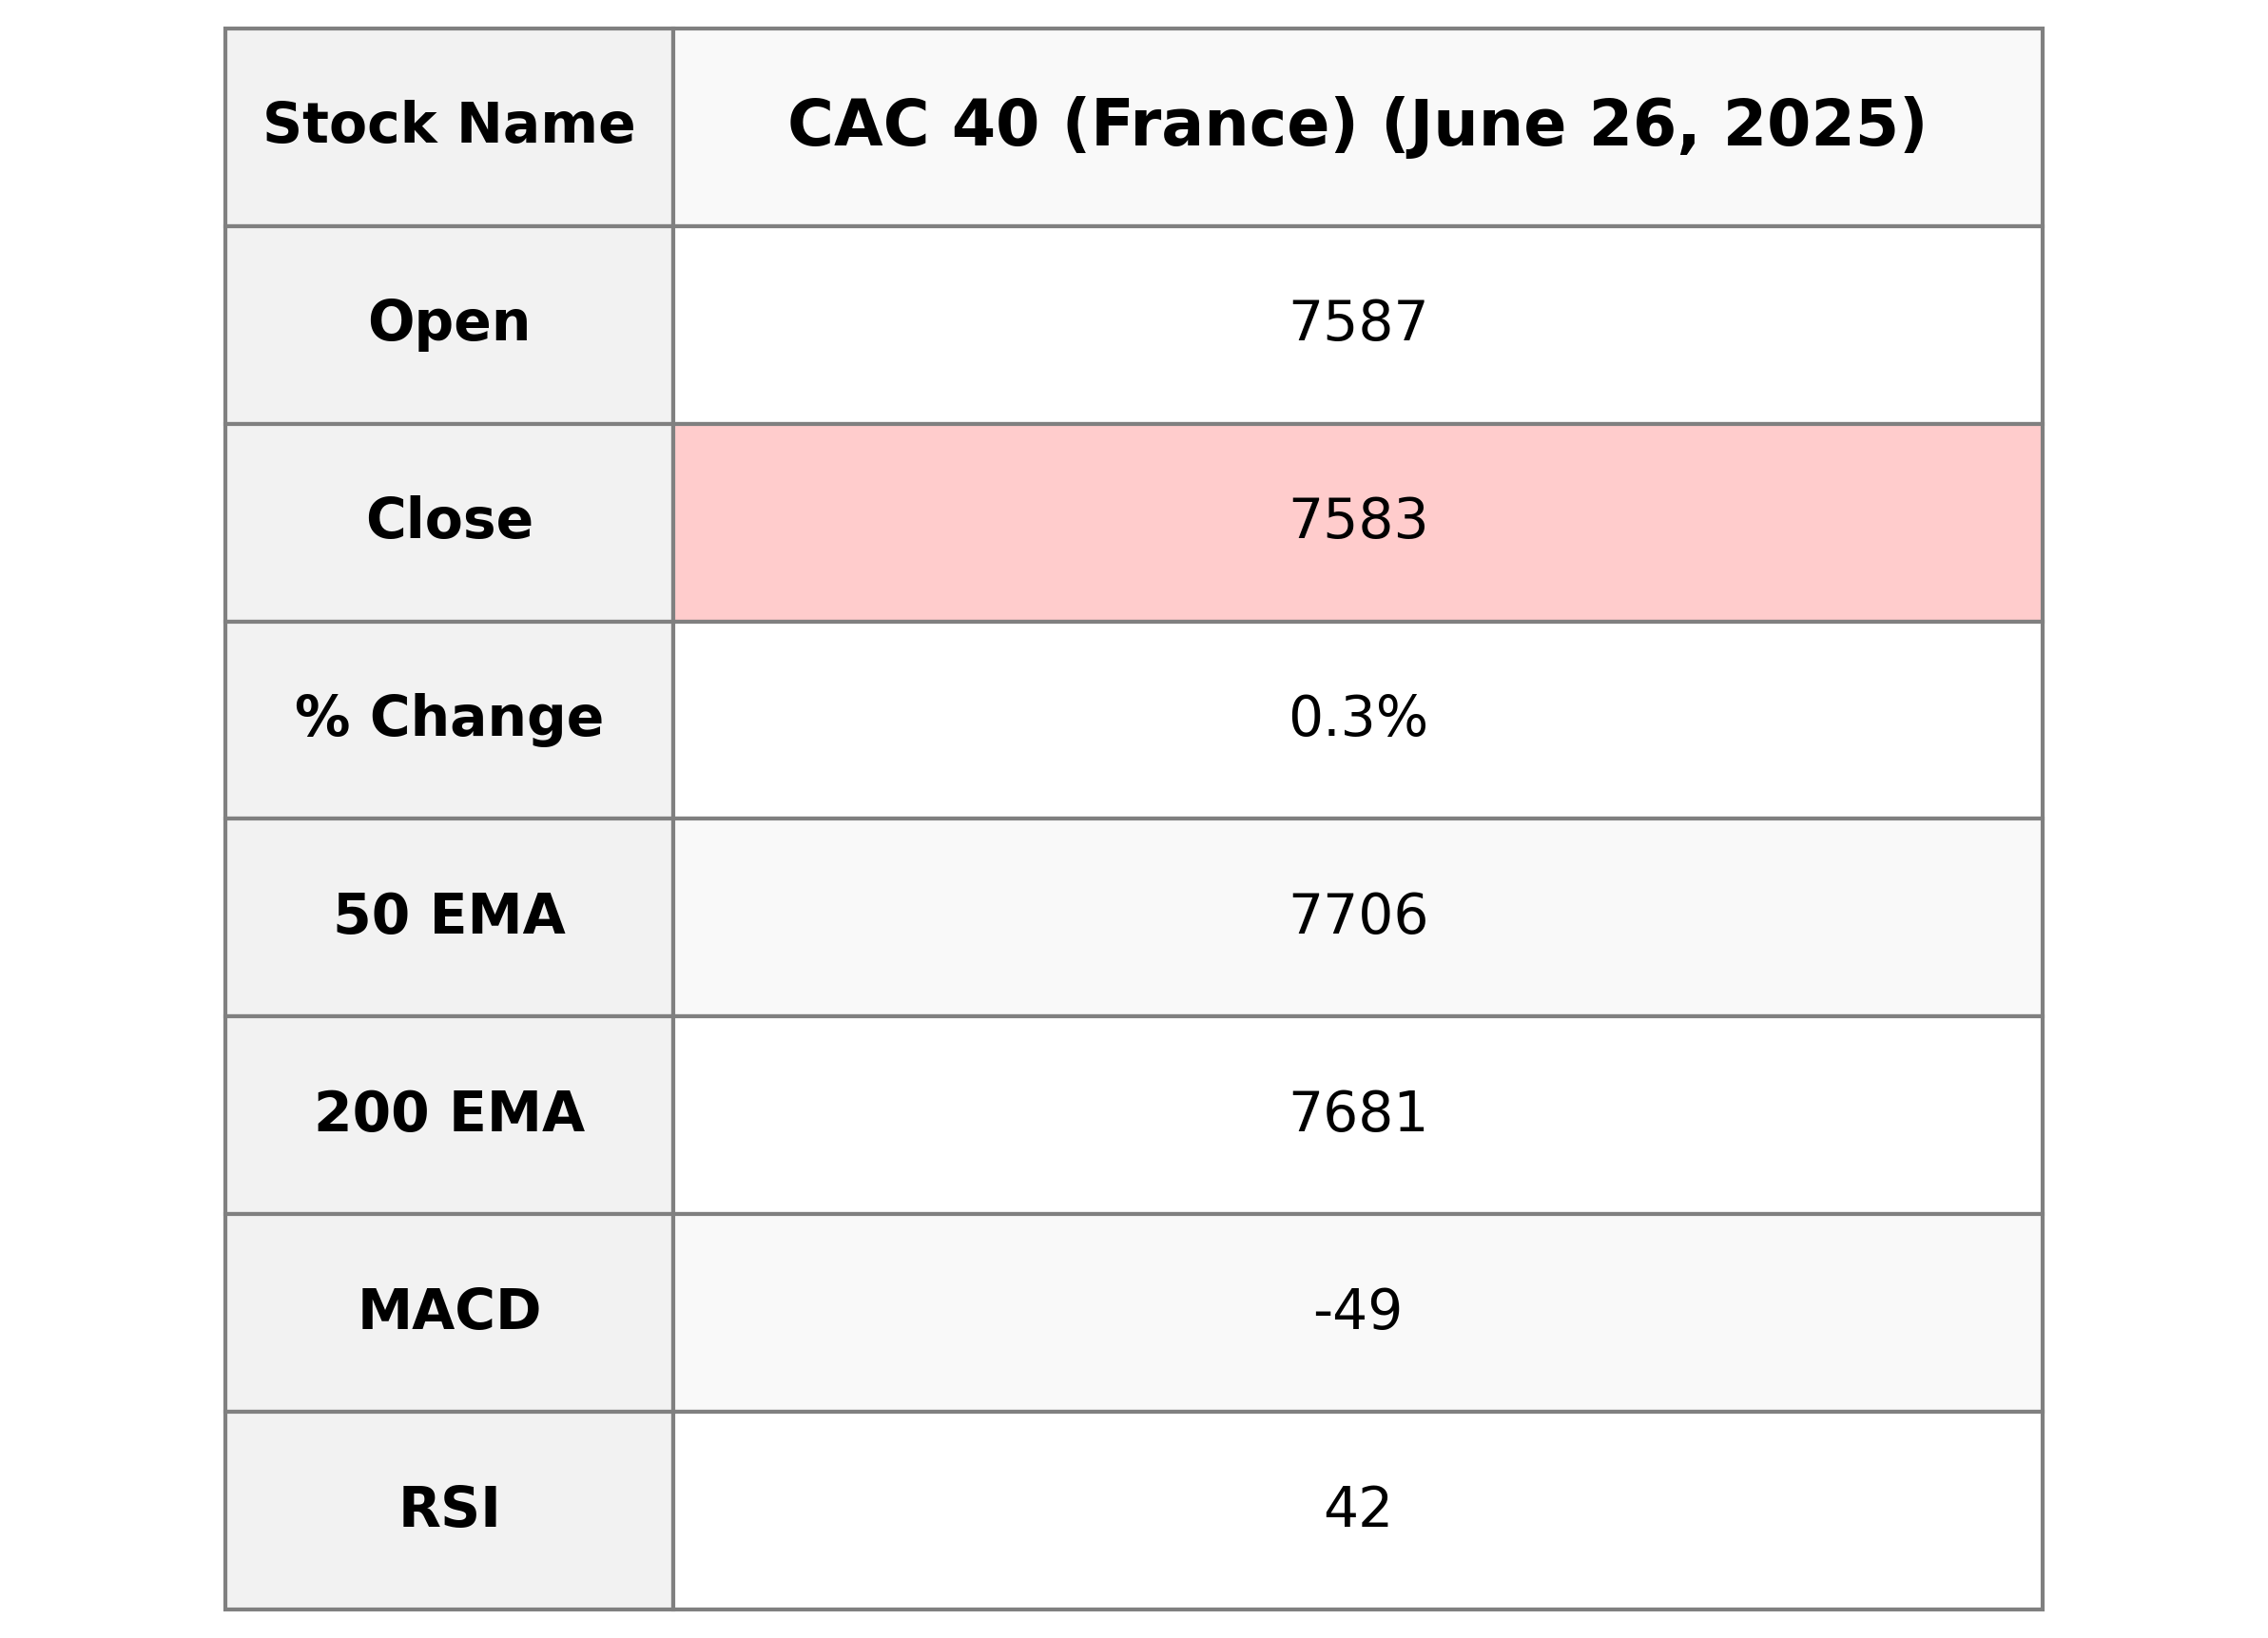
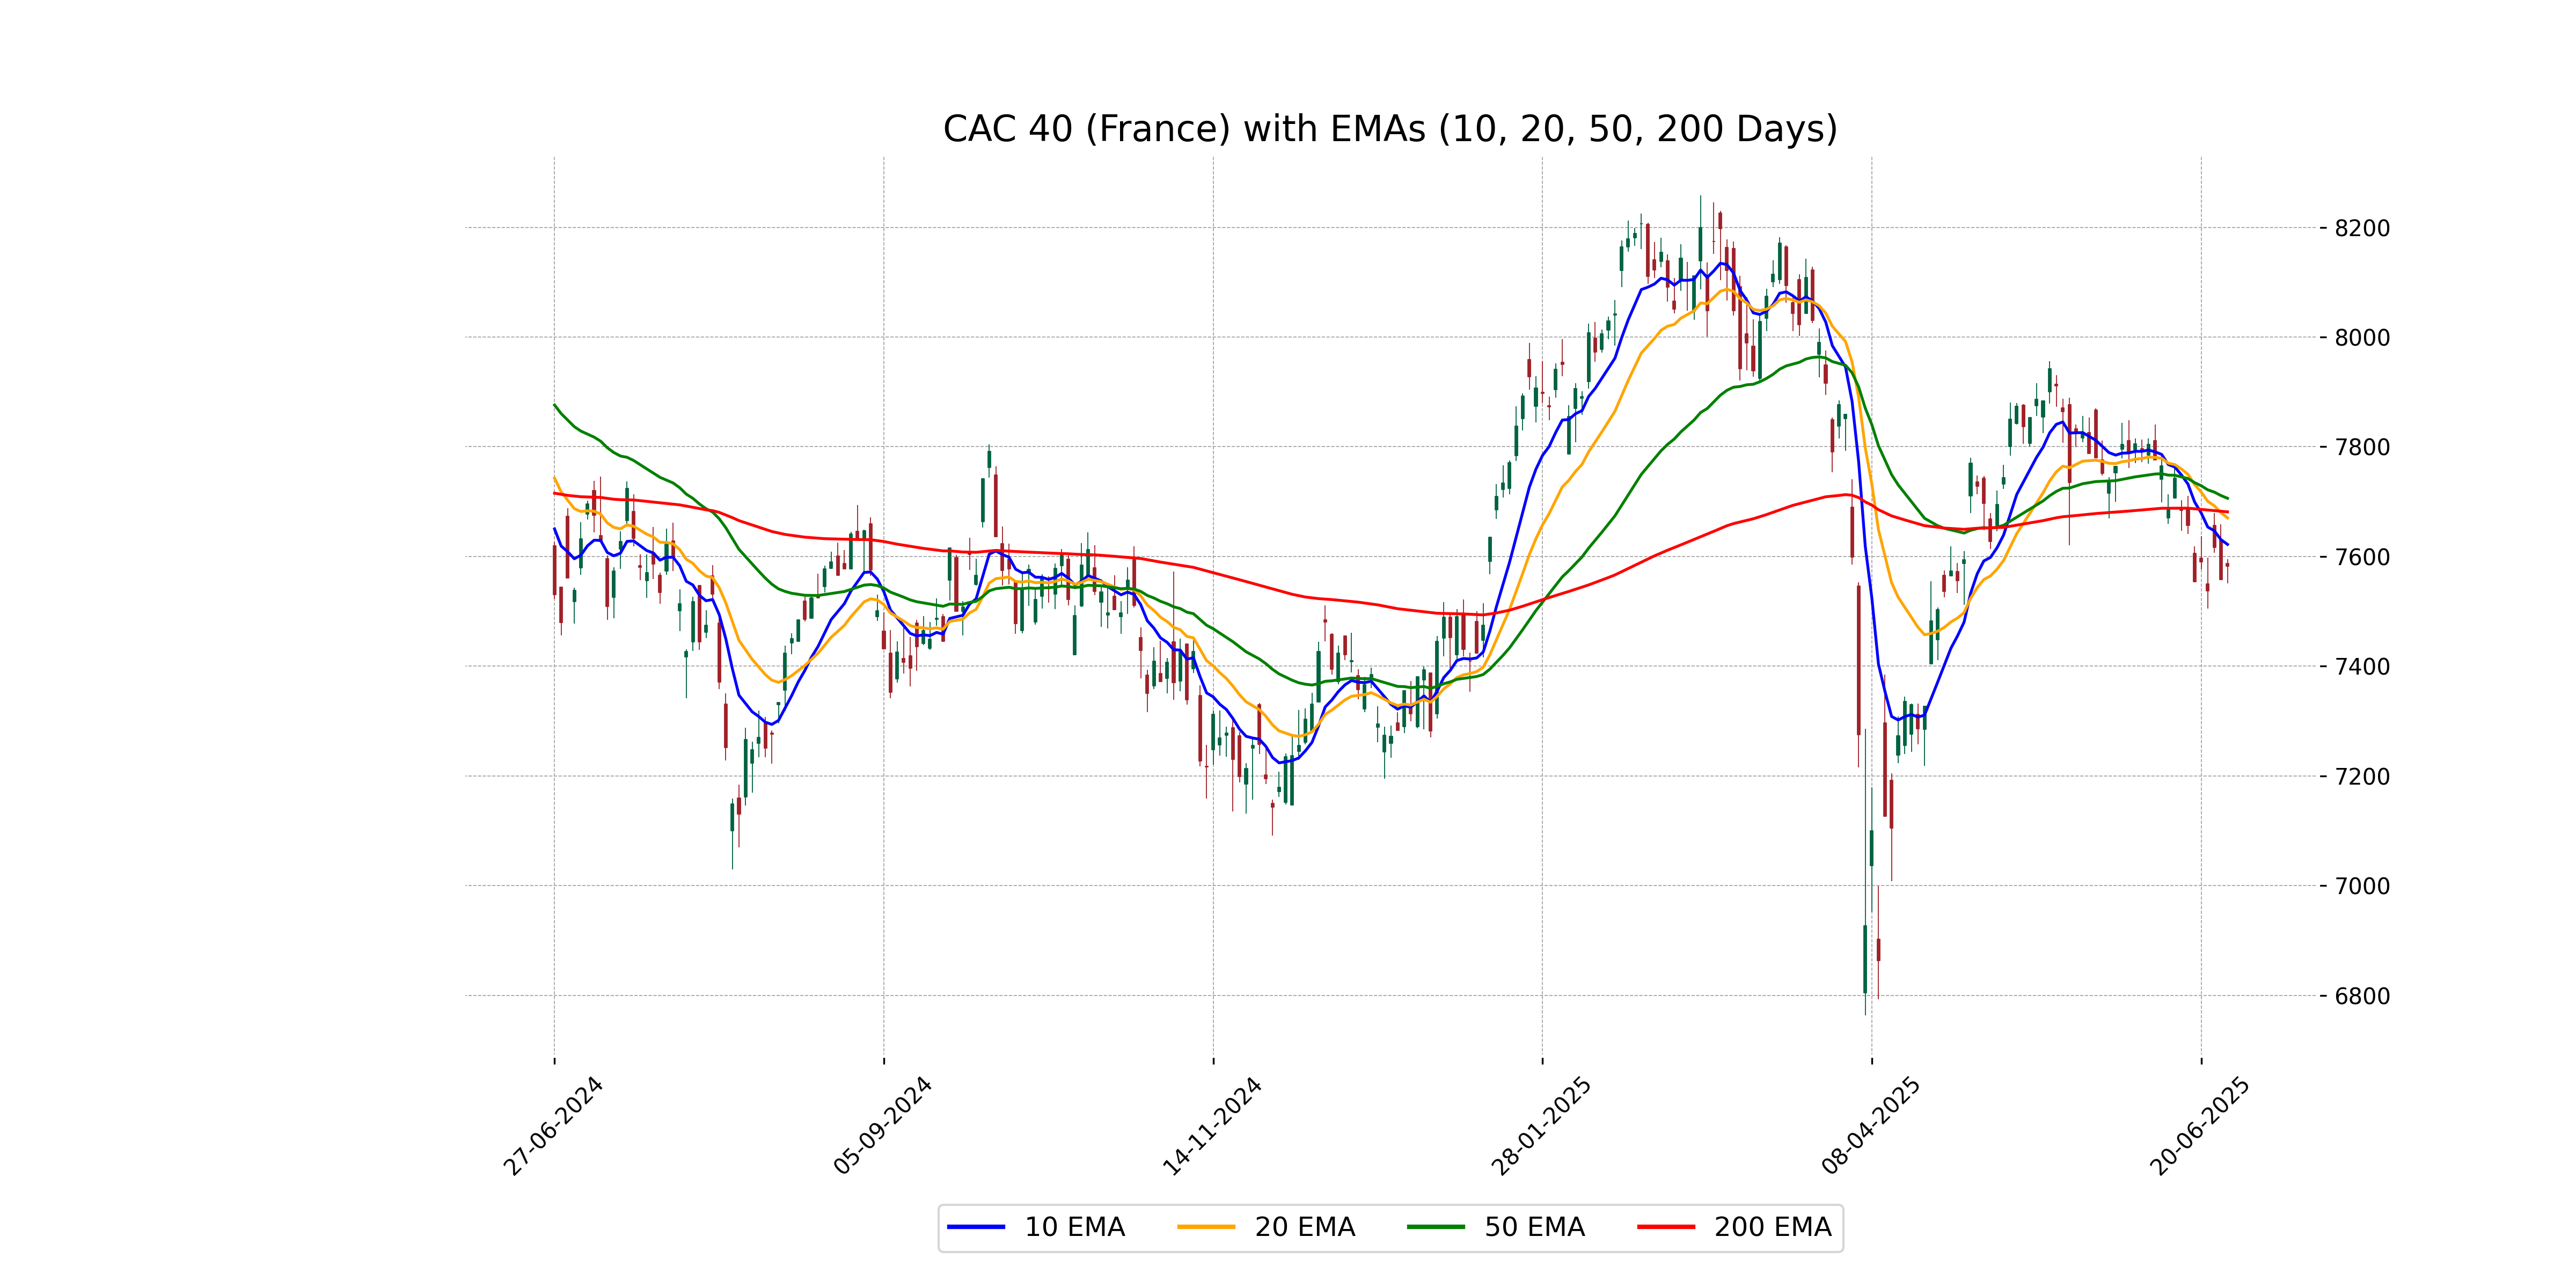
CAC 40 (France) opened at 7587.24, reached a high of 7594.90, and closed at 7582.63. This represents a slight increase of 0.32% or a points change of 24.47 from the previous close of 7558.16. Despite the gains, the RSI is at 41.60, indicating a weaker momentum, with the MACD at -49.15, suggesting bearish signals.
Relationship with Key Moving Averages
CAC 40 is trading below its key moving averages: 50 EMA (7705.98), 200 EMA (7681.27), 10 EMA (7621.93), and 20 EMA (7670.30). This suggests a bearish trend, as the current close price (7582.63) indicates weakness against these averages.
Moving Averages Trend (MACD)
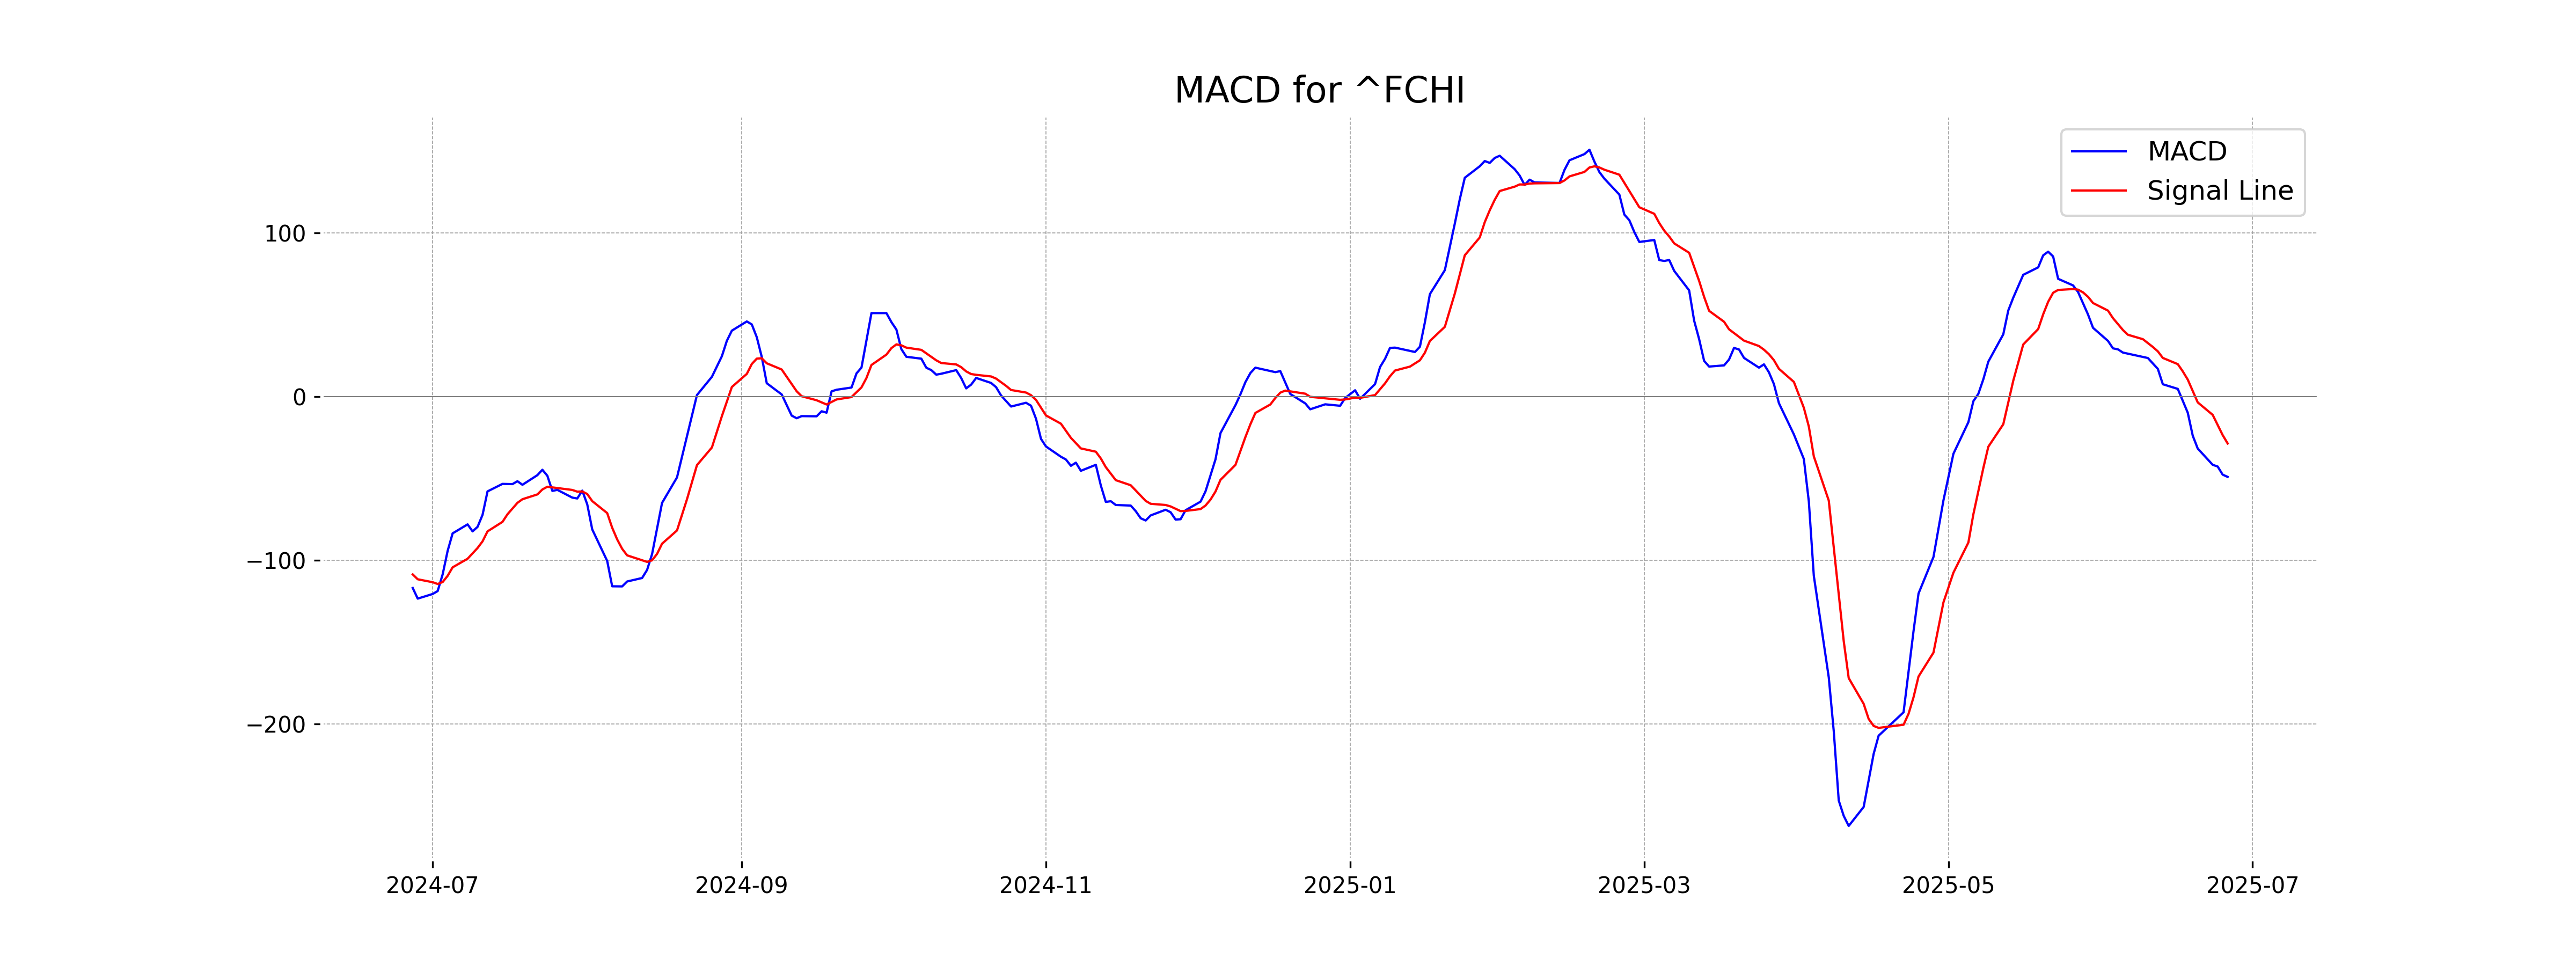
The CAC 40 index is currently showing a bearish signal with the MACD at -49.15, which is below the MACD Signal line at -28.71. This suggests that the momentum is currently negative, and there may be continued weakness in the near term.
RSI Analysis
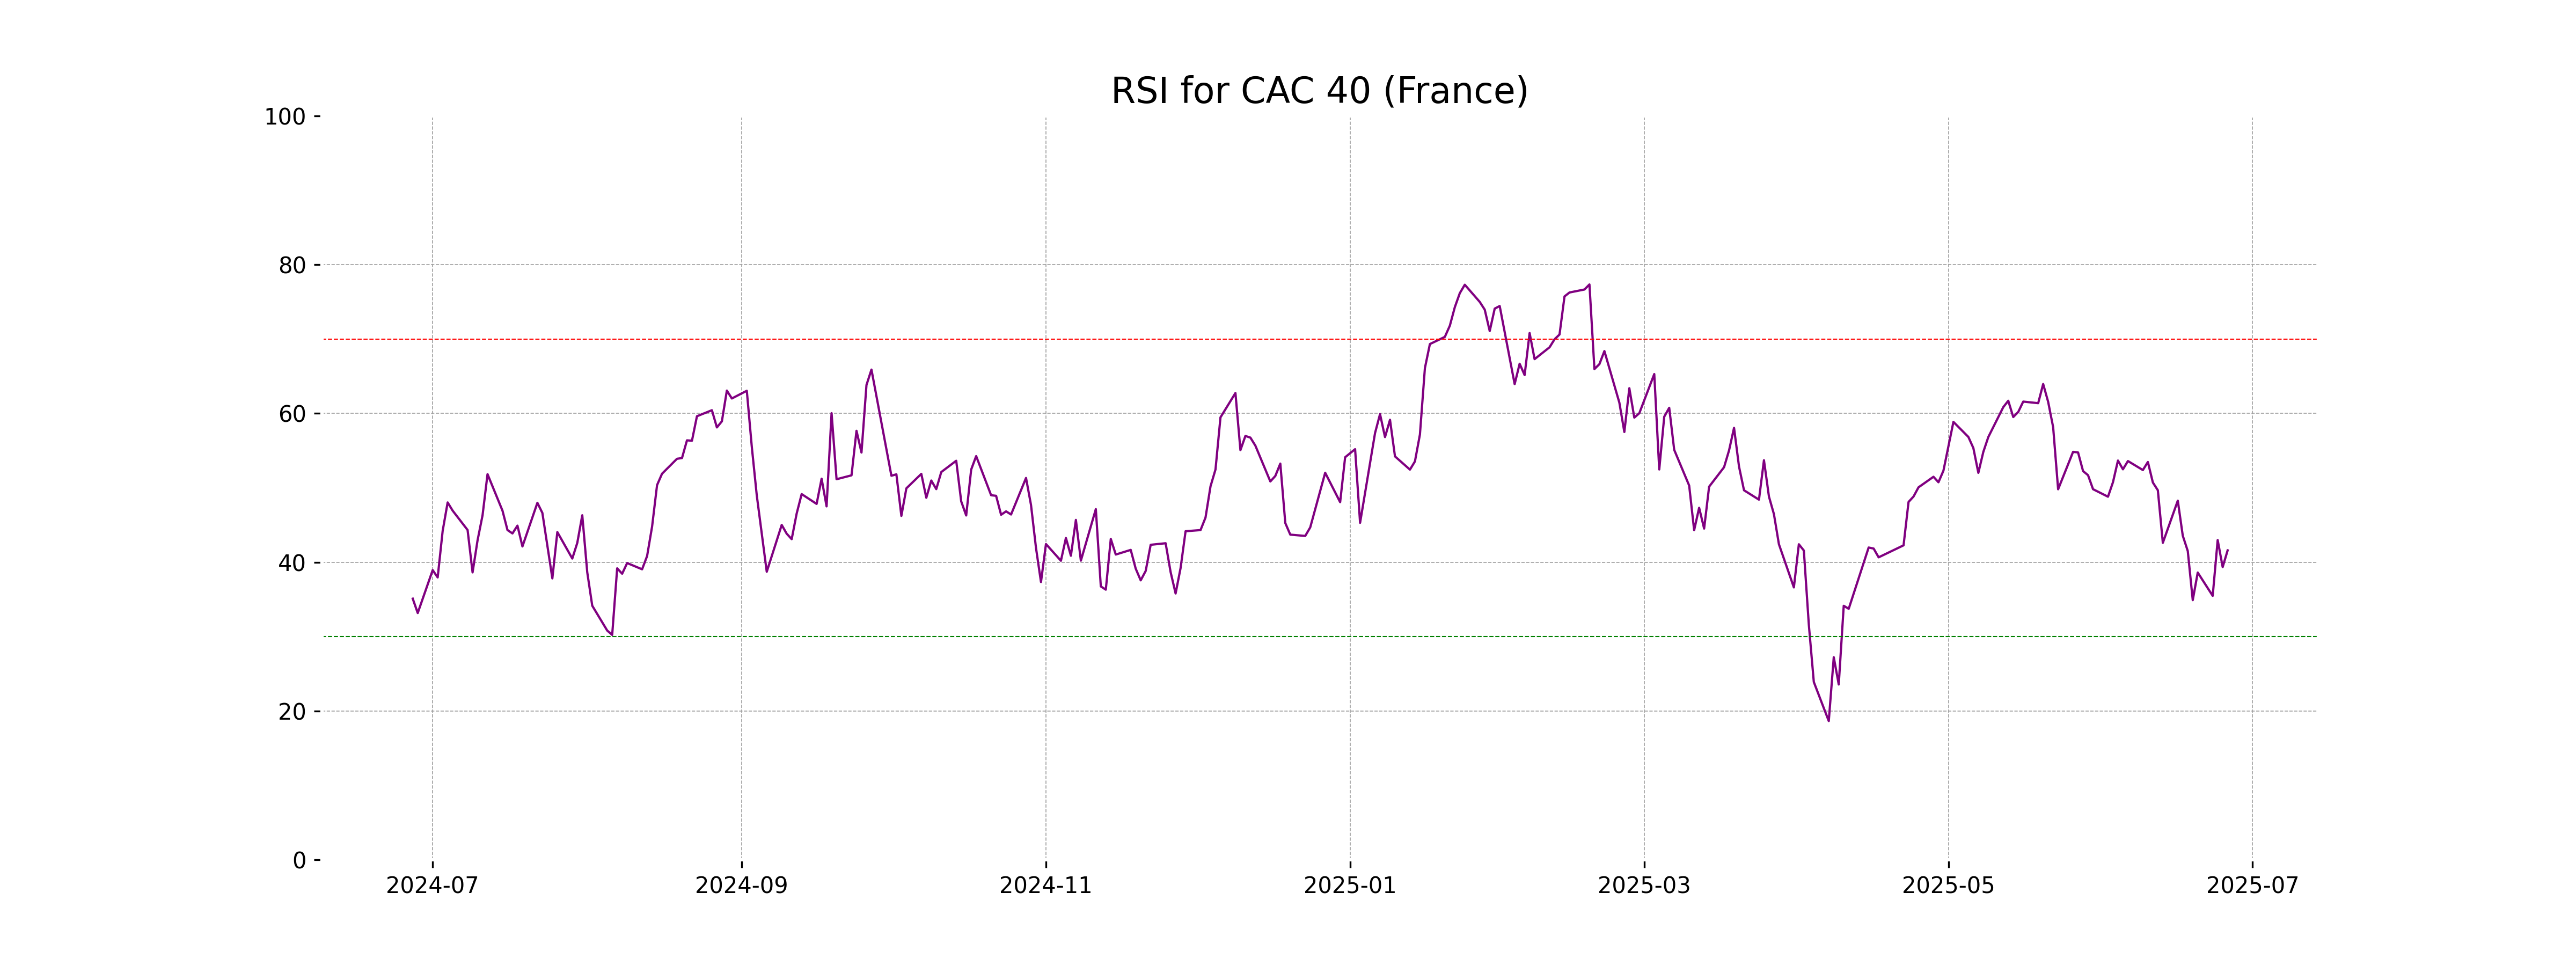
The CAC 40 index in France currently has an RSI of 41.60, indicating that it is closer to the oversold territory but not yet at a level that would typically suggest a strong chance for a price reversal. Generally, an RSI below 30 is considered oversold, potentially signaling a buying opportunity.
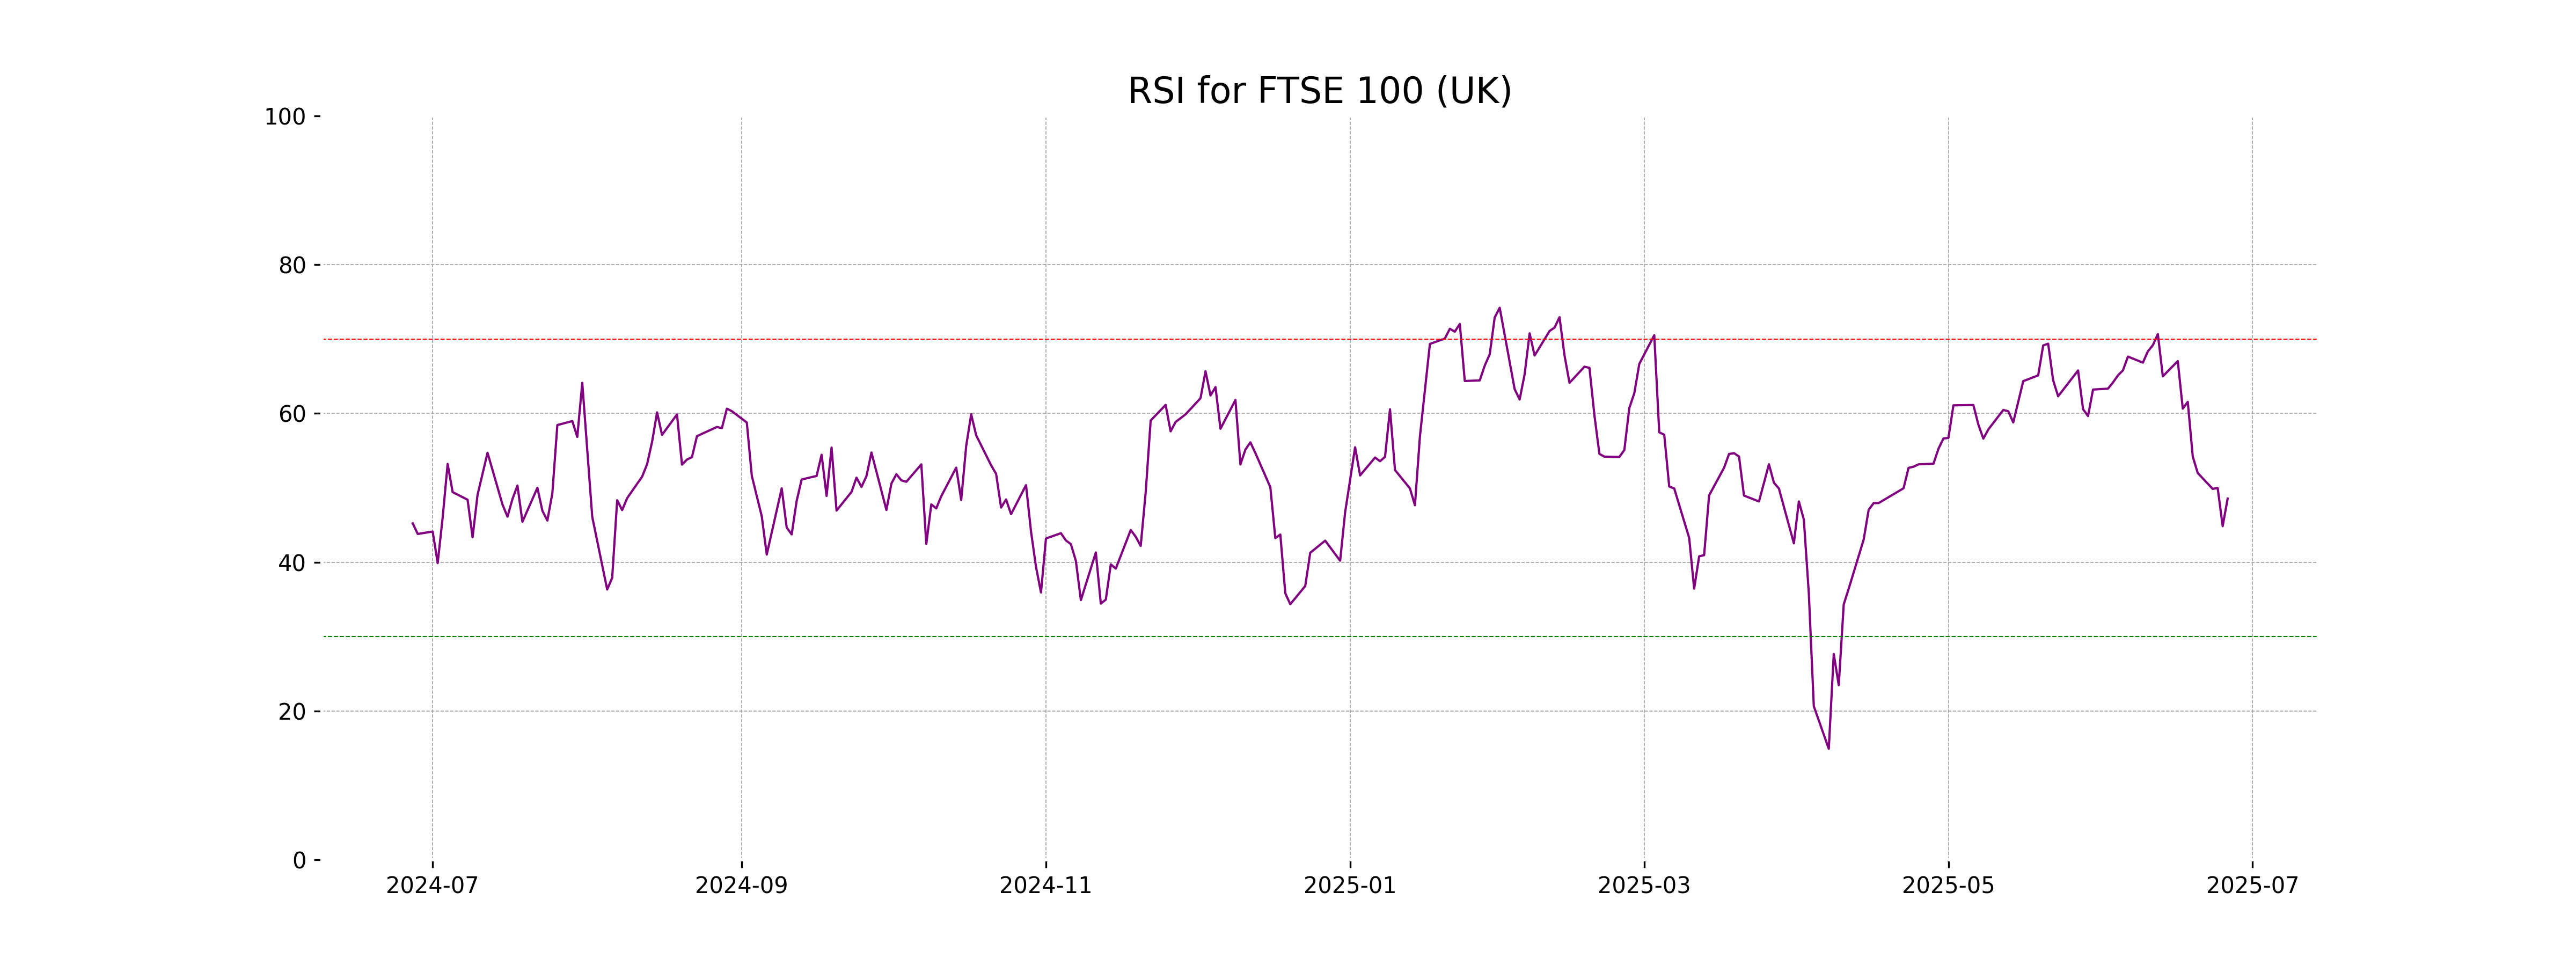
Analysis for FTSE 100 (UK) - June 26, 2025

FTSE 100 (UK) opened at 8718.75 and closed slightly higher at 8744.94, marking a percentage change of 0.30% and a point change of 26.14. The Relative Strength Index (RSI) stands at 48.55, indicating a relatively neutral market momentum. The index's performance is close to its 10-day and 20-day EMAs but remains significantly above the 50-day and 200-day EMAs.
Relationship with Key Moving Averages
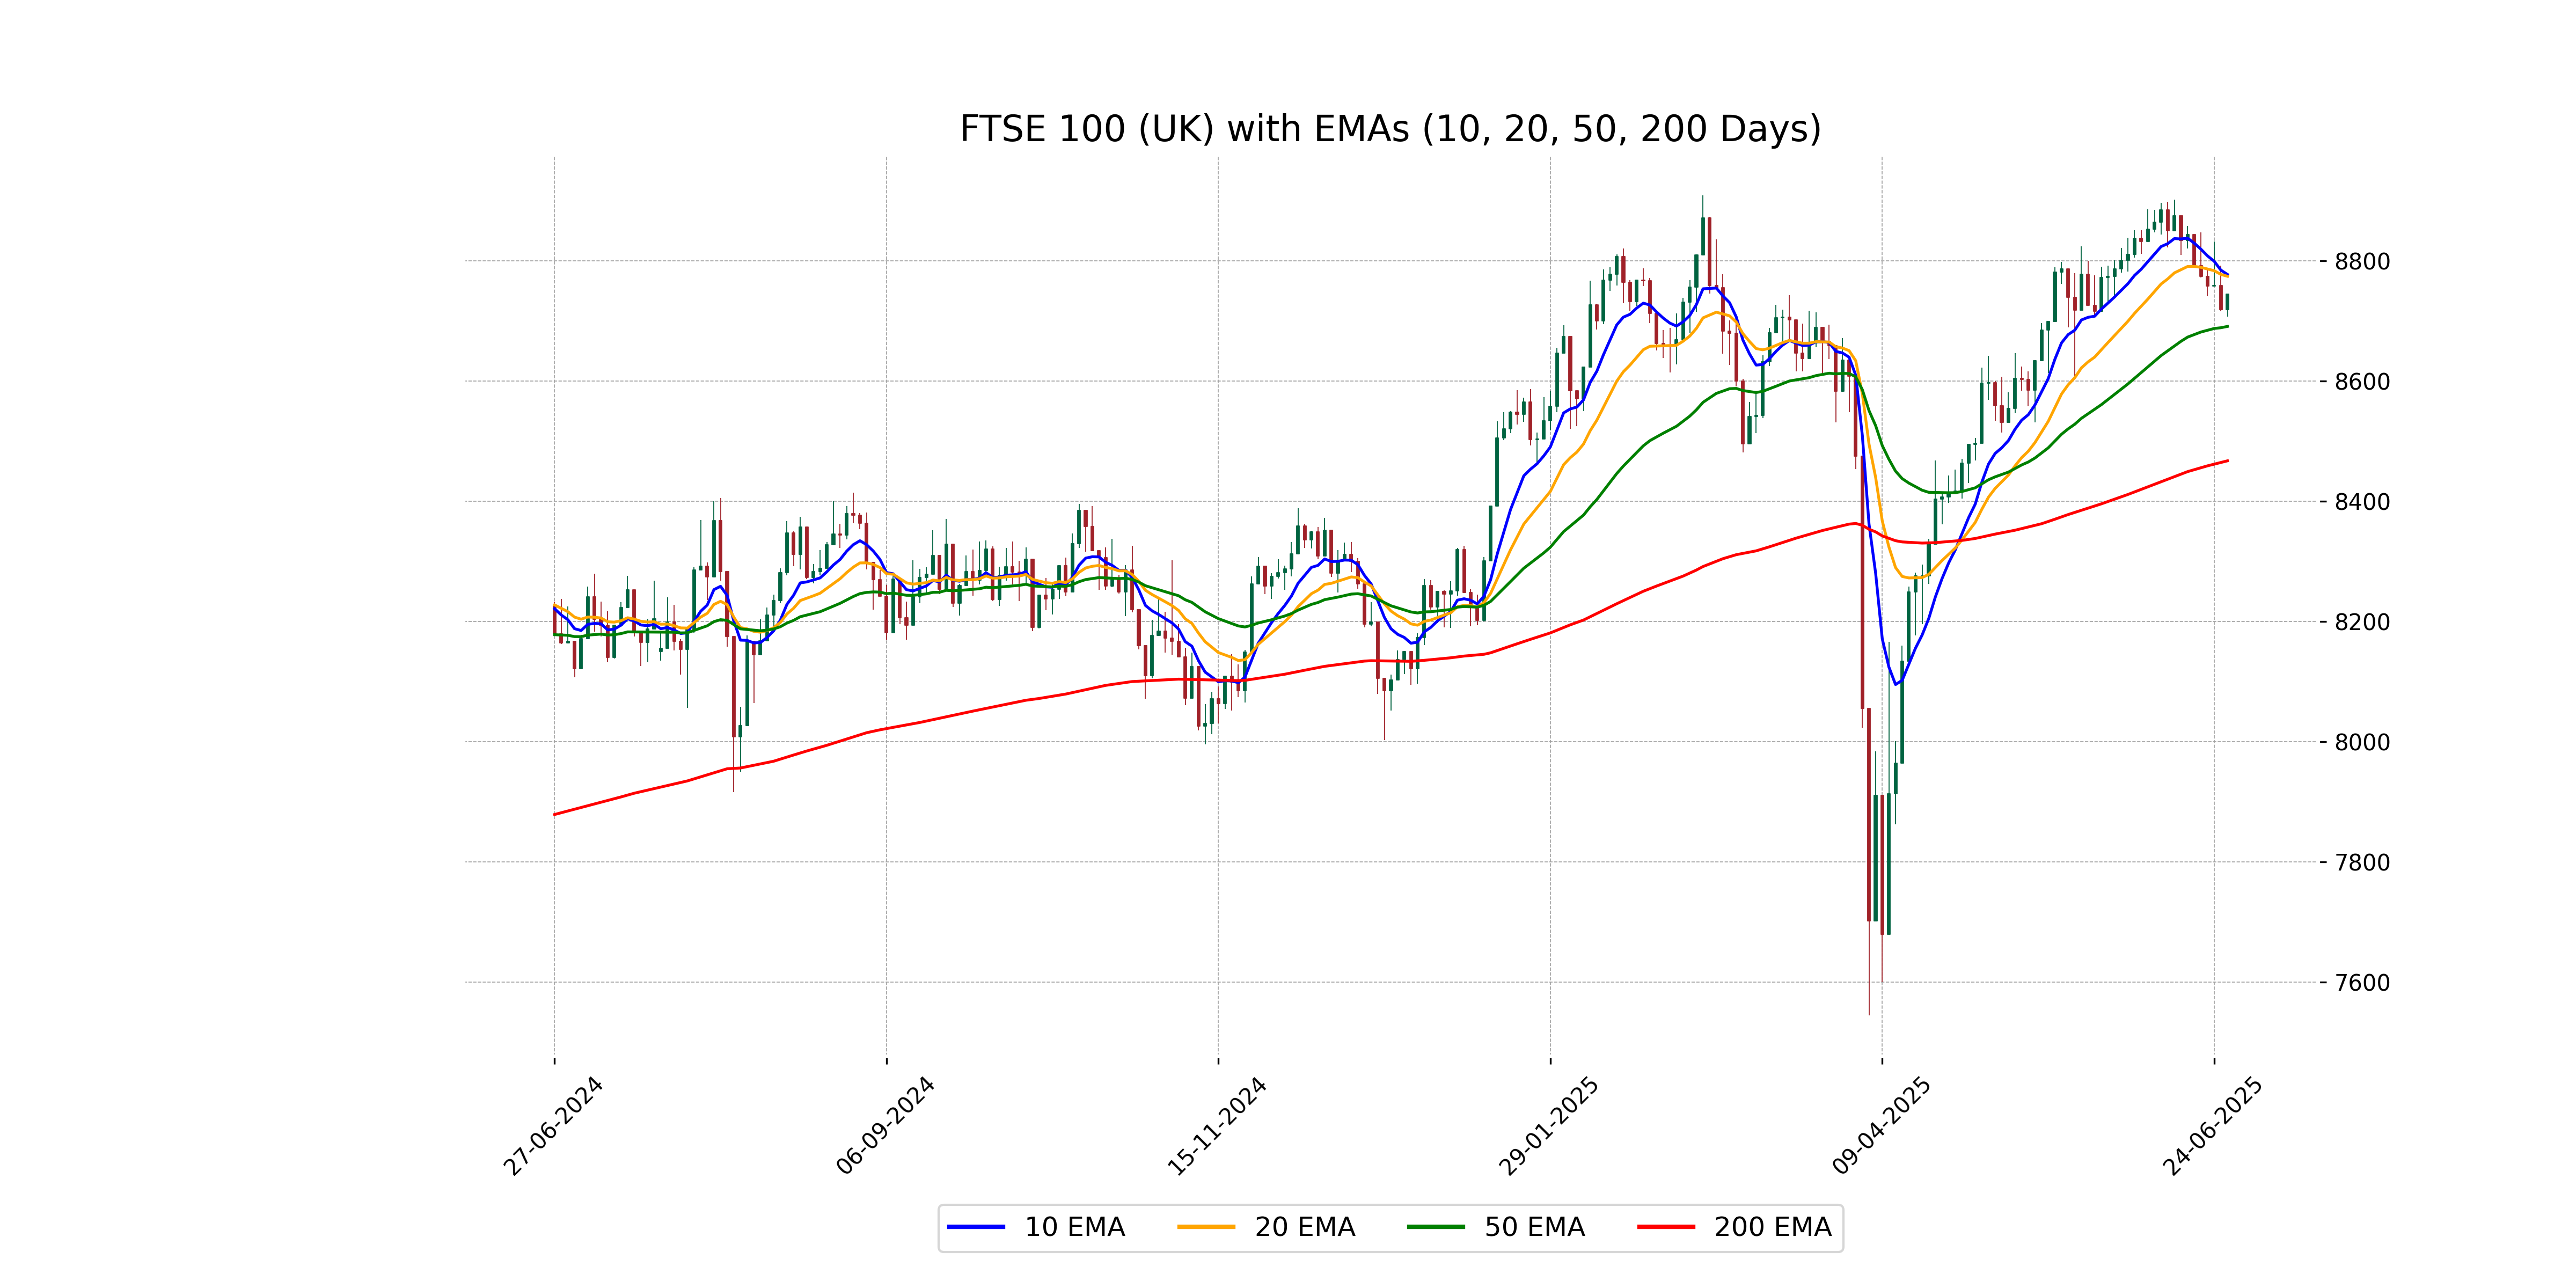
The FTSE 100 closed above its 50-day EMA (8691.00) and 200-day EMA (8467.34), indicating a bullish trend, but remains below the 10-day (8777.49) and 20-day EMA (8774.45), suggesting short-term resistance.
Moving Averages Trend (MACD)
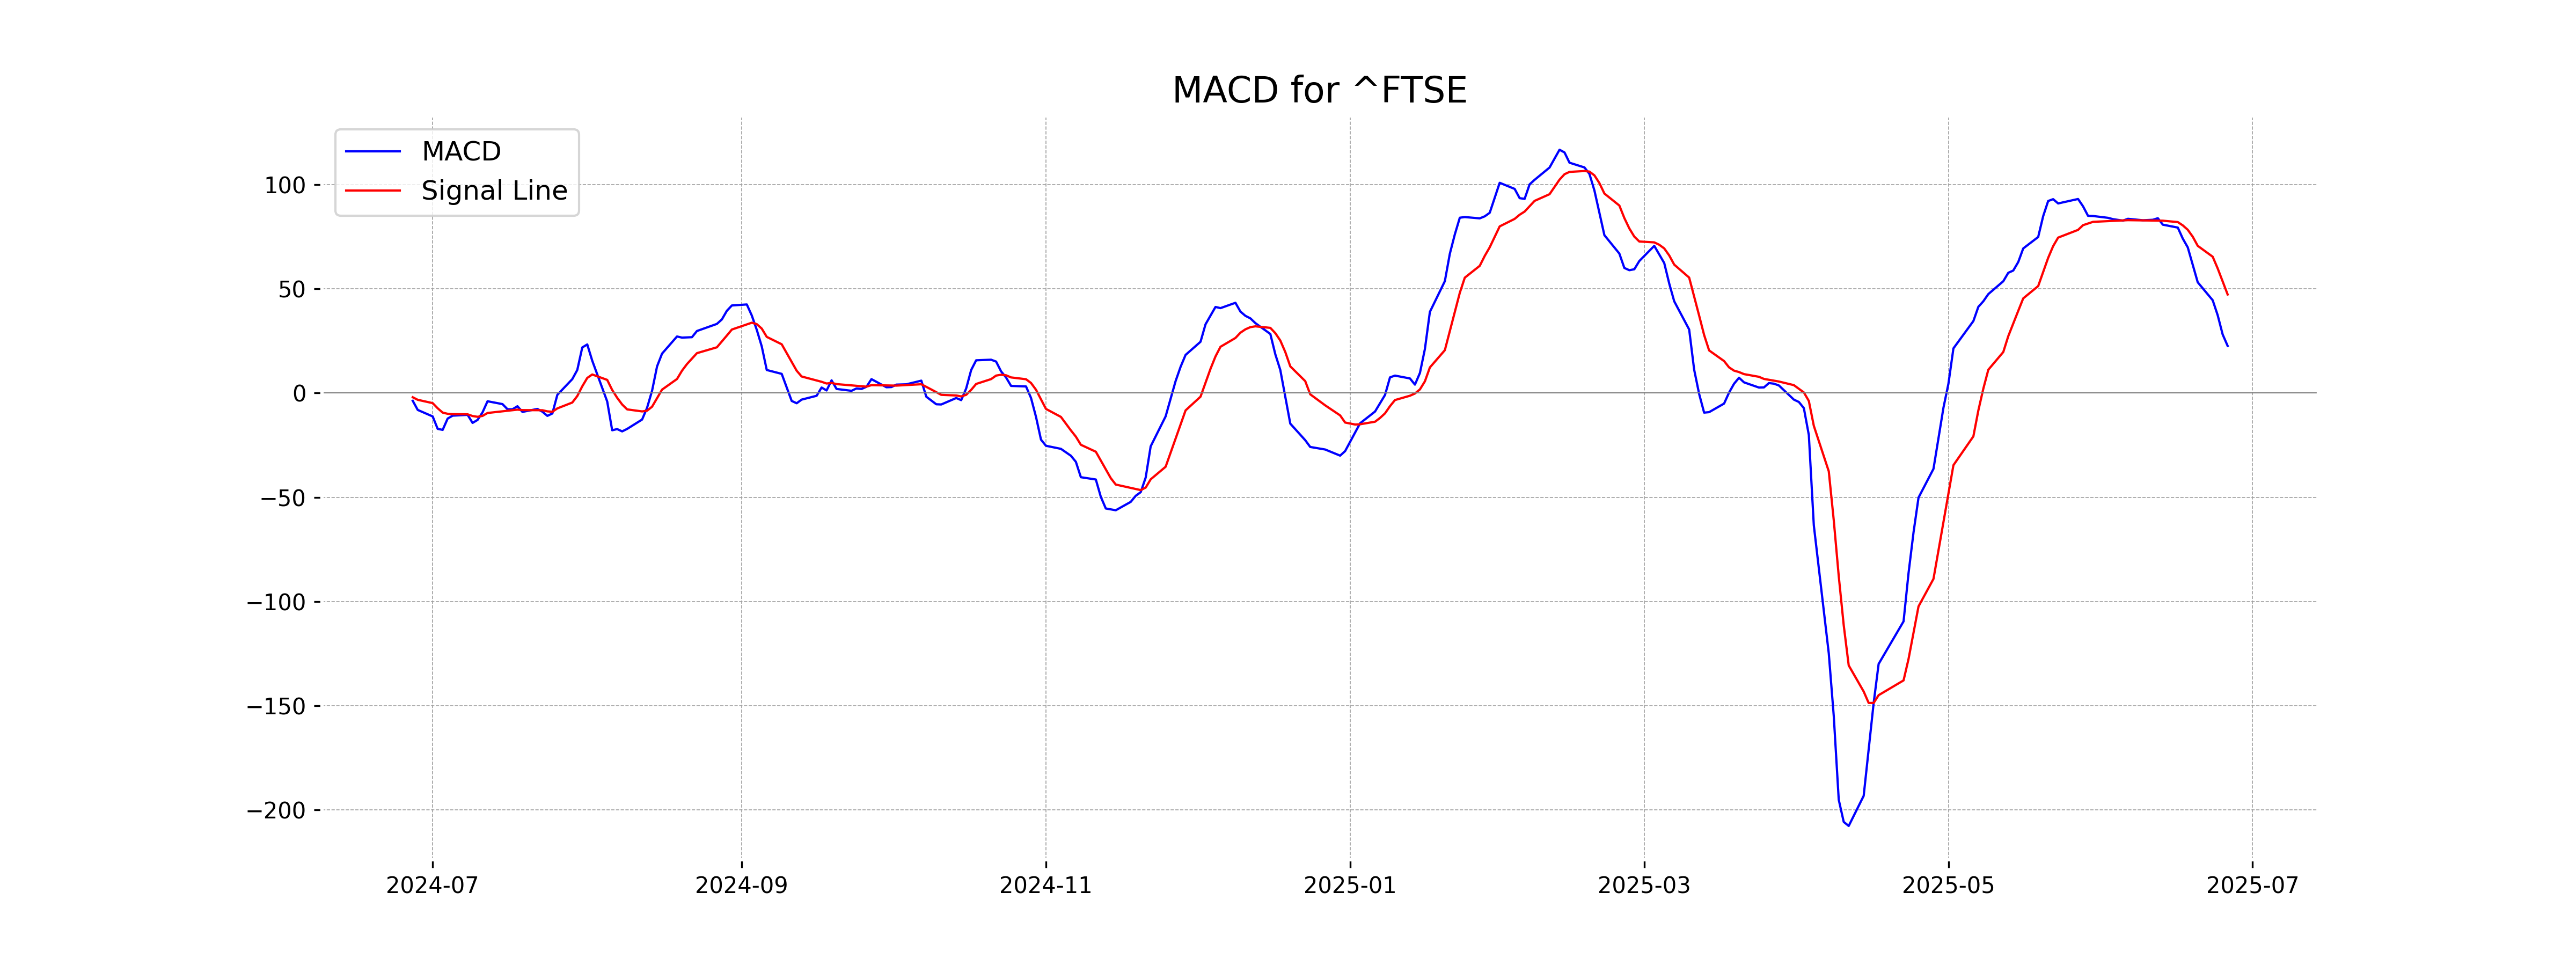
FTSE 100 (UK) MACD Analysis: The MACD is at 22.62, with a Signal Line at 47.28, indicating that the MACD is below its Signal Line. This suggests a bearish momentum in the short term, as the recent price movement may not support an immediate upward trend.
RSI Analysis
The RSI for the FTSE 100 is 48.55, which suggests that the index is in a neutral zone and neither overbought nor oversold. A reading close to 50 indicates a balance between bullish and bearish pressure.
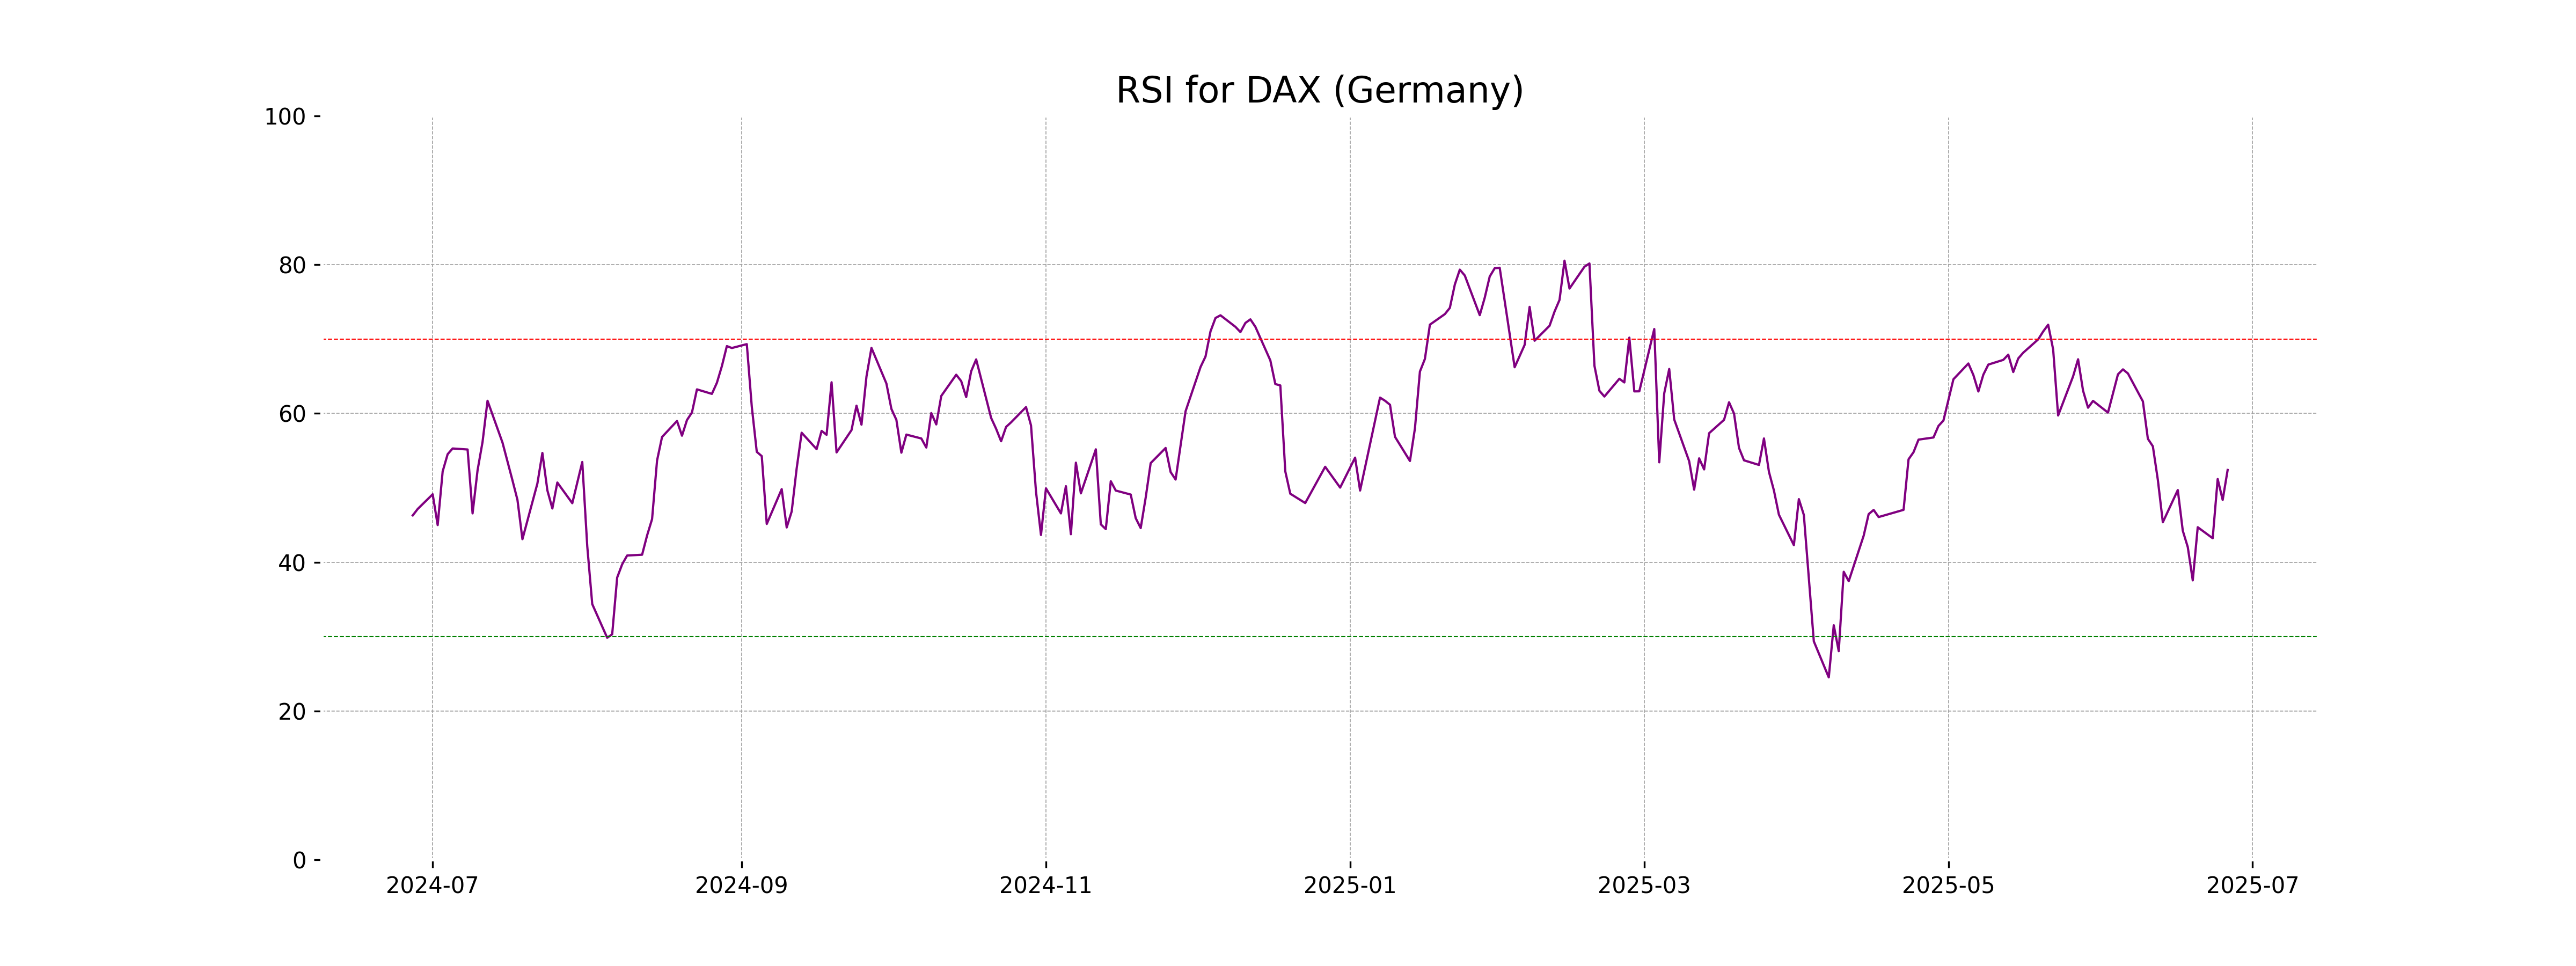
Analysis for DAX (Germany) - June 26, 2025
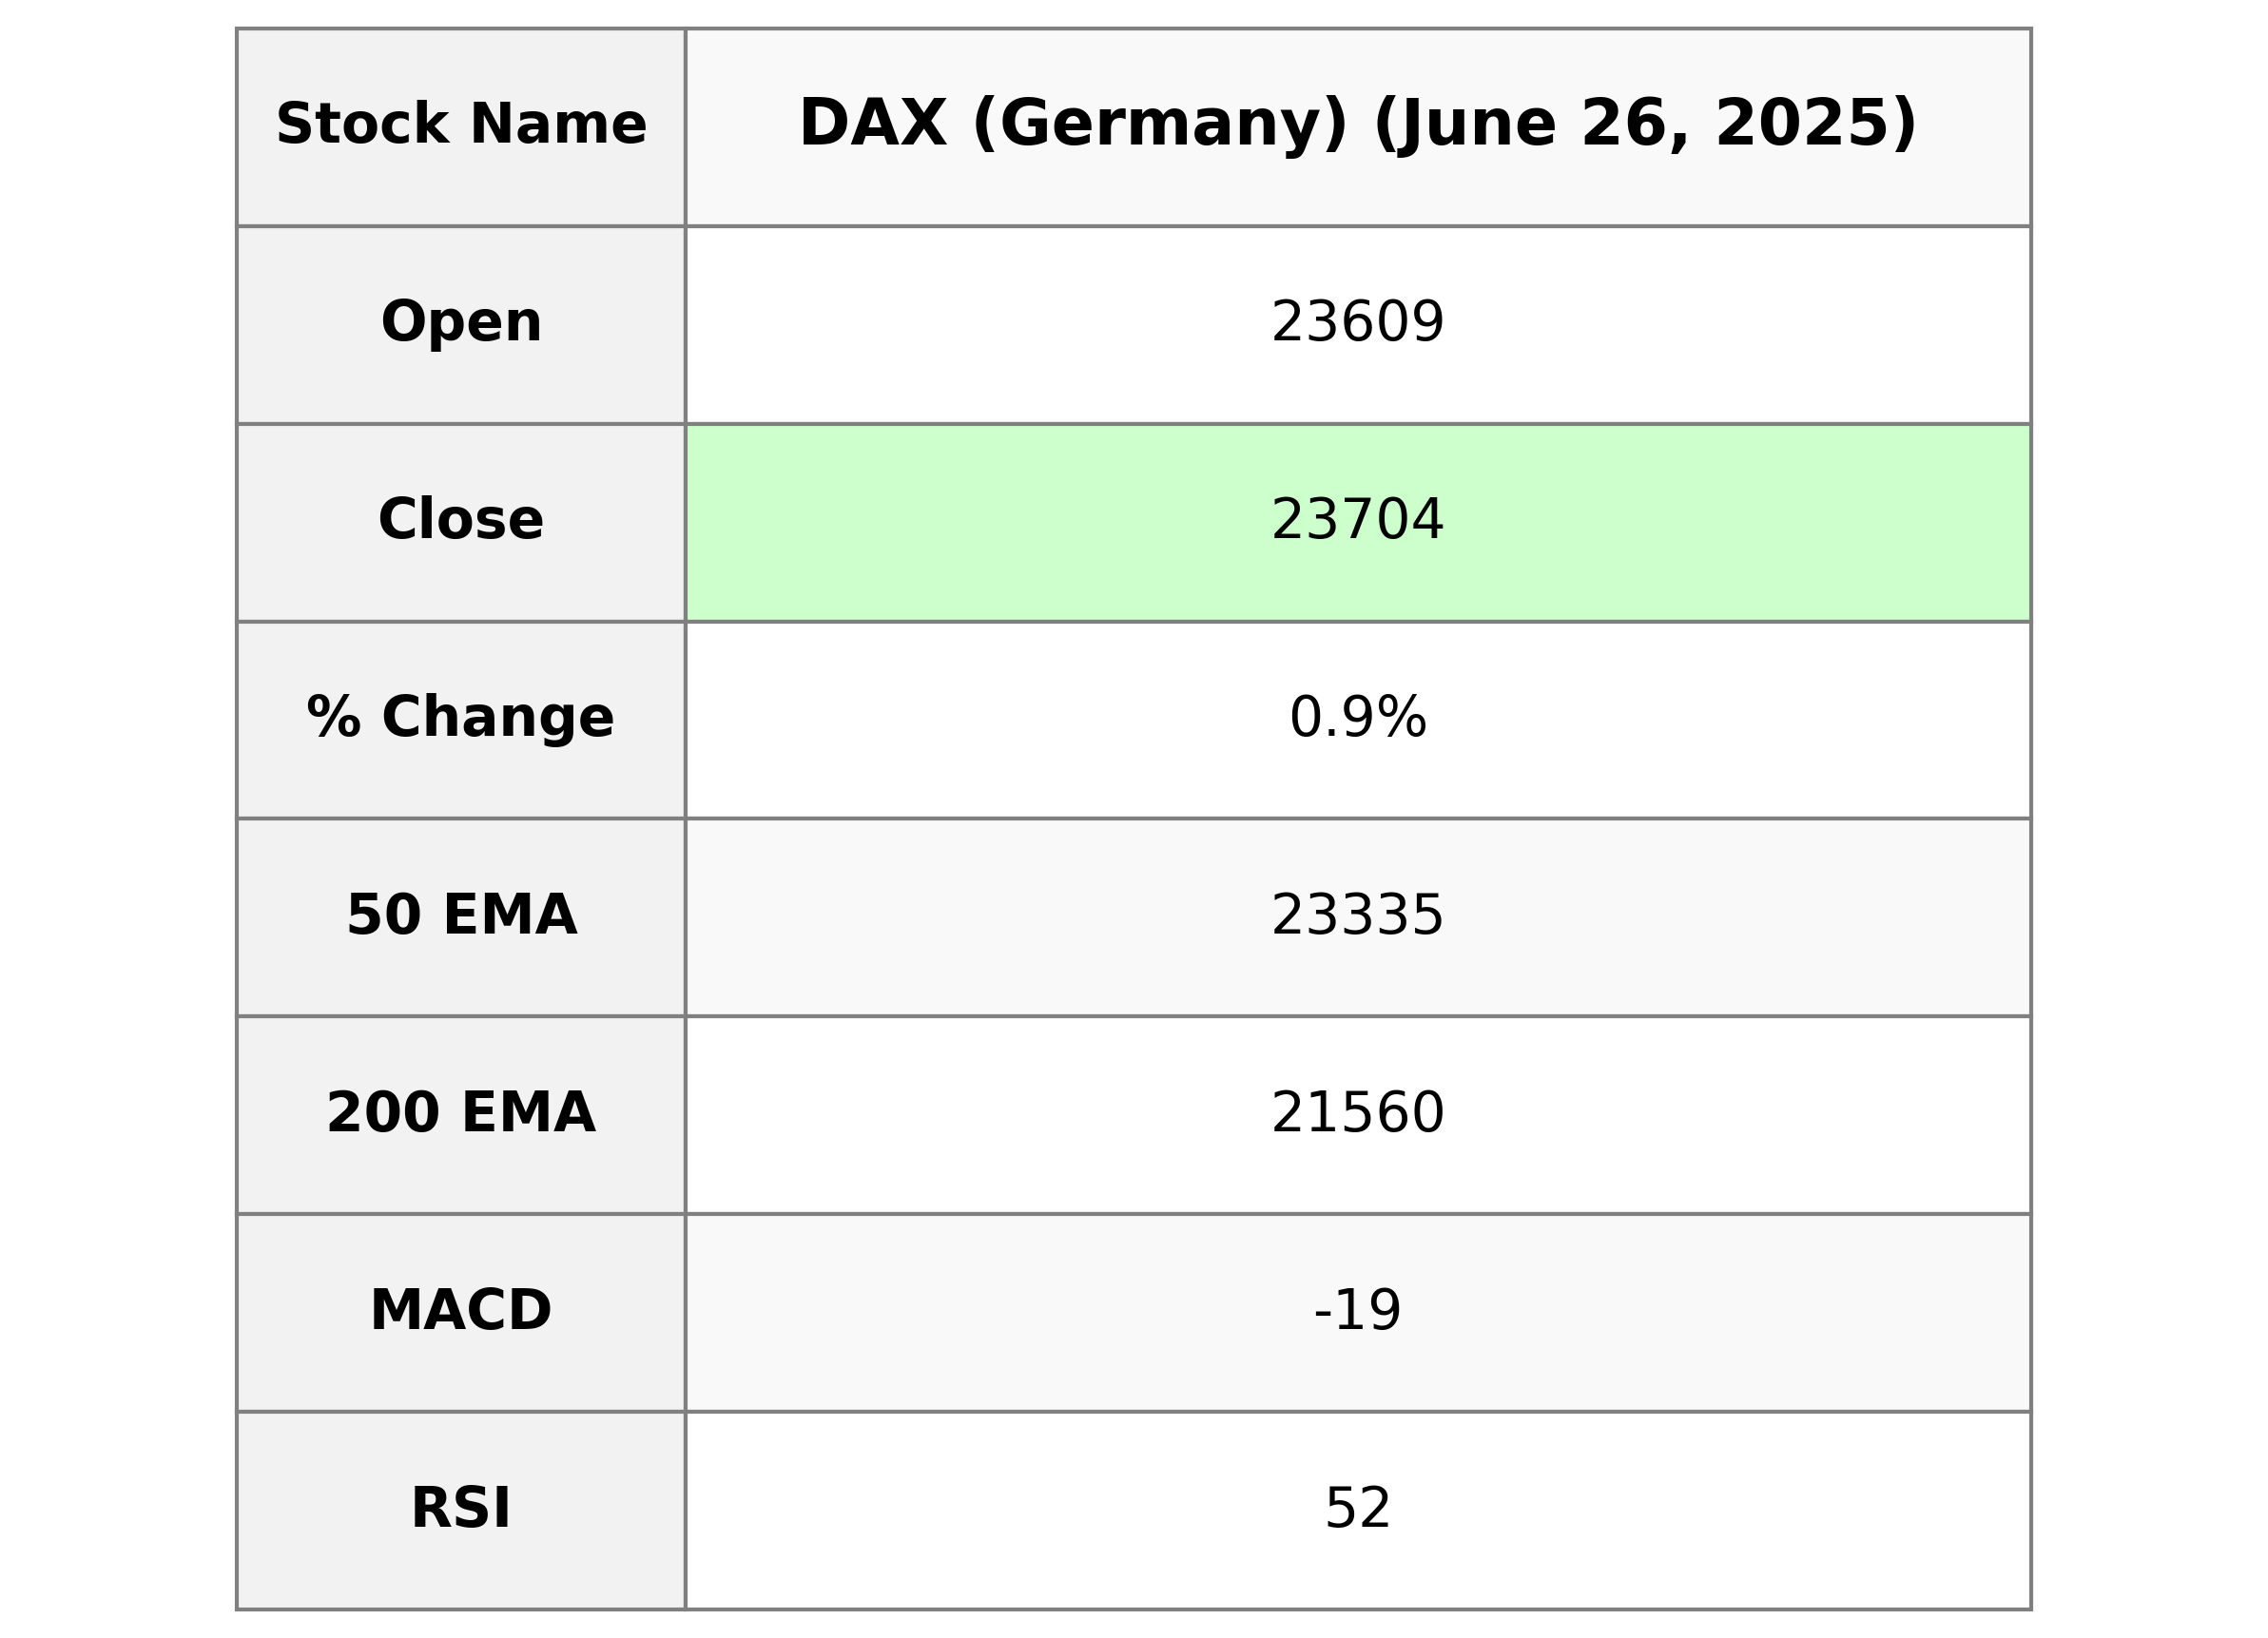
The DAX (Germany) opened at 23,609.30 and closed at 23,703.51, marking a positive change of 0.87% or a gain of 205.18 points from the previous close of 23,498.33. Despite the trading session's zero-volume data, technical indicators suggest a slightly bullish sentiment with the RSI at 52.40. However, the MACD is negative at -18.79, indicating potential caution in the short term.
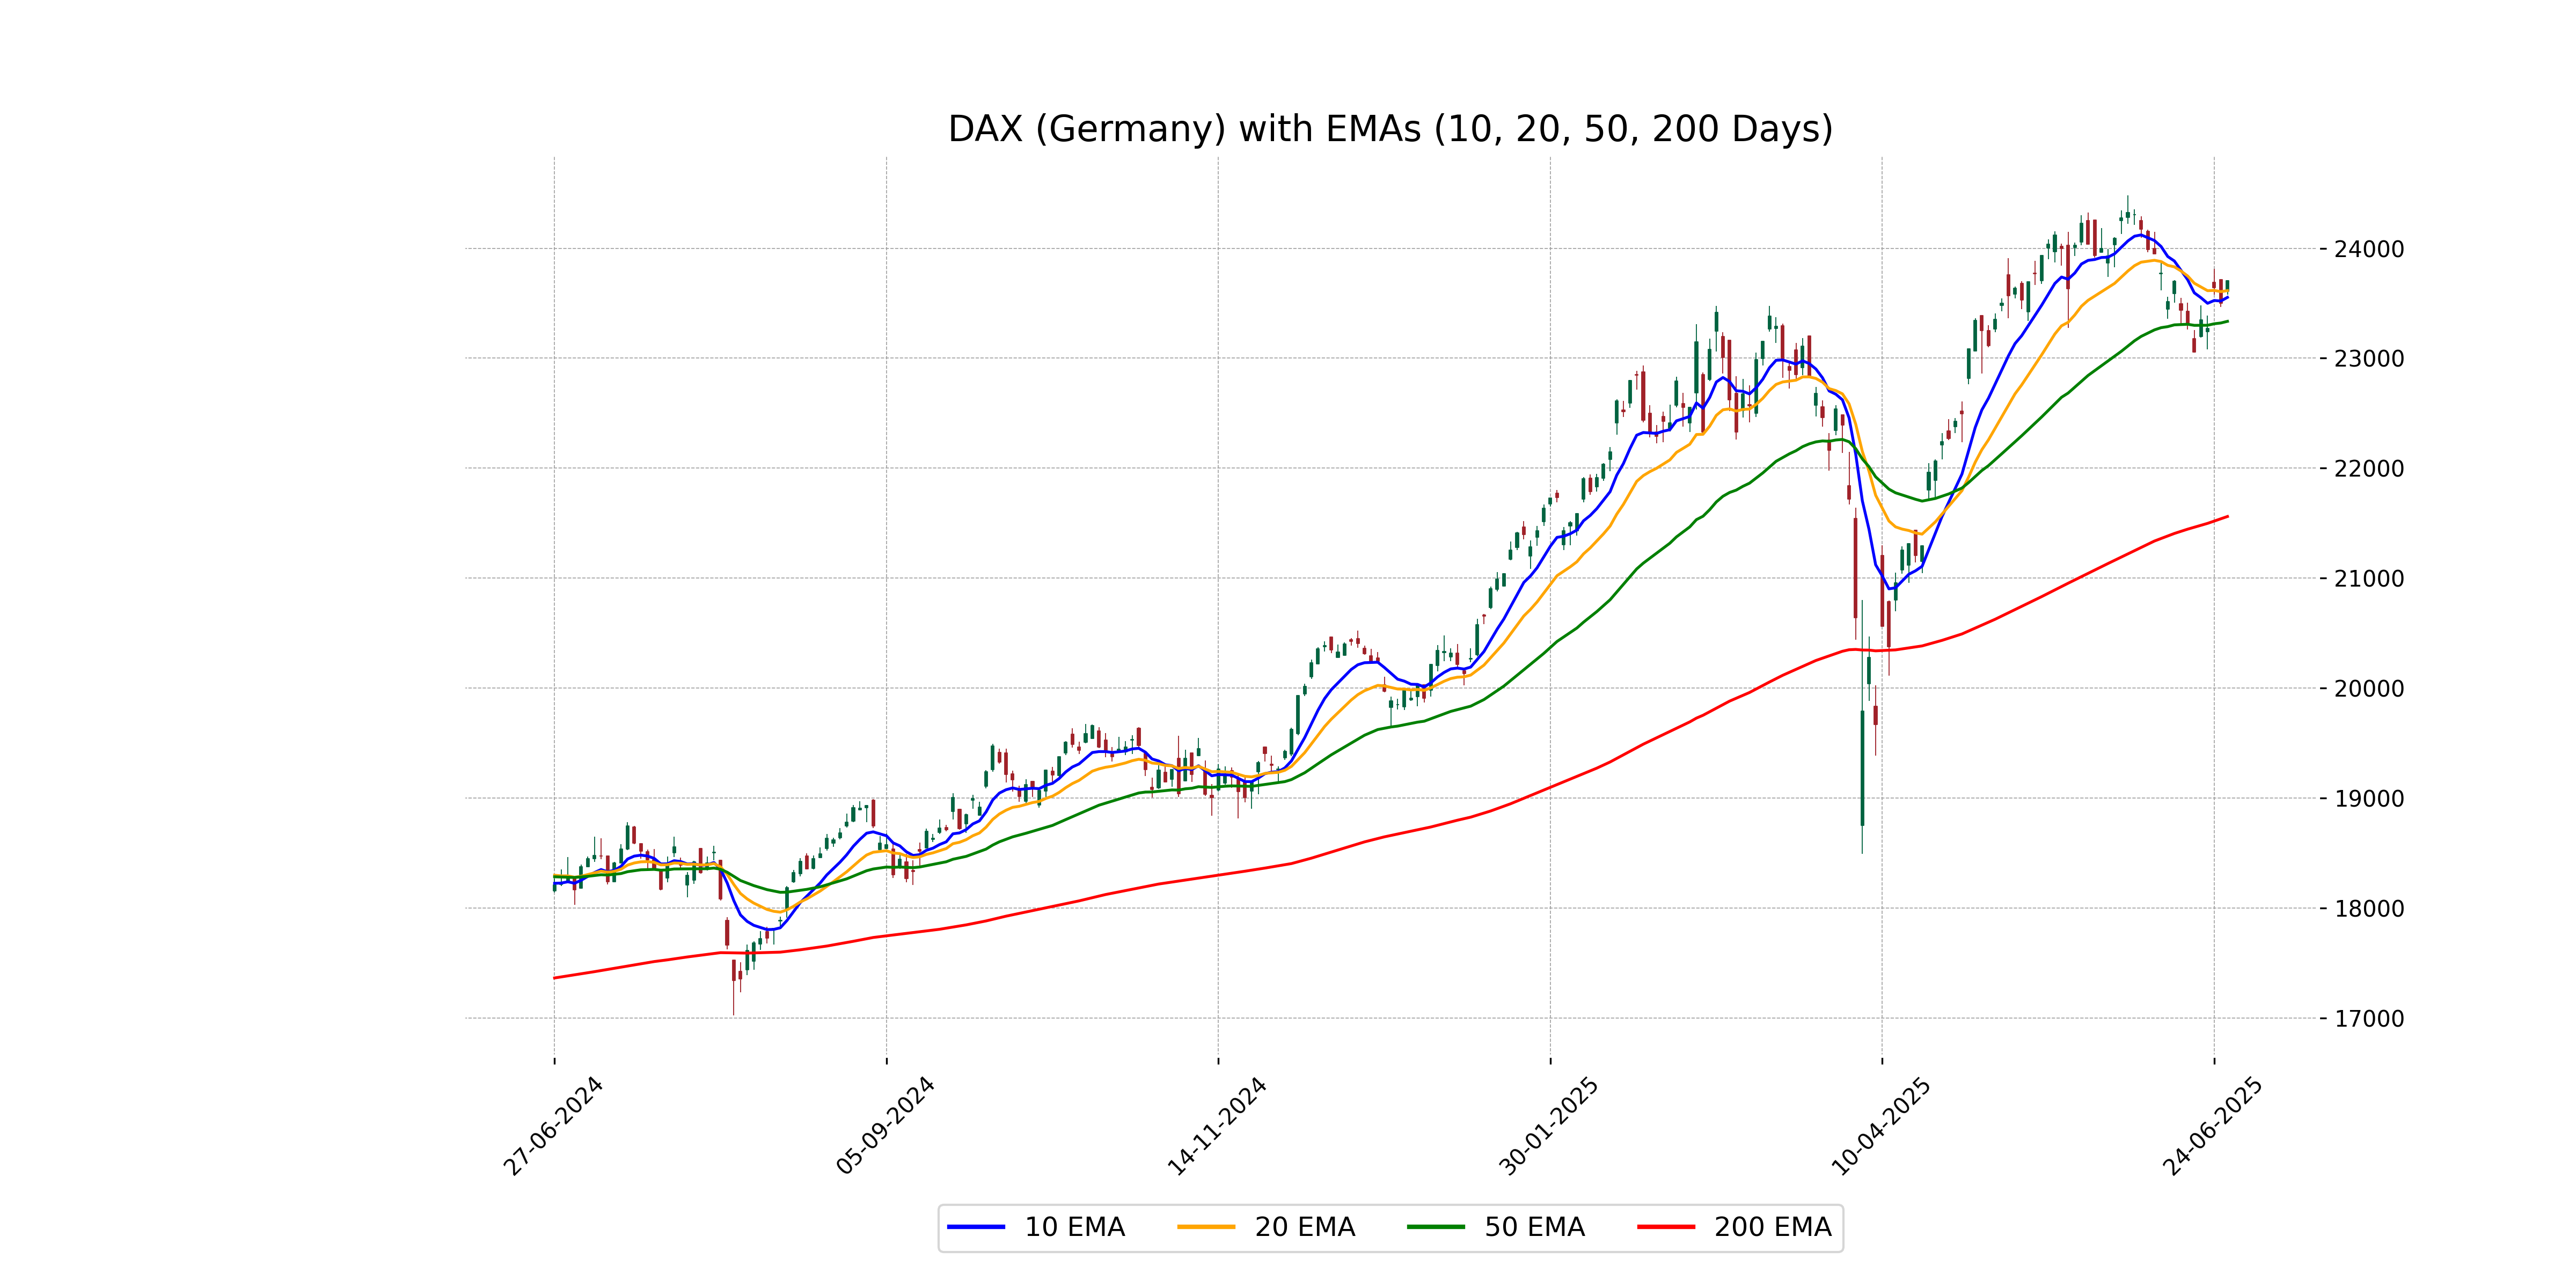
Relationship with Key Moving Averages
The DAX (Germany) closed at 23,703.51, significantly above its 50 EMA of 23,335.39 and the 200 EMA of 21,560.41, indicating a bullish trend. It also closed above the 10 EMA of 23,553.55 and 20 EMA of 23,614.80, suggesting short-term strength.
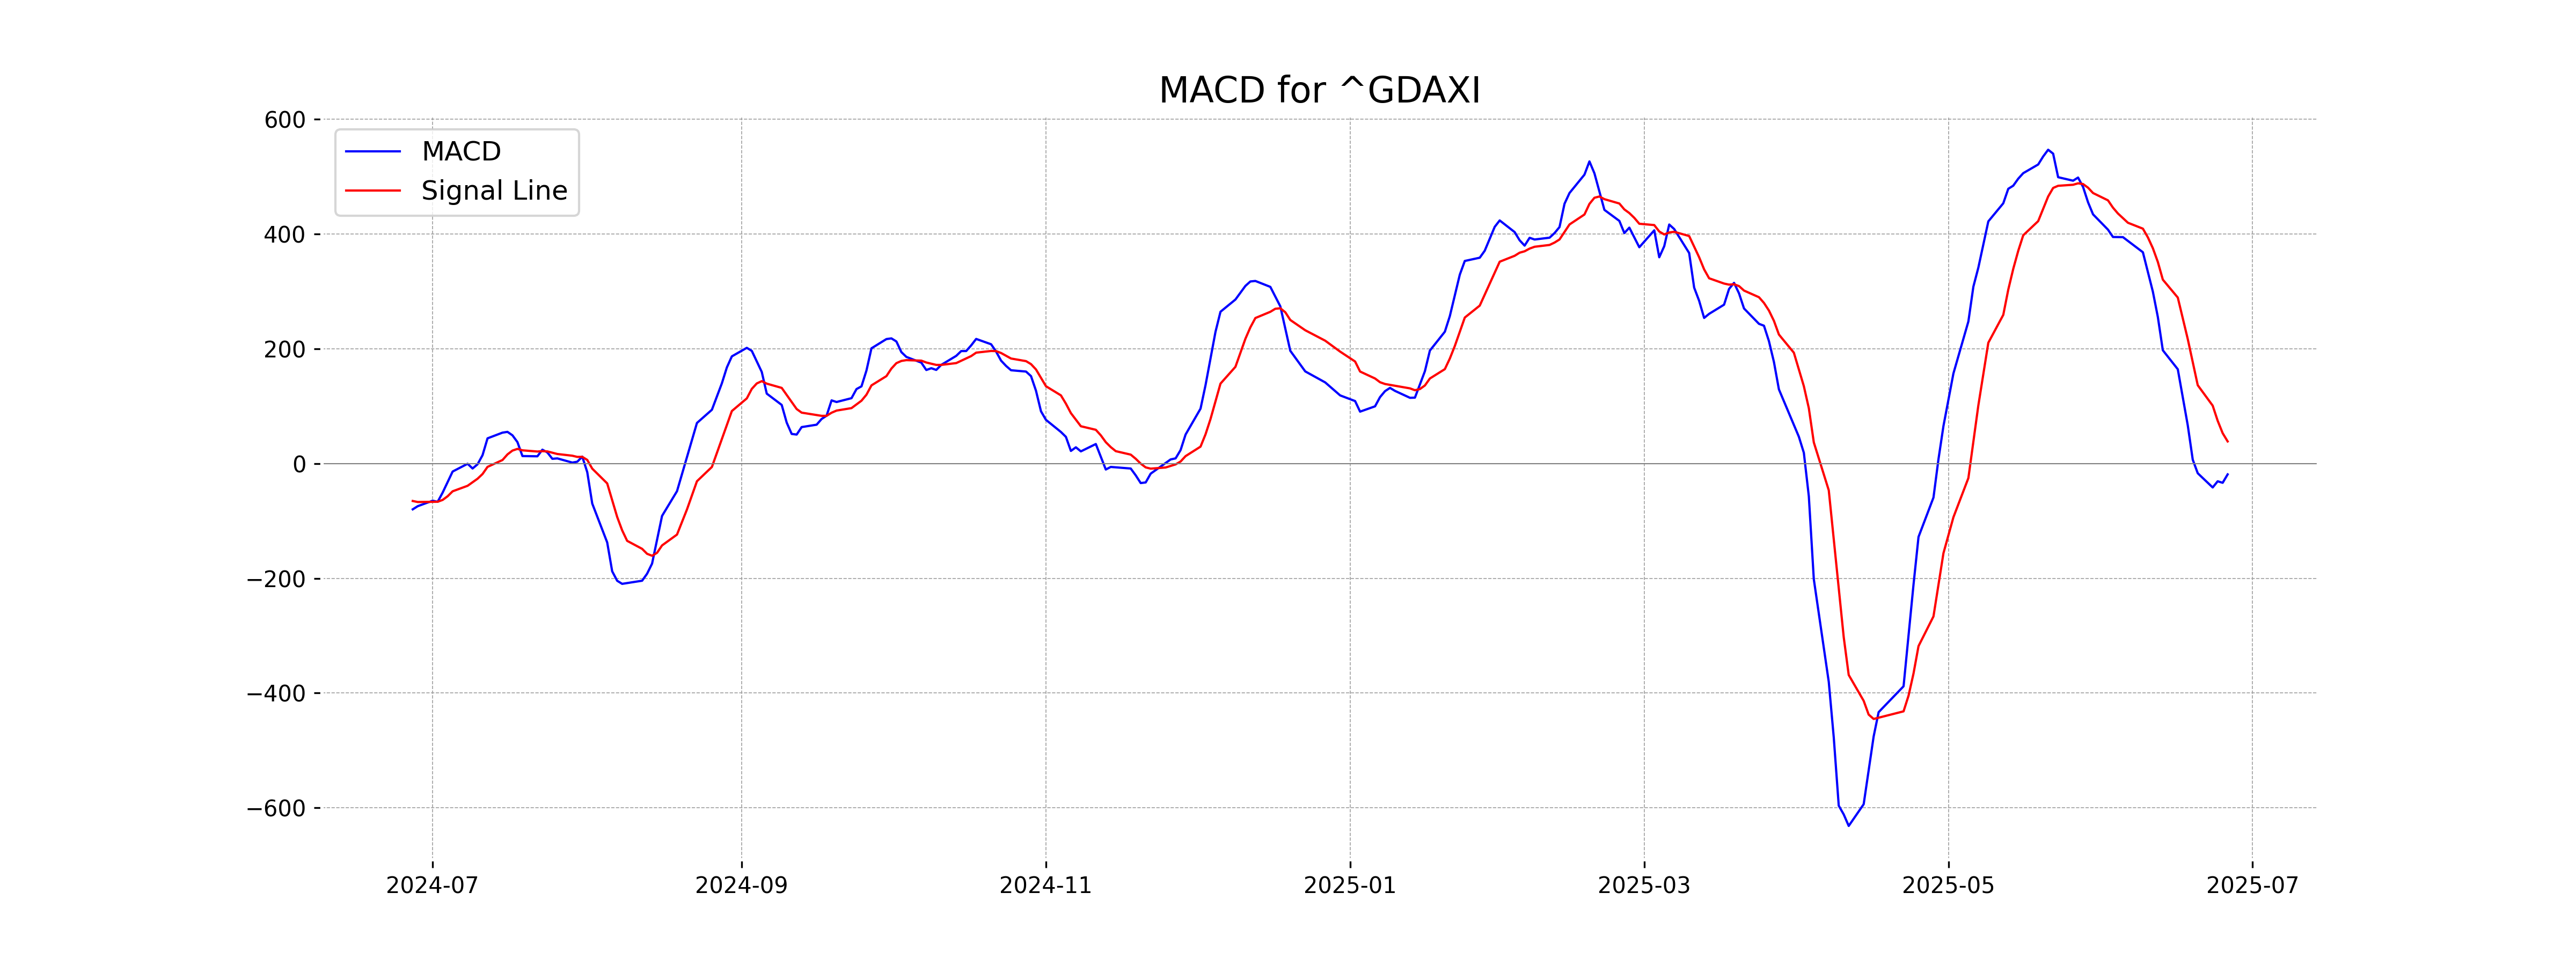
Moving Averages Trend (MACD)
Based on the stock data, the MACD for DAX (Germany) is -18.79, while the MACD Signal is 38.64. This suggests a bearish momentum, as the MACD line is below the MACD Signal line. However, further confirmation from other indicators might be beneficial before making any trading decision.
RSI Analysis
RSI Analysis for DAX (Germany): The RSI value of 52.40 suggests that the DAX index is currently in a neutral state, neither overbought nor oversold. This indicates a balance between bullish and bearish pressures within the market.
Analysis for S&P 500 (US) - June 26, 2025
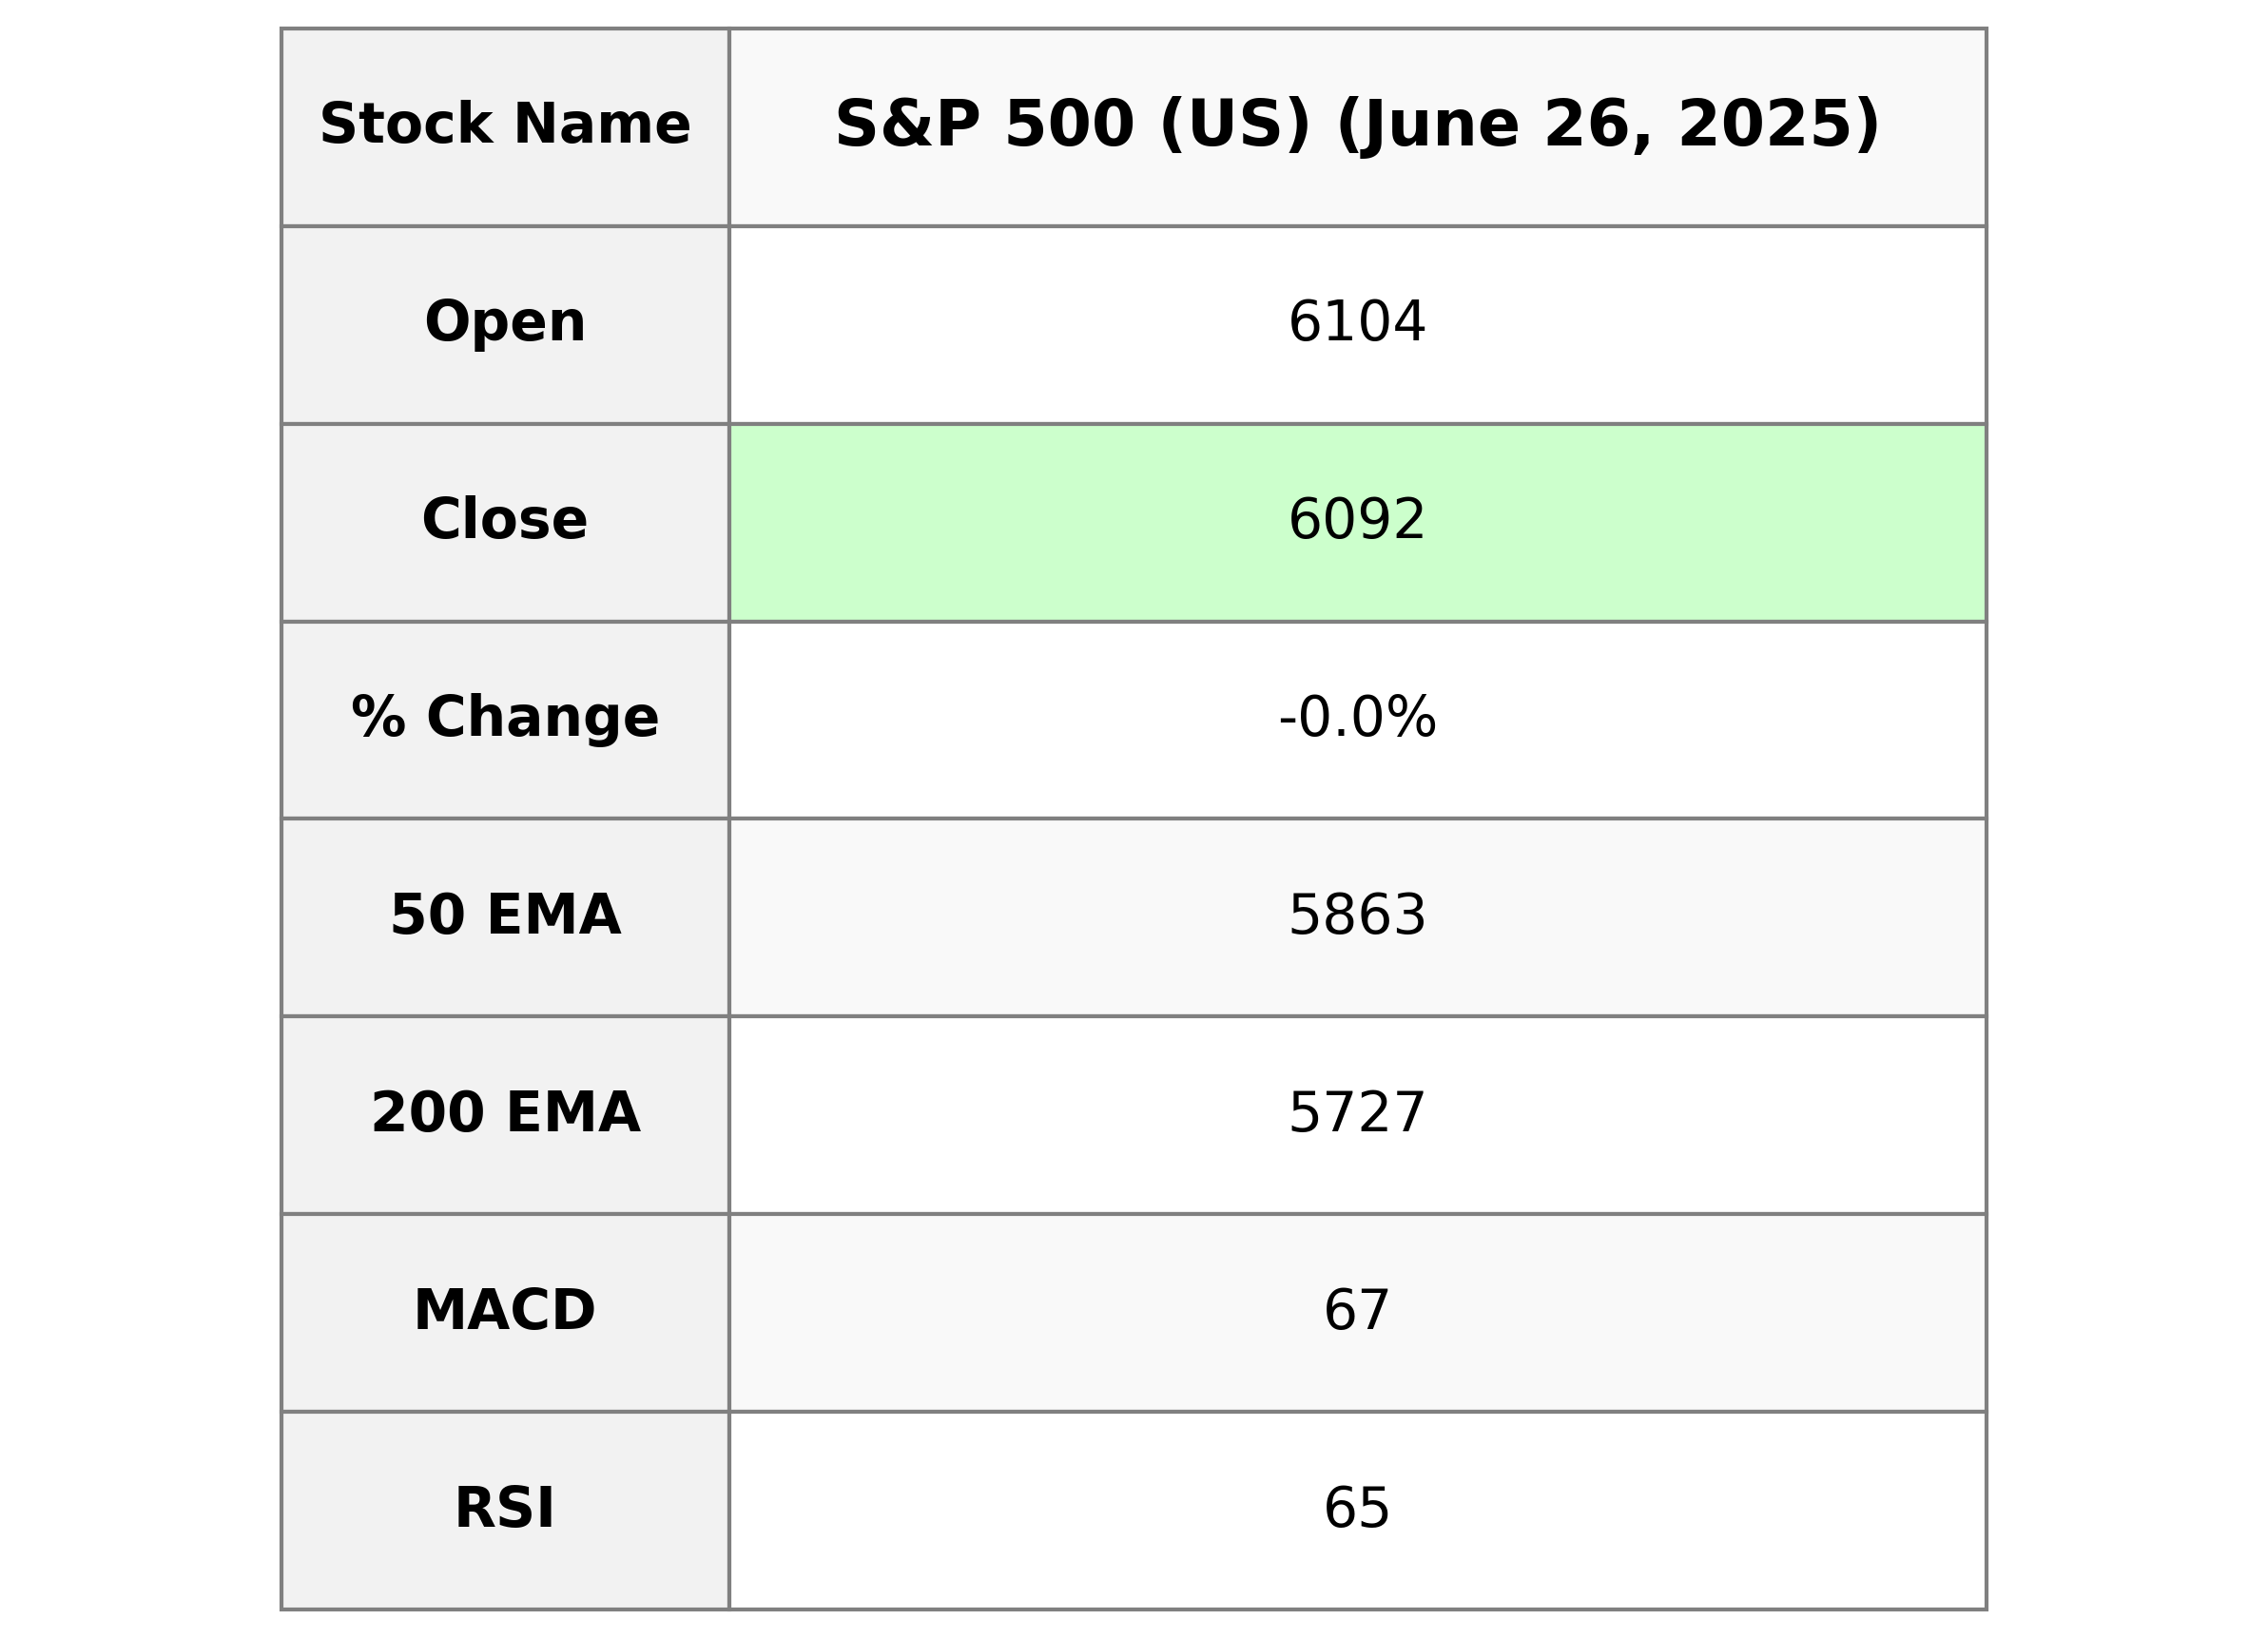
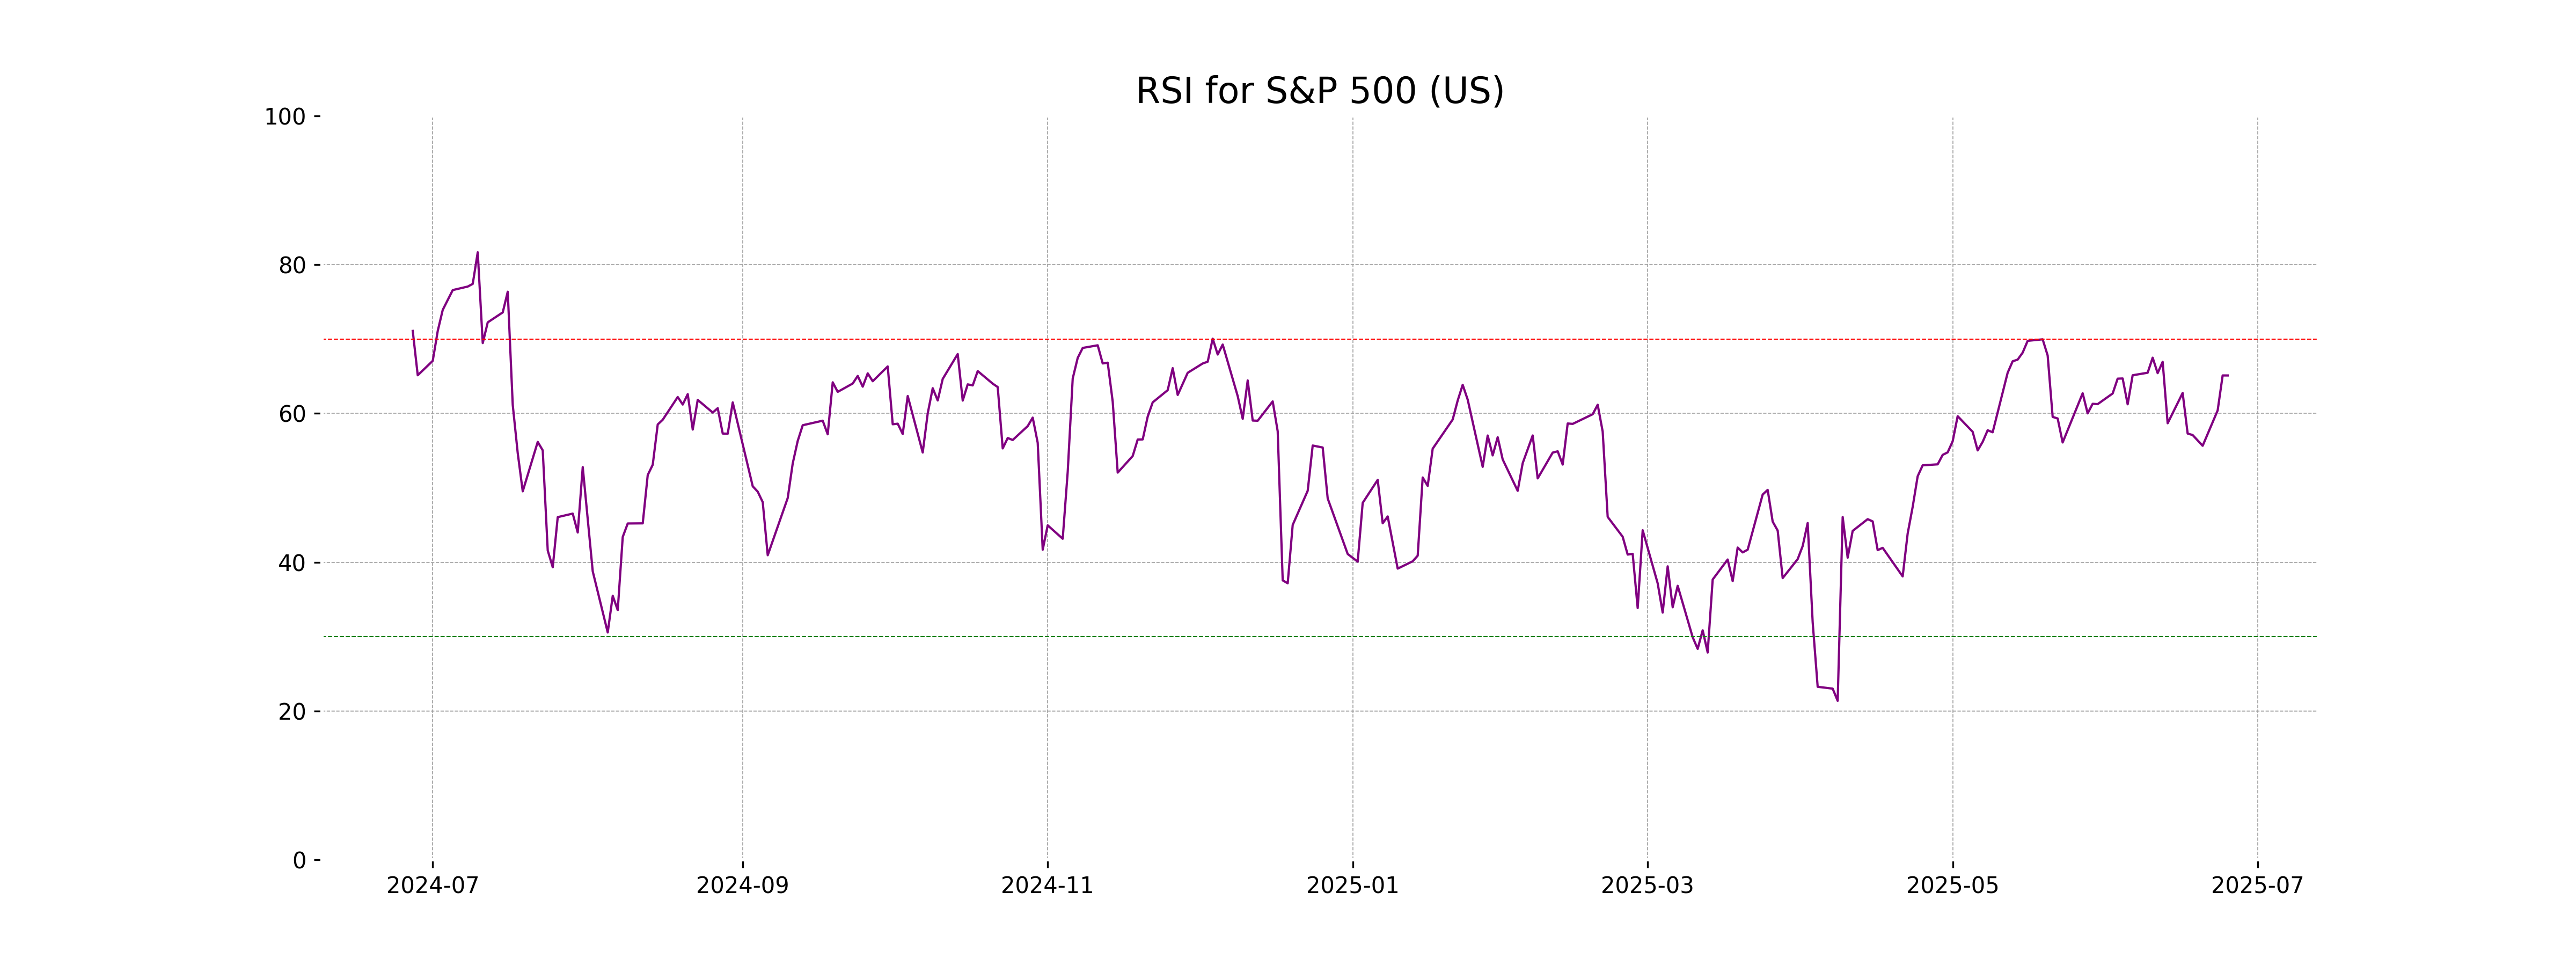
The S&P 500 (US) showed a minor decline with a closing value of 6092.16, slightly lower than the previous close at 6092.18, reflecting a negligible percentage change of -0.0003%. The index remained within a high of 6108.51 and a low of 6080.09, with a substantial trading volume of 5.17 billion. Indicators such as the Relative Strength Index (RSI) at 65.11 suggest a strong but not overbought market, with the 50-day EMA above the 200-day EMA, indicating an overall upward trend.
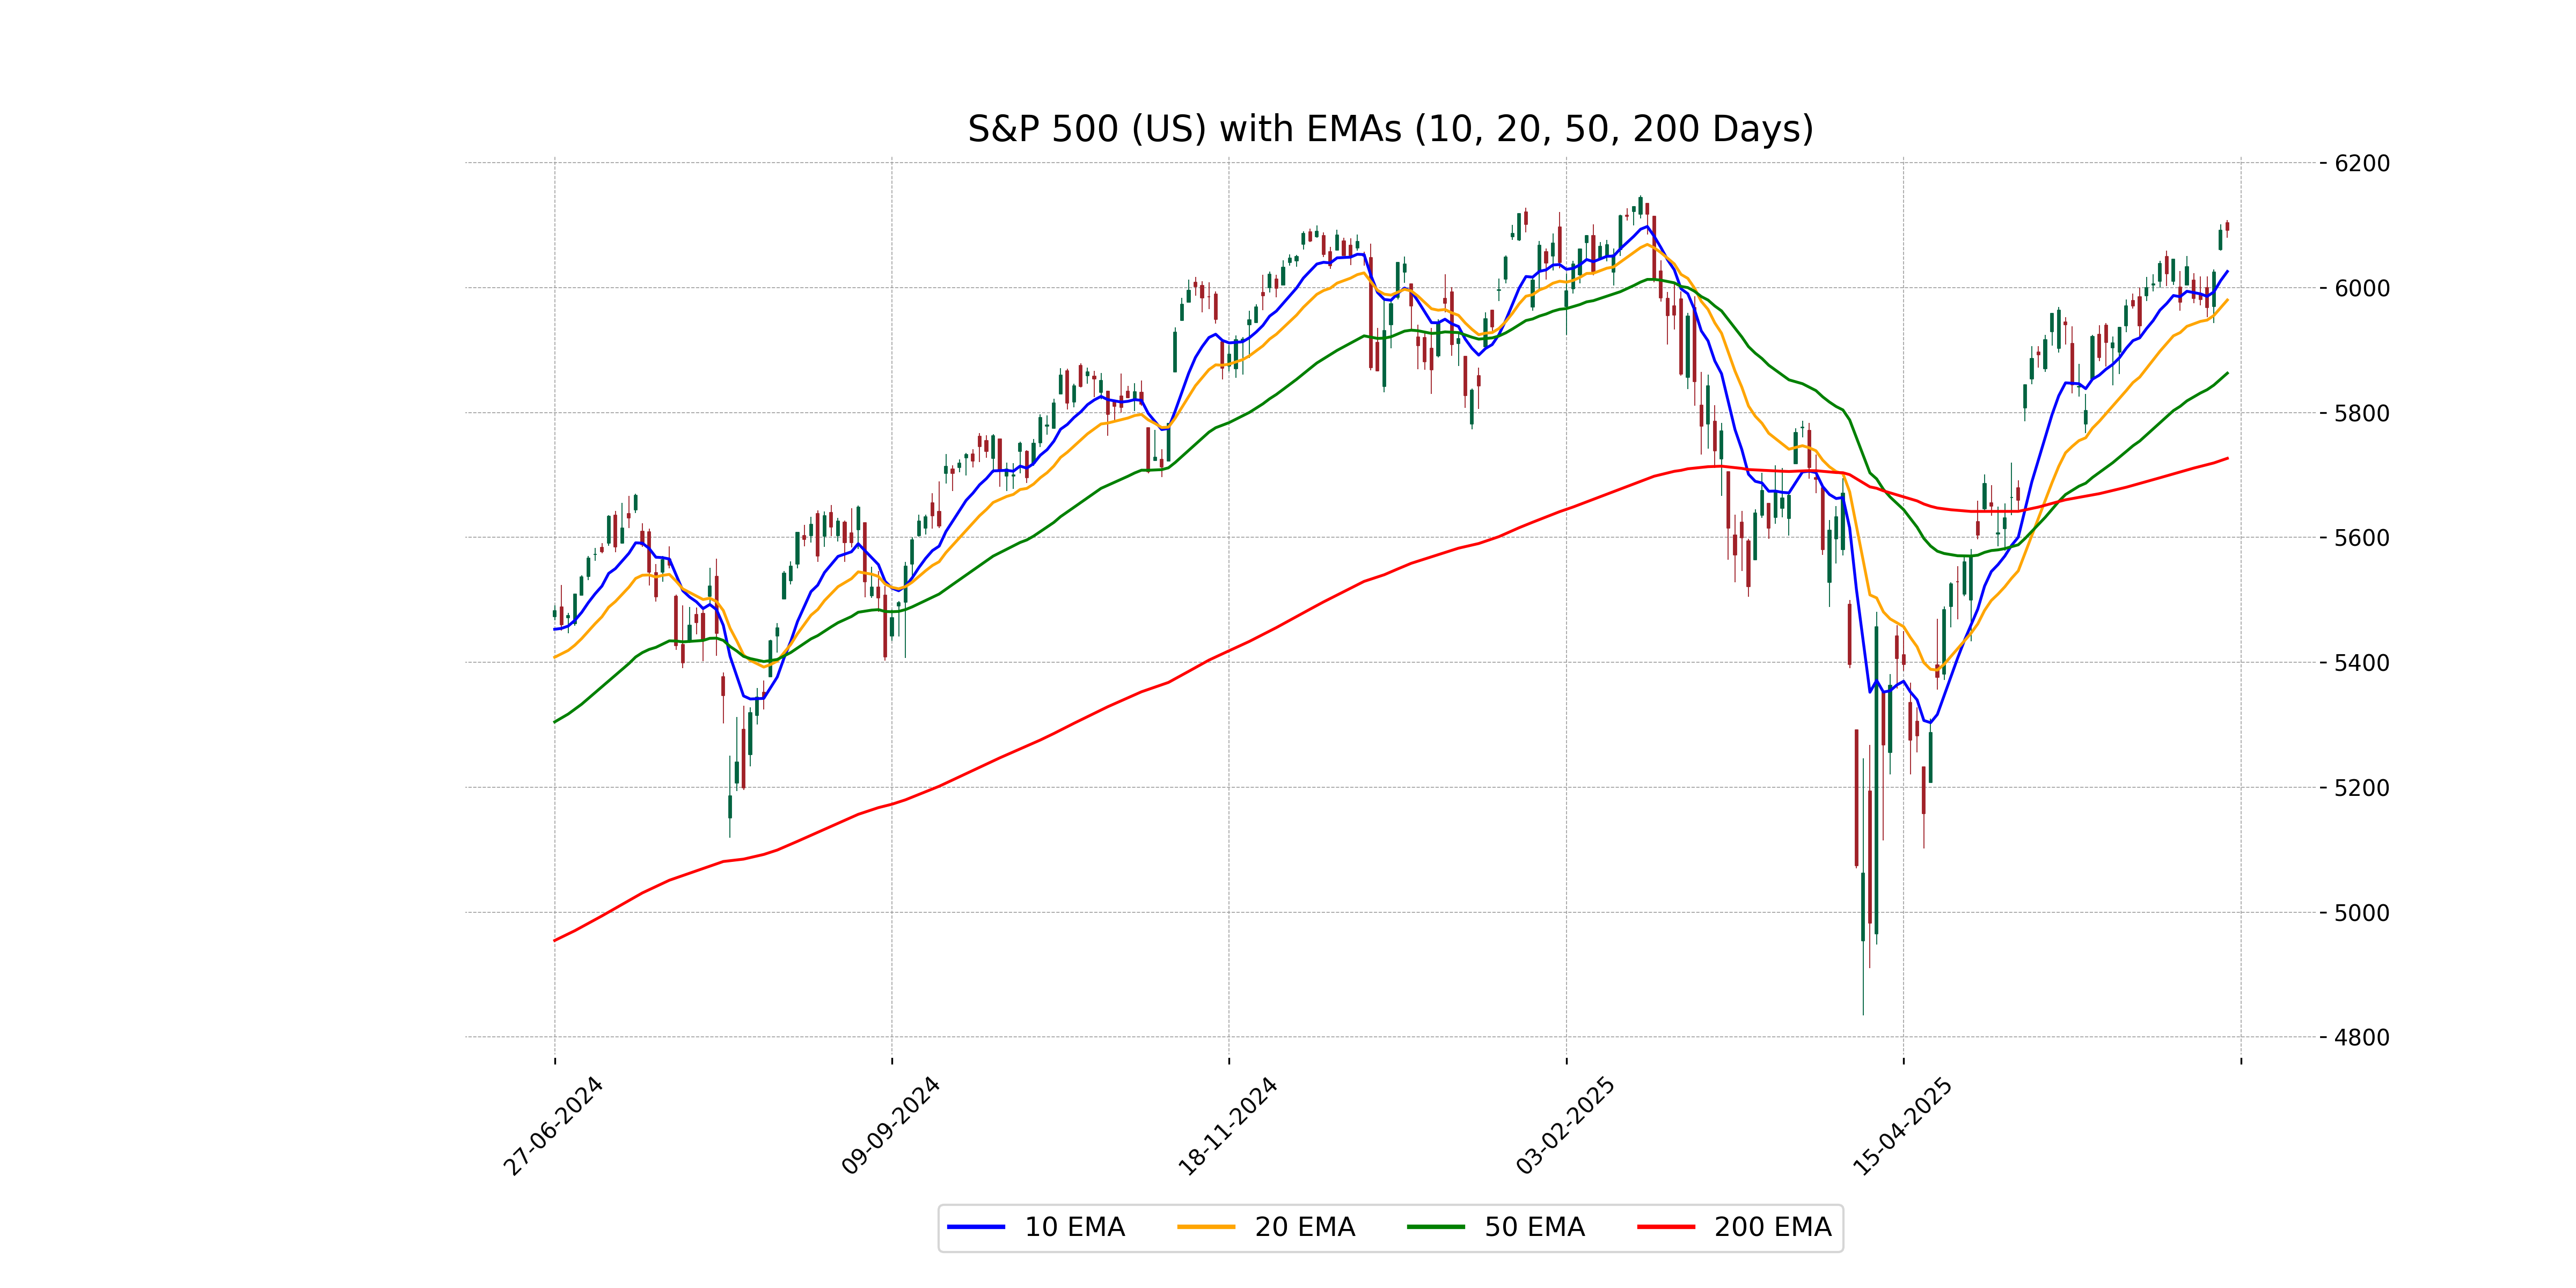
Relationship with Key Moving Averages
The S&P 500 (US) is currently trading slightly above the 10-day and 20-day EMAs, indicative of short-term strength. However, it remains significantly above the 50-day and 200-day EMAs, suggesting strong positive momentum over both the medium and long terms.
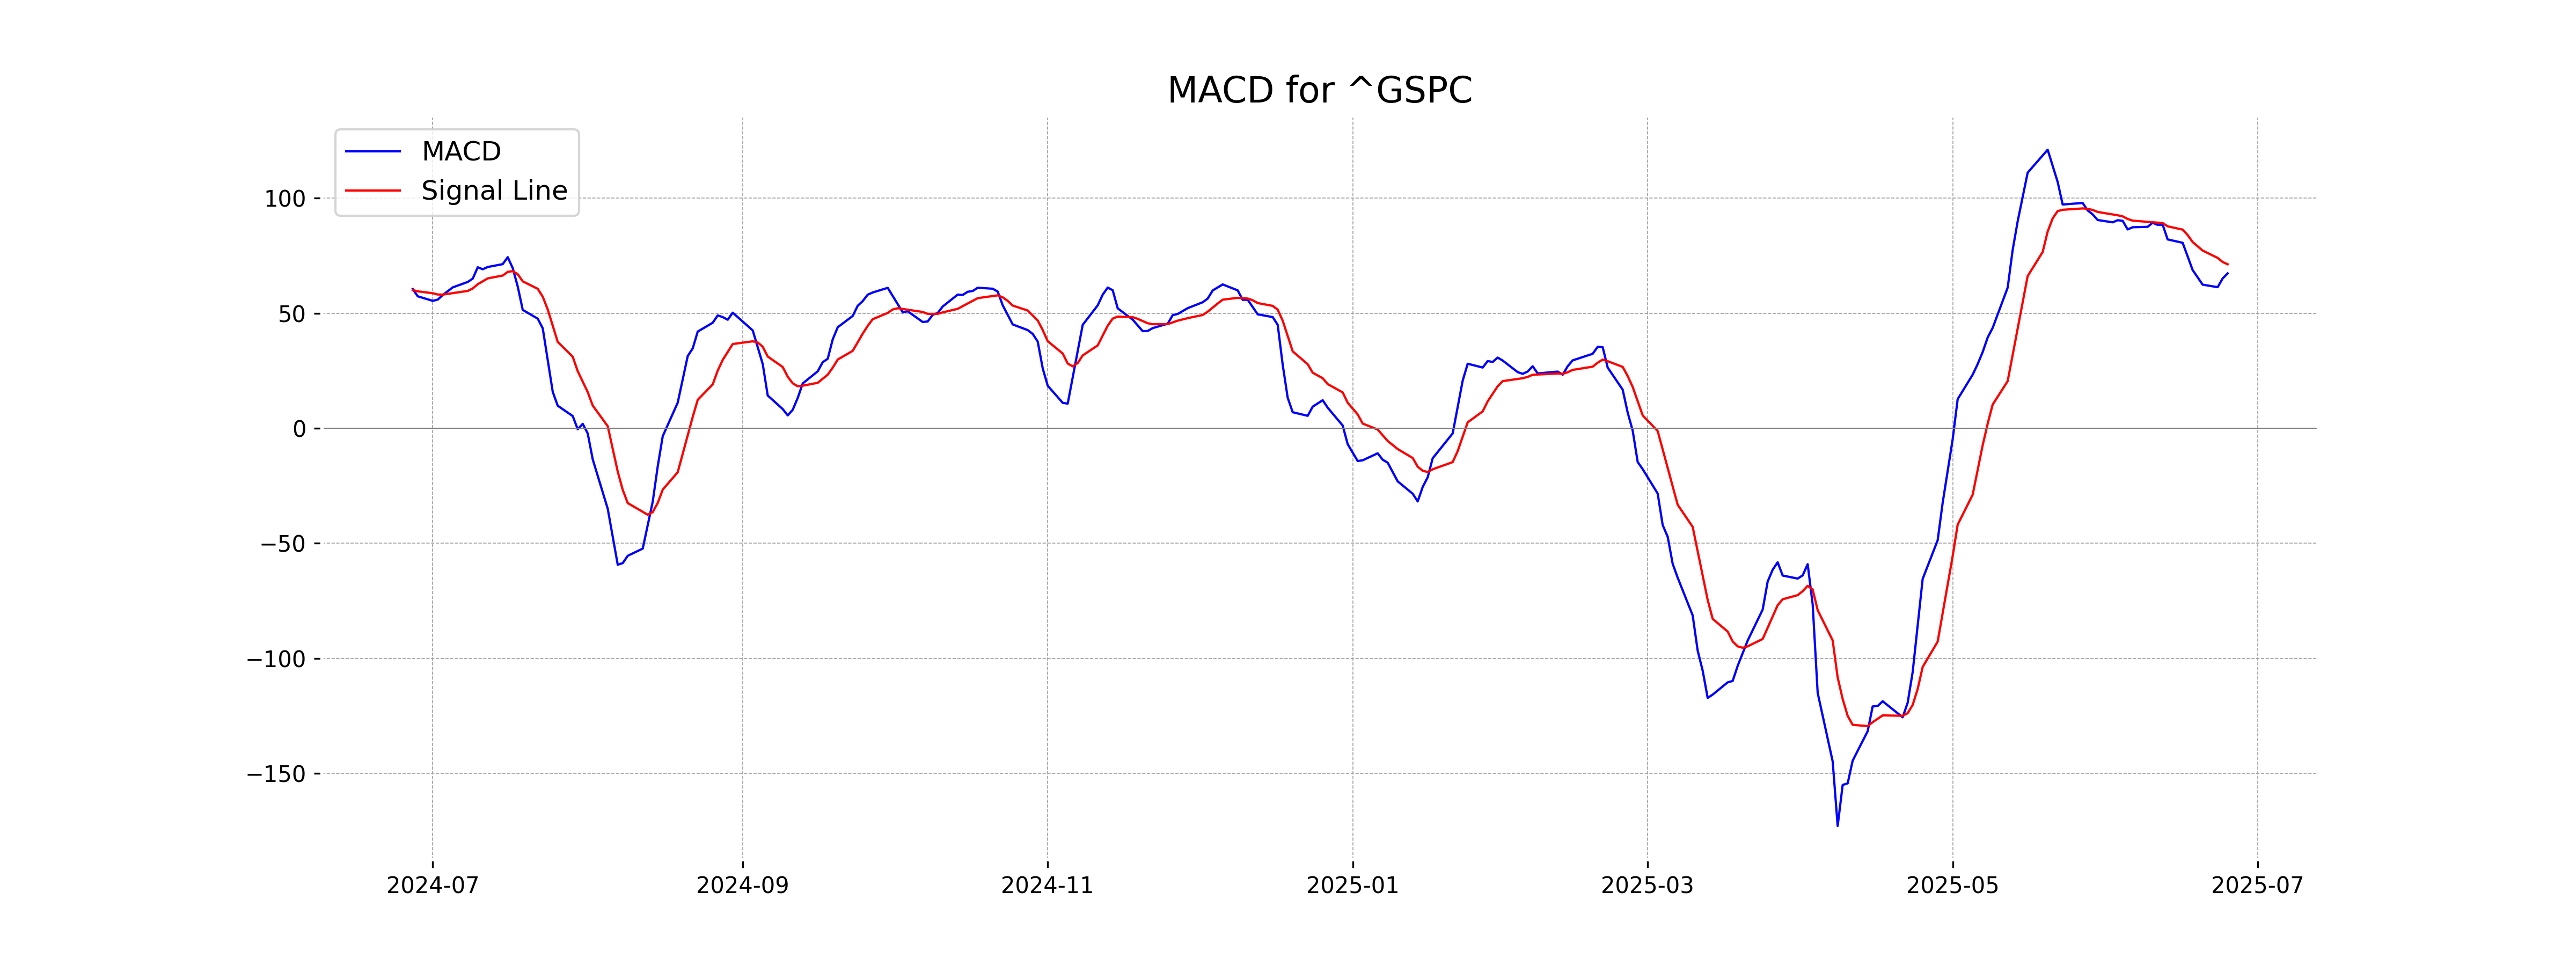
Moving Averages Trend (MACD)
The MACD for S&P 500 is 67.34, which is below the MACD Signal of 71.29. This suggests a possible bearish momentum as the MACD line is crossing below the signal line. The Relative Strength Index (RSI) at 65.11 indicates the stock is nearing overbought conditions.
RSI Analysis
{'RSI_Analysis': 'The RSI value for S&P 500 (US) is 65.11, indicating that the index is approaching the overbought range but is currently in a neutral zone. Traders should remain cautious as further increases could suggest overbought conditions.'}
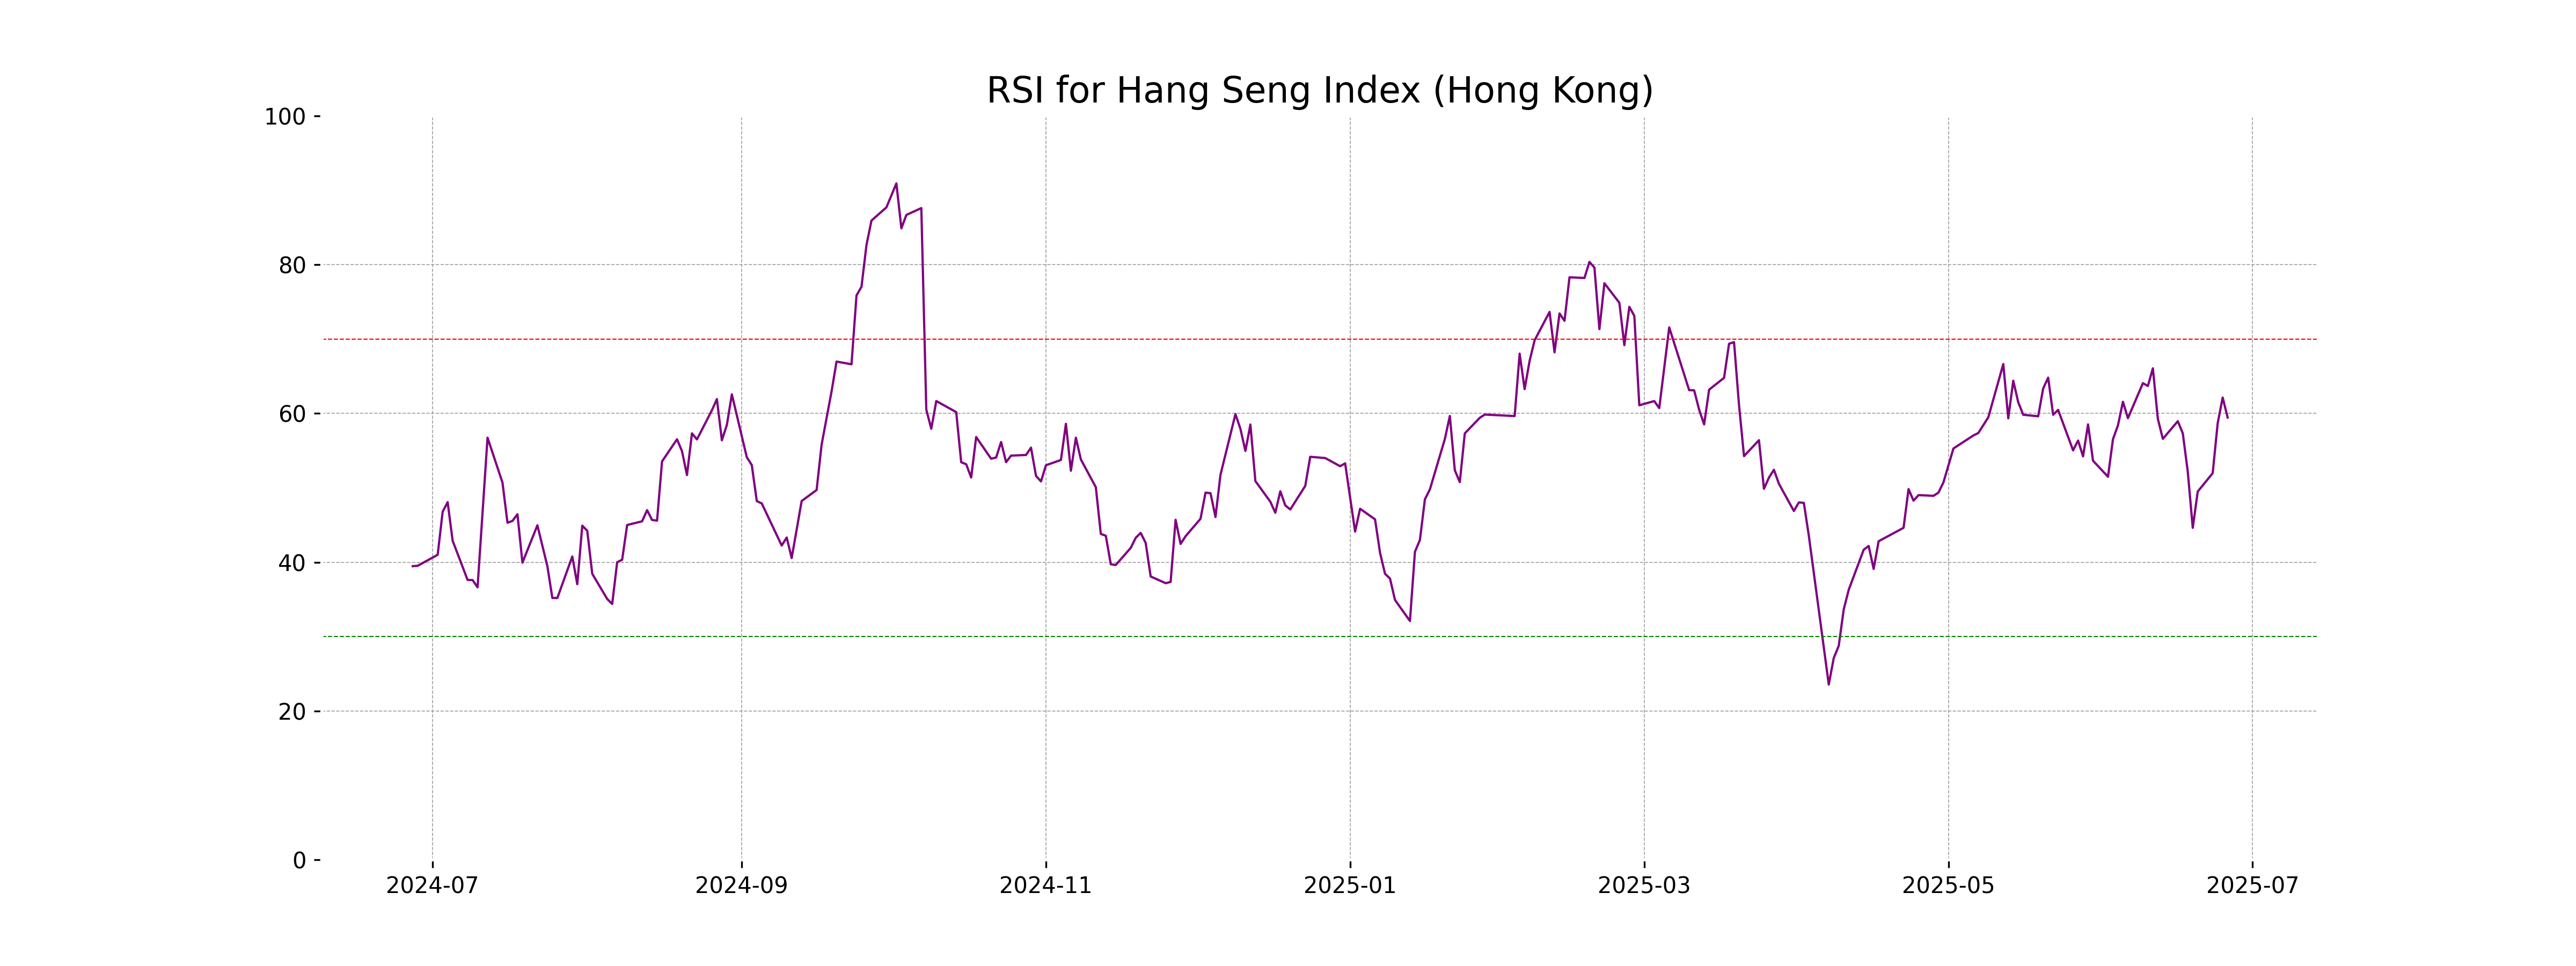
Analysis for Hang Seng Index (Hong Kong) - June 26, 2025
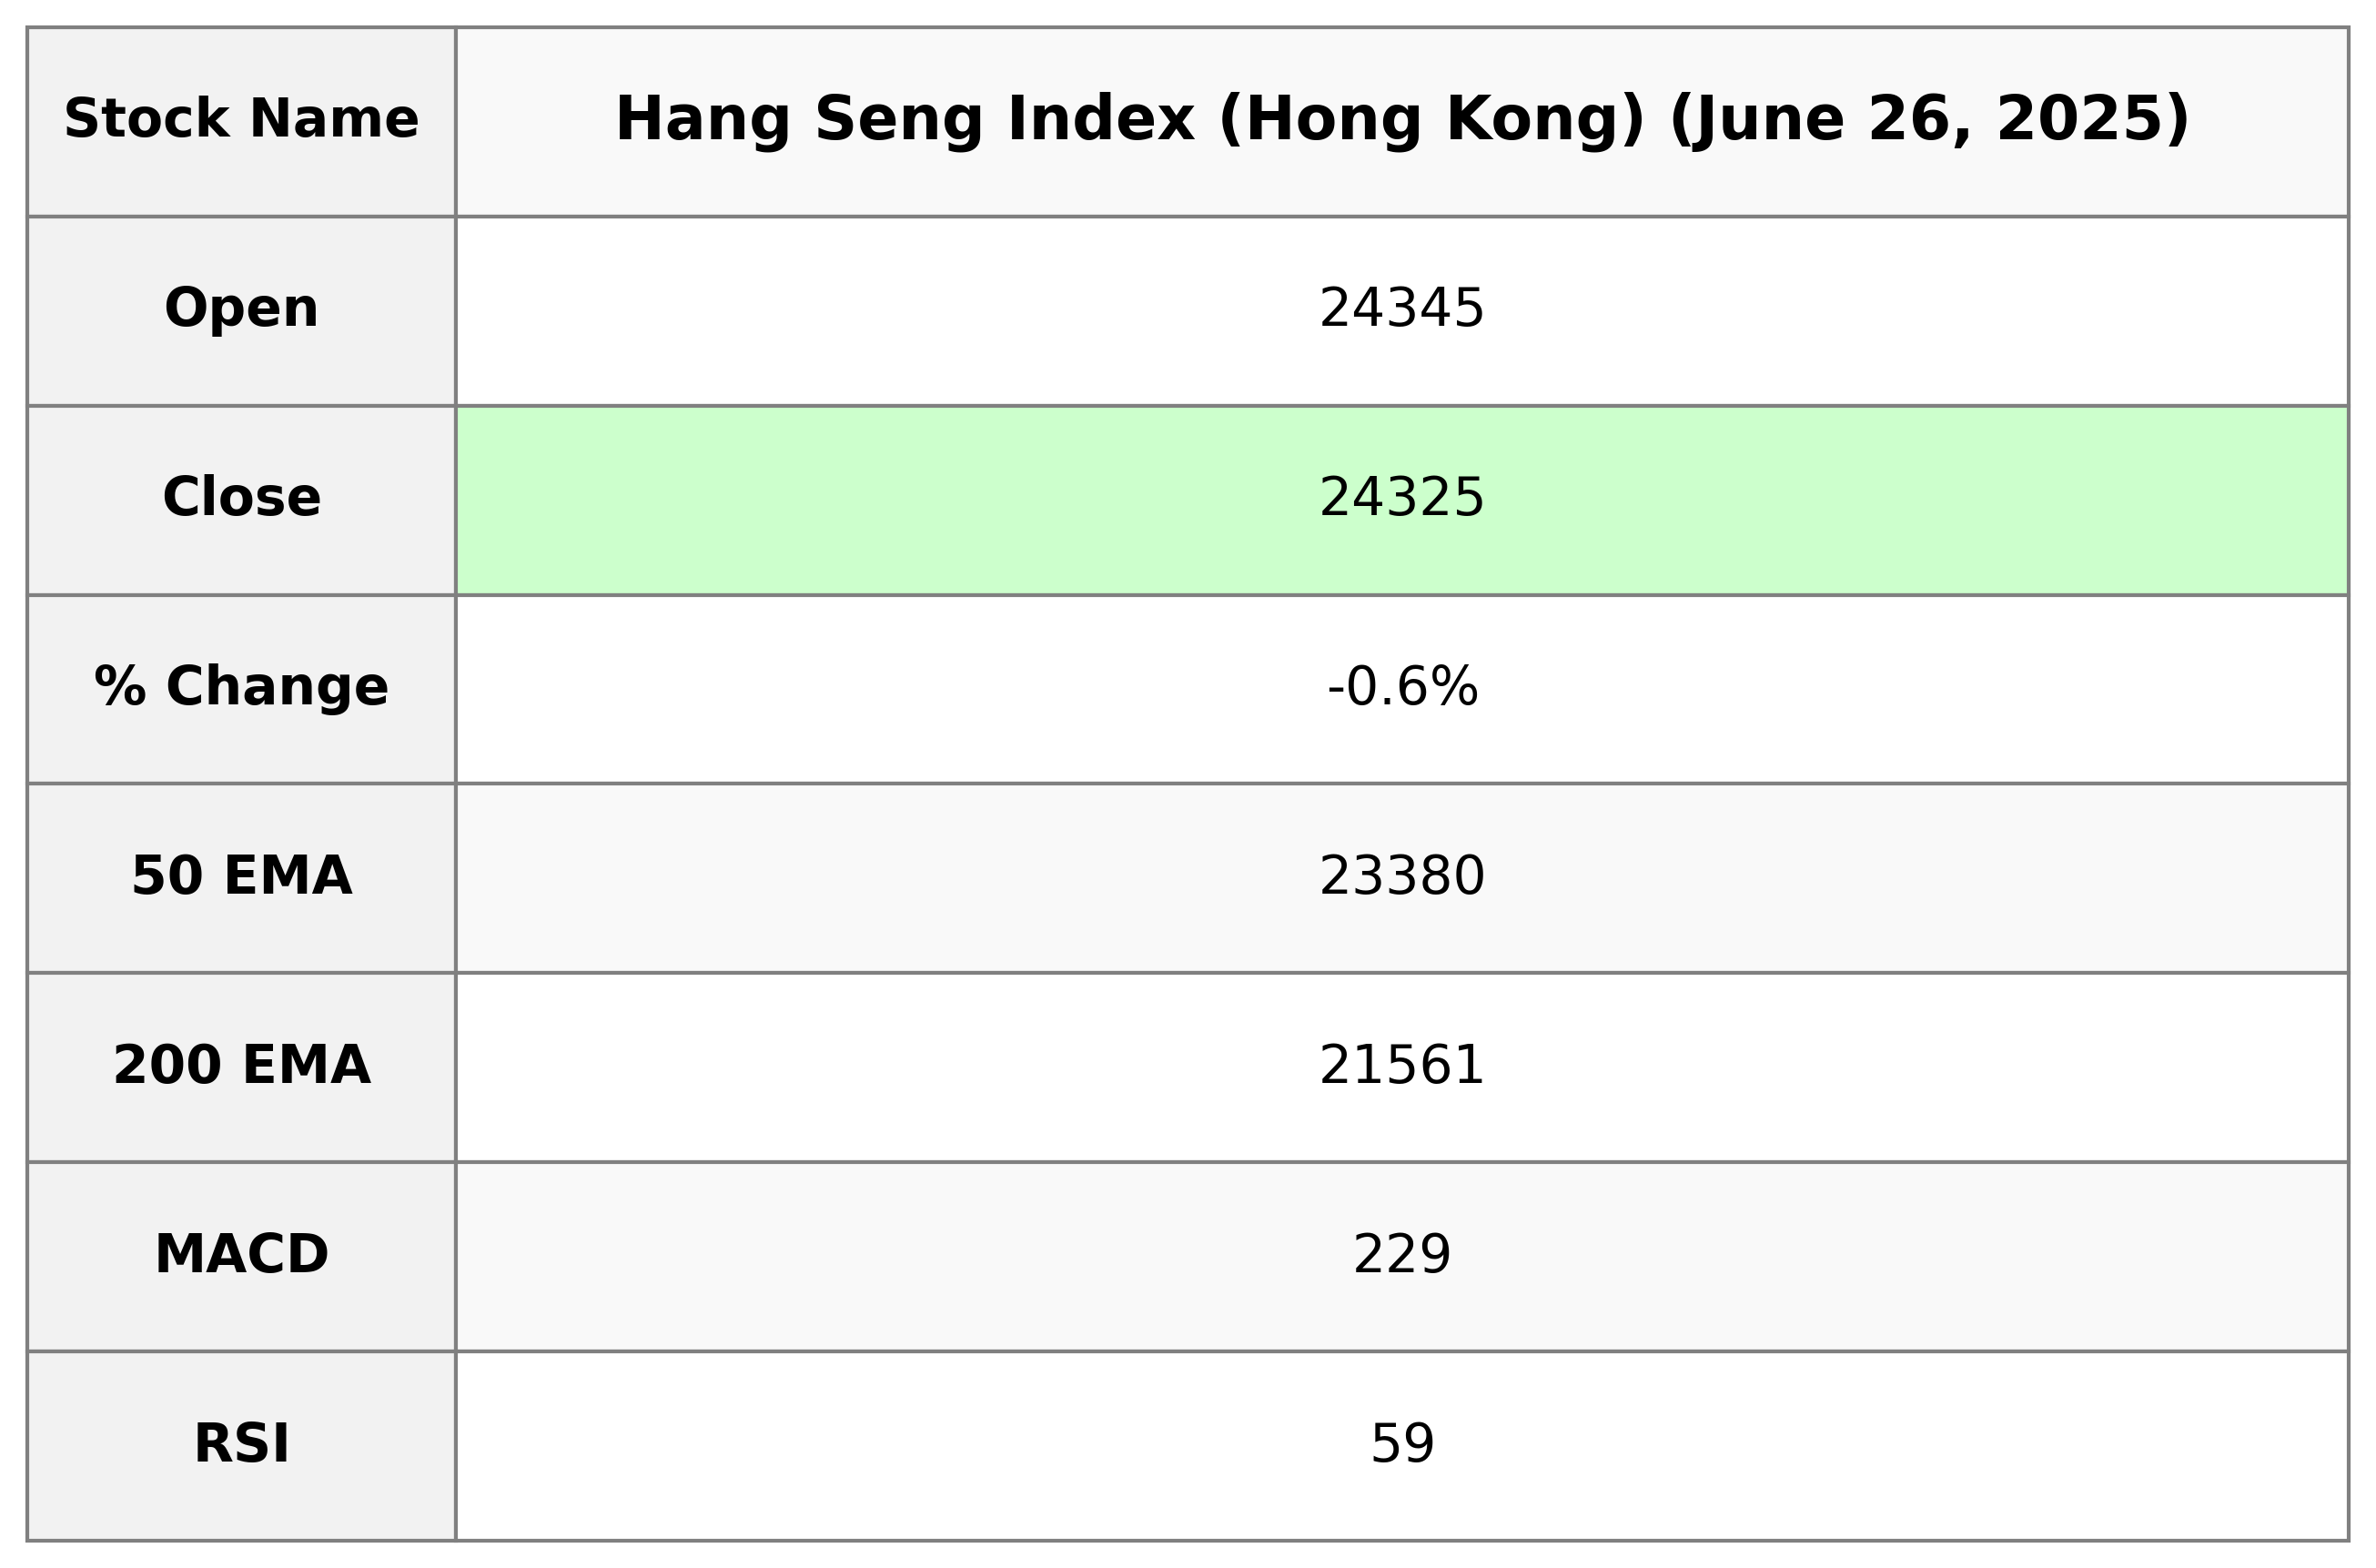
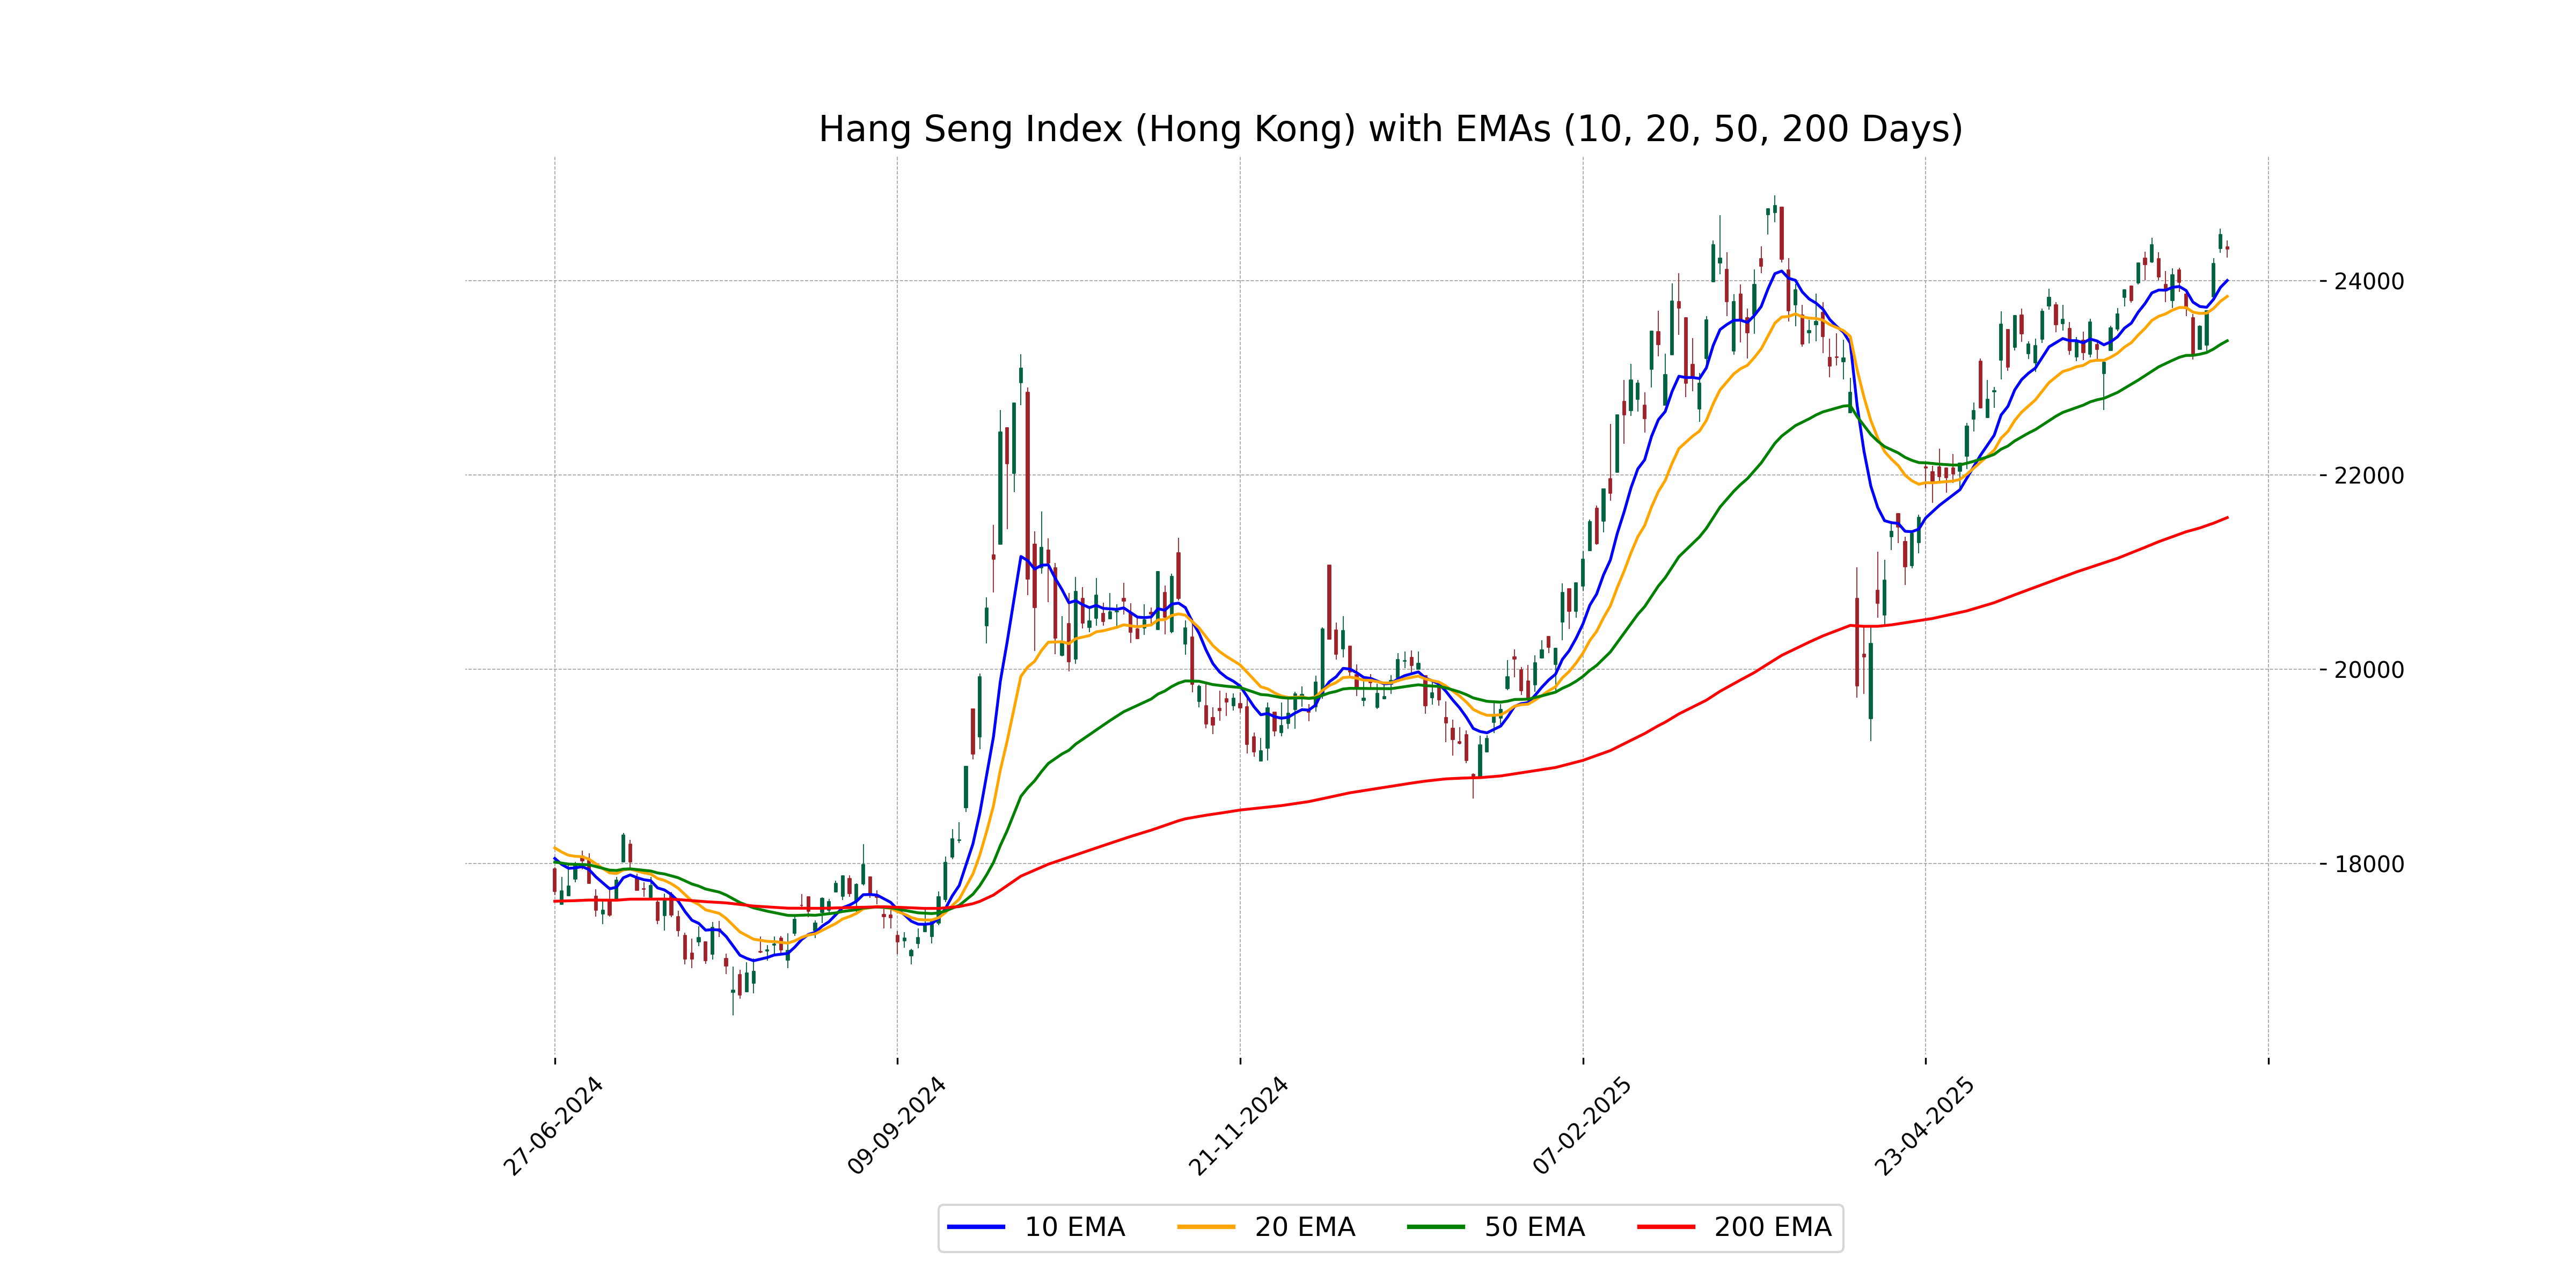
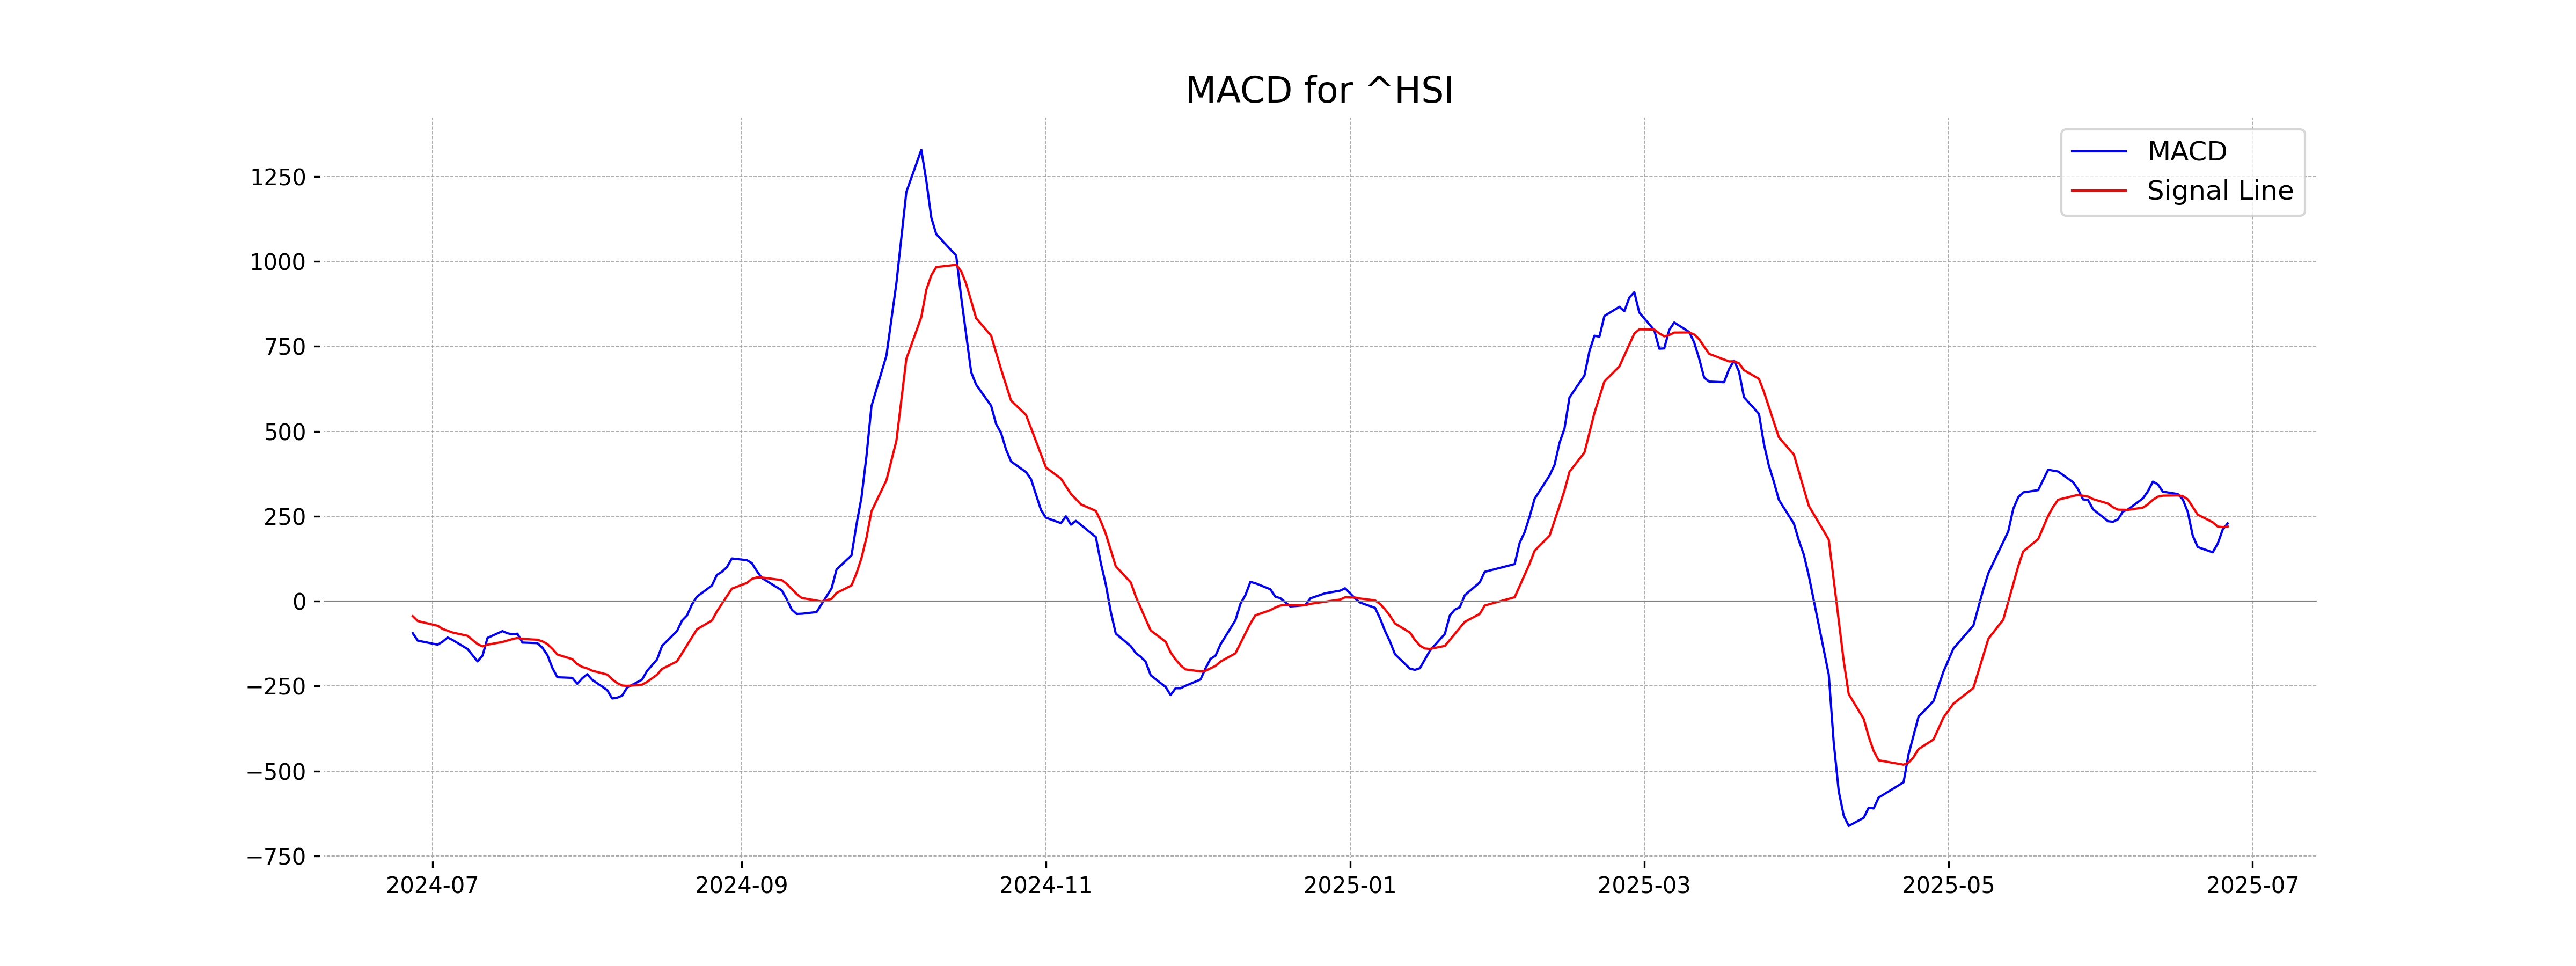
Hang Seng Index (Hong Kong) opened at 24,345.29, reaching a high of 24,411.48 and a low of 24,235.54, closing at 24,325.40, reflecting a decrease of 0.61% from the previous close with a points change of -149.27. The index's 50-day EMA is 23,380.23, while the 200-day EMA is 21,560.88, indicating a generally upward trend. The RSI value of 59.44 suggests the index is approaching overbought territory, and the MACD of 228.63 is above the signal line, signaling potential bullish momentum.
Relationship with Key Moving Averages
The closing price of the Hang Seng Index is 24,325.40, which is above its 10-day EMA (24,000.52) and 20-day EMA (23,836.90), indicating short-term bullish momentum. However, it is still well above the 50-day EMA (23,380.23) and significantly higher than the 200-day EMA (21,560.88), suggesting a sustained longer-term upward trend.
Moving Averages Trend (MACD)
MACD Analysis for Hang Seng Index (Hong Kong): The MACD for the Hang Seng Index is 228.63, while the MACD Signal is 219.90. The positive difference between the MACD line and the Signal line suggests a bullish momentum.
RSI Analysis
The current RSI for the Hang Seng Index (Hong Kong) is 59.44, indicating that the index is in a neutral position but leaning towards the overbought range. This suggests that there is moderate buying pressure, and investors should monitor for potential trends or reversals.
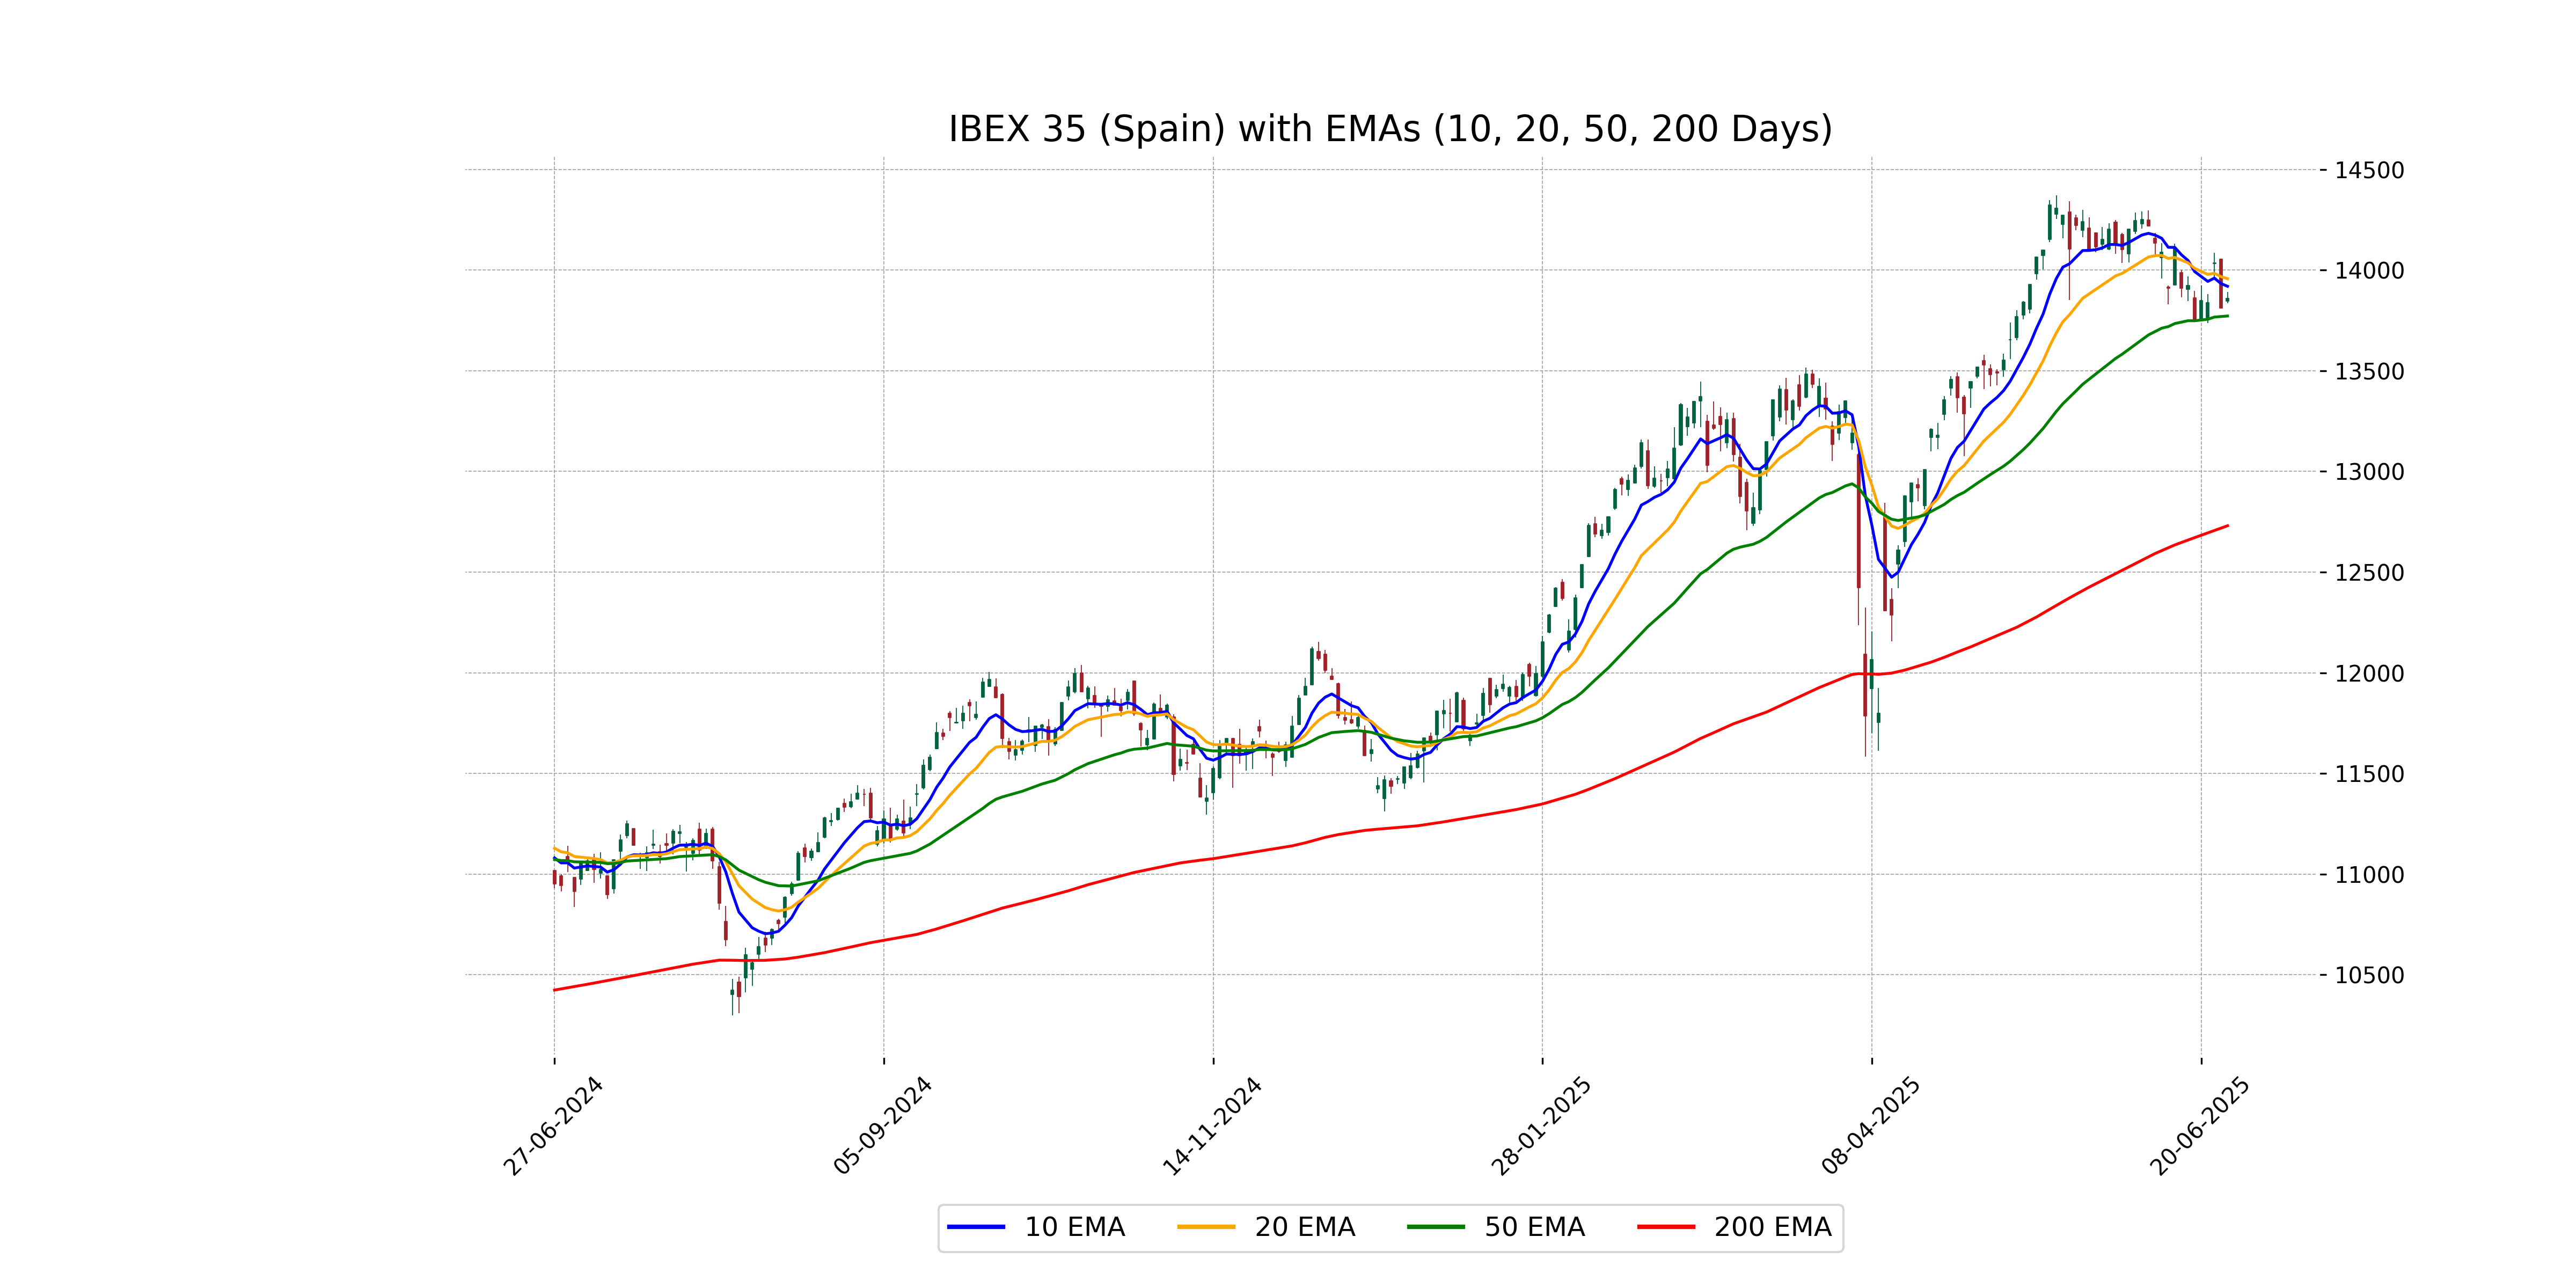
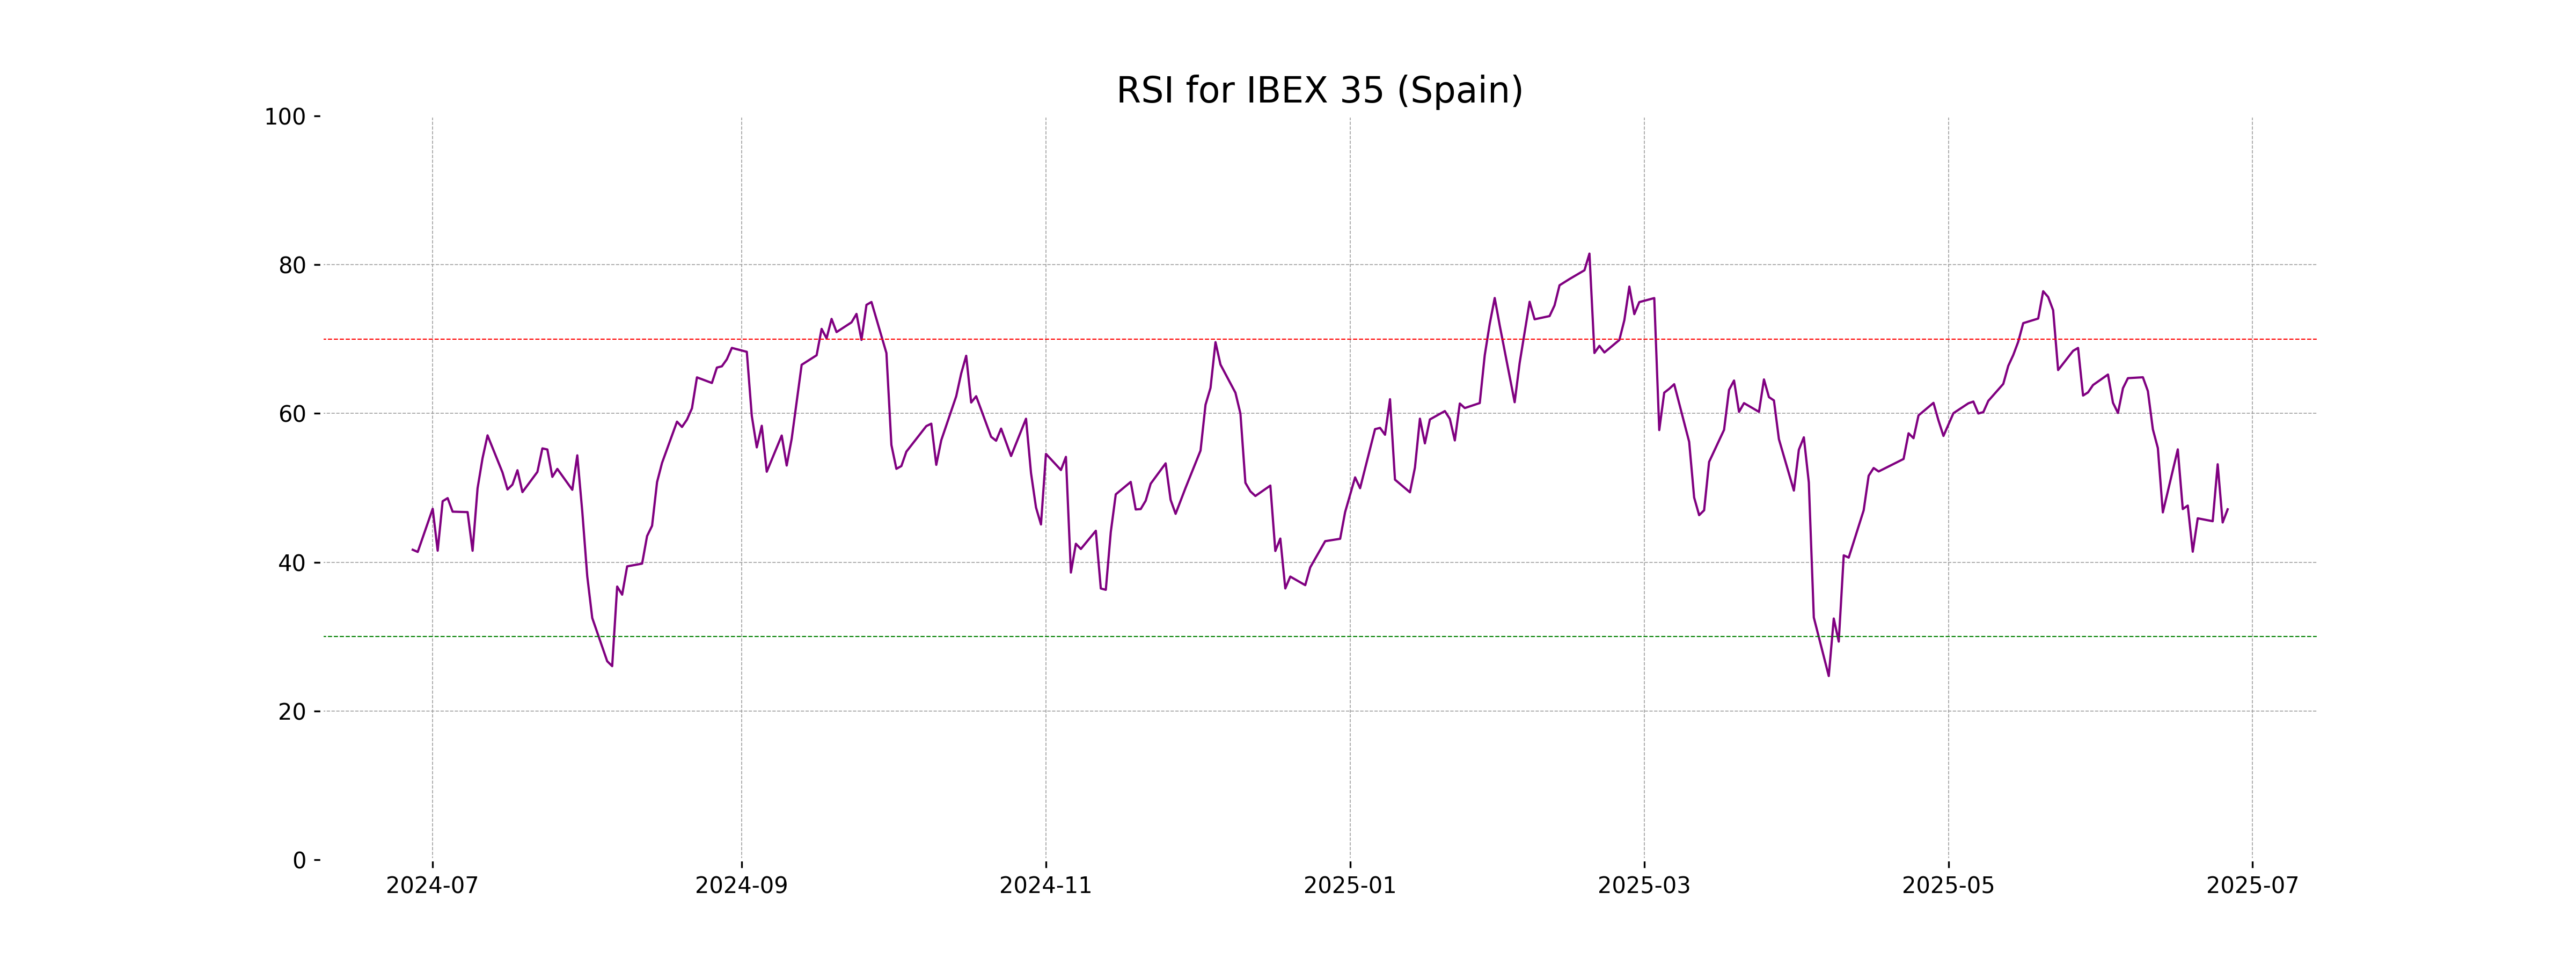
Analysis for IBEX 35 (Spain) - June 26, 2025
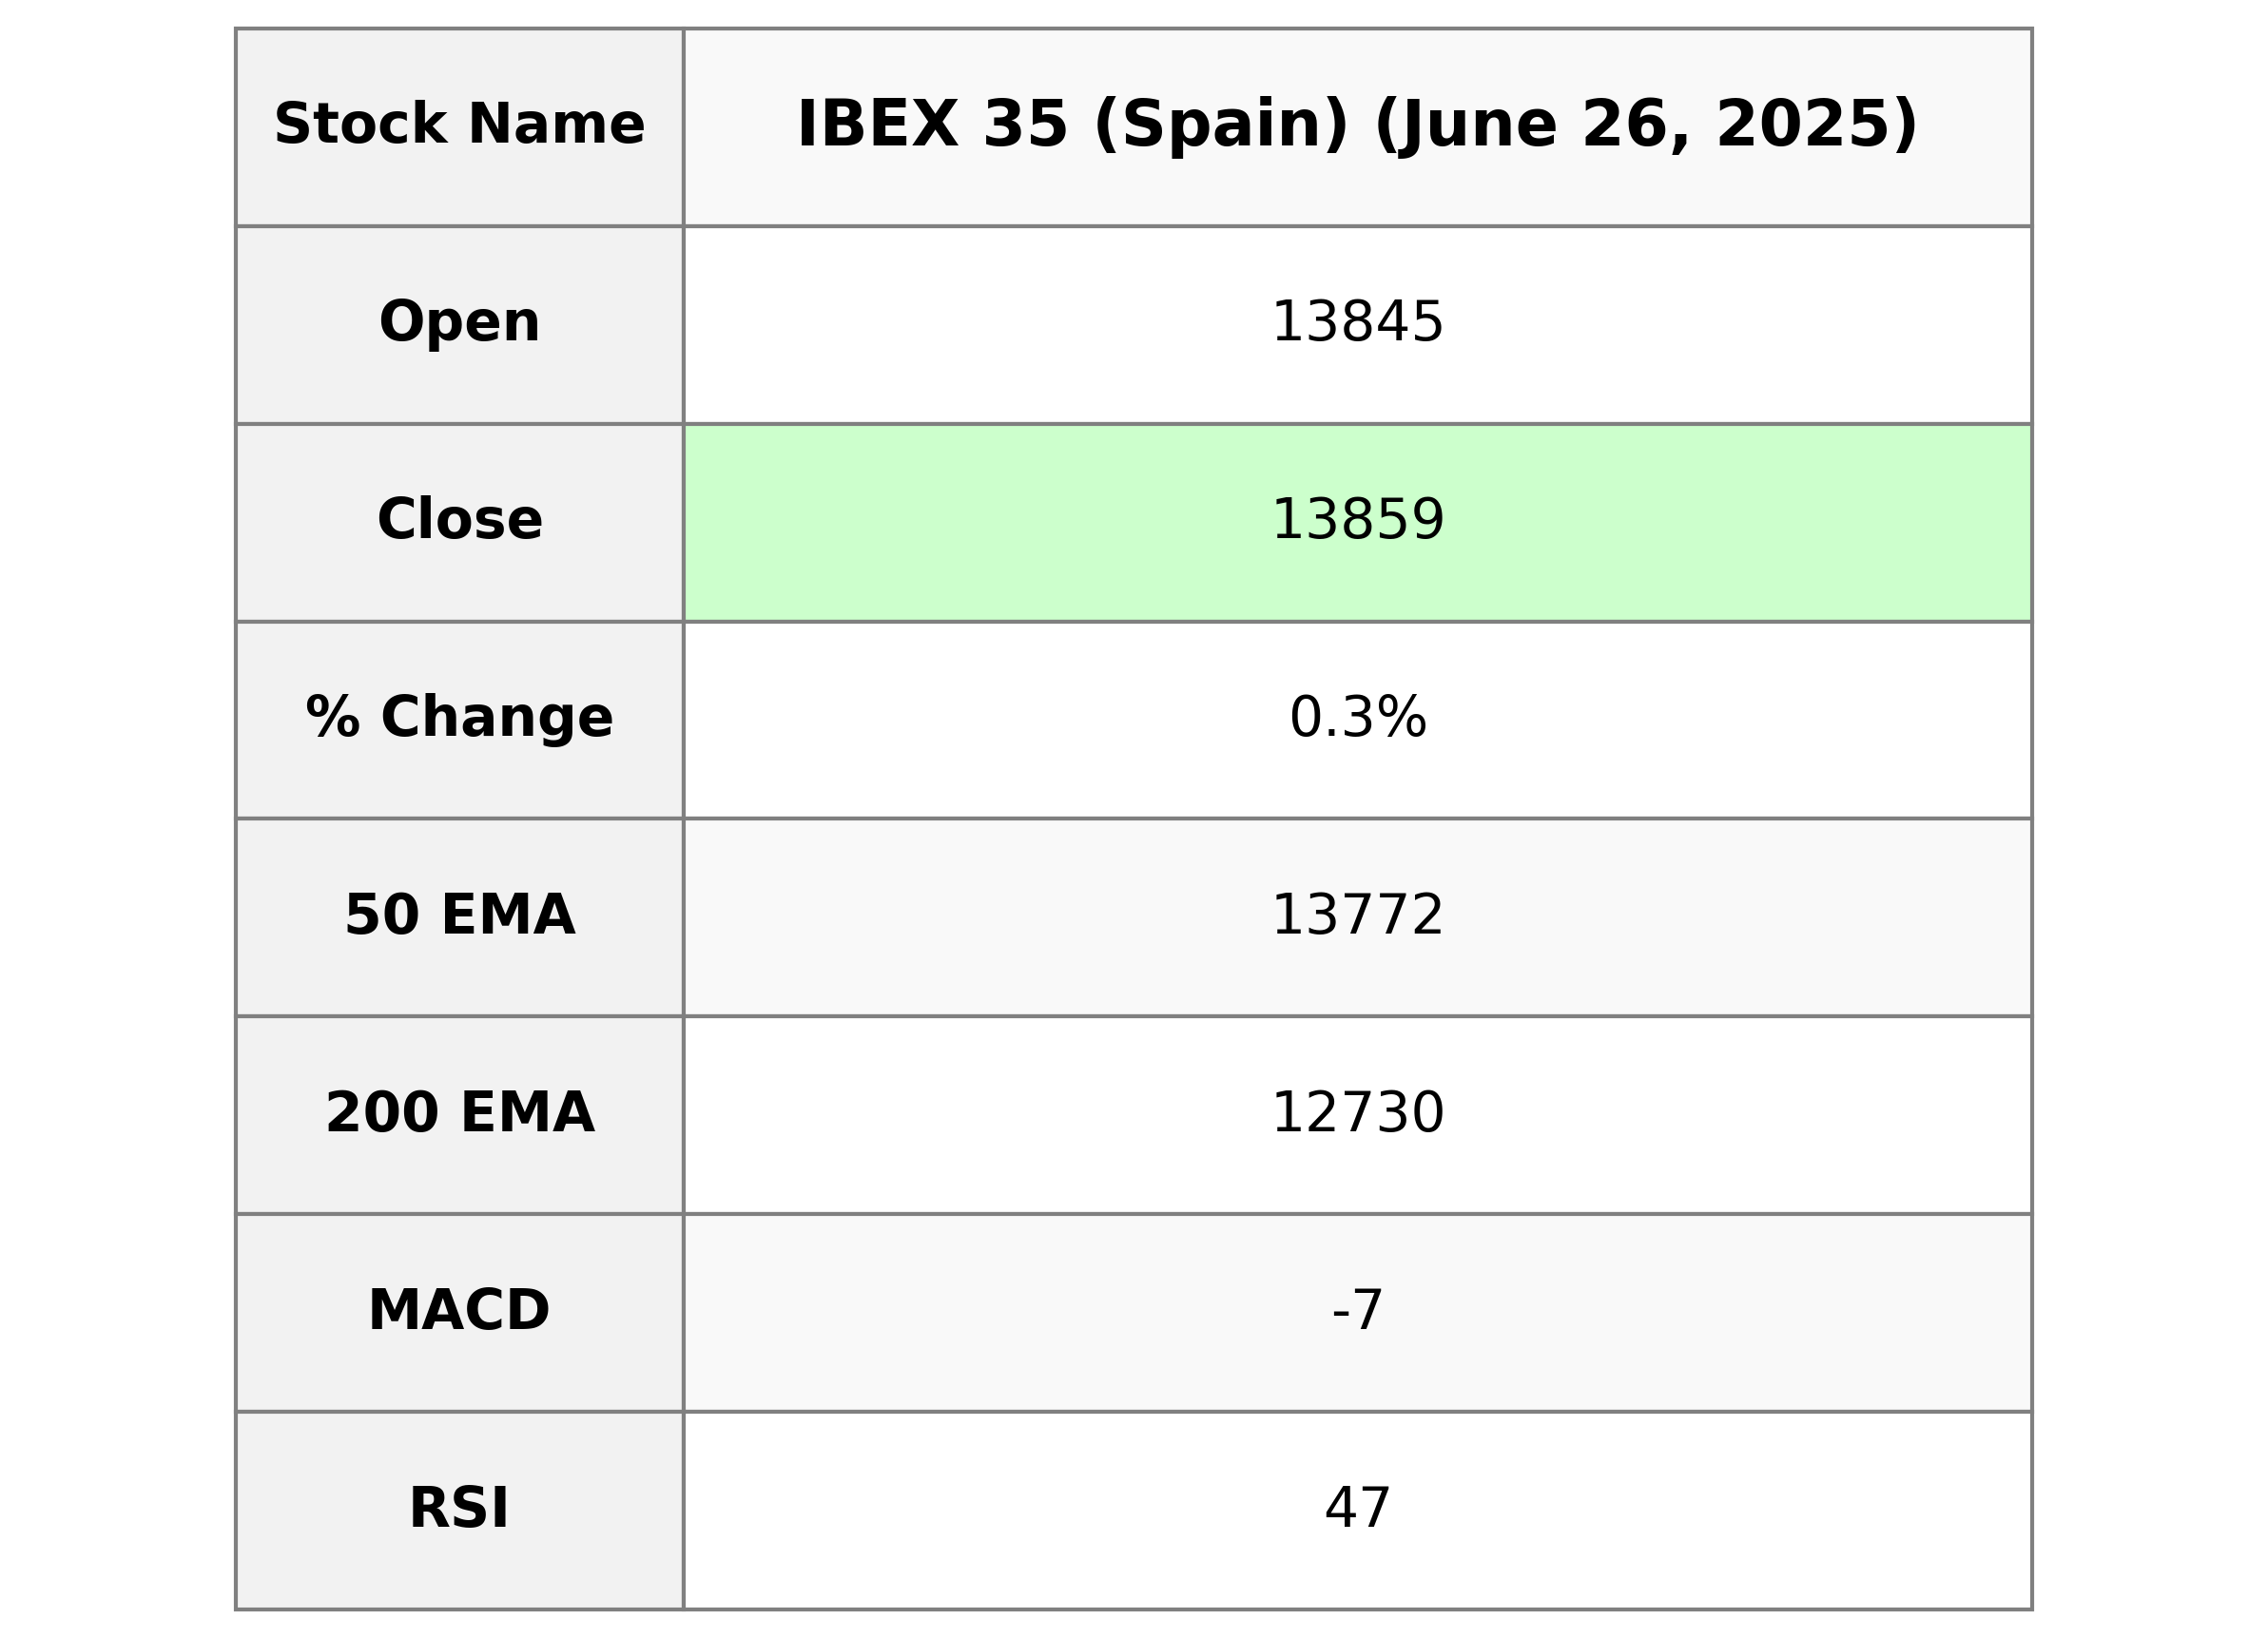
IBEX 35 (Spain) Performance: The IBEX 35 opened at 13,845.30 and closed at 13,859.00, marking a slight increase of 0.34% with a points change of 47.20. The Relative Strength Index stands at 47.11, indicating a neutral market sentiment. The MACD shows a bearish signal at -6.68, with the 50-day EMA below the current price at 13,772.35.
Relationship with Key Moving Averages
For IBEX 35 (Spain), the closing price of 13,859.0 is below the 10 EMA (13,920.02) and 20 EMA (13,957.66), but above the 50 EMA (13,772.35). This suggests short-term bearish momentum, although it's holding above the longer-term trendline.
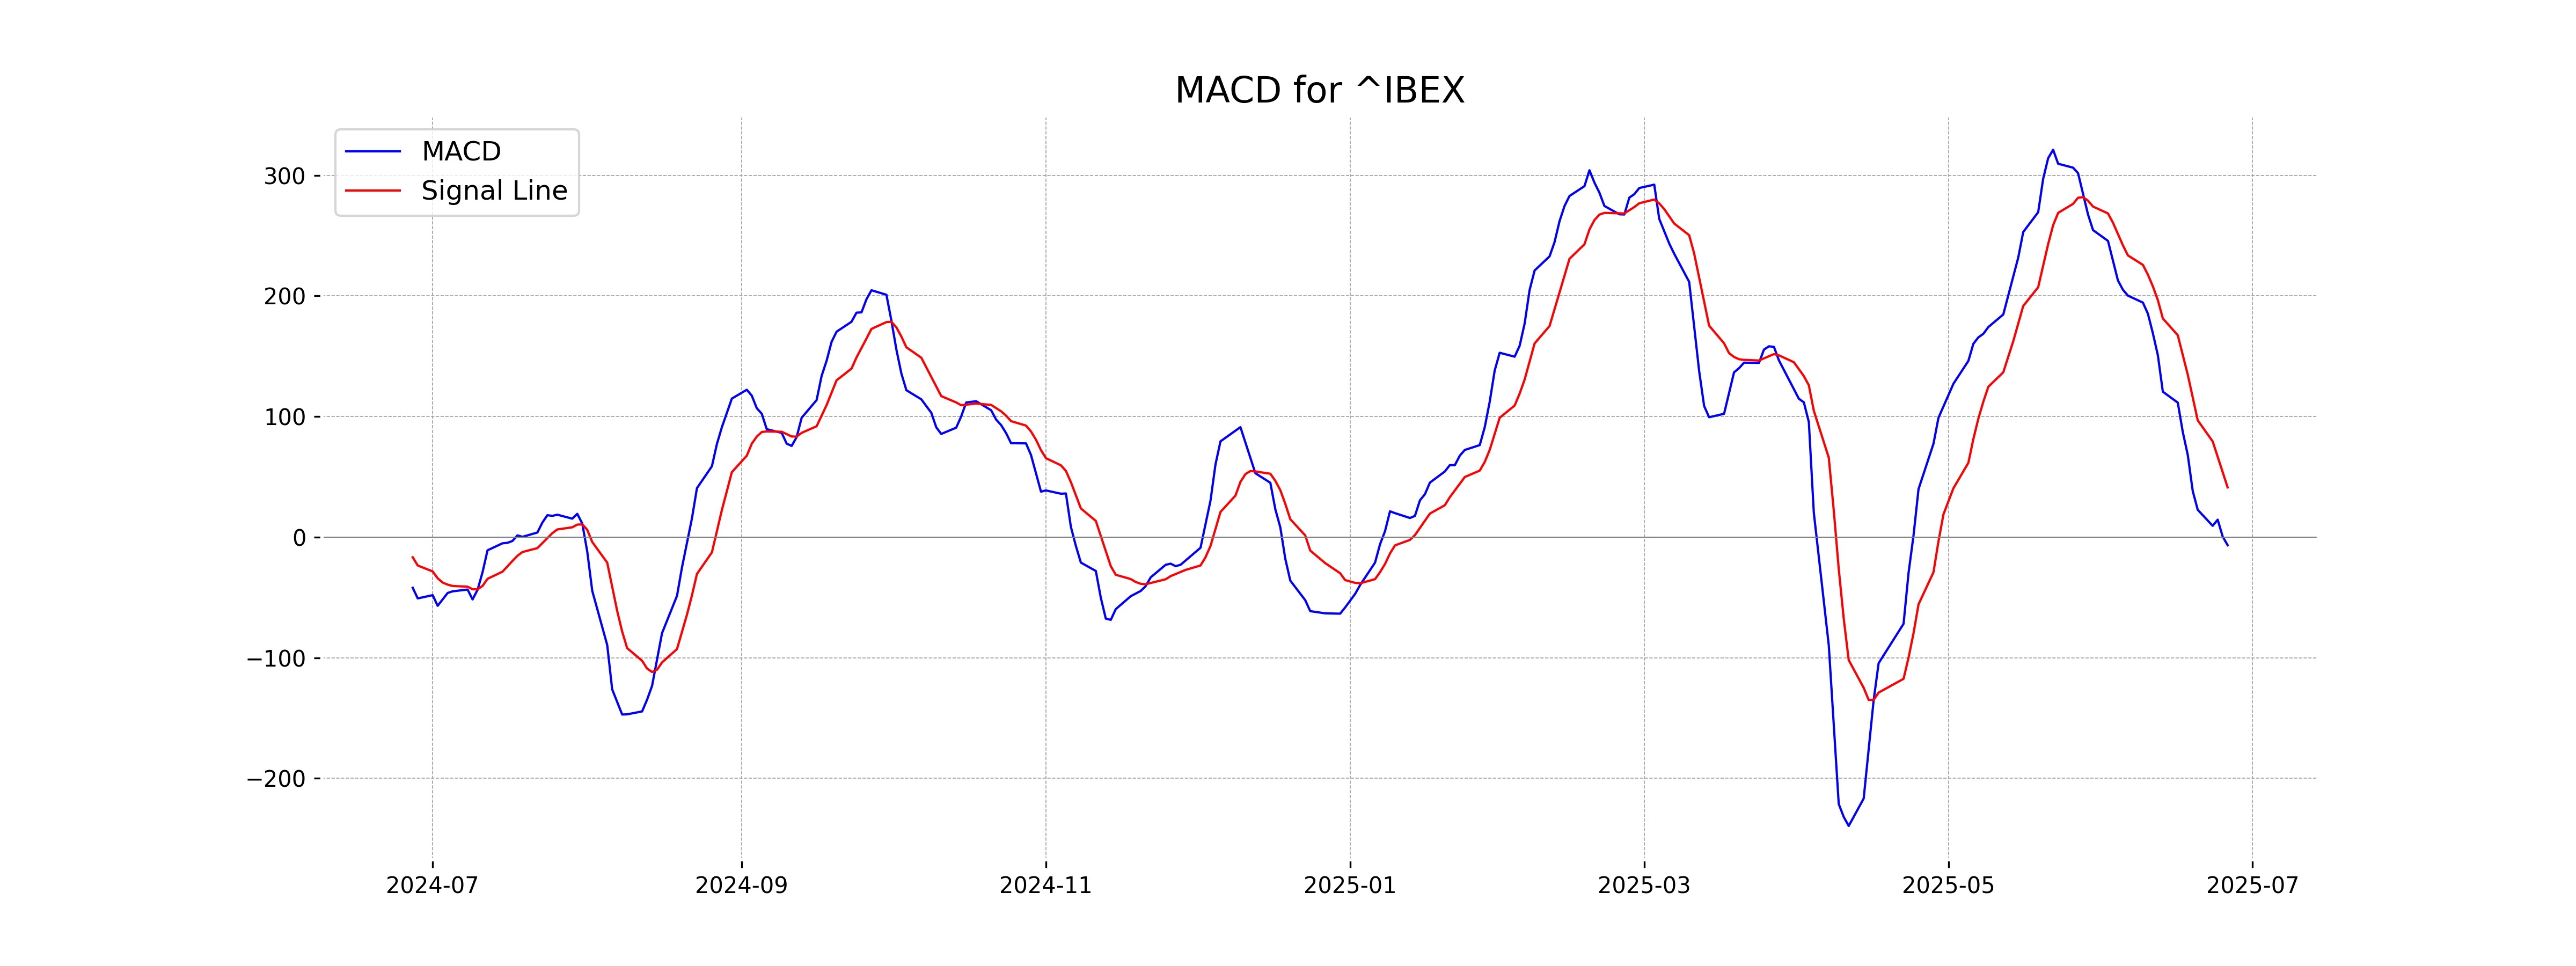
Moving Averages Trend (MACD)
The MACD value for IBEX 35 (Spain) is -6.68, which is below its MACD signal line at 41.22. This suggests bearish momentum, indicating the potential for downward price movement or a continuation of a downtrend.
RSI Analysis
The RSI (Relative Strength Index) for IBEX 35 is at 47.11, indicating that the index is in a neutral zone. This suggests neither overbought nor oversold conditions, implying that recent price changes are stable without signaling a strong trend reversal.
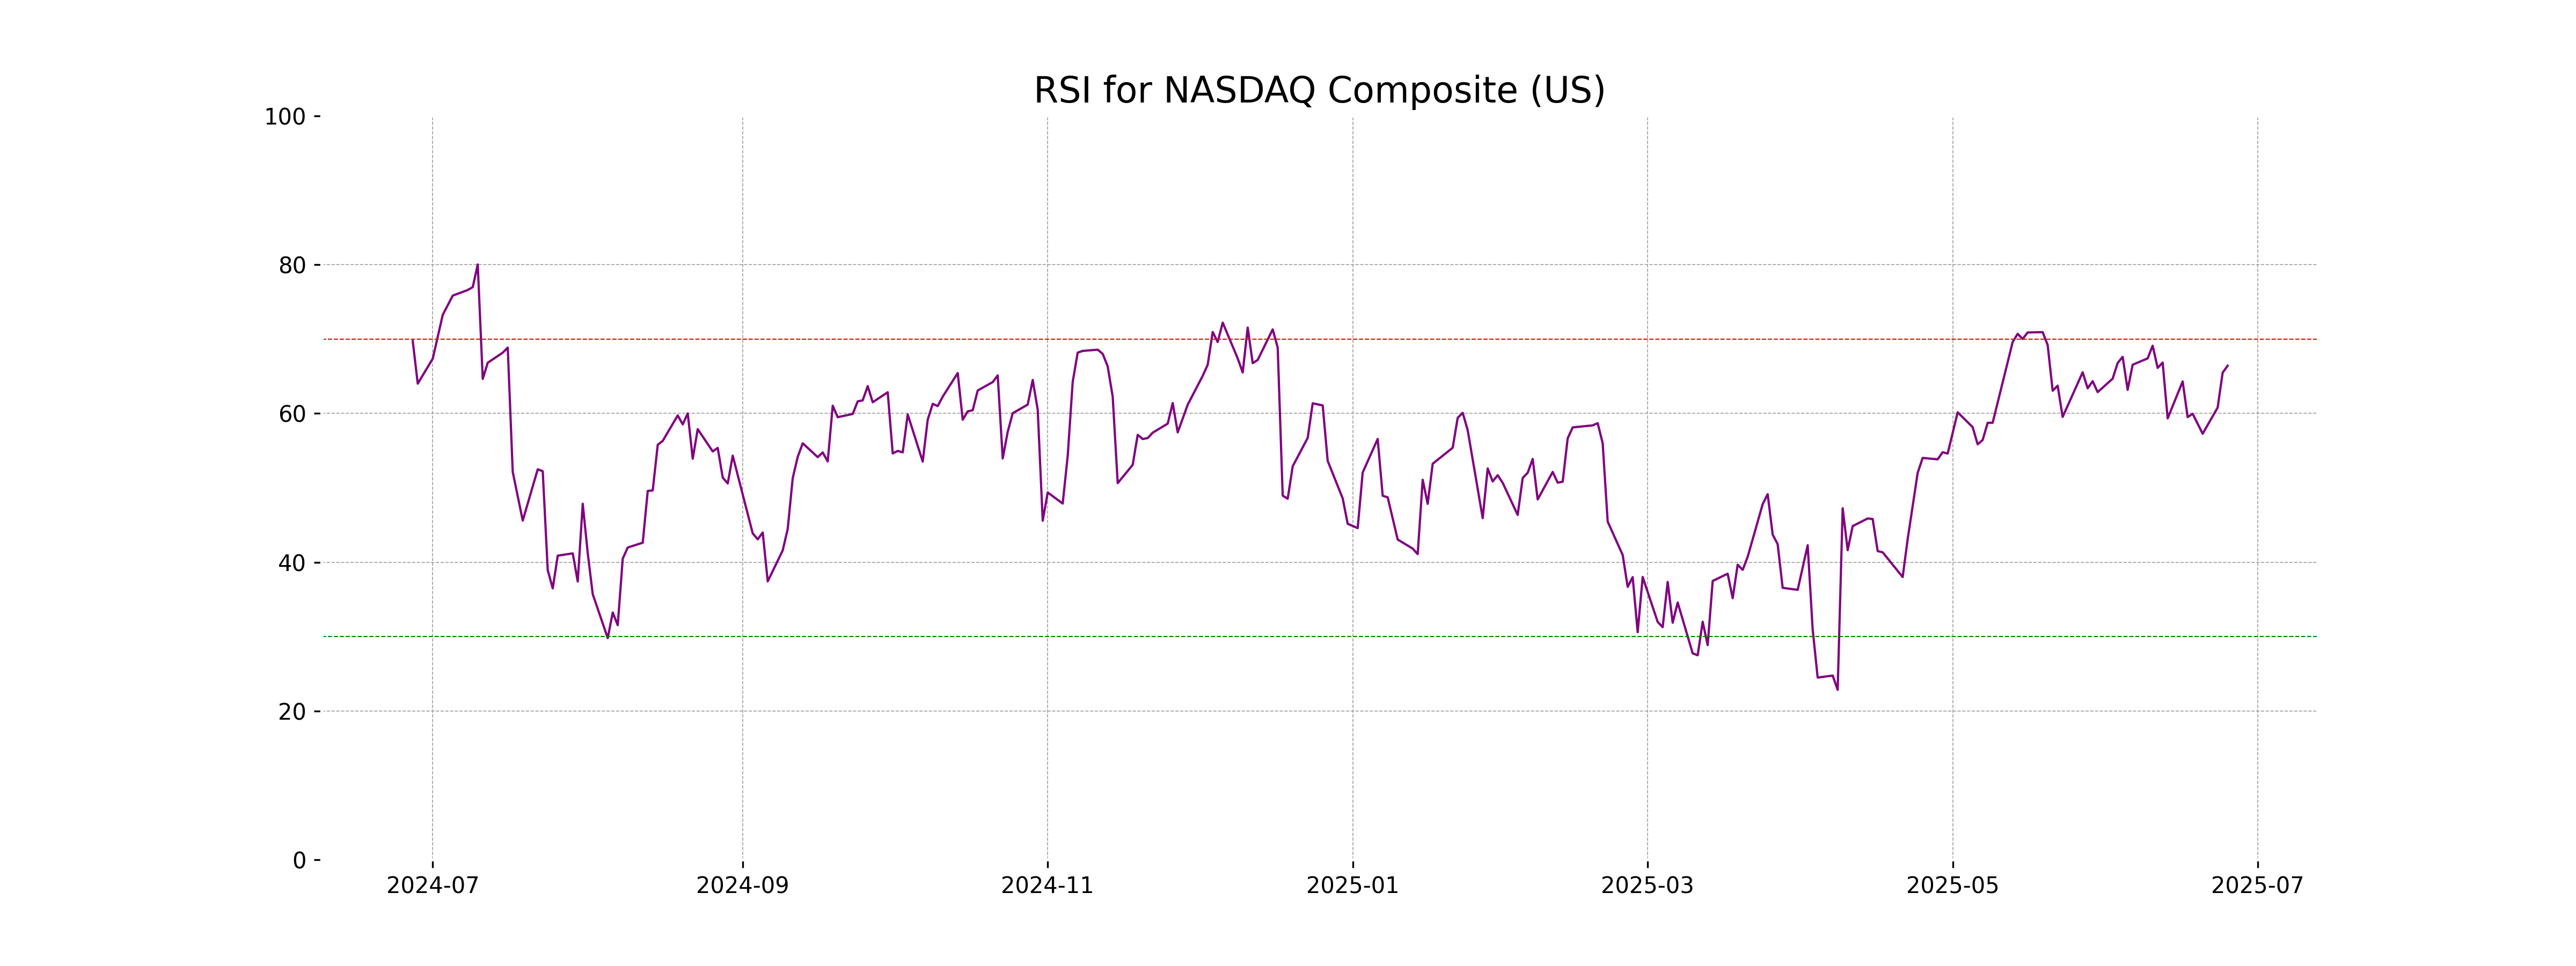
Analysis for NASDAQ Composite (US) - June 26, 2025
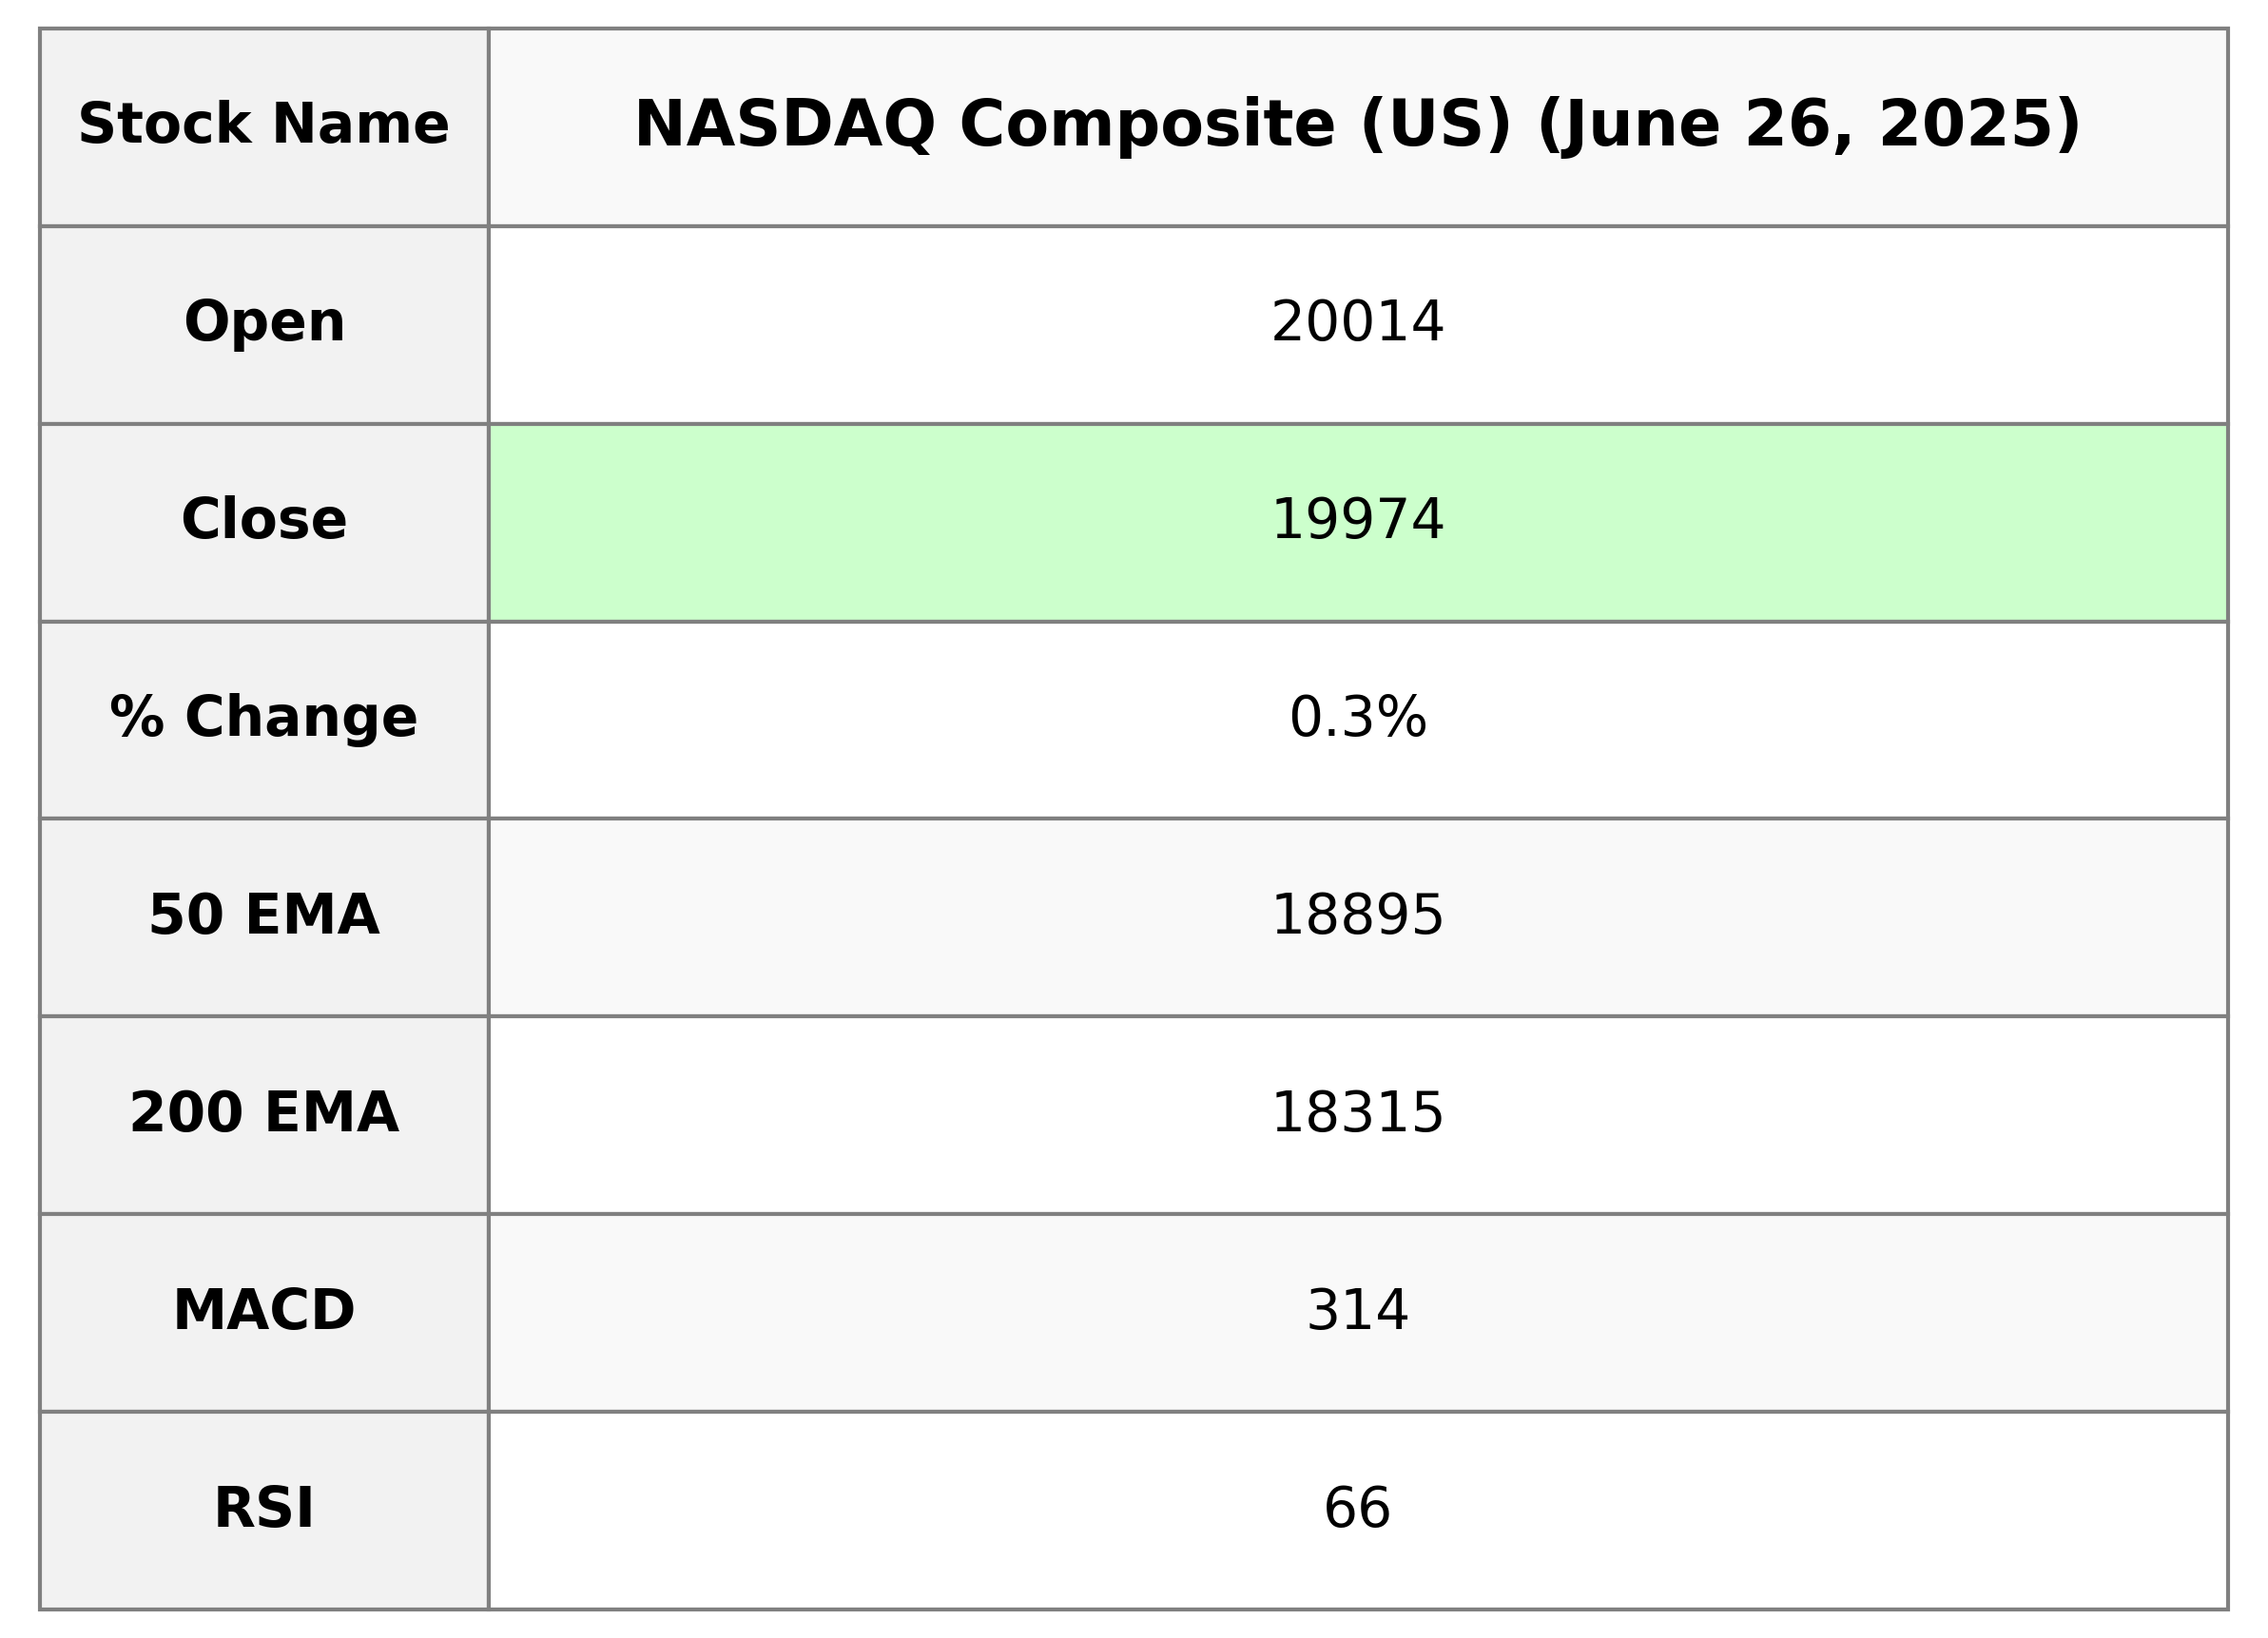
NASDAQ Composite (US) opened at 20013.95 and closed at 19973.55, marking a positive change of 0.31% or 61.02 points from its previous close of 19912.53. The index experienced a high of 20052.78 and a low of 19918.08 during the session with a substantial trading volume of 8.26 billion. The Relative Strength Index (RSI) stands at 66.42, indicating moderately strong momentum.
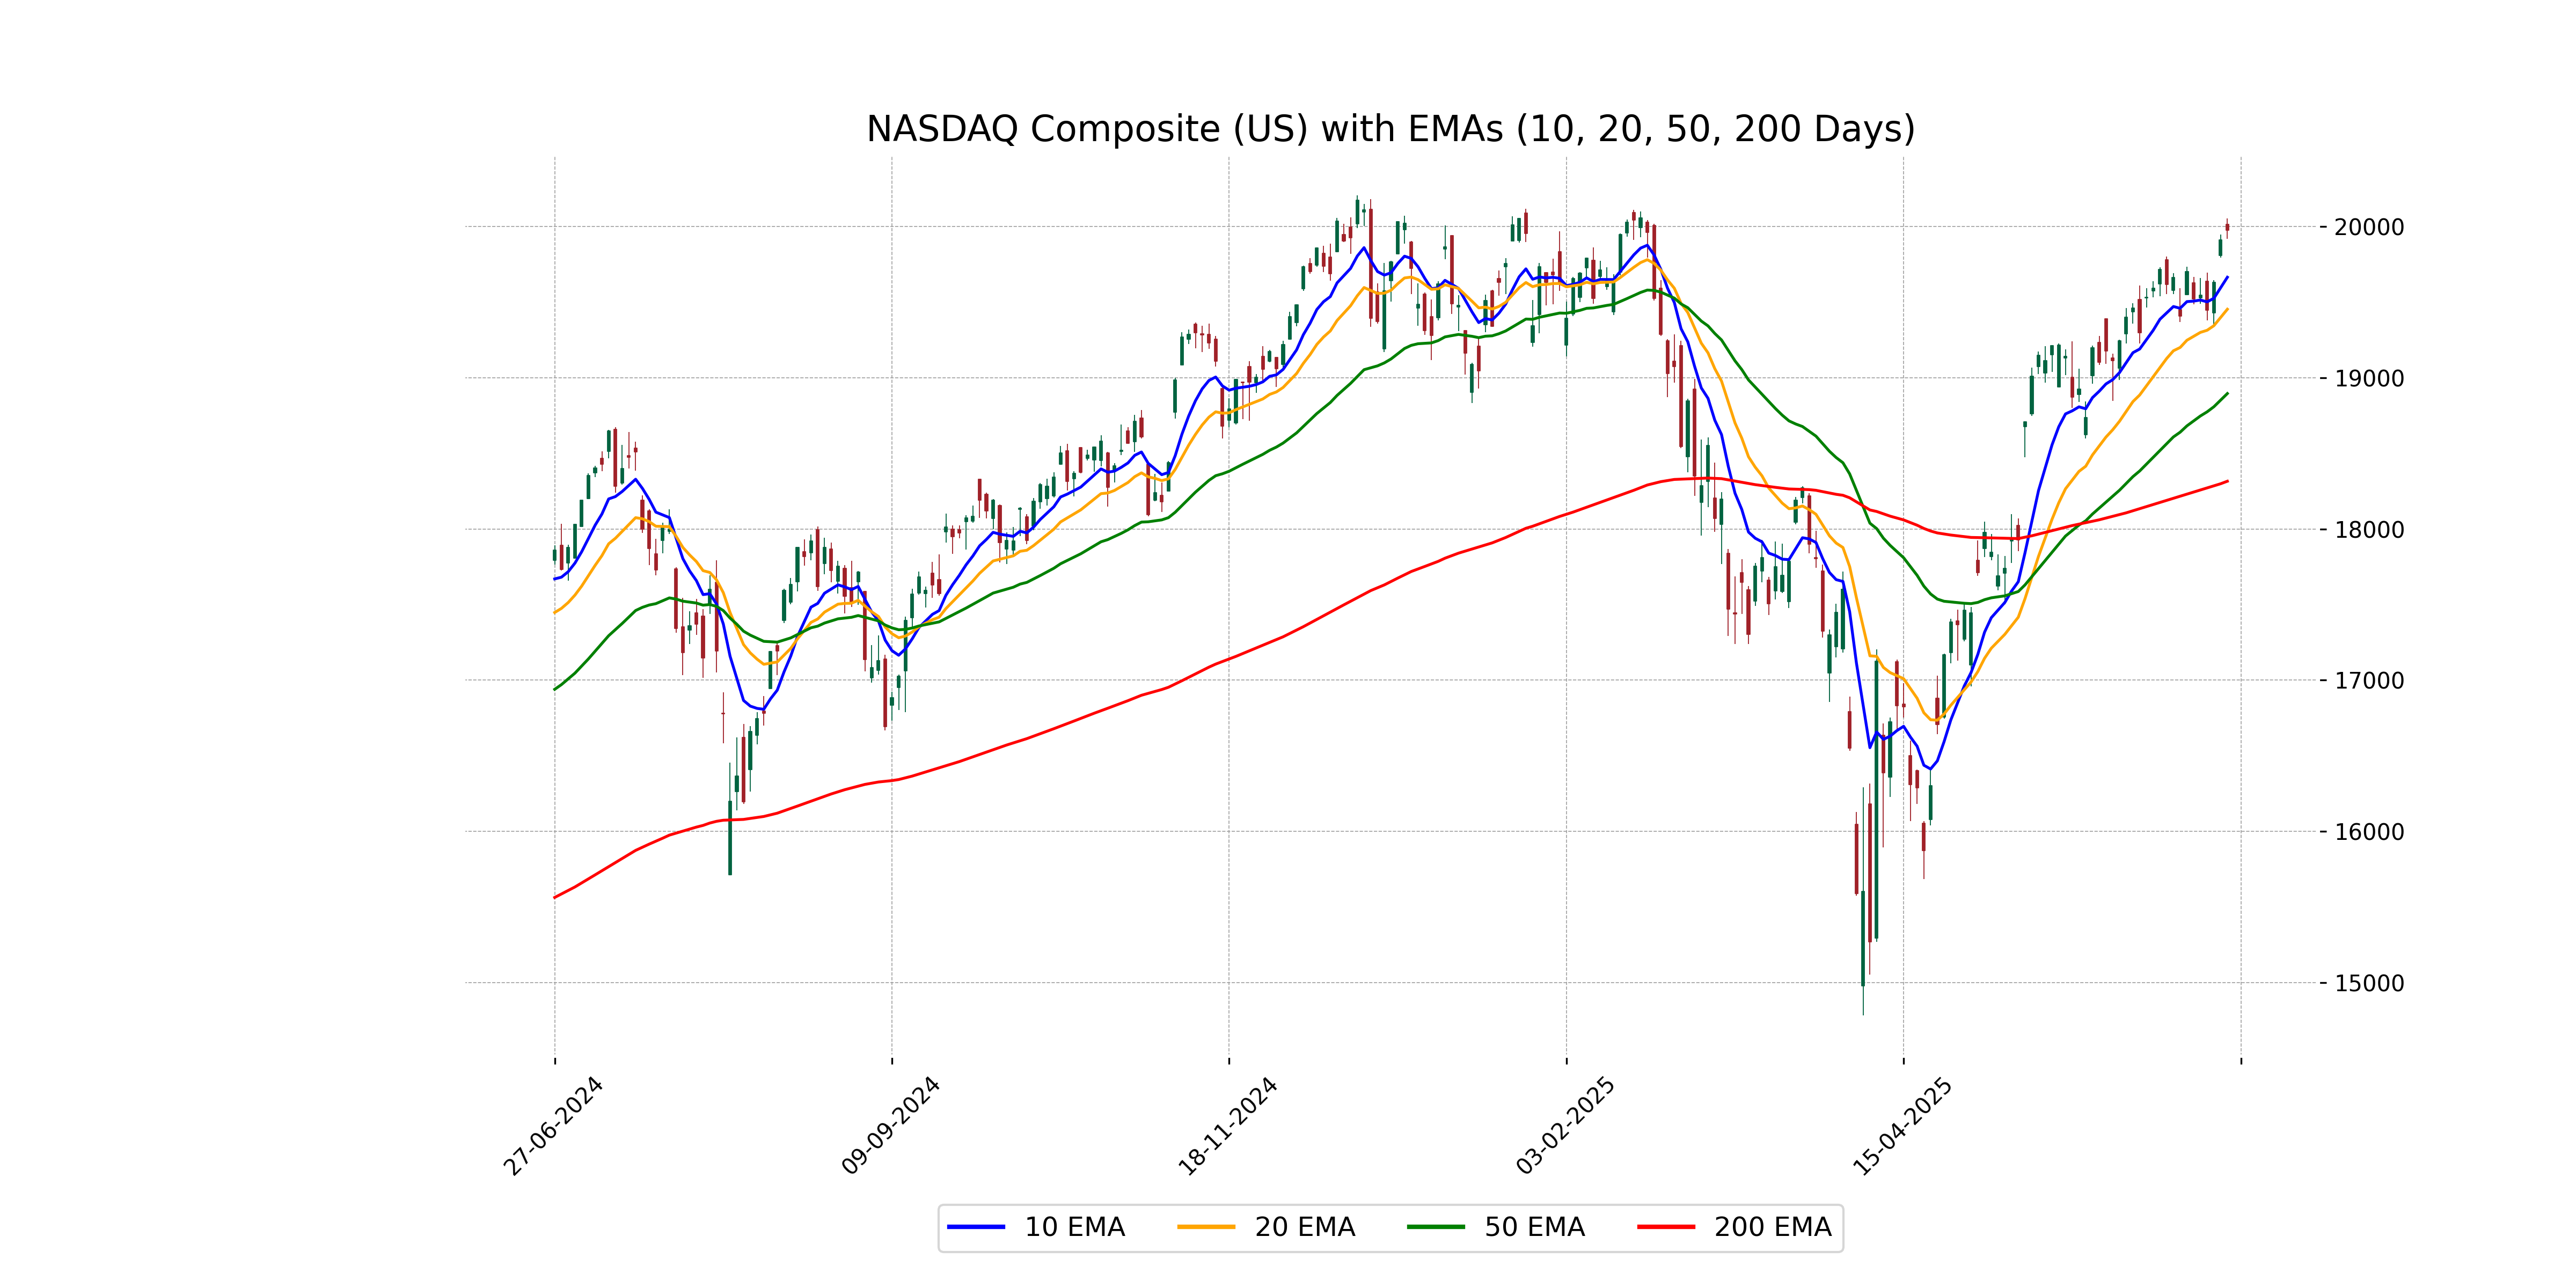
Relationship with Key Moving Averages
The NASDAQ Composite has recently closed at 19973.55, which is above its 50-day EMA of 18895.19 and the 200-day EMA of 18315.24, indicating a potential bullish trend. However, it is slightly above the 10-day EMA of 19664.27 and the 20-day EMA of 19452.83, suggesting short-term gains may be stabilizing.
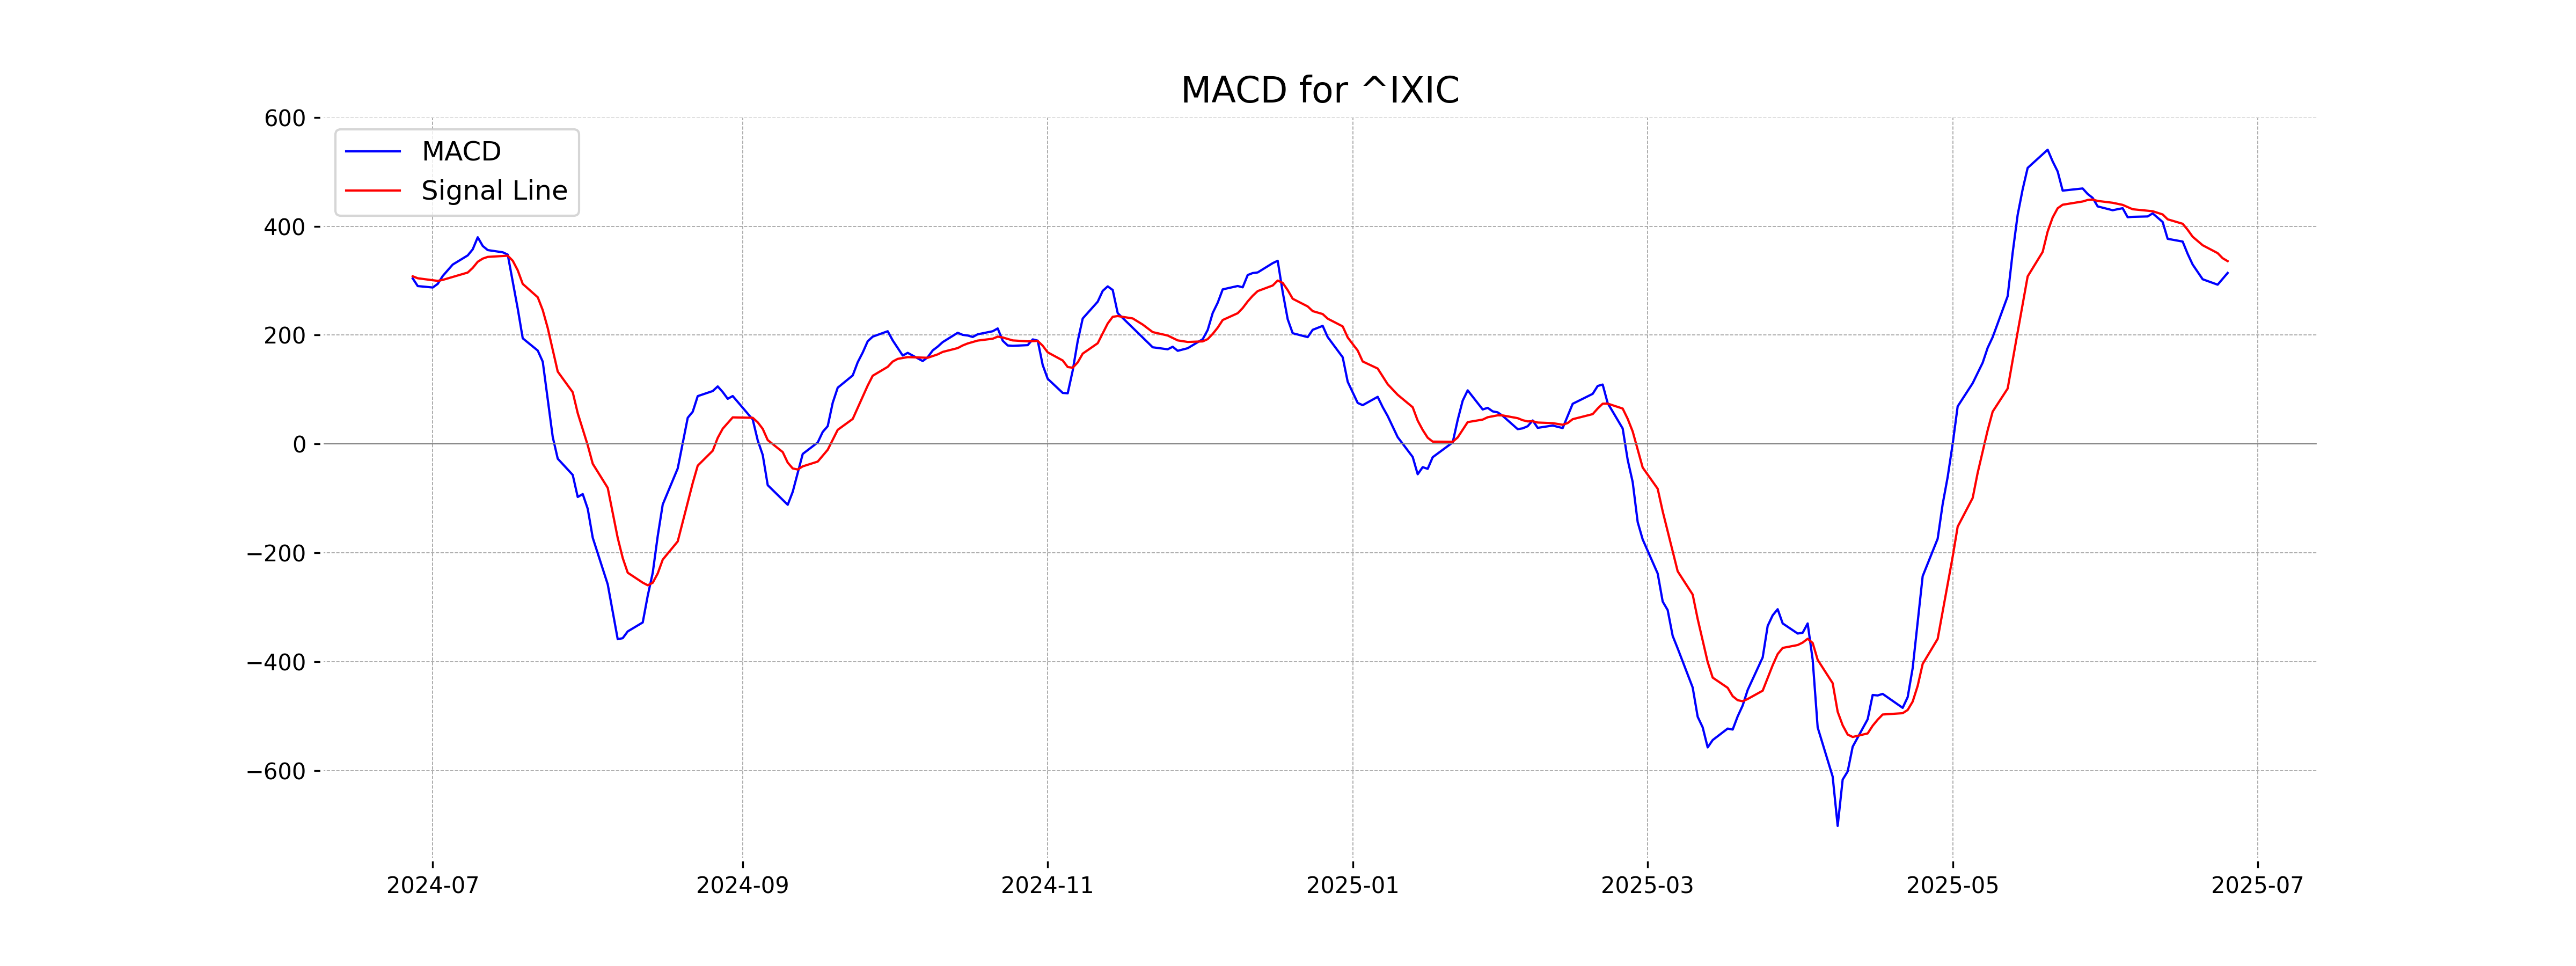
Moving Averages Trend (MACD)
The current MACD value for NASDAQ Composite (US) is 314.16, while the MACD Signal line is 335.83. Since the MACD is below the Signal line, it suggests a potential bearish momentum in the near term. However, it is important to monitor for a crossover or further divergence for confirmation.
RSI Analysis
Based on the given stock data, the Relative Strength Index (RSI) for the NASDAQ Composite is 66.42, which indicates that the stock is approaching overbought territory. Typically, an RSI above 70 suggests overbuying, while an RSI below 30 suggests overselling. Therefore, the NASDAQ Composite is currently leaning towards overbought, signaling a potential pullback or consolidation.
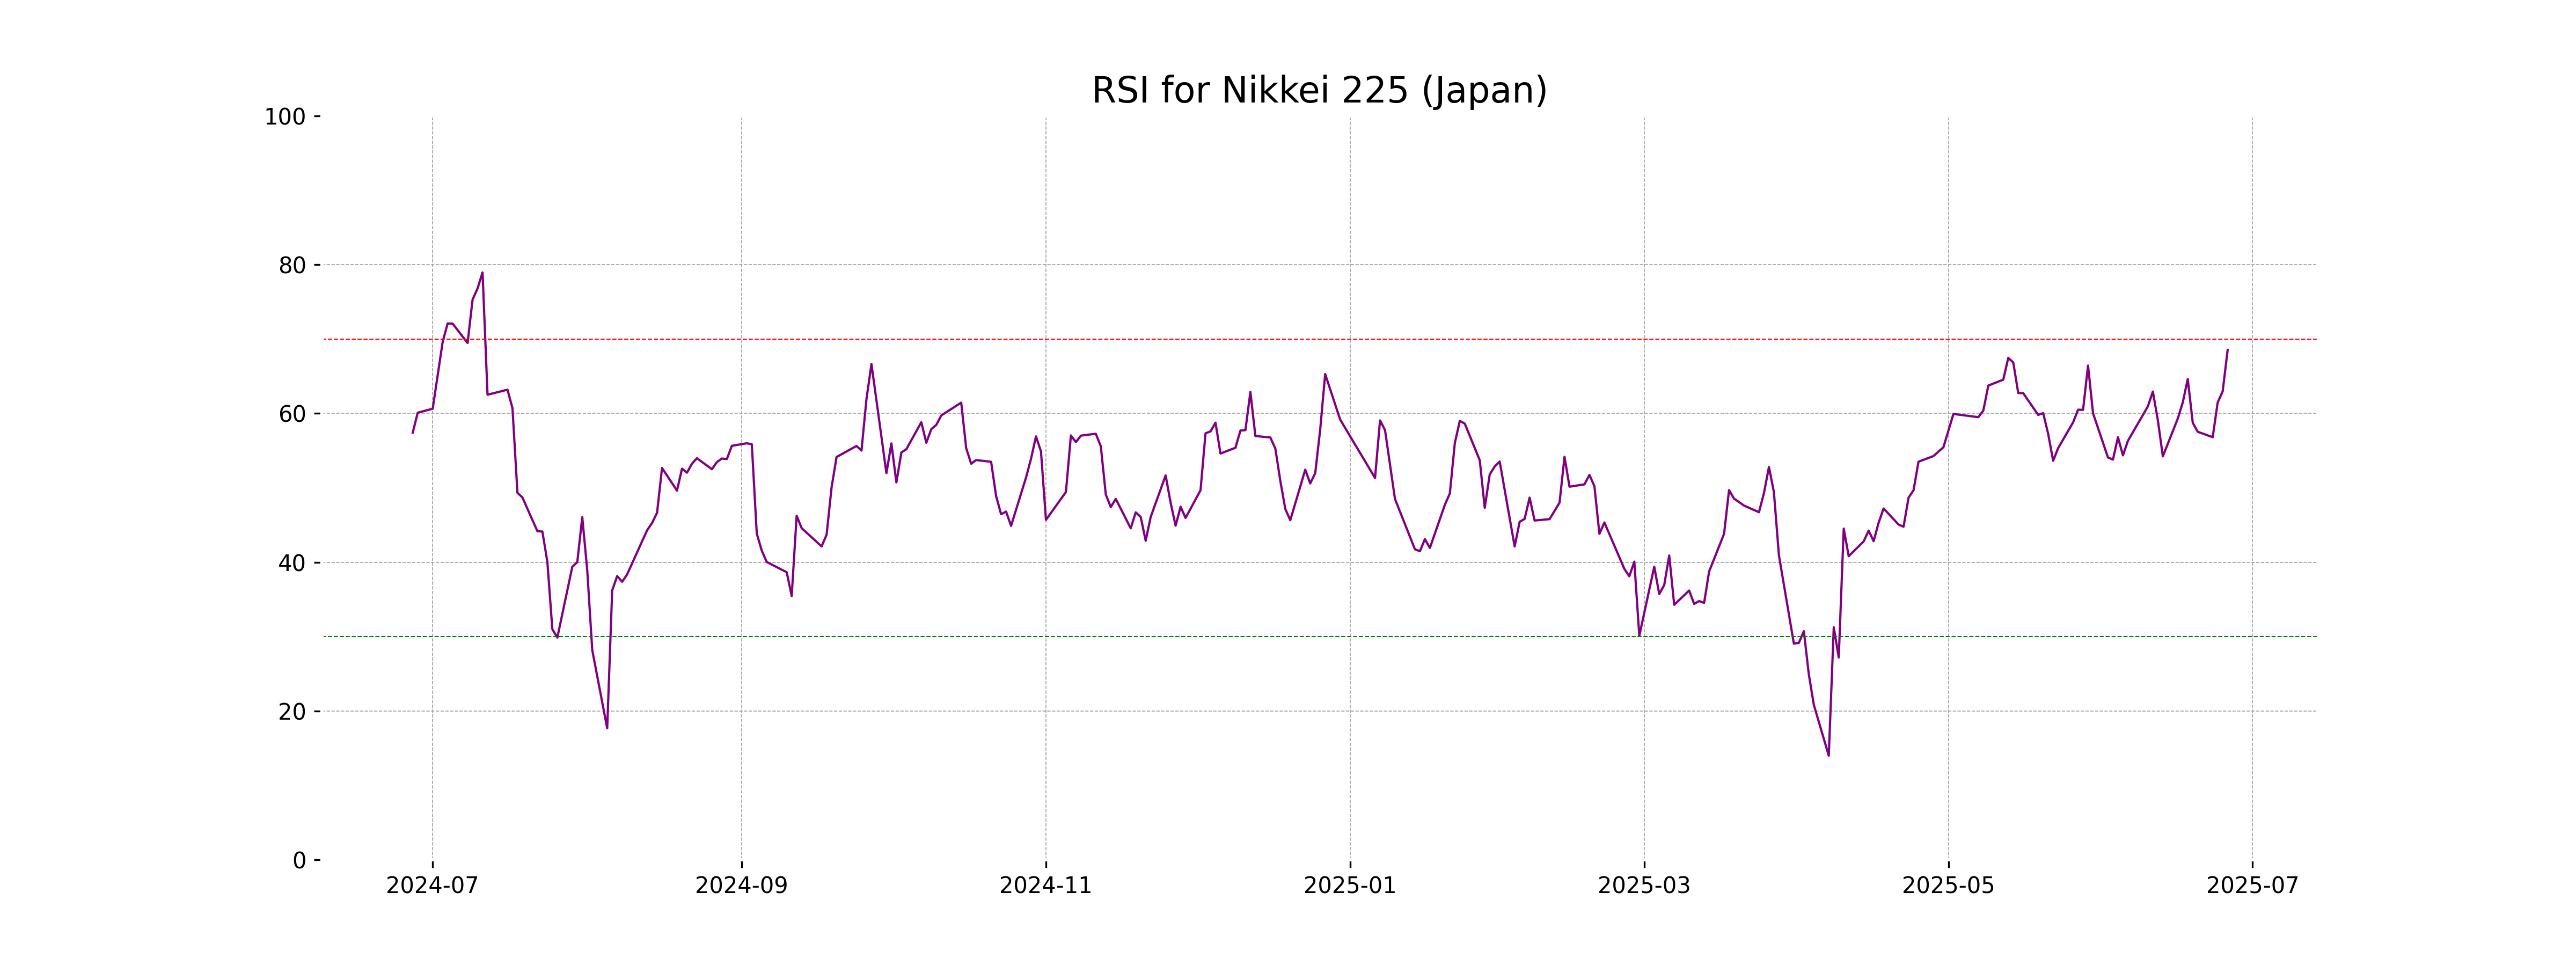
Analysis for Nikkei 225 (Japan) - June 26, 2025
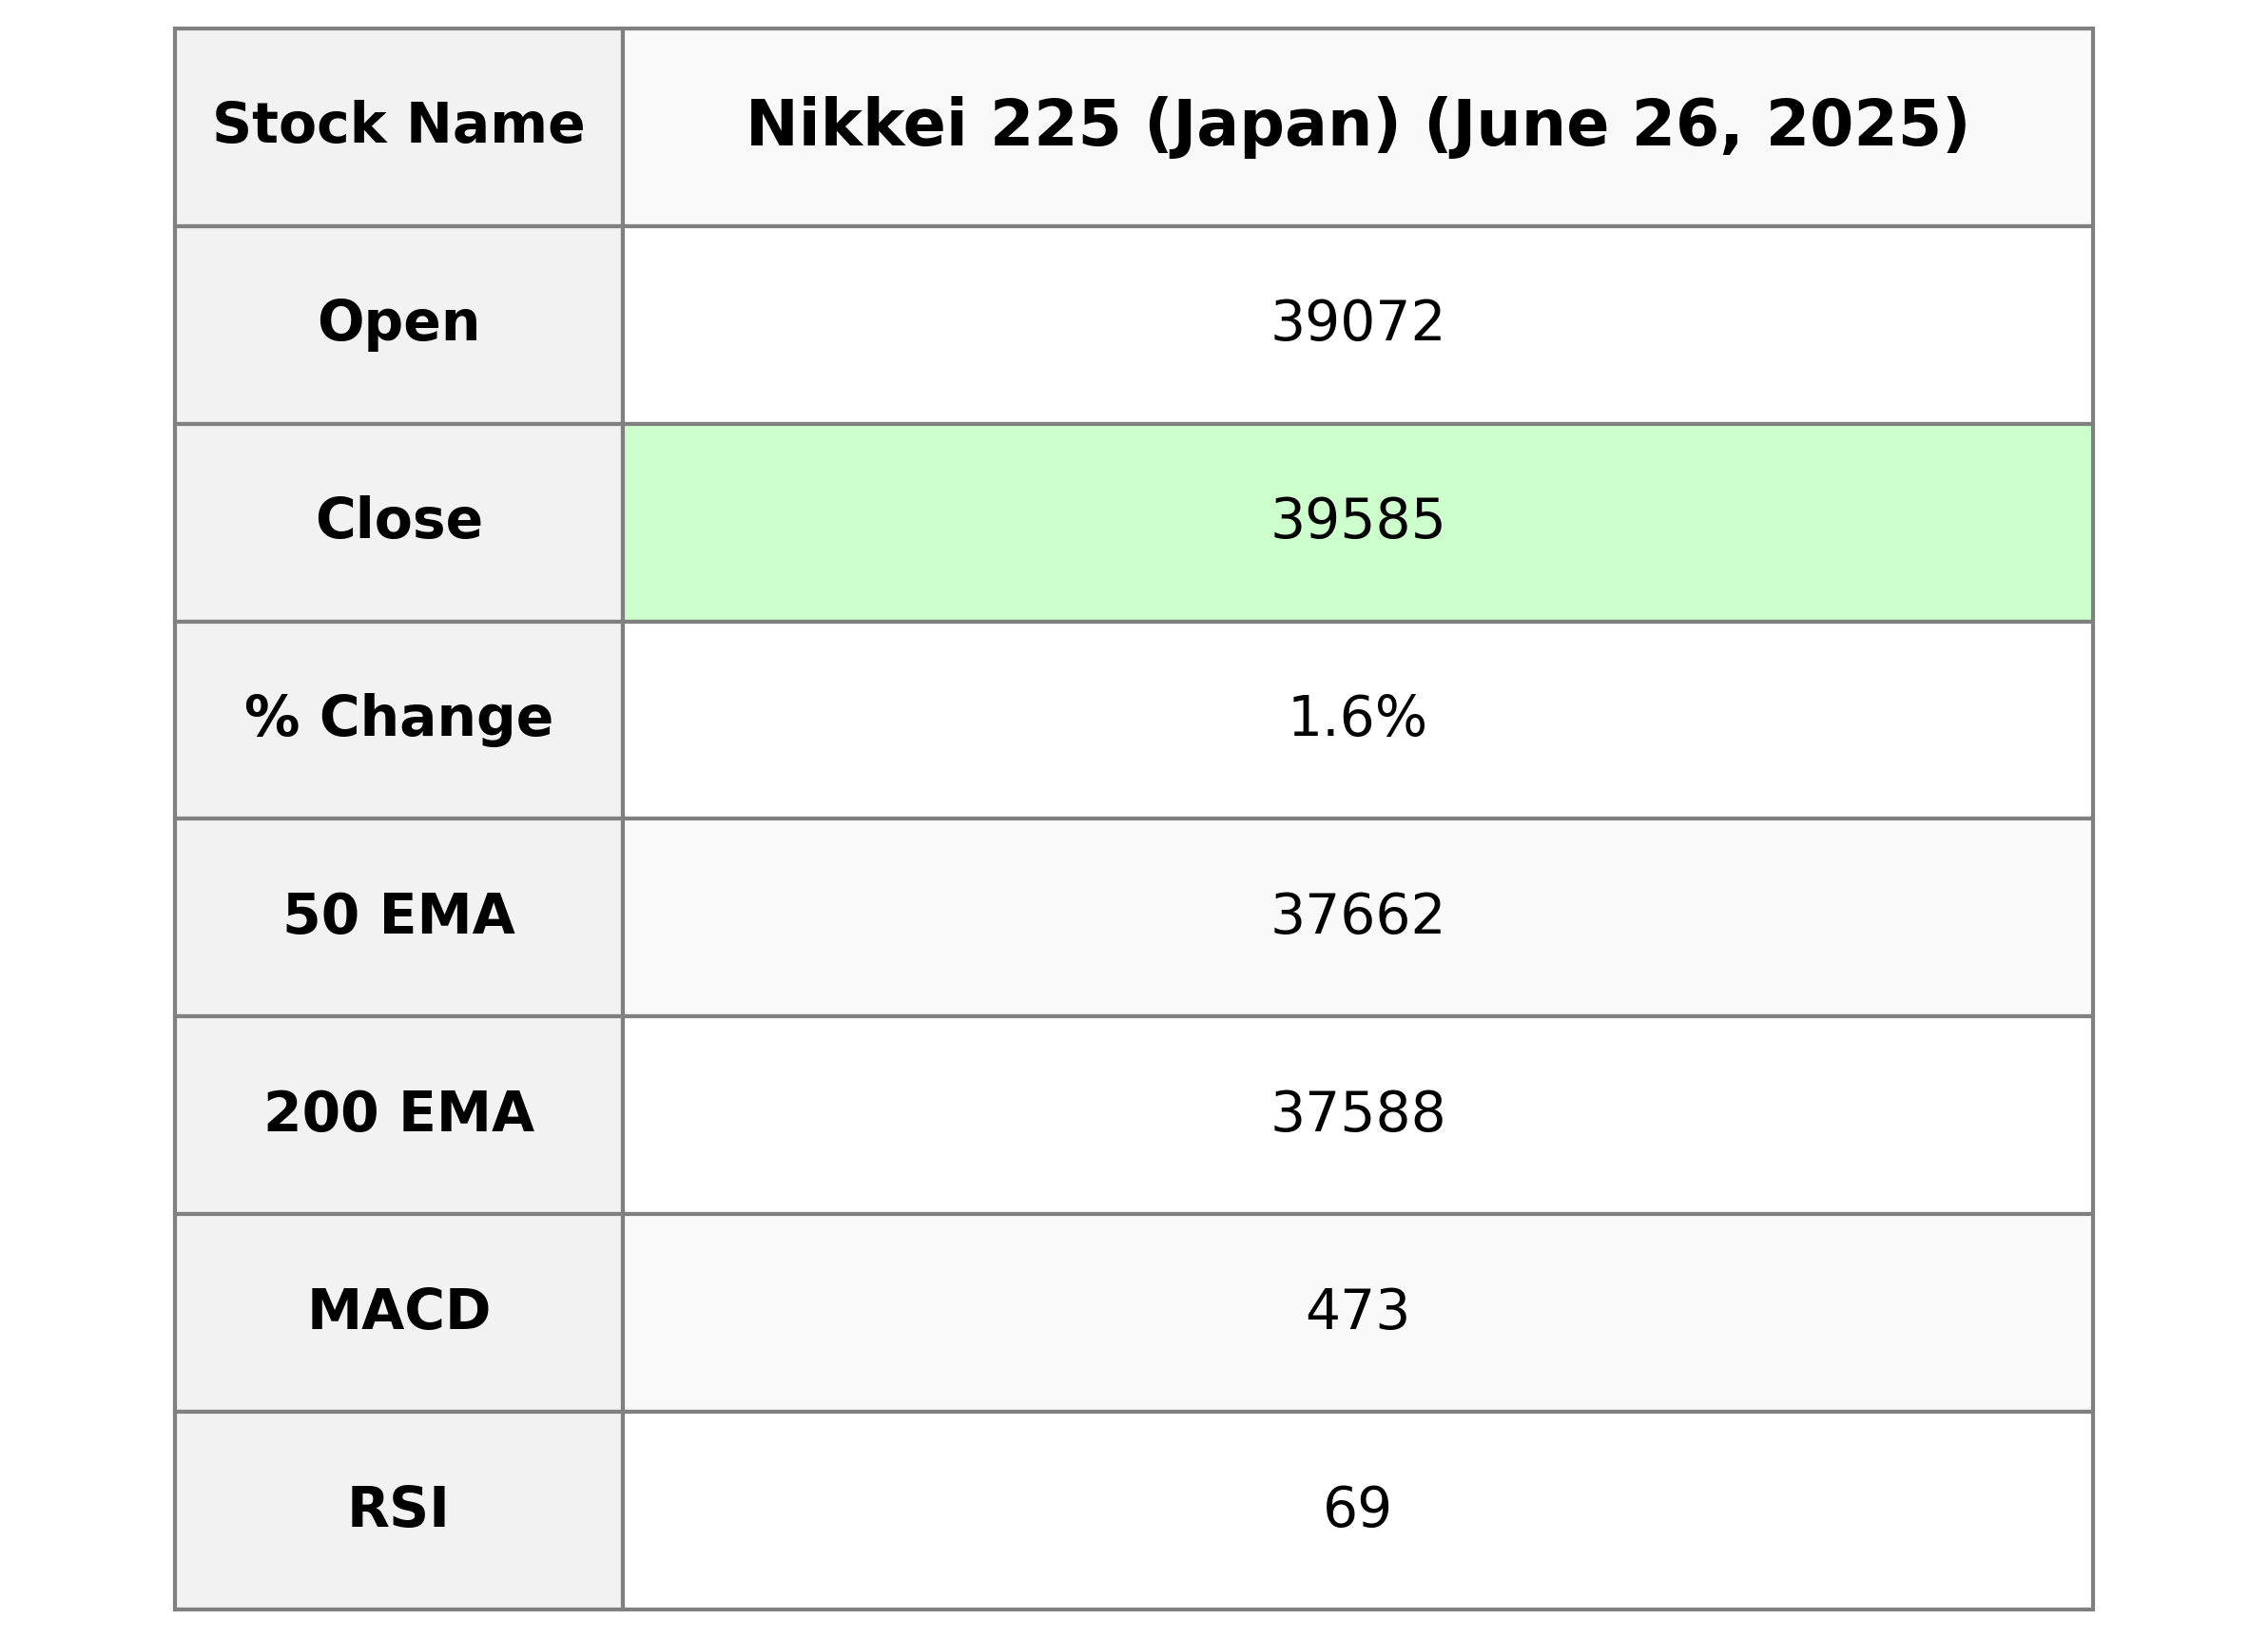
Nikkei 225 (Japan) opened at 39,072.14 and closed higher at 39,584.58, reflecting a 1.65% increase with a points gain of 642.51. The daily trading range spanned between a low of 39,056.14 and a high of 39,615.59, while the RSI was at 68.54, indicating a strong upward momentum.
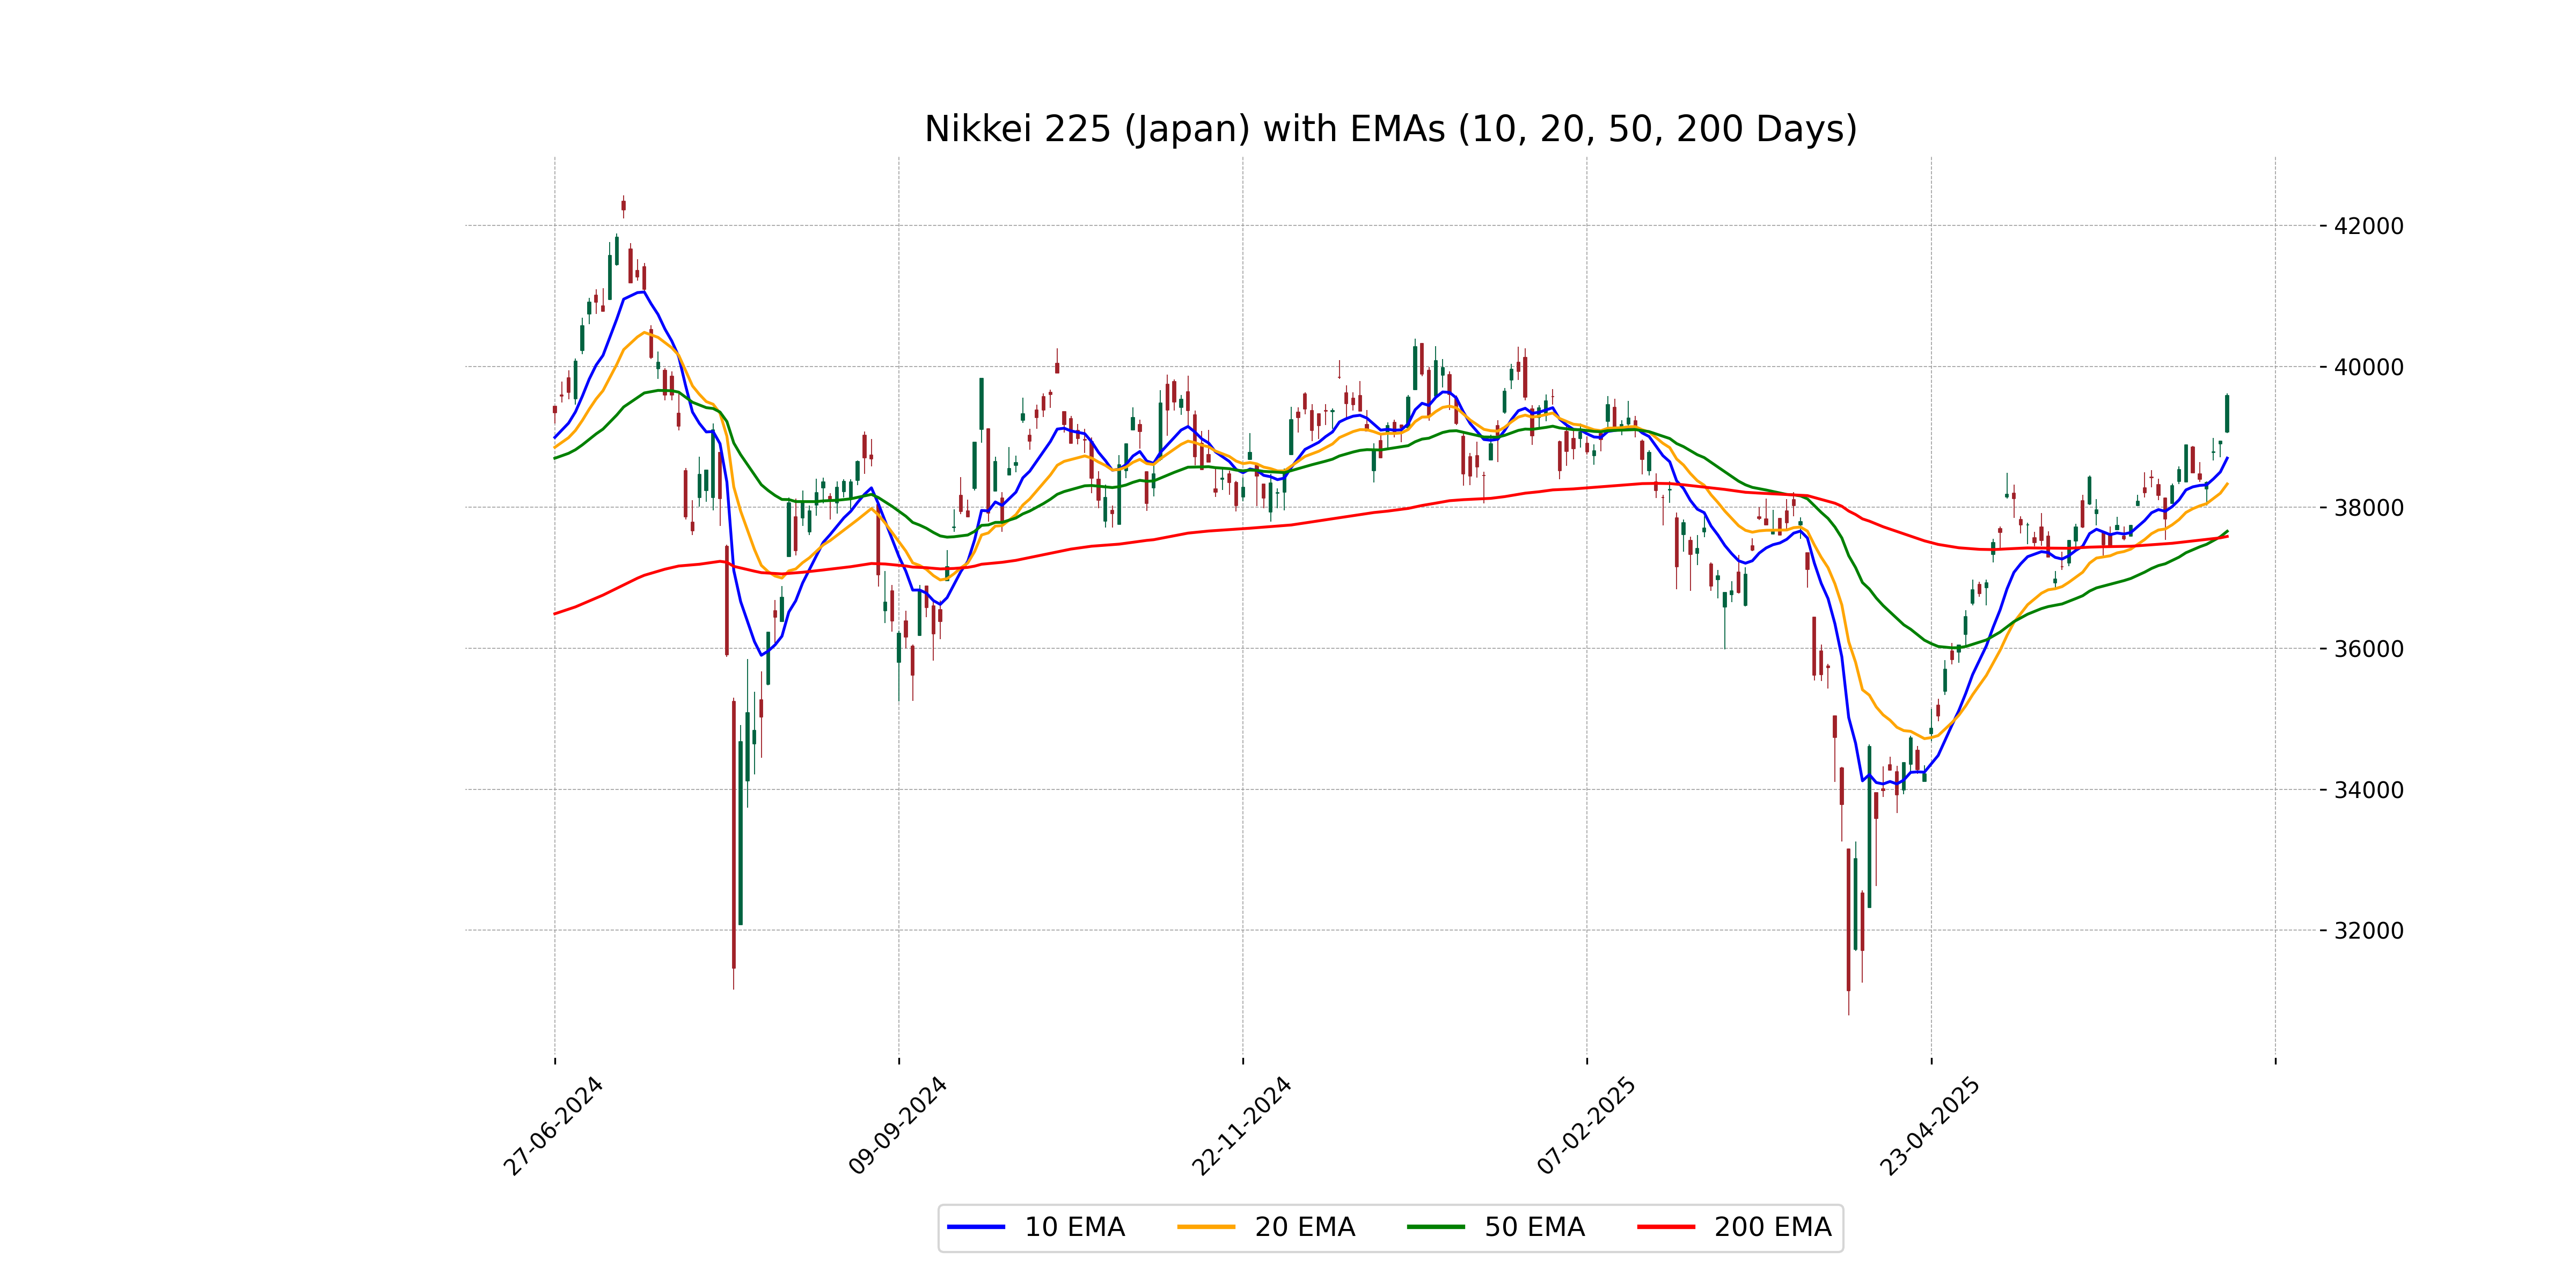
Relationship with Key Moving Averages
Nikkei 225's current close of 39,584.578125 is above its 10-day EMA of 38,699.65, 20-day EMA of 38,333.28, 50-day EMA of 37,661.80, and 200-day EMA of 37,588.20, indicating a strong bullish trend. The RSI value of 68.54 suggests that it is nearing overbought territory.
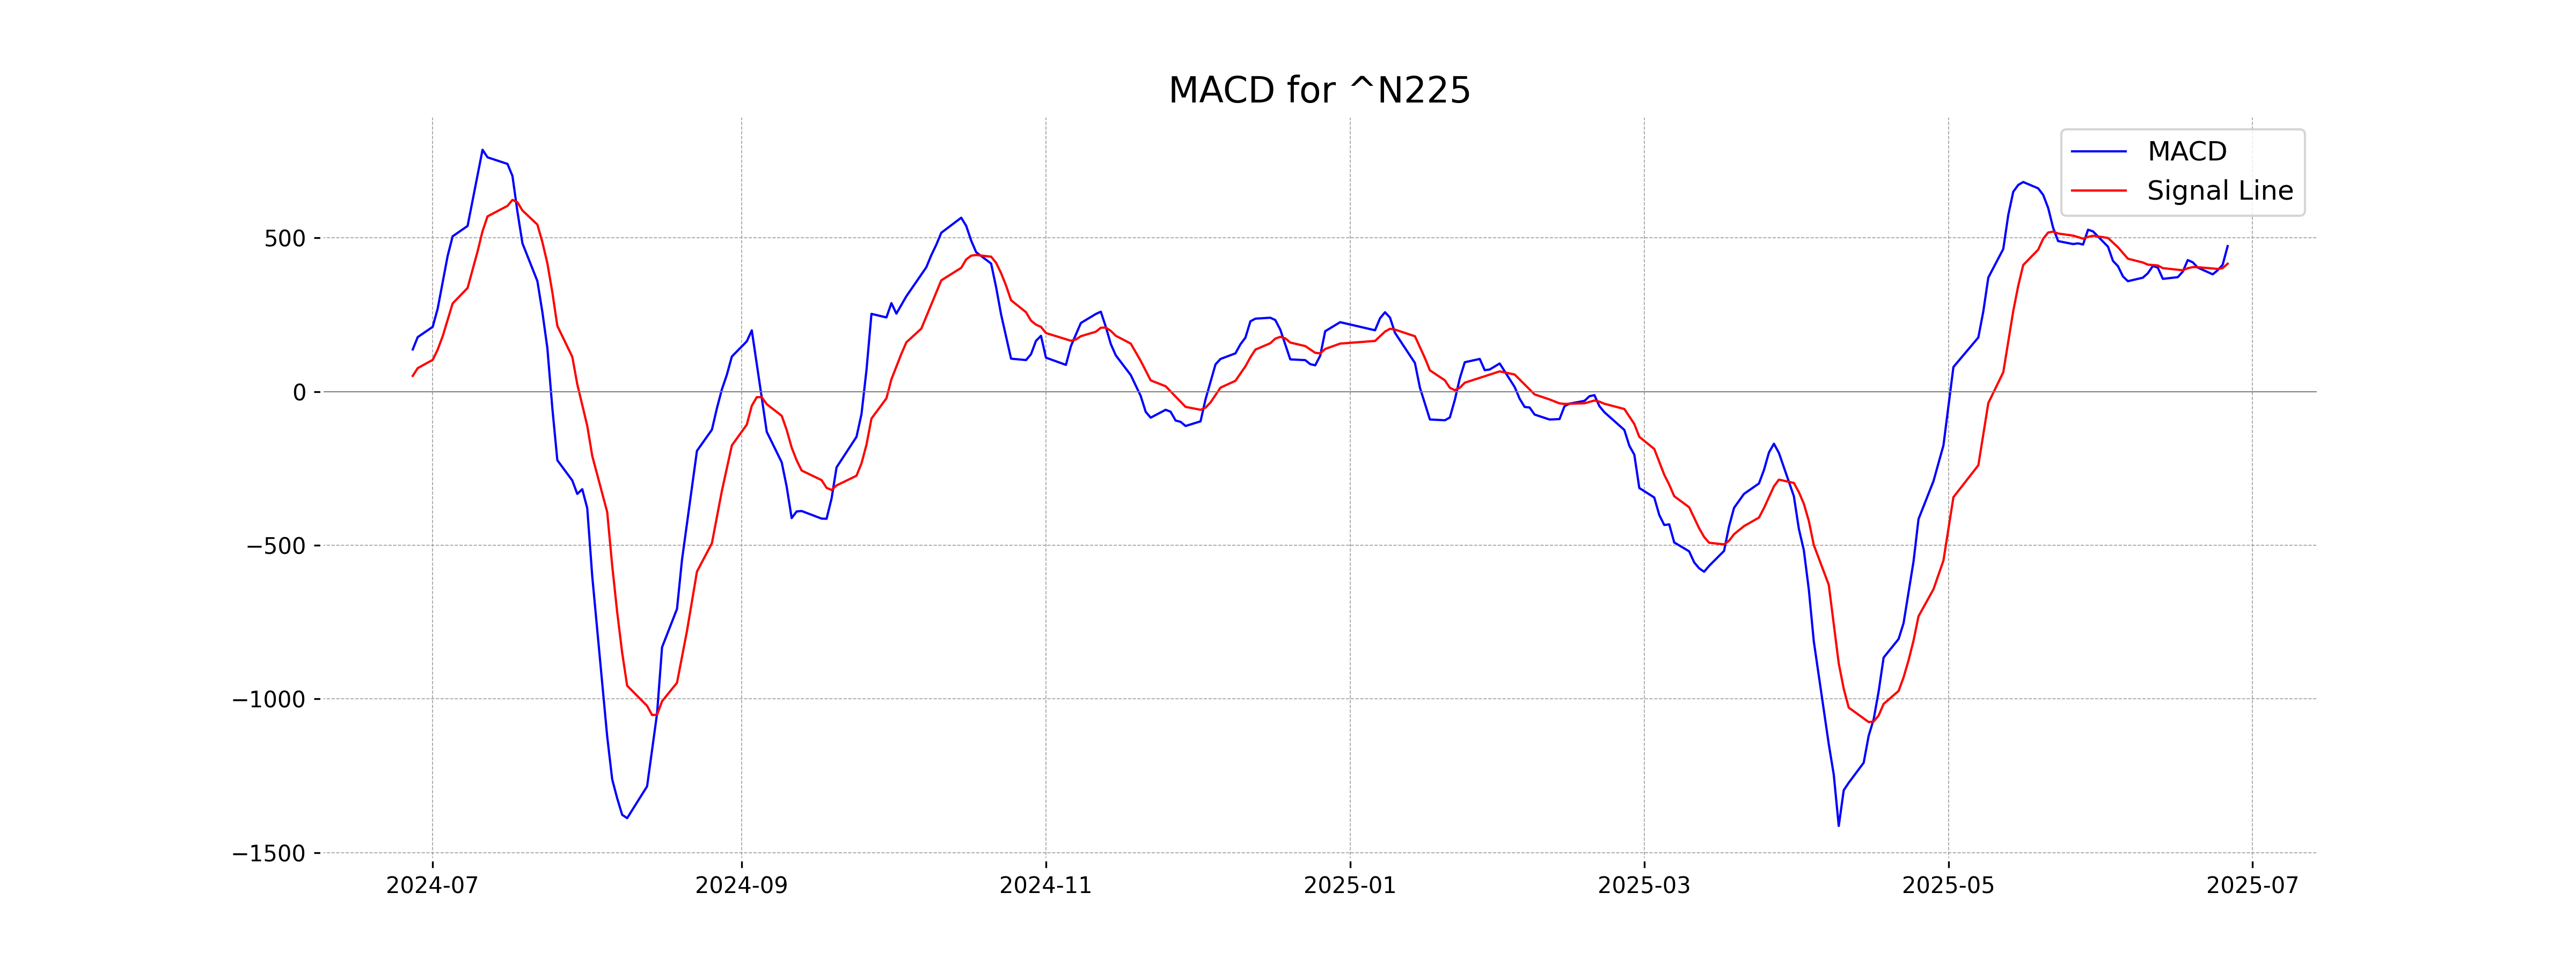
Moving Averages Trend (MACD)
The MACD value for Nikkei 225 is 473.27, which is above the MACD Signal of 416.05, indicating a bullish trend. This suggests upward momentum in the stock's price movement.
RSI Analysis
Nikkei 225 (Japan) currently has an RSI value of 68.54, which suggests the index is nearing overbought conditions. Investors may want to watch for potential consolidation or a pullback if the RSI continues to rise above 70.
Analysis for Nifty Bank - June 26, 2025
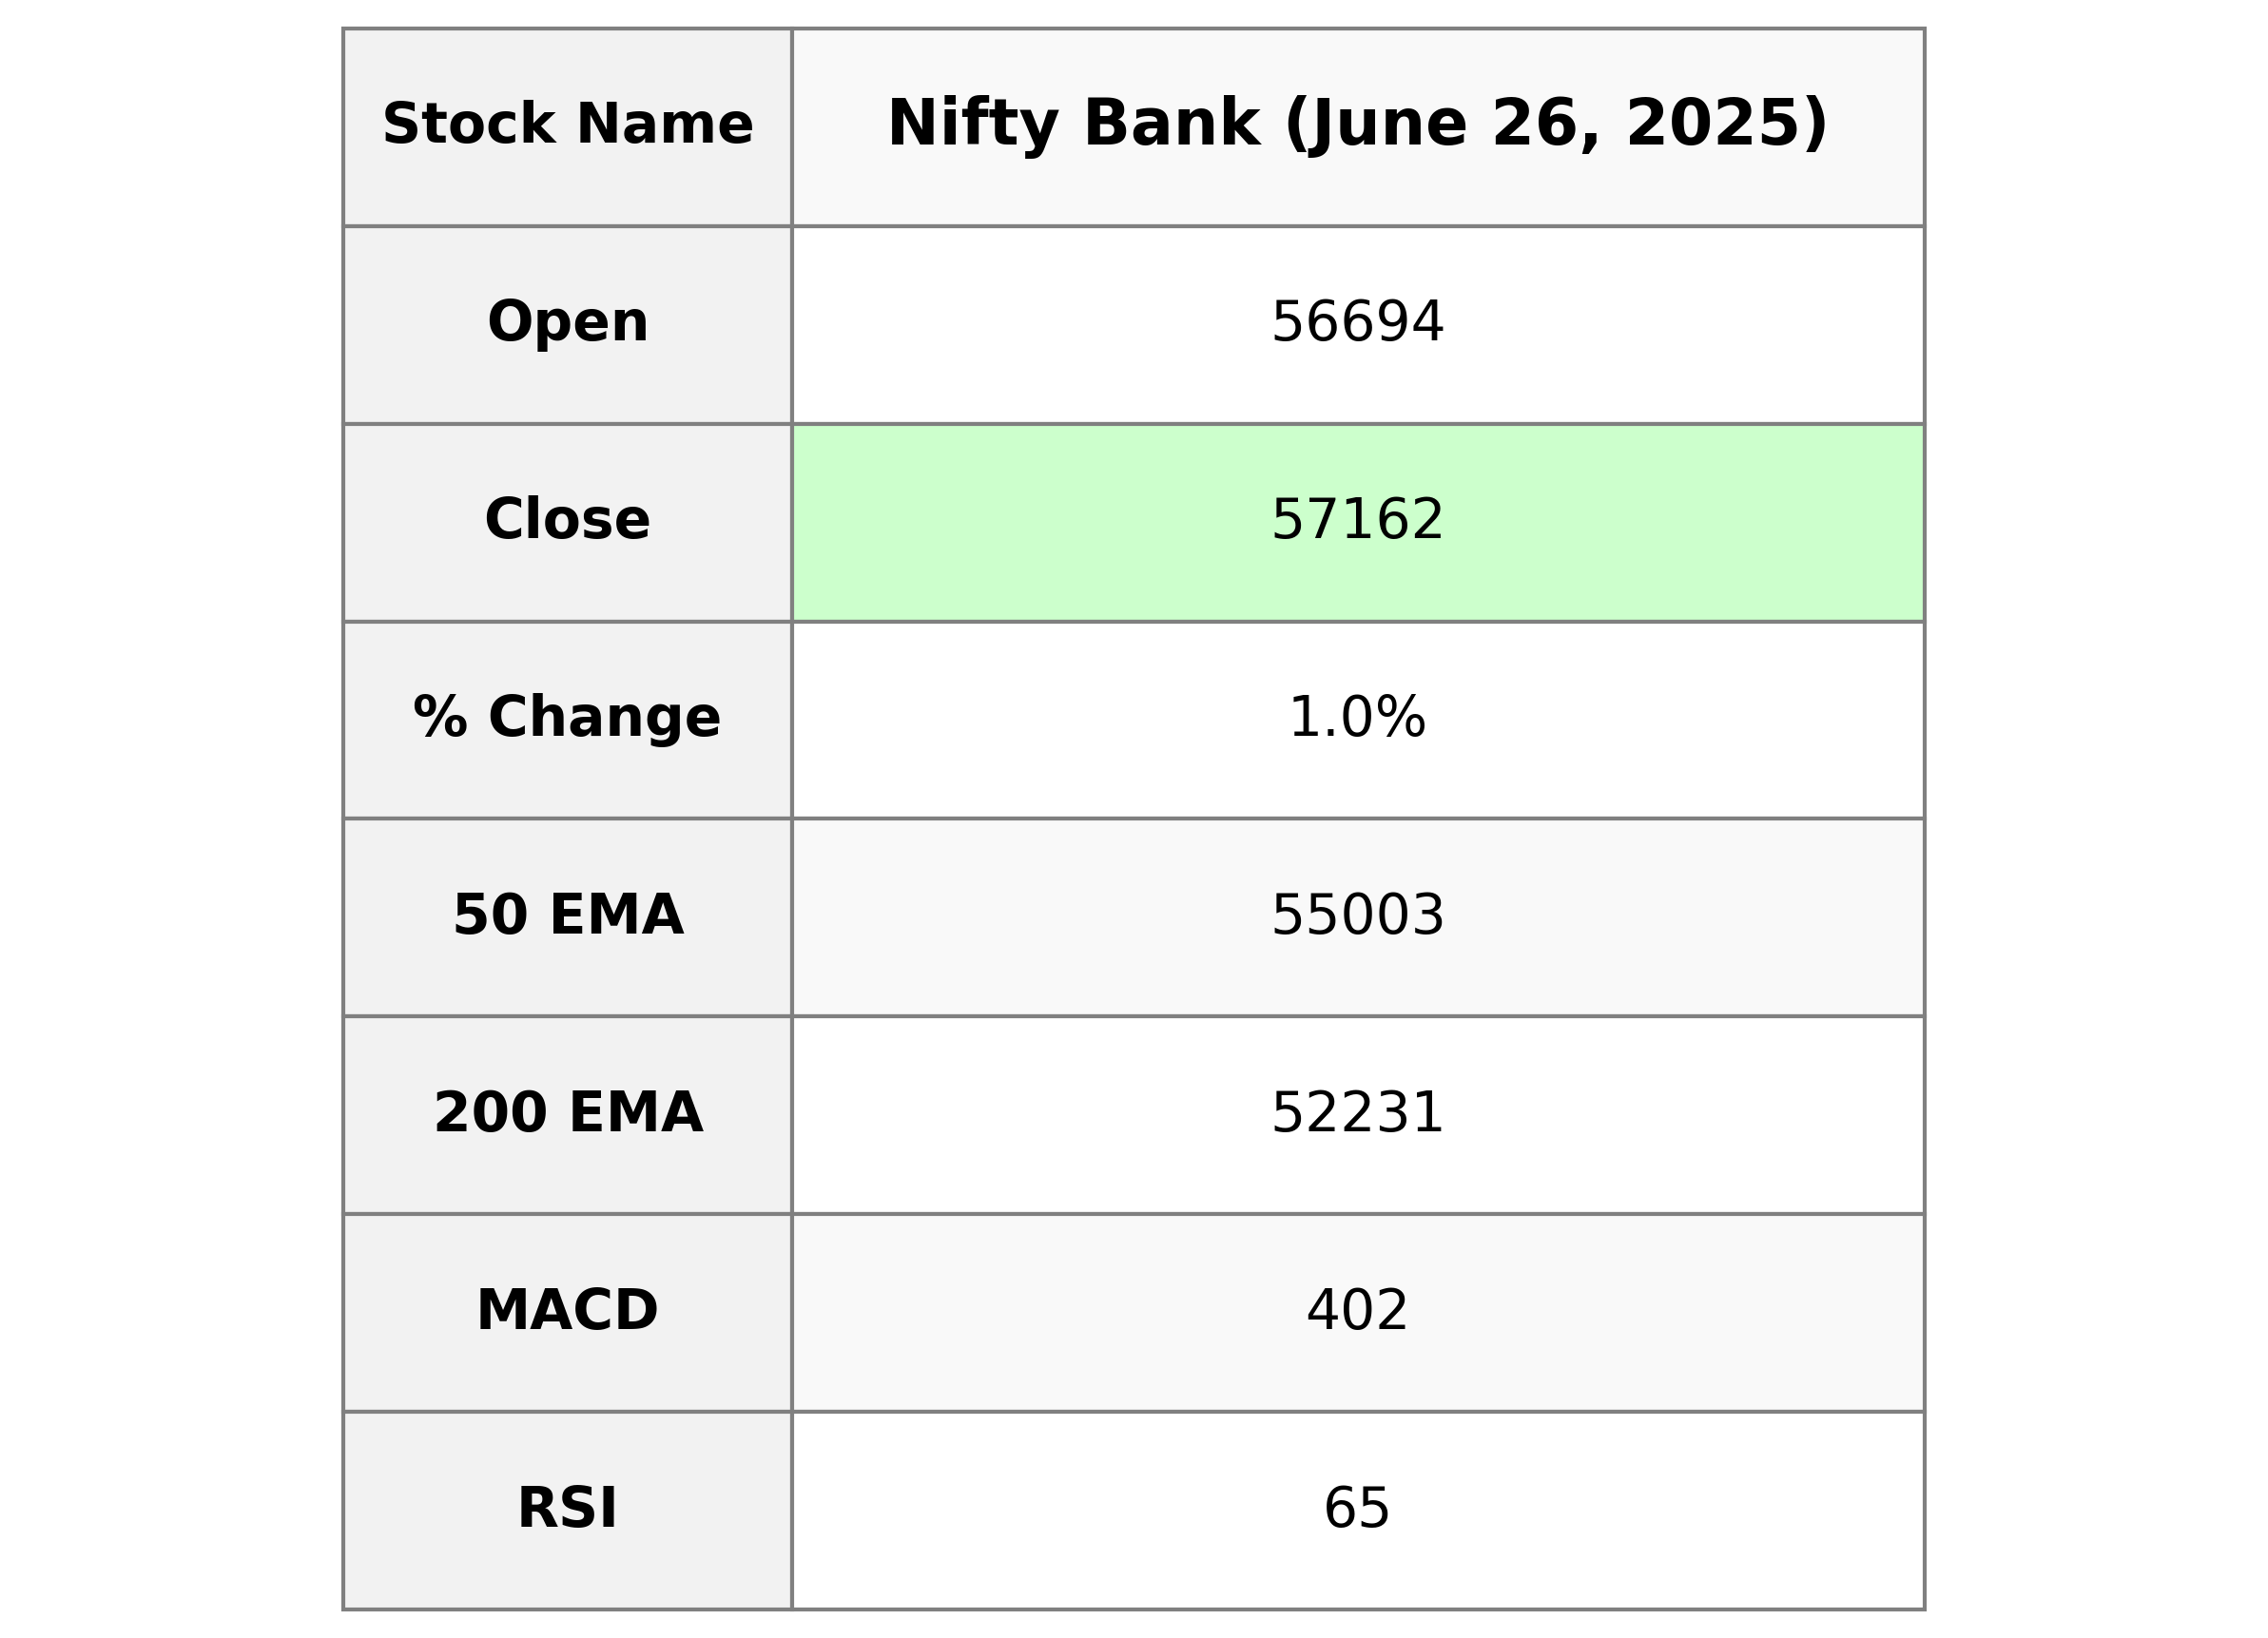
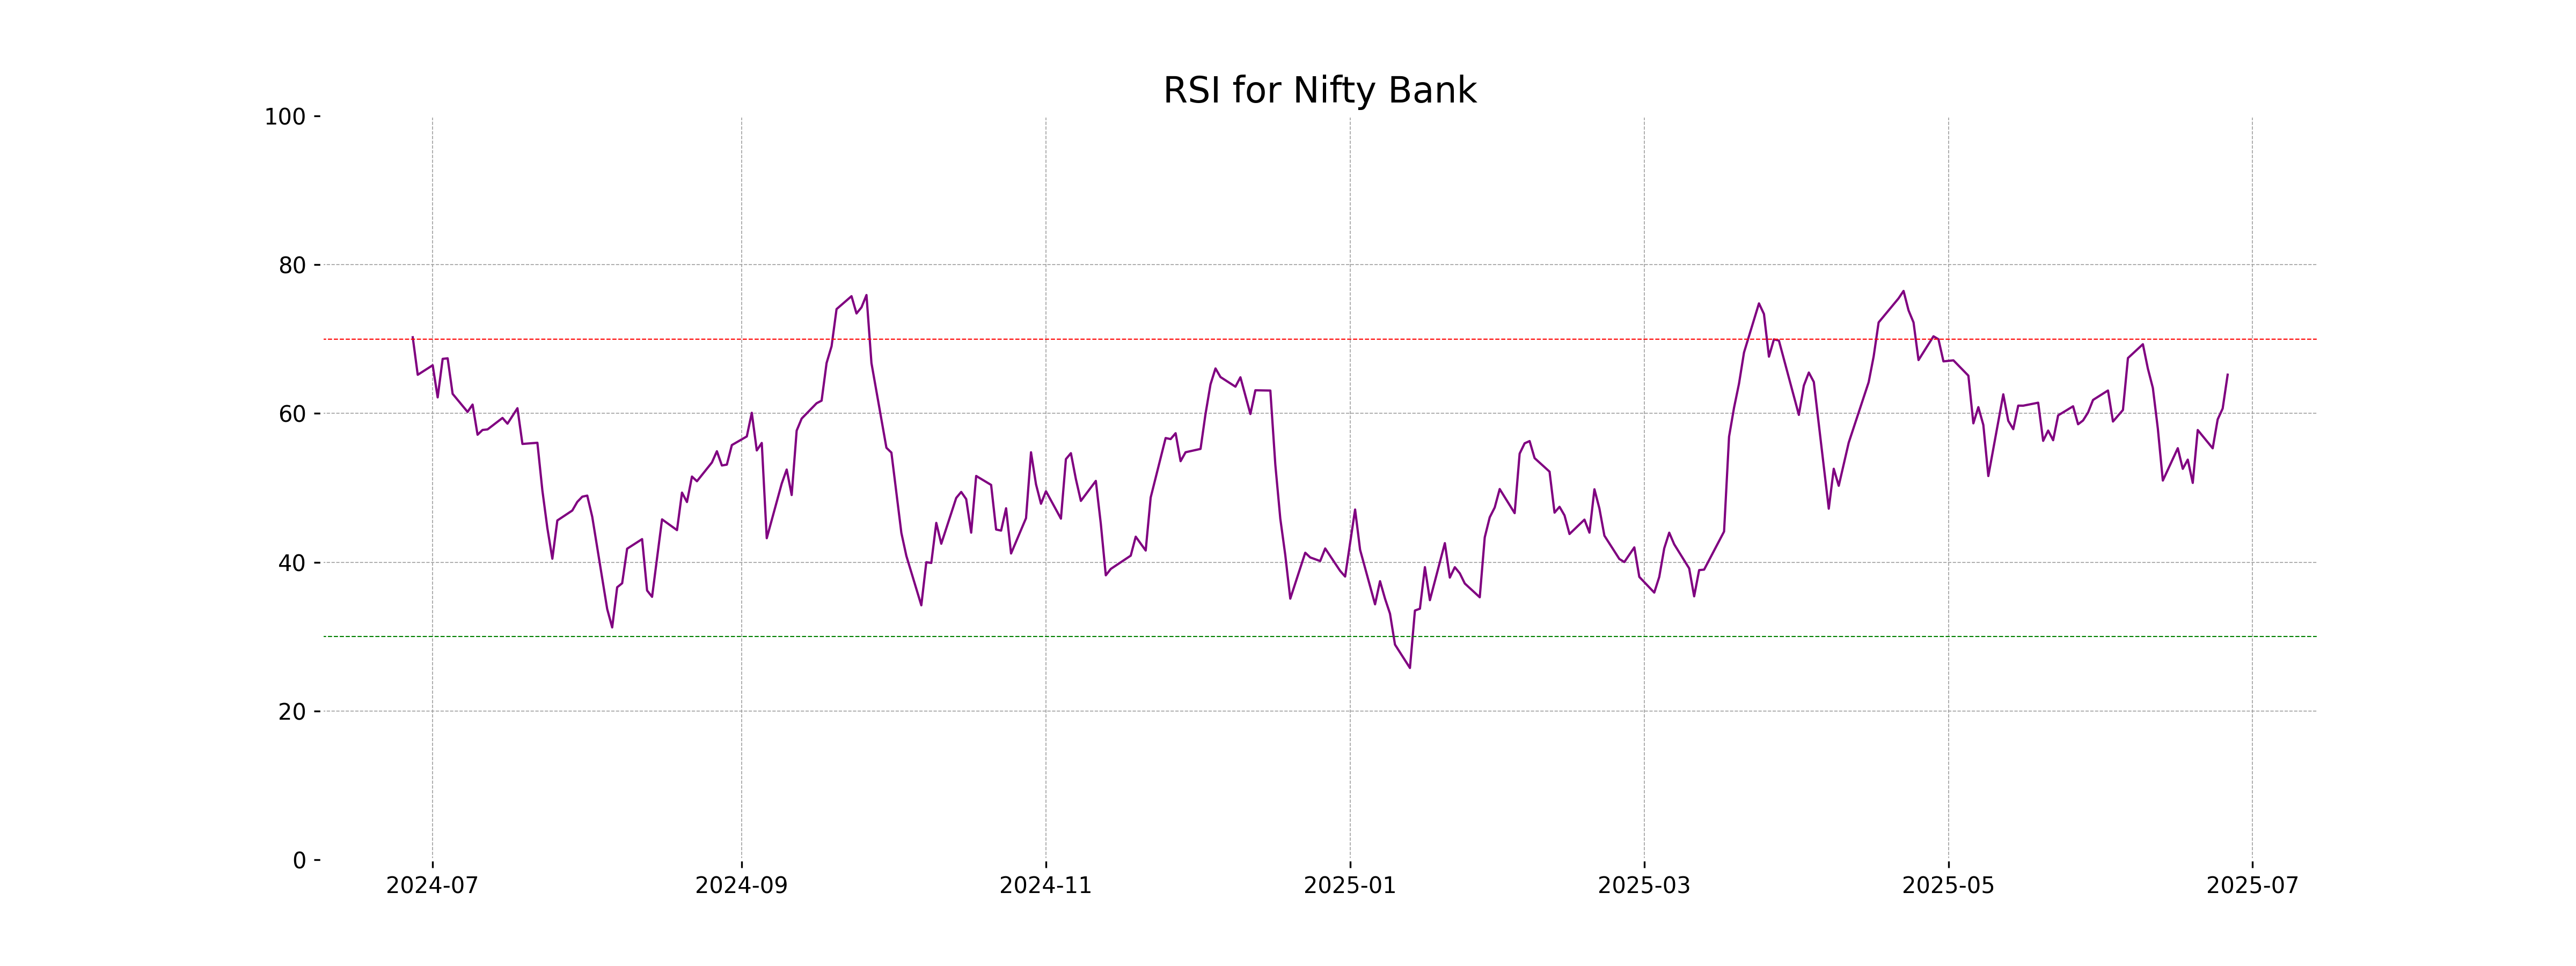
Based on the given data, Nifty Bank showed a positive performance with a closing value of 57,161.90, witnessing a gain of 540.75 points, or a 0.96% increase, from the previous close. The index traded within a range from a low of 56,558.35 to a high of 57,255.85, and the RSI stood at 65.21, indicating a strong momentum.
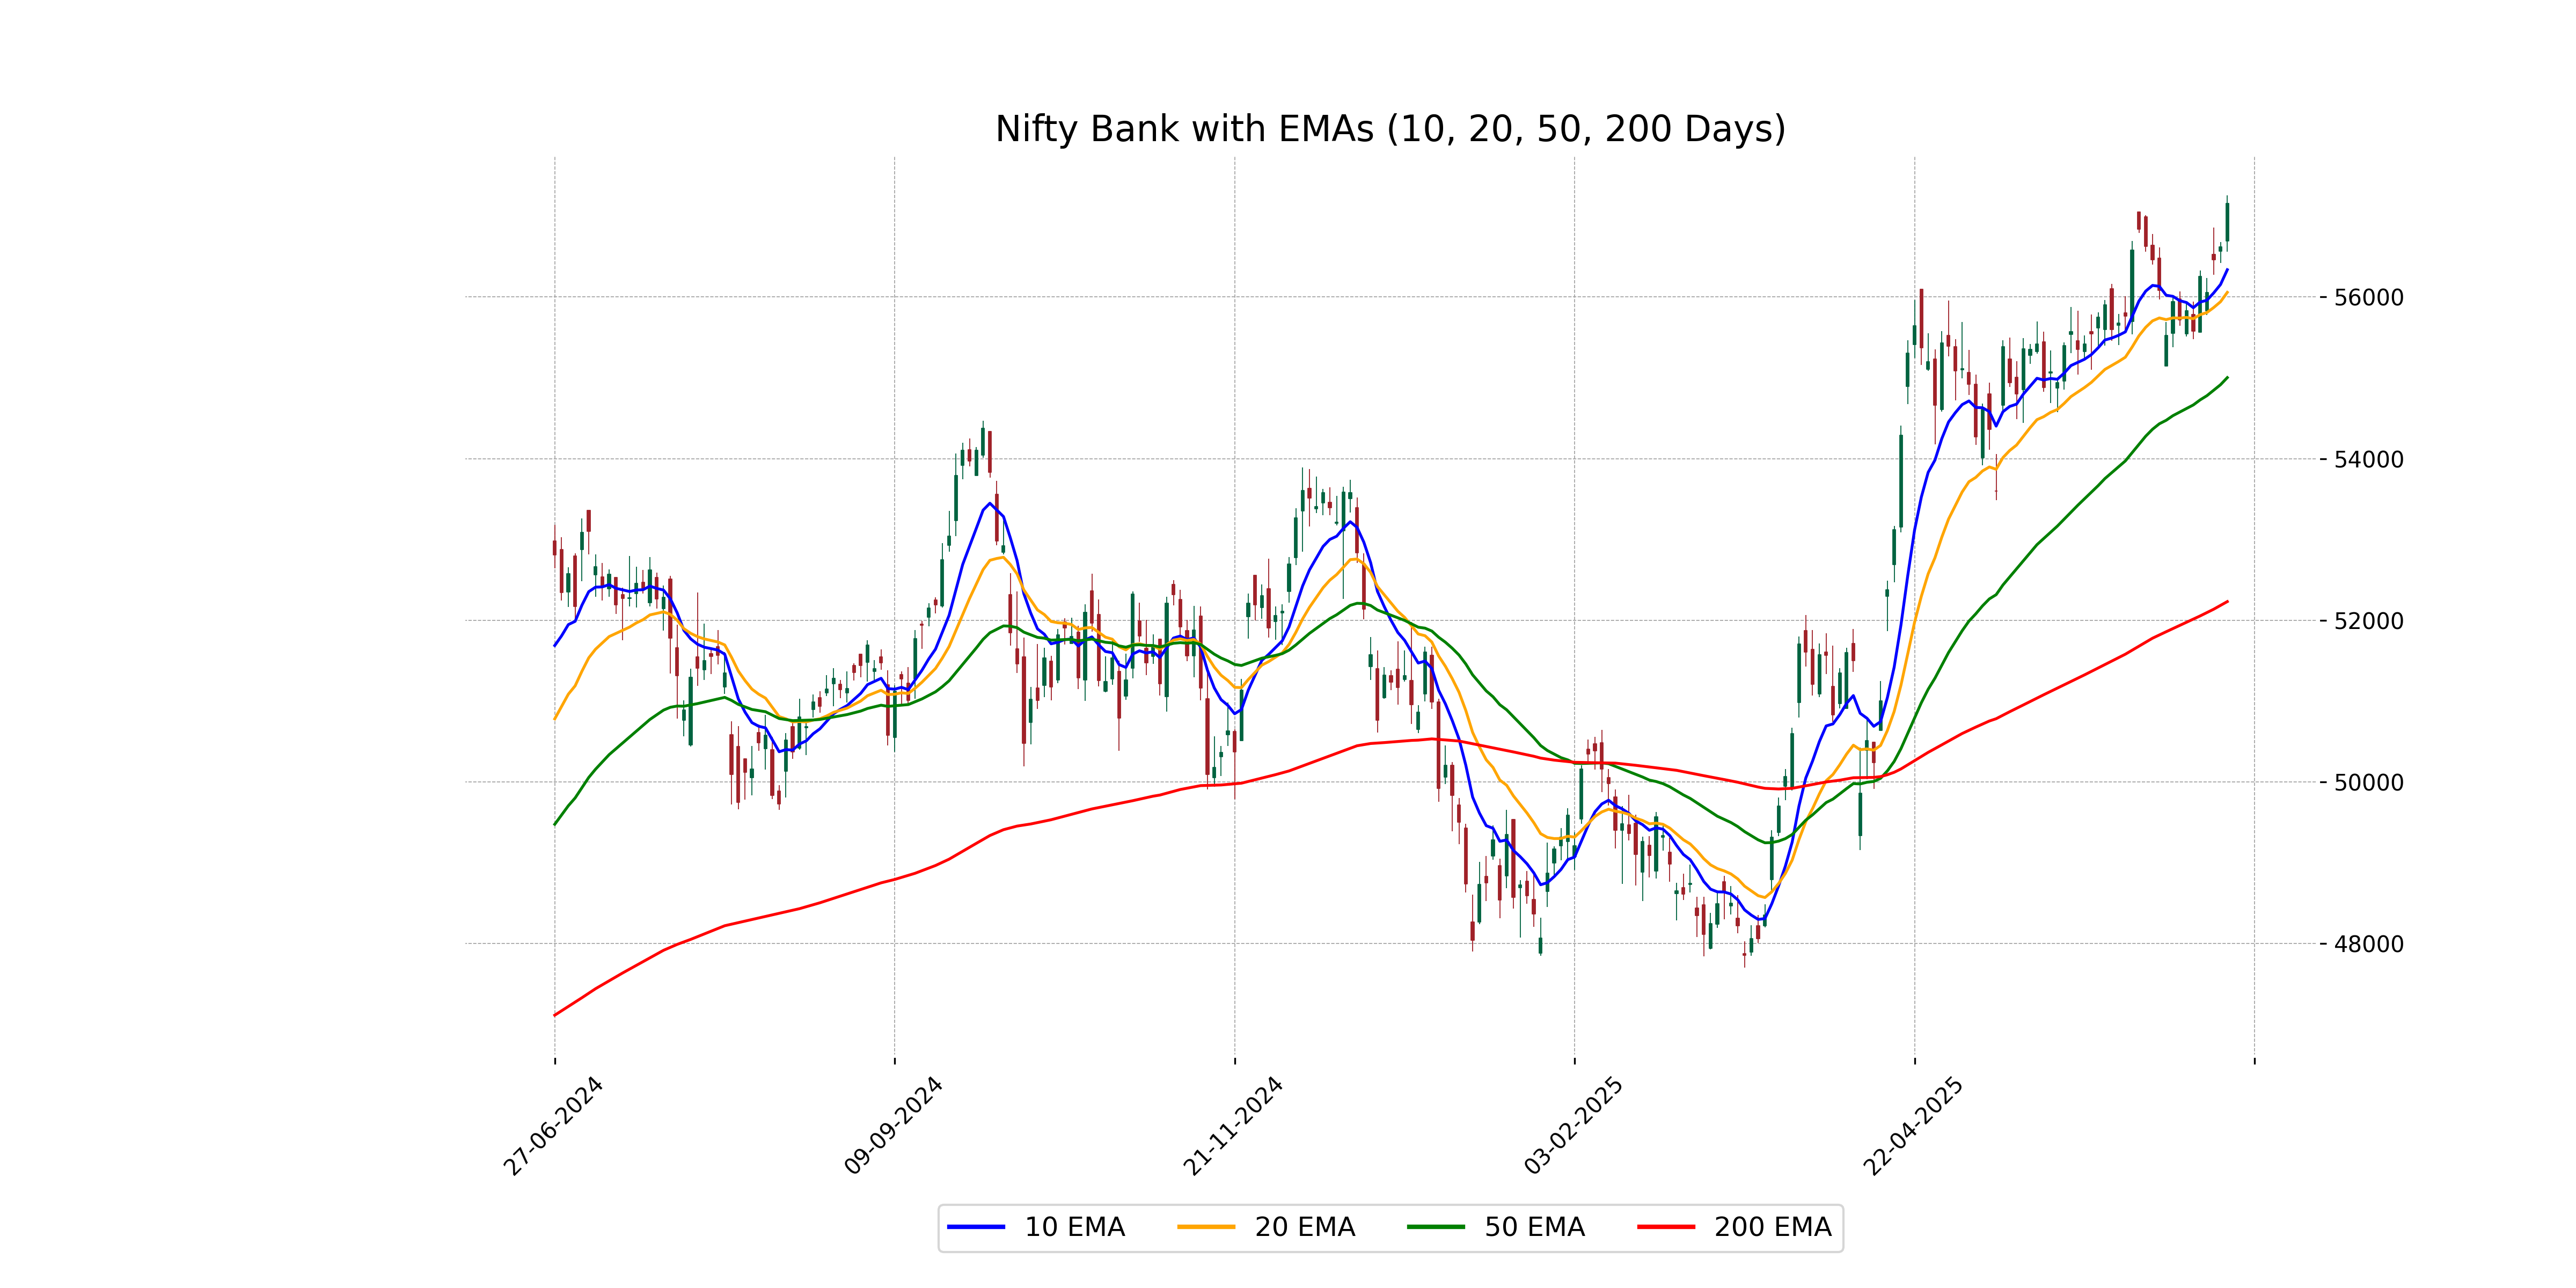
Relationship with Key Moving Averages
The close price of Nifty Bank at 57,161.90 is above key moving averages: the 10-day EMA at 56,337.80, the 20-day EMA at 56,057.74, the 50-day EMA at 55,002.65, and the 200-day EMA at 52,230.61, indicating a strong bullish sentiment.
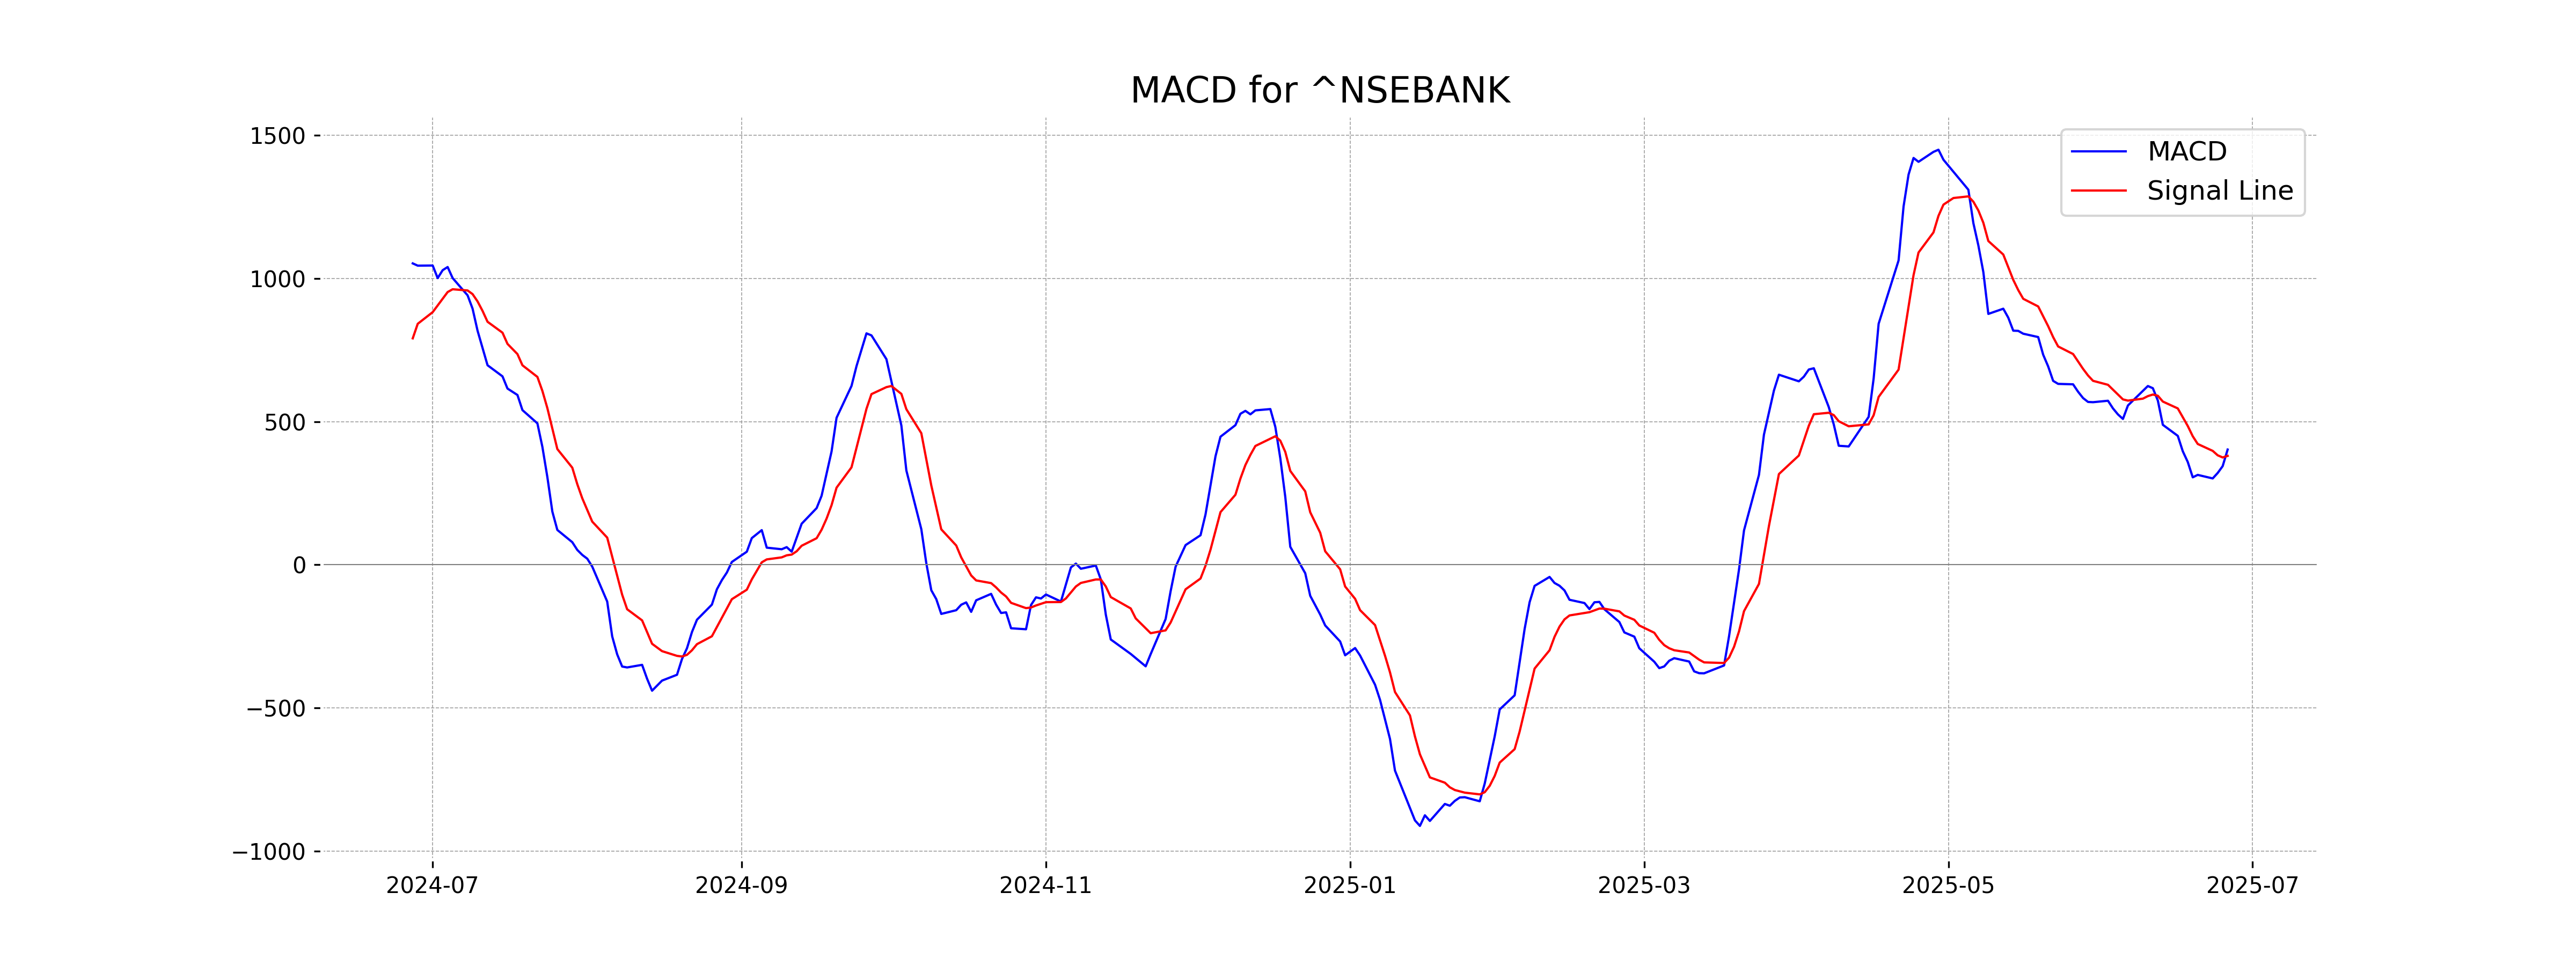
Moving Averages Trend (MACD)
The MACD for Nifty Bank is 402.45, which is above the Signal Line value of 380.32. This suggests a bullish momentum in the current market trend. With the RSI at 65.21, the stock is approaching overbought territory, indicating continued strength but with caution advised.
RSI Analysis
Based on the RSI value of 65.21 for Nifty Bank, the stock is approaching the overbought zone but is not yet overbought, suggesting that there is still upward momentum. However, if the RSI continues to rise close to 70, it may indicate that the stock is becoming overbought and could potentially face a price correction.
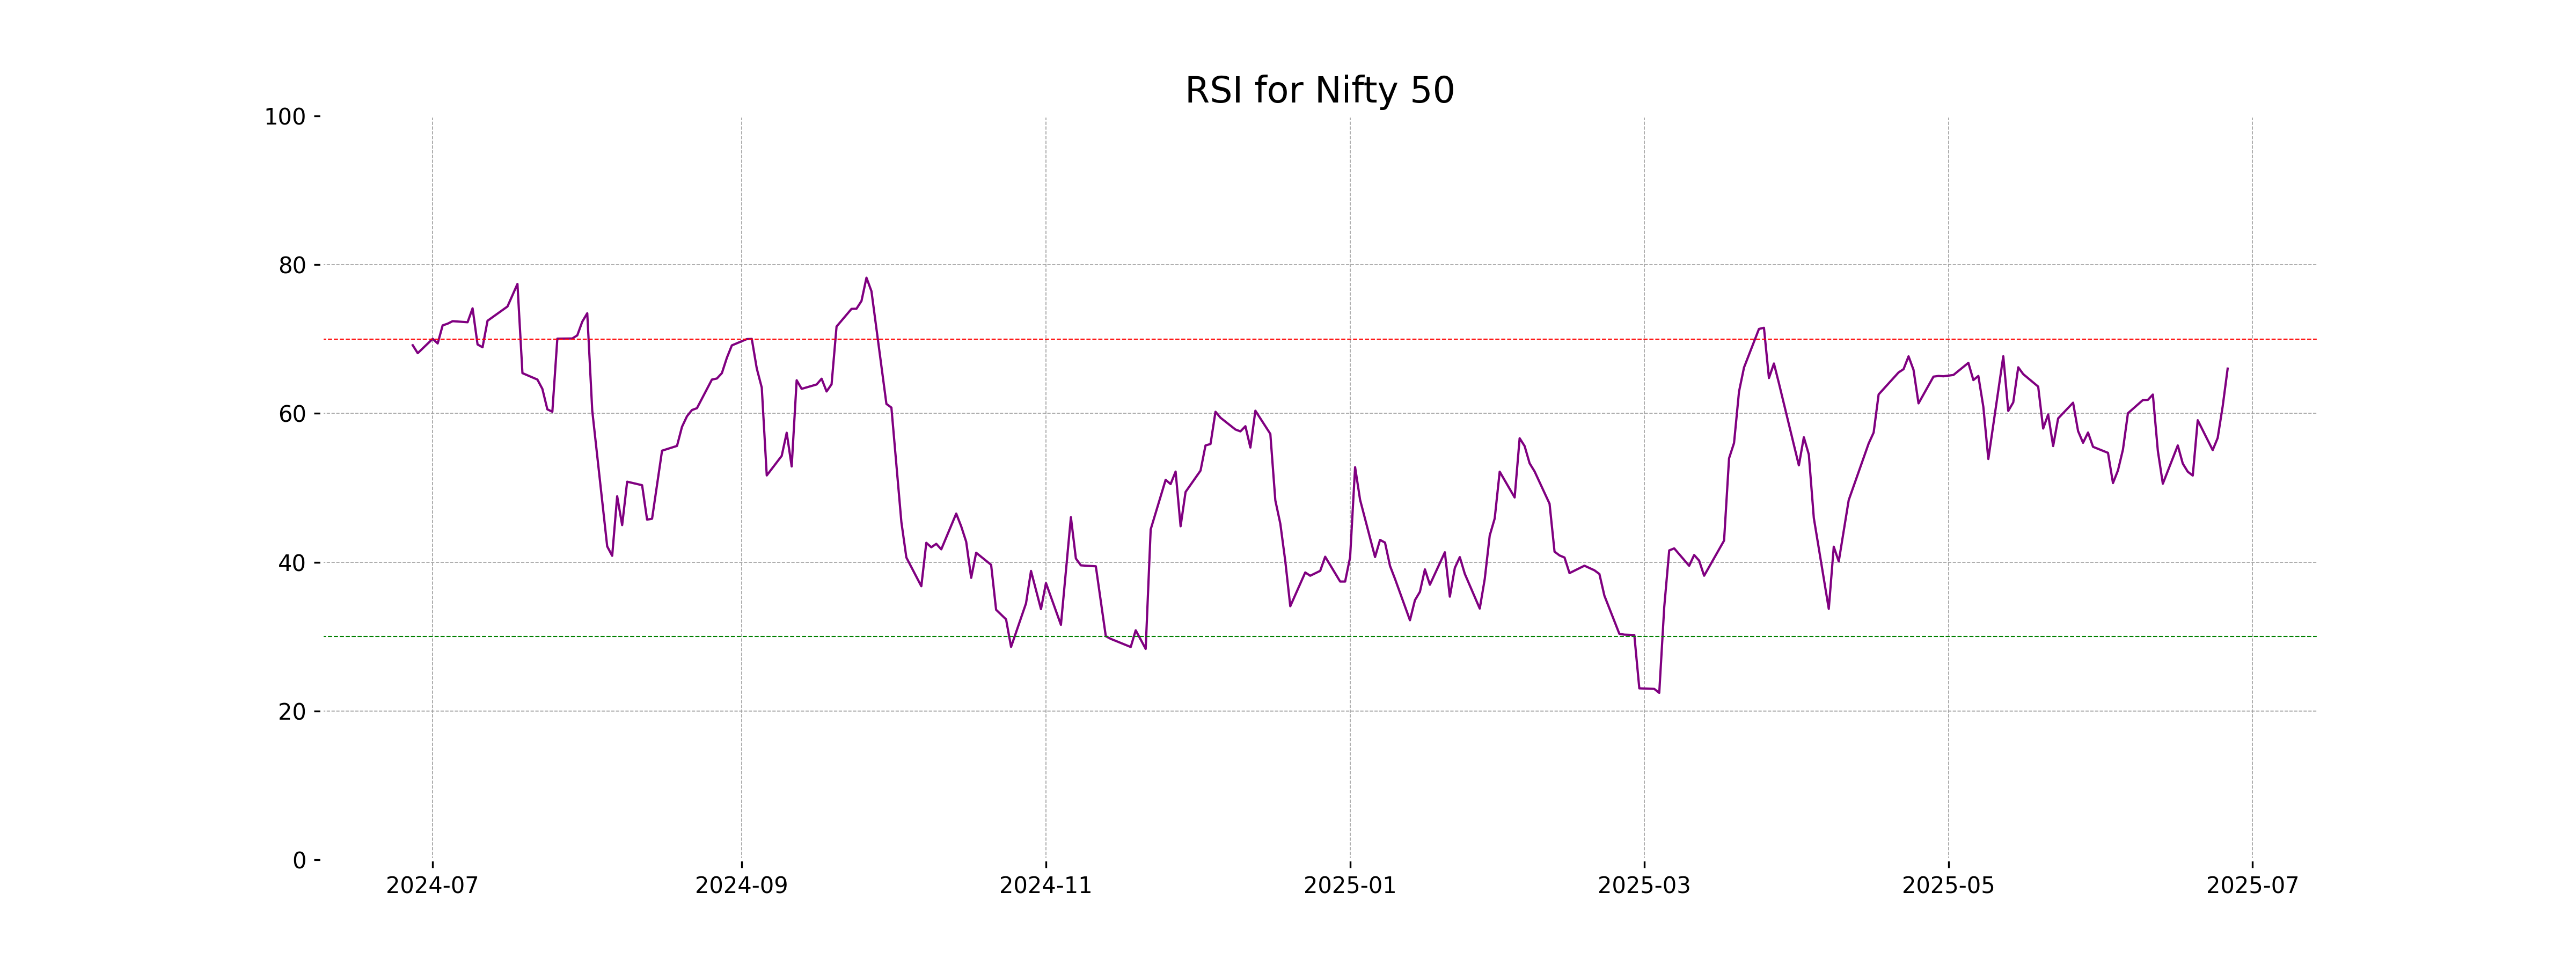
Analysis for Nifty 50 - June 26, 2025
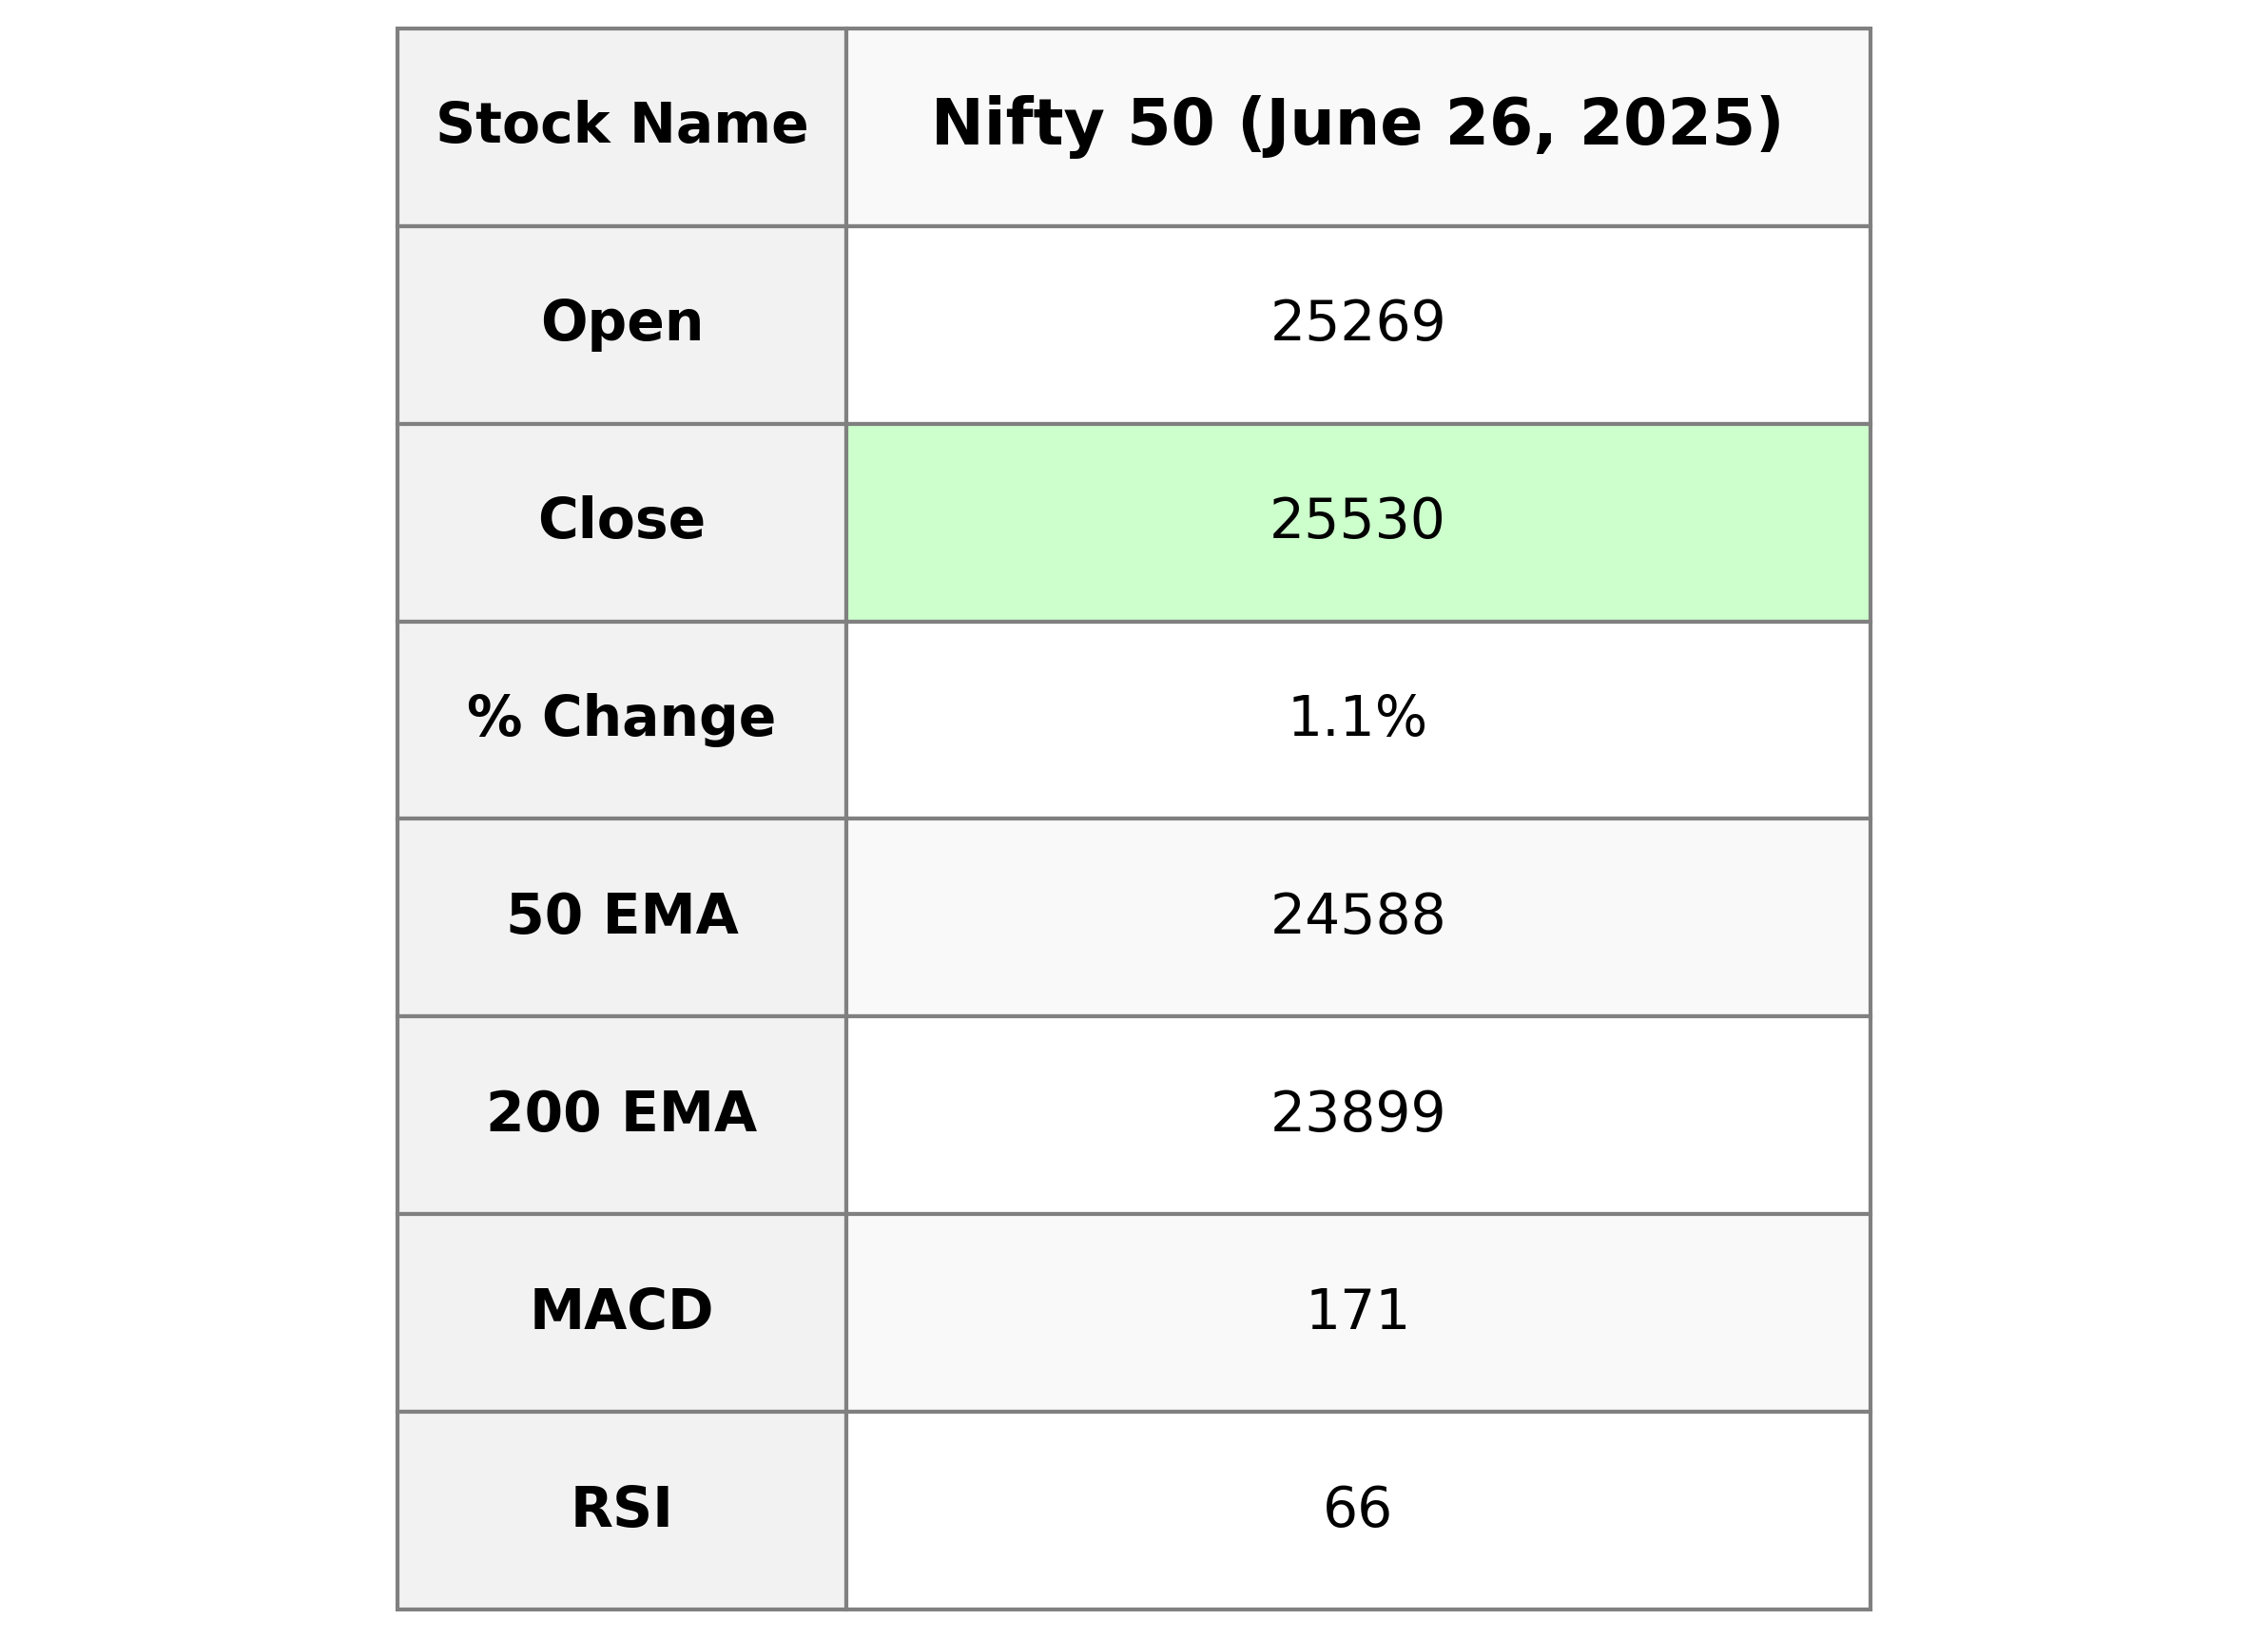
The Nifty 50 index opened at 25,268.95, reaching a high of 25,564.75 and closing at 25,529.90, with a daily gain of 285.15 points, marking a 1.13% increase from the previous close of 25,244.75. The technical indicators show an RSI of 66.03, suggesting a strong momentum, and the MACD is above the signal line, indicating potential bullish sentiment.
Relationship with Key Moving Averages
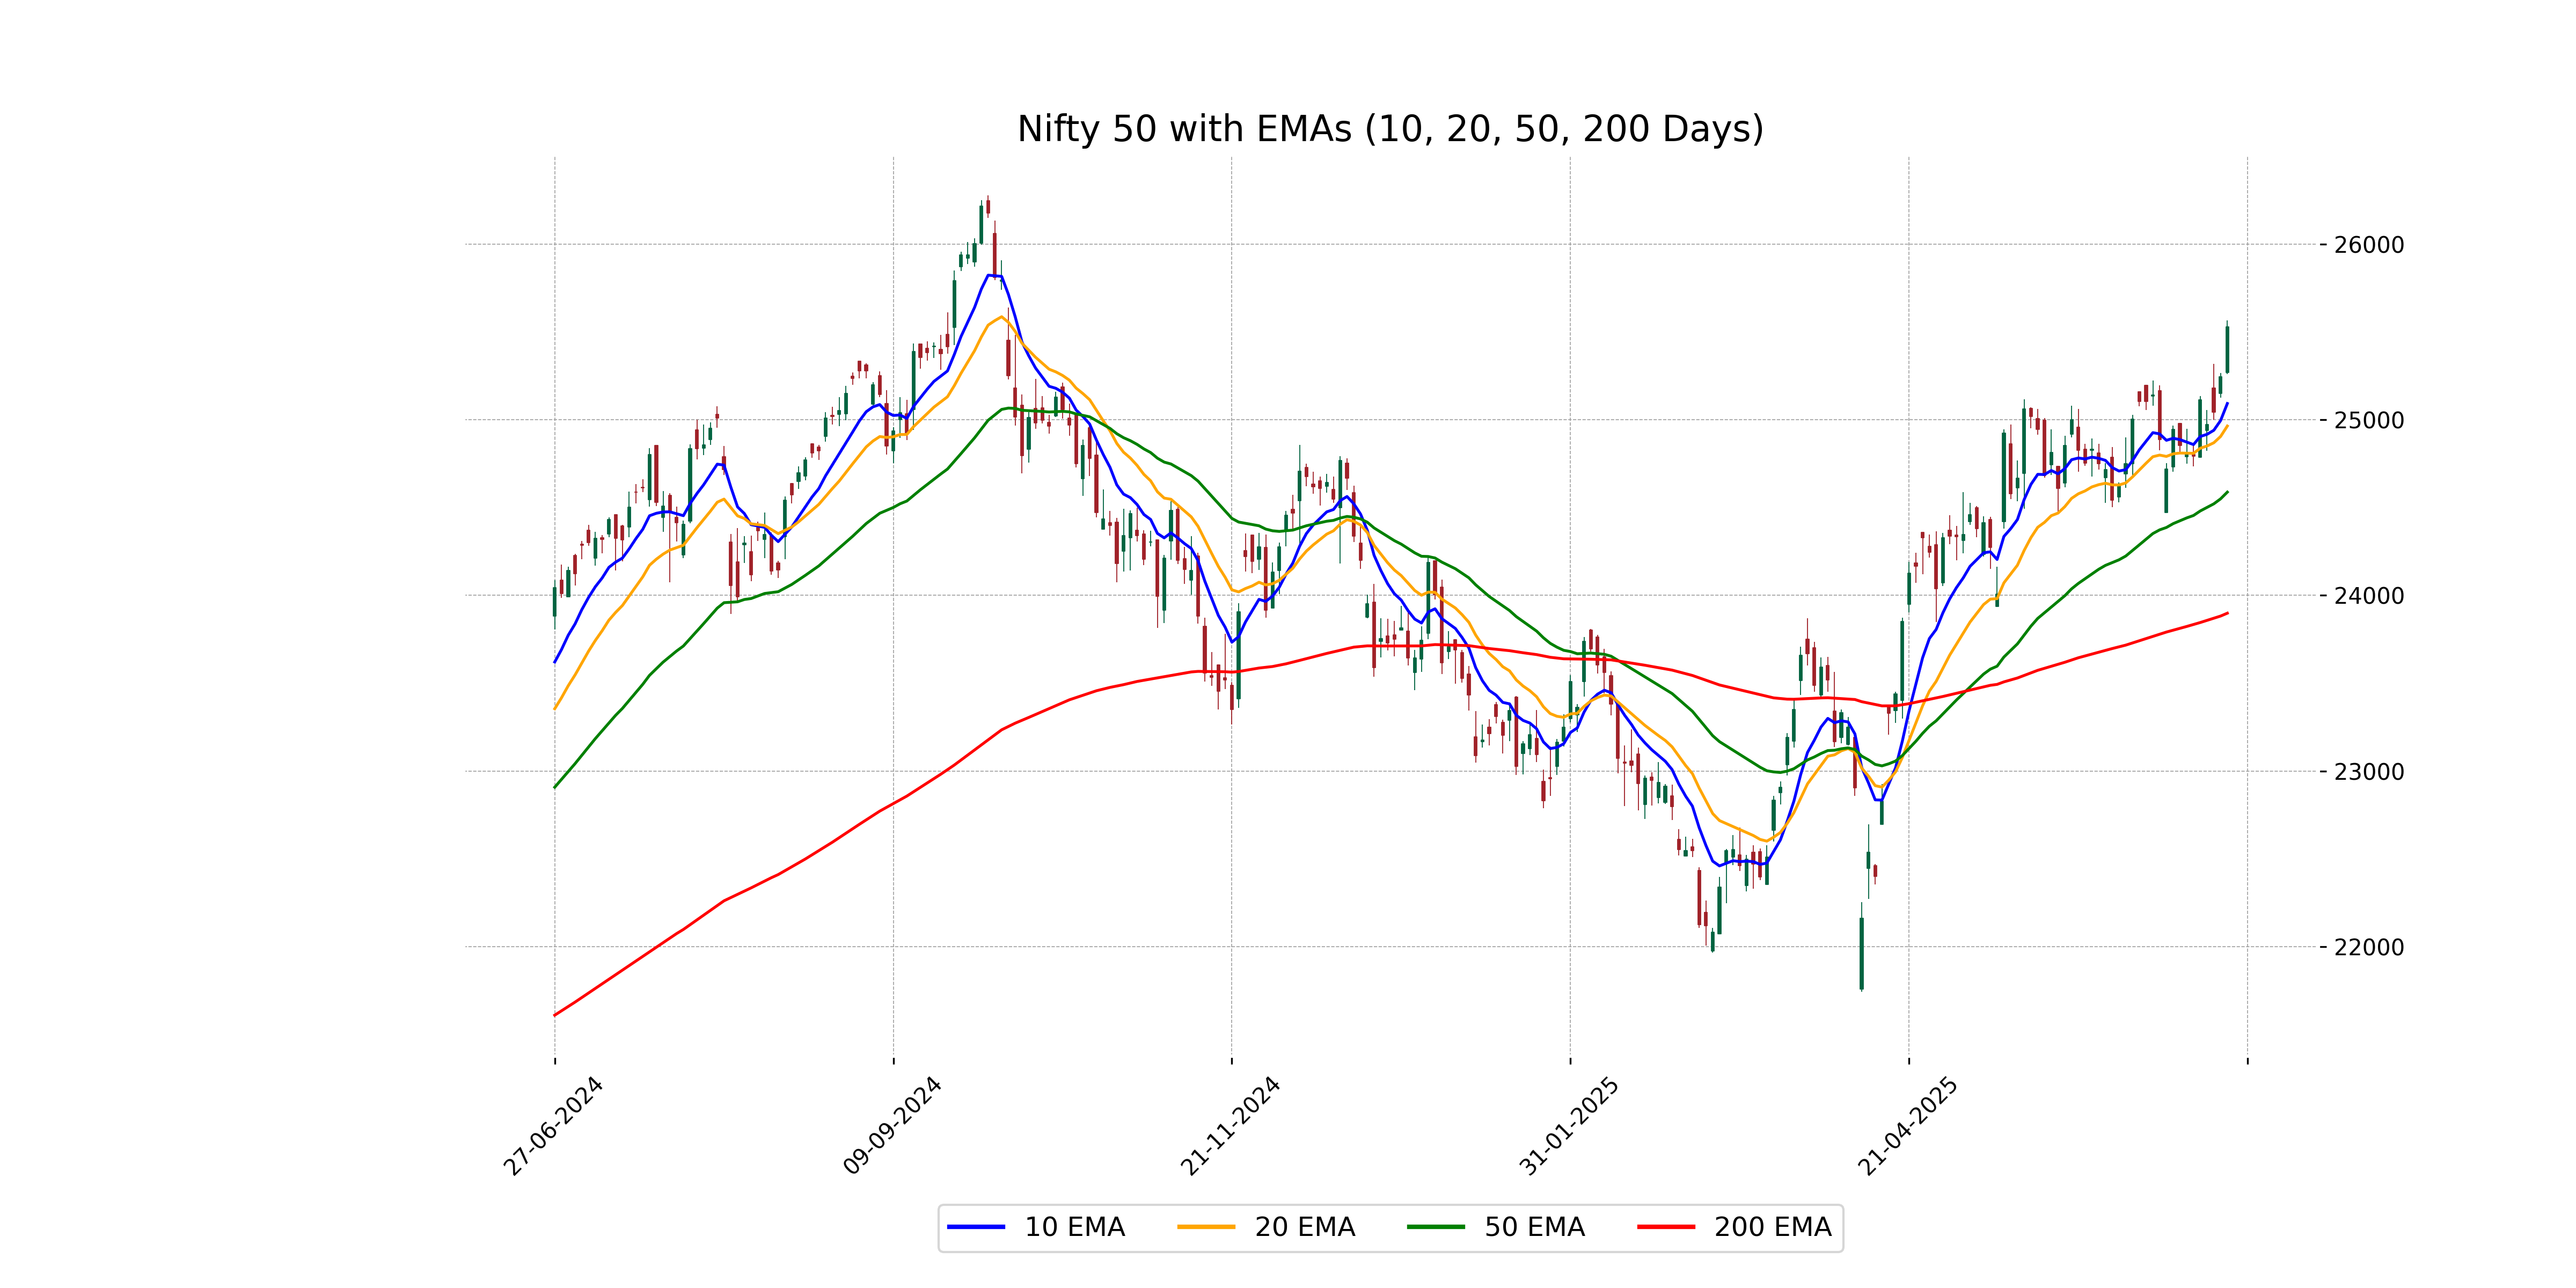
The Nifty 50 closed at 25,529.90, which is above its 50-day EMA of 24,588.15, indicating a bullish trend in the short-term perspective. It is also above the 200-day EMA of 23,898.52, suggesting a strong long-term bullish outlook. Additionally, the close is higher than both the 10-day EMA of 25,092.79 and the 20-day EMA of 24,964.48, supporting the upward momentum.
Moving Averages Trend (MACD)
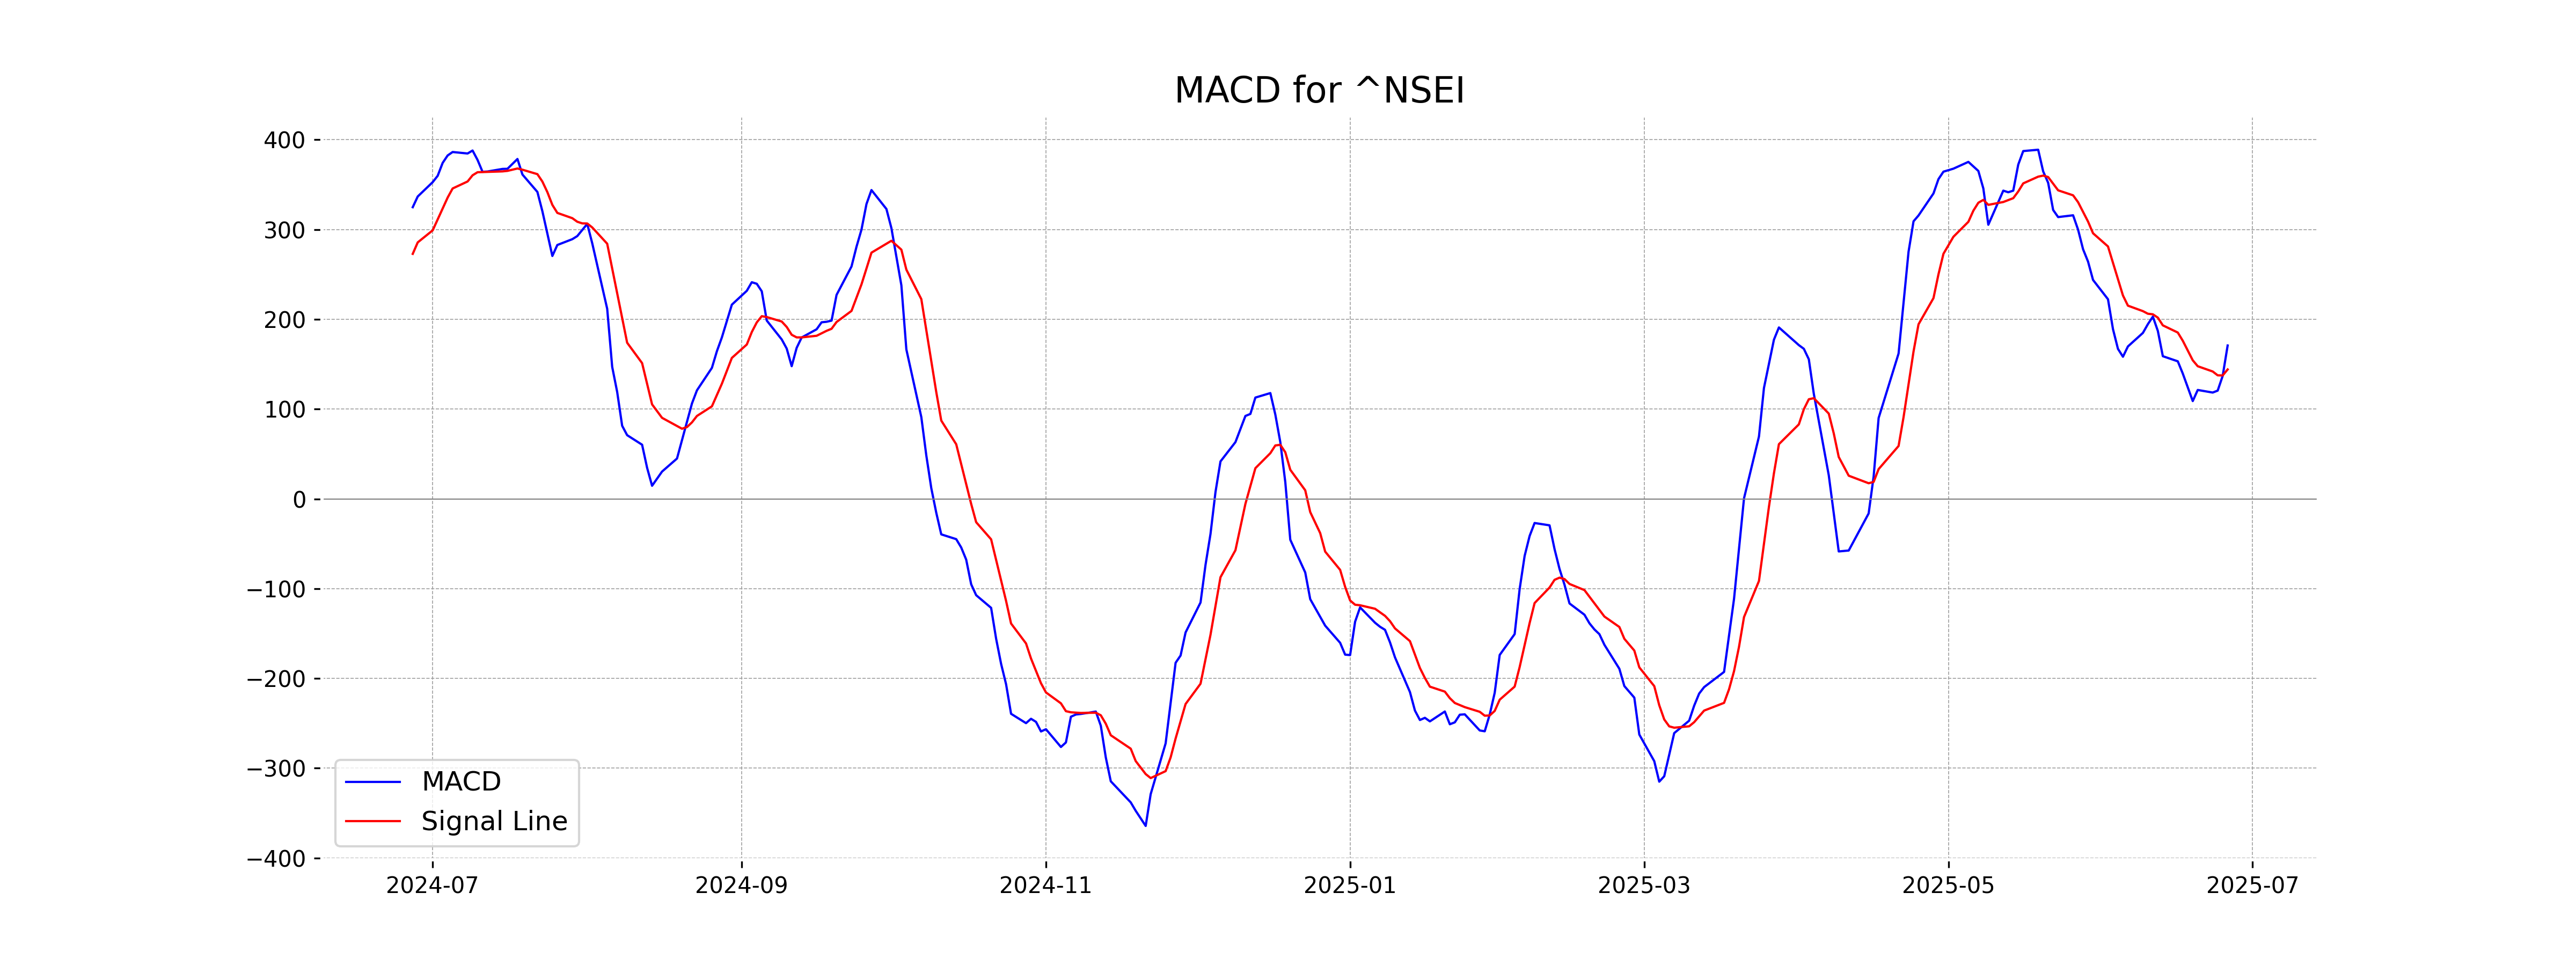
The MACD for Nifty 50 is calculated as 170.86 while the MACD Signal is 144.16, indicating a positive divergence which suggests a potential bullish trend. The MACD line being above the signal line typically signals that the market may continue with upward momentum.
RSI Analysis
The Nifty 50 has an RSI of 66.03, suggesting it is approaching overbought territory as it nears the 70 level, indicating potential caution for investors. However, it is not yet in the overbought zone, so upward momentum may still continue if buying pressure persists.