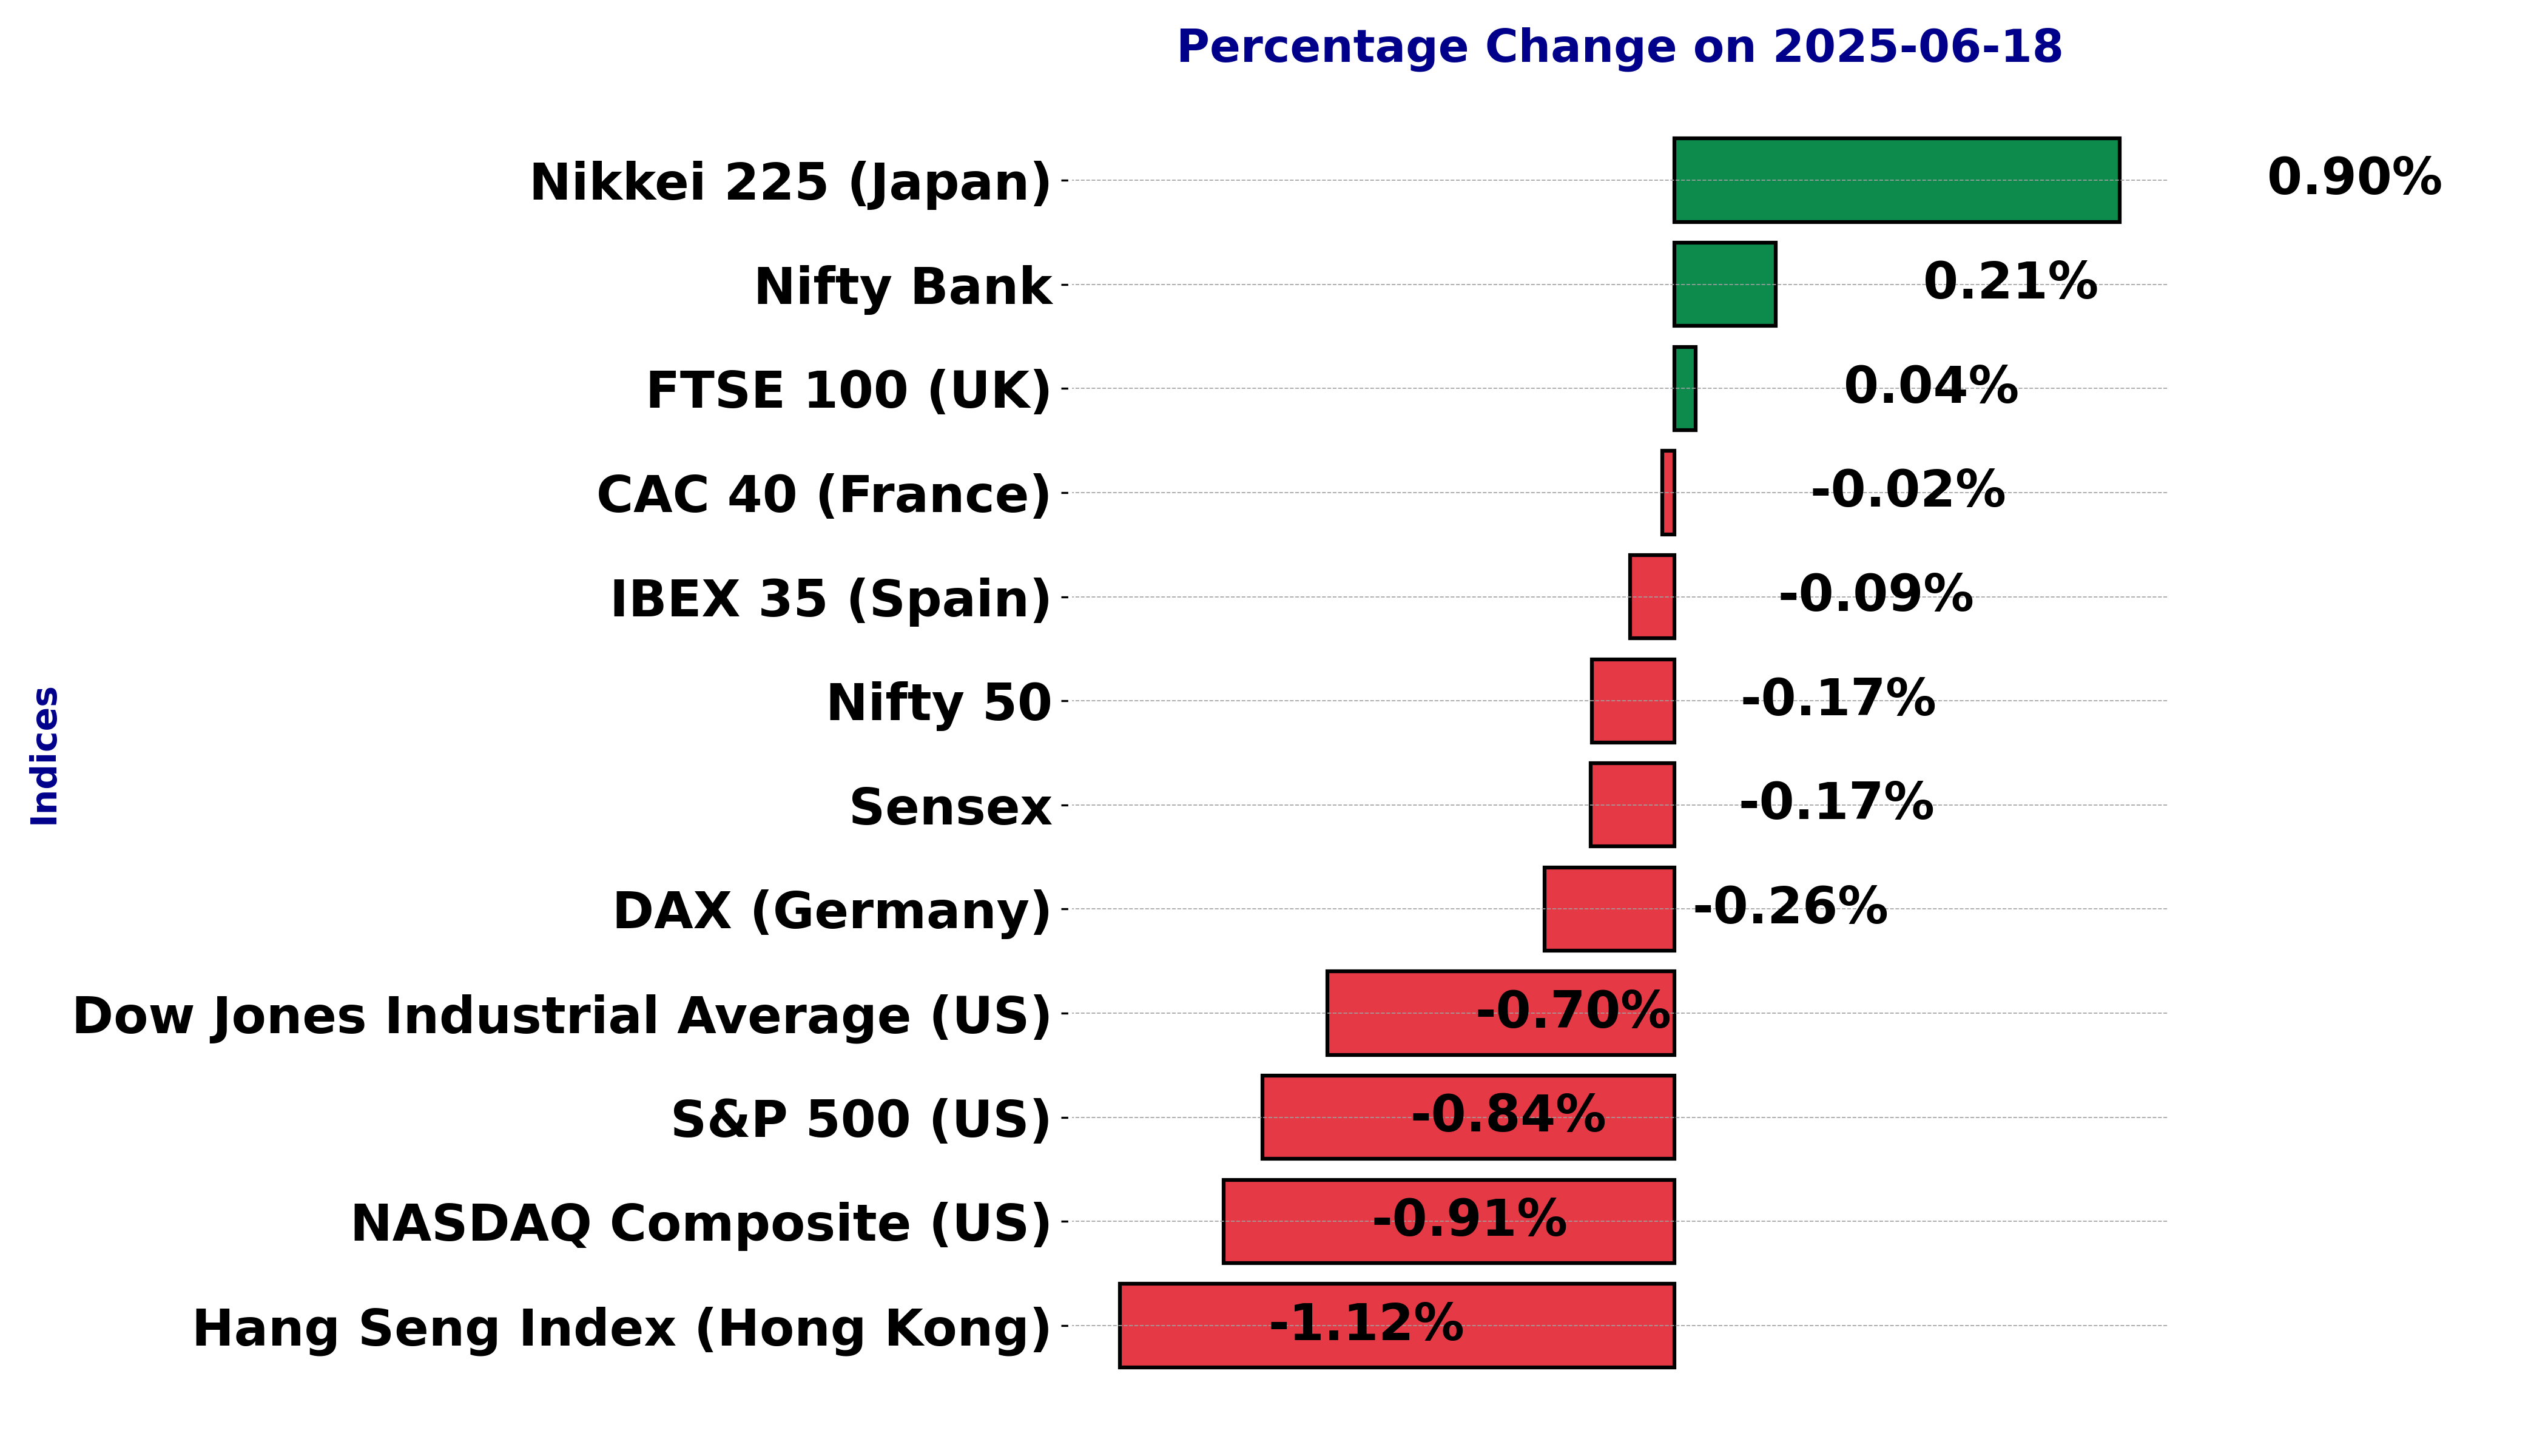
Global stock market indices: How the world markets performed today - 18 June 2025
The international stock market indices showed varied performances on June 18, 2025, reflecting the economic sentiment across different regions.
In this article, we analyze the performance of key global indices including the S&P 500, Dow Jones Industrial Average, NASDAQ Composite, FTSE 100, DAX, CAC 40, IBEX 35, Nikkei 225, Hang Seng, Nifty 50, and BSE Sensex.
Analysis for Sensex - June 18, 2025
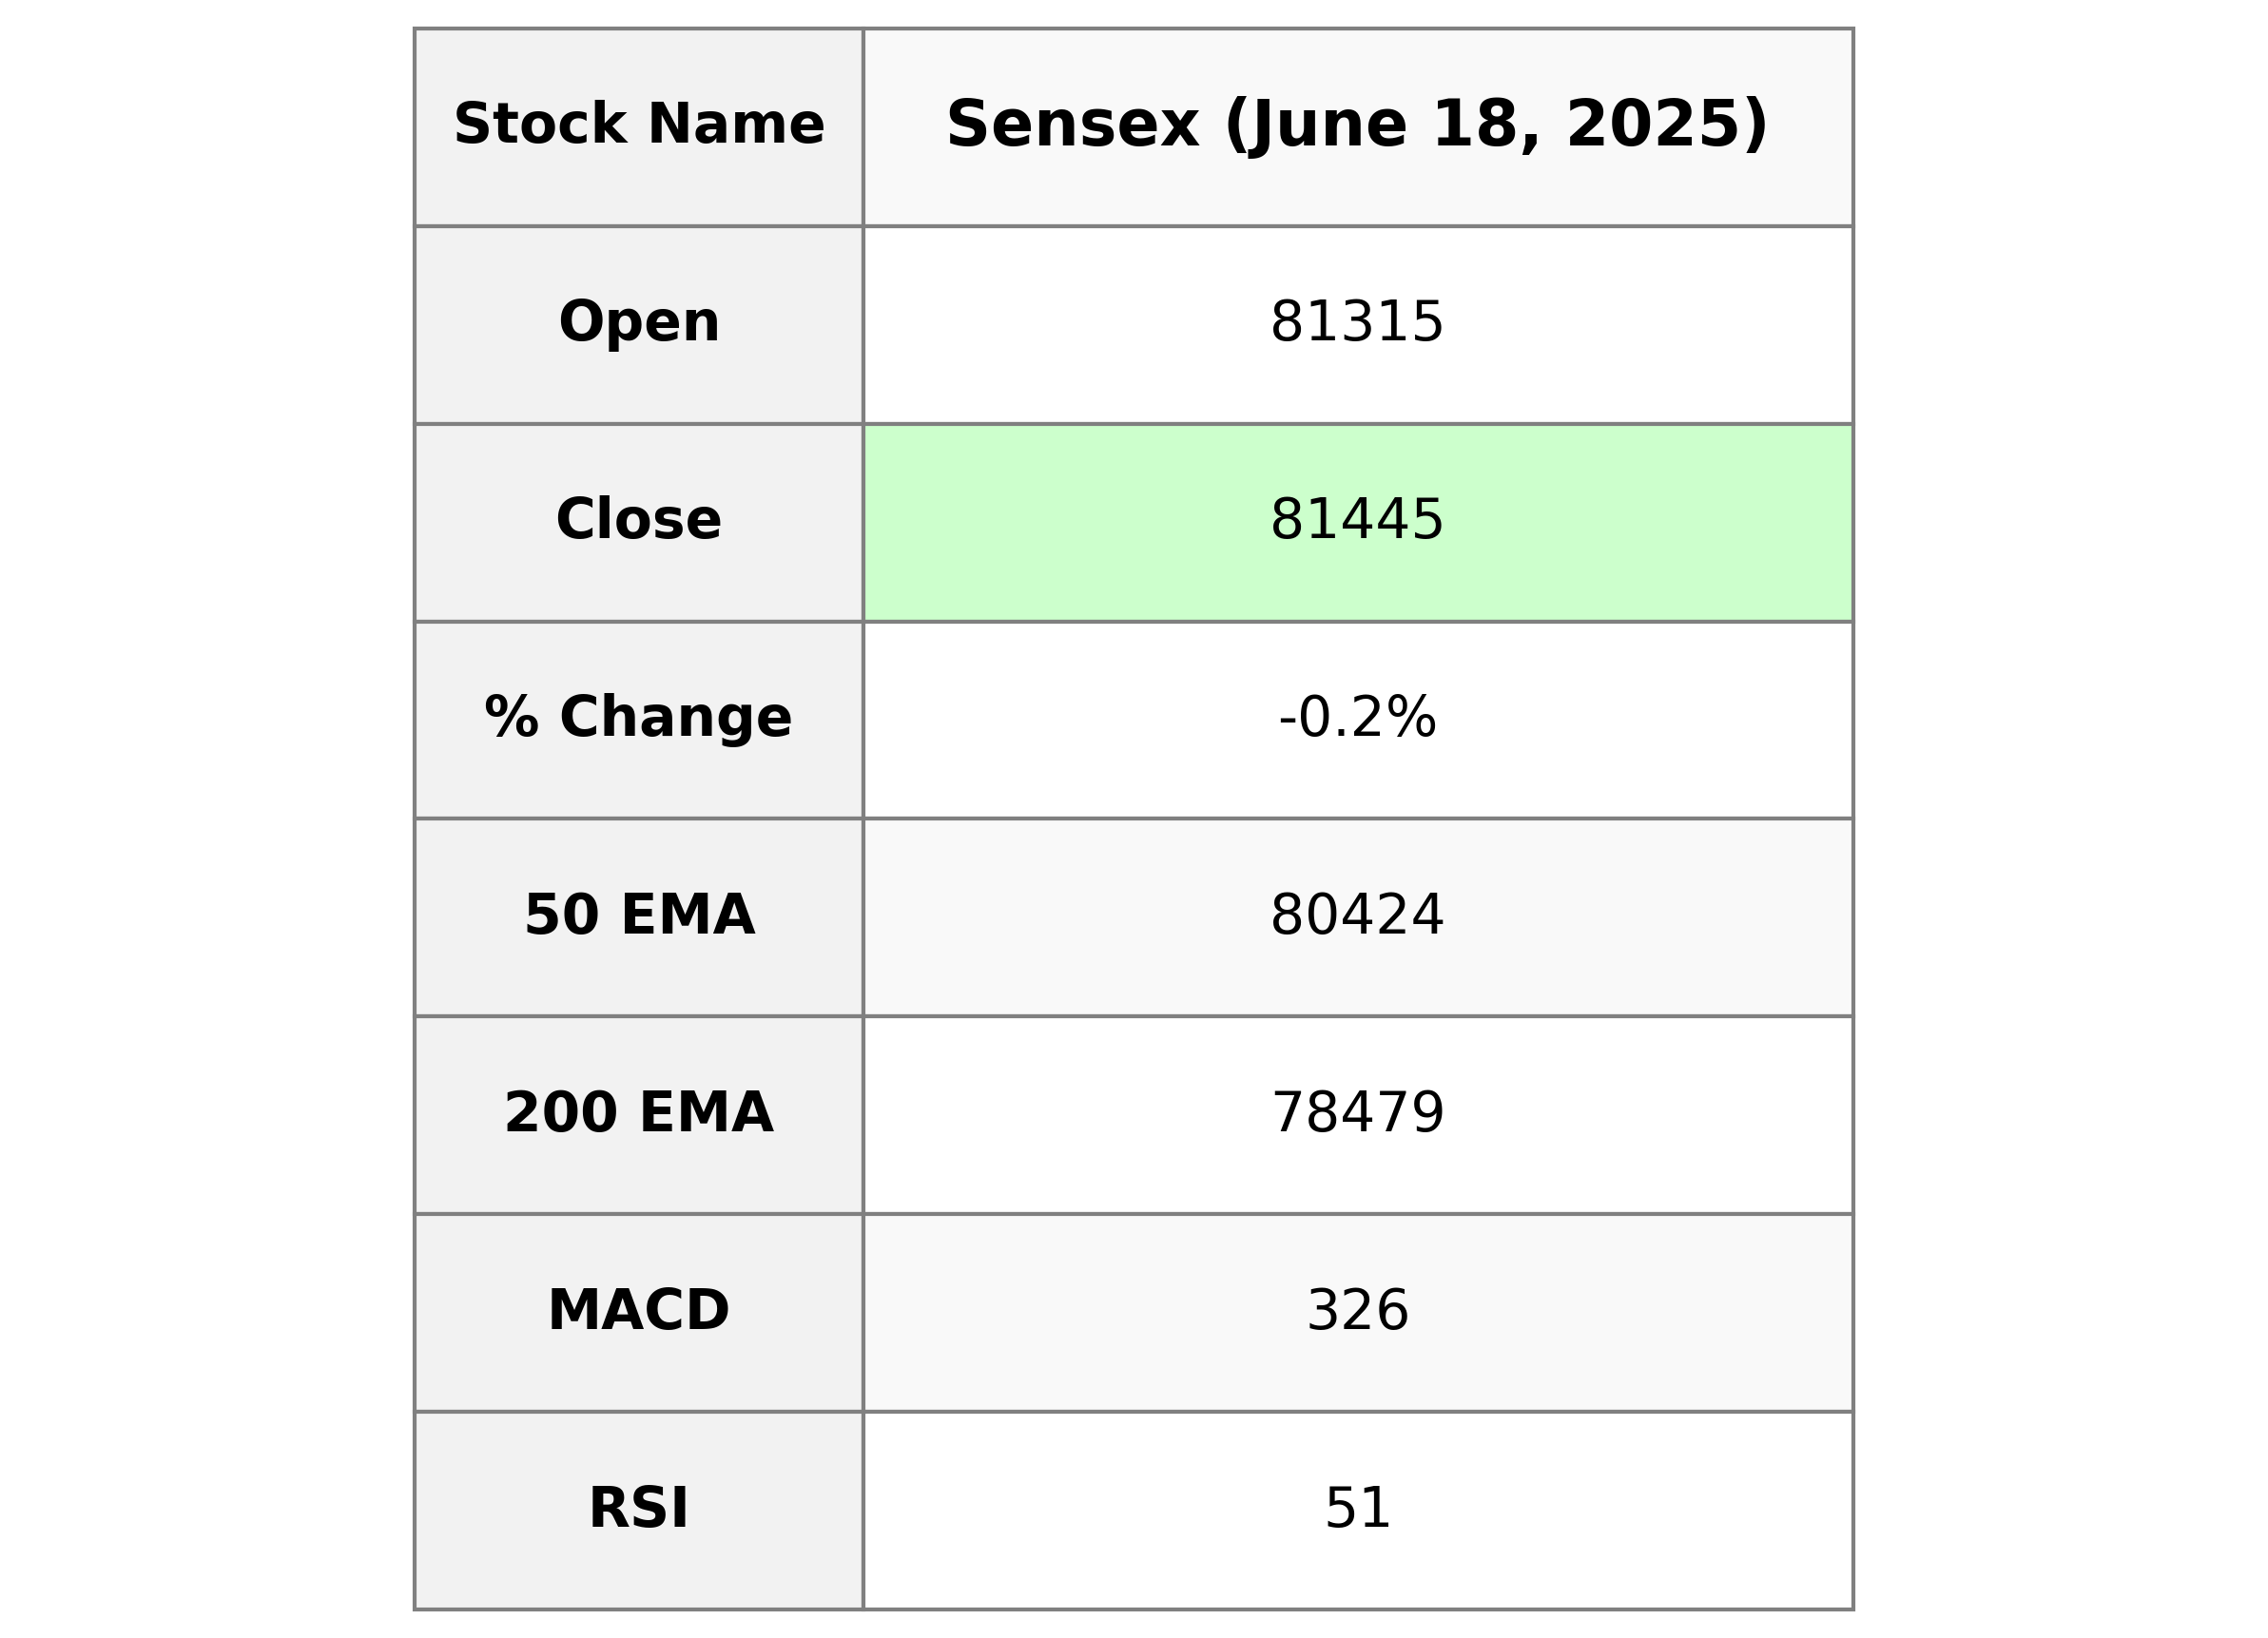
The Sensex opened at 81,314.62 and closed slightly lower at 81,444.66, indicating a minor decrease with a percentage change of -0.17% from the previous close of 81,583.30. The Relative Strength Index (RSI) is at 51.21, suggesting a neutral market condition. The MACD is below the signal line, which might indicate a potential bearish trend.
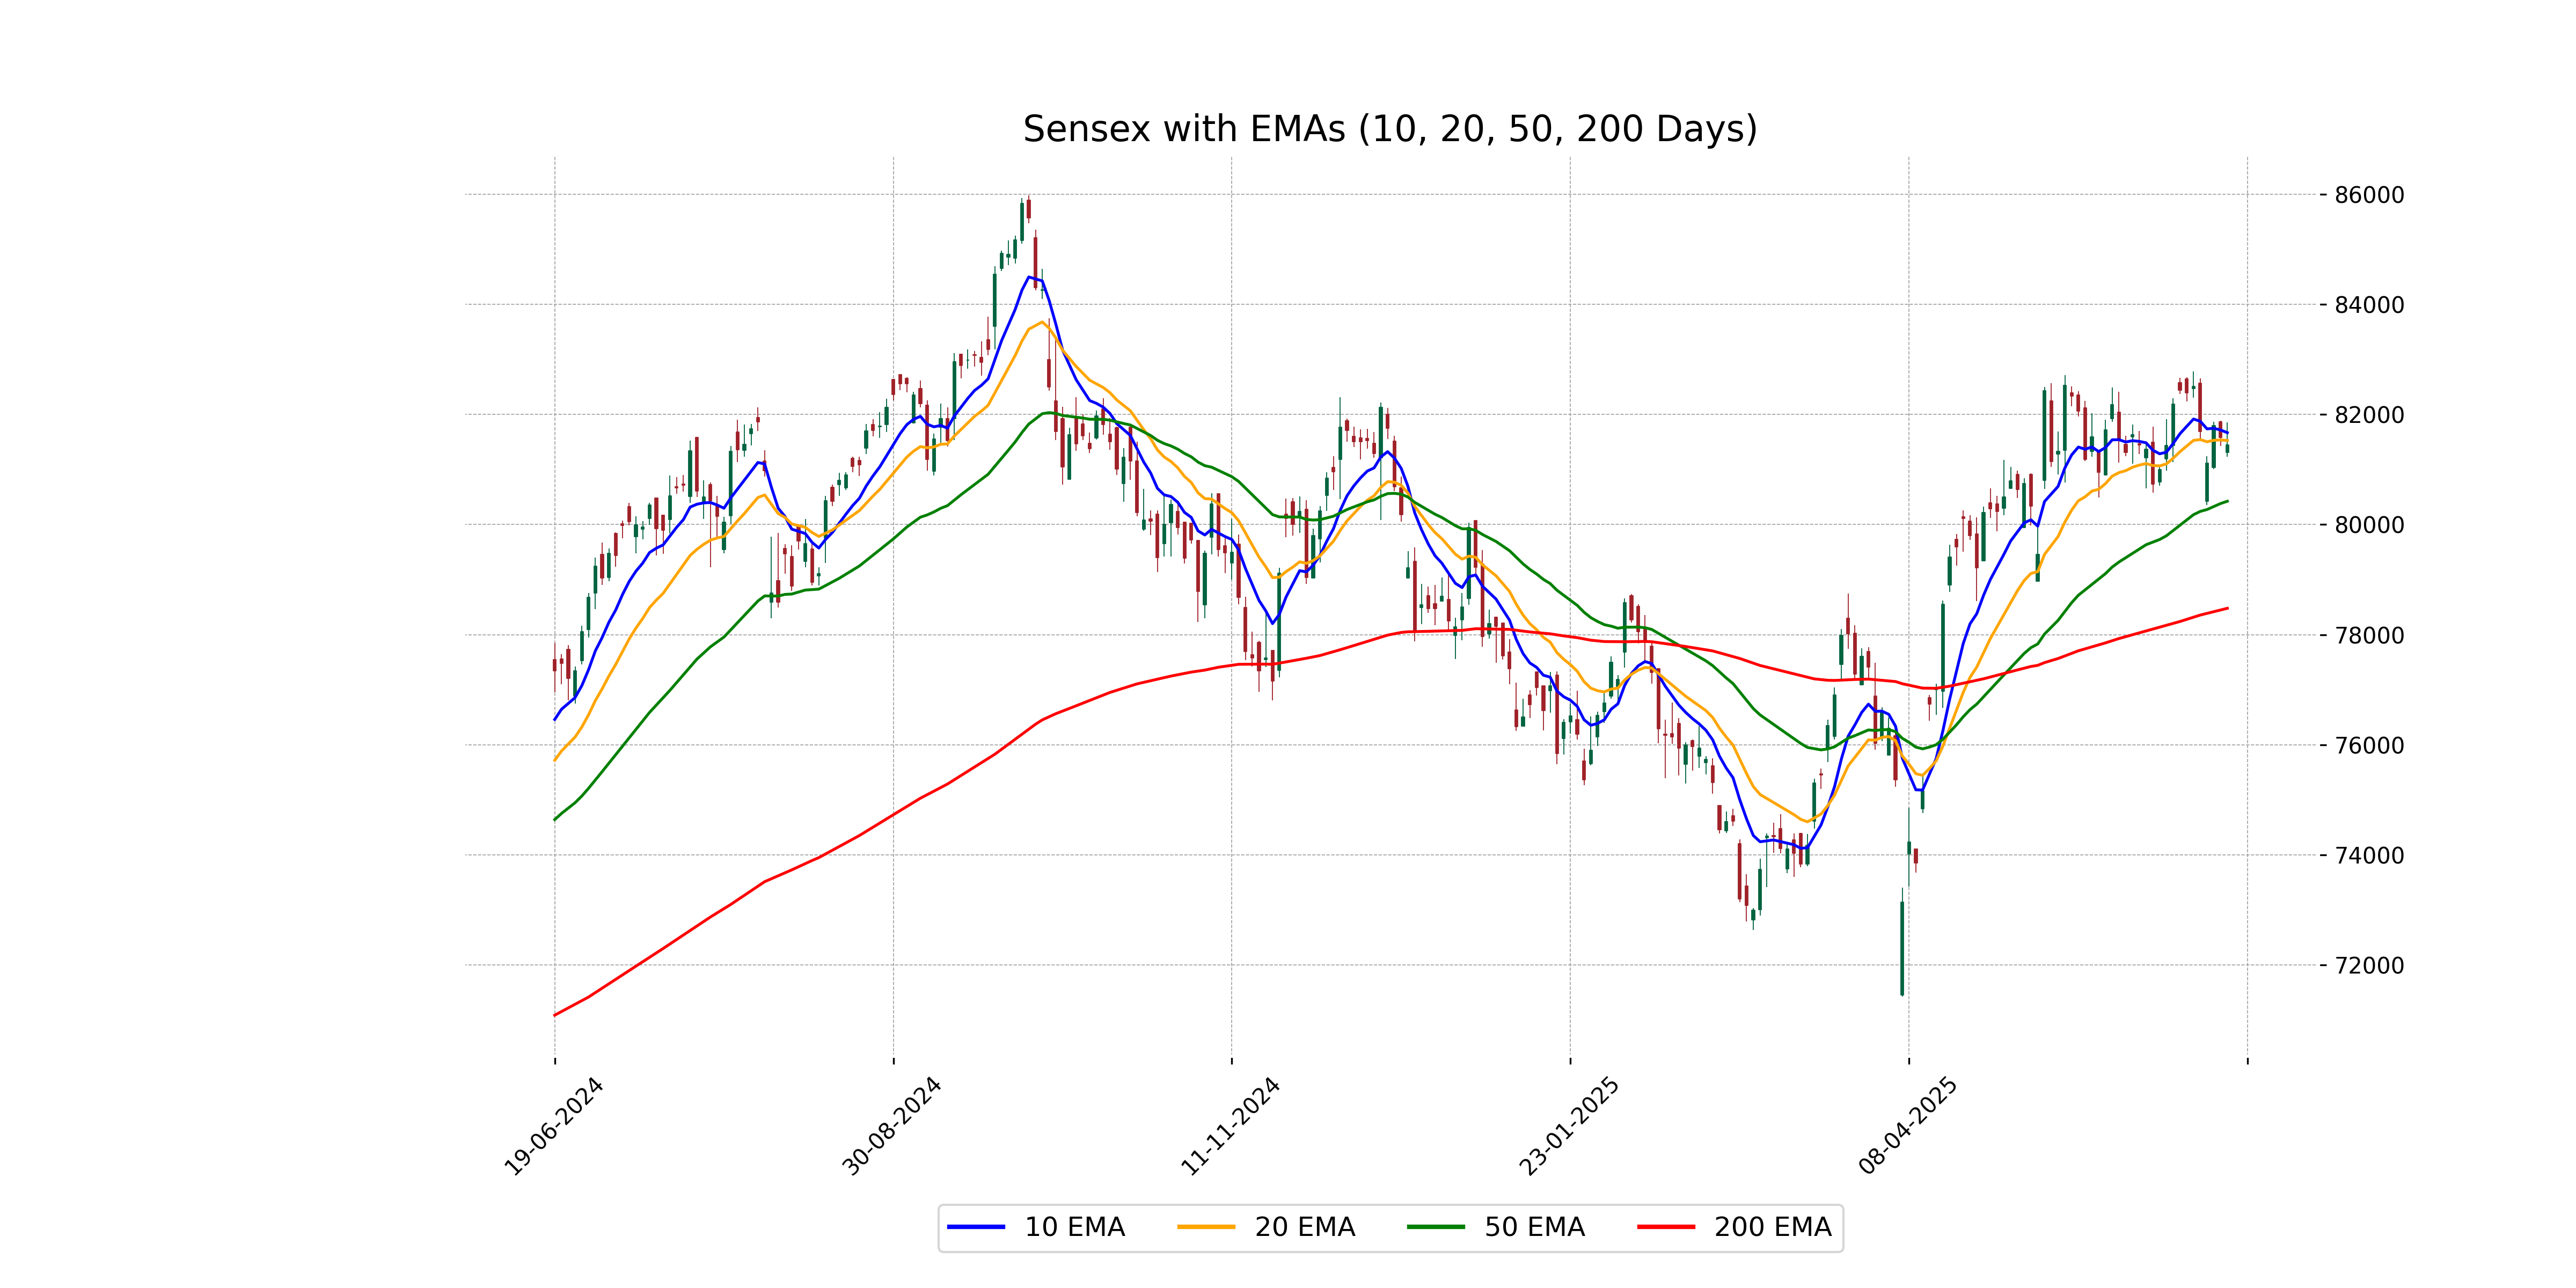
Relationship with Key Moving Averages
The Sensex closed at 81,444.66, slightly below its 10-day EMA of 81,669.18 and its 20-day EMA of 81,527.92, indicating a potential short-term bearish momentum. However, it remains significantly above its 50-day EMA of 80,423.77 and 200-day EMA of 78,478.64, suggesting a long-term uptrend.
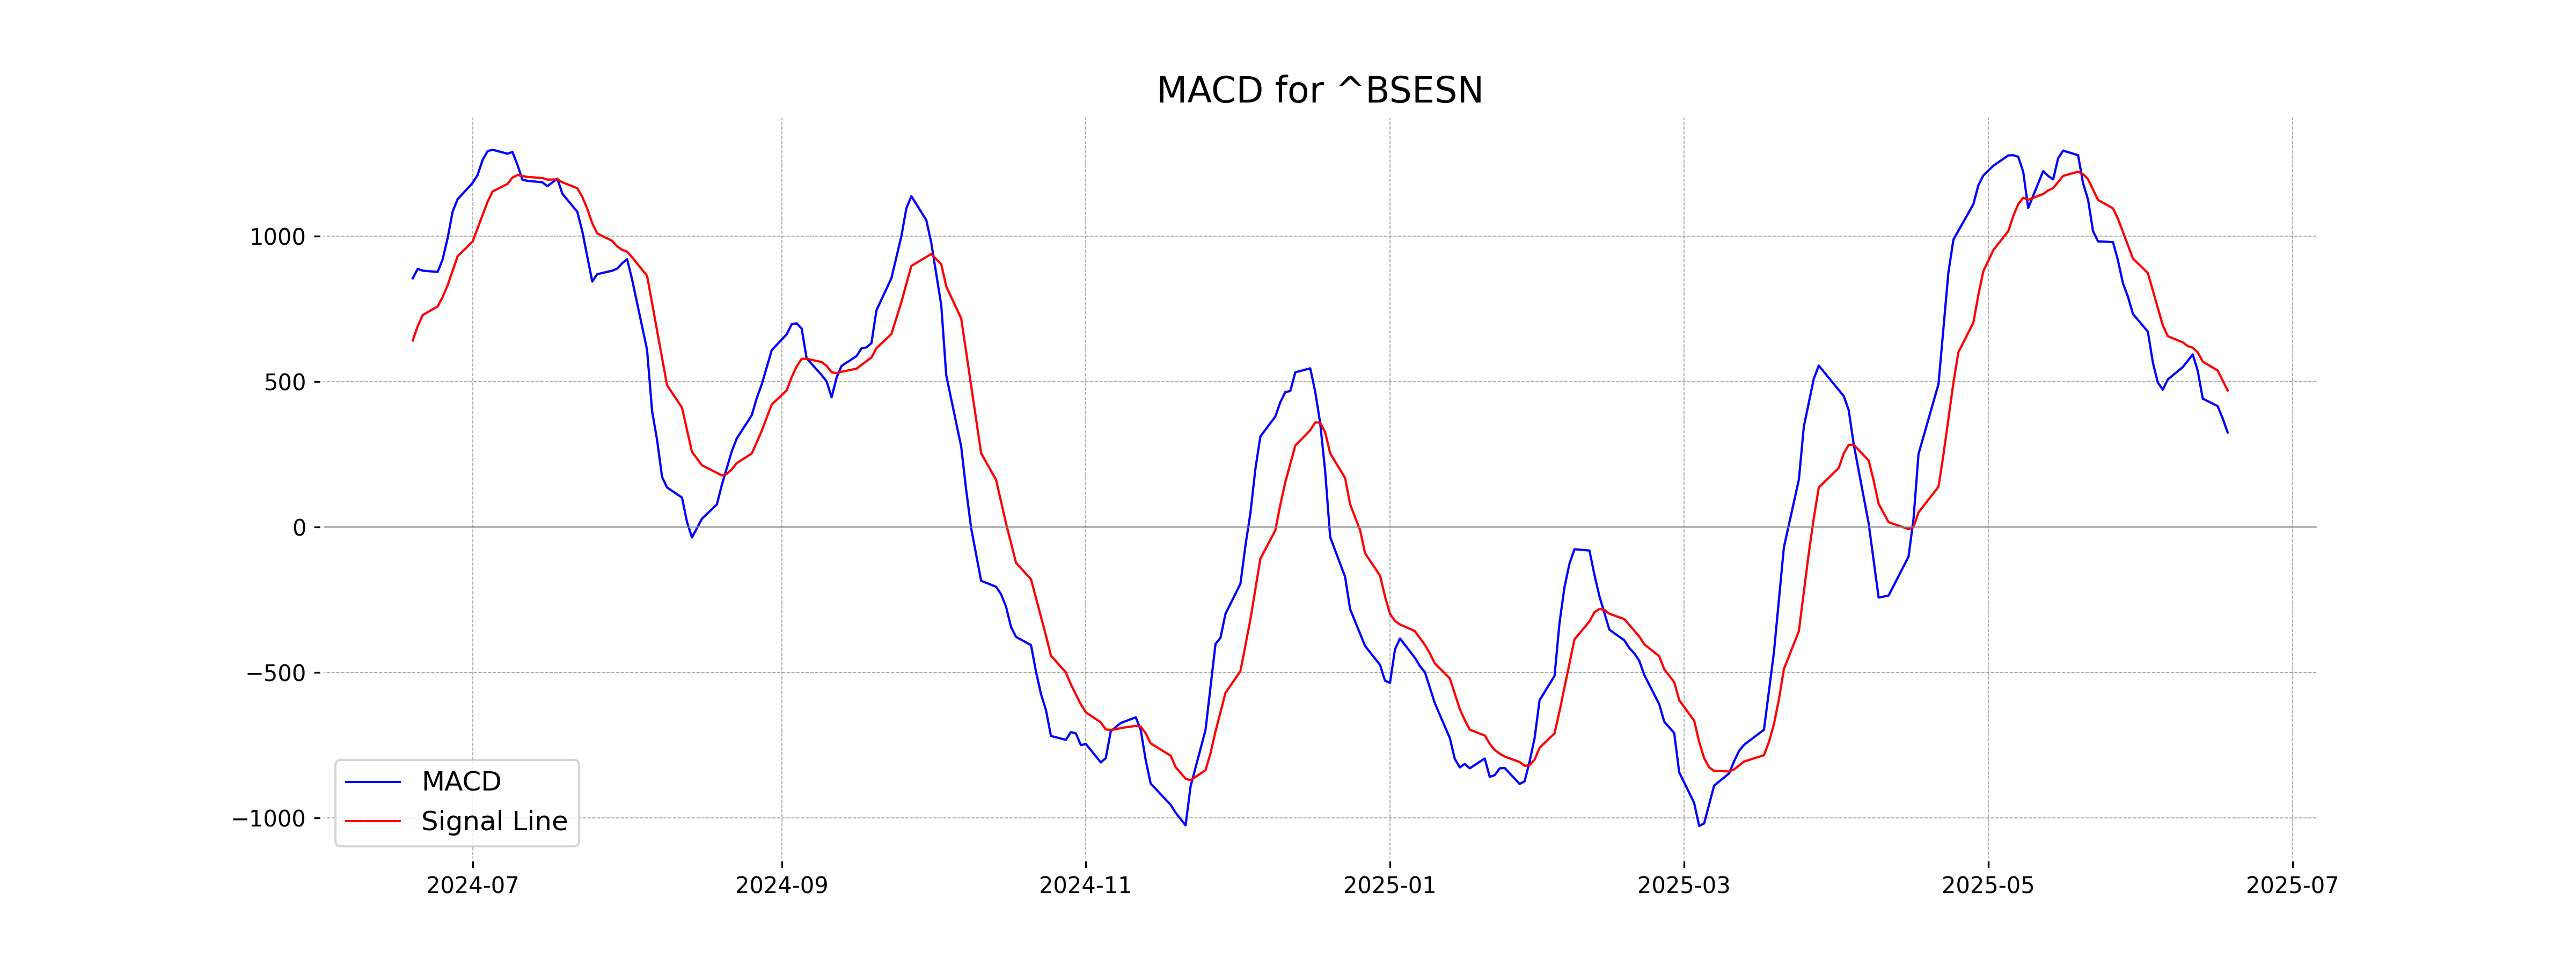
Moving Averages Trend (MACD)
Based on the stock data for Sensex, the MACD value is 325.73 while the MACD Signal is 469.78. This indicates a bearish signal as the MACD line is below the signal line, suggesting potential downward momentum.
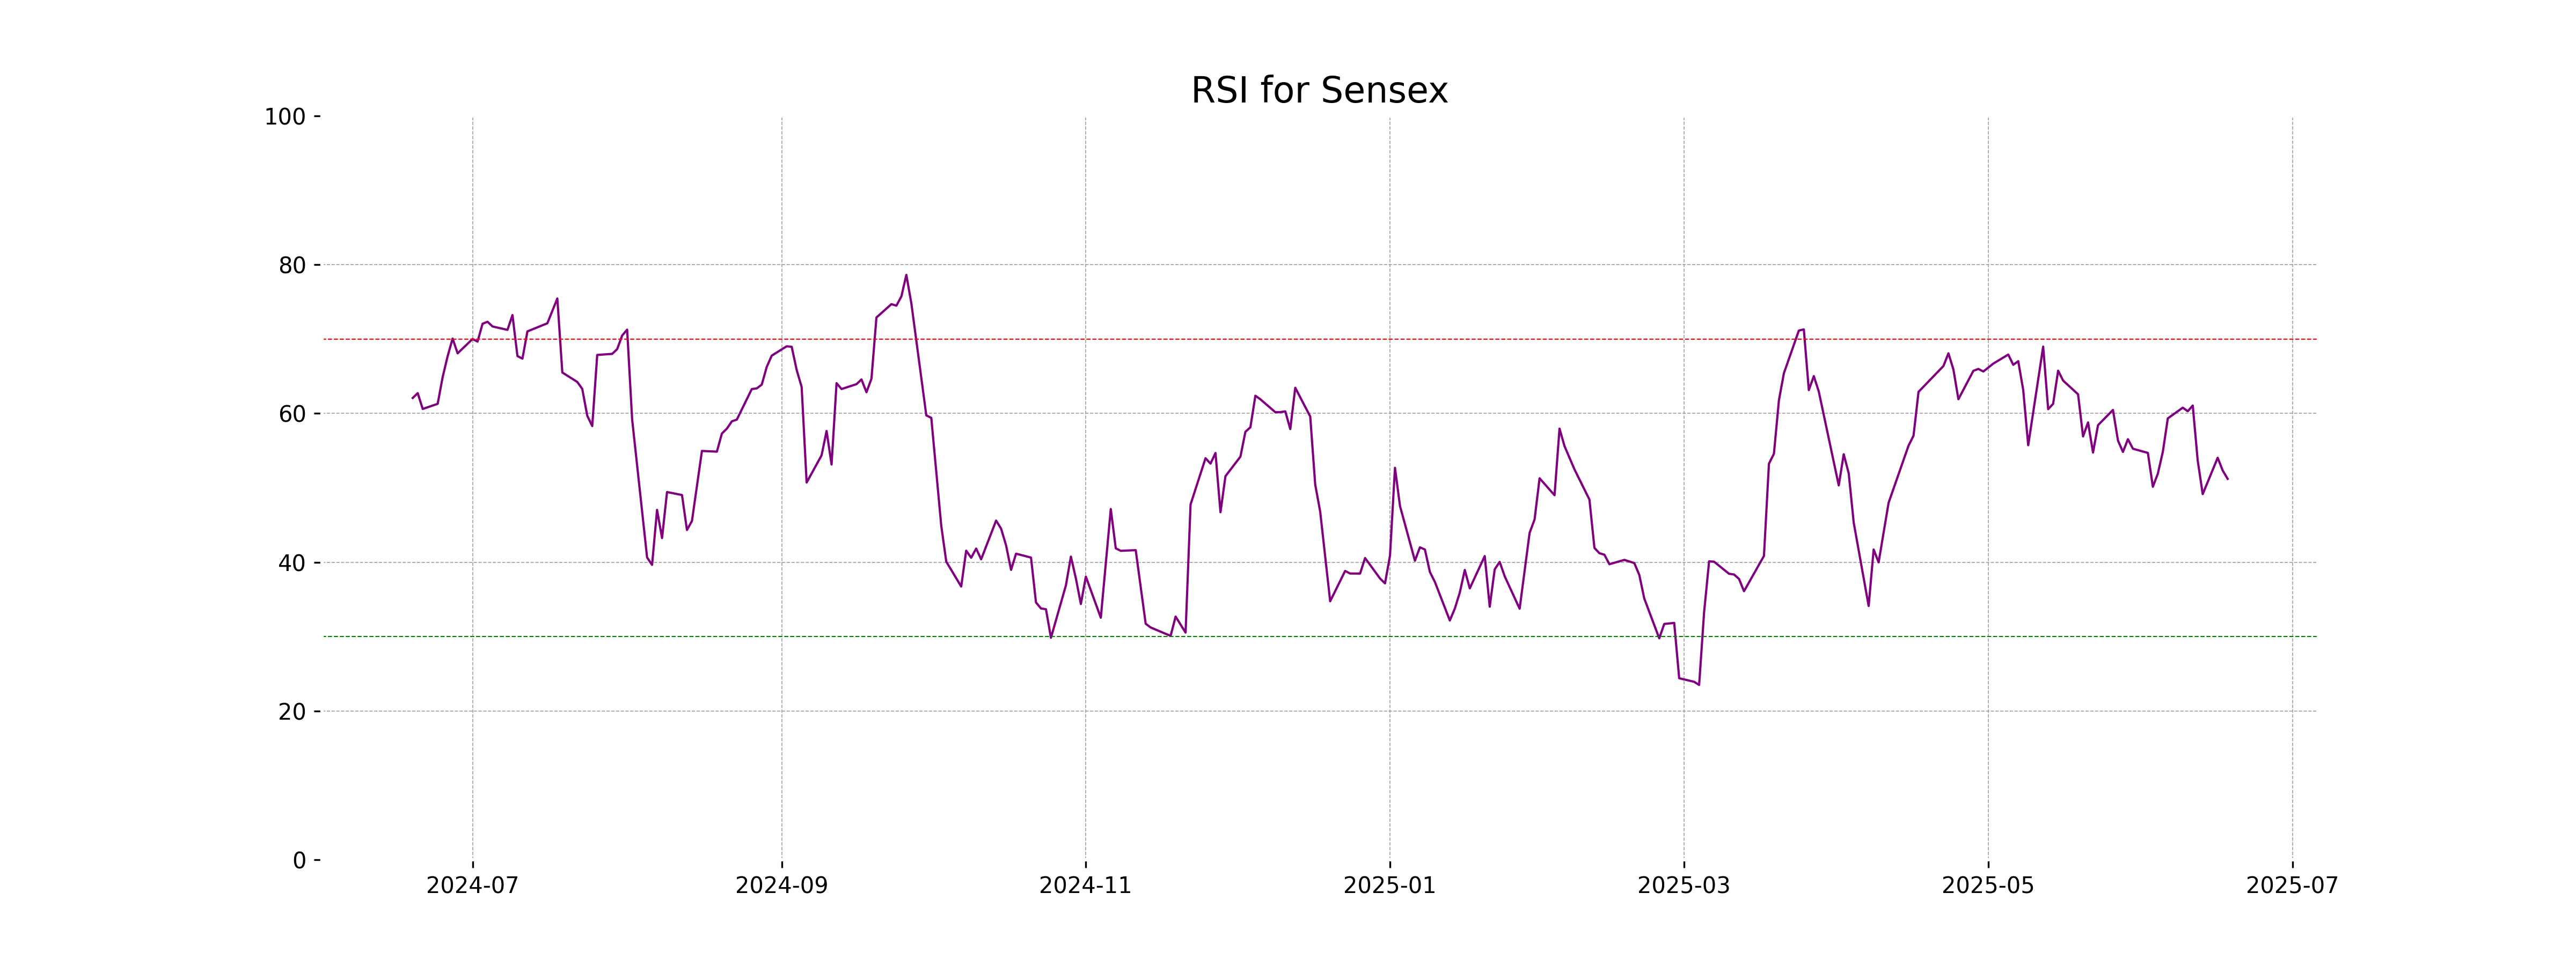
RSI Analysis
Sensex has an RSI of 51.21, which indicates a neutral trend as it hovers around the midpoint of the RSI scale. This suggests that the index is neither overbought nor oversold, implying a balanced momentum in the market.
Analysis for Dow Jones Industrial Average (US) - June 18, 2025
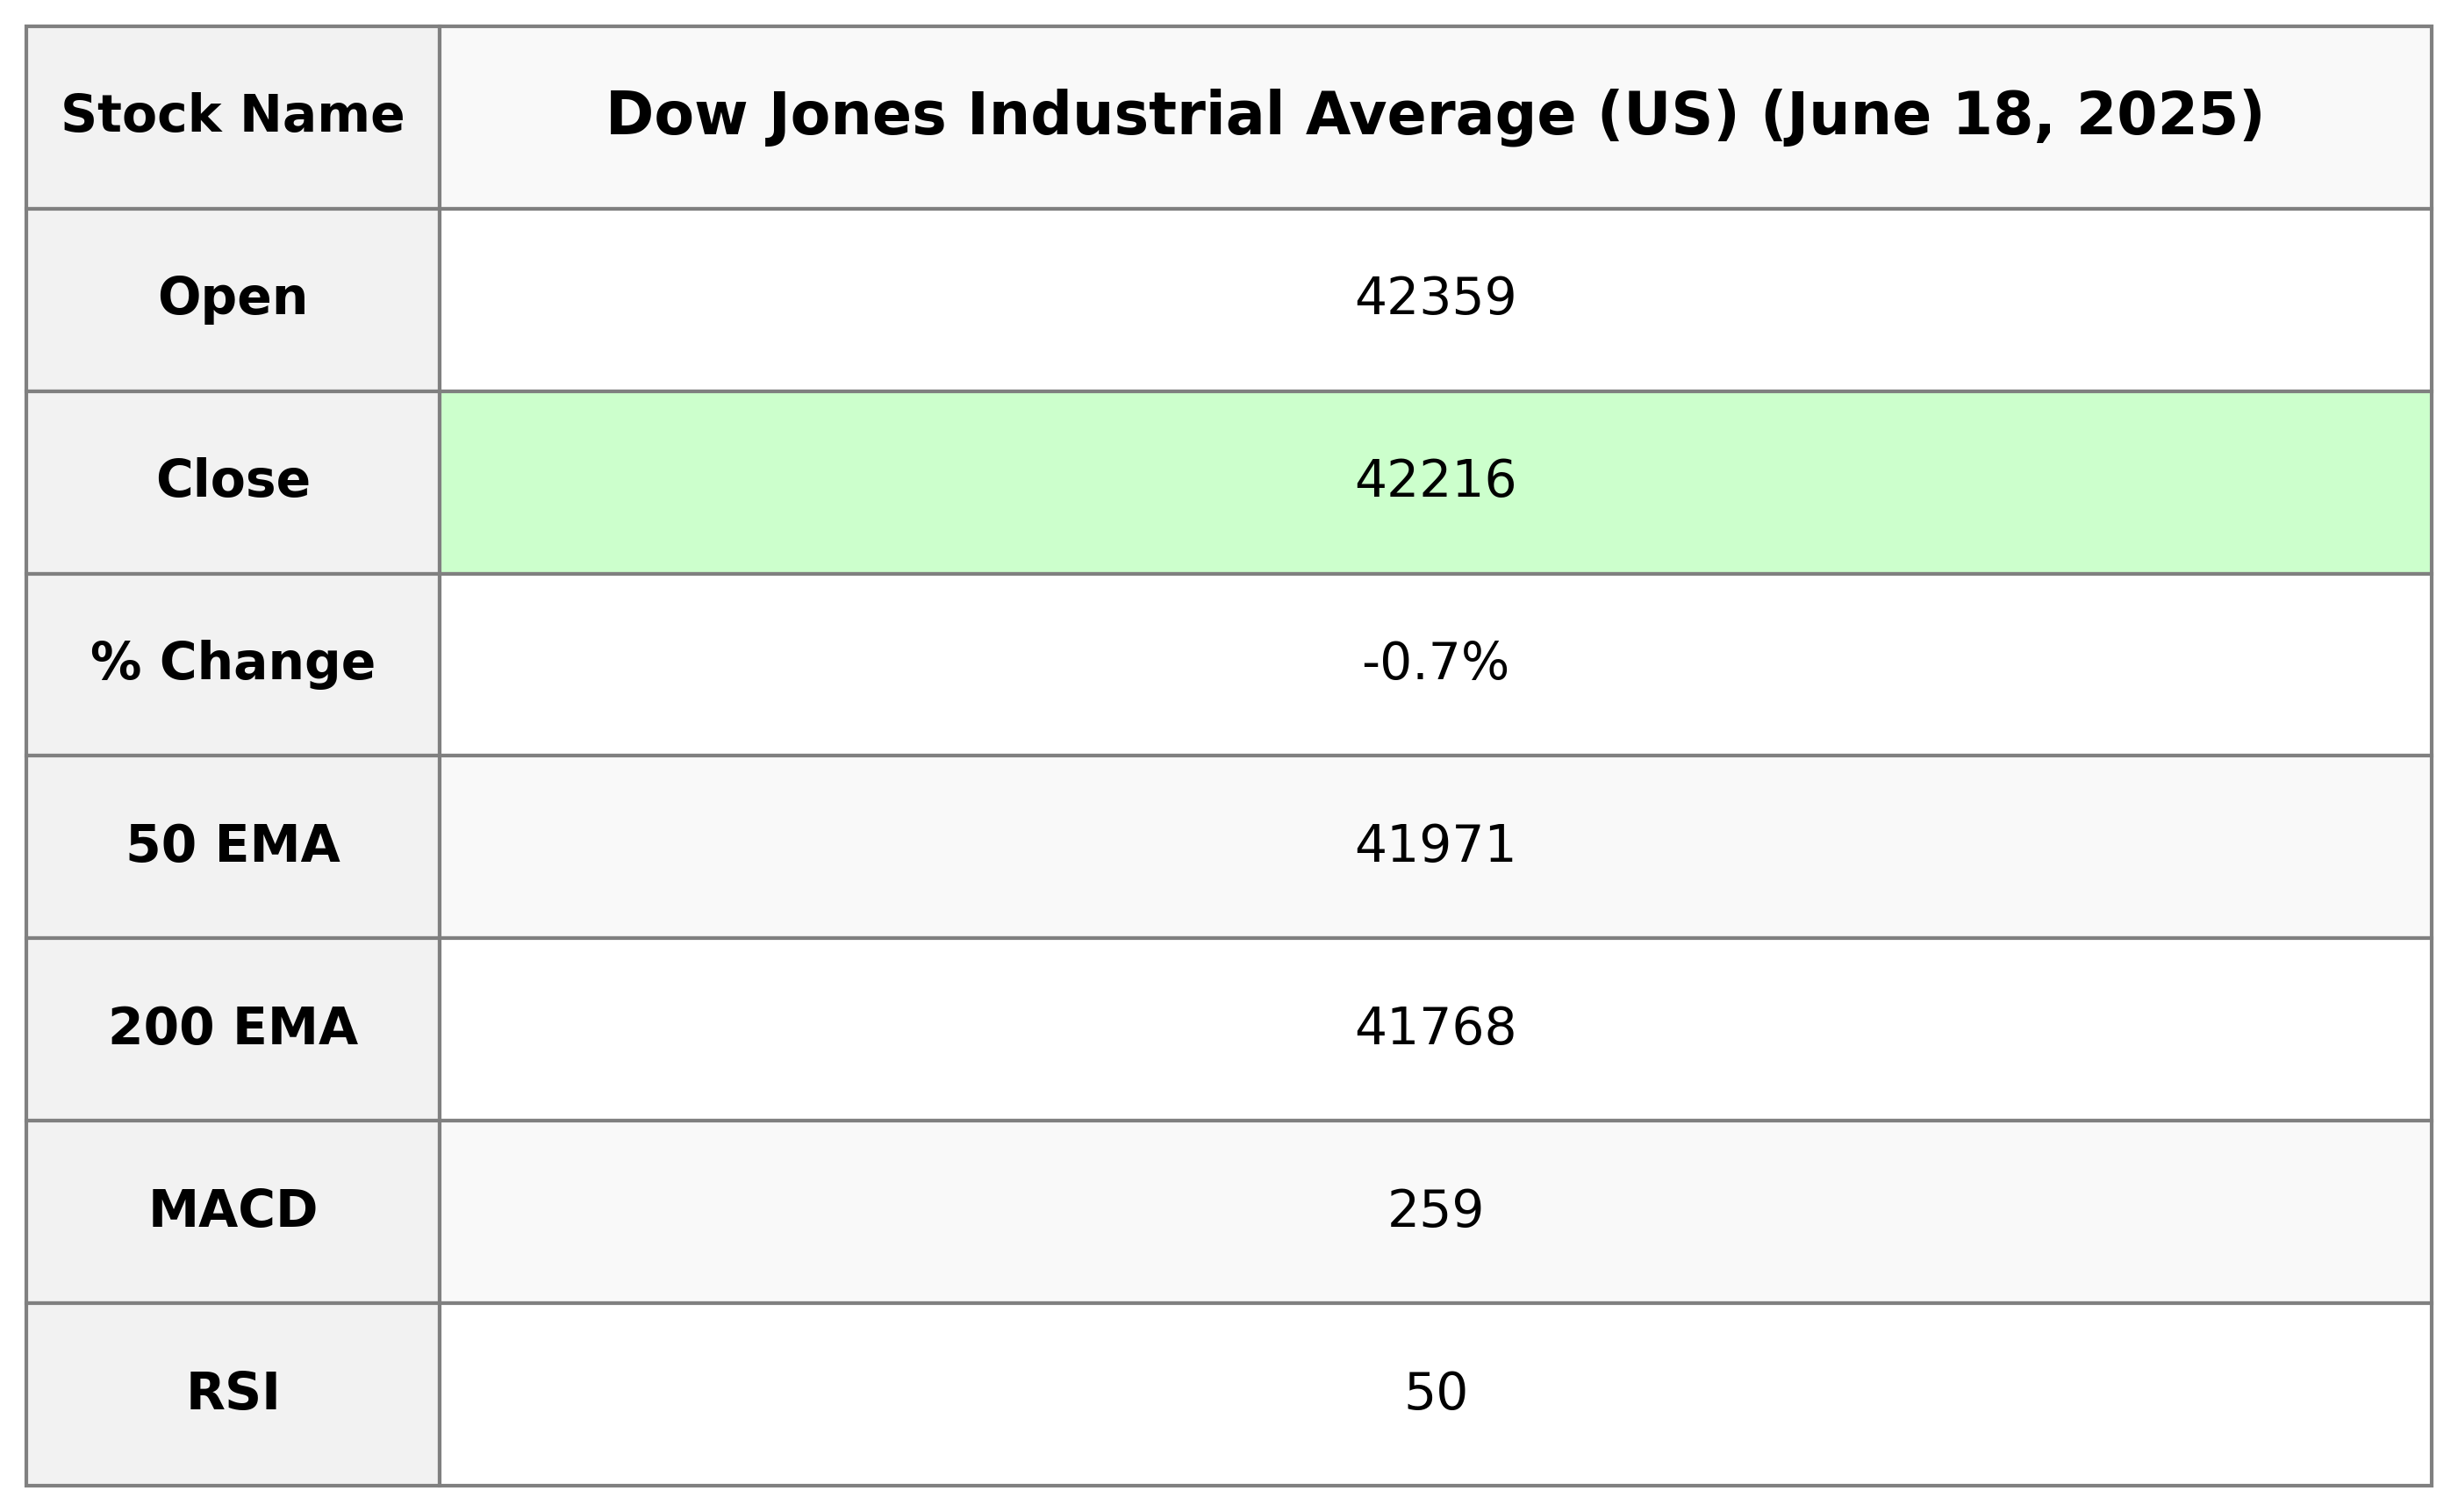
Dow Jones Industrial Average (US) opened at 42,358.62, reaching a high of 42,530.83 and a low of 42,132.65, with a closing at 42,215.80. The index experienced a decrease of 0.70% from the previous close, resulting in a loss of 299.29 points. Key indicators show the 50-day EMA at 41,970.78 and the 200-day EMA at 41,767.77, while the RSI stands at 50.24, indicating a neutral momentum.
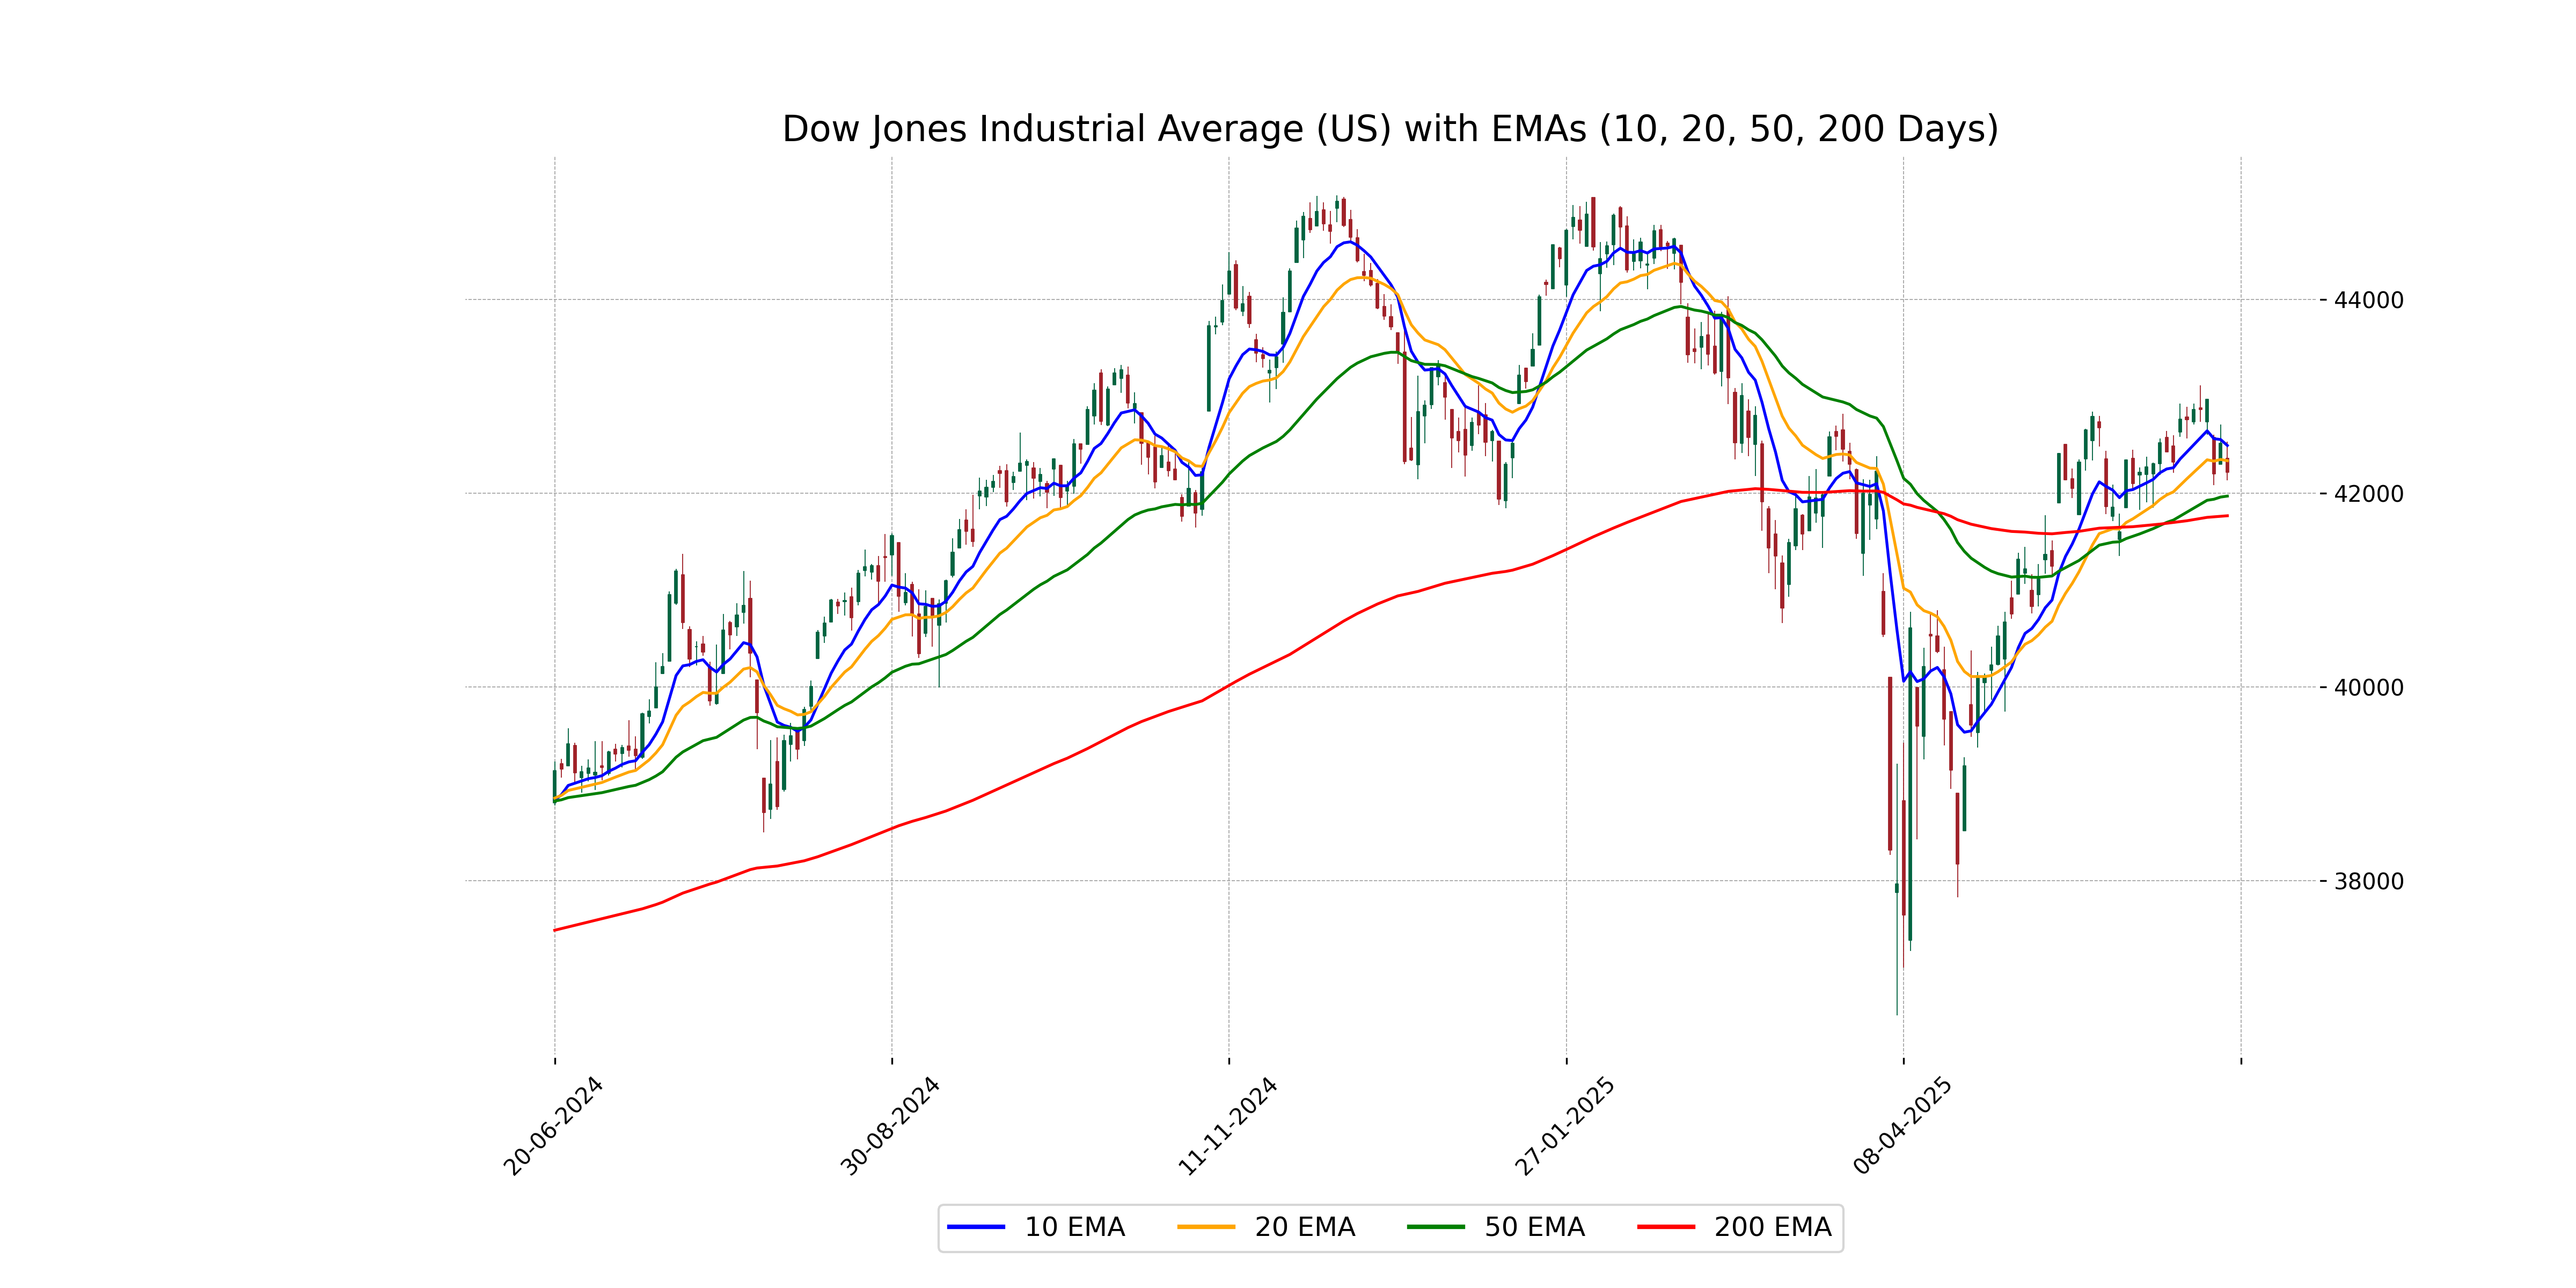
Relationship with Key Moving Averages
The Dow Jones Industrial Average is trading above both its 50-day EMA of 41970.78 and its 200-day EMA of 41767.77, indicating potential strength in its medium to long-term trend. However, the current price of 42215.80 is slightly below the 10-day EMA of 42493.11 and the 20-day EMA of 42336.29, suggesting some short-term weakness.
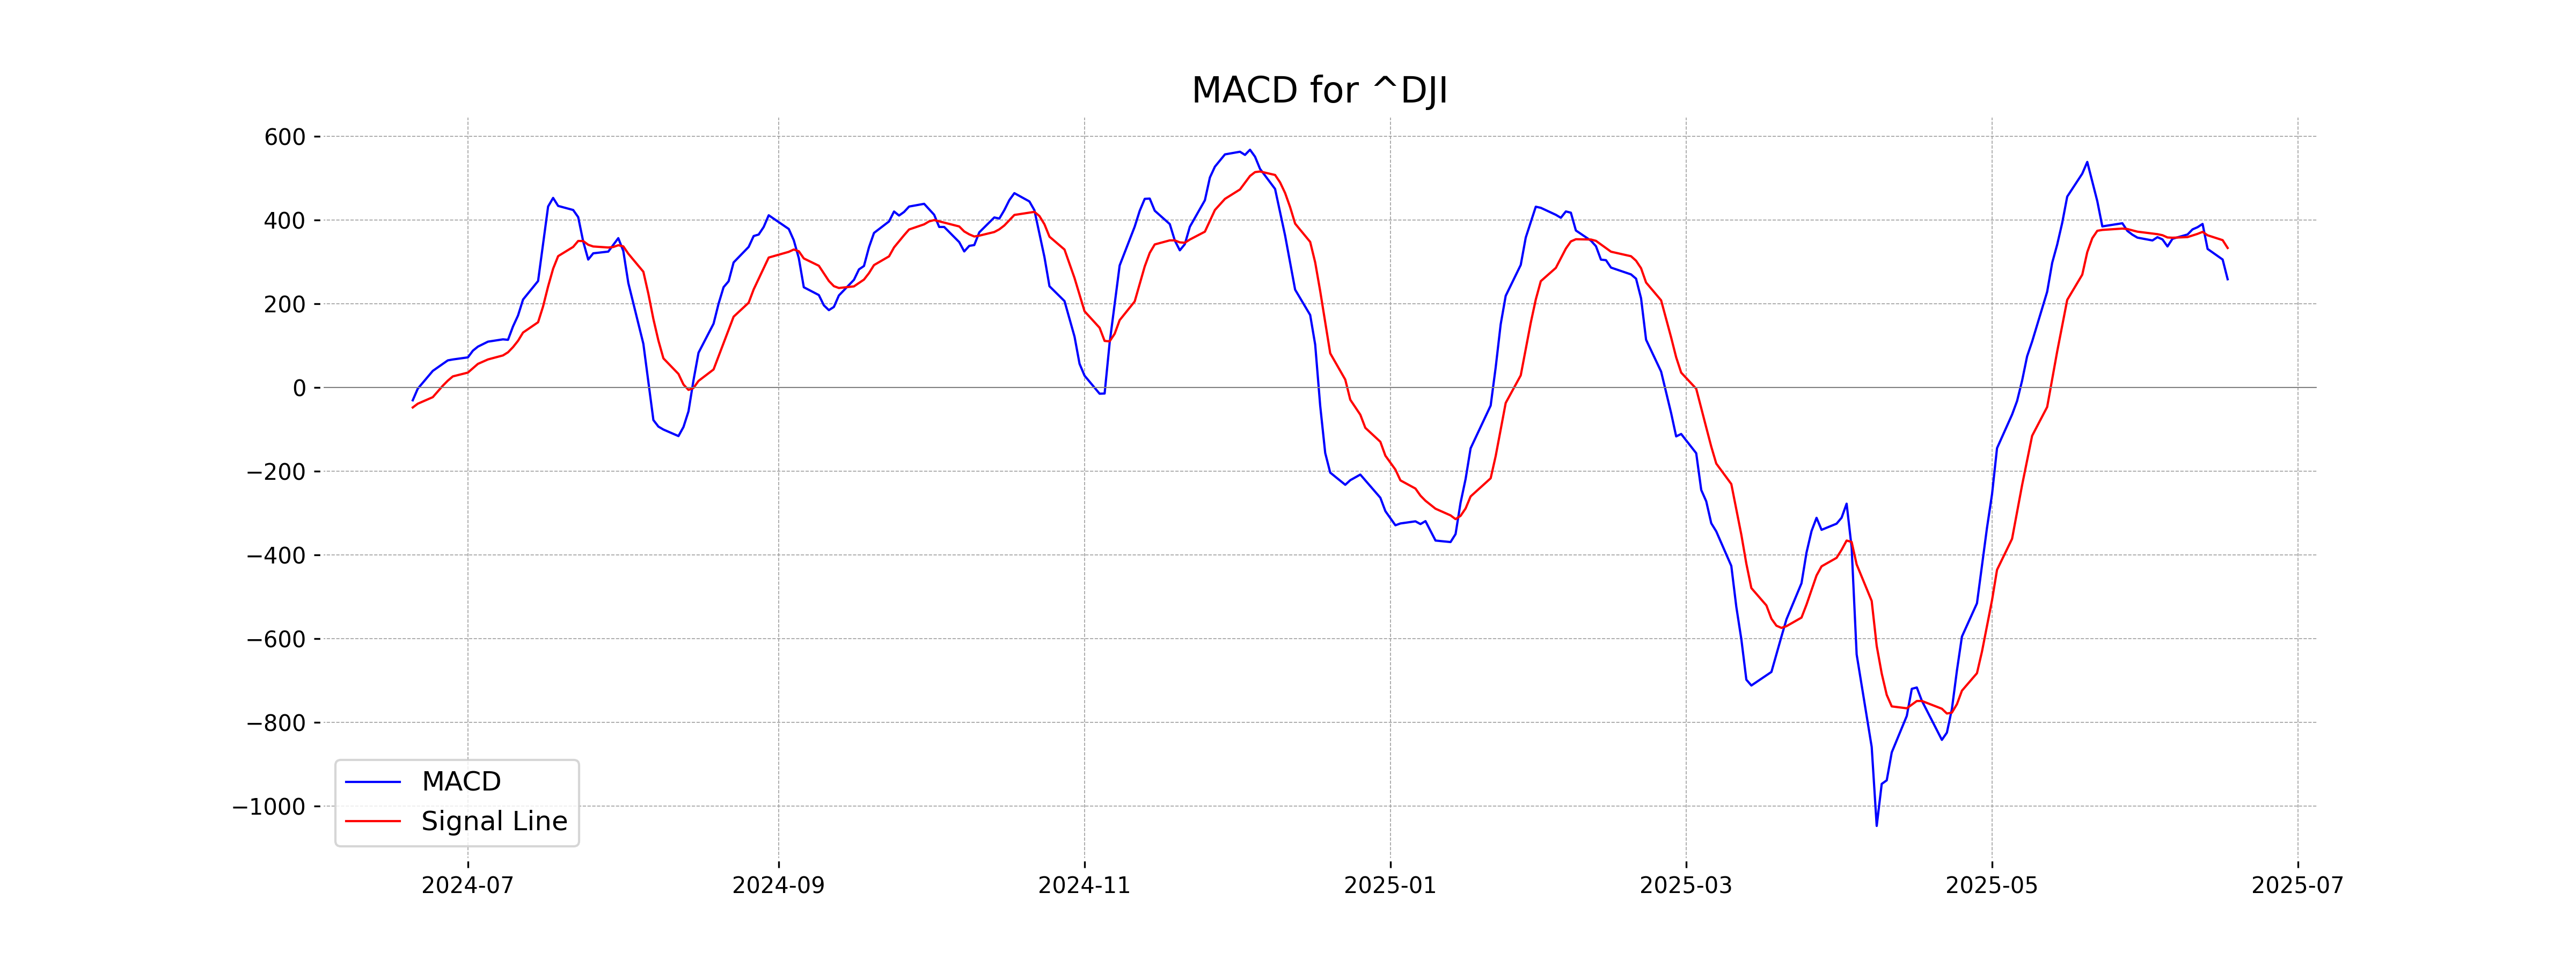
Moving Averages Trend (MACD)
The MACD value of 258.78 is below the MACD Signal of 333.54 for the Dow Jones Industrial Average, indicating a potential bearish trend as the MACD line is crossing below the signal line. This crossover suggests possible negative momentum in the short term.
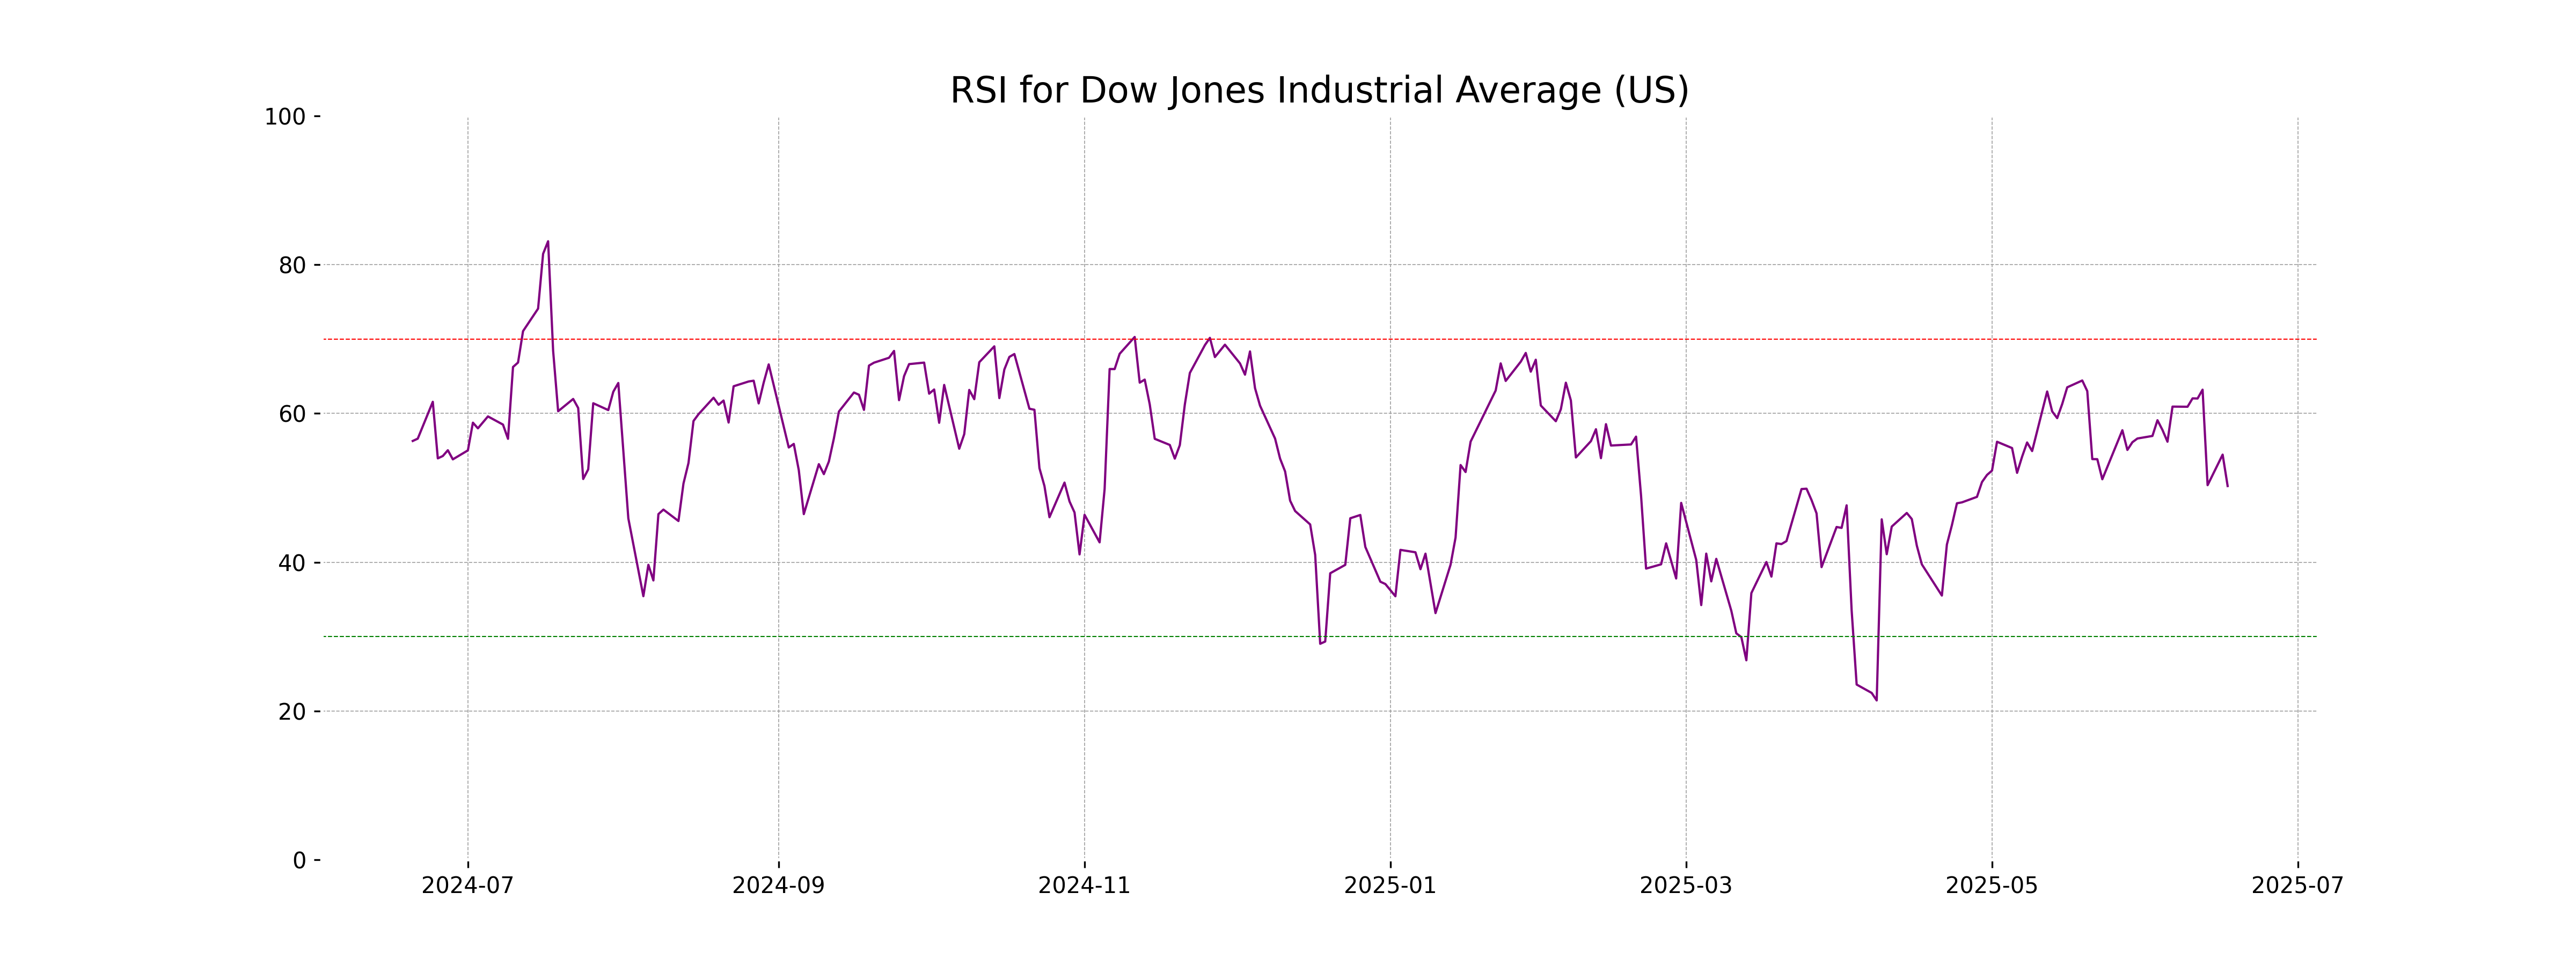
RSI Analysis
The RSI value for Dow Jones Industrial Average is 50.24, suggesting a neutral market sentiment with no strong buying or selling pressure. Typically, RSI values below 30 are considered oversold, and above 70 are overbought, so the current level indicates a balanced scenario.
Analysis for CAC 40 (France) - June 18, 2025
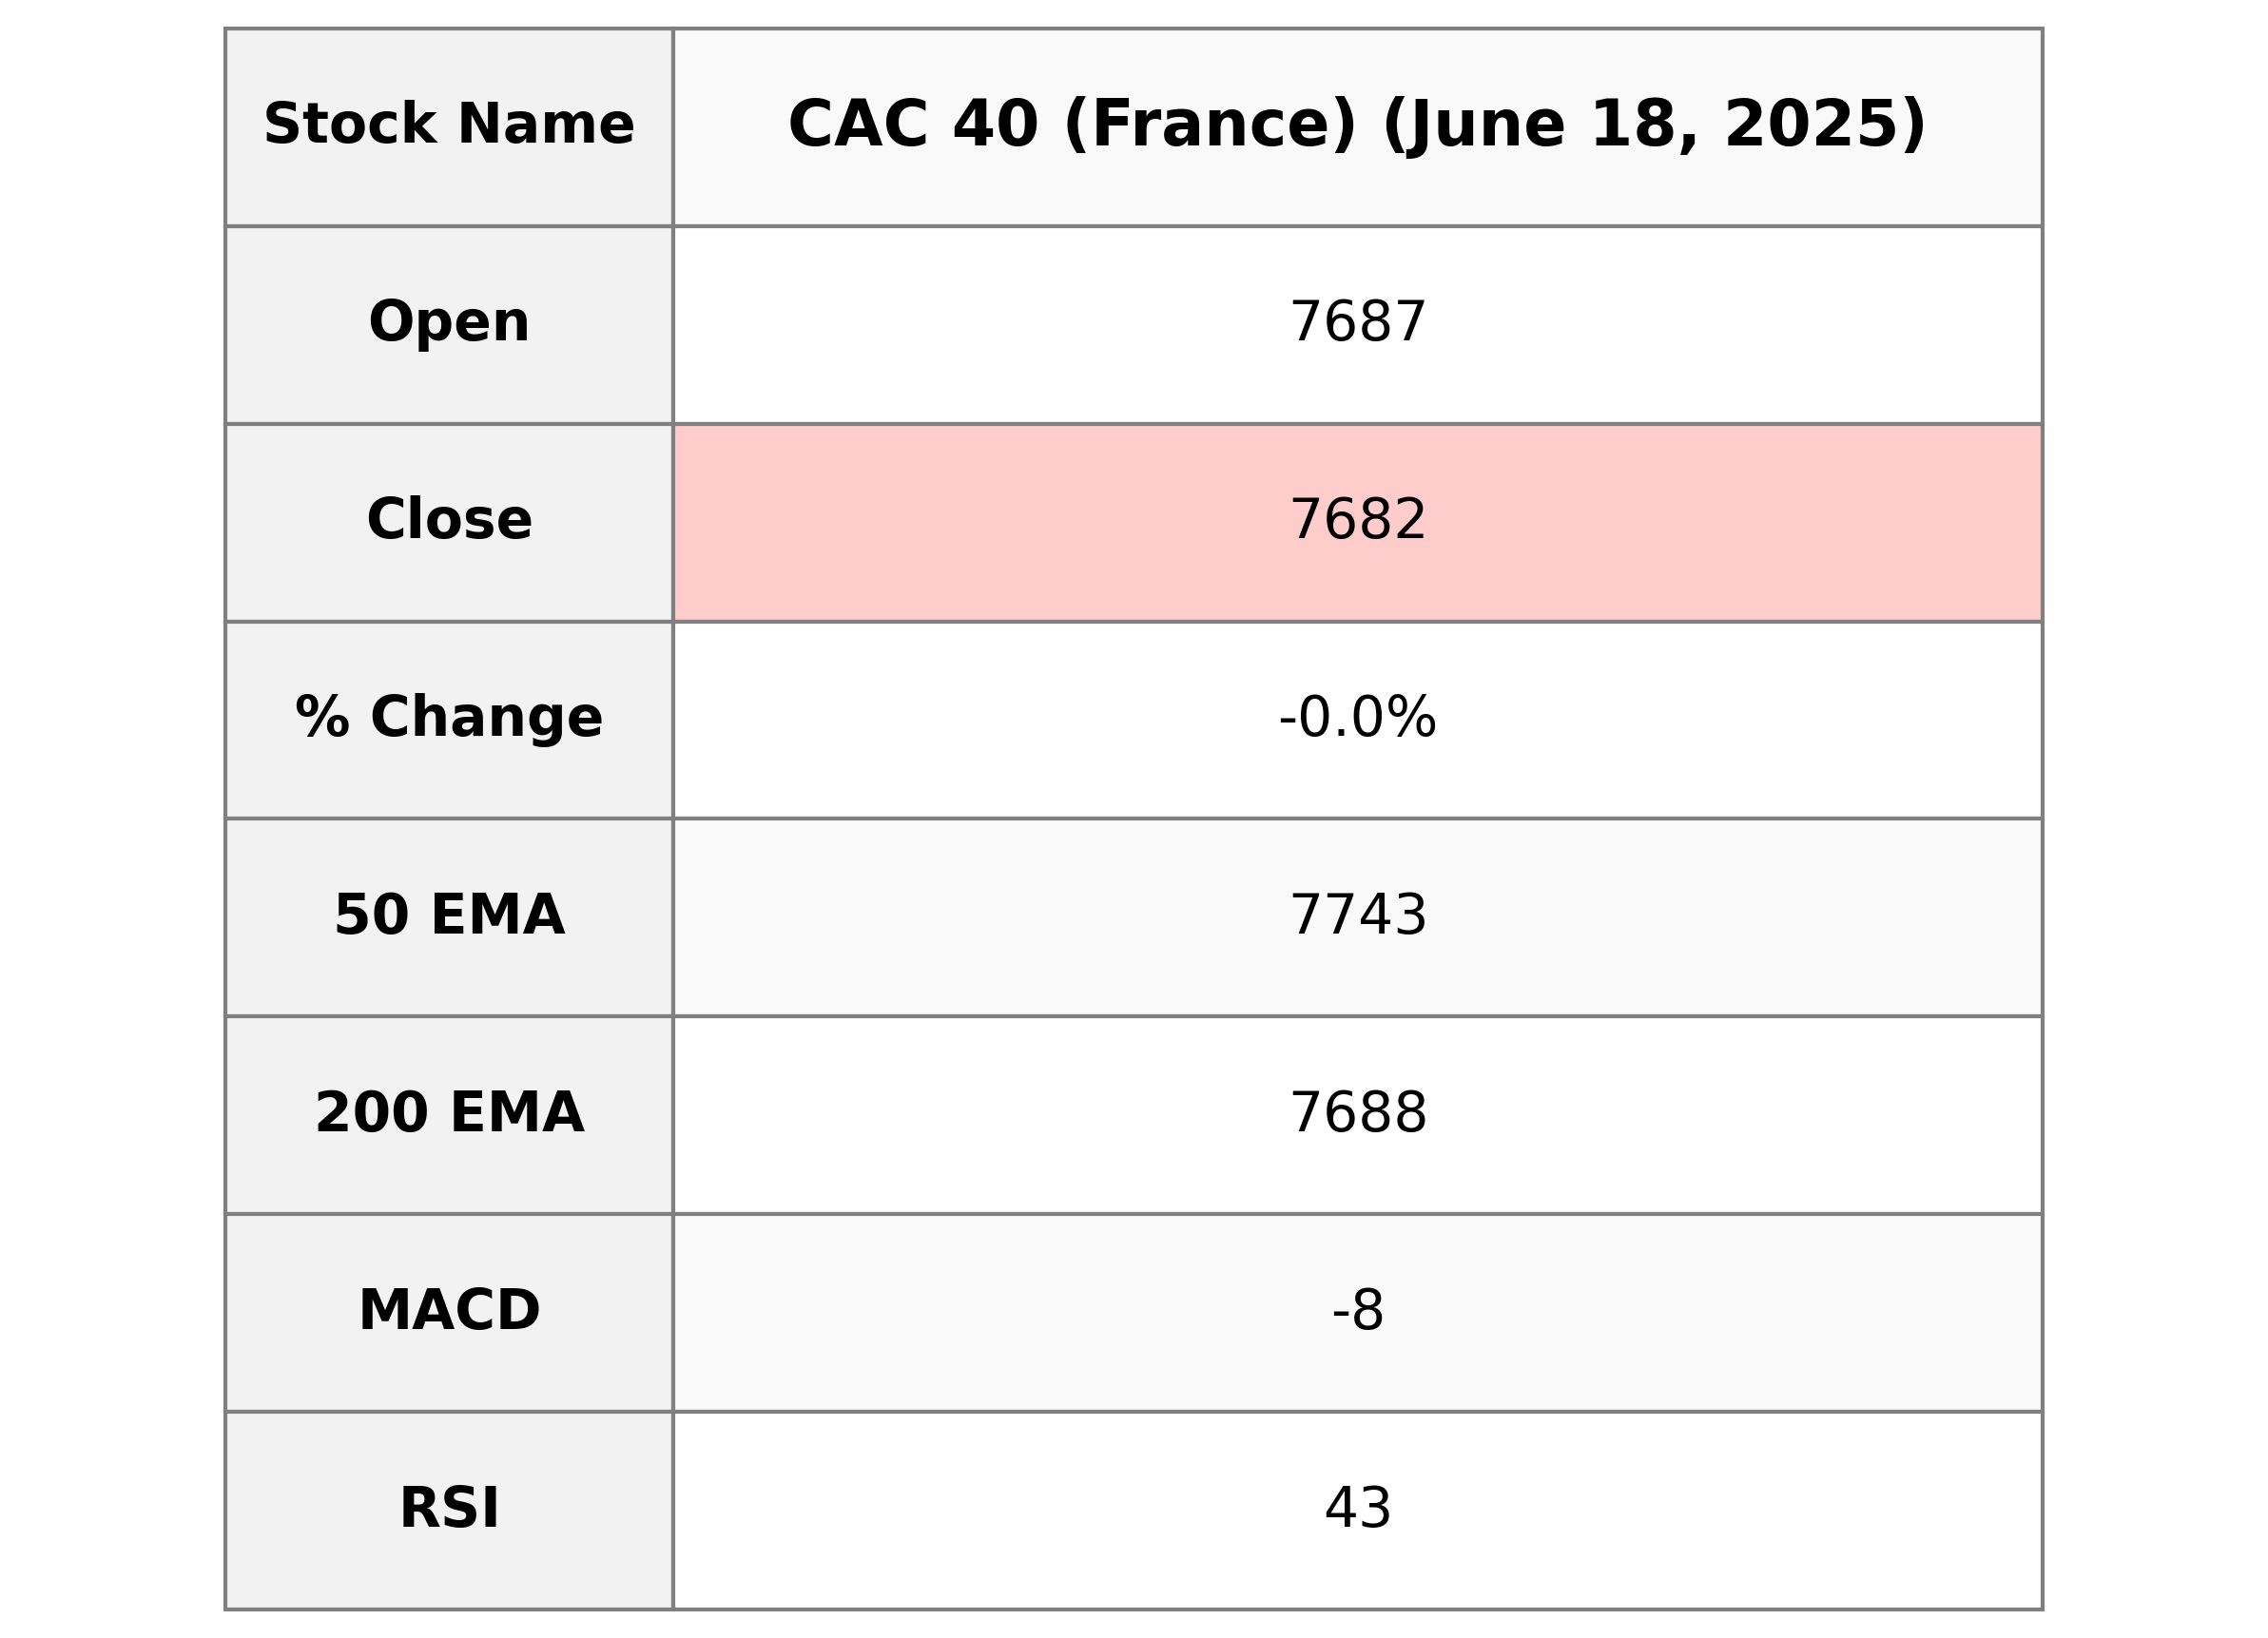
CAC 40 (France) experienced a slight decline with a close at 7681.91, down from the previous close of 7683.73, registering a minor percentage change of -0.02%. The Relative Strength Index (RSI) is at 43.42, suggesting a neutral to slightly bearish sentiment. The Moving Average Convergence Divergence (MACD) indicates a bearish trend with a value of -7.88, below the MACD Signal of 10.70.
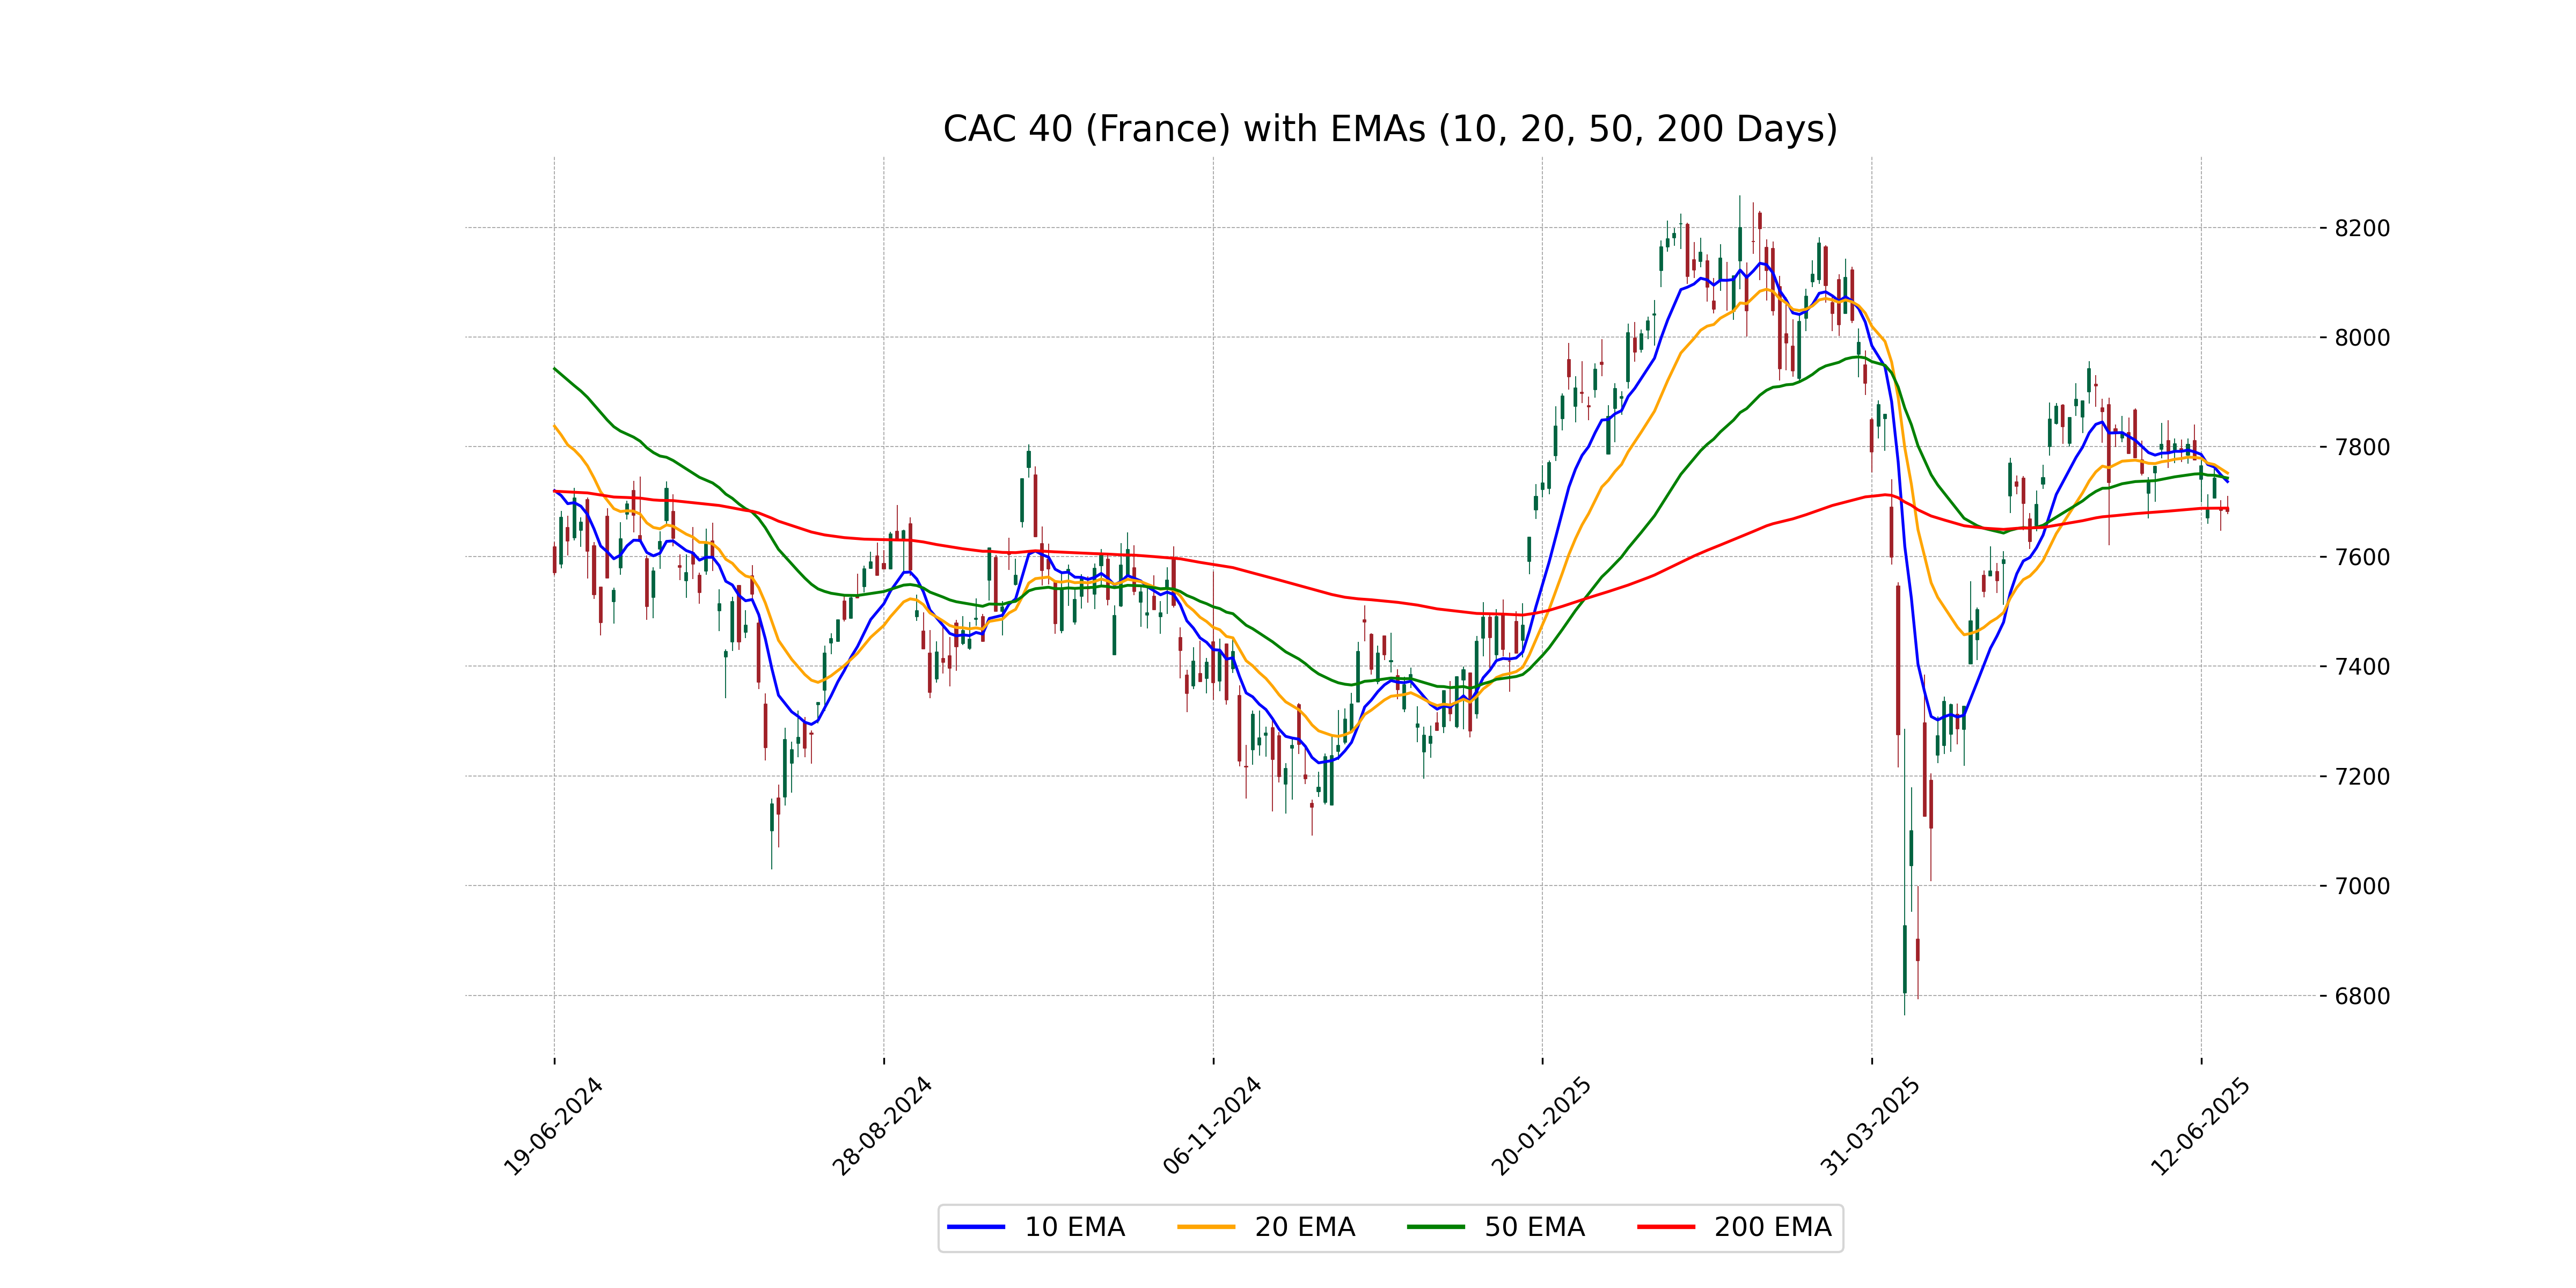
Relationship with Key Moving Averages
The current close price of CAC 40 (France) at 7681.91 is below the 50-day EMA of 7742.98 and the 20-day EMA of 7752.06, indicating a bearish trend in the short to medium term. It is also slightly below the 200-day EMA of 7688.12, suggesting a potential bearish shift in the longer-term trend as well.
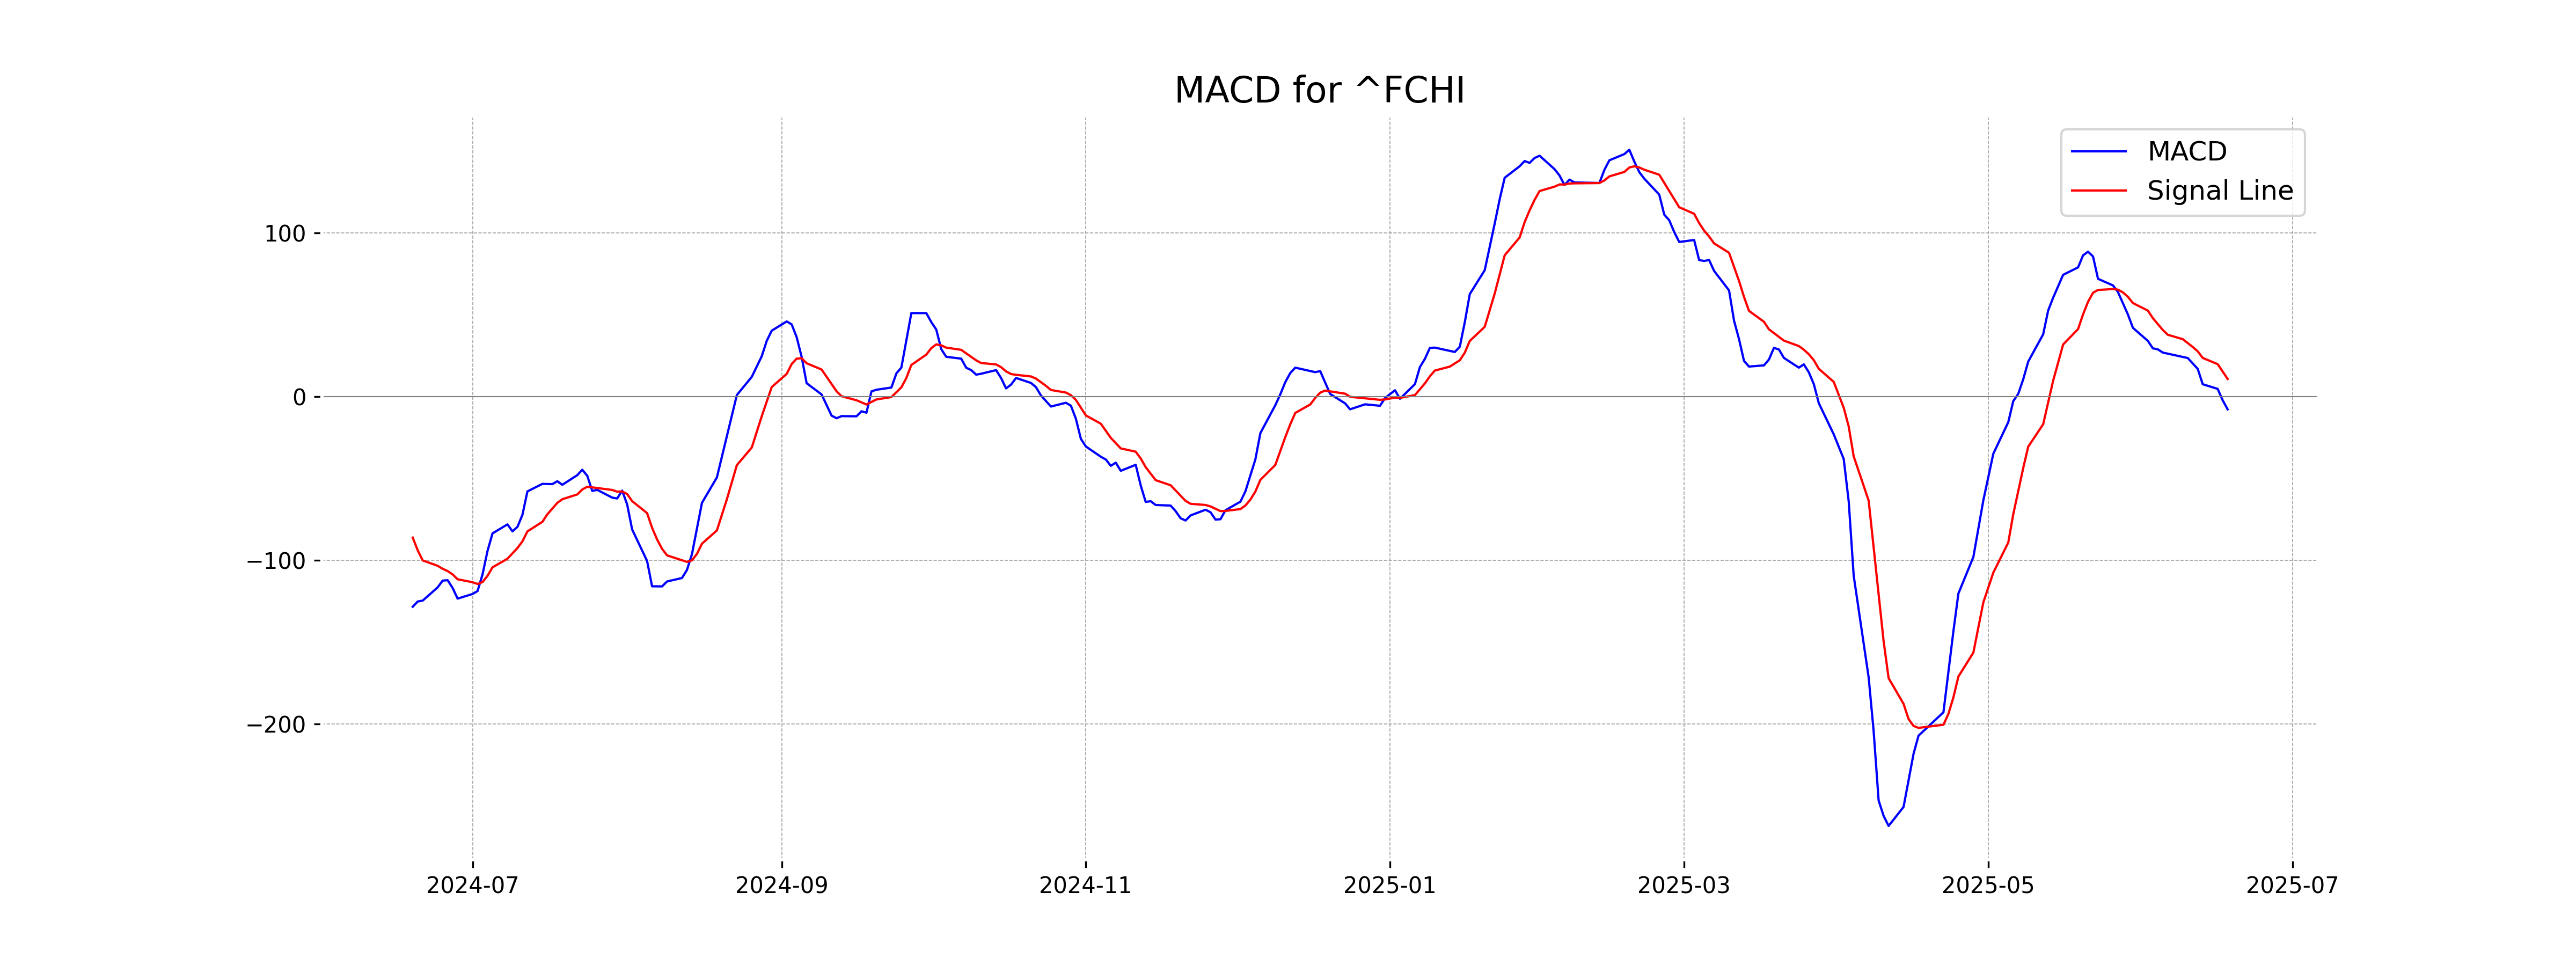
Moving Averages Trend (MACD)
MACD Analysis for CAC 40 (France): The MACD for CAC 40 is negative at -7.88, while the MACD Signal is 10.70, indicating a bearish trend as the MACD line is below the signal line. This suggests potential continued downward momentum in the short term.
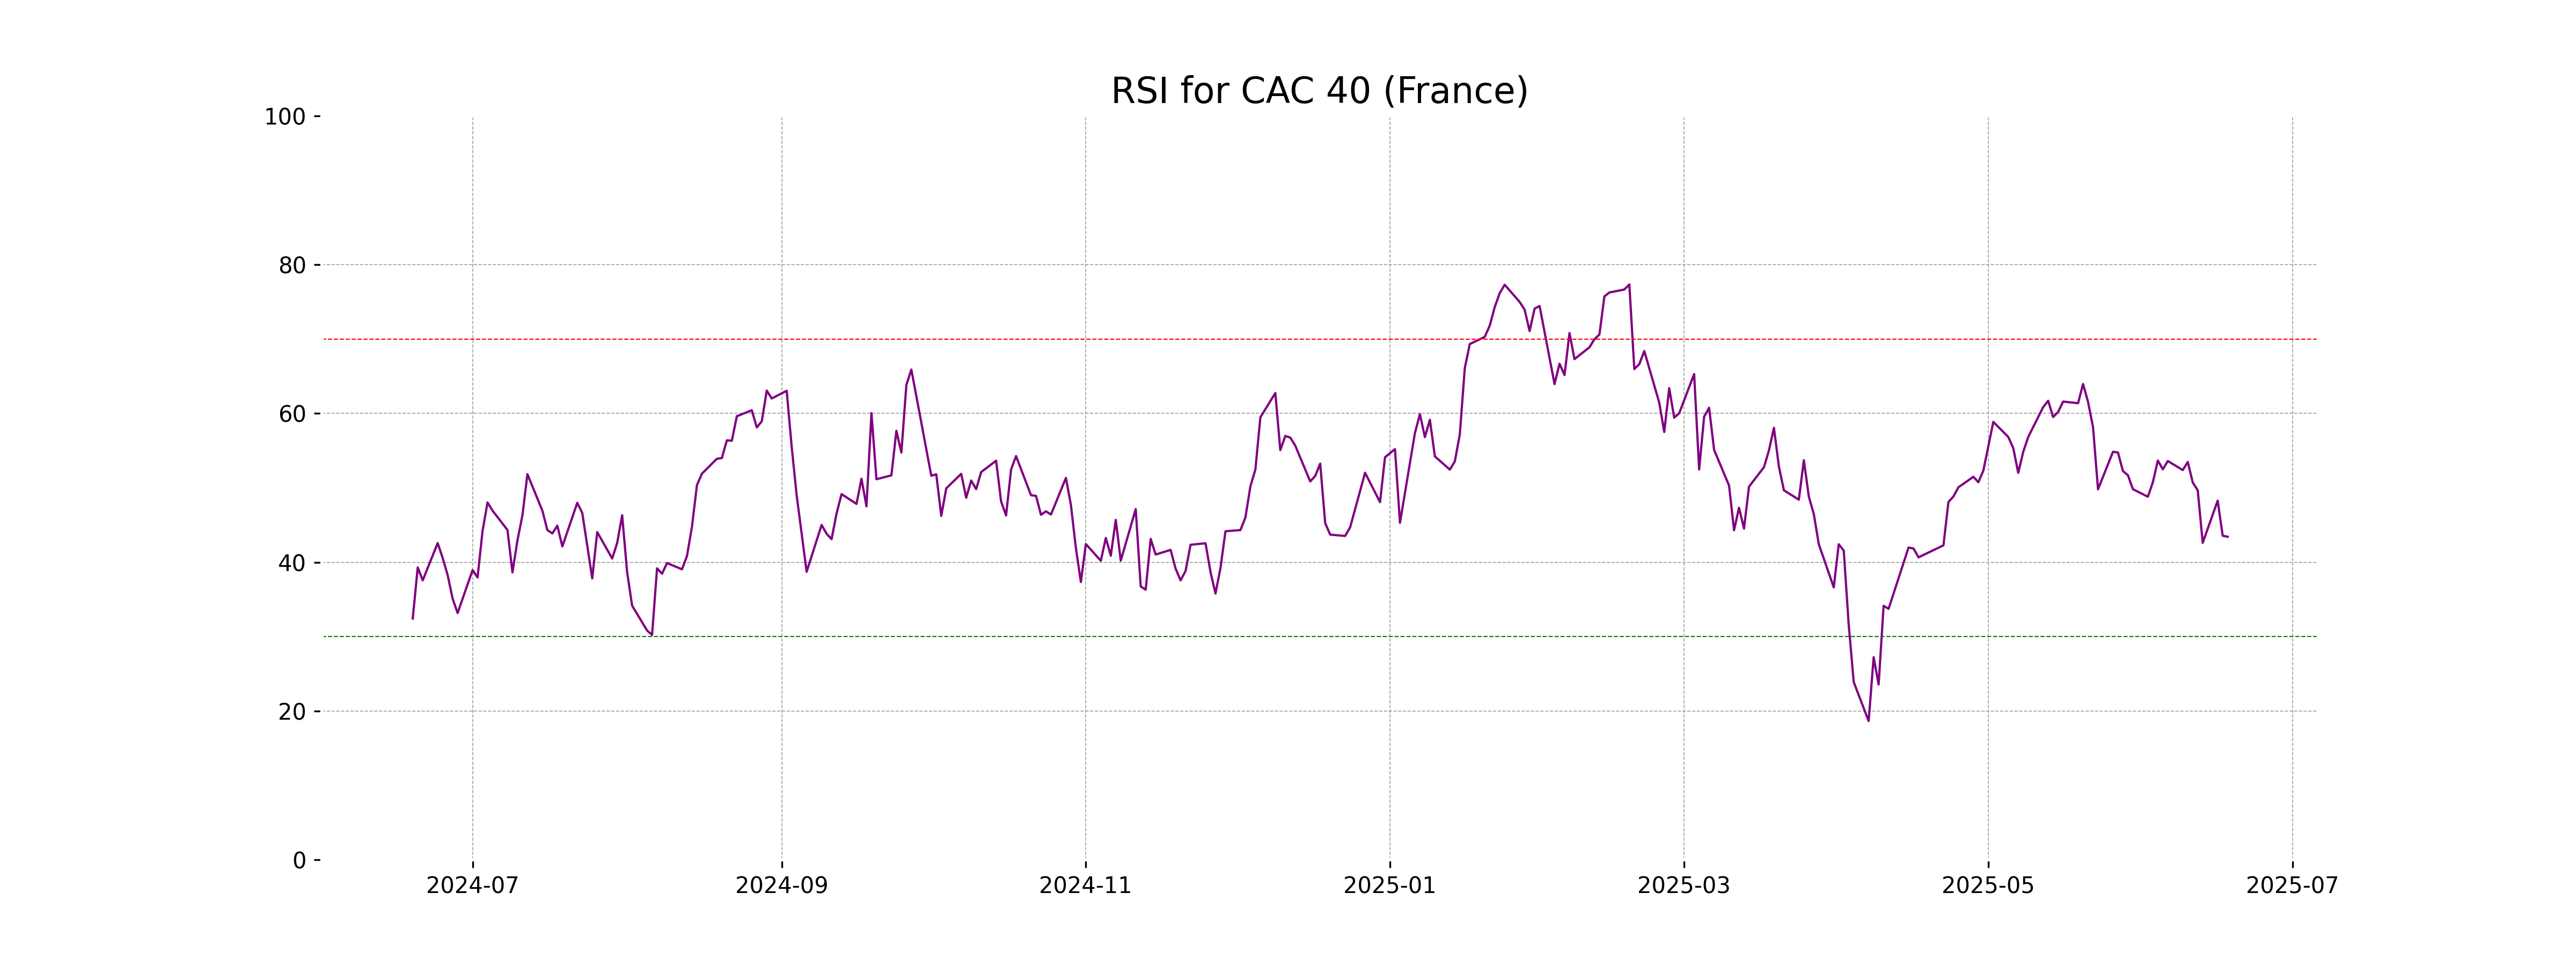
RSI Analysis
The RSI for CAC 40 is 43.42, indicating that the market is currently neither overbought nor oversold. This suggests a relatively neutral momentum, and traders might anticipate further price signals to determine the next movement.
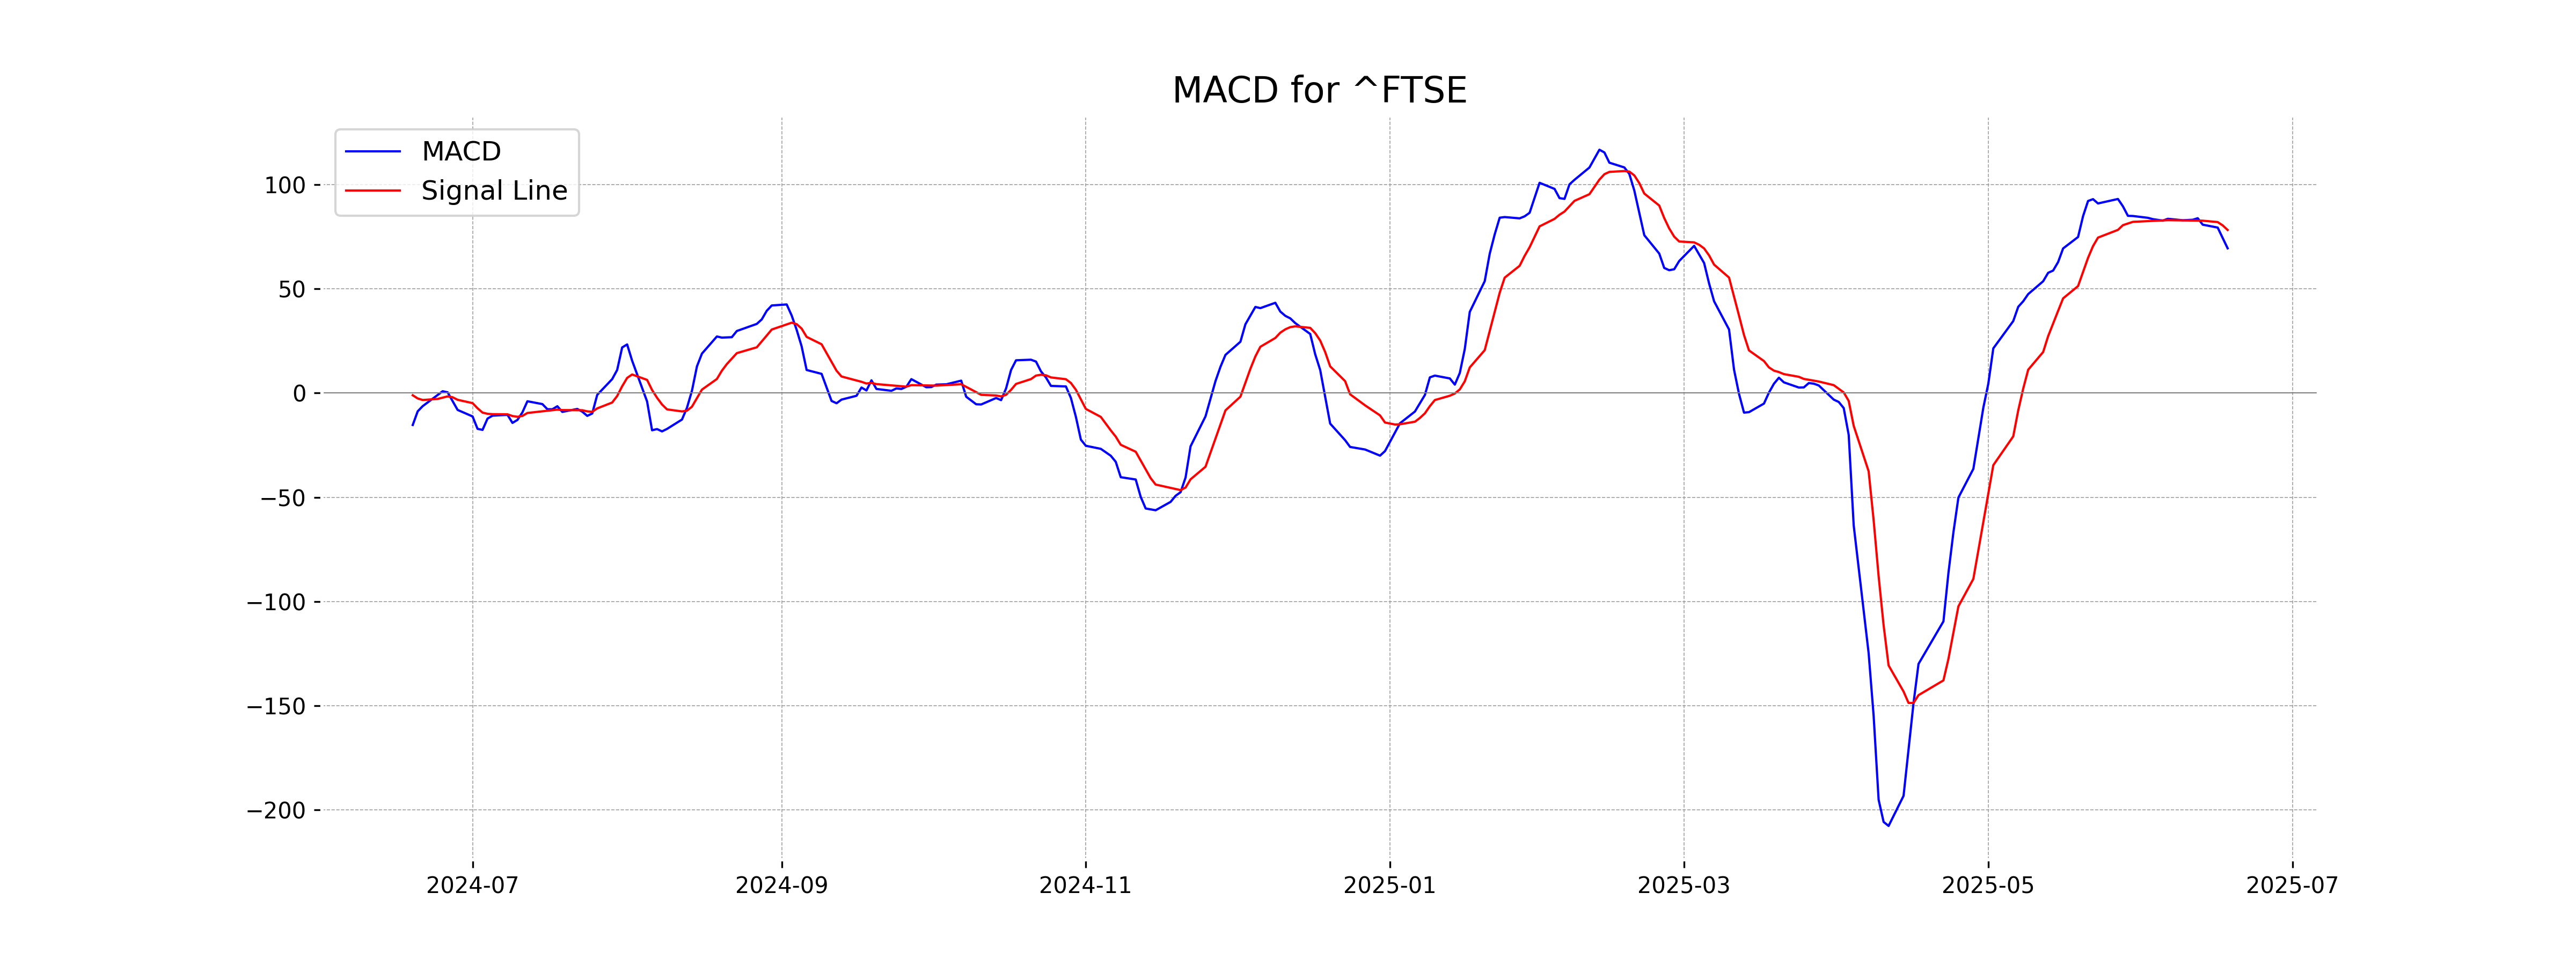
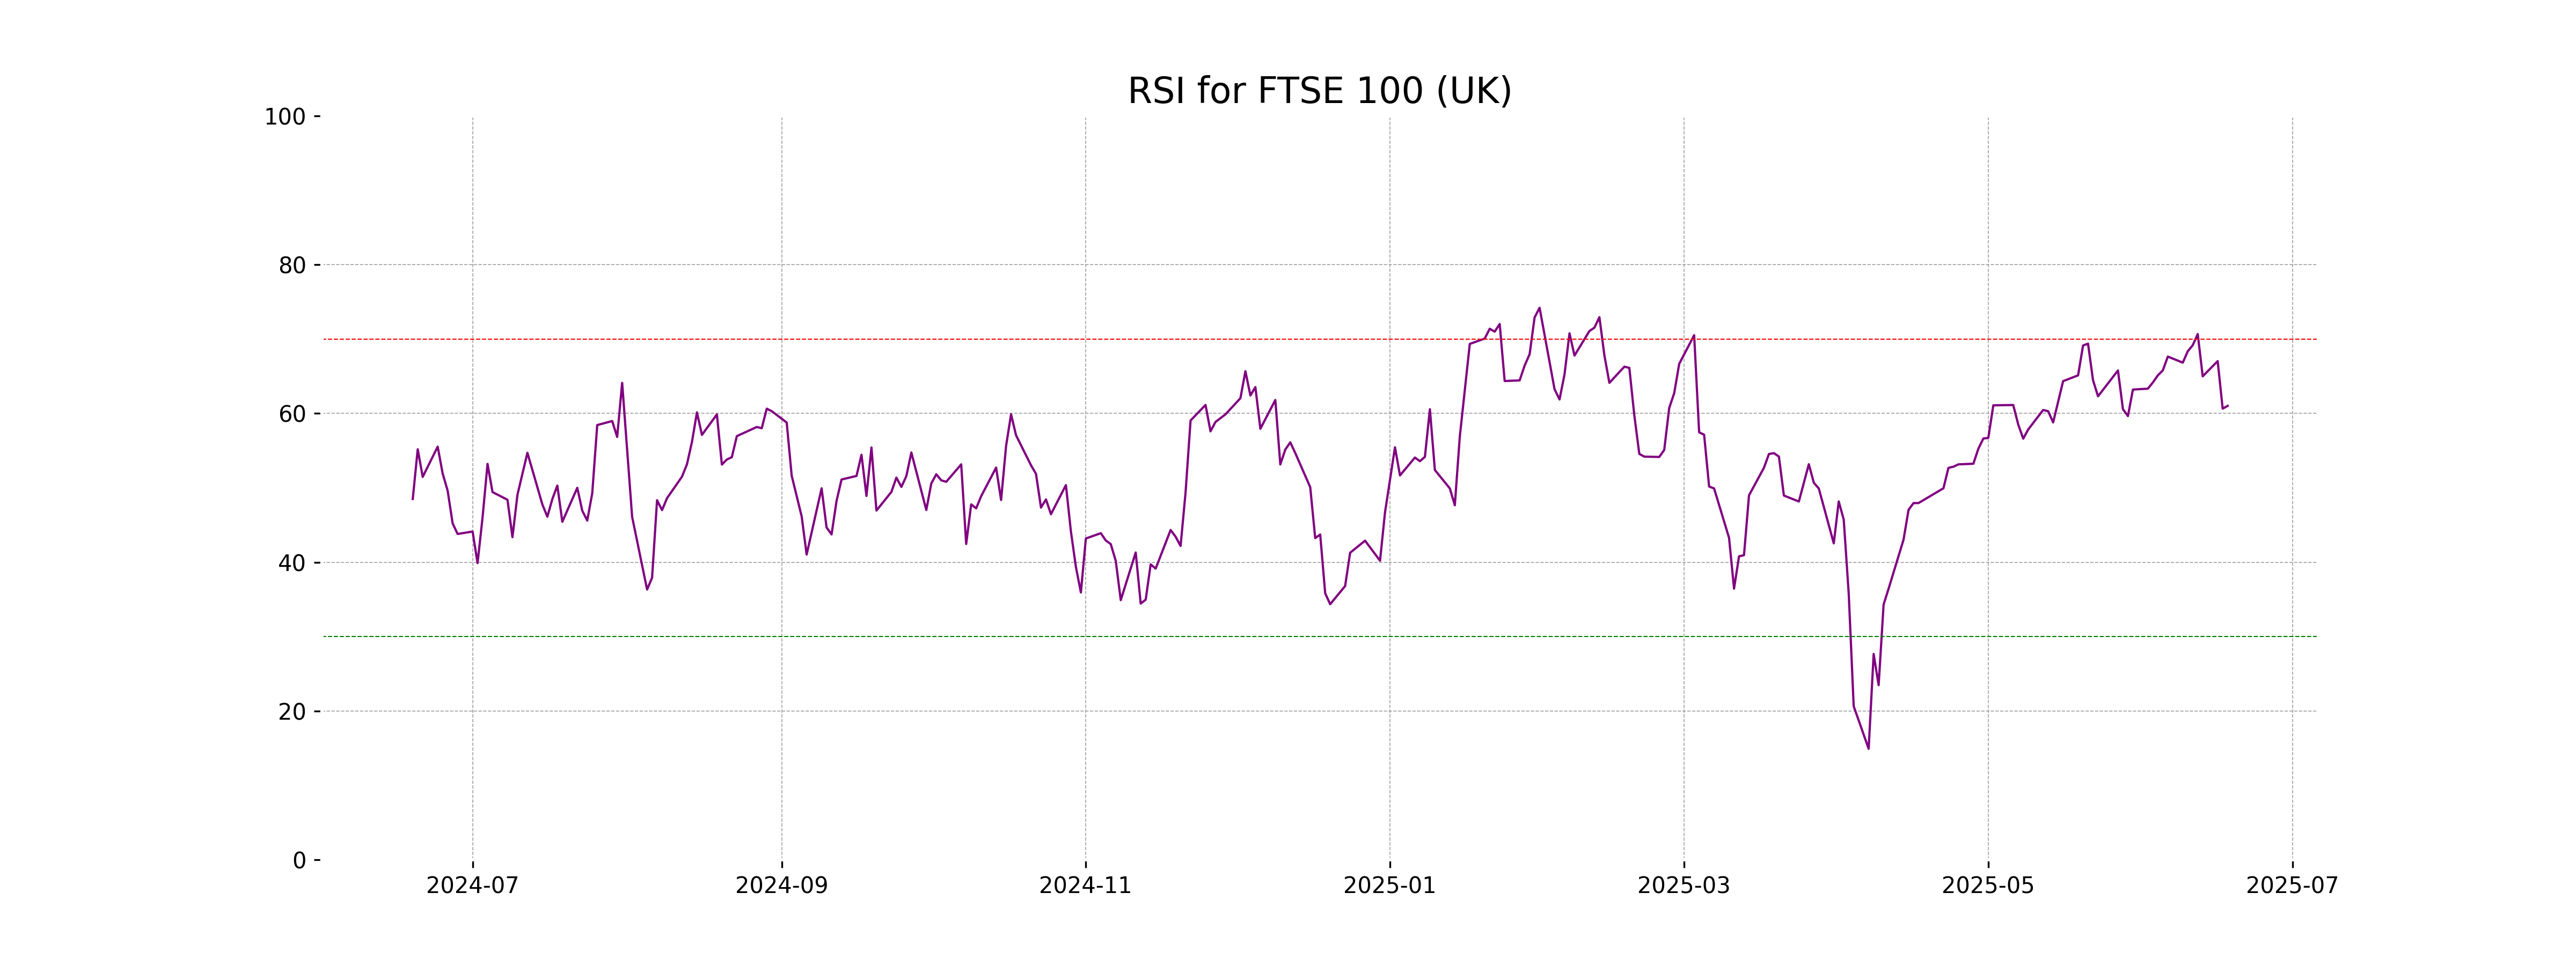
Analysis for FTSE 100 (UK) - June 18, 2025
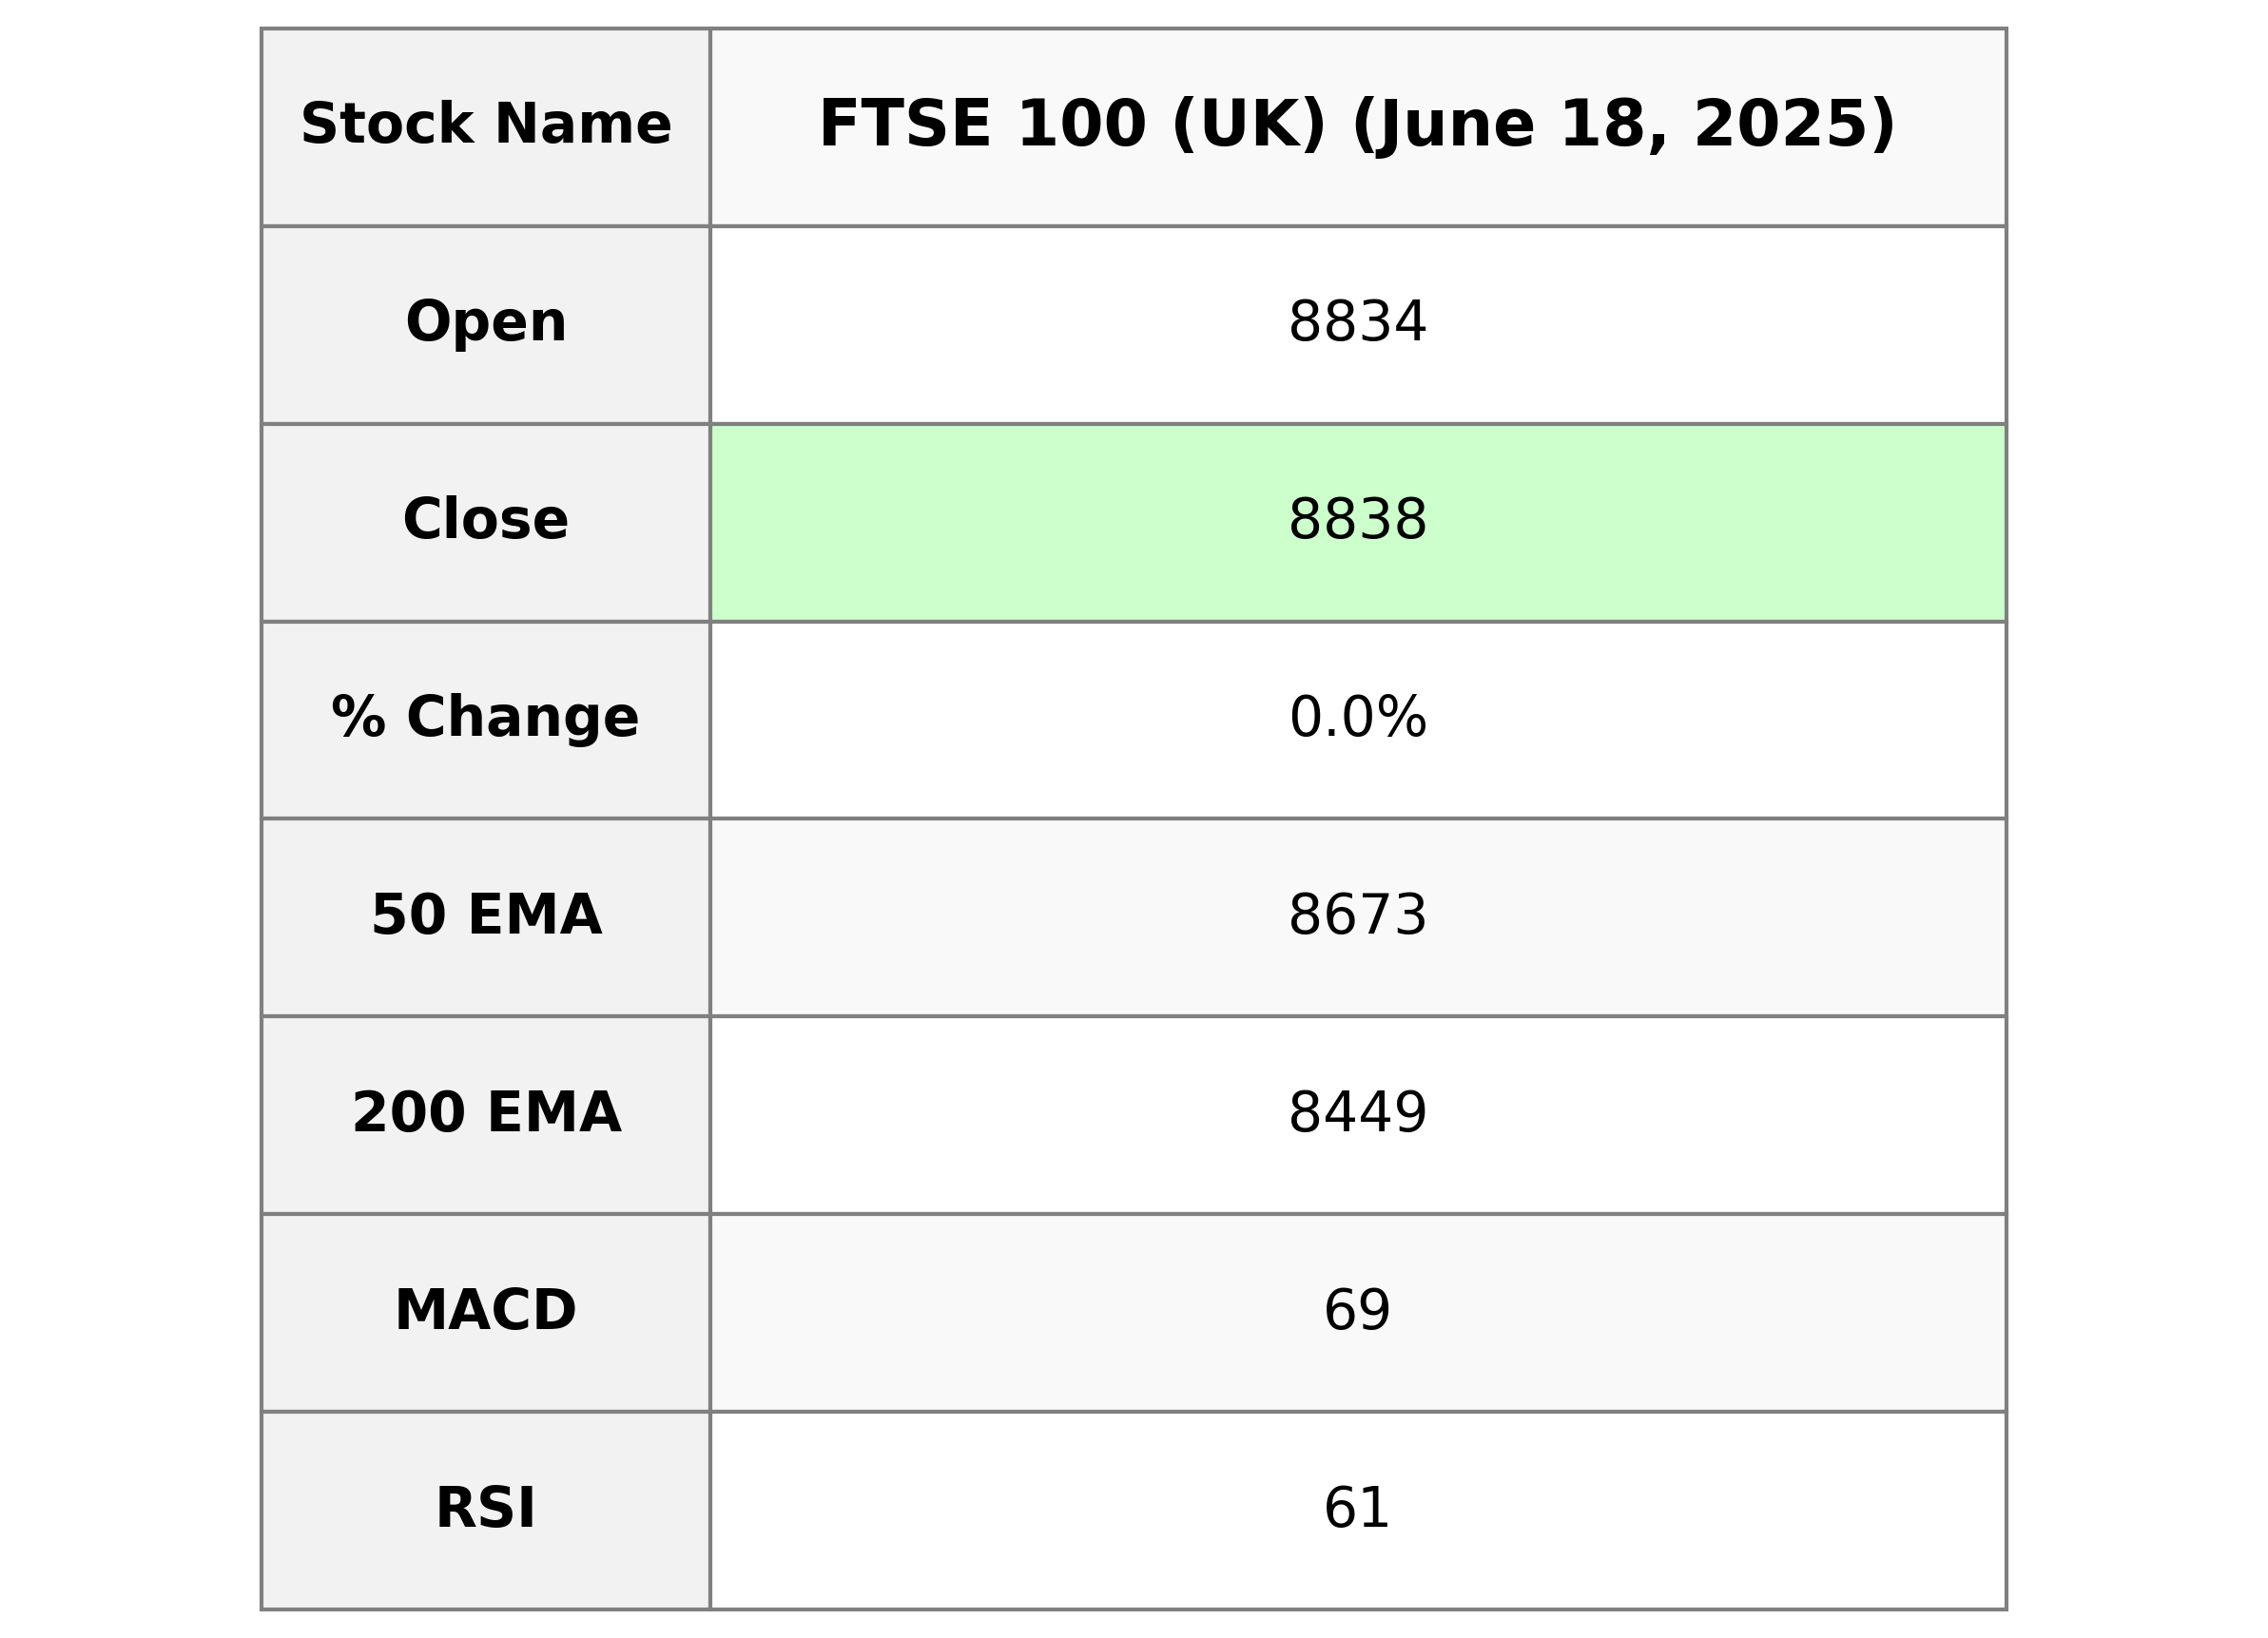
FTSE 100 (UK) opened at 8834.03 and closed slightly higher at 8837.87, marking a modest gain of 0.04%. The index's current price sits above its 50 and 200-day EMAs, suggesting a positive trend, while the RSI of 61.02 indicates moderate momentum. The MACD is slightly below the signal line, indicating a potential slowing of bullish momentum.
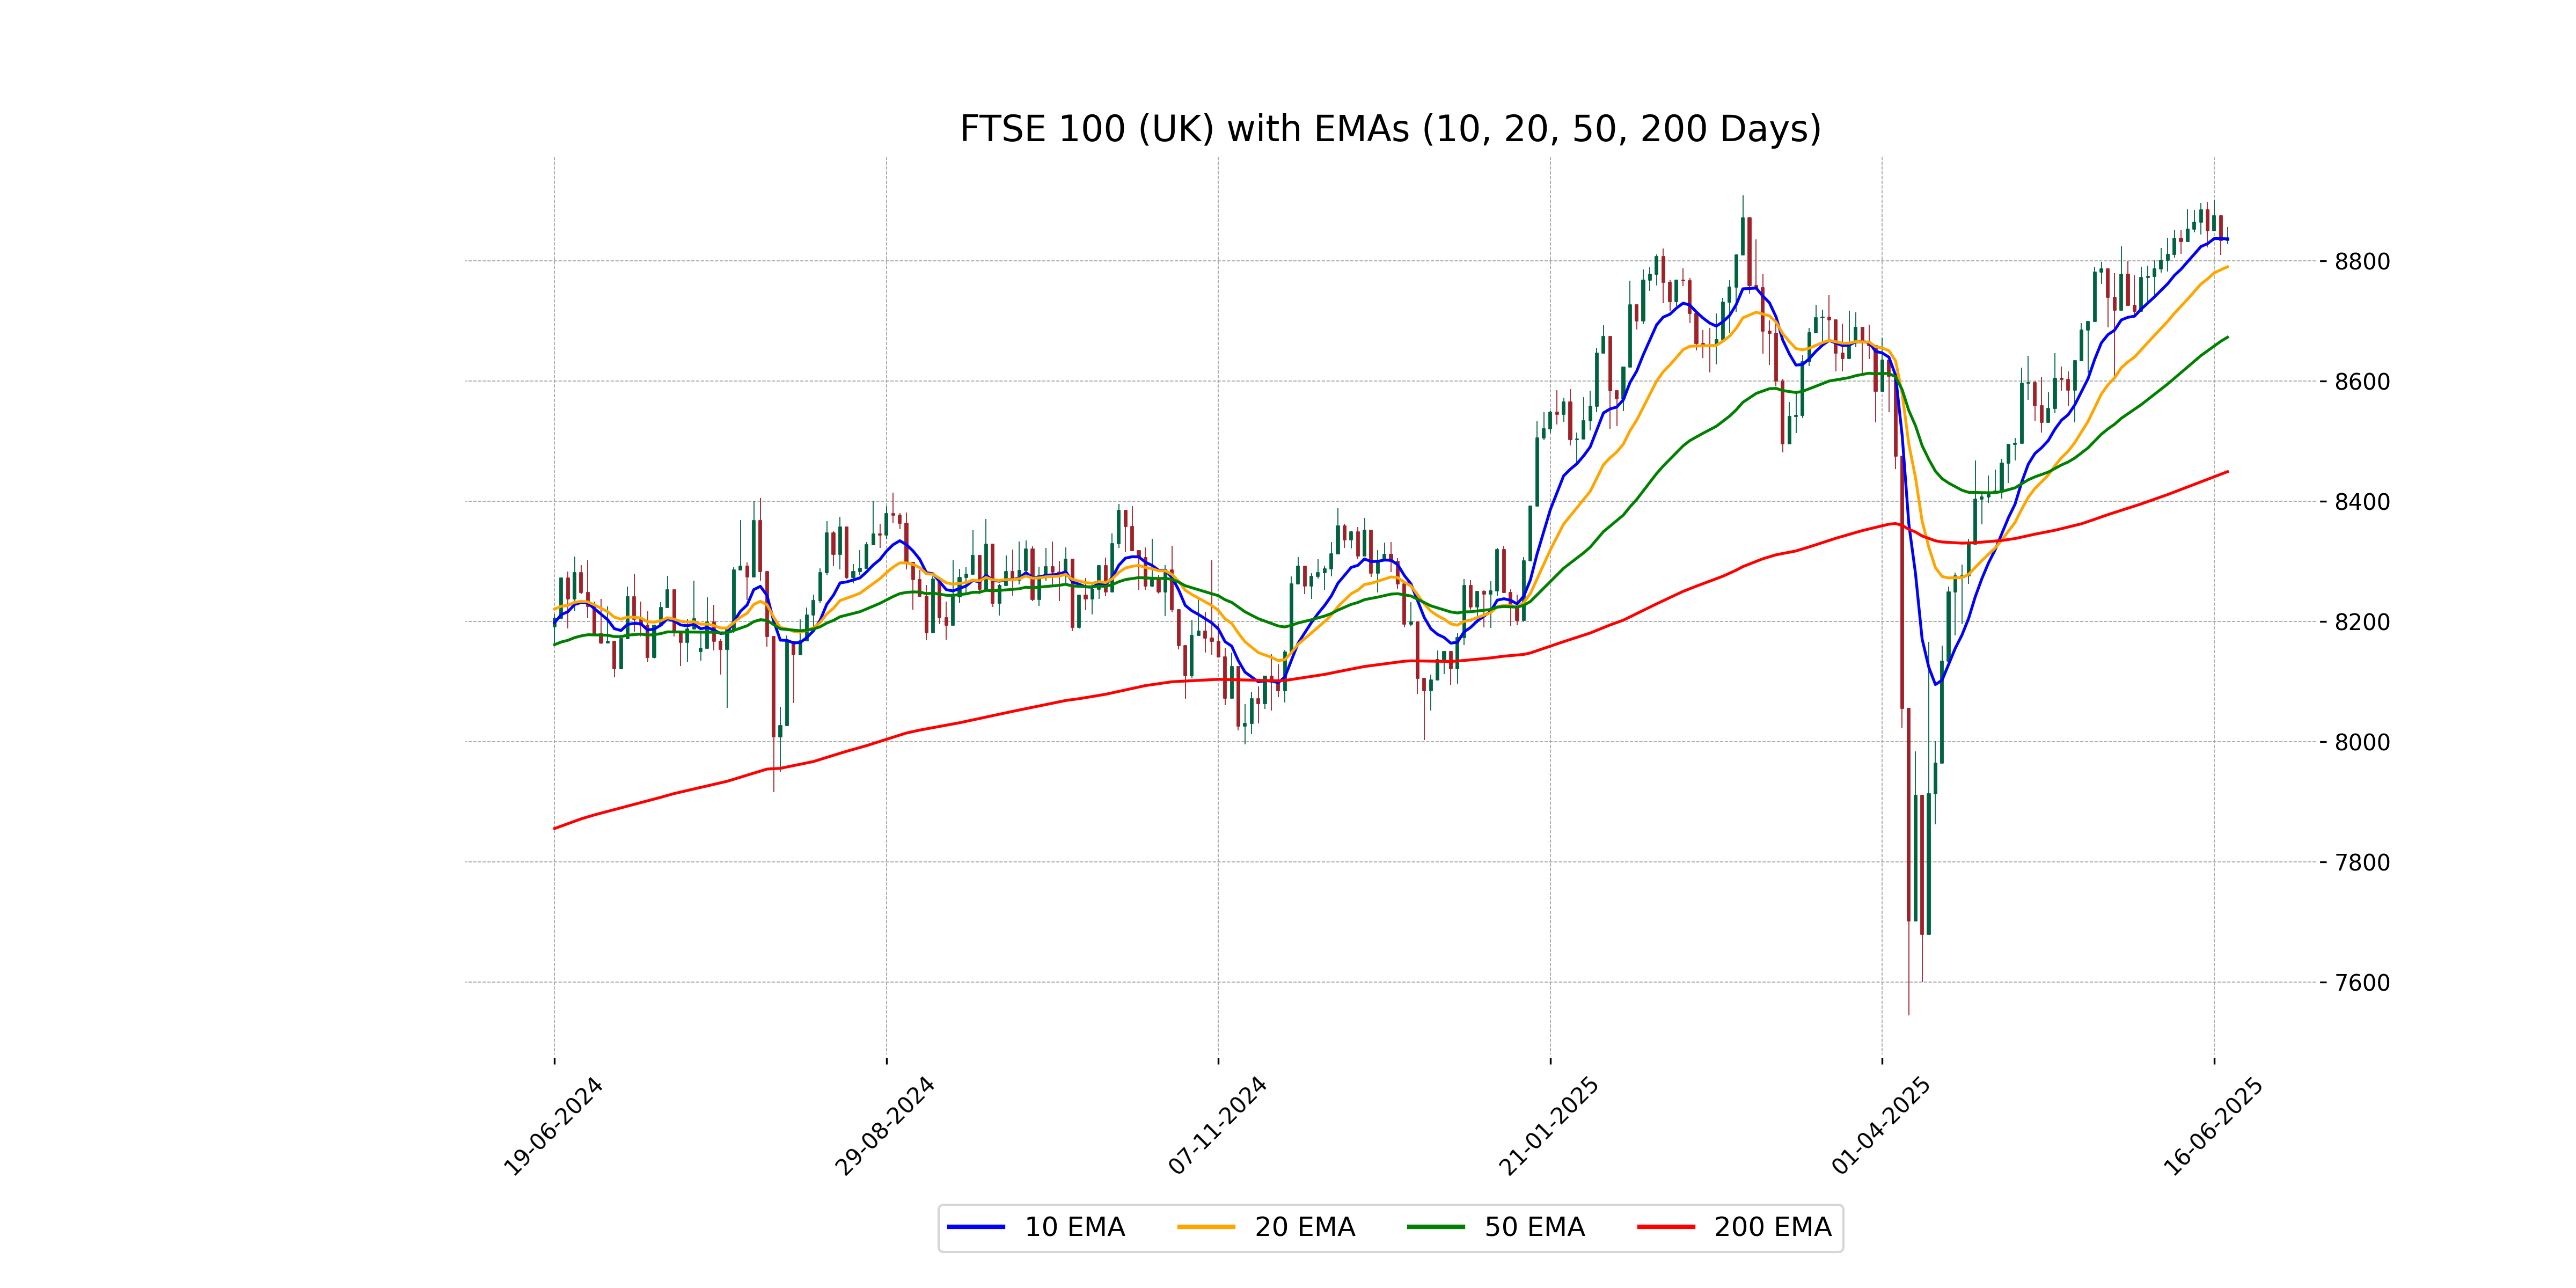
Relationship with Key Moving Averages
The FTSE 100 is currently trading above its 50 EMA (8672.99) and 200 EMA (8449.23), indicating an uptrend, but is just slightly above its 10 EMA (8836.83), suggesting near-term consolidation. The RSI of 61.02 indicates a moderately strong trend, while the MACD is below its signal line, showing potential for a slowdown.
Moving Averages Trend (MACD)
FTSE 100 shows a negative MACD condition, as the MACD line (69.43) is below the MACD signal line (78.23). This suggests a bearish momentum, indicating that the index could be experiencing a downside pressure in the short term.
RSI Analysis
The RSI for FTSE 100 is currently 61.02, suggesting that the index is in a fairly neutral territory and not close to being overbought or oversold. It's near the standard 70-overbought and 30-oversold thresholds, indicating stability in market sentiment.
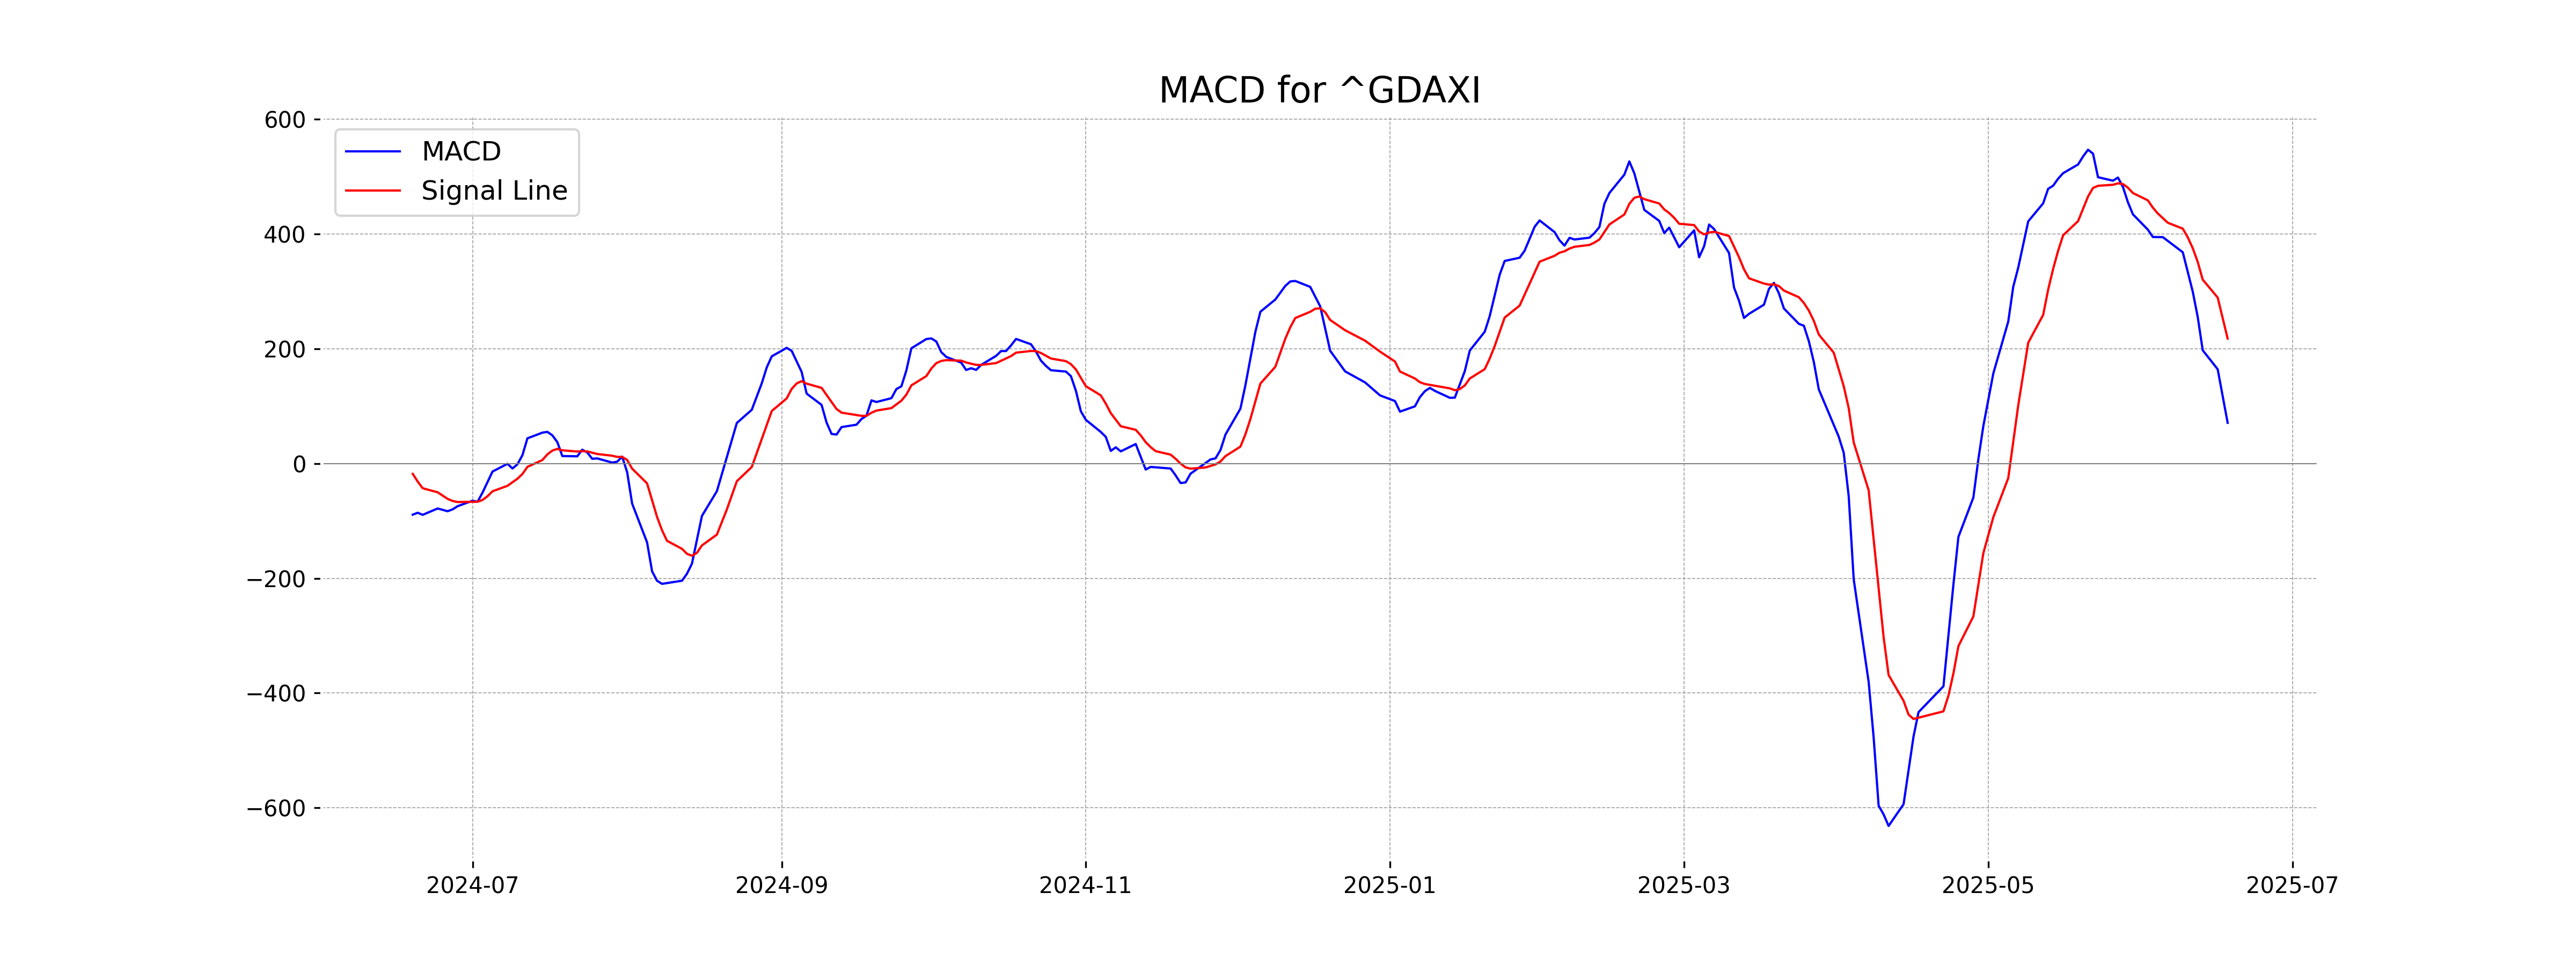
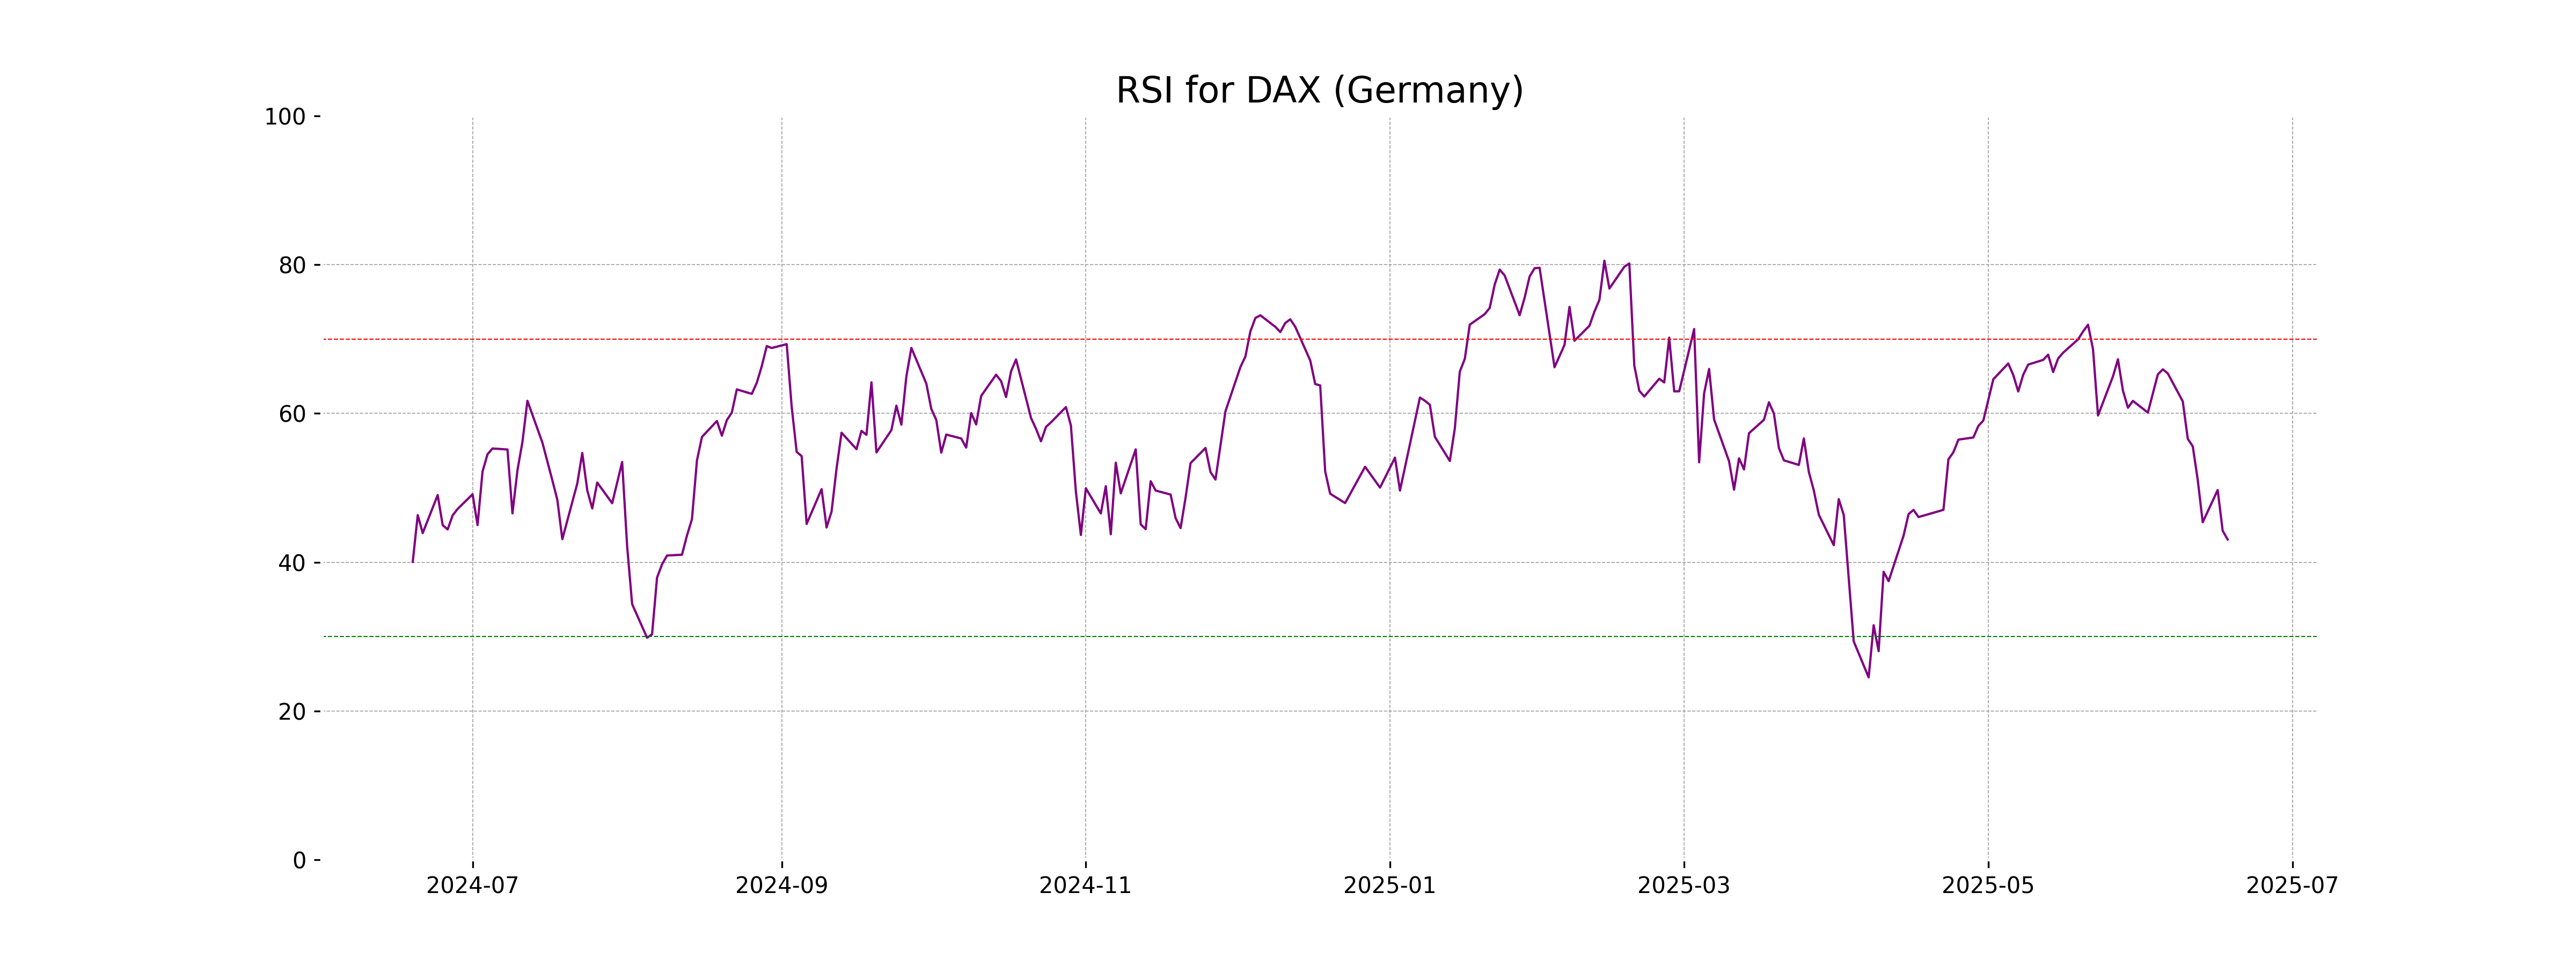
Analysis for DAX (Germany) - June 18, 2025
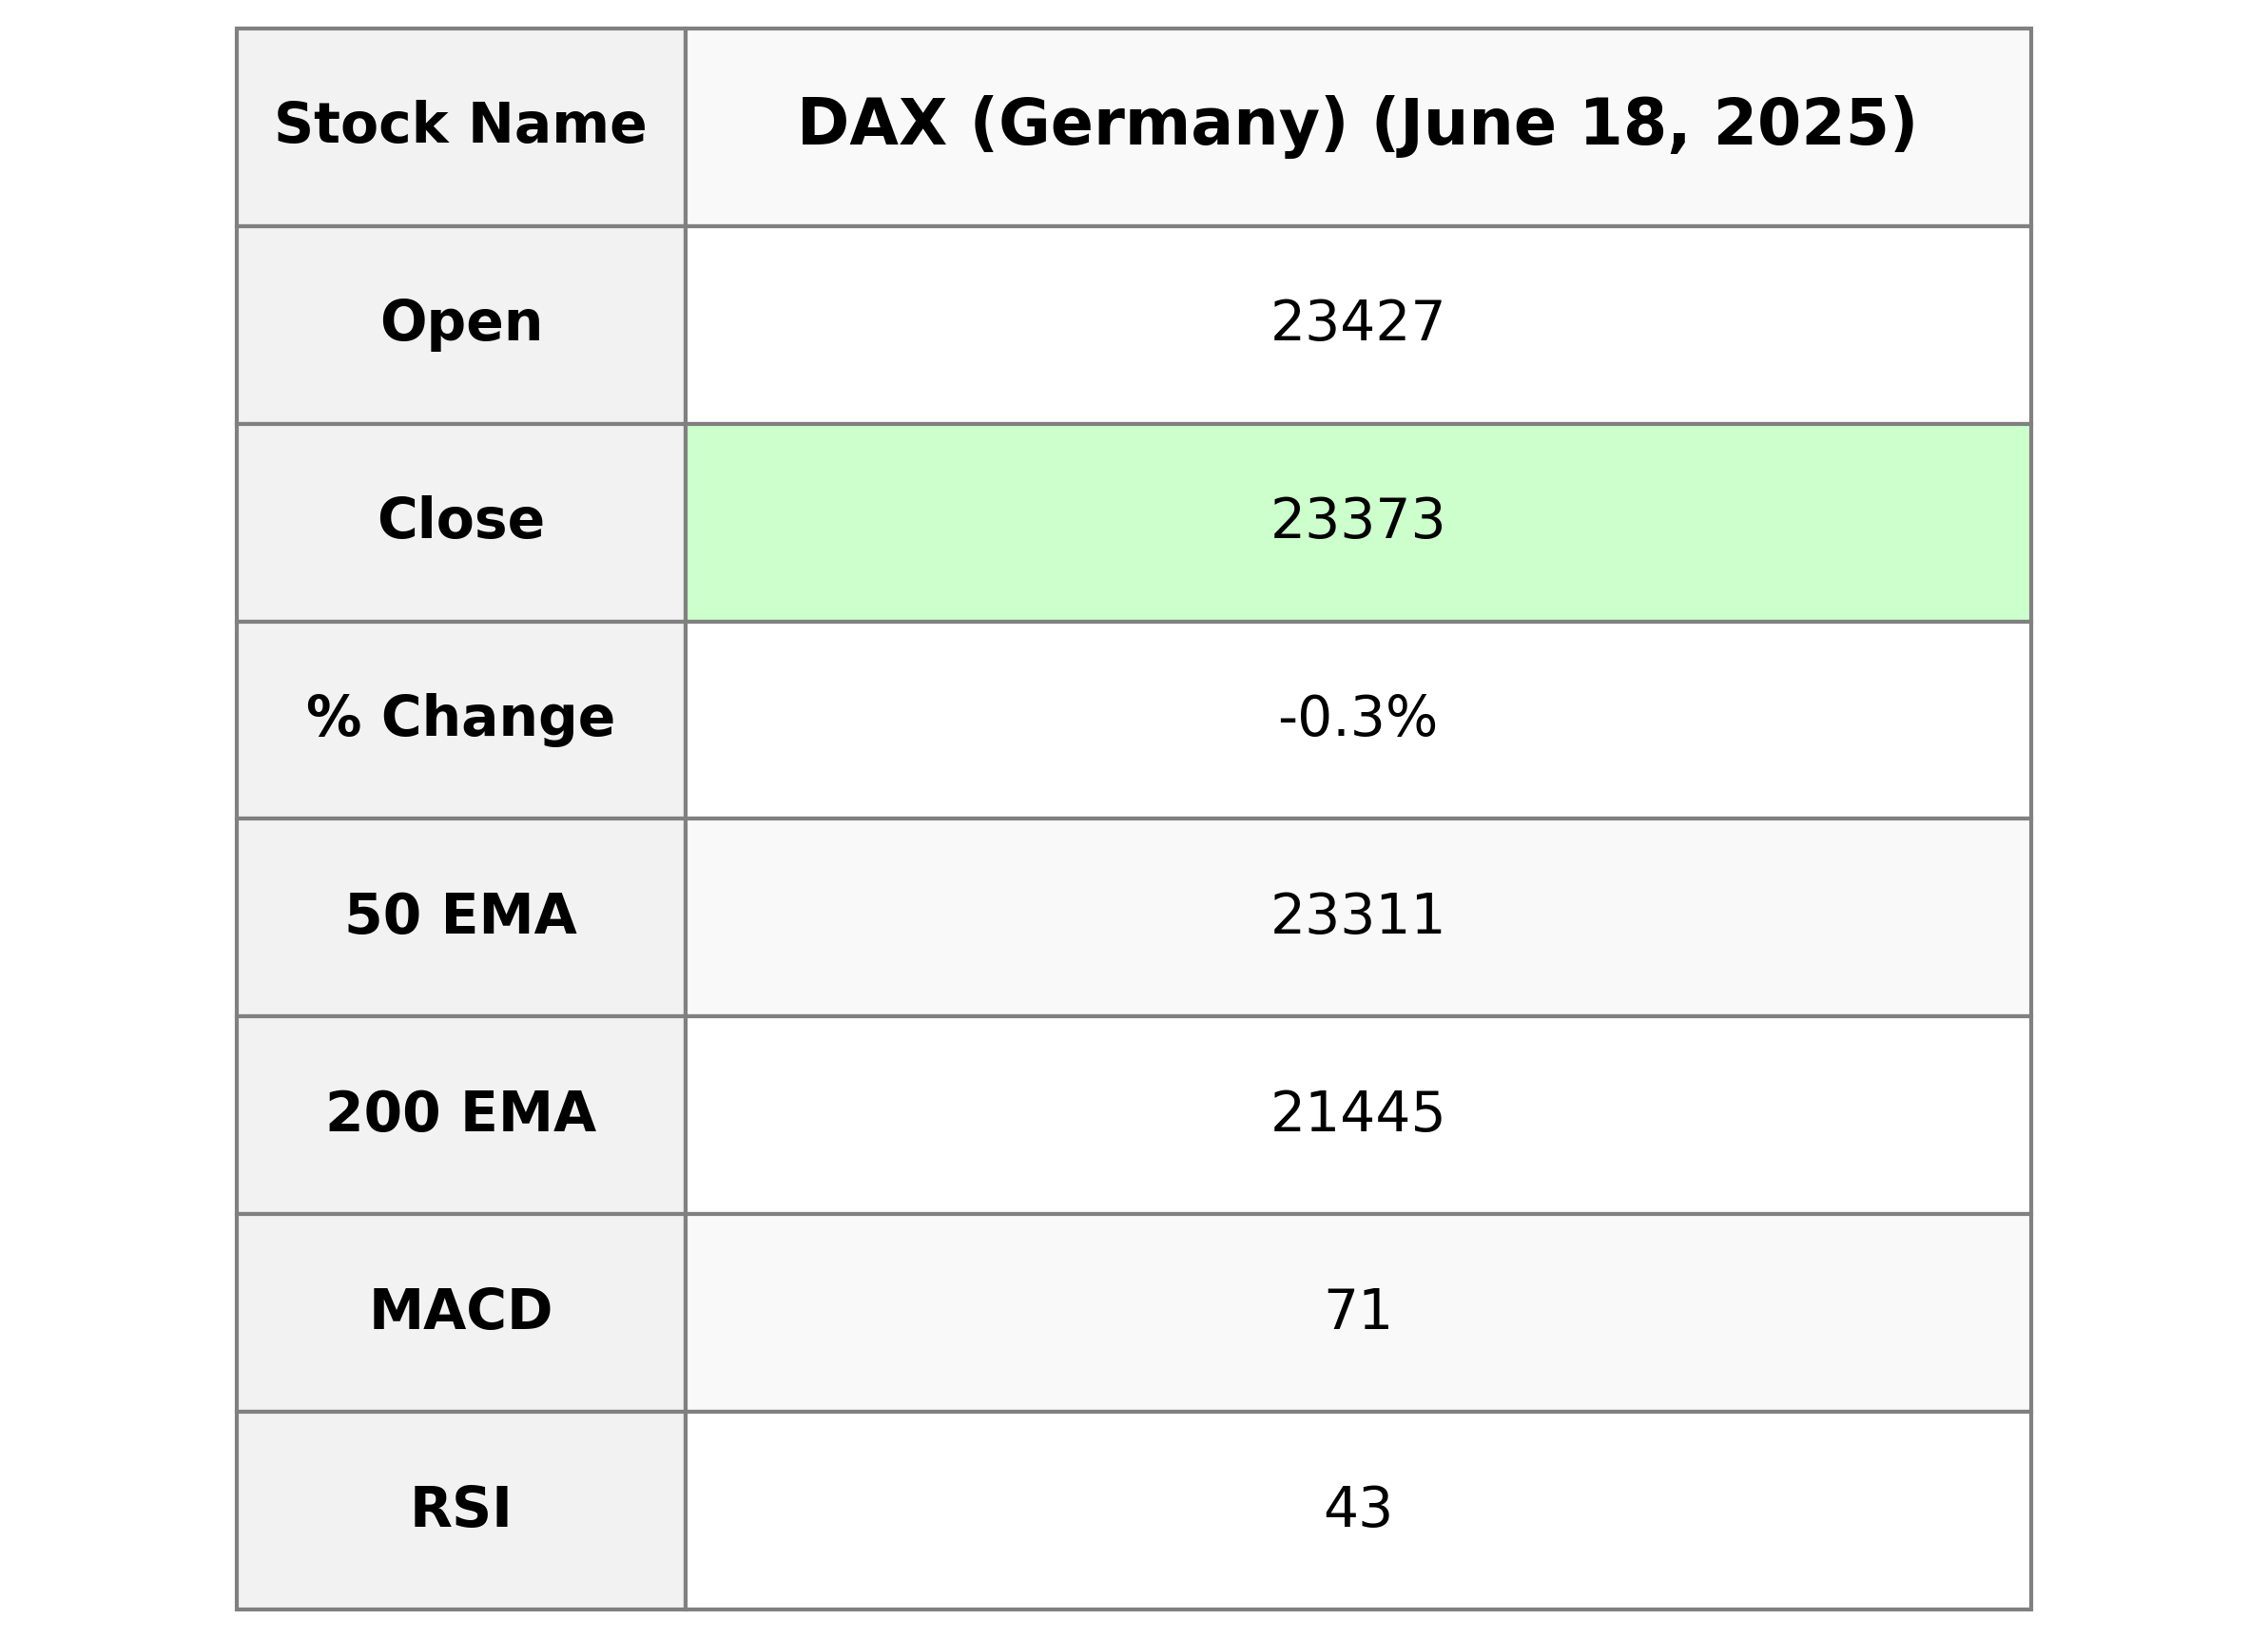
DAX (Germany) Performance: The DAX index opened at 23,426.97 and closed slightly lower at 23,373.05, marking a daily change of -0.26%. The index experienced a decline with a points change of -61.60. The Relative Strength Index (RSI) is at 43.05, suggesting a neutral stance, while the MACD indicates potential bearish momentum due to its lower value compared to the Signal line. Current trends are observed with the 50-day EMA at 23,310.94, below the 10 and 20-day EMAs, signaling recent downward pressure.
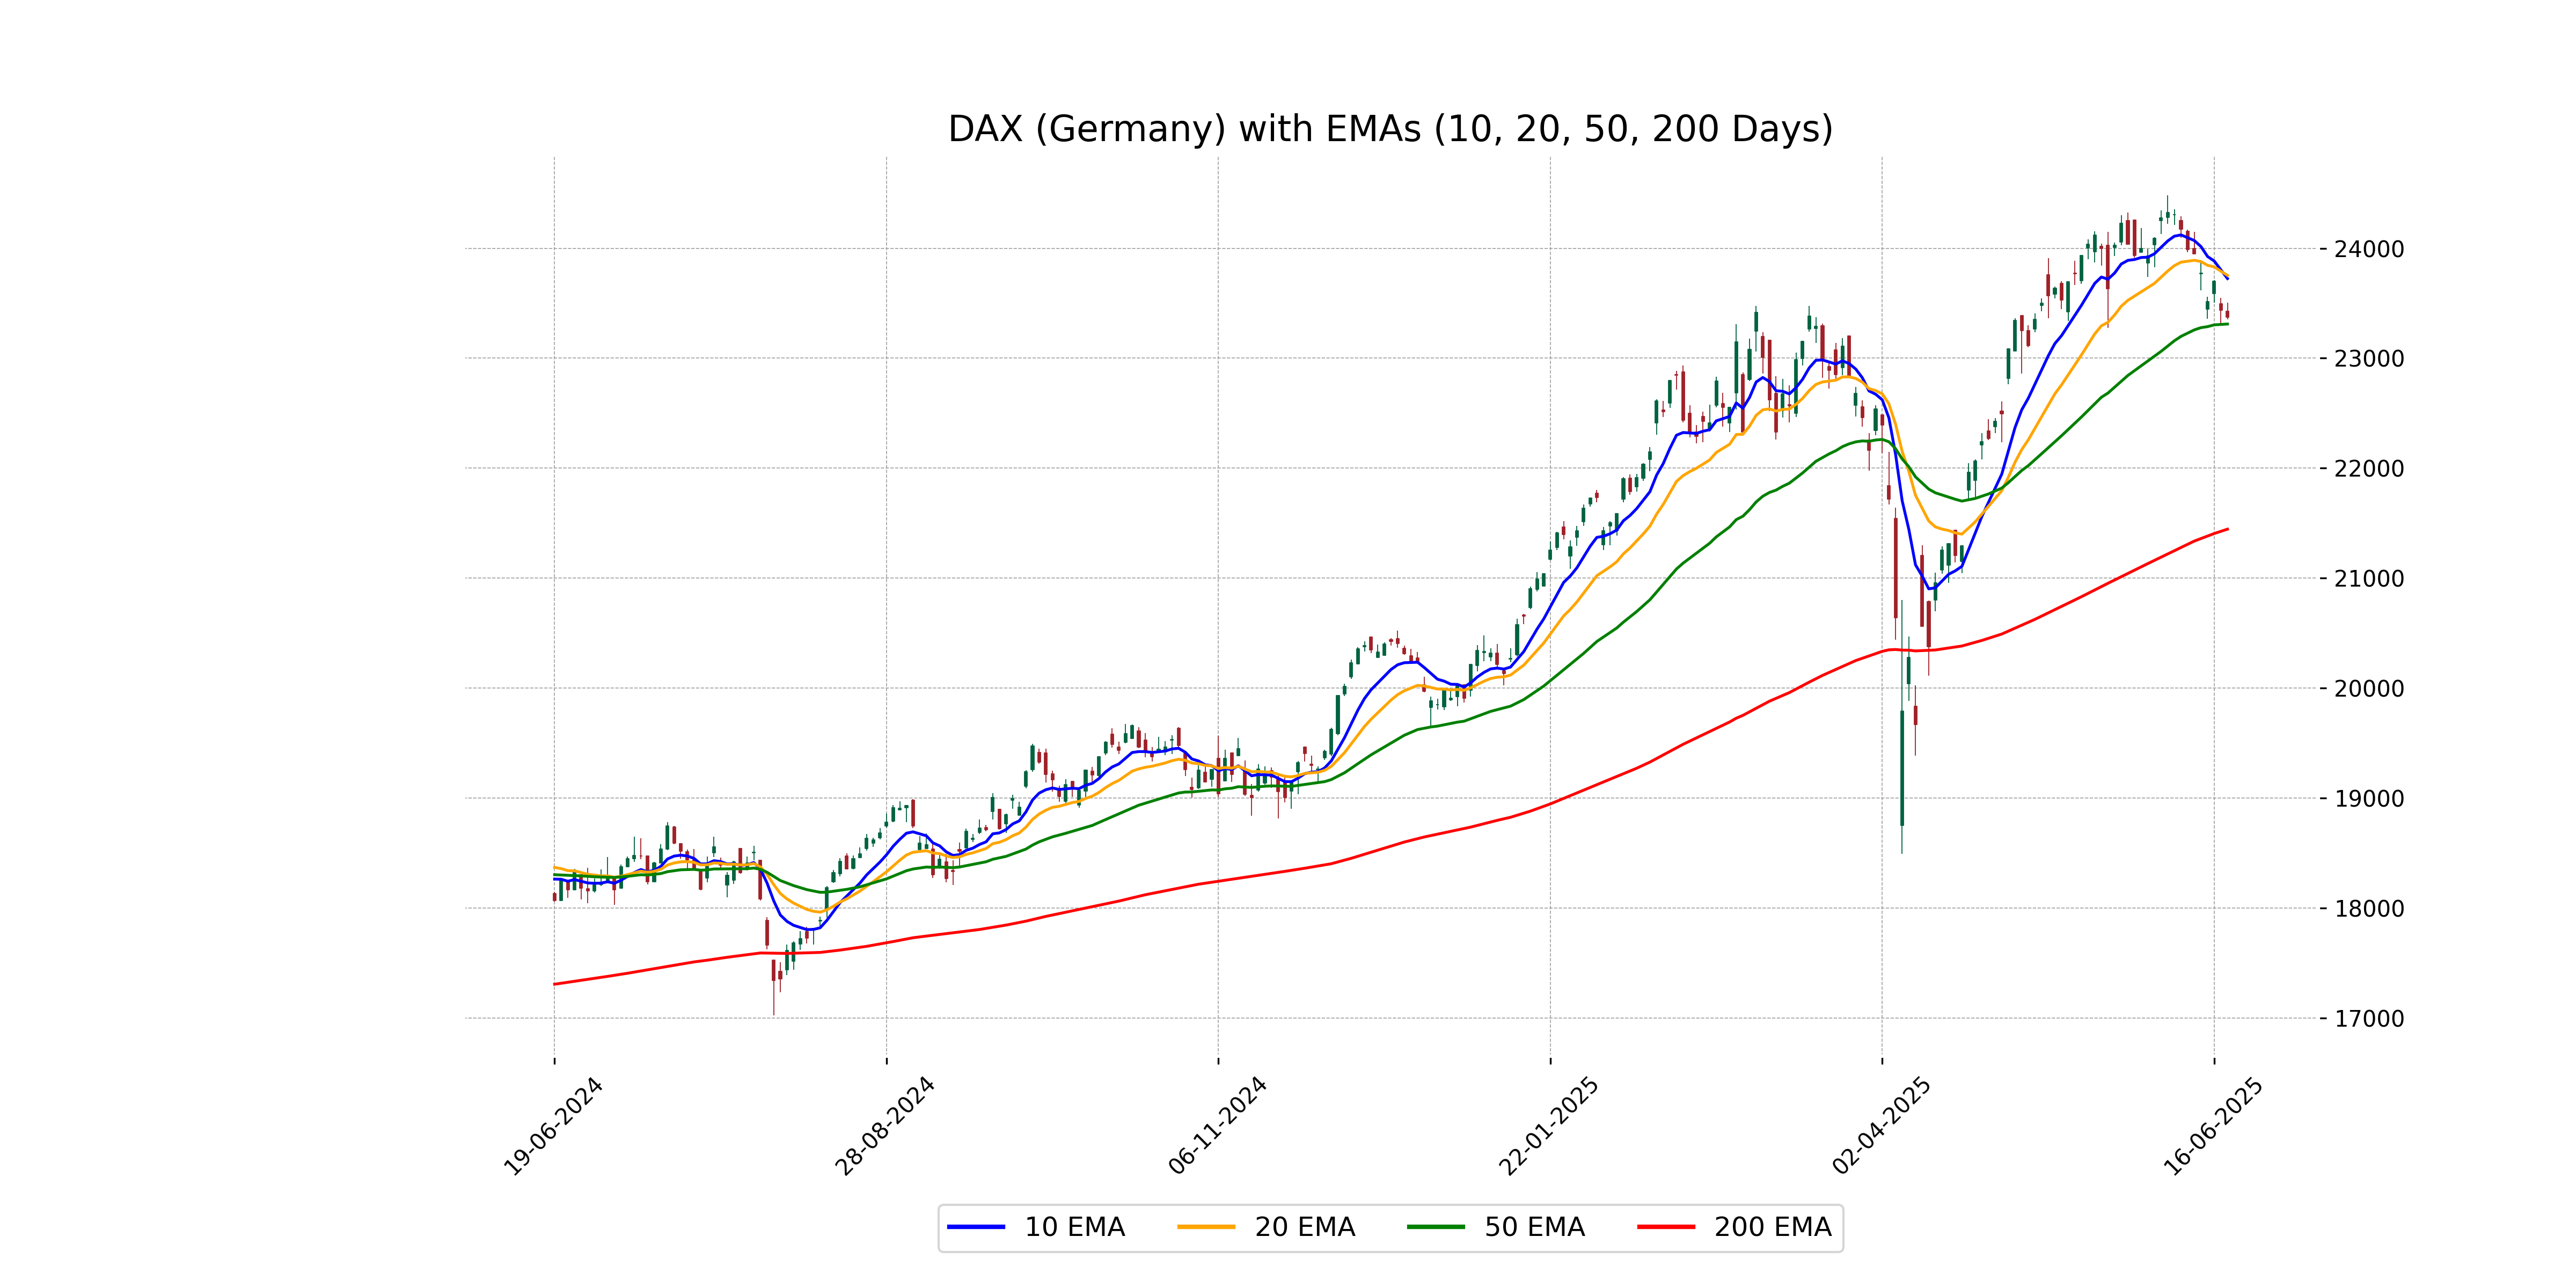
Relationship with Key Moving Averages
DAX opened and closed below its 10-day and 20-day EMAs, indicating a potential bearish trend in the short term. However, it remains above the 50-day EMA, suggesting some underlying support. The index's movement also highlights its proximity to these key moving averages, which could influence future direction.
Moving Averages Trend (MACD)
MACD Analysis for DAX (Germany): The MACD value of 71.06 is below the MACD Signal of 217.91, indicating bearish momentum. This suggests potential downward price movement and implies weakness in the current trend.
RSI Analysis
For the DAX (Germany), the RSI value is 43.05, indicating that the index is in a neutral zone, neither overbought nor oversold. Generally, an RSI below 30 suggests oversold conditions, while above 70 indicates overbought conditions. Therefore, the DAX is currently exhibiting a balanced momentum.
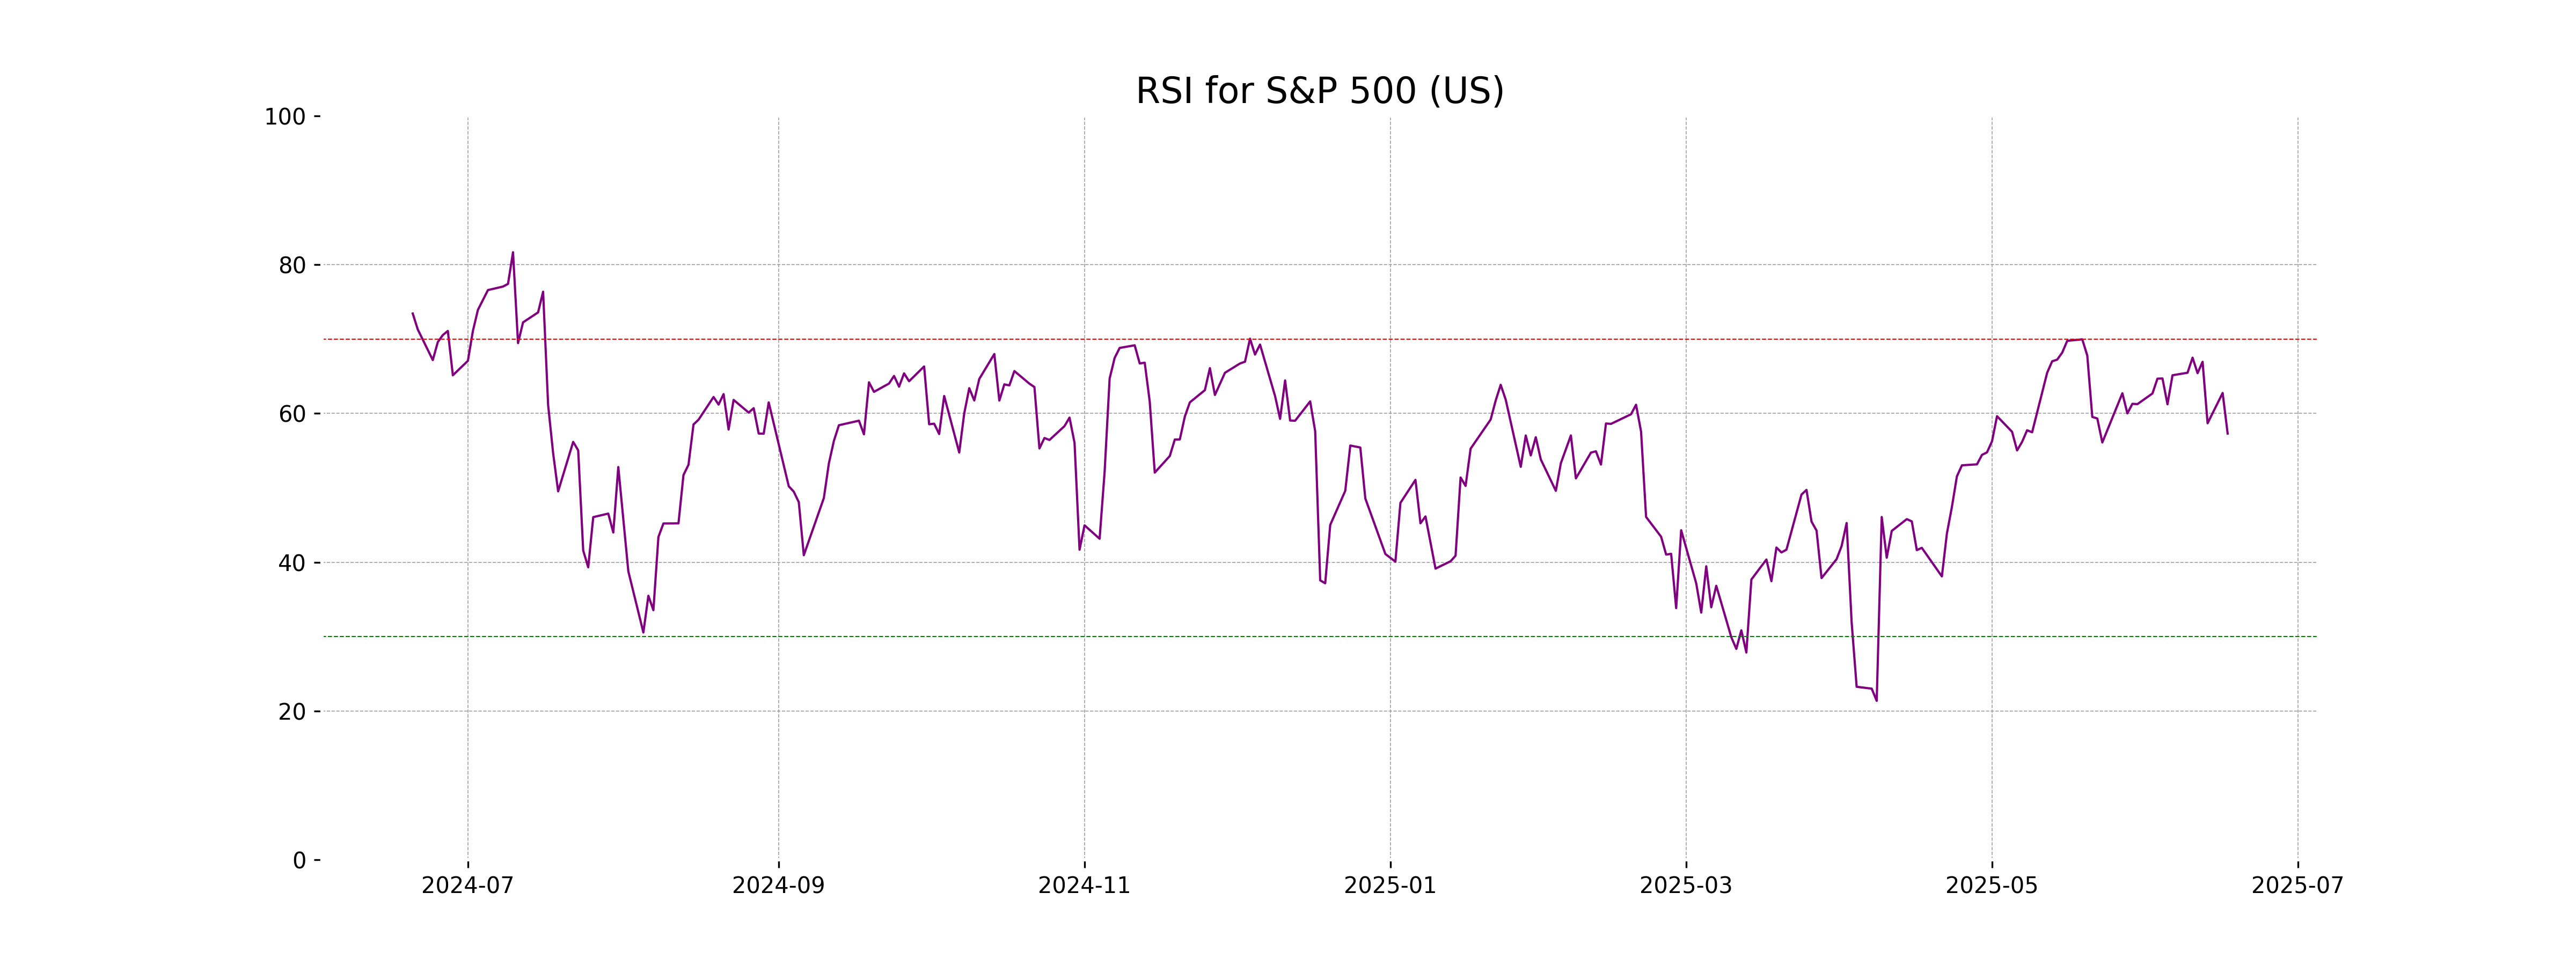
Analysis for S&P 500 (US) - June 18, 2025

The S&P 500 (US) had a closing value of 5982.72, which is a decrease of 0.84% from the previous close of 6033.11, with a points change of -50.39. The RSI is at 57.30, indicating neutral market conditions, and the MACD is below the signal line, suggesting a potential weakening momentum.
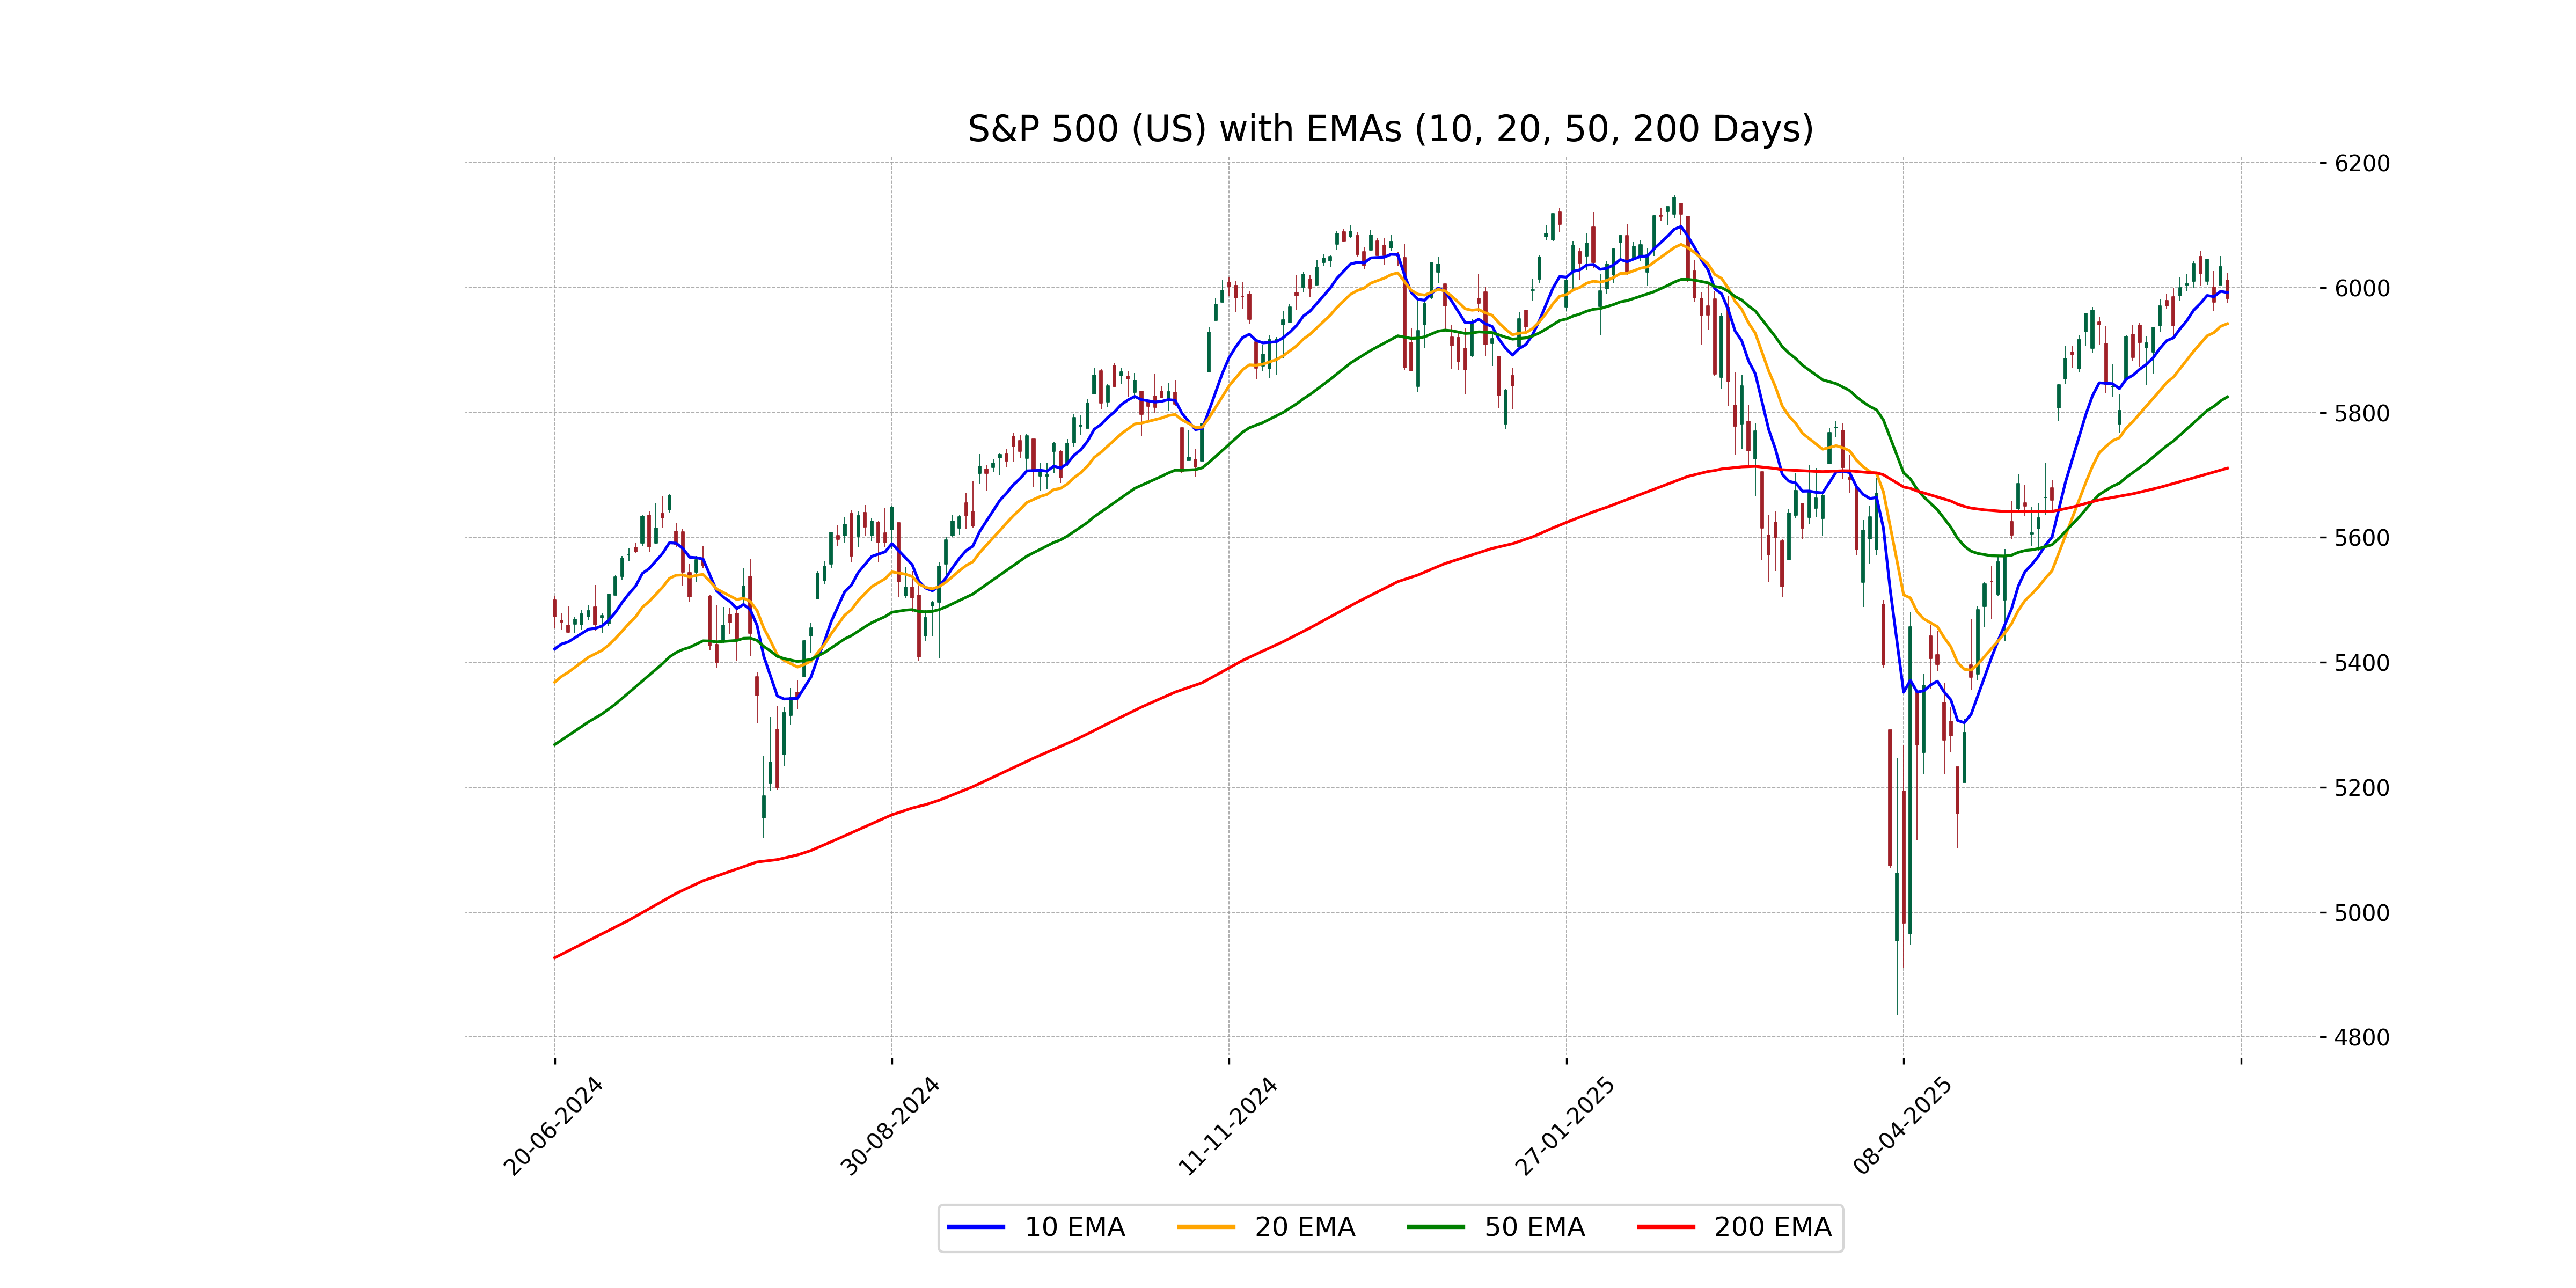
Relationship with Key Moving Averages
The S&P 500 is currently trading below its 10 EMA (5992.06) and above both its 50 EMA (5825.07) and 200 EMA (5710.85). This indicates a short-term bearish trend with prices under the 10 EMA, but a bullish trend is suggested in the medium and long term as it remains above the 50 and 200 EMAs.
Moving Averages Trend (MACD)
The MACD for the S&P 500 is 74.55, which is below the MACD Signal of 84.00, indicating a current bearish trend. The crossover suggests potential short-term selling pressure as the MACD line is below the signal line.
RSI Analysis
The Relative Strength Index (RSI) for S&P 500 (US) is 57.30, suggesting a relatively neutral market momentum. This value indicates that the index is neither overbought nor oversold, signaling a potential stable trading environment.
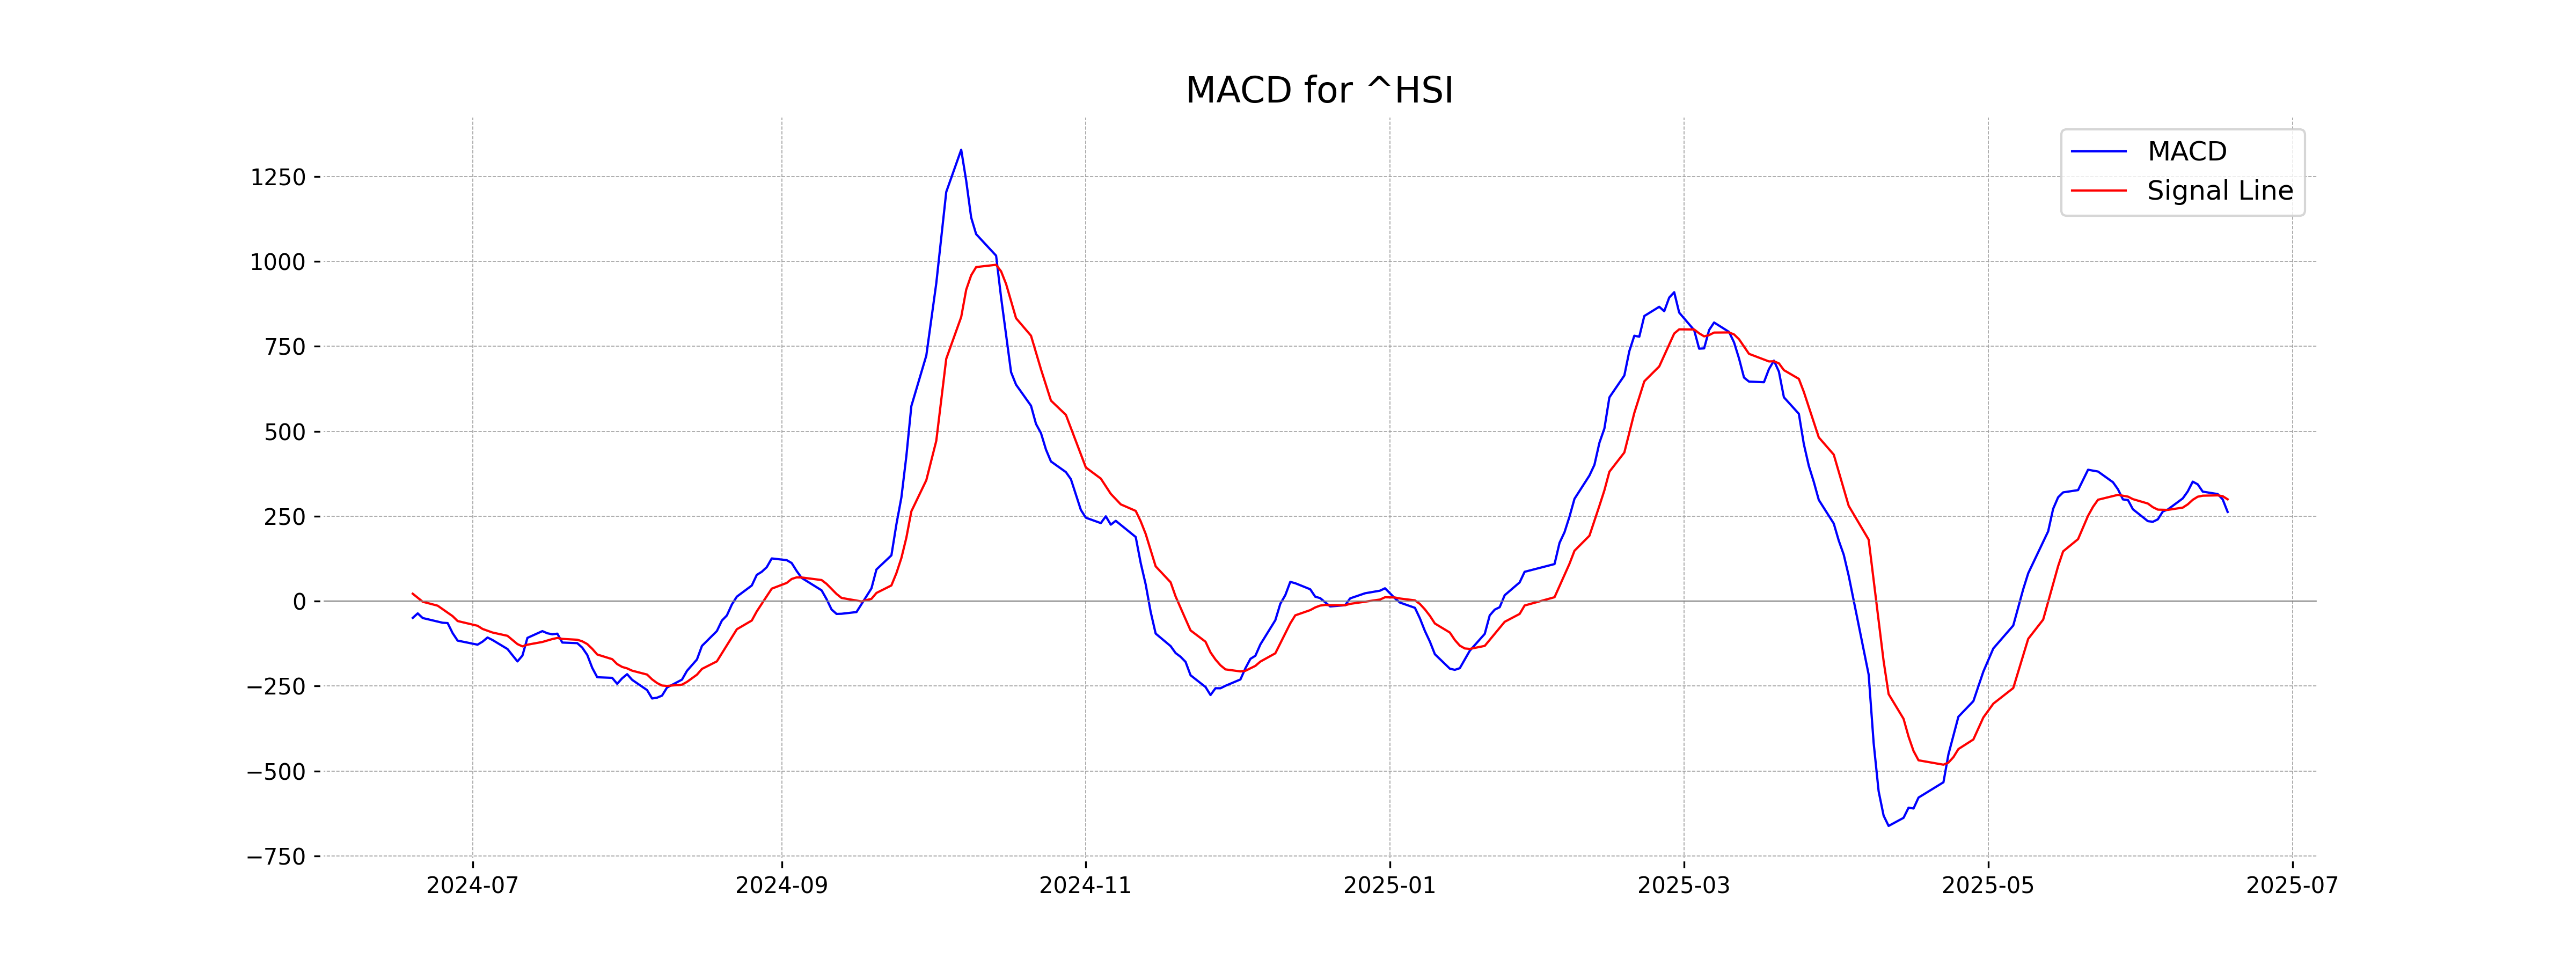
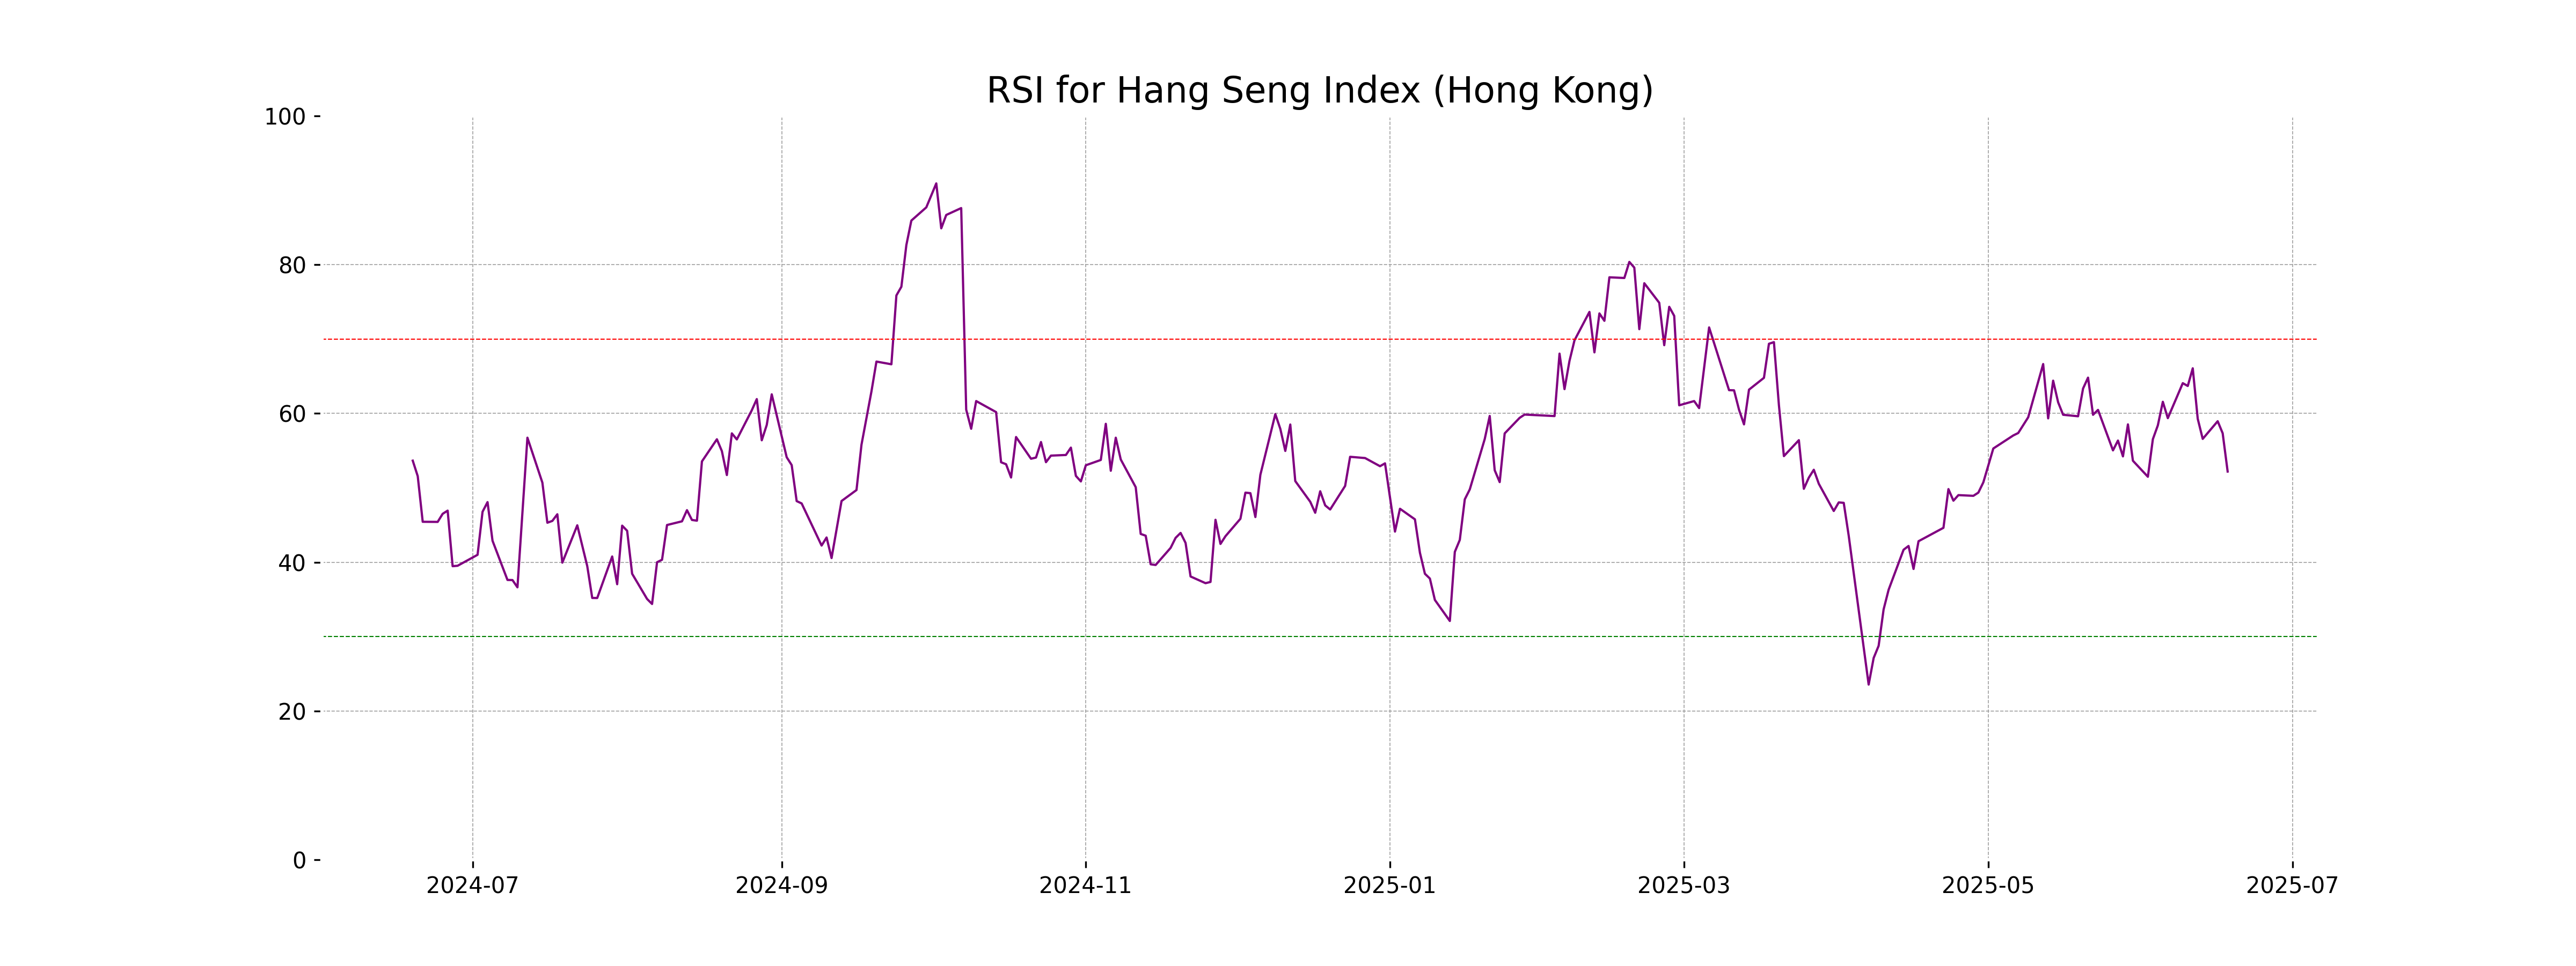
Analysis for Hang Seng Index (Hong Kong) - June 18, 2025
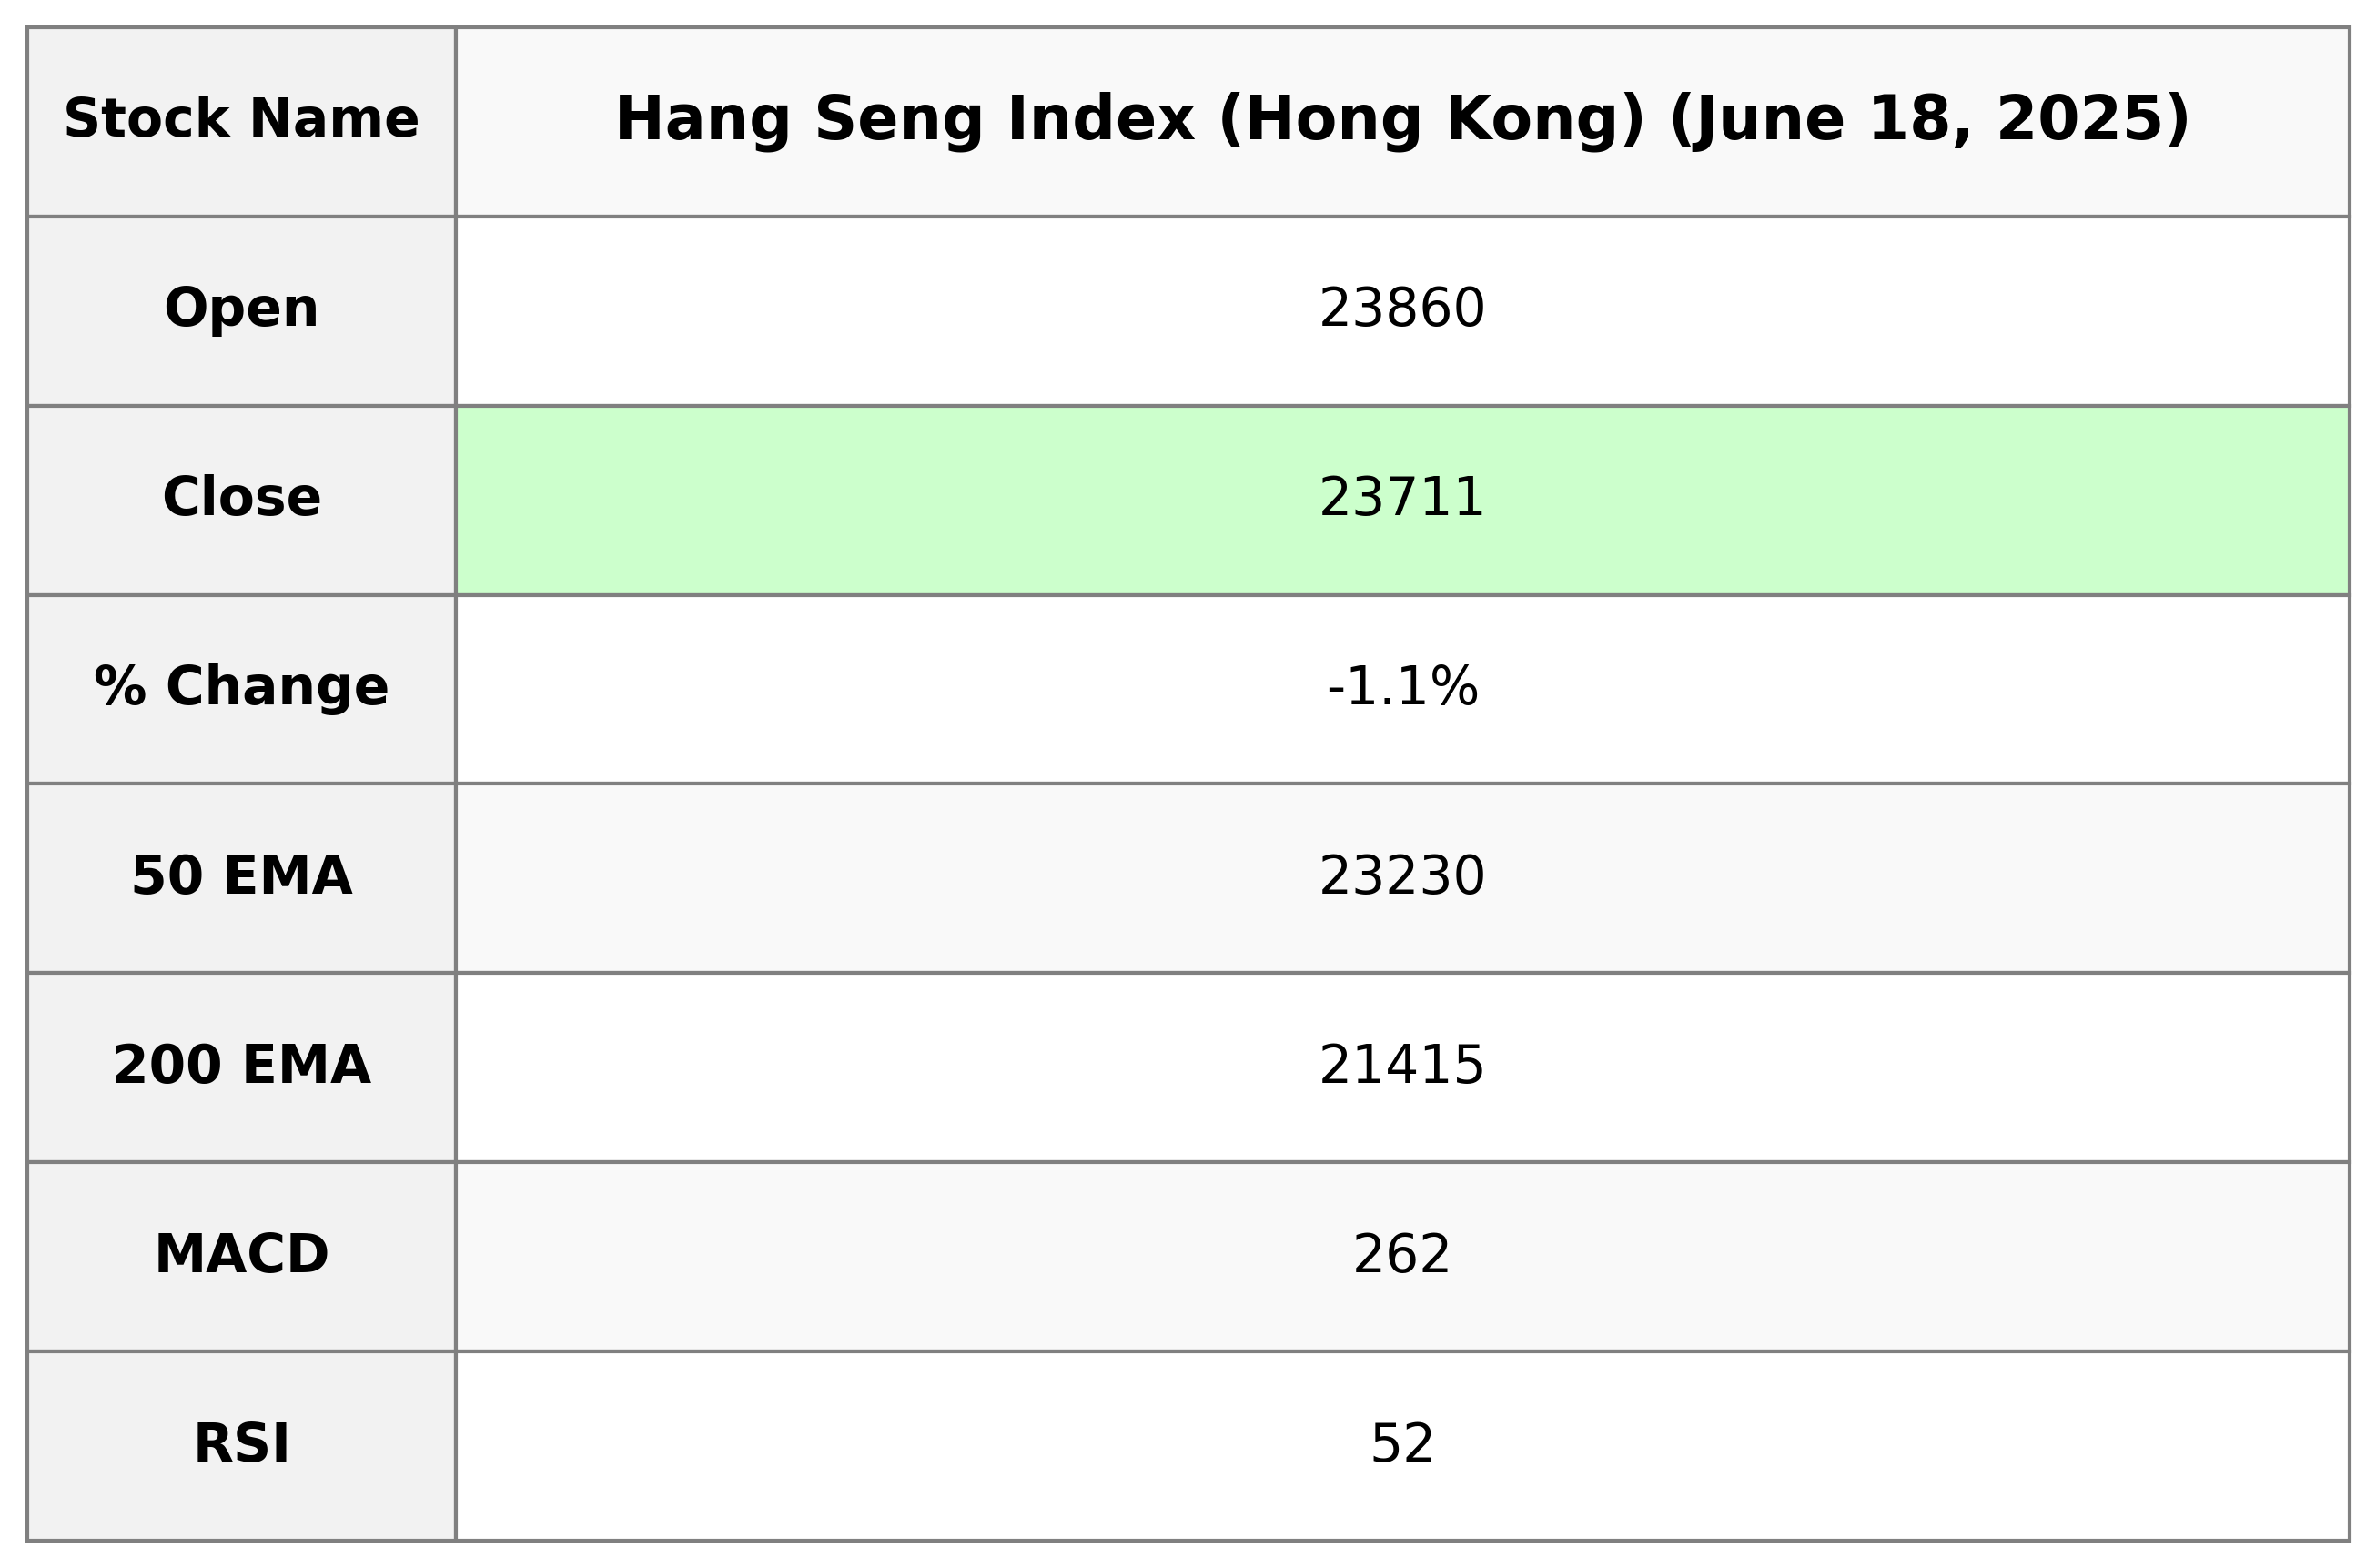
The Hang Seng Index opened at 23,859.55 and closed at 23,710.69, marking a decrease with a percentage change of -1.12% and a points change of -269.61. The index's 50-day EMA stands at 23,229.79, with a current RSI of 52.19, indicating a neutral momentum.
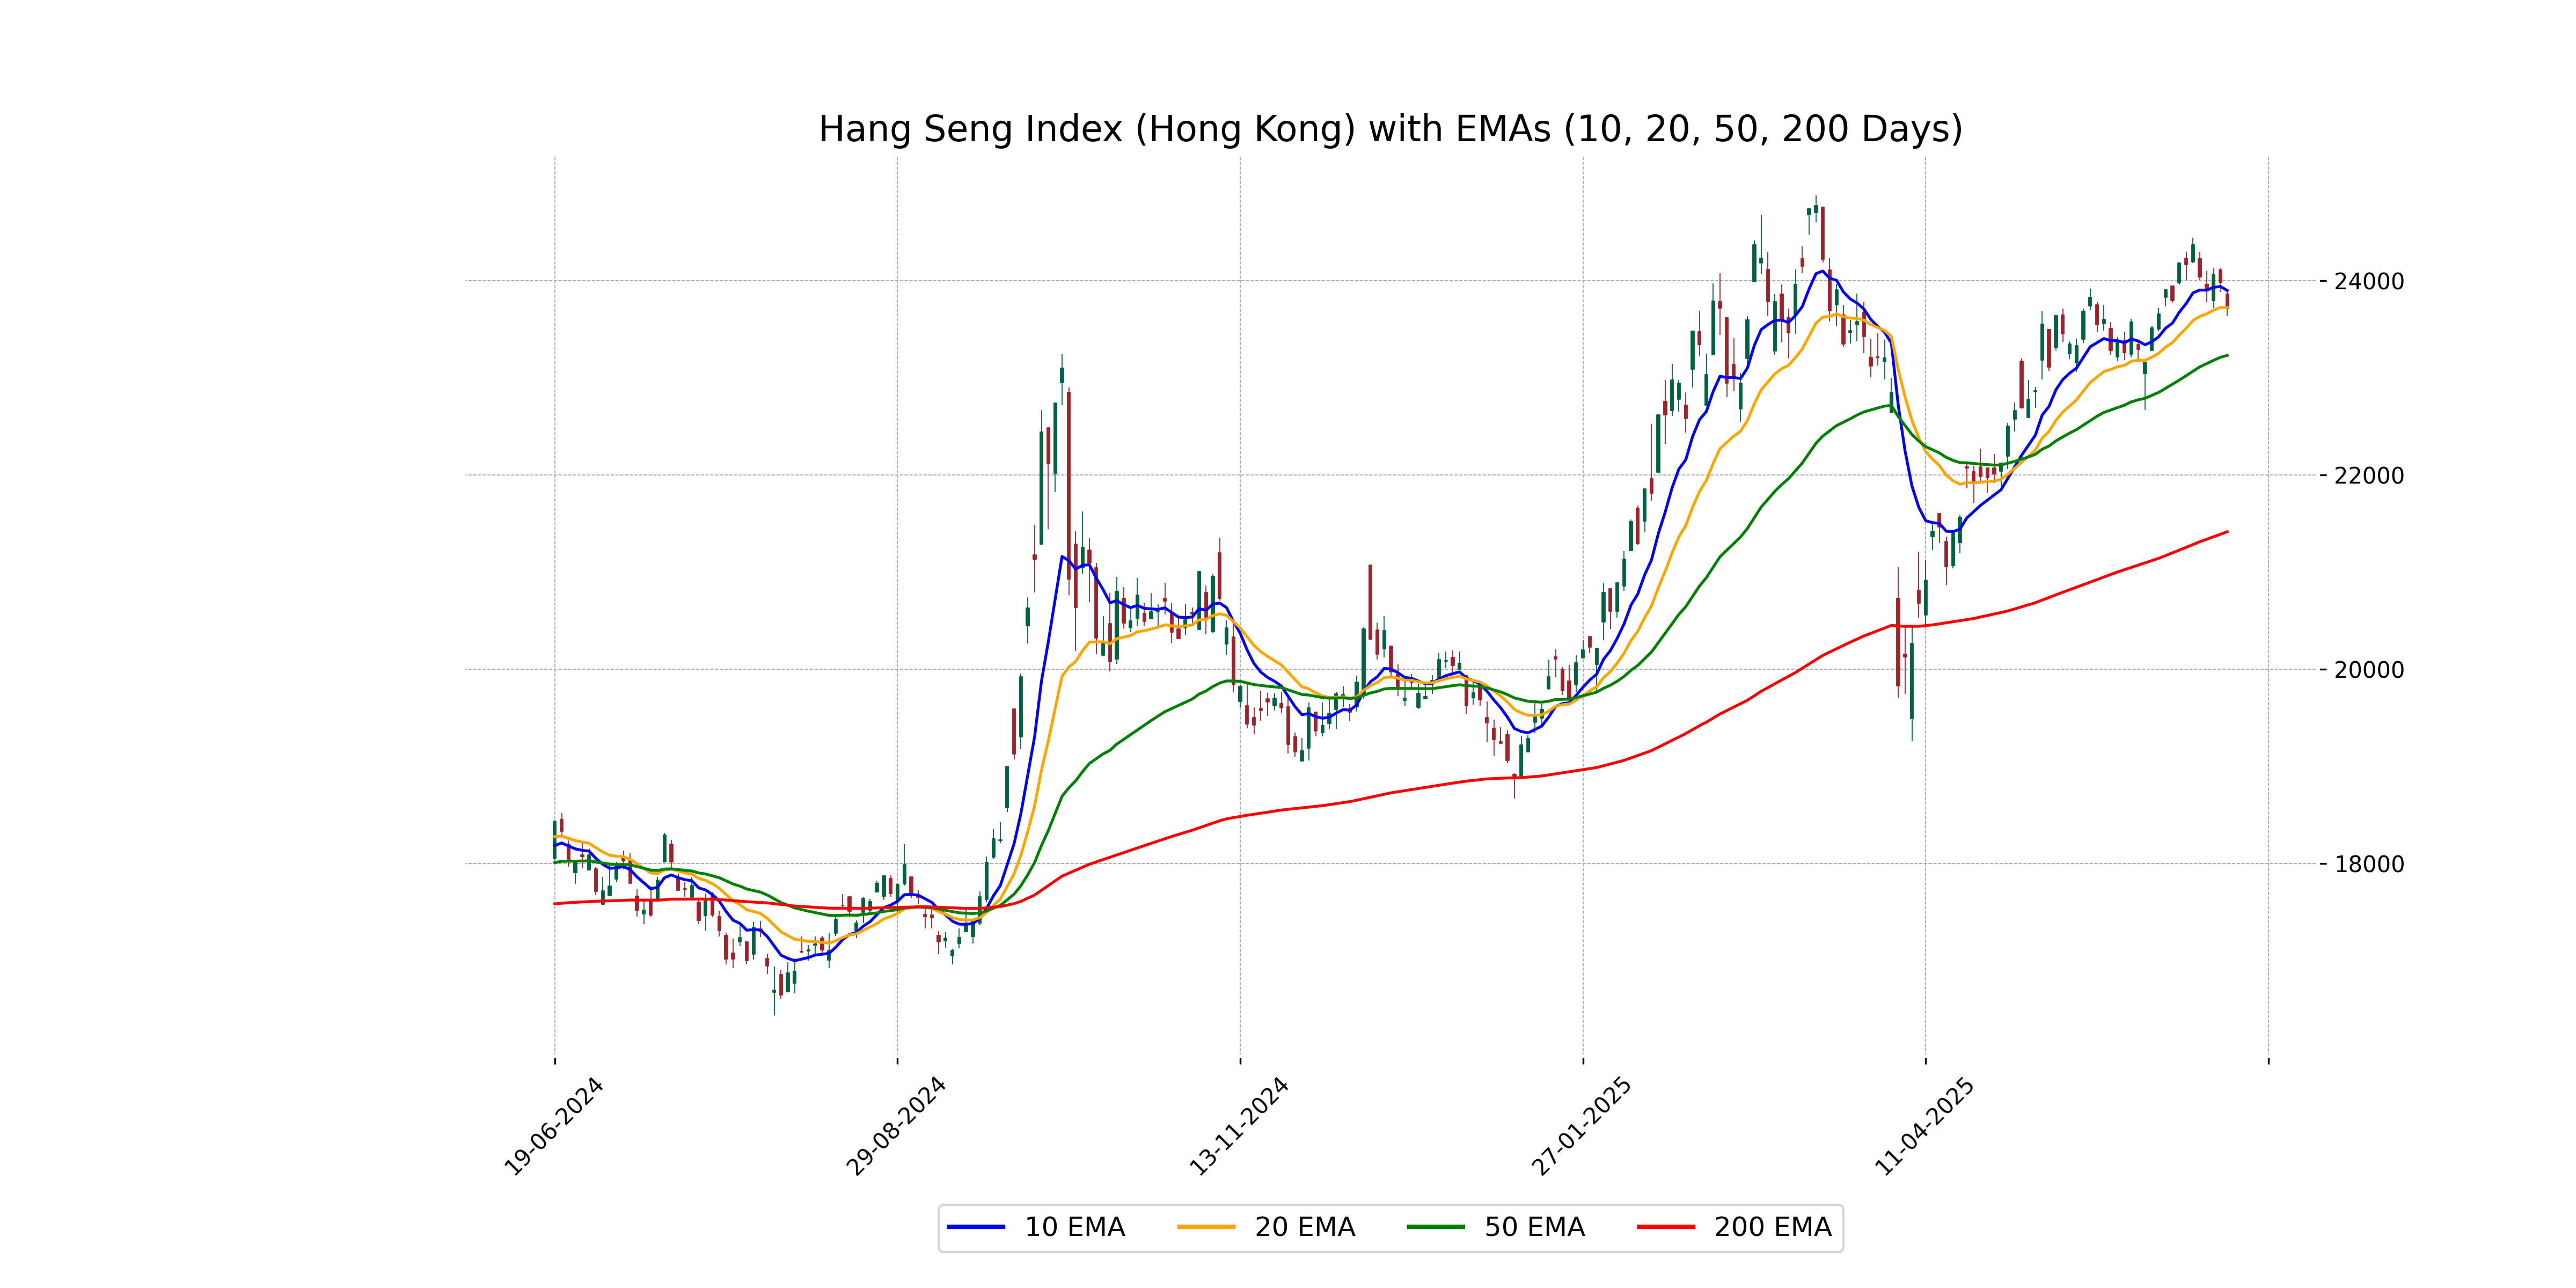
Relationship with Key Moving Averages
The Hang Seng Index closed at 23,710.69, which is below its 10 EMA of 23,897.40 and slightly below its 20 EMA of 23,721.28. It remains above the 50 EMA of 23,229.79 and significantly above the 200 EMA of 21,414.95, indicating a mixed trend with short-term pressures but longer-term support.
Moving Averages Trend (MACD)
The MACD for Hang Seng Index (Hong Kong) is 262.41, with the MACD Signal at 299.61. Since the MACD is below the signal line, this could indicate a potential bearish trend or a possible continuation of the current downtrend.
RSI Analysis
RSI Analysis for Hang Seng Index (Hong Kong): The Relative Strength Index (RSI) for the Hang Seng Index is currently at 52.19, indicating a neutral state as it hovers around the midpoint of the typical RSI range (30 to 70). This suggests there's neither significant overbought nor oversold pressure in the market at present.
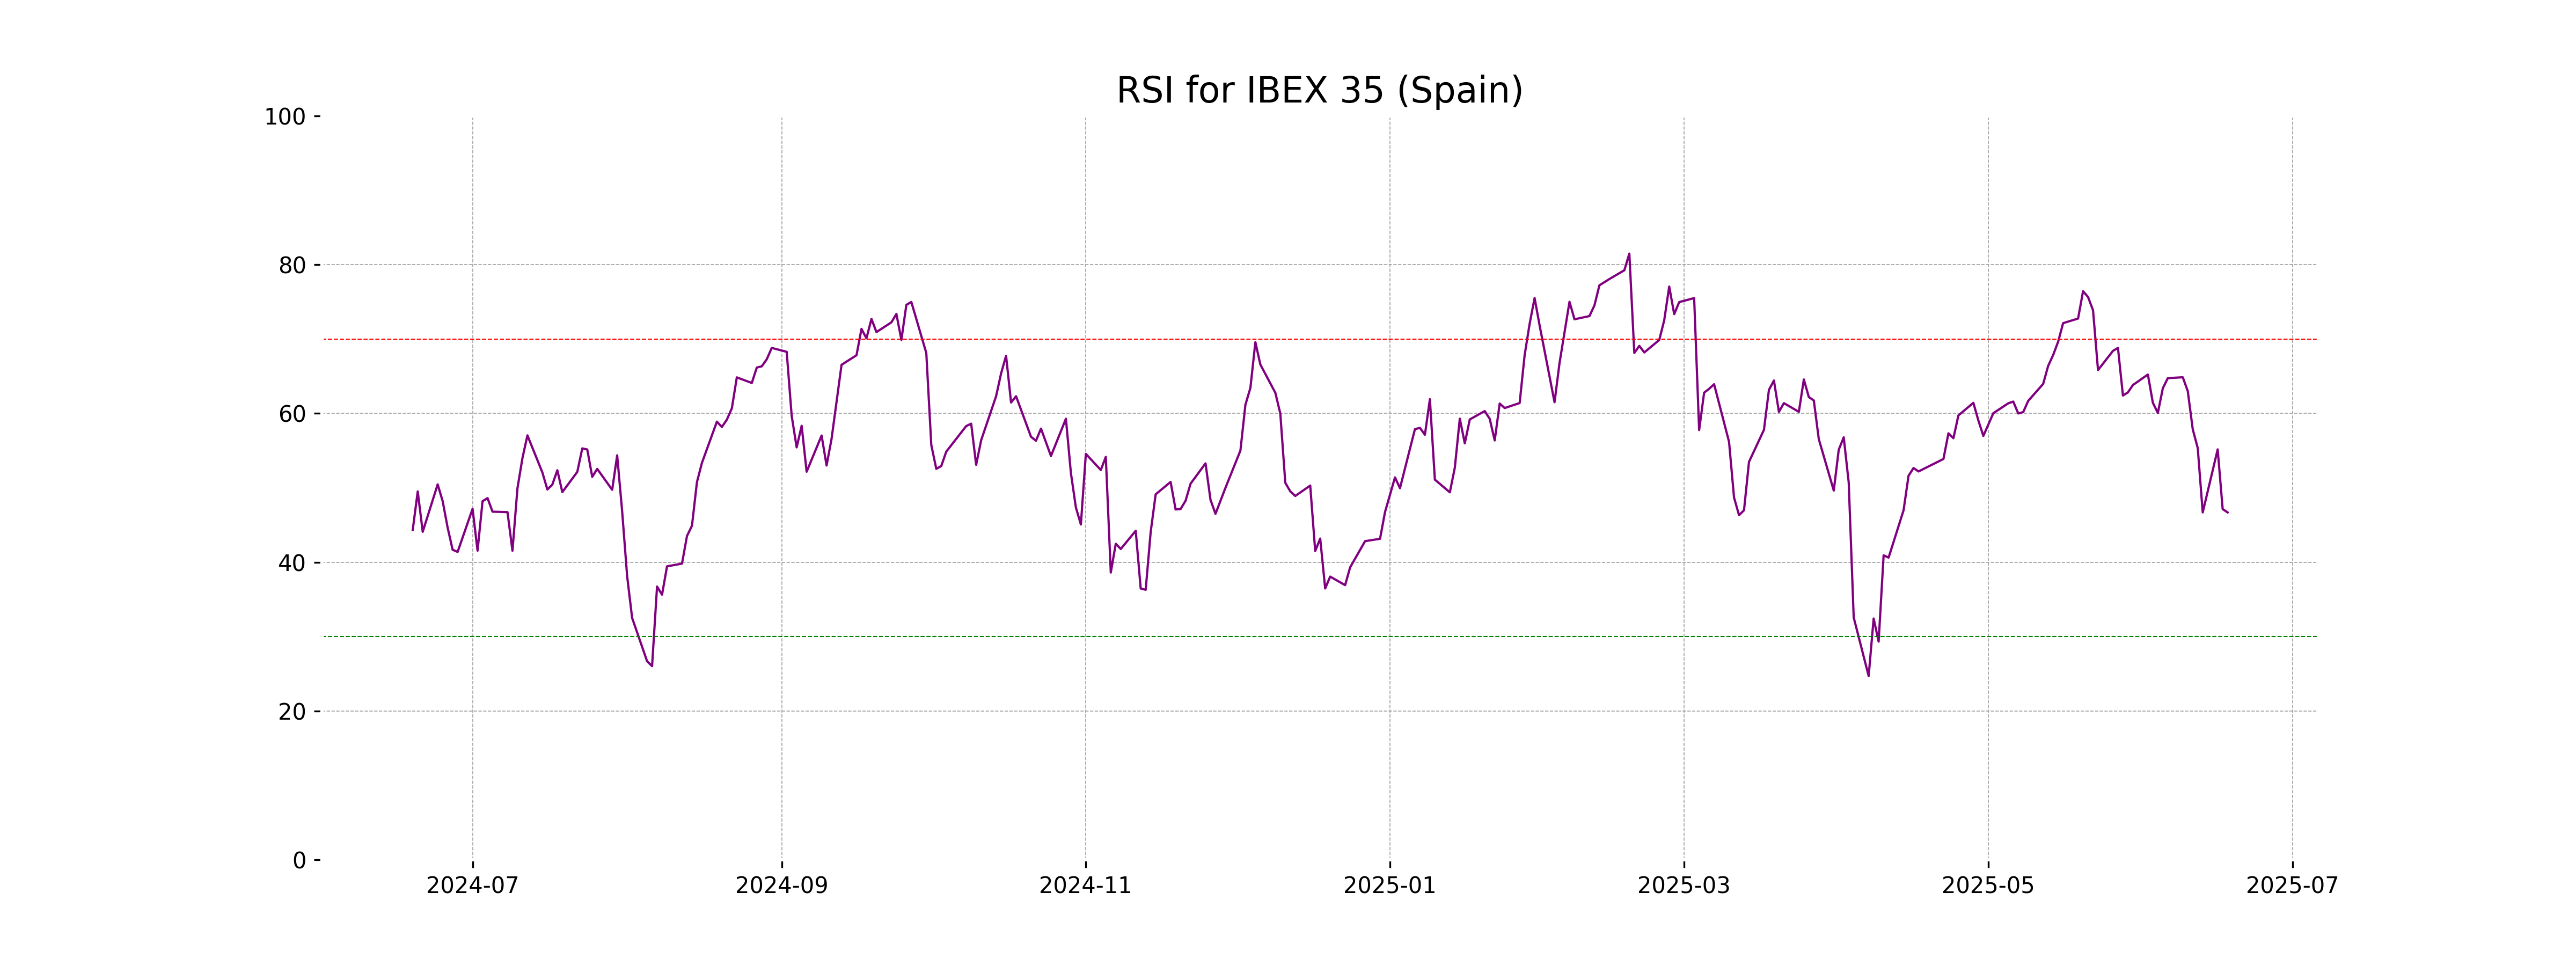
Analysis for IBEX 35 (Spain) - June 18, 2025
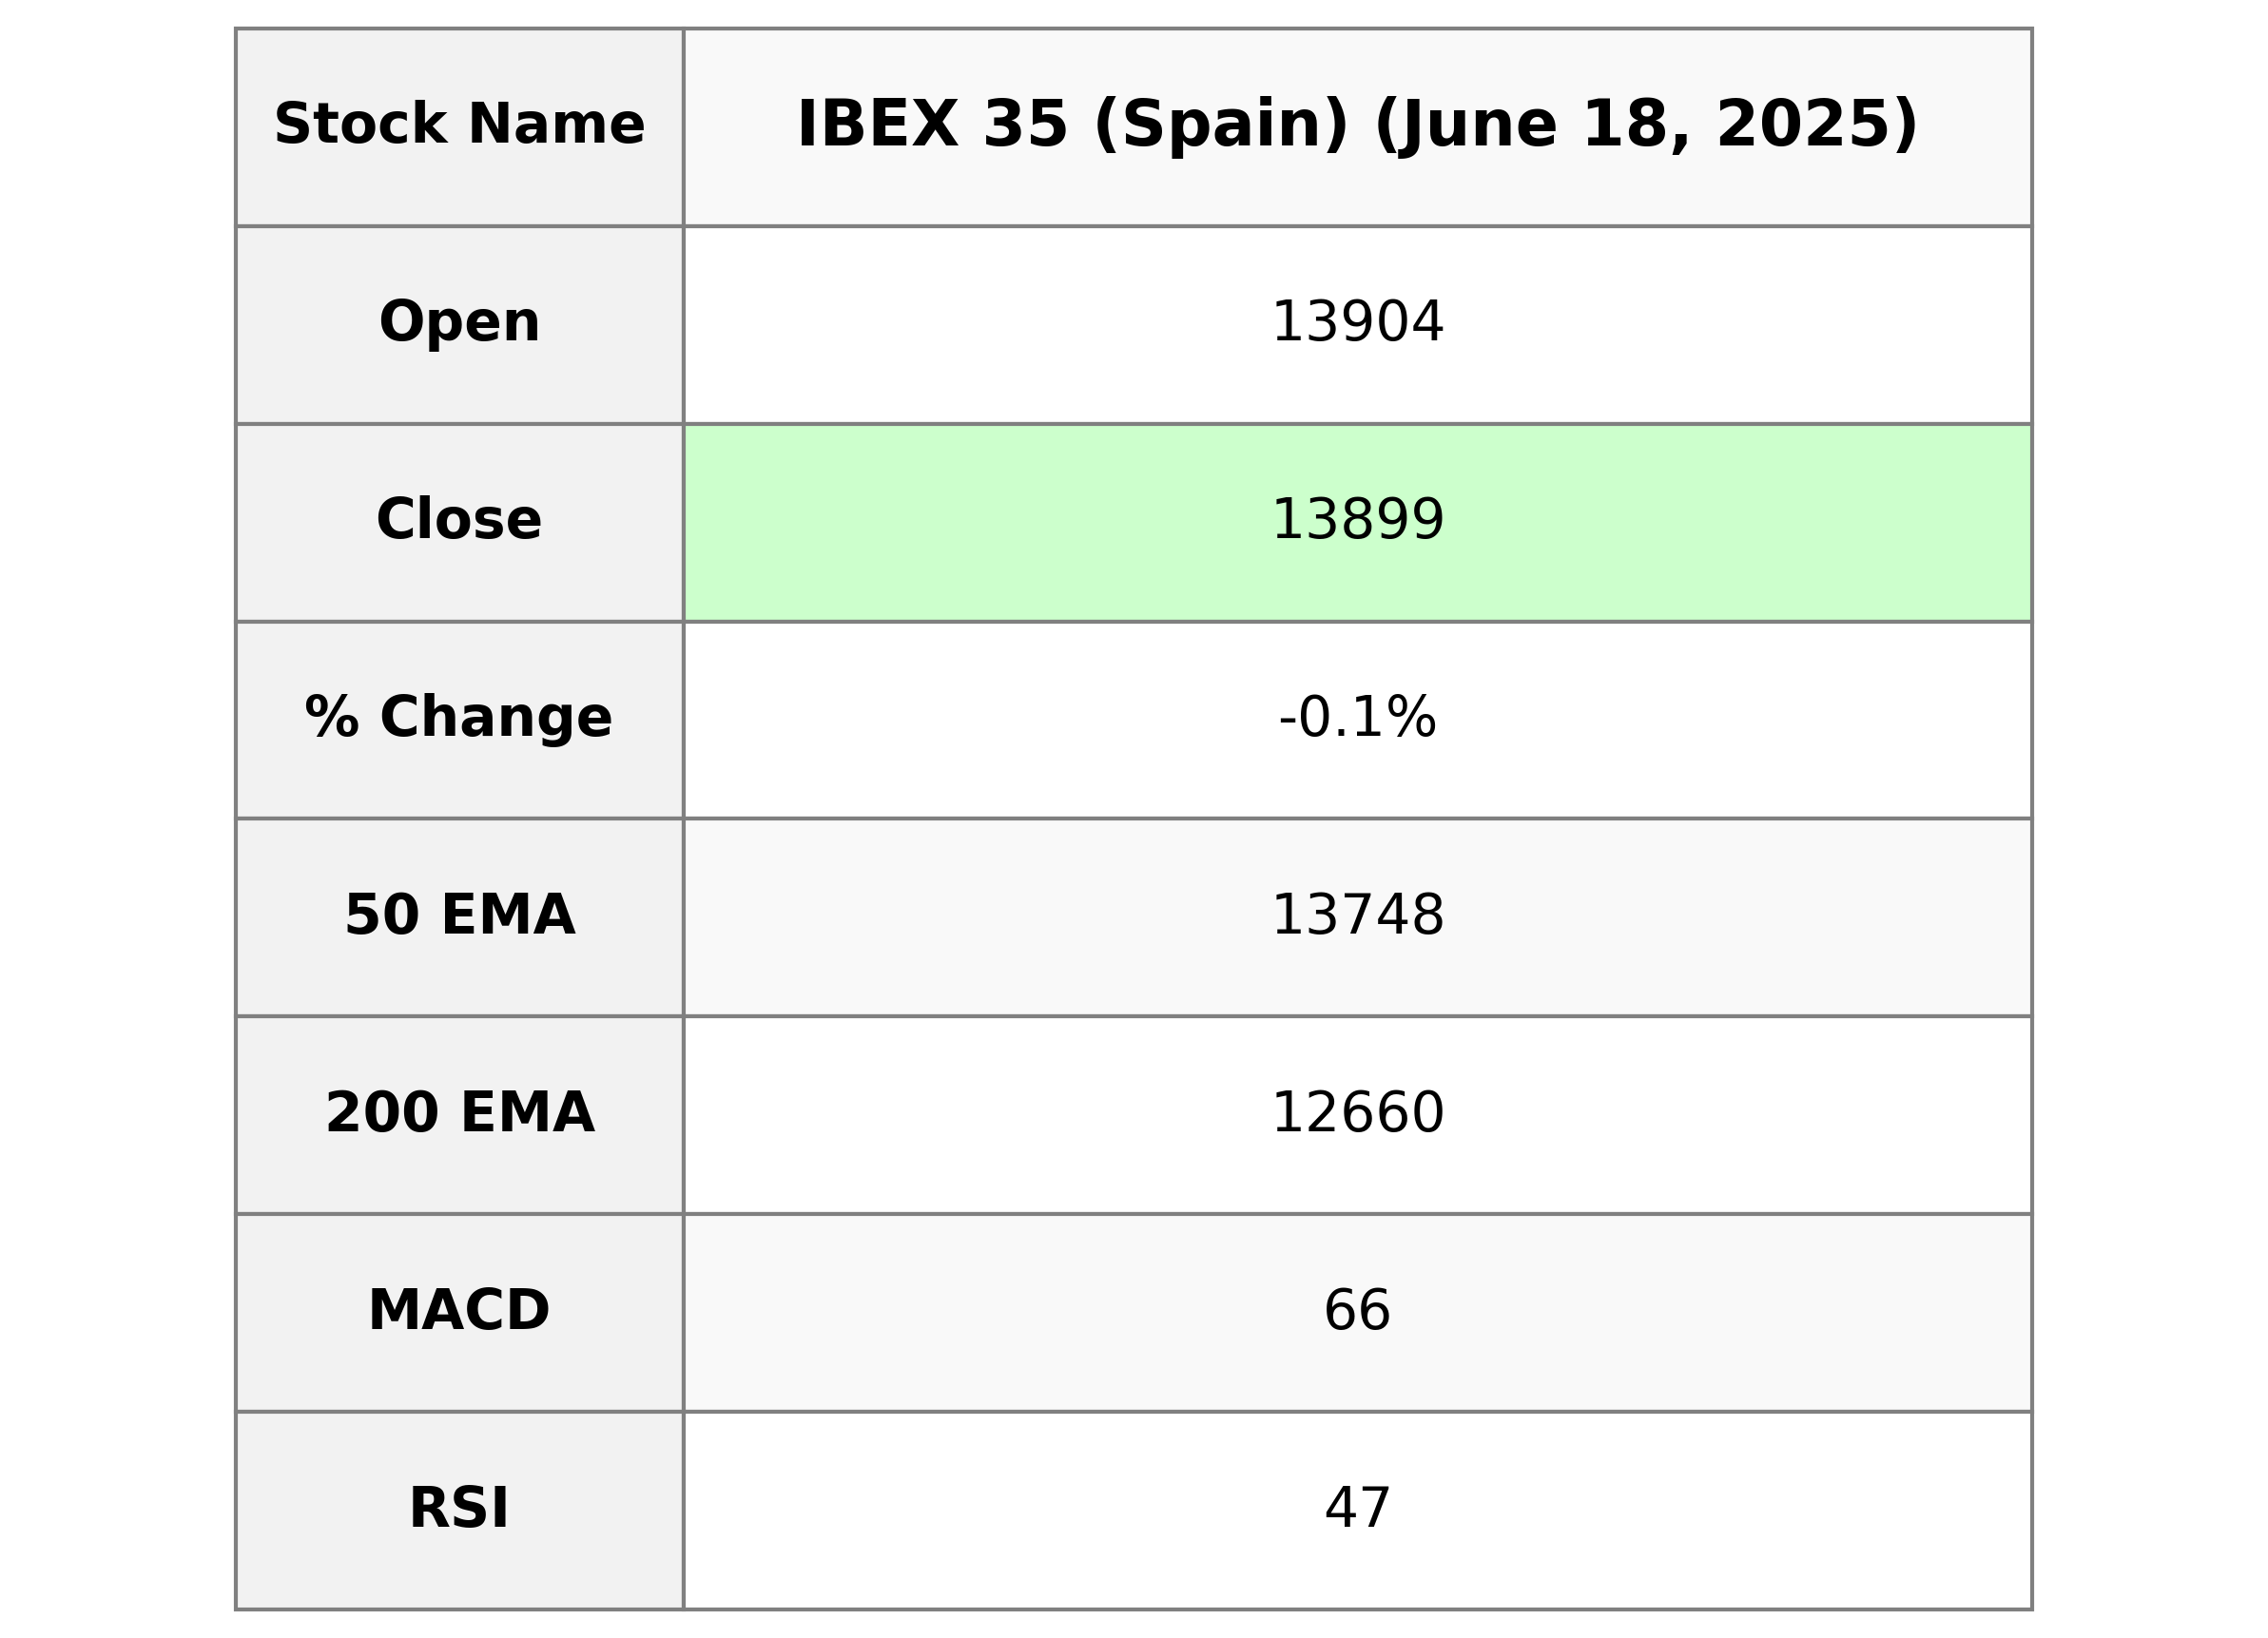
The IBEX 35 index opened at 13,903.90 and closed slightly lower at 13,899.30, marking a minor decline of 0.09% with a decrease of 12.40 points. The Relative Strength Index (RSI) indicates a neutral momentum at 46.69, while the MACD suggests bearish sentiment, as it is below its signal line. The volume was recorded at 22,597,473.
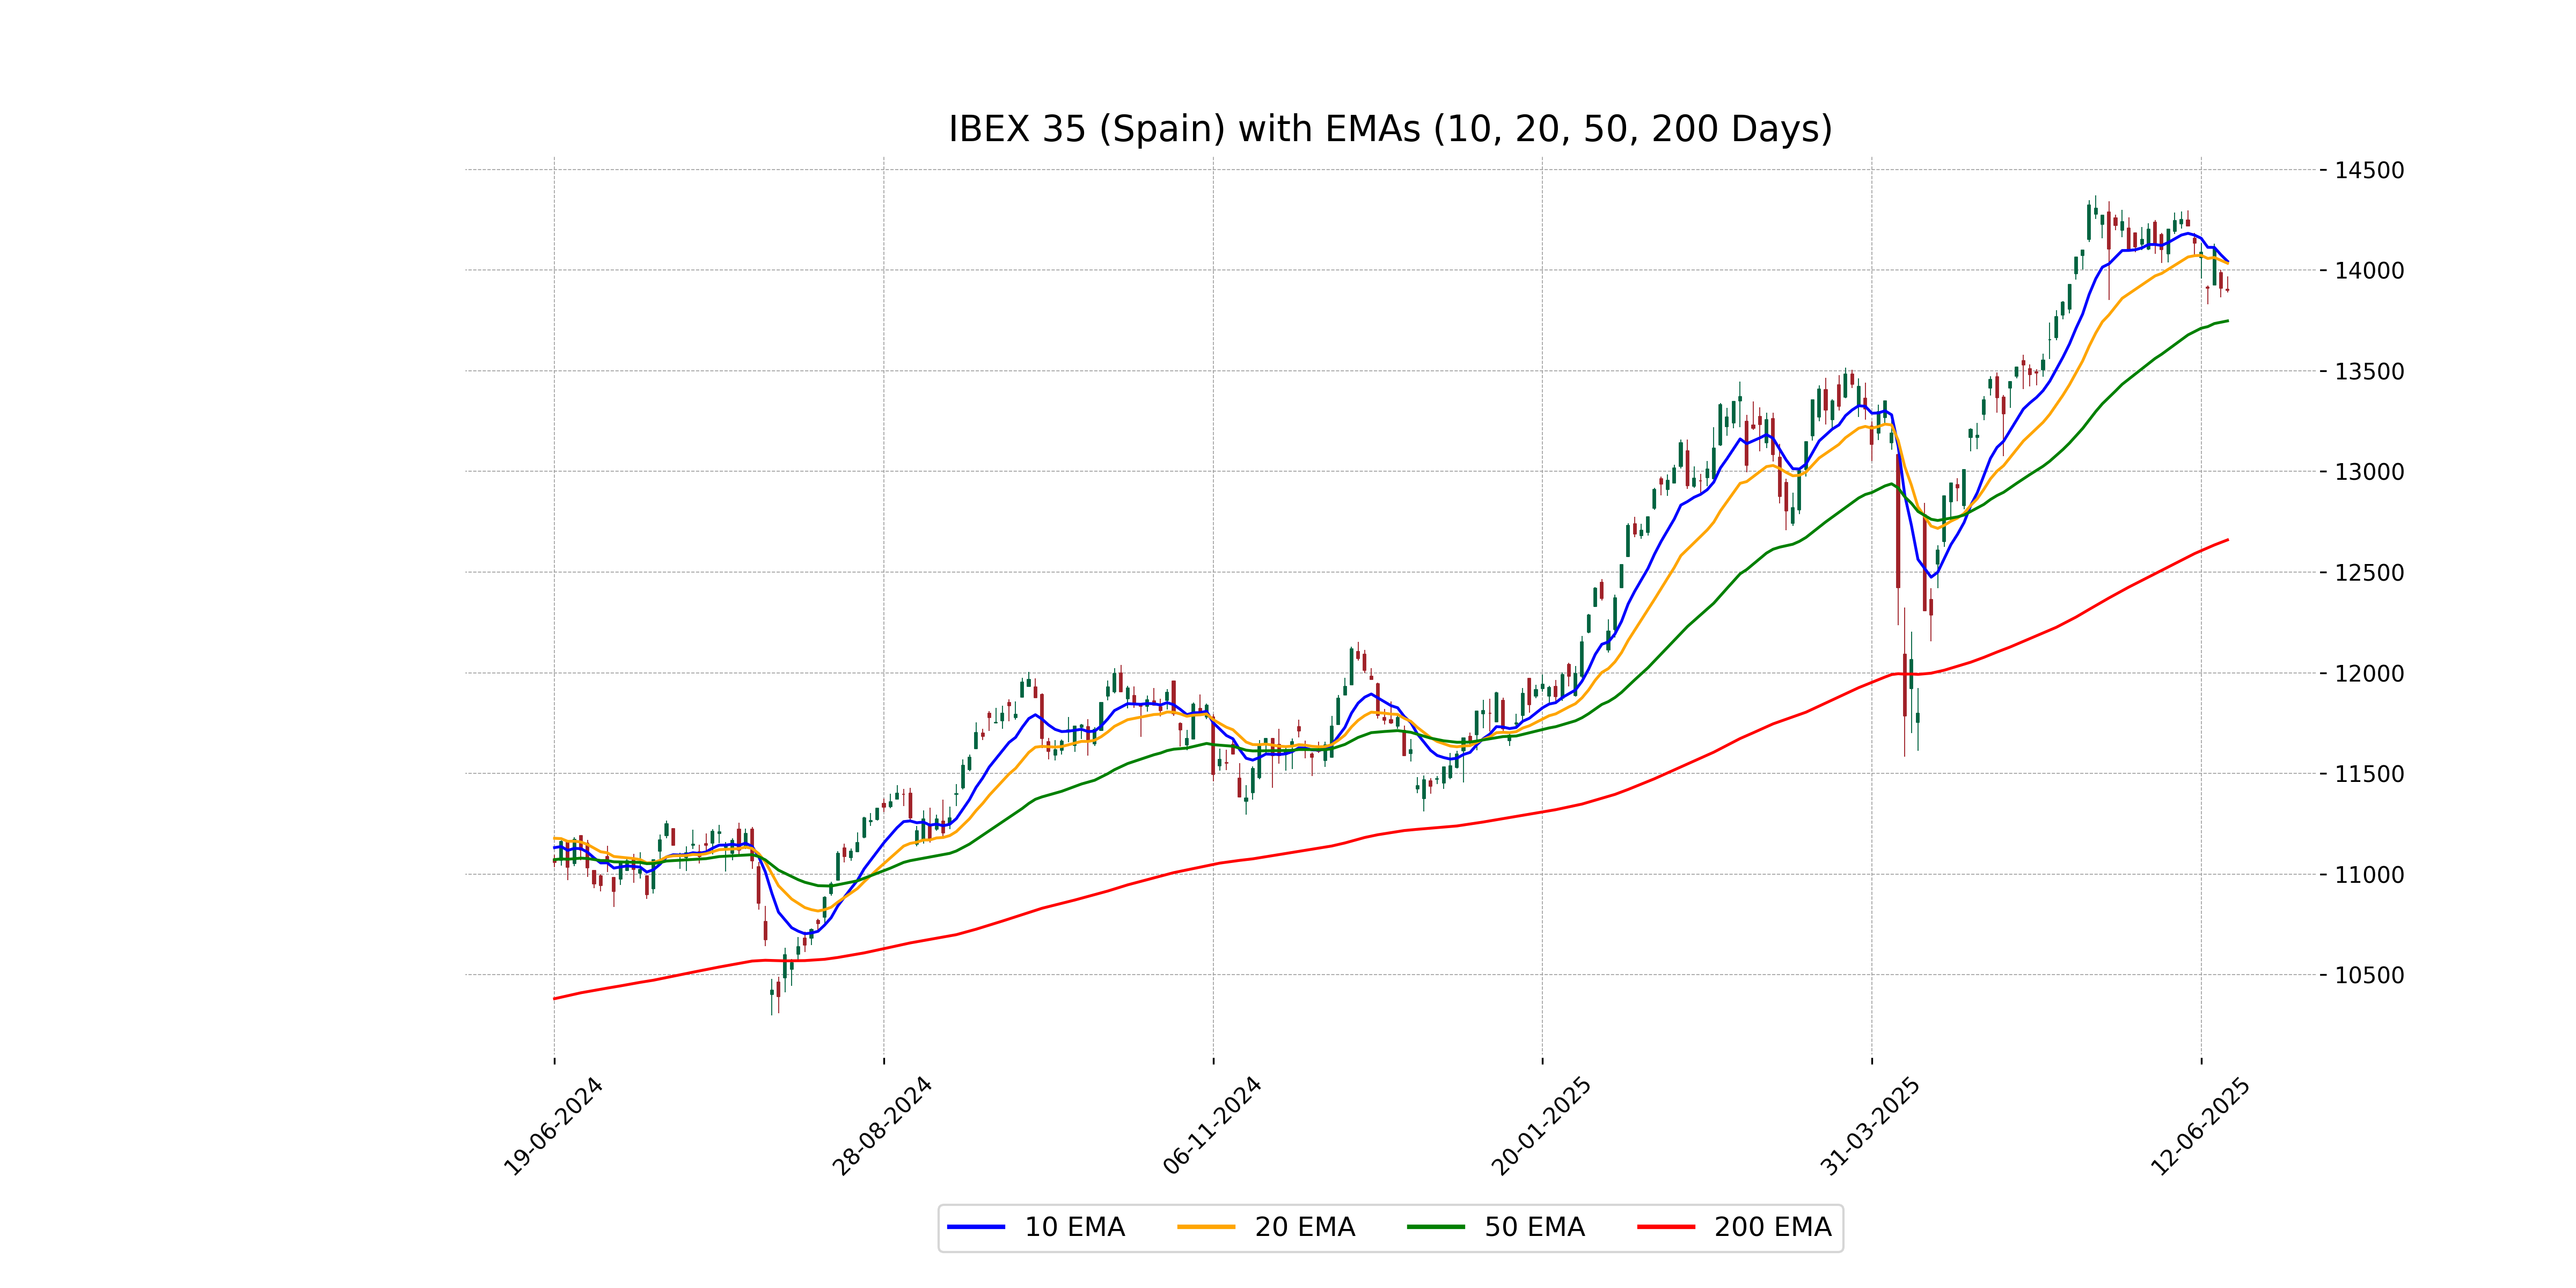
Relationship with Key Moving Averages
The IBEX 35's current close of 13,899.30 is below its 10-day EMA of 14,044.23 and 20-day EMA of 14,034.52, suggesting a short-term bearish trend. However, it remains above the 50-day EMA of 13,747.96, indicating potential long-term support.
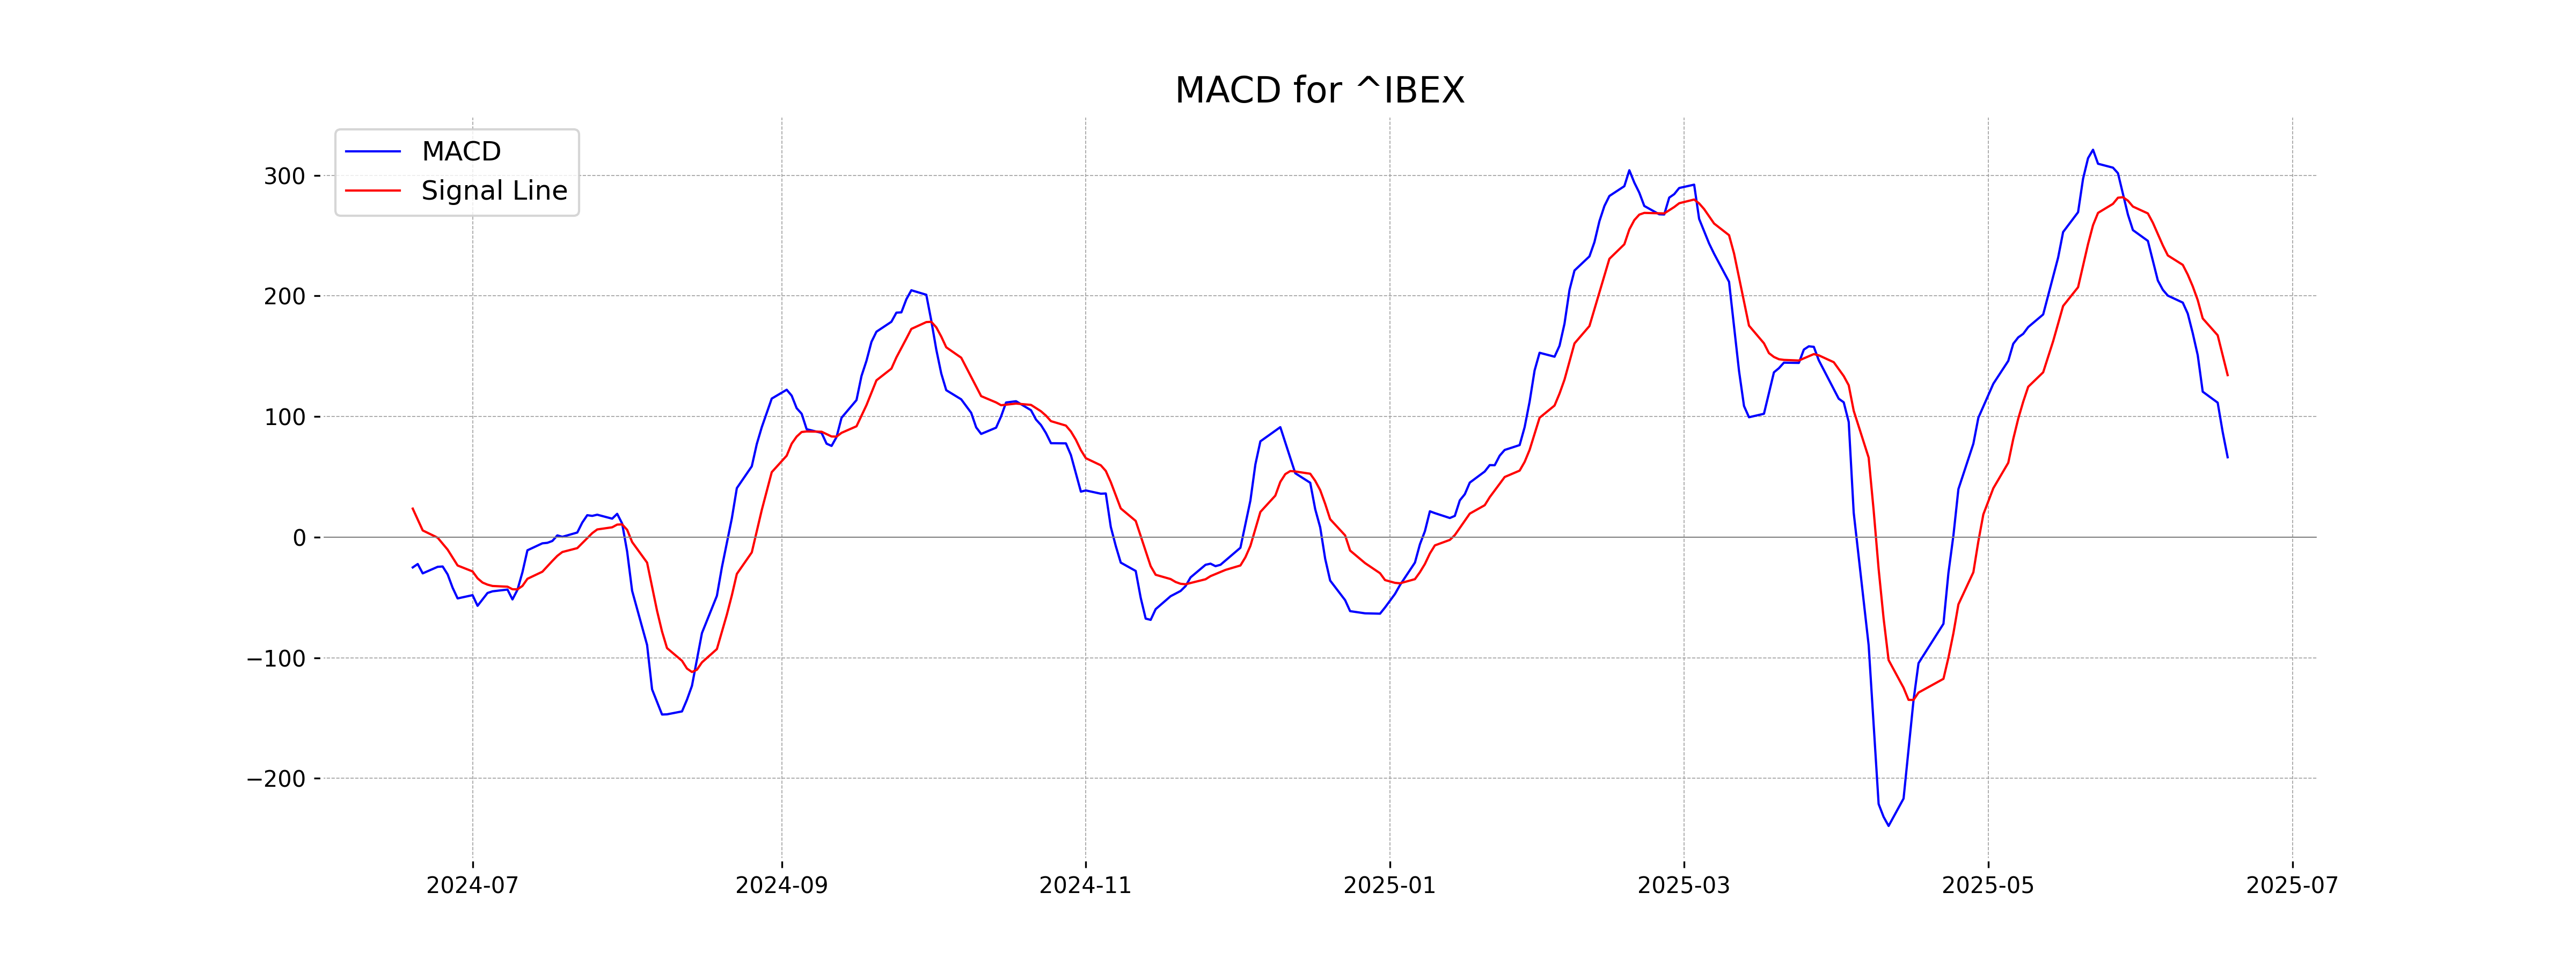
Moving Averages Trend (MACD)
The MACD for the IBEX 35 is 66.20, which is below its MACD Signal line at 134.29. This indicates a potential bearish trend since the MACD is decreasing relative to the signal line.
RSI Analysis
The RSI value for IBEX 35 is 46.69, which suggests that the index is currently neither overbought nor oversold. It is in a neutral zone, indicating that there are no strong bullish or bearish trends based on RSI analysis.
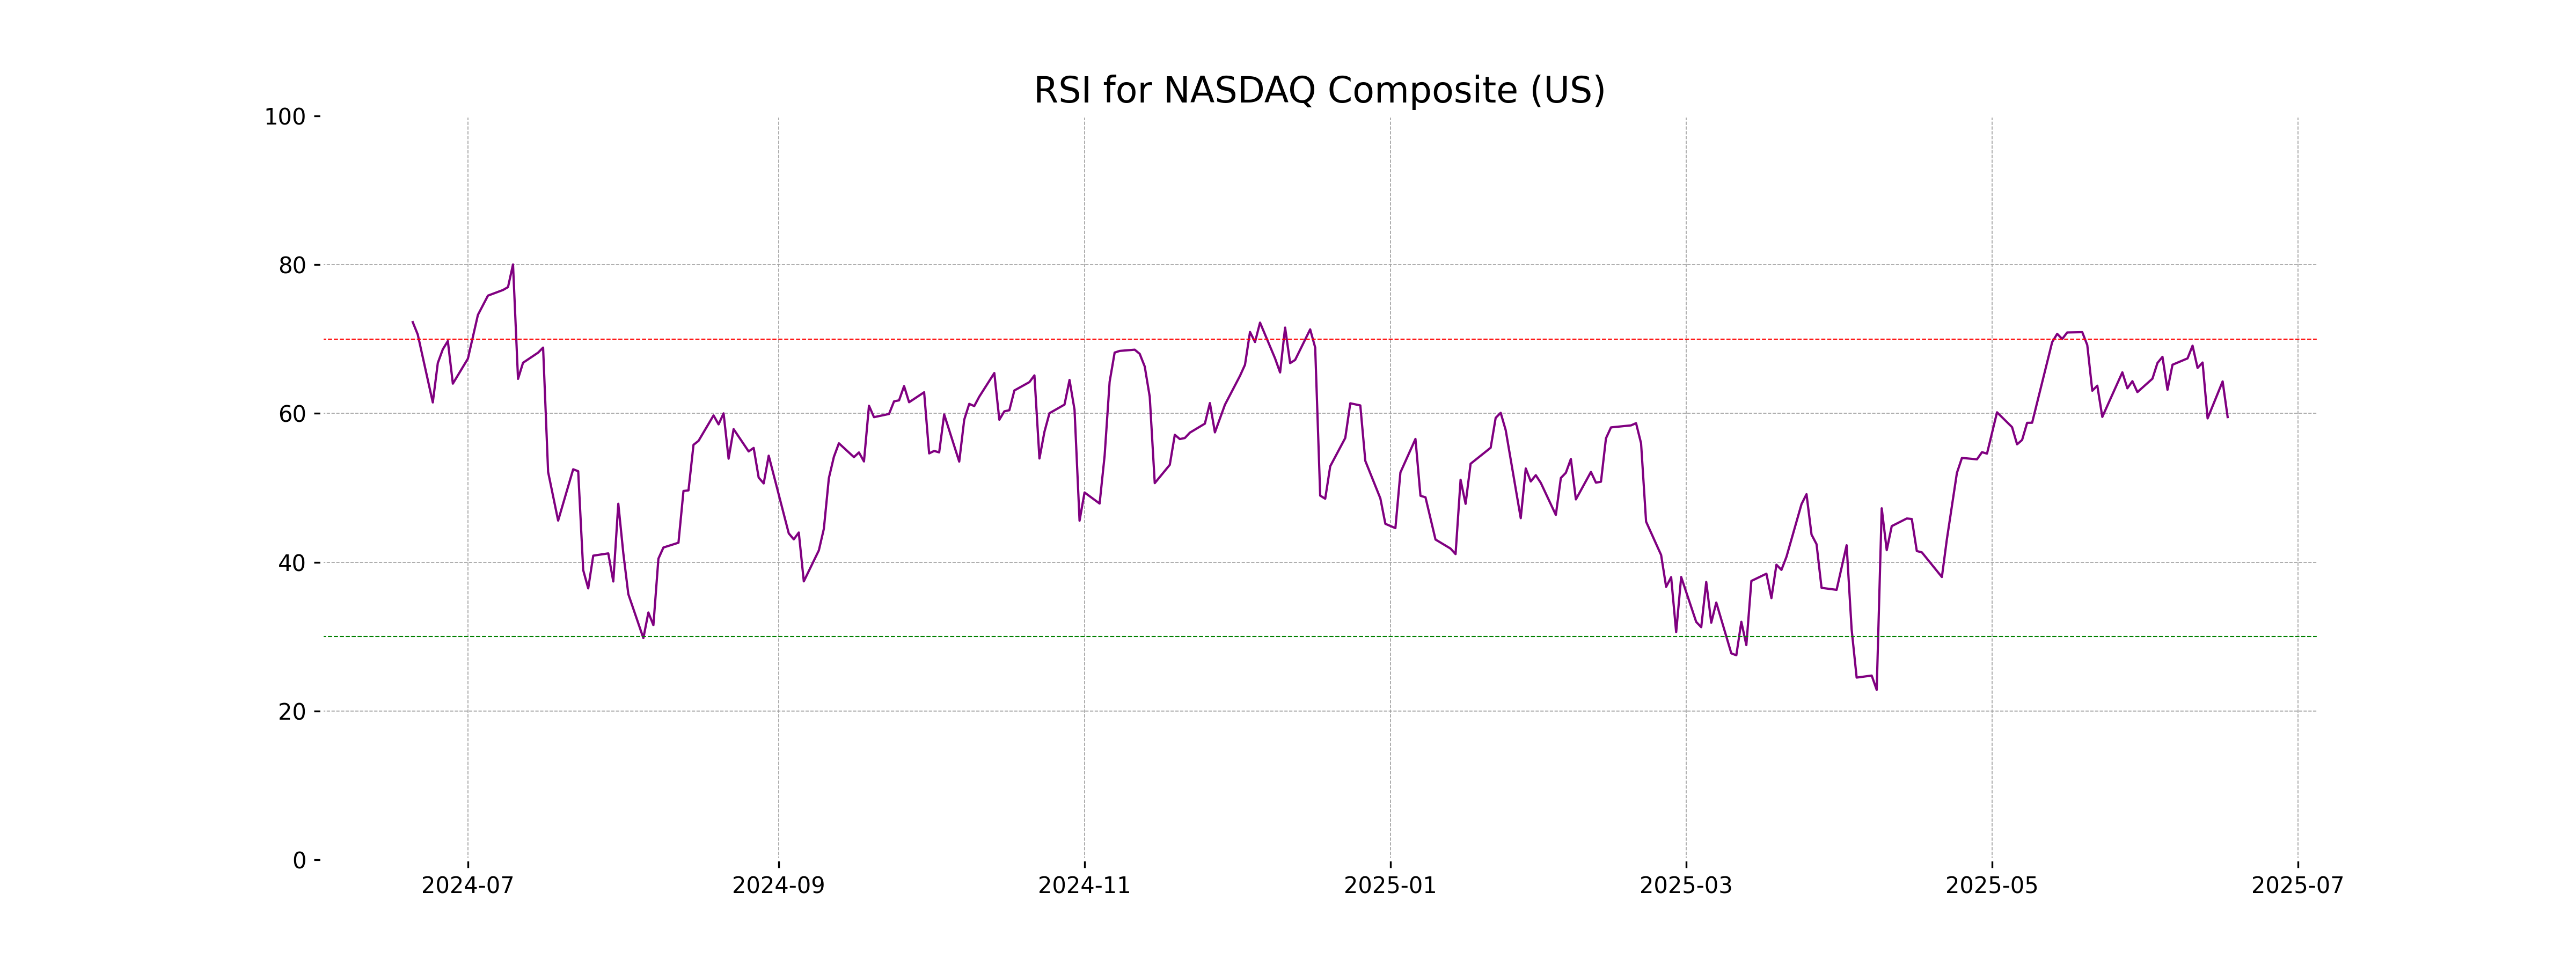
Analysis for NASDAQ Composite (US) - June 18, 2025
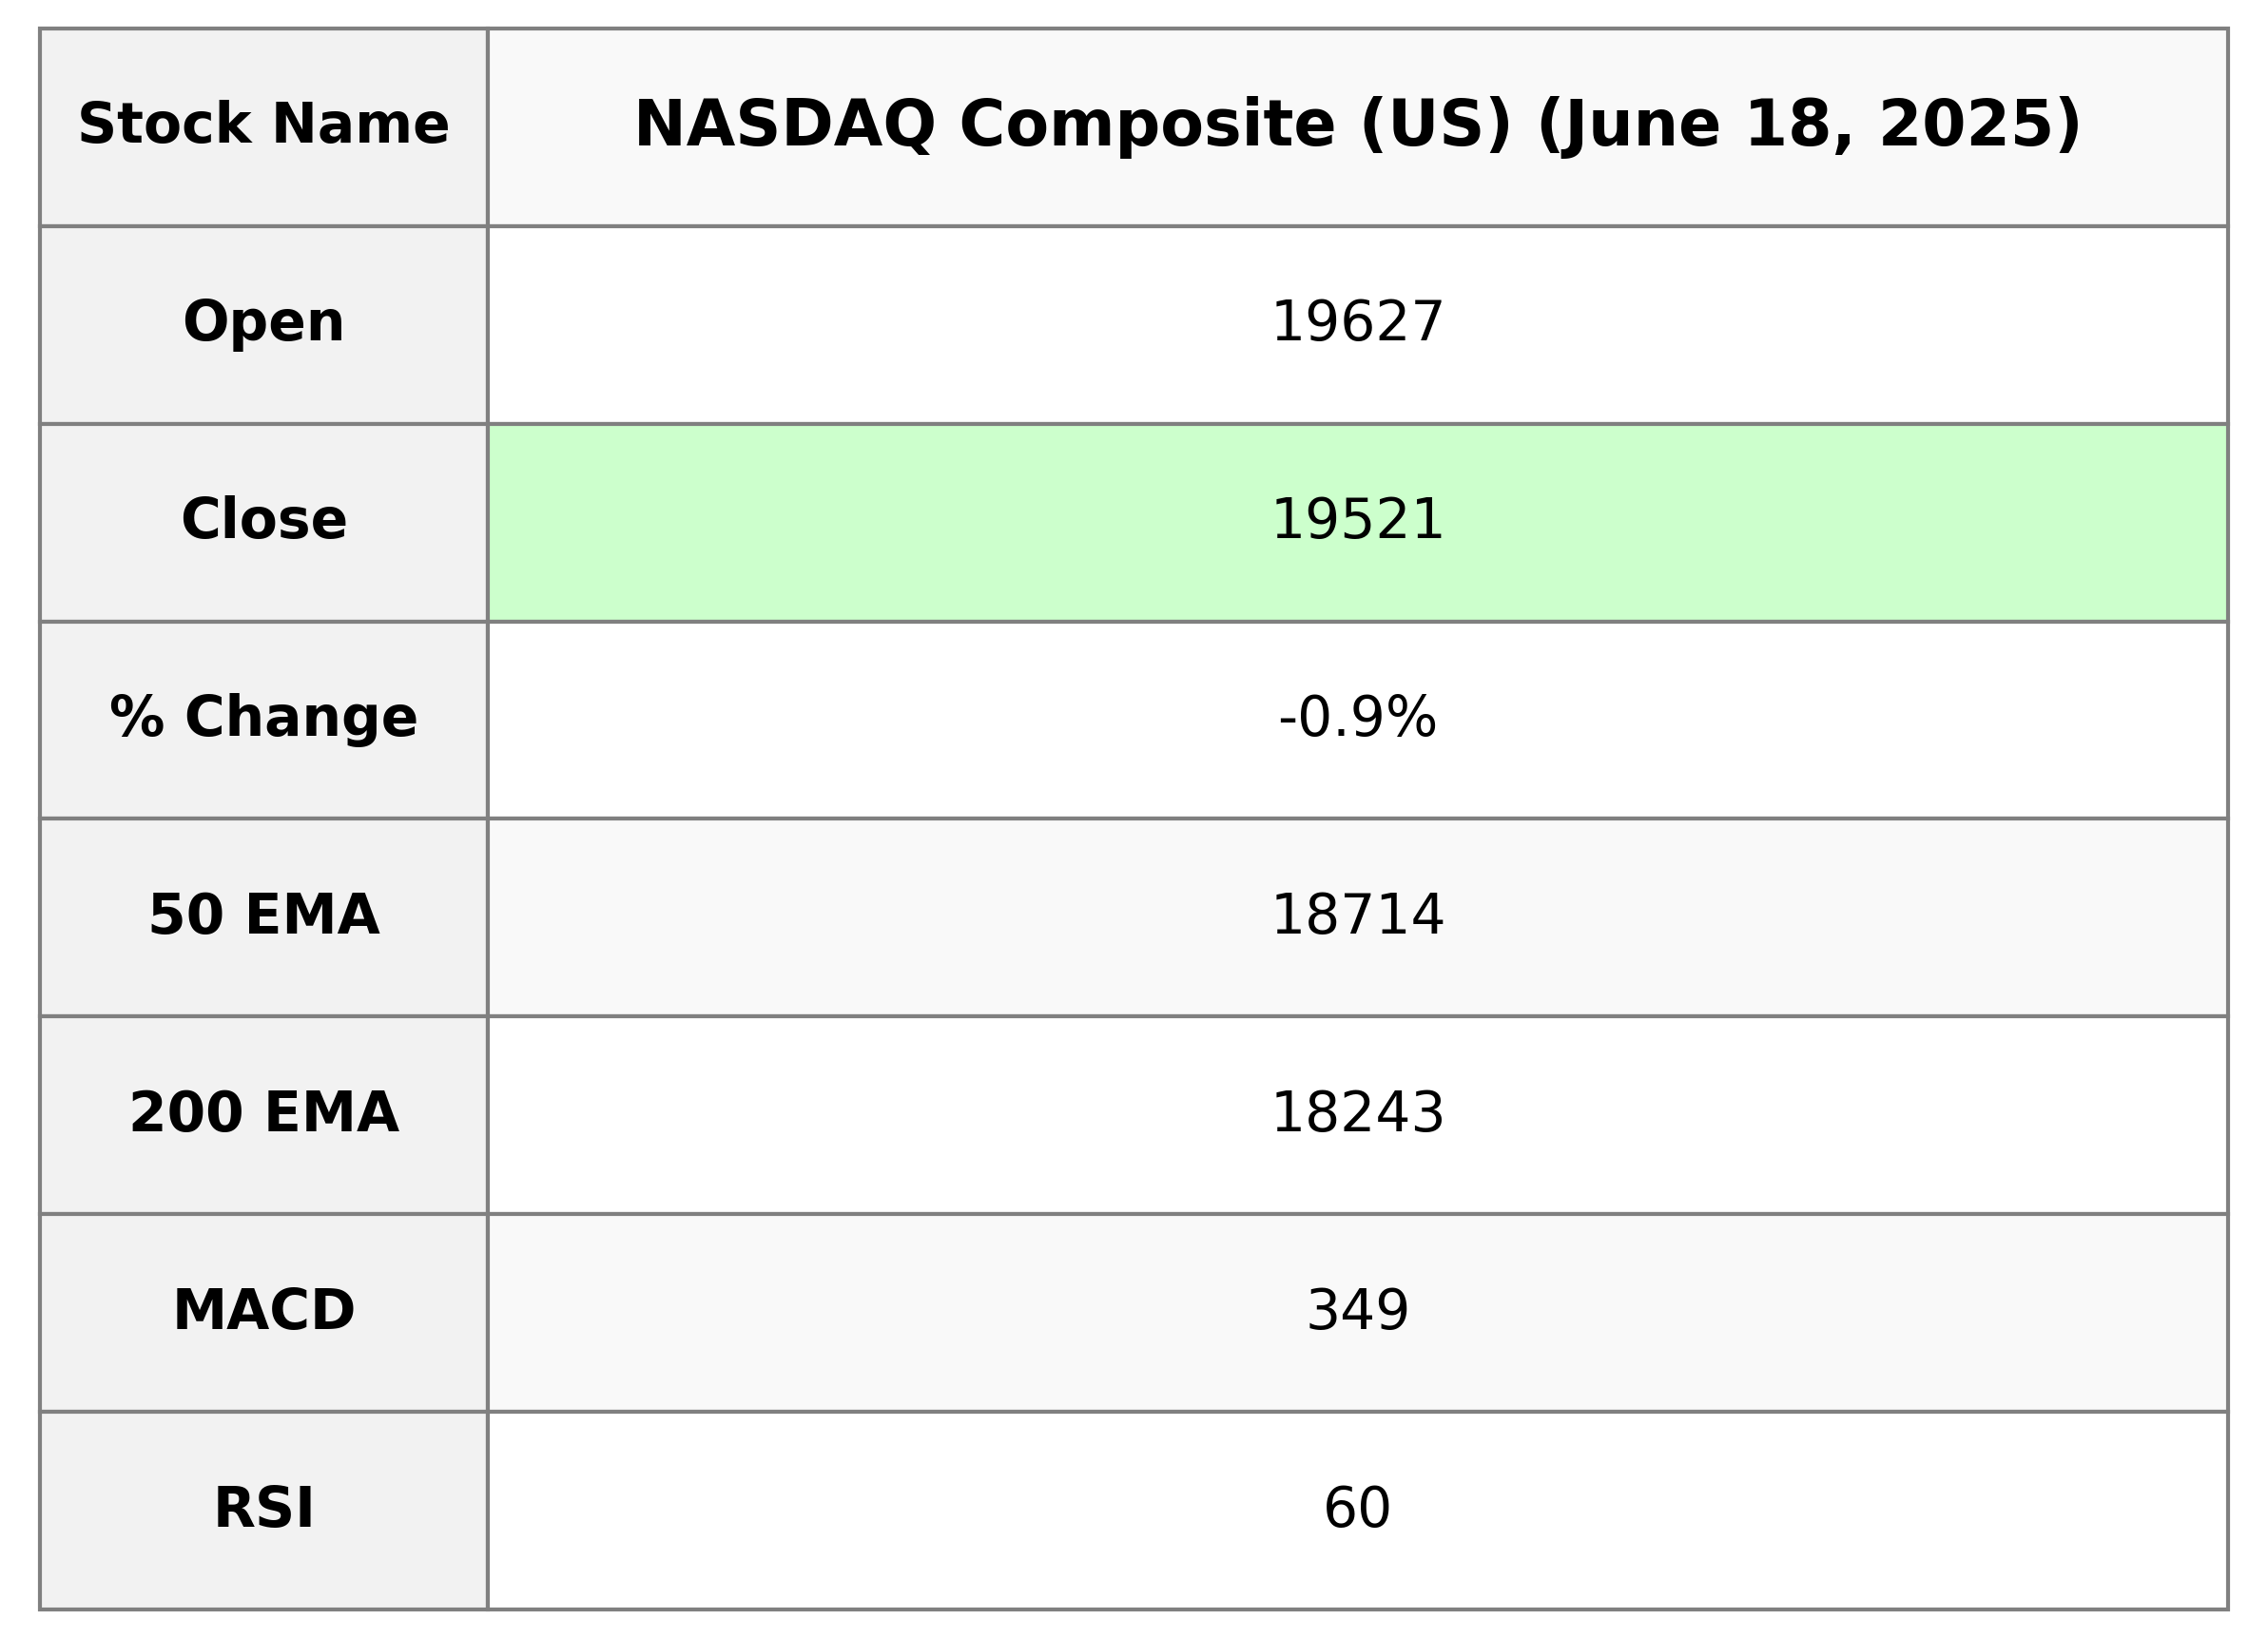
The NASDAQ Composite (US) closed at 19,521.09, marking a decrease of -0.91% from the previous close of 19,701.21, a points change of -180.12. The trading volume was robust at 8.52 billion with a current RSI of 59.51, suggesting mildly bullish market sentiment. The MACD indicator is below the MACD Signal, hinting at potential bearish momentum.
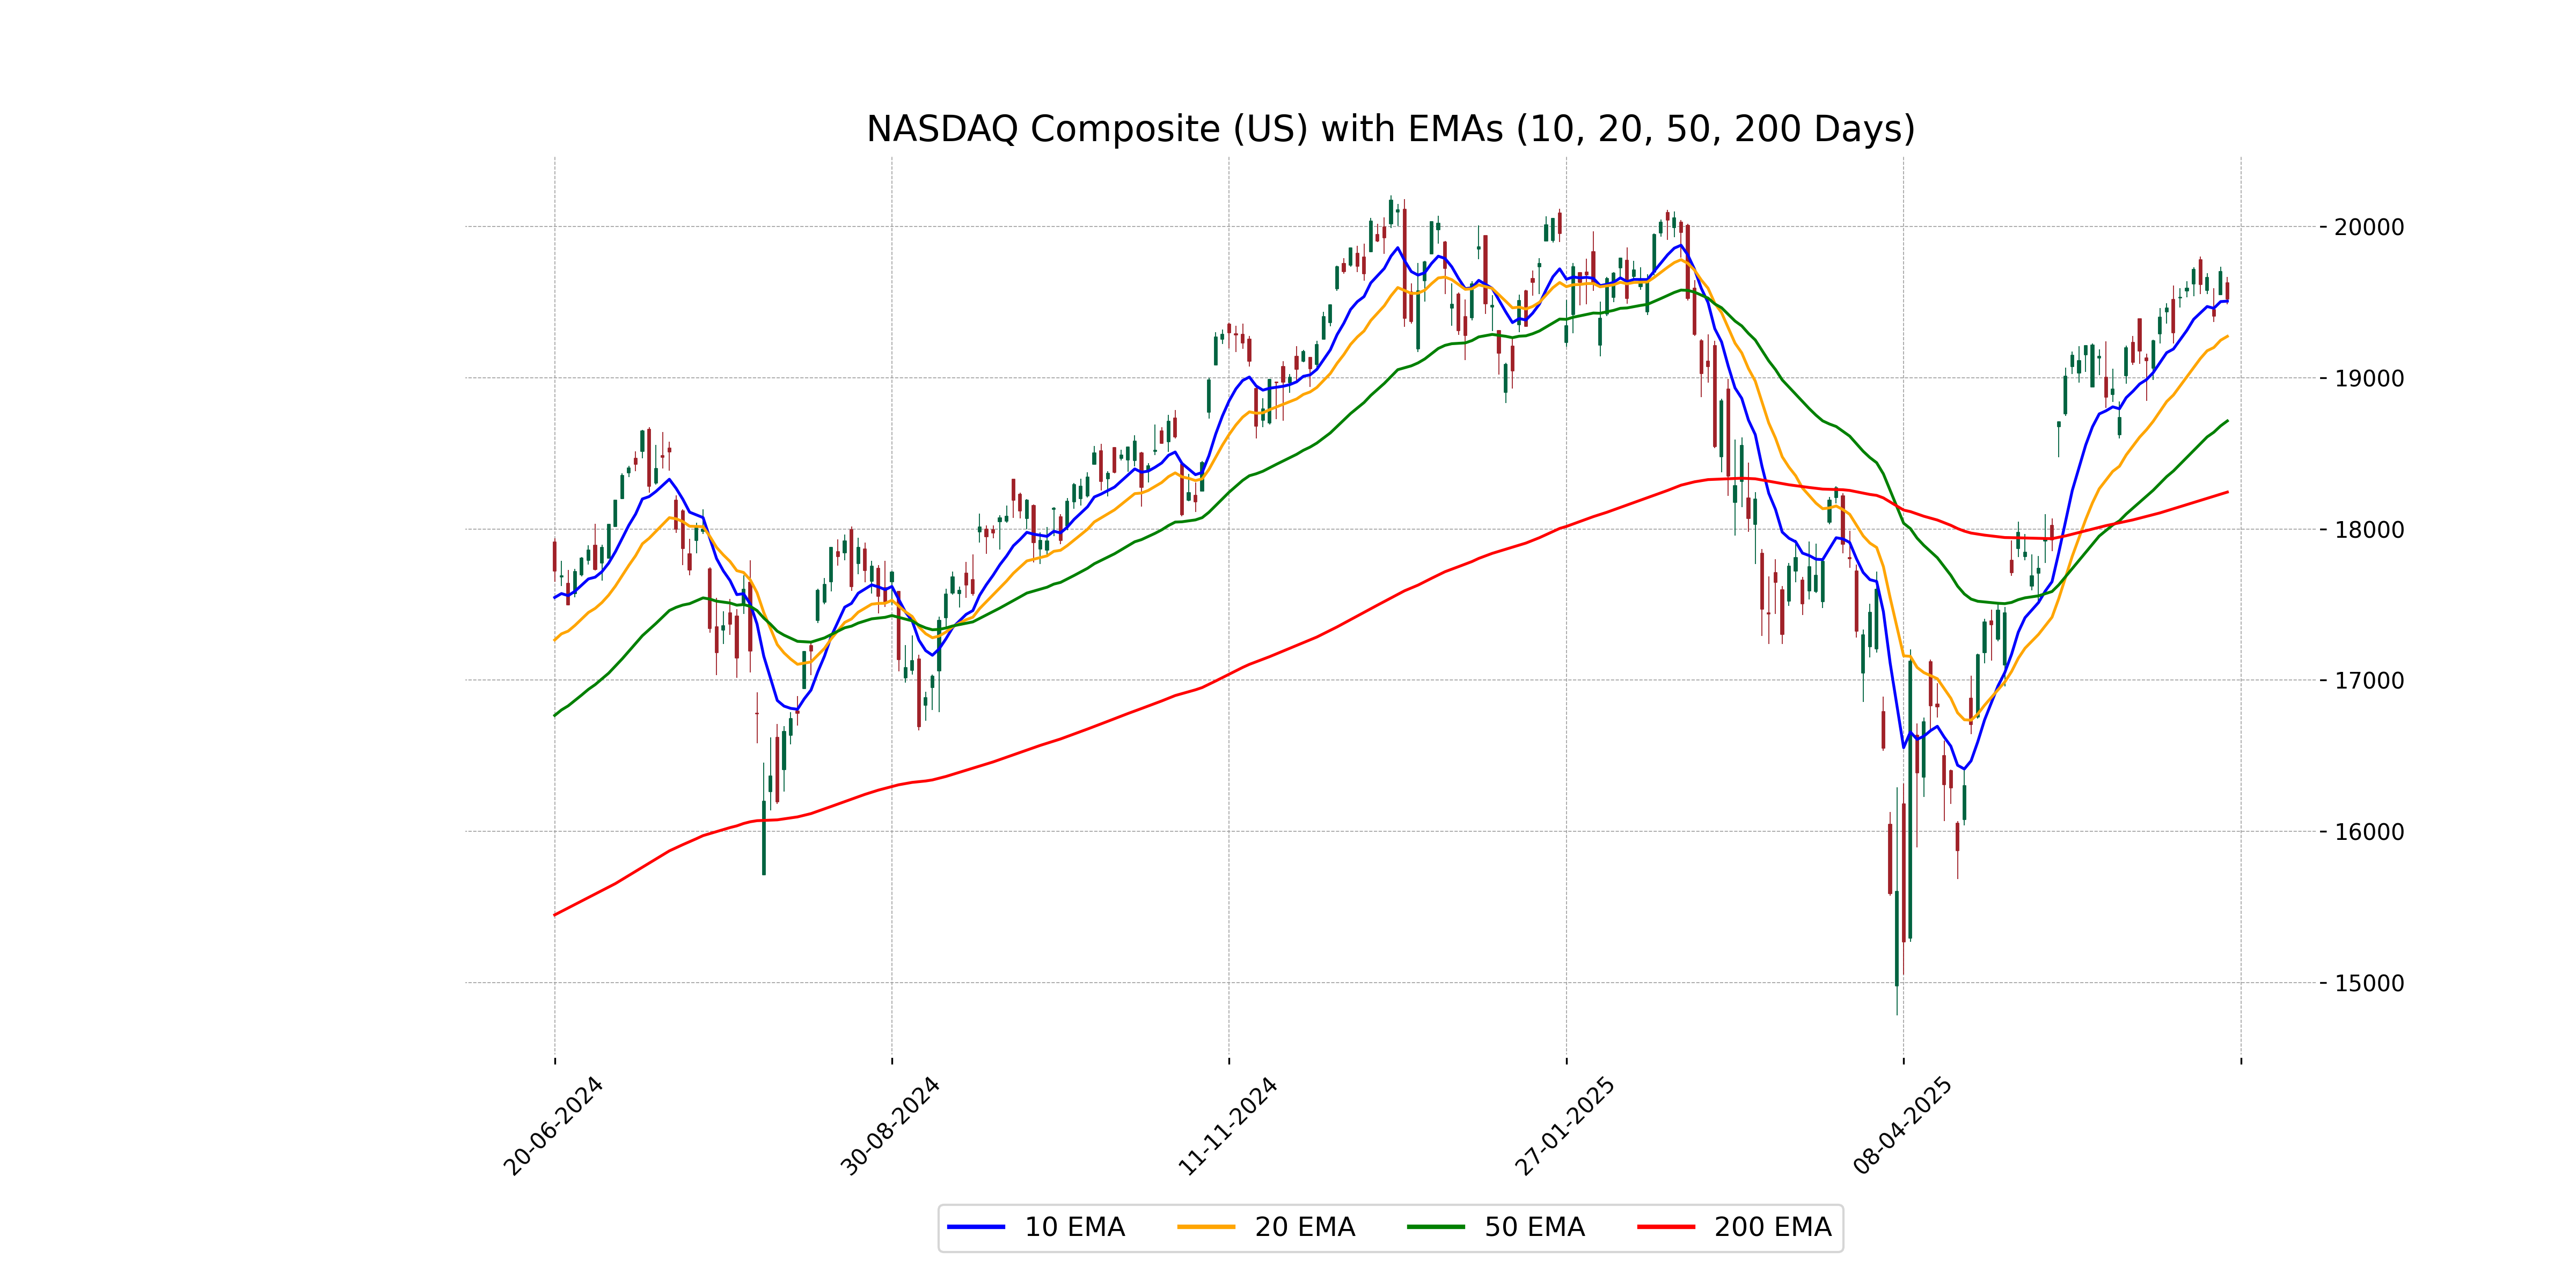
Relationship with Key Moving Averages
NASDAQ Composite is currently trading below its 10 EMA at 19,521.09, with the 10 EMA at 19,506.36, indicating a slight downward pressure. It remains above both the 50 EMA at 18,714.15 and the 200 EMA at 18,243.44, suggesting a longer-term bullish trend despite the recent decline.
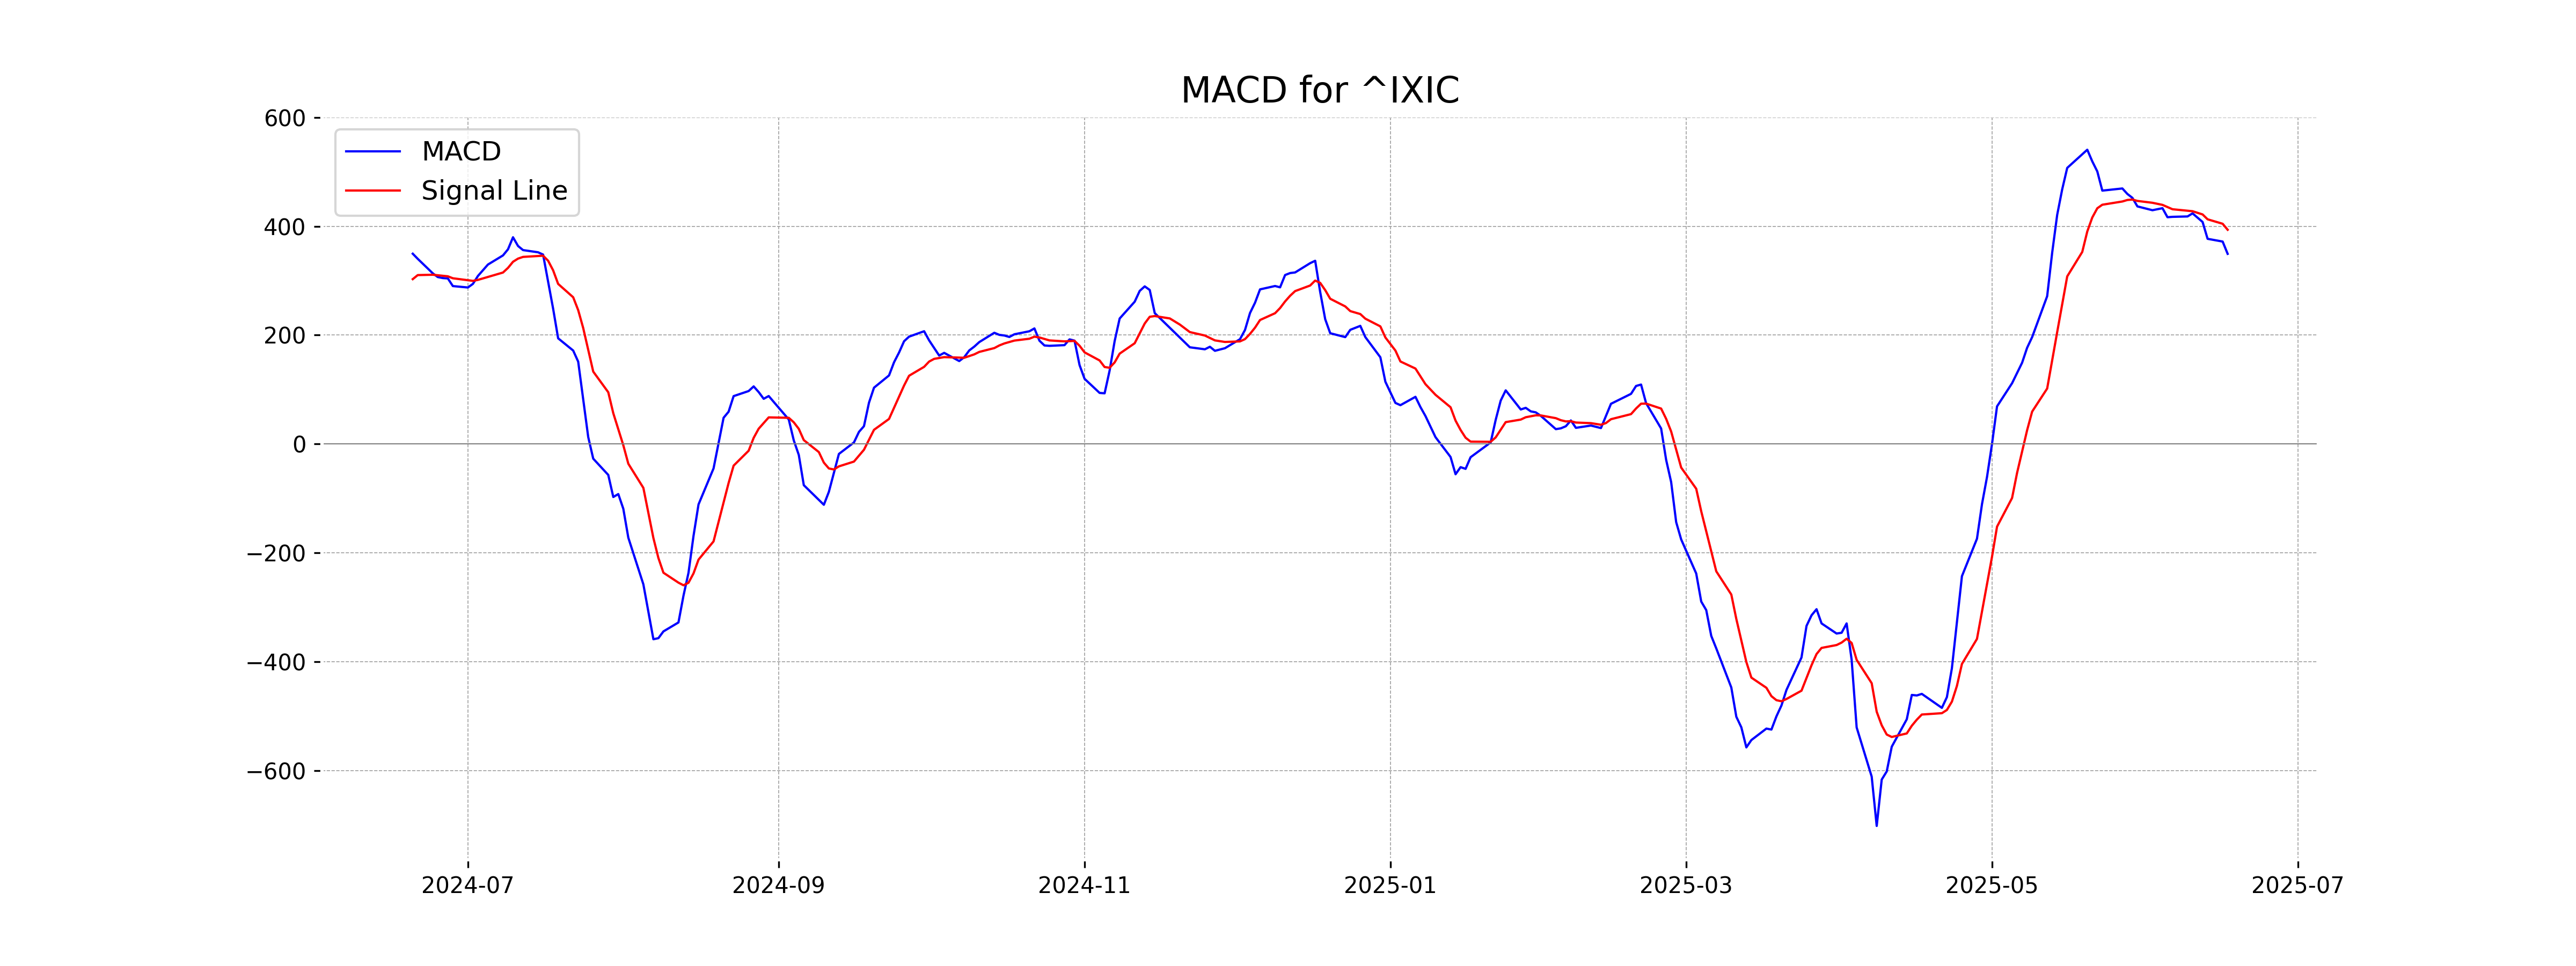
Moving Averages Trend (MACD)
The NASDAQ Composite currently has a MACD of 349.27, which is below its MACD Signal of 393.48. This suggests a potential bearish trend, as the MACD line is crossing below the signal line.
RSI Analysis
Based on the stock data for NASDAQ Composite, the Relative Strength Index (RSI) is 59.51. This figure suggests a neutral market sentiment, as RSI values between 30 and 70 typically indicate neither overbought nor oversold conditions, though it is approaching the upper range which could suggest potential bullish sentiment if the RSI continues to increase.
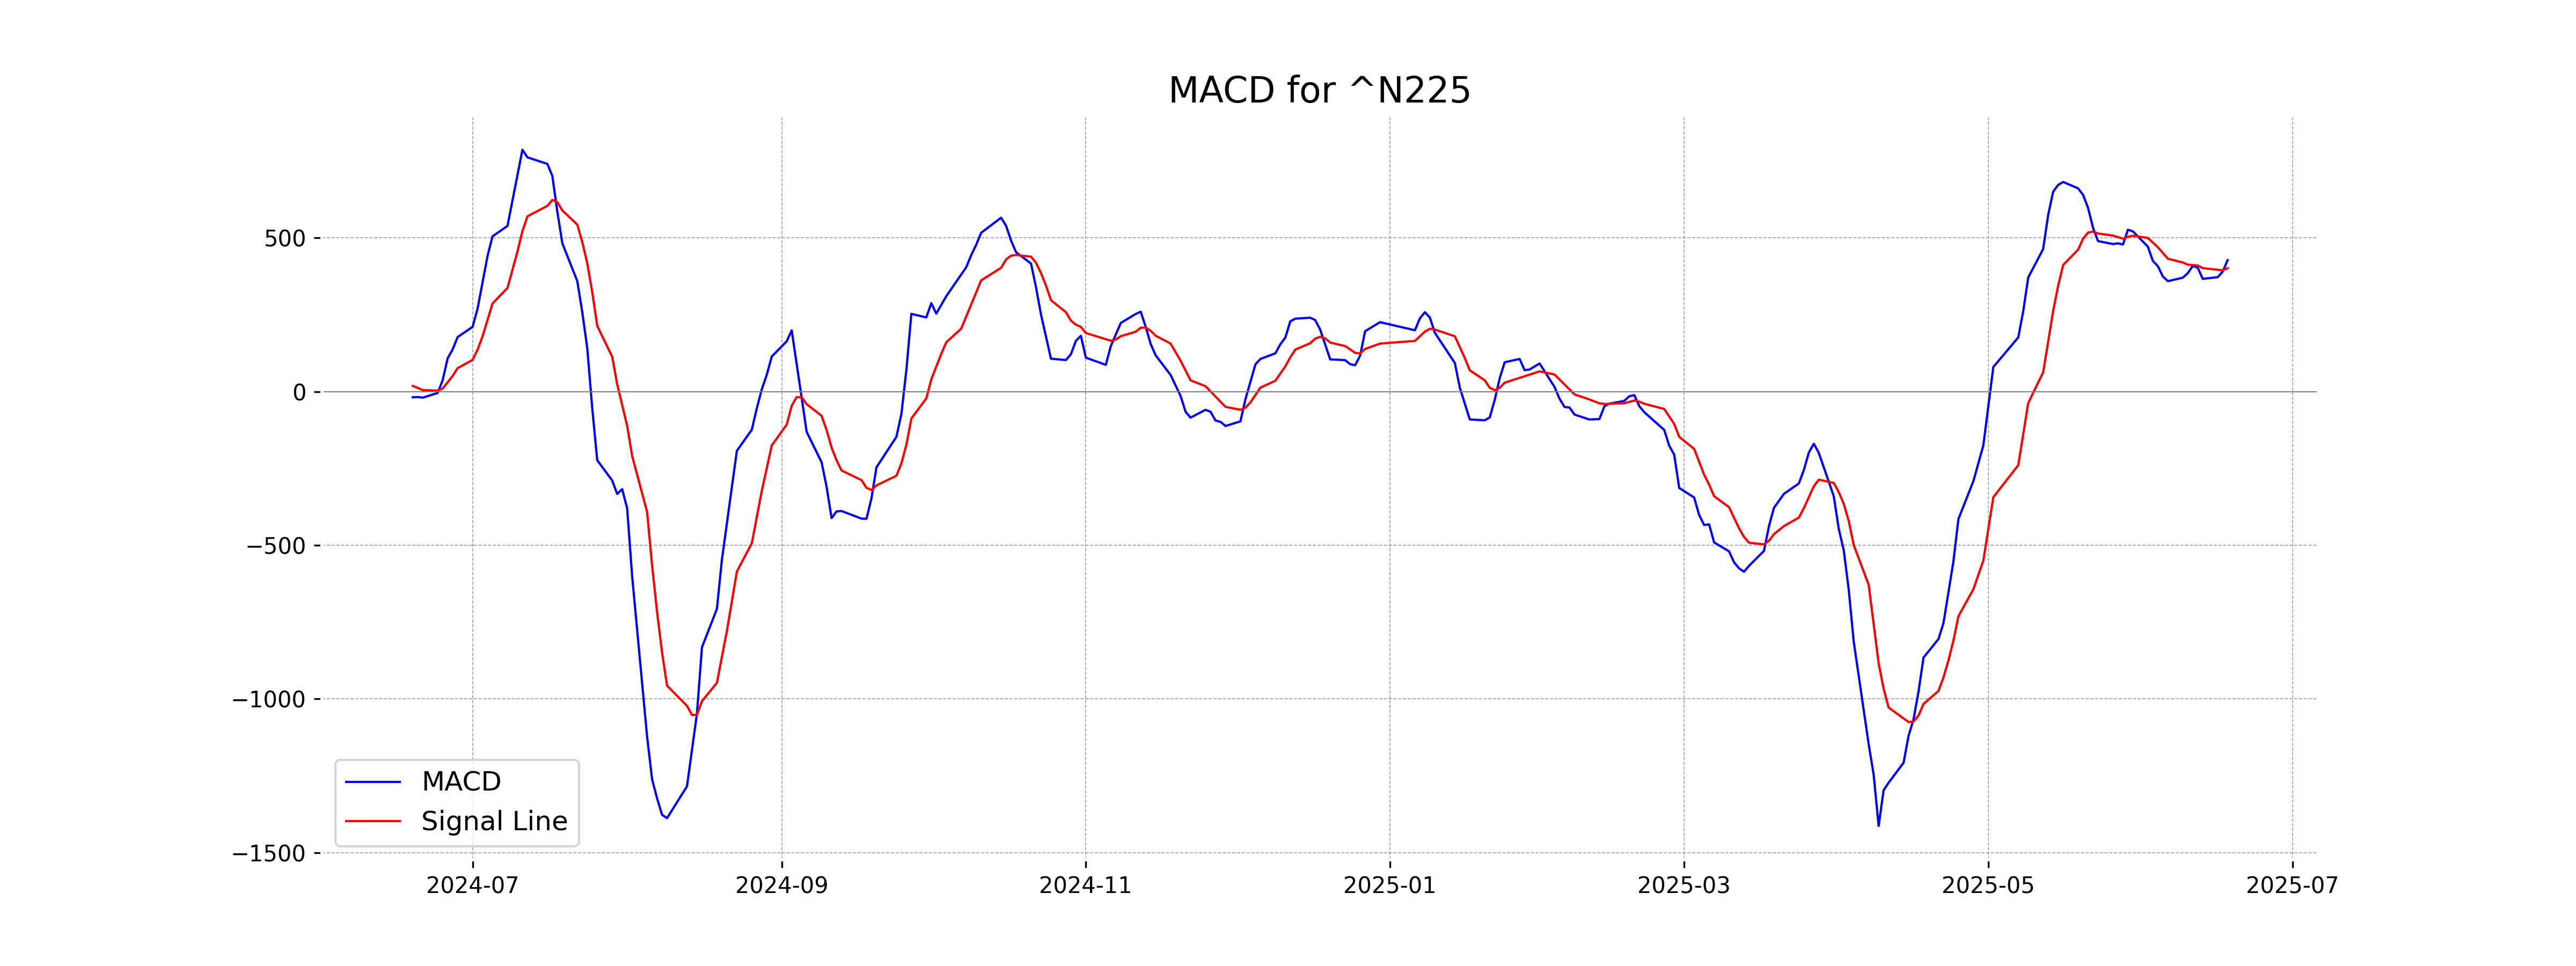
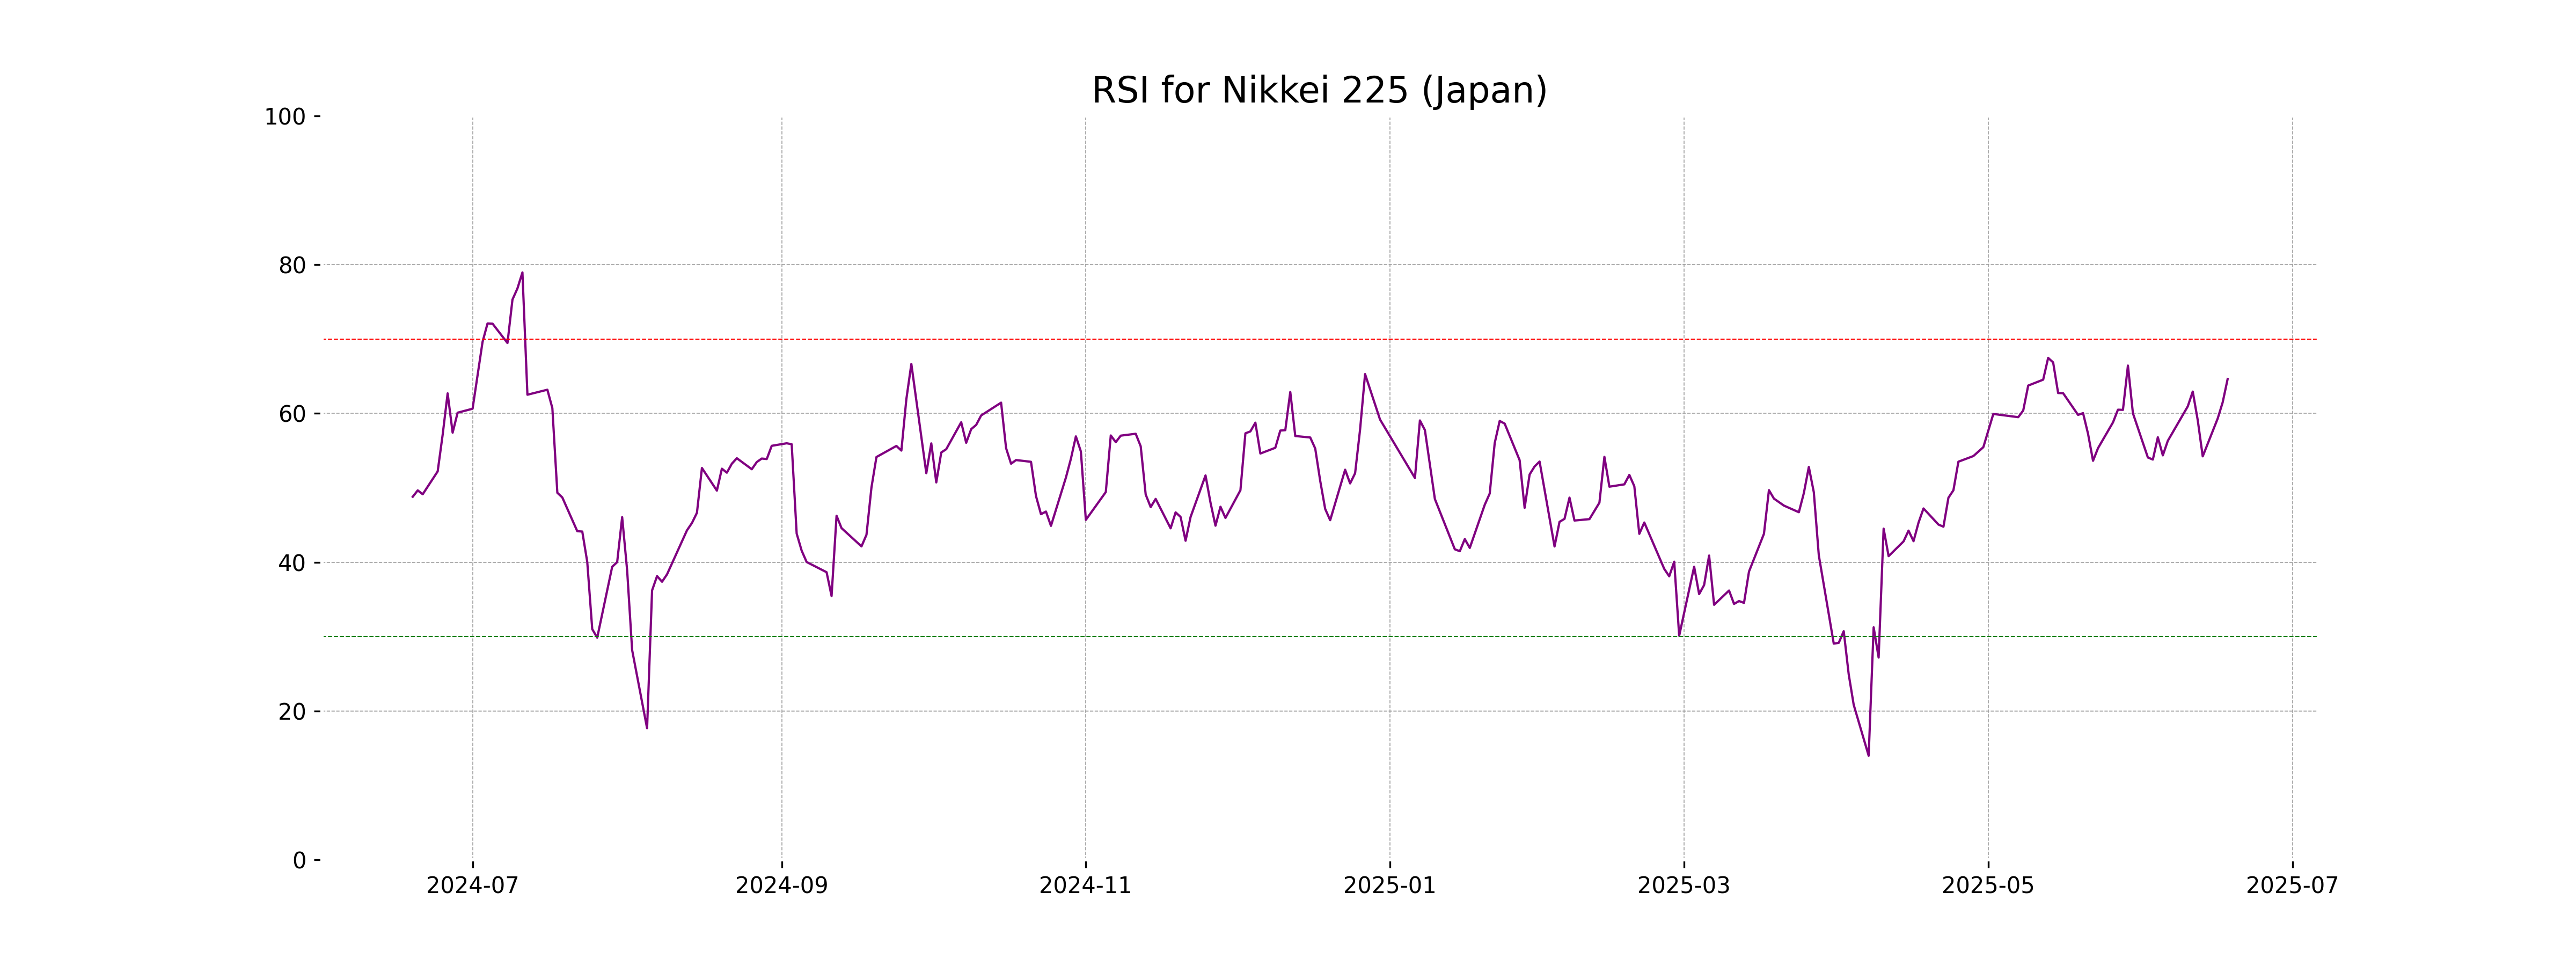
Analysis for Nikkei 225 (Japan) - June 18, 2025
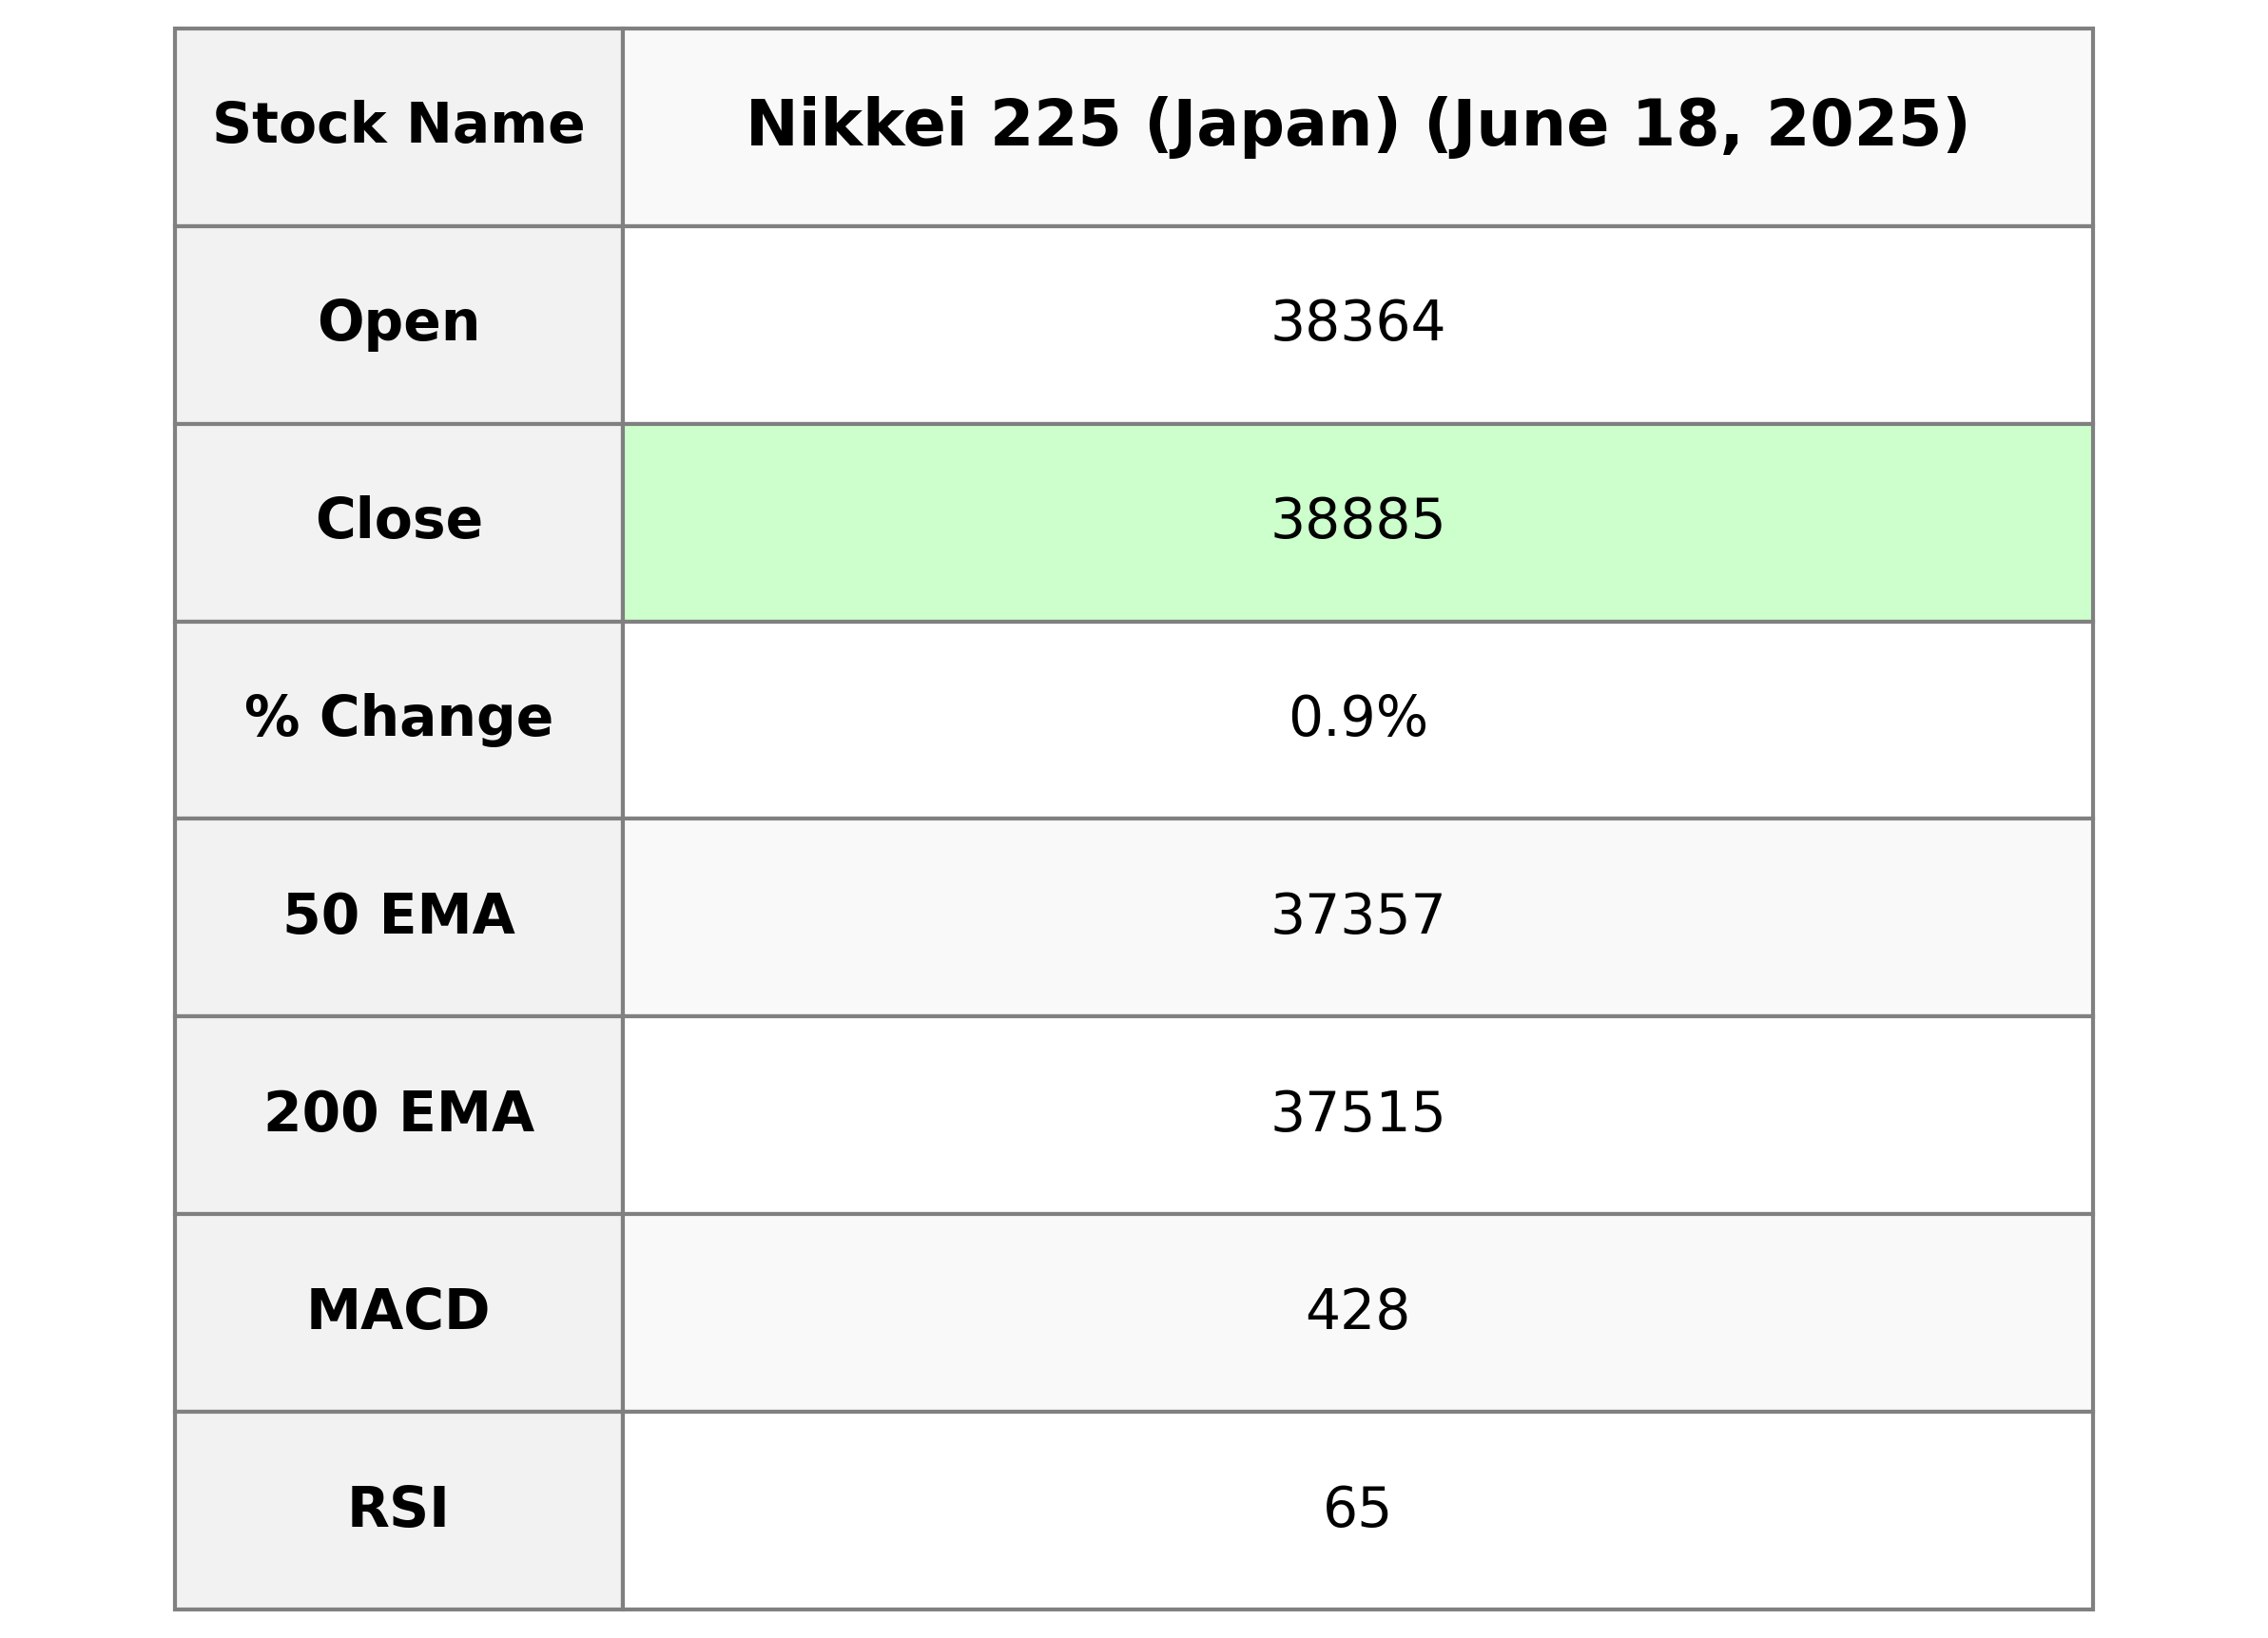
The Nikkei 225 (Japan) opened at 38,364.16 and closed at 38,885.15, experiencing a gain of 0.90% with a points change of 348.41 from the previous close of 38,536.74. The RSI indicates a moderately strong position at 64.64. Key exponential moving averages show the index performing above its 10, 20, 50, and 200 EMA levels.
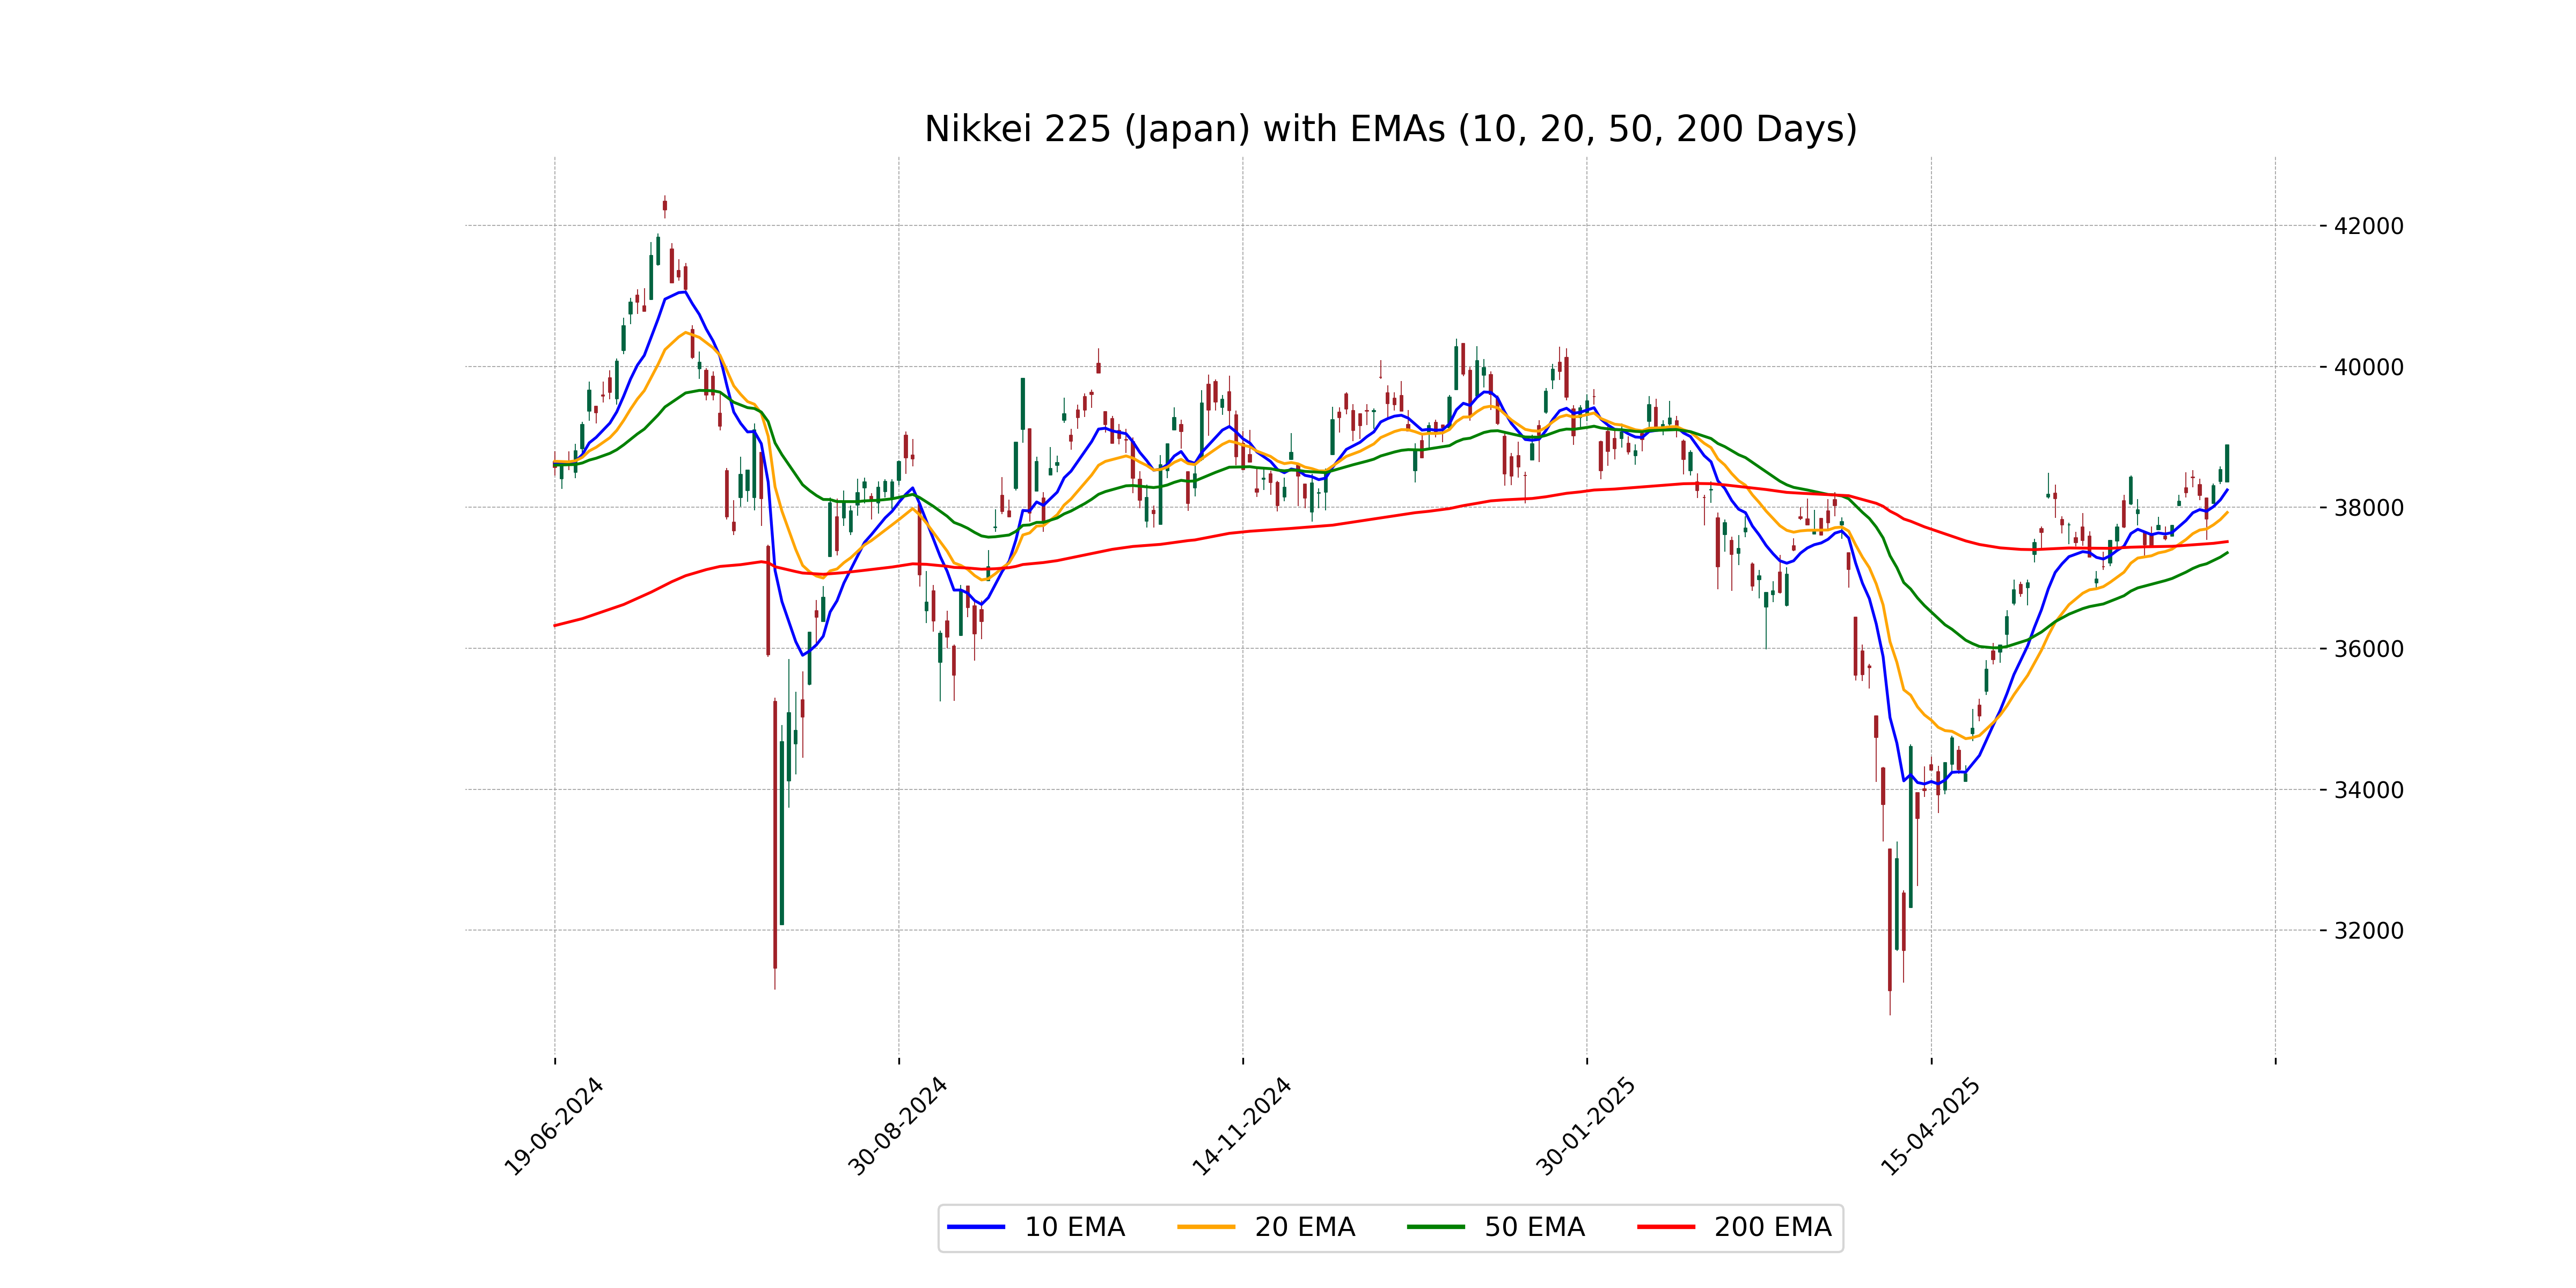
Relationship with Key Moving Averages
The Nikkei 225 (Japan) is trading above its key moving averages, with the closing price of 38,885.15 surpassing the 50-day EMA (37,356.83), 200-day EMA (37,514.53), 10-day EMA (38,248.37), and 20-day EMA (37,928.27). This indicates overall bullish momentum as the price is above all moving averages.
Moving Averages Trend (MACD)
Nikkei 225's MACD line is currently at 427.76, above the signal line at 401.24, indicating a bullish momentum. With the MACD greater than the signal line, the trend suggests potential upward movement.
RSI Analysis
The RSI for Nikkei 225 (Japan) is 64.64, indicating that the index is approaching overbought territory but is not yet over the 70 level, which is typically considered overbought. Investors should watch for potential changes in momentum as the RSI nears critical levels.
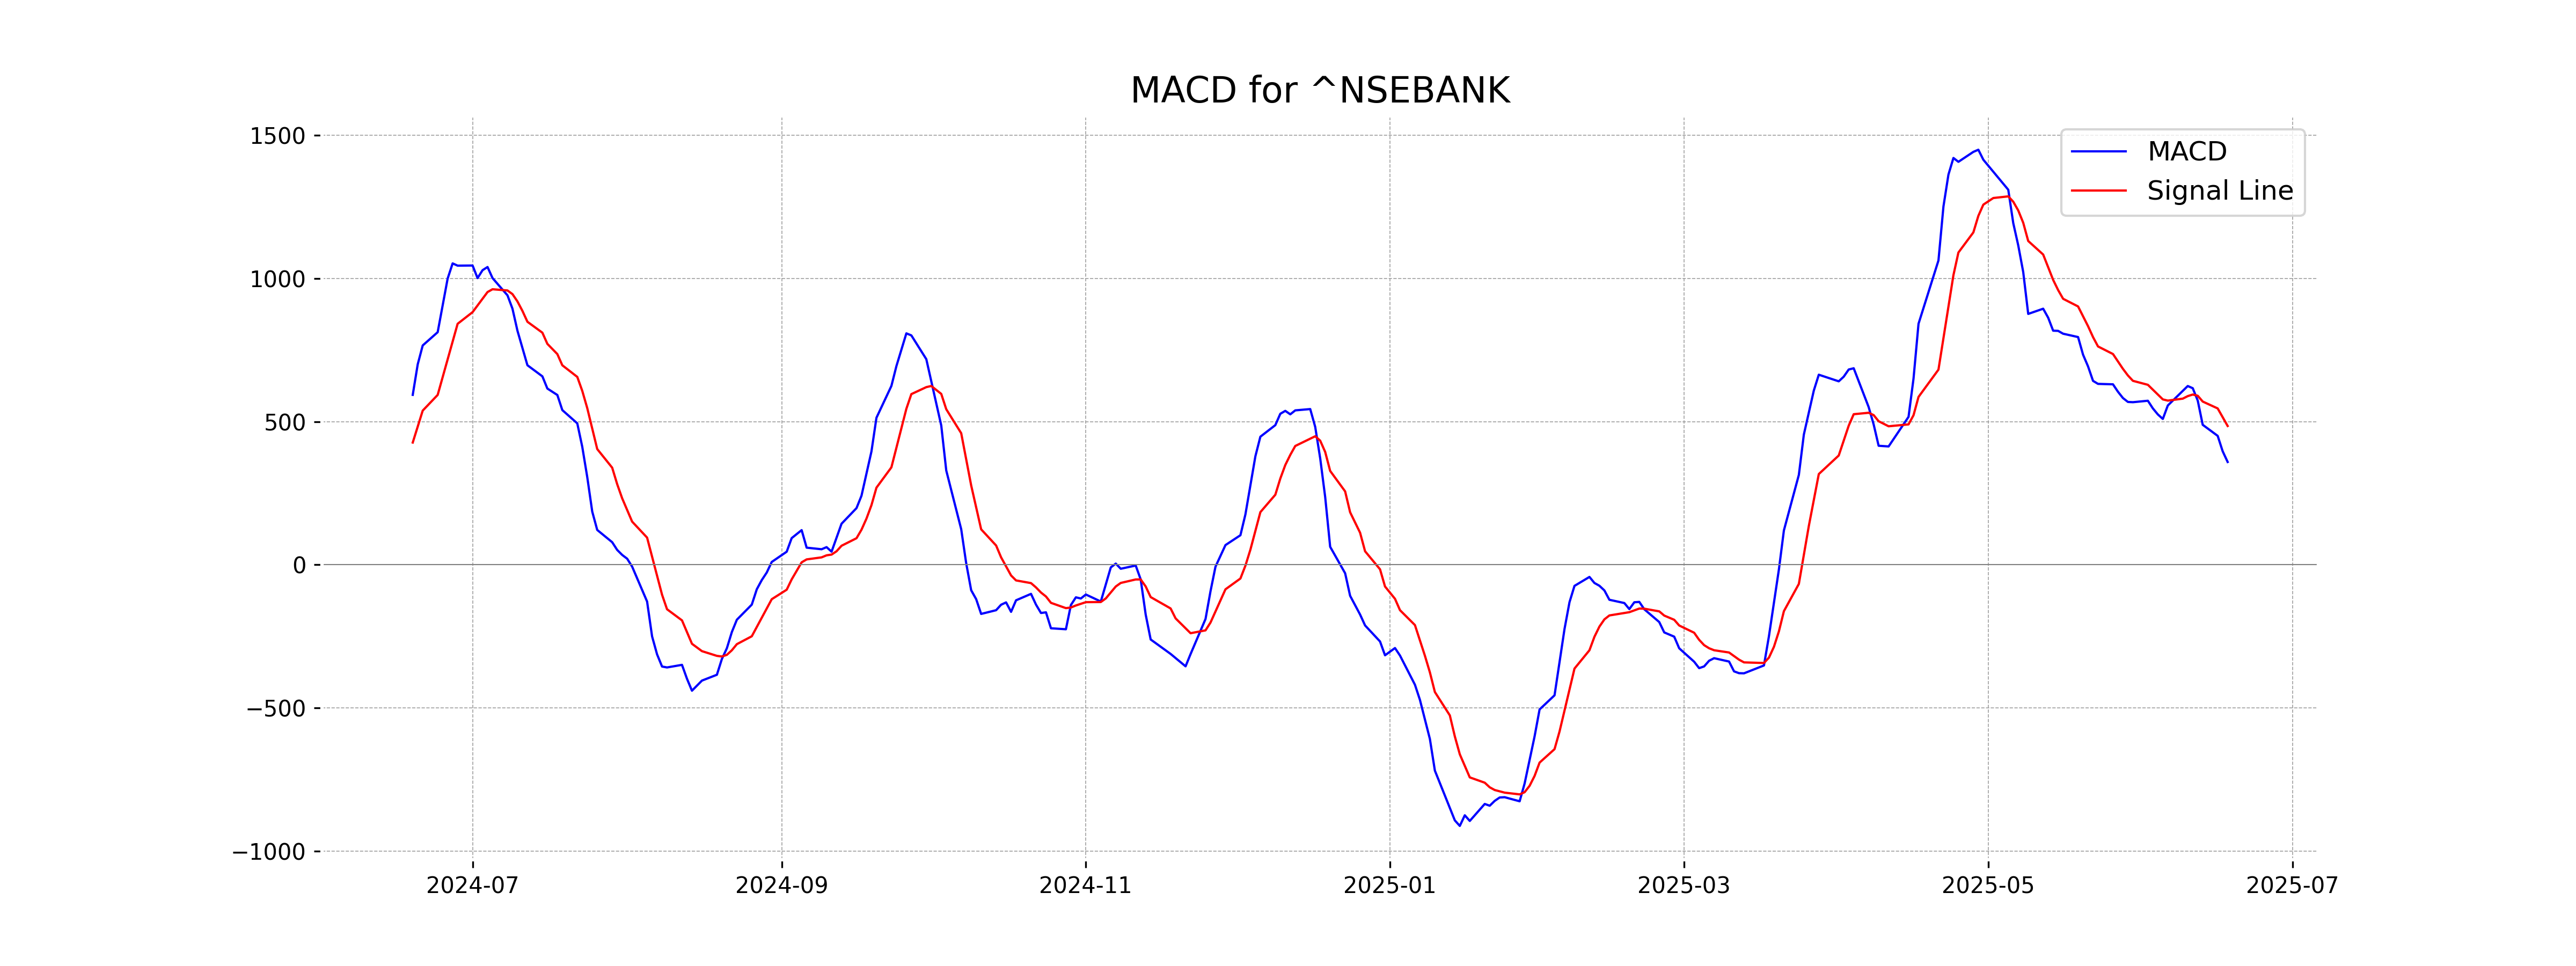
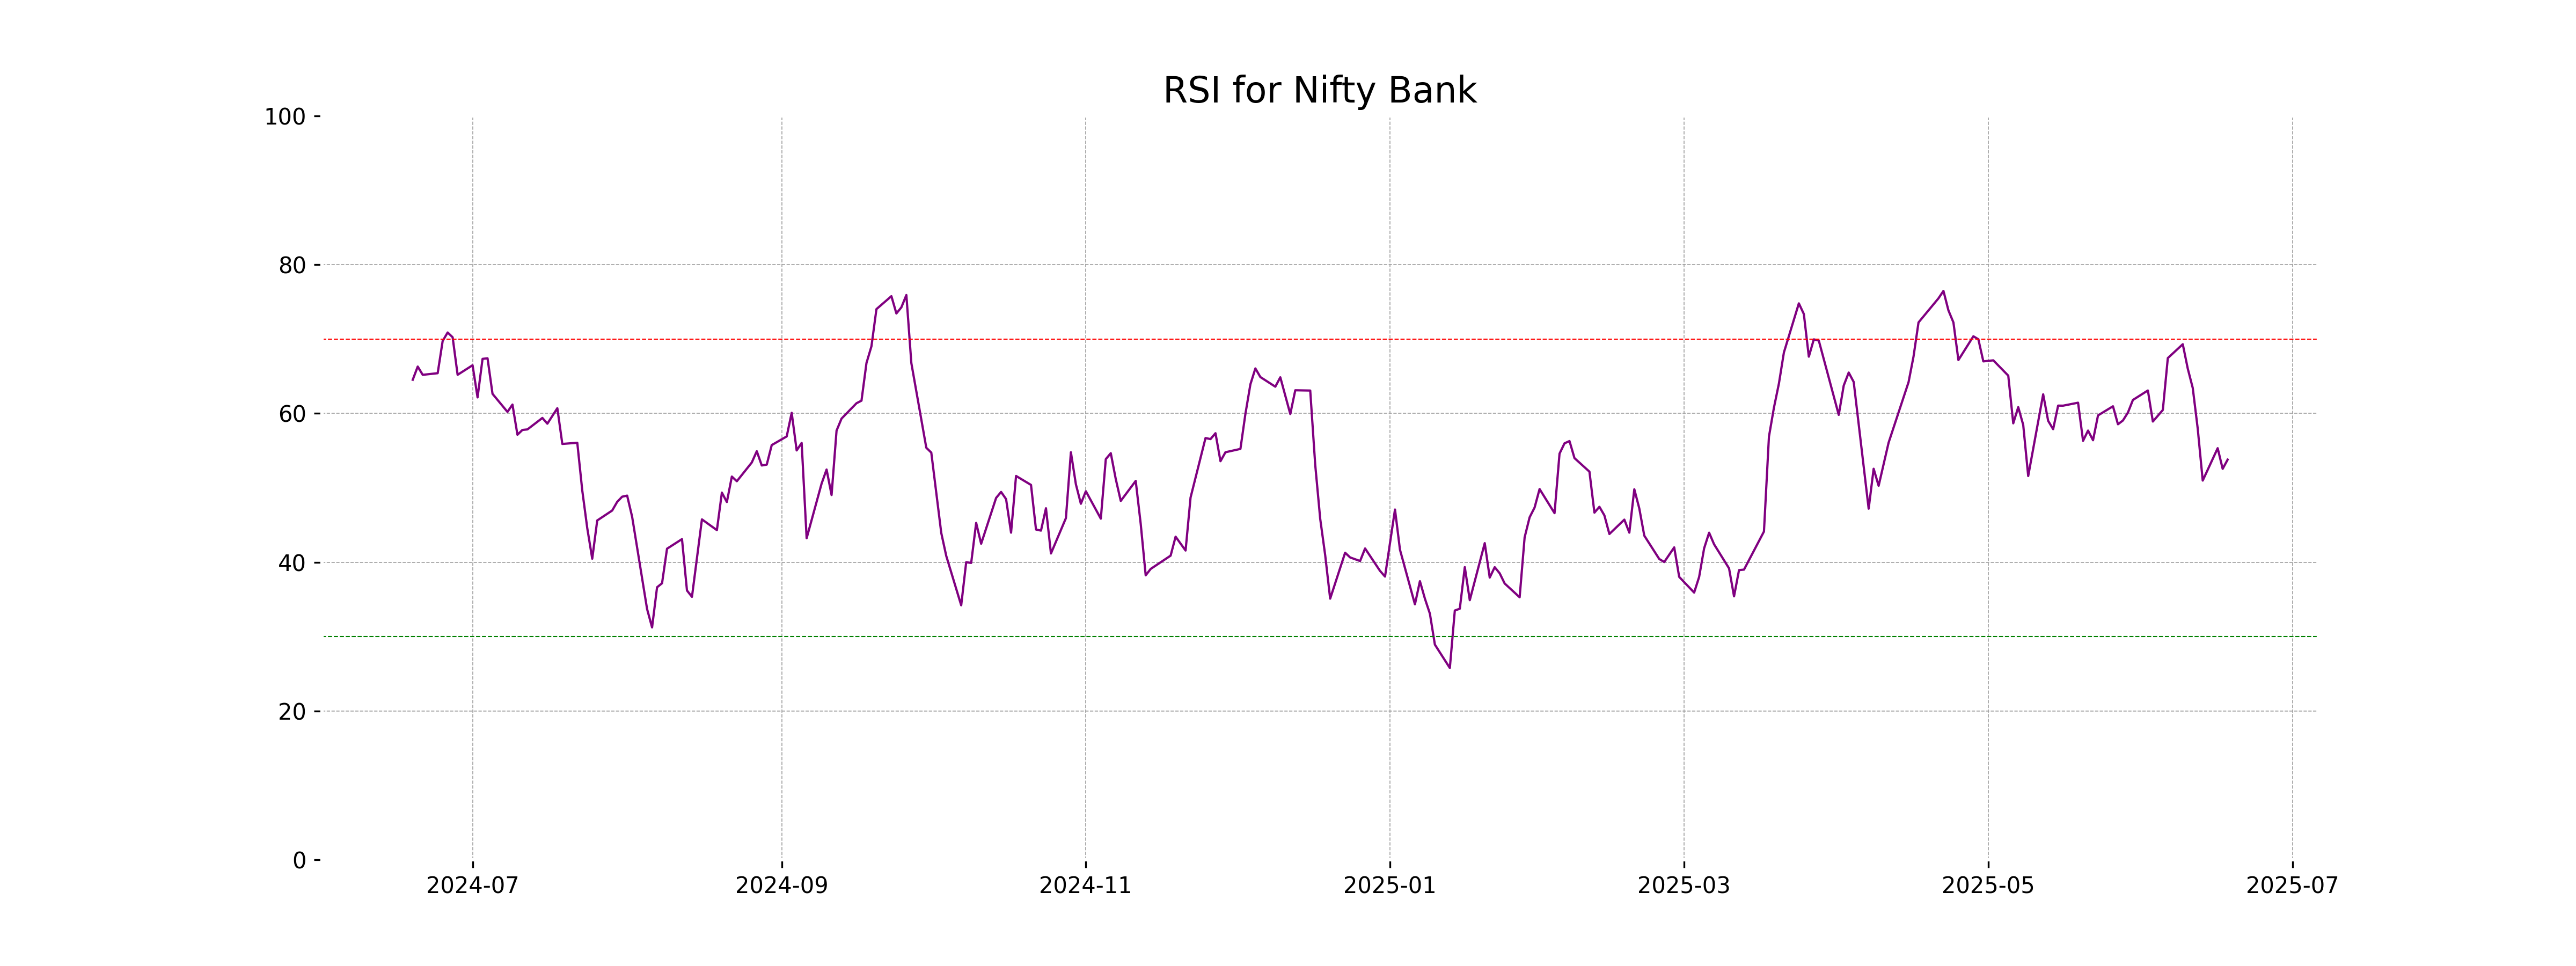
Analysis for Nifty Bank - June 18, 2025
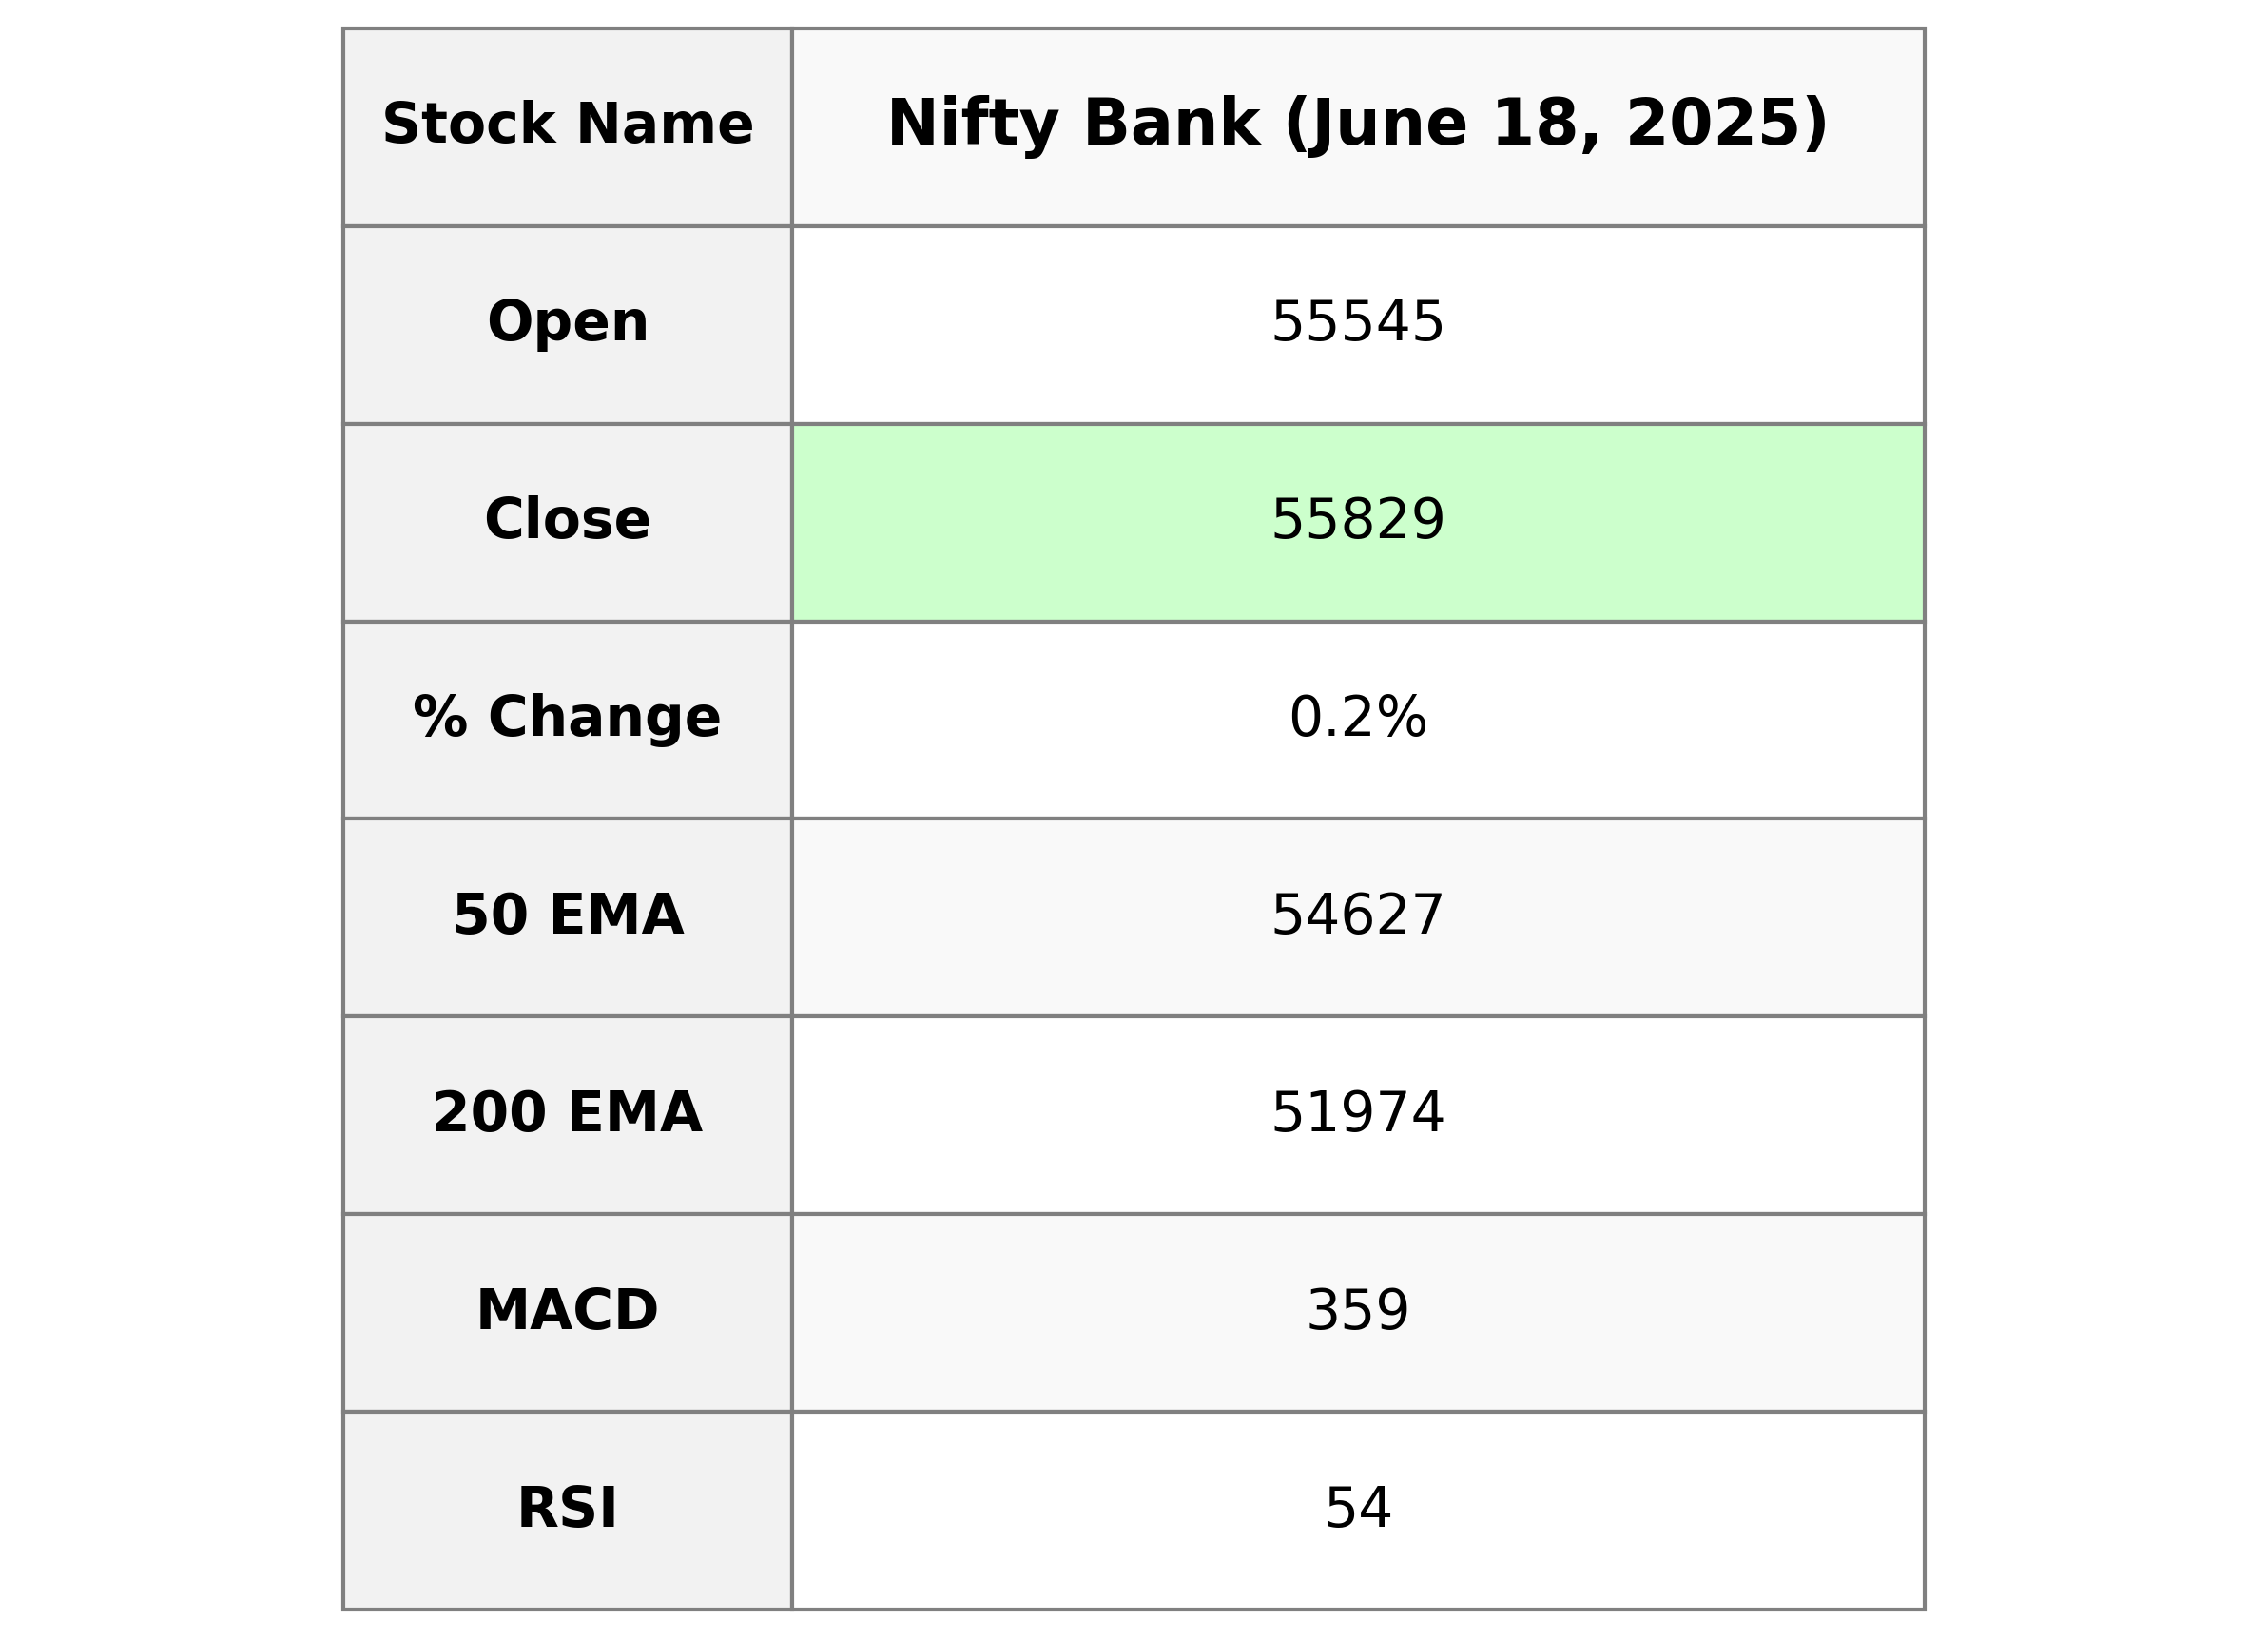
The Nifty Bank opened at 55,544.95 and closed at 55,828.75, registering a modest percentage change of 0.21% from the previous close. The stock saw a high of 55,933.60 and a low of 55,511.80, with no volume data provided. Key technical indicators include a 50-day EMA of 54,627.03 and a 200-day EMA of 51,973.69, alongside a MACD of 358.99 versus a MACD Signal of 484.68, suggesting potential market trends.
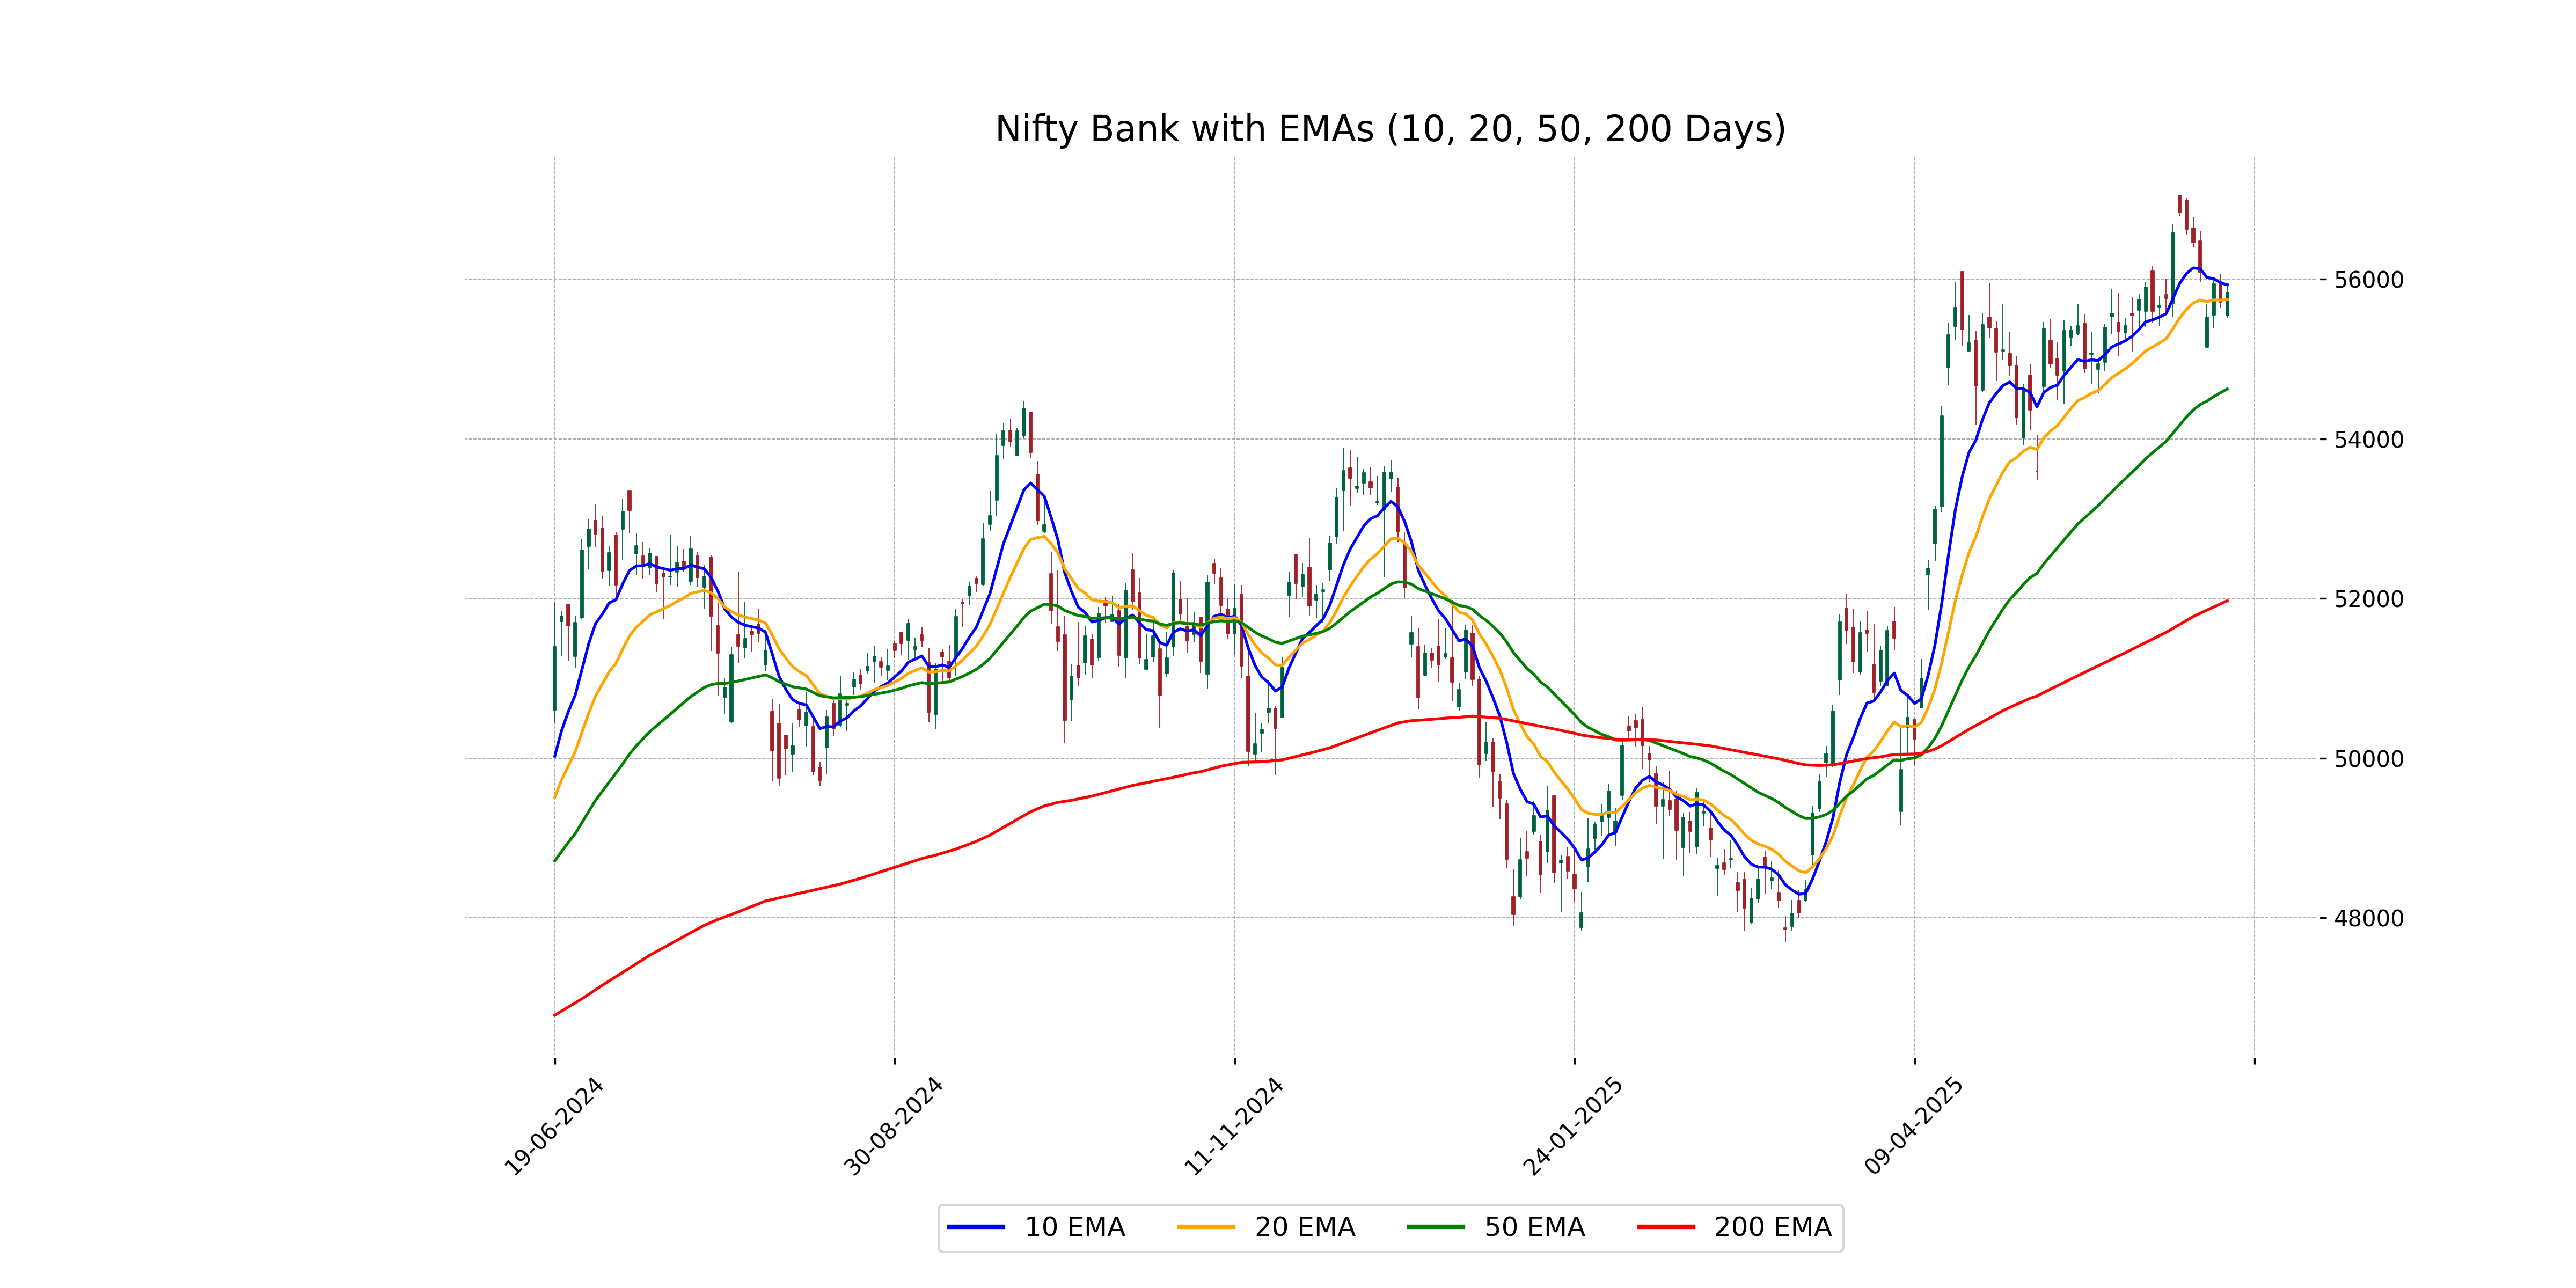
Relationship with Key Moving Averages
The closing price of Nifty Bank is 55,828.75, which is above its 50 EMA of 54,627.03, indicating a bullish trend. However, it is slightly below the 10 EMA of 55,931.92, suggesting some short-term fluctuations. The close above the 20 EMA of 55,747.75 reinforces its overall positive momentum.
Moving Averages Trend (MACD)
The MACD value for Nifty Bank is 358.995, which is below the MACD Signal line at 484.681, suggesting a bearish trend. This indicates that the stock may be experiencing downward momentum. Traders might watch for a crossover or further divergence as potential signals for entry or exit points.
RSI Analysis
Based on the stock data, Nifty Bank has an RSI of approximately 53.79, indicating a neutral market sentiment as it lies between the typical overbought (70) and oversold (30) levels. This suggests that the stock is not currently presenting strong buying or selling signals and may continue to trade within a range.
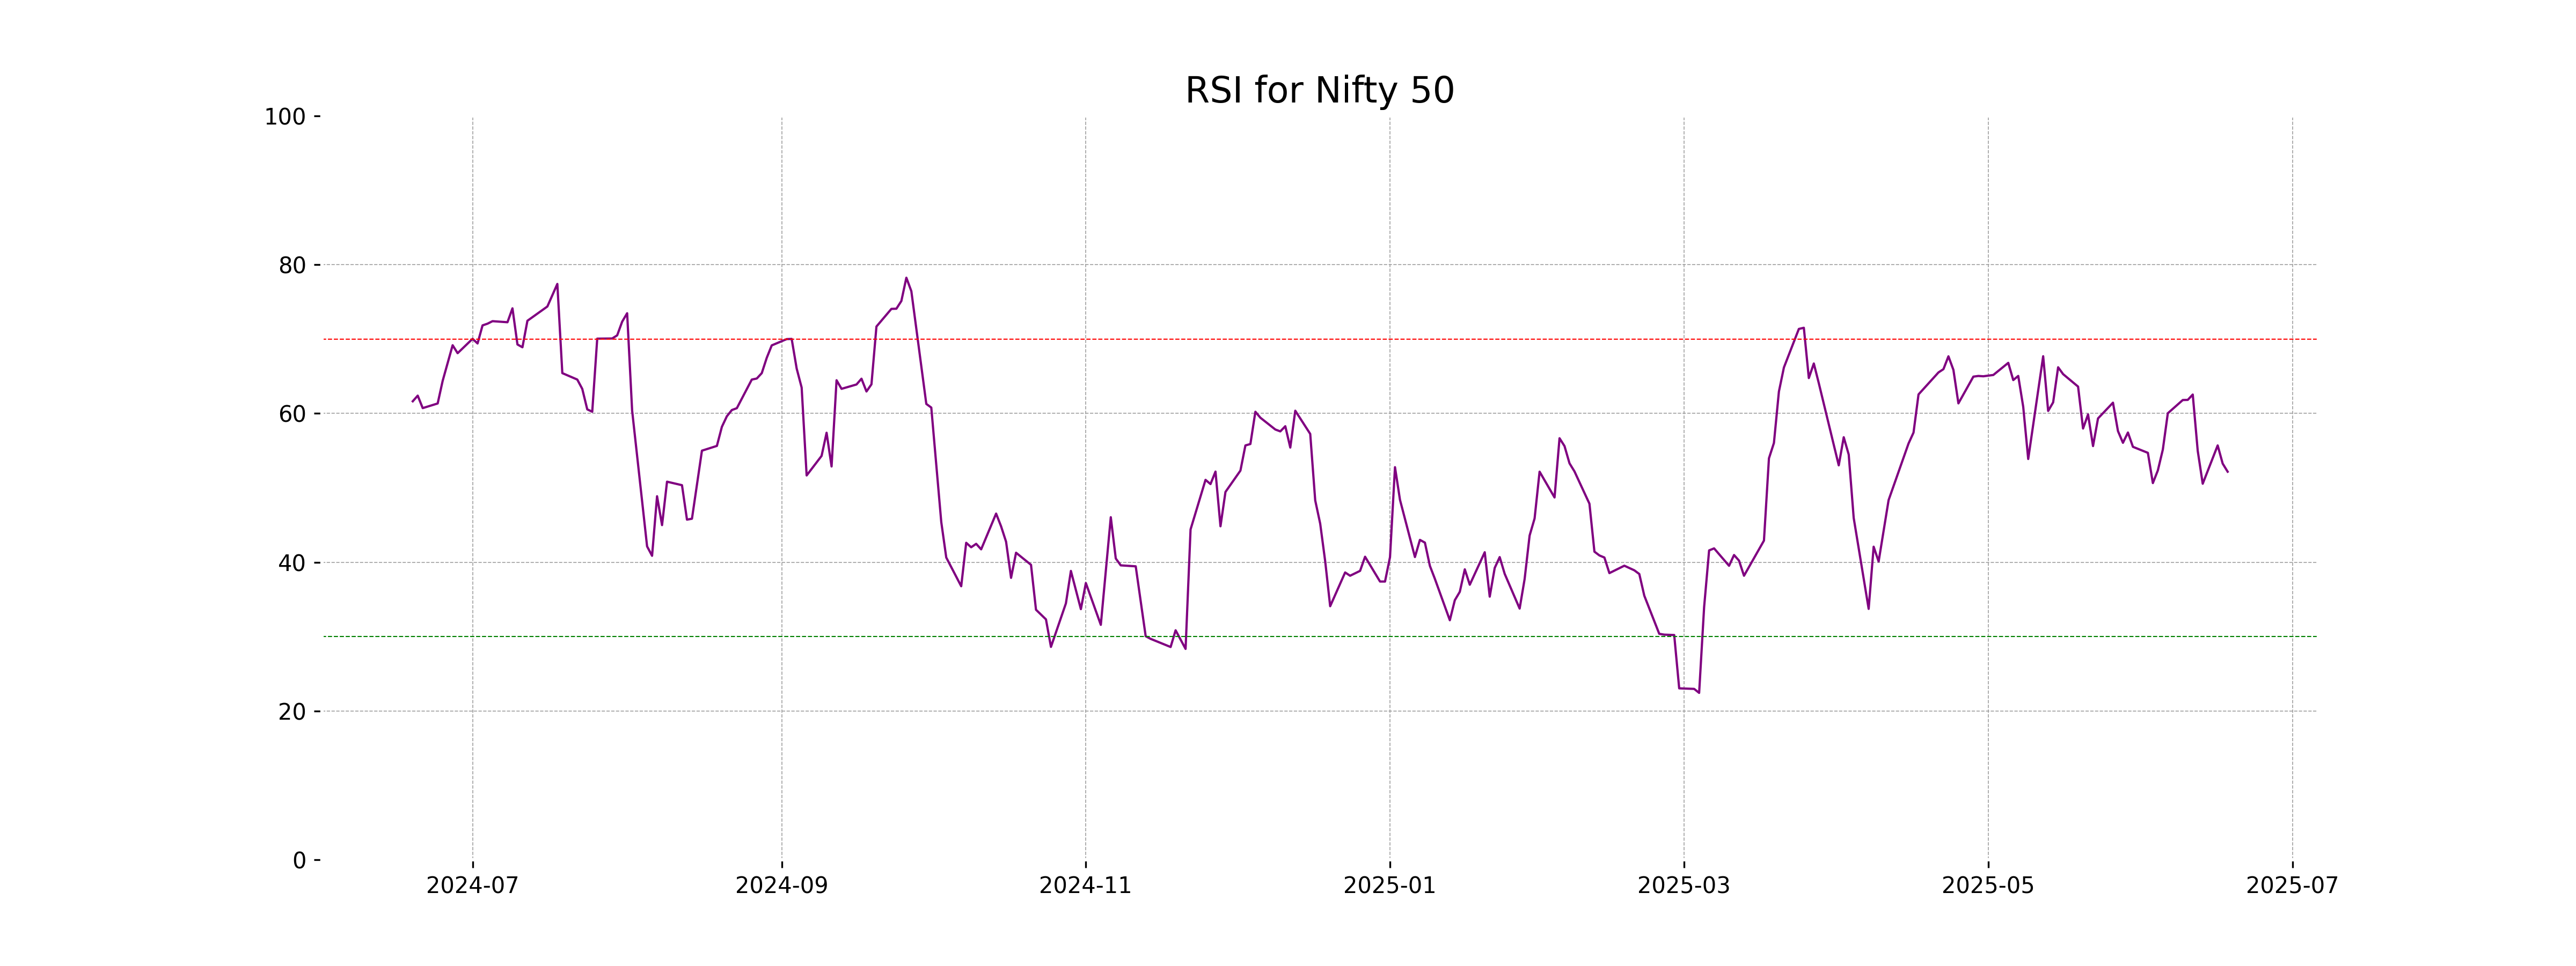
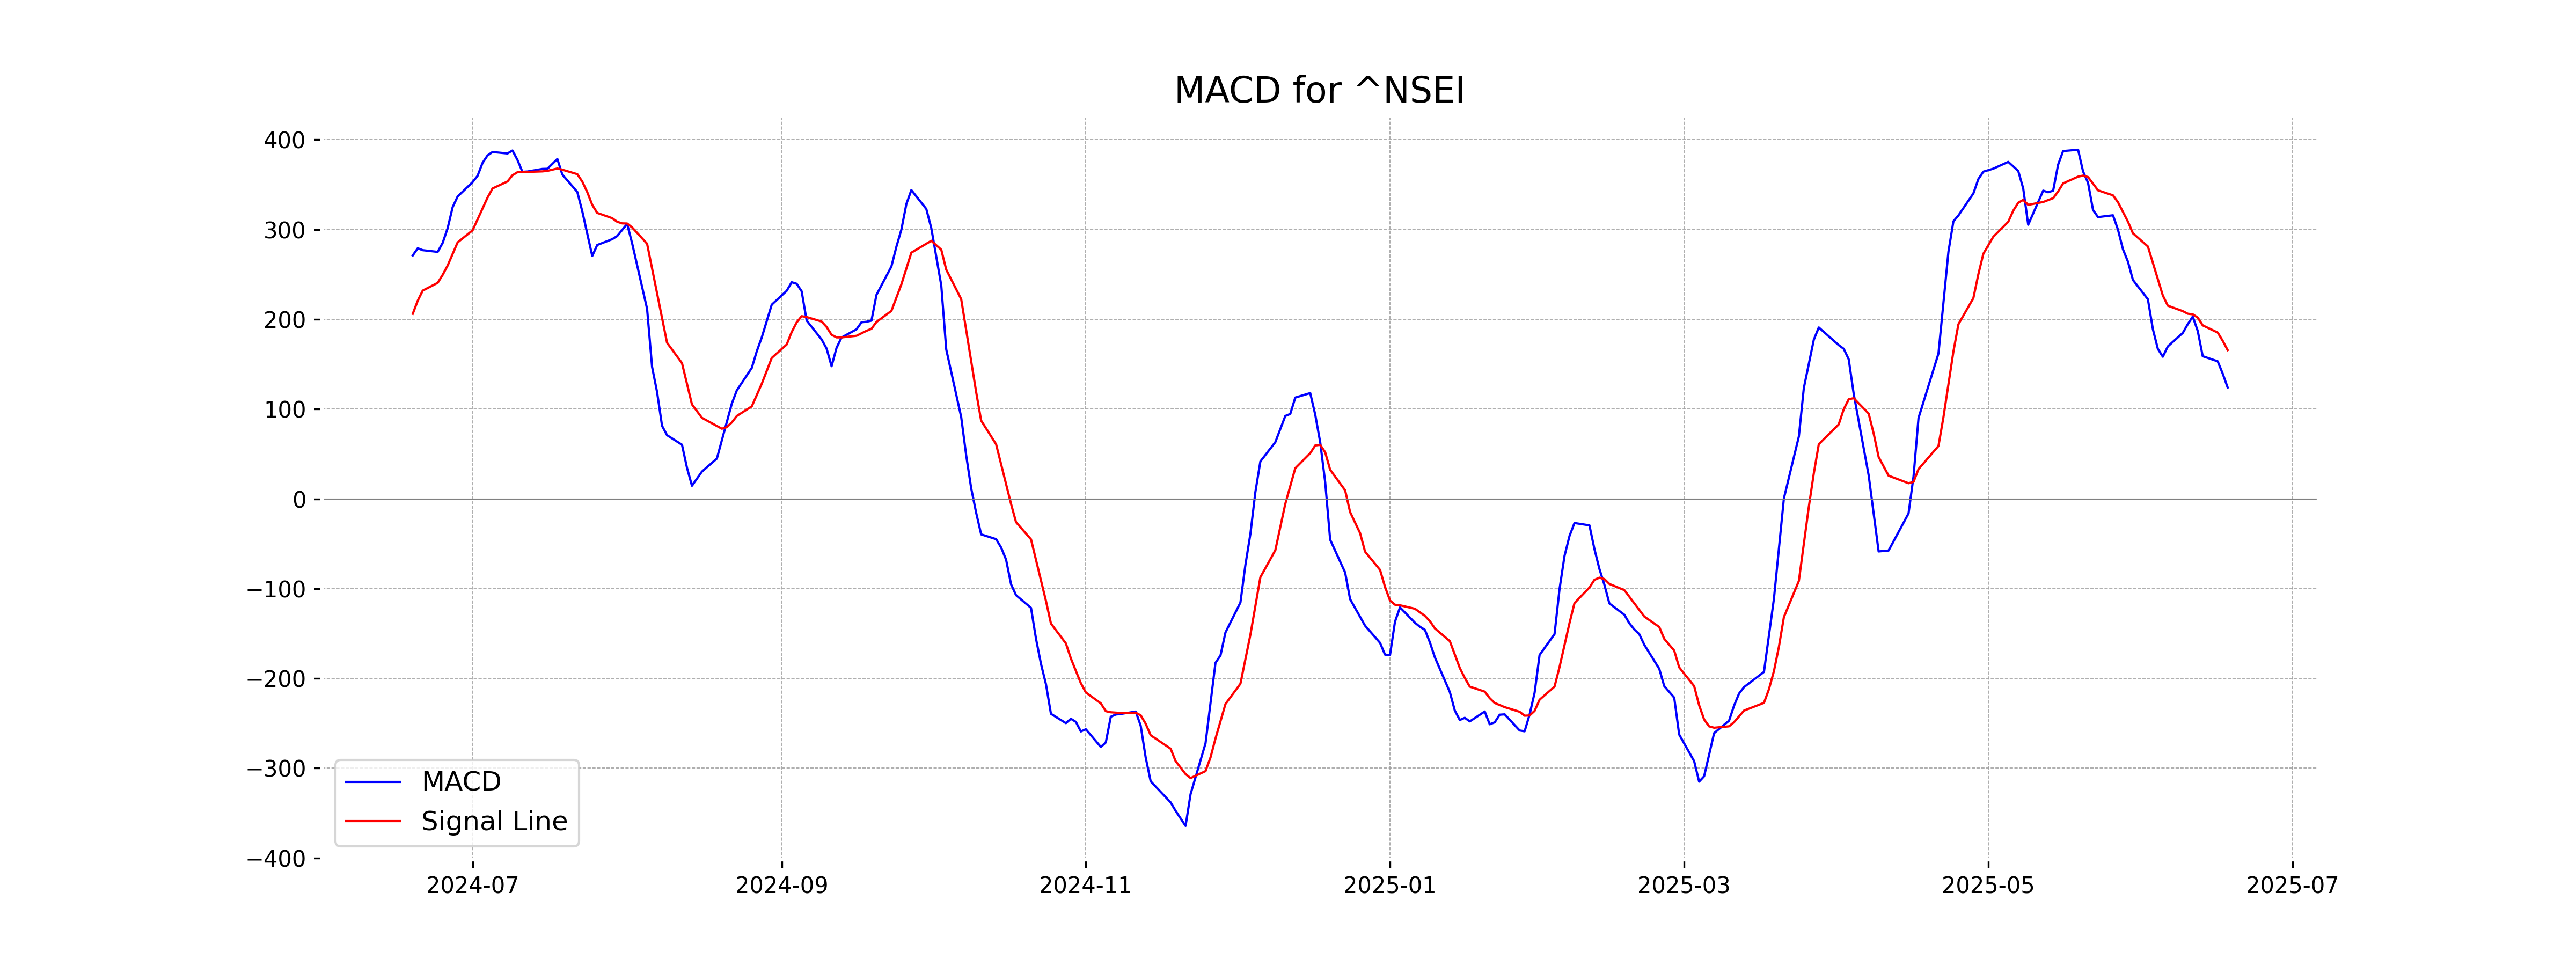
Analysis for Nifty 50 - June 18, 2025
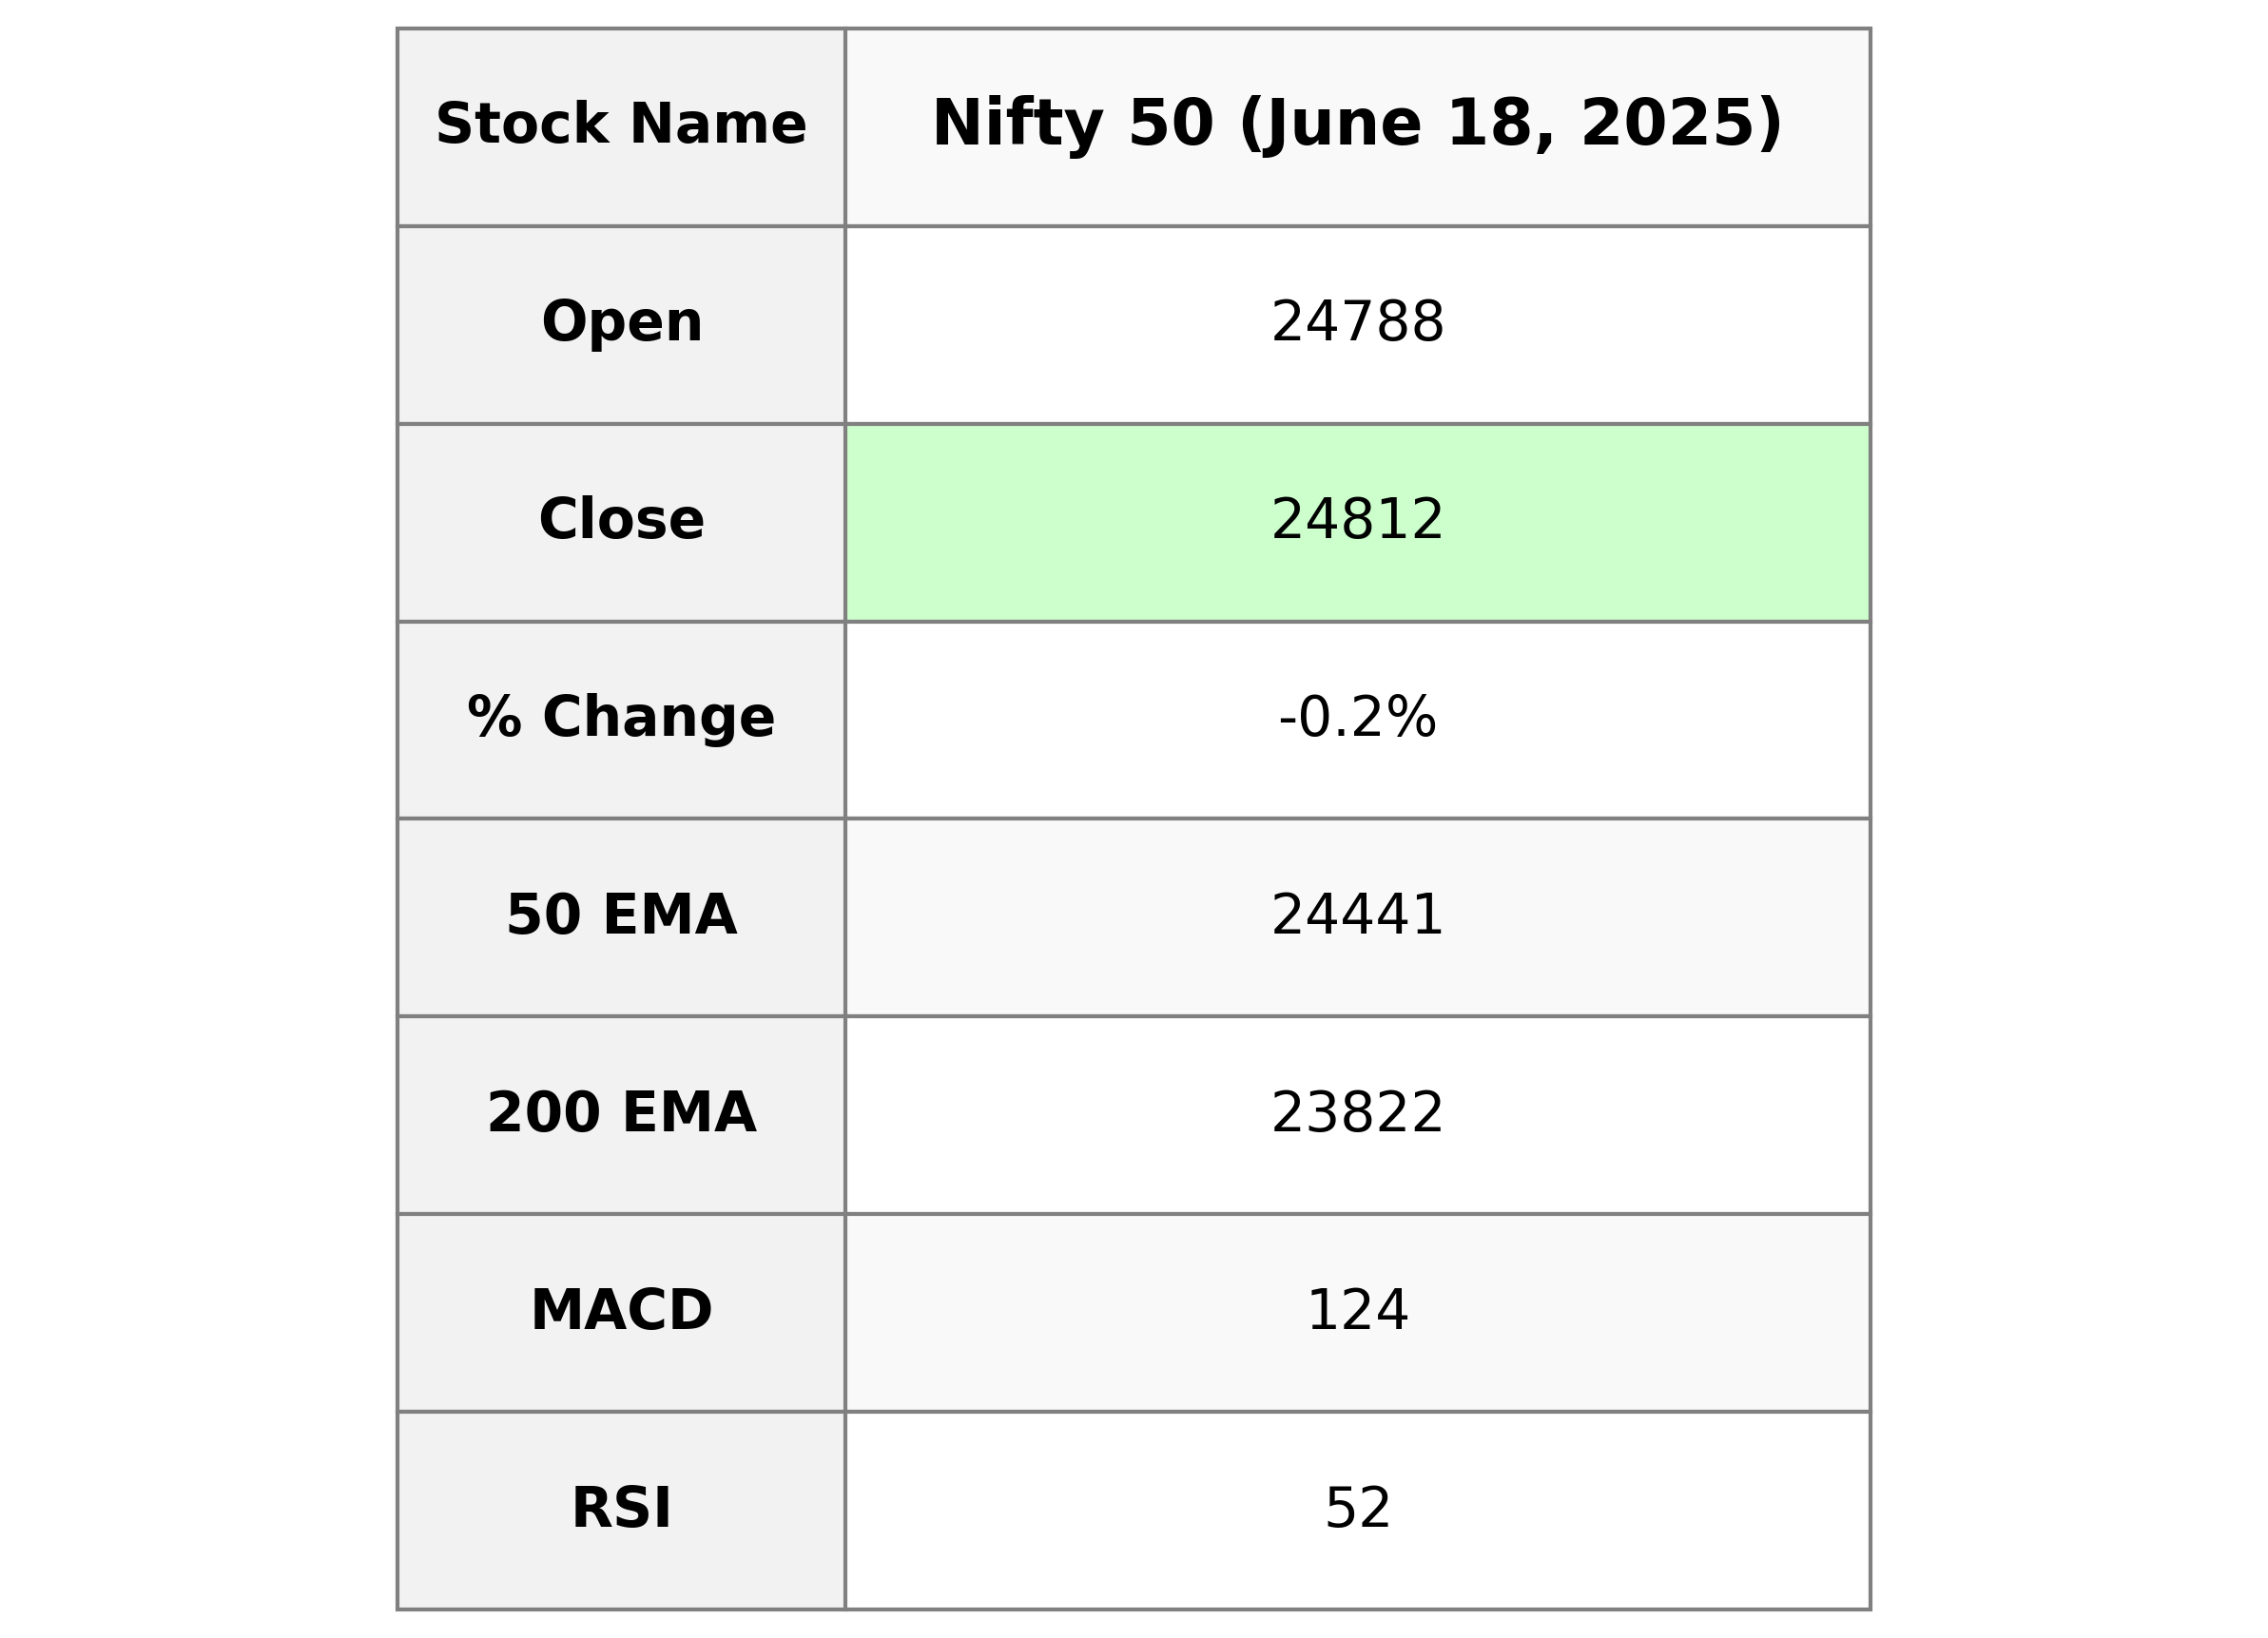
Nifty 50 opened at 24,788.35 and closed slightly lower at 24,812.05, marking a modest decline of 0.17% with a points change of -41.35 from the previous close of 24,853.40. The RSI is neutral at 52.17, and the MACD is below its signal line, suggesting a potential bearish trend.
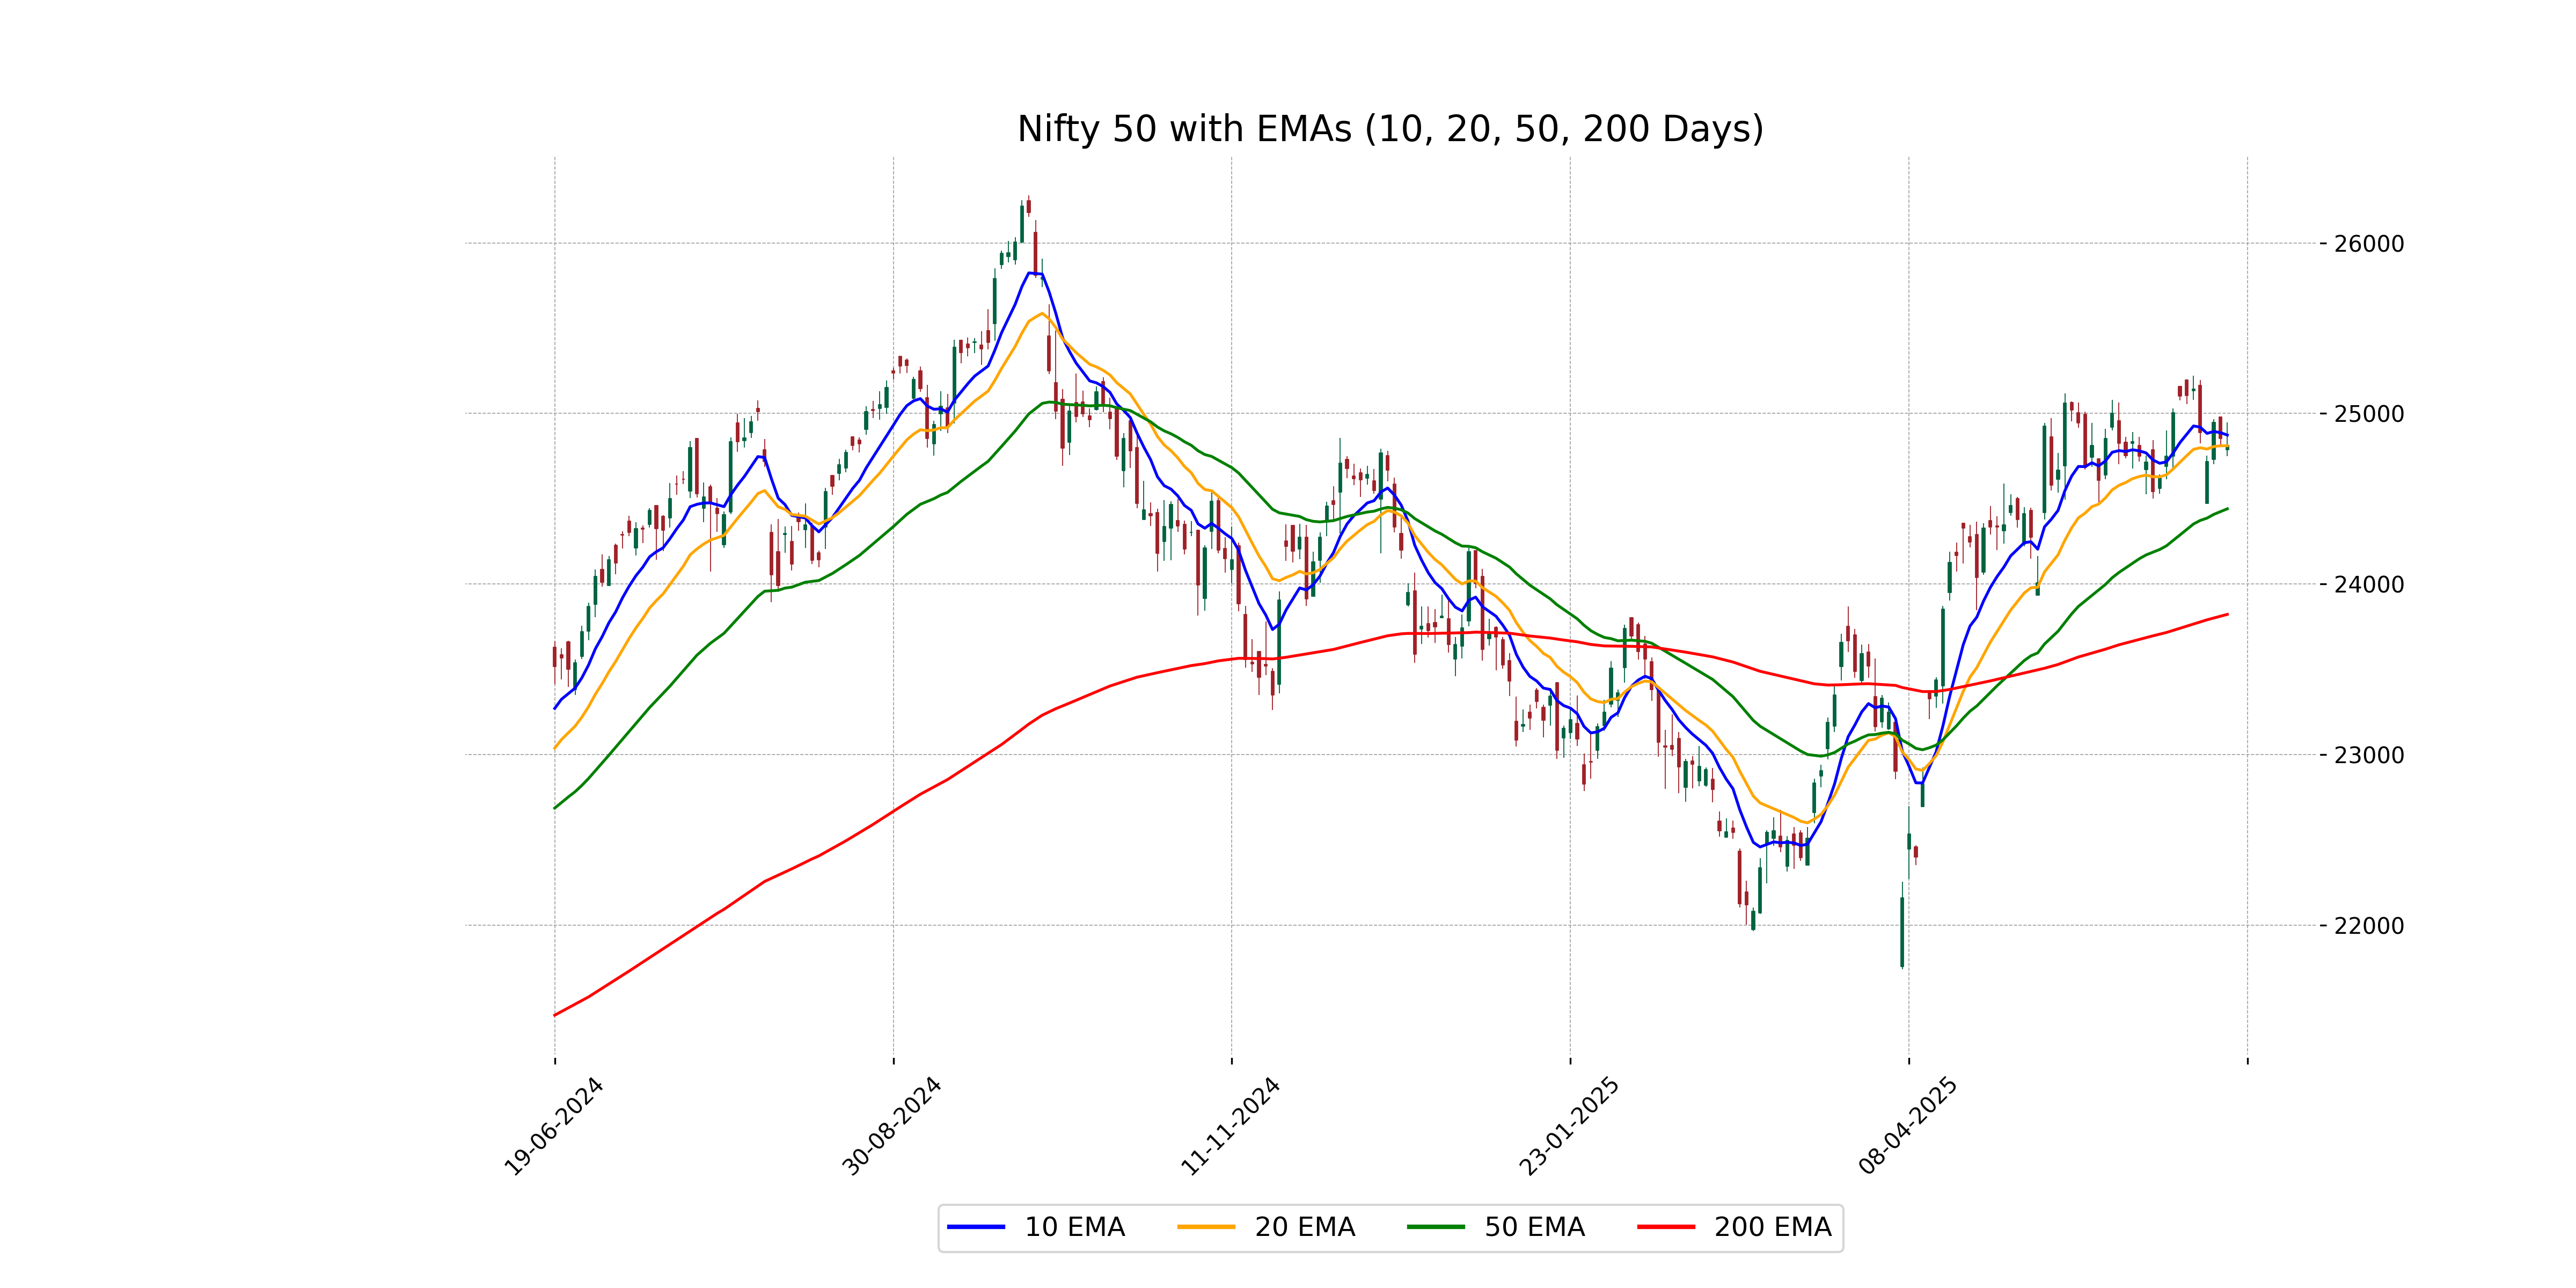
Relationship with Key Moving Averages
Nifty 50 closed below its 10 EMA of 24873.54, indicating a short-term bearish signal, but above the 50 EMA of 24441.15 and 200 EMA of 23822.43, suggesting the longer-term trend remains upward. The slight decline in price accompanied by a negative MACD indicates potential short-term weakness.
Moving Averages Trend (MACD)
The MACD value of 124.04 compared to the MACD Signal of 165.72 for Nifty 50 indicates a bearish crossover, suggesting potential downward momentum. The low RSI of 52.17 supports this view, as it suggests limited buying pressure at the moment.
RSI Analysis
Based on the stock data, the RSI value for Nifty 50 is 52.17, which indicates a neutral market trend. This suggests that the stock is neither overbought nor oversold and may continue to move sideways unless influenced by external factors.