Global stock market indices: How the world markets performed today - 14 July 2025
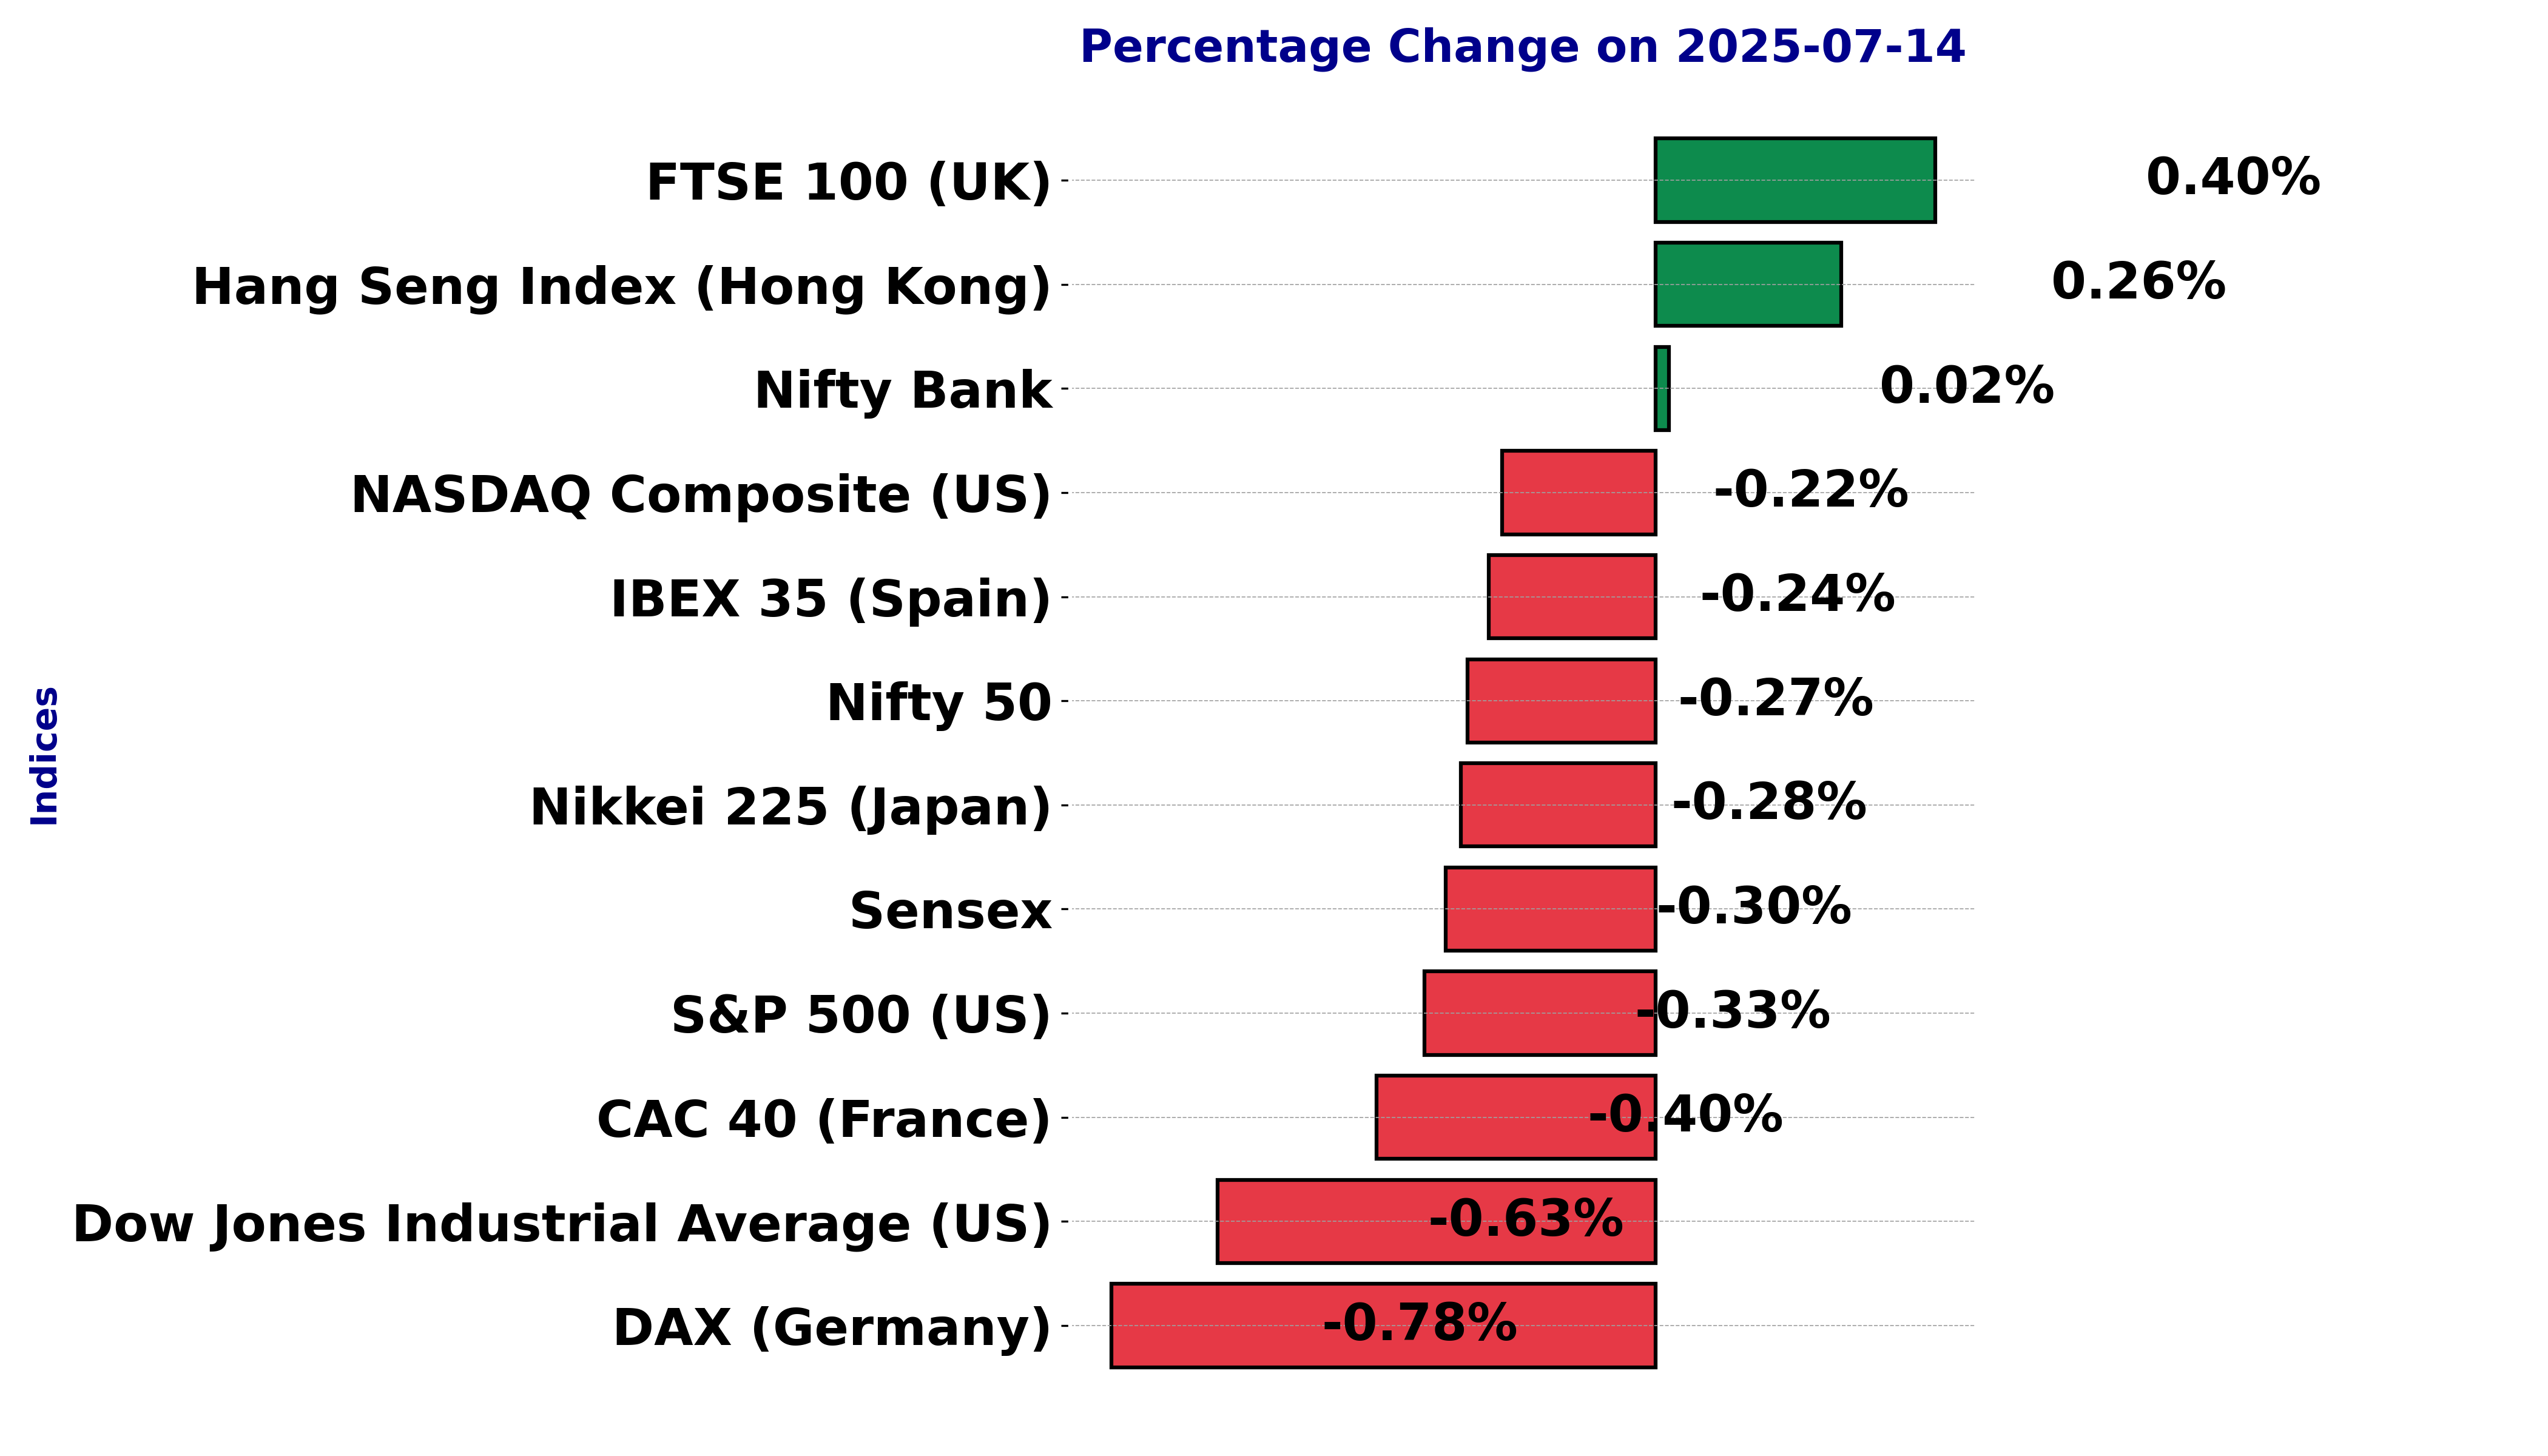
The international stock market indices showed varied performances on July 14, 2025, reflecting the economic sentiment across different regions.
In this article, we analyze the performance of key global indices including the S&P 500, Dow Jones Industrial Average, NASDAQ Composite, FTSE 100, DAX, CAC 40, IBEX 35, Nikkei 225, Hang Seng, Nifty 50, and BSE Sensex.
Analysis for Sensex - July 14, 2025
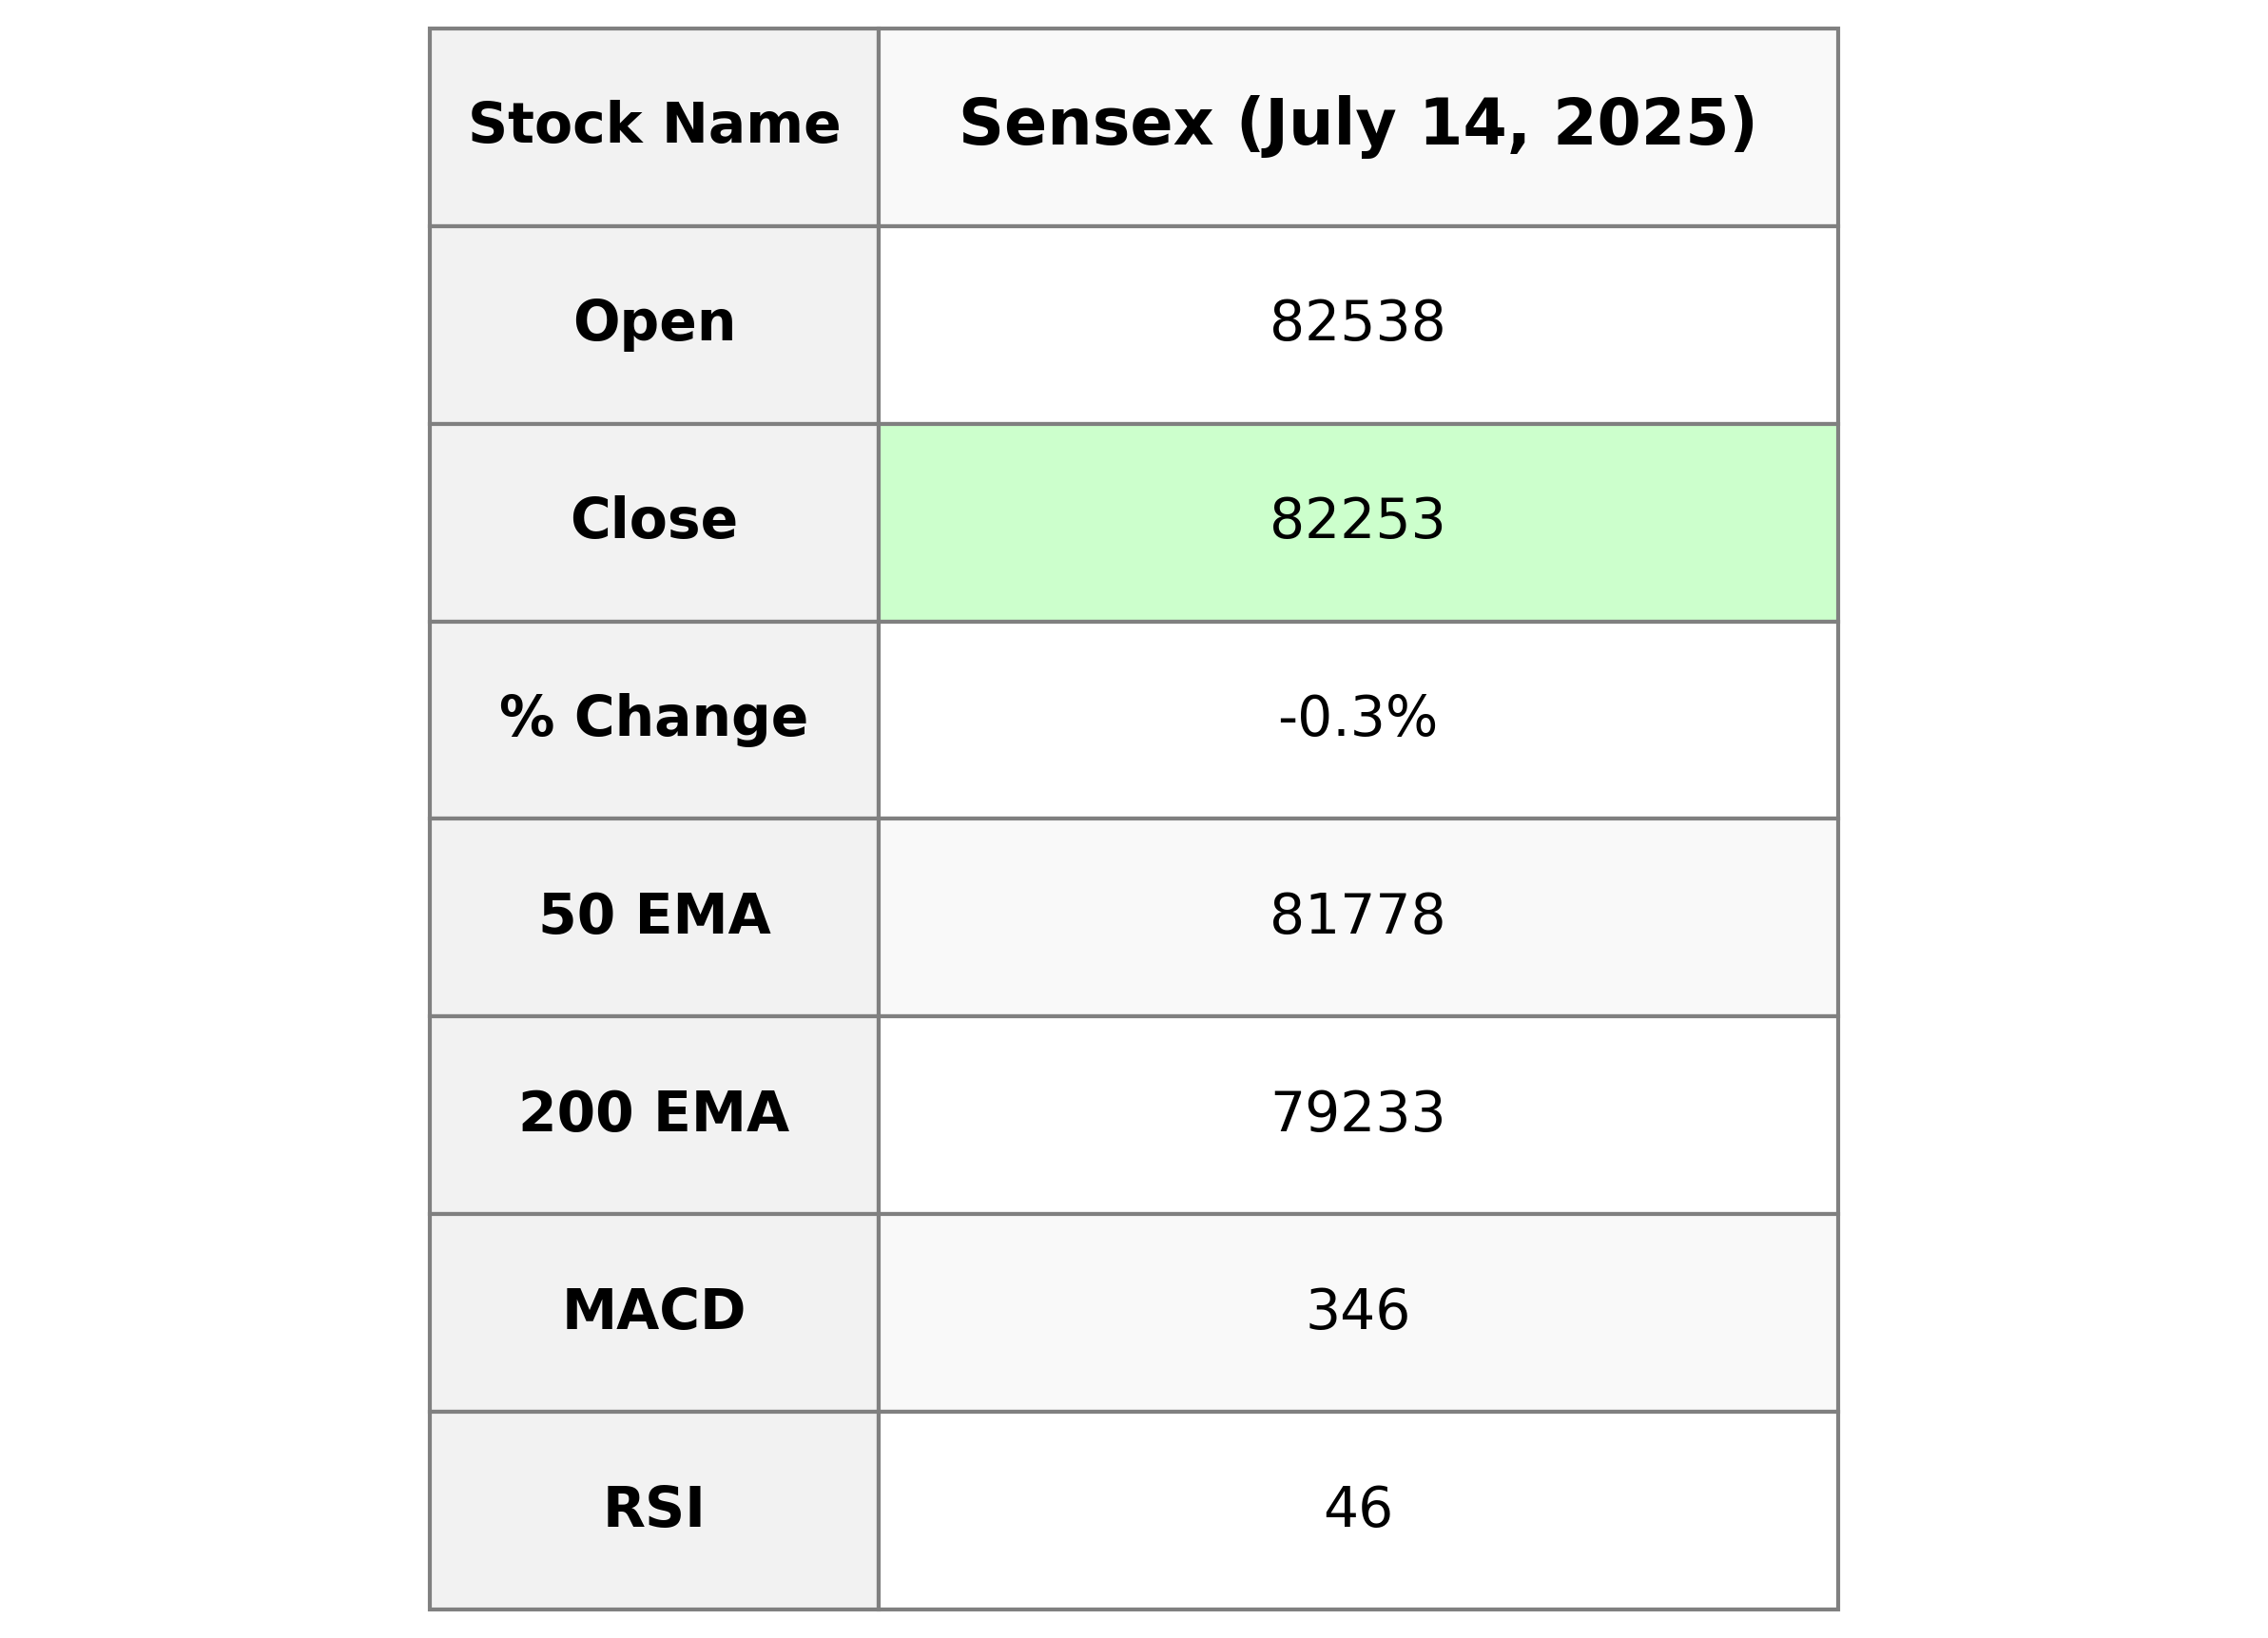
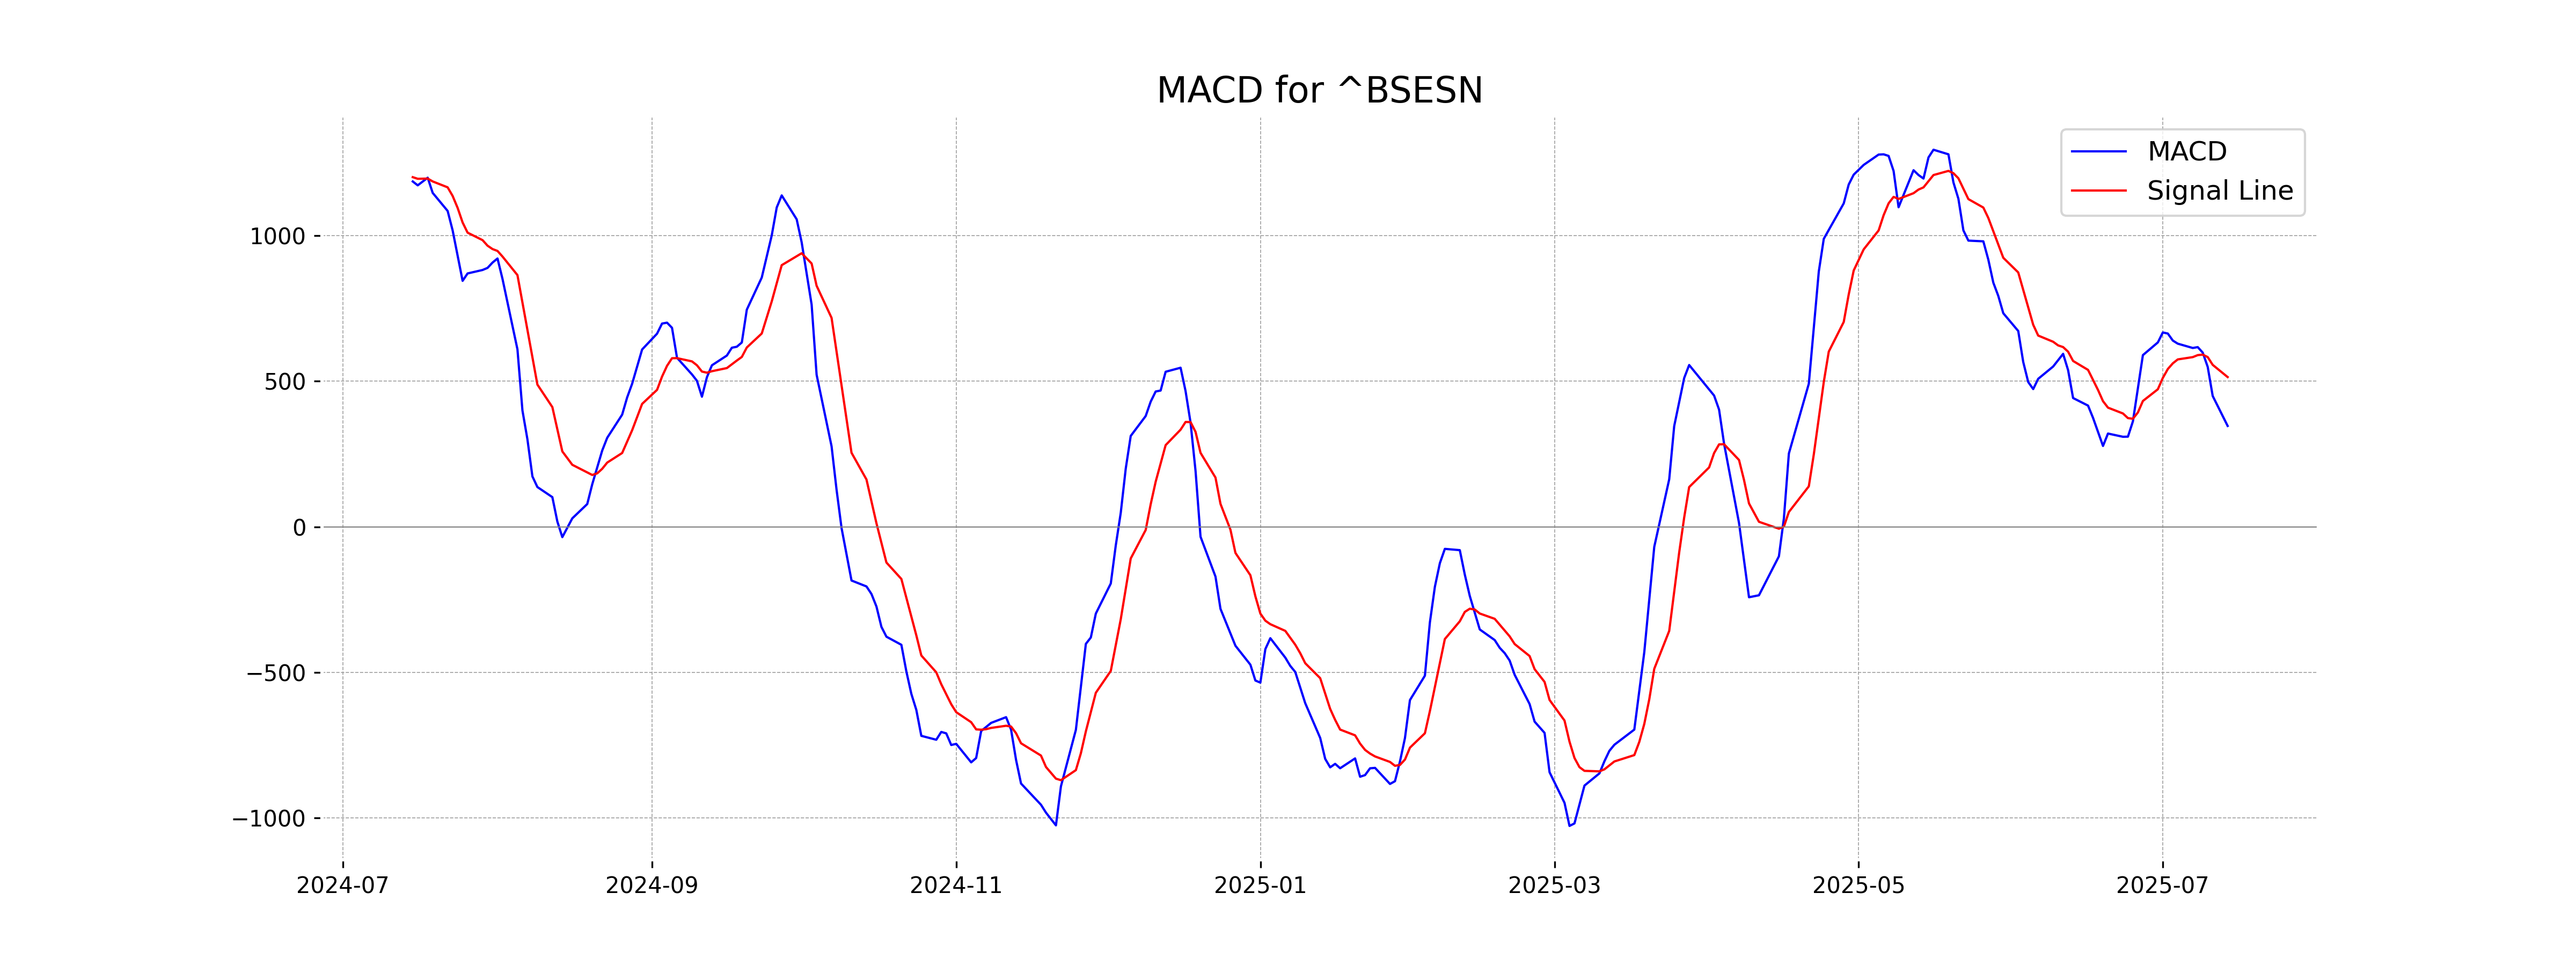
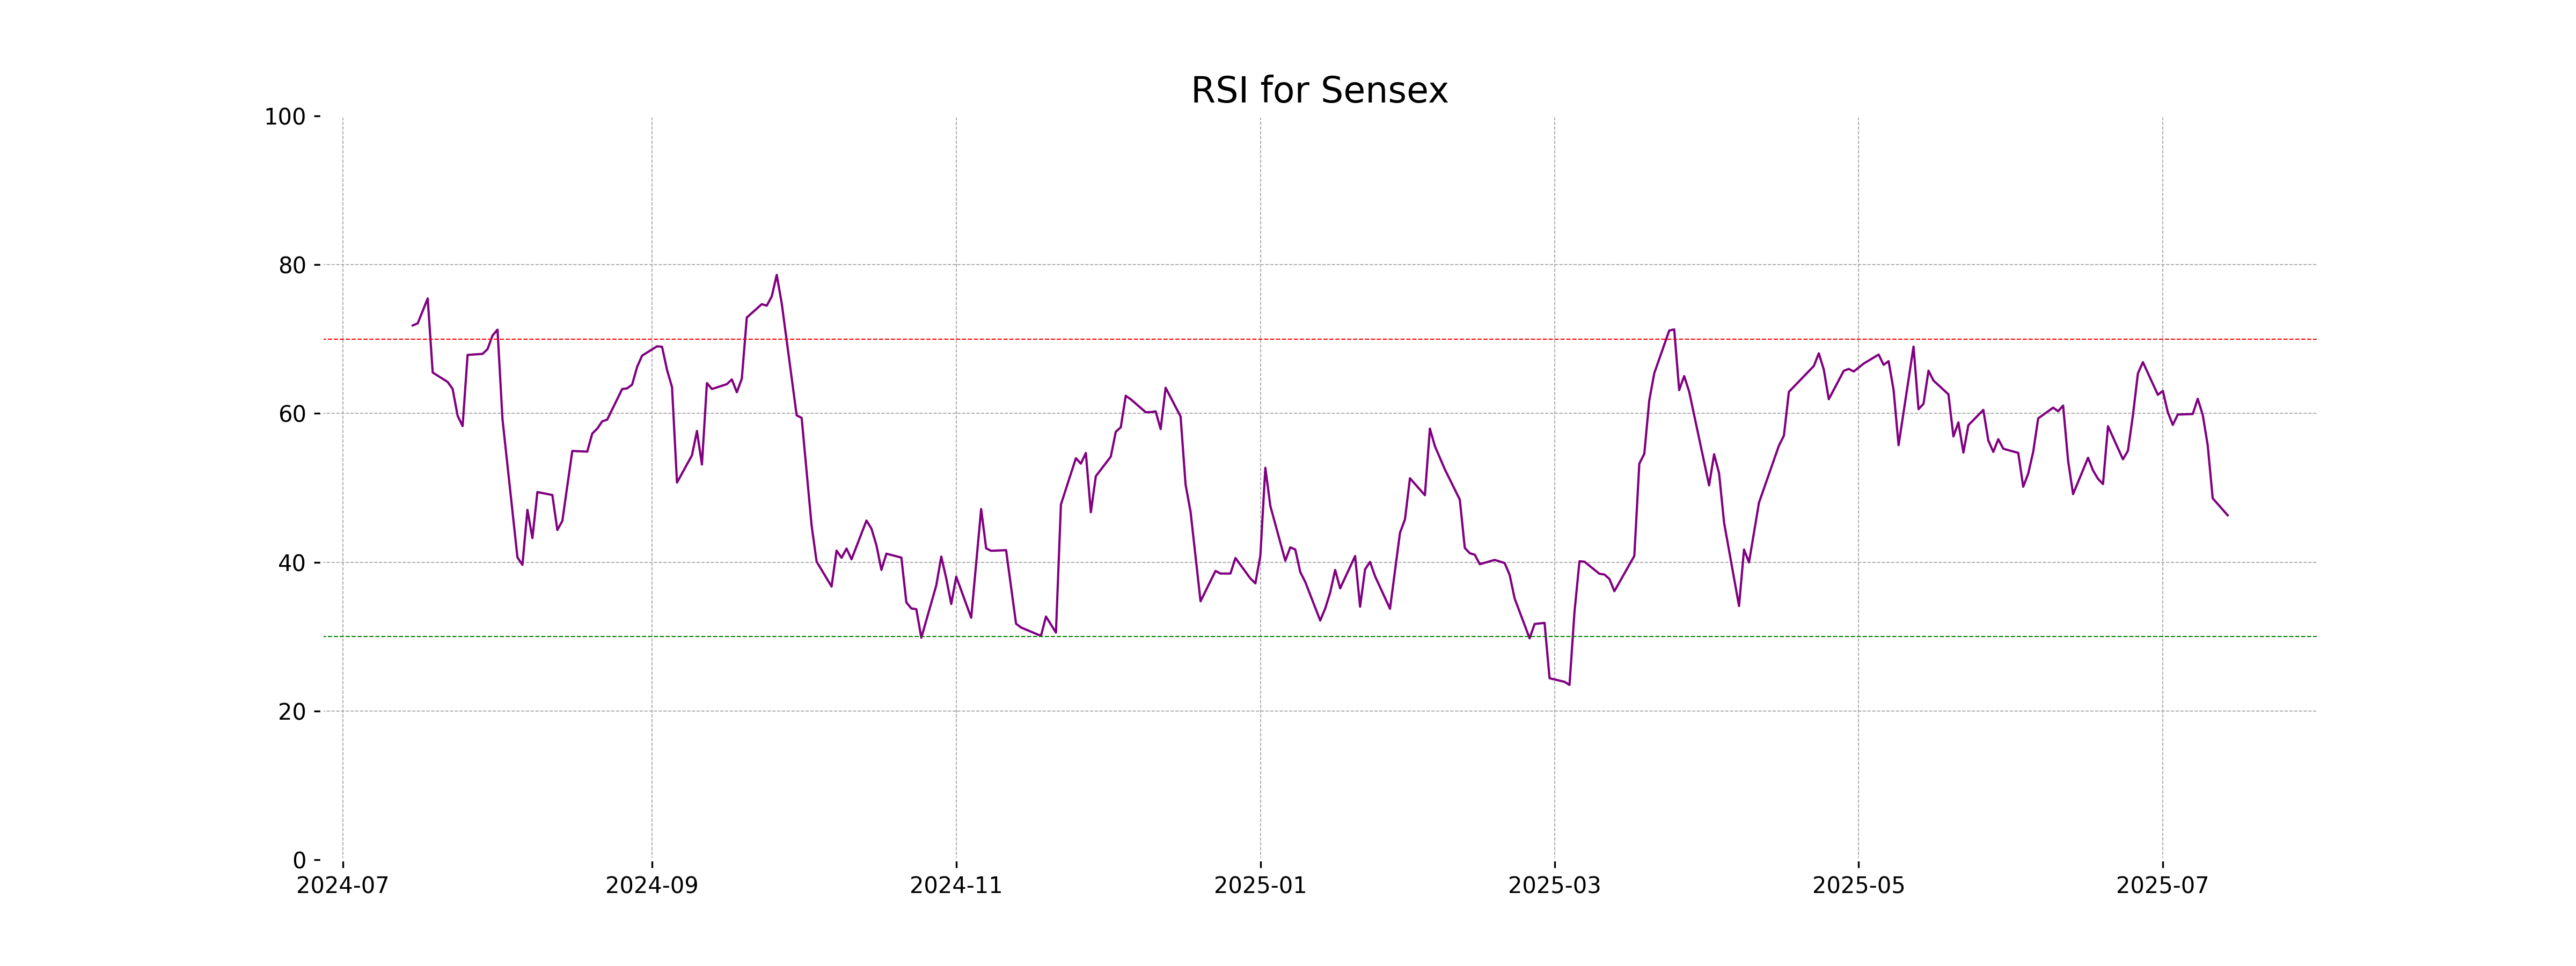
Sensex opened at 82,537.87 and closed at 82,253.46, marking a slight decline with a % change of -0.299%. The index experienced a drop of 247.01 points in trading activity, although no trading volume data is available. The 50 and 200 EMAs are 81,778.42 and 79,233.30 respectively, while the 10 and 20 EMAs are higher, indicating potential short-term fluctuations. With an RSI of 46.31, the sentiment is neutral to slightly bearish, and the MACD of 346.24 is below its signal line, indicating bearish momentum.
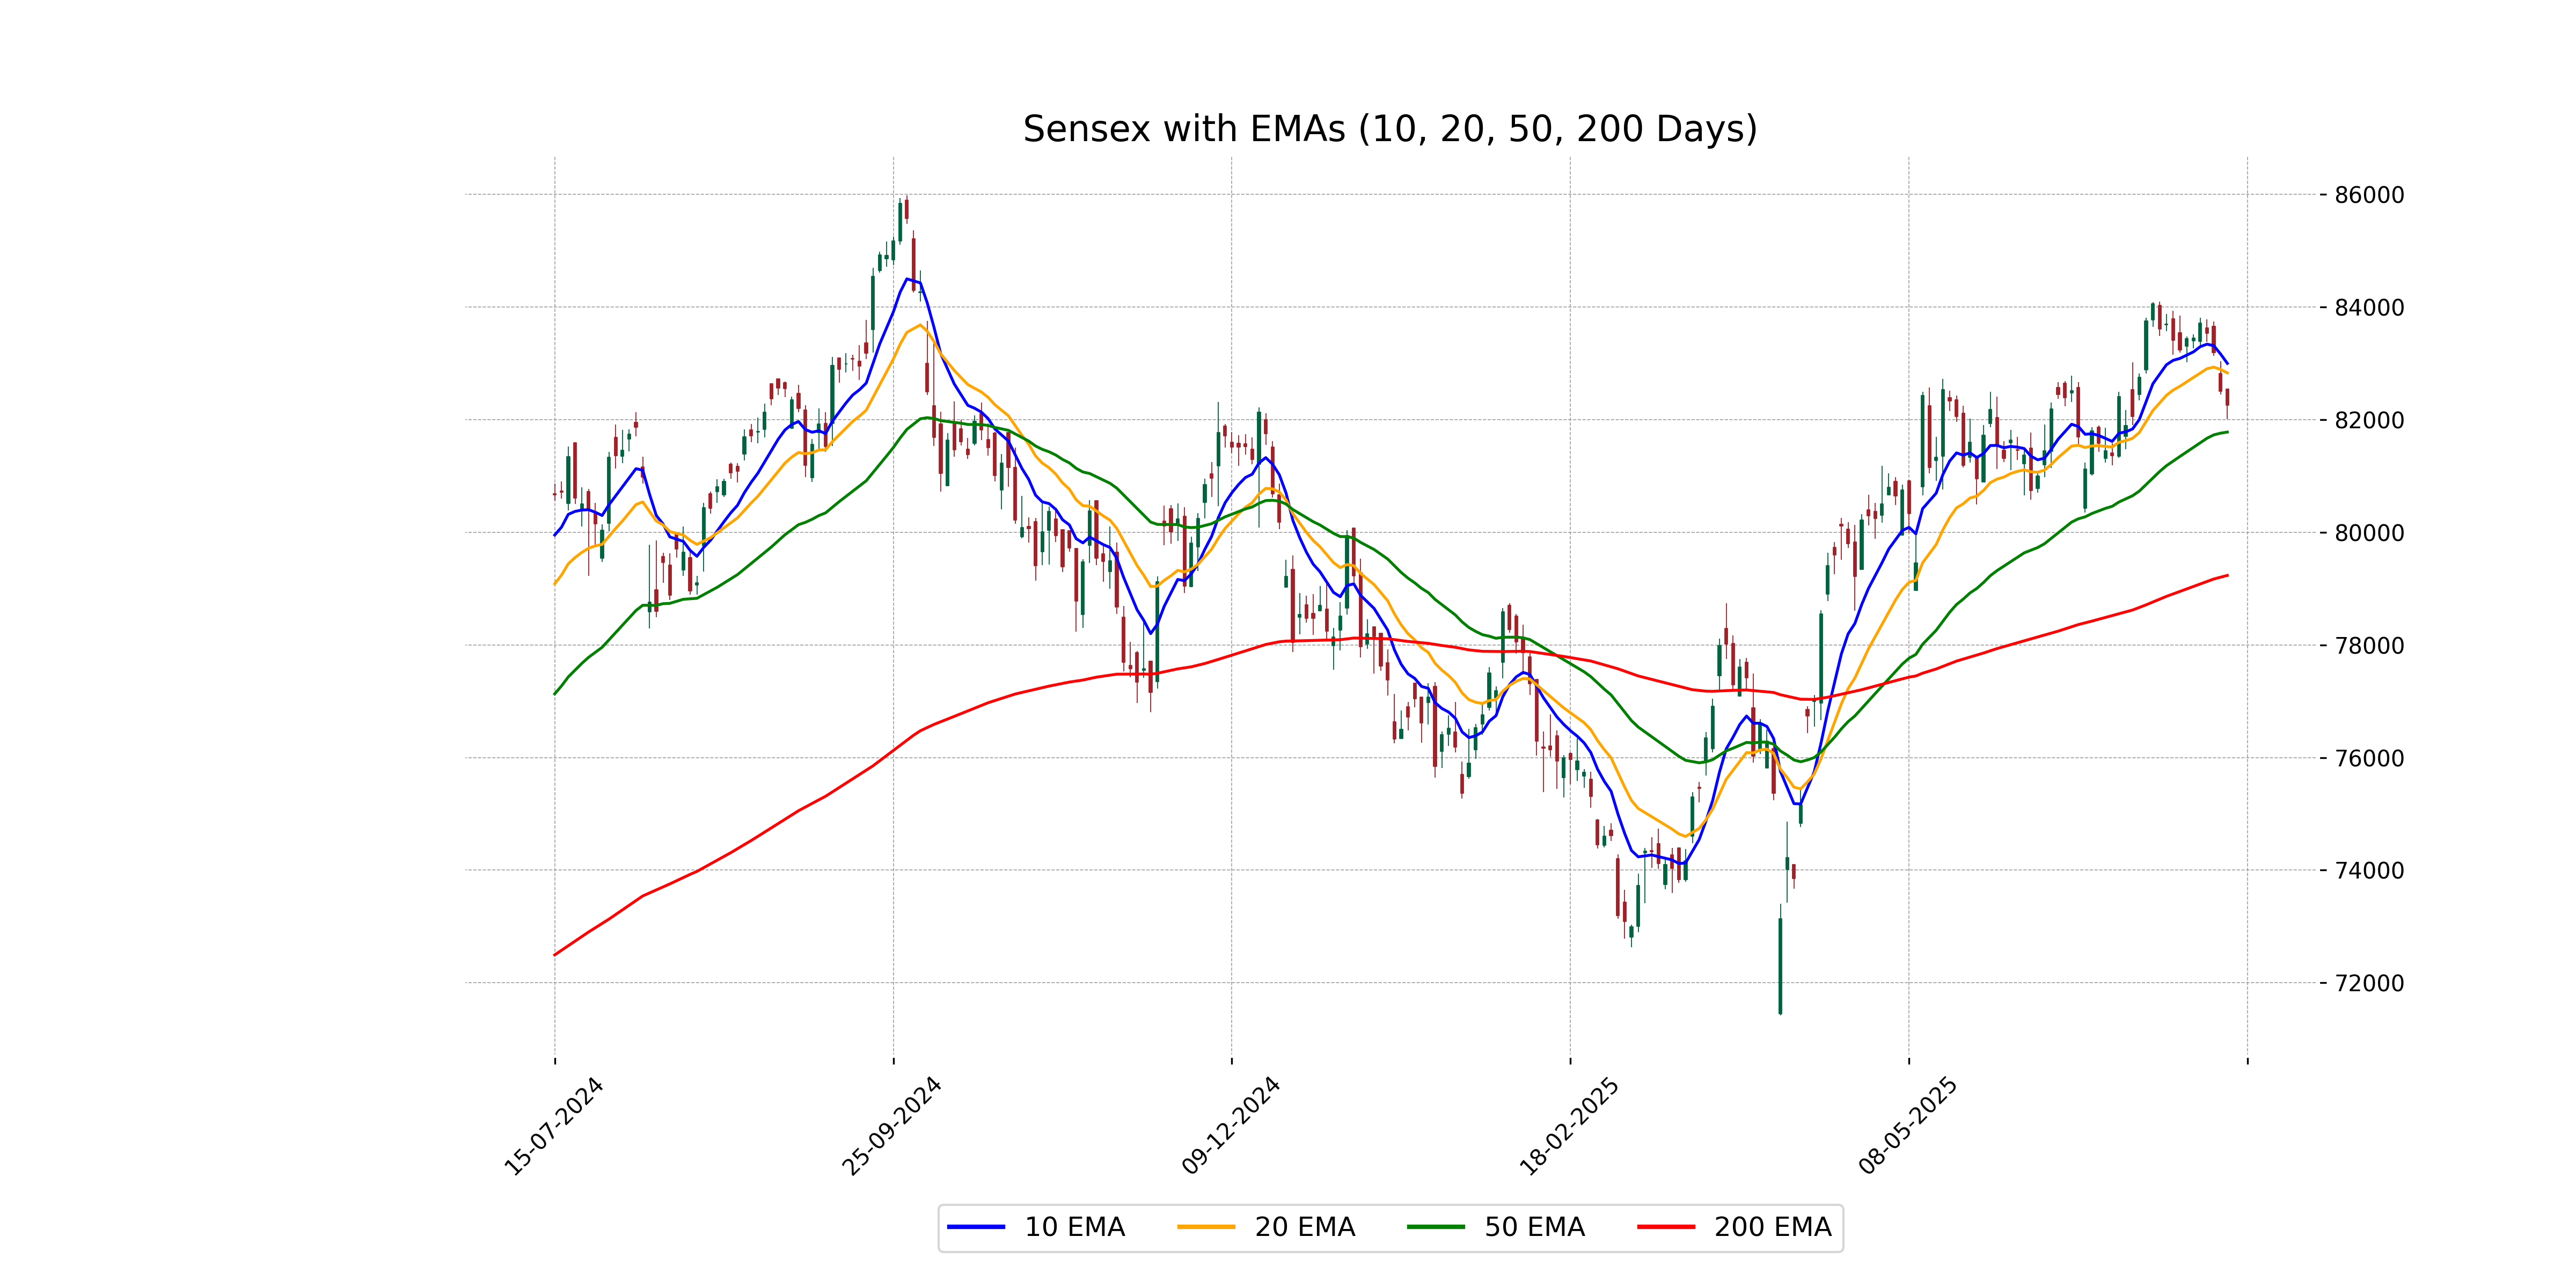
Relationship with Key Moving Averages
Sensex closed below its 10-day and 20-day EMAs, indicating short-term weakness. However, it remains above the 50-day and significantly above the 200-day EMAs, suggesting long-term strength remains intact.
Moving Averages Trend (MACD)
The MACD for the Sensex is 346.24, which is below the MACD Signal of 514.08. This indicates a bearish trend, suggesting that the momentum may be weakening and a potential sell signal could be forming. Keep an eye on further price movements to confirm this trend.
RSI Analysis
The Relative Strength Index (RSI) for Sensex is 46.31, indicating a neutral market sentiment as RSI is below 50. This suggests that the index is neither in an overbought nor oversold condition, implying a possible consolidation phase.
Analysis for Dow Jones Industrial Average (US) - July 14, 2025
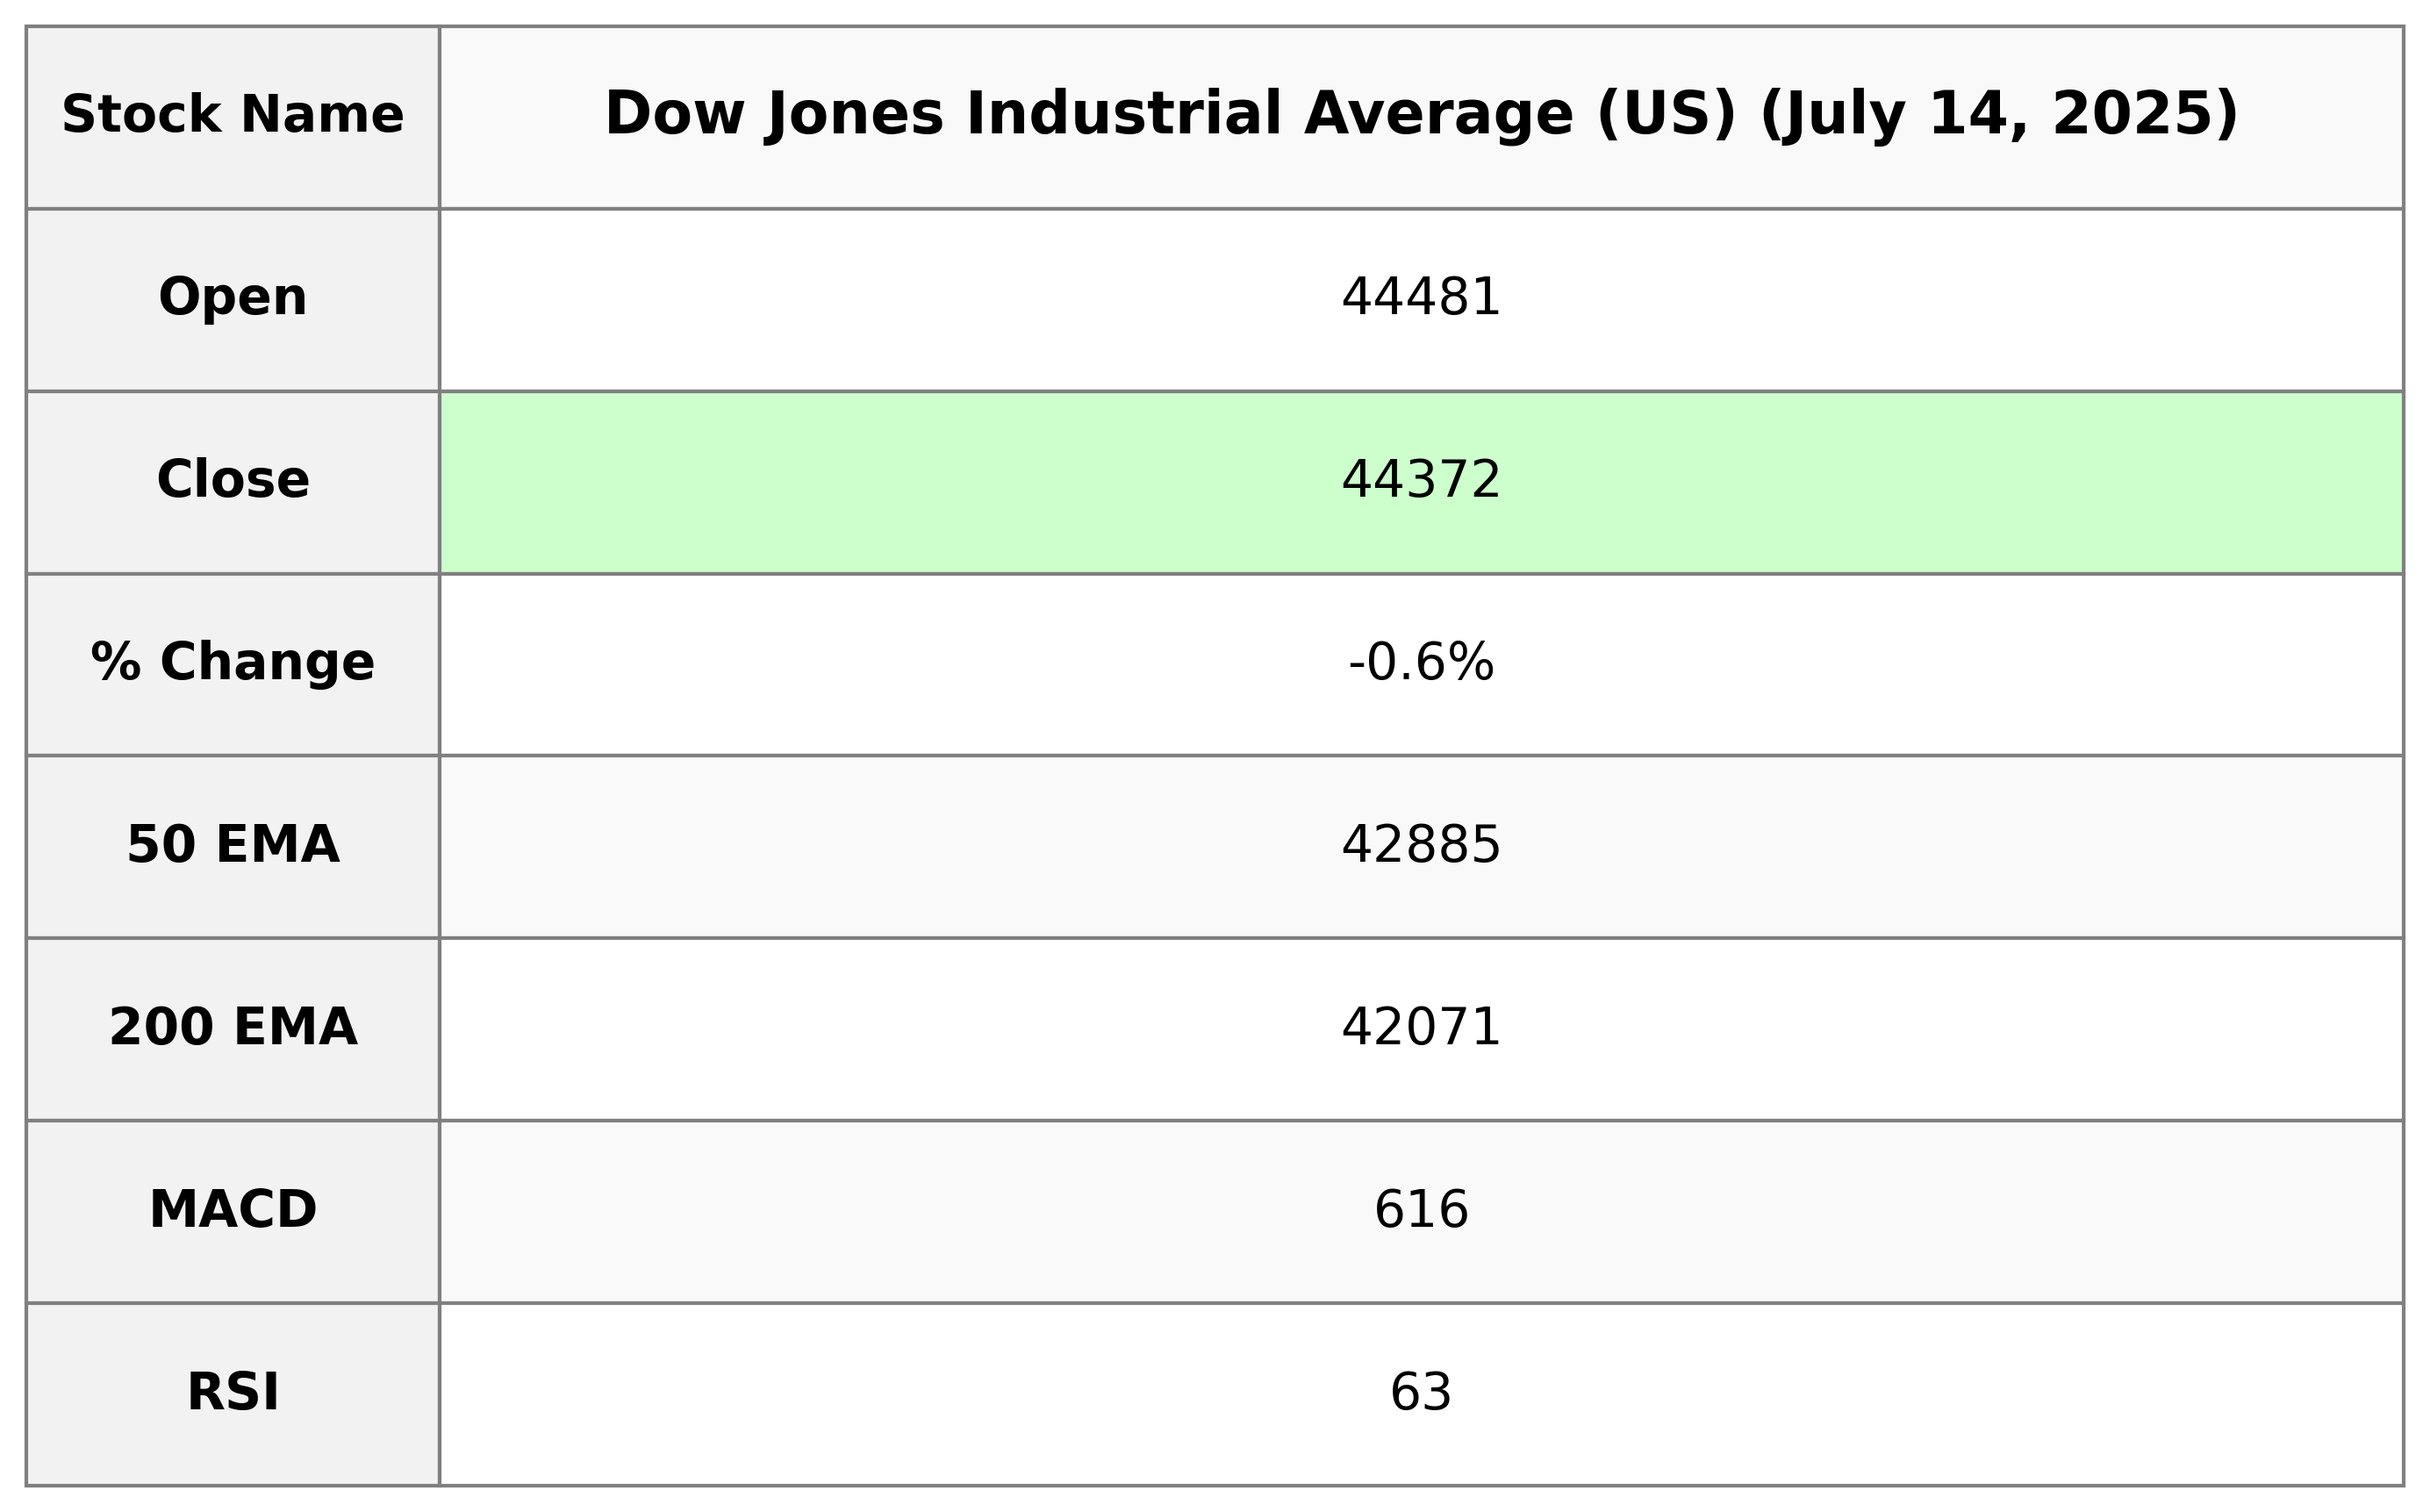
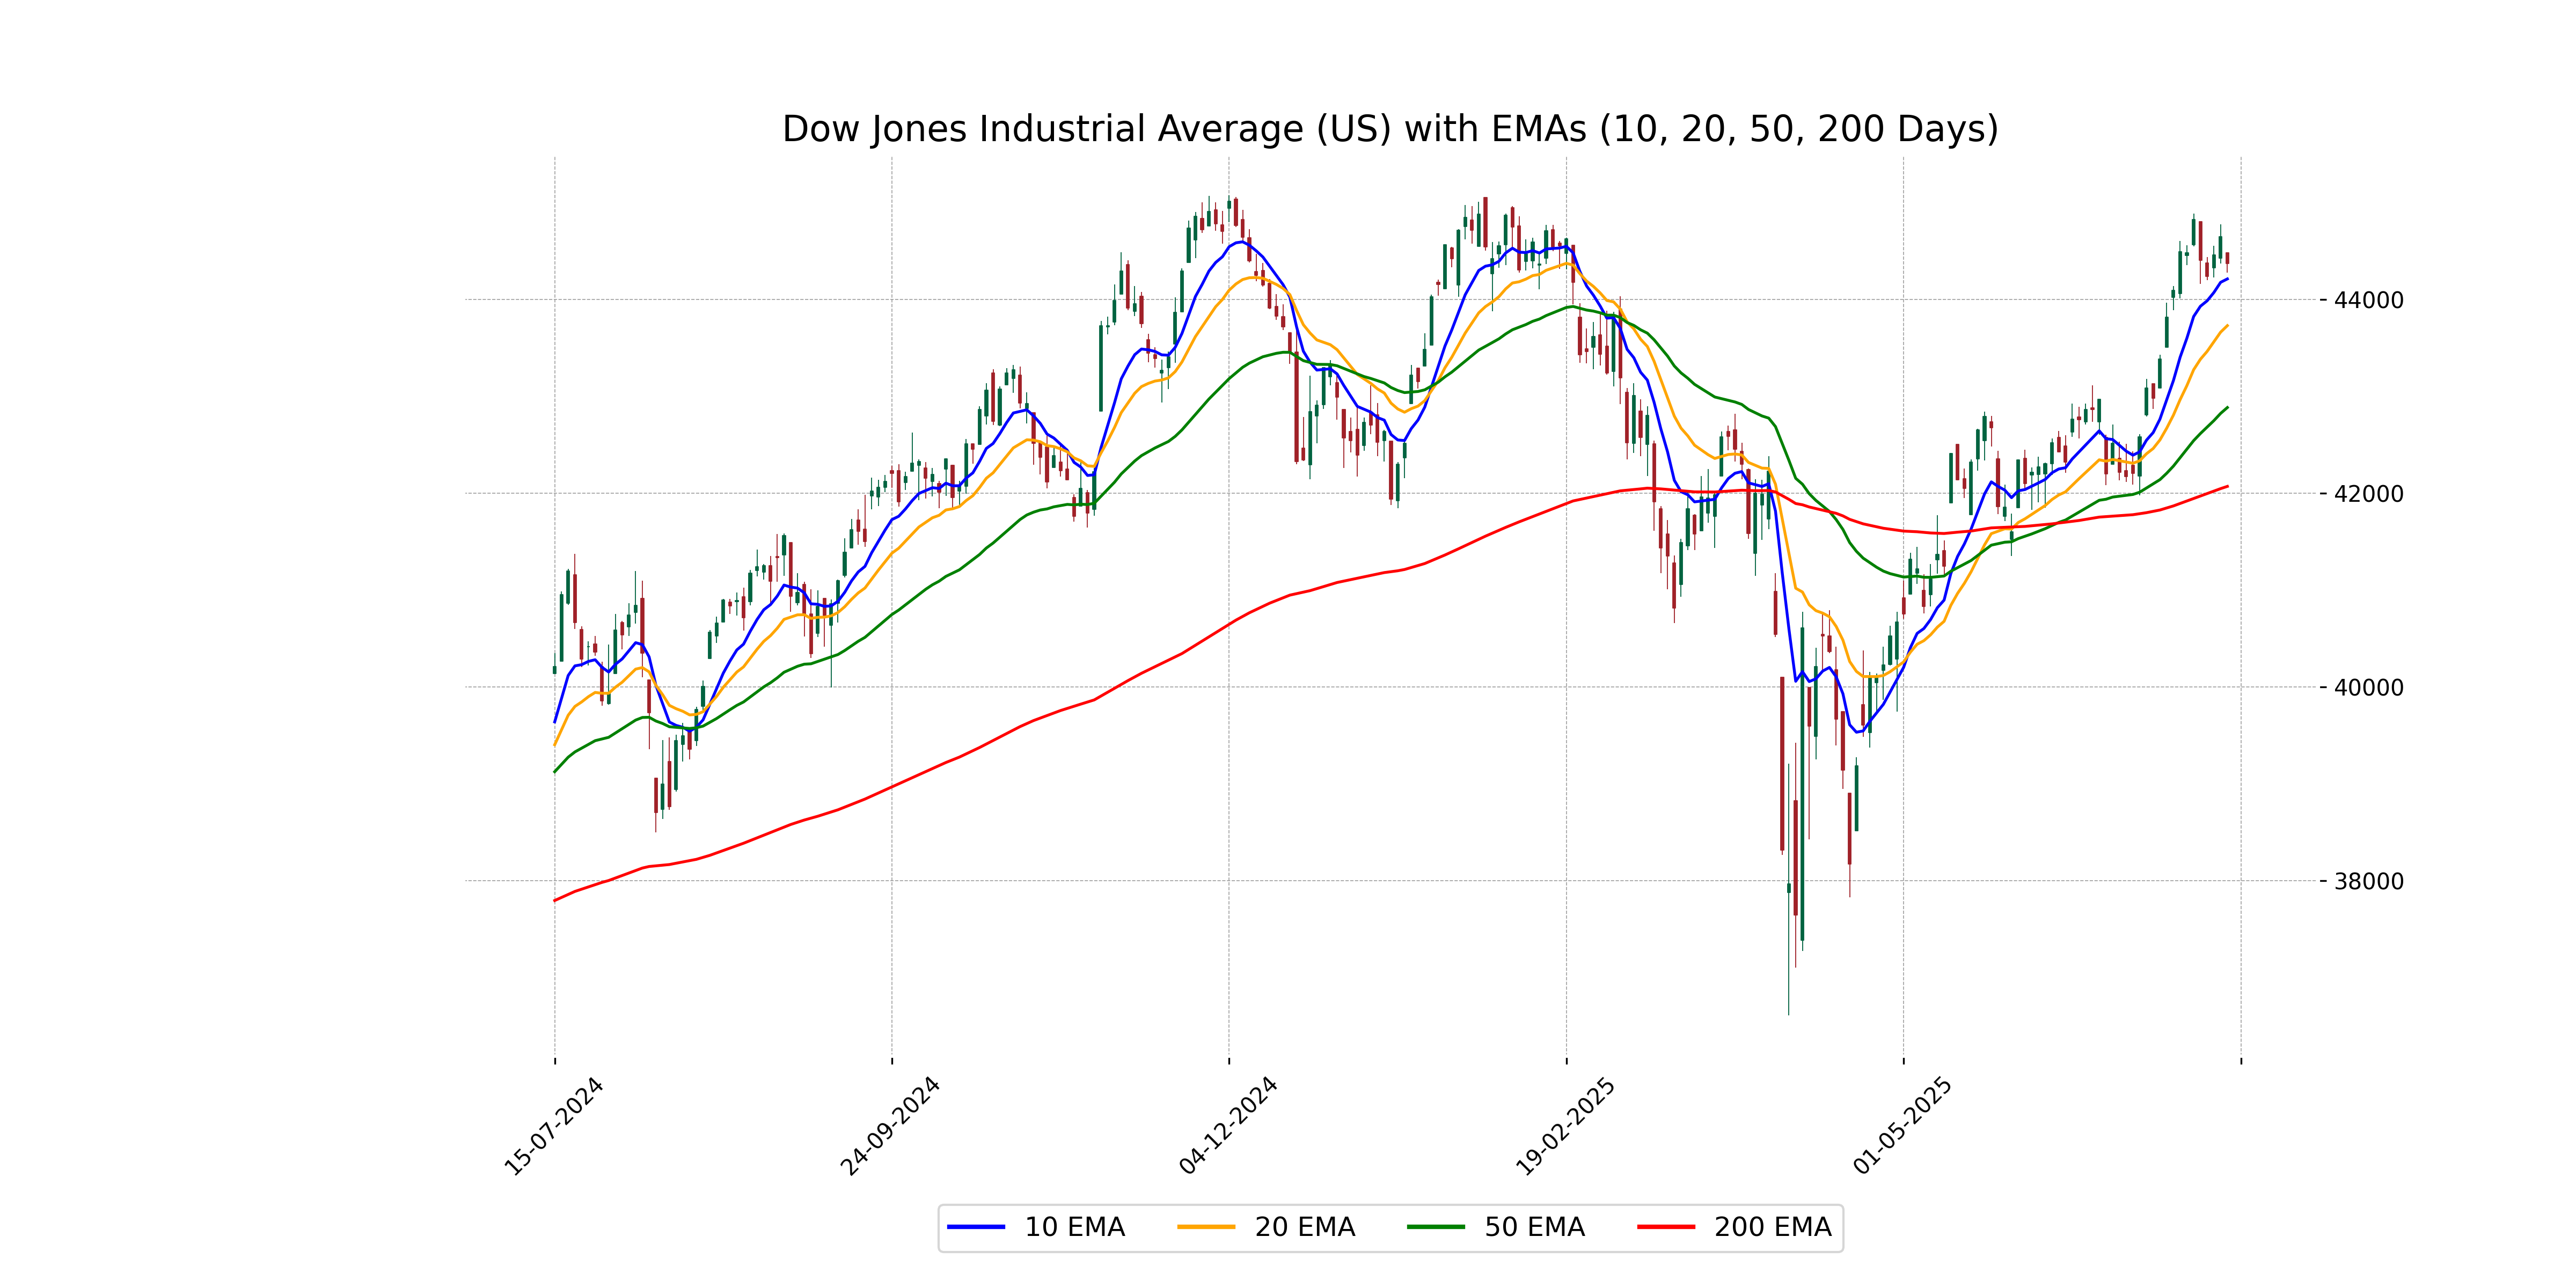
Dow Jones Industrial Average (US) opened at 44480.77 and closed at 44371.51, reflecting a decrease of 279.13 points or approximately -0.63% from the previous close. The index had a high of 44480.77 and a low of 44275.25, with a turnover volume of 474.09 million. The RSI indicates a relatively strong momentum at 63.14, while the MACD value shows a positive divergence from the signal line.
Relationship with Key Moving Averages
The Dow Jones Industrial Average is trading above its 50-day EMA of 42,885.20 and 200-day EMA of 42,071.09, indicating a potential upward trend. However, it closed slightly below the 10-day EMA of 44,212.98, which could suggest some short-term weakness.
Moving Averages Trend (MACD)
The Dow Jones Industrial Average shows a MACD of 616.31 which is above the MACD Signal of 566.88. This suggests a positive bullish momentum in the short term, indicating potential upward movement. However, investors should consider other indicators and market conditions before making decisions.
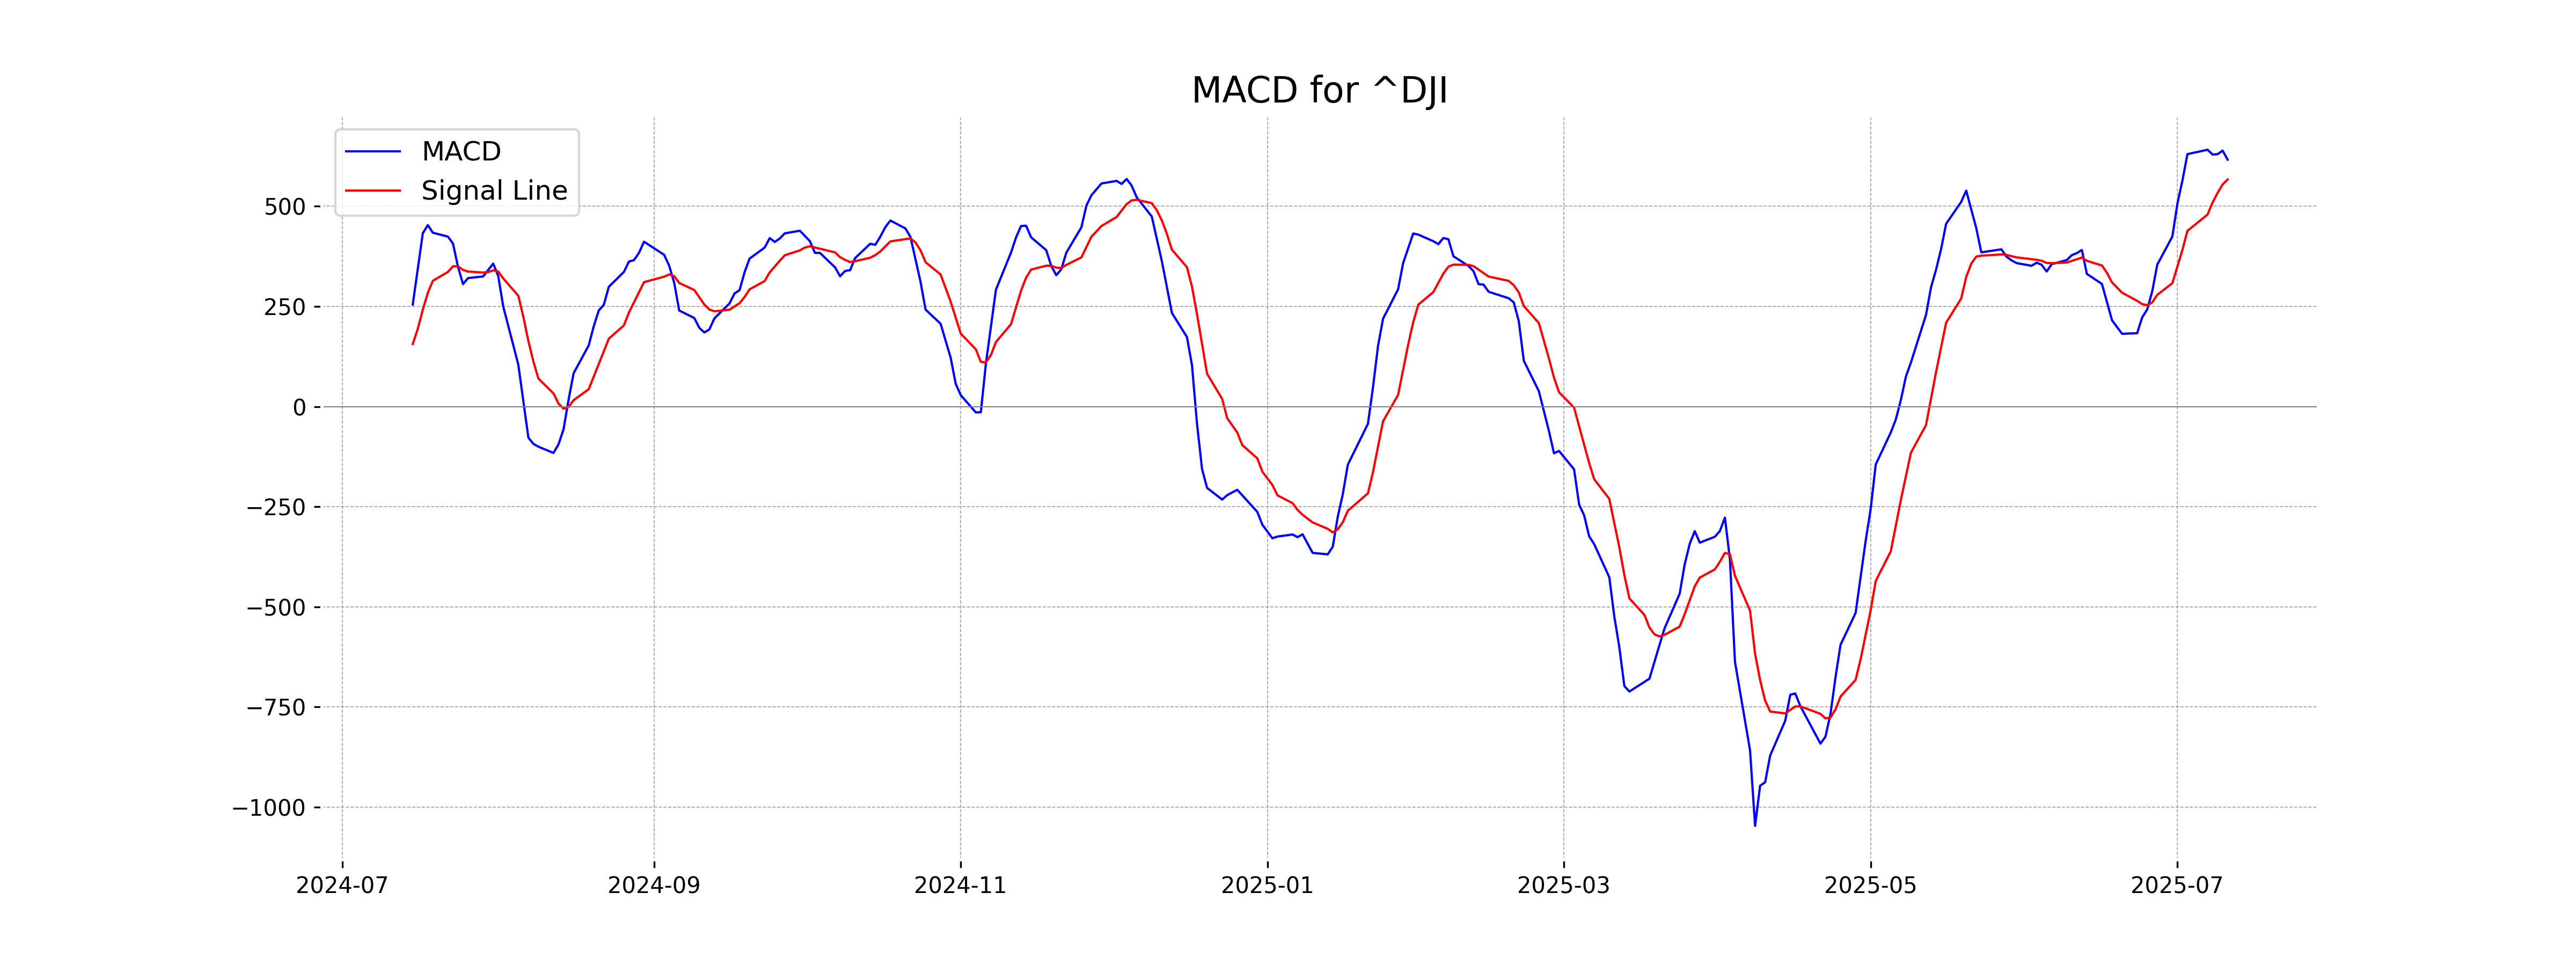
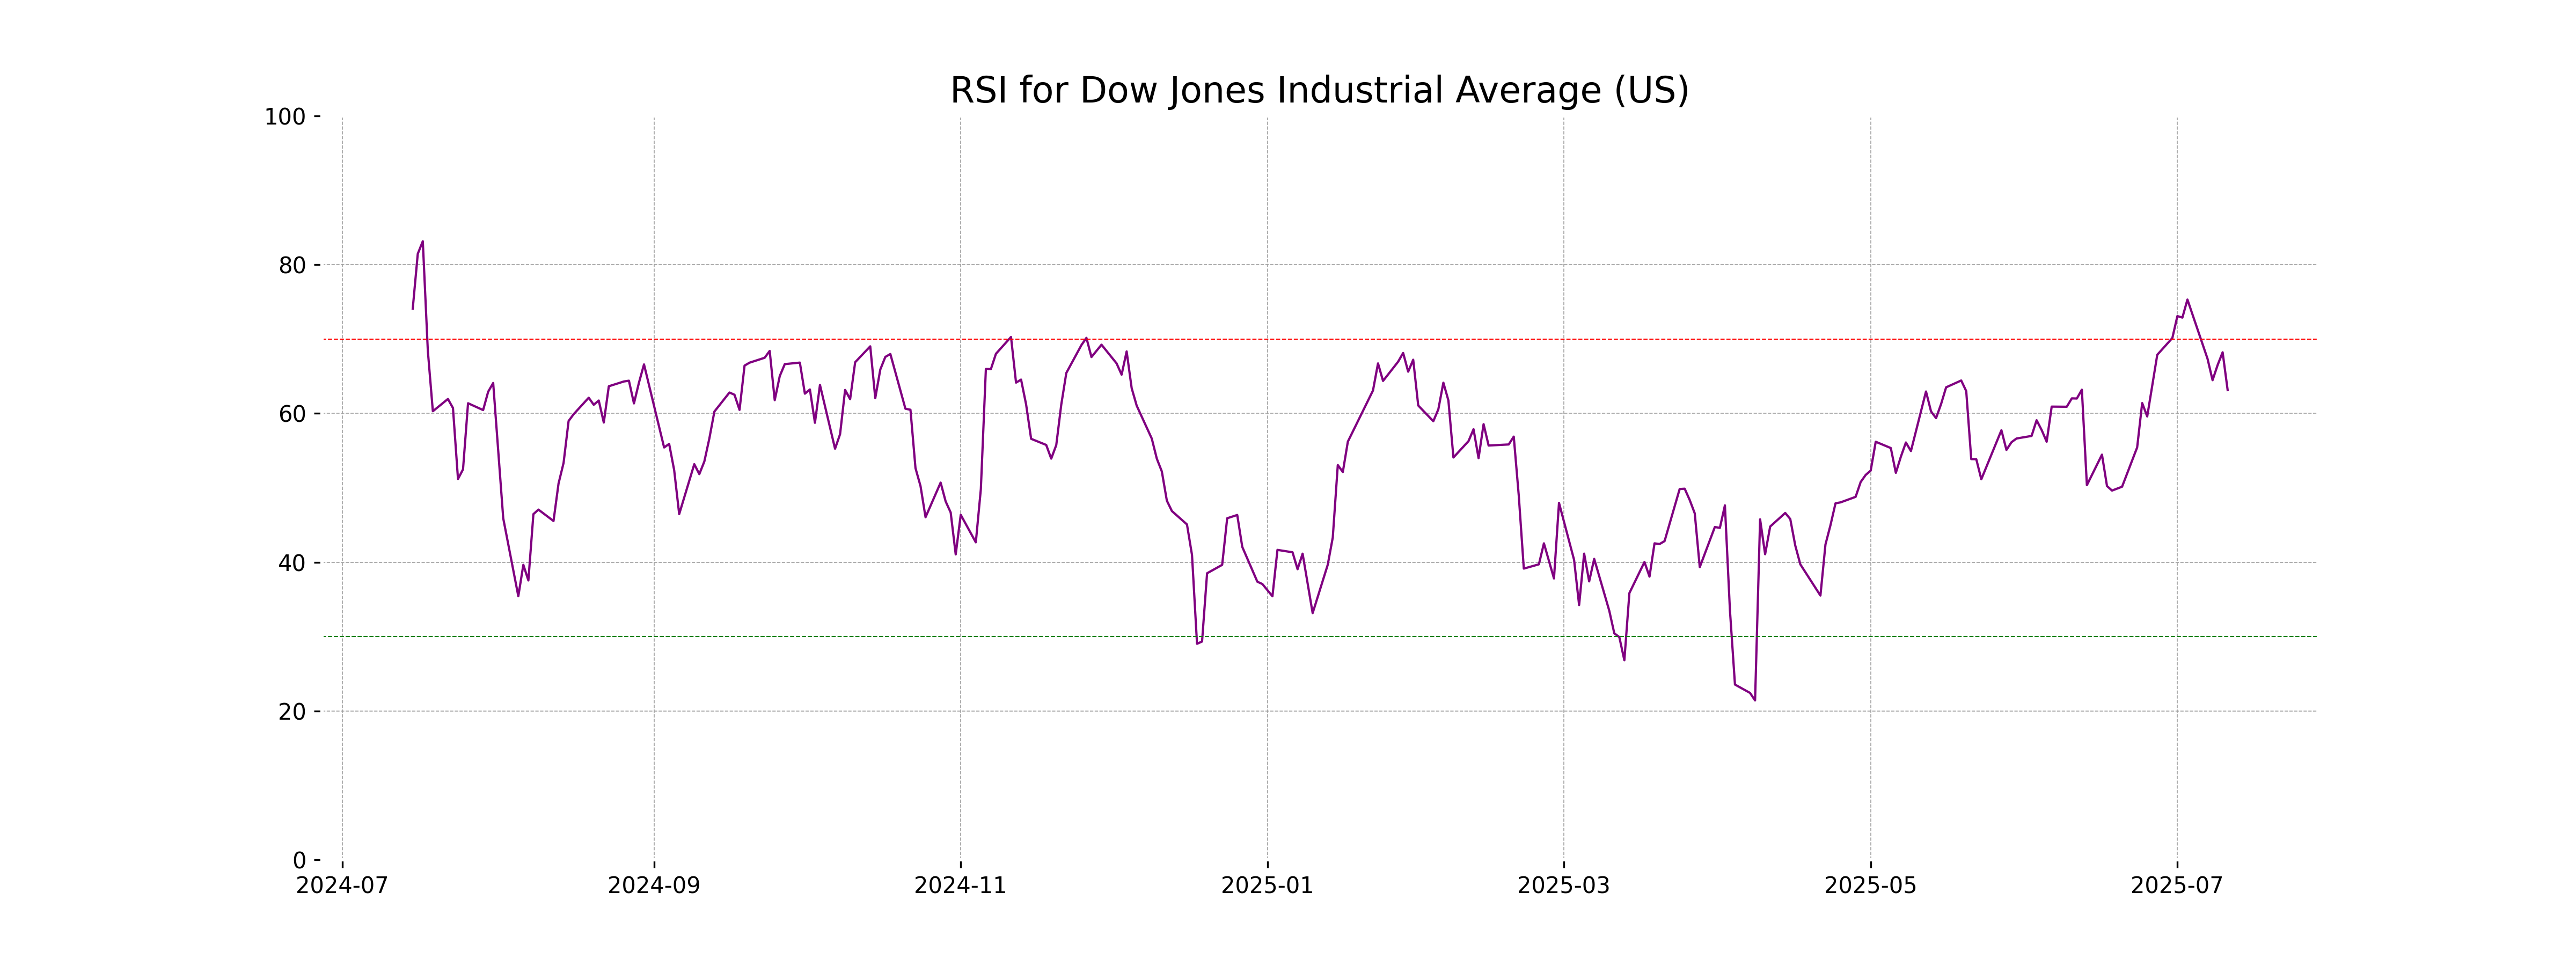
RSI Analysis
The Relative Strength Index (RSI) for the Dow Jones Industrial Average is at 63.14. This suggests a moderately strong position, approaching the overbought threshold of 70, indicating that recent gains could be losing momentum.
Analysis for CAC 40 (France) - July 14, 2025
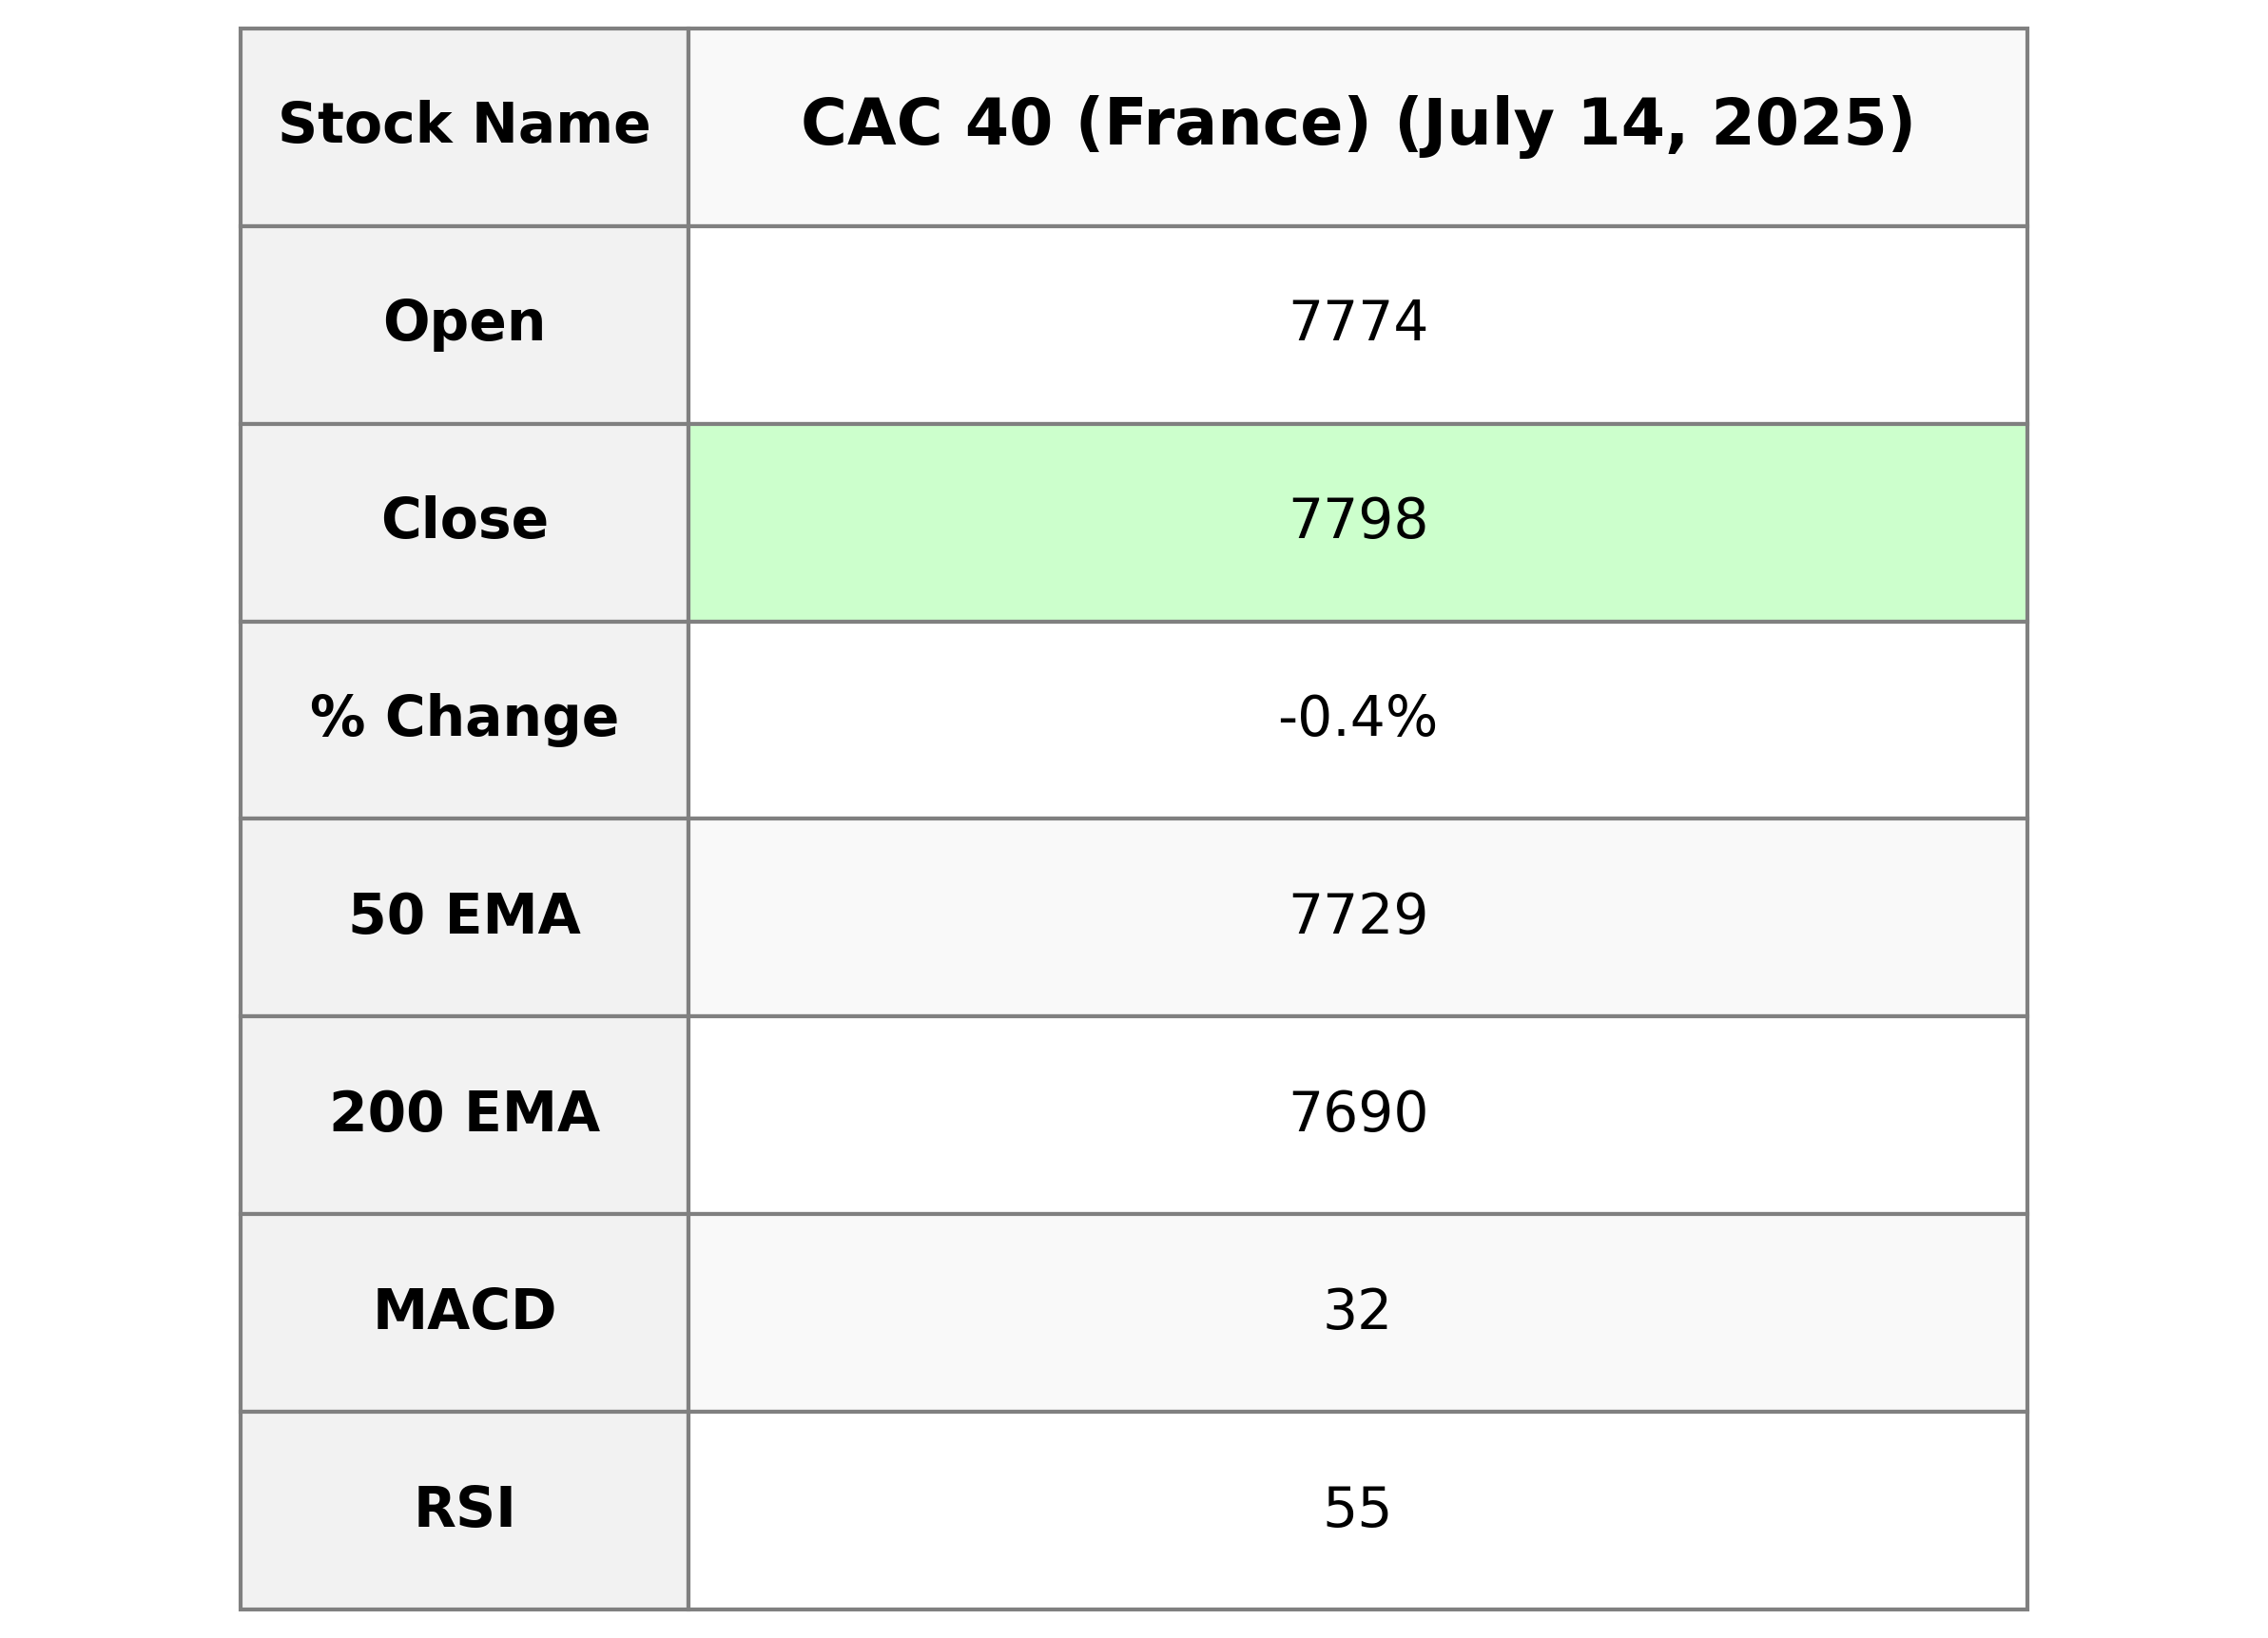
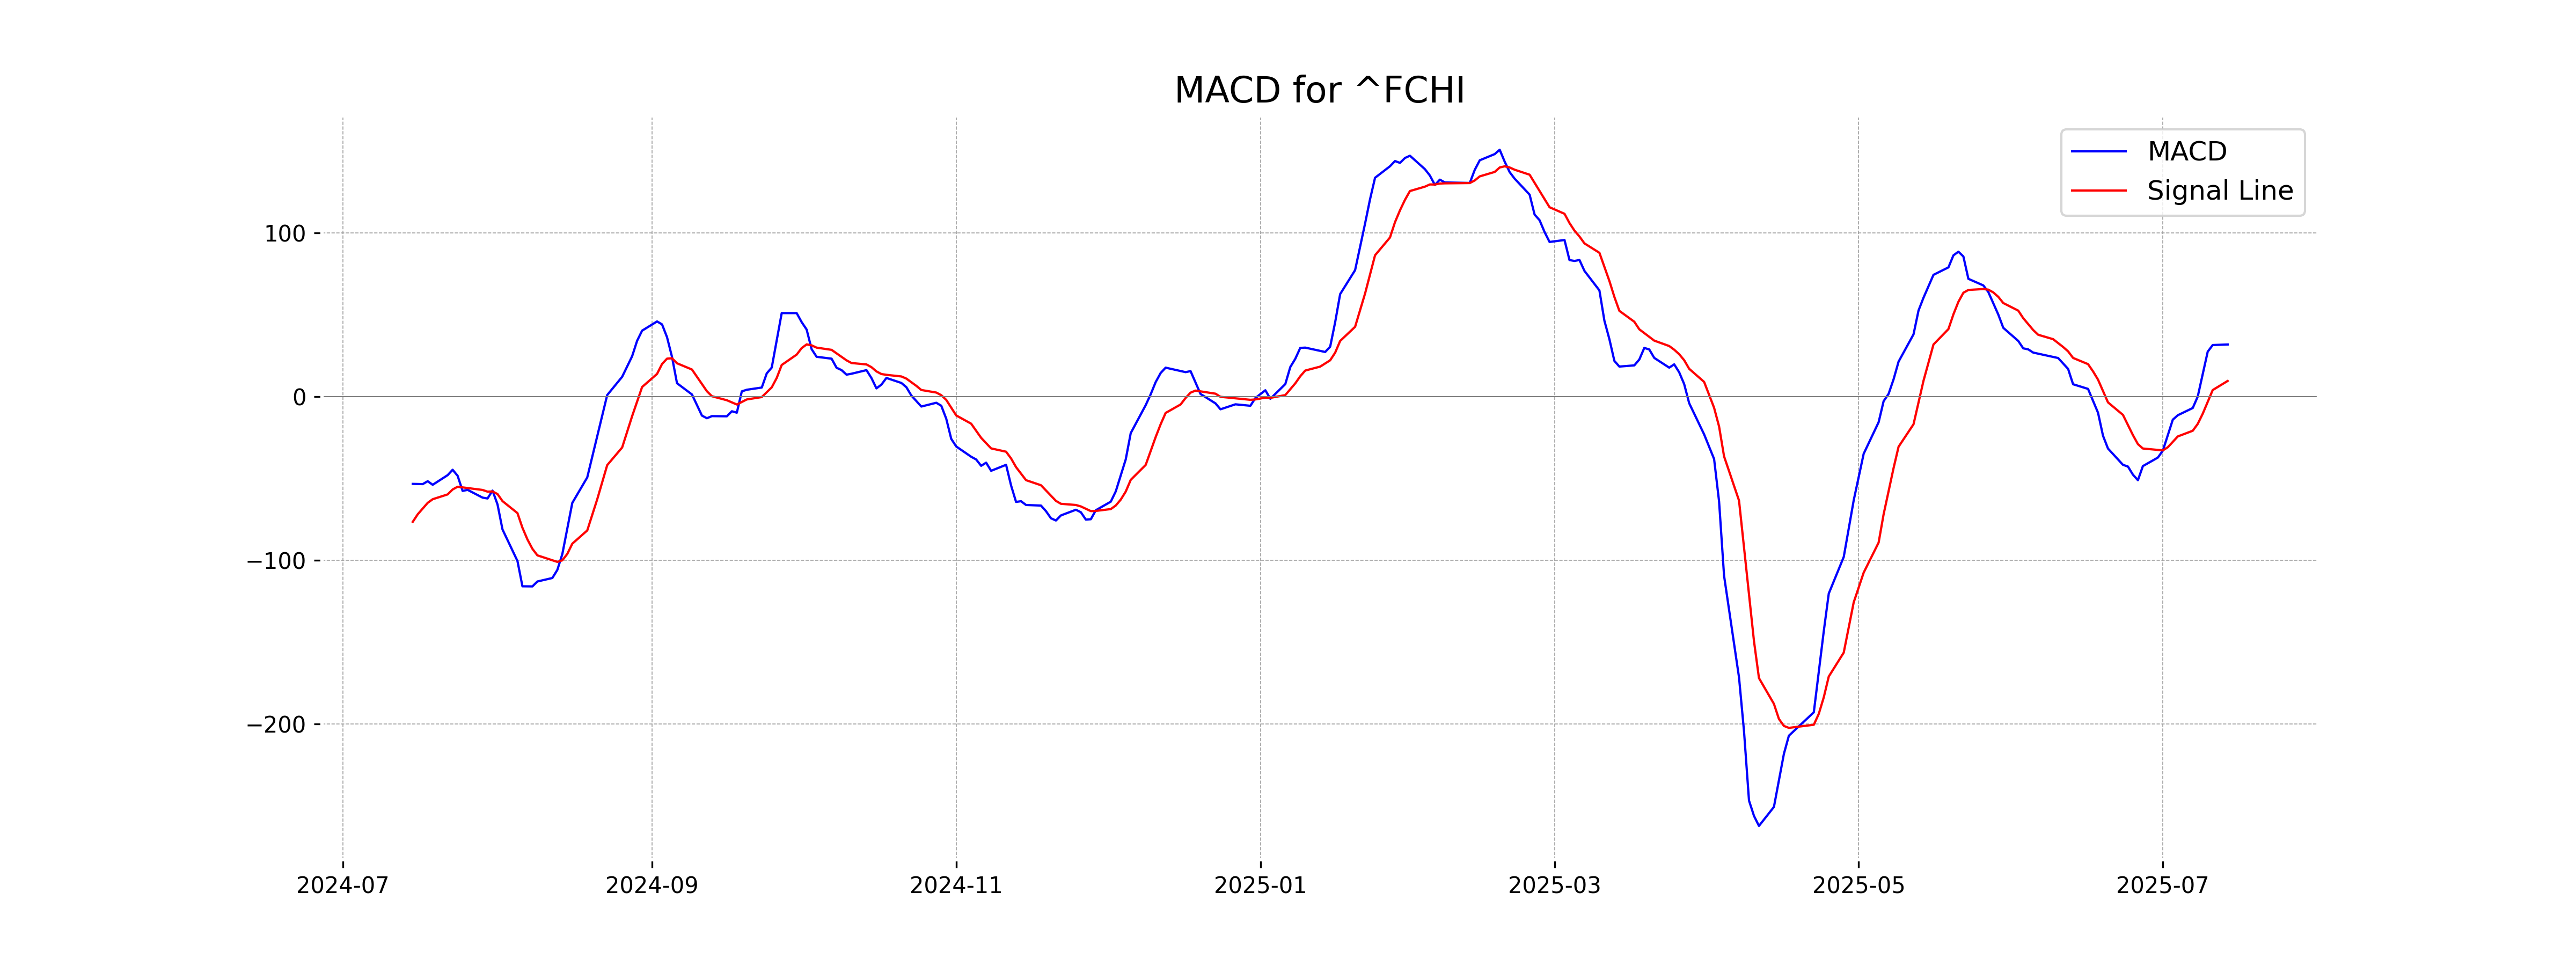
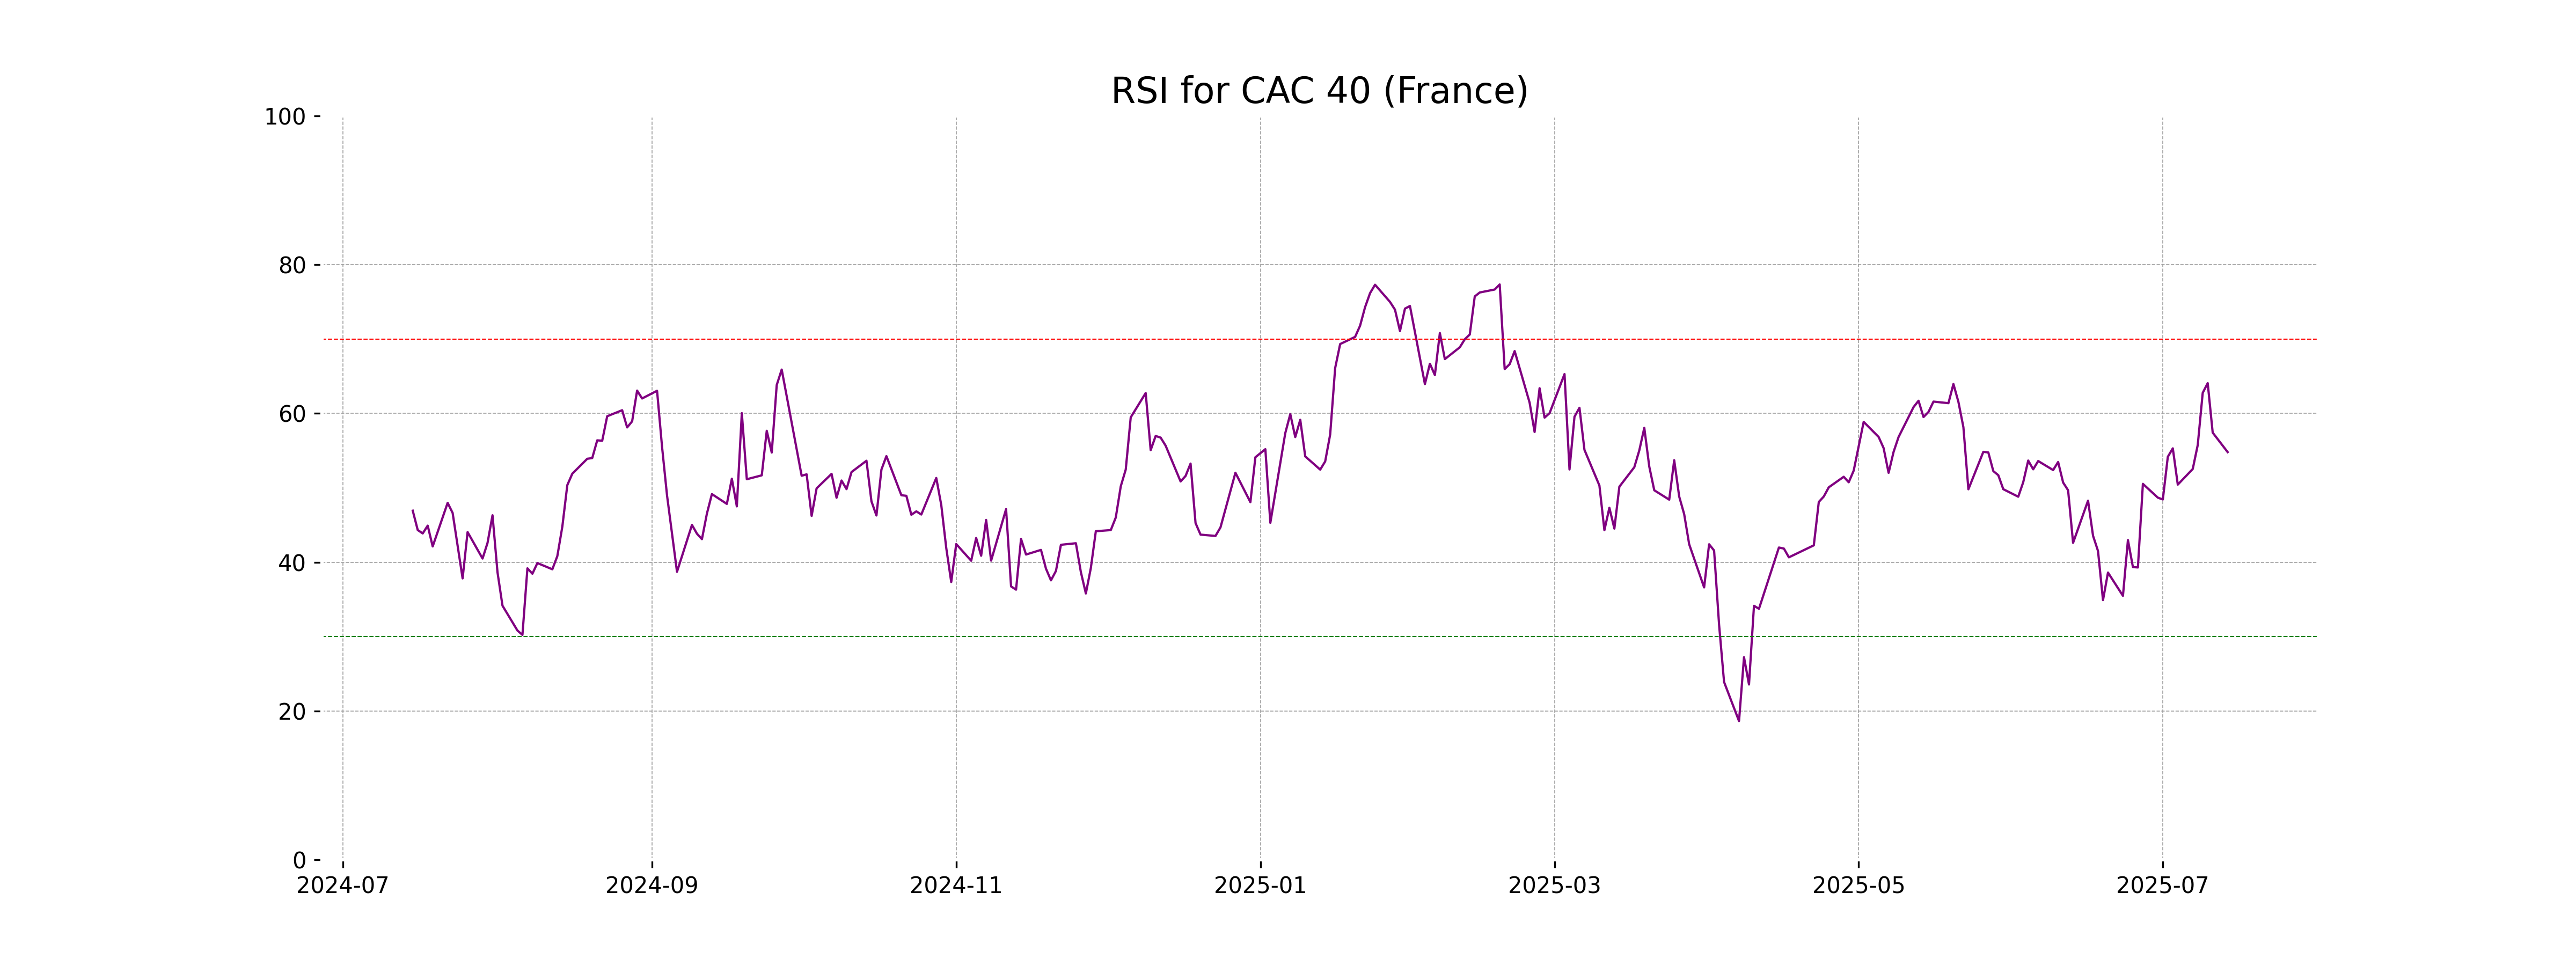
CAC 40 (France) opened at 7774.04 and closed at 7798.14, showing a decline of approximately 0.40% from the previous close of 7829.29, with a points change of -31.15. The Relative Strength Index (RSI) stands at 54.80, indicating a moderately bullish trend, while the MACD suggests positive momentum with a value of 31.76 compared to the MACD Signal of 9.48.
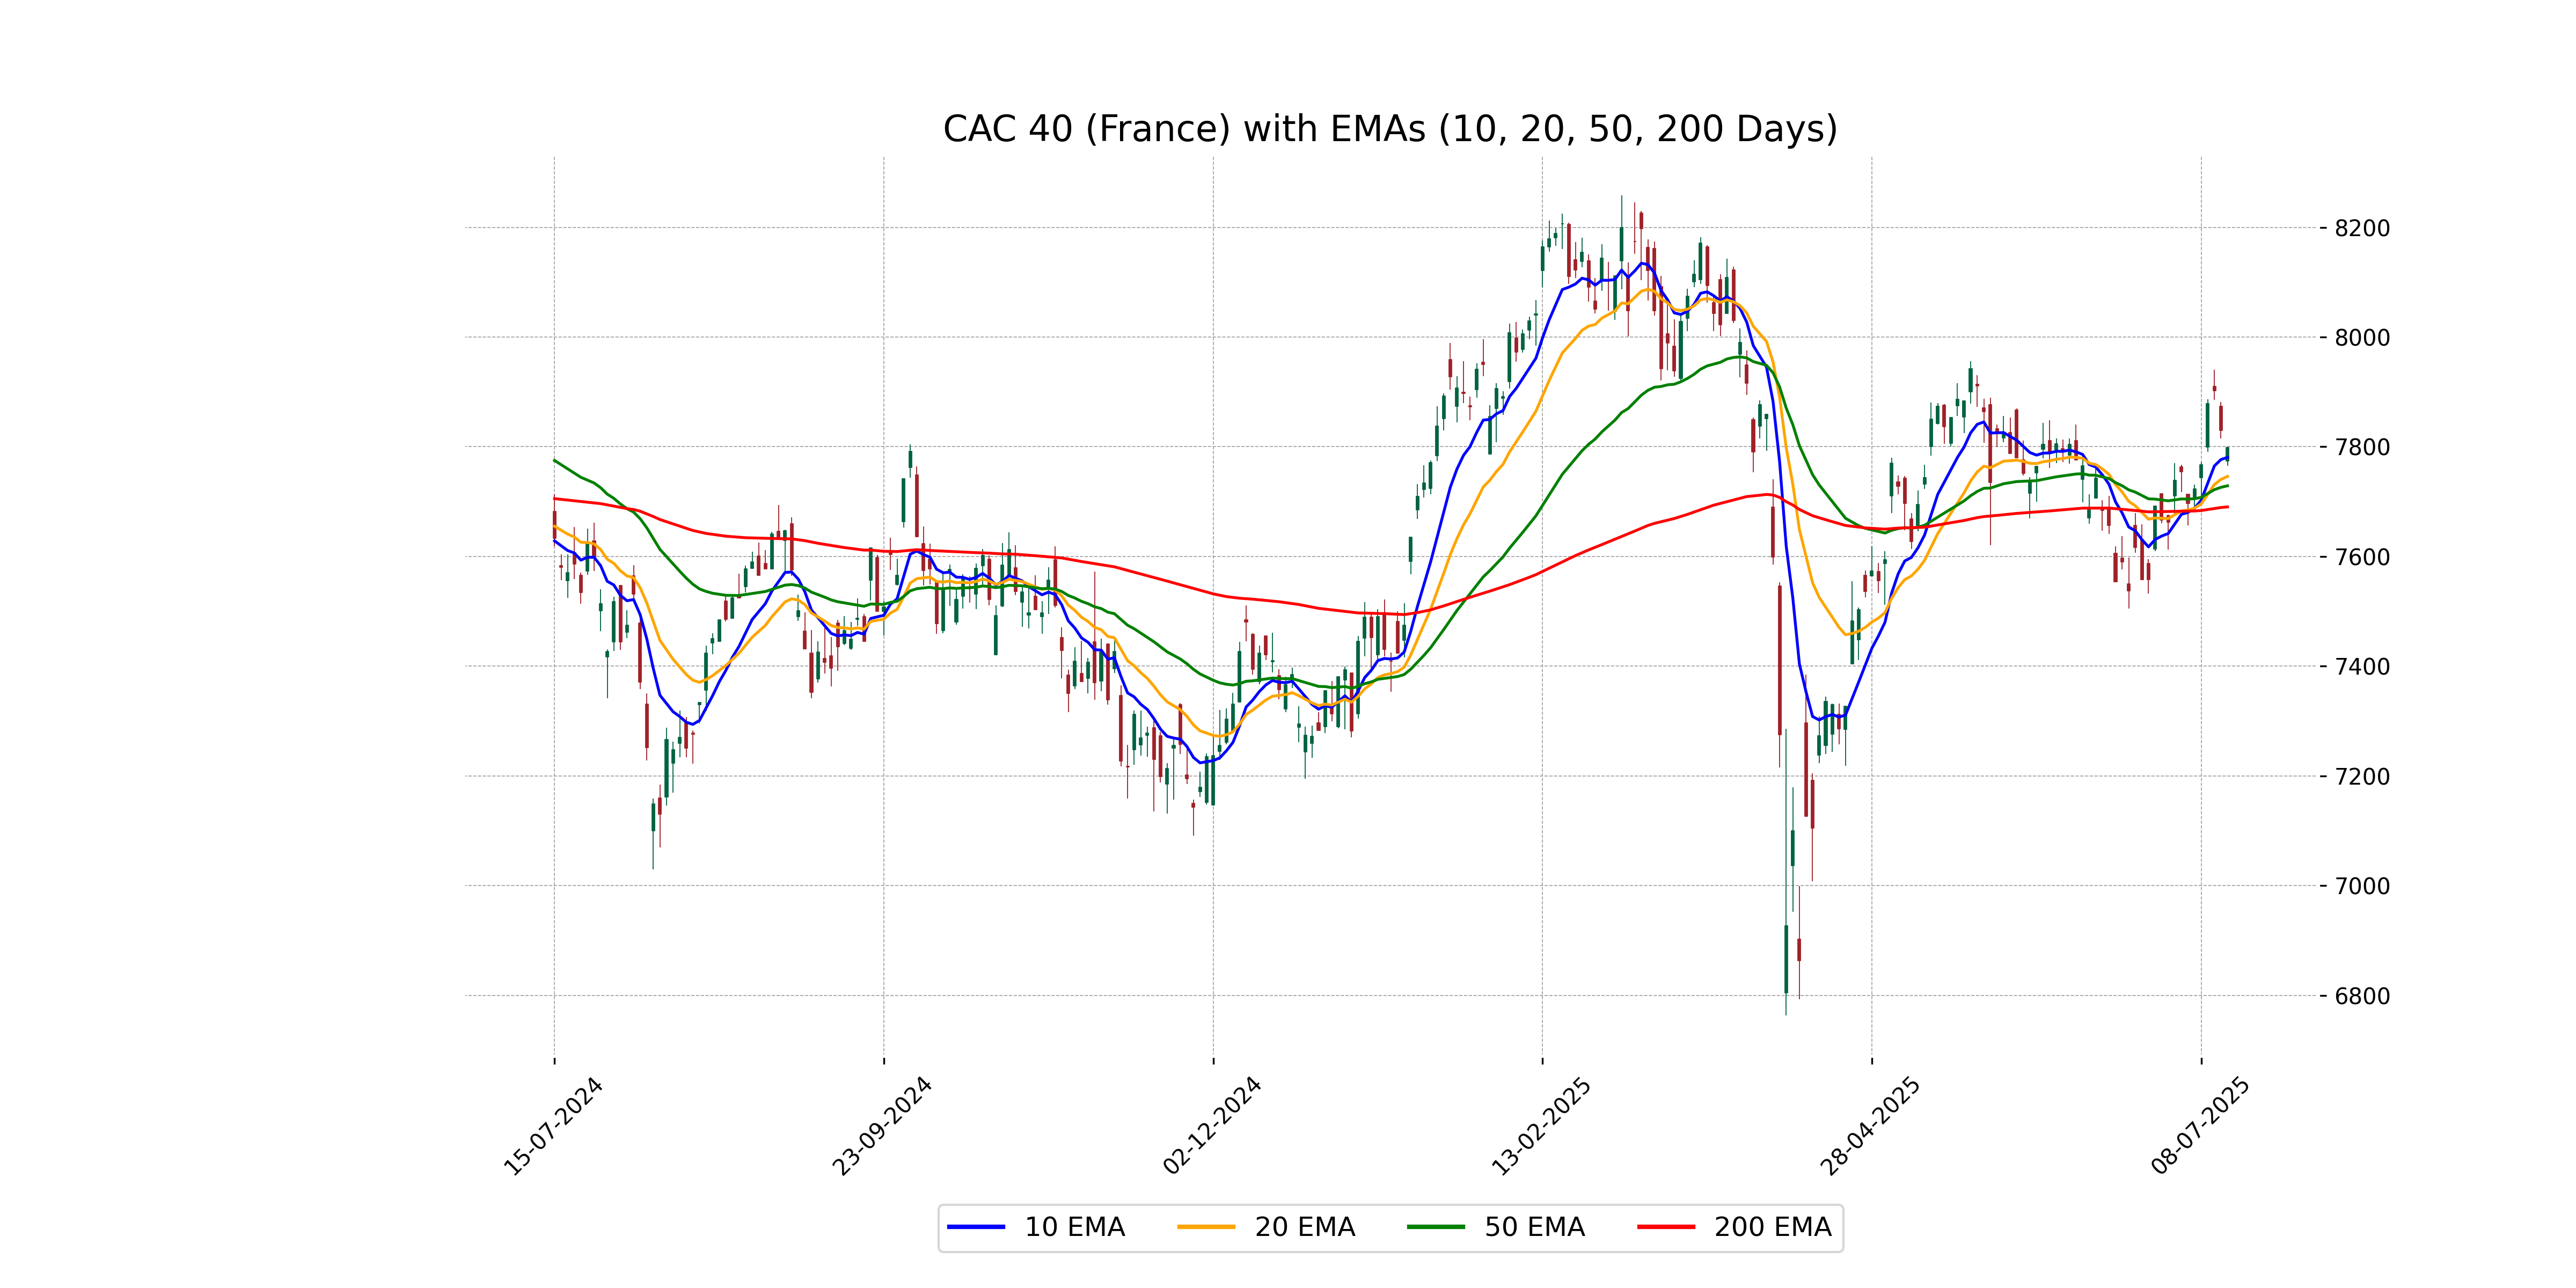
Relationship with Key Moving Averages
The CAC 40 index closed at 7798.14, which is above its 50 EMA of 7728.78 and 200 EMA of 7690.27, suggesting a bullish momentum in the short and long term. Additionally, the close is also above the 10 EMA of 7780.54 and the 20 EMA of 7745.91, indicating recent strength in the market.
Moving Averages Trend (MACD)
The MACD for CAC 40 (France) is 31.76, which is above its Signal Line of 9.48. This indicates a bullish momentum, suggesting potential continued upward movement. However, traders should consider other factors and confirm with additional indicators.
RSI Analysis
RSI Analysis for CAC 40 (France): The RSI (Relative Strength Index) for CAC 40 stands at 54.80, which is around the neutral 50 level, indicating neither overbought nor oversold conditions. This suggests that the current market momentum is somewhat balanced, with no strong directional bias.
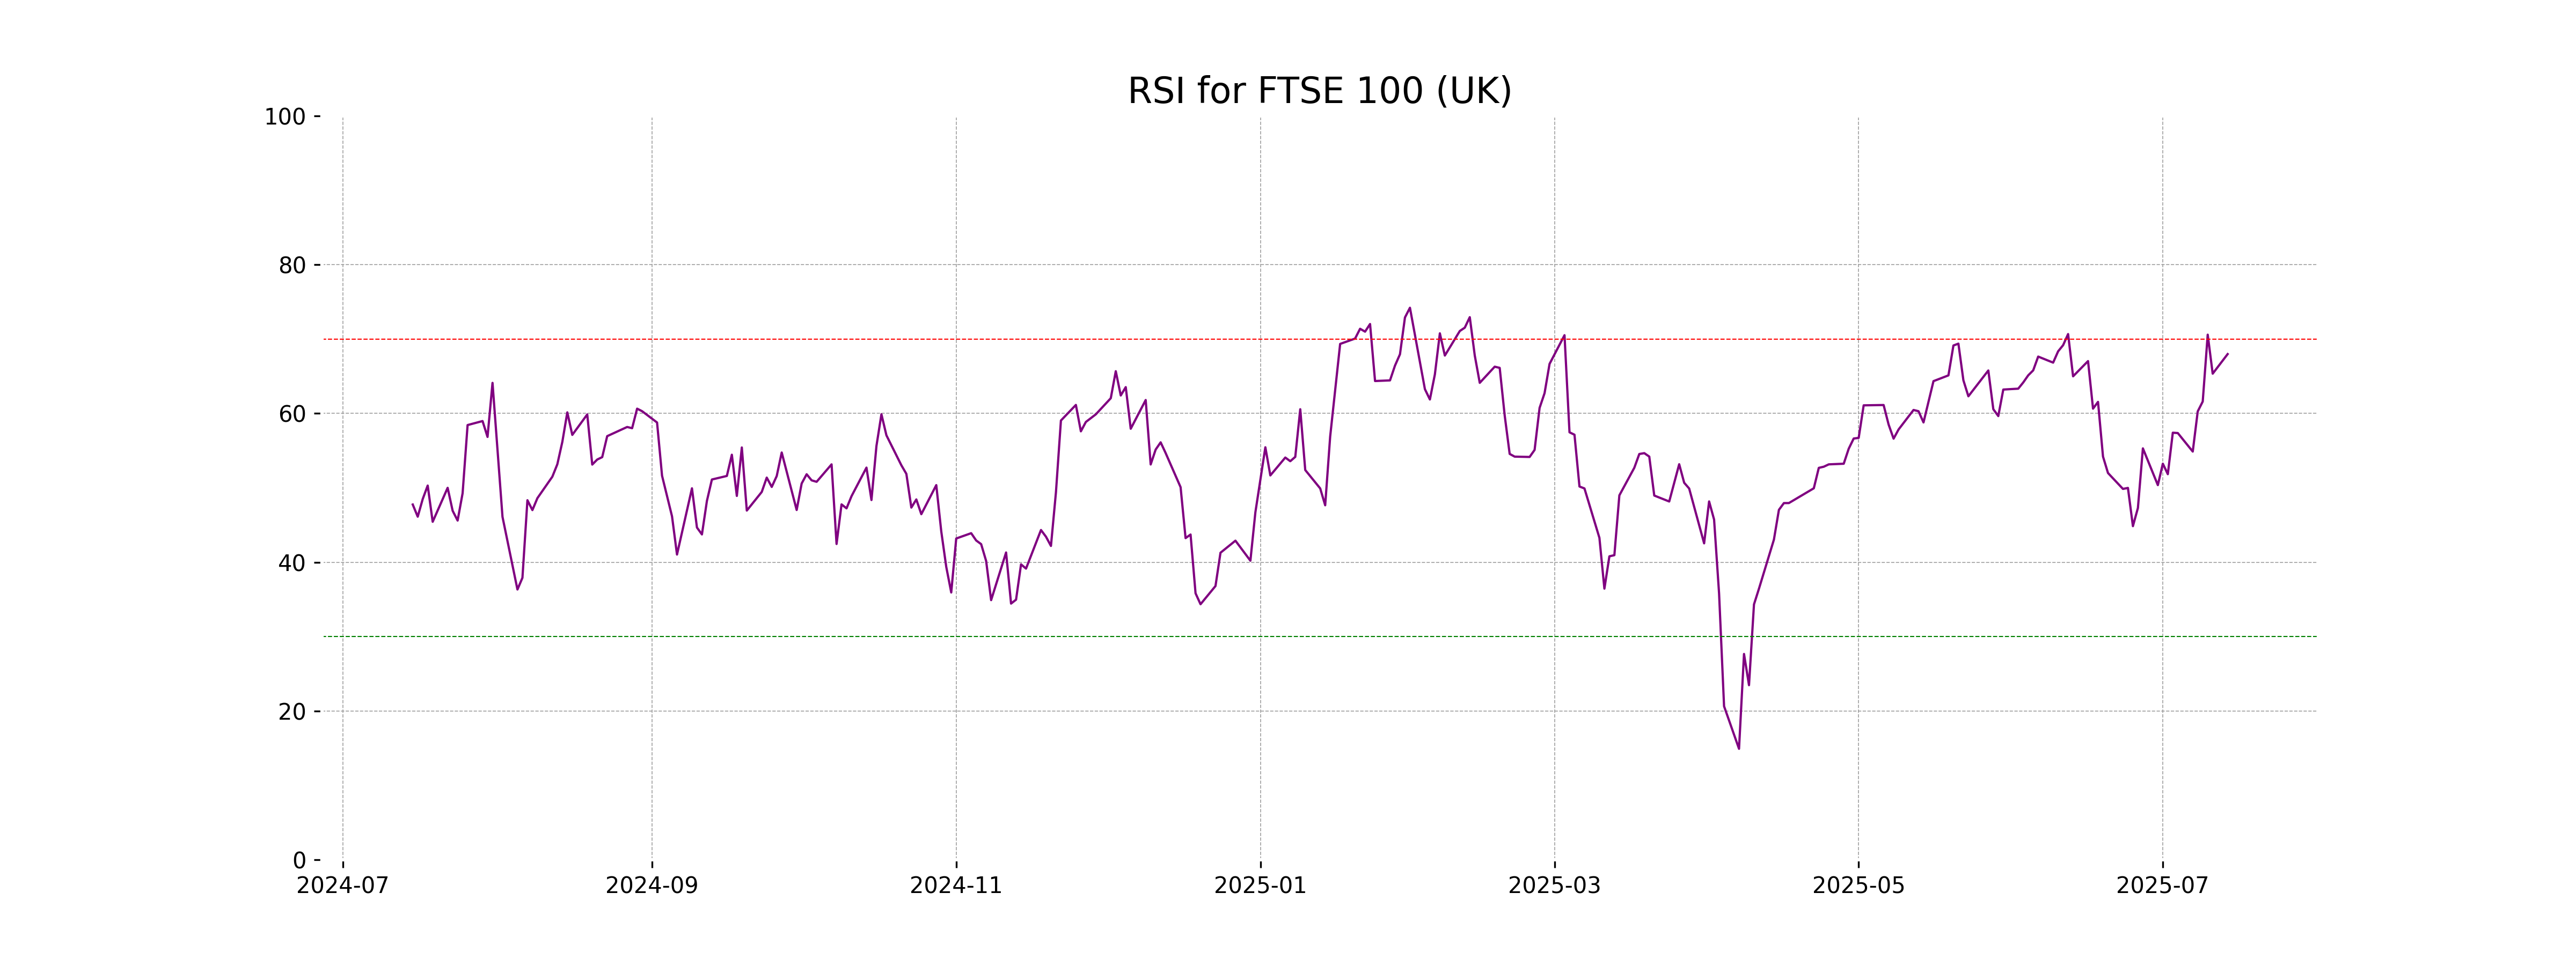
Analysis for FTSE 100 (UK) - July 14, 2025

The FTSE 100 (UK) showed a positive performance with a close of 8976.71, marking a 0.40% increase from the previous close of 8941.10. Indicators suggest a bullish momentum, with the 10 EMA above its 20 EMA, and a MACD higher than its signal line. The RSI is at 67.98, indicating strong buying interest but nearing overbought territory.
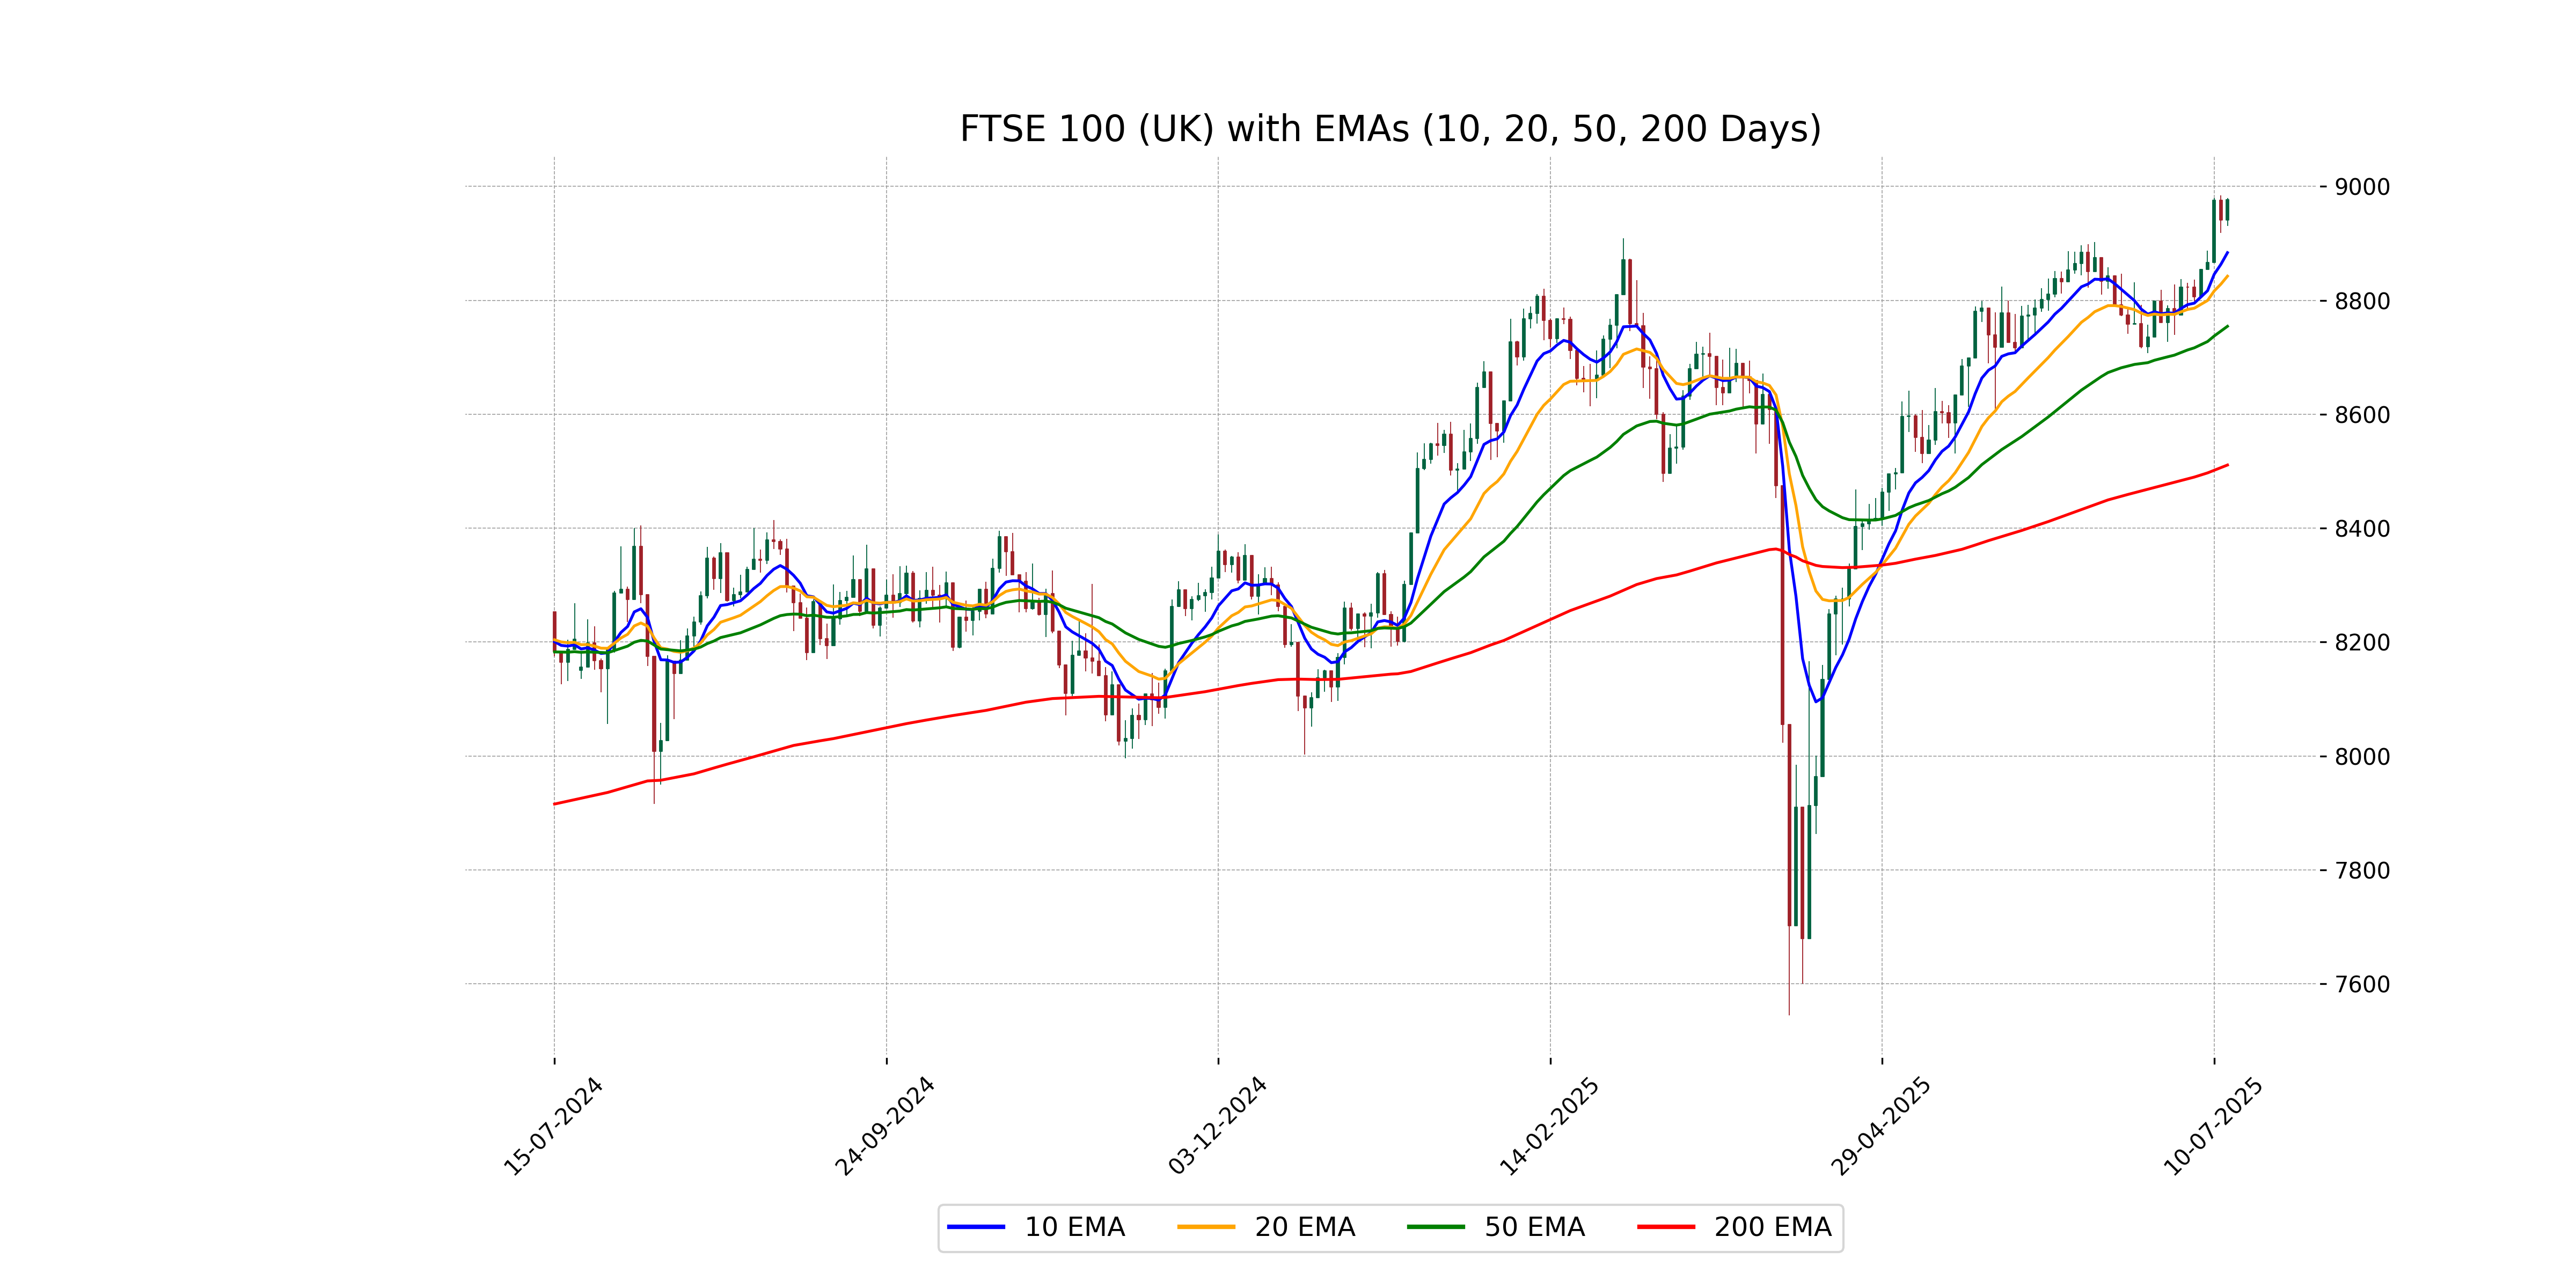
Relationship with Key Moving Averages
The FTSE 100 is trading above its key moving averages, with a current close of 8976.71, surpassing the 10 EMA (8883.79), 20 EMA (8842.53), 50 EMA (8754.51), and 200 EMA (8510.89). This suggests a bullish momentum in the short to long term based on the moving average trends.
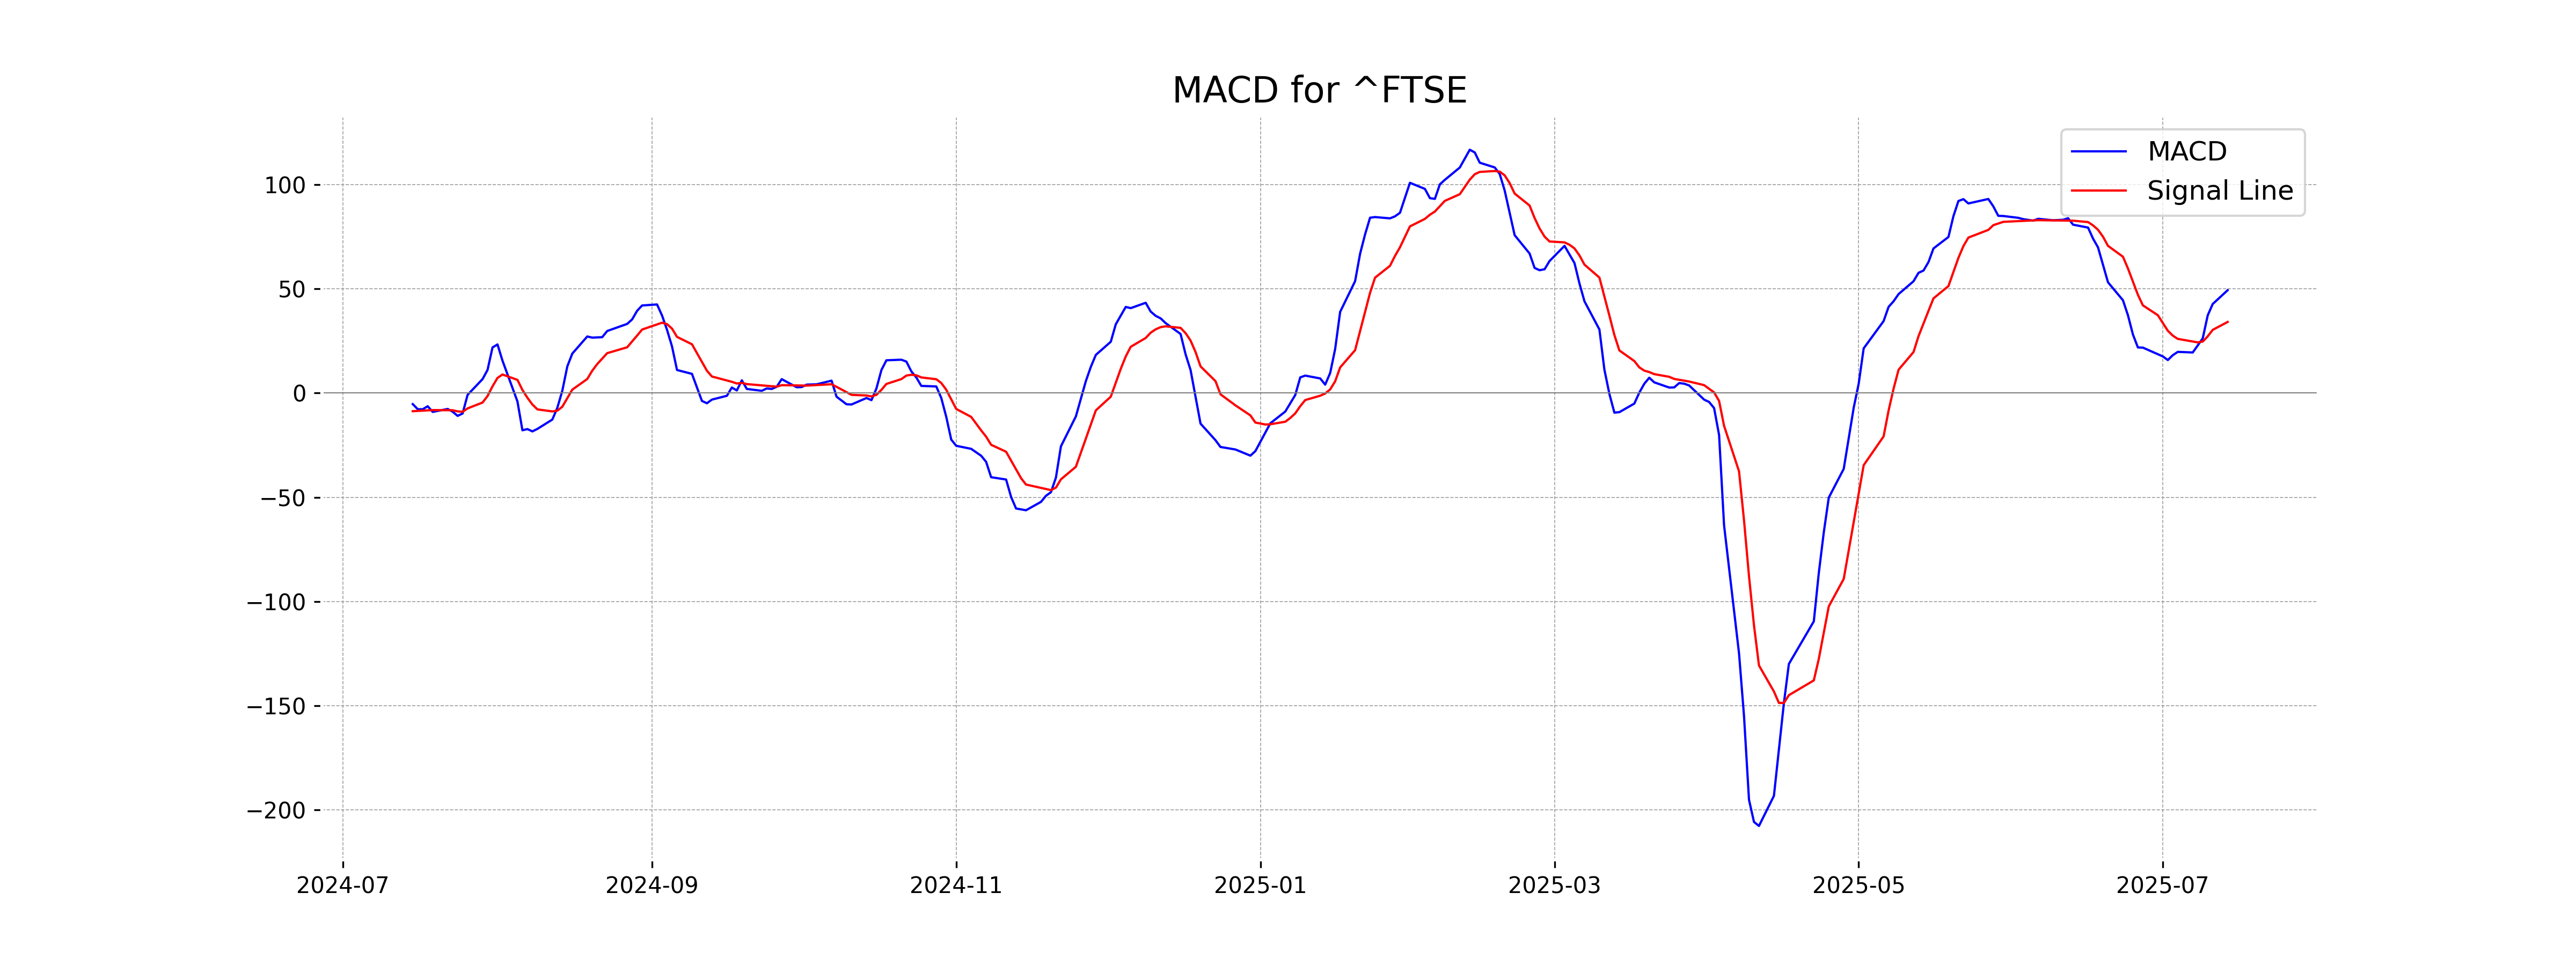
Moving Averages Trend (MACD)
The MACD value of 49.34, which is above the MACD signal of 34.11, indicates a bullish momentum for FTSE 100 (UK). This suggests that the index is experiencing upward momentum, increasing the probability of further gains if this trend continues.
RSI Analysis
The RSI value for FTSE 100 (UK) is 67.98, indicating that the index is nearing overbought territory. This suggests that there is strong buying momentum, and the index might be due for a pullback if it crosses above 70.
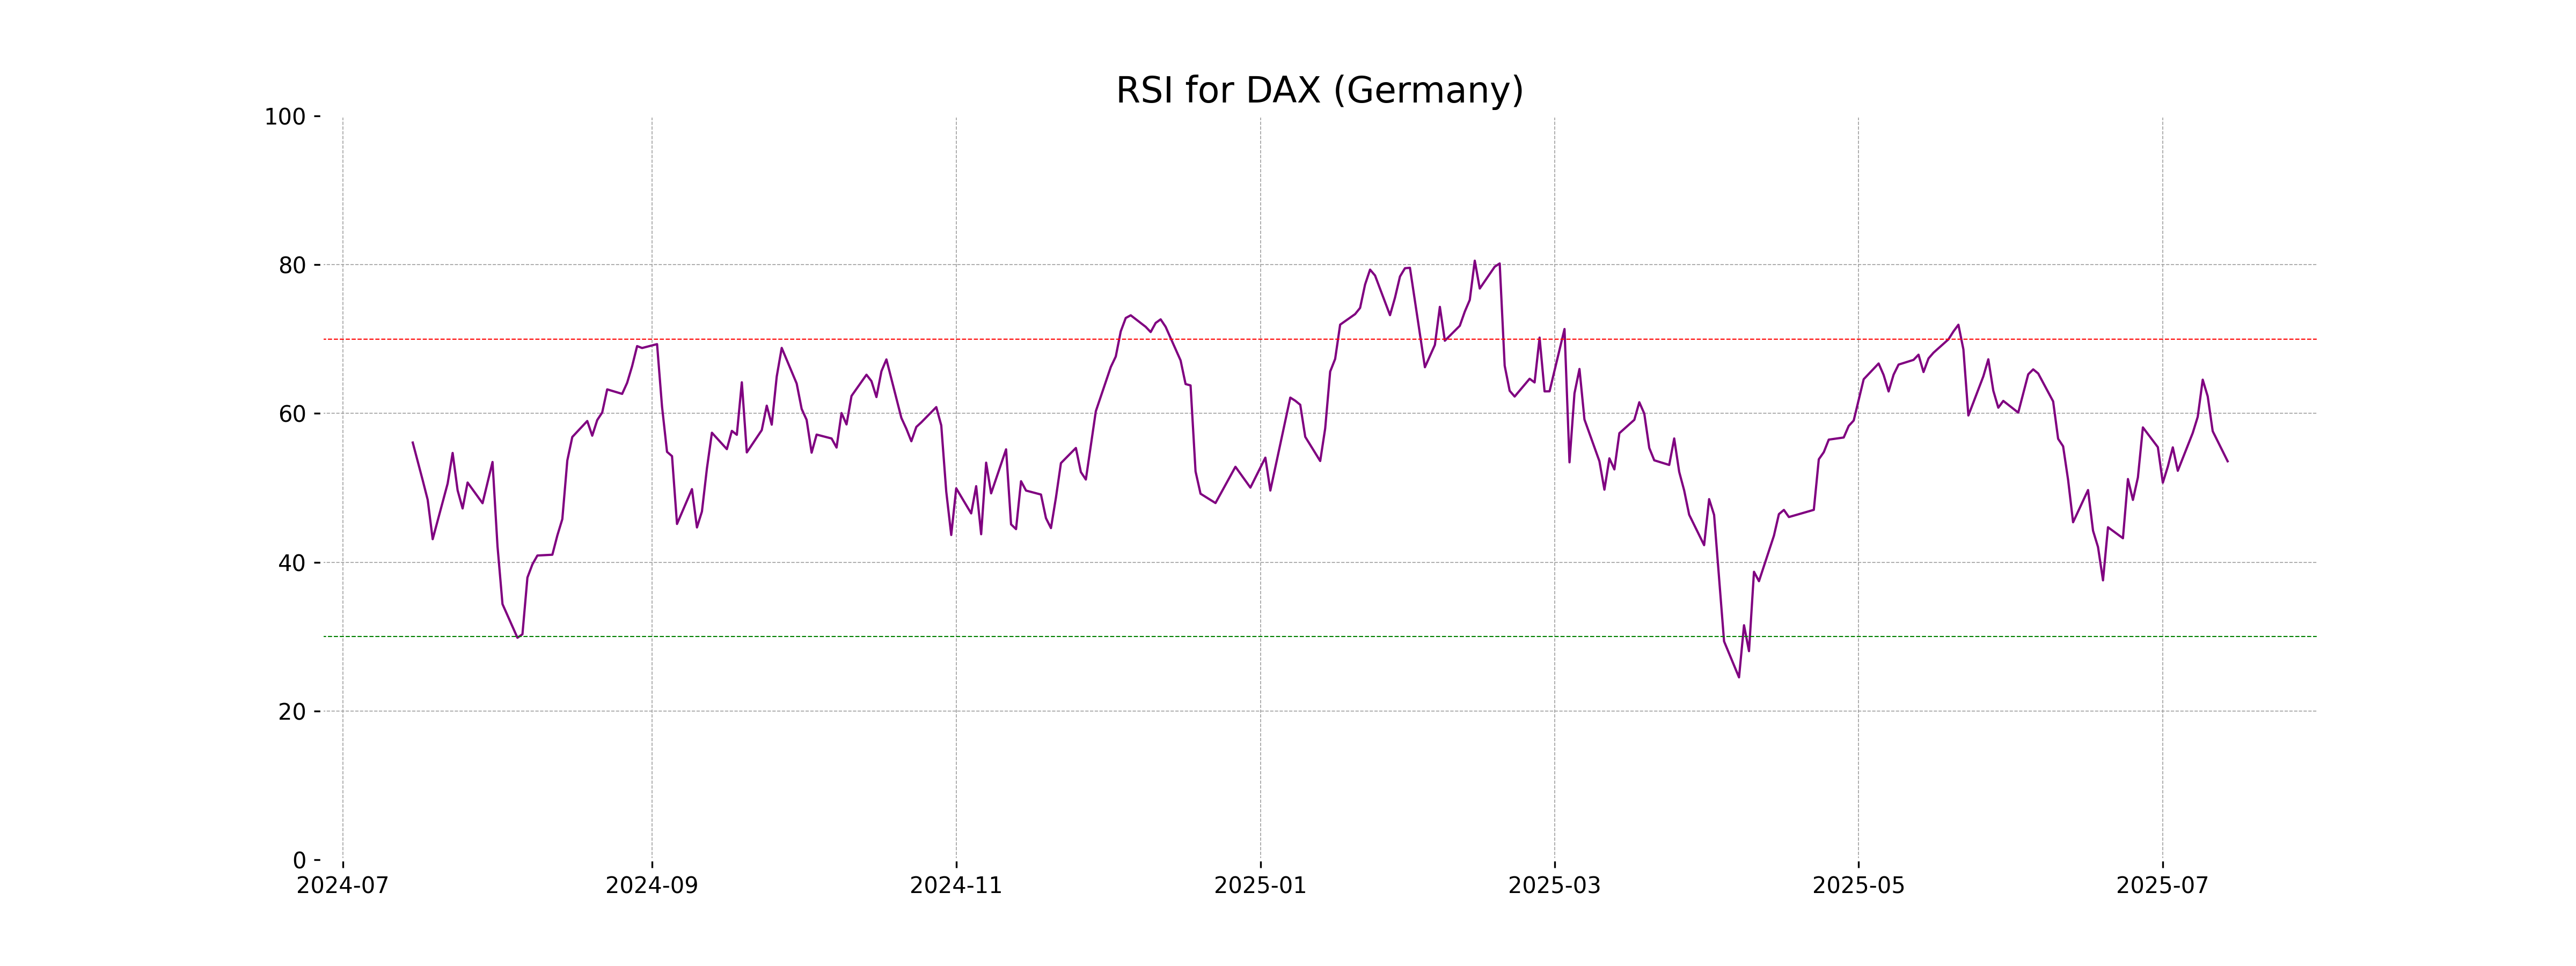
Analysis for DAX (Germany) - July 14, 2025
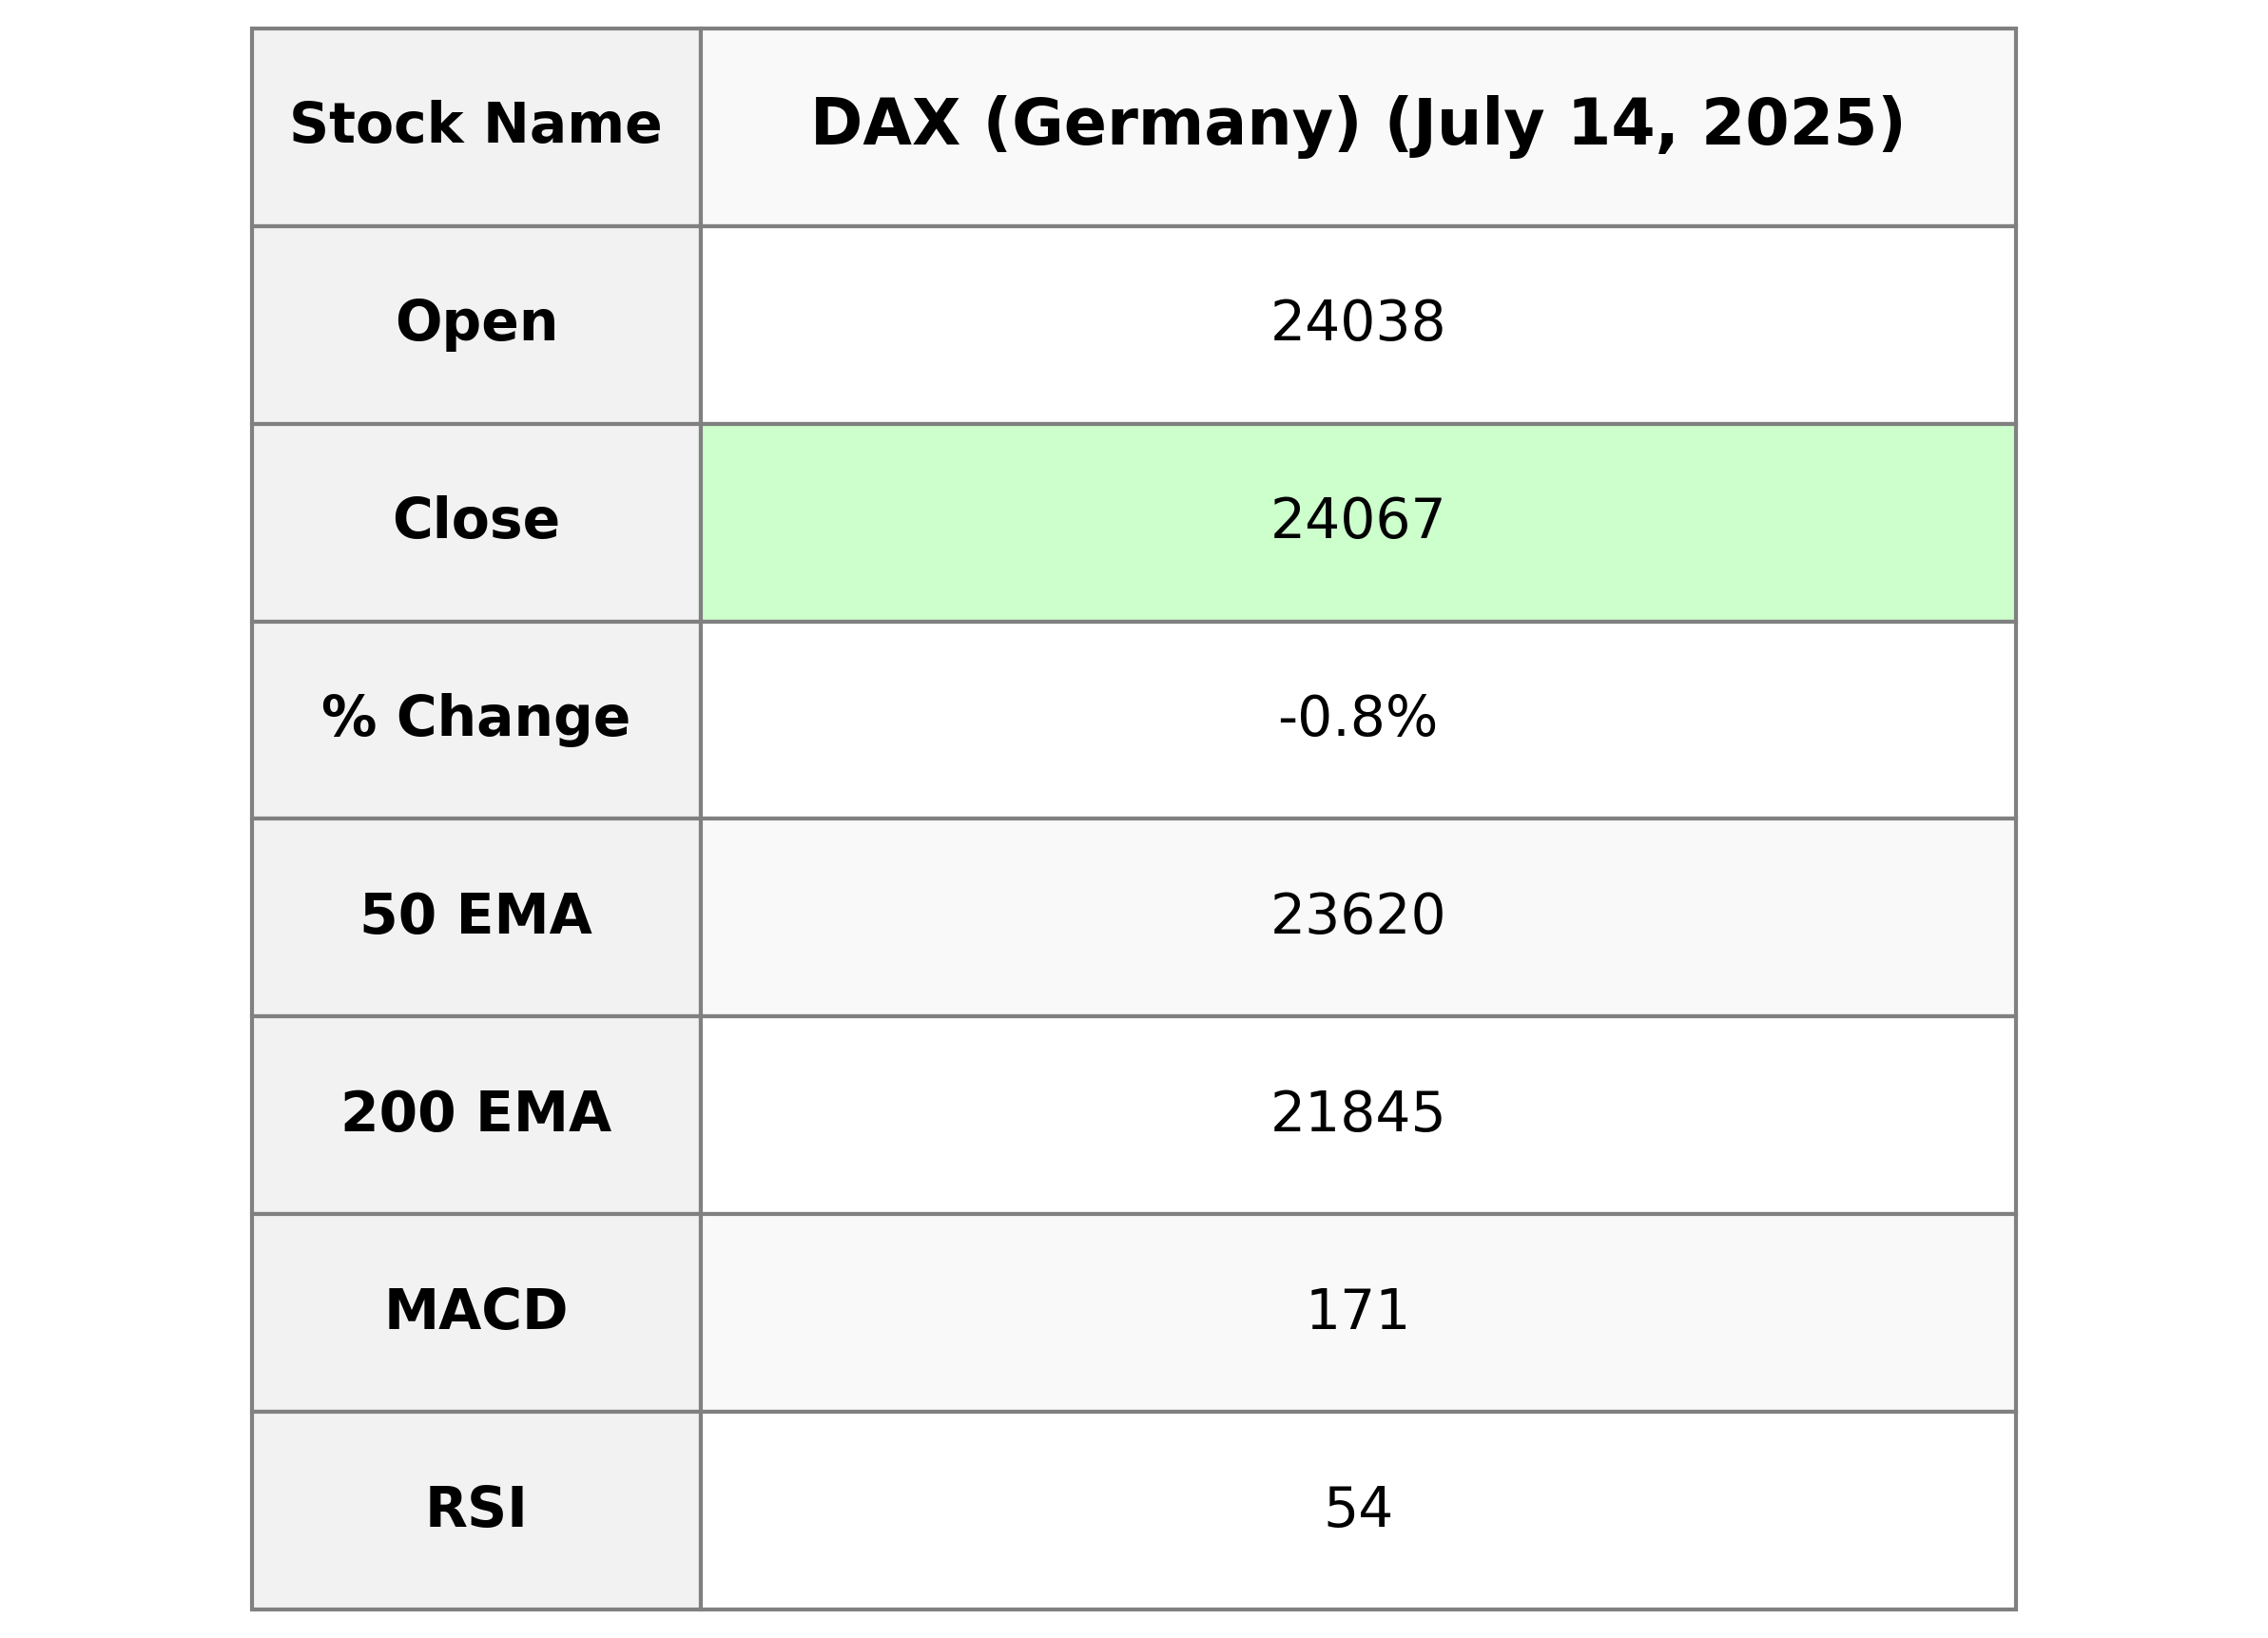
DAX (Germany) Performance: The DAX index opened at 24,038.29, reaching a high of 24,102.68 and a low of 24,019.19, closing at 24,067.05. It experienced a decline of 0.78% from the previous close of 24,255.31, with a points change of -188.26. The RSI stands at 53.57, indicating a moderate momentum, while the MACD is above the signal at 171.02, suggesting potential bullish sentiment.
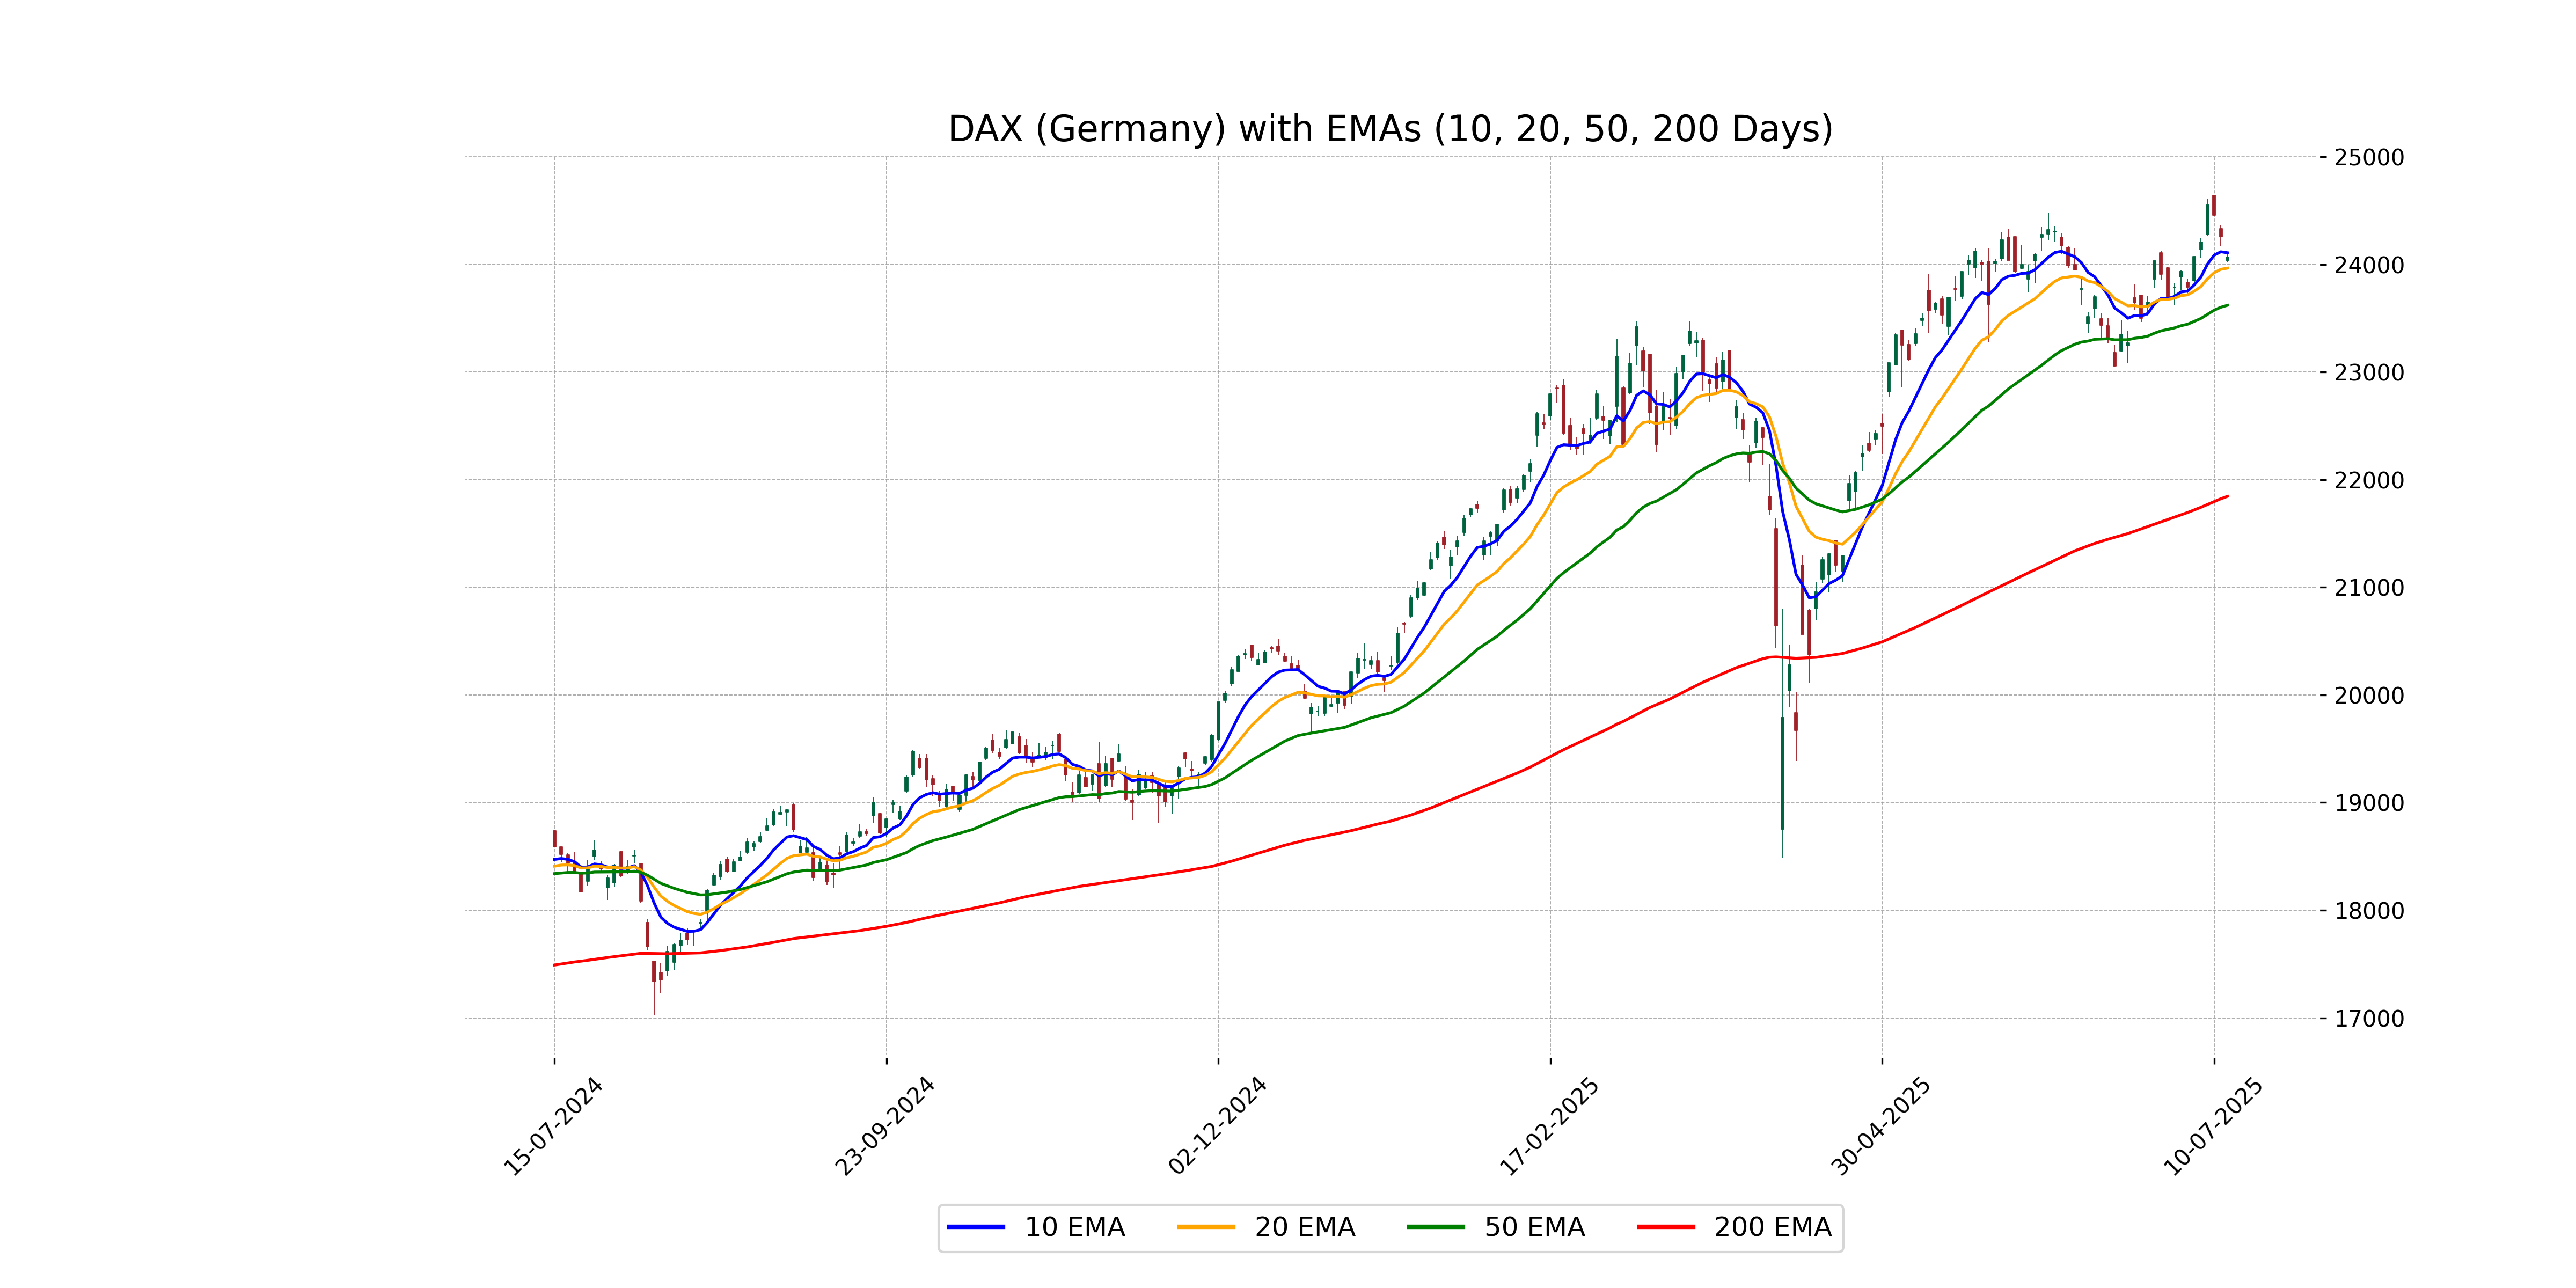
Relationship with Key Moving Averages
DAX closed at 24067.05, which is above its 50-day EMA of 23619.68 and below its 10-day EMA of 24107.70, indicating short-term weakness. The index also remains significantly above its 200-day EMA of 21844.64, suggesting long-term strength.
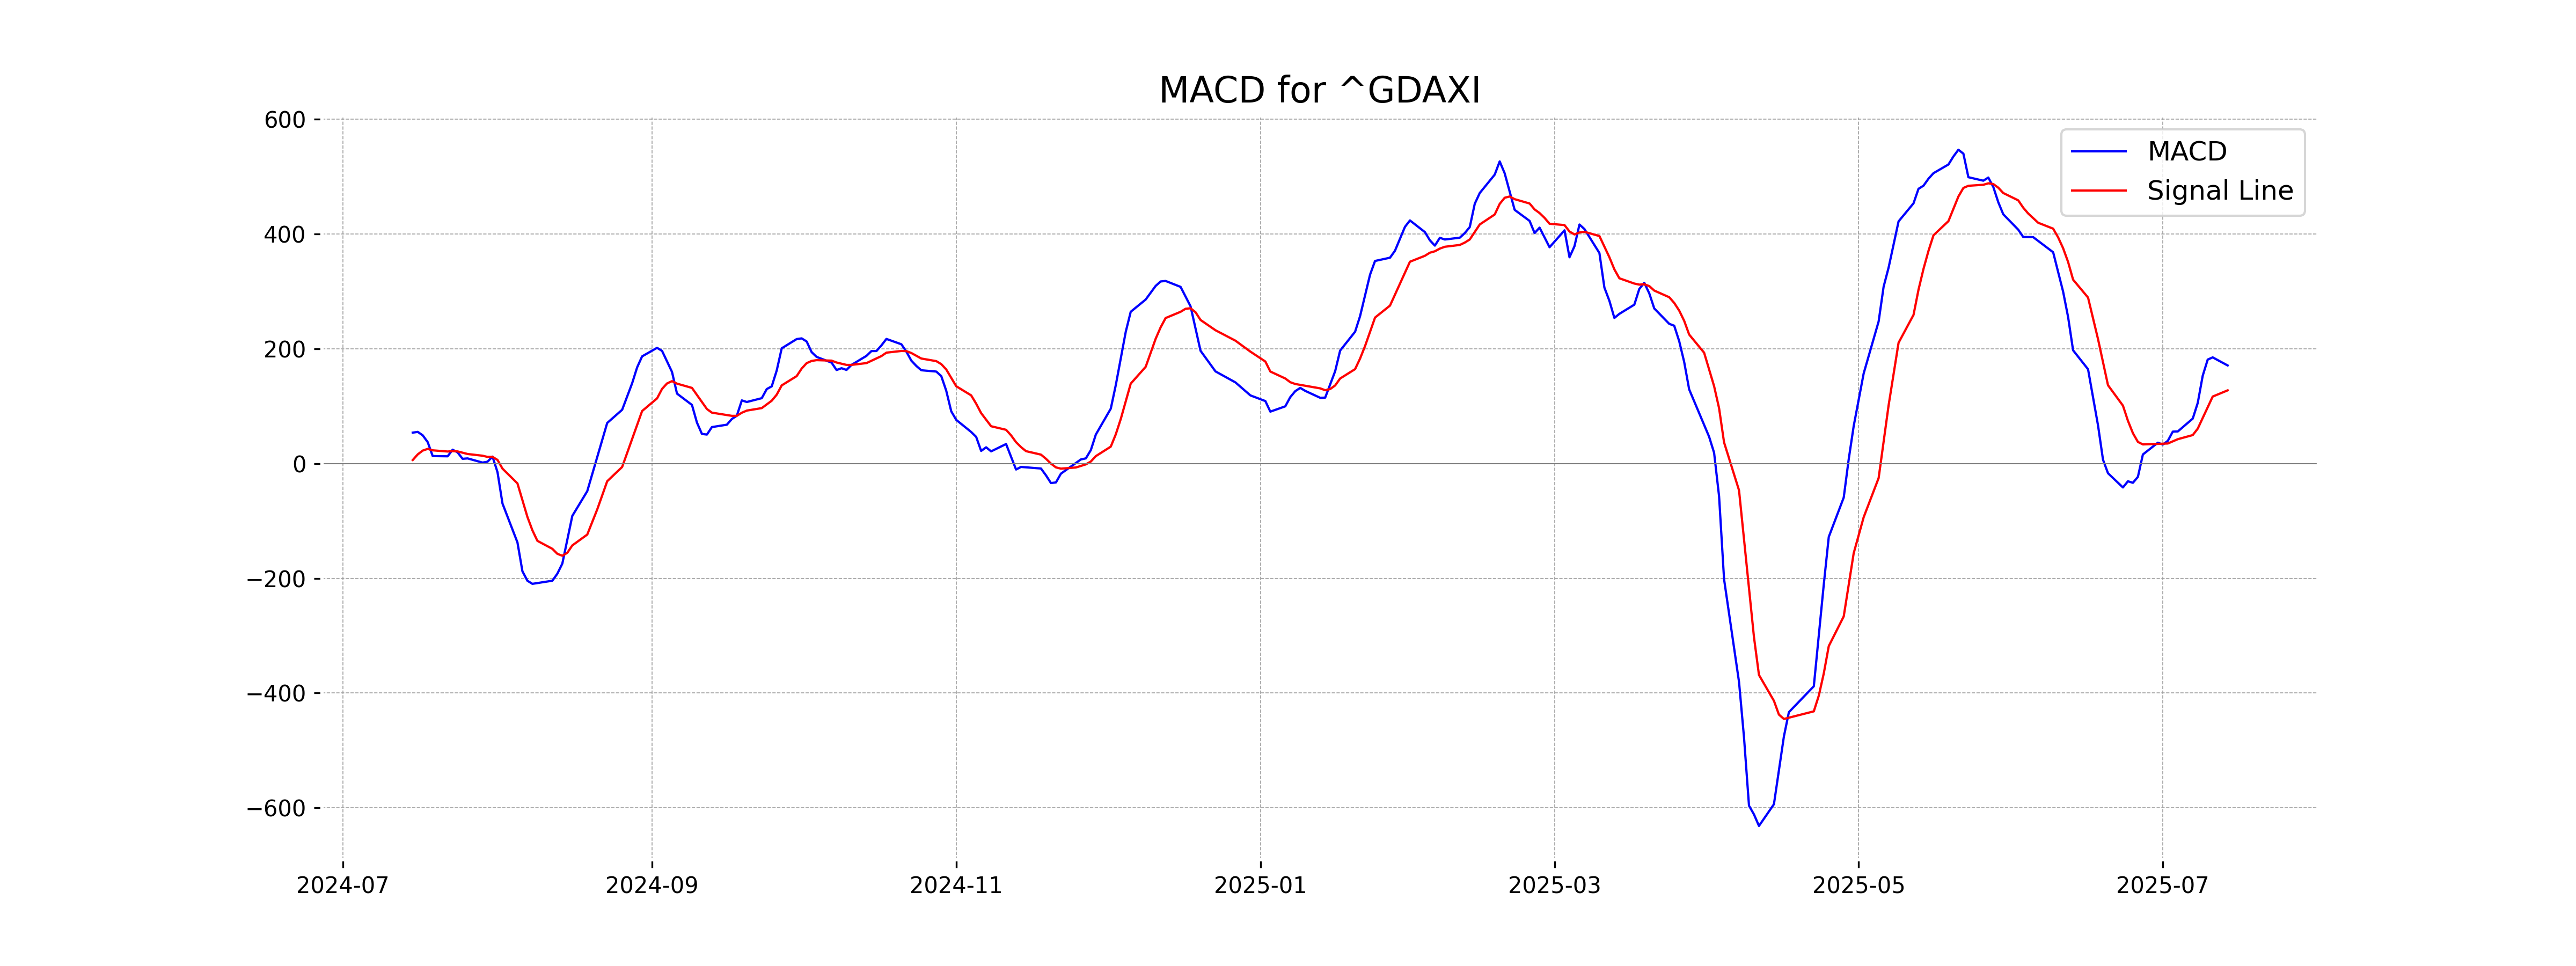
Moving Averages Trend (MACD)
The MACD for DAX (Germany) is 171.02, while the MACD Signal is 127.66. This indicates a positive MACD line crossing above the signal line, suggesting a potential bullish momentum.
RSI Analysis
The Relative Strength Index (RSI) for DAX (Germany) is 53.57, indicating a neutral position. This value suggests that the market is neither overbought nor oversold, presenting no strong bias towards buying or selling at this time.
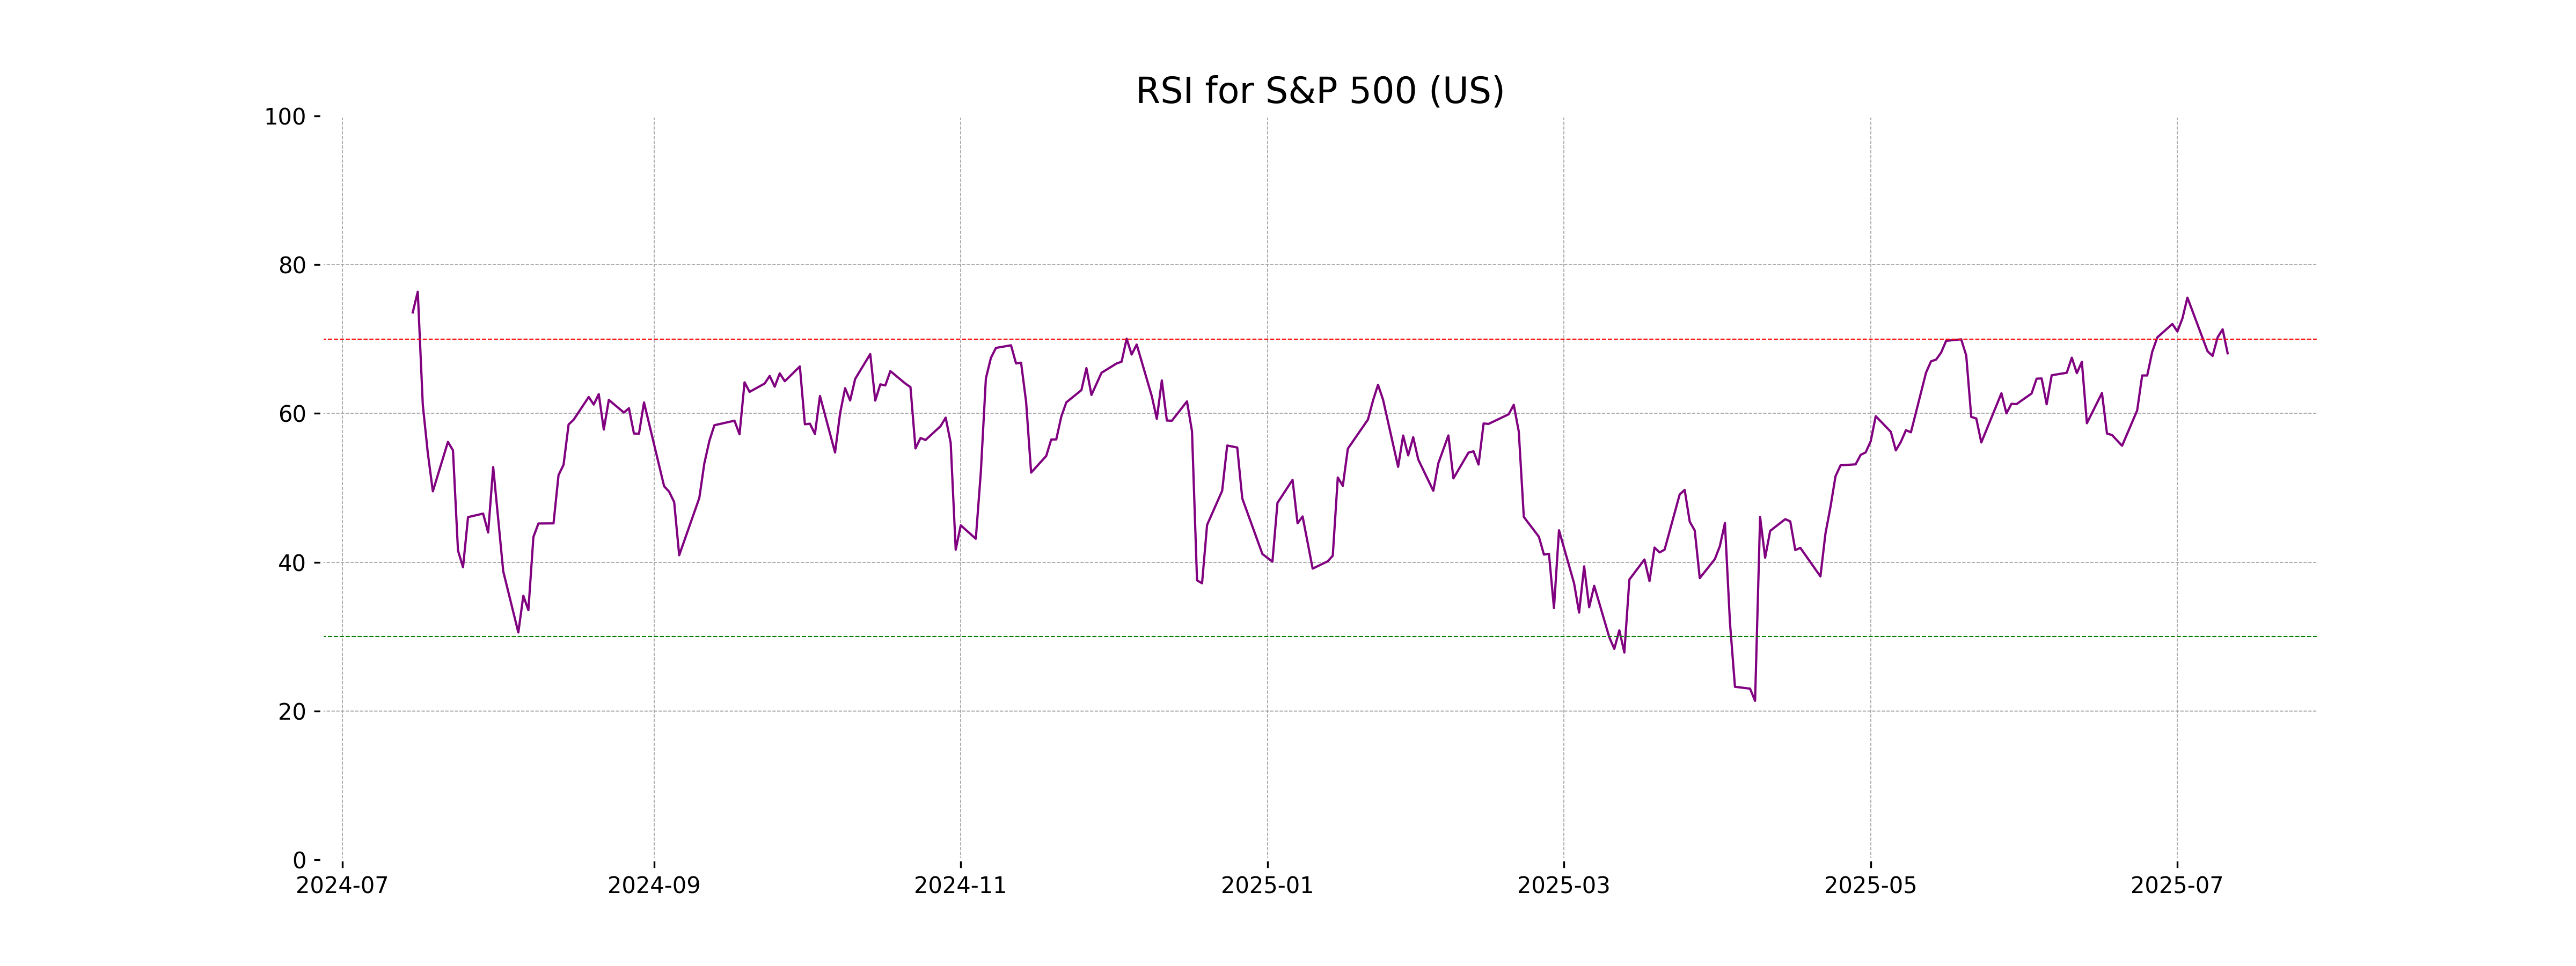
Analysis for S&P 500 (US) - July 14, 2025
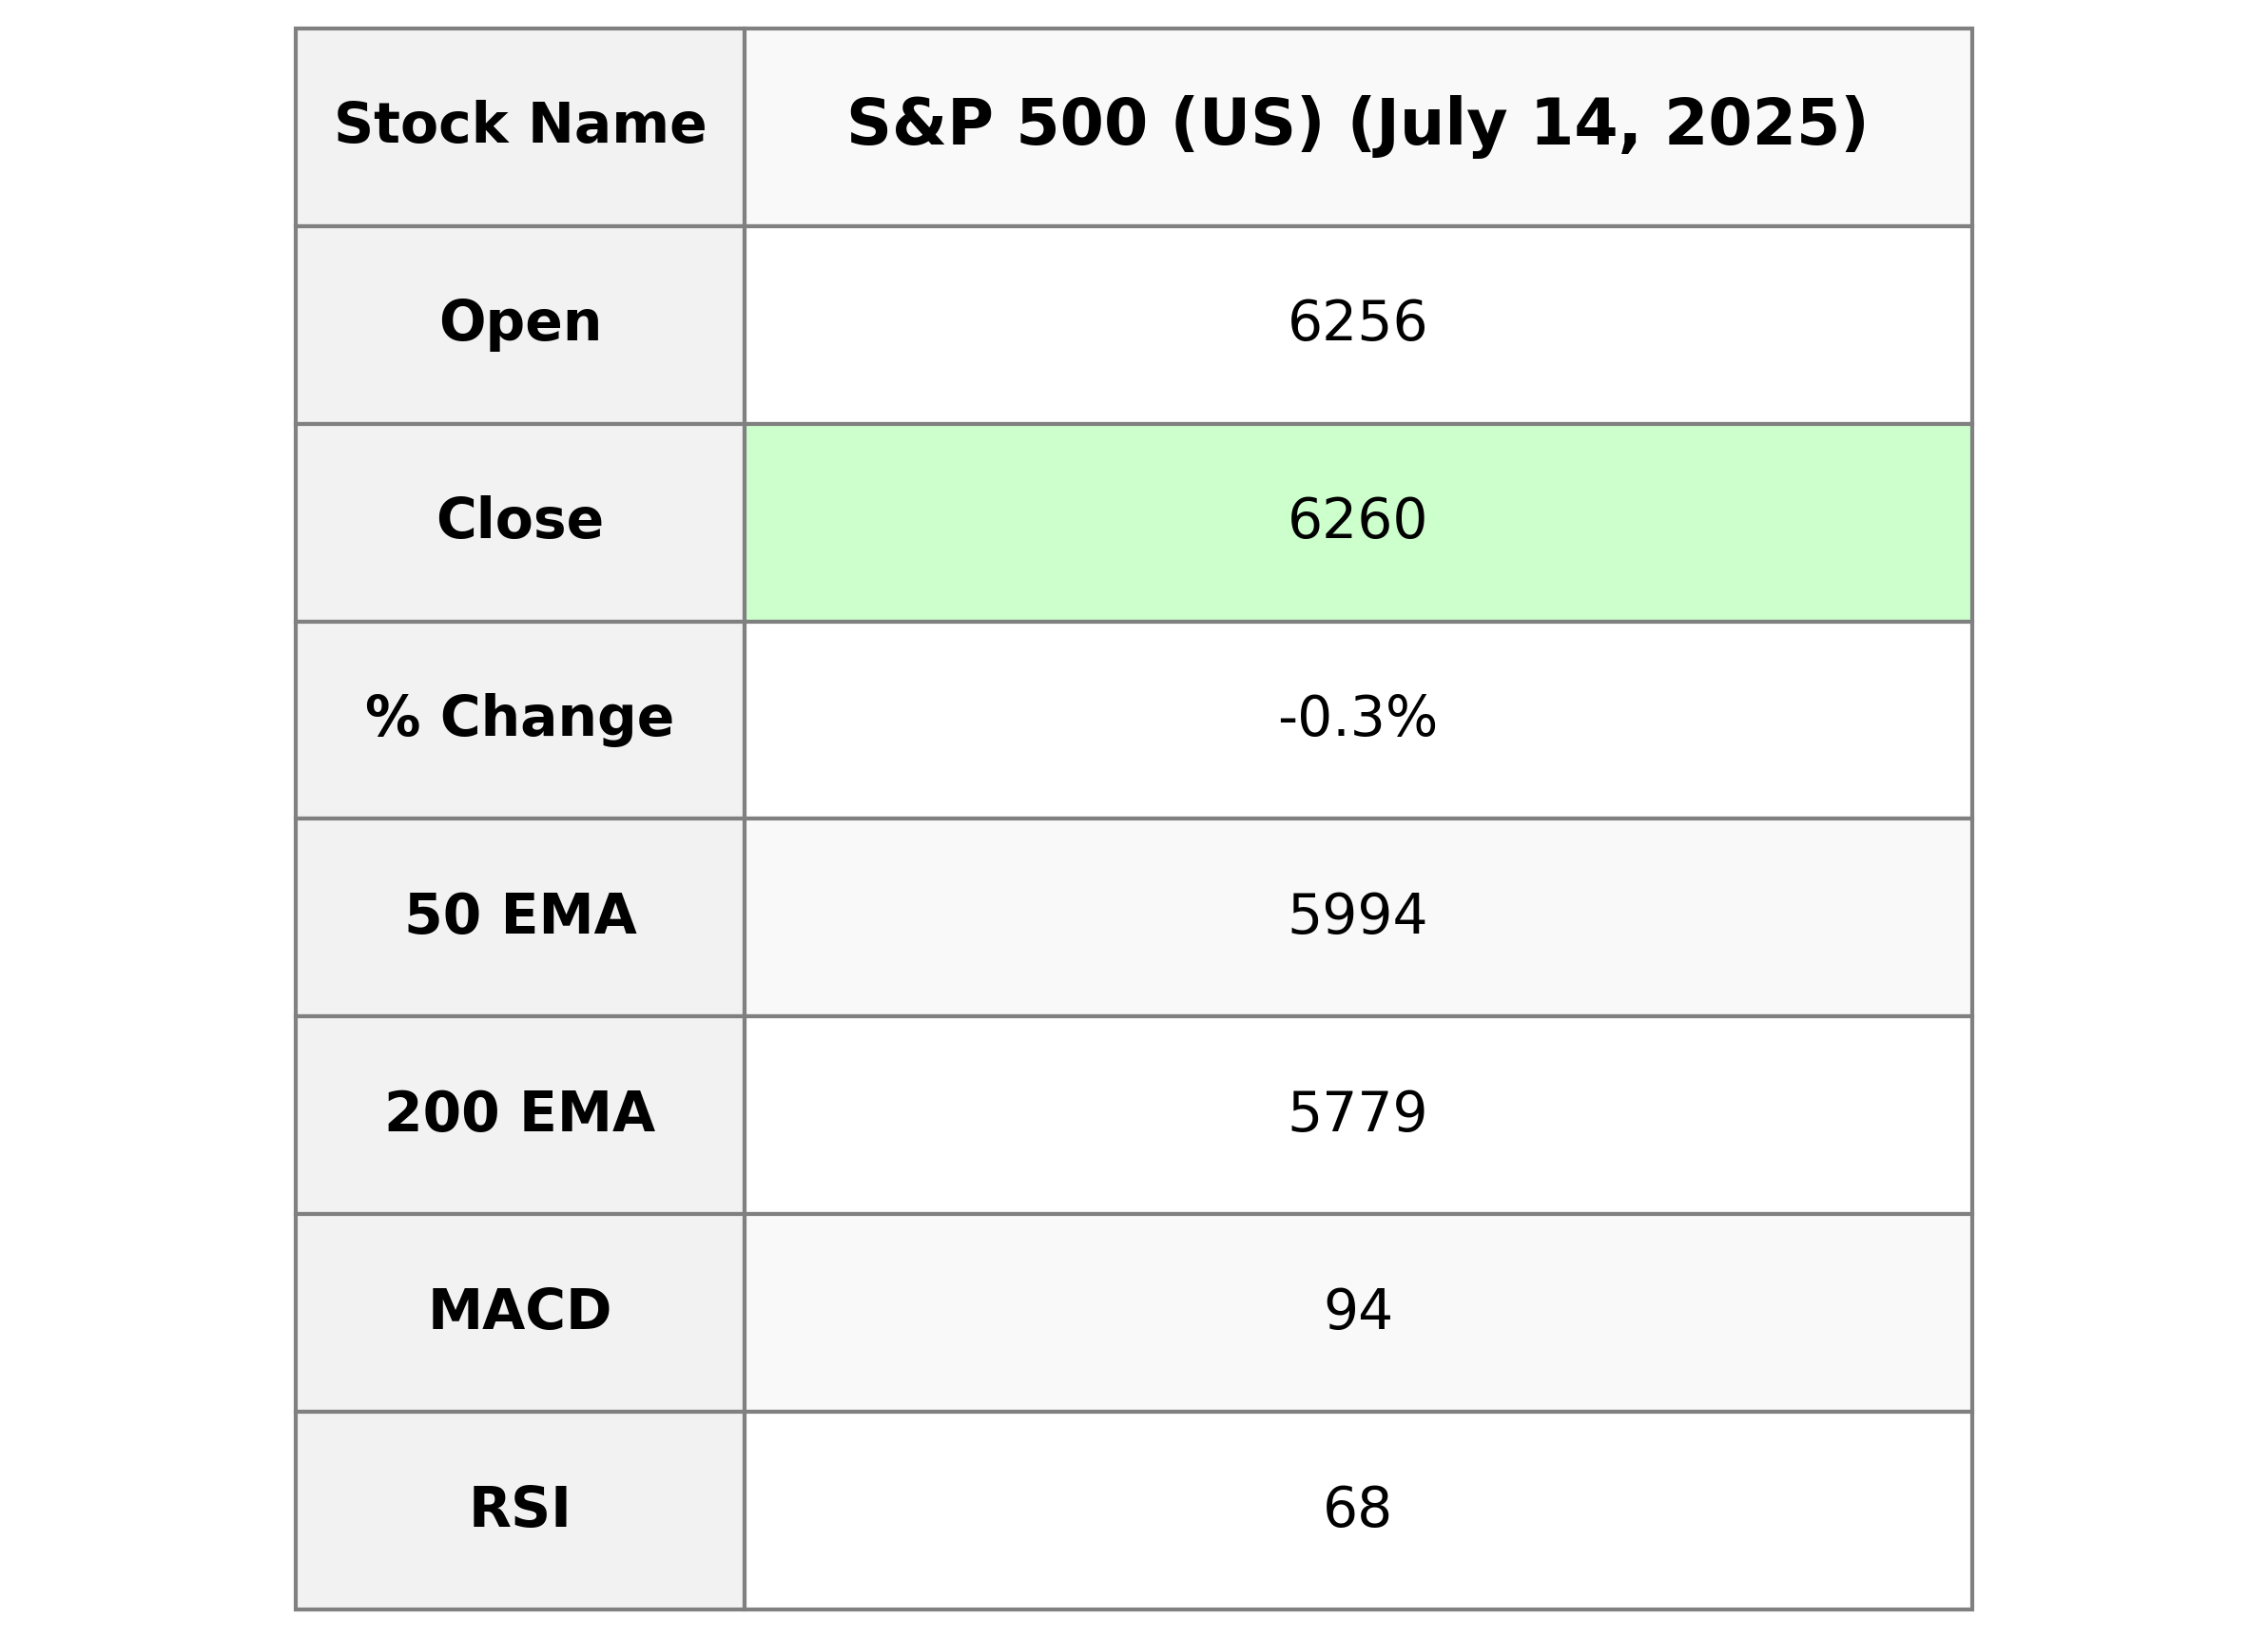
The S&P 500 (US) experienced a slight decline, with a closing value of 6259.75. This represents a decrease of 0.33% or a points change of -20.71 from the previous close of 6280.46. Despite the drop, the index is above its 10-day EMA of 6220.99, indicating some near-term strength. The RSI of 68.09 suggests the index is approaching overbought territory.
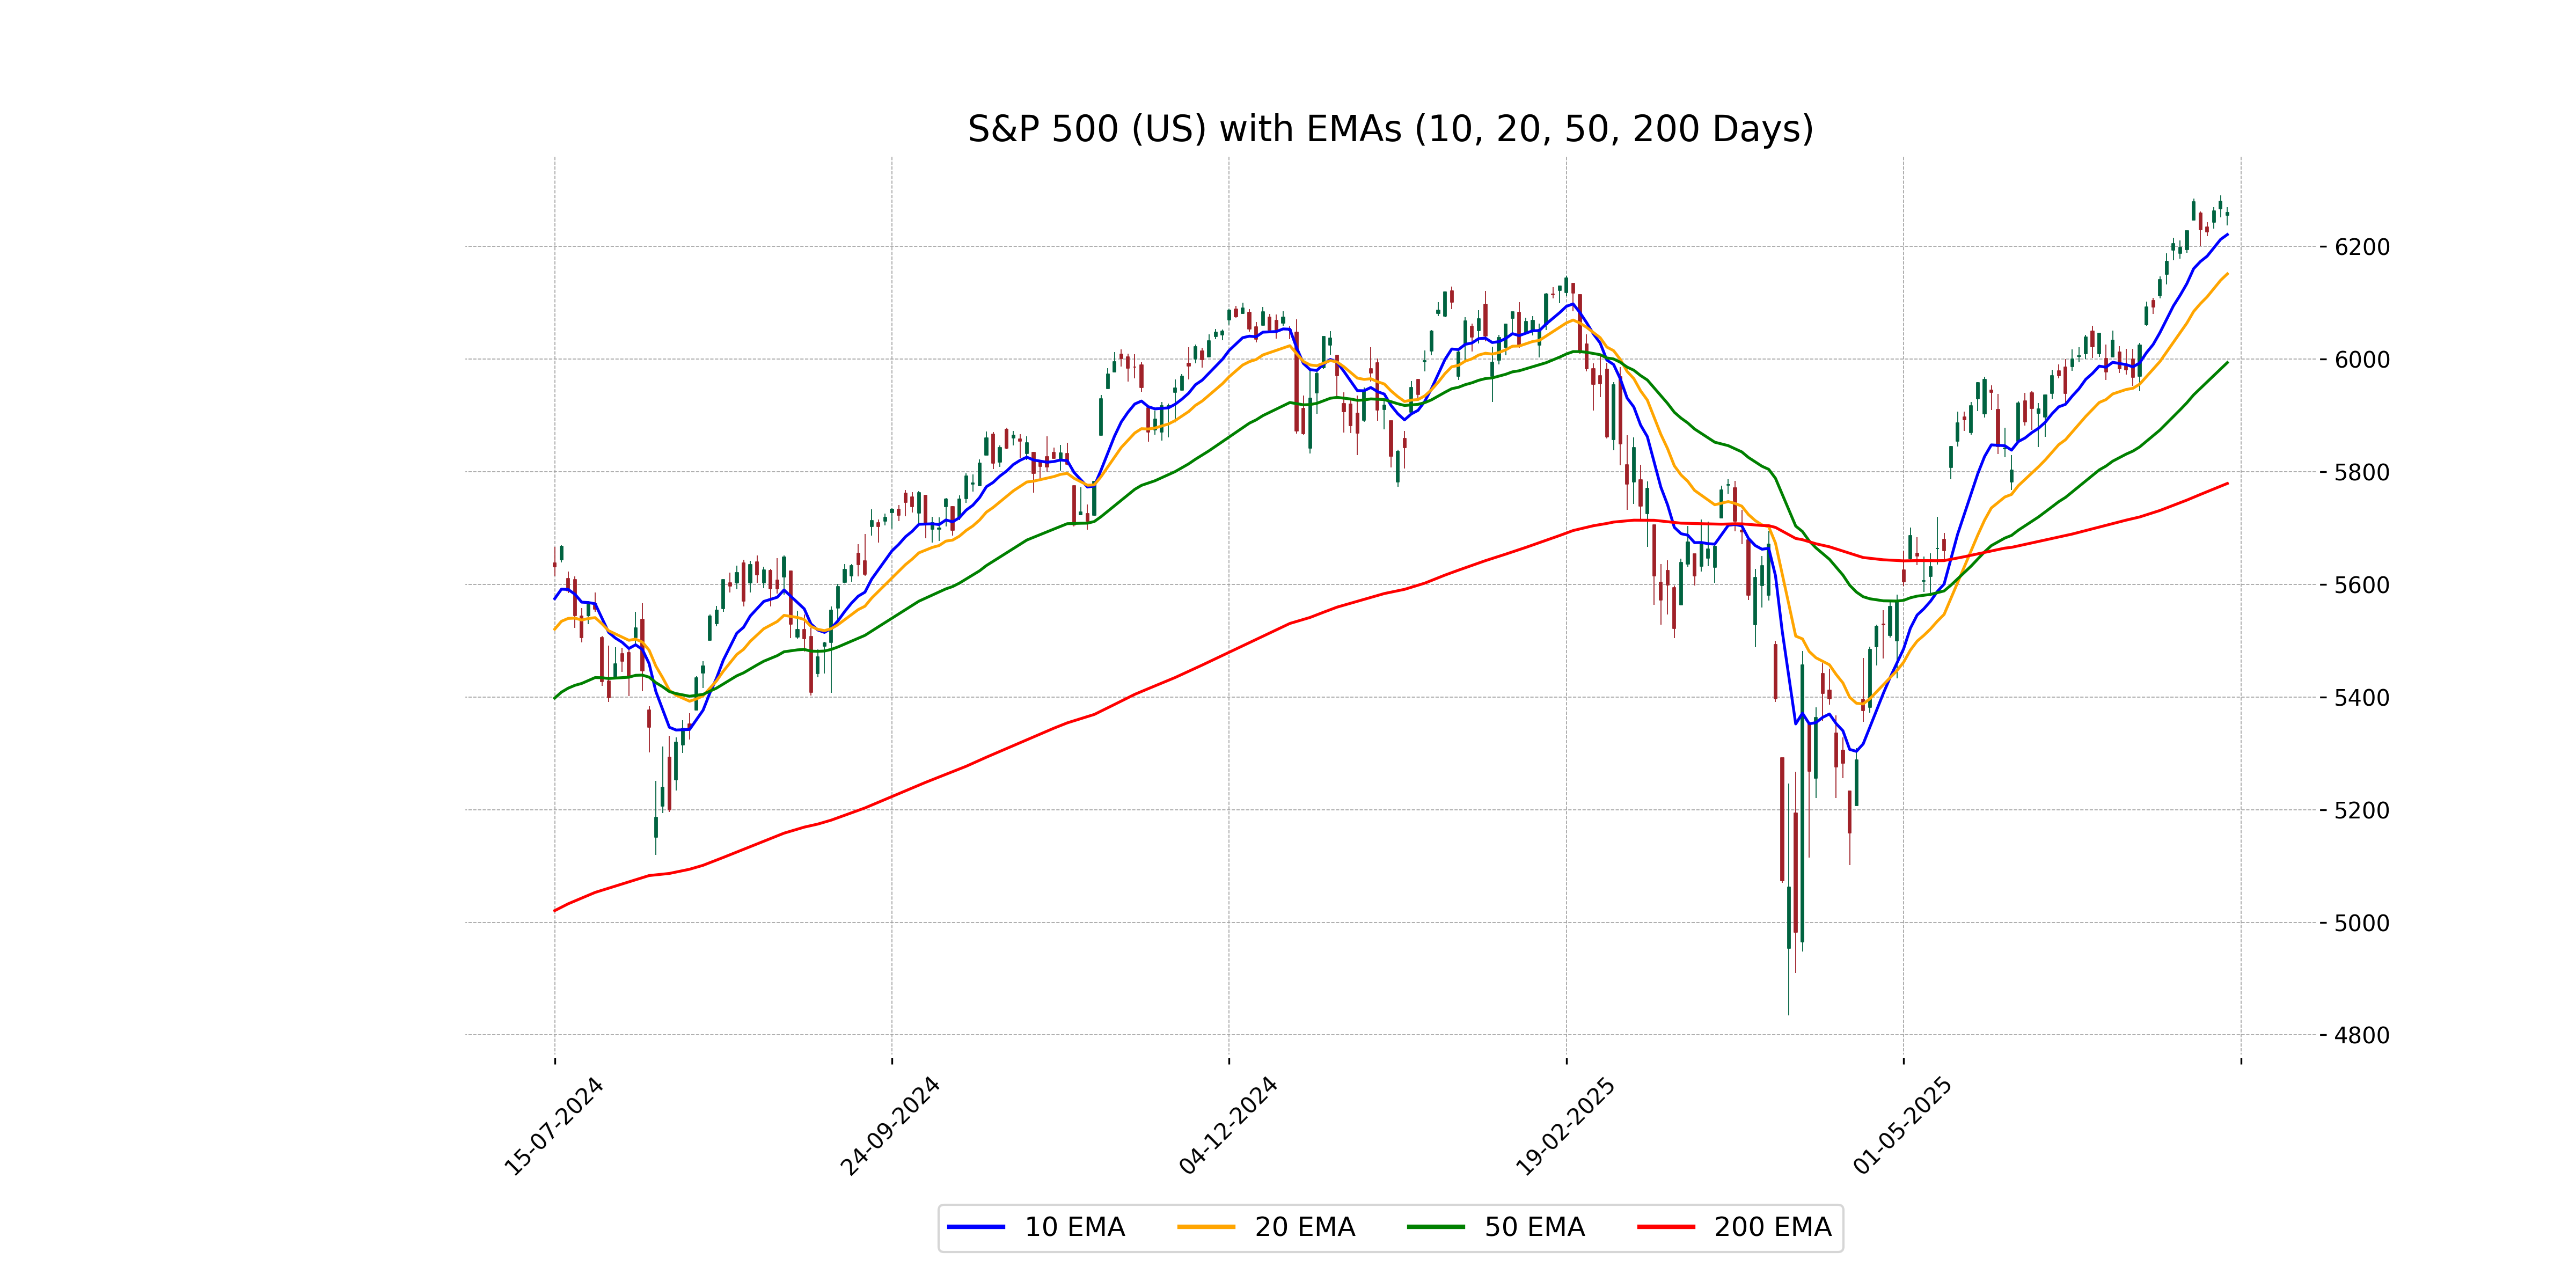
Relationship with Key Moving Averages
The closing price of the S&P 500 is 6,259.75, which is above both the 50-day EMA of 5,993.73 and the 200-day EMA of 5,779.08, indicating a strong upward trend in the medium to long term. However, the price is relatively close to the 10-day EMA of 6,220.99 and the 20-day EMA of 6,151.19, which suggests the current uptrend is supported by recent momentum.
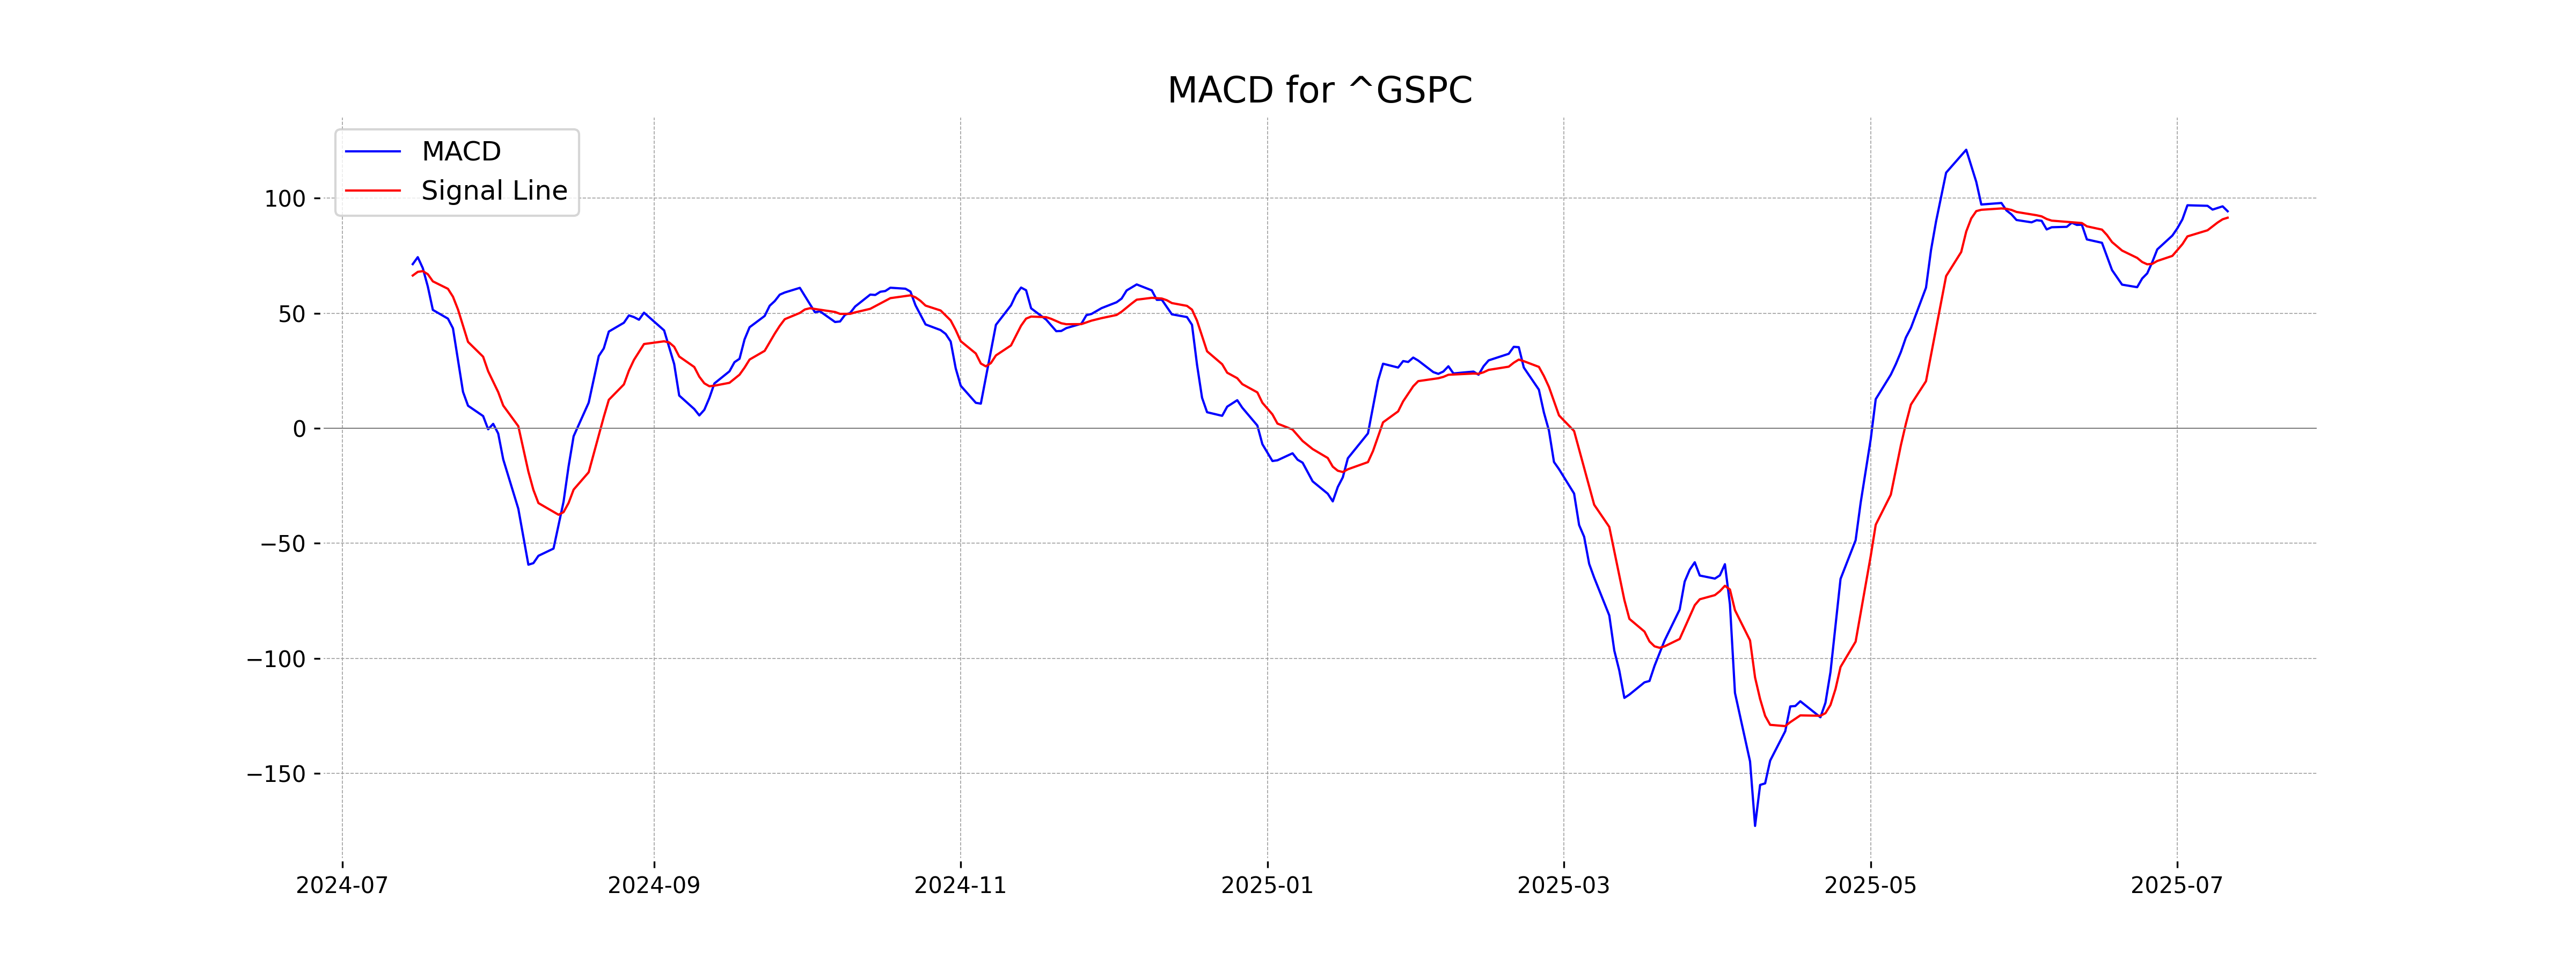
Moving Averages Trend (MACD)
The MACD for S&P 500 shows a value of 94.34, which is above the MACD Signal line of 91.54, indicating bullish momentum. This suggests potential positive price movement in the short term. However, consider other indicators and market conditions for a comprehensive analysis.
RSI Analysis
The RSI for S&P 500 is 68.09, indicating that the index is nearing the overbought territory, as RSI values above 70 suggest overbought conditions. It's crucial for investors to monitor closely as it could signal a potential price reversal if it continues to rise.
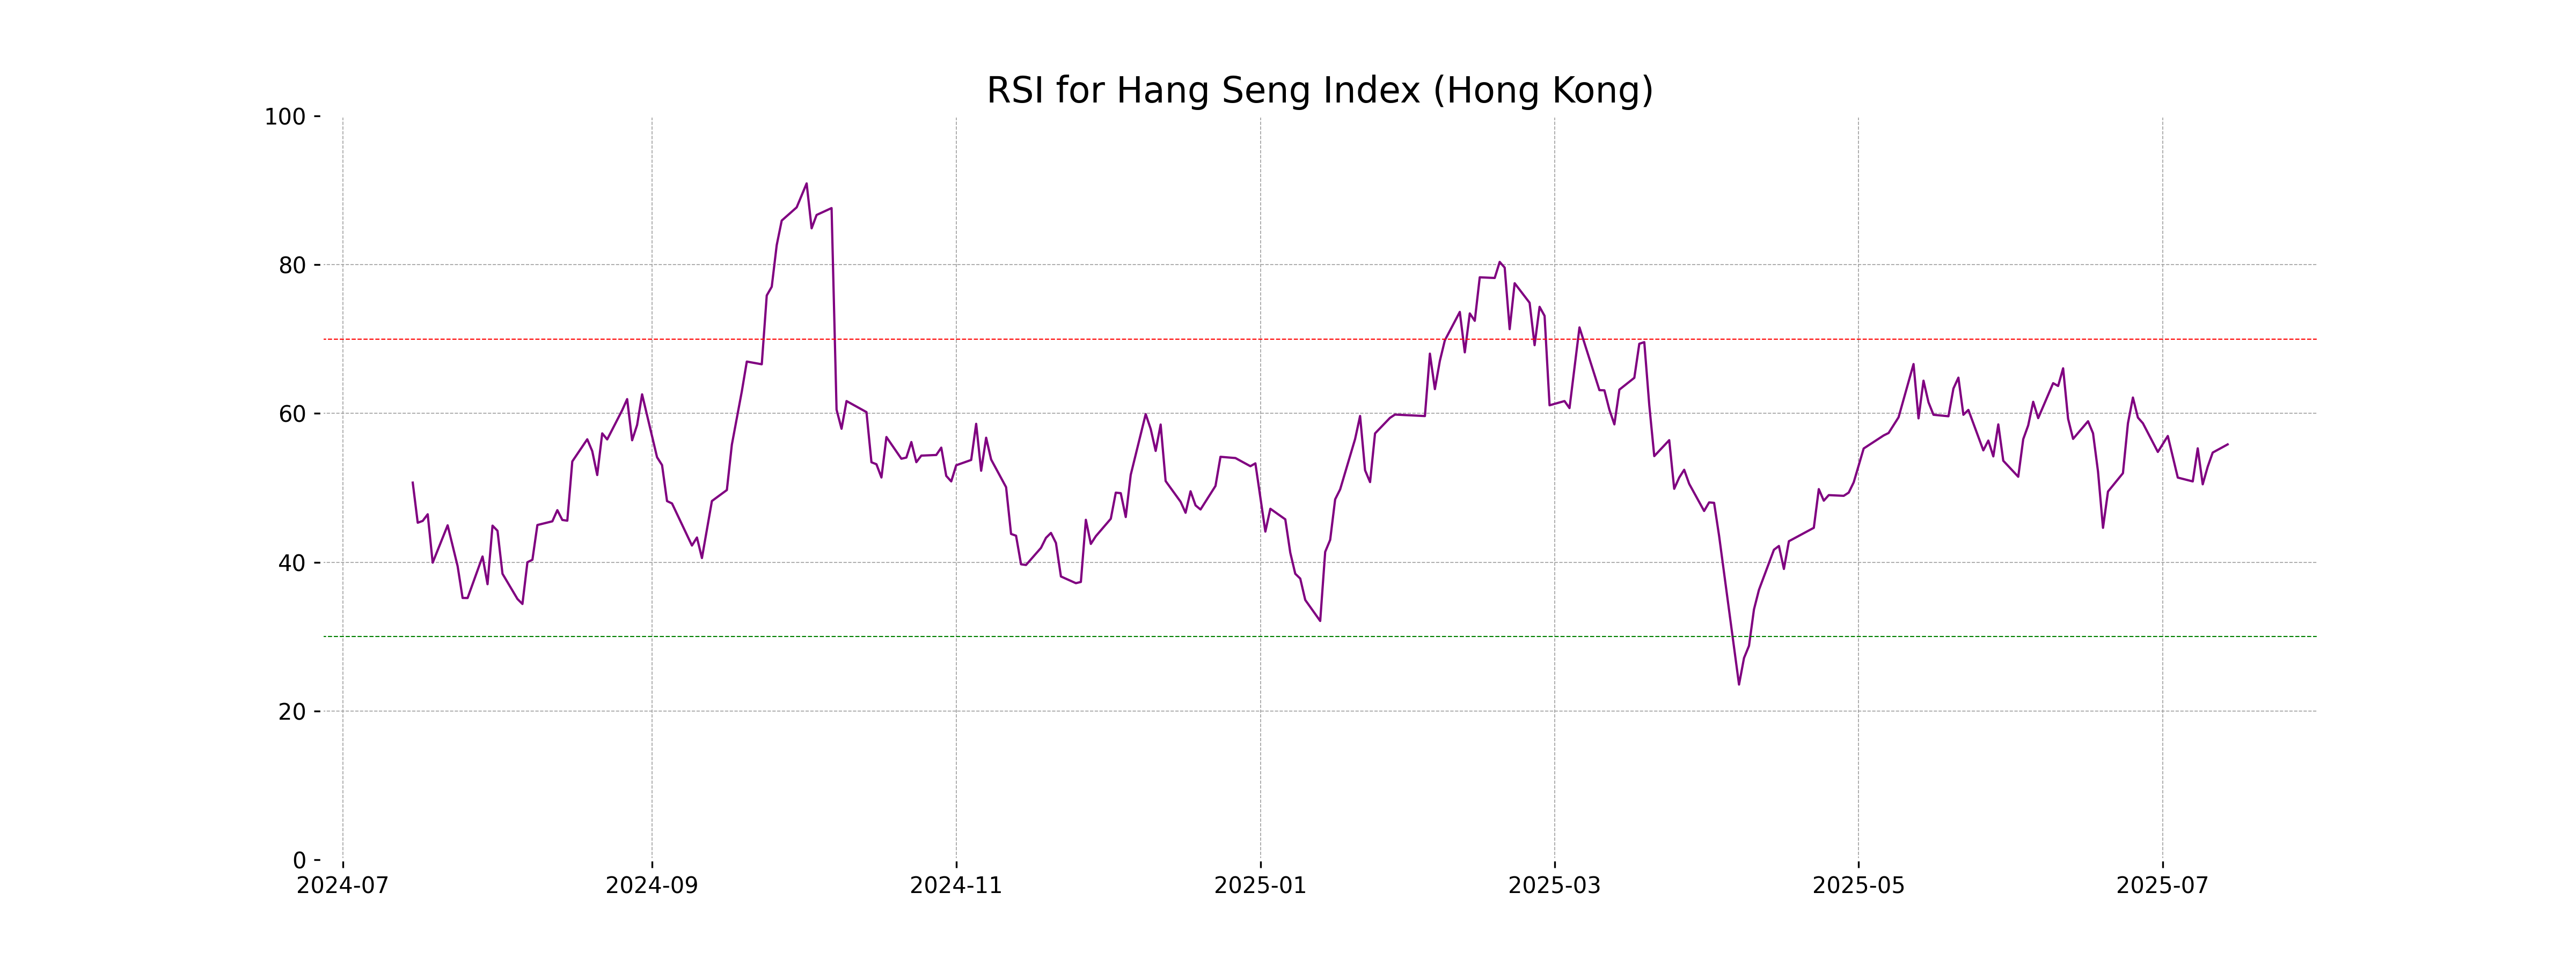
Analysis for Hang Seng Index (Hong Kong) - July 14, 2025
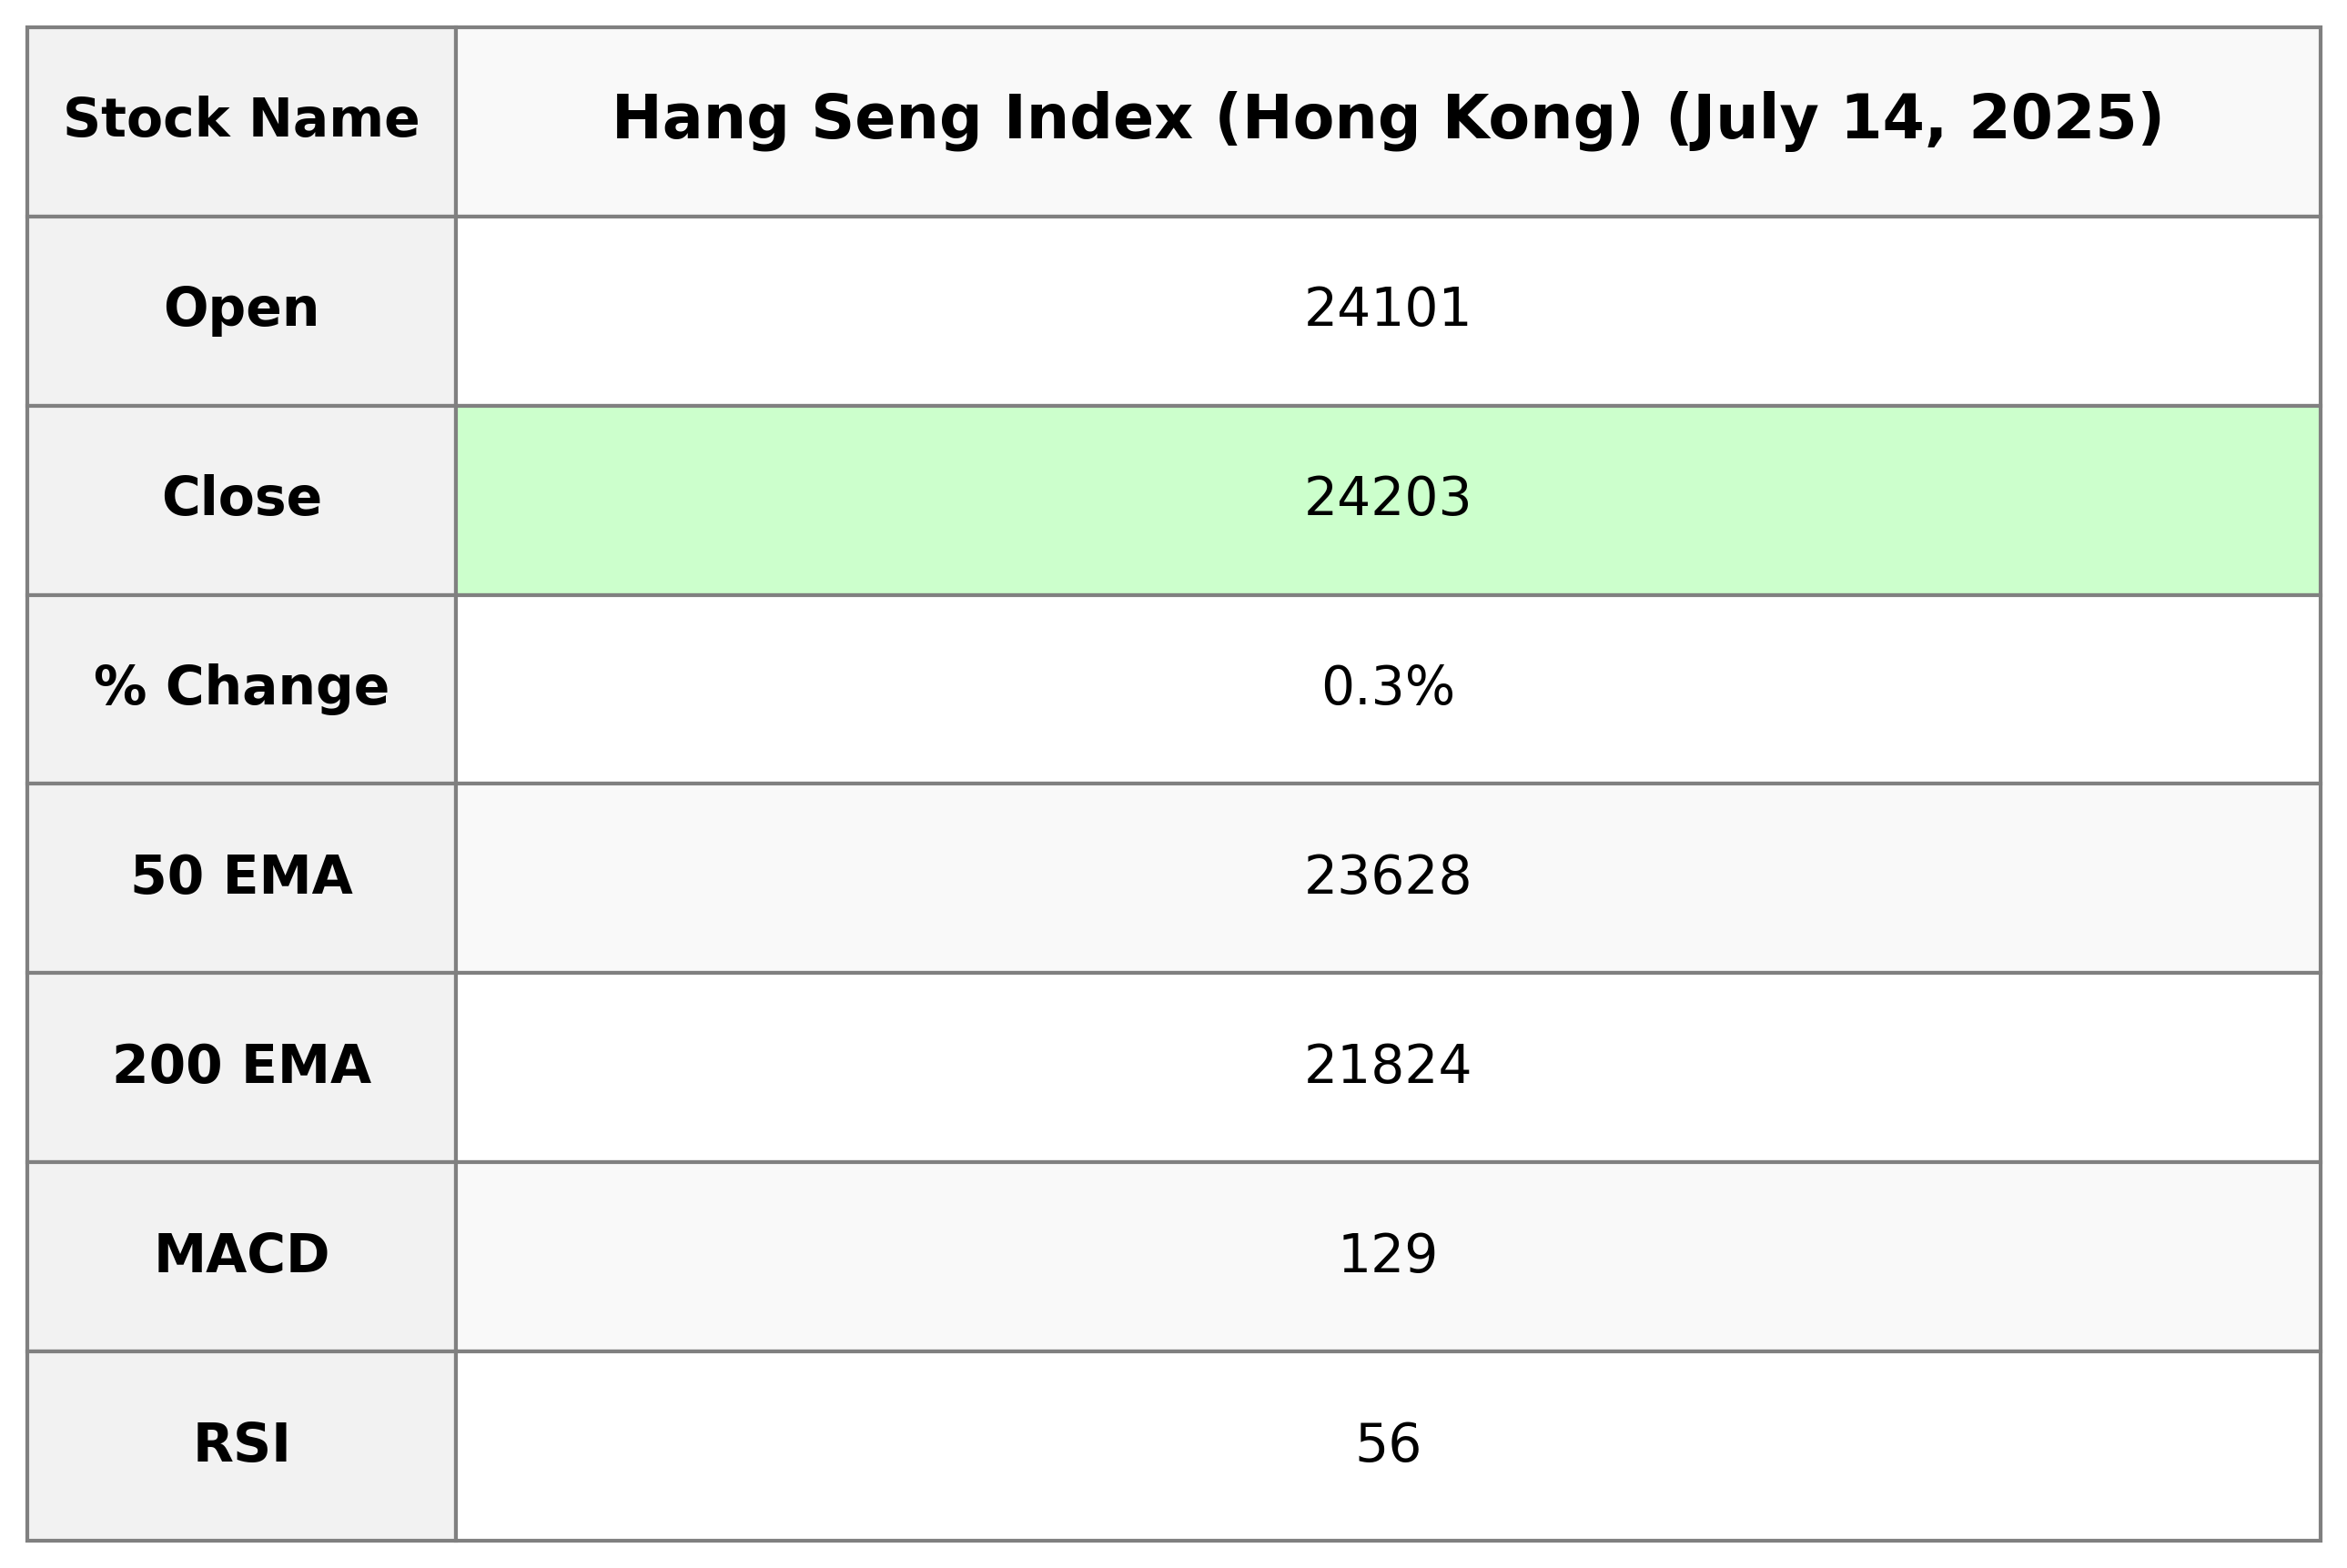
The Hang Seng Index opened at 24,100.57 and closed at 24,203.32, marking a gain of 0.26% or 63.75 points from the previous close of 24,139.57. The RSI stands at 55.84, indicating a neutral momentum. The MACD is below its signal line, which could suggest a slowing of current trend strength.
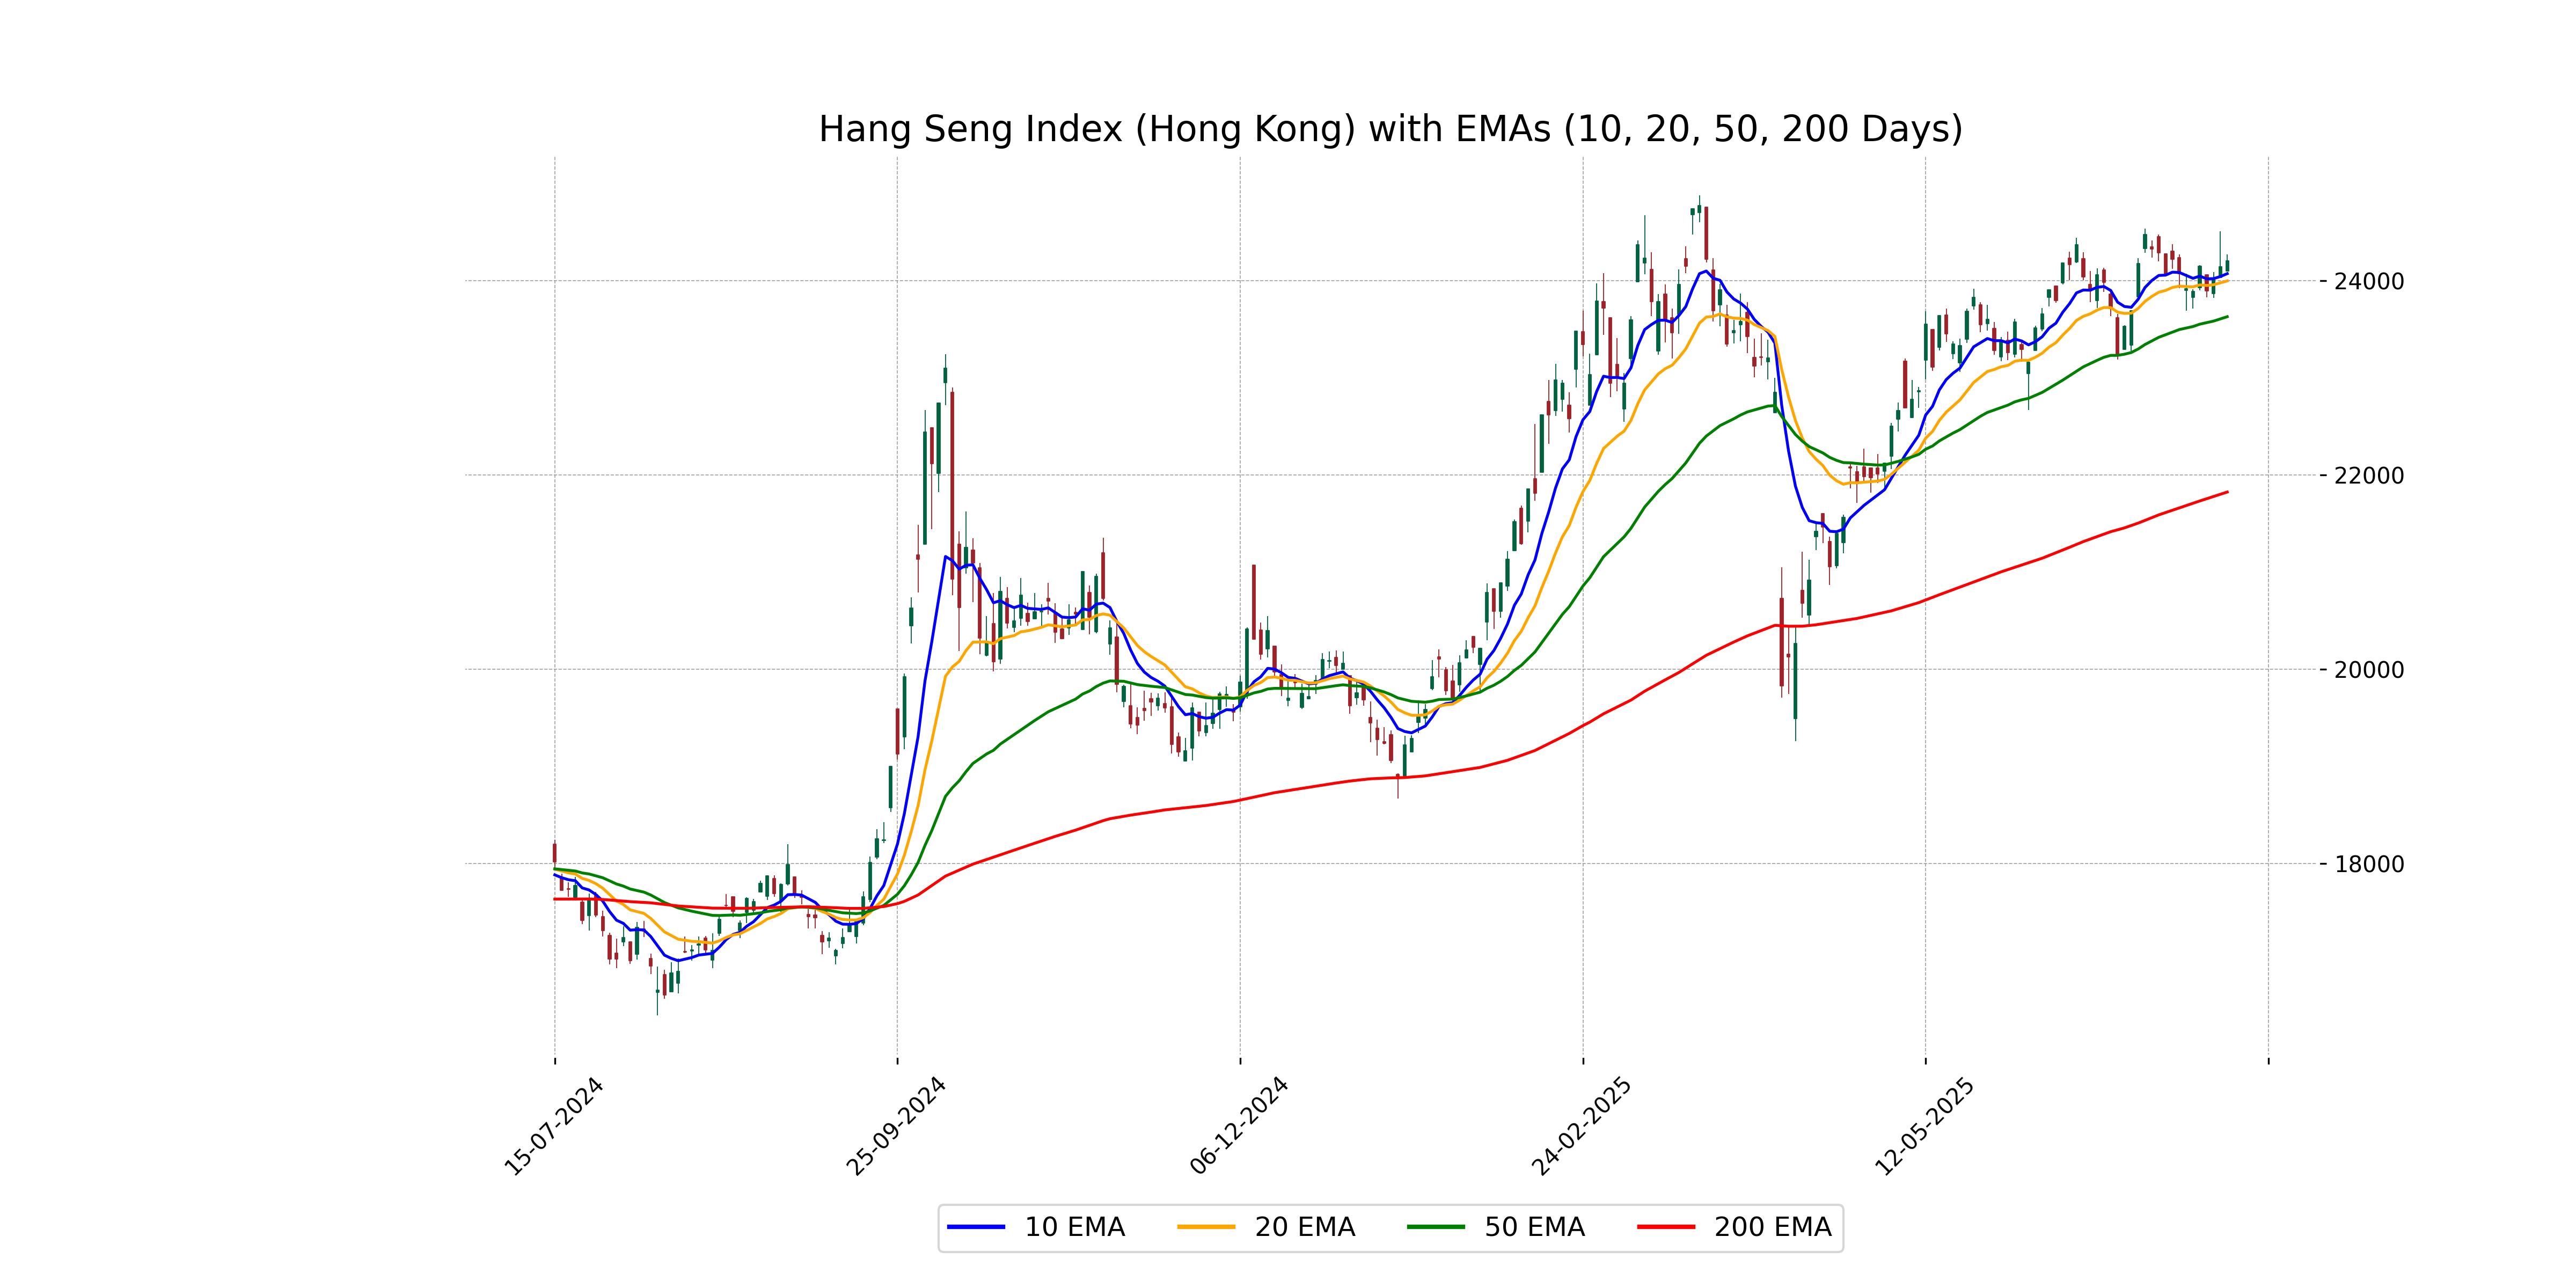
Relationship with Key Moving Averages
The Hang Seng Index closed at 24,203.32, which is above the 50-day EMA of 23,627.96 and the 10-day EMA of 24,070.84, indicating a potential bullish trend. However, it is below the MACD signal of 153.92, suggesting caution in the momentum.
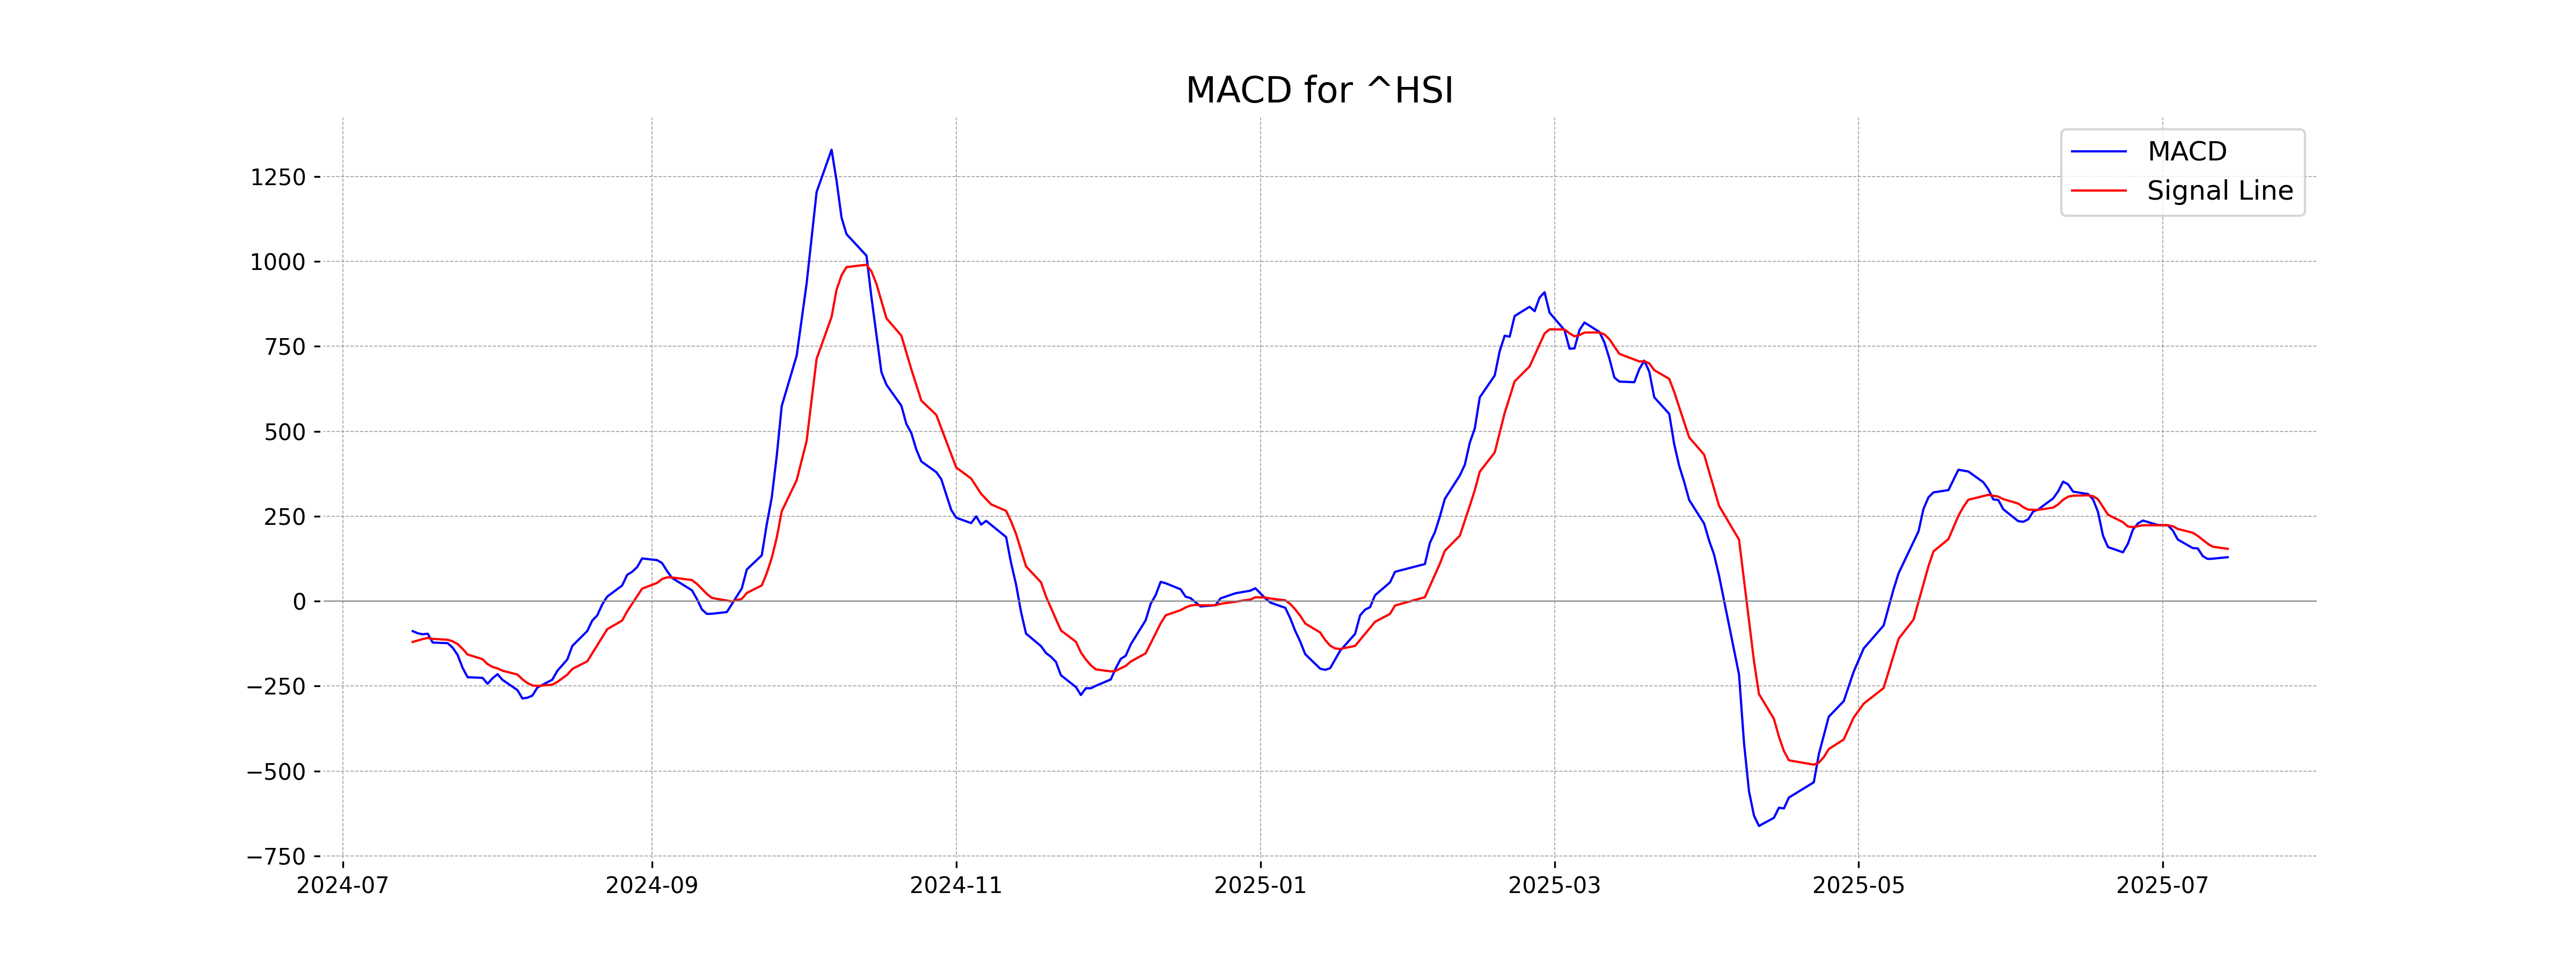
Moving Averages Trend (MACD)
MACD Analysis for Hang Seng Index (Hong Kong): The MACD value of 129.17 is below the MACD Signal value of 153.92, indicating a potential bearish trend. Continuous monitoring is recommended to confirm any downward movement sentiments.
RSI Analysis
Based on the provided stock data for Hang Seng Index (Hong Kong), the RSI stands at approximately 55.84. This value suggests a neutral market position, indicating that the index is neither overbought nor oversold. An RSI below 30 typically signals potential buying opportunities, while above 70 suggests potential selling.
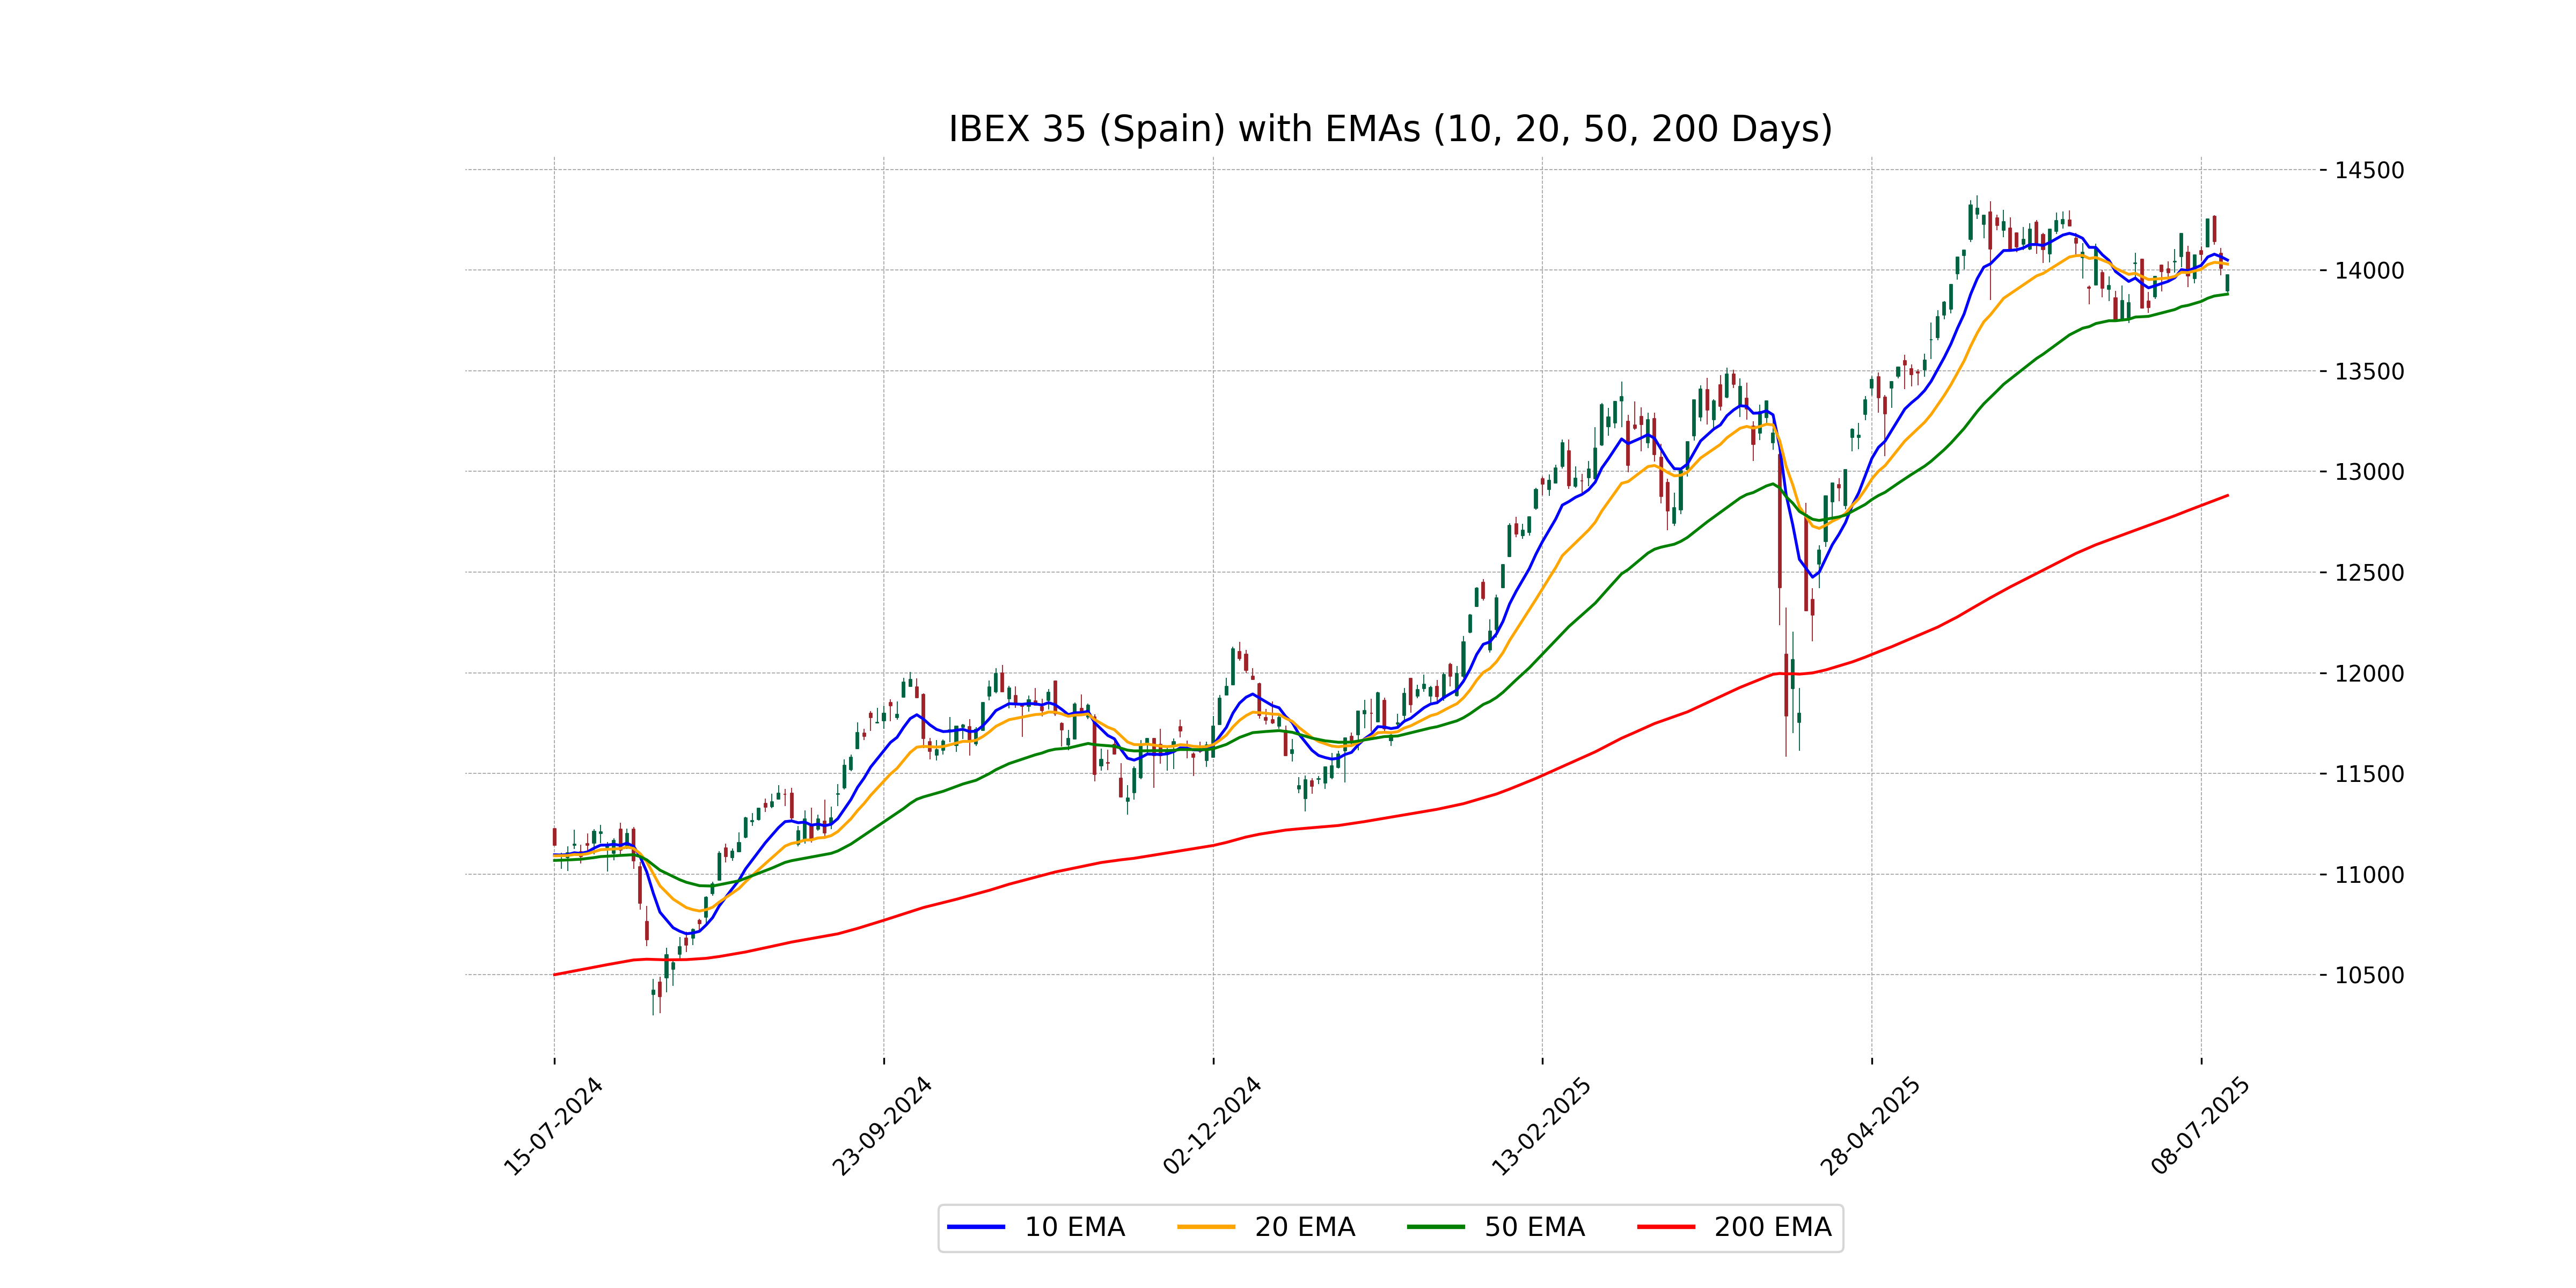
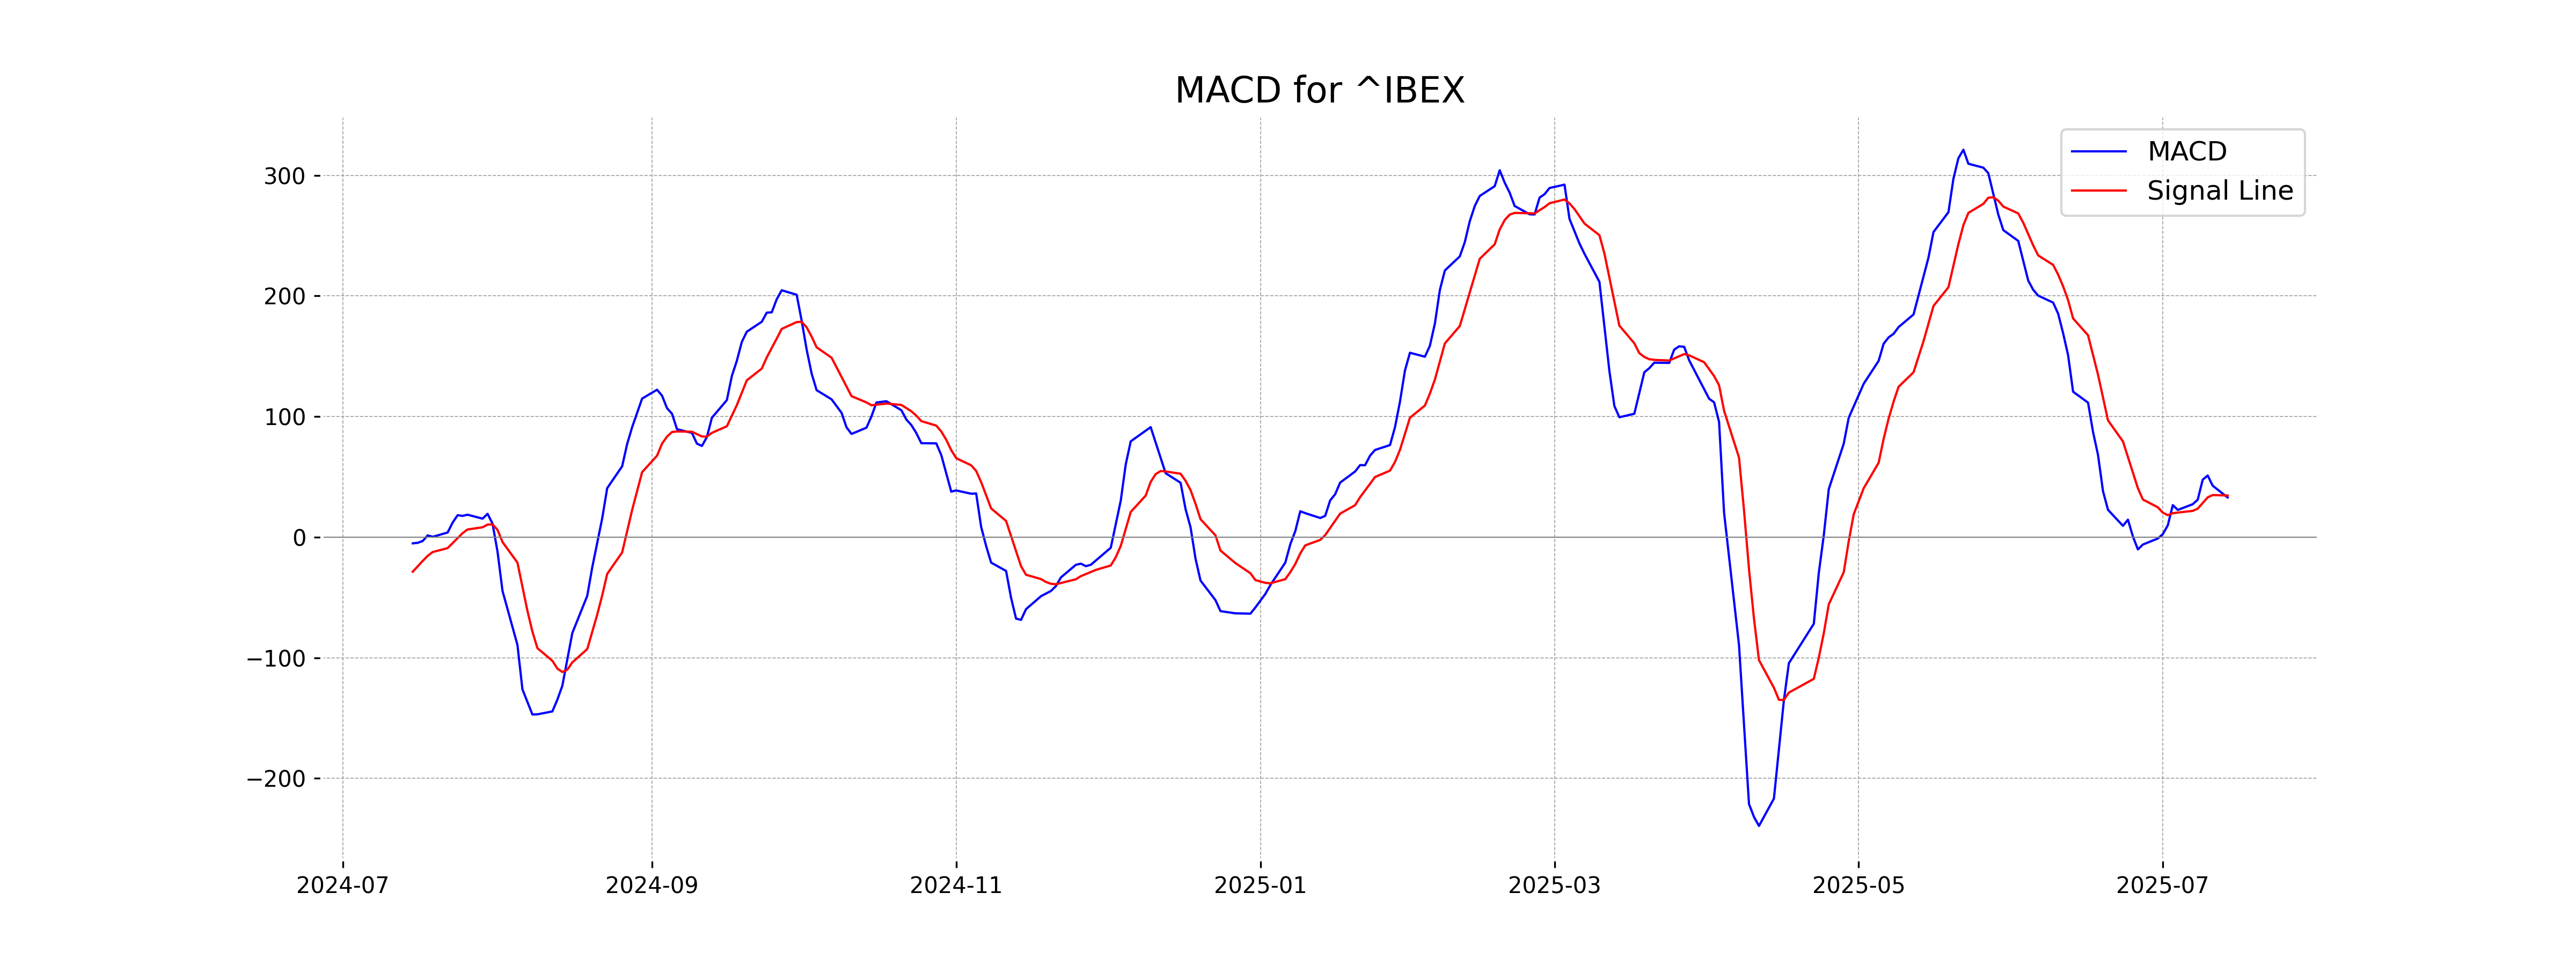
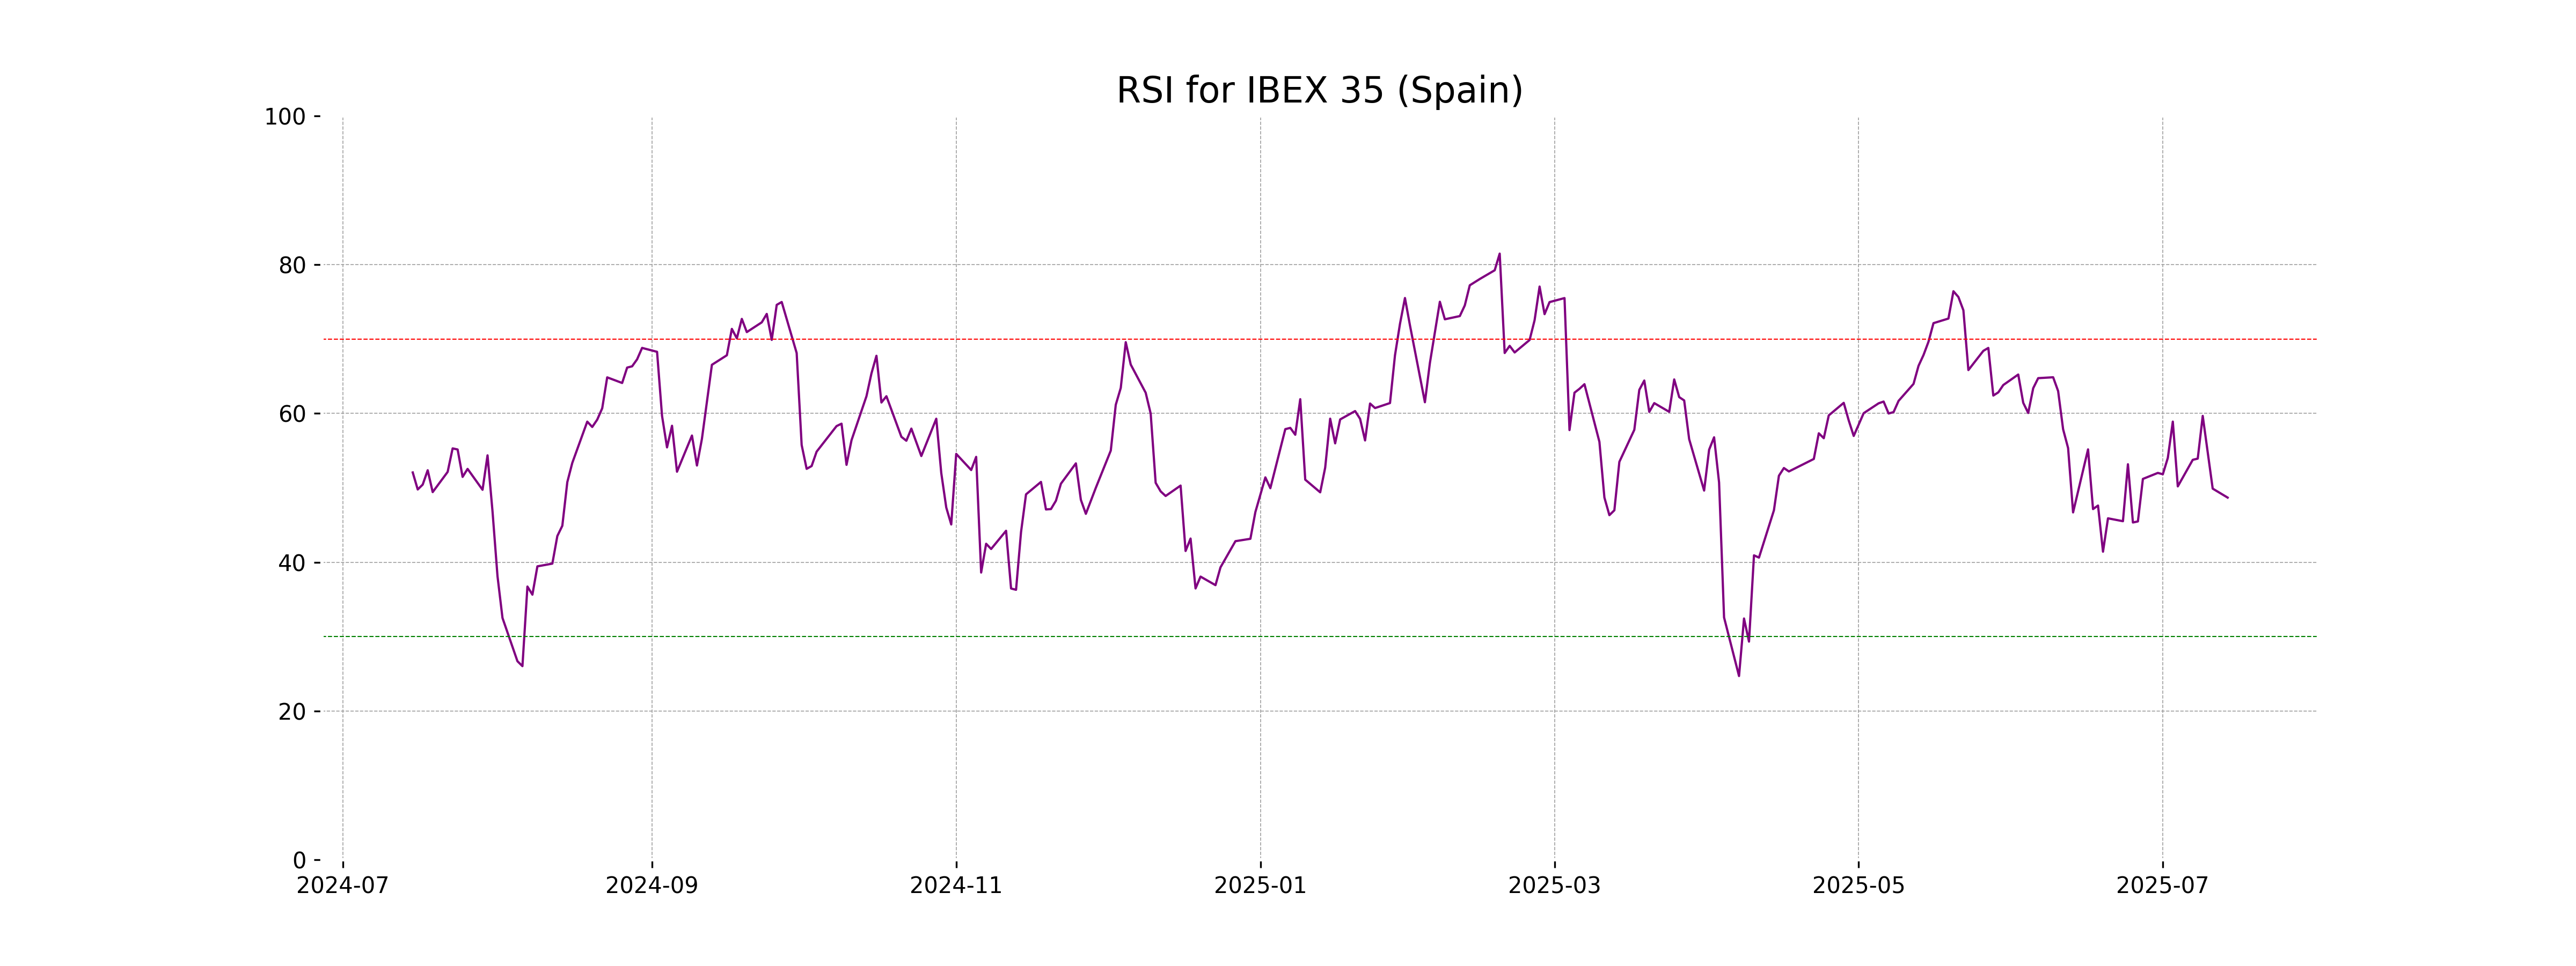
Analysis for IBEX 35 (Spain) - July 14, 2025
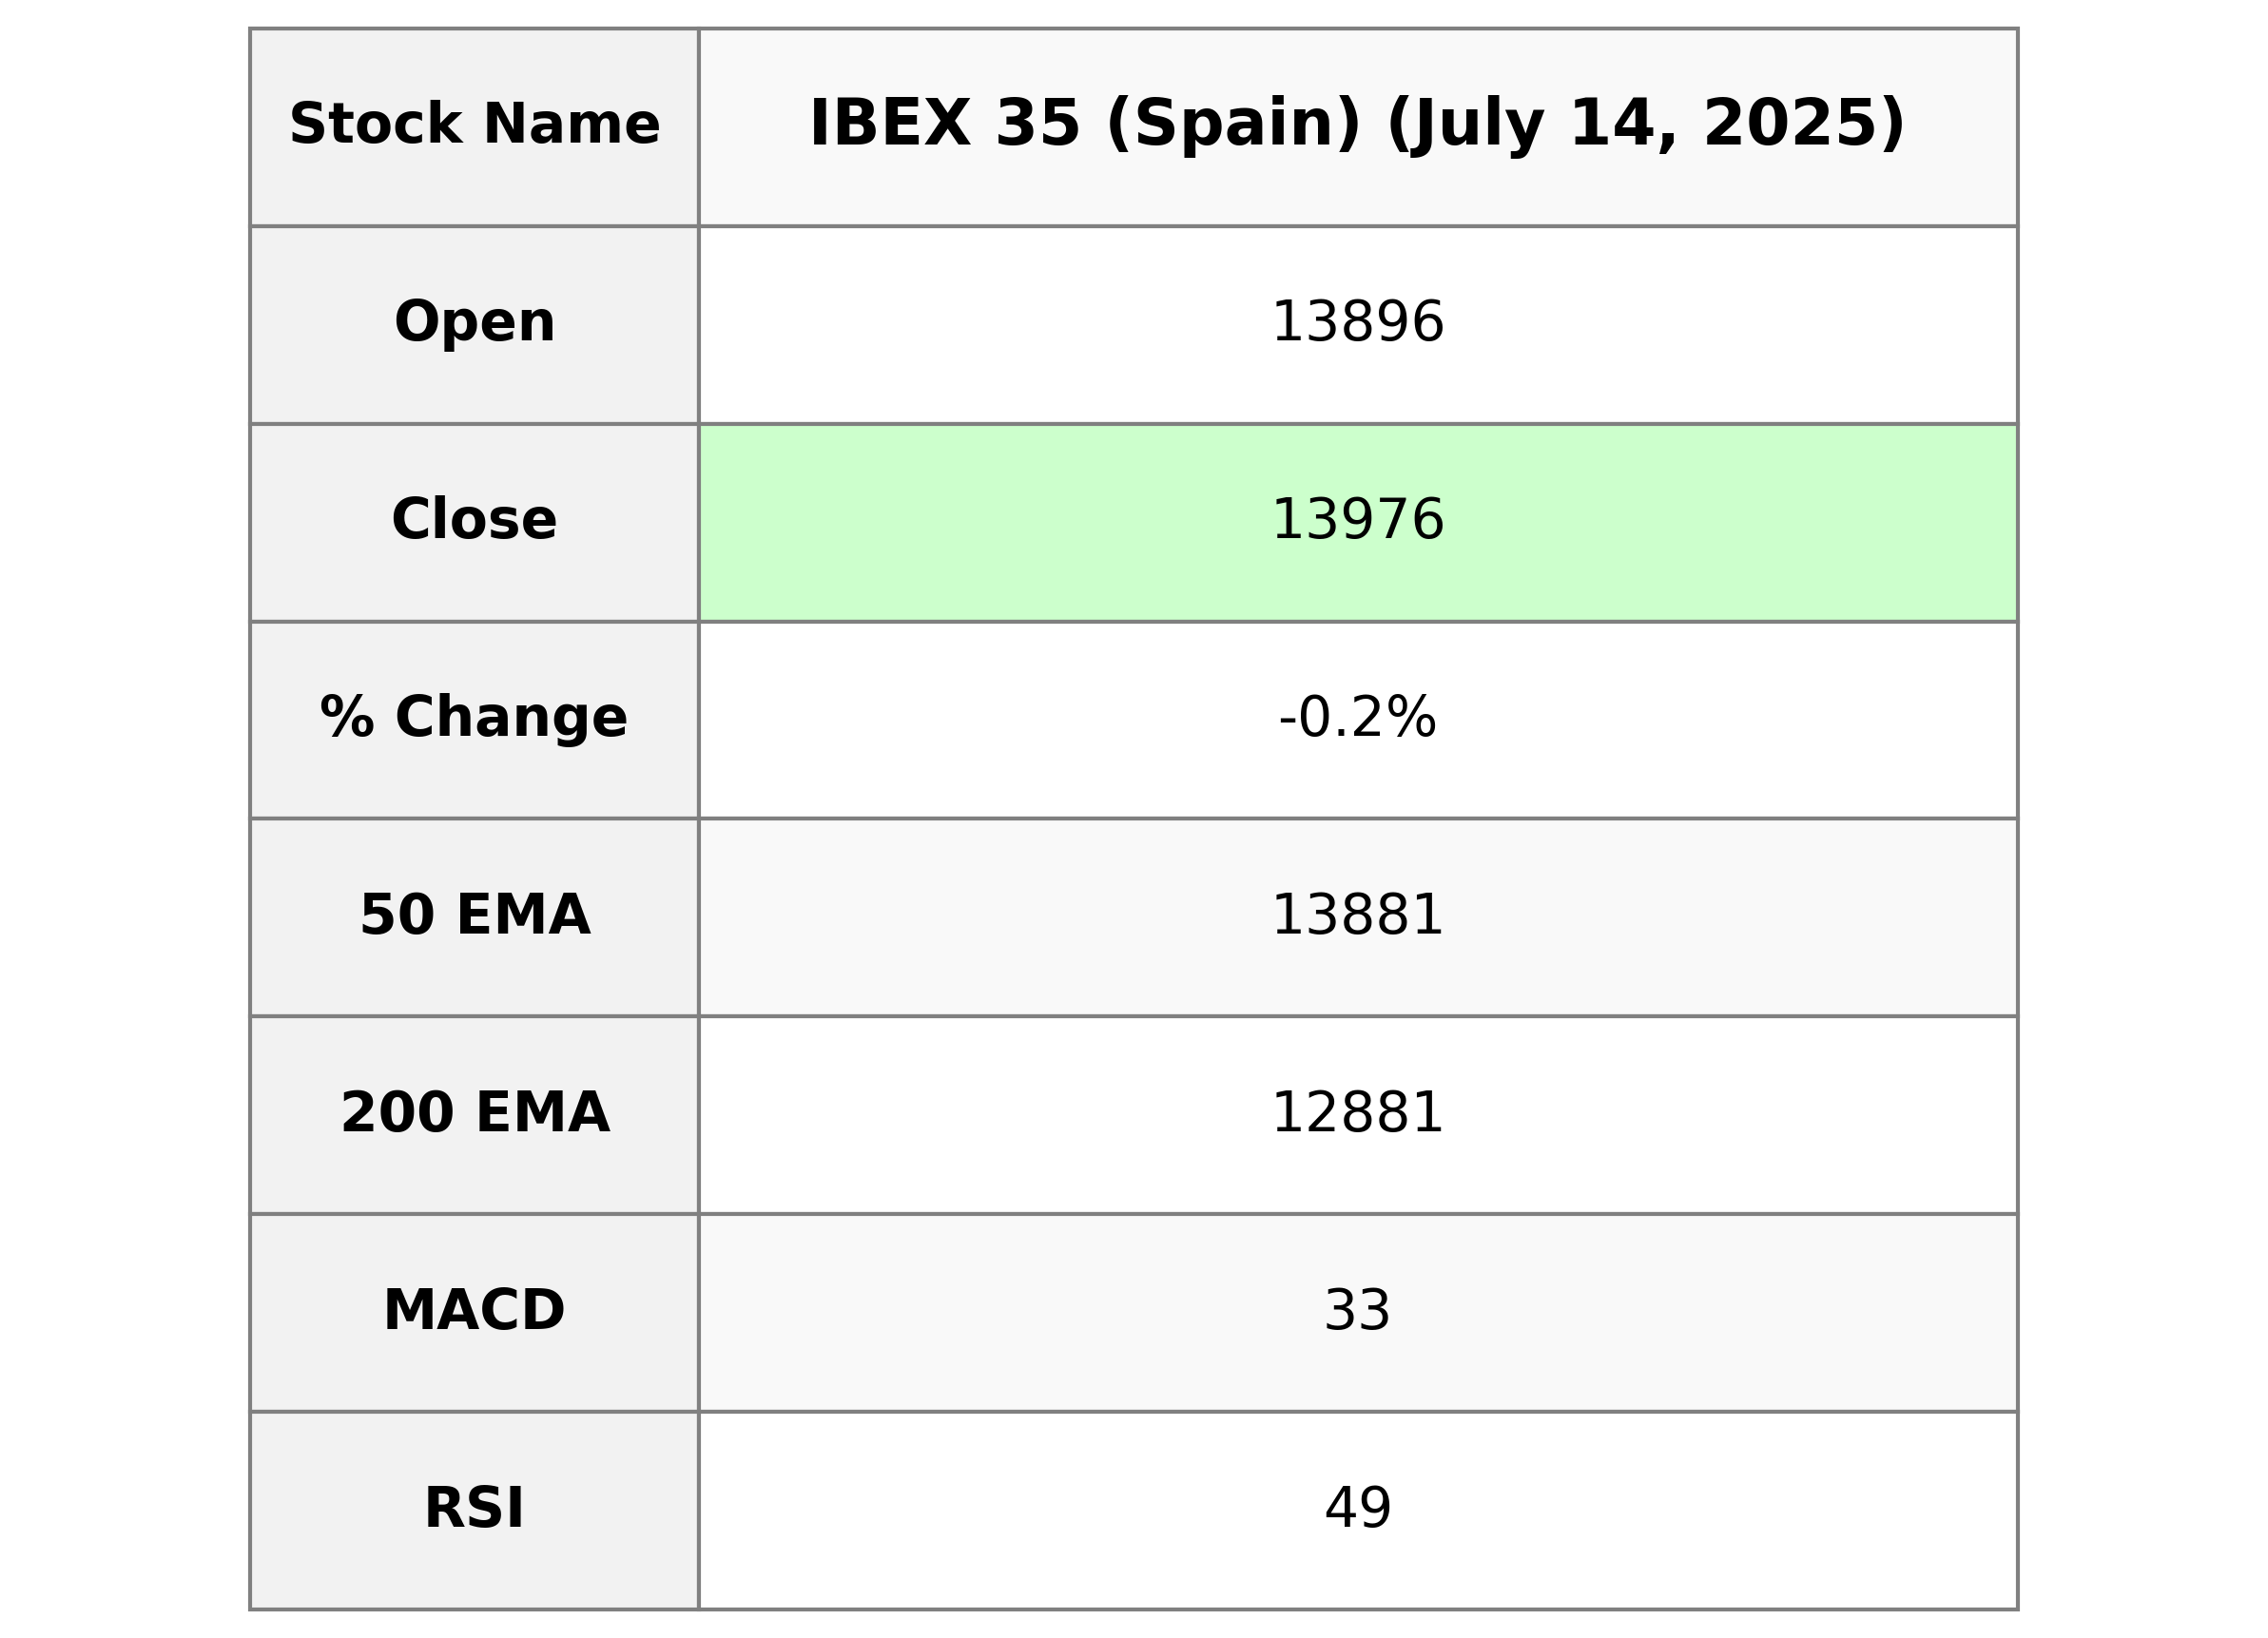
The IBEX 35 index opened at 13,896.10, reaching a high of 13,981.10 and closing at 13,975.90, reflecting a slight decline from the previous close of 14,009.20, with a percentage change of -0.24%. The RSI is at 48.69, indicating a neutral position, while the MACD is below its signal line, suggesting potential bearish momentum. The trading volume stood at 27,083,109.
Relationship with Key Moving Averages
IBEX 35 (Spain) is currently trading above its 50-day EMA of 13,881.04 but below its 10-day EMA of 14,050.23 and 20-day EMA of 14,030.28, indicating potential short-term weakness amidst a longer-term upward trend. It is significantly above the 200-day EMA of 12,880.70, suggesting overall long-term bullish momentum.
Moving Averages Trend (MACD)
MACD Analysis for IBEX 35: The current MACD value is 32.87, which is slightly below the MACD Signal line of 34.49, indicating a potential bearish crossover. This suggests that the recent momentum might be weakening, signaling a possible short-term decline in market strength.
RSI Analysis
The current RSI for IBEX 35 is 48.69, which suggests a neutral level as it is close to 50. This implies that the index is neither overbought nor oversold, indicating a balanced state in the market for this period.
Analysis for NASDAQ Composite (US) - July 14, 2025
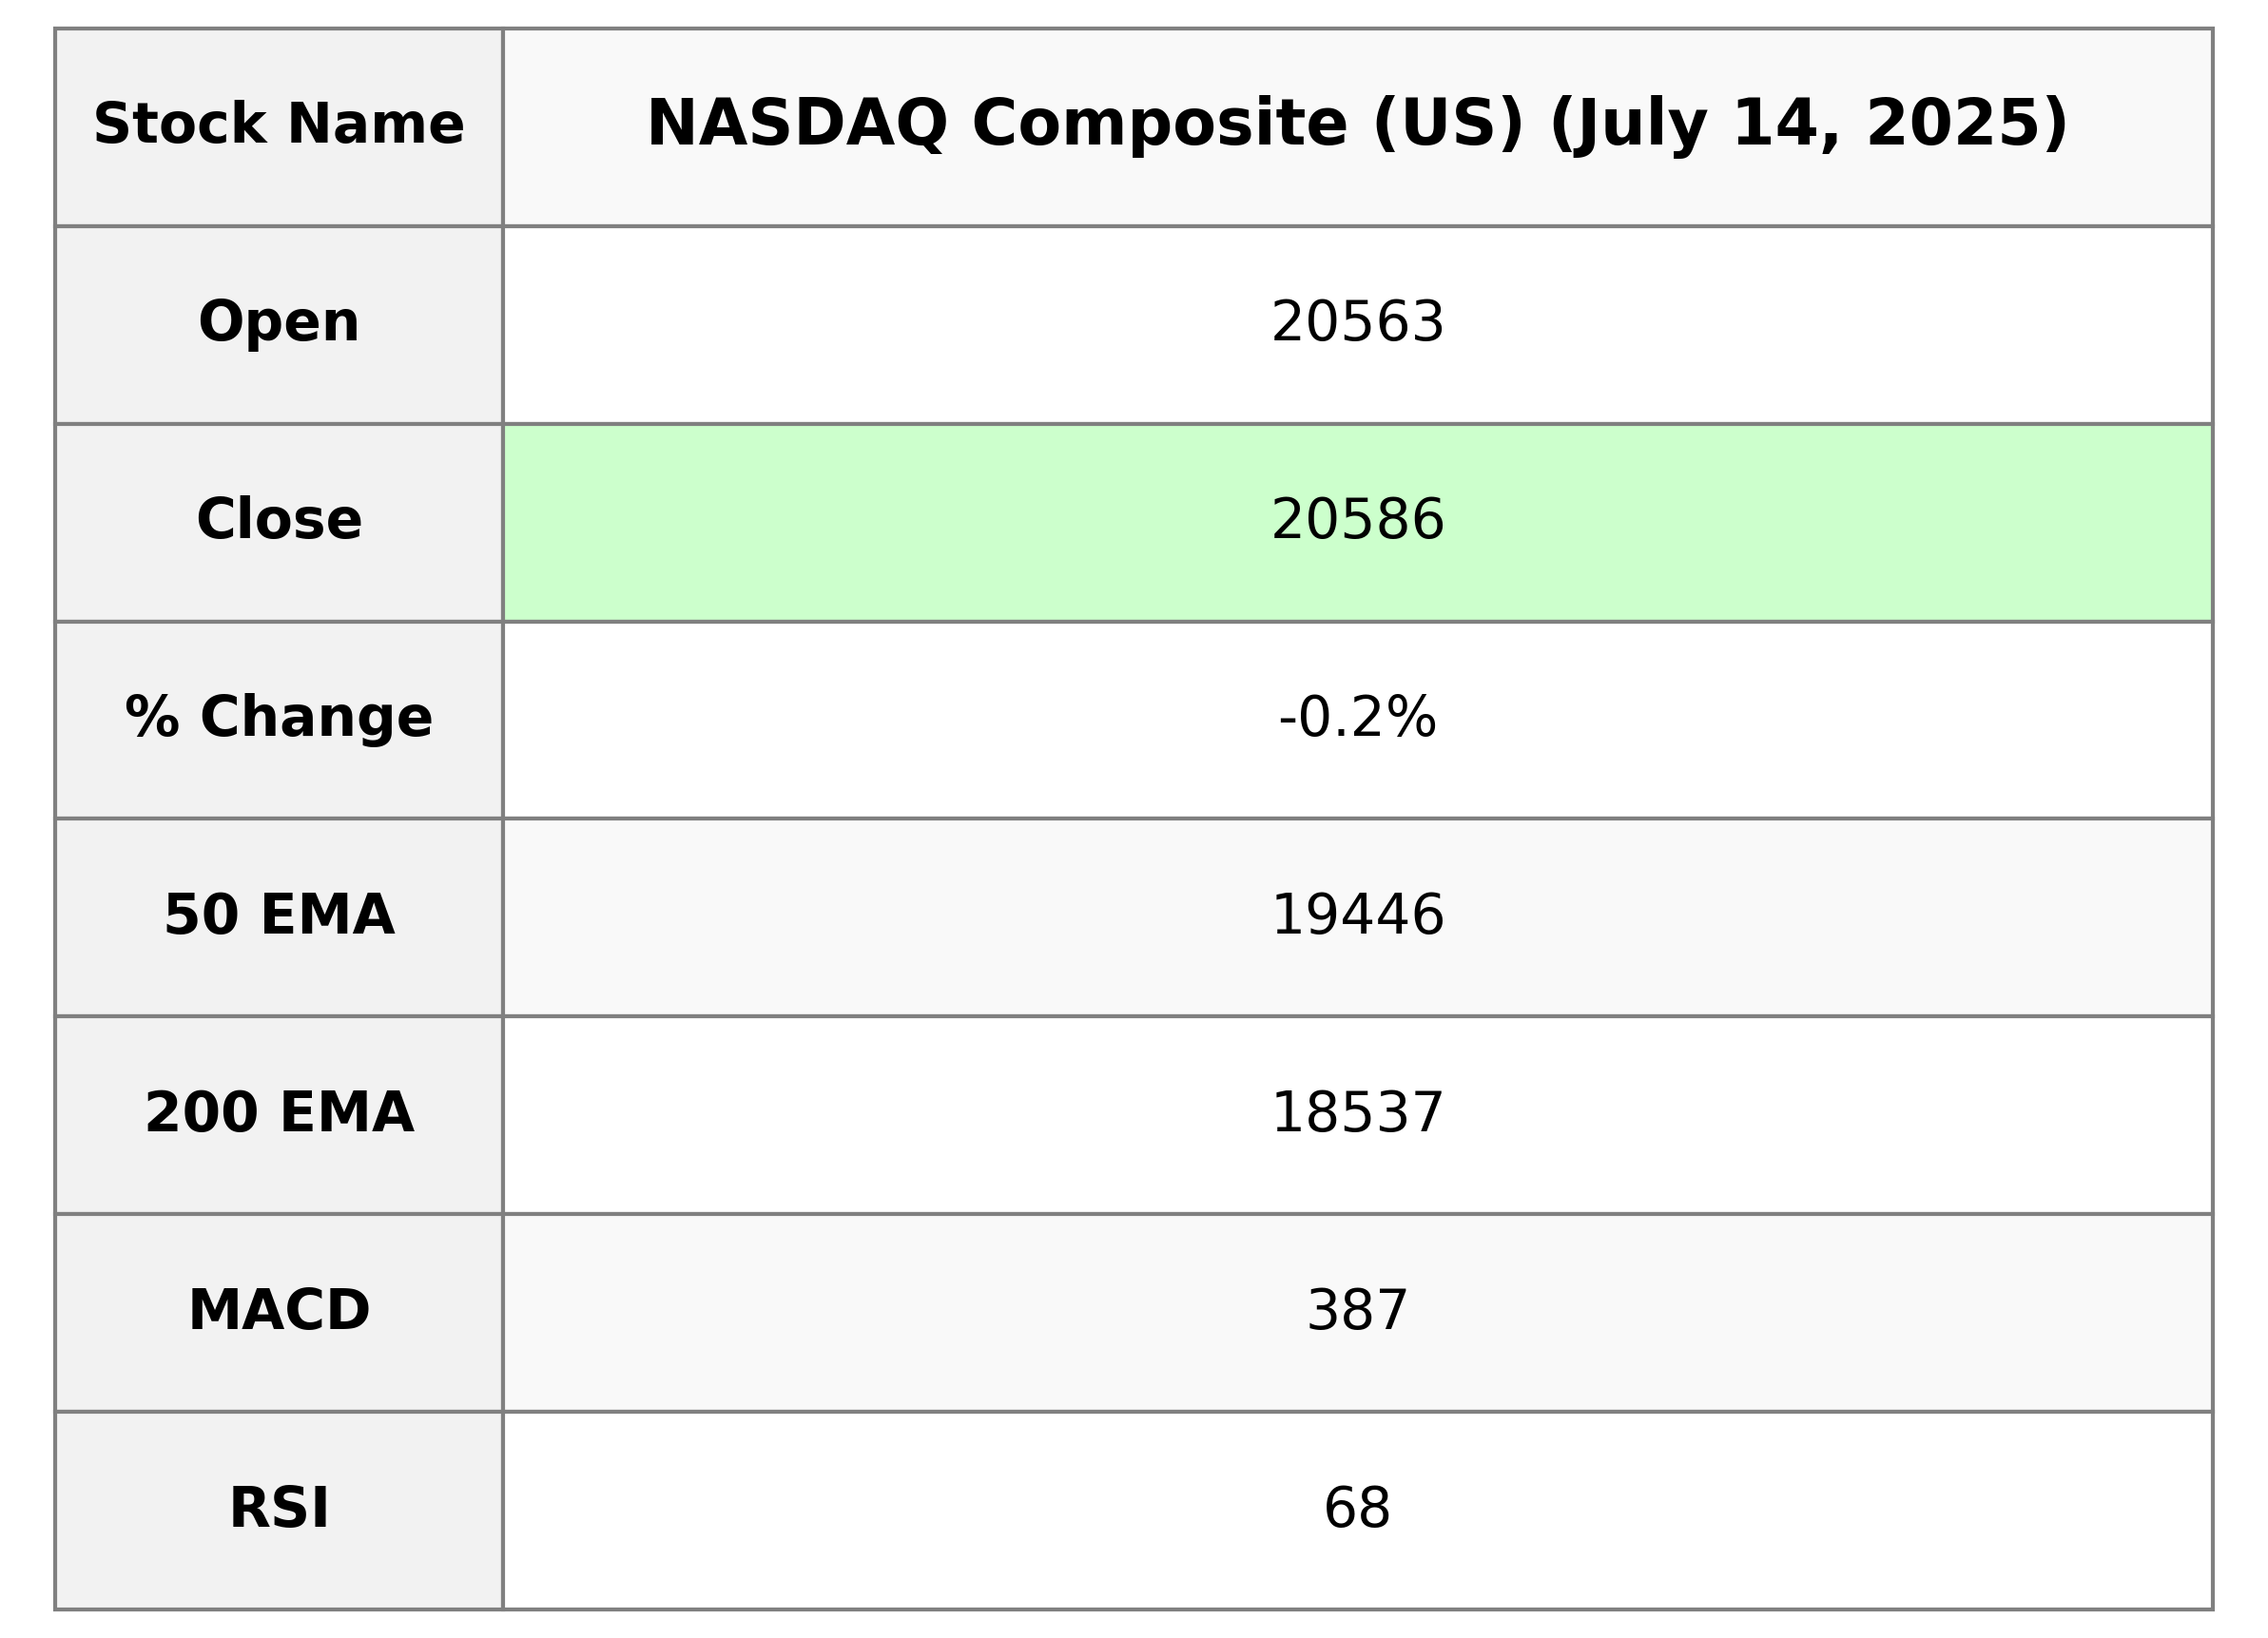
The NASDAQ Composite (US) opened at 20,562.88 and closed at 20,585.53, experiencing a marginal decline with a percentage change of -0.22% and a points change of -45.13. The relative strength index indicates a moderately strong market at 68.01, while the MACD shows a slight bullish trend with a value of 387.20, slightly above the signal line.
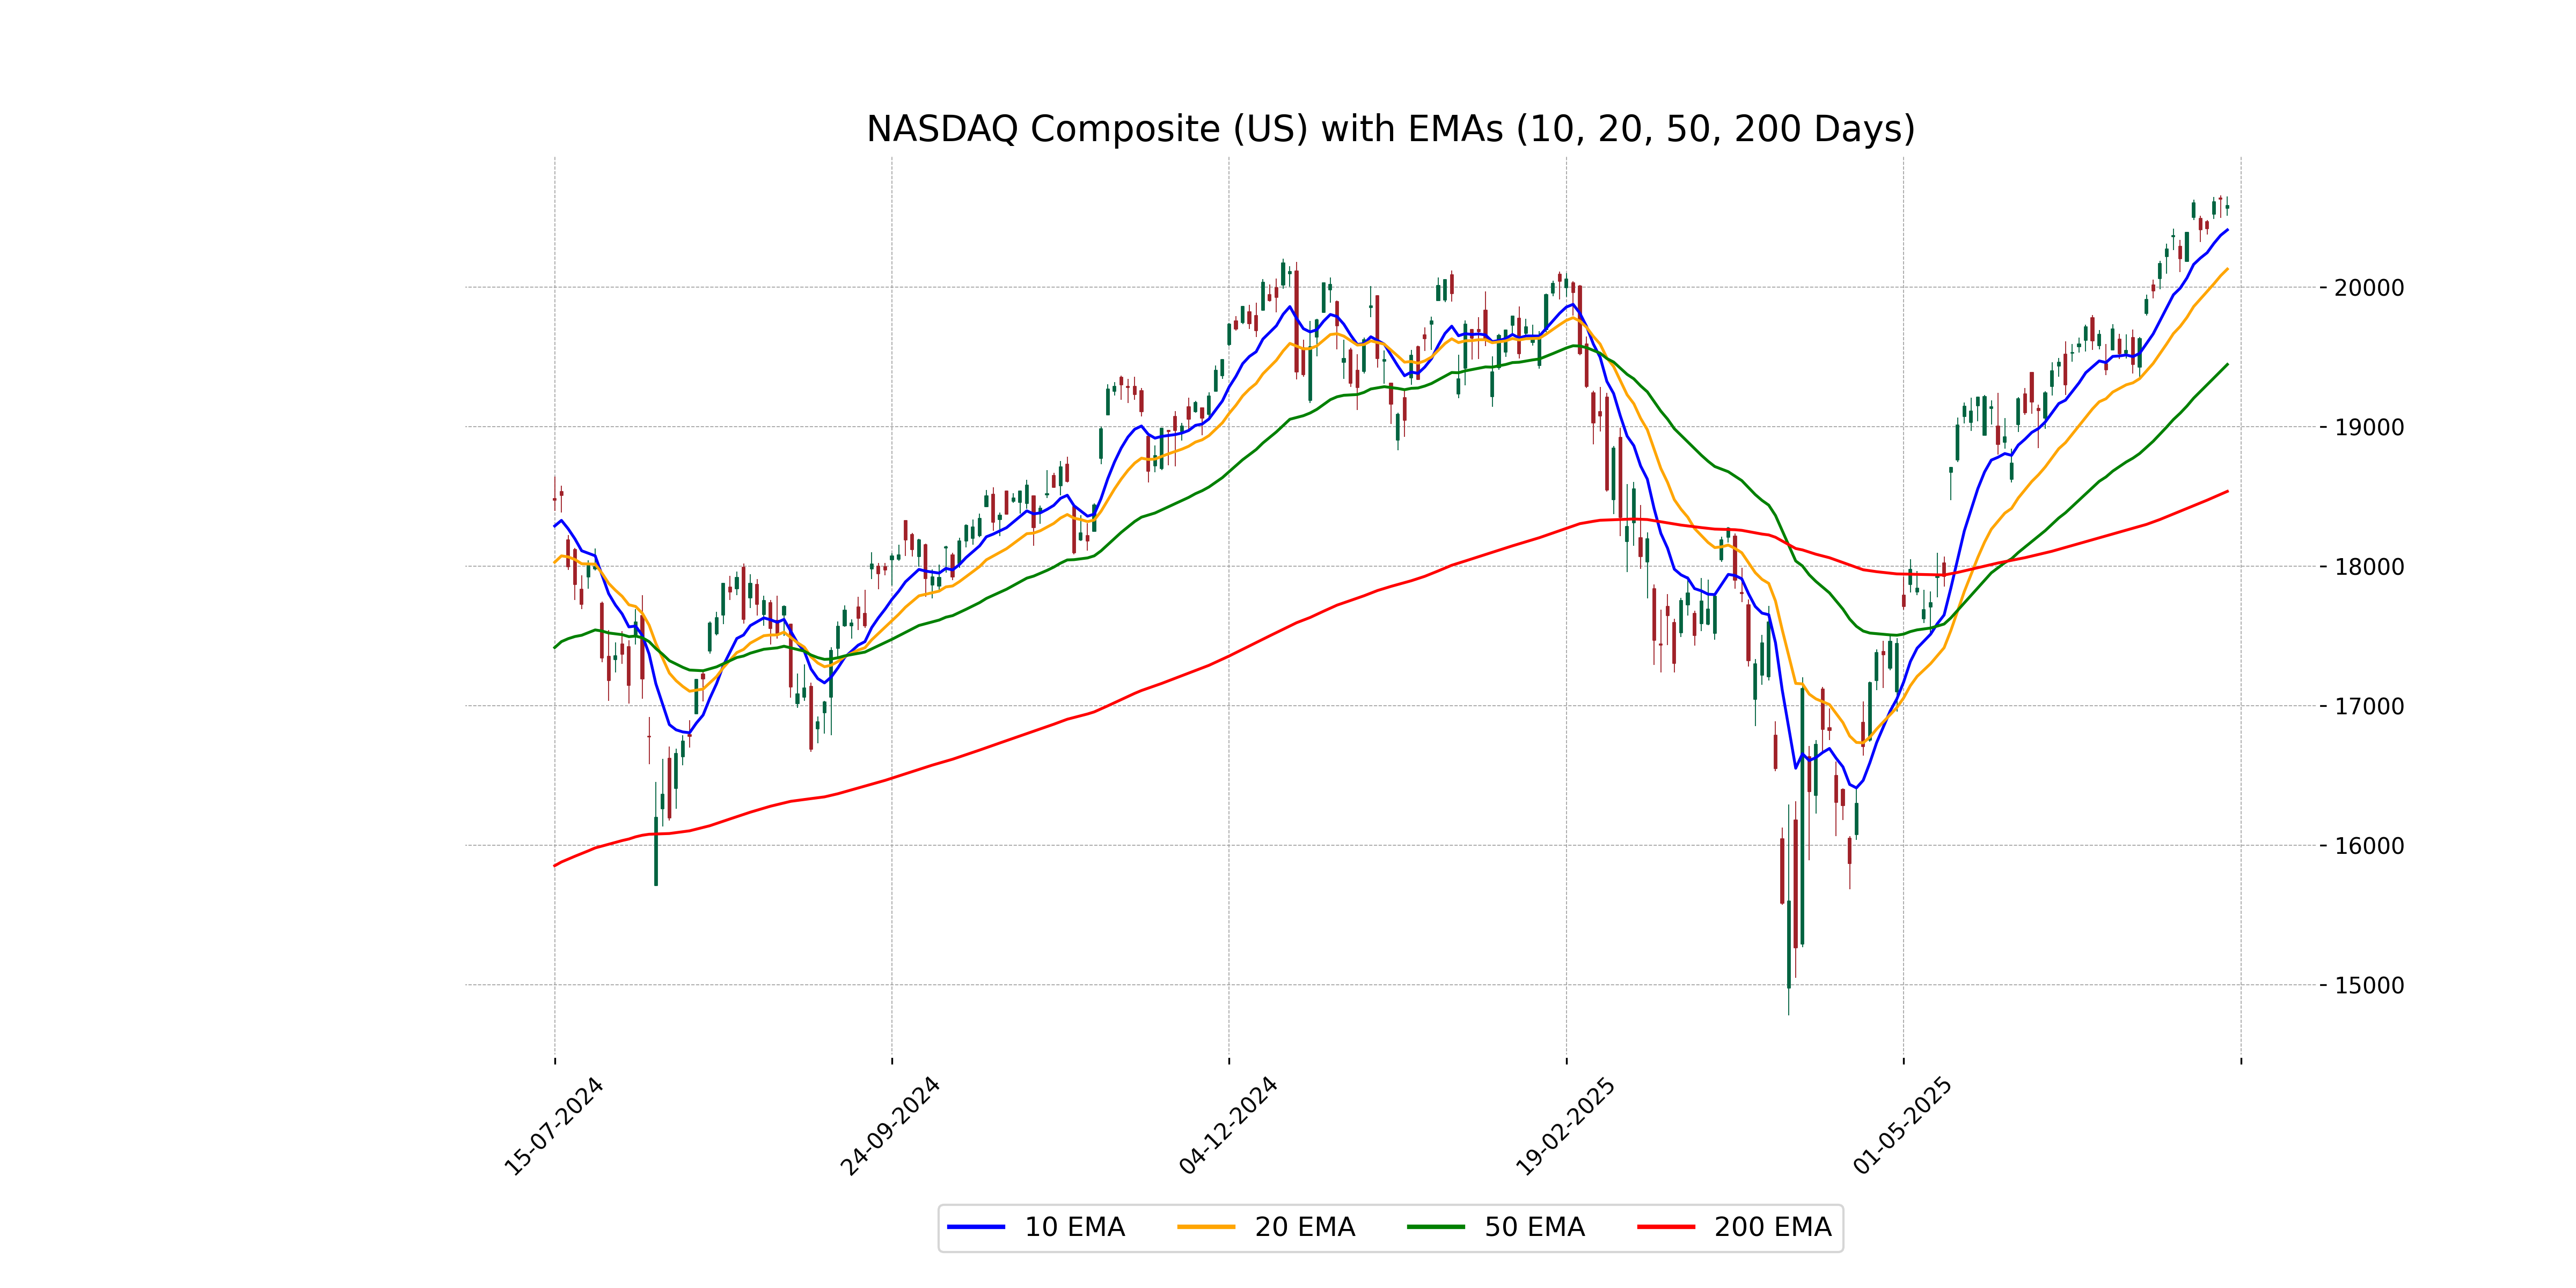
Relationship with Key Moving Averages
The NASDAQ Composite closed at 20585.529, which is above its 50-day EMA (19445.562) and 200-day EMA (18536.529), indicating a strong uptrend. It is also above the 10-day EMA (20409.382) and 20-day EMA (20128.748), suggesting recent bullish momentum.
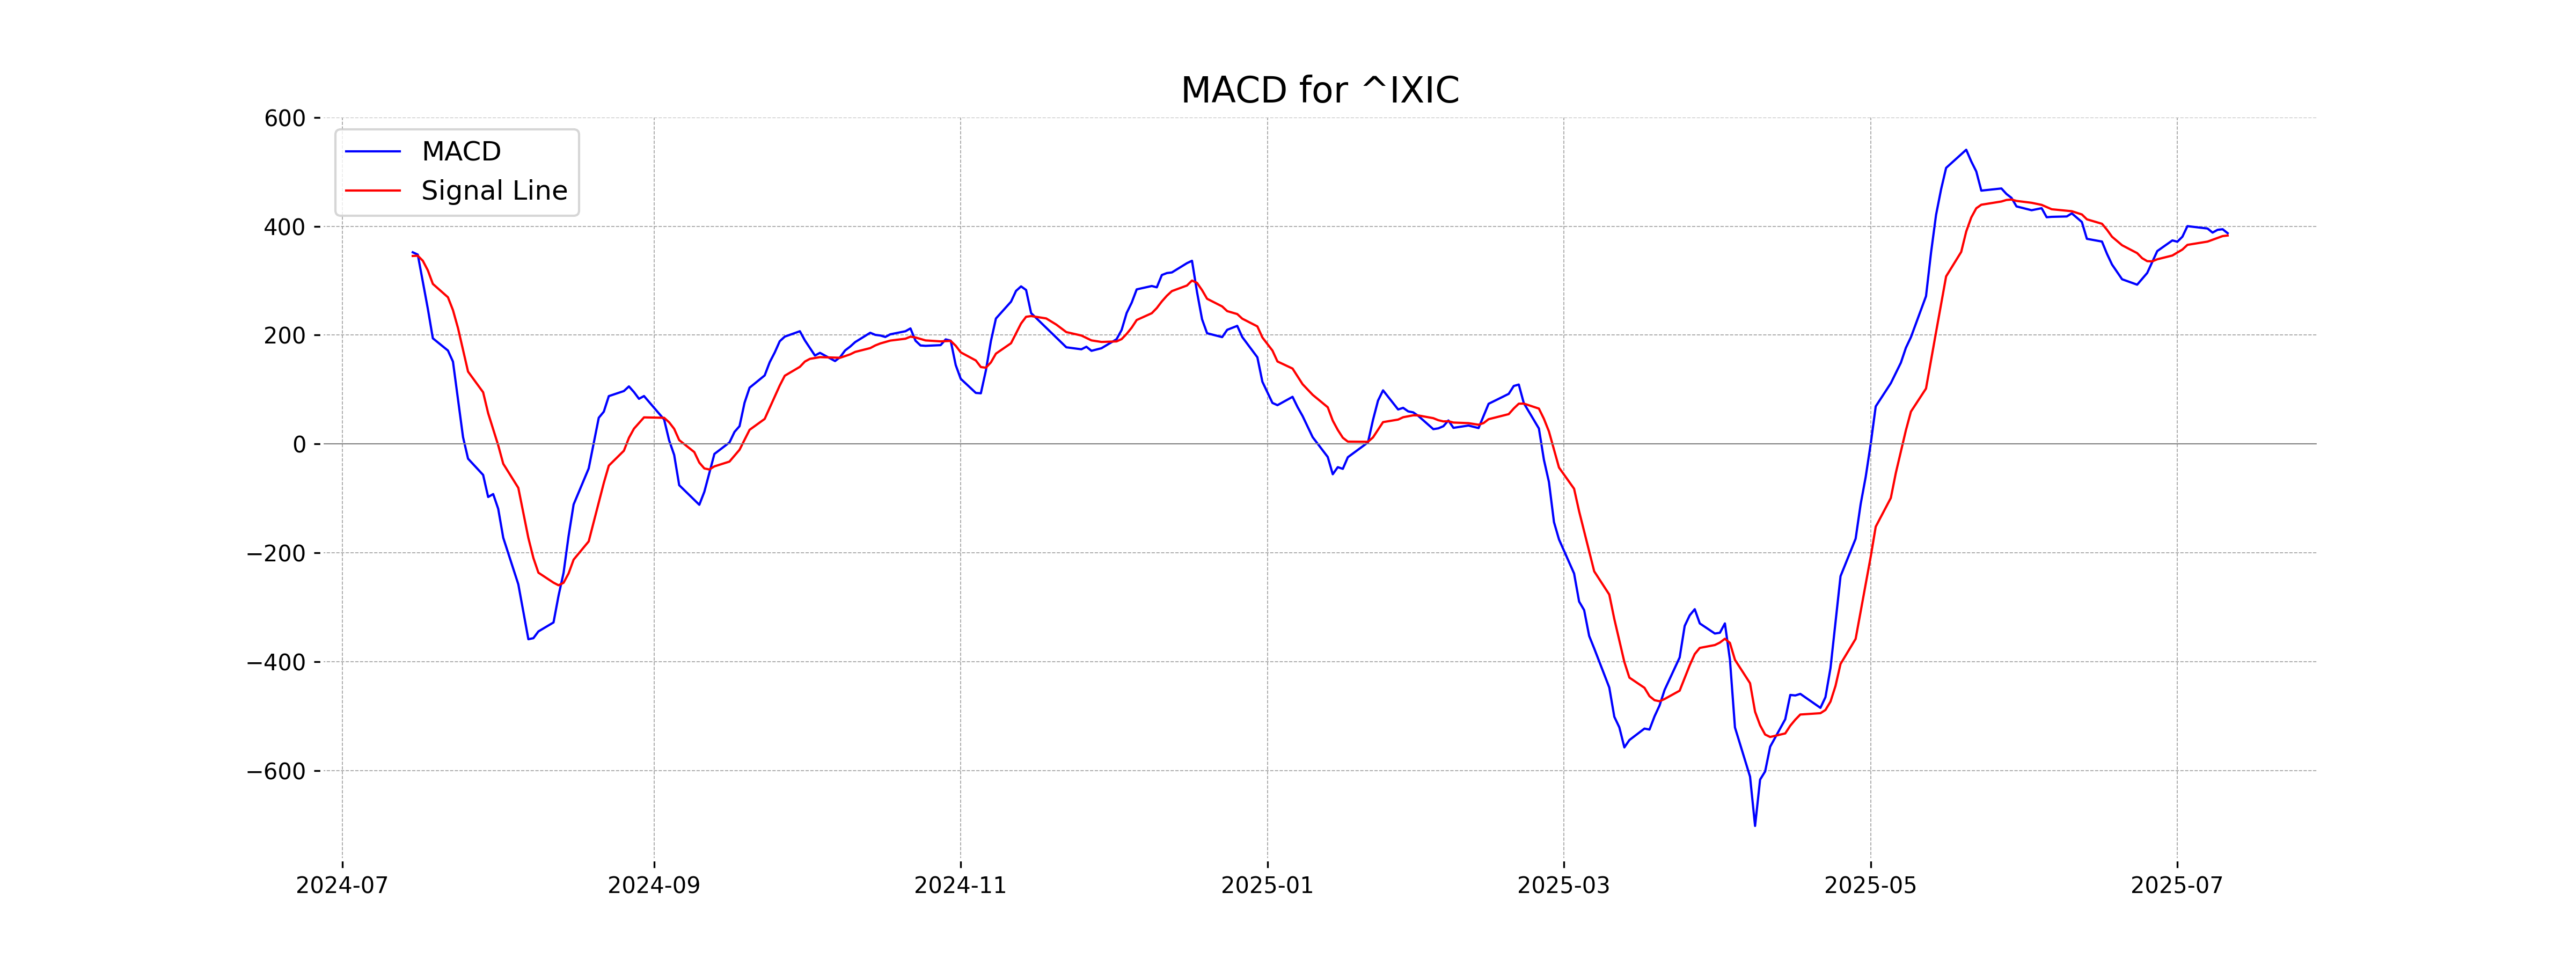
Moving Averages Trend (MACD)
The NASDAQ Composite's MACD is 387.20, which is slightly above the MACD Signal line at 382.95, suggesting a bullish momentum. This indicates a potential for continued upward movement if the trend persists, but caution is advised given market volatility.
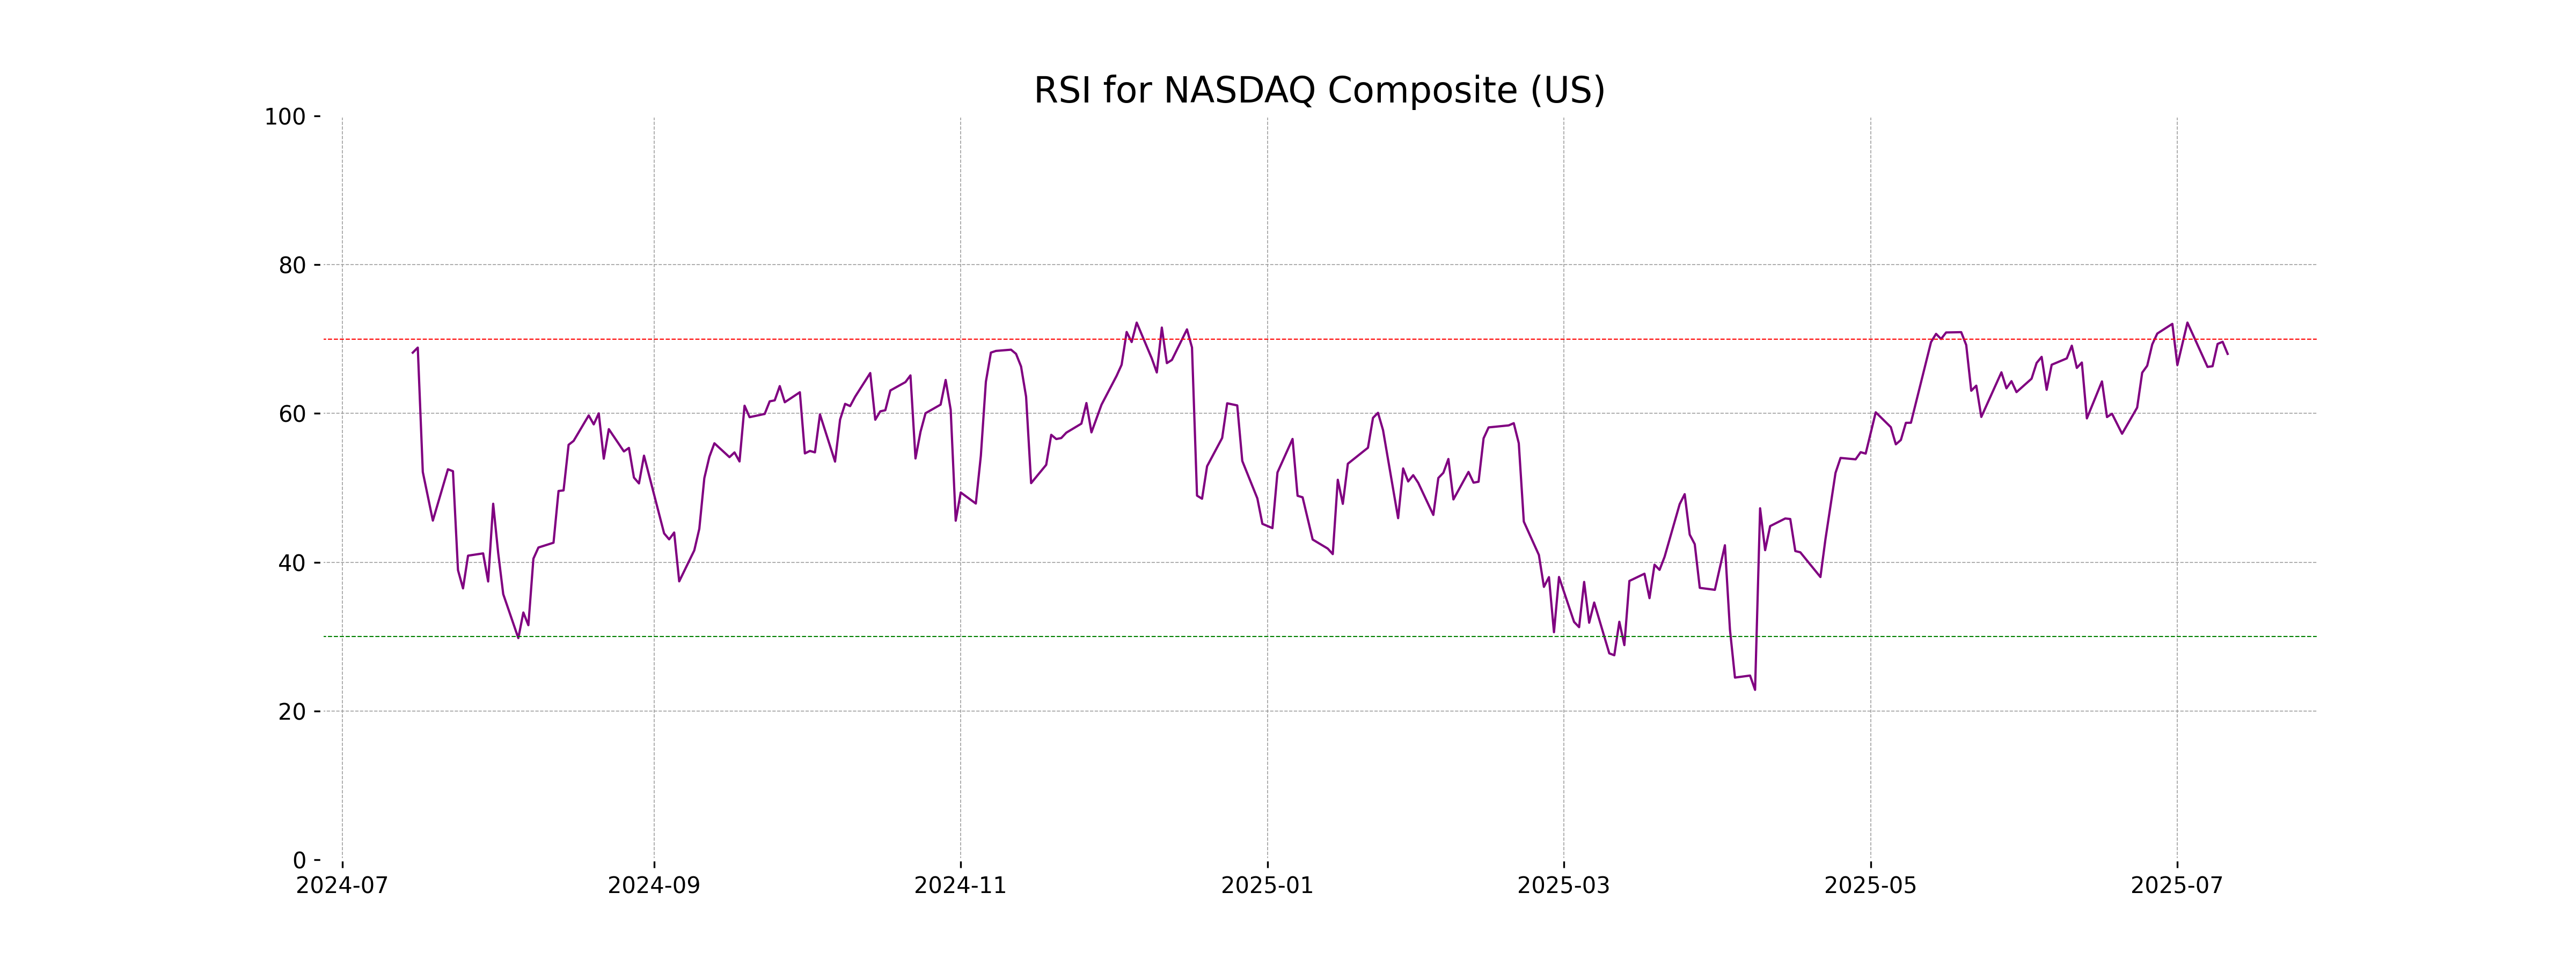
RSI Analysis
The RSI value of 68.01 suggests that the NASDAQ Composite is approaching overbought territory but is not yet extremely overbought. This implies potential for continued upward momentum, but caution is advised as it nears the 70 threshold, which often signals overbought conditions.
Analysis for Nikkei 225 (Japan) - July 14, 2025
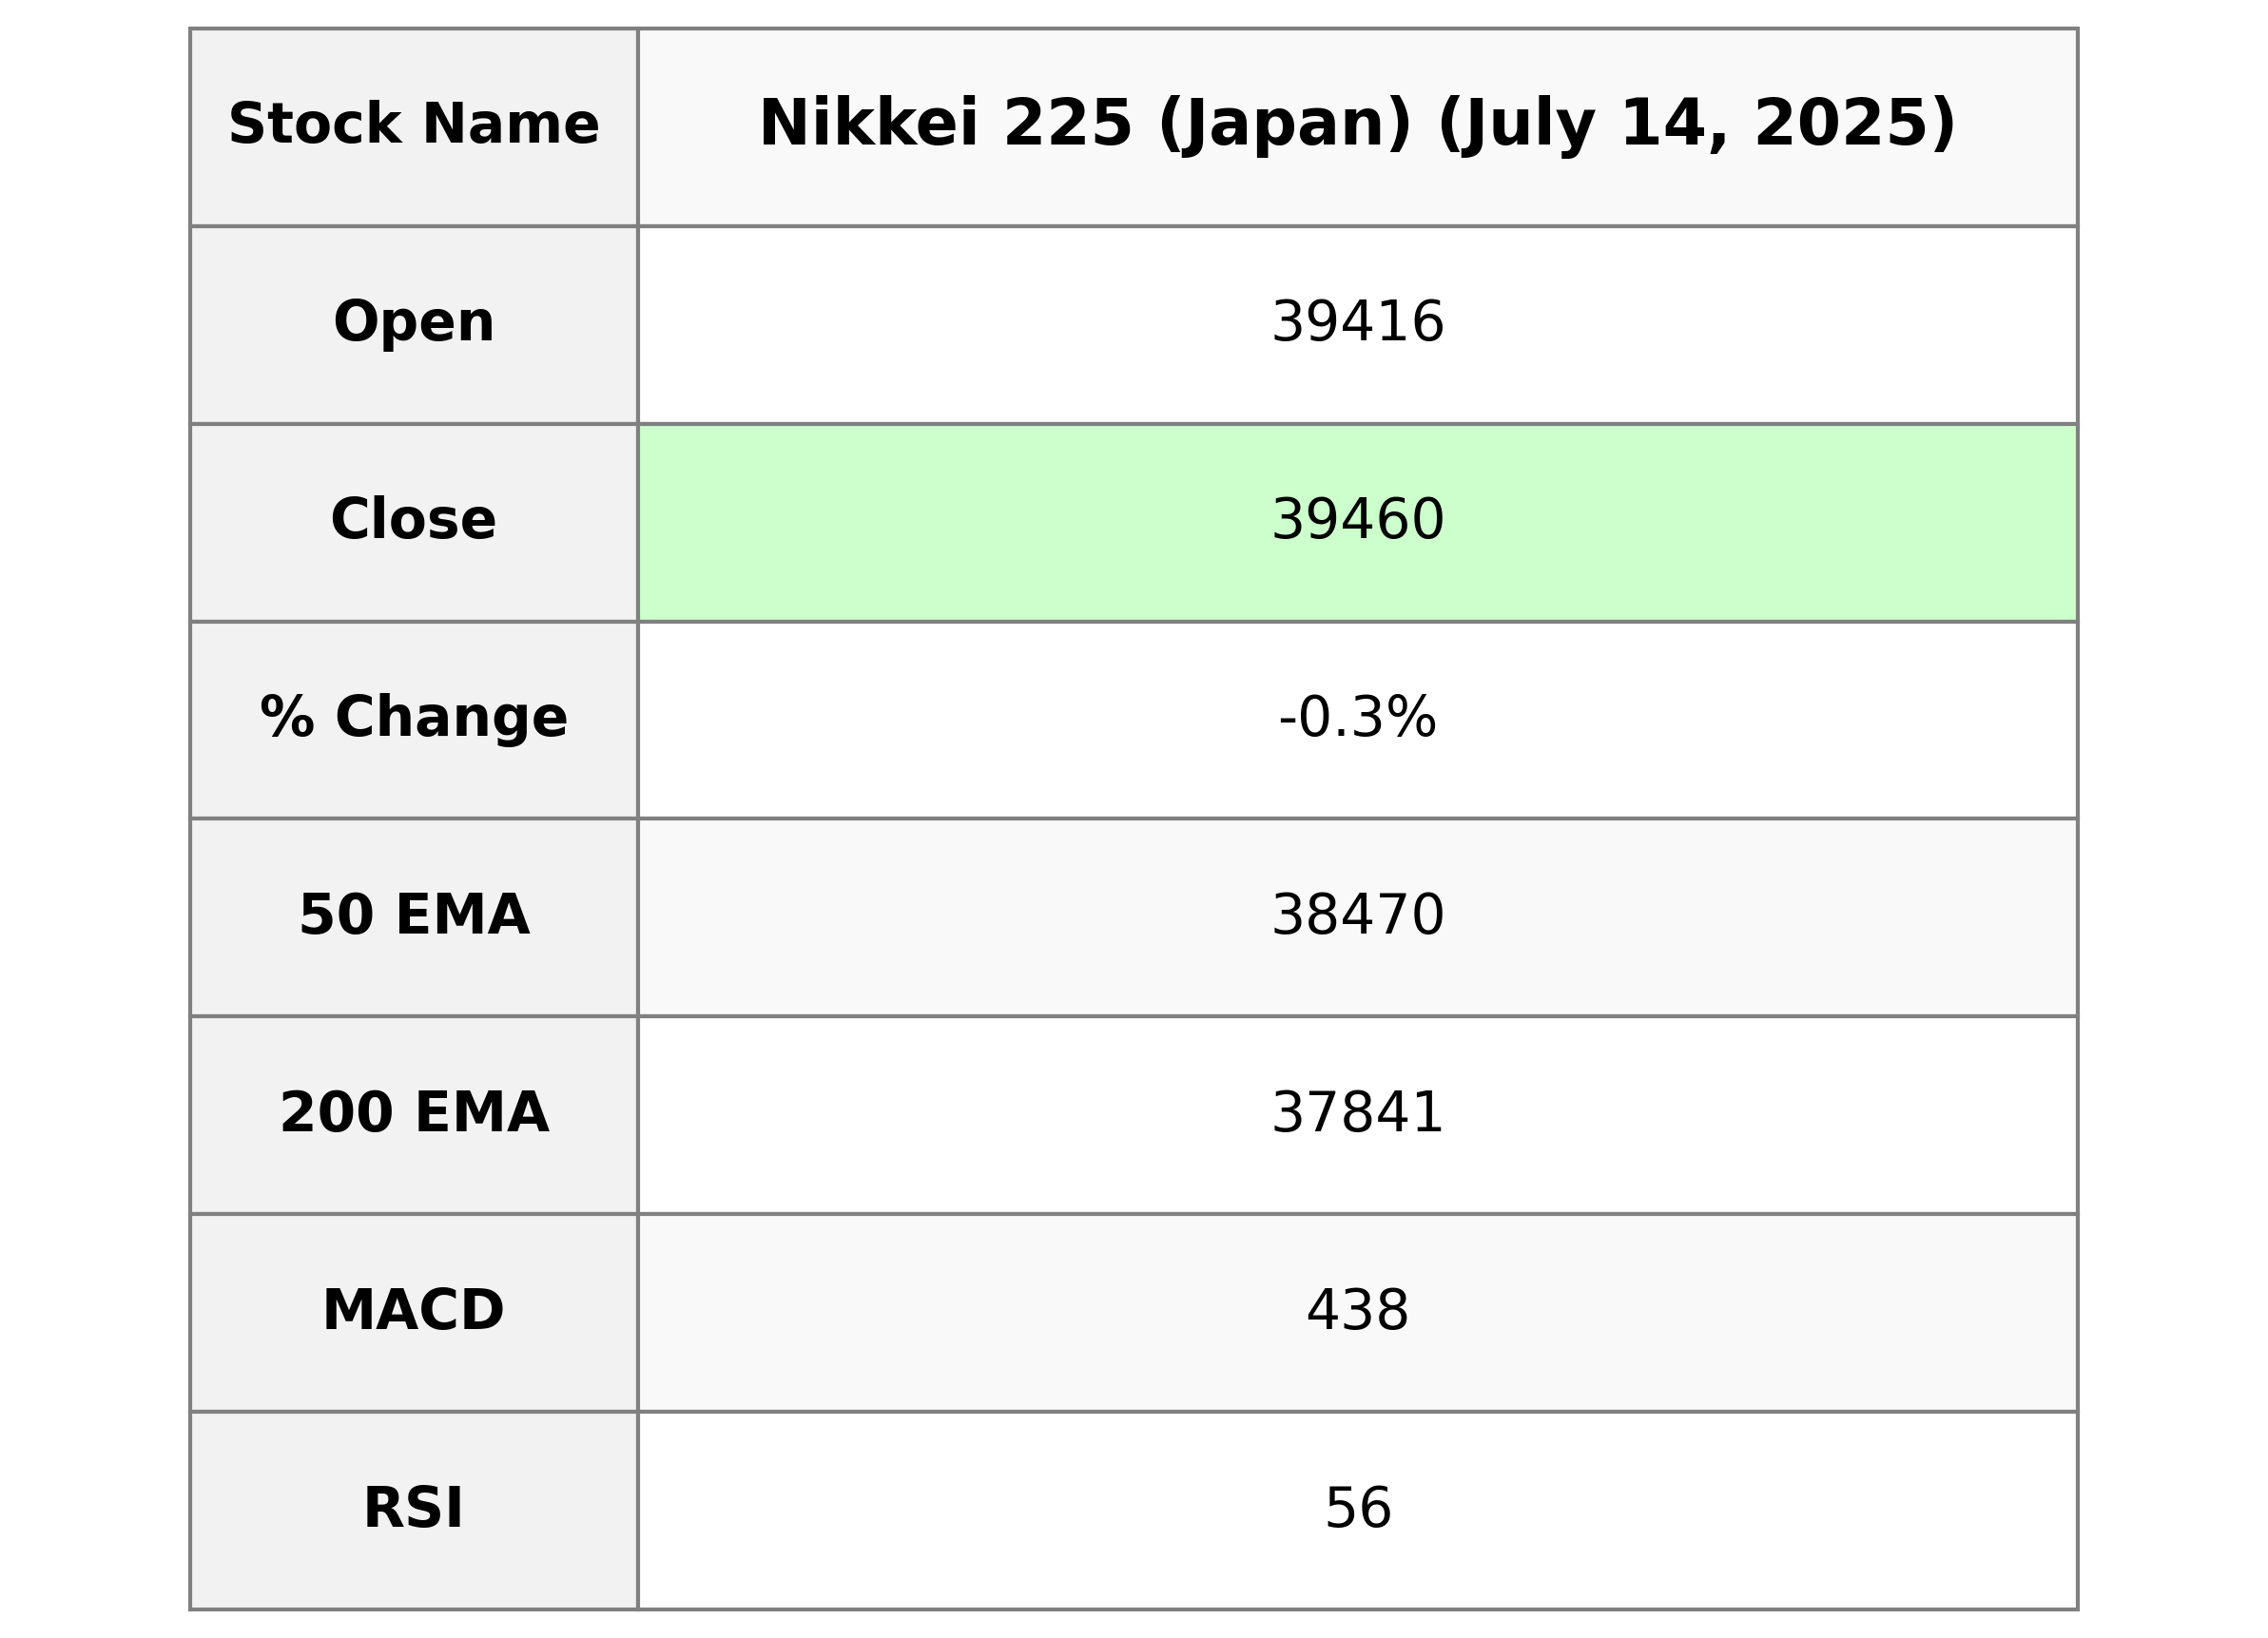
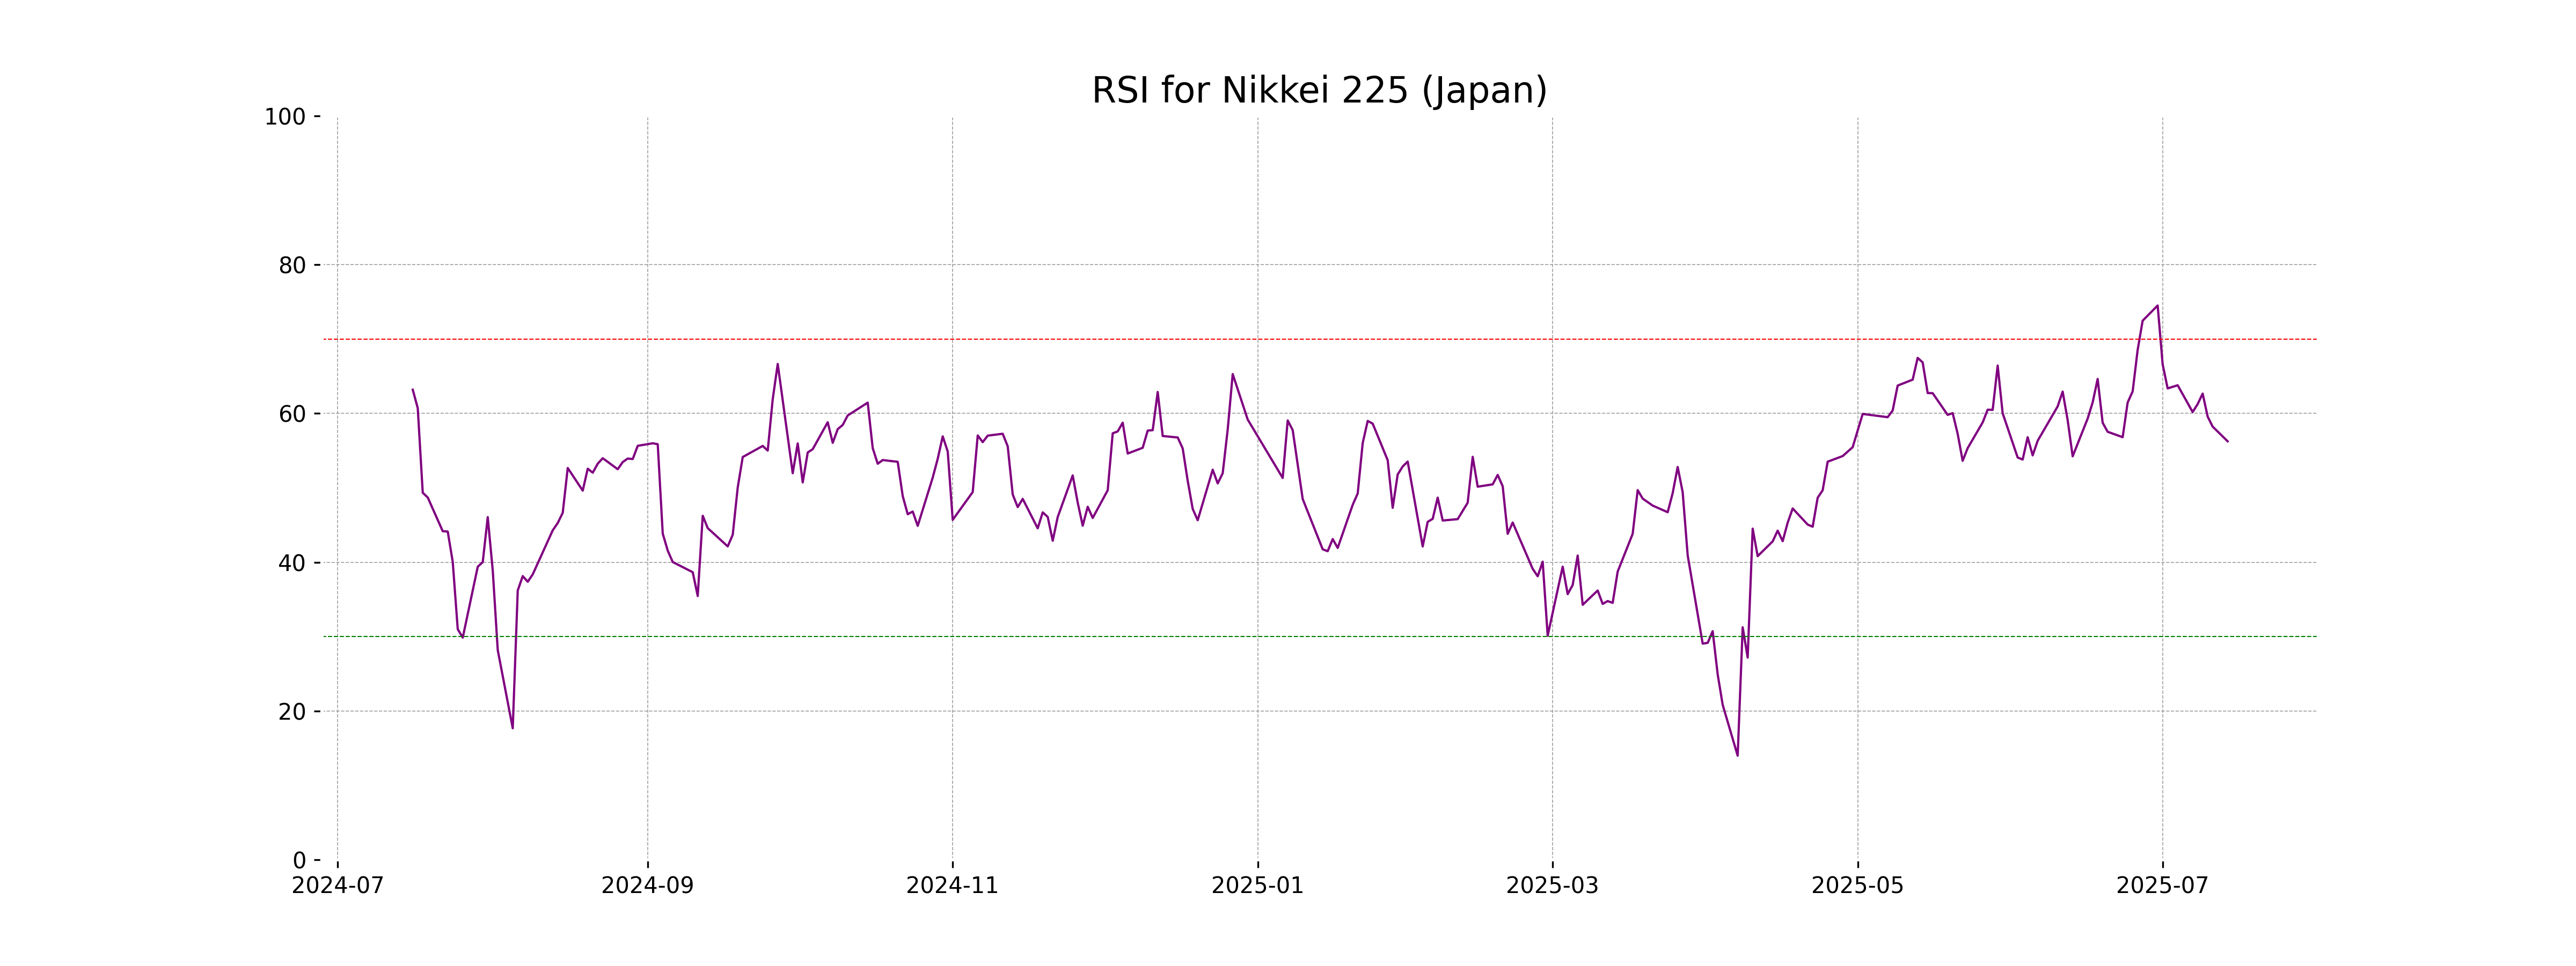
Nikkei 225 (Japan) opened at 39,416.10 and closed at 39,459.62, with a slight decrease from the previous close of 39,569.68, indicating a percentage change of -0.28%. The high for the session was 39,608.02, and the low was 39,288.90, with an RSI of 56.25, suggesting moderate relative strength. The MACD of 437.60 is below its signal line of 527.54, indicating a potential downtrend.
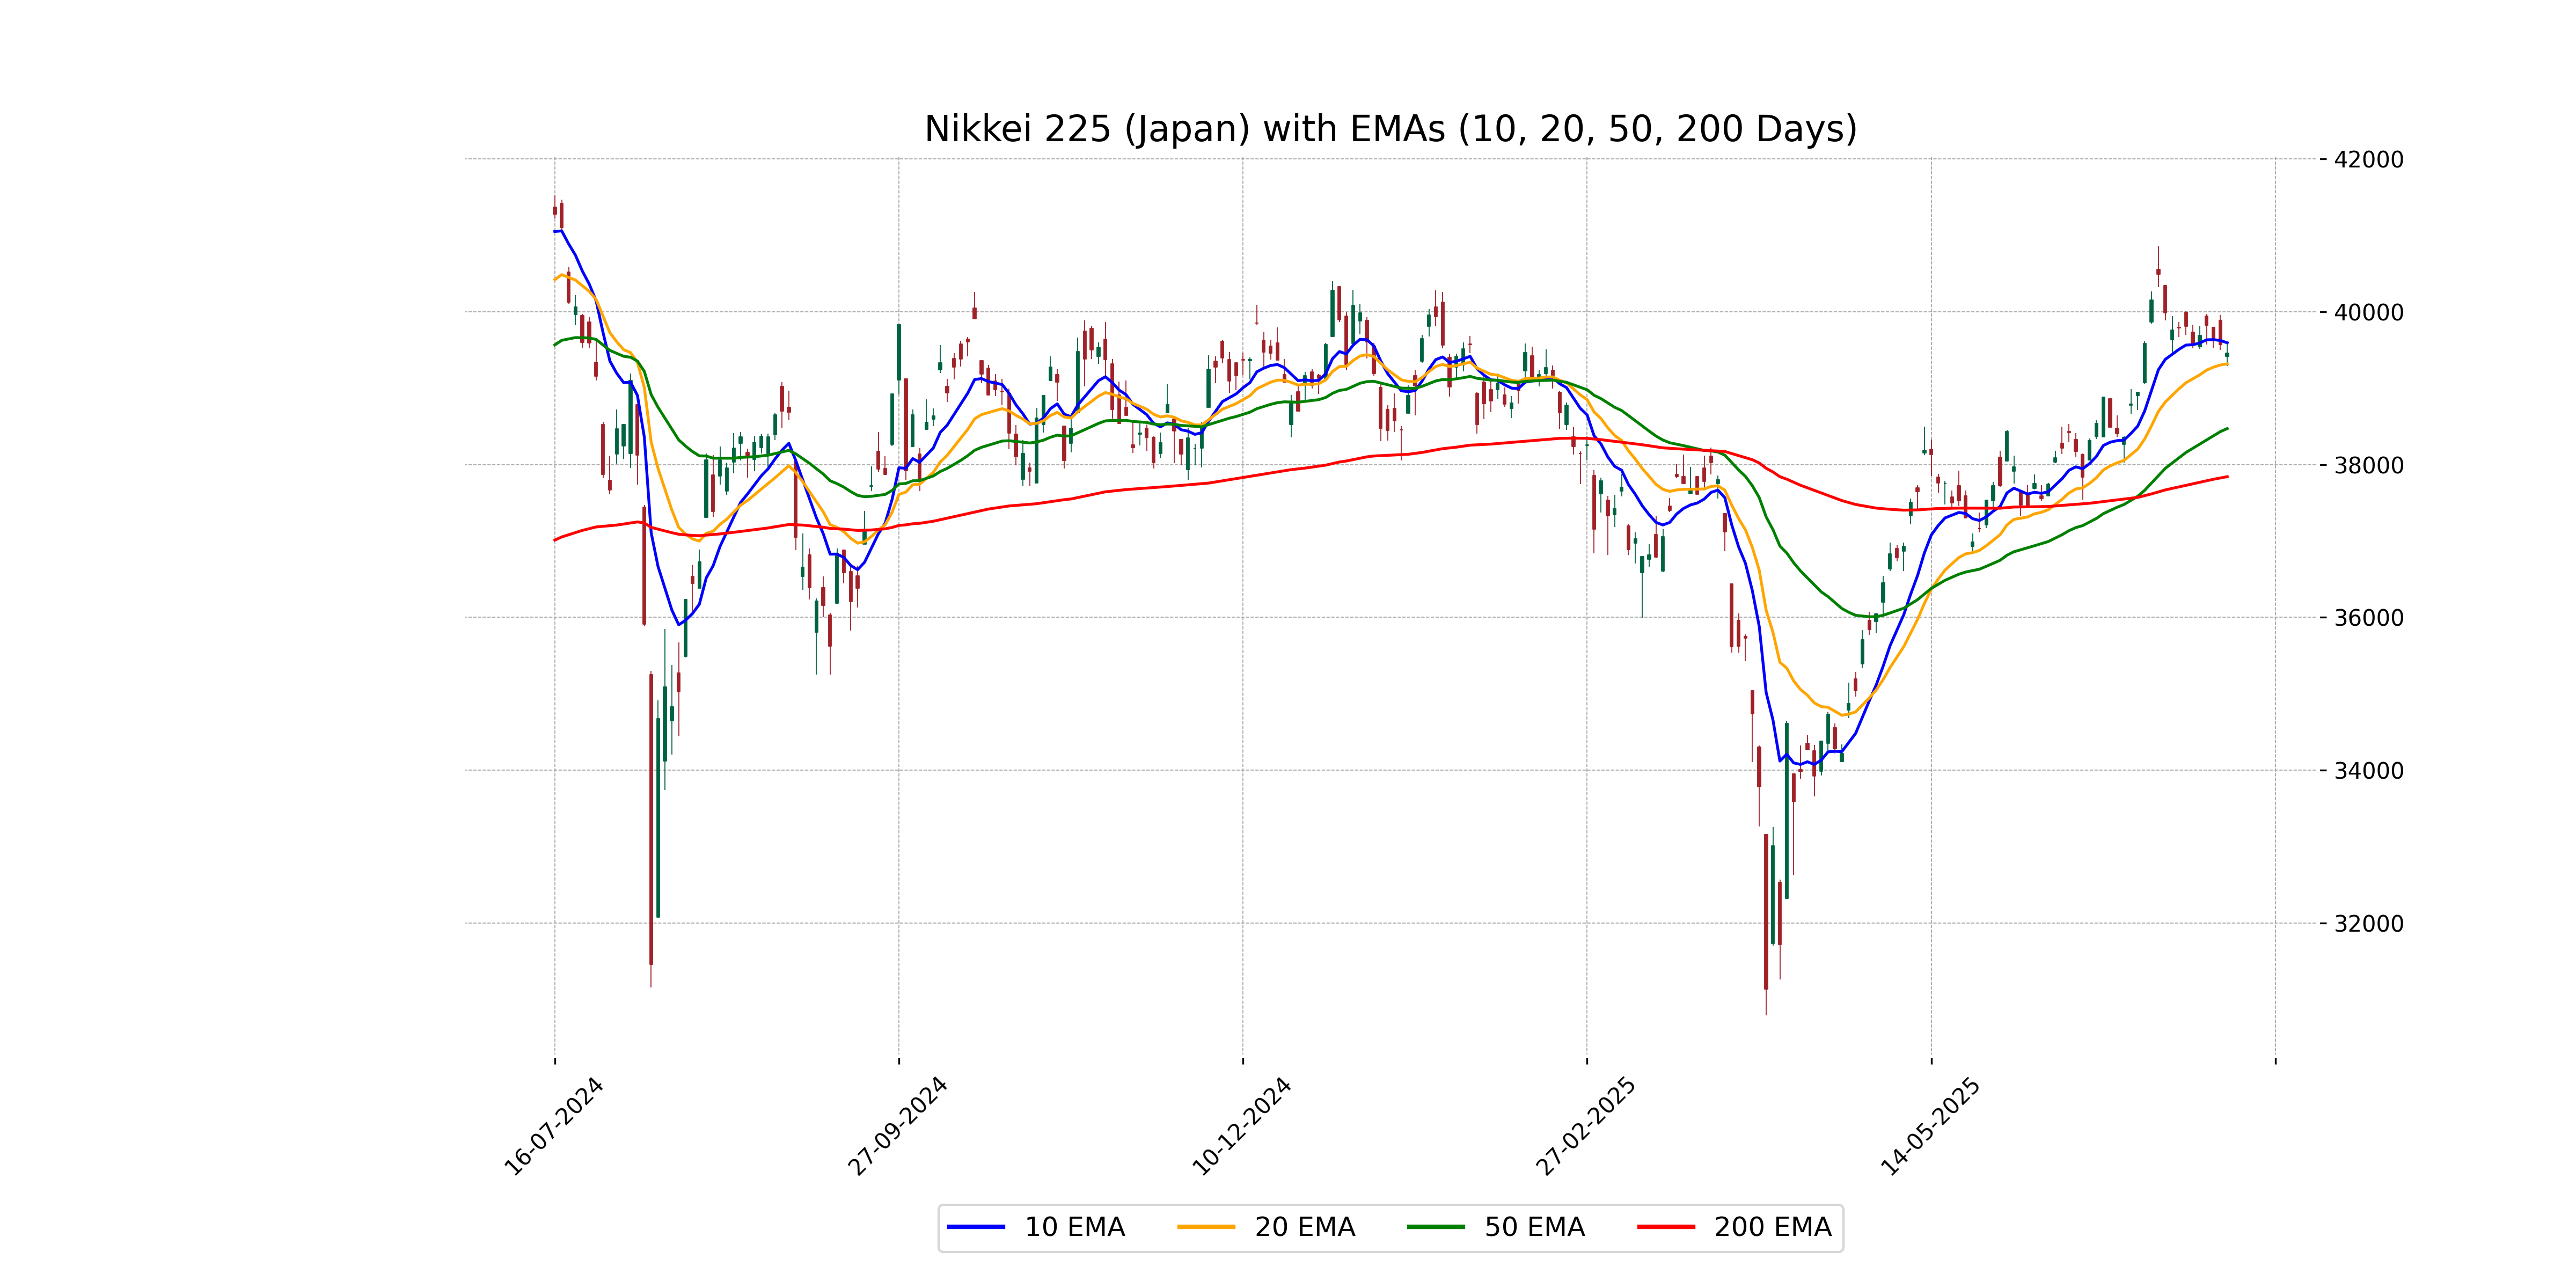
Relationship with Key Moving Averages
Nikkei 225 closed at 39459.62, slightly below its 10 EMA of 39593.01, indicating short-term weakness. However, it remains above its significant 50 EMA of 38470.50 and 200 EMA of 37840.60, reflecting a longer-term bullish trend.
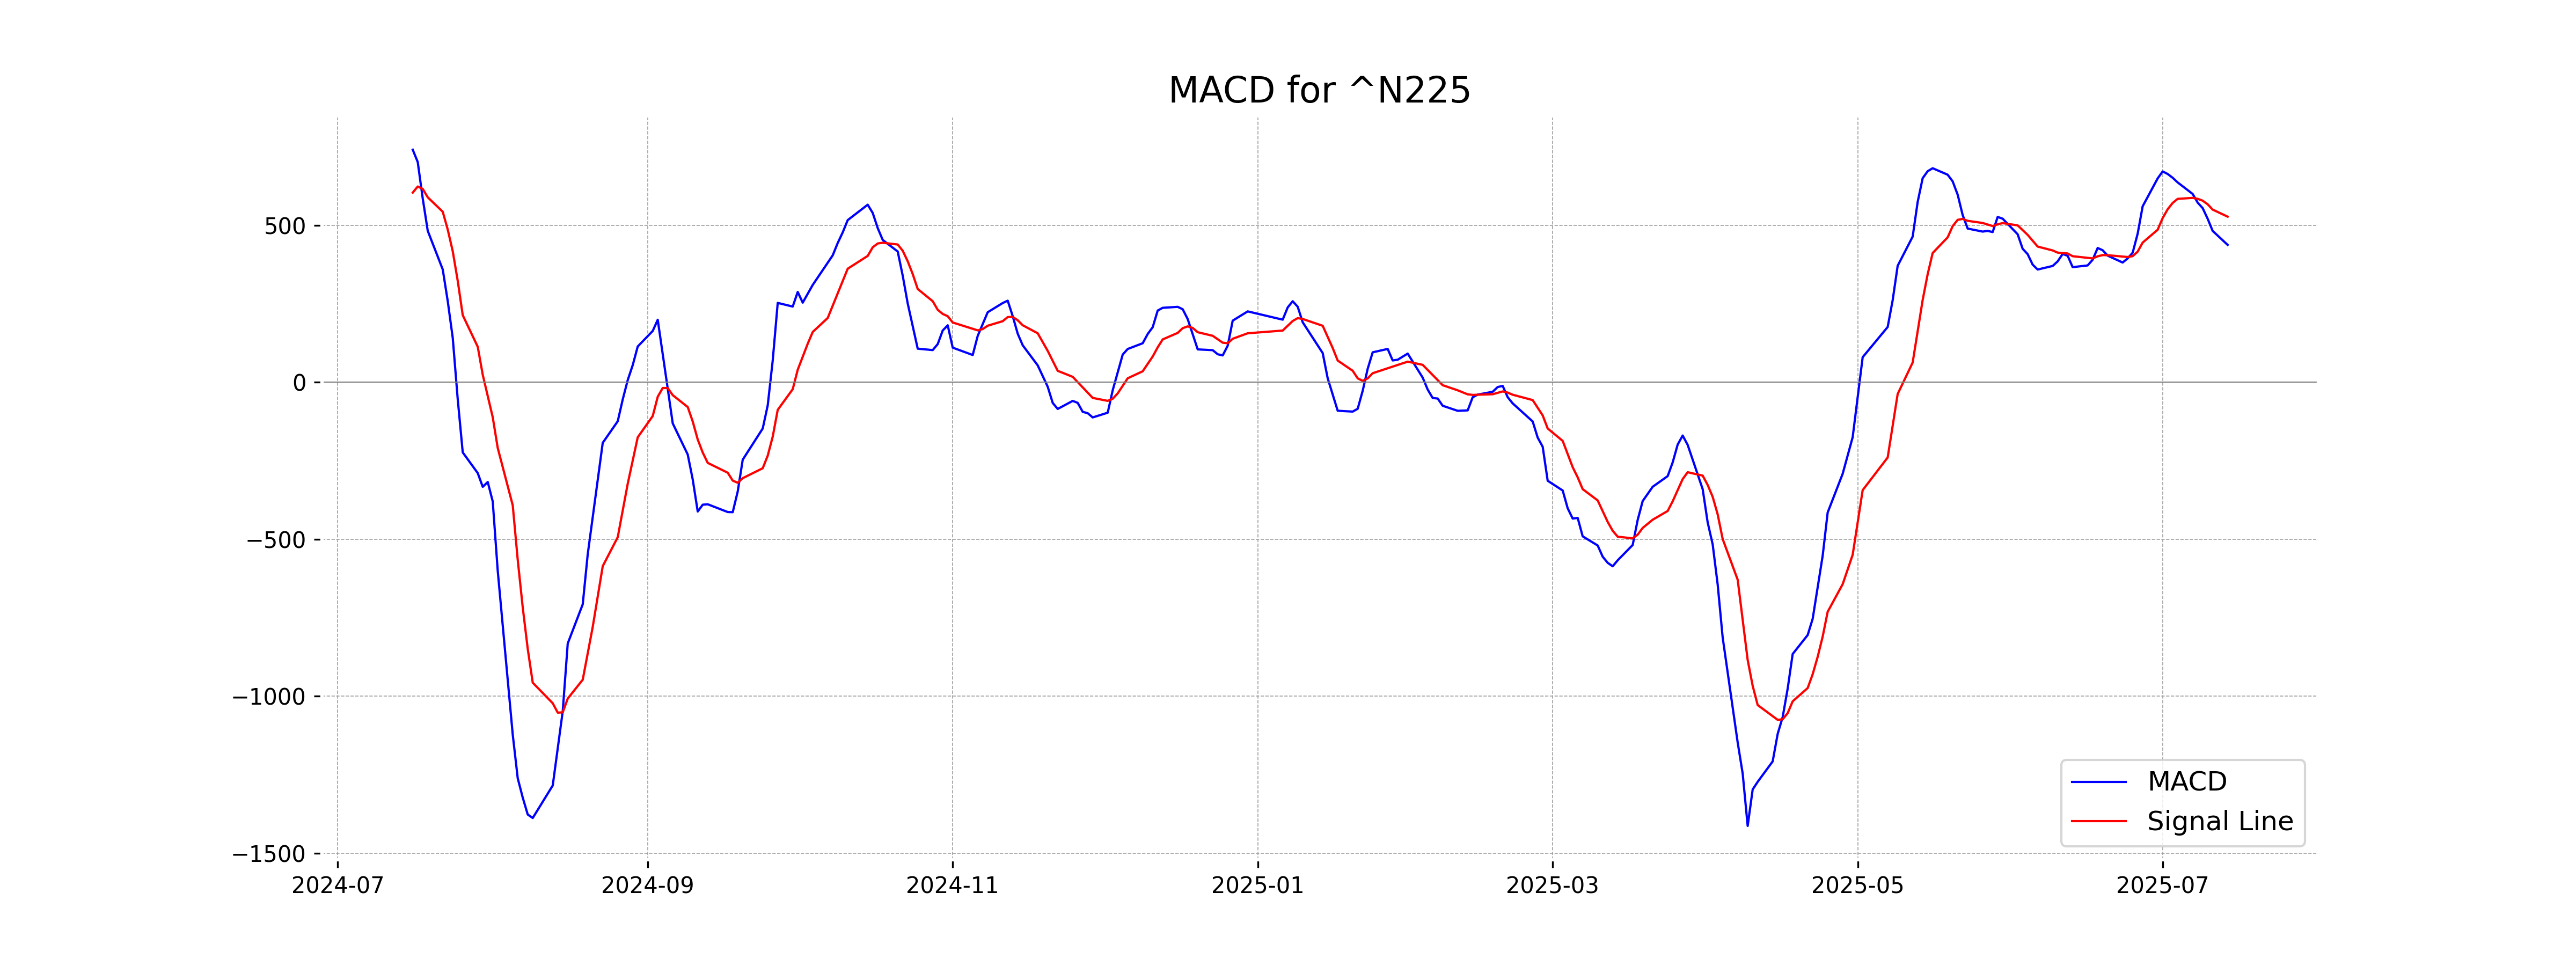
Moving Averages Trend (MACD)
The MACD for Nikkei 225 is 437.60 with a MACD Signal of 527.54, indicating a bearish trend as the MACD line is below the Signal line. The relatively high RSI of 56.25 suggests a neutral momentum, pointing towards neither an overbought nor oversold condition.
RSI Analysis
The RSI of Nikkei 225 (Japan) is 56.25, indicating a neutral momentum. It is neither in overbought territory above 70 nor in oversold territory below 30, suggesting a balanced momentum at present.
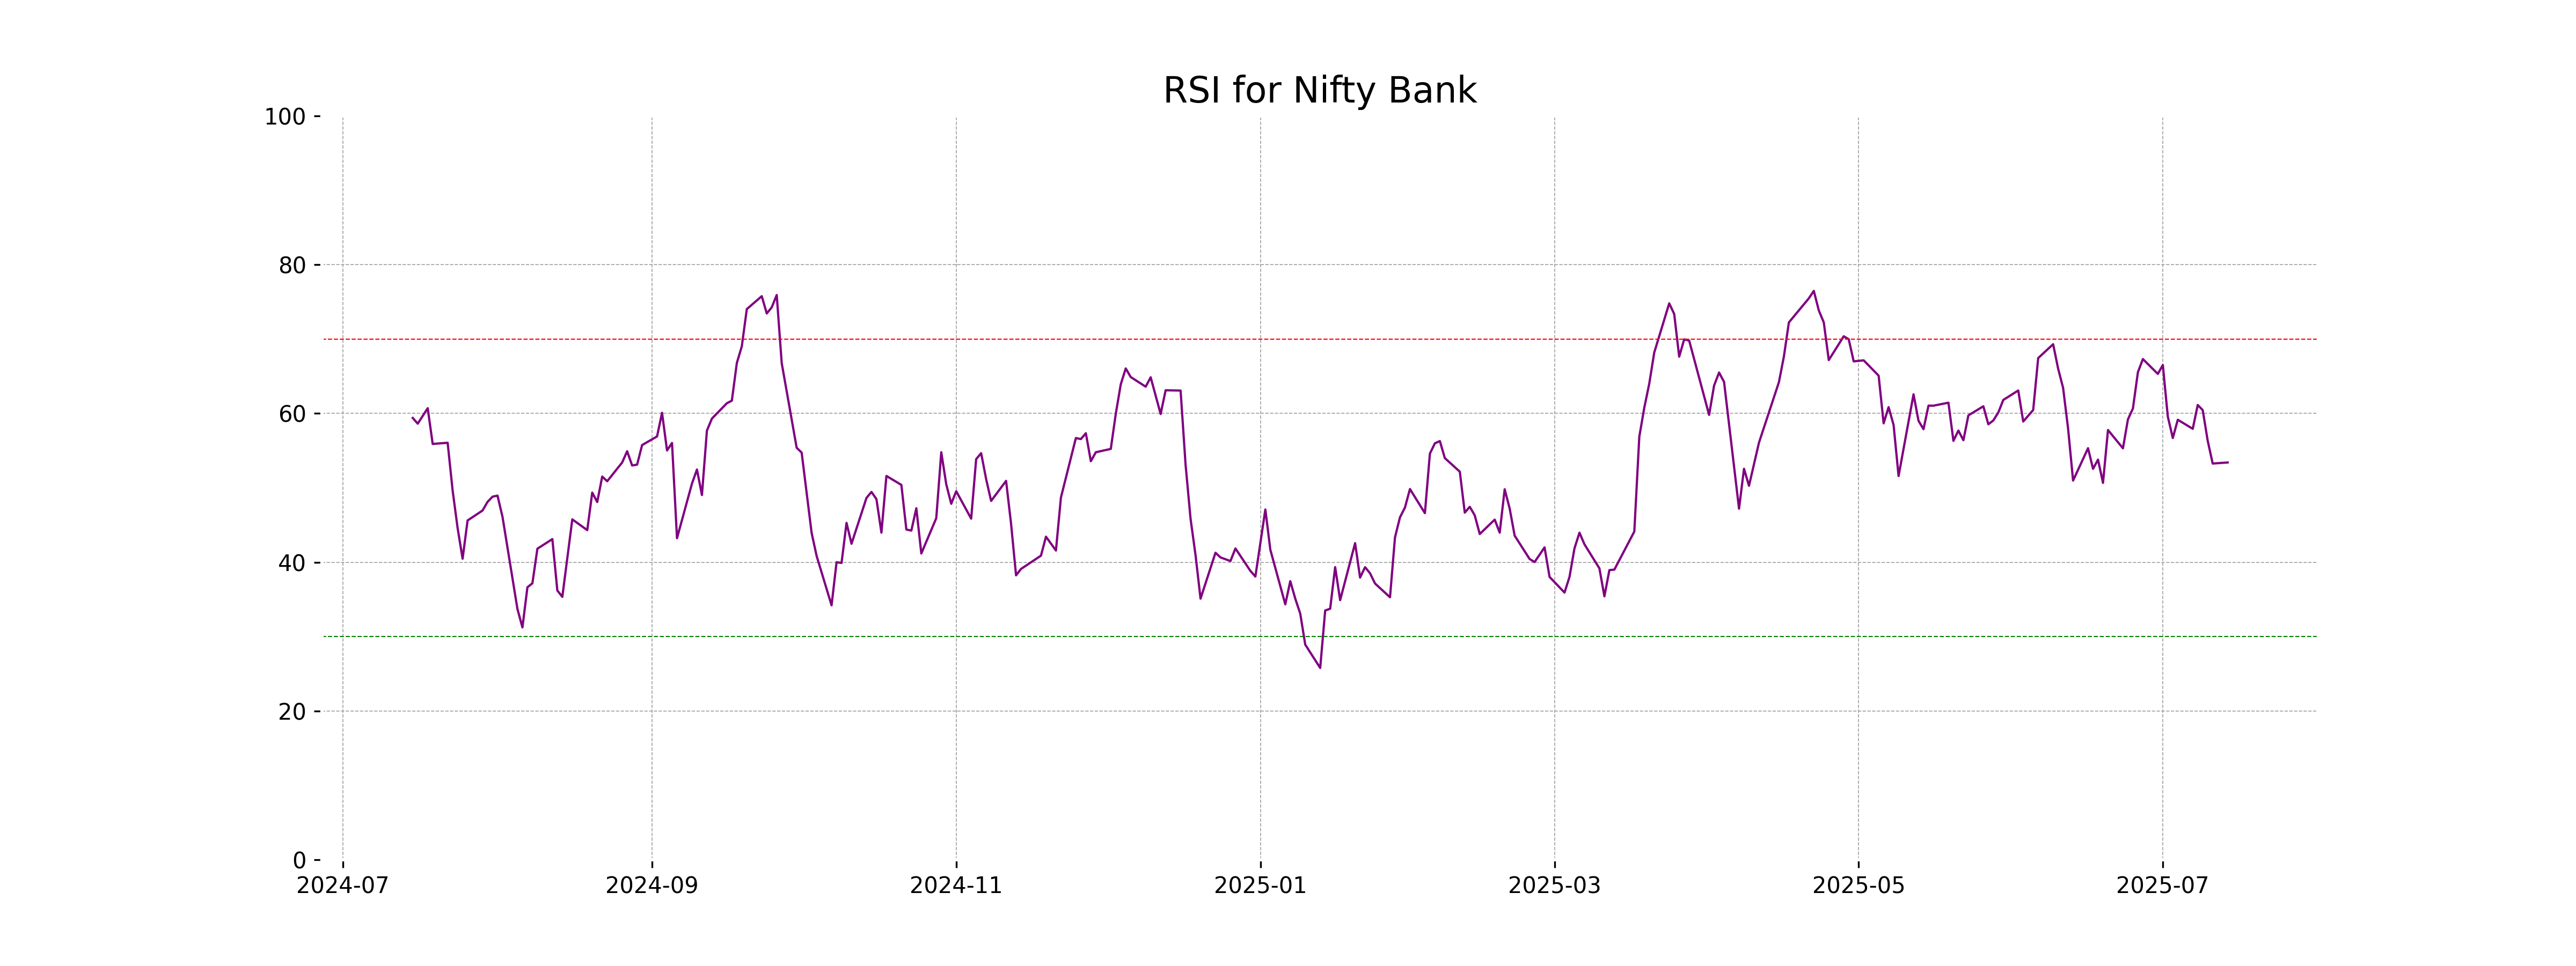
Analysis for Nifty Bank - July 14, 2025
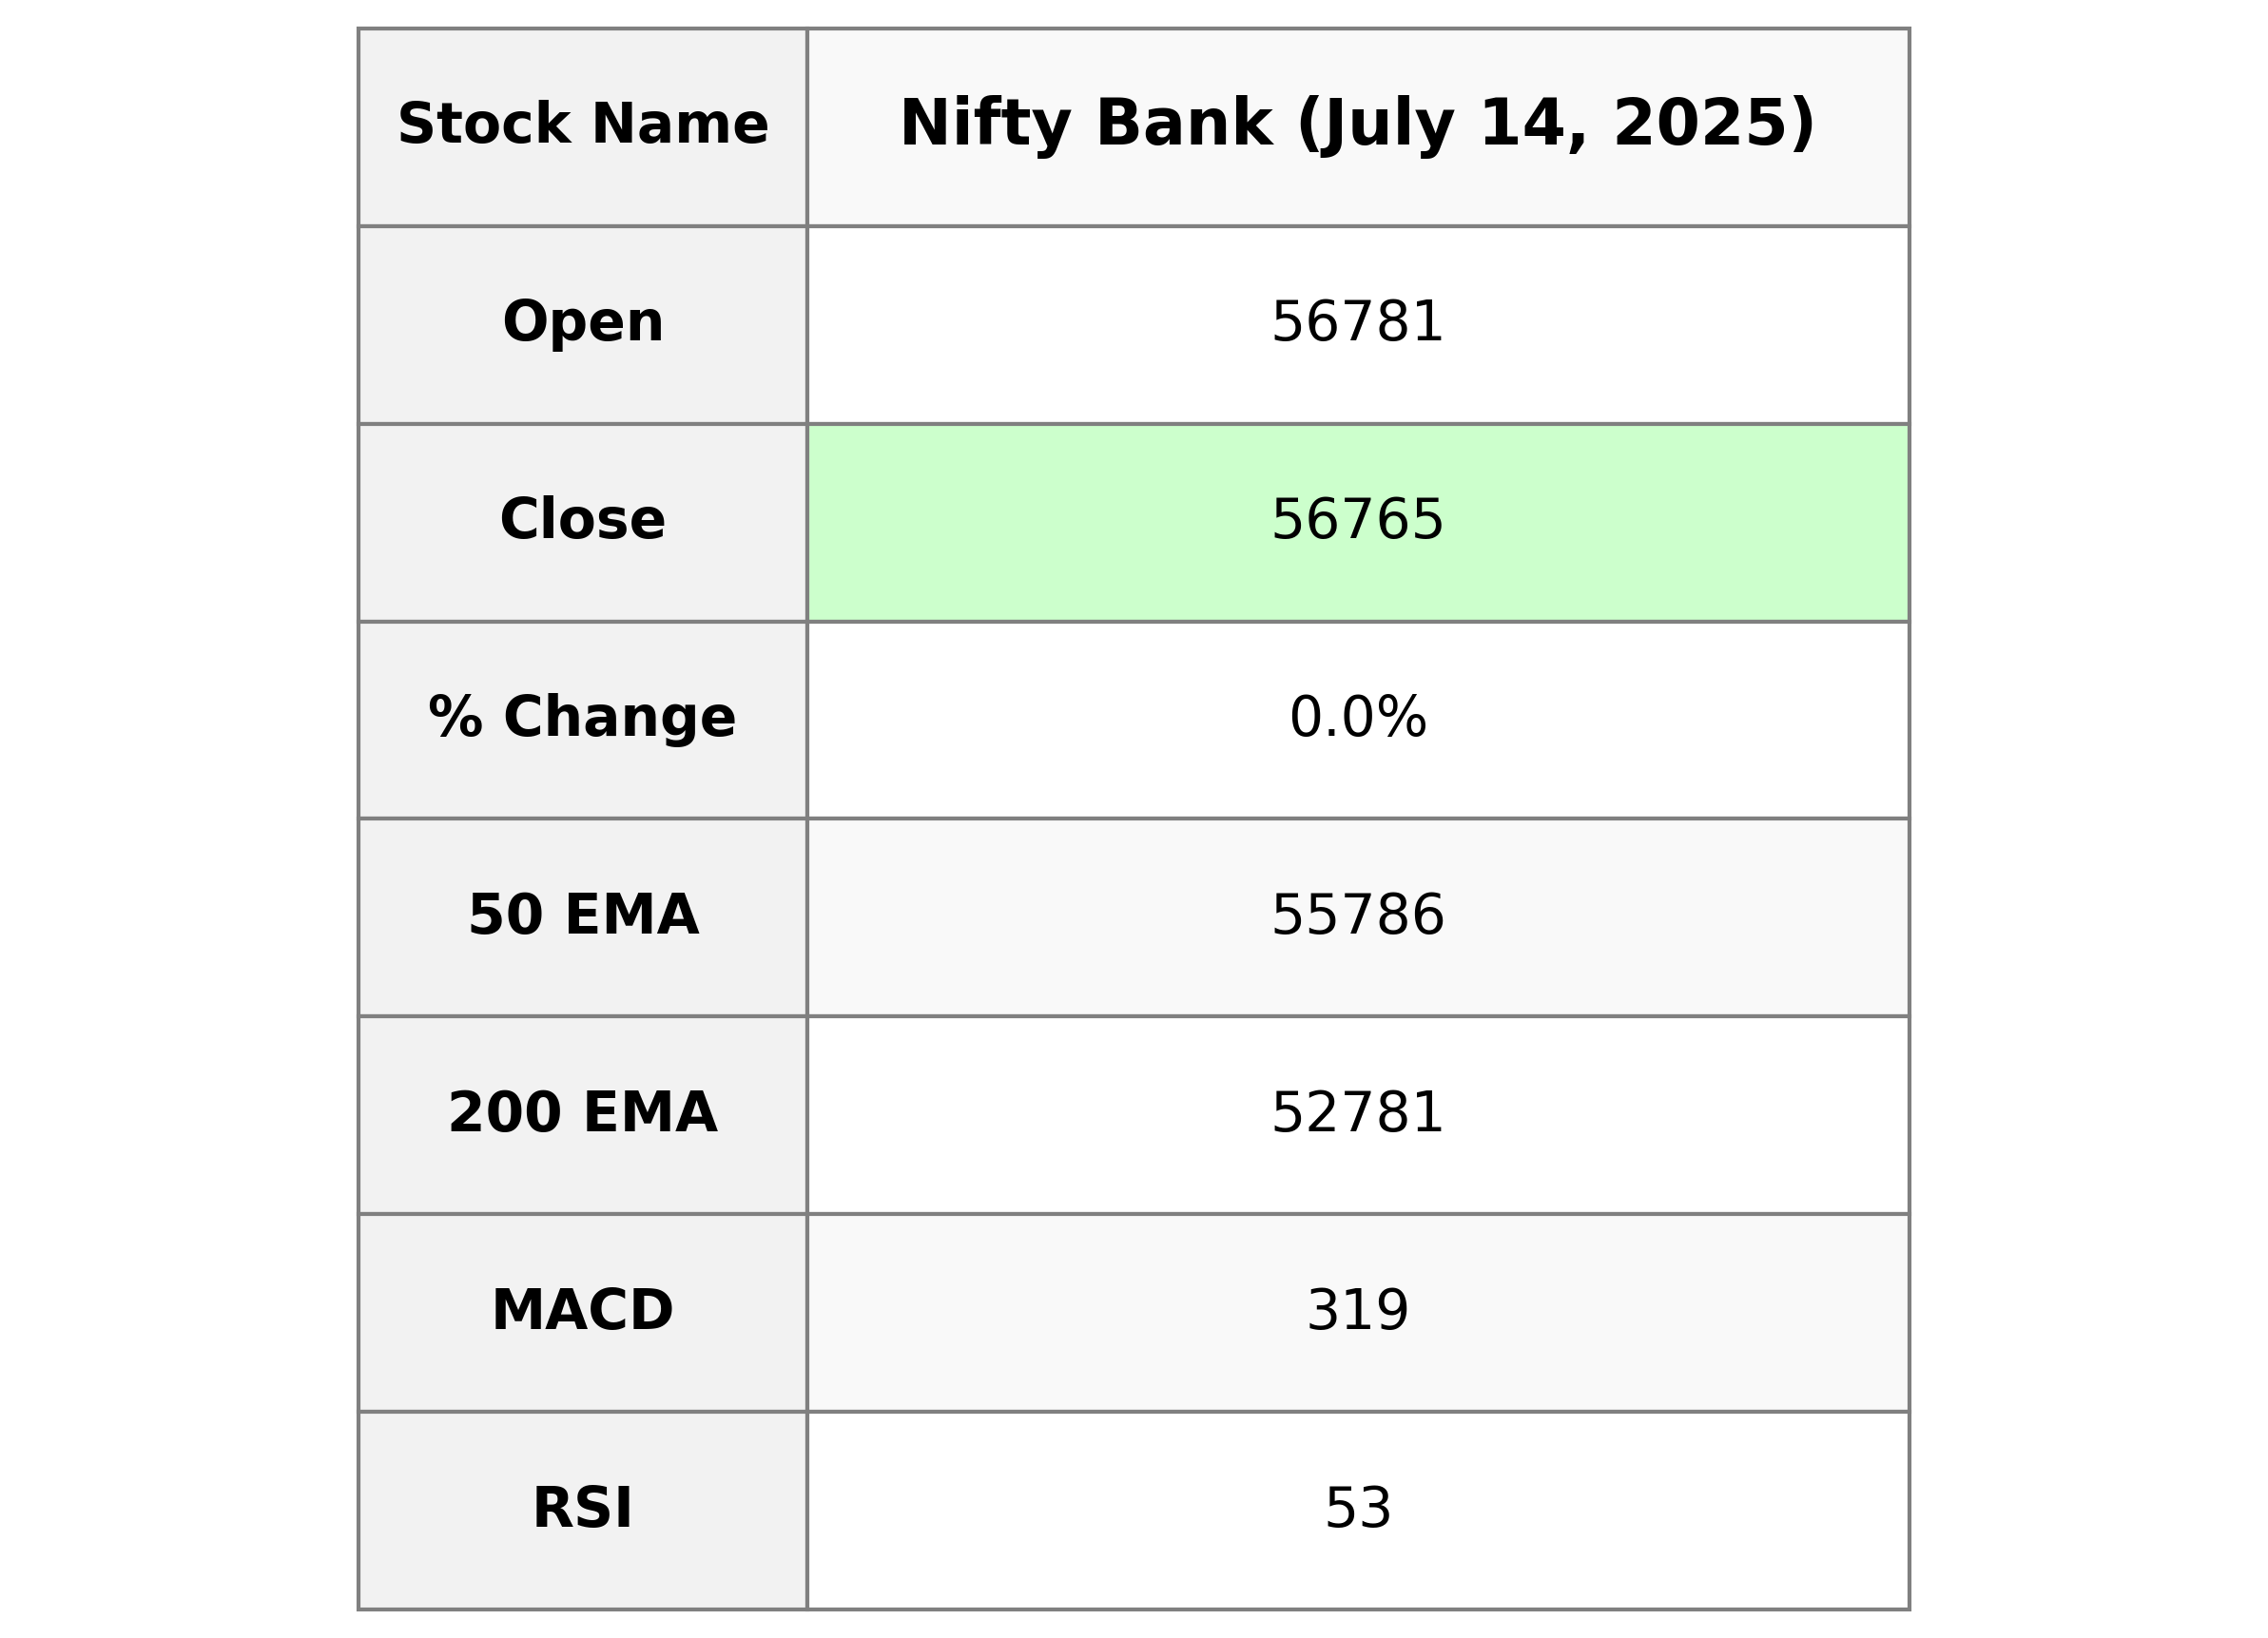
Nifty Bank opened at 56780.75 and closed slightly lower at 56765.35, indicating a marginal decrease for the day with a % change of 0.0188%. The stock remained fairly stable, trading between a high of 56896.30 and a low of 56594.25. The RSI of 53.41 suggests a neutral momentum, while the MACD indicates a potential downturn as it is below the MACD signal line.
Relationship with Key Moving Averages
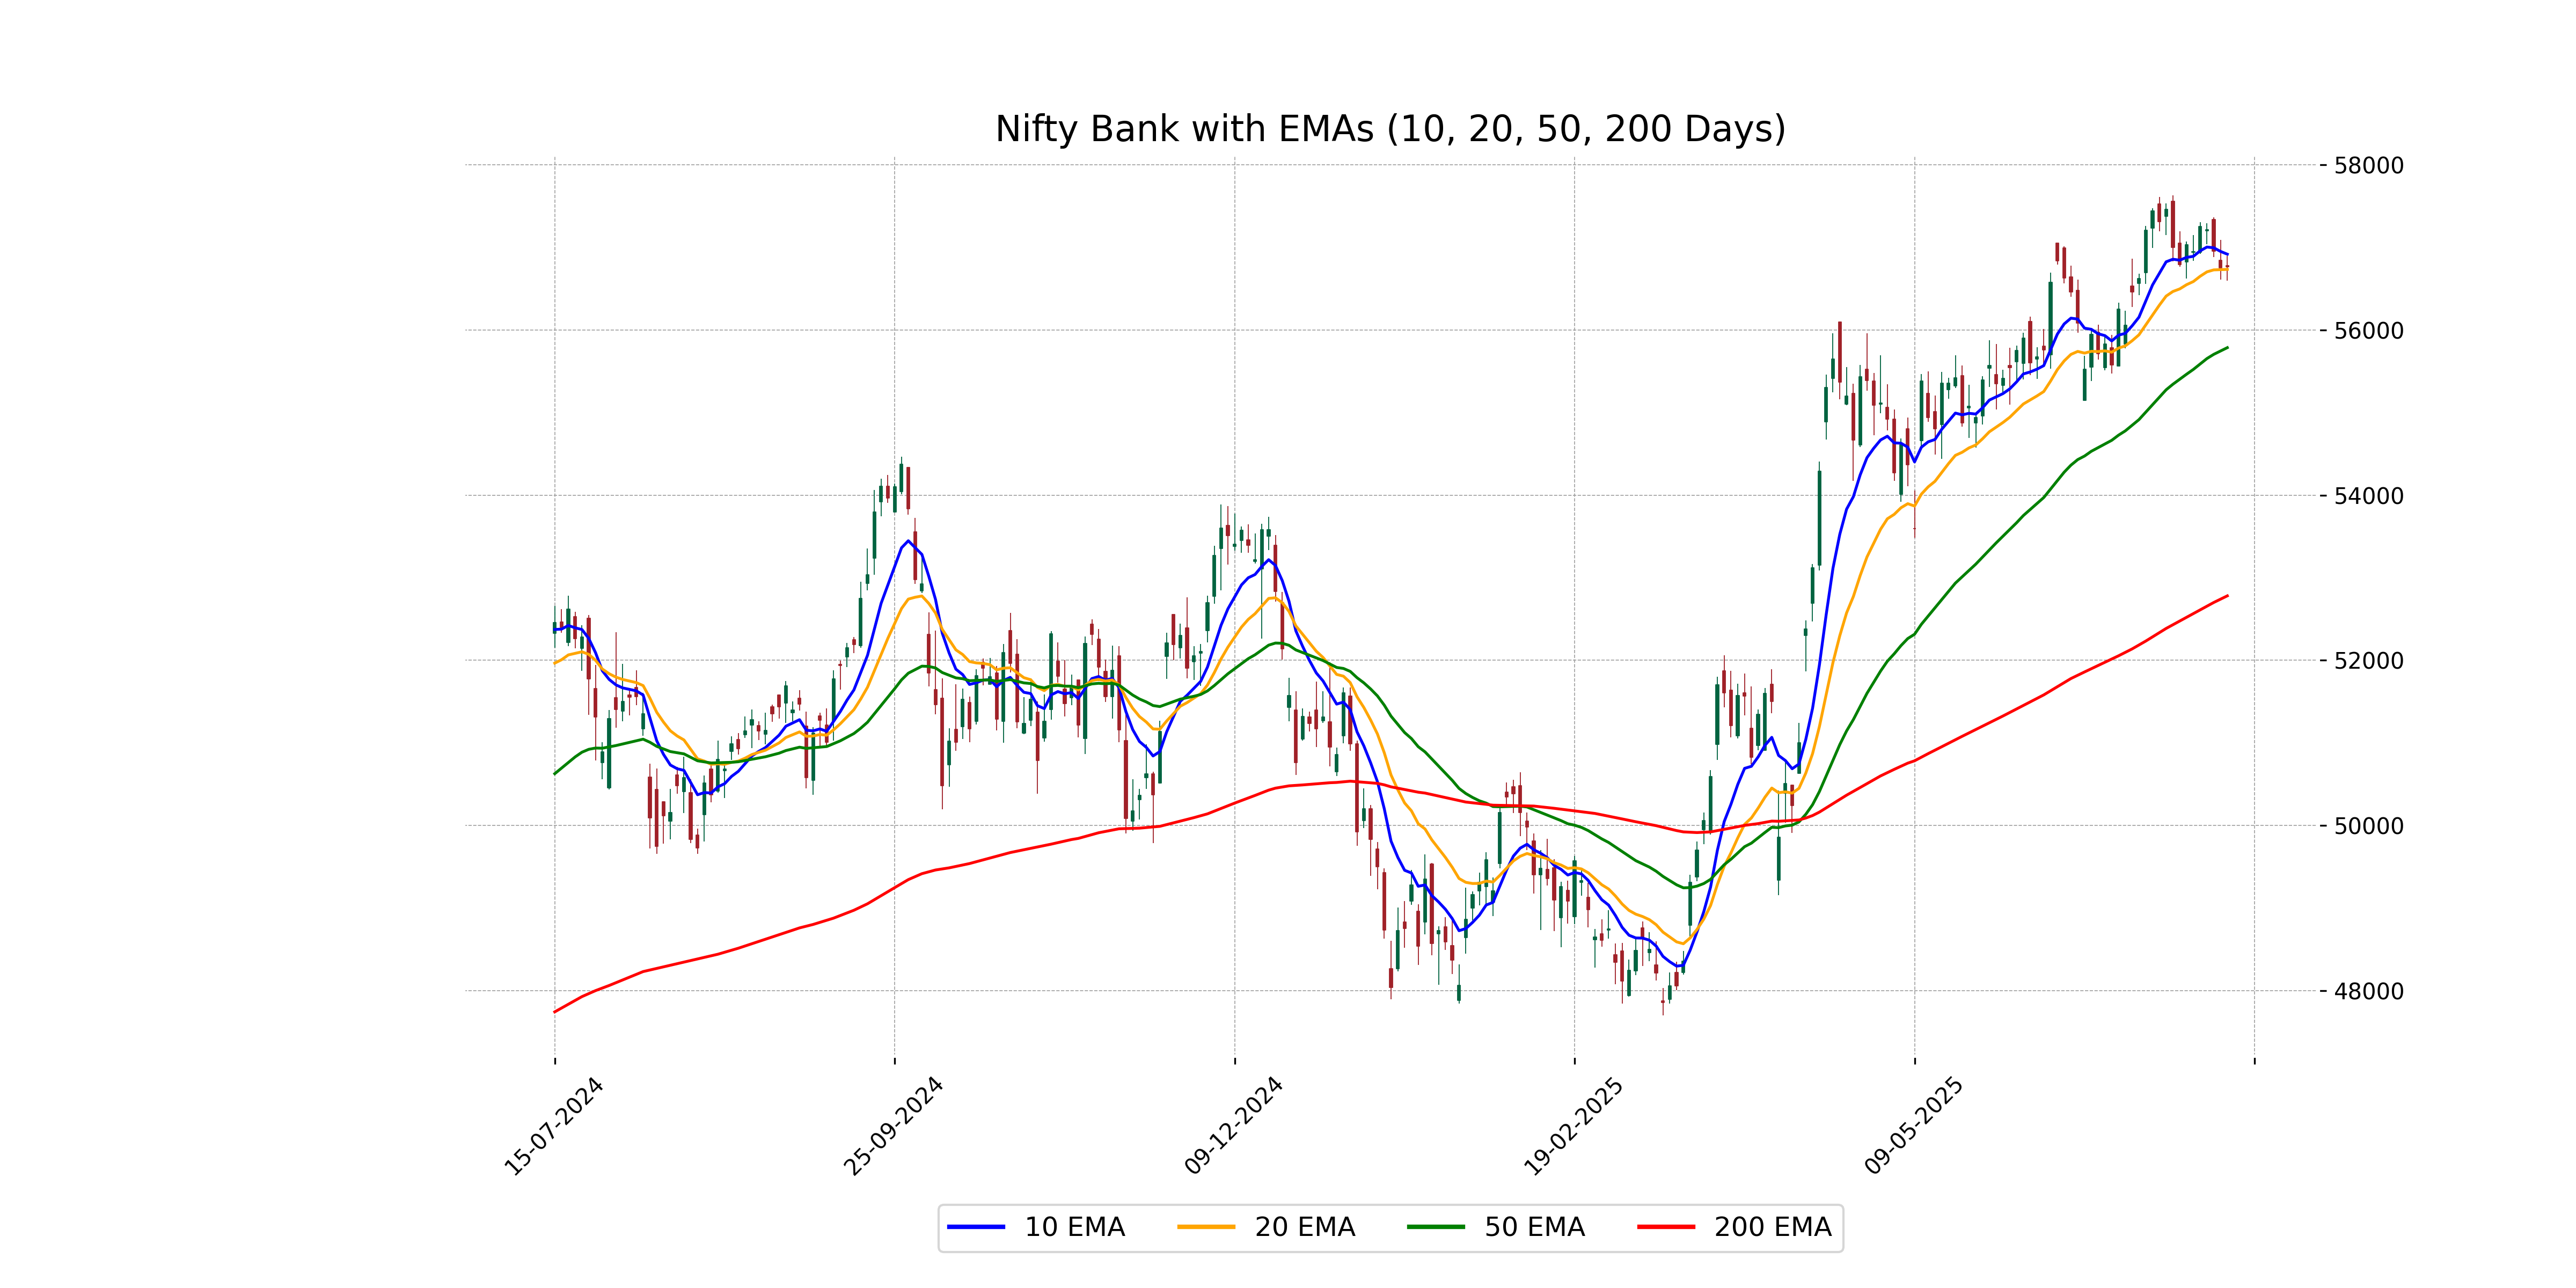
Nifty Bank's current closing price of 56765.35 is slightly above its 50-day EMA of 55786.36, indicating a short-term upward trend, but it is below the 10-day EMA of 56918.07. The 200-day EMA is significantly lower at 52780.84, suggesting a long-term upward trend.
Moving Averages Trend (MACD)
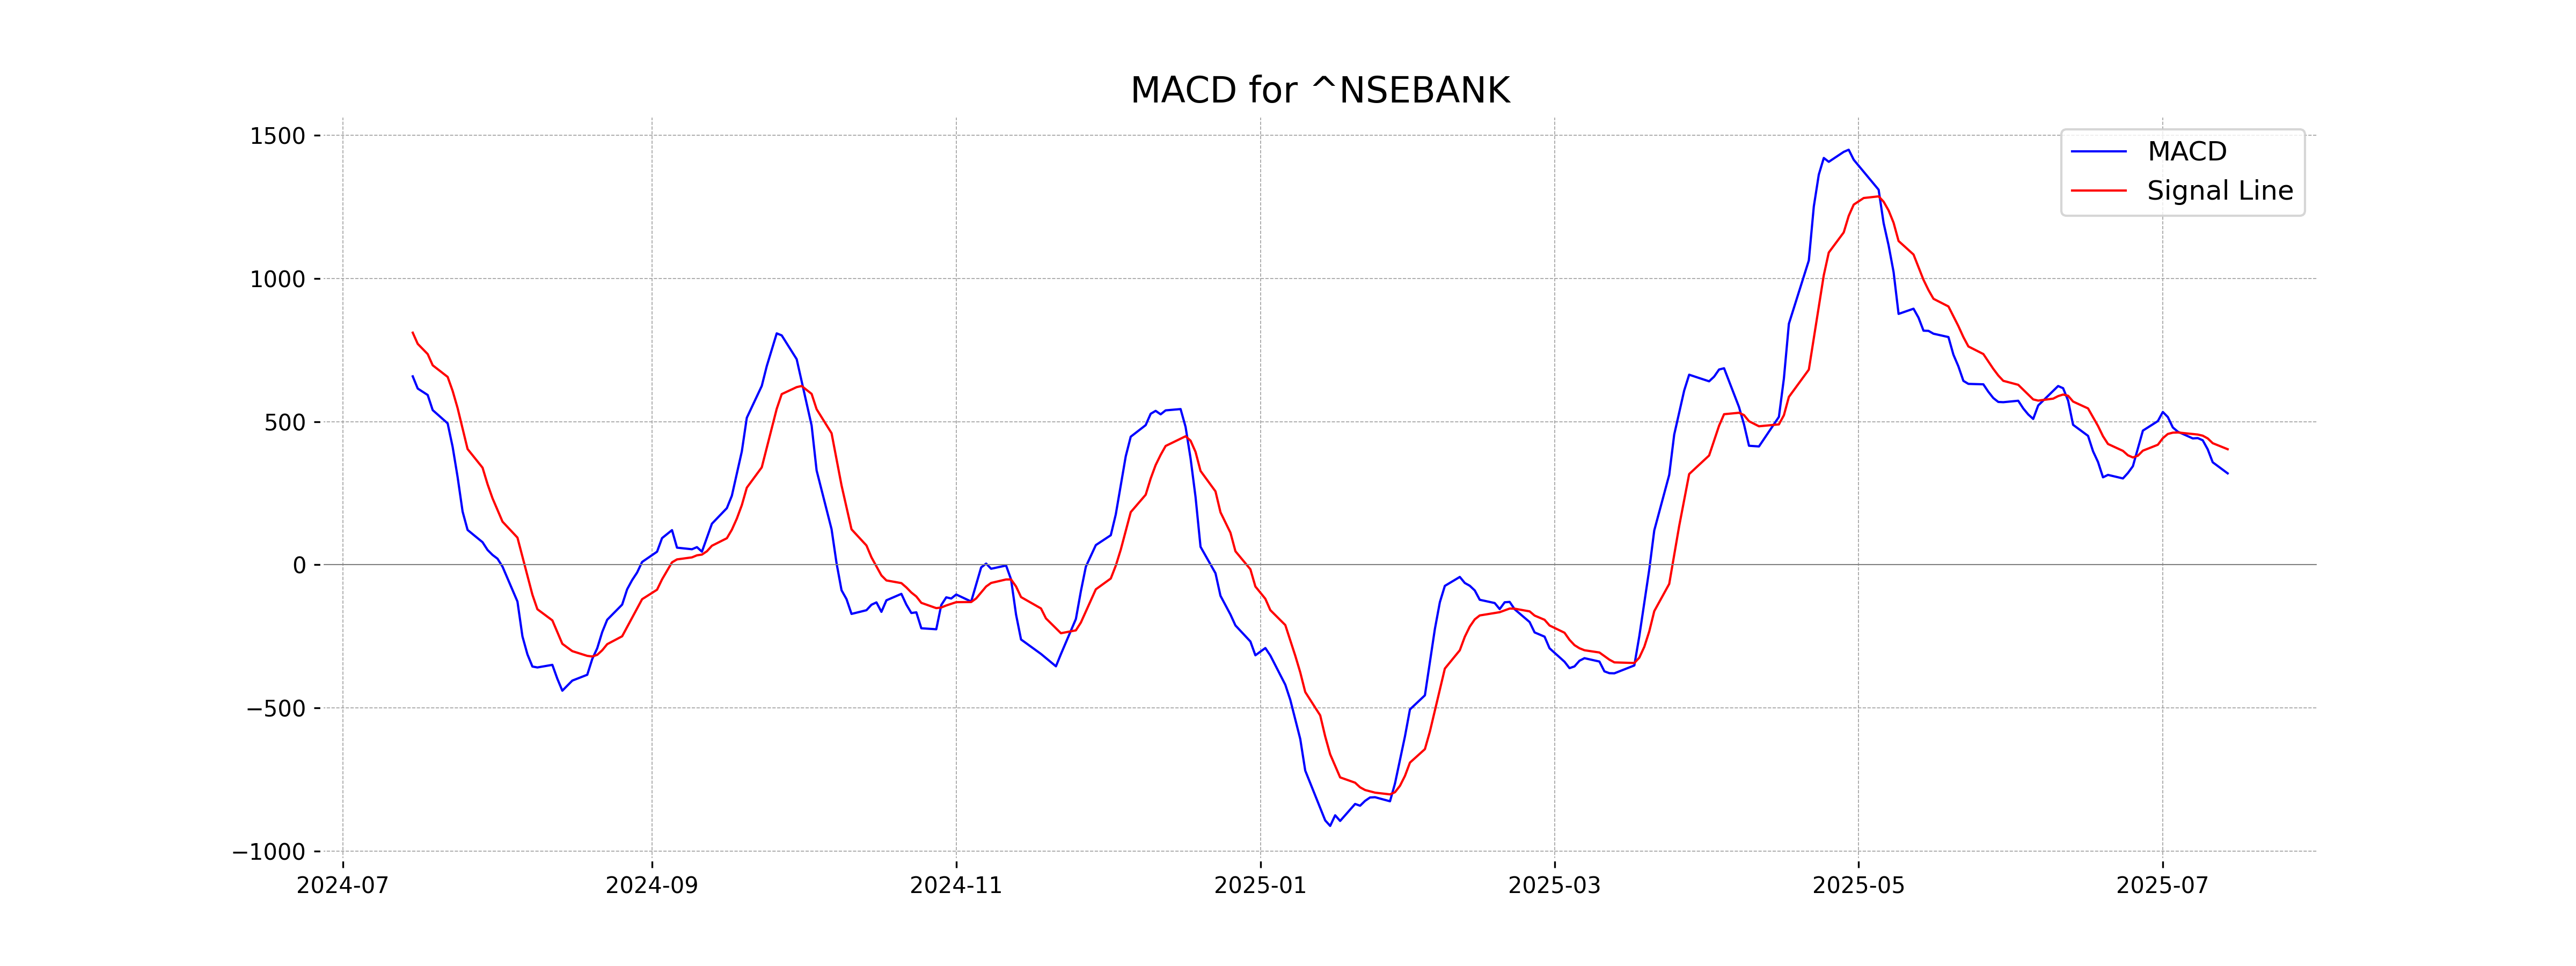
The MACD for Nifty Bank is at 319.32, which is below the MACD Signal of 403.60, indicating a potential bearish sentiment. This suggests a negative momentum in the stock, signaling possible caution for traders.
RSI Analysis
The Relative Strength Index (RSI) for Nifty Bank stands at 53.41, indicating a neutral market condition. An RSI value between 30 and 70 suggests that the index is neither in the overbought nor oversold territory, allowing for potential market movement in either direction.
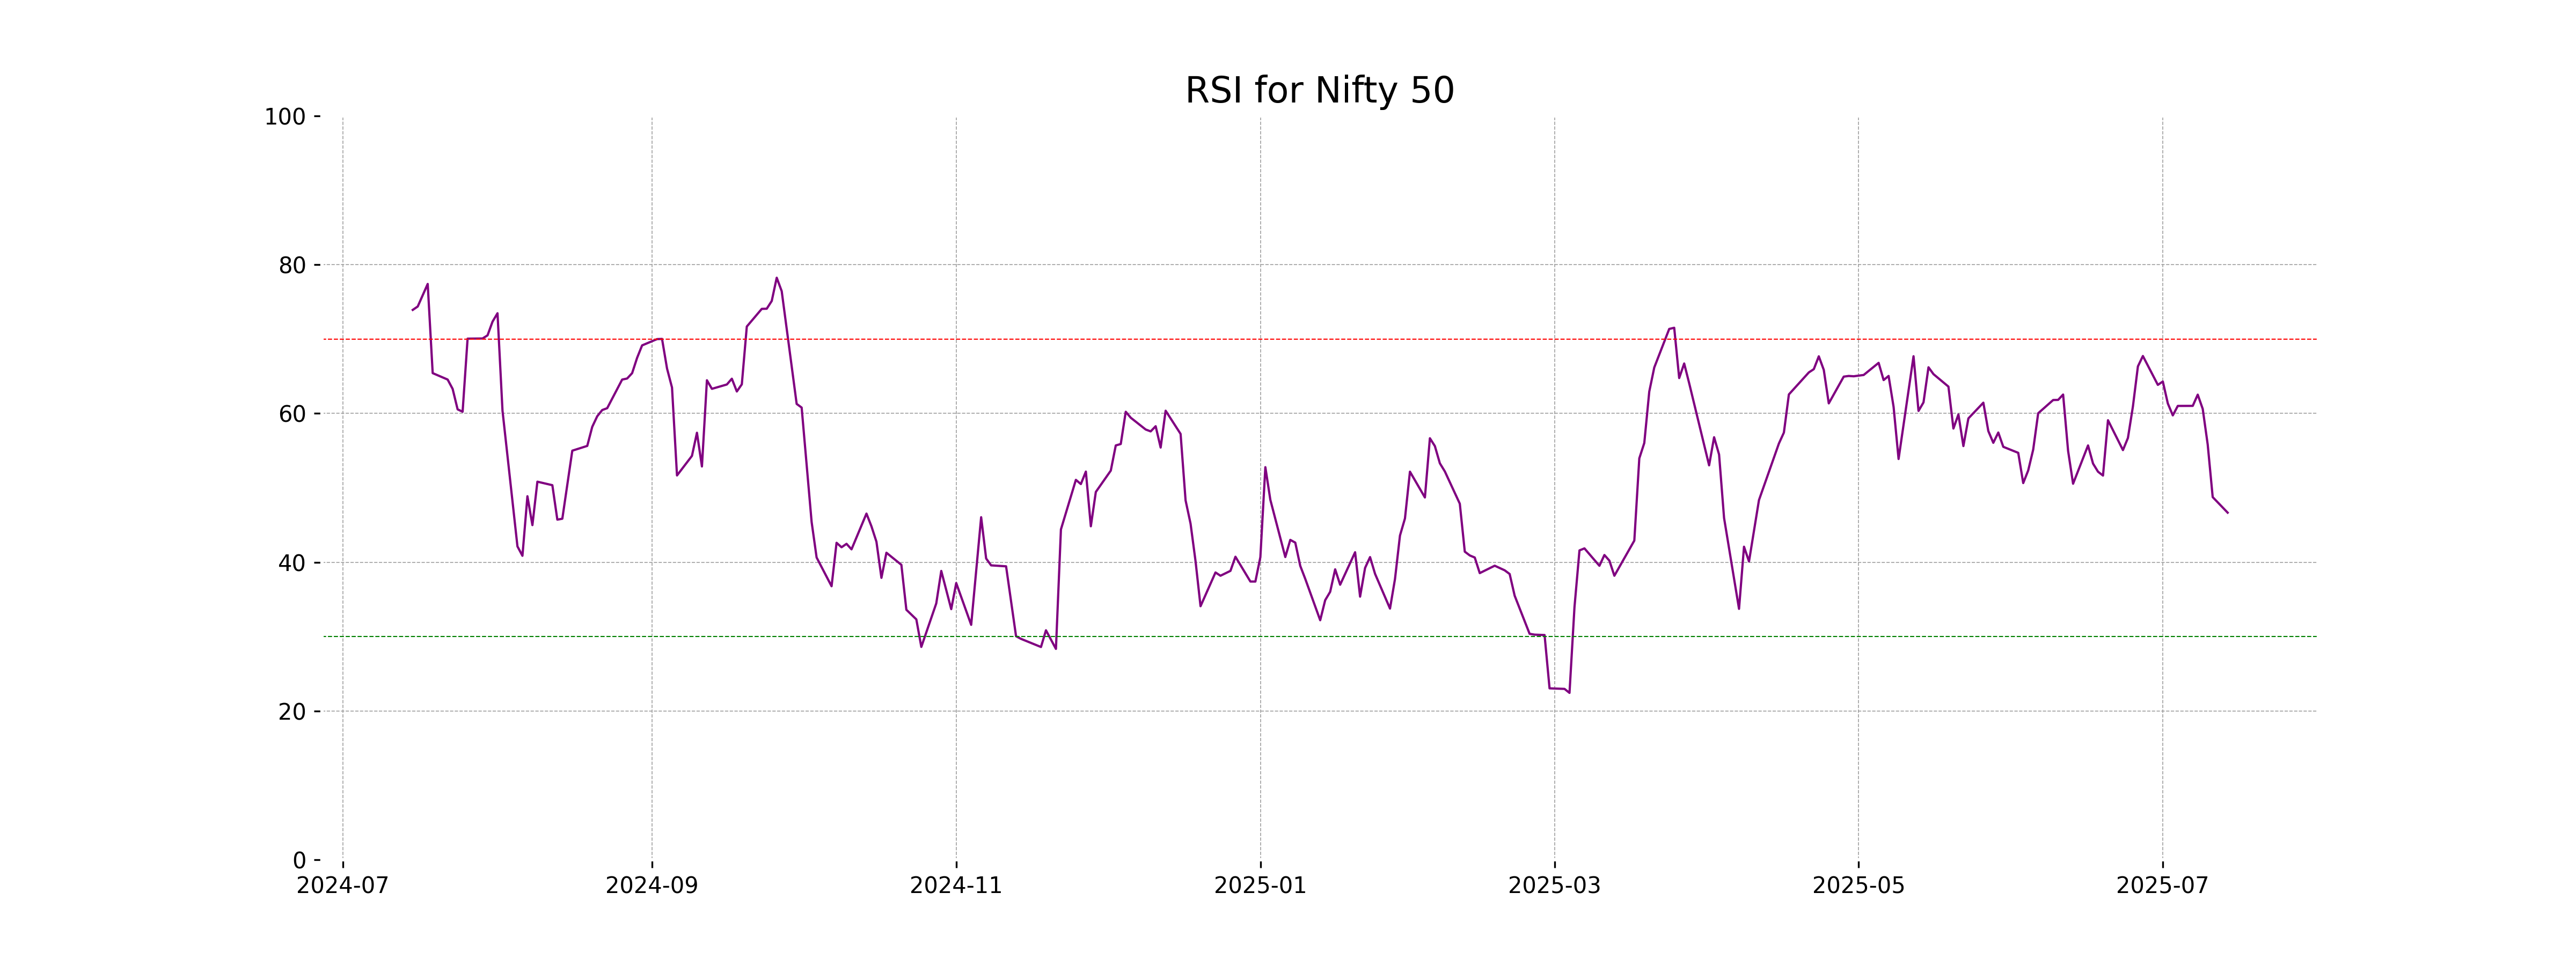
Analysis for Nifty 50 - July 14, 2025
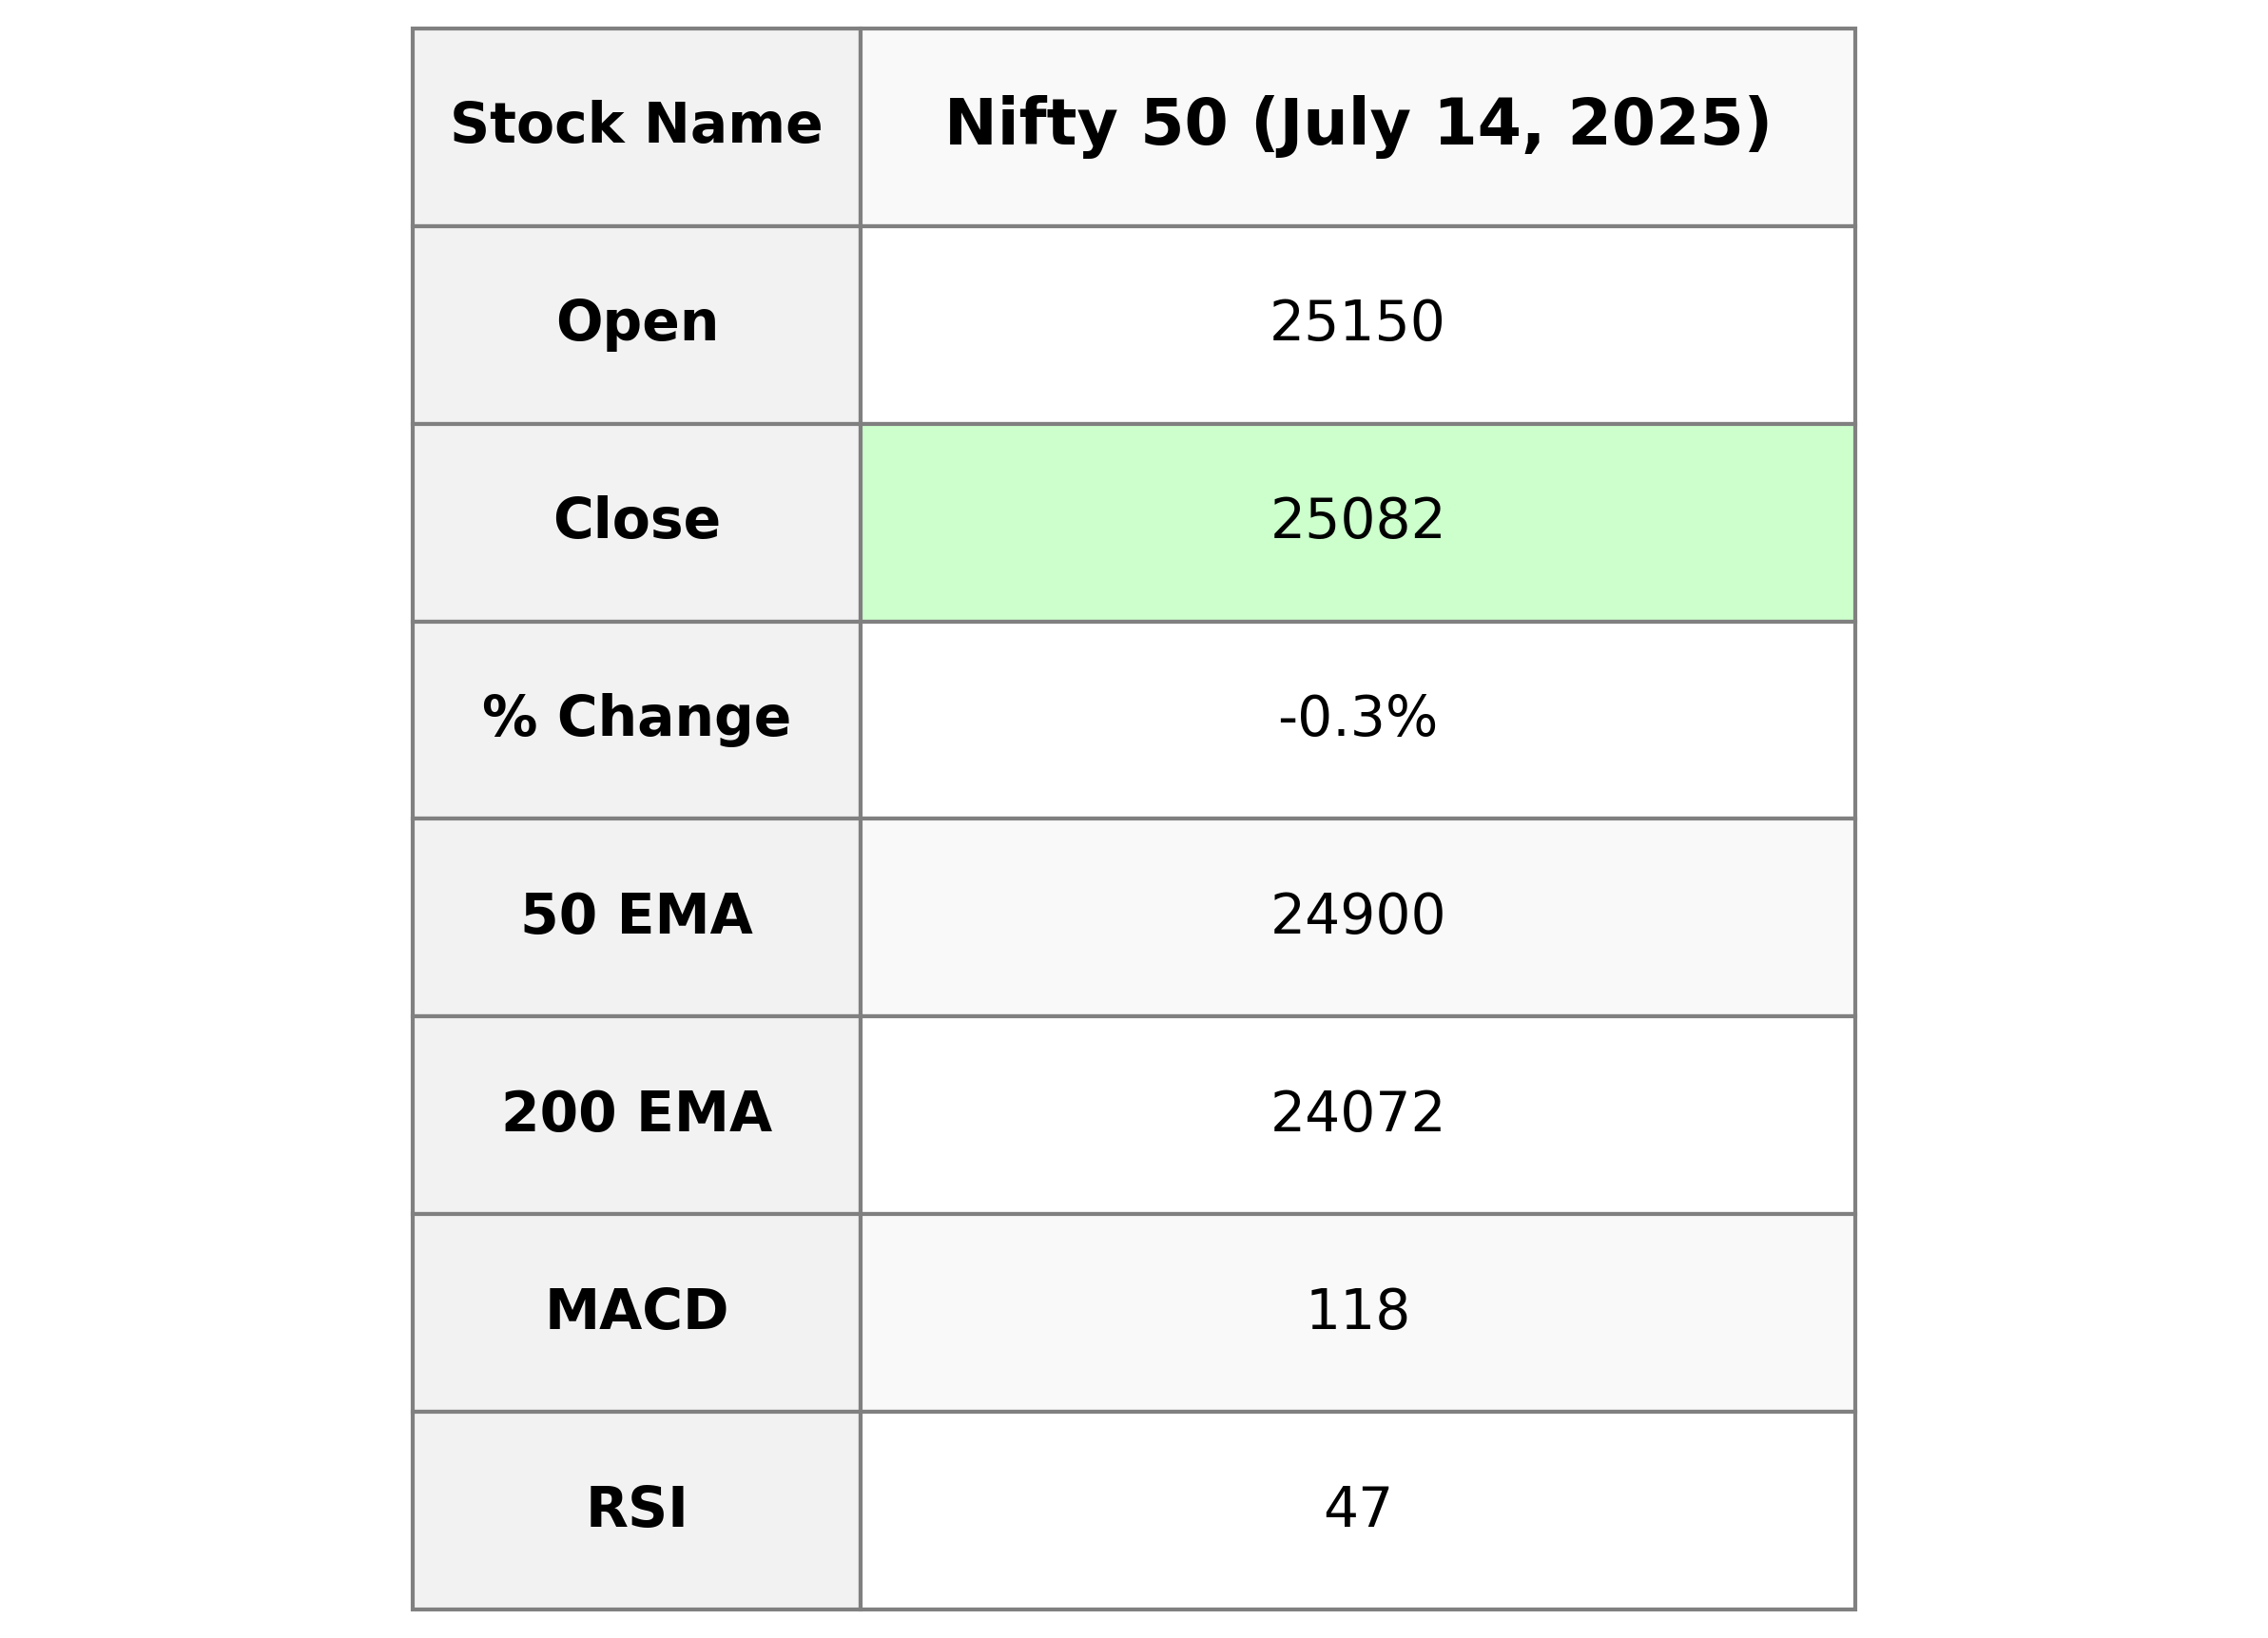
Nifty 50 opened at 25,149.5 and closed slightly lower at 25,082.3, marking a point change of -67.55 with a percentage change of -0.27% from the previous close of 25,149.85. The RSI stands at 46.66, suggesting a neutral momentum, while the MACD is 118.01, lower than the MACD signal of 175.10, indicating a bearish sentiment.
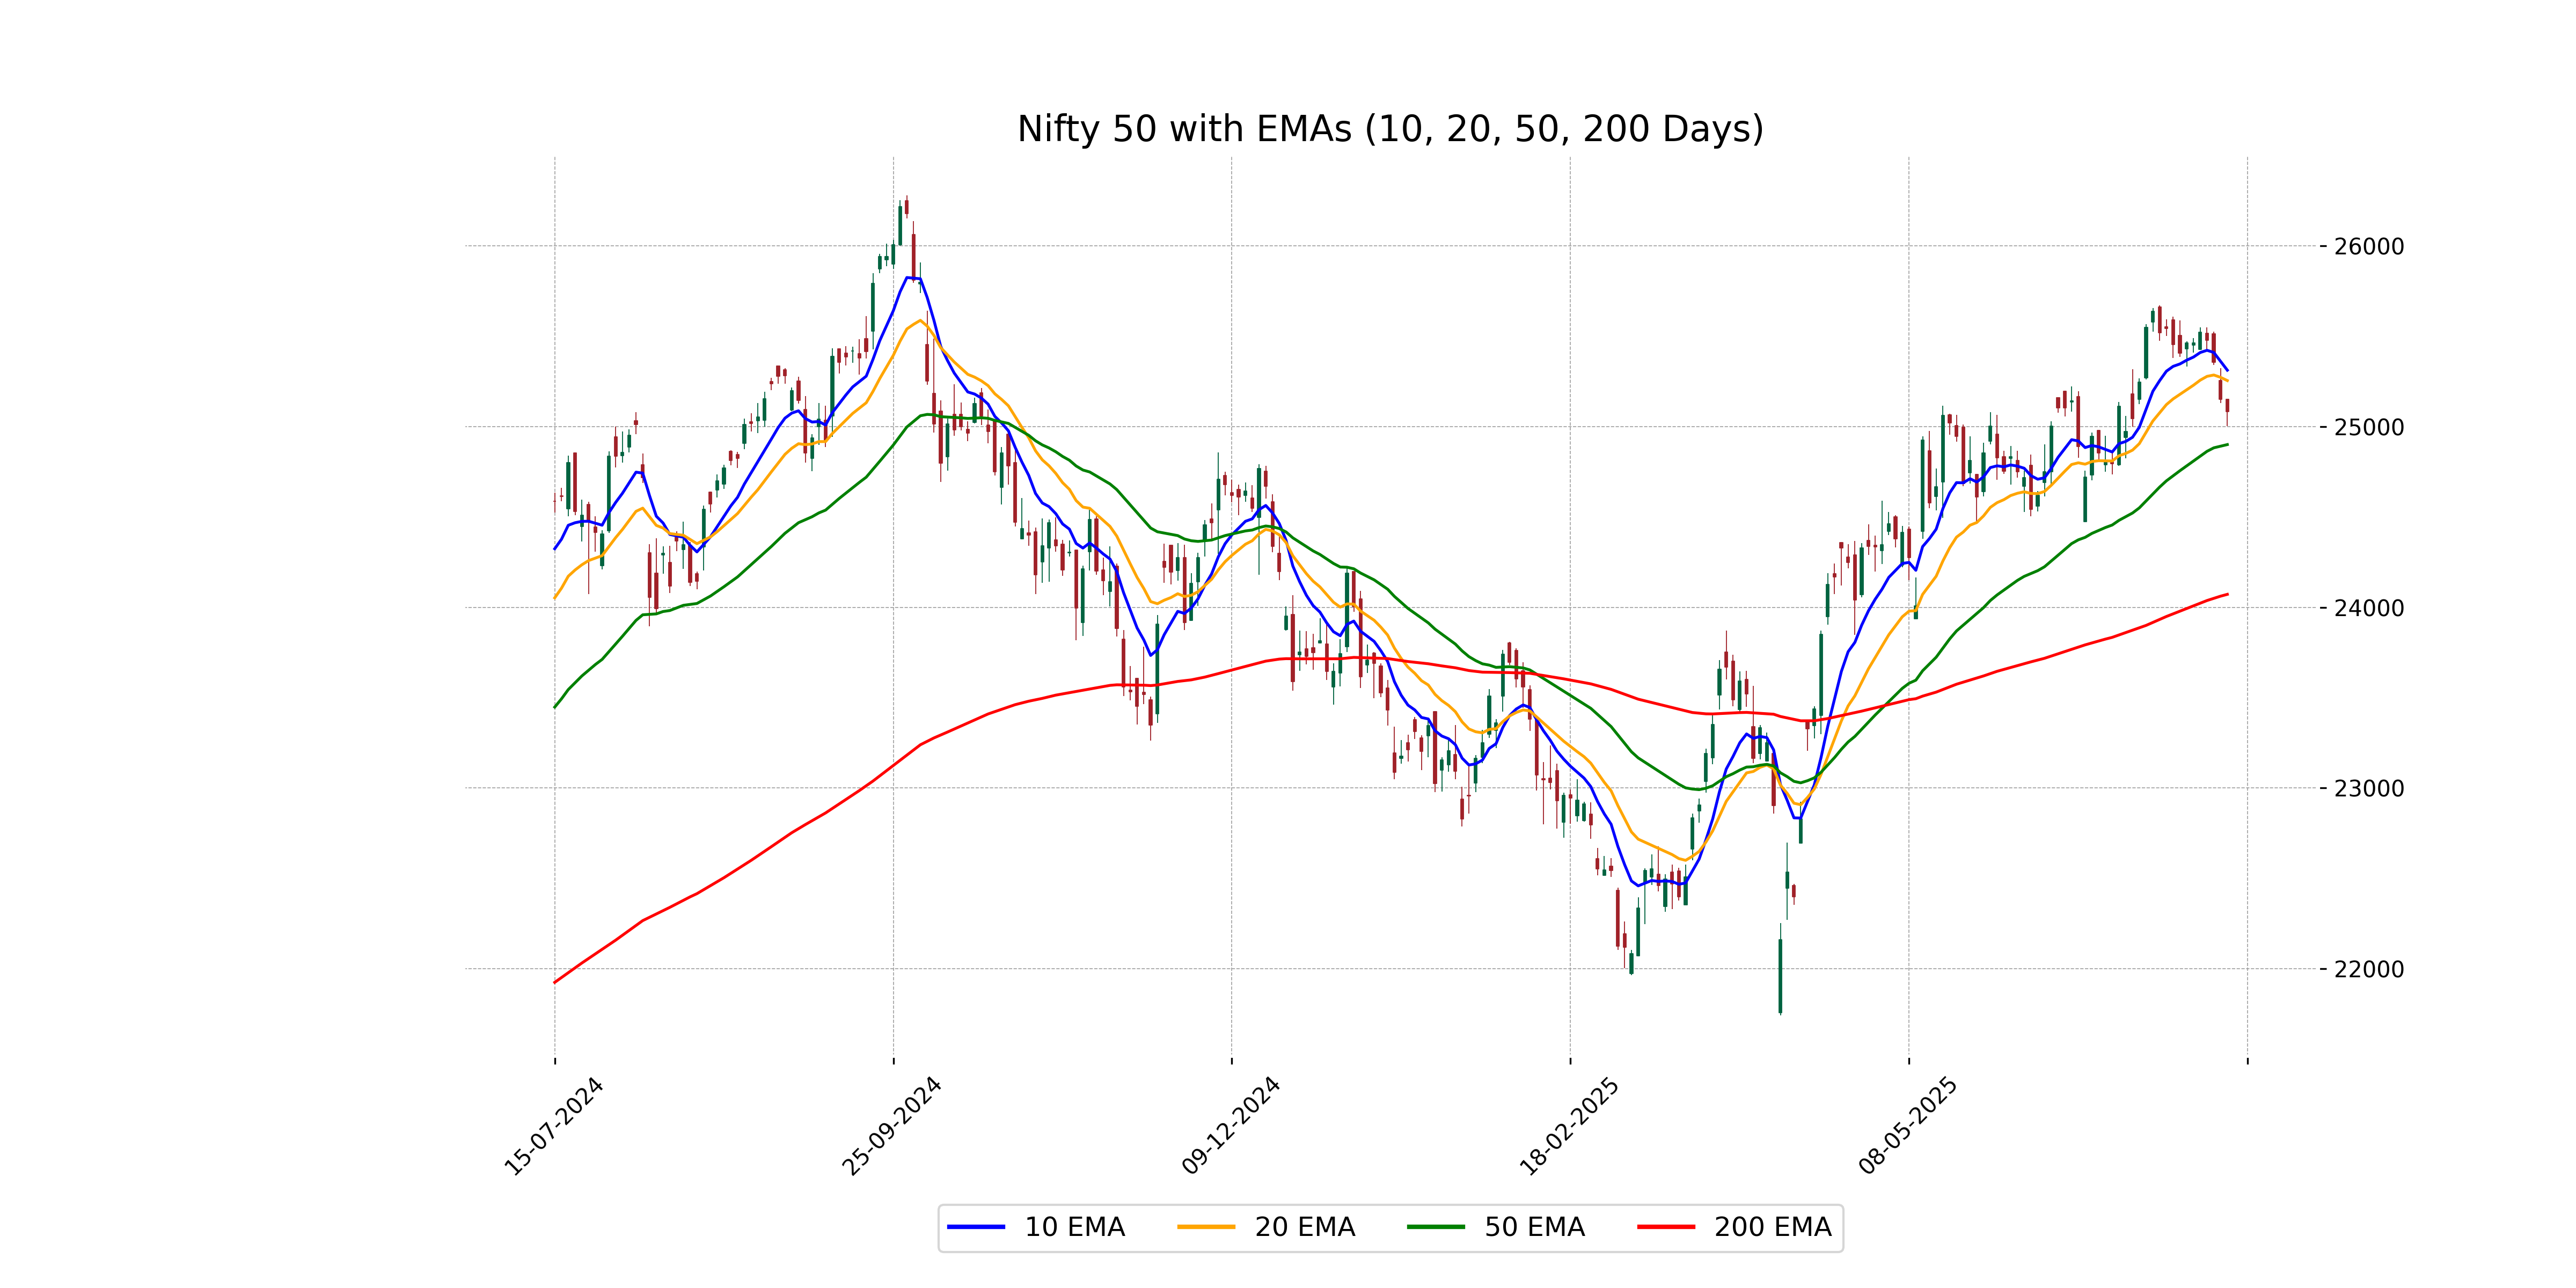
Relationship with Key Moving Averages
Nifty 50's current close of 25082.30 is below its 10 EMA (25311.26) and 20 EMA (25253.77), suggesting a potential short-term downtrend. However, it remains above its 50 EMA (24899.86) and 200 EMA (24071.50), indicating a longer-term upward trajectory may still be intact.
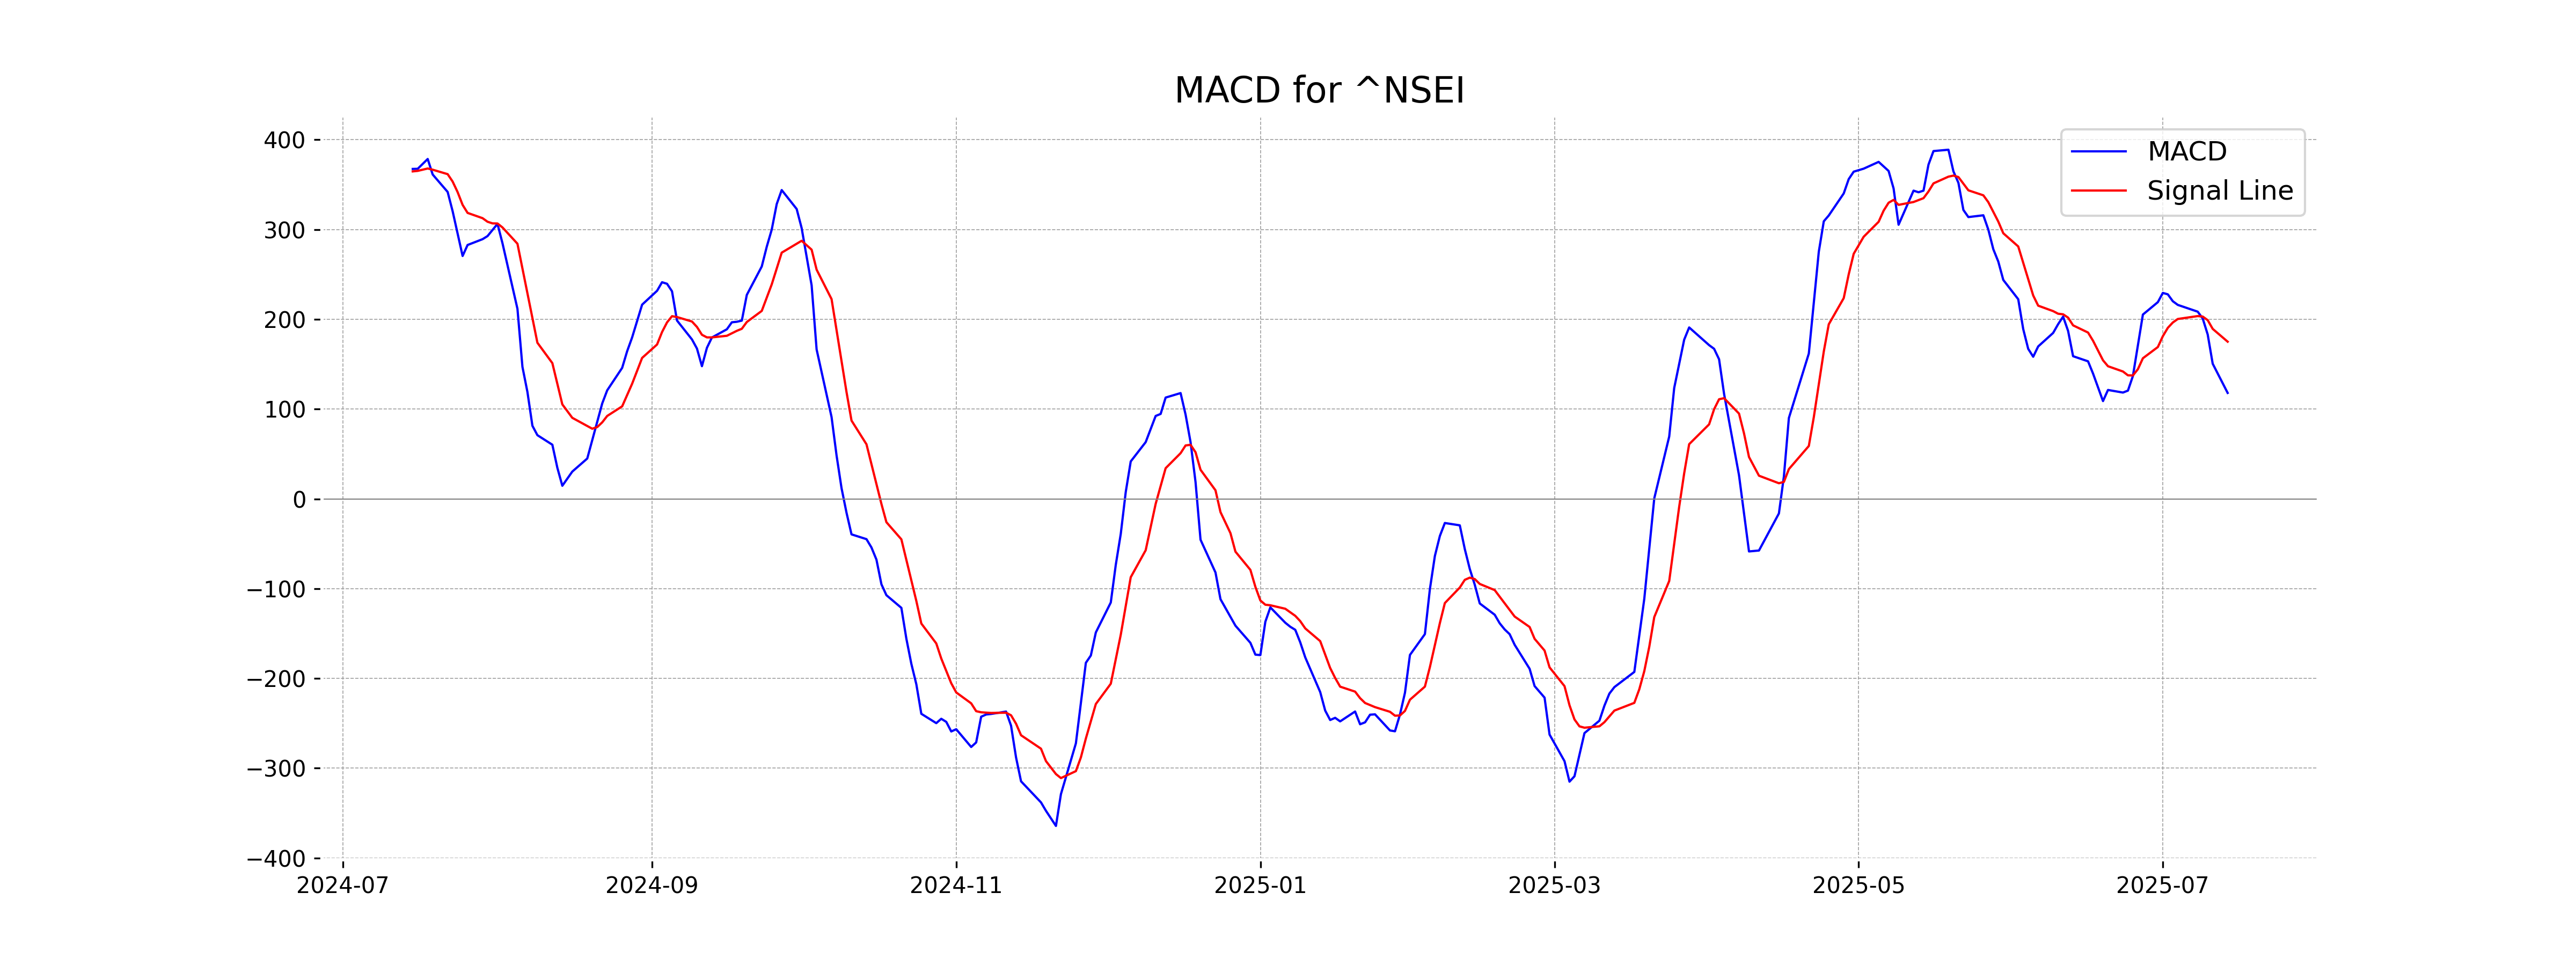
Moving Averages Trend (MACD)
Nifty 50 has a negative MACD histogram, as the MACD line (118.01) is below the MACD Signal line (175.09). This suggests a potential bearish momentum in the market. Traders might watch for further movements to confirm a trend.
RSI Analysis
Nifty 50 RSI Analysis: The current Relative Strength Index (RSI) for Nifty 50 stands at approximately 46.66, suggesting a neutral market sentiment. This value implies that Nifty 50 is neither overbought nor oversold, indicating a balanced momentum at this point.