Global stock market indices: How the world markets performed today - 08 July 2025
The international stock market indices showed varied performances on July 08, 2025, reflecting the economic sentiment across different regions.
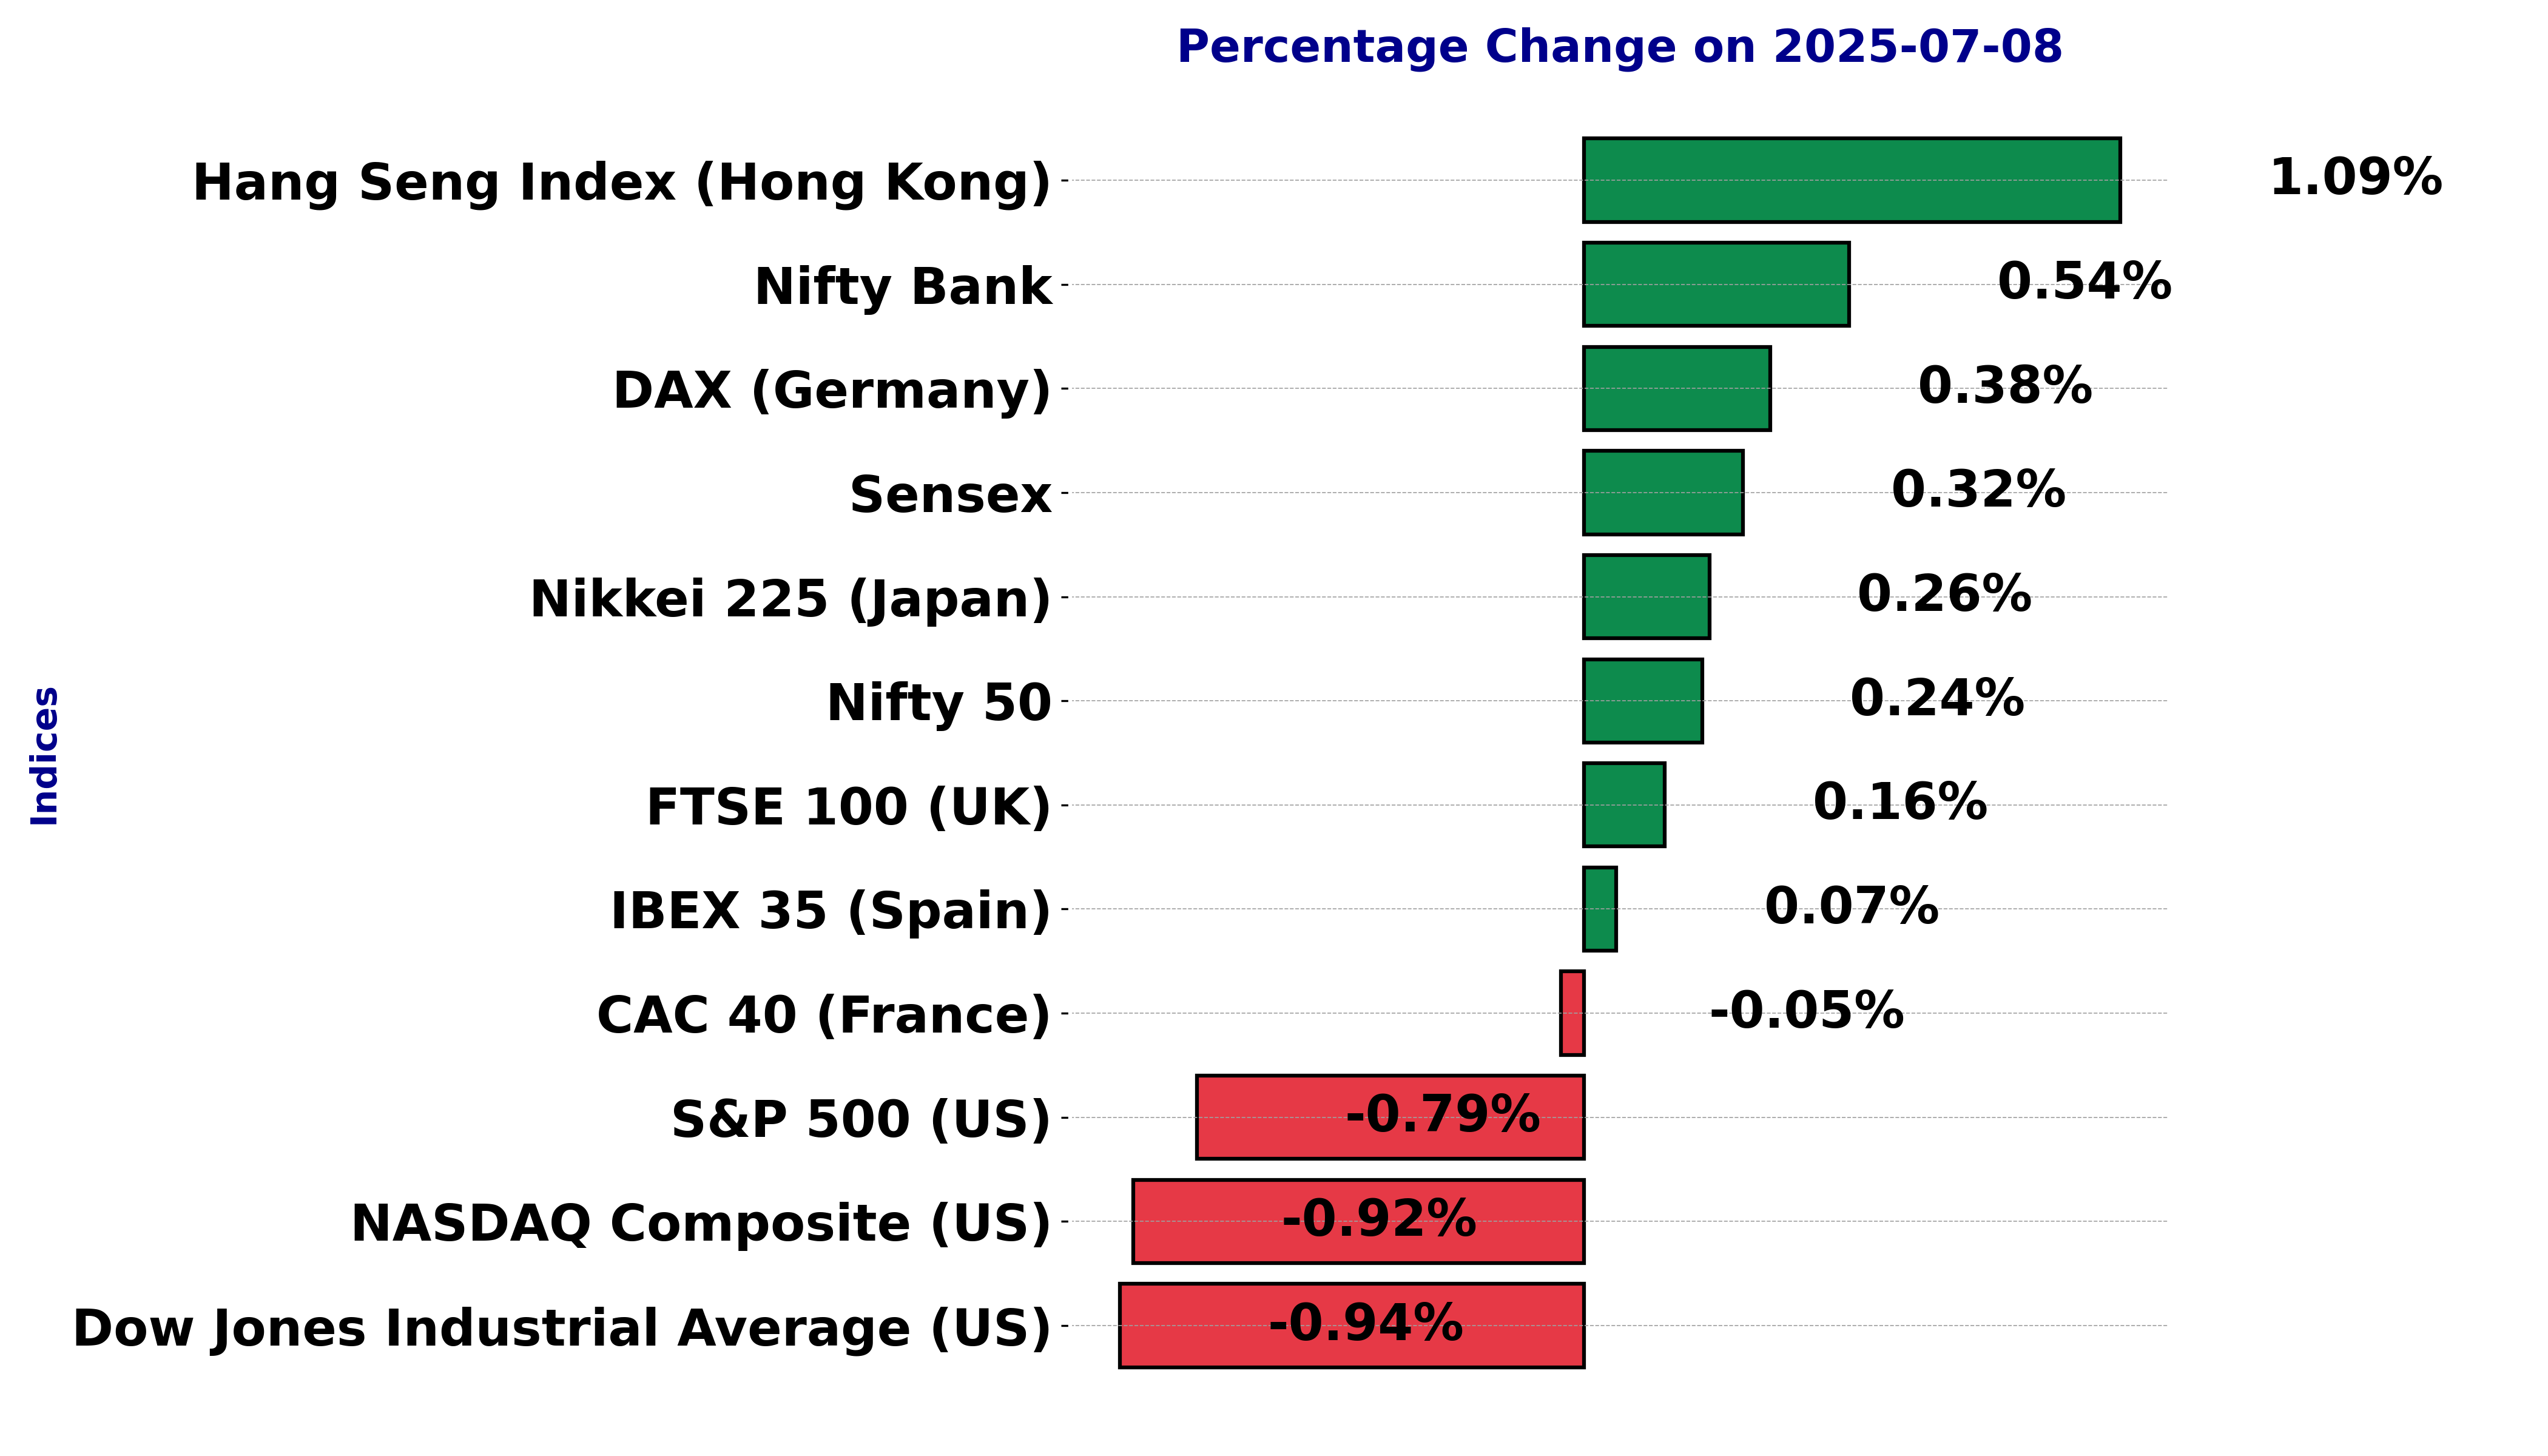
In this article, we analyze the performance of key global indices including the S&P 500, Dow Jones Industrial Average, NASDAQ Composite, FTSE 100, DAX, CAC 40, IBEX 35, Nikkei 225, Hang Seng, Nifty 50, and BSE Sensex.
Analysis for Sensex - July 08, 2025
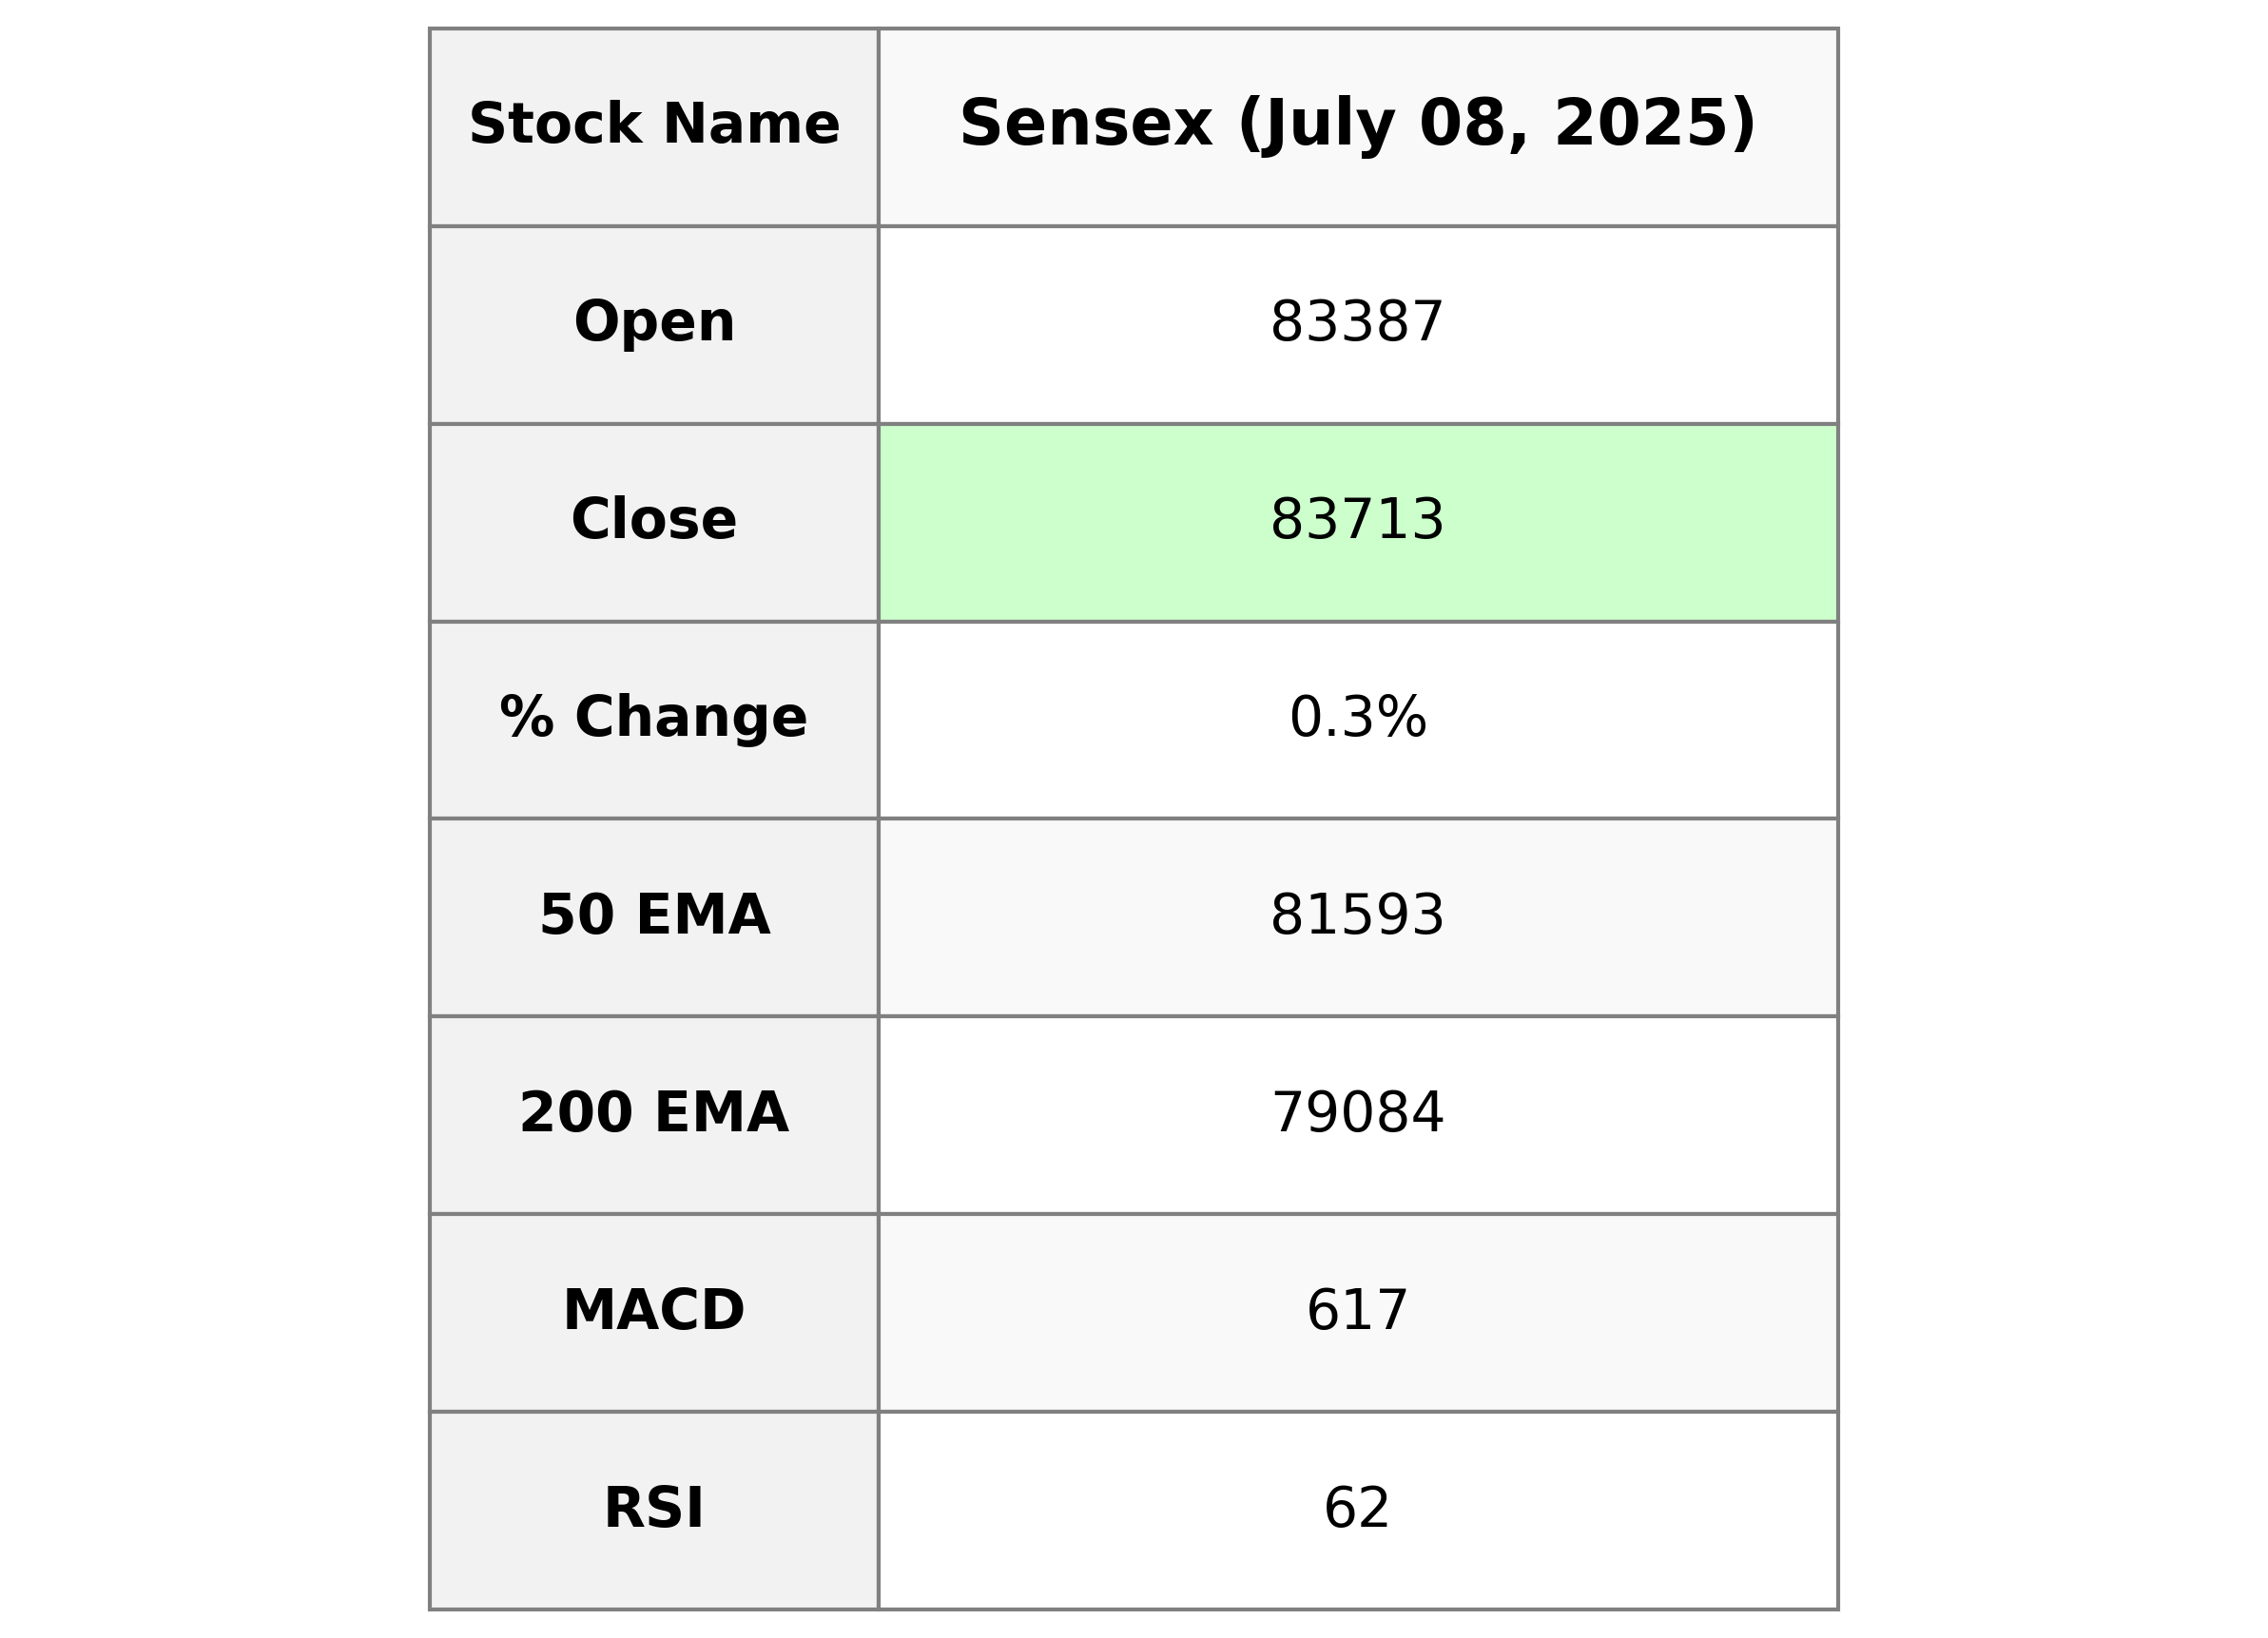
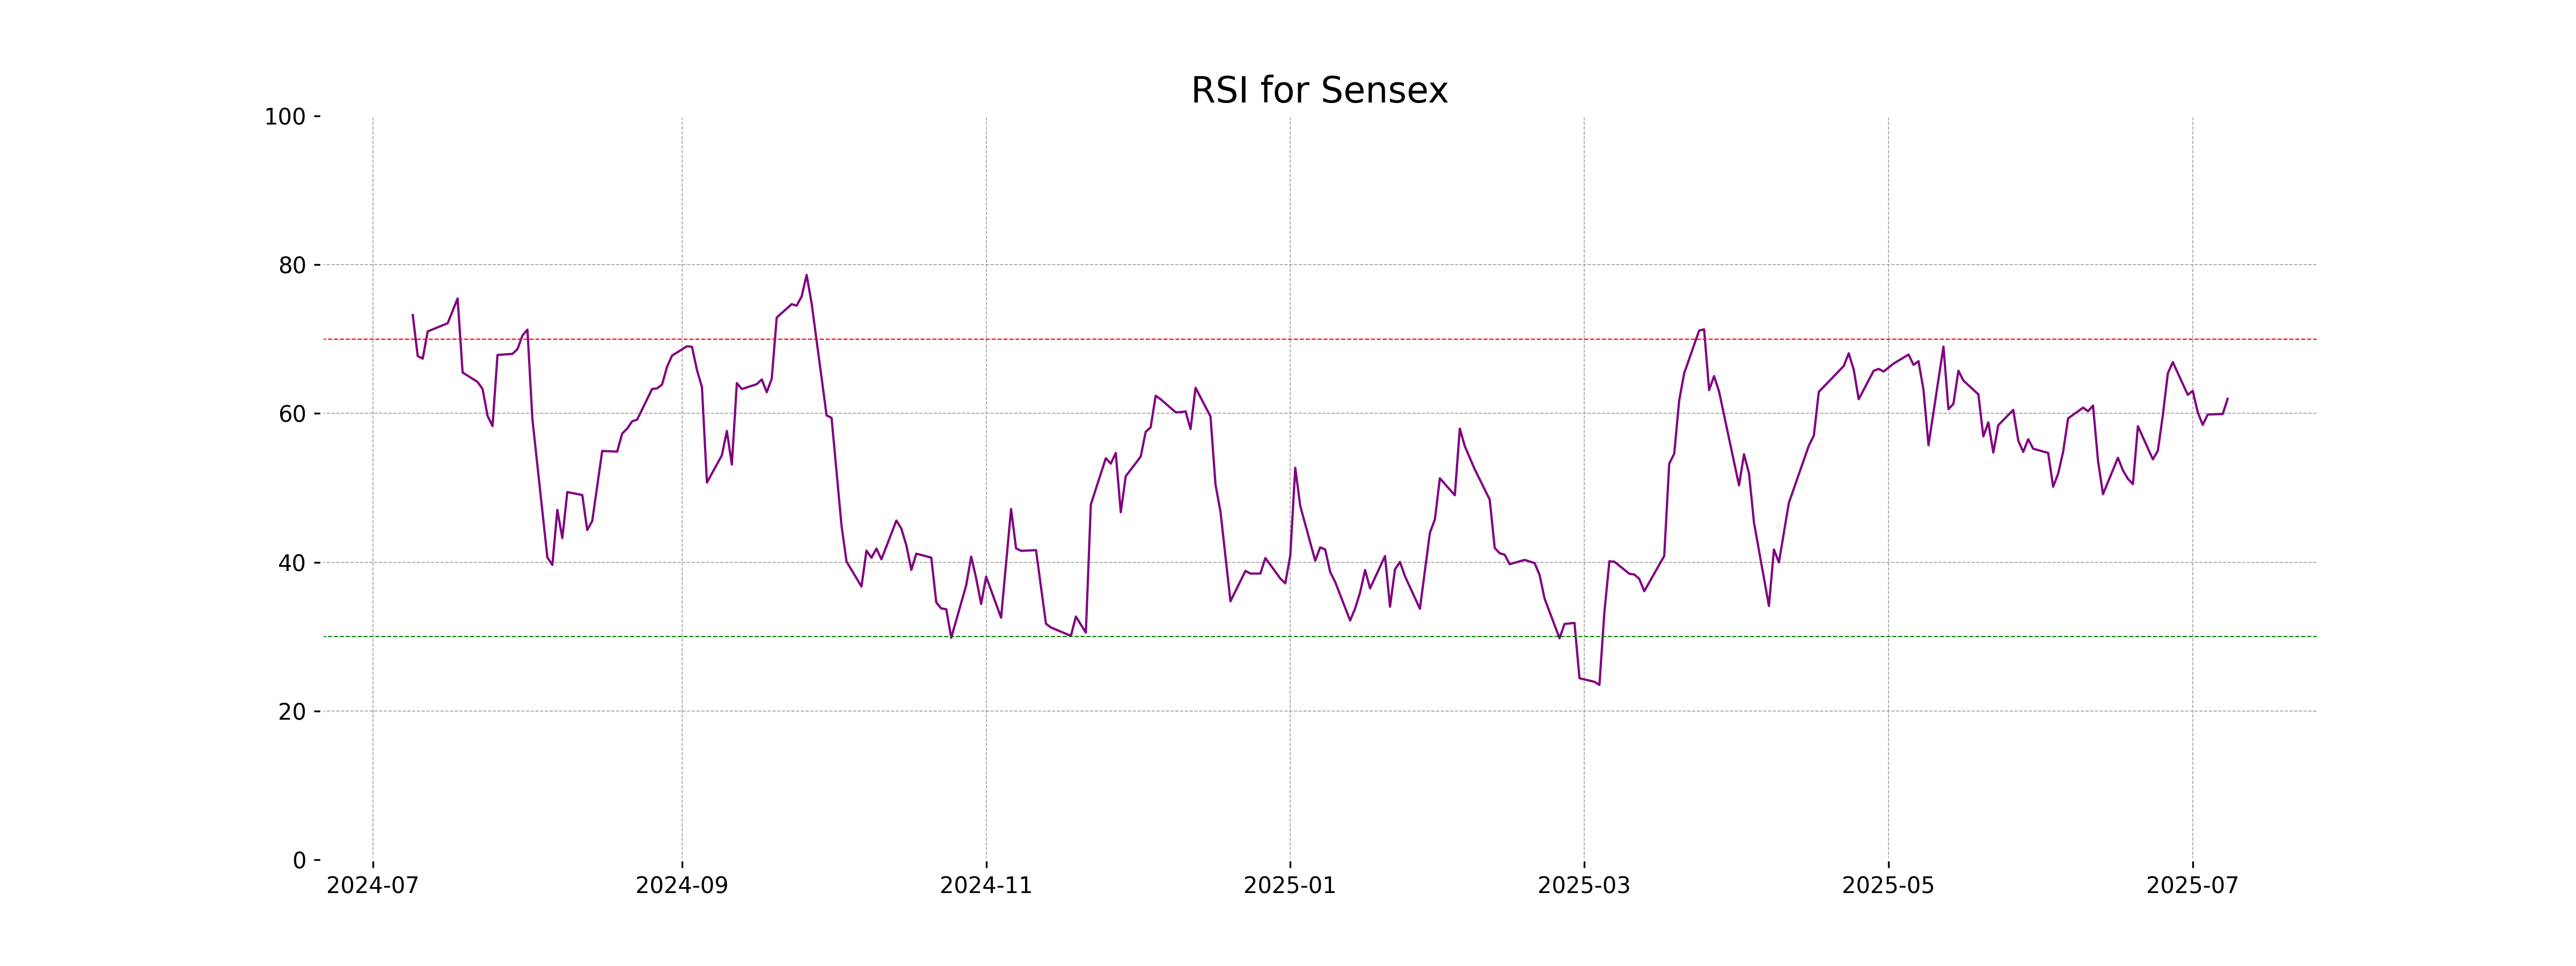
The Sensex opened at 83,387.03 and closed at 83,712.51, marking a 0.32% increase with a points change of 270.01. The day's high was 83,812.31, and the low was 83,320.95, reflecting a bullish movement. The Relative Strength Index (RSI) of 61.97 suggests a moderately strong momentum, and the MACD indicates a continuing upward trend.

Relationship with Key Moving Averages
Sensex closed at 83,712.51, which is above its 50-day EMA of 81,592.91 and 200-day EMA of 79,083.90, indicating a positive short to mid-term trend. The close is also above the 10-day and 20-day EMAs of 83,295.46 and 82,837.59 respectively, suggesting a strong upward momentum.
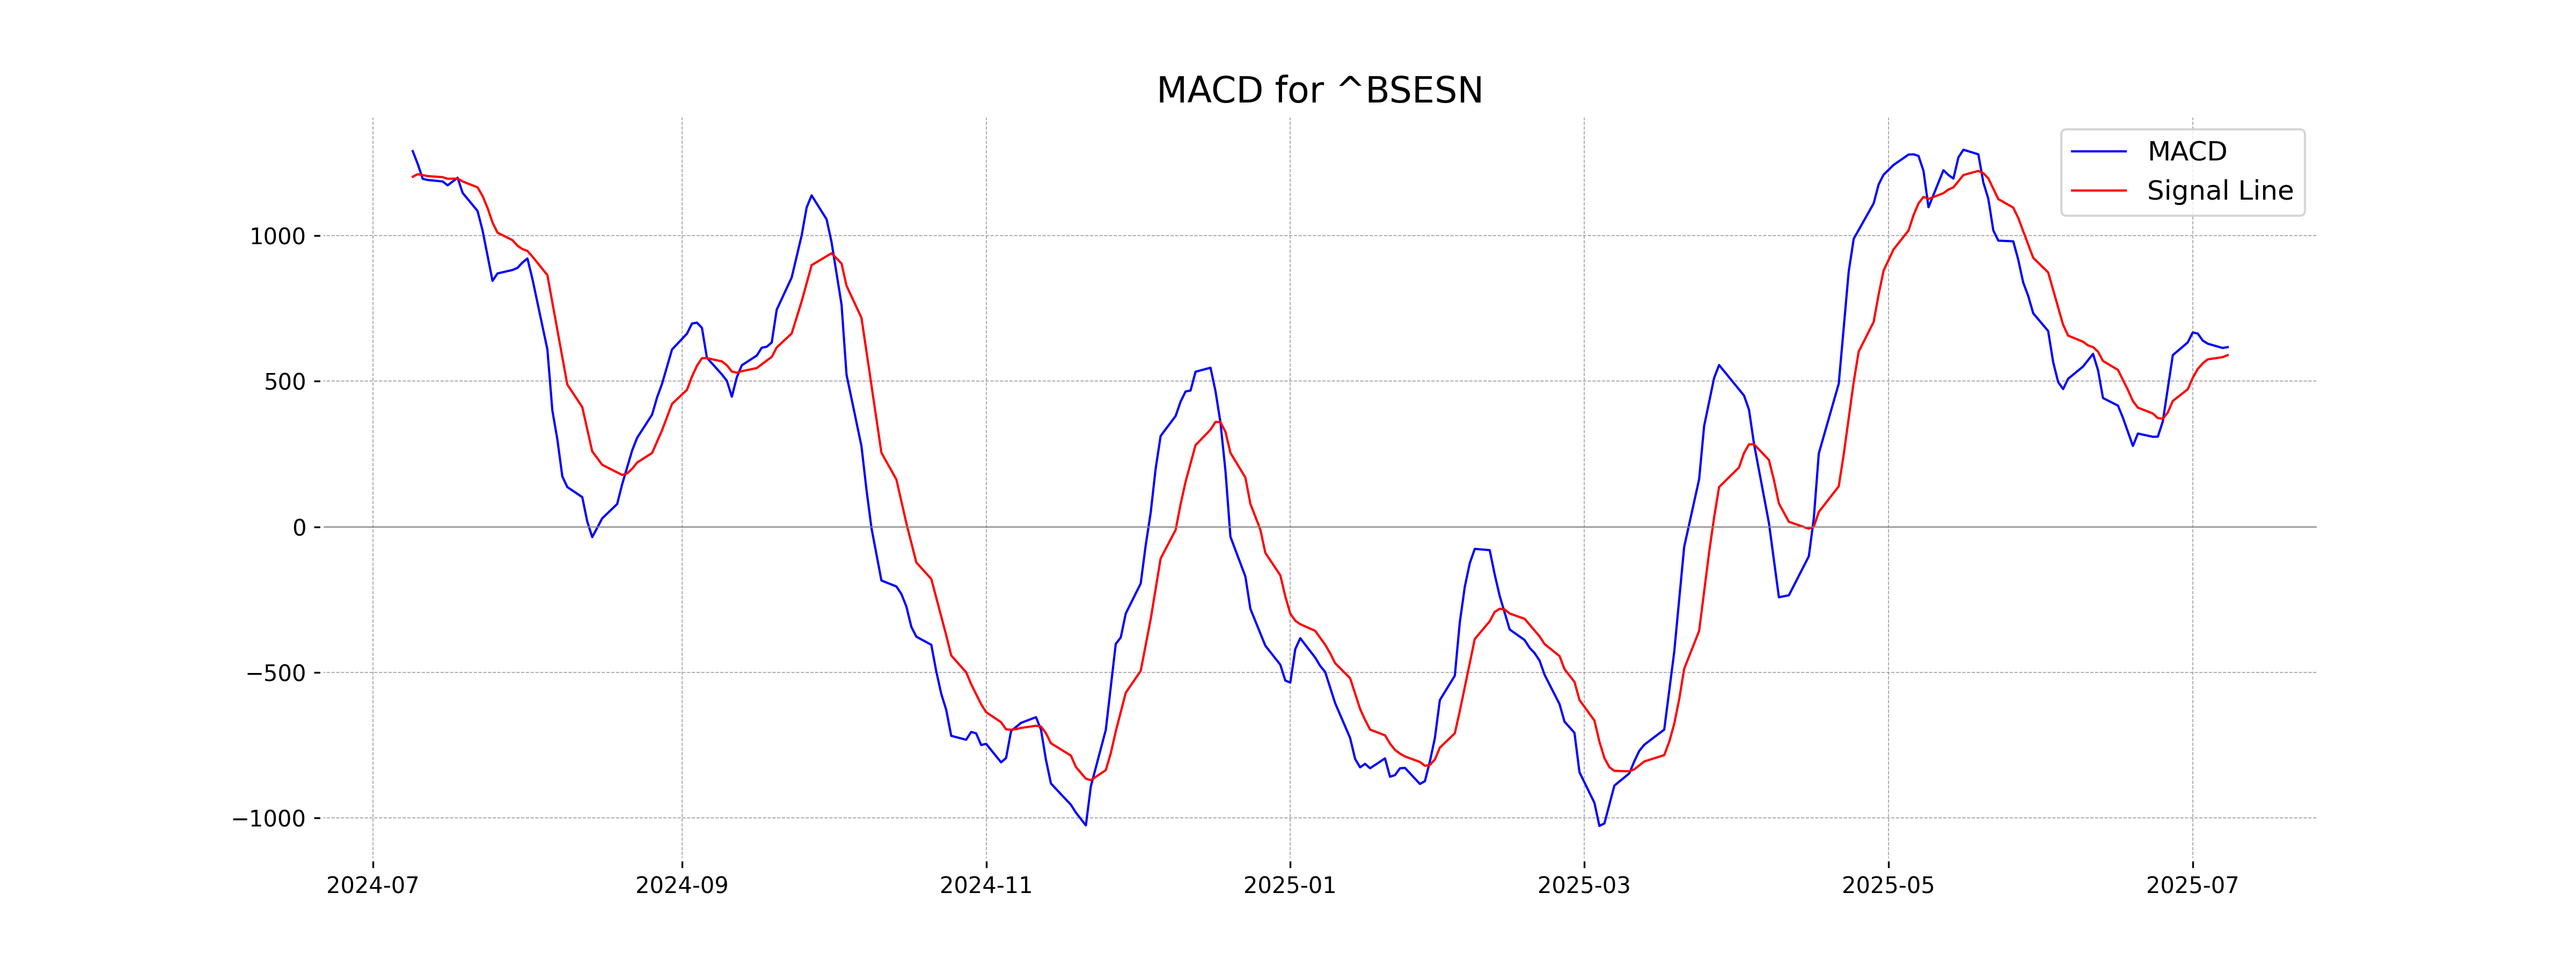
Moving Averages Trend (MACD)
The MACD for Sensex is currently at 616.92, which is above the MACD Signal line of 589.45, indicating a bullish trend. This suggests that the momentum is positive and there might be an upward price movement in the near term.
RSI Analysis
The RSI for Sensex is 61.97, indicating that the market is in a neutral to slightly overbought condition. Traders might interpret this as a sign that the index still has room to grow, but it should be monitored closely for any overbought signals.
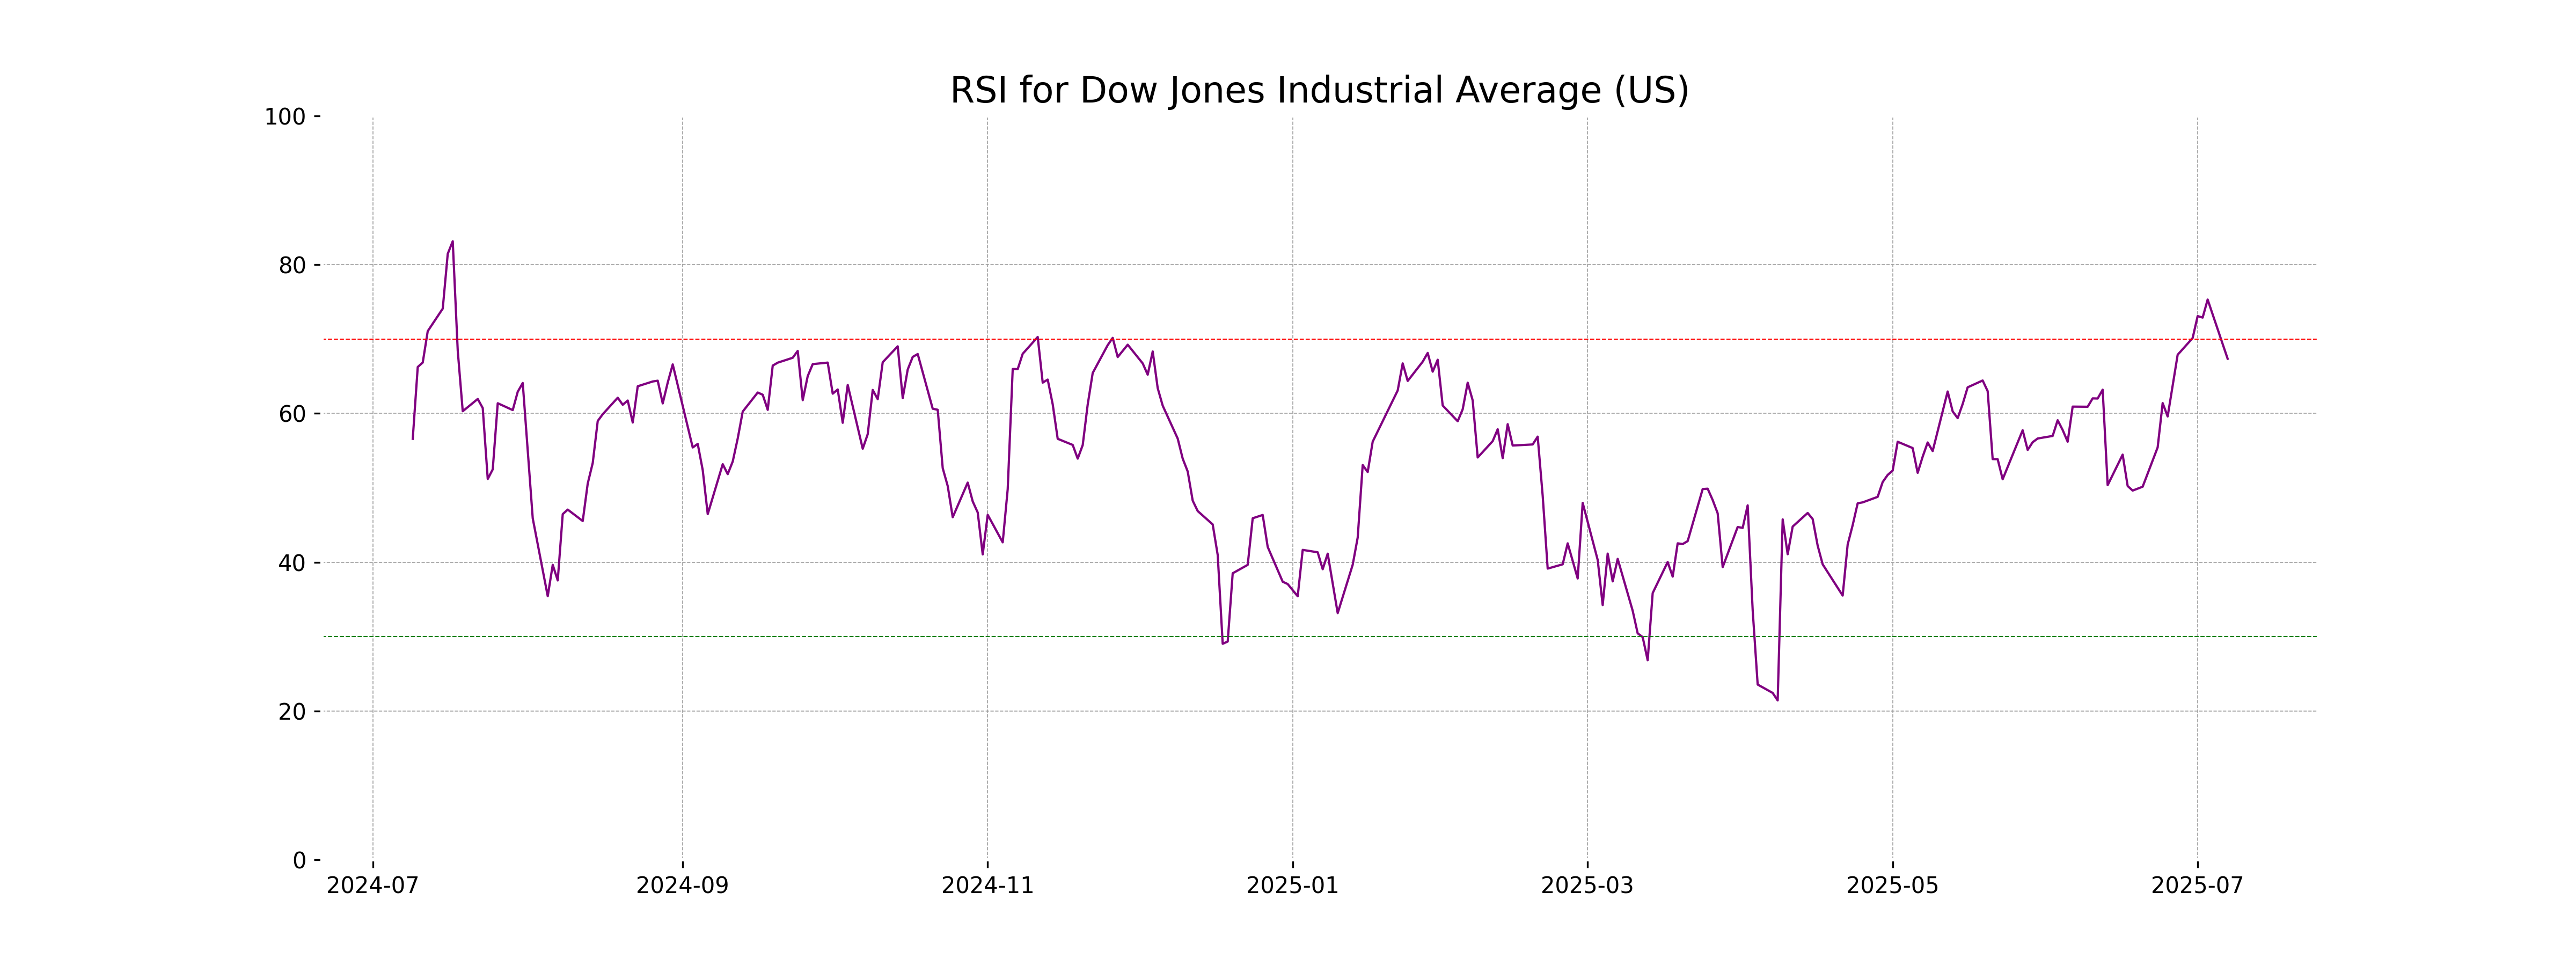
Analysis for Dow Jones Industrial Average (US) - July 08, 2025
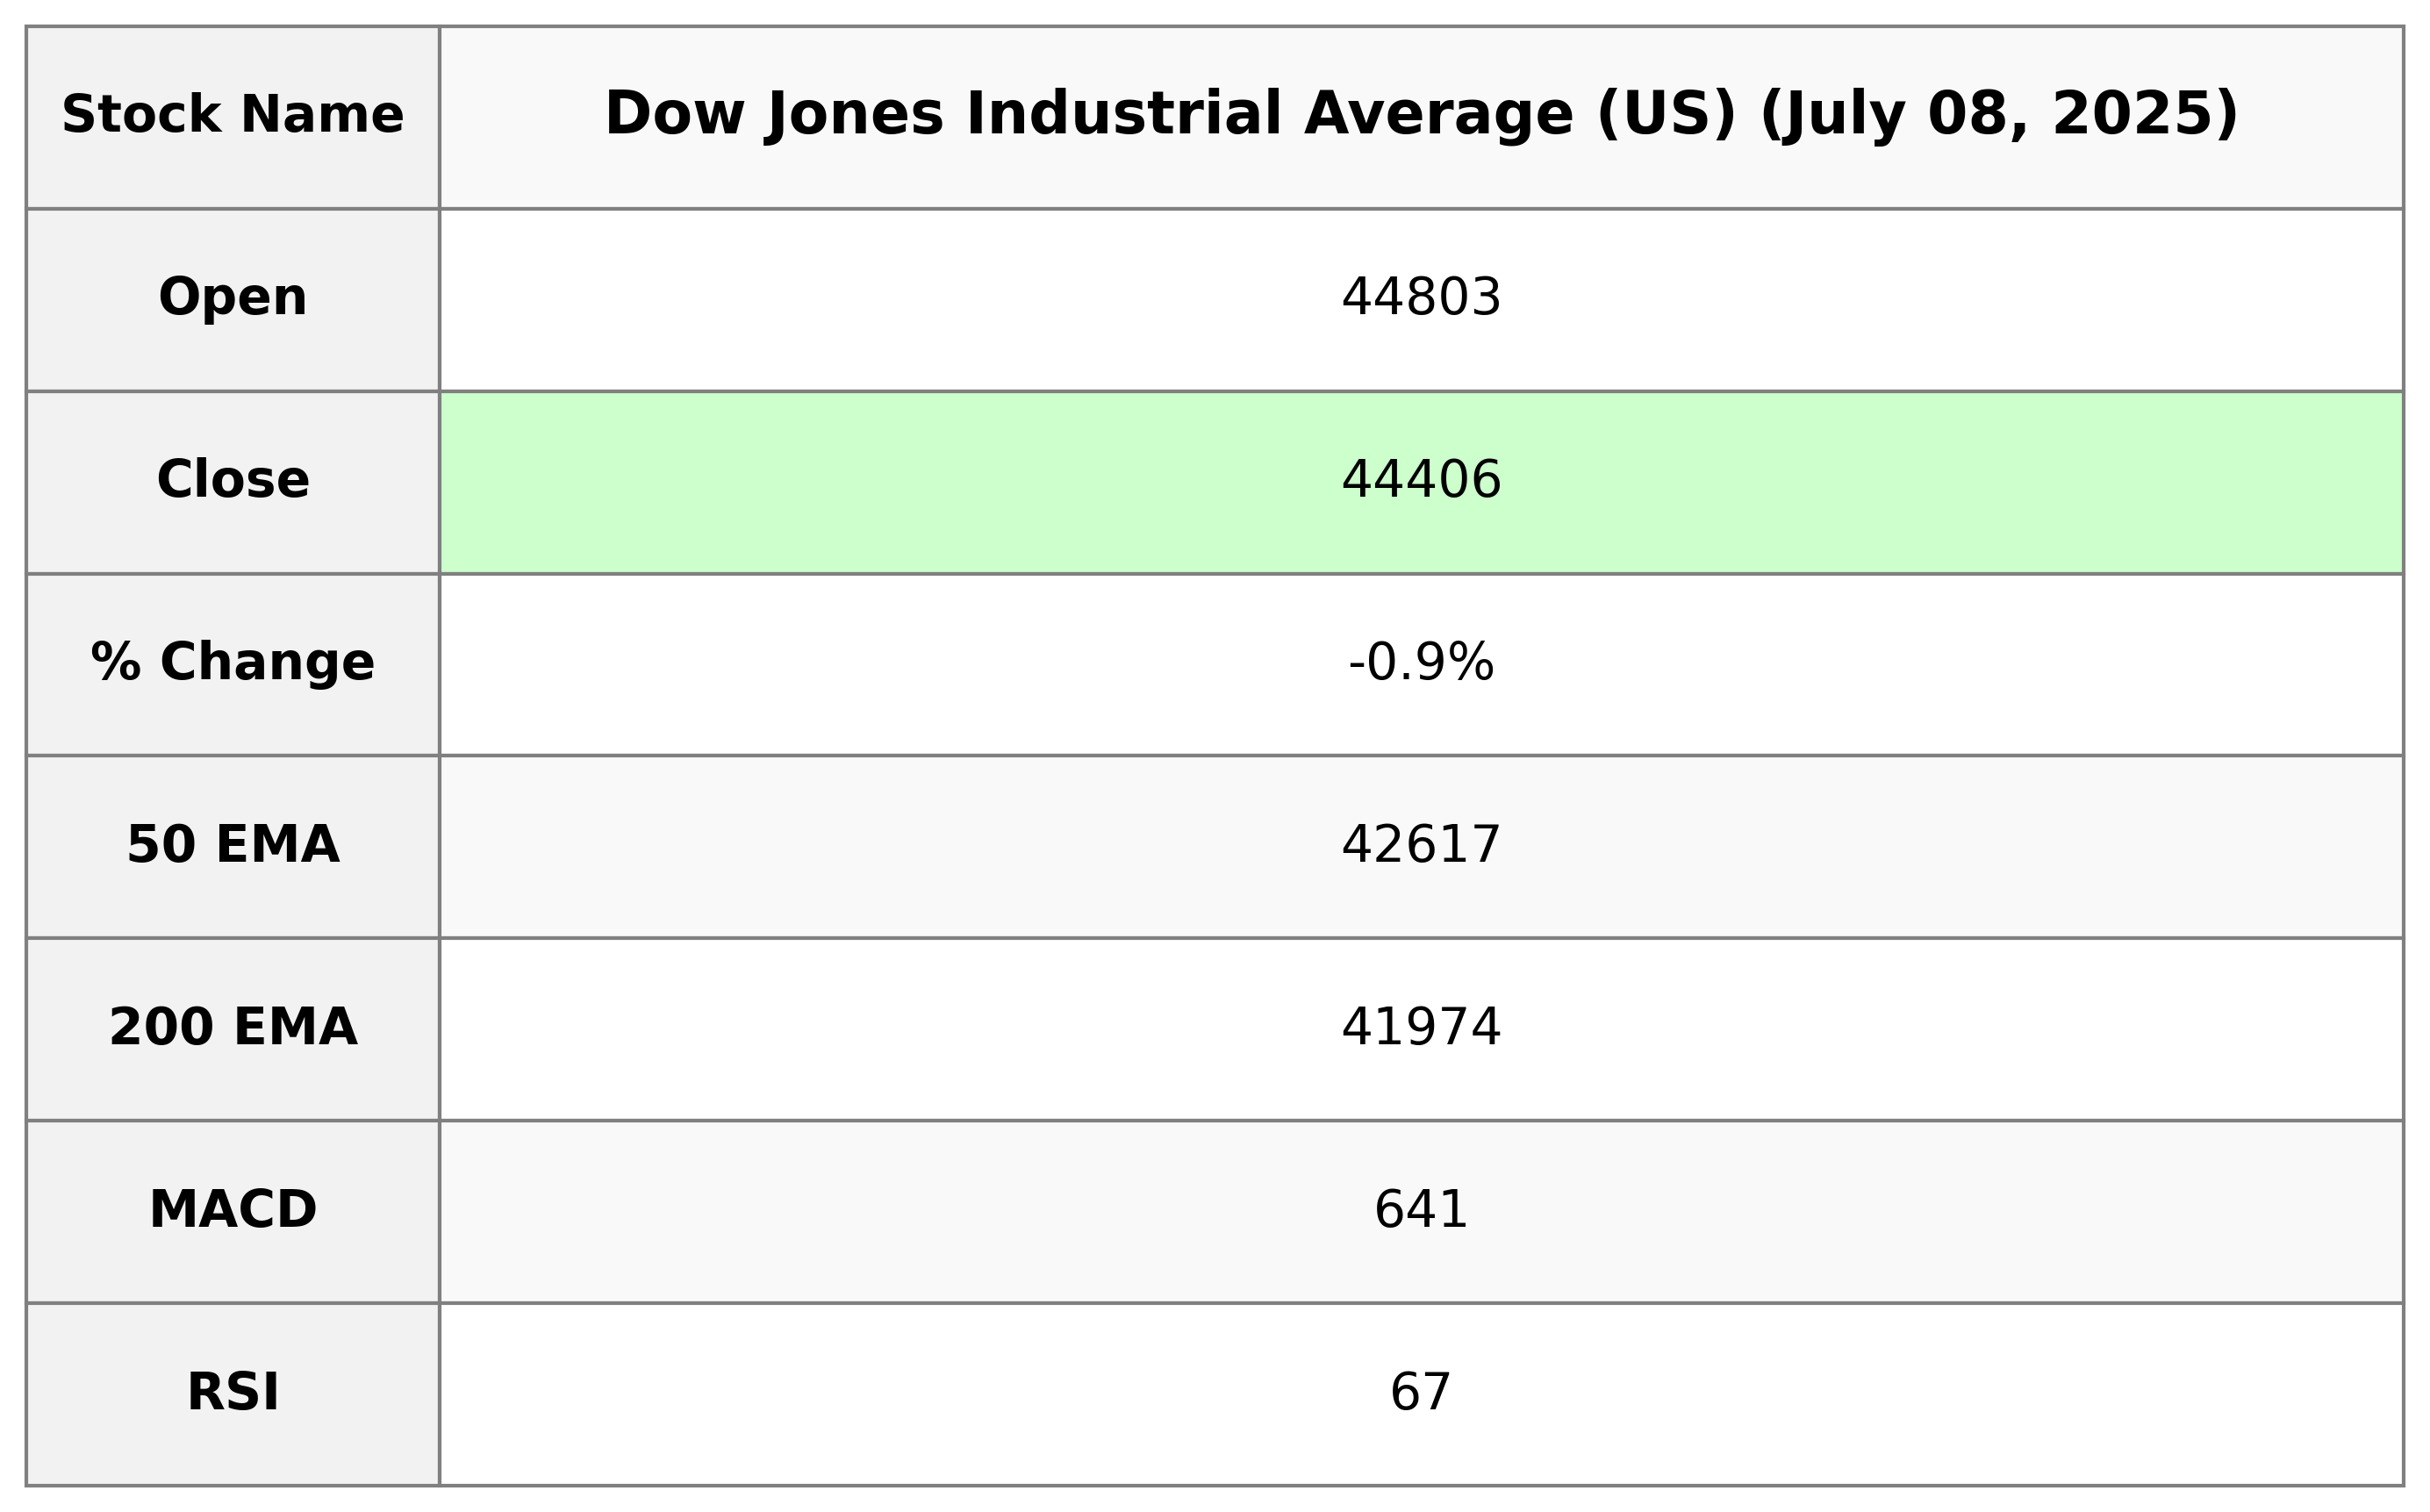
The Dow Jones Industrial Average (US) opened at 44,803.36 and closed at 44,406.36, experiencing a decrease of 422.17 points, equivalent to a -0.94% change. The RSI is at 67.35, indicating a relatively strong momentum, while the MACD value of 641.16 suggests bullish sentiment but with potential slowing momentum as it is above the MACD signal line.
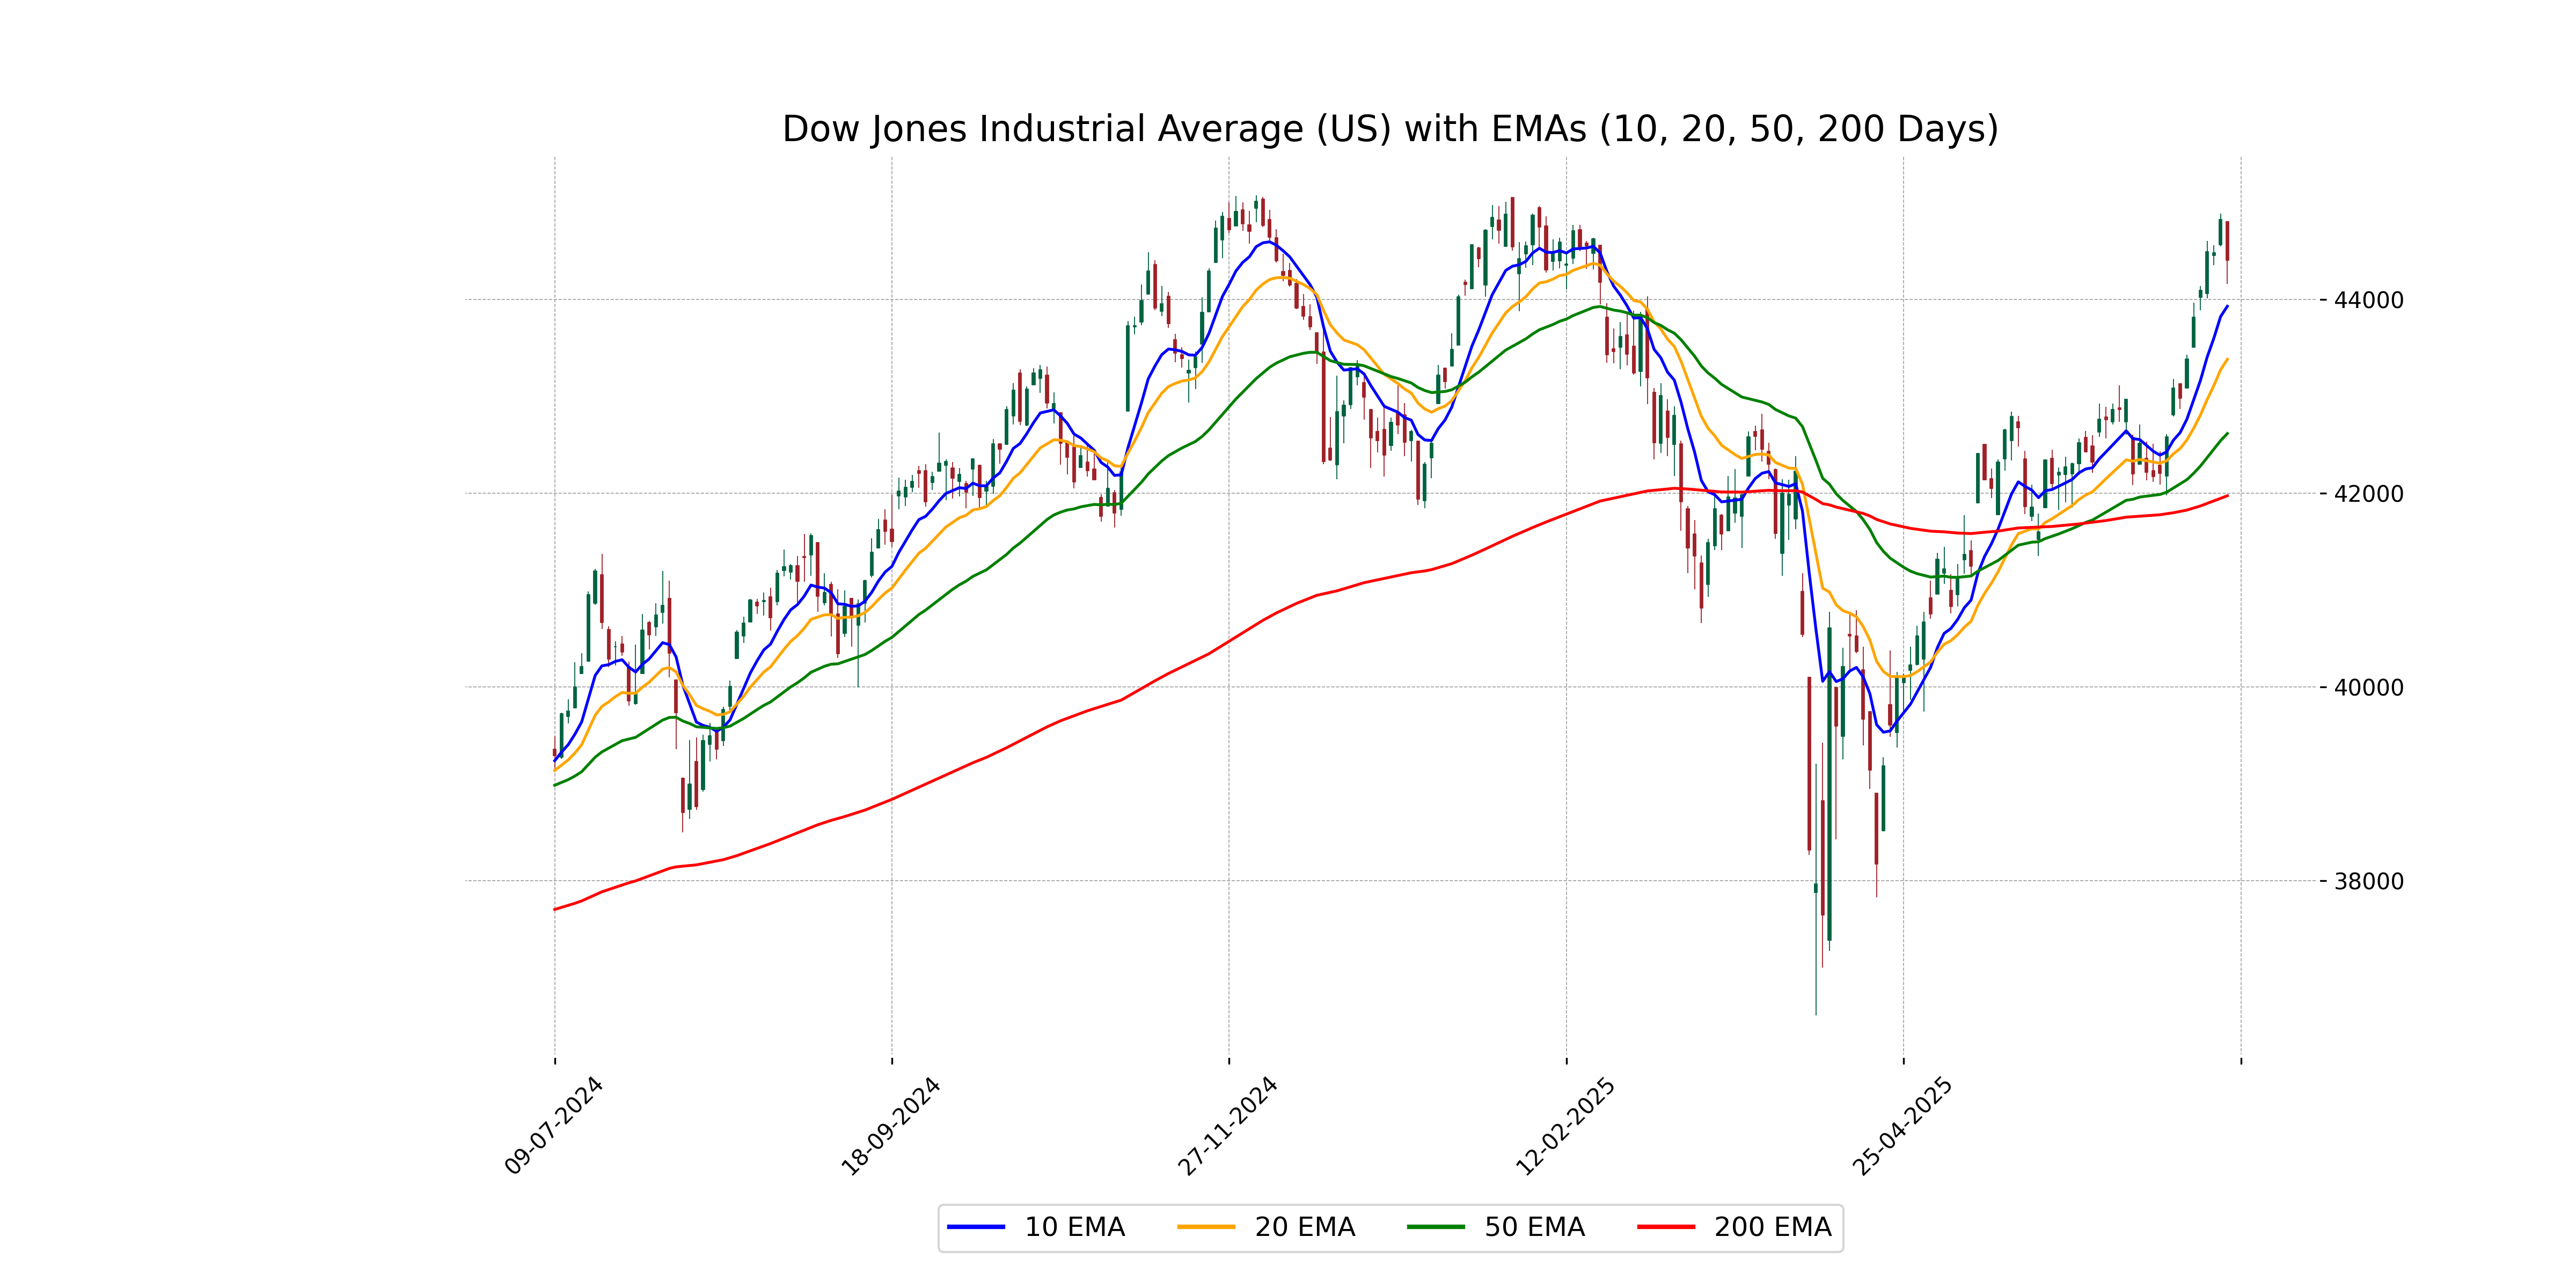
Relationship with Key Moving Averages
The Dow Jones Industrial Average is trading above its key moving averages with the current close at 44,406.36, which is above the 50 EMA (42,616.58), 200 EMA (41,974.14), 10 EMA (43,930.58), and 20 EMA (43,383.14). This suggests a bullish trend as the stock is maintaining levels higher than these averages.
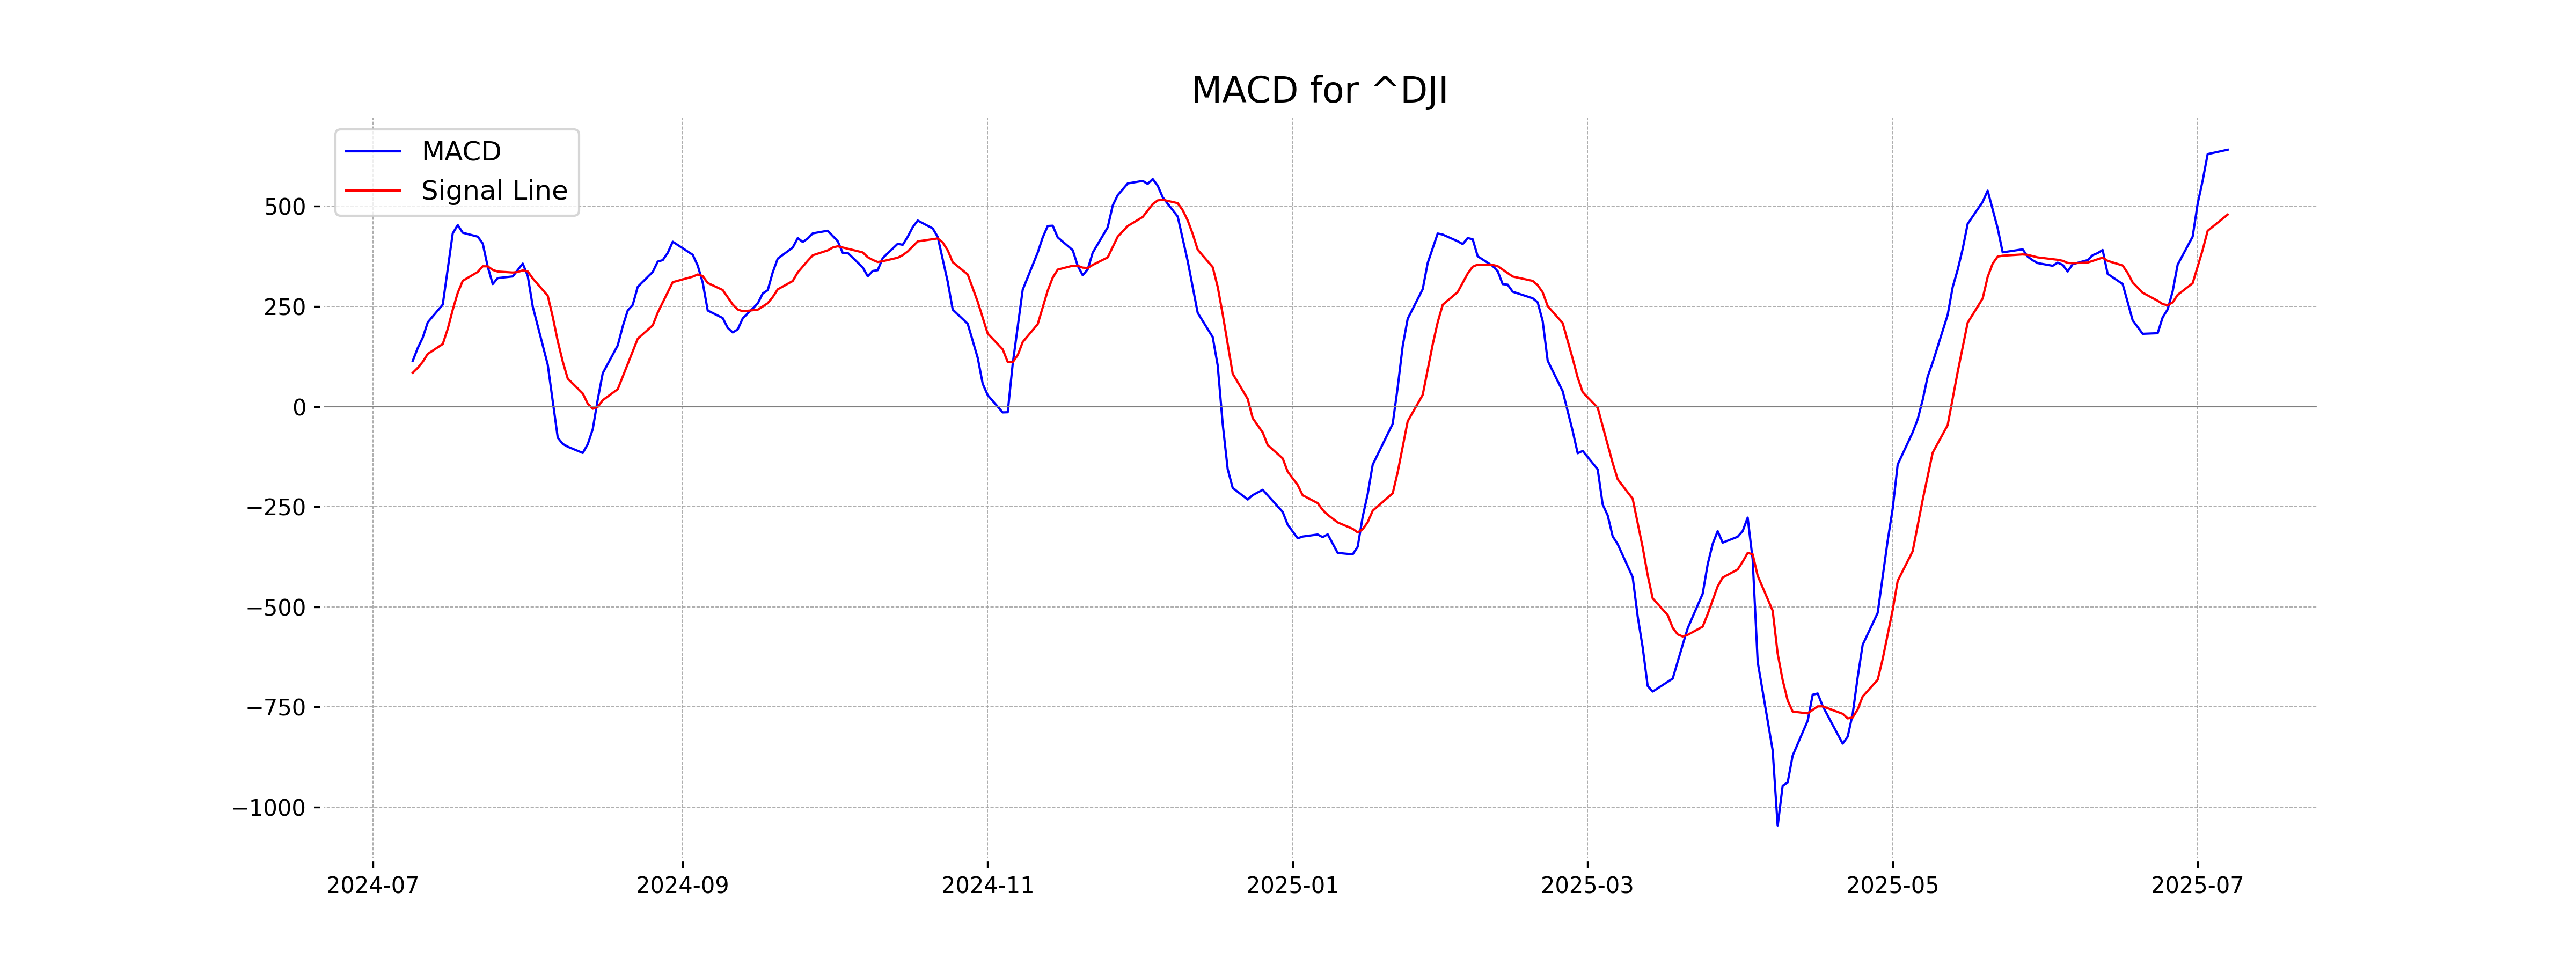
Moving Averages Trend (MACD)
The Dow Jones Industrial Average shows a MACD of 641.16, while the MACD Signal is 479.26. The positive divergence indicates bullish momentum, suggesting potential upward movement.
RSI Analysis
--- RSI Analysis for Dow Jones Industrial Average (US): The RSI value of 67.35 suggests that the Dow Jones Industrial Average is approaching the overbought territory but is not quite there yet. Investors should monitor the index closely, as a move above 70 could indicate potential overbought conditions. ---
Analysis for CAC 40 (France) - July 08, 2025
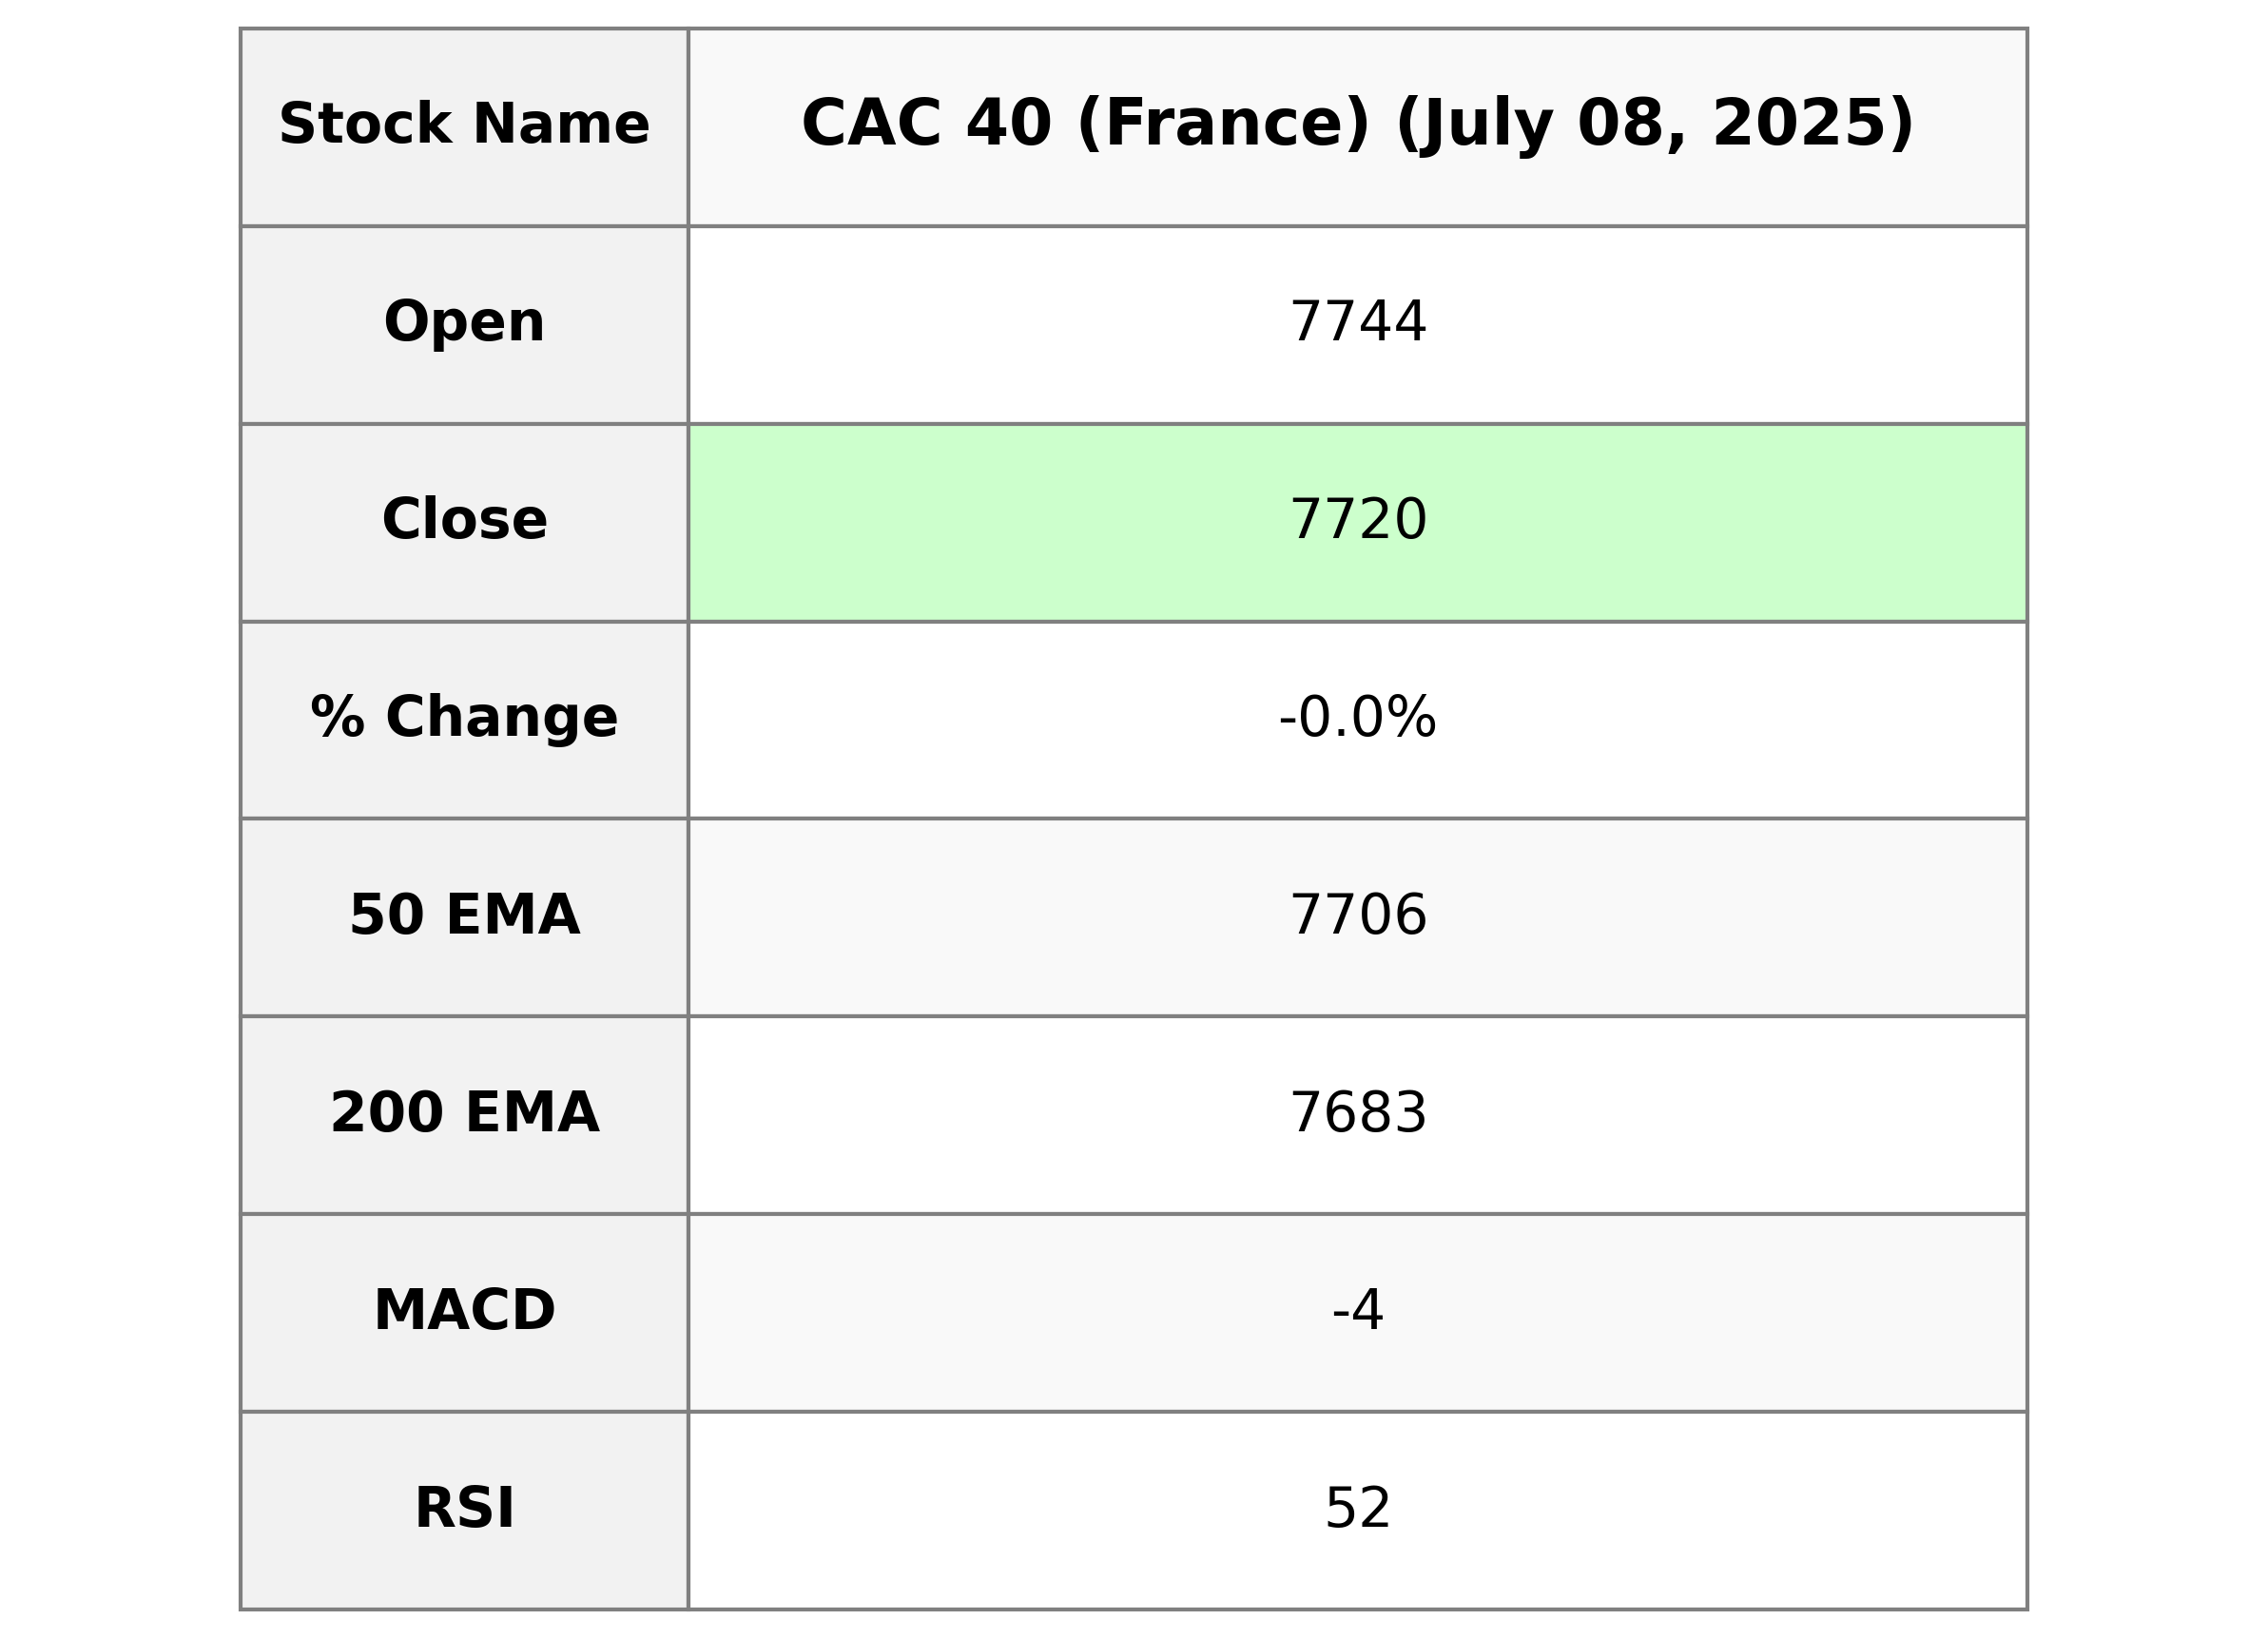
CAC 40 (France) Performance Description: The CAC 40 index closed at 7719.91, slightly down from its previous close of 7723.47, marking a small percentage decrease of -0.046%. The technical indicators show a 50-day EMA of 7705.83, a 200-day EMA of 7683.14, and an RSI of 52.22, indicating a neutral market sentiment with slight bearish tendencies as reflected in the MACD of -3.79.
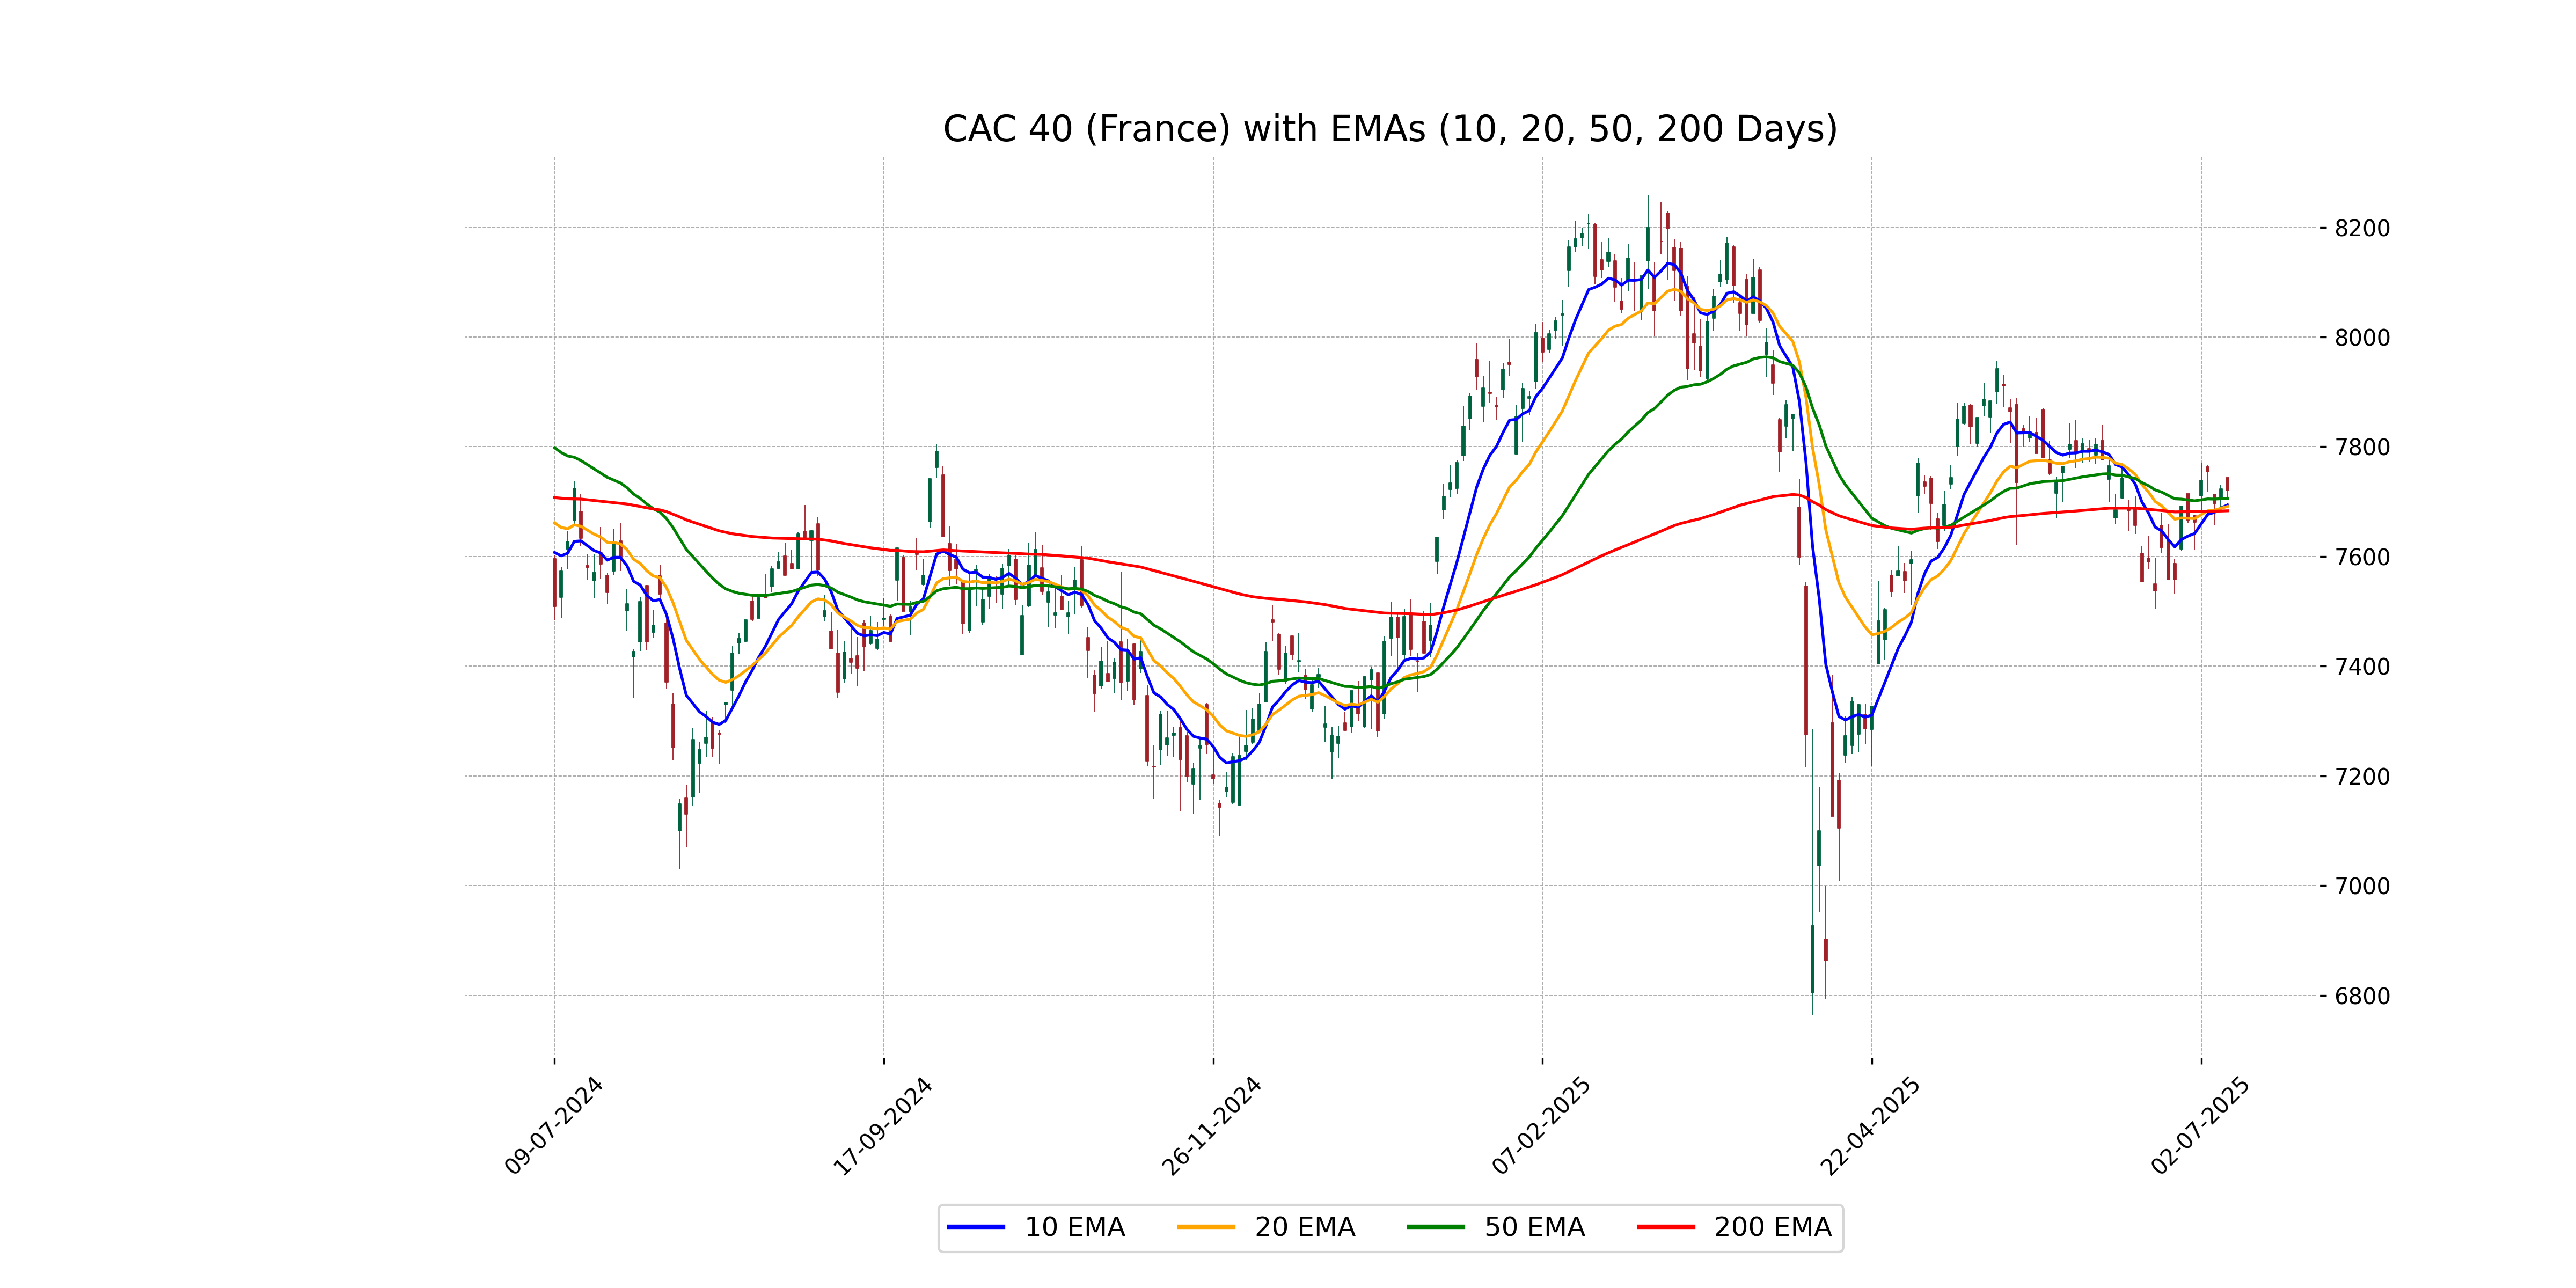
Relationship with Key Moving Averages
The CAC 40 index is currently trading at 7719.91, which is slightly above its 50-day EMA of 7705.83 and significantly above its 200-day EMA of 7683.14, indicating a potential short-term bullish sentiment. It is also above the 10-day and 20-day EMAs of 7693.89 and 7691.17, respectively, supporting a positive short-term trend.
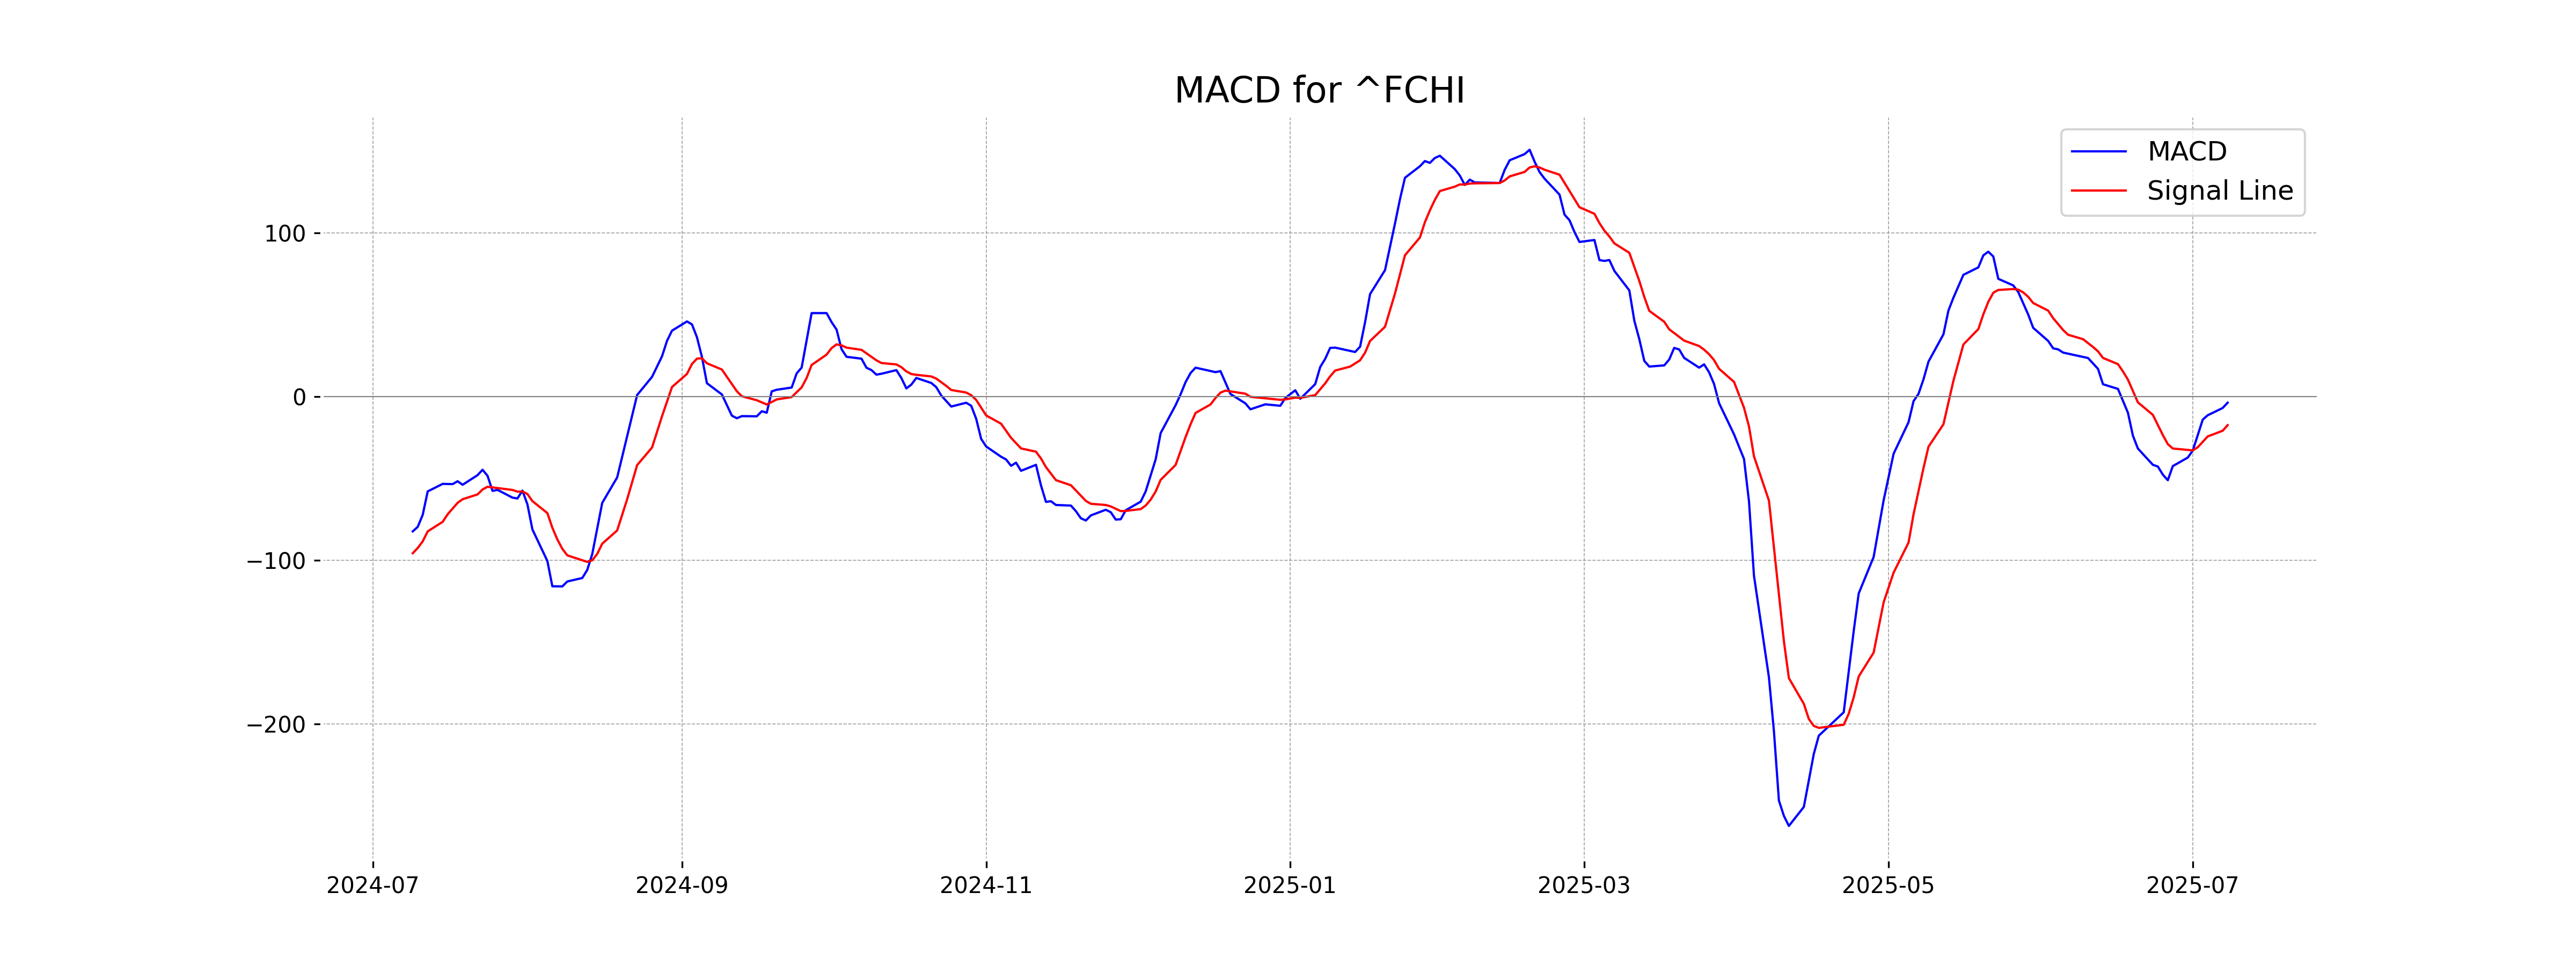
Moving Averages Trend (MACD)
MACD Analysis for CAC 40 (France): The MACD value of -3.79, being above its signal line of -17.52, suggests a potential bullish trend. This crossover may indicate a favorable momentum shift, but caution is advised as it is still below the zero line, which can limit upside potential.
RSI Analysis
The Relative Strength Index (RSI) for CAC 40 (France) is 52.22, indicating a neutral market position. This level suggests that the index is neither in overbought nor oversold territory, providing no strong signals for a bullish or bearish trend.
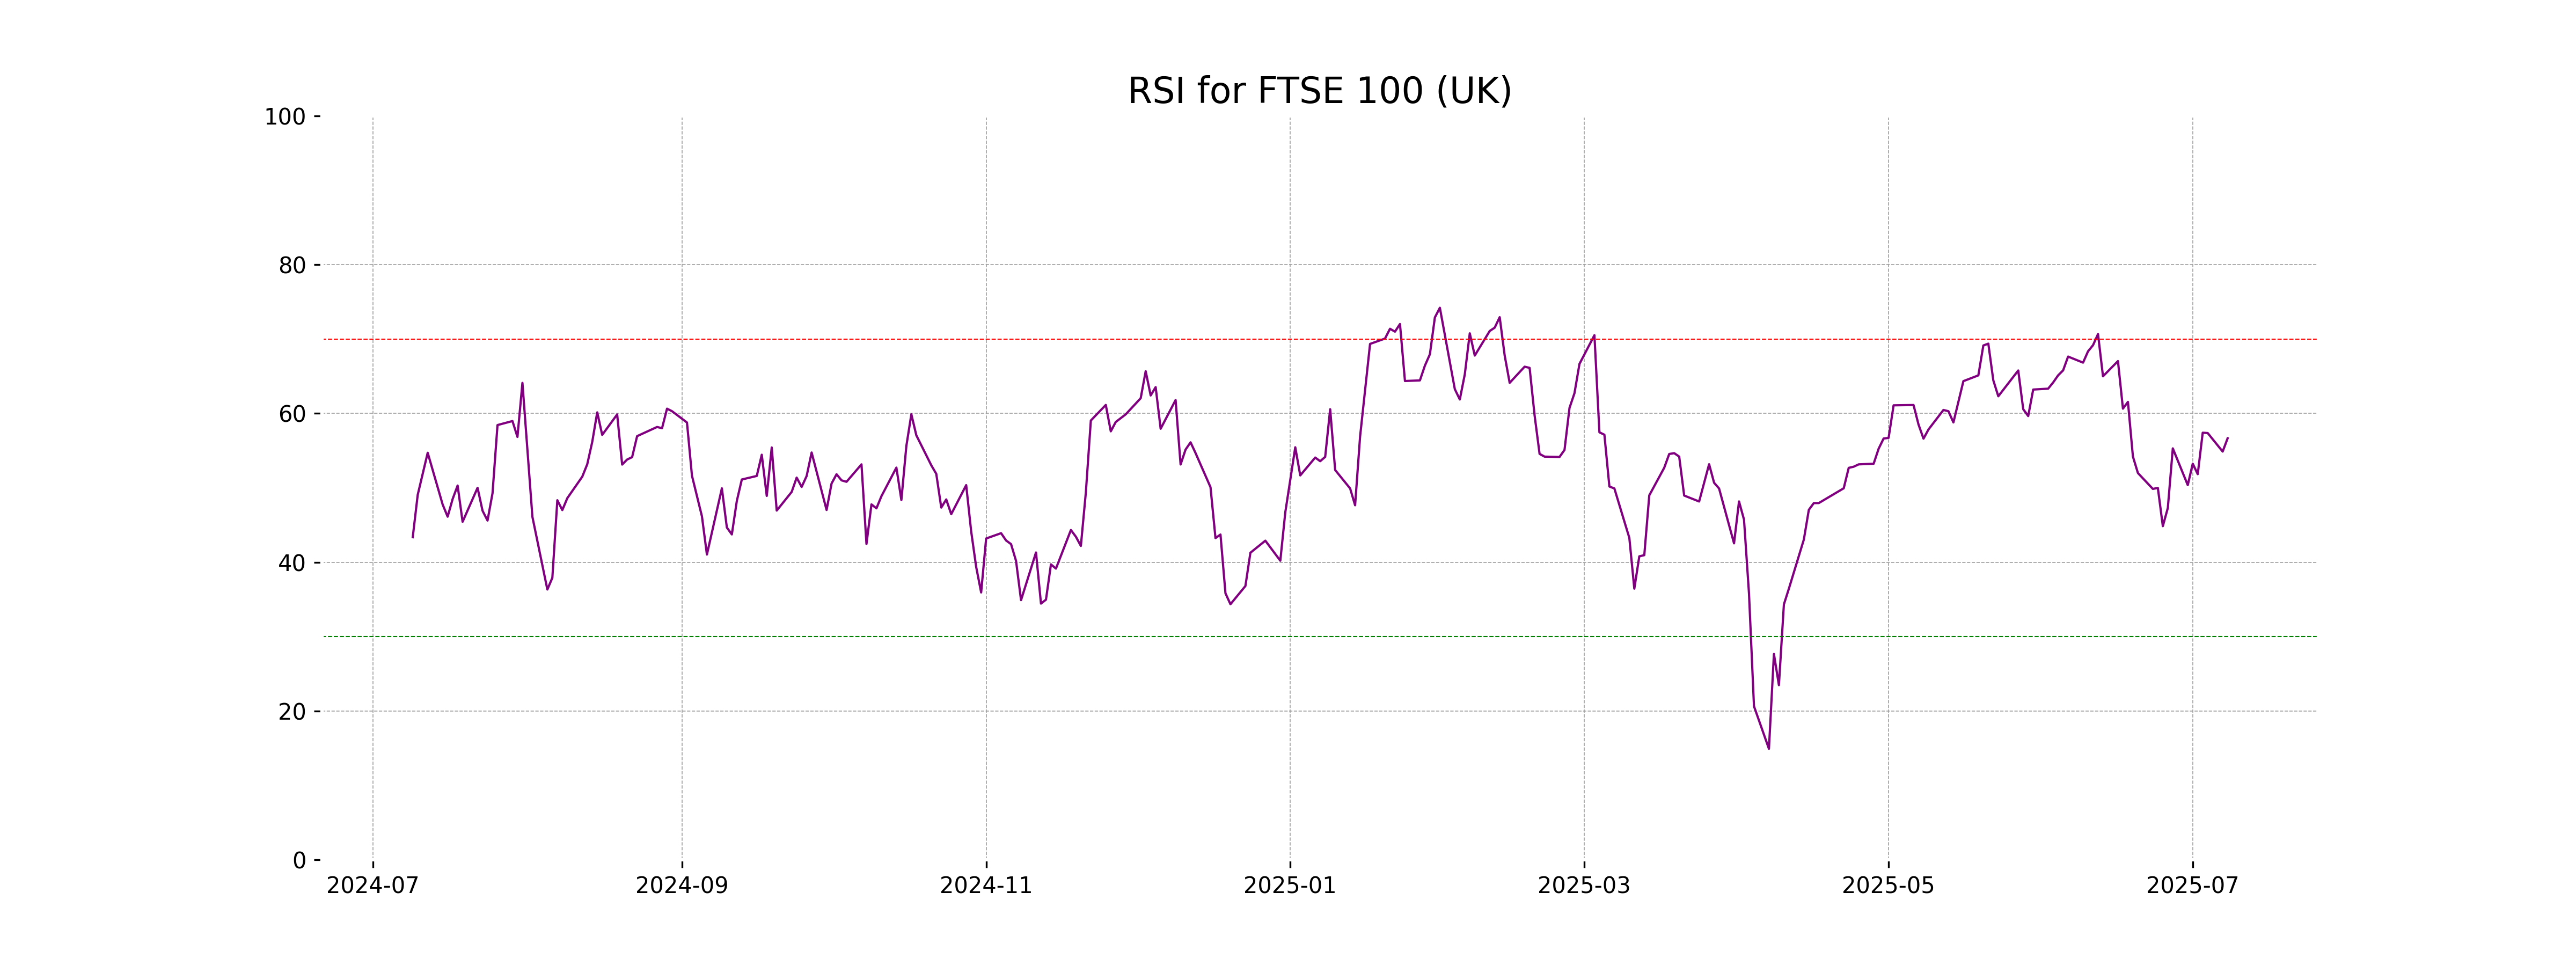
Analysis for FTSE 100 (UK) - July 08, 2025
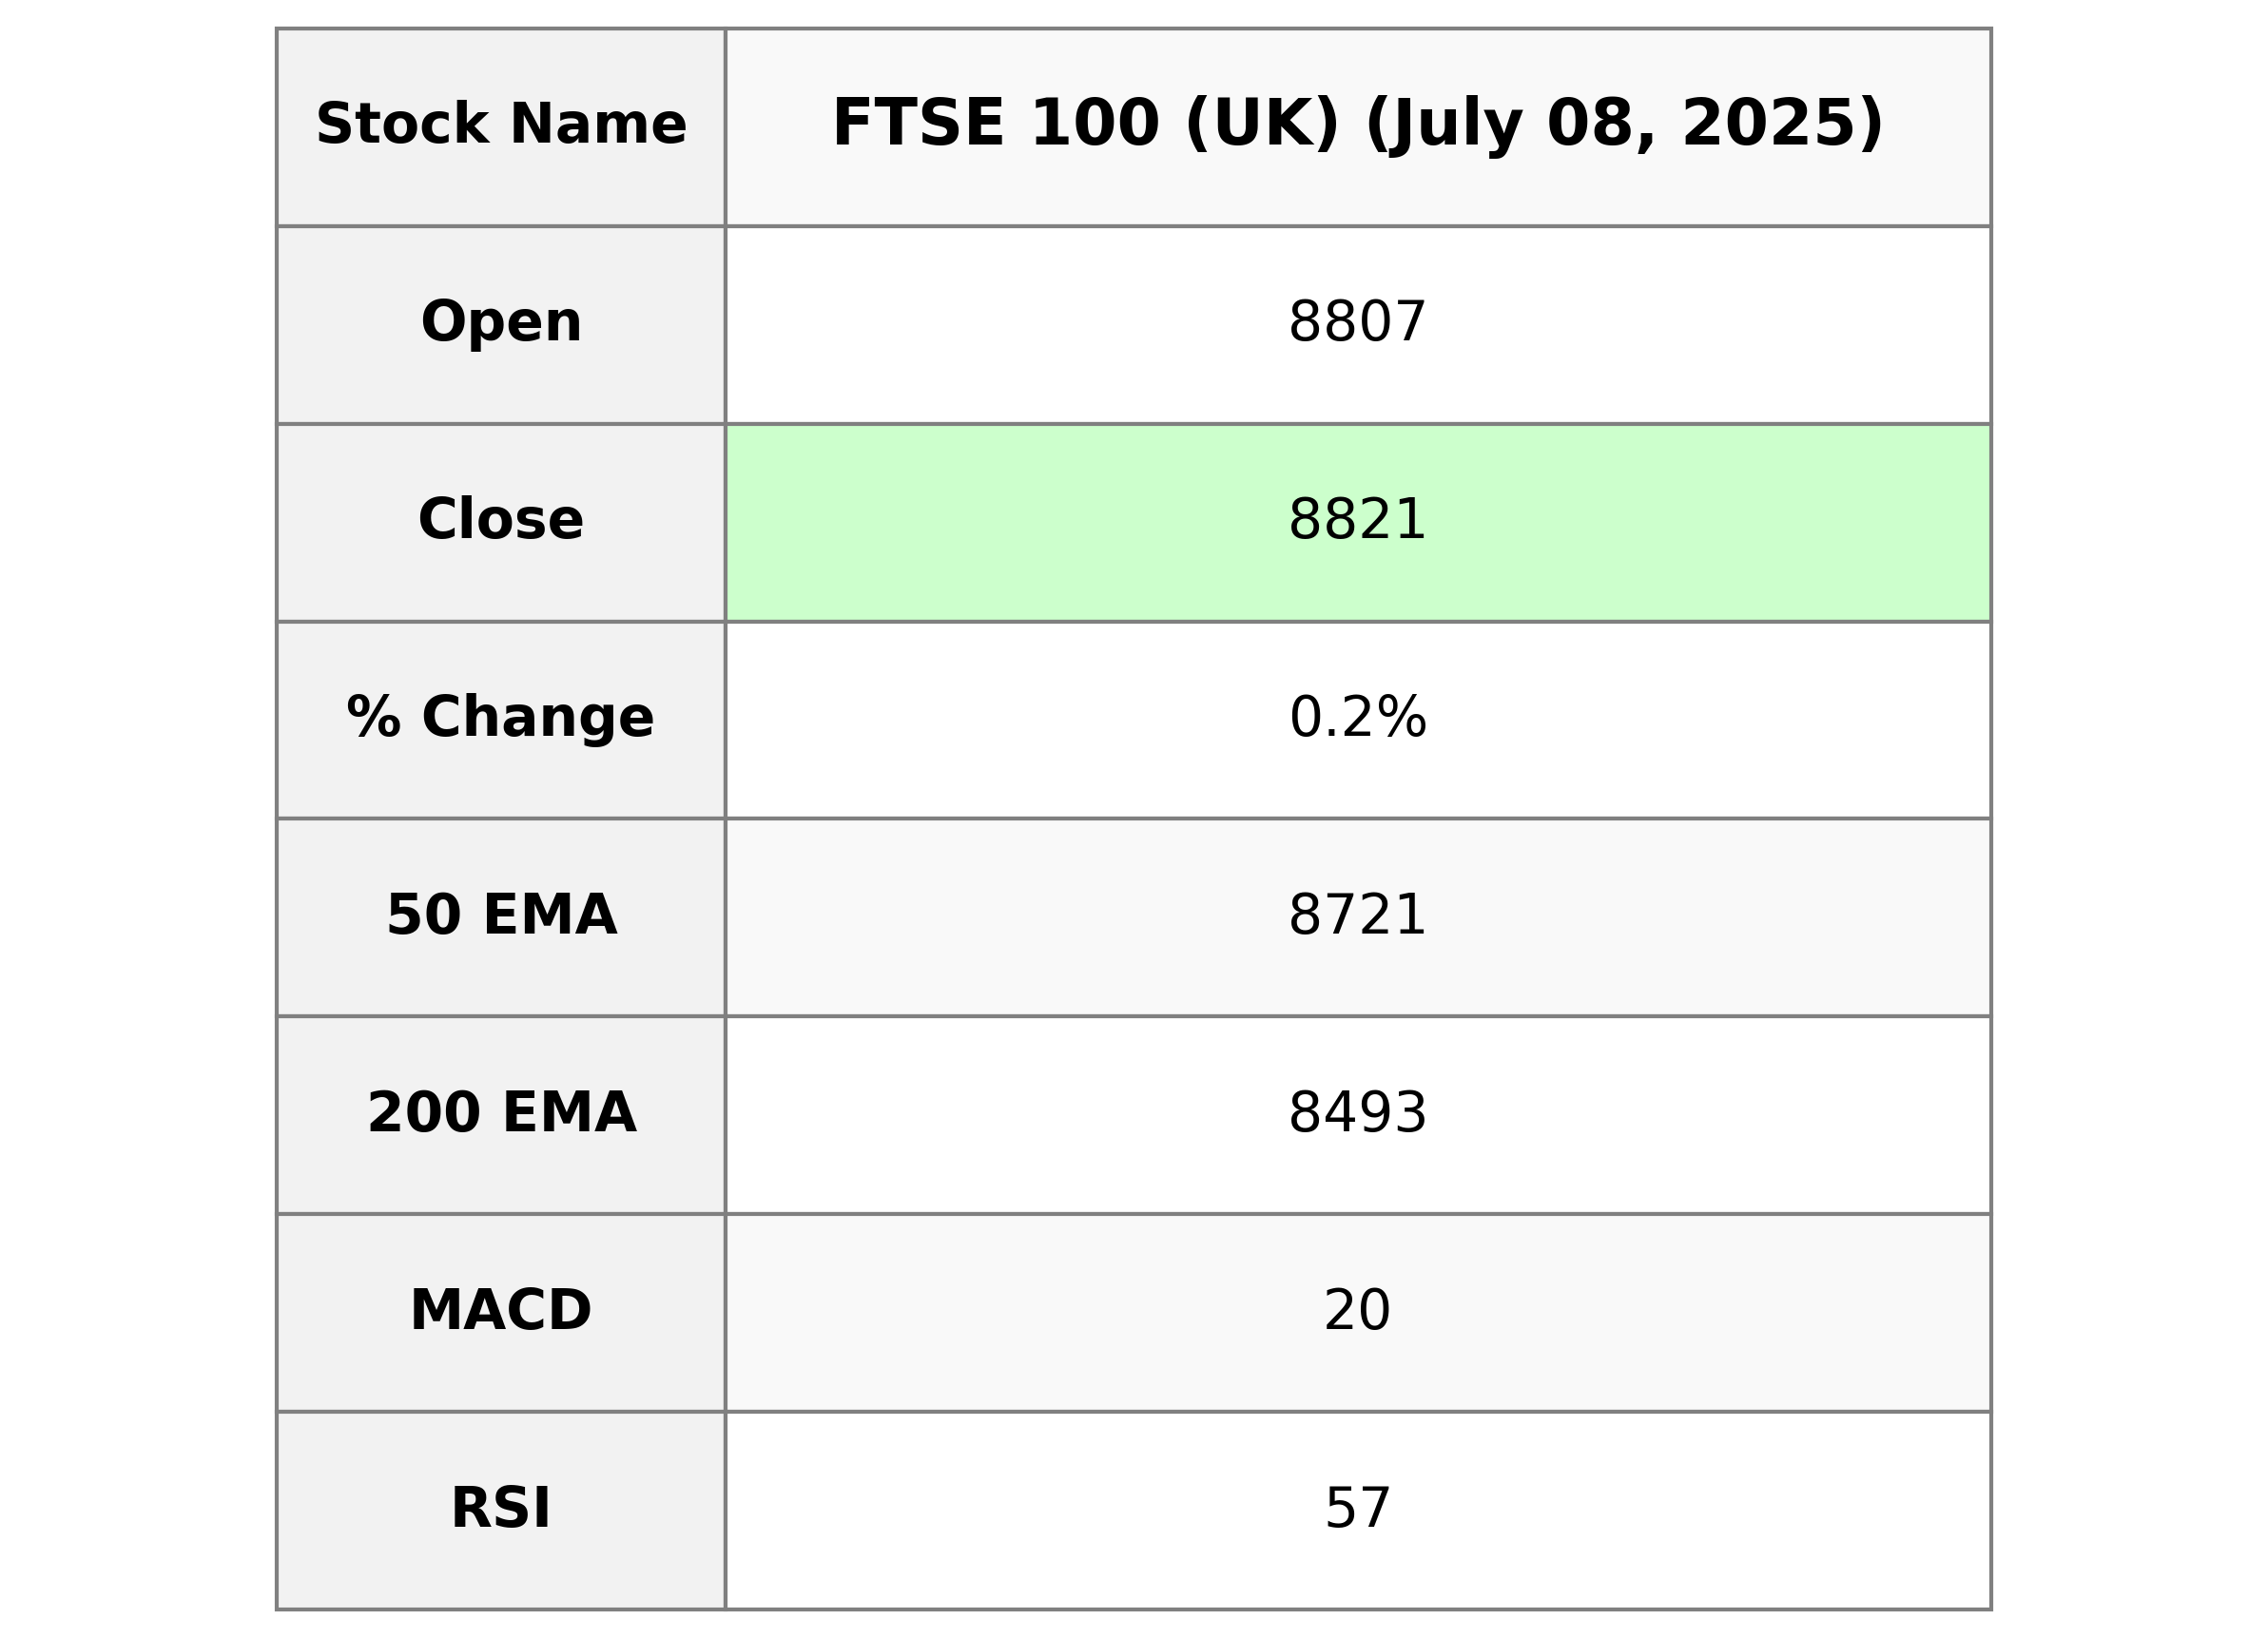
FTSE 100 (UK) opened at 8806.53, with a high of 8824.31 and closed at 8821.00, showing a slight daily increase of 0.16% or 14.5 points from the previous close. The Relative Strength Index (RSI) stands at 56.67, indicating neutral momentum while the MACD is below the signal line, suggesting less bullish sentiment in the short term.
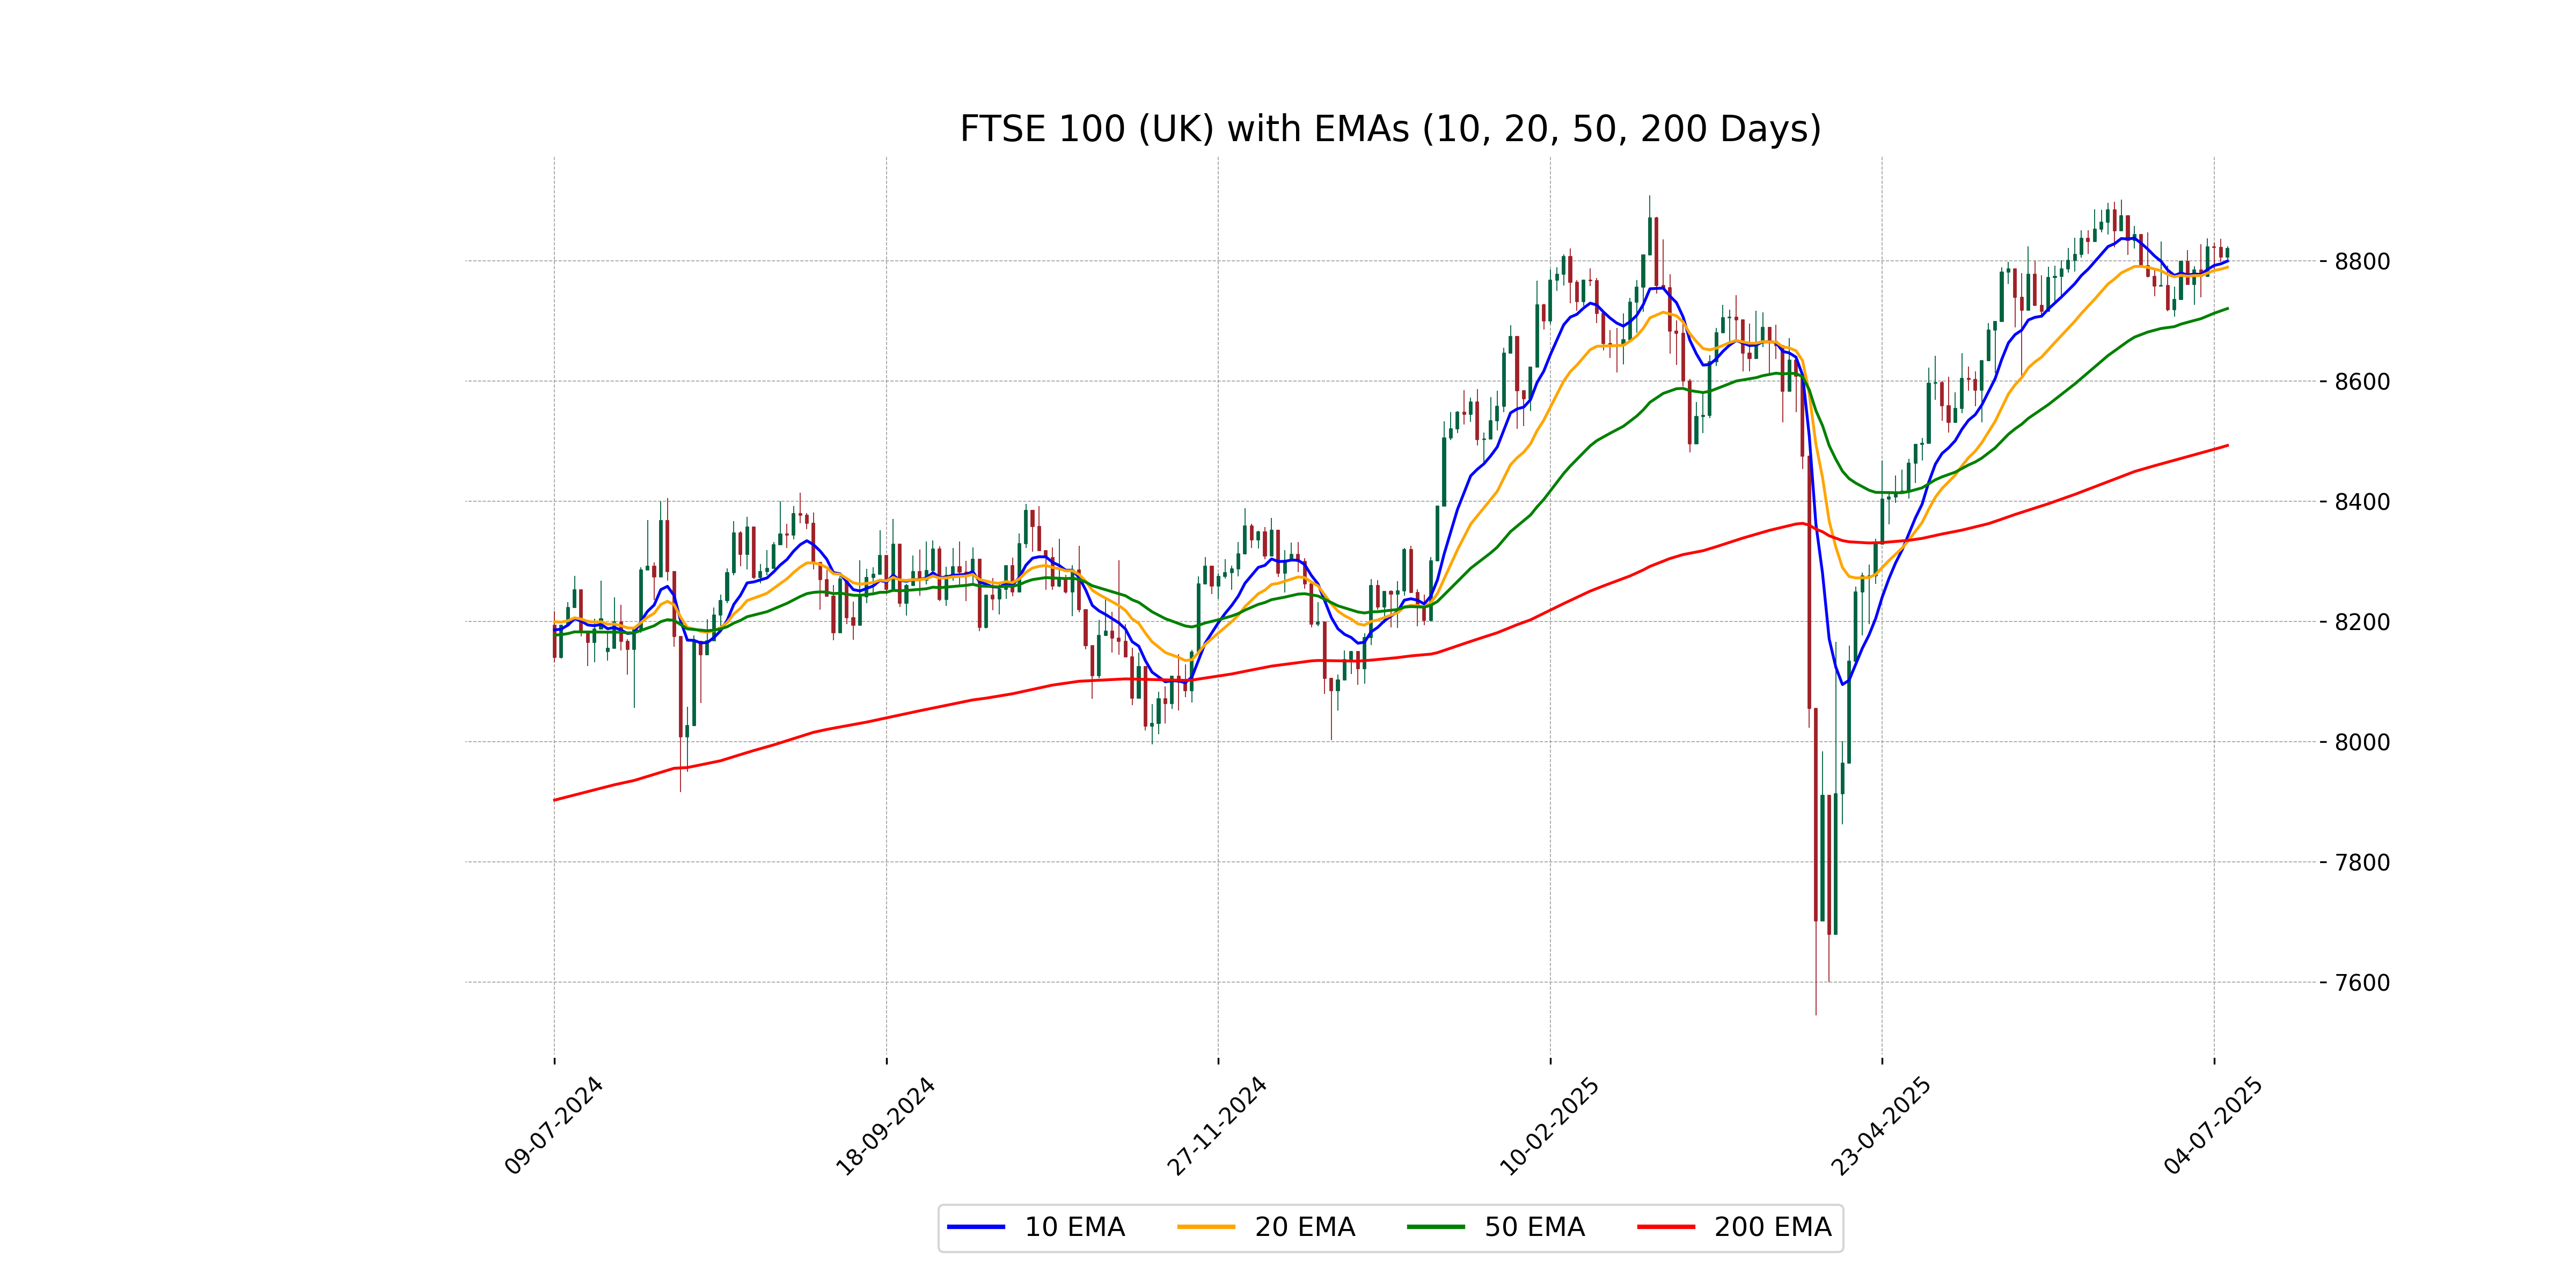
Relationship with Key Moving Averages
FTSE 100 closed at 8821.0, above its 10 EMA of 8799.80 and 20 EMA of 8789.56, indicating short-term upward momentum. It also surpassed its 50 EMA of 8720.74, suggesting a bullish trend in the medium term.
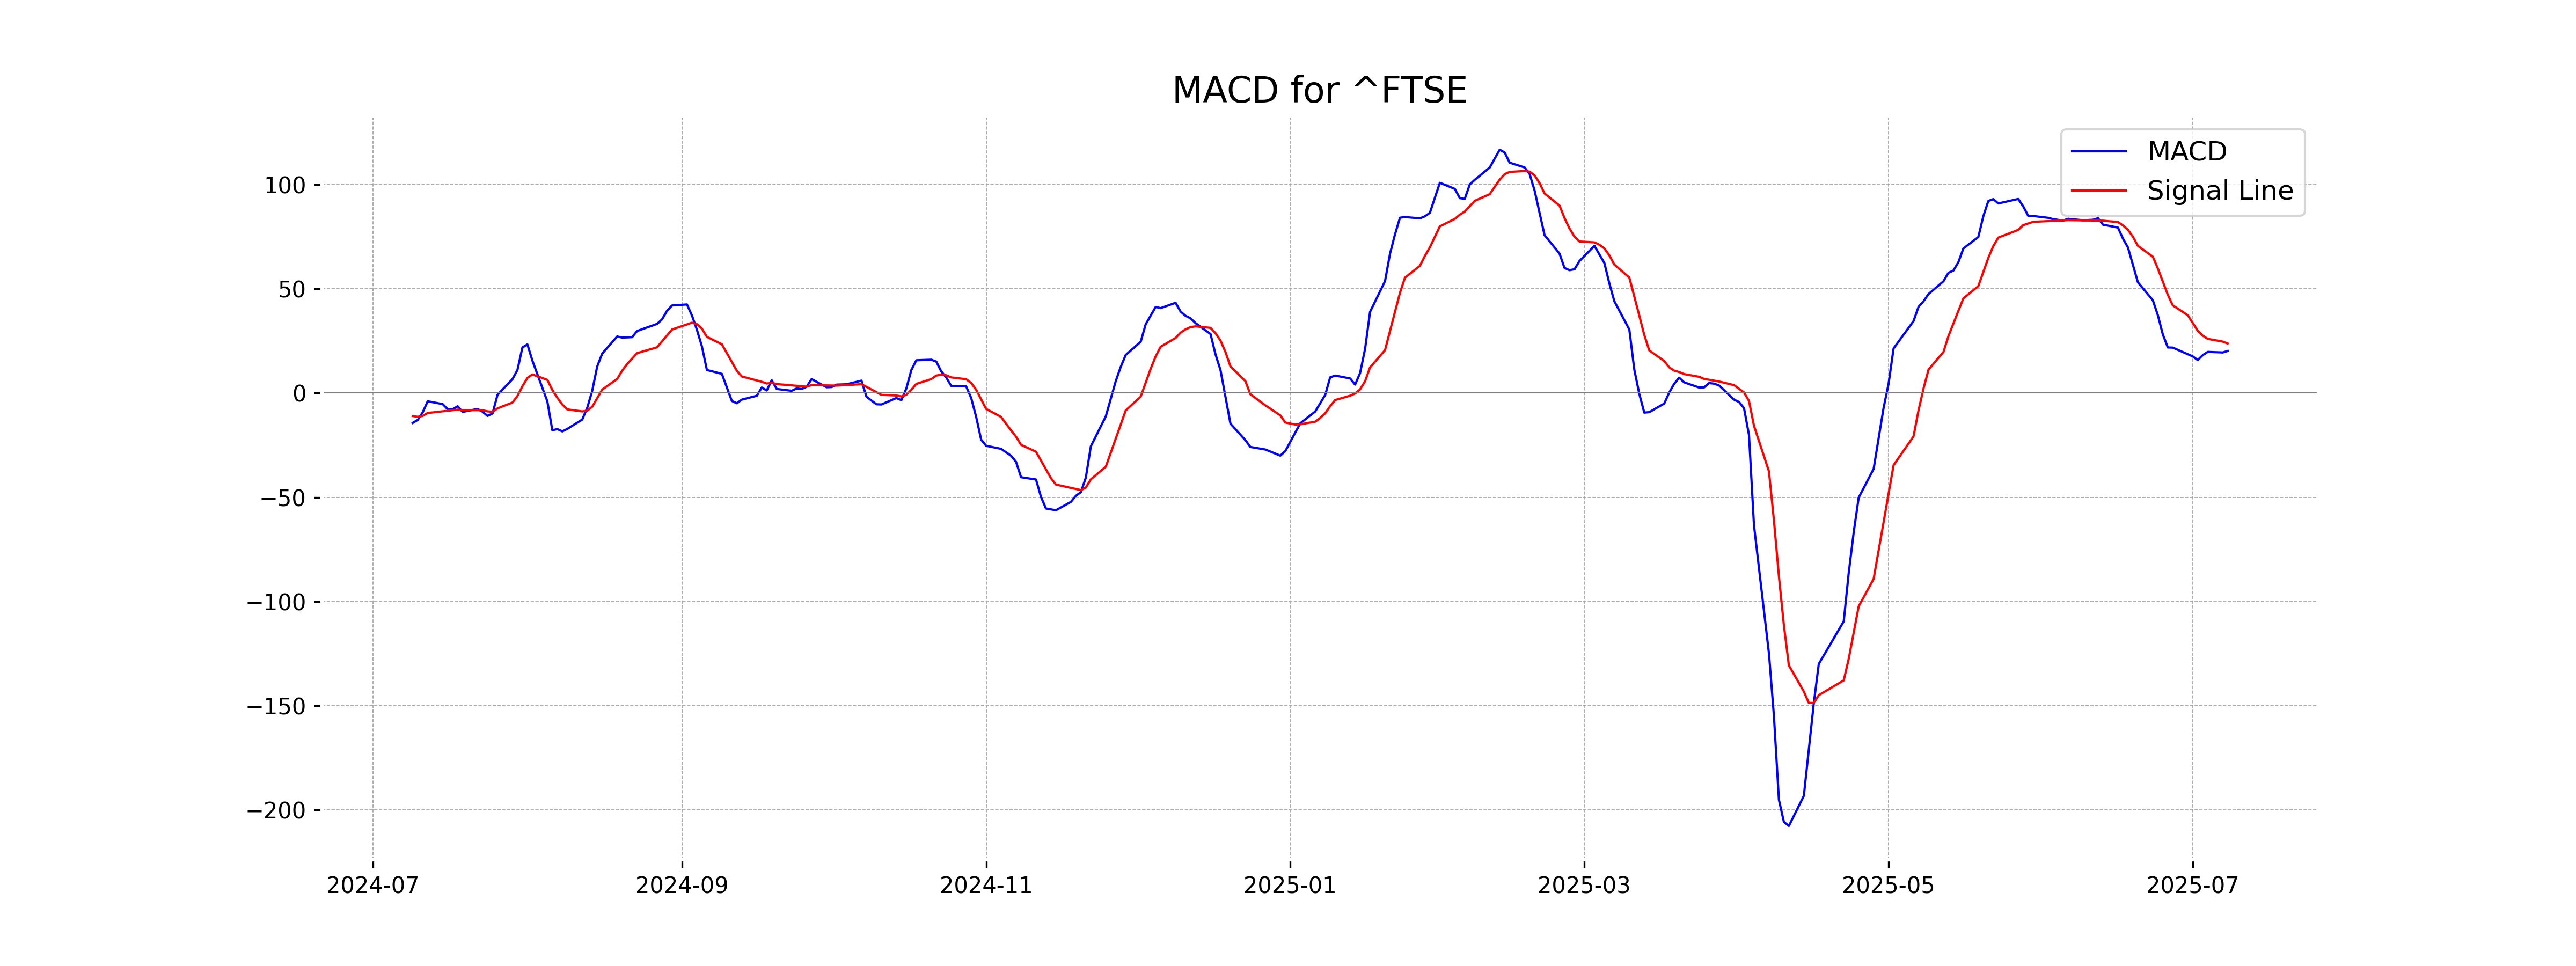
Moving Averages Trend (MACD)
The MACD for FTSE 100 (UK) is 20.18 while the MACD Signal is 23.78. This indicates a bearish signal as the MACD is below the Signal line, suggesting the possibility of downward momentum.
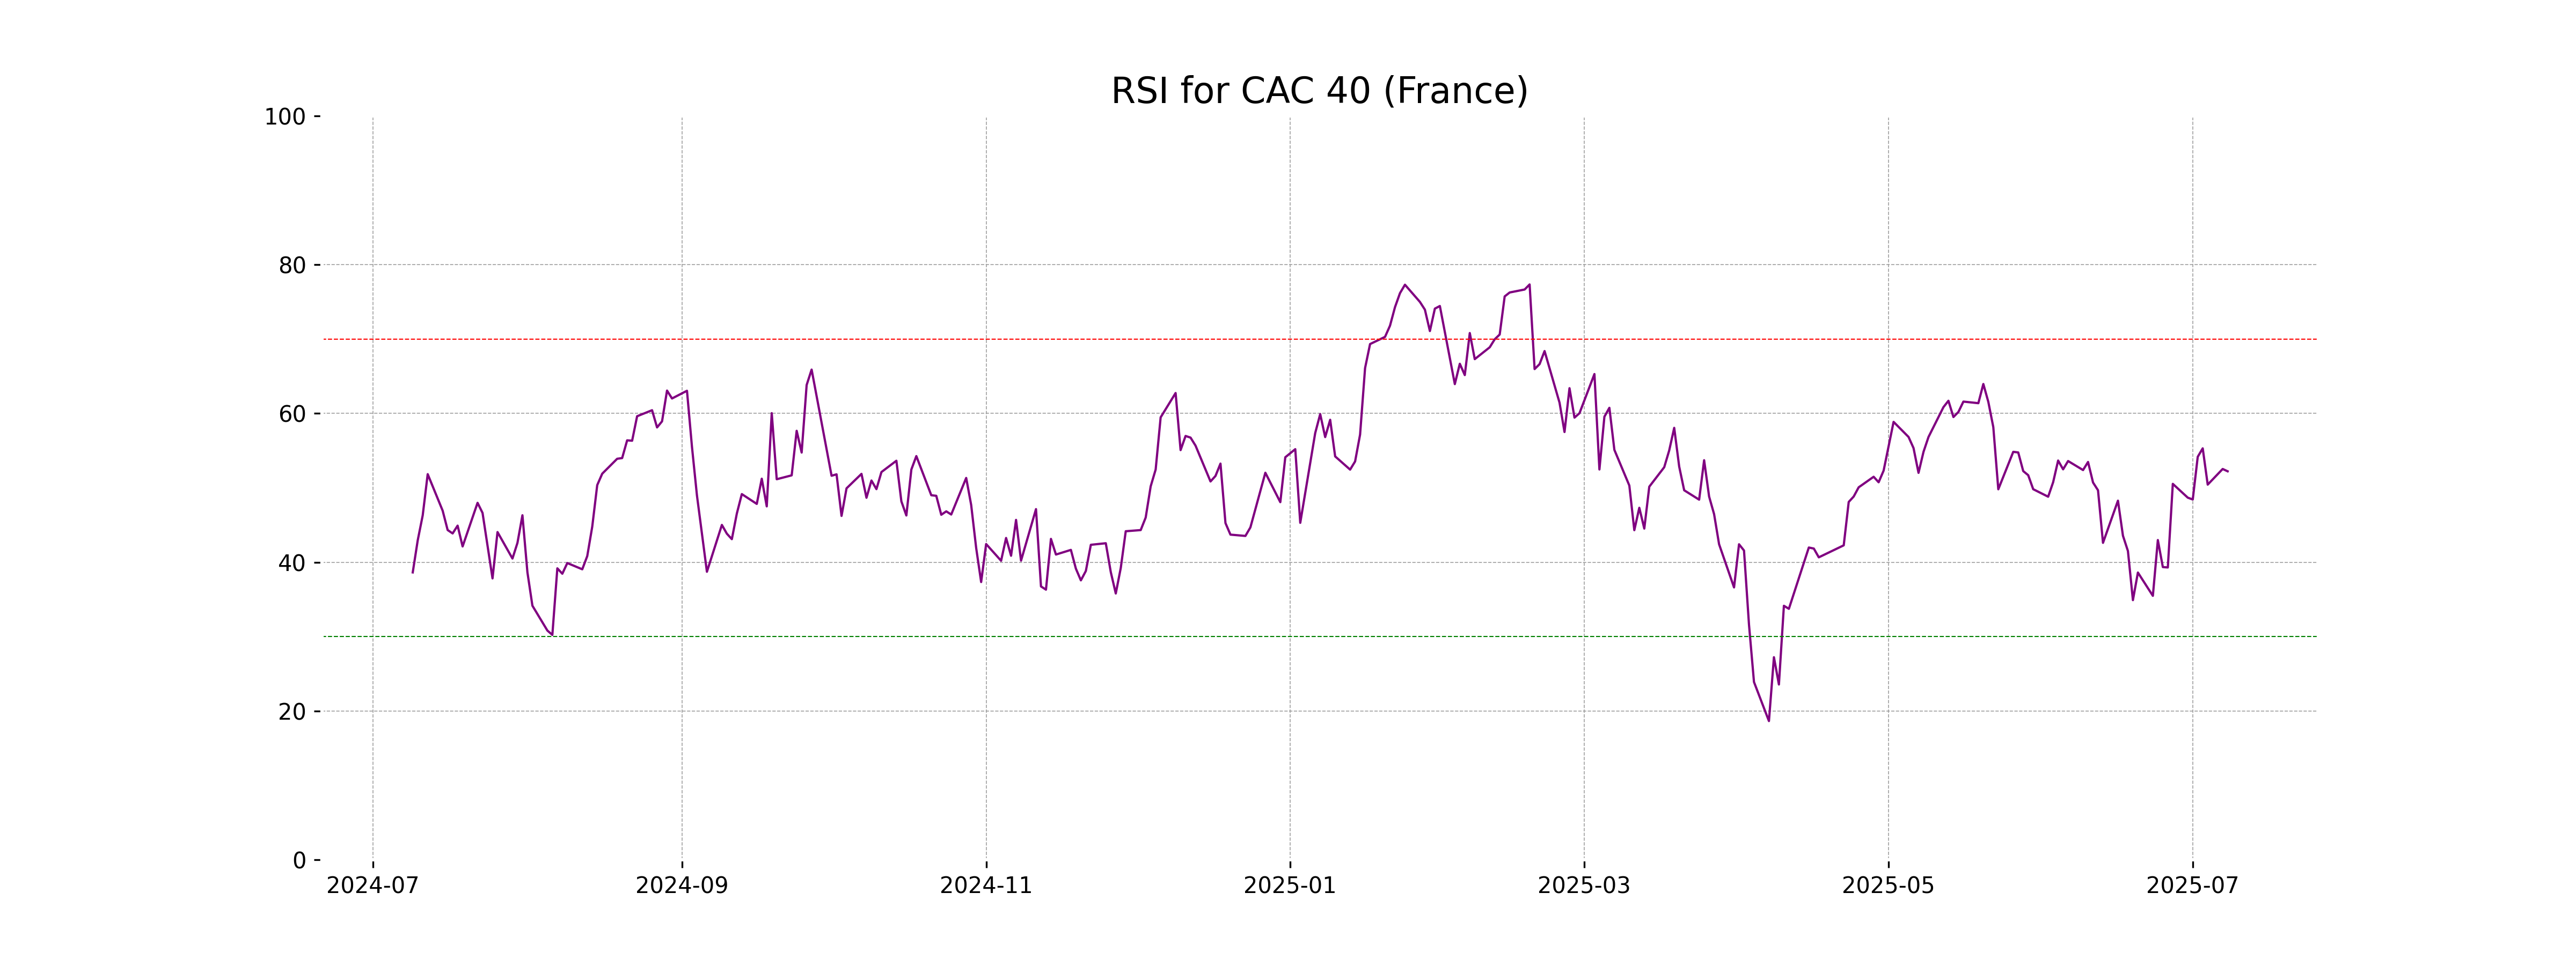
RSI Analysis
The FTSE 100 is displaying an RSI of 56.67, which suggests a neutral to slightly bullish sentiment in the market. An RSI between 50 and 70 typically implies that the index is neither overbought nor oversold, indicating stability with a leaning towards potential upward movement.
Analysis for DAX (Germany) - July 08, 2025

The DAX (Germany) index opened at 24,135.74 and closed at 24,164.77, showing a gain of approximately 0.38% with a points change of 91.10. The recent performance indicates a positive momentum with key indicators like the RSI at 58.89 and MACD significantly above the signal line, suggesting potential bullish sentiment in the market.
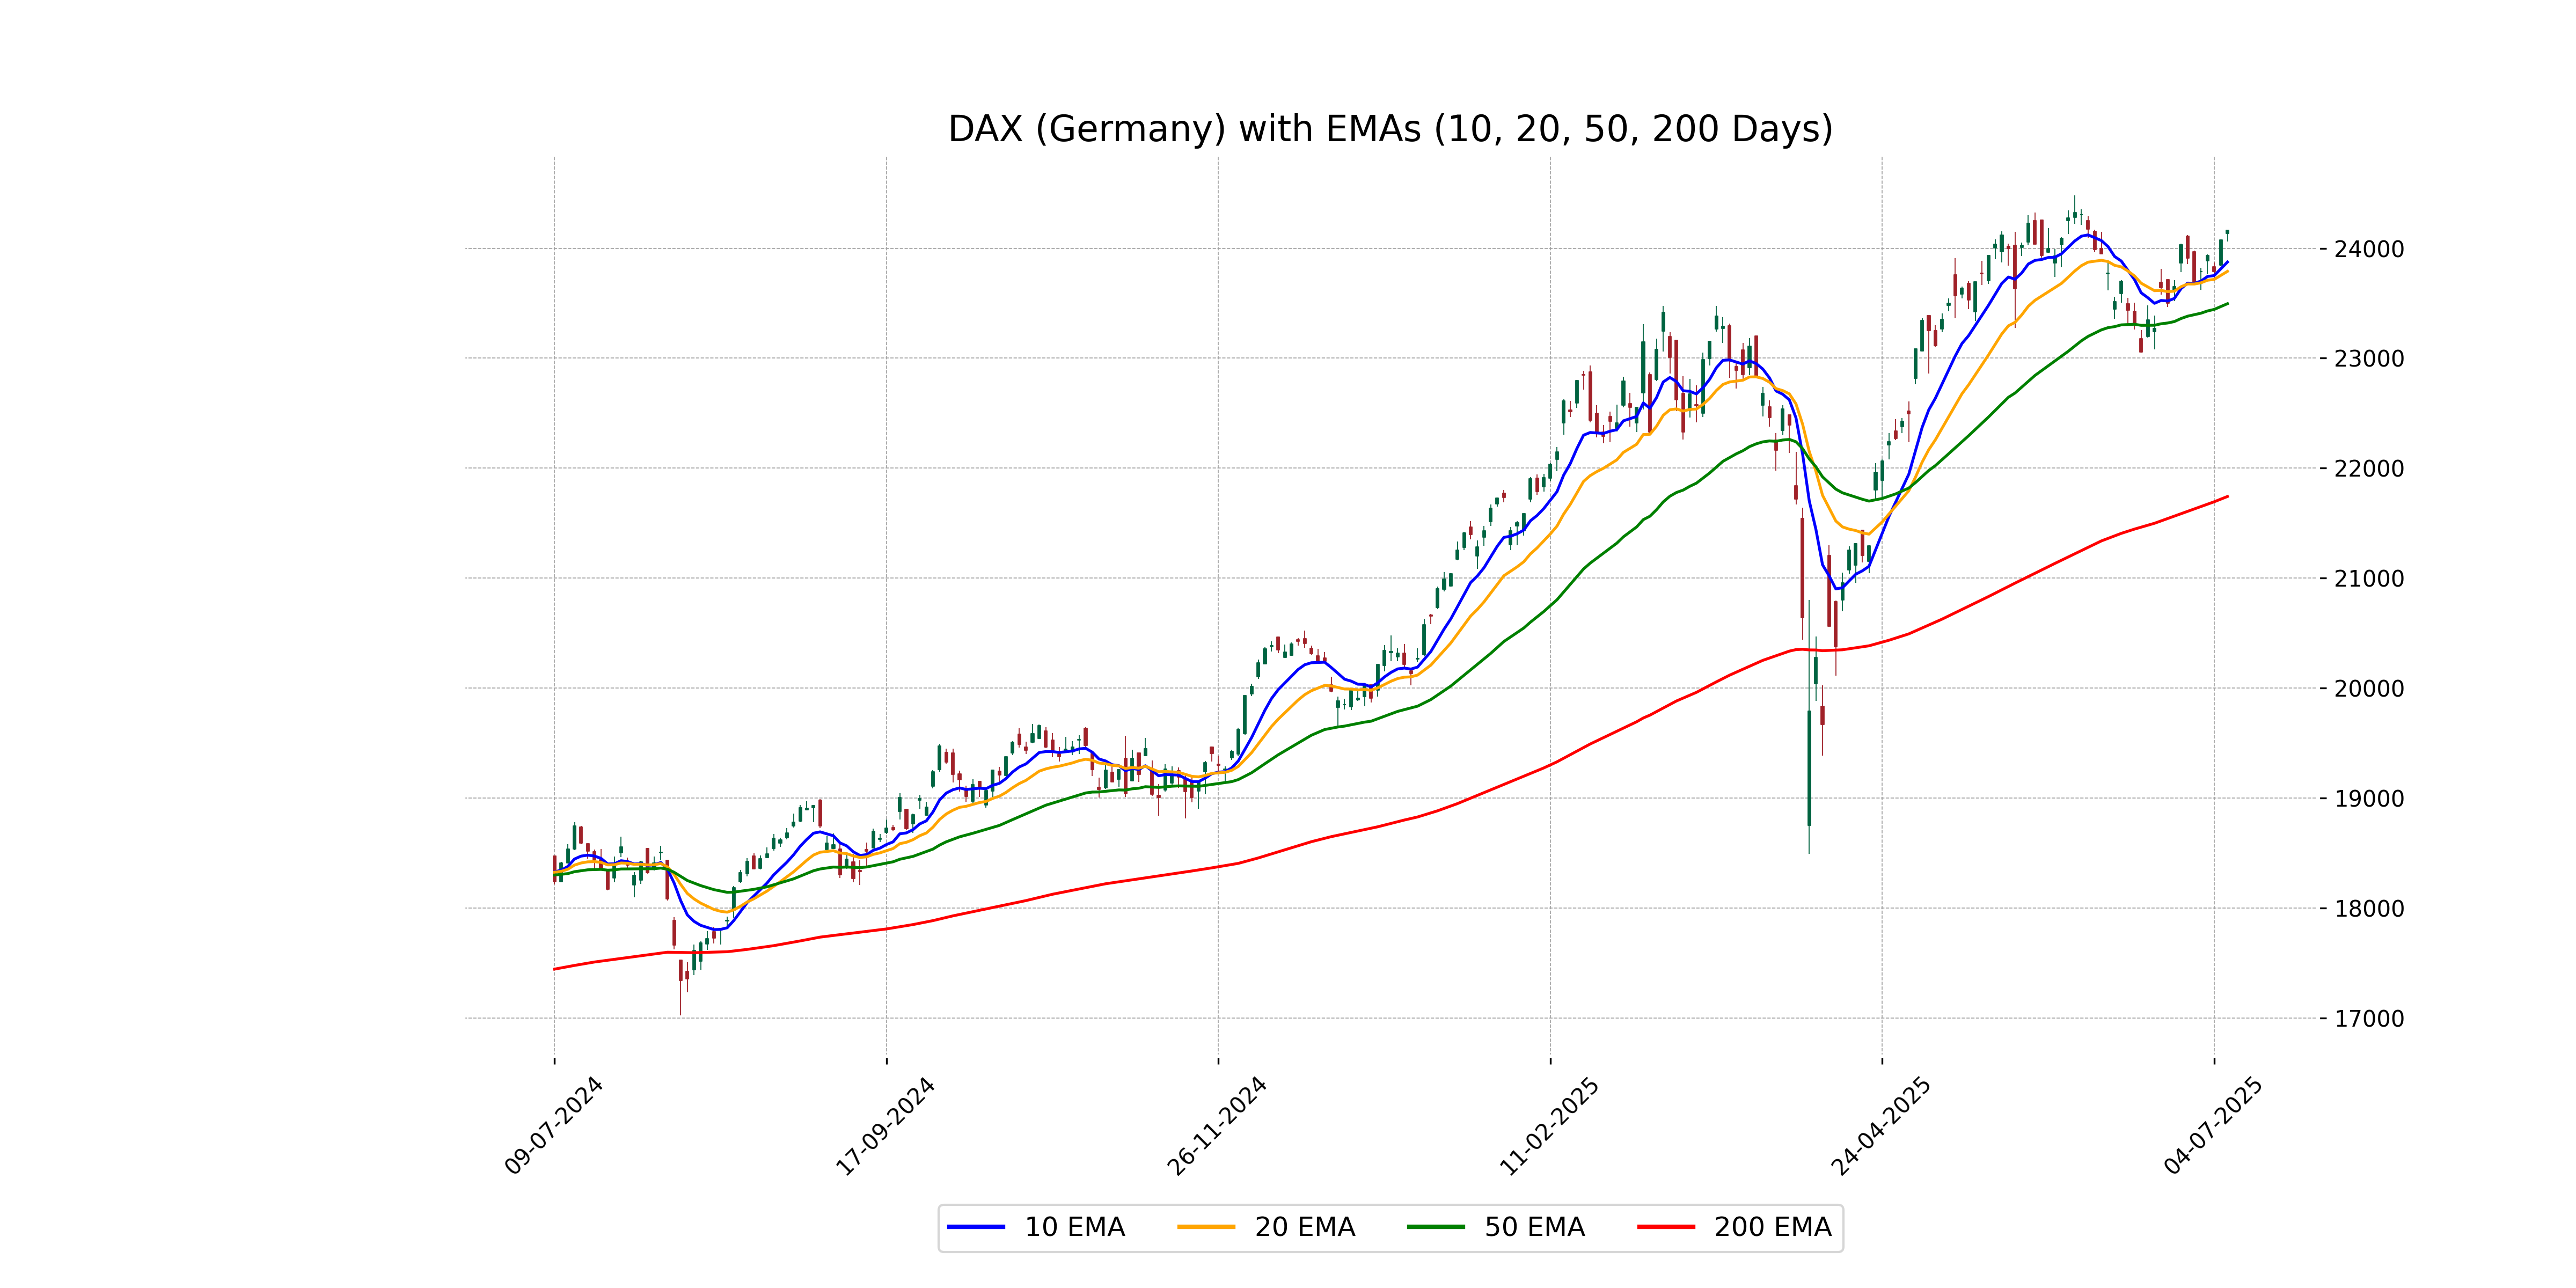
Relationship with Key Moving Averages
The DAX (Germany) closed at 24,164.77, which is above its 10-day EMA of 23,874.53, 20-day EMA of 23,790.13, 50-day EMA of 23,495.81, and 200-day EMA of 21,742.33, indicating a strong upward momentum relative to these key moving averages.
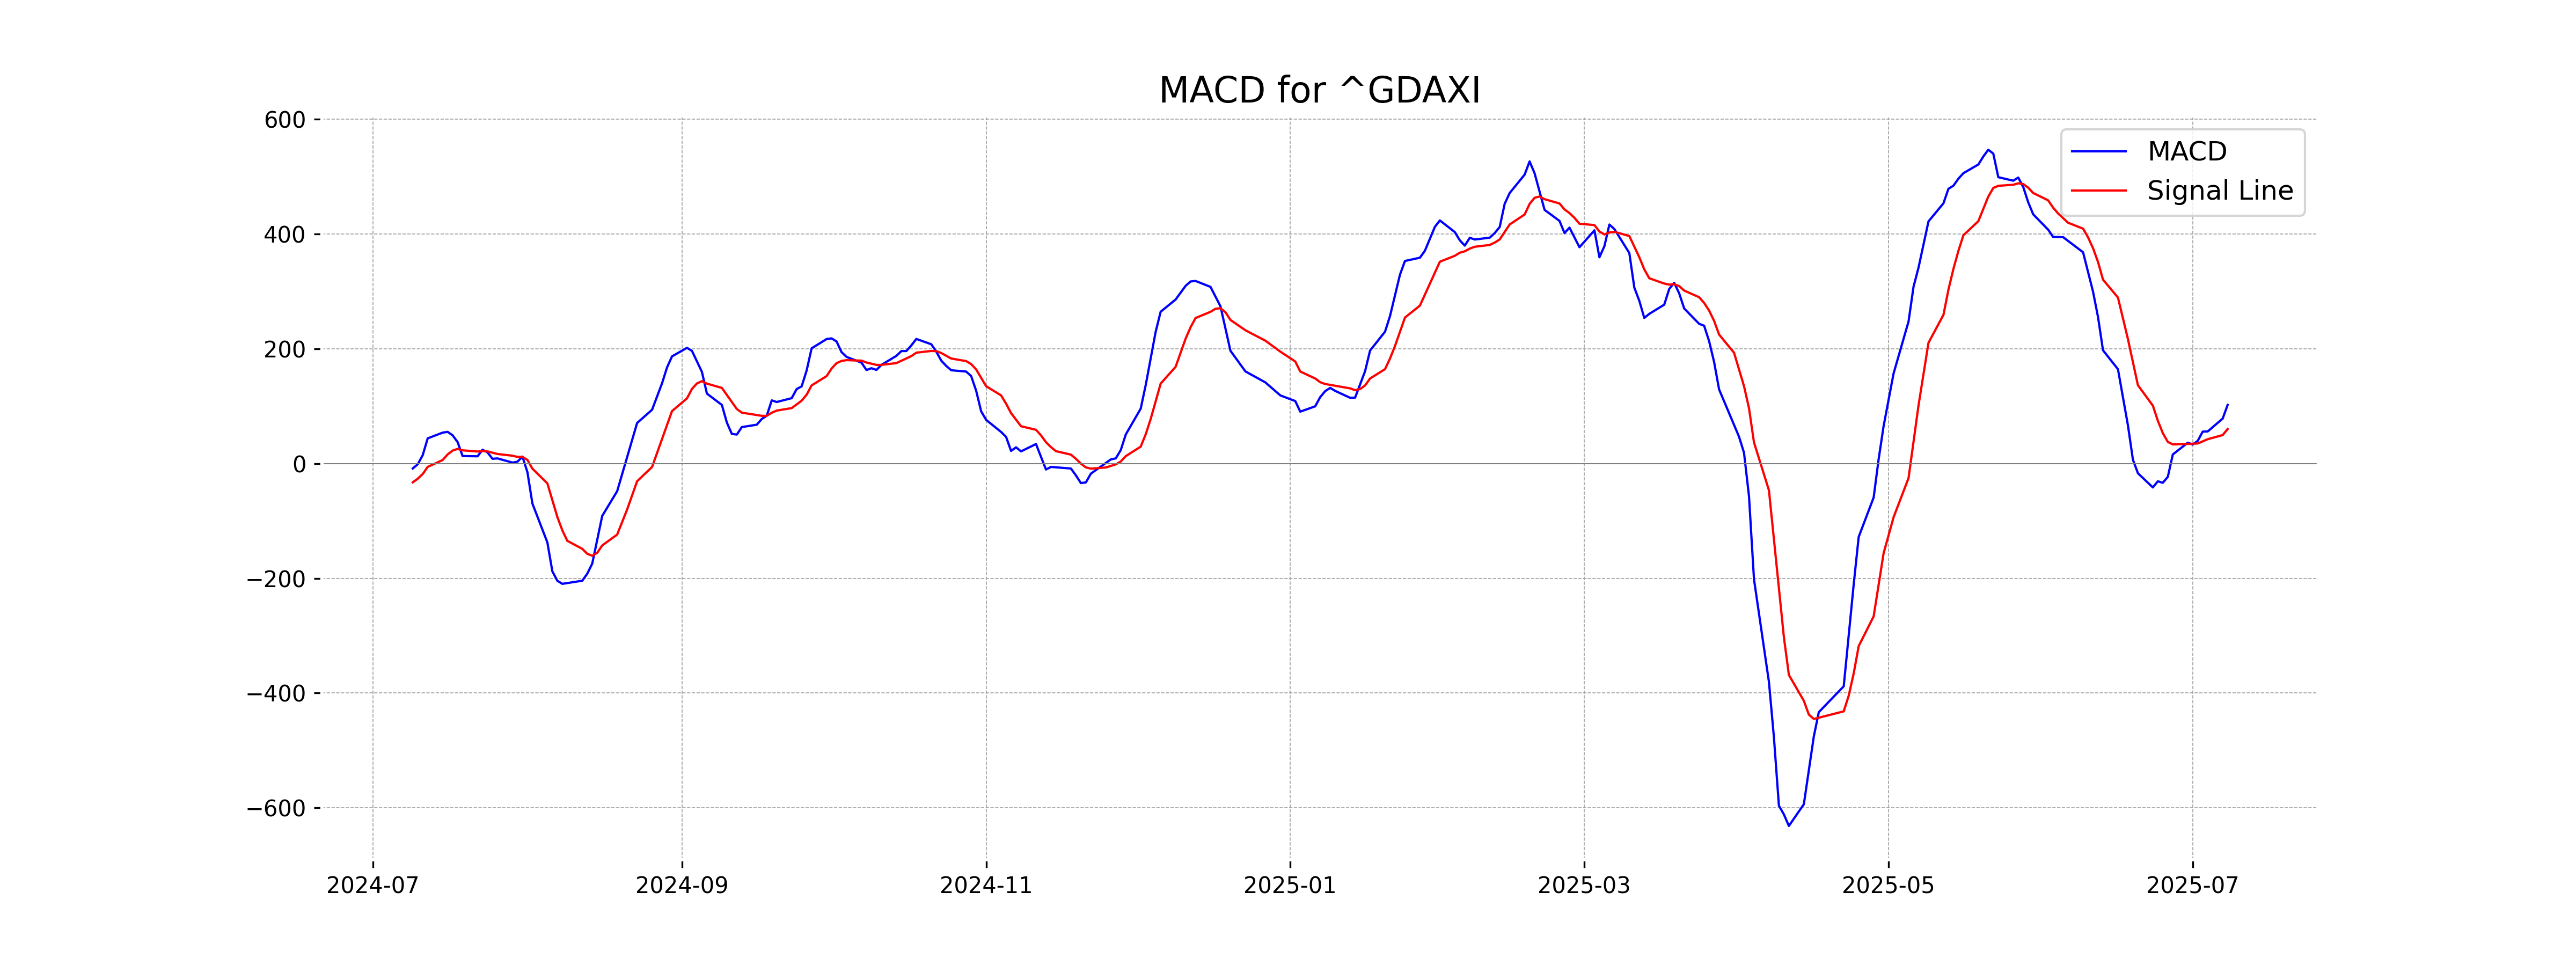
Moving Averages Trend (MACD)
The MACD for DAX (Germany) is 102.32 with a signal line of 60.22. Since the MACD line is above the signal line, this indicates a bullish momentum in the market, suggesting a potential buying opportunity.
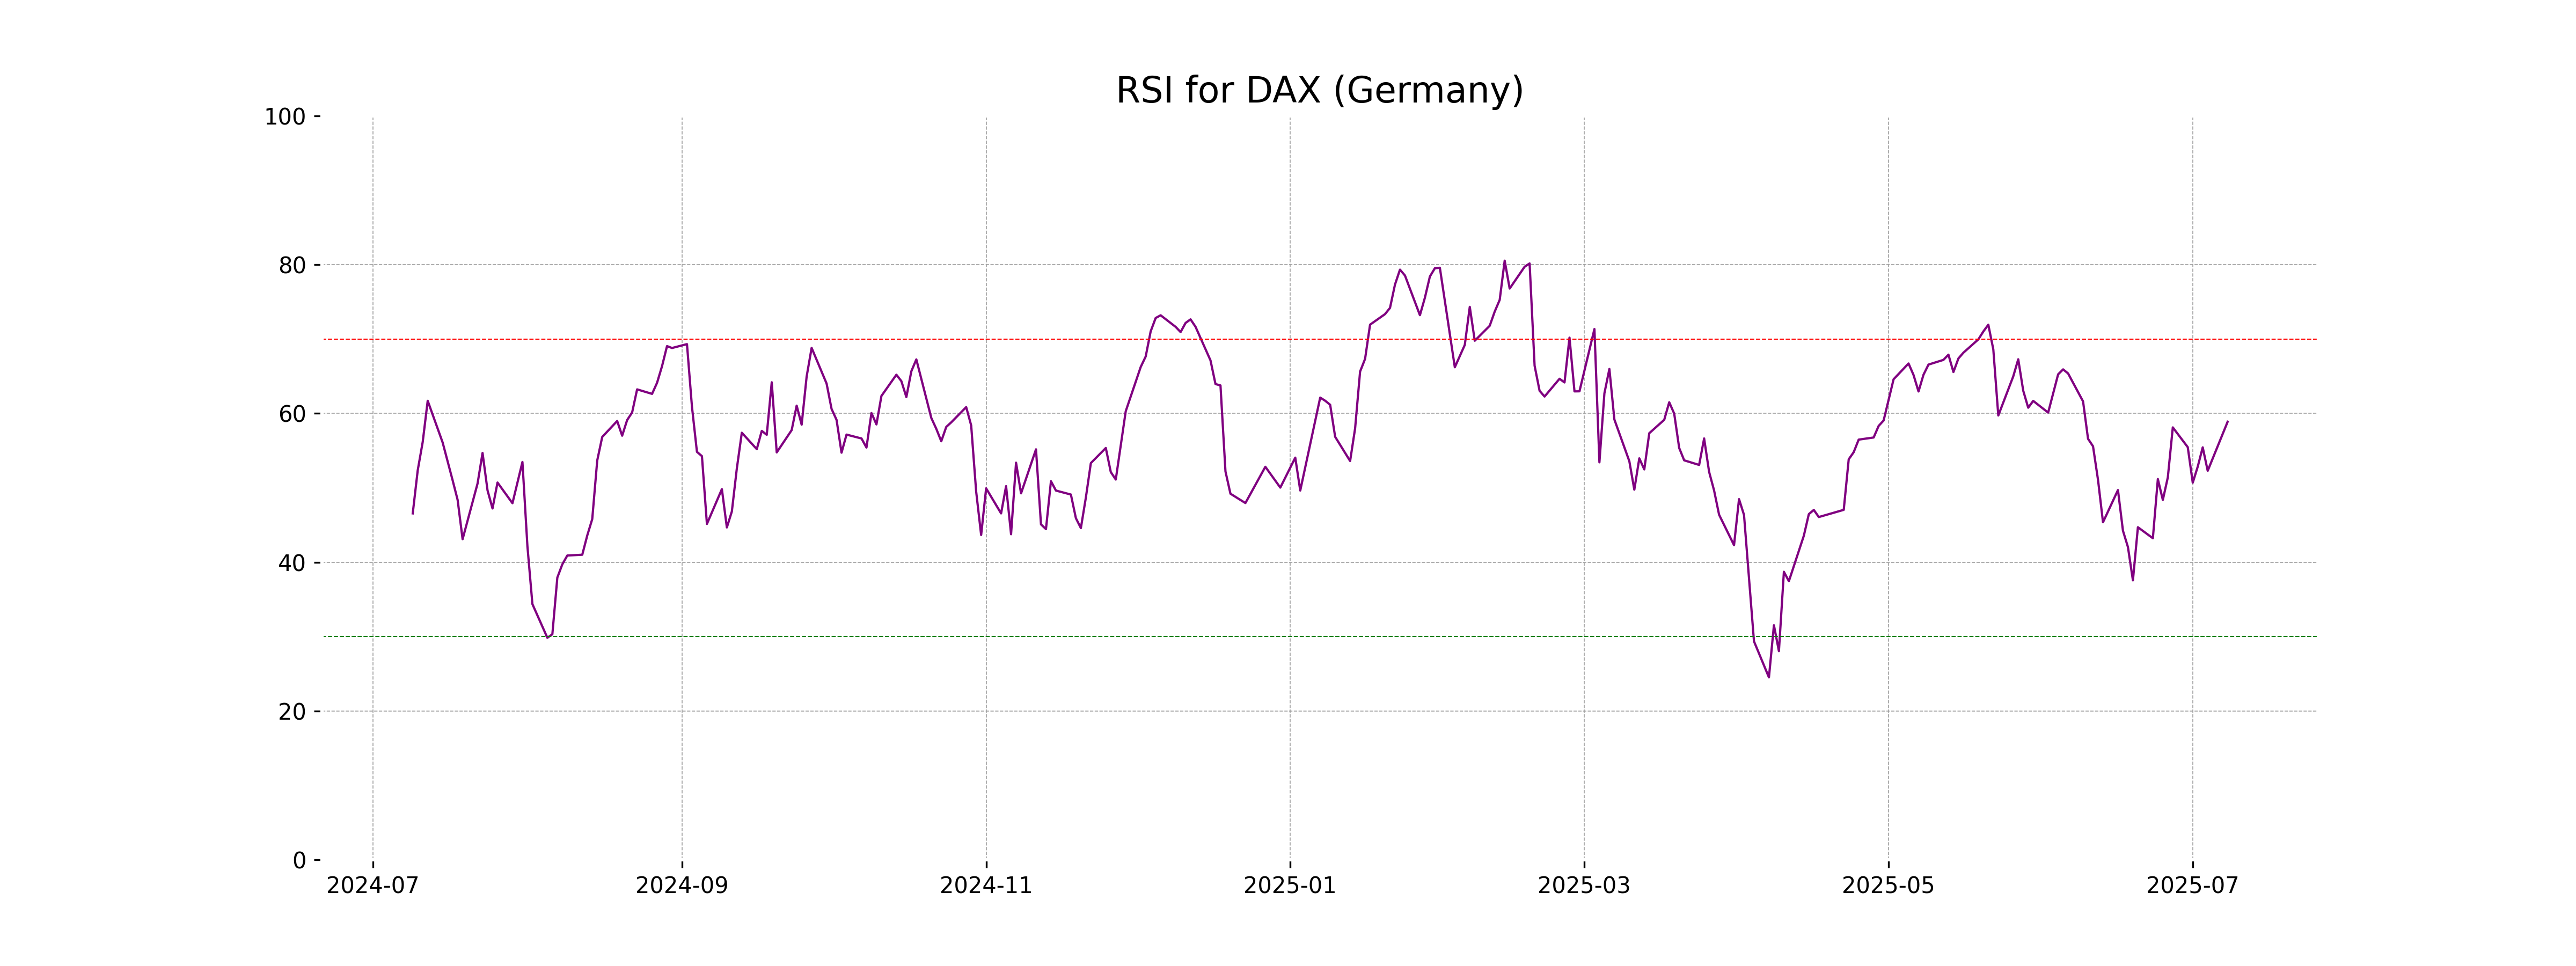
RSI Analysis
The RSI (Relative Strength Index) for DAX (Germany) is 58.89, which indicates a moderate level, suggesting that the market neither shows overbought nor oversold conditions. Generally, RSI values between 30 and 70 denote stable momentum, implying a potential continuation of the current trend unless extreme changes occur.
Analysis for S&P 500 (US) - July 08, 2025

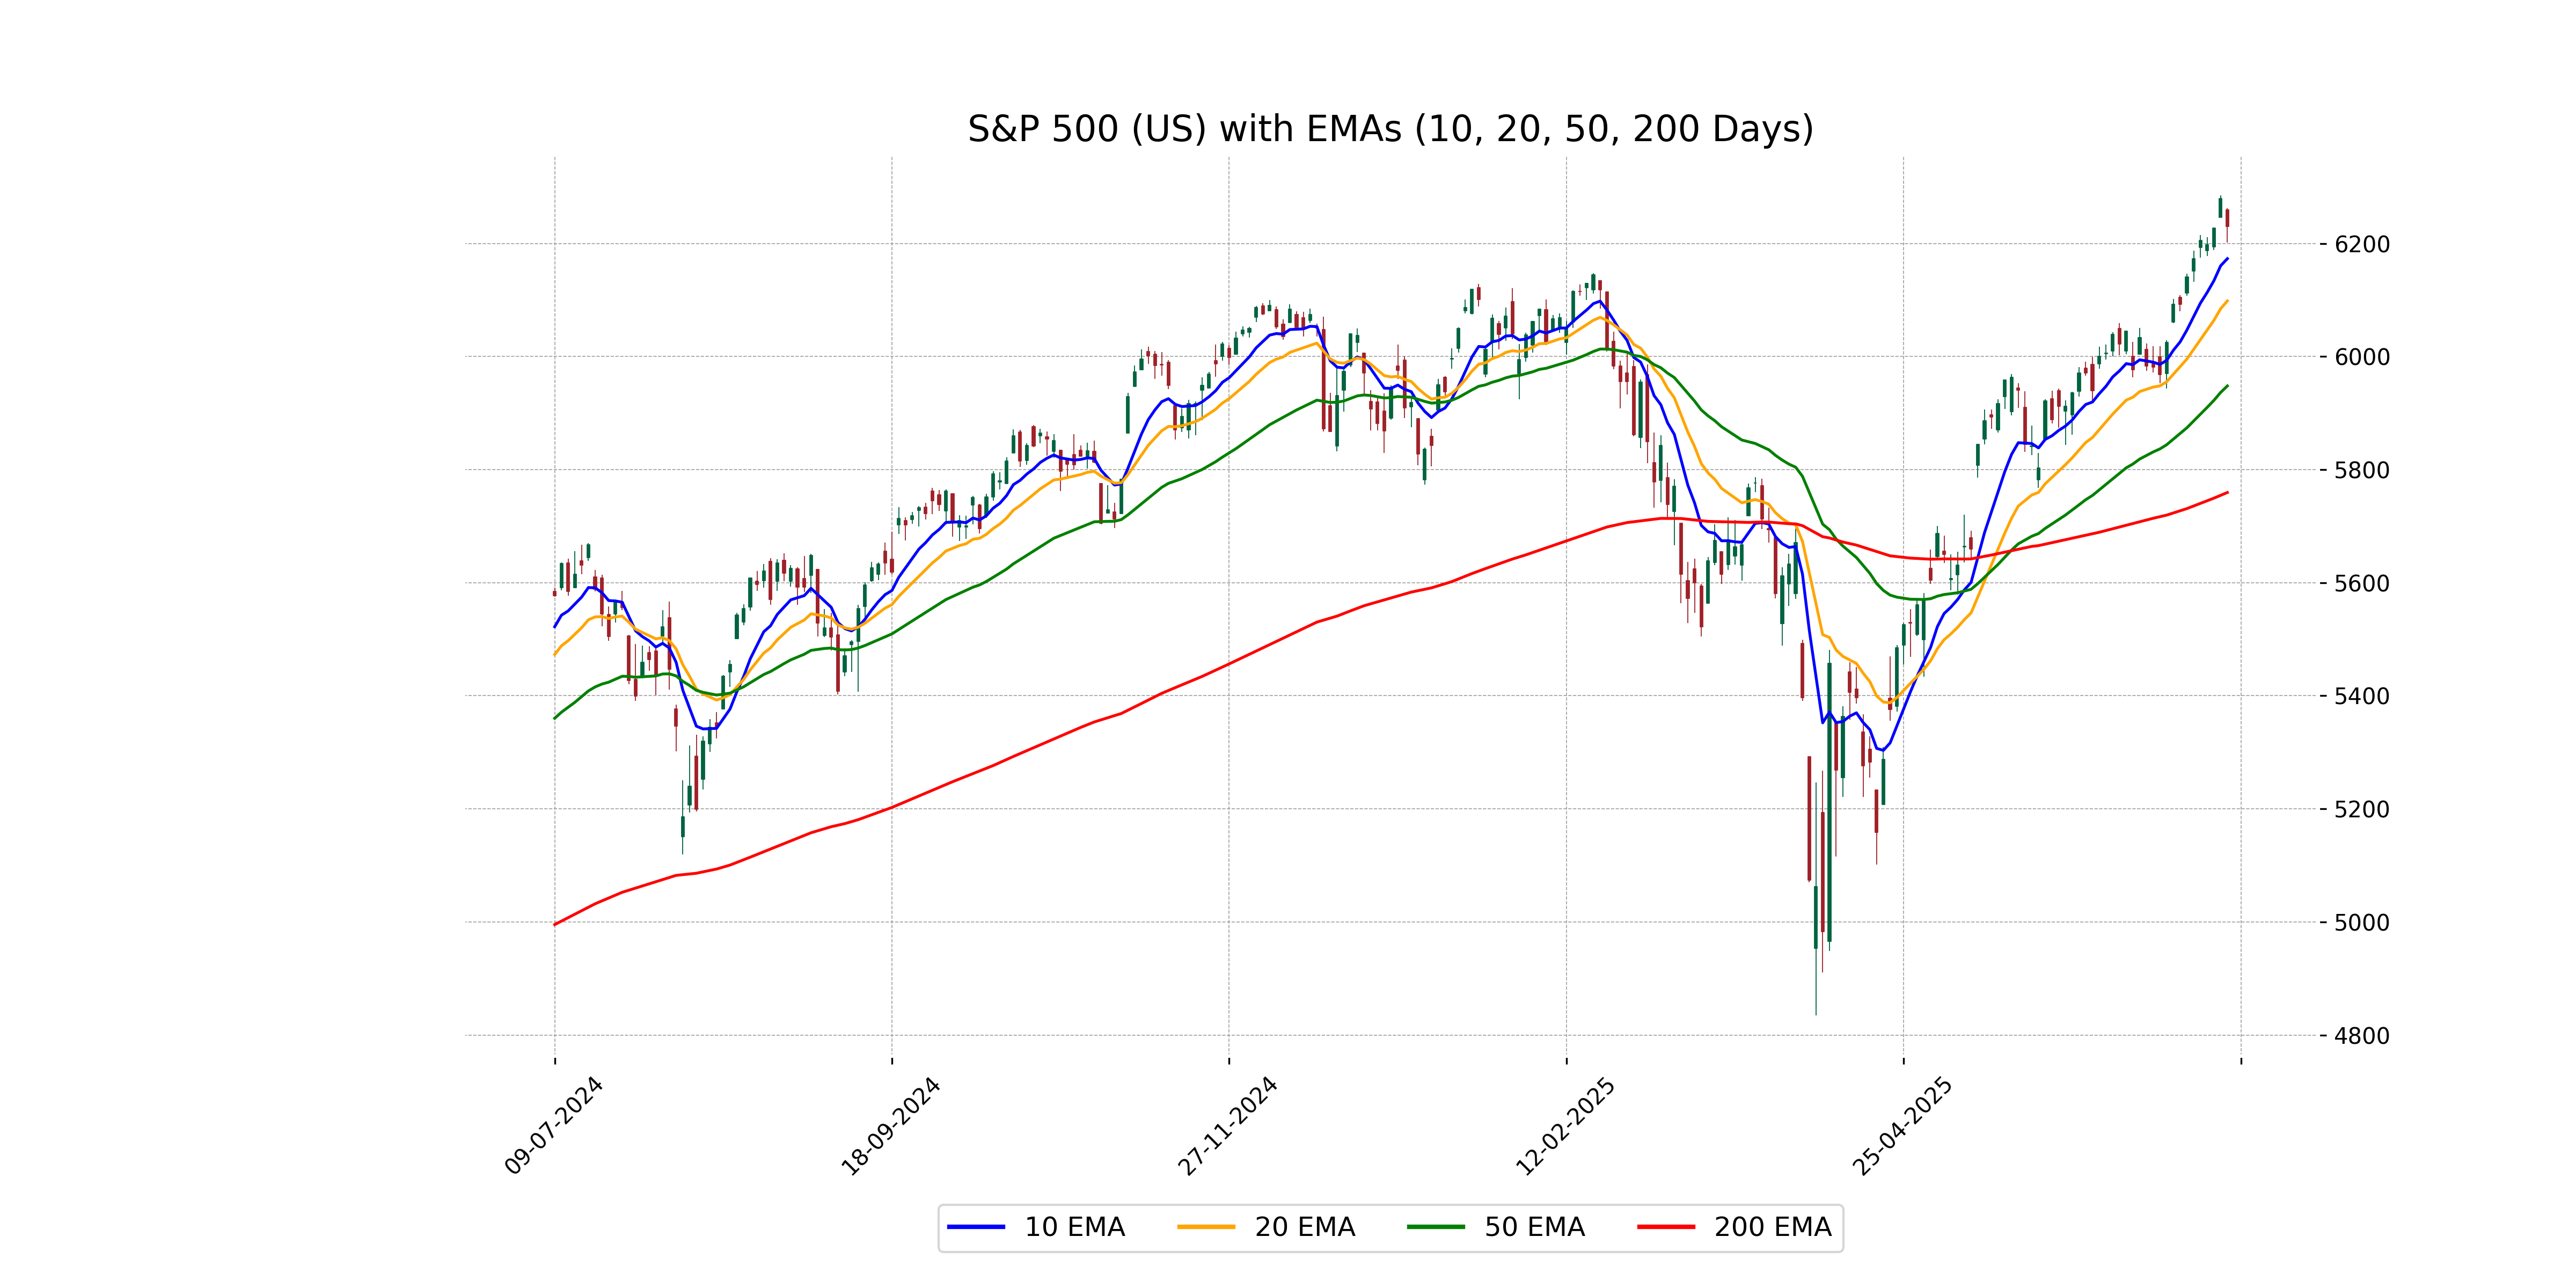
S&P 500 (US) Performance: The S&P 500 opened at 6,259.04, reaching a high of 6,262.07 and a low of 6,201.00, eventually closing at 6,229.98. The index experienced a decline of 0.79% from the previous close of 6,279.35, marking a points change of -49.37. The trading volume was 5.24 billion, with indicators such as the 50-day EMA at 5,947.90, 200-day EMA at 5,759.45, and a high RSI of 68.36, suggesting a bullish trend with significant momentum.
Relationship with Key Moving Averages
The S&P 500 (US) closed at 6229.98, which is above the 50-day EMA of 5947.90 and the 200-day EMA of 5759.45, indicating a bullish trend. However, it remains slightly above the 10-day EMA of 6173.04 and the 20-day EMA of 6098.27, suggesting recent strength despite today's negative change.
Moving Averages Trend (MACD)
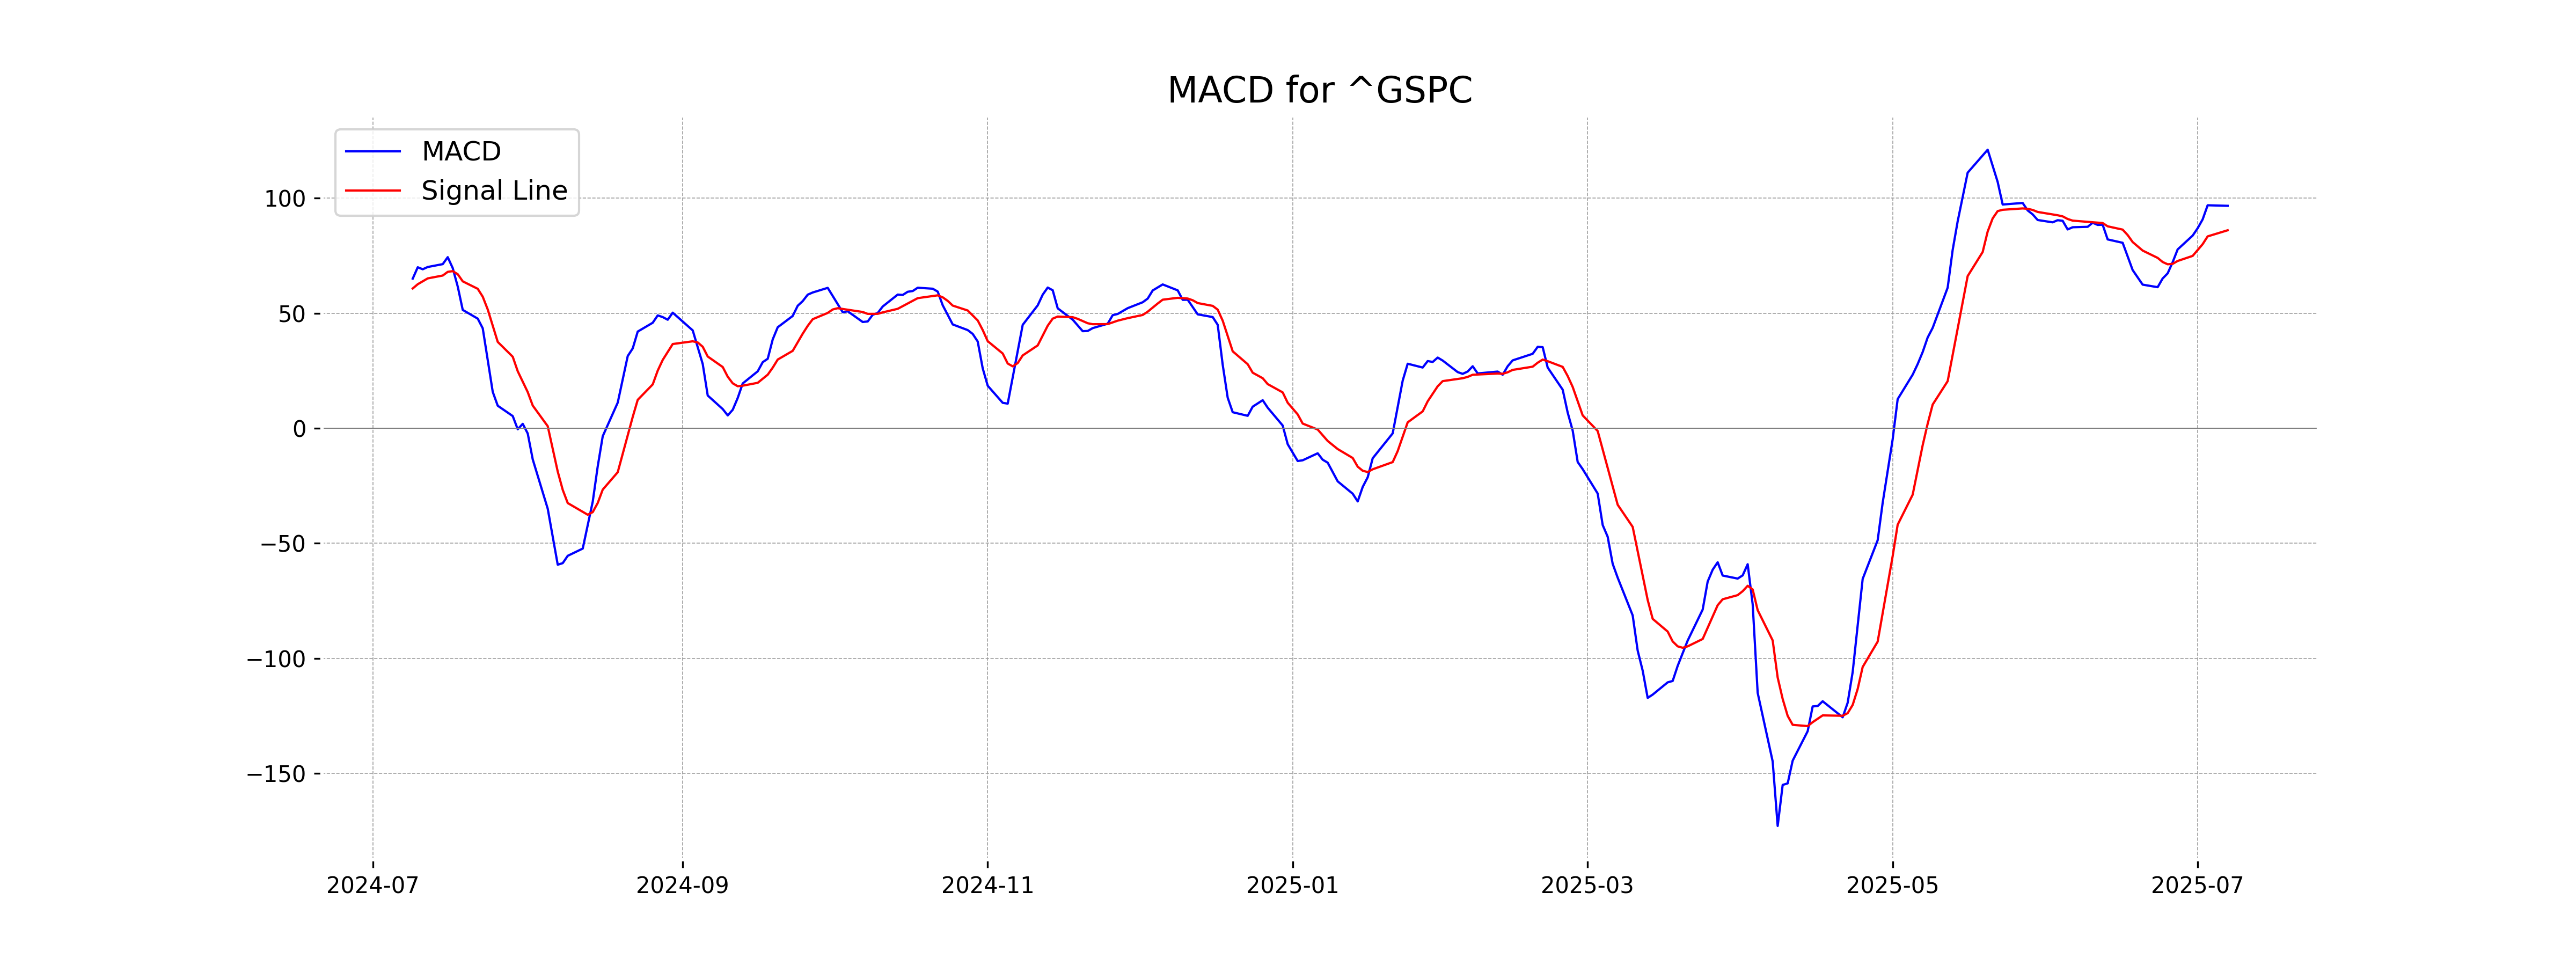
S&P 500 (US) MACD Analysis: The MACD value of 96.70 is above the MACD Signal line of 86.07, indicating a potential bullish trend. This suggests that momentum is currently favoring an upward move, but external factors should also be considered.
RSI Analysis
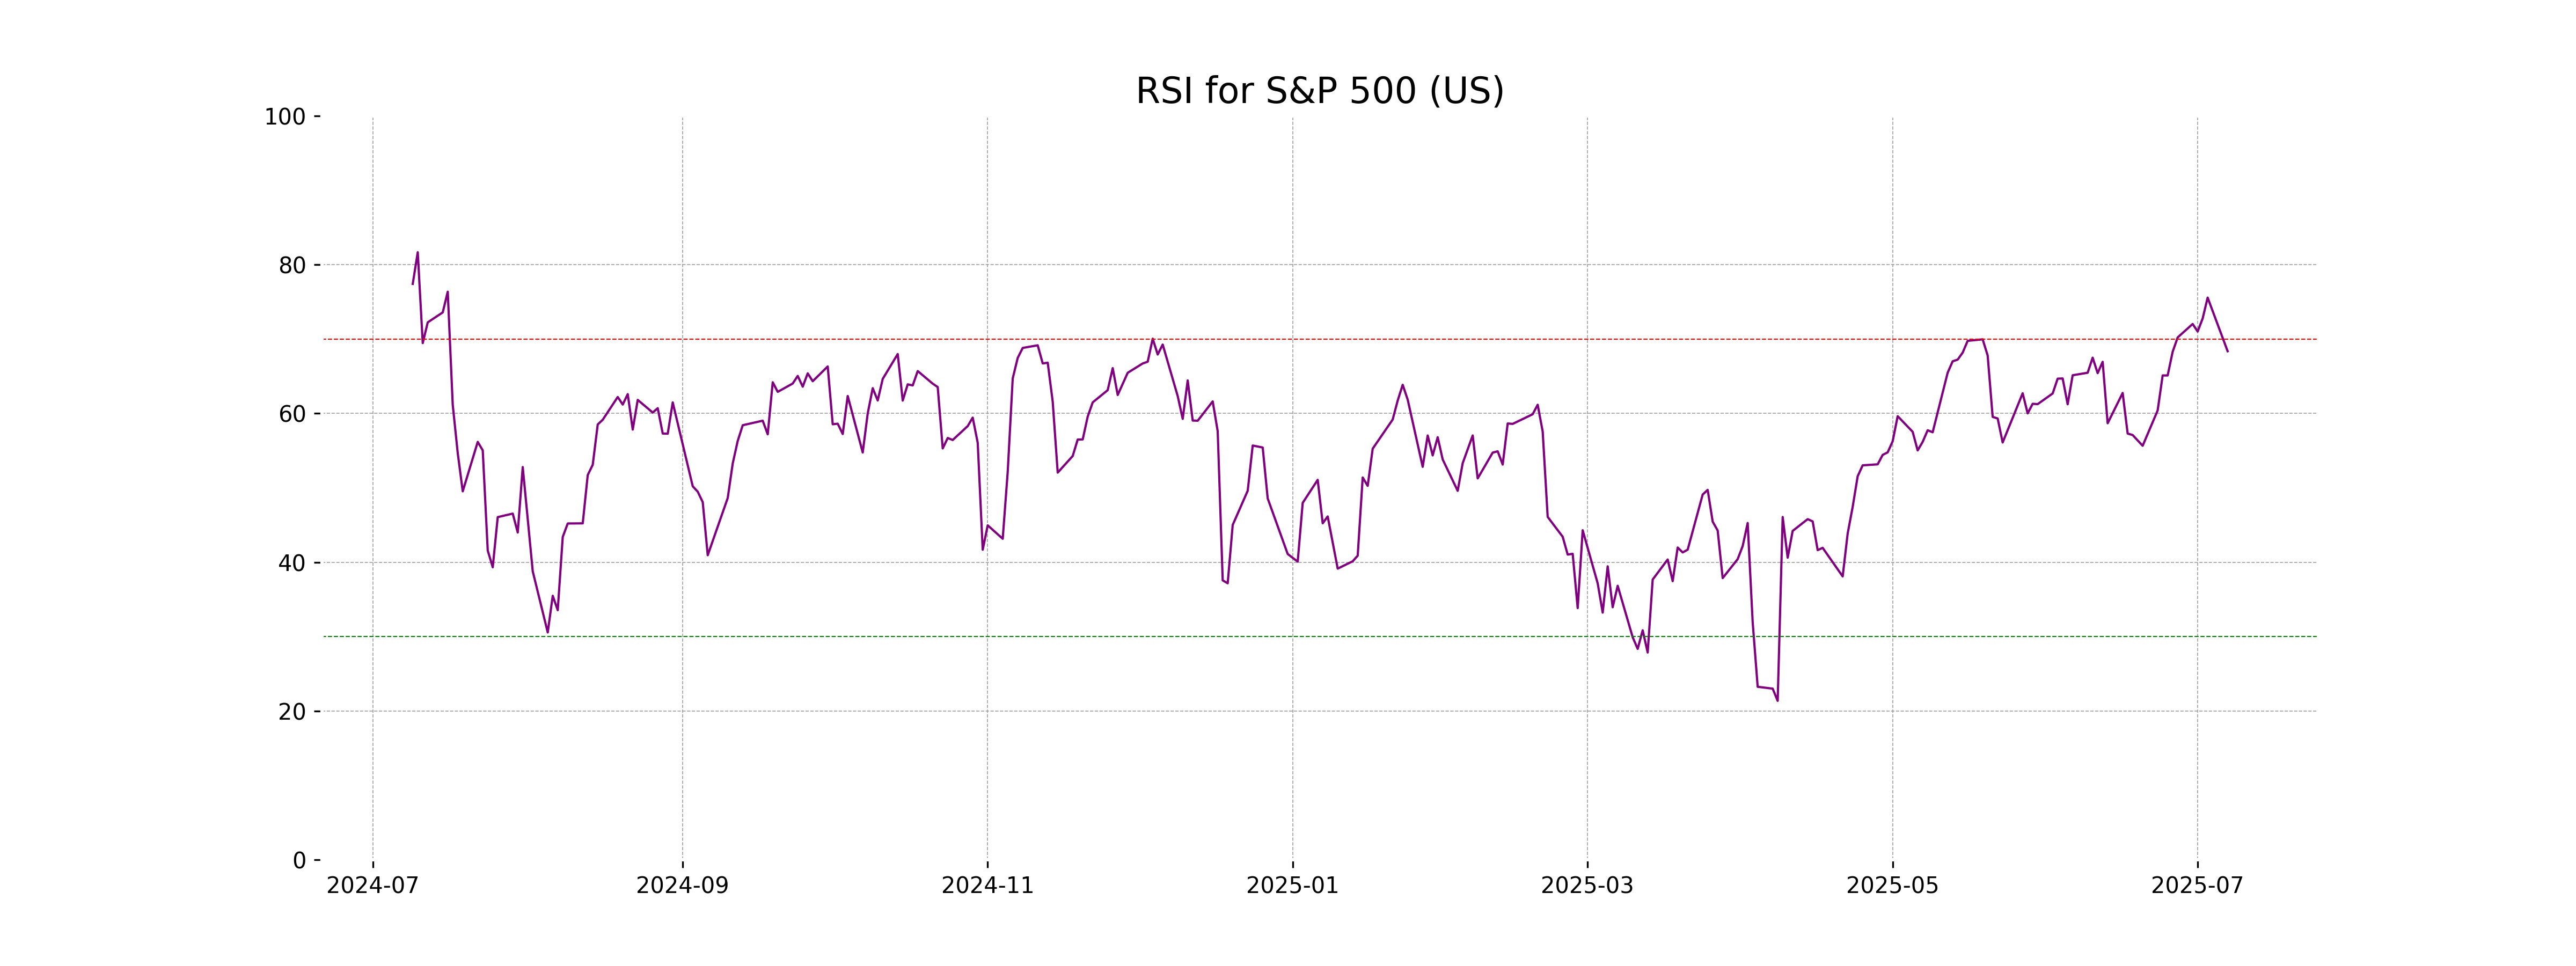
The RSI for S&P 500 is 68.36, which suggests it is approaching overbought conditions, but not at extreme levels yet. Traders might watch this closely for potential signs of a trend reversal or a continuation depending on market sentiment and other indicators.
Analysis for Hang Seng Index (Hong Kong) - July 08, 2025
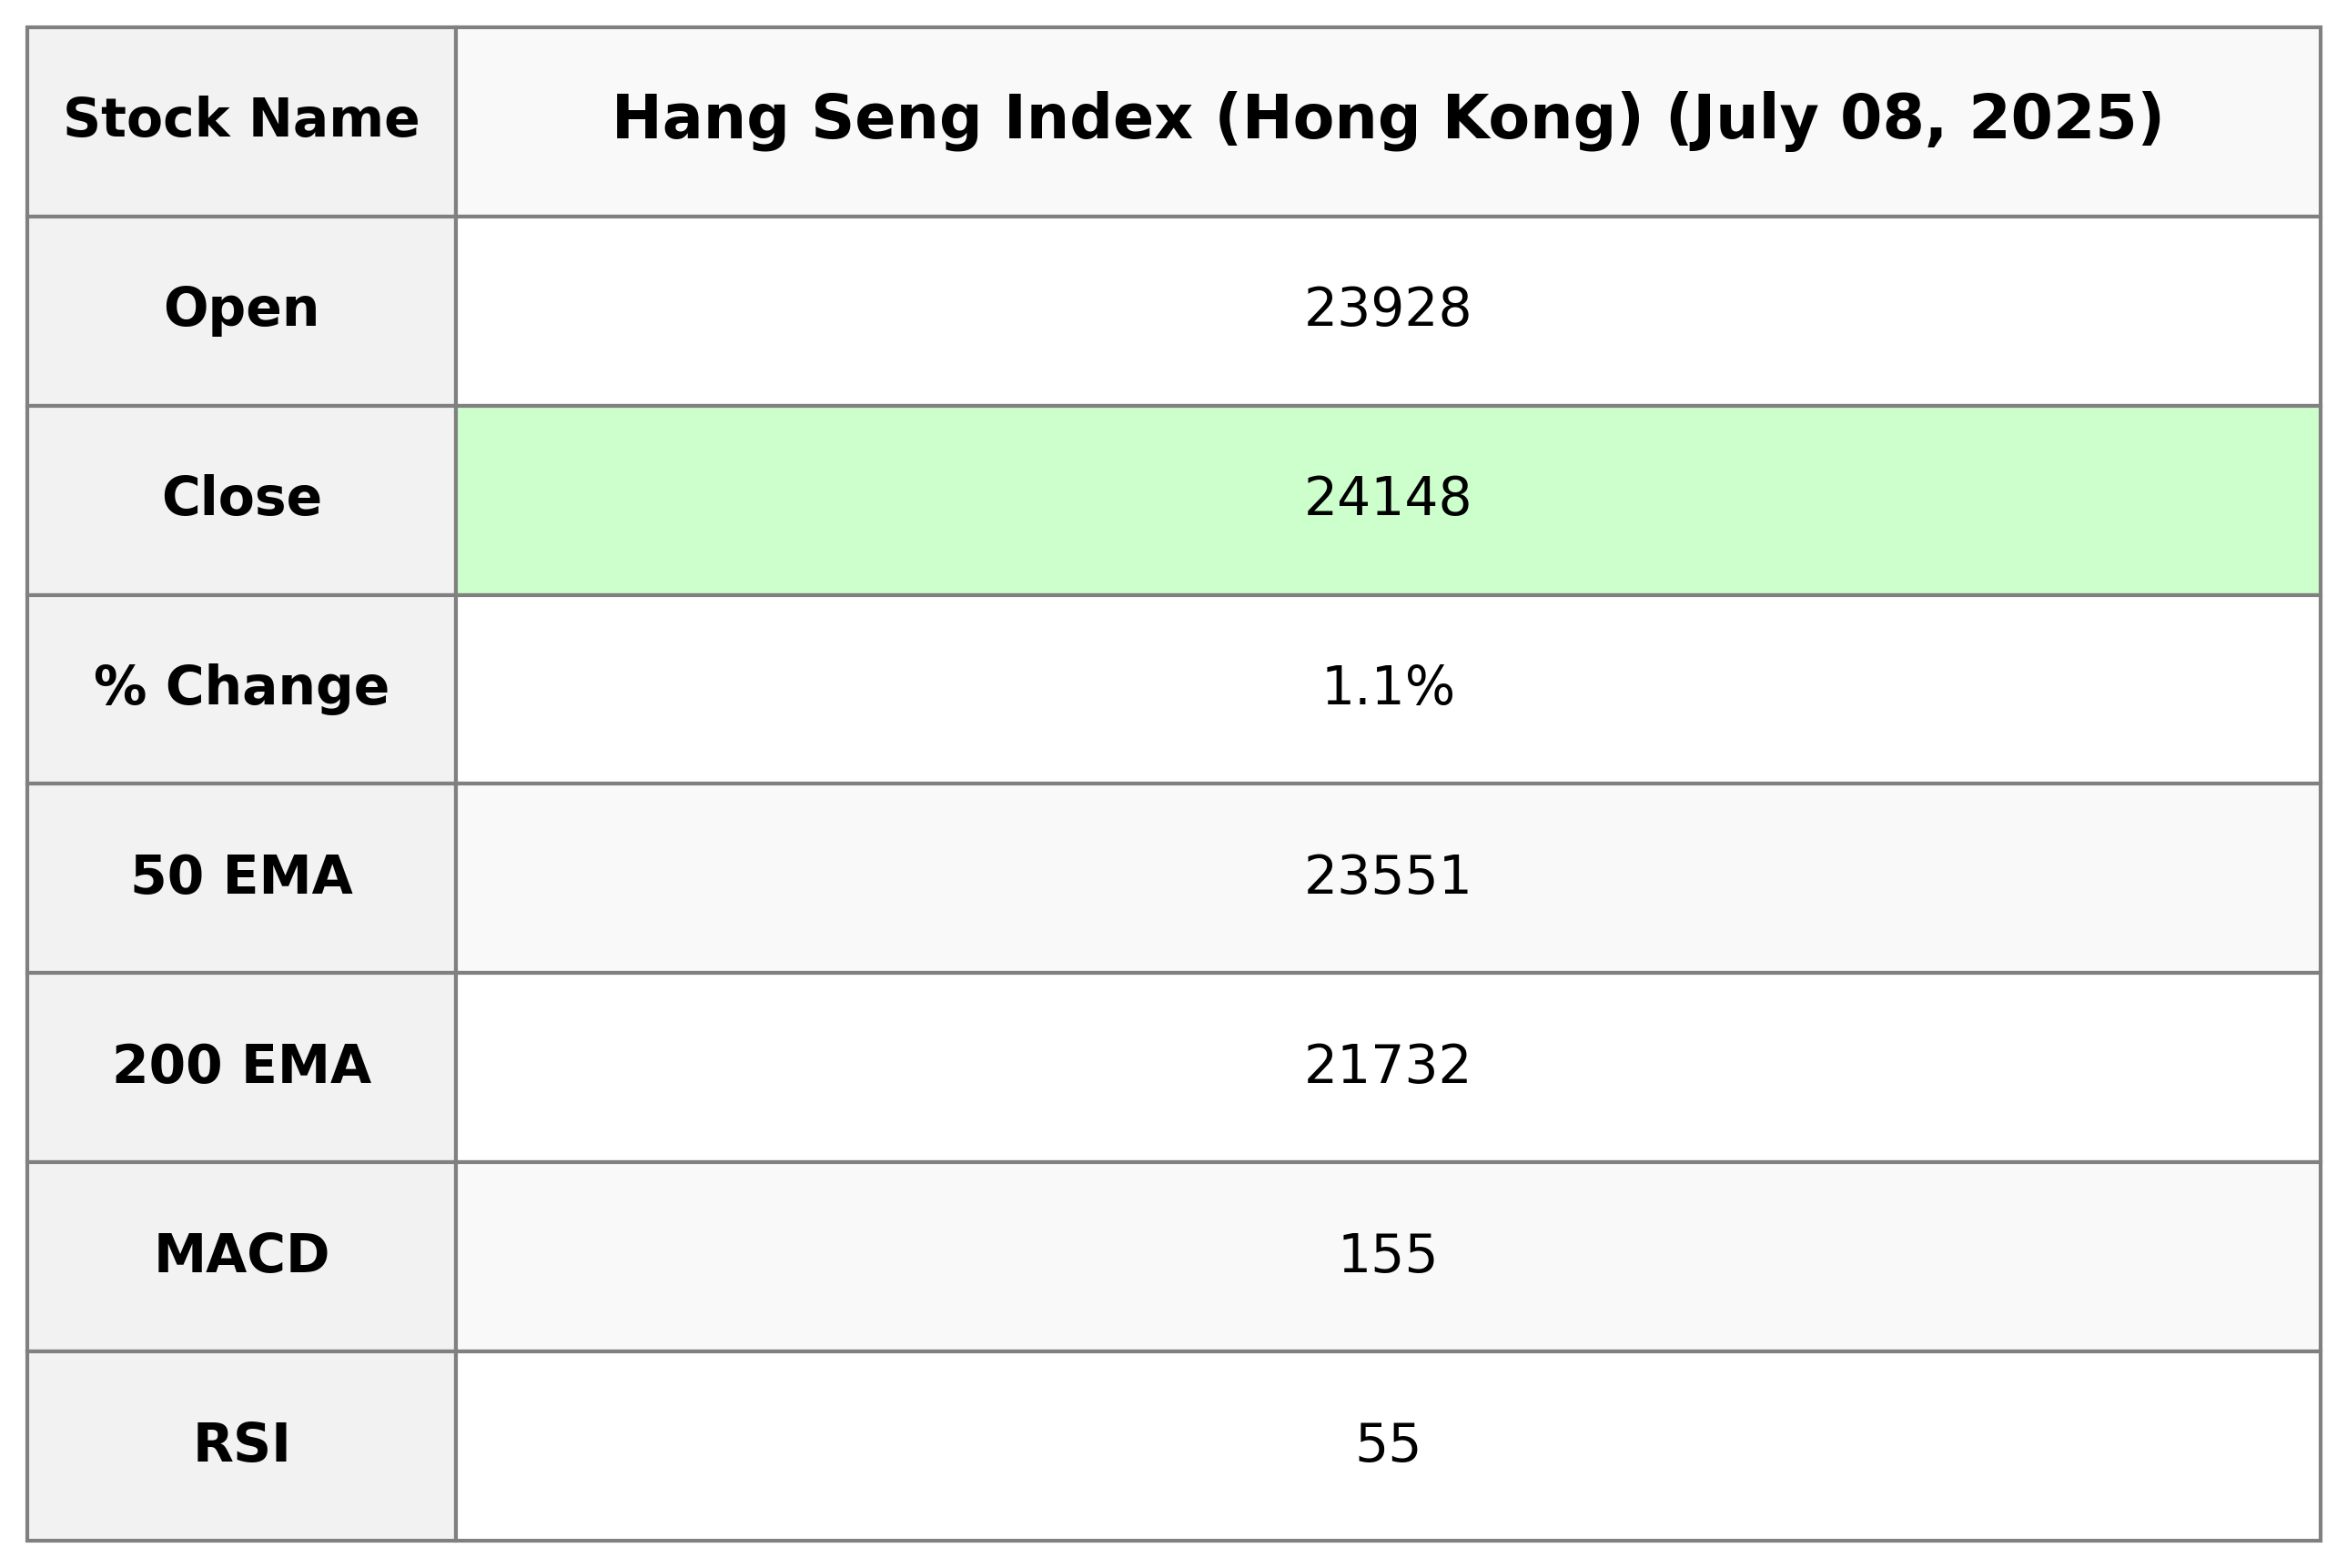
The Hang Seng Index (Hong Kong) opened at 23,927.53 and closed at 24,148.07, showing a 1.09% increase from the previous close of 23,887.83, with a points change of 260.24. The index traded between a high of 24,159.01 and a low of 23,899.60, with notable indicators including an RSI of 55.31 and a MACD below the signal line at 155.31.
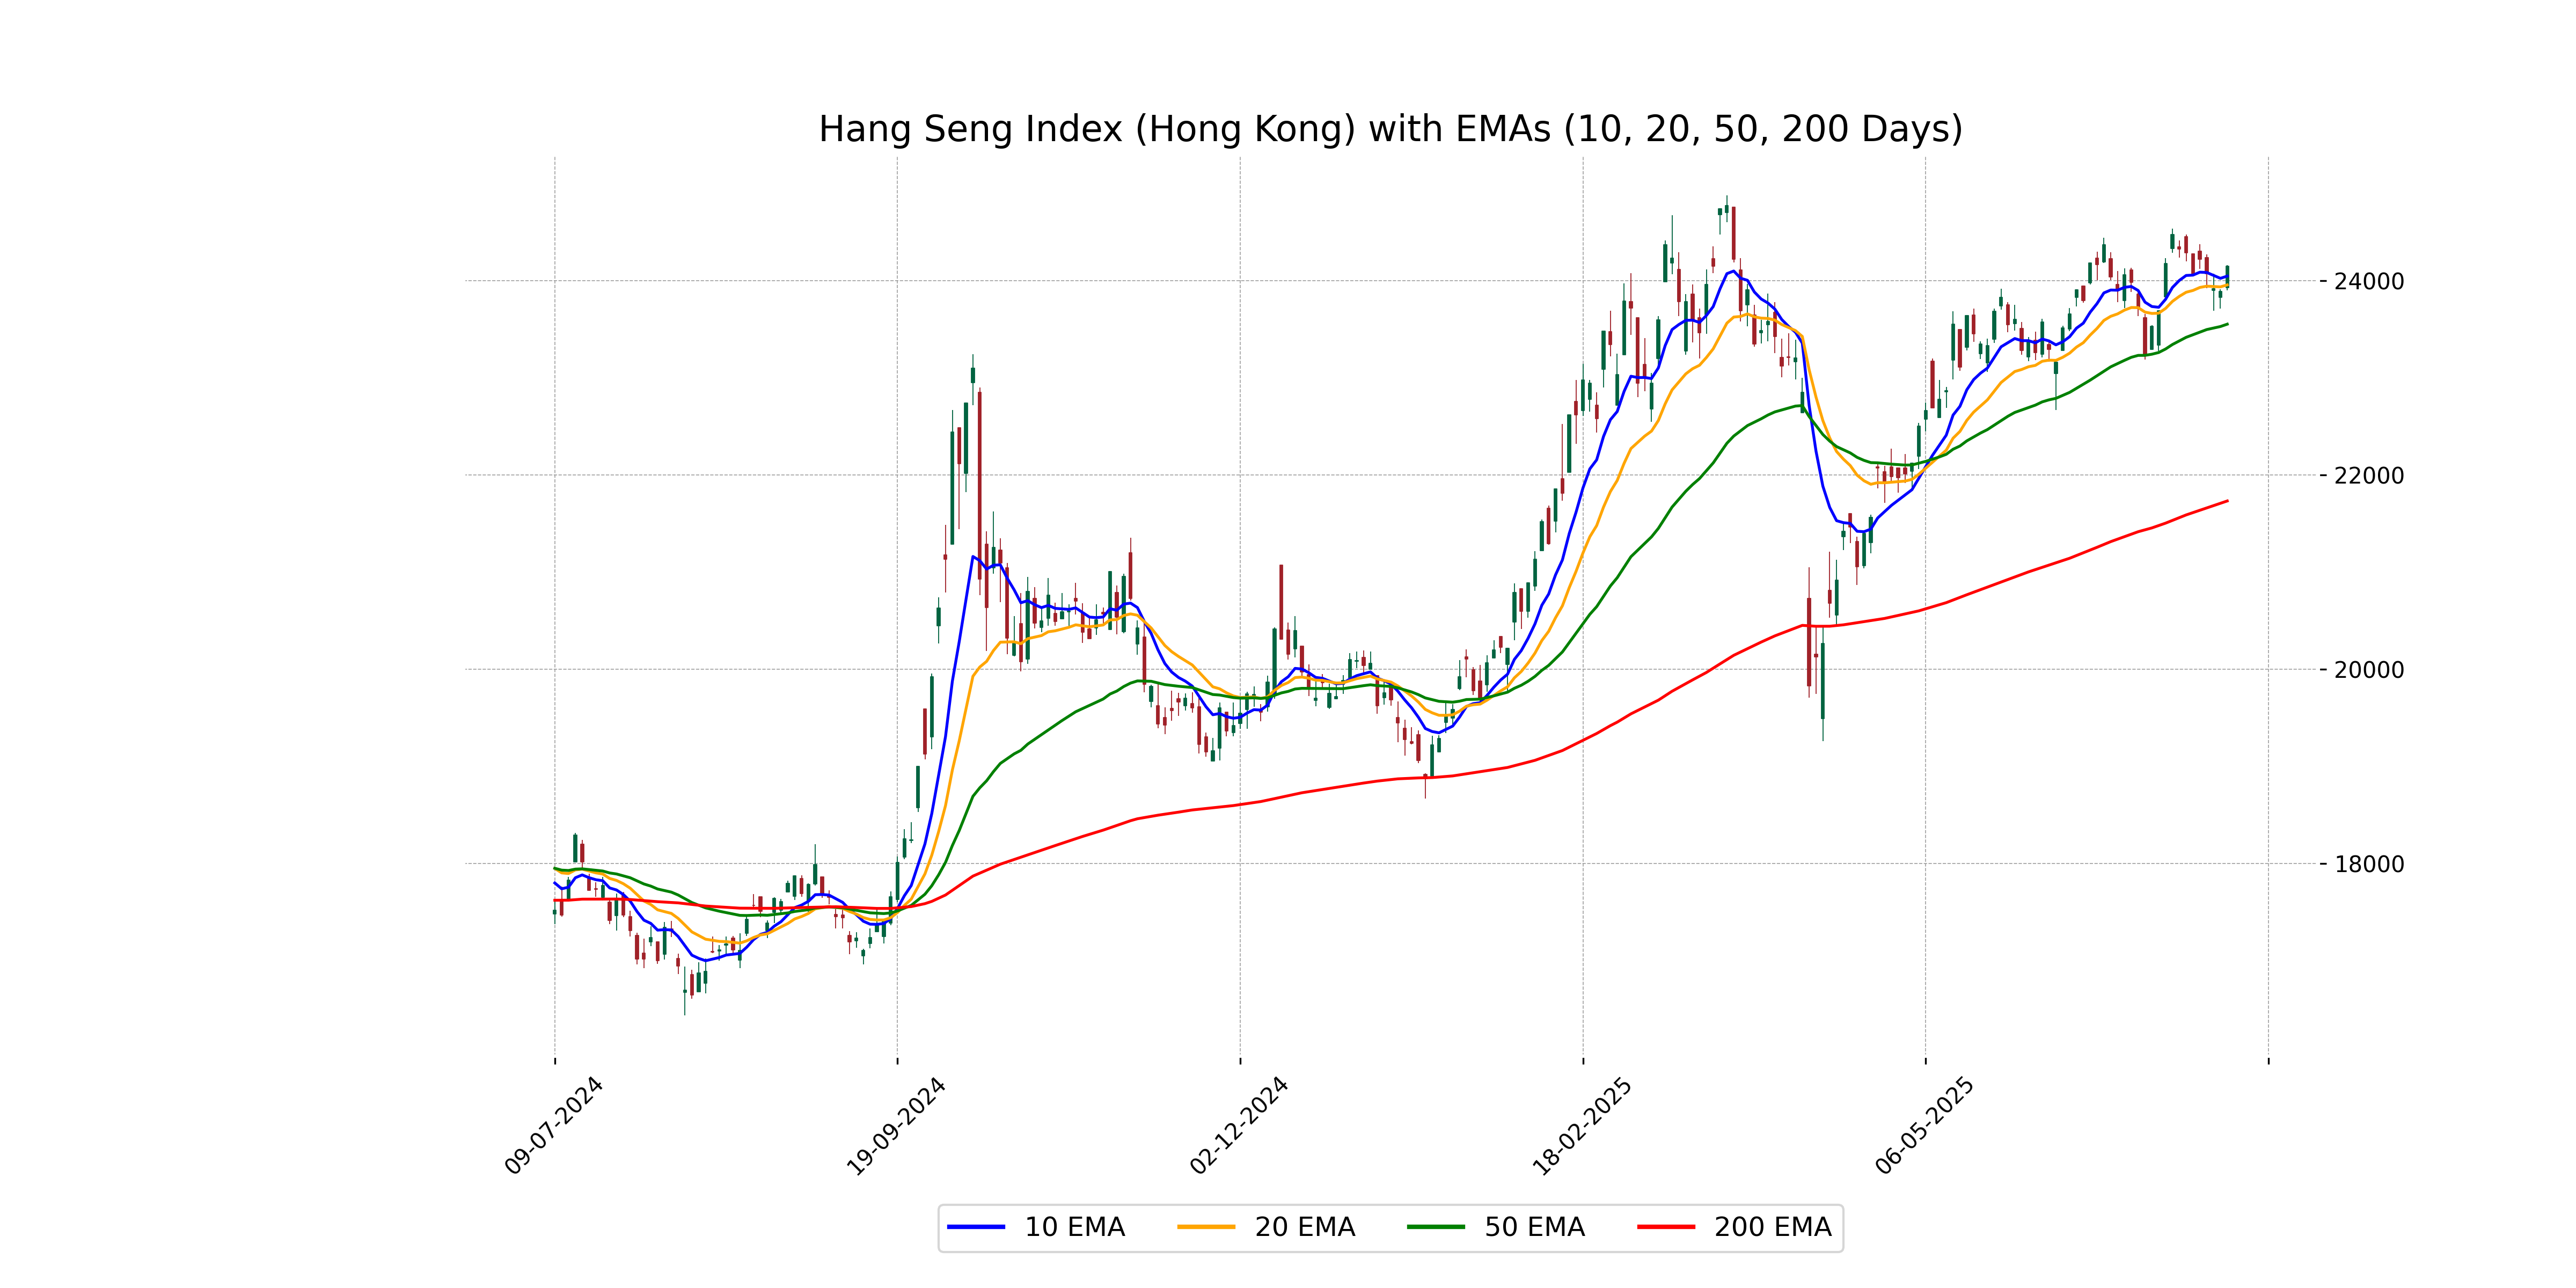
Relationship with Key Moving Averages
Hang Seng Index (Hong Kong) closed above its 50-day EMA at 24,148, indicating a short-term bullish trend. The current close is also above the 10-day EMA of 24,045 and the 20-day EMA of 23,955, suggesting positive momentum. However, the index is significantly higher than the 200-day EMA of 21,732, indicating a long-term upward movement.
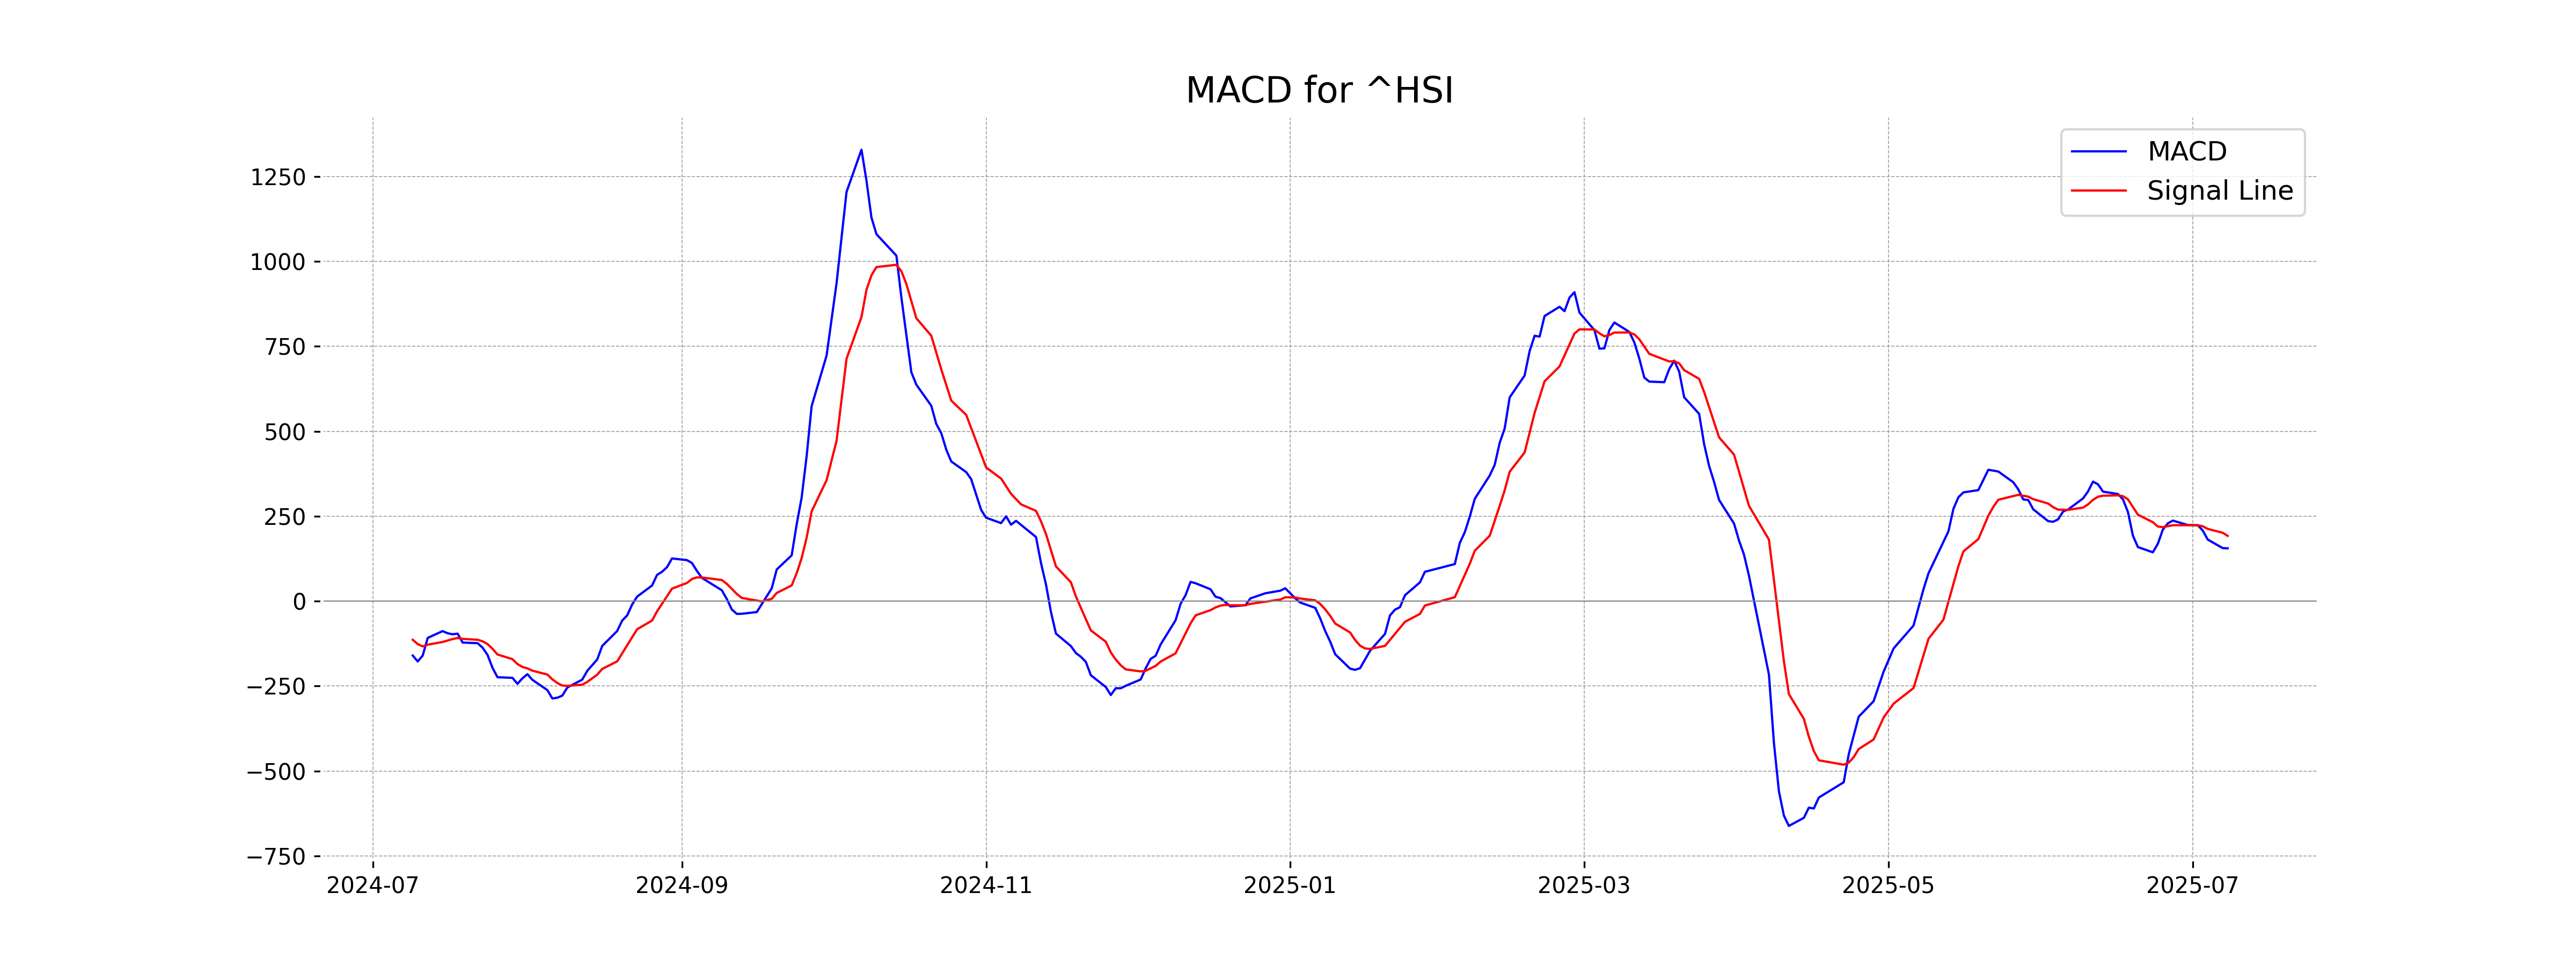
Moving Averages Trend (MACD)
The Hang Seng Index displays a MACD of 155.31 and a MACD signal of 192.02, indicating the MACD line is below the signal line. This suggests a potential bearish trend, as the MACD is not confirming bullish momentum.
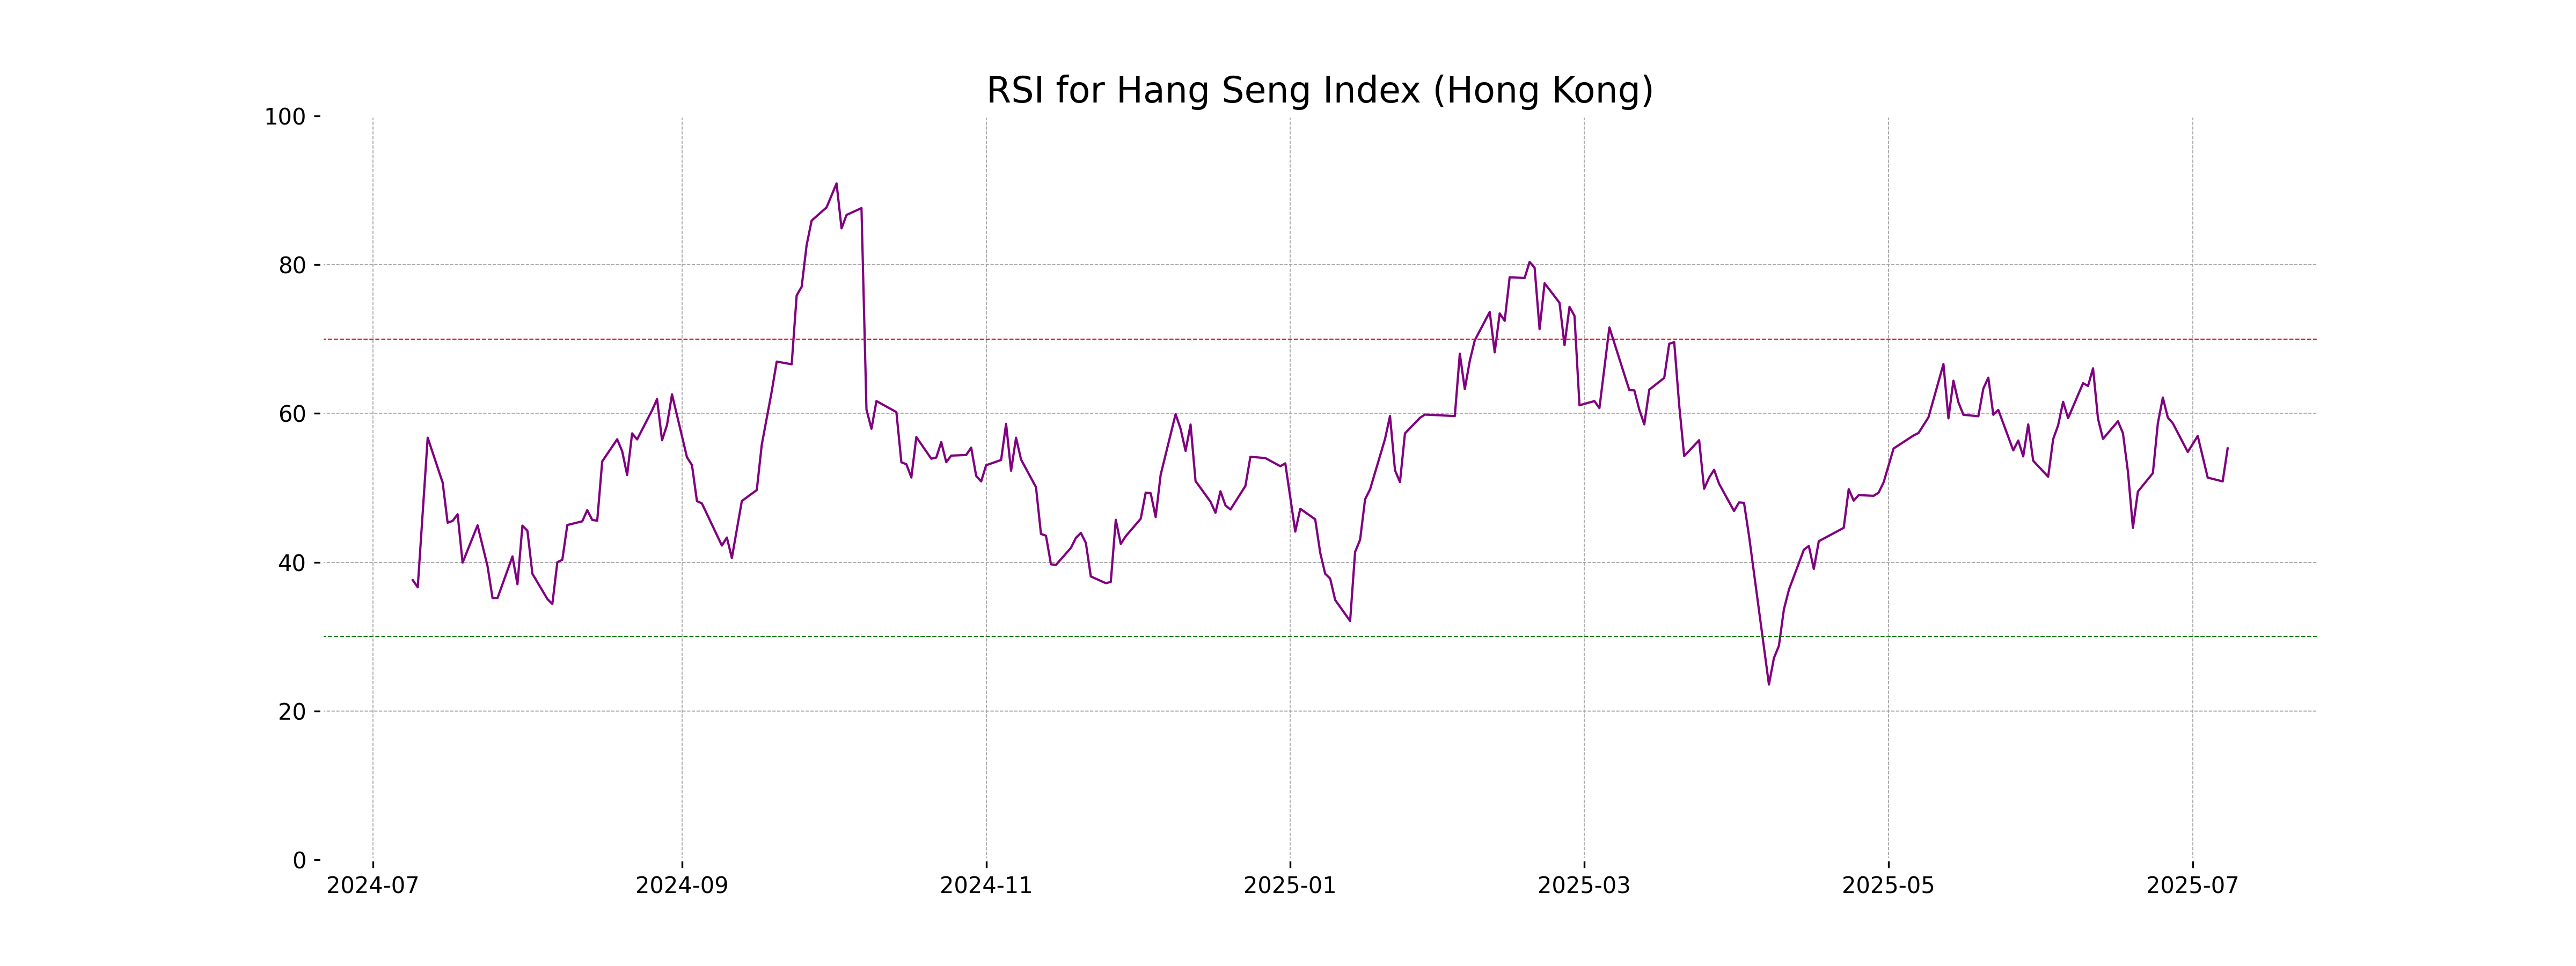
RSI Analysis
The RSI (Relative Strength Index) for the Hang Seng Index is at 55.31, indicating a neutral zone as it is between the typical overbought (above 70) and oversold (below 30) levels. This suggests that the index is neither strongly overvalued nor undervalued at the current time.
Analysis for IBEX 35 (Spain) - July 08, 2025
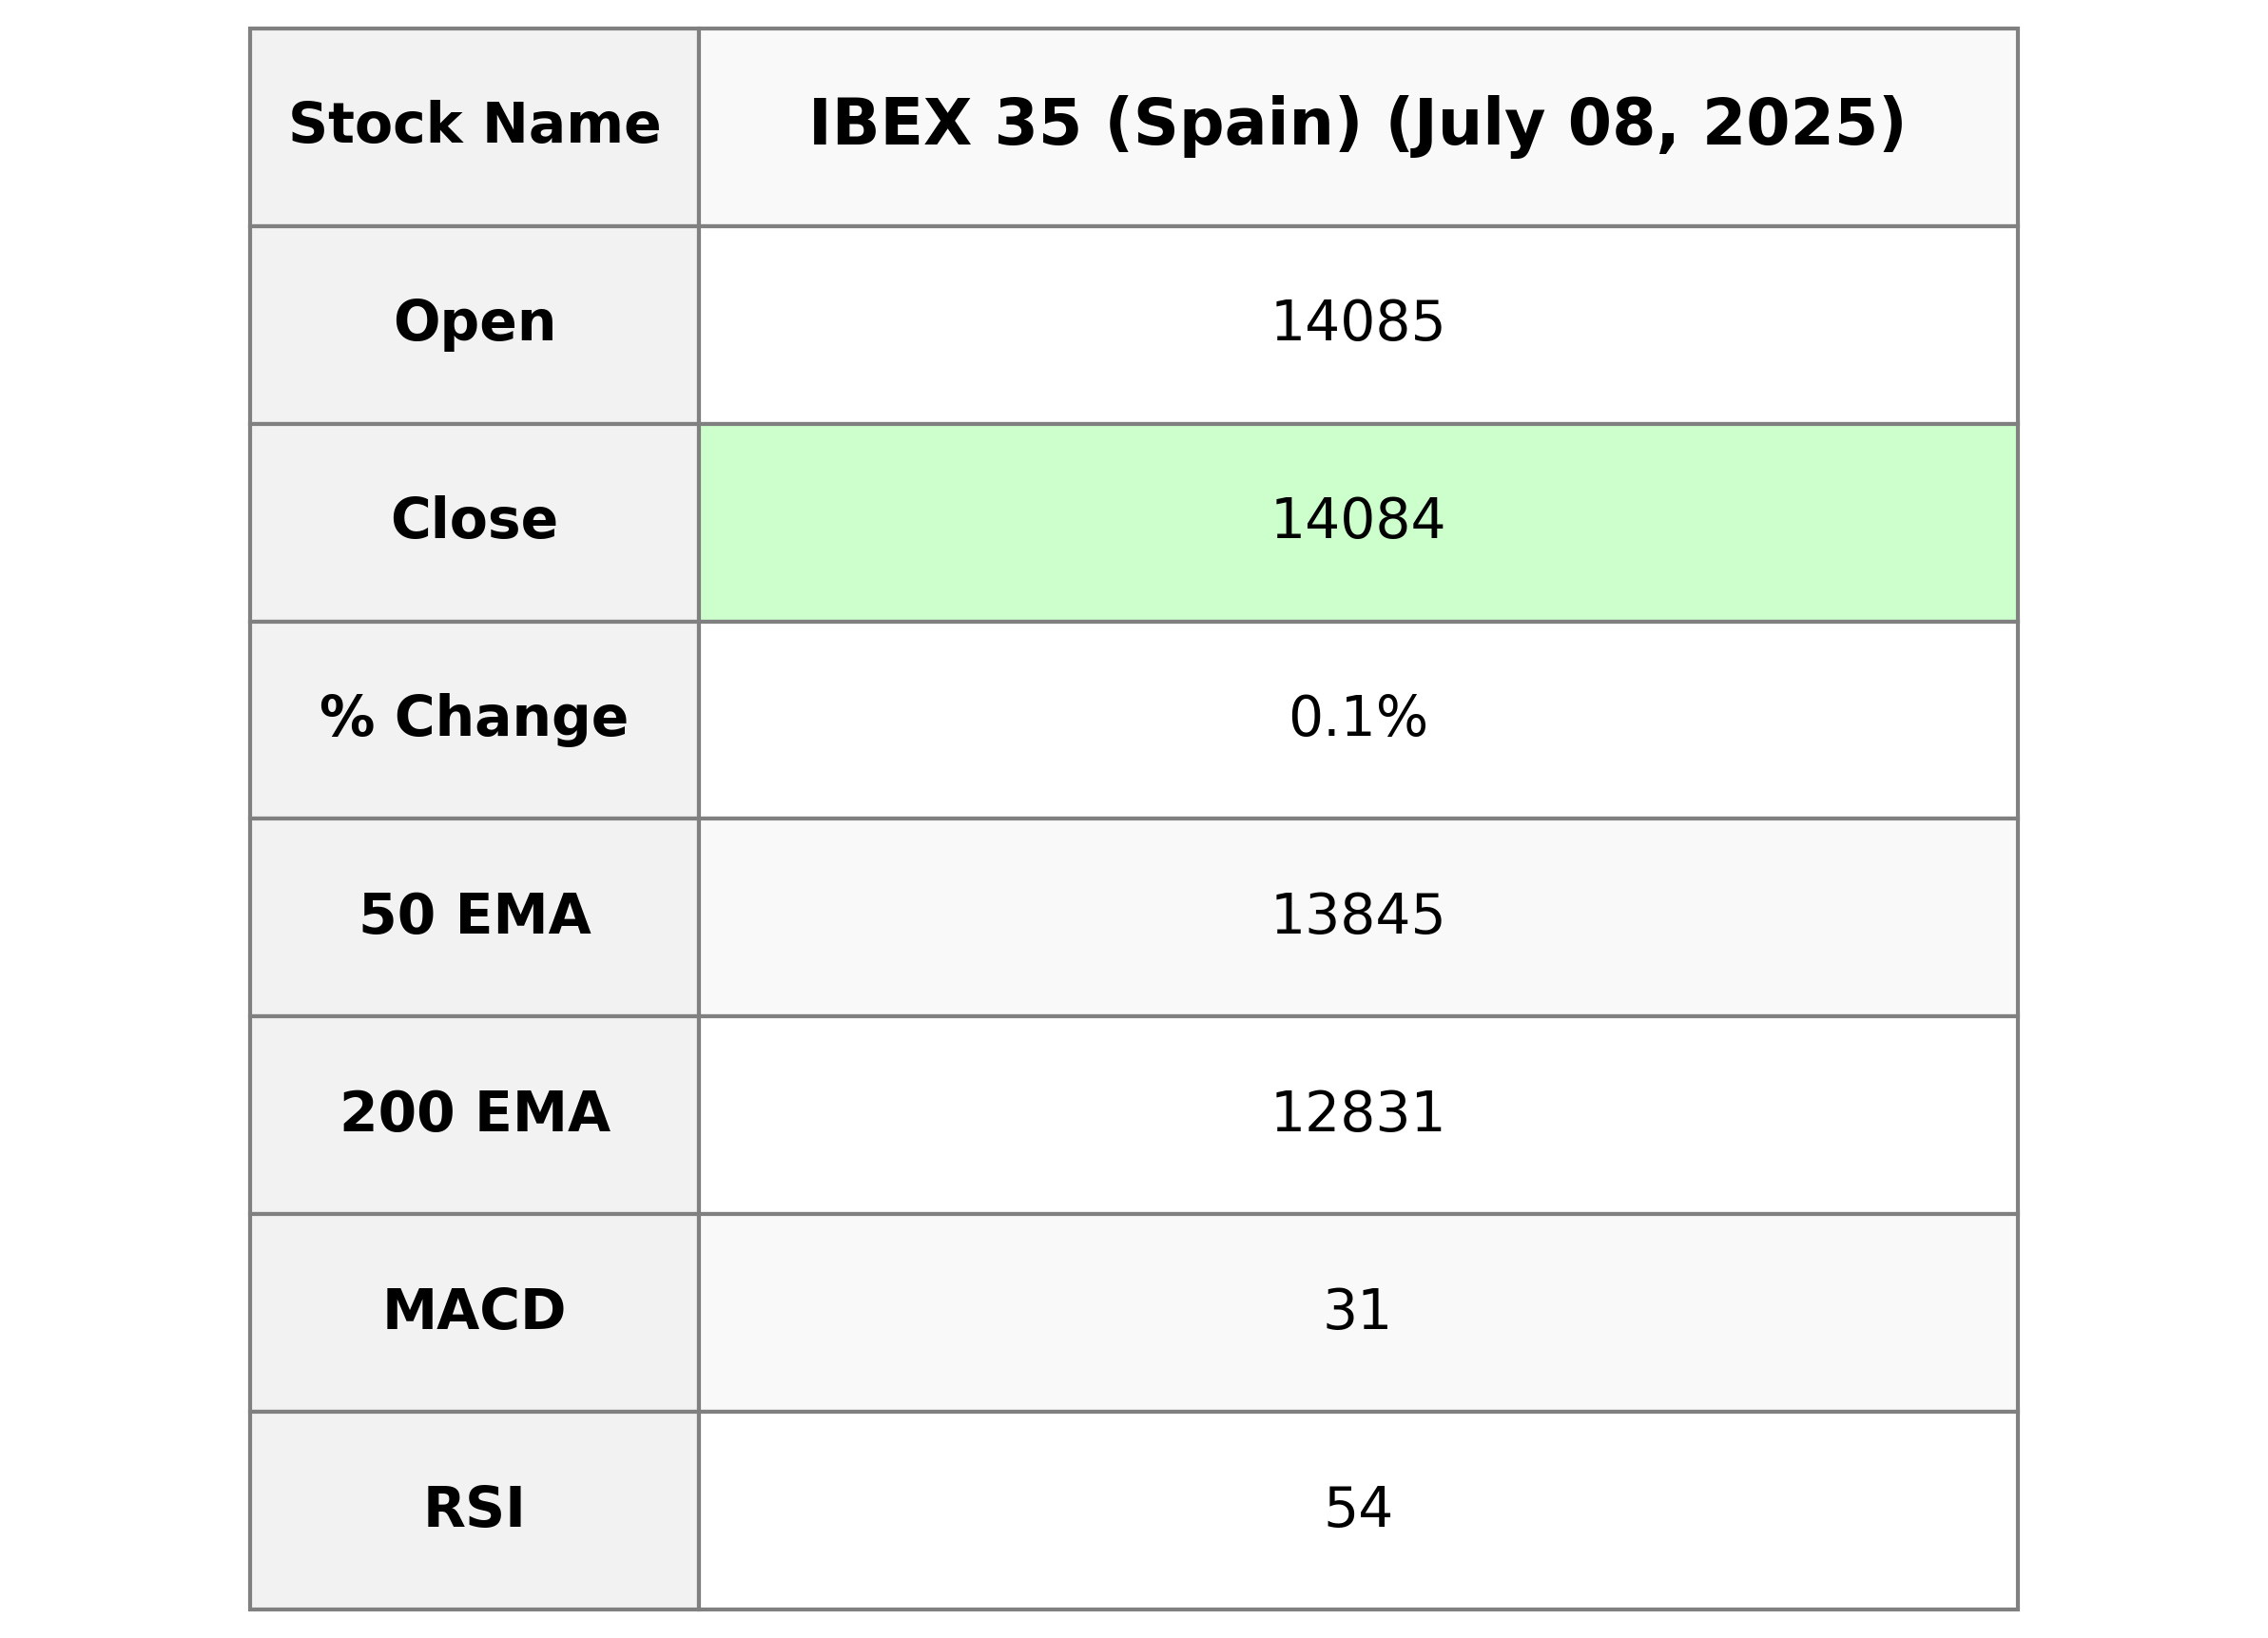
The IBEX 35 (Spain) opened at 14,085.30 and closed slightly higher at 14,084.10, marking a small positive change of 0.07% with a points increase of 9.30 from the previous close. The index experienced a trading range with a high of 14,117.90 and a low of 14,051.20. Technical indicators show a MACD of 31.45, signaling potential upward momentum, while a Relative Strength Index (RSI) of 54.09 suggests moderate strength.
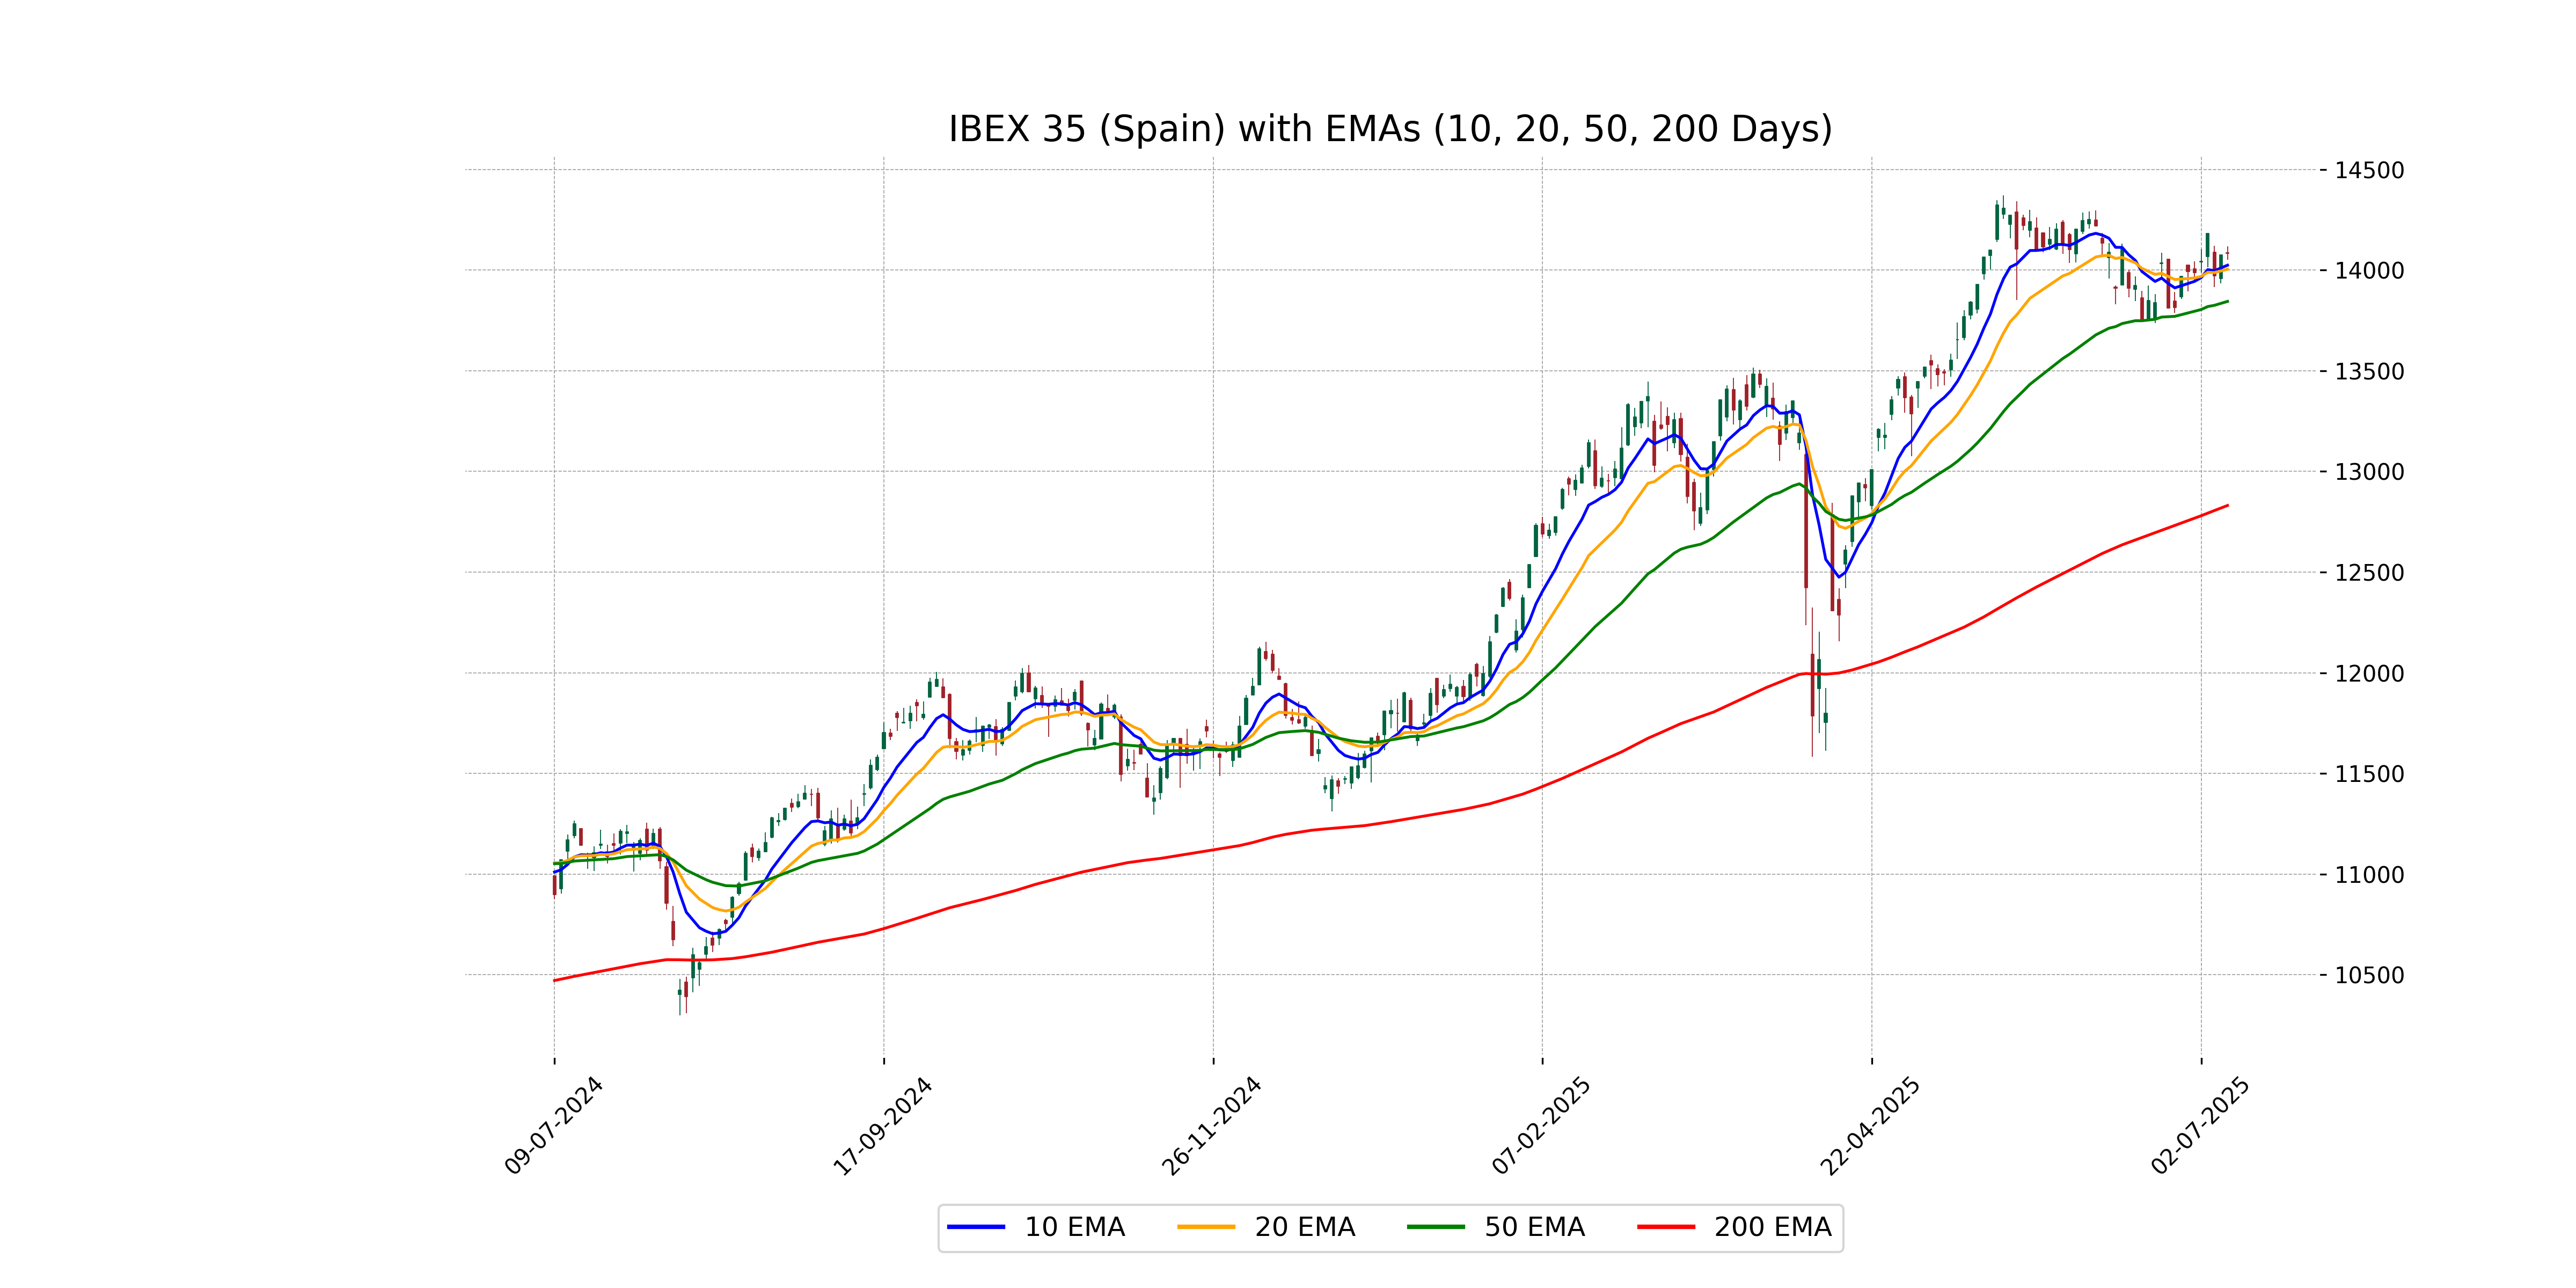
Relationship with Key Moving Averages
IBEX 35 is trading above its key moving averages, with the close price of 14084.10 being higher than the 10-day EMA of 14024.66, the 20-day EMA of 14004.61, and the 50-day EMA of 13844.88, indicating a positive trend. Additionally, its close is well above the 200-day EMA of 12830.98, suggesting a strong longer-term bullish sentiment.
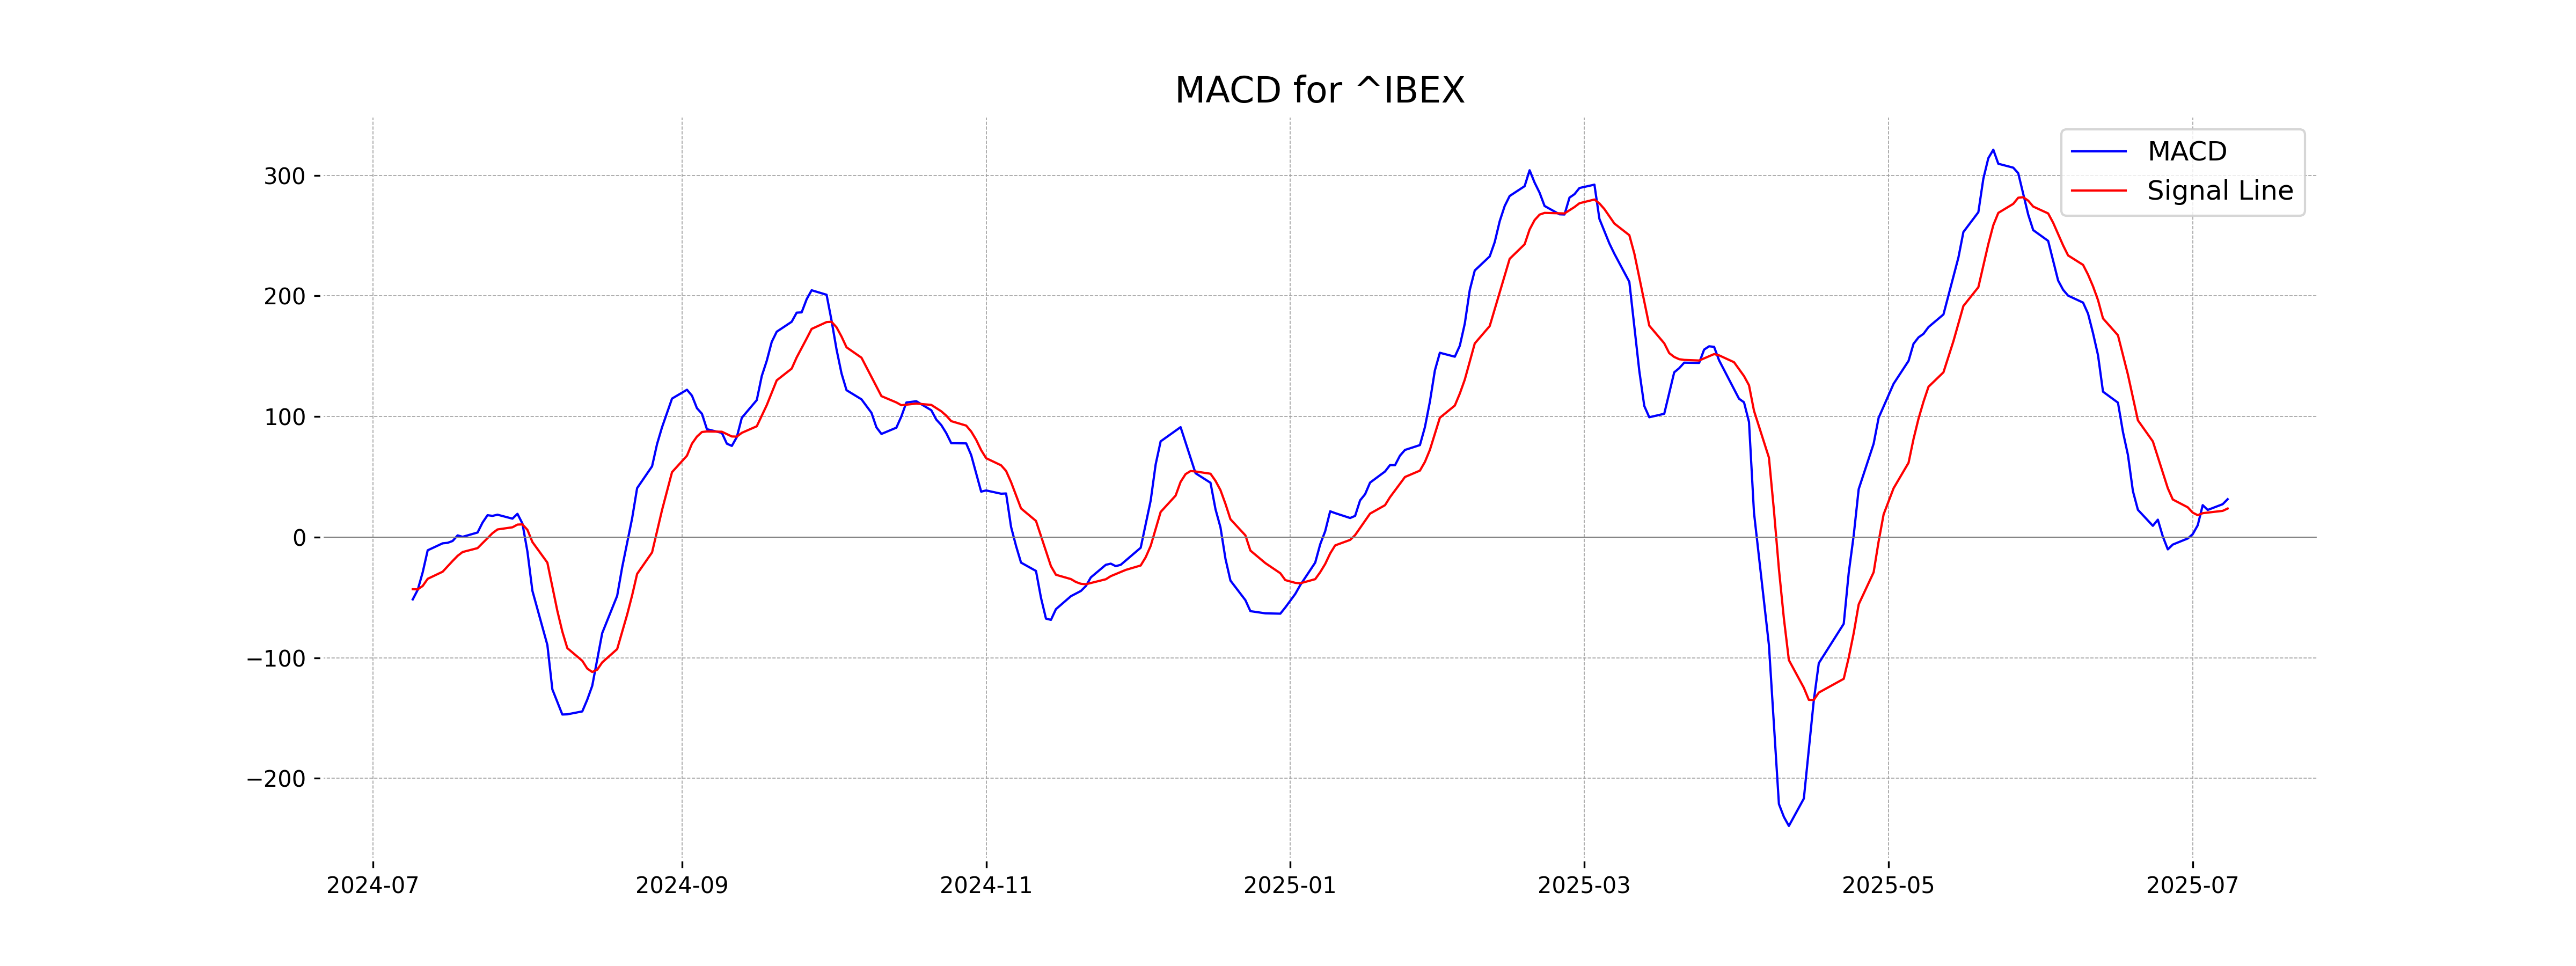
Moving Averages Trend (MACD)
The MACD for IBEX 35 is 31.45, showing a bullish trend as it is above the signal line of 23.71. This indicates increasing positive momentum.
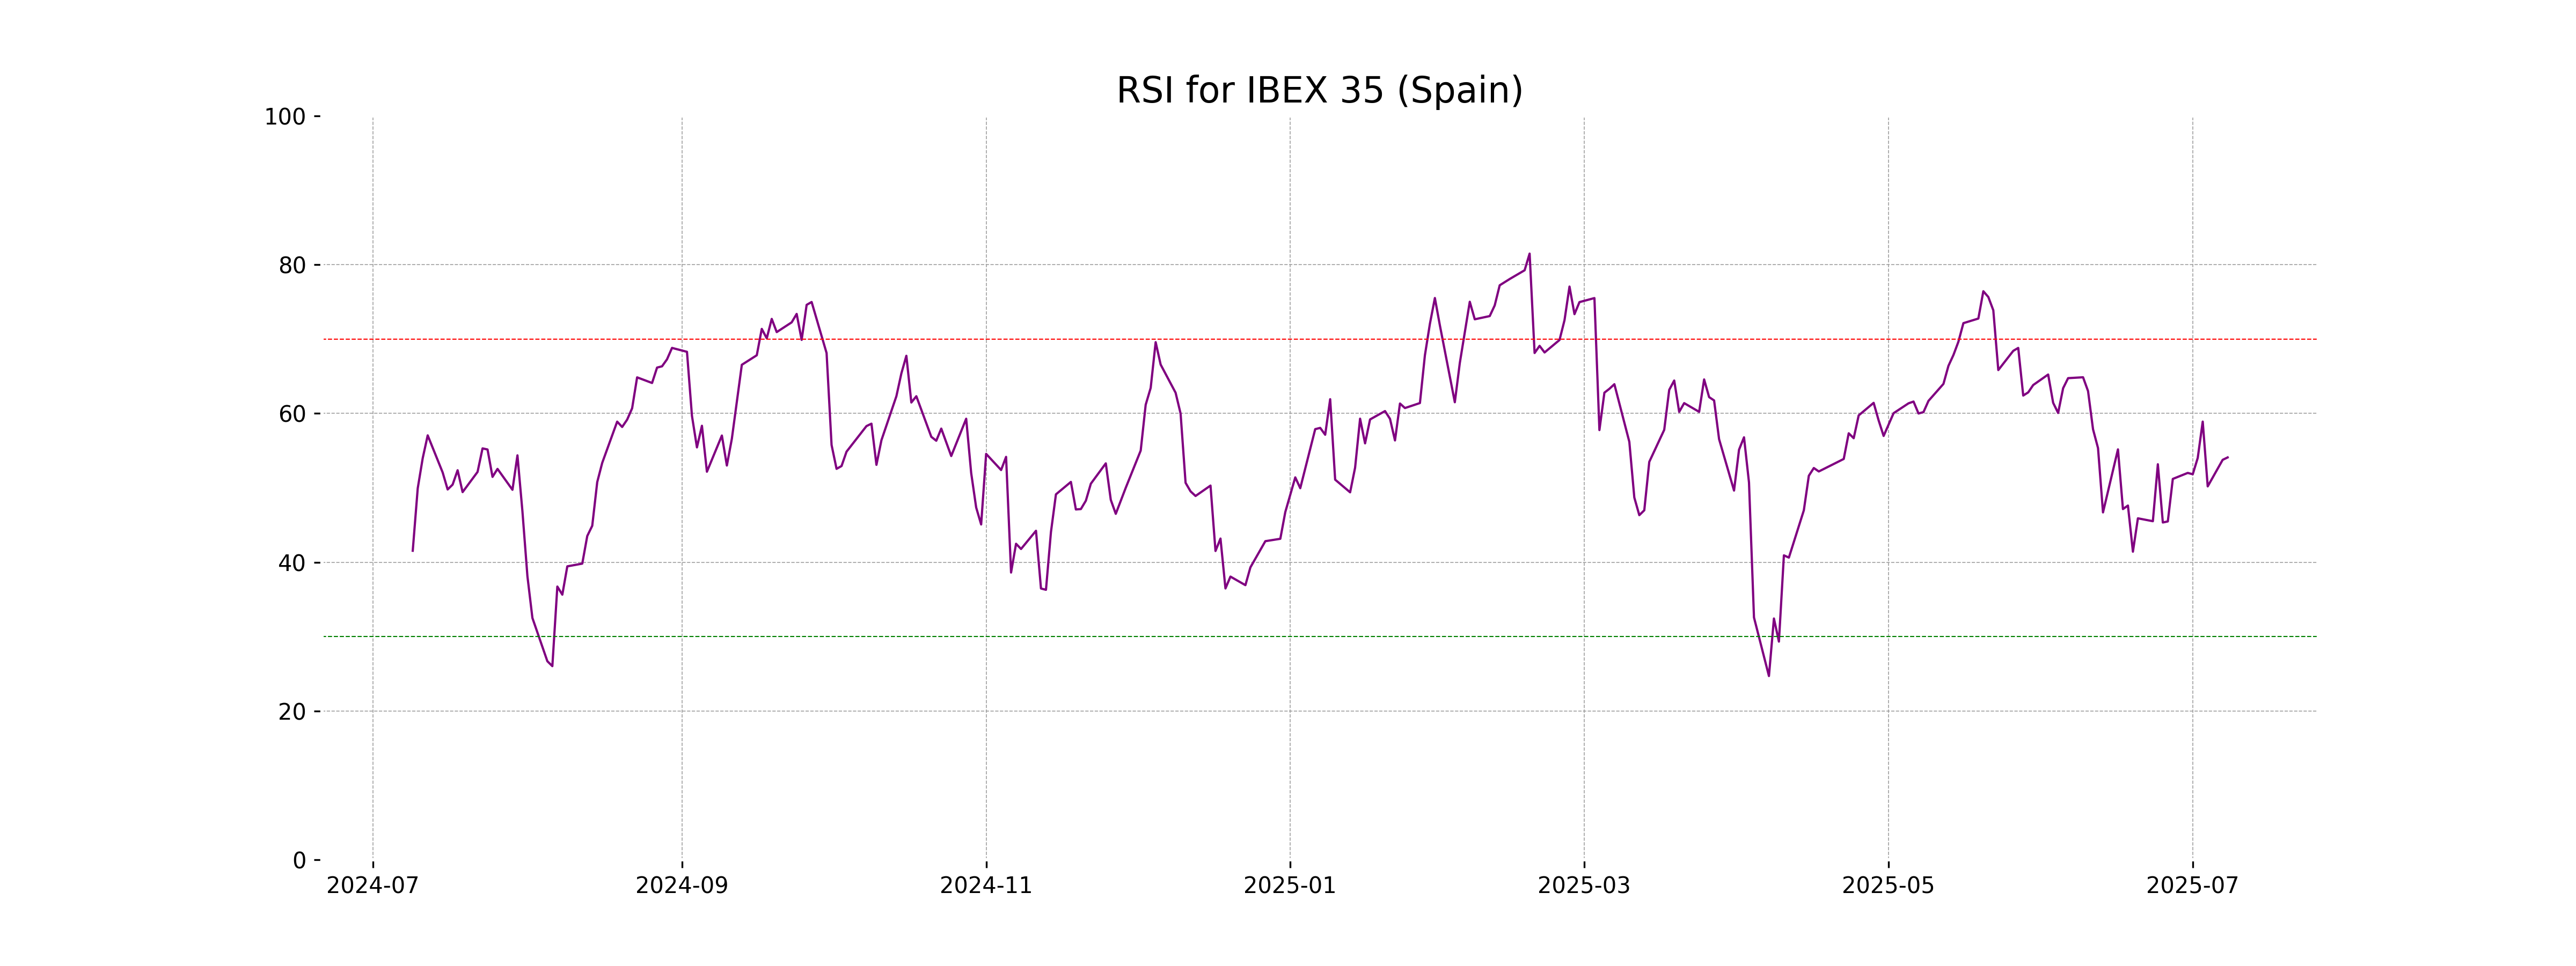
RSI Analysis
The RSI value for IBEX 35 (Spain) is 54.09, which indicates a neutral position as it's between the 30-70 range. This suggests that the index is not currently overbought or oversold, implying stability with no strong trend in either direction.
Analysis for NASDAQ Composite (US) - July 08, 2025
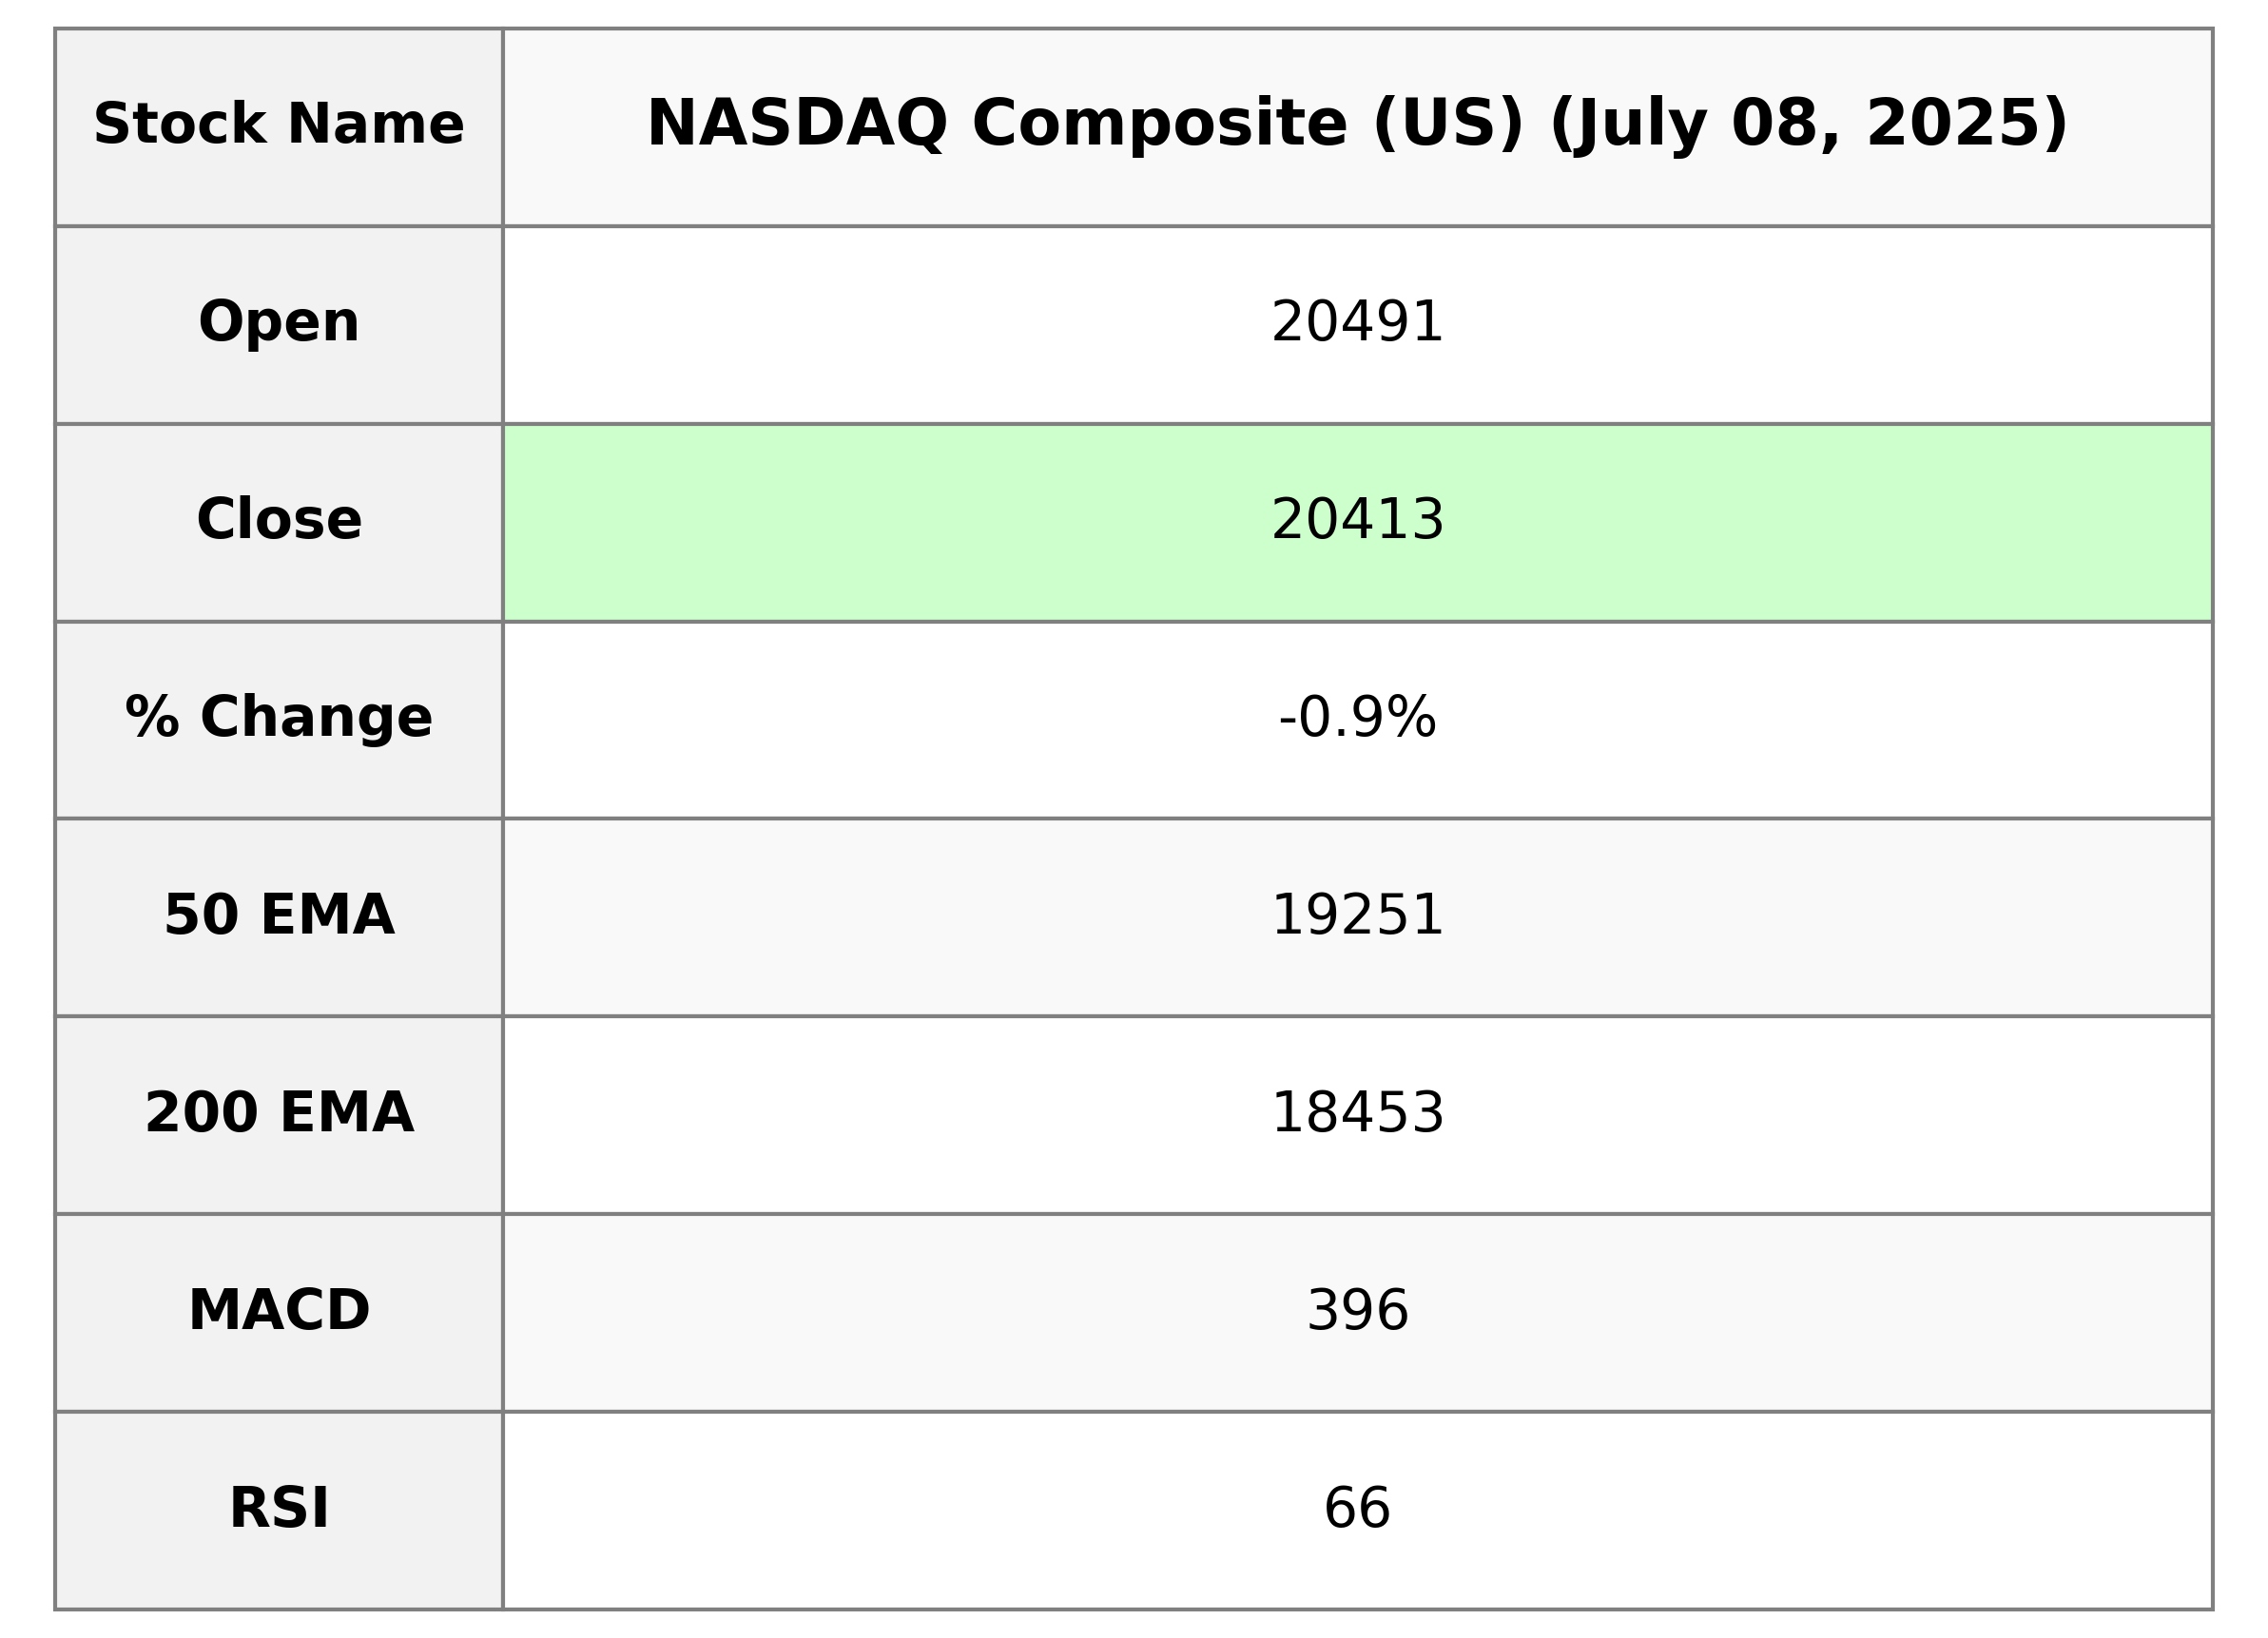
The NASDAQ Composite shows a negative performance with a closing value of 20,412.52, reflecting a decrease of approximately 0.92% or 188.58 points from the previous close. The current RSI is 66.26, indicating it is approaching overbought conditions. The market experienced significant trading activity with a volume of 8.35 billion shares.
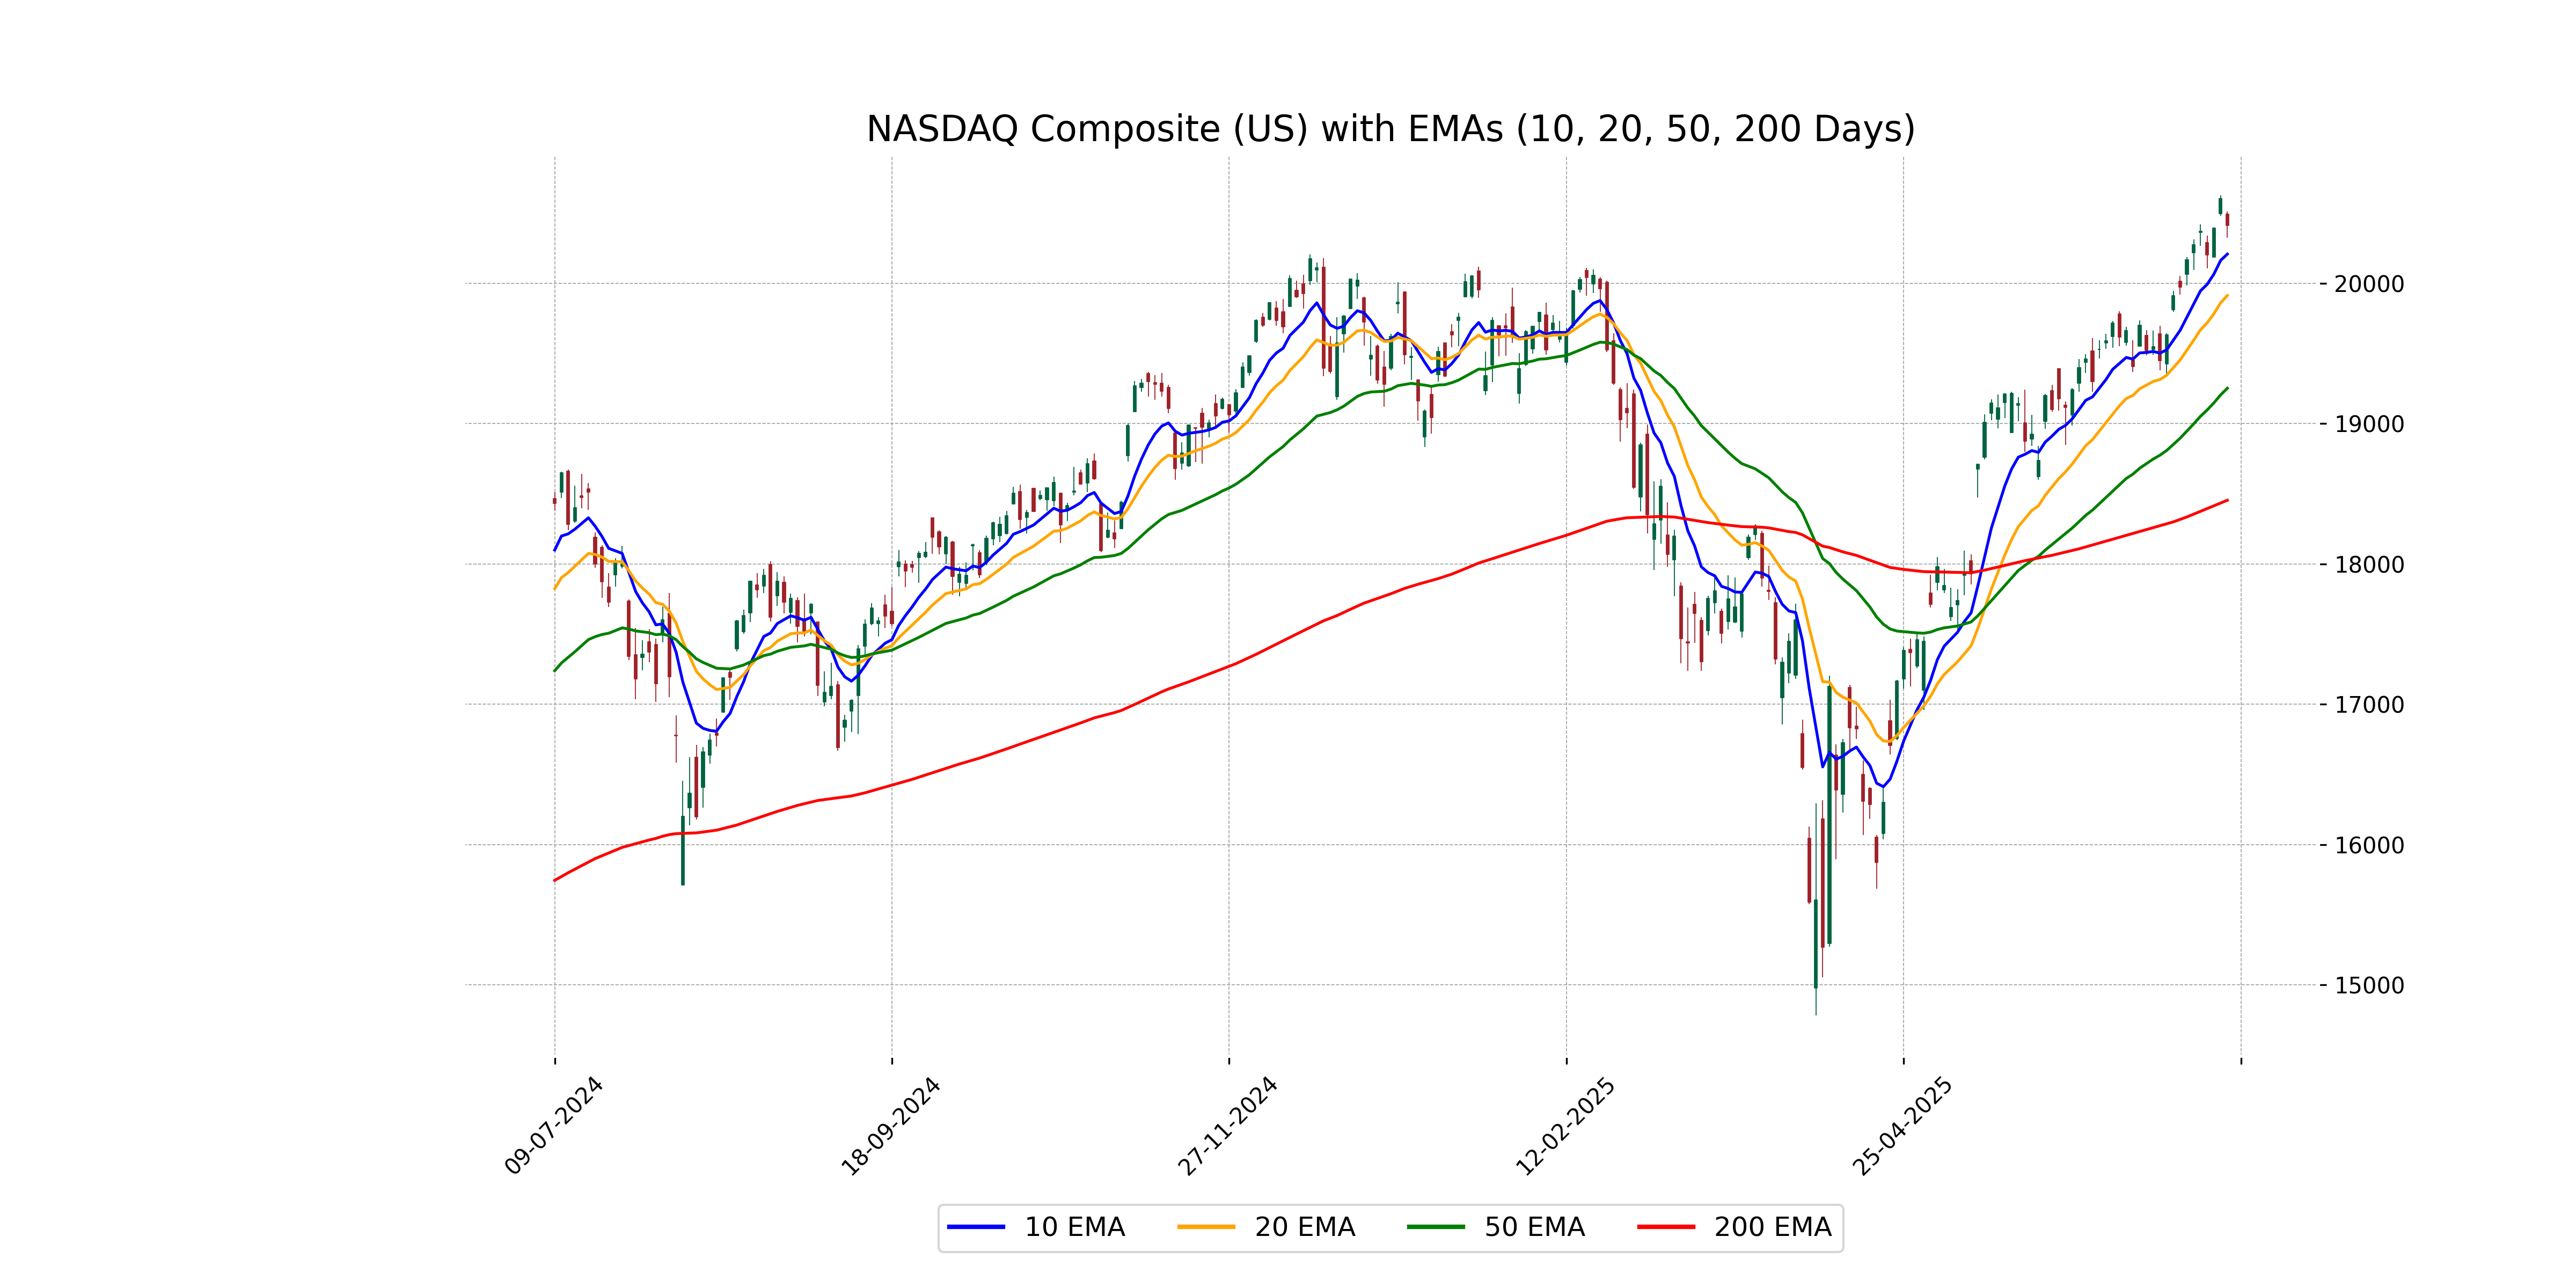
Relationship with Key Moving Averages
The NASDAQ Composite is trading above its 10 EMA of 20207.59 and 20 EMA of 19912.64, indicating short-term strength, yet remains significantly above its 50 EMA of 19251.46 and 200 EMA of 18453.42, suggesting continued bullish momentum over the longer term. Additionally, the negative MACD indicates deceleration in its upward momentum.
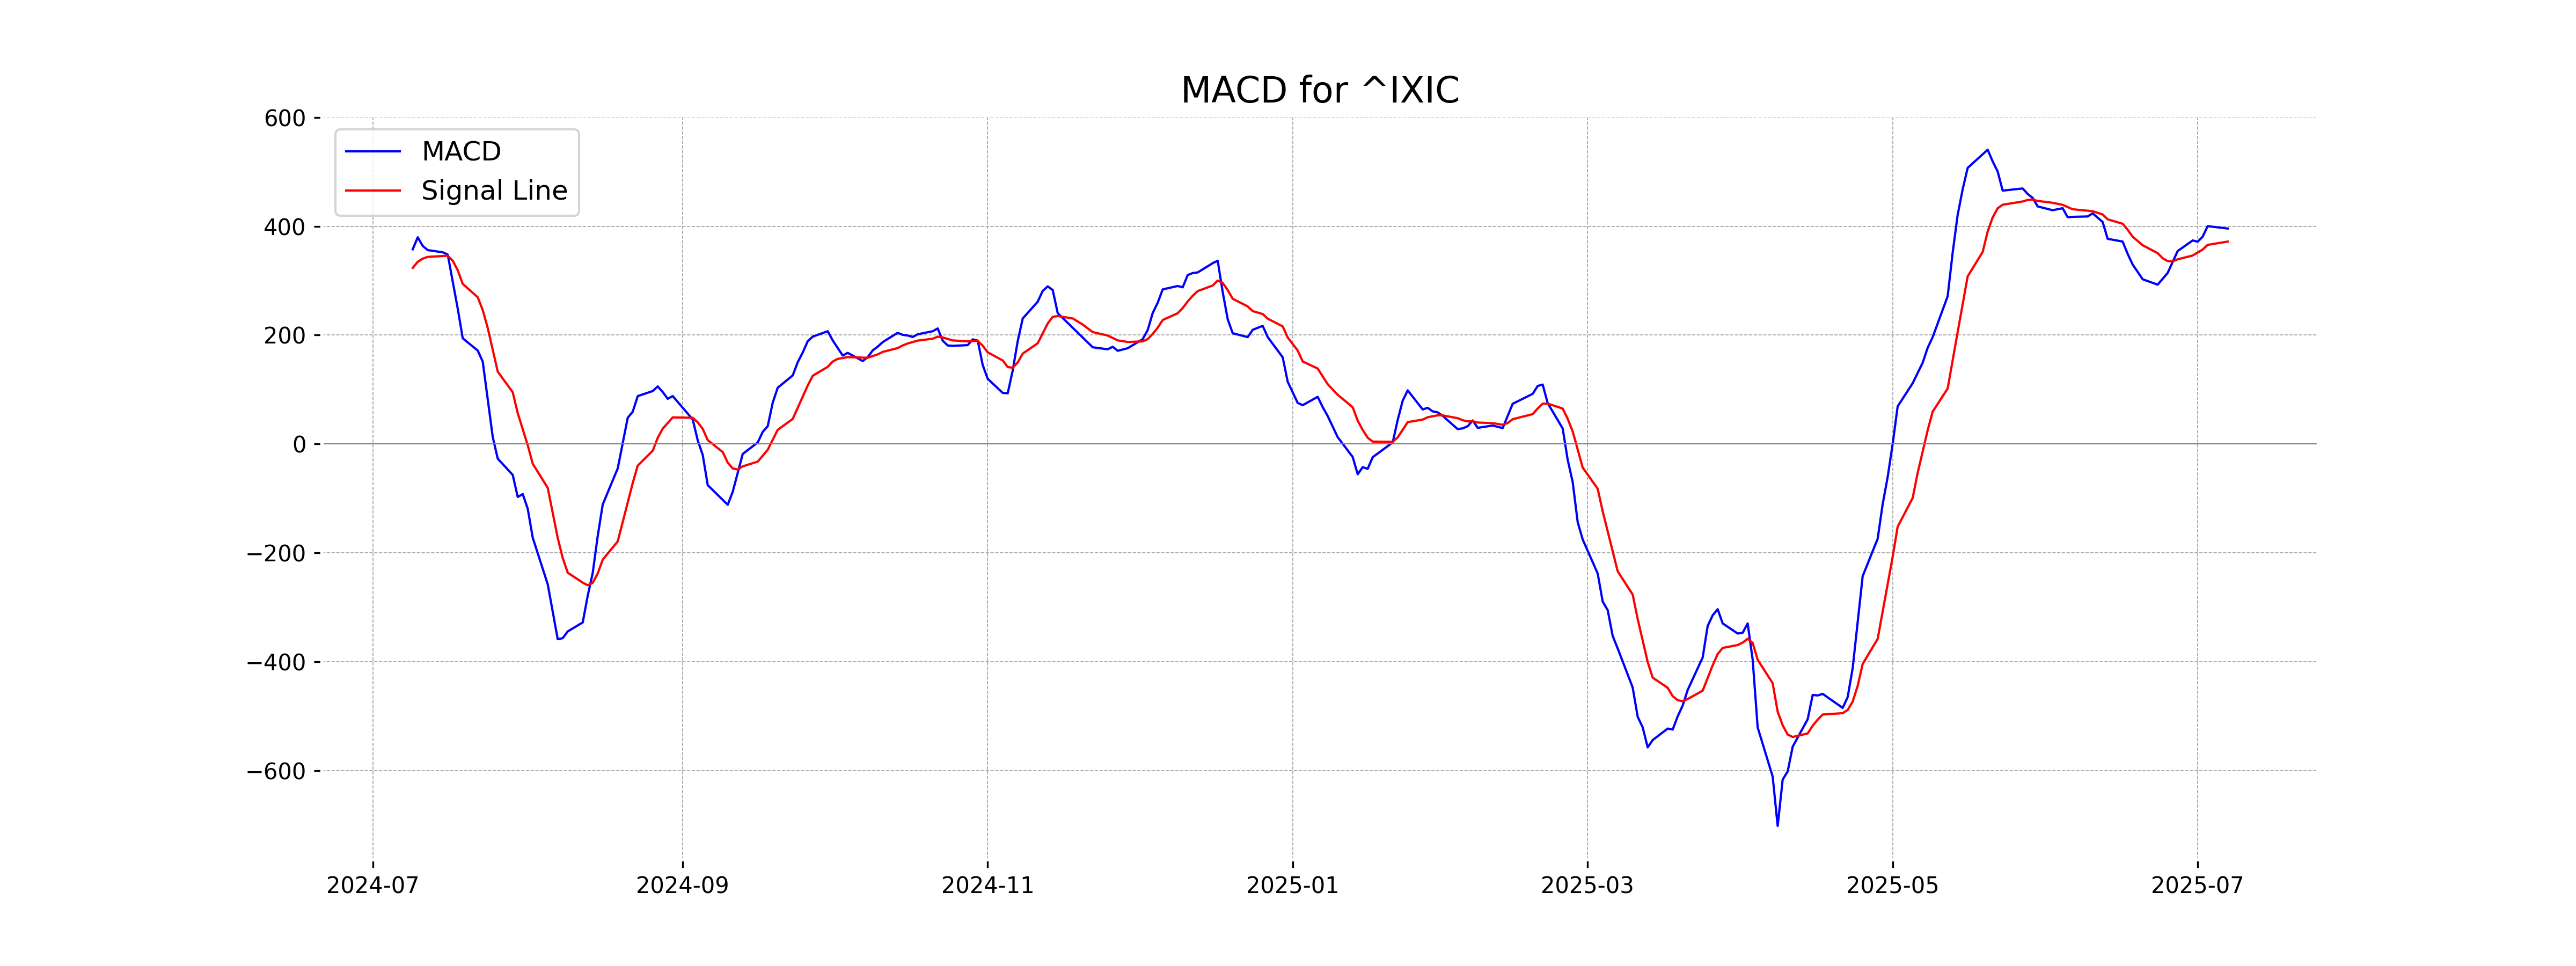
Moving Averages Trend (MACD)
The NASDAQ Composite shows a positive MACD value of 395.78, which is above its signal line of 371.77, indicating a potential uptrend or bullish momentum. The difference between the MACD and the signal line suggests that the market may continue to experience positive momentum in the short term.
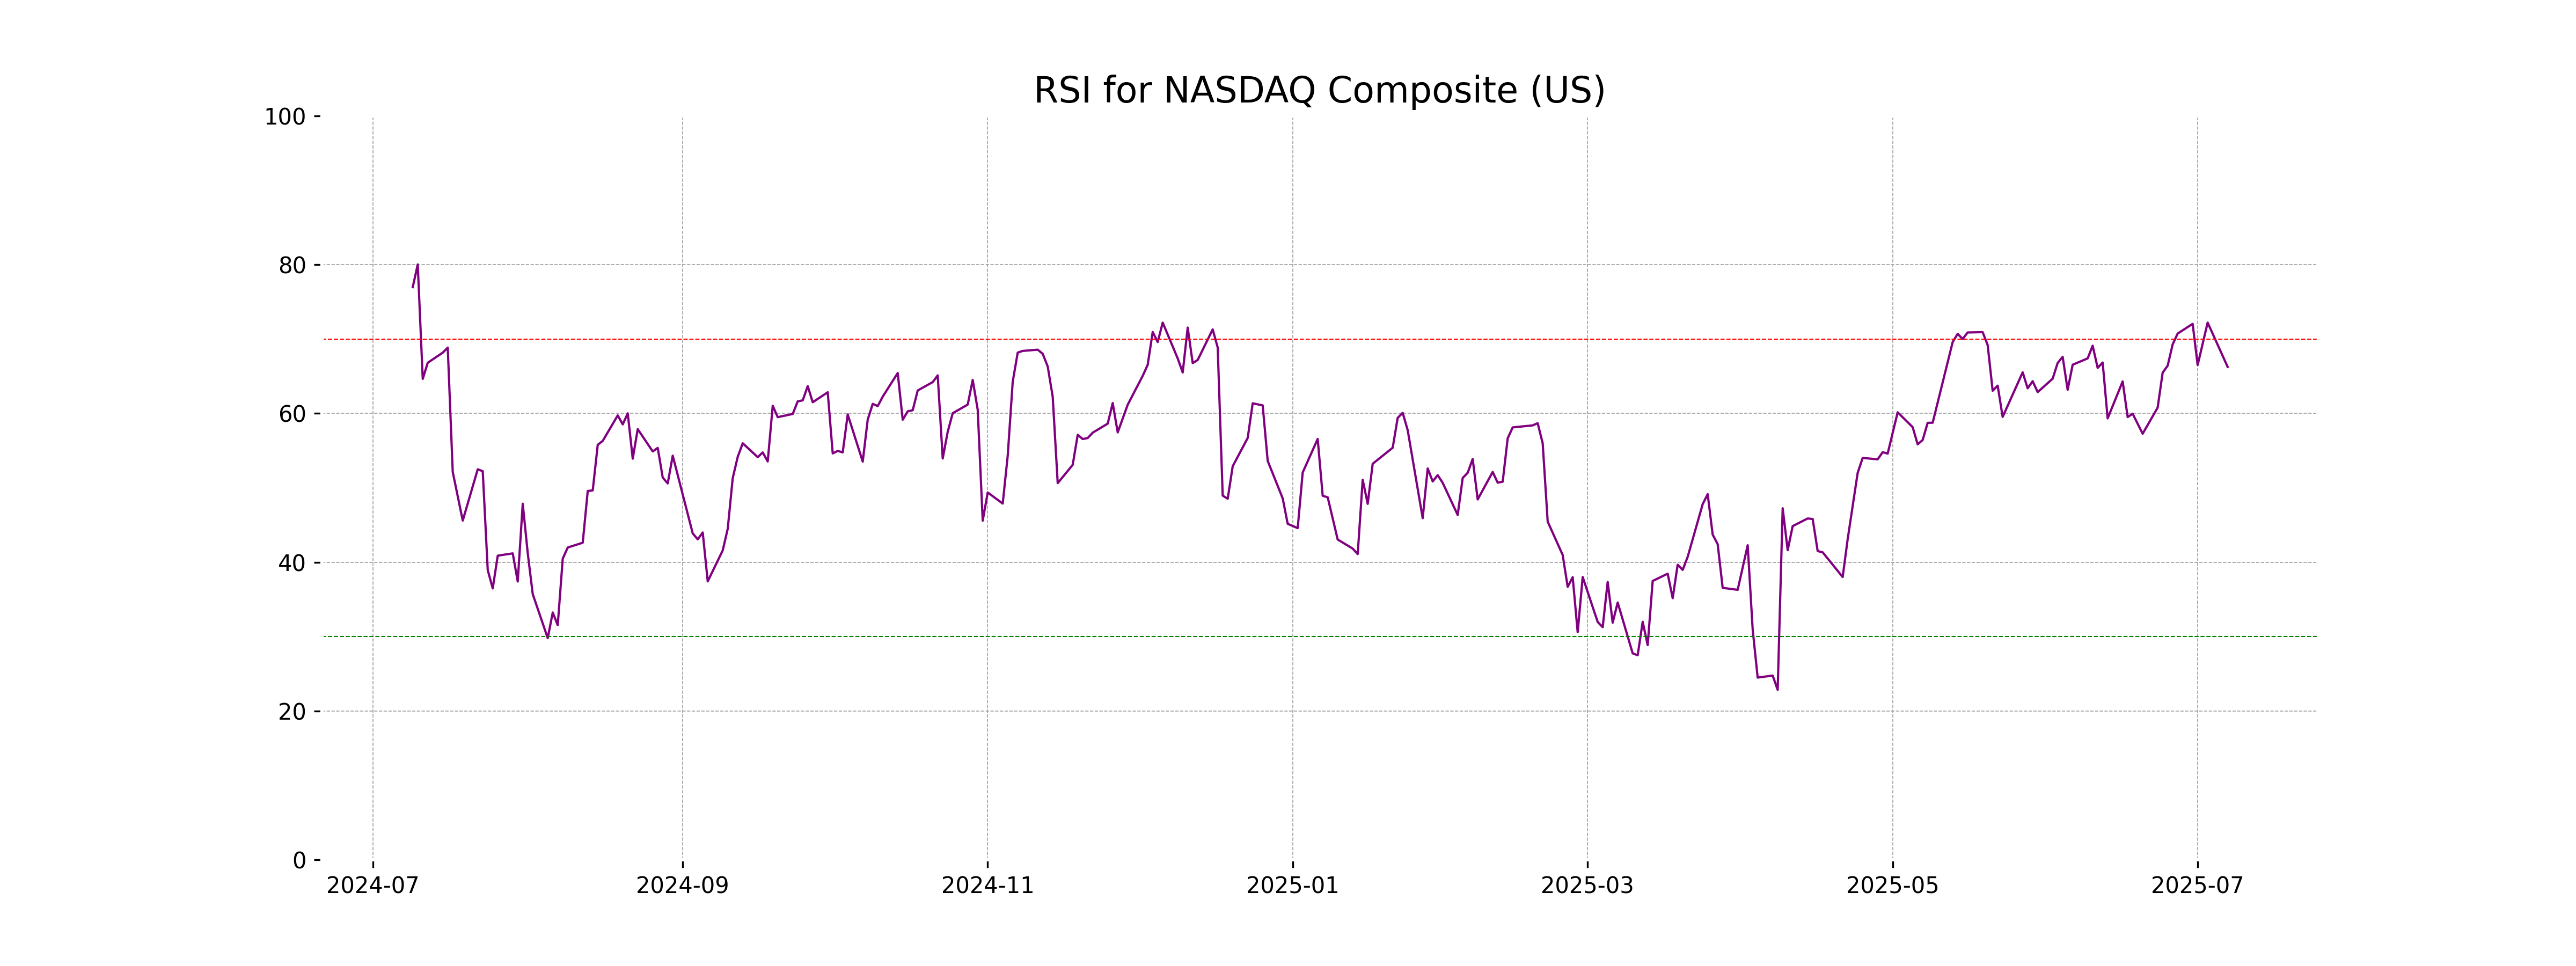
RSI Analysis
The NASDAQ Composite has an RSI of 66.26, suggesting that the index is approaching overbought conditions but is not quite there yet. The RSI indicates strong momentum, and investors should watch for potential shifts if it continues to rise above 70.
Analysis for Nikkei 225 (Japan) - July 08, 2025
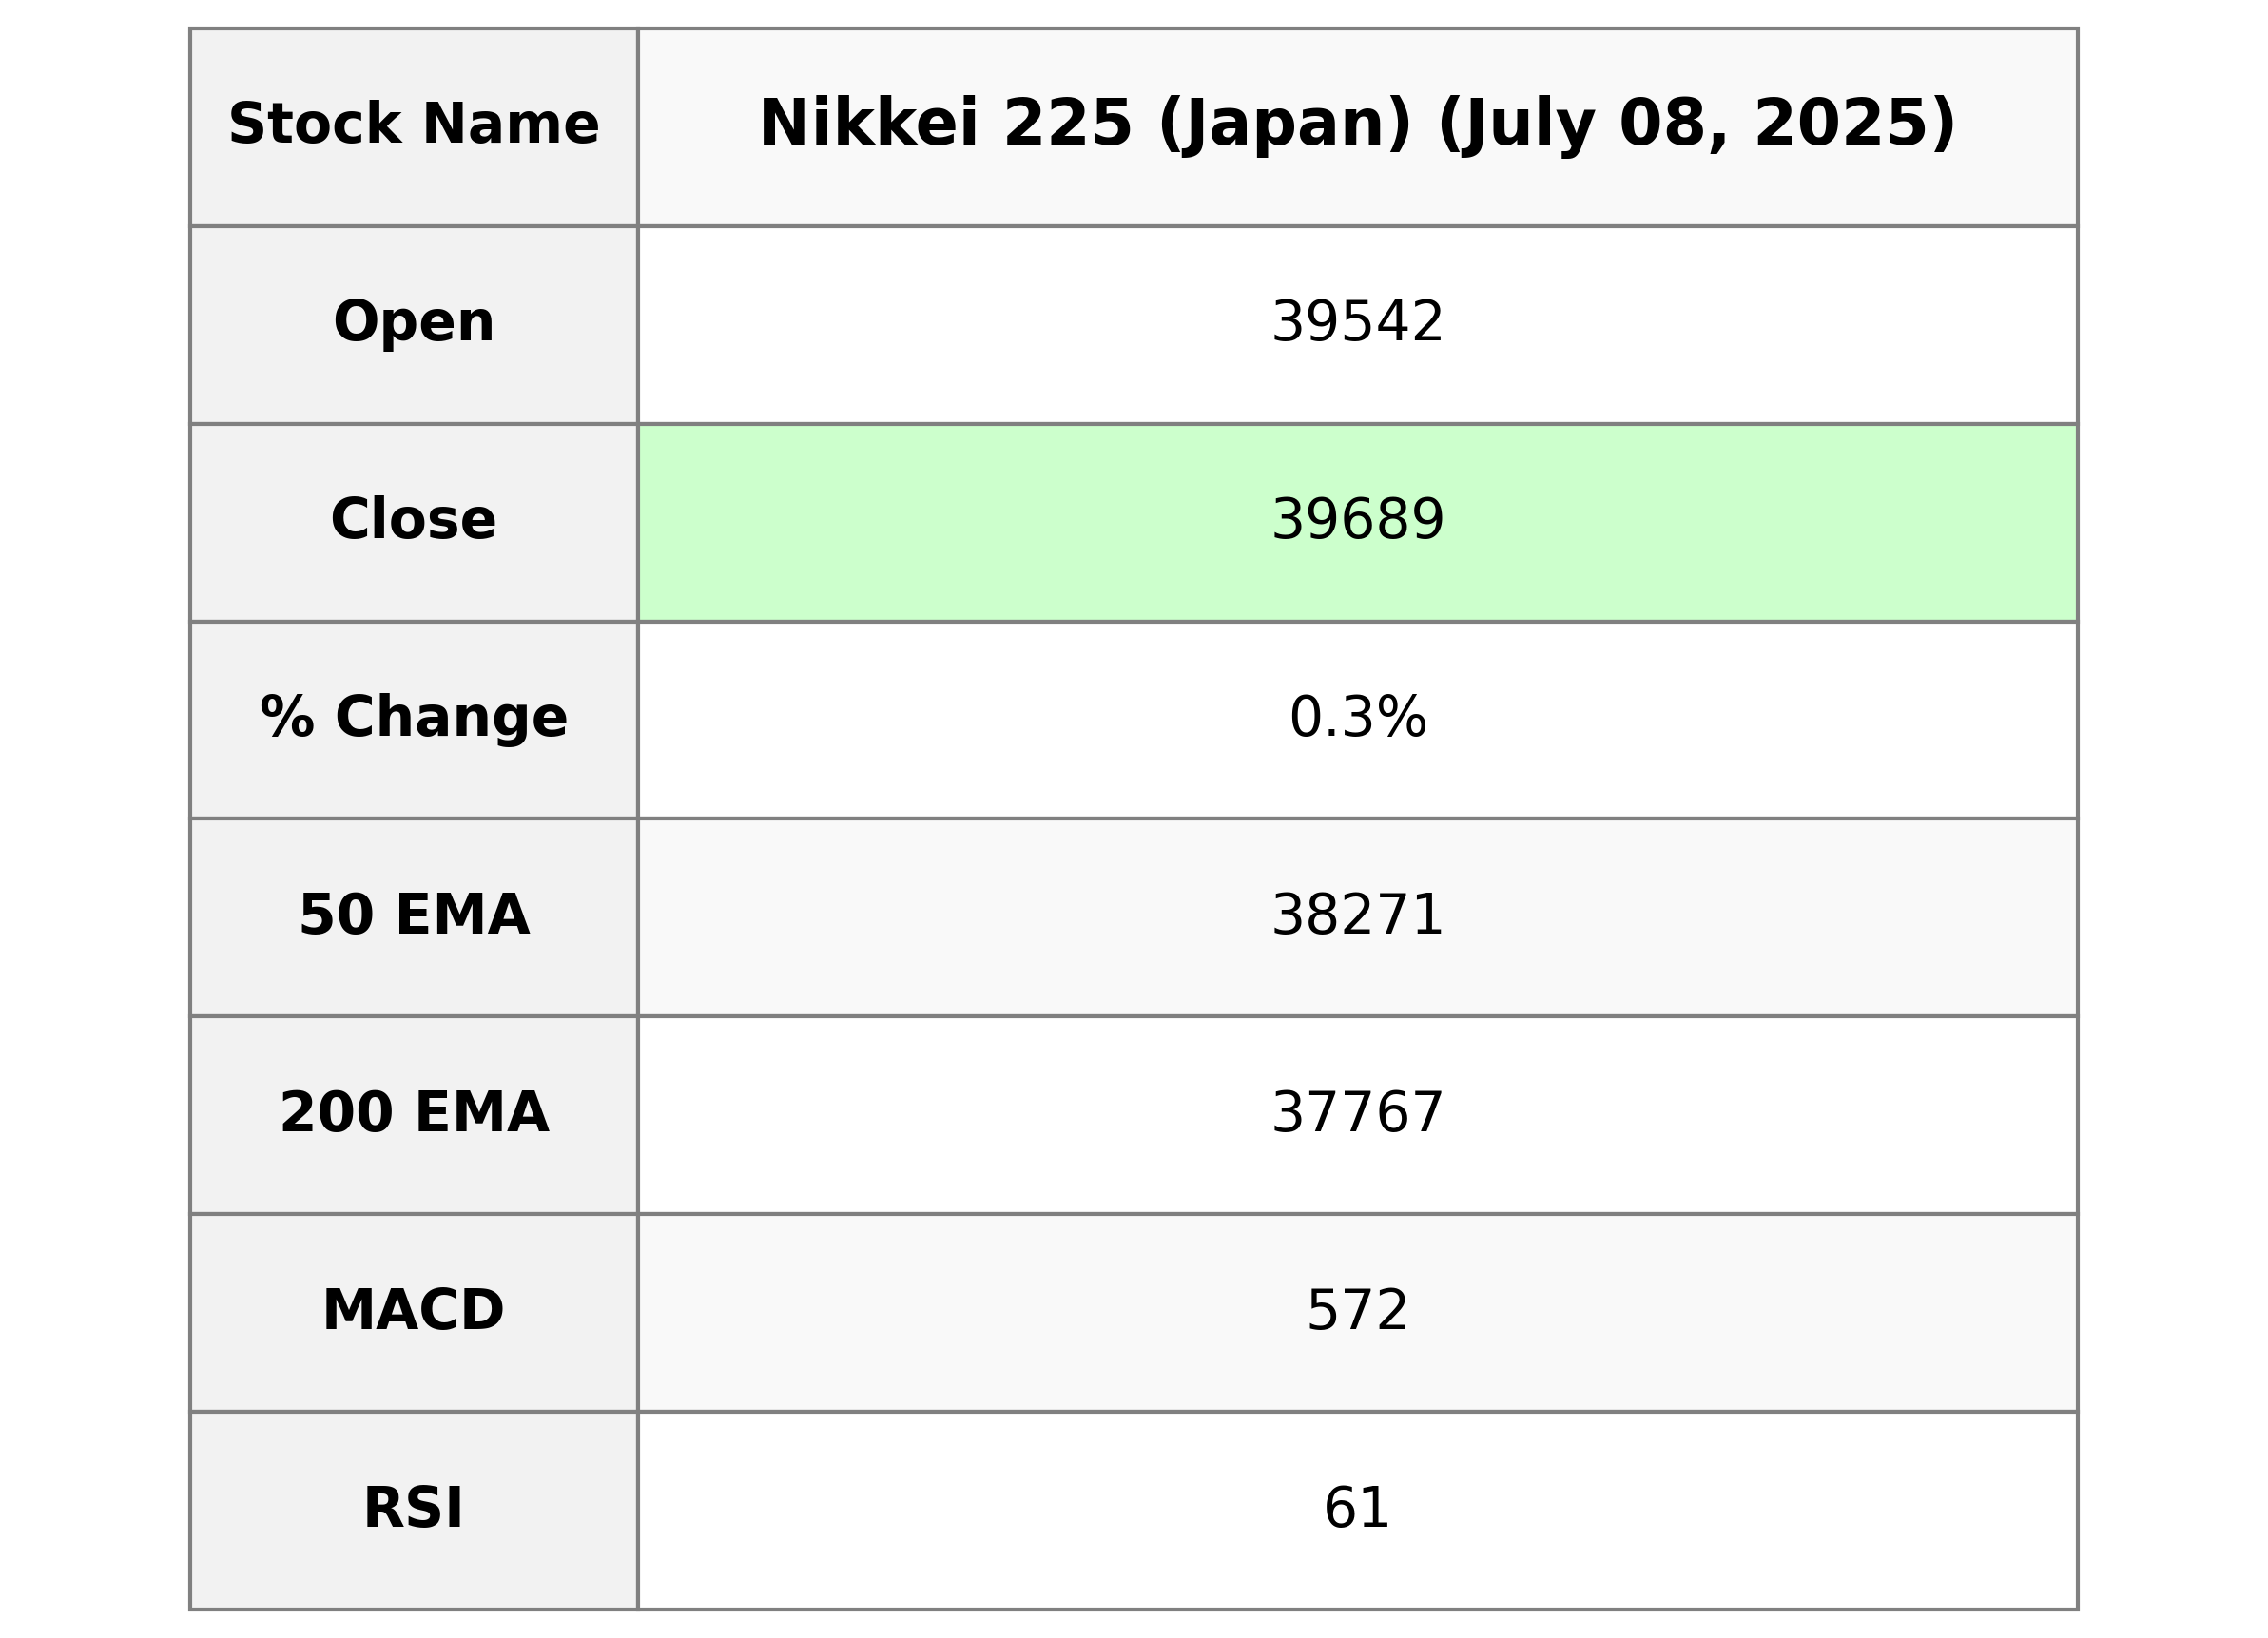
The Nikkei 225 (Japan) observed a slight increase, closing at 39,688.81, which is a 0.26% rise from the previous close of 39,587.68, resulting in a points change of 101.13. The RSI stands at 61.26, indicating moderately positive momentum, although the MACD is below the signal line, suggesting possible weakening in bullish momentum.
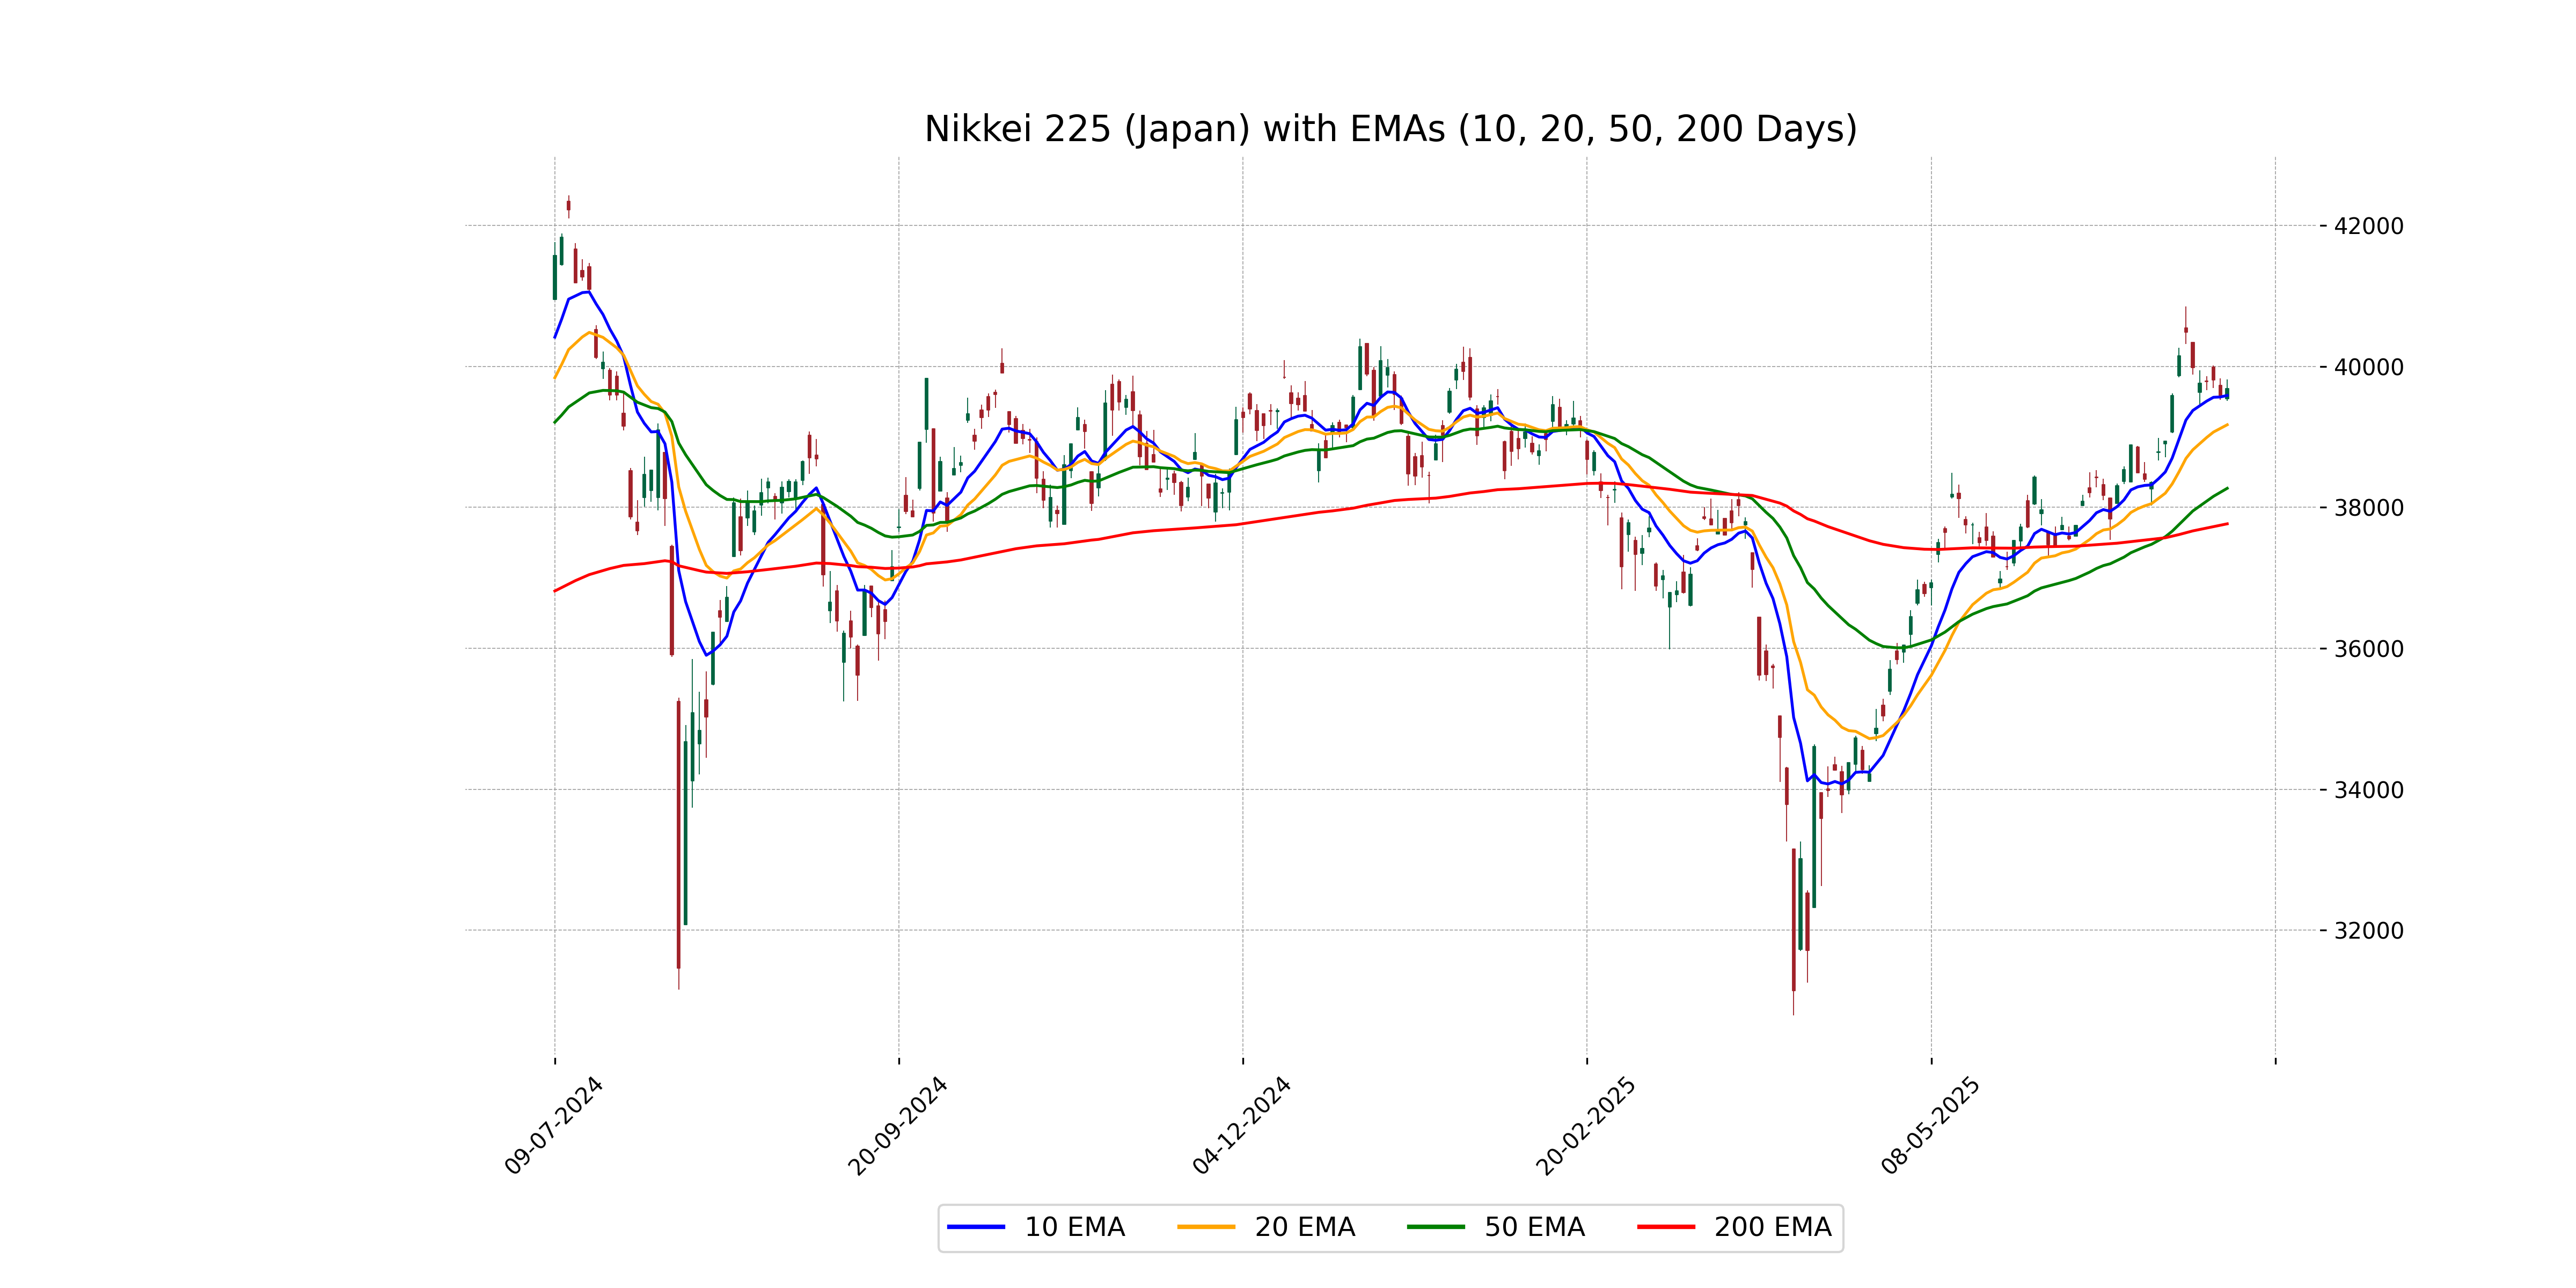
Relationship with Key Moving Averages
Nikkei 225 is currently trading above its 50 EMA (38,271.29) and 200 EMA (37,767.23), suggesting a bullish trend. However, it's very close to its 10 EMA (39,589.66), indicating potential short-term stability around the current level.
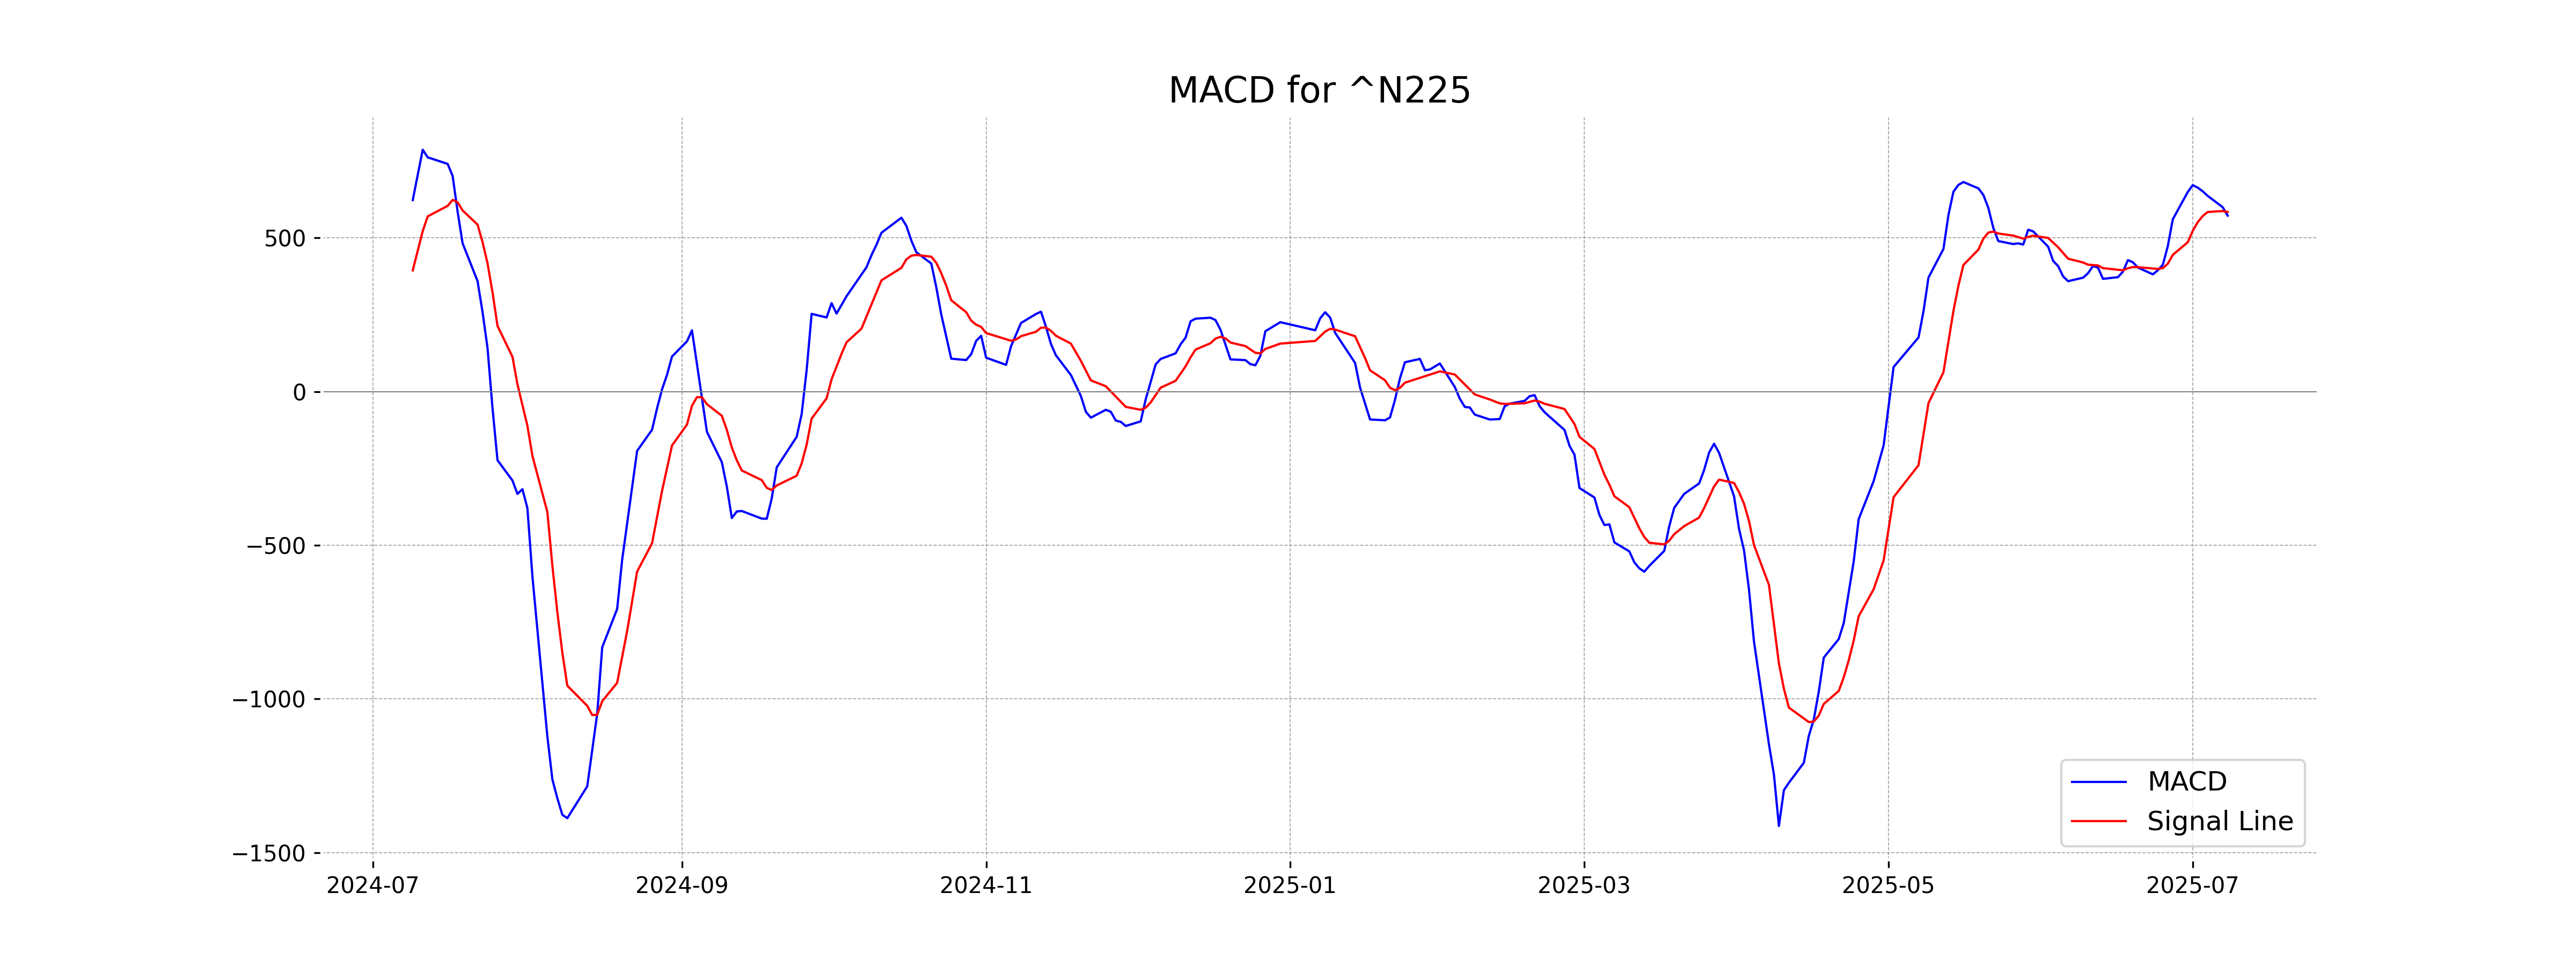
Moving Averages Trend (MACD)
The MACD line for Nikkei 225 is 572.41 while the MACD Signal is 584.40, indicating a bearish crossover as the MACD is below the Signal line. This suggests potential downward momentum in the short term.
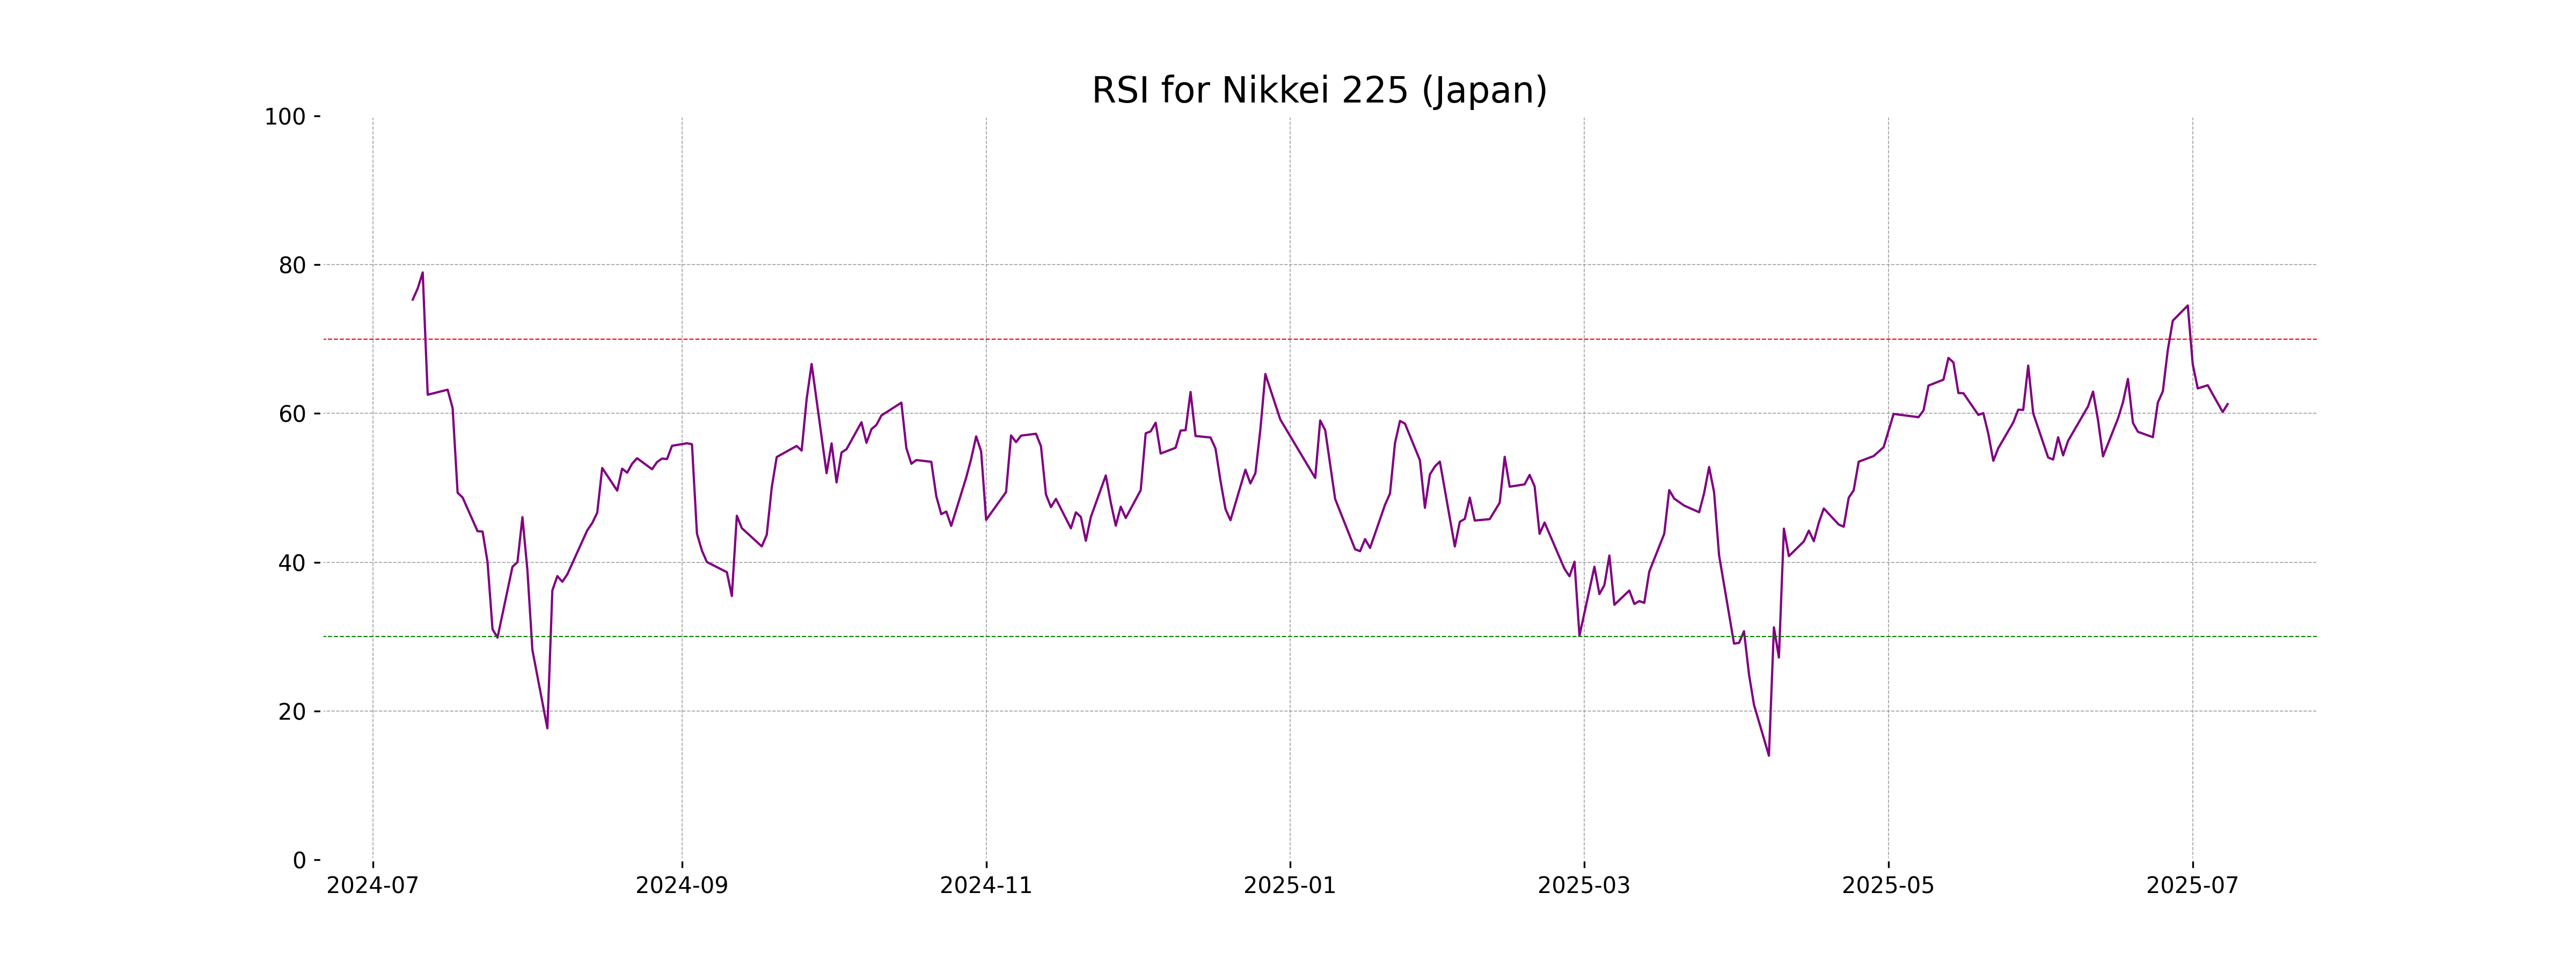
RSI Analysis
Nikkei 225 (Japan) has an RSI of 61.26, which indicates a neutral to slightly bullish momentum in the market. An RSI above 50 suggests the index is gaining upward momentum, but it's not yet in overbought territory.
Analysis for Nifty Bank - July 08, 2025
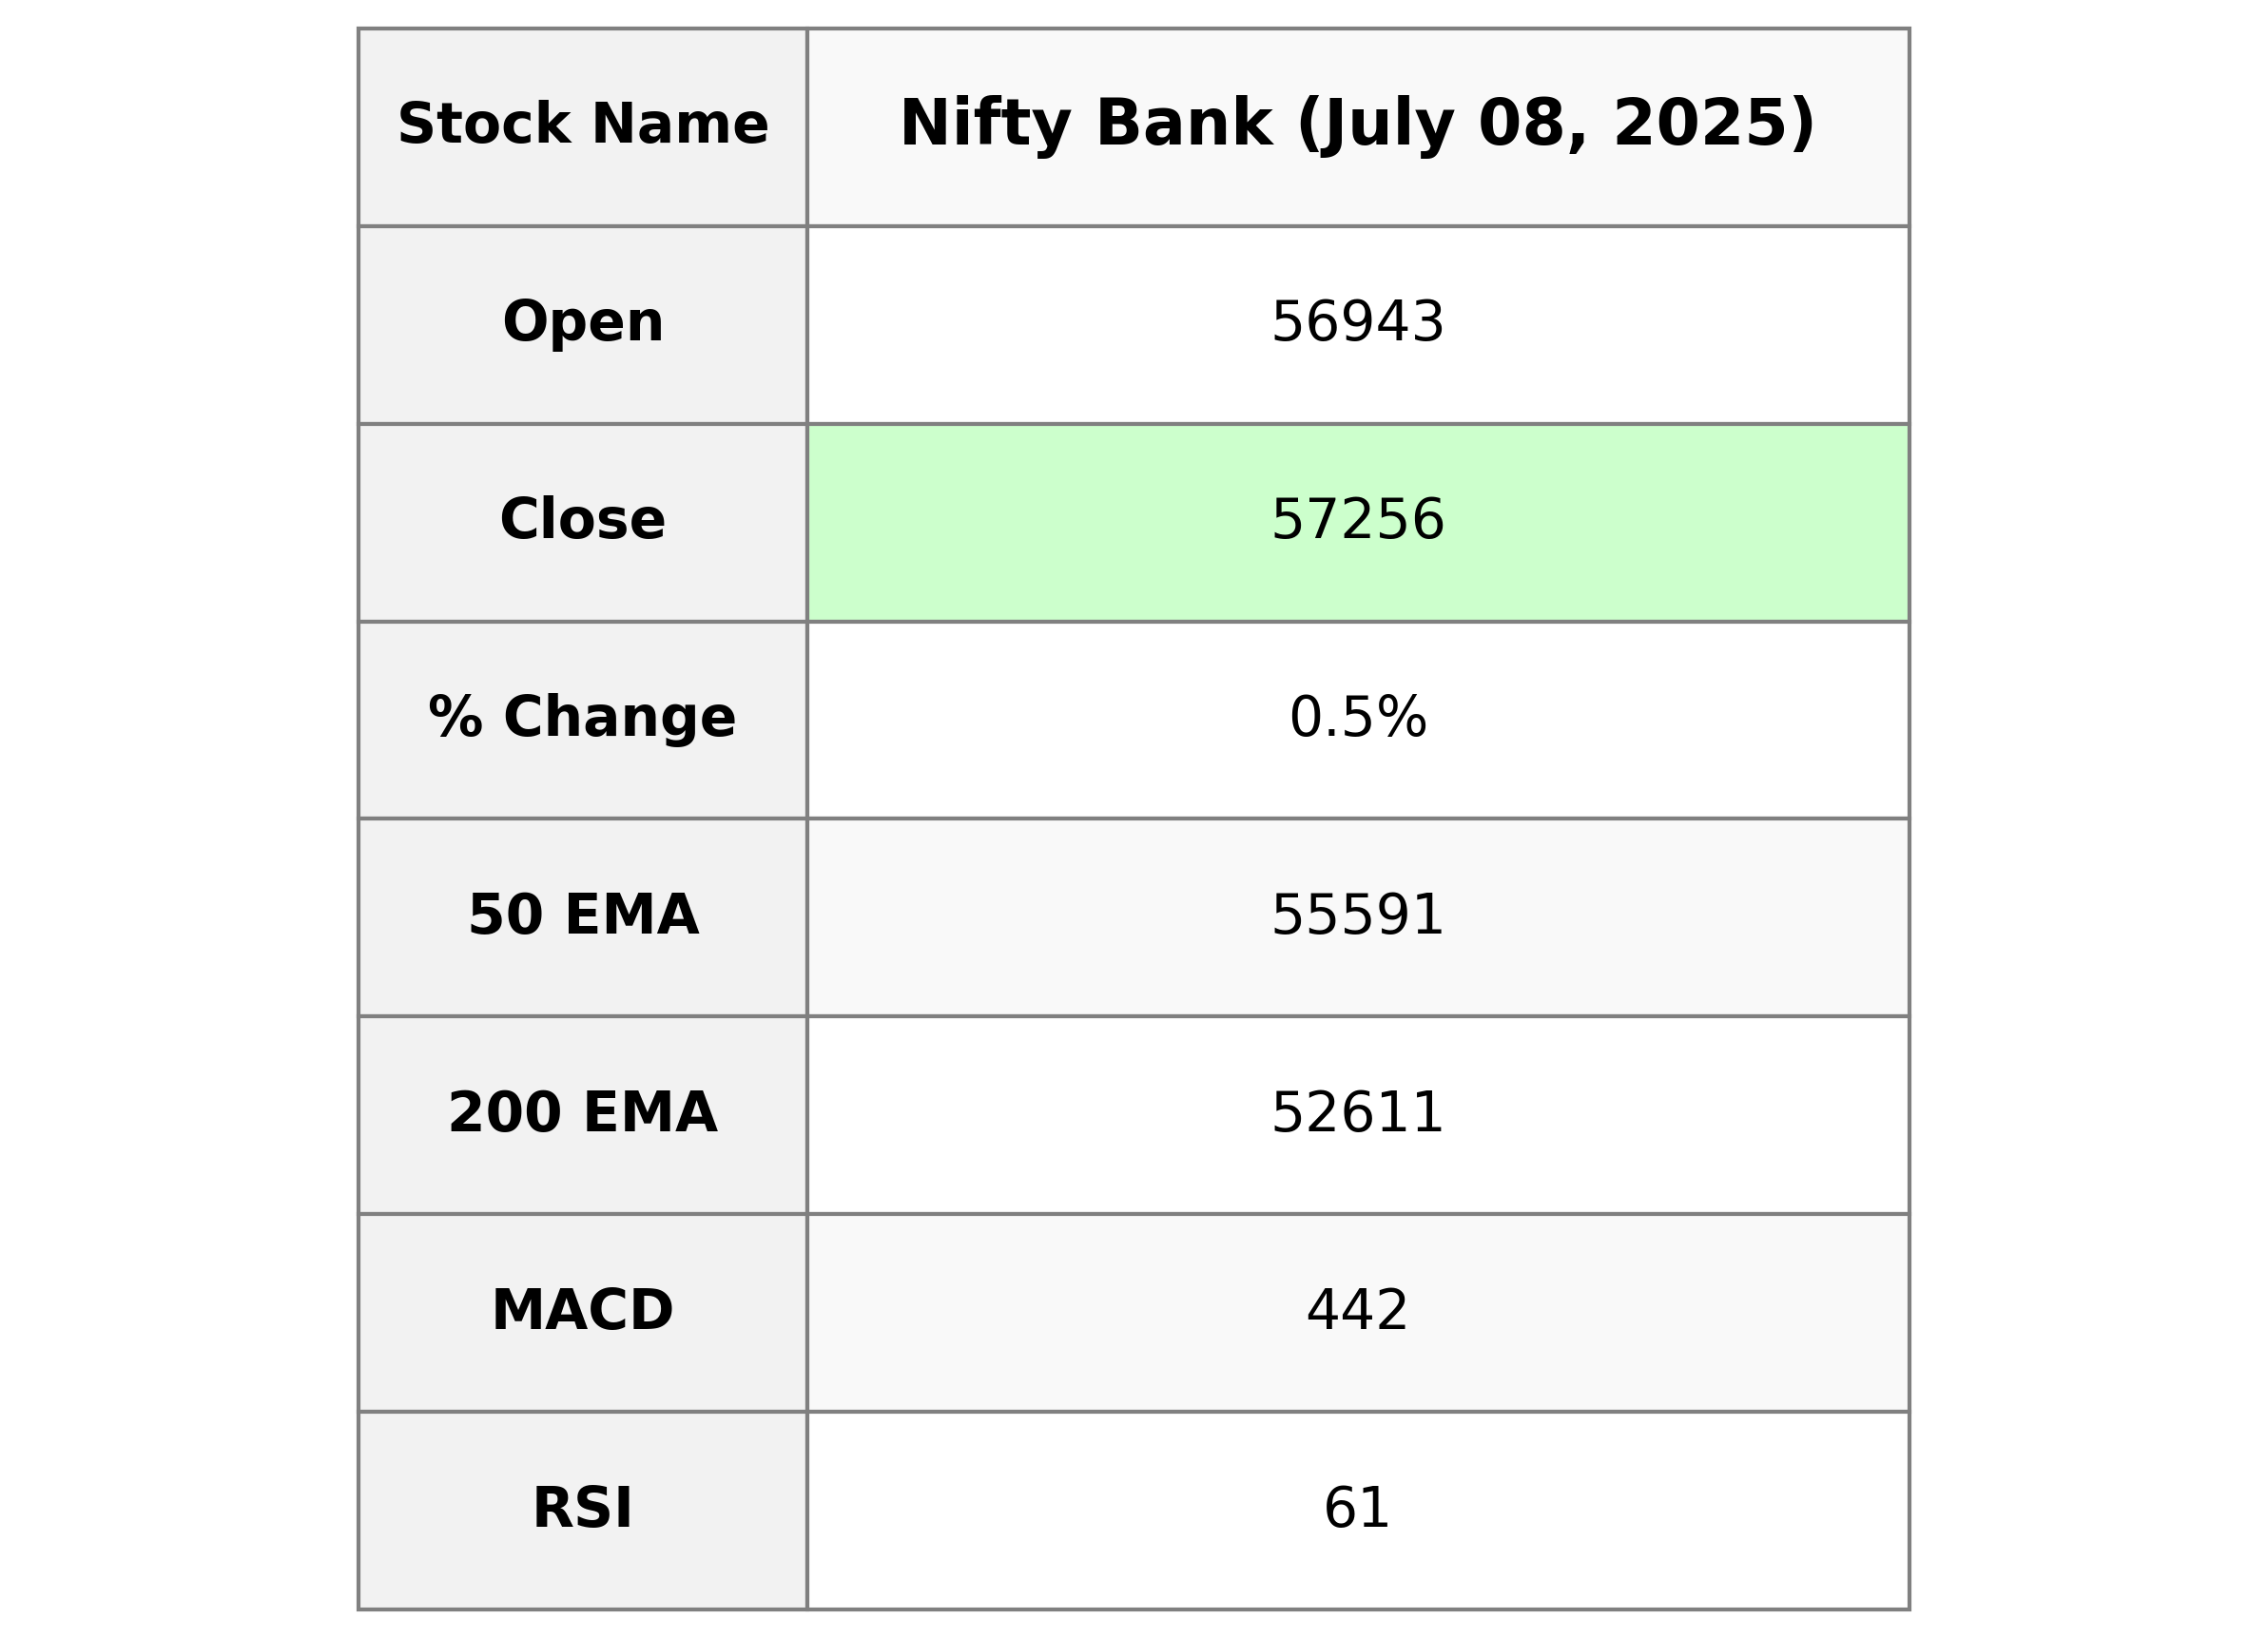
Nifty Bank opened at 56942.55 and closed at 57256.30, marking a positive change of 0.54% or a gain of 307.10 points from the previous close. The index touched a high of 57303.30 and a low of 56923.05, with an RSI of 61.14 indicating moderately bullish momentum. The MACD at 442.42 is slightly below its signal line, suggesting a subtle potential for reversal or consolidating movement.
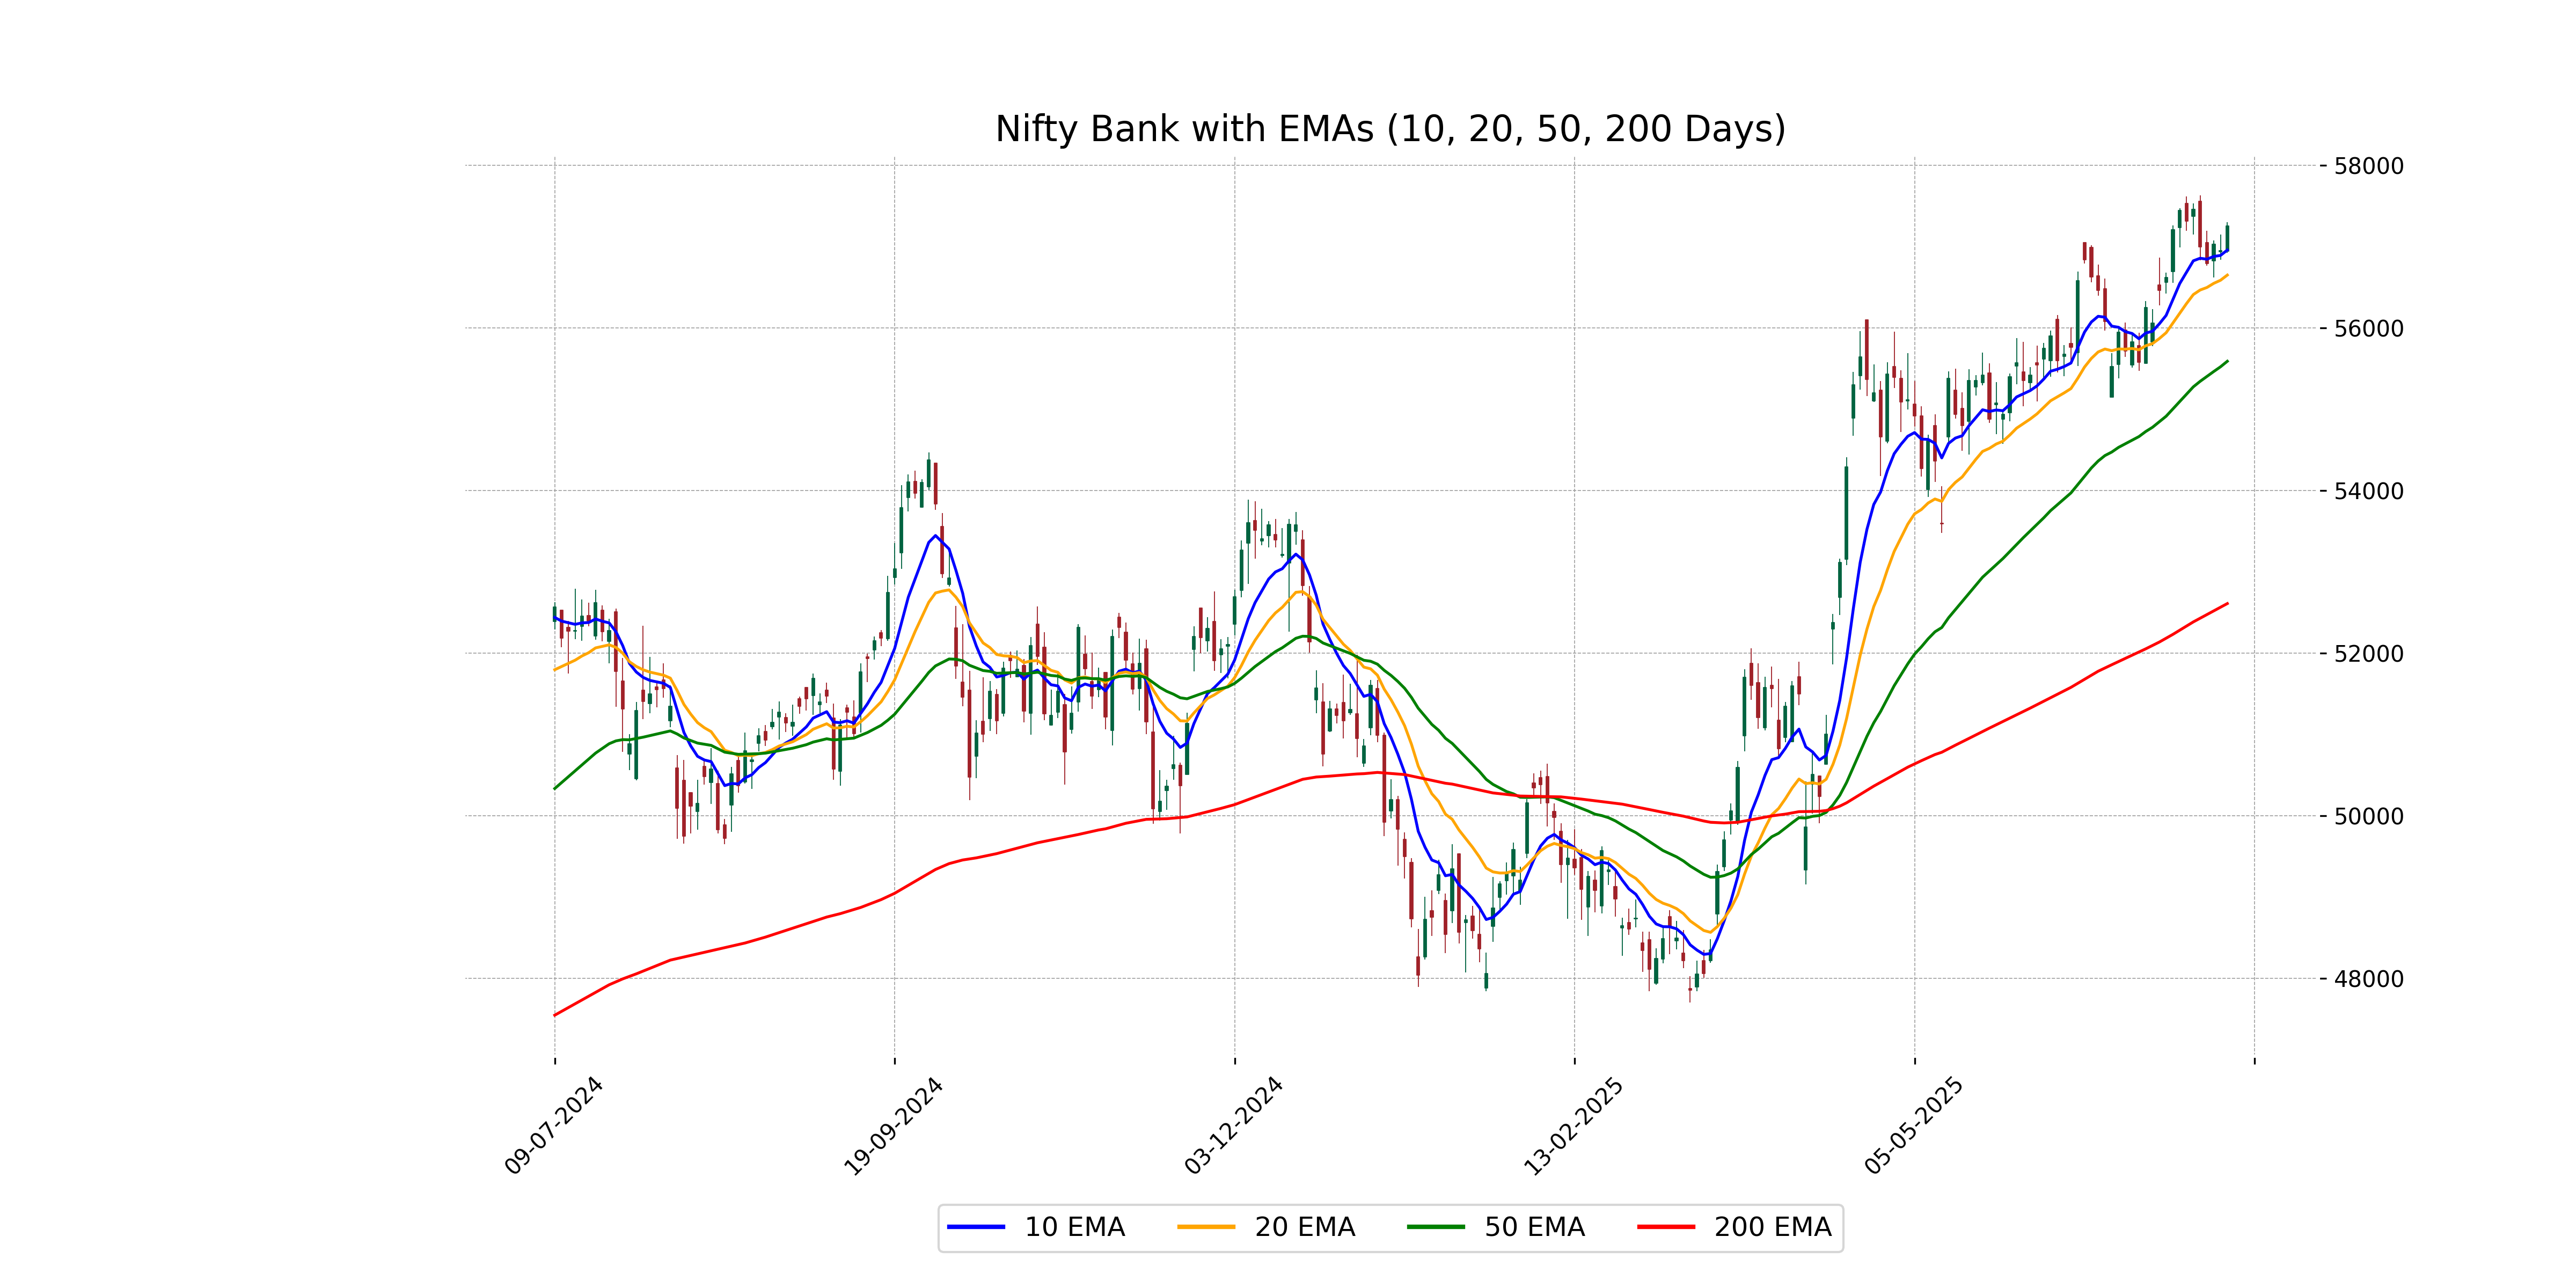
Relationship with Key Moving Averages
Based on the given data for Nifty Bank, the close price of 57,256.30 is above the 10-day EMA of 56,958.29, the 20-day EMA of 56,650.46, the 50-day EMA of 55,590.55, and the 200-day EMA of 52,611.02. This generally indicates a bullish trend in the short to long term as the current price is above key moving averages.
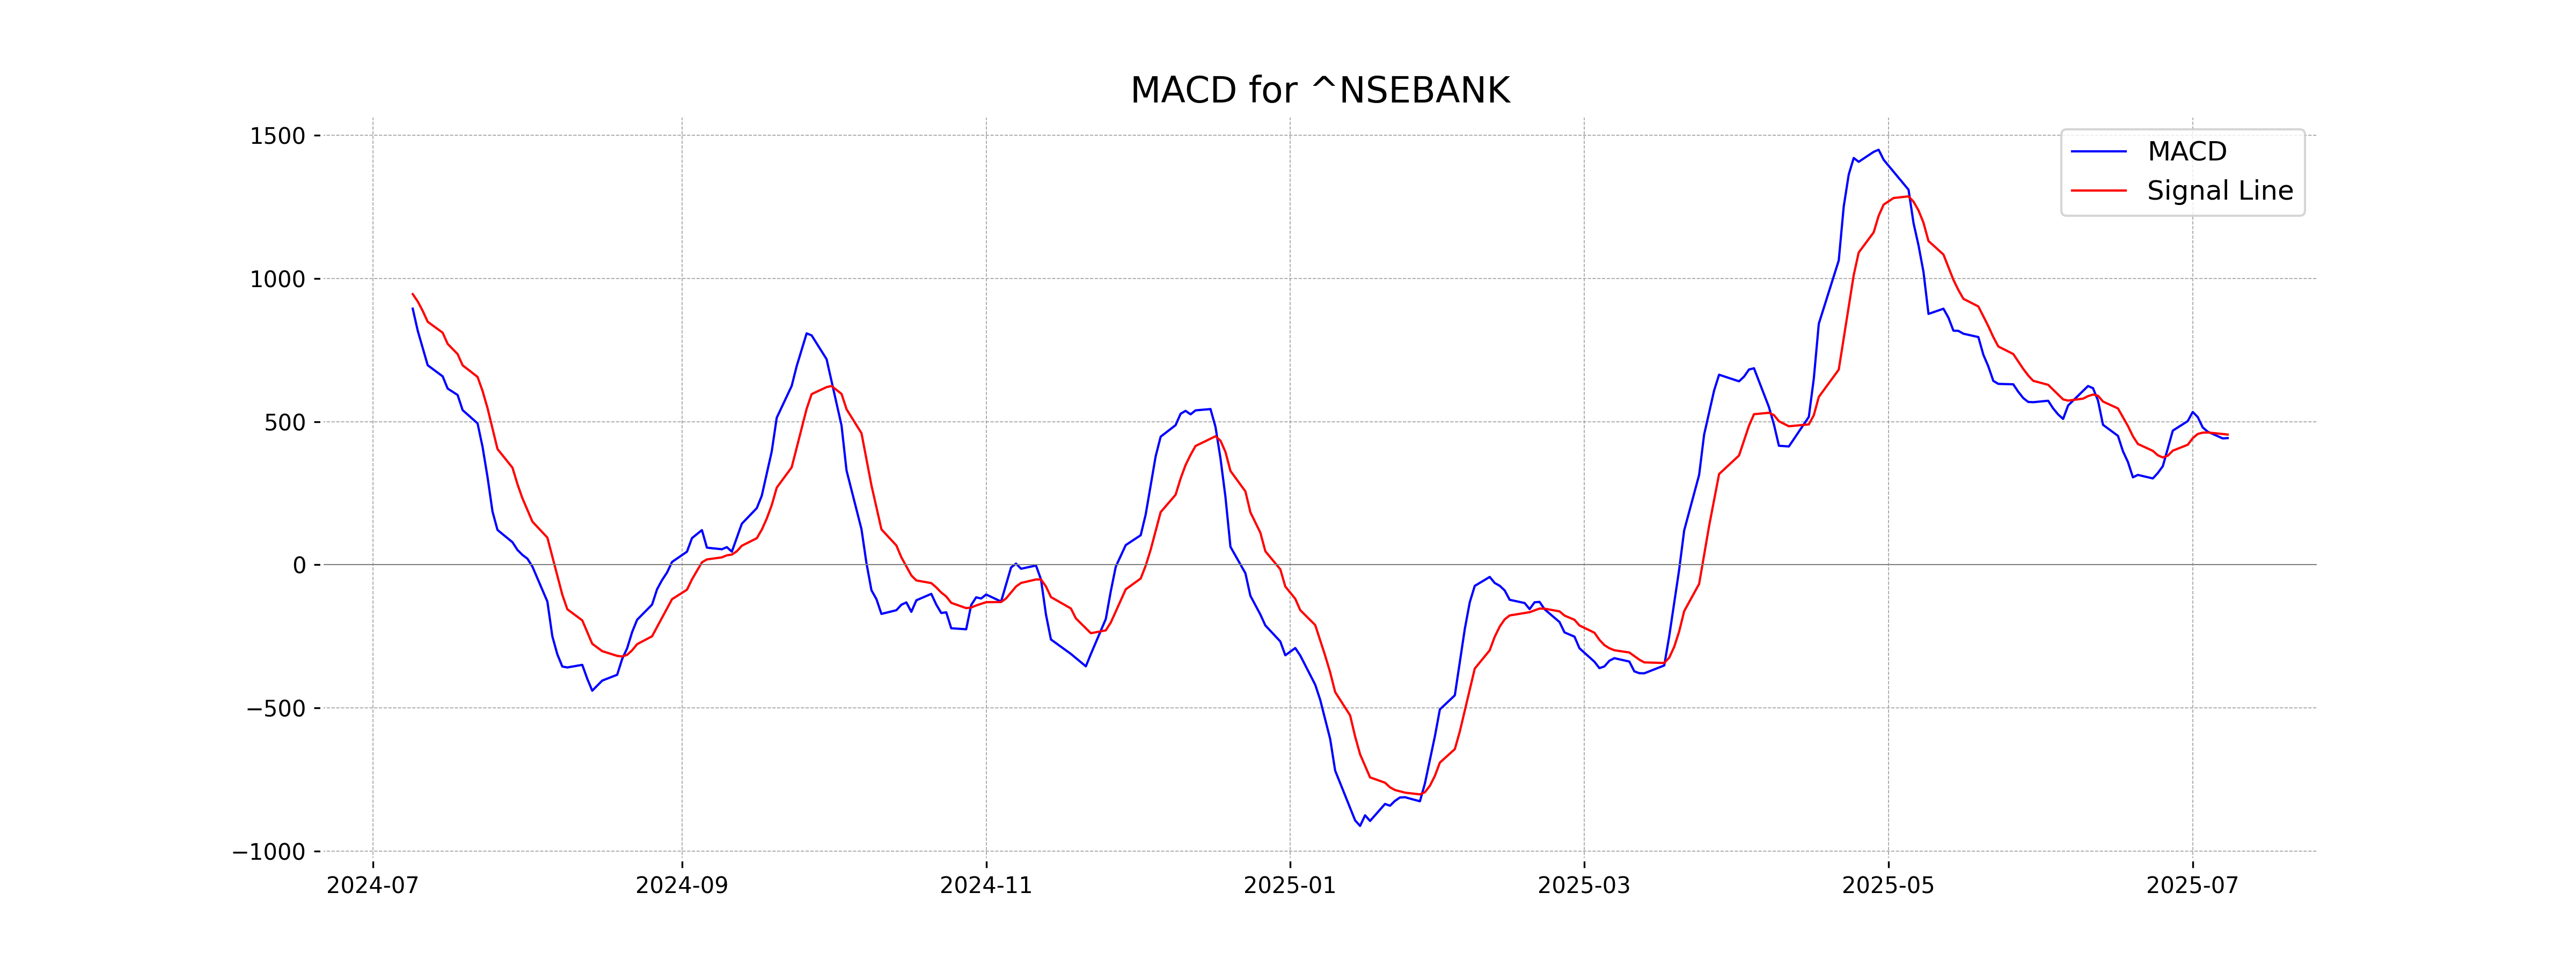
Moving Averages Trend (MACD)
MACD Analysis for Nifty Bank: The MACD for Nifty Bank is 442.42, which is below the MACD Signal of 454.82. This indicates a potential bearish trend as the MACD line is below the signal line, suggesting that momentum might be slowing down. However, with an RSI of 61.14, the market is showing some strength, which might provide support to the current price levels.
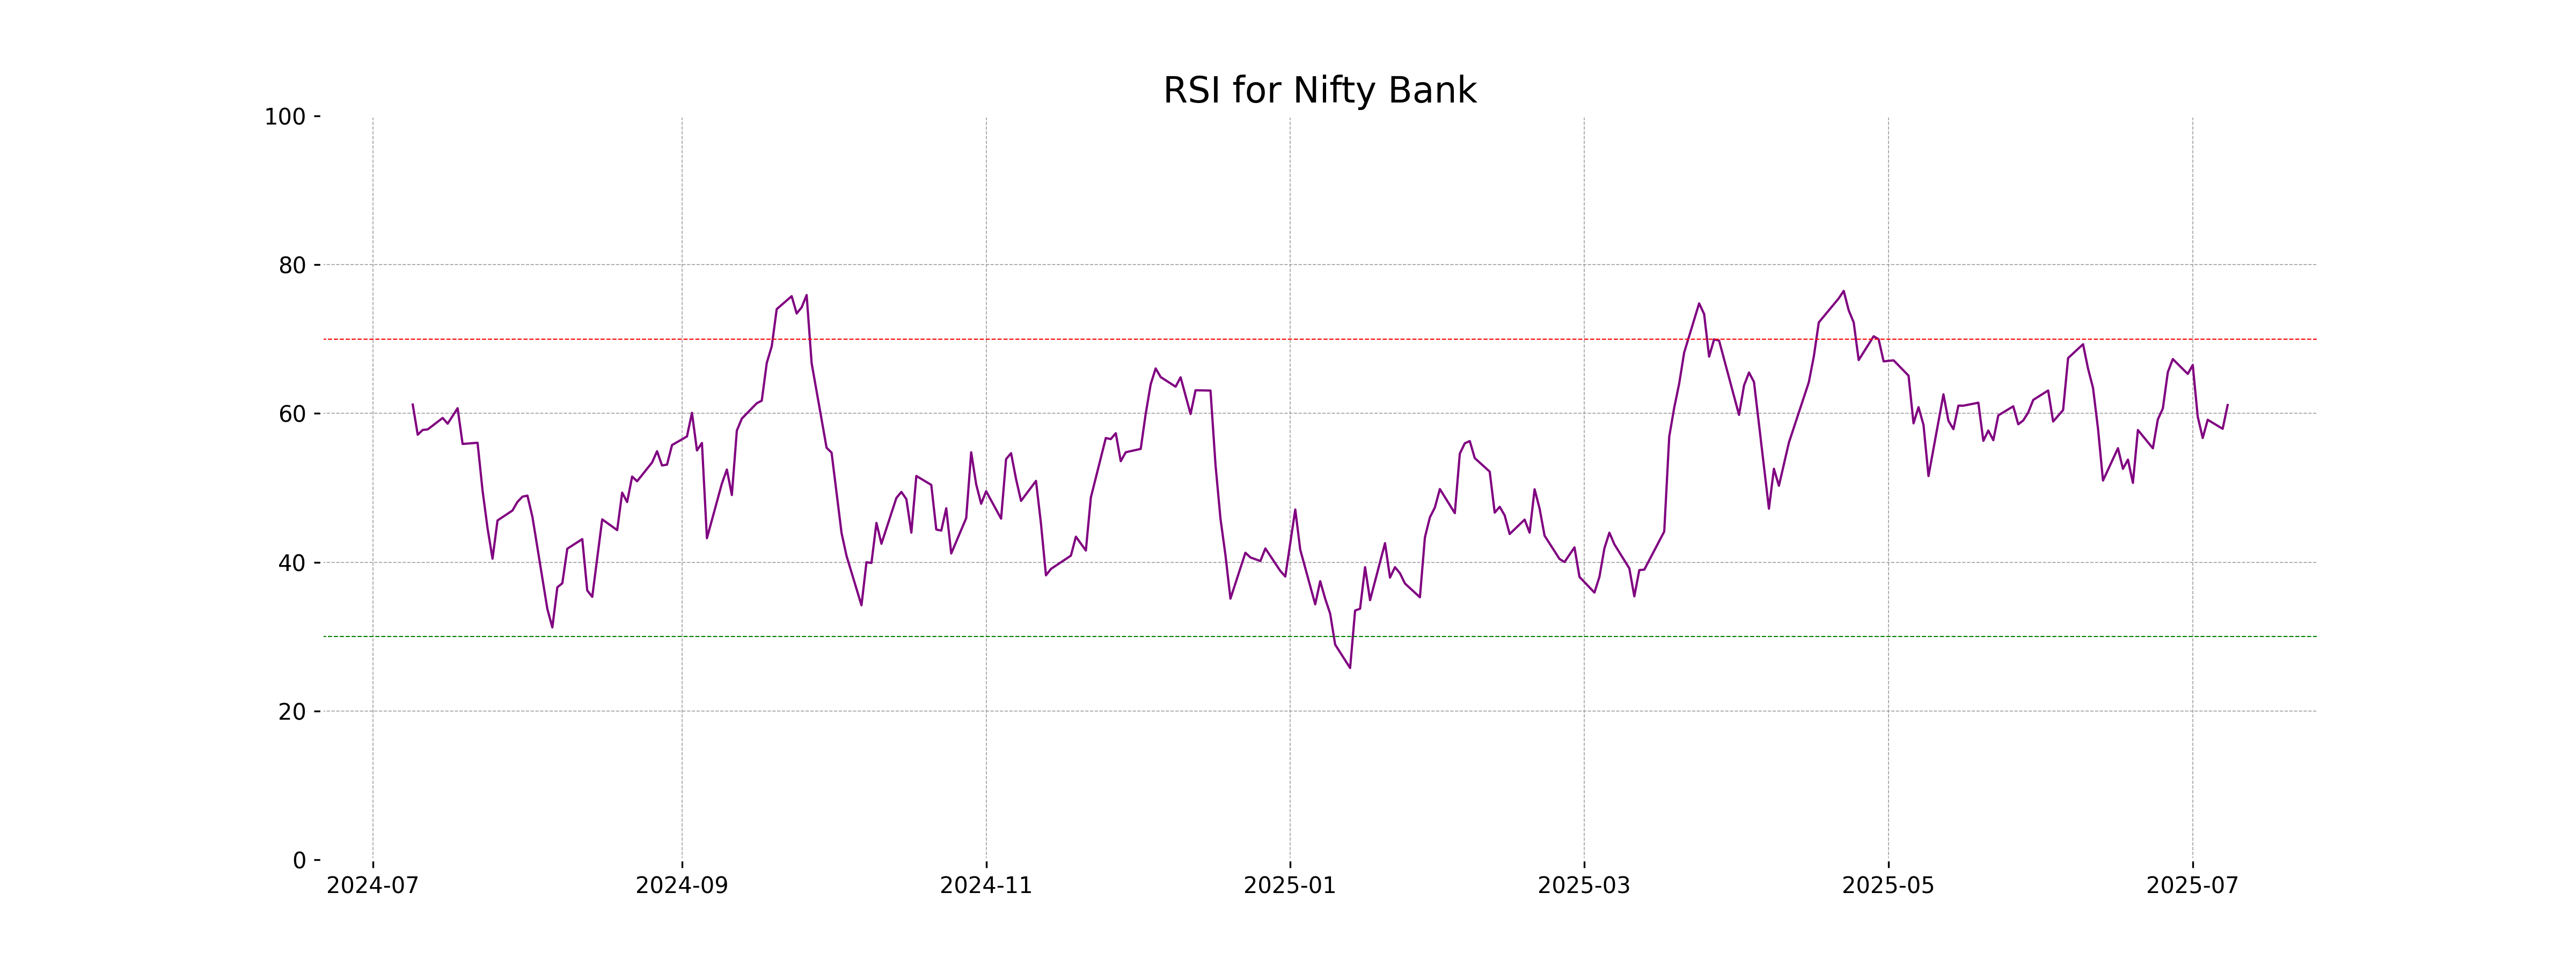
RSI Analysis
The RSI for Nifty Bank is currently at 61.14, indicating mild bullish momentum, as it is above the neutral level of 50. This suggests that Nifty Bank may have upward potential but is not yet in overbought territory, which typically starts above 70.
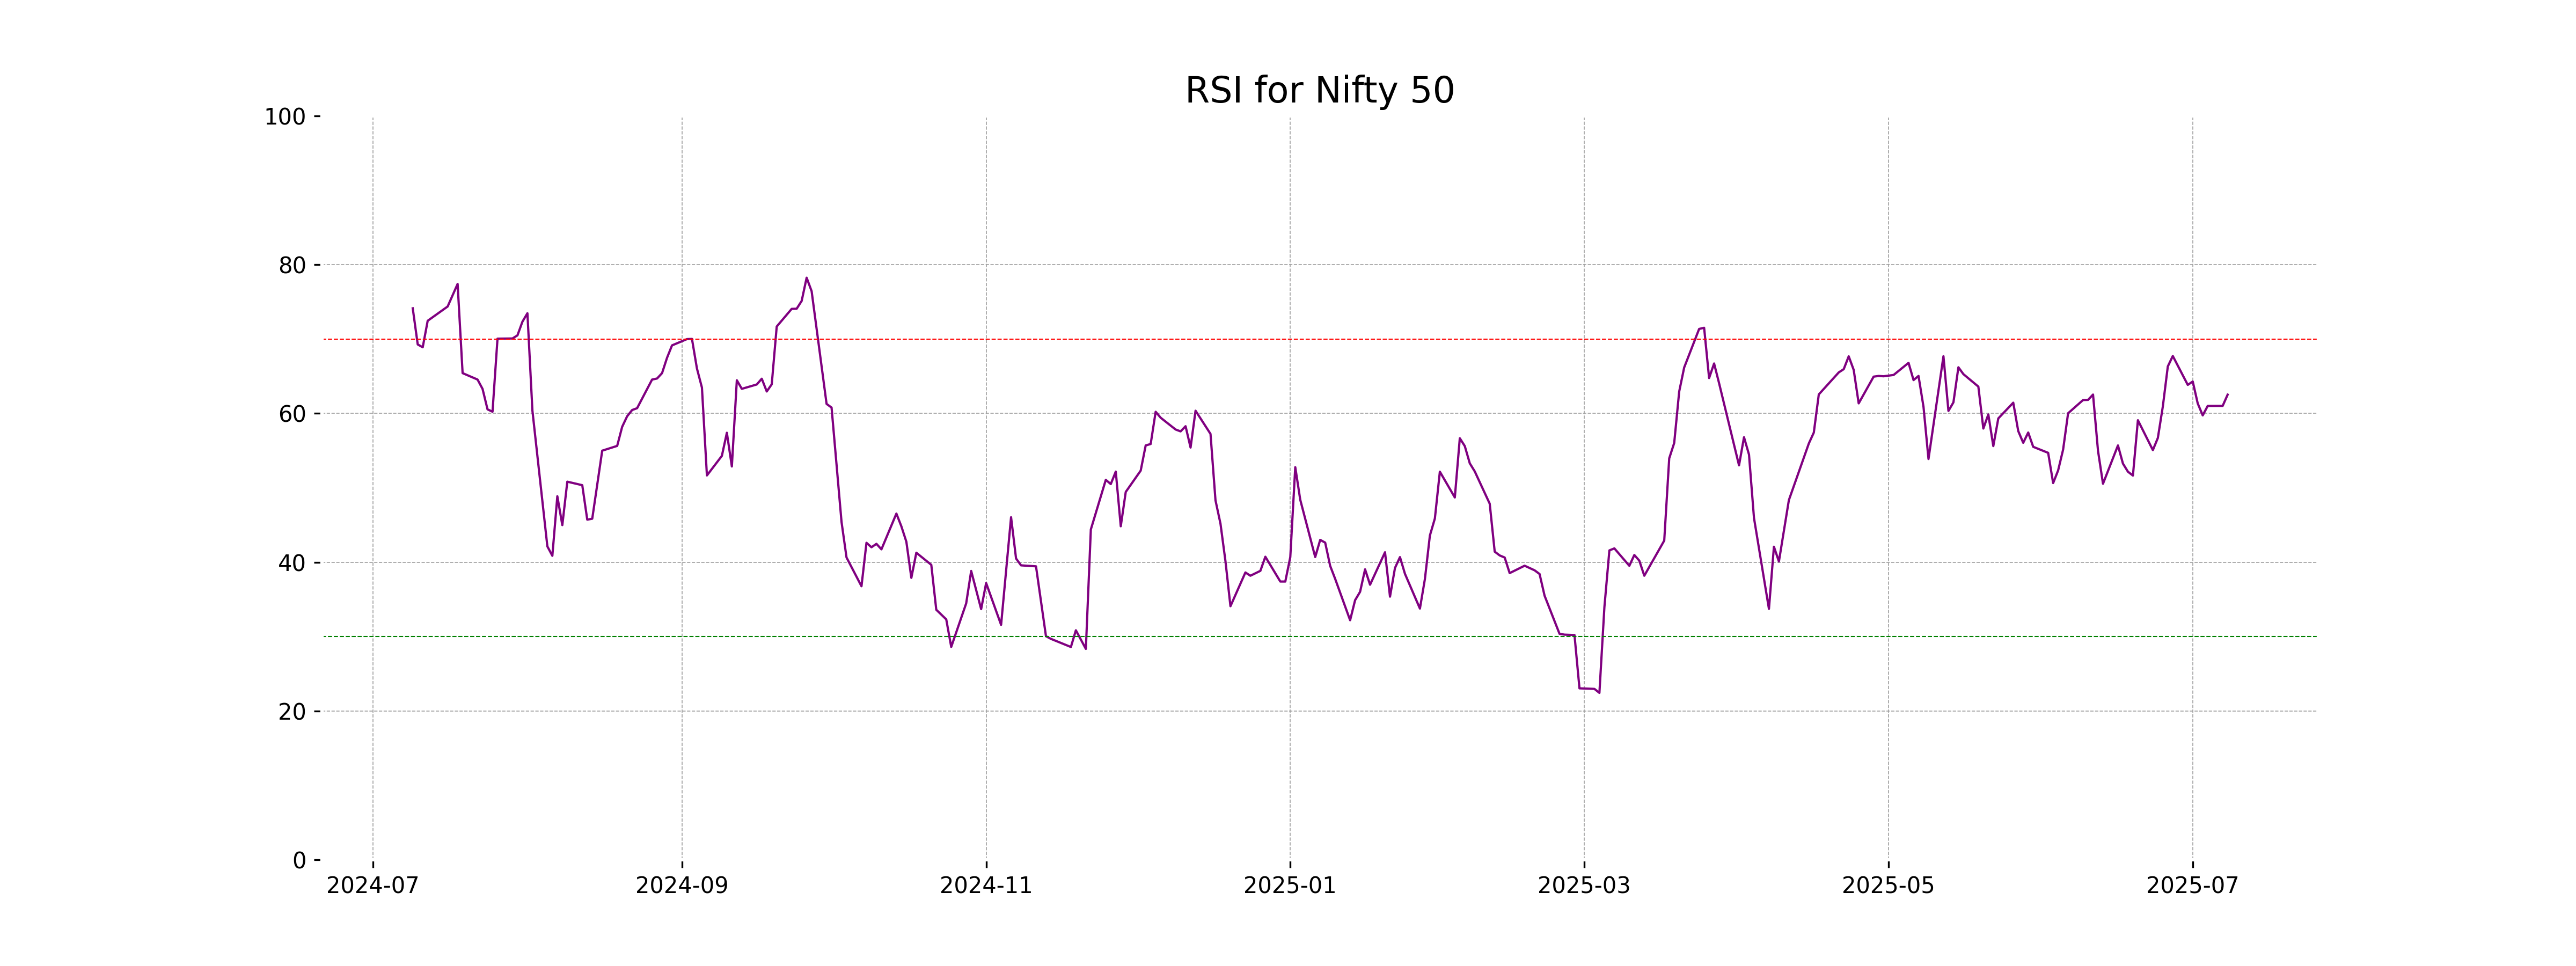
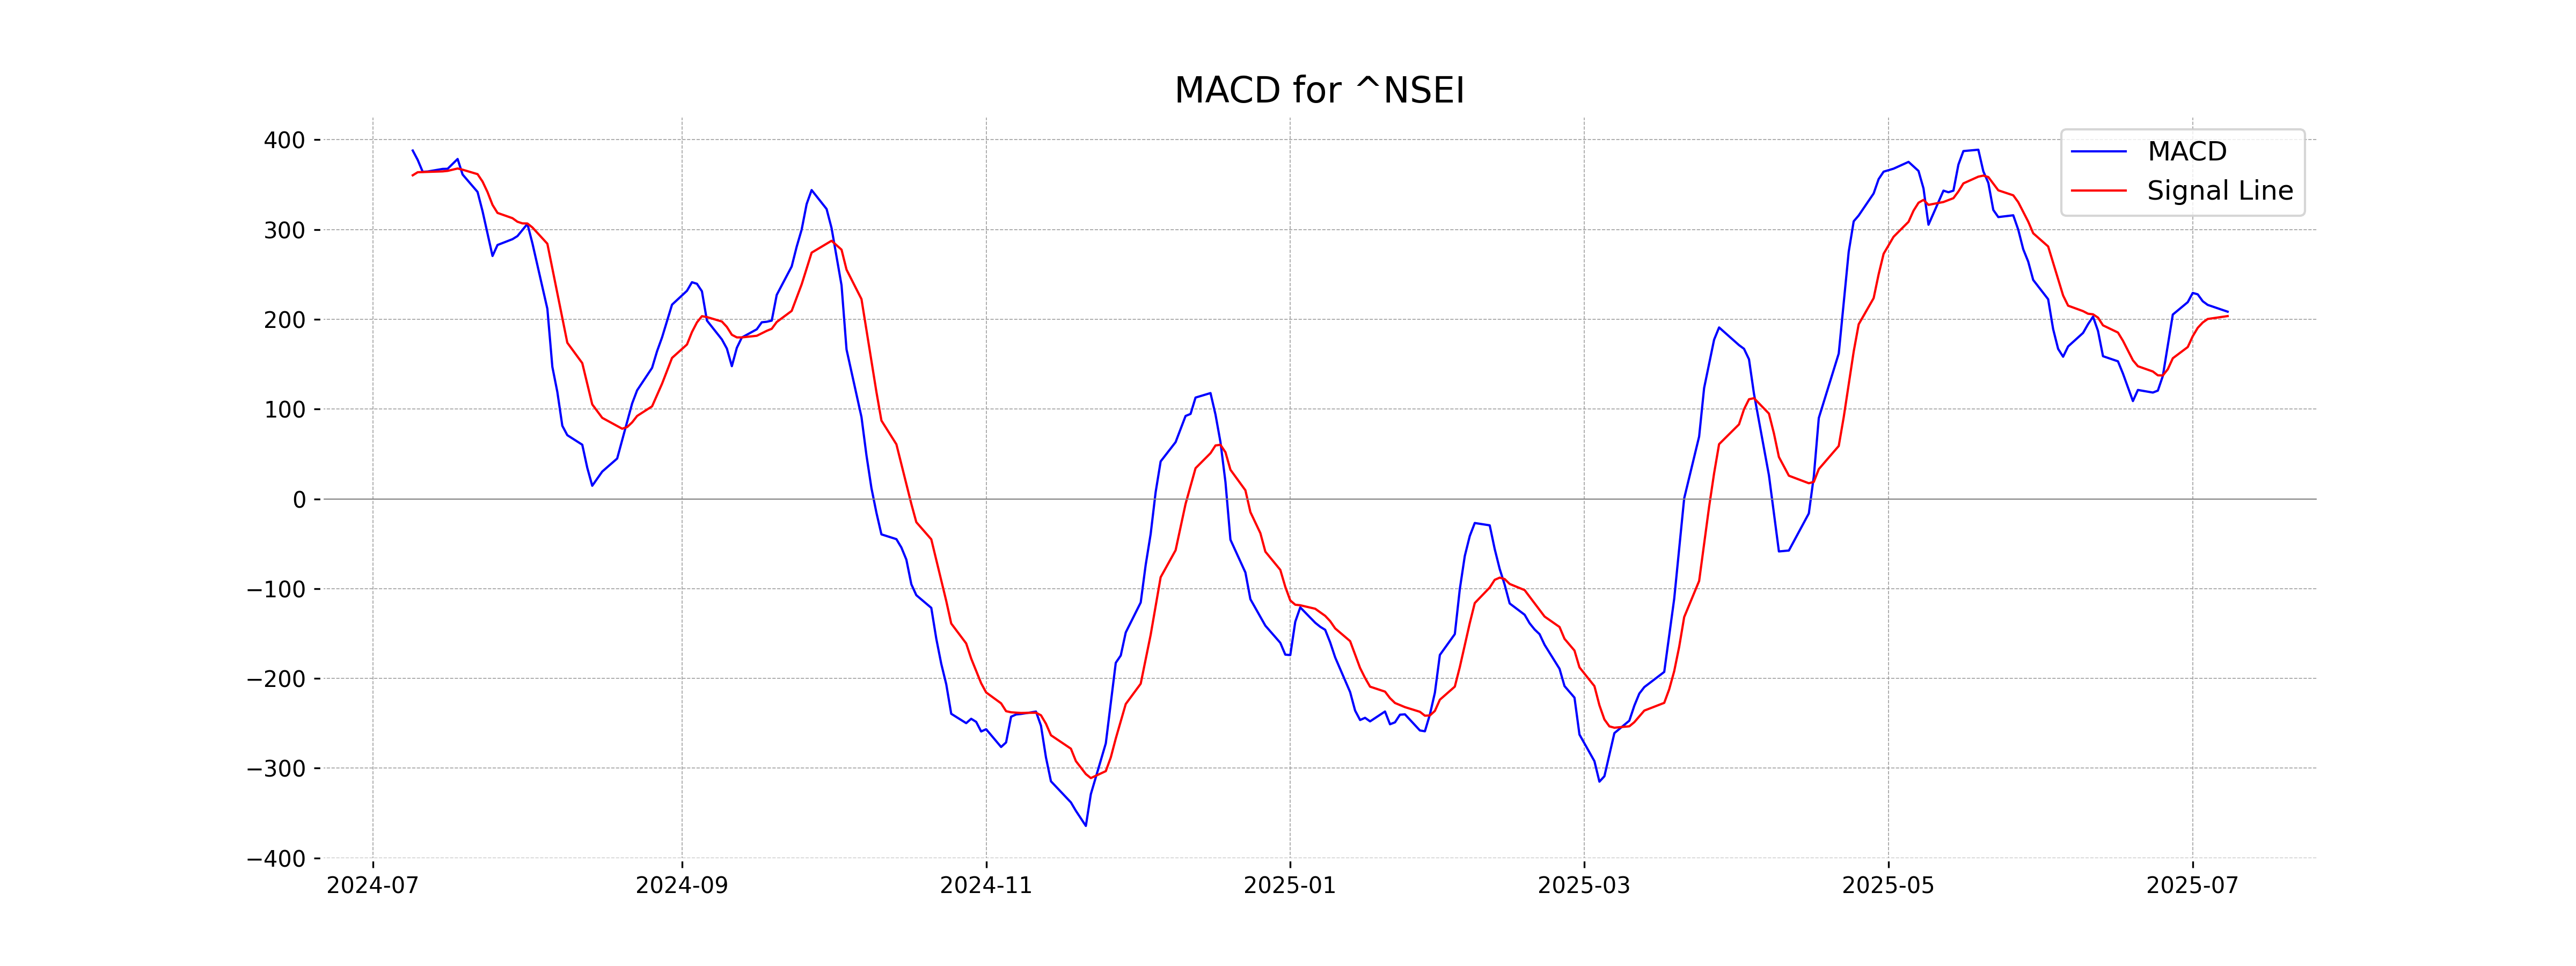
Analysis for Nifty 50 - July 08, 2025

The Nifty 50 index opened at 25,427.85 and closed at 25,522.5, showing a slight increase with a 0.24% change and a points change of 61.20. The RSI indicates a relatively strong market at 62.53, and the MACD is positive at 208.51, which suggests bullish momentum. The current close is above the 10-day, 20-day, 50-day, and 200-day EMAs, indicating overall positive trend sentiment.
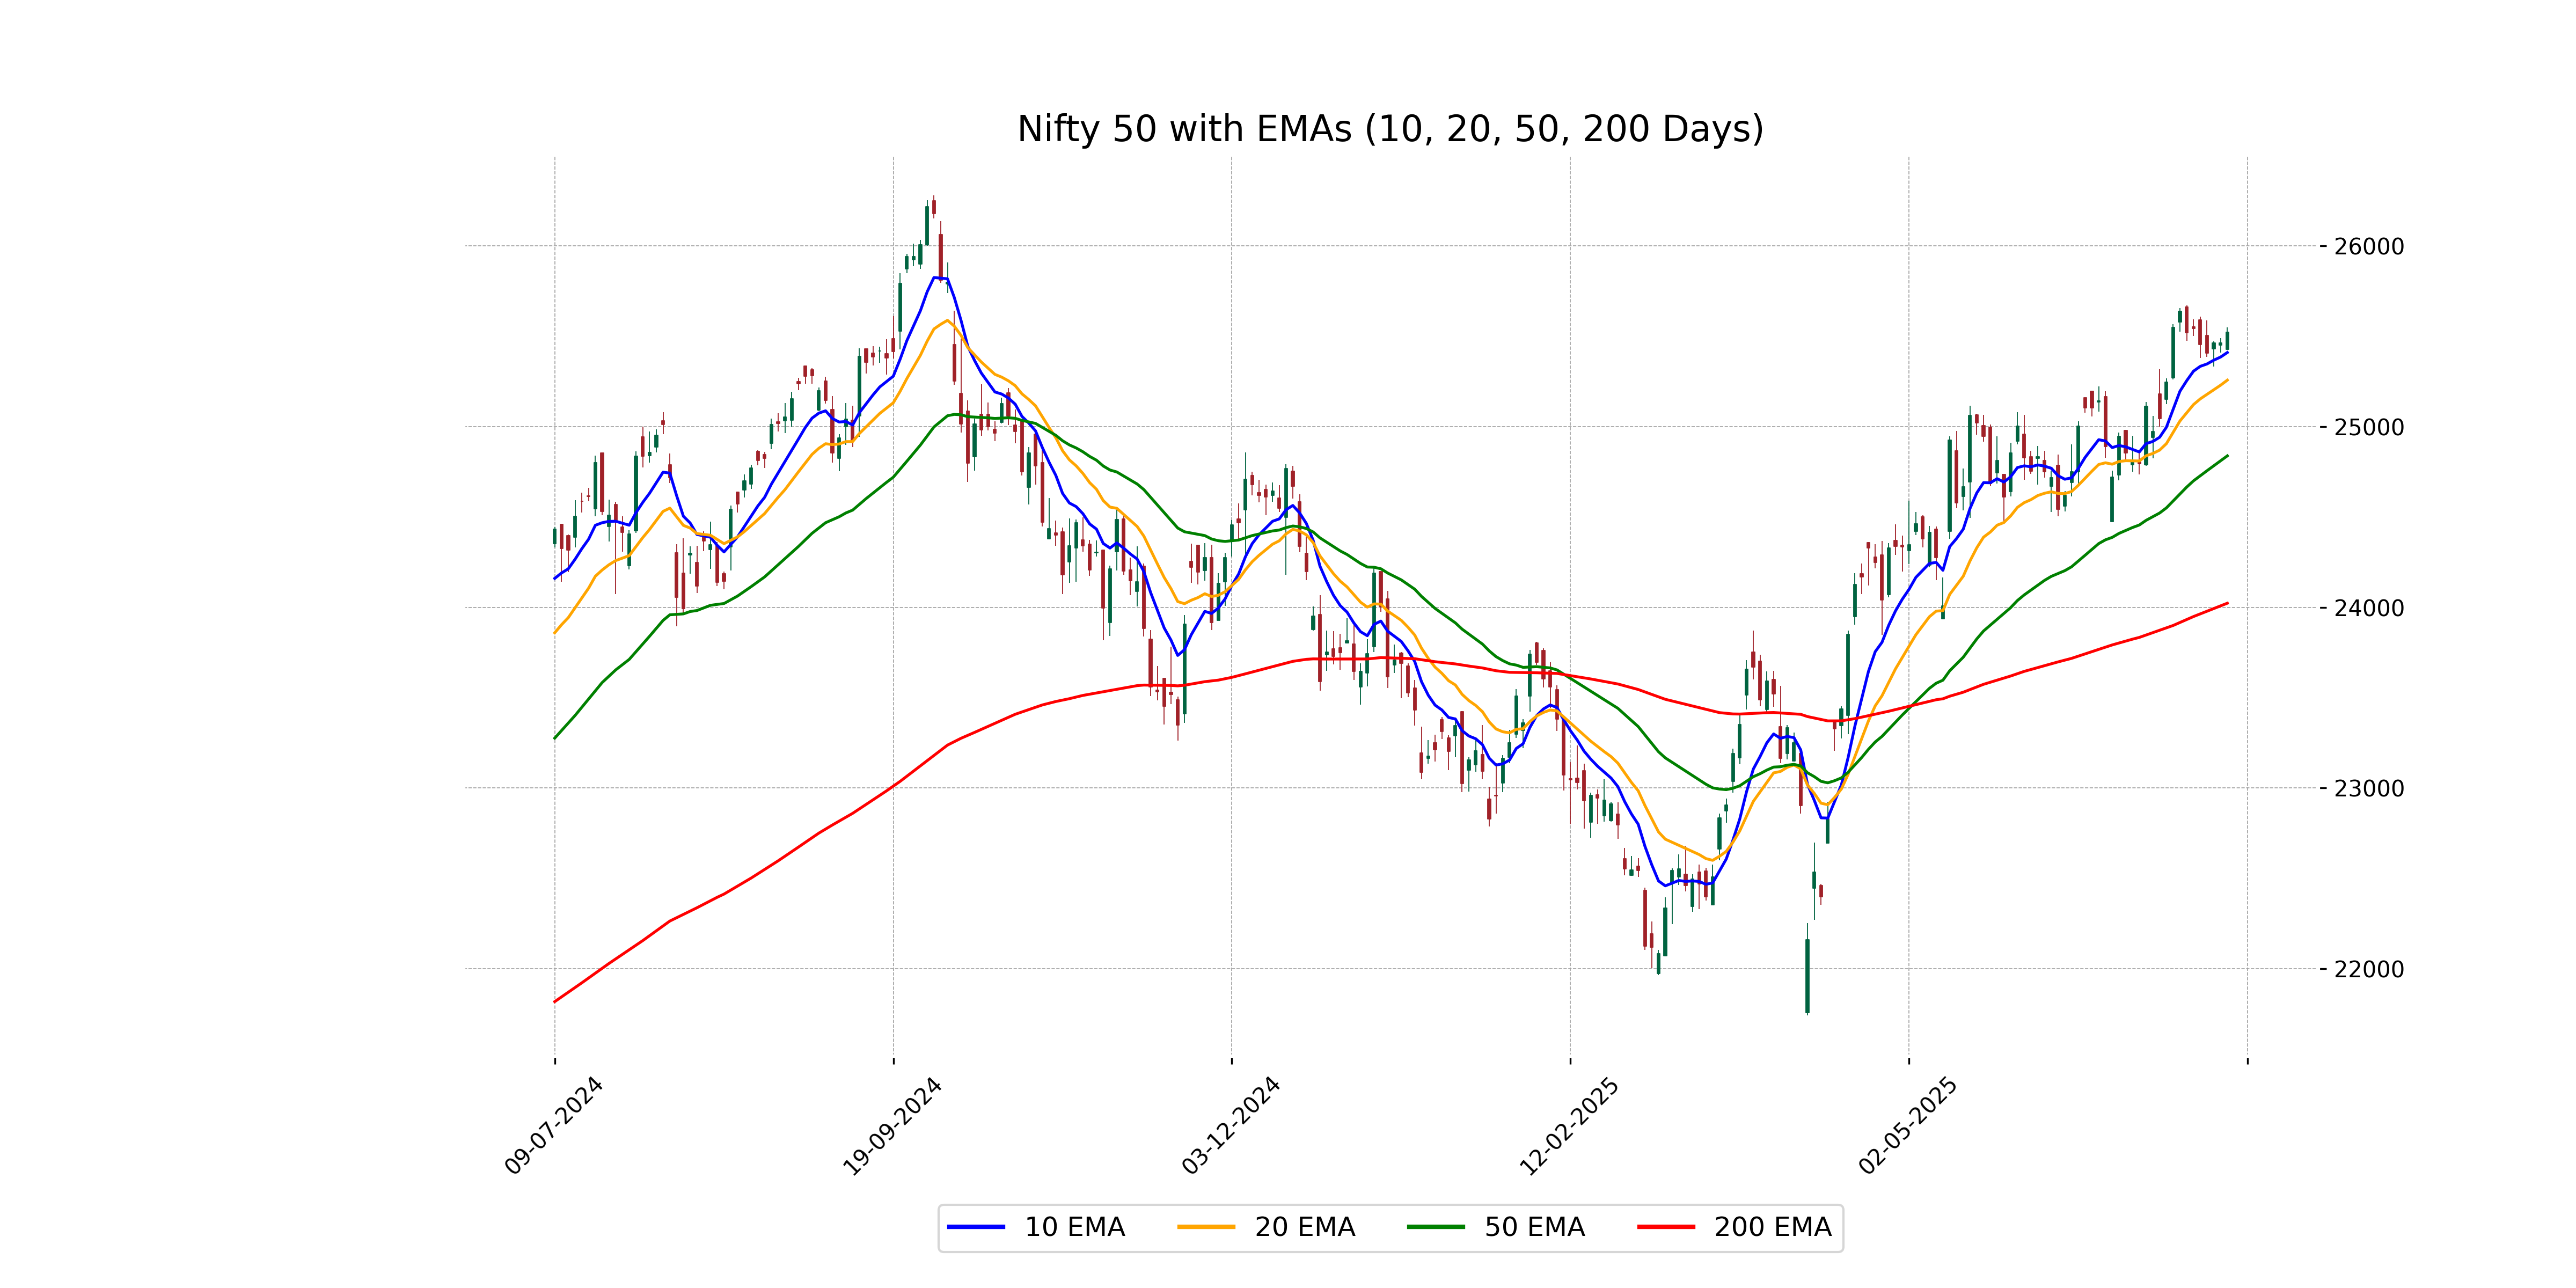
Relationship with Key Moving Averages
The Nifty 50's current close of 25,522.5 is above its 10-day EMA of 25,409.14 and significantly higher than both its 50-day EMA of 24,837.55 and 200-day EMA of 24,022.44. This indicates a short-term bullish trend as the index maintains a position above key moving averages.
Moving Averages Trend (MACD)
The MACD line for Nifty 50 is higher than the MACD signal line, with values of 208.51 and 203.61 respectively. This suggests a bullish momentum as the MACD line crossing above the signal line often indicates a potential upward trend continuation. Keep an eye on volume and other indicators for confirmation.
RSI Analysis
The RSI value for Nifty 50 is 62.53, which indicates that the index is in the bullish zone, but not yet overbought. Generally, an RSI above 70 may suggest overbought conditions, while below 30 indicates oversold conditions.