Global stock market indices: How the world markets performed today - 12 February 2025
The international stock market indices showed varied performances on February 12, 2025, reflecting the economic sentiment across different regions.
In this article, we analyze the performance of key global indices including the S&P 500, Dow Jones Industrial Average, NASDAQ Composite, FTSE 100, DAX, CAC 40, IBEX 35, Nikkei 225, Hang Seng, Nifty 50, and BSE Sensex.

Analysis for Sensex - February 12, 2025
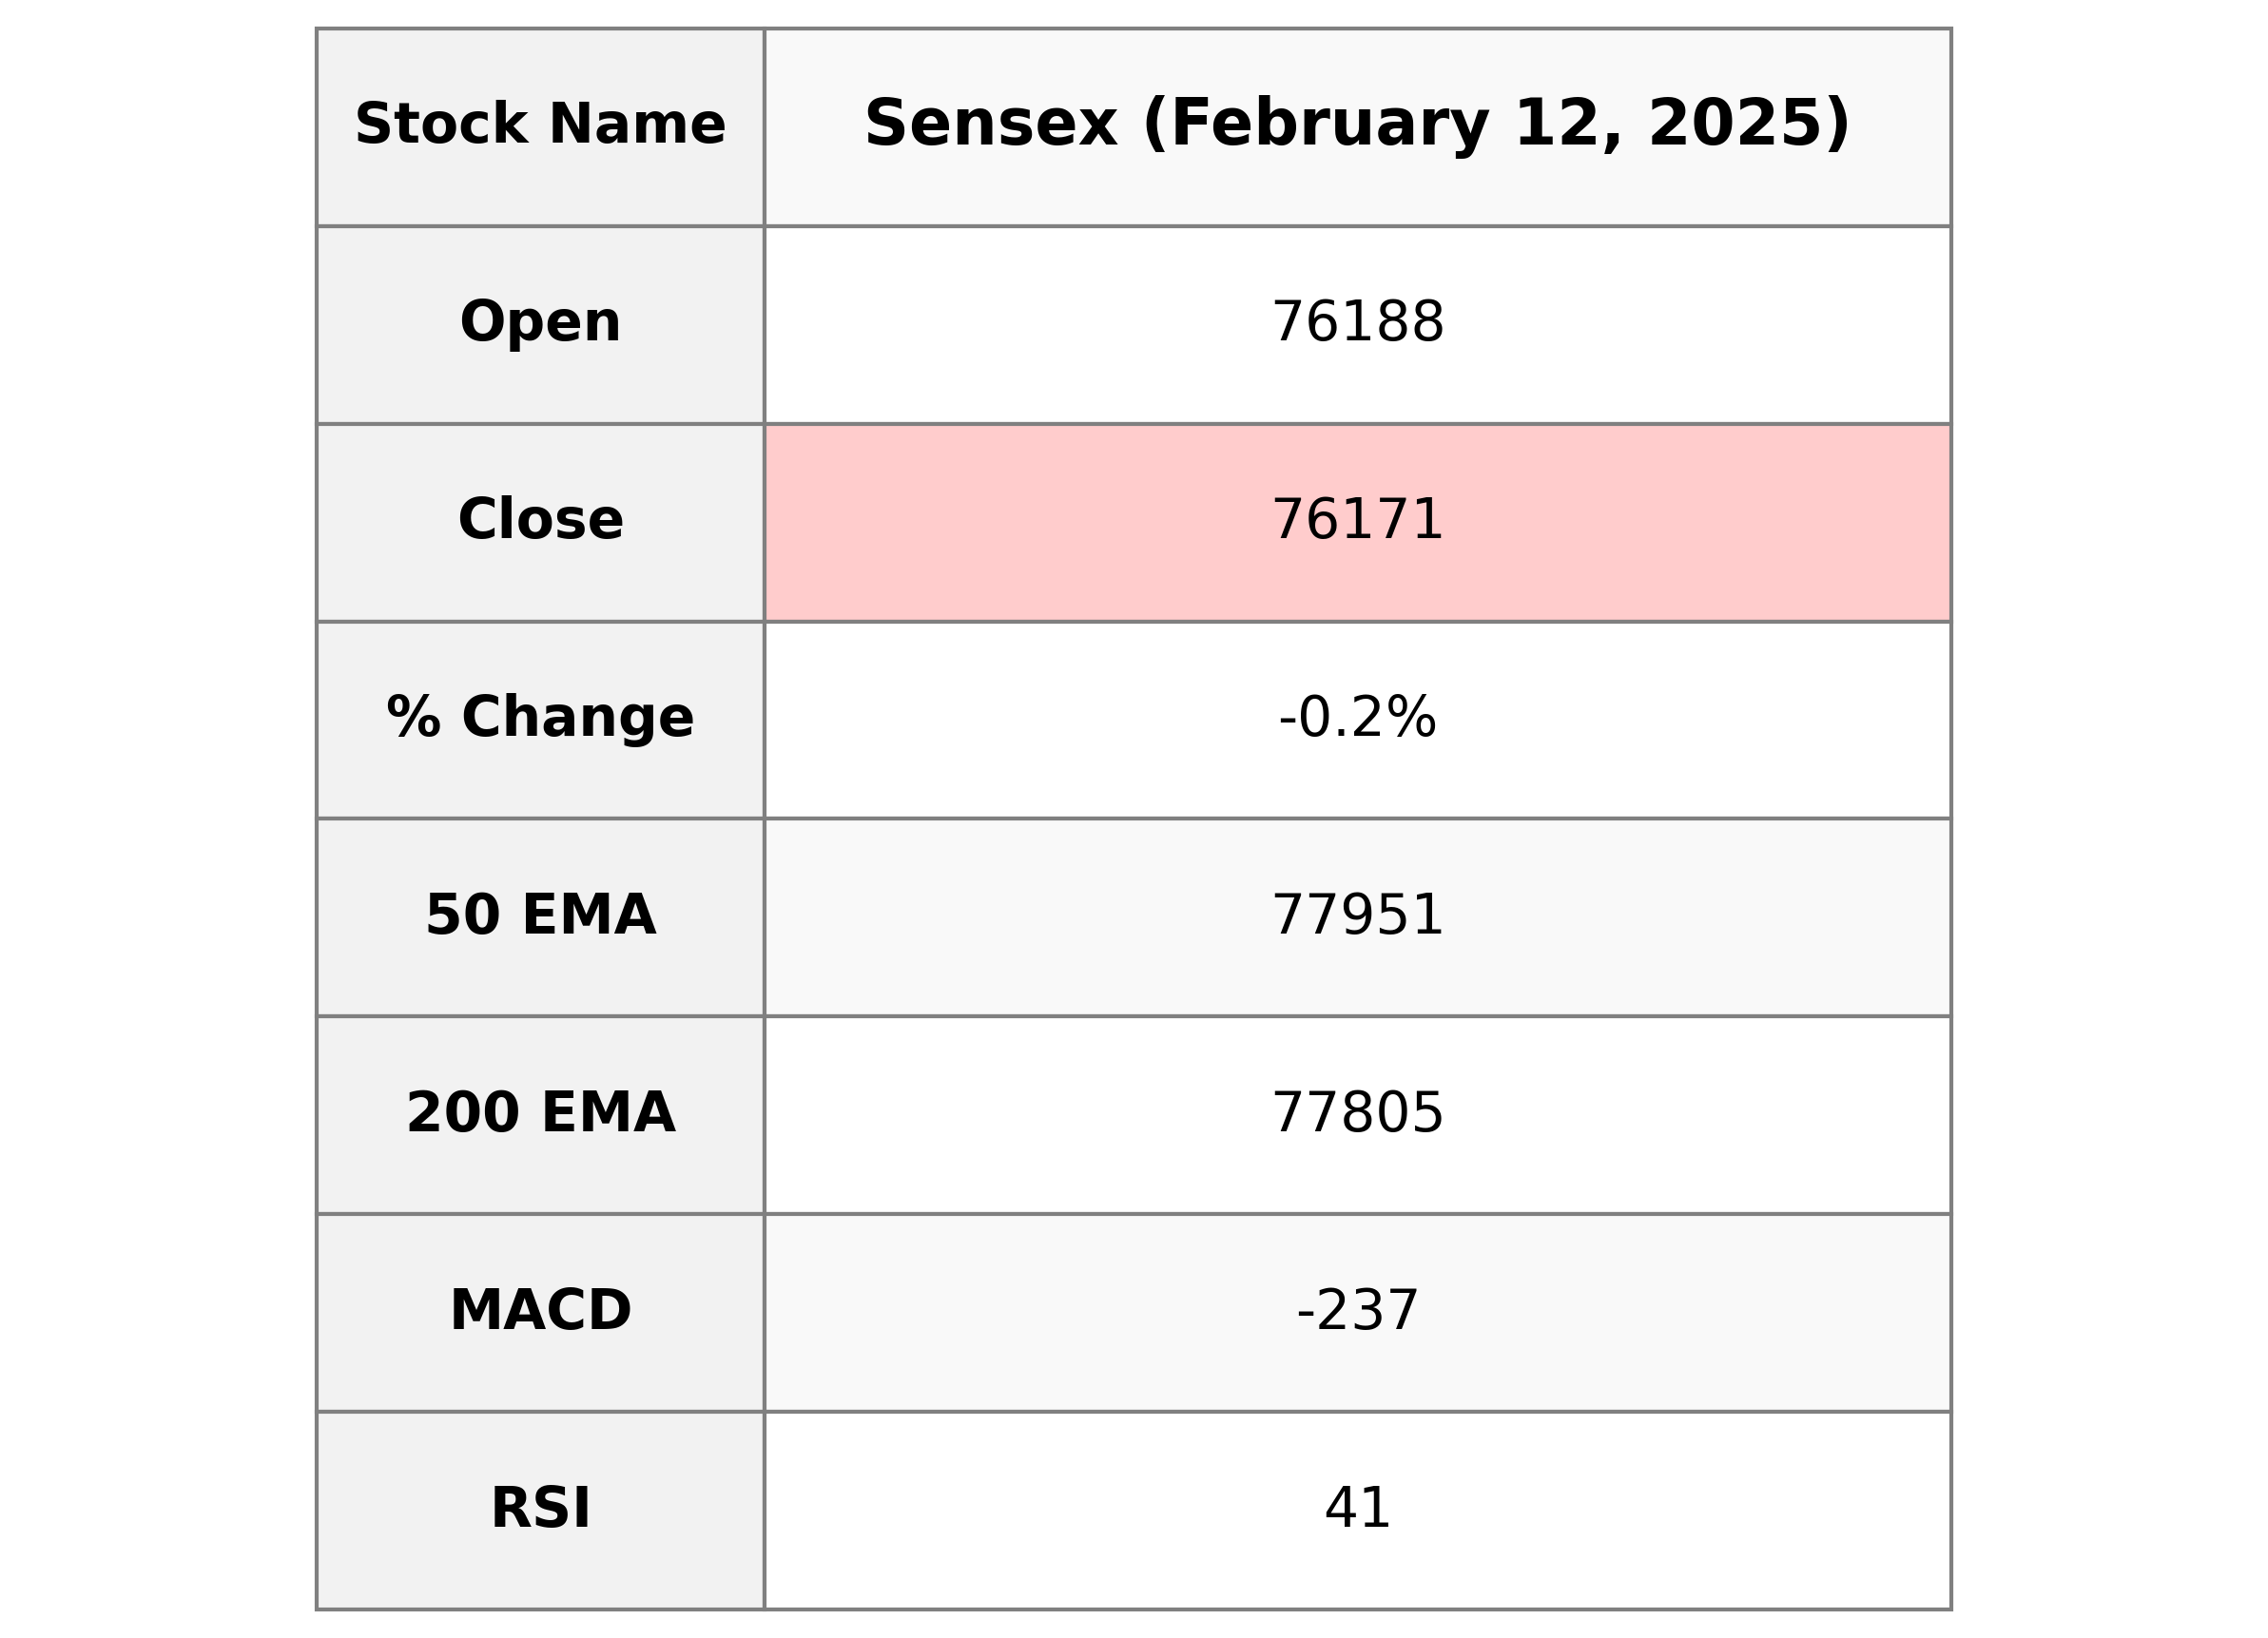
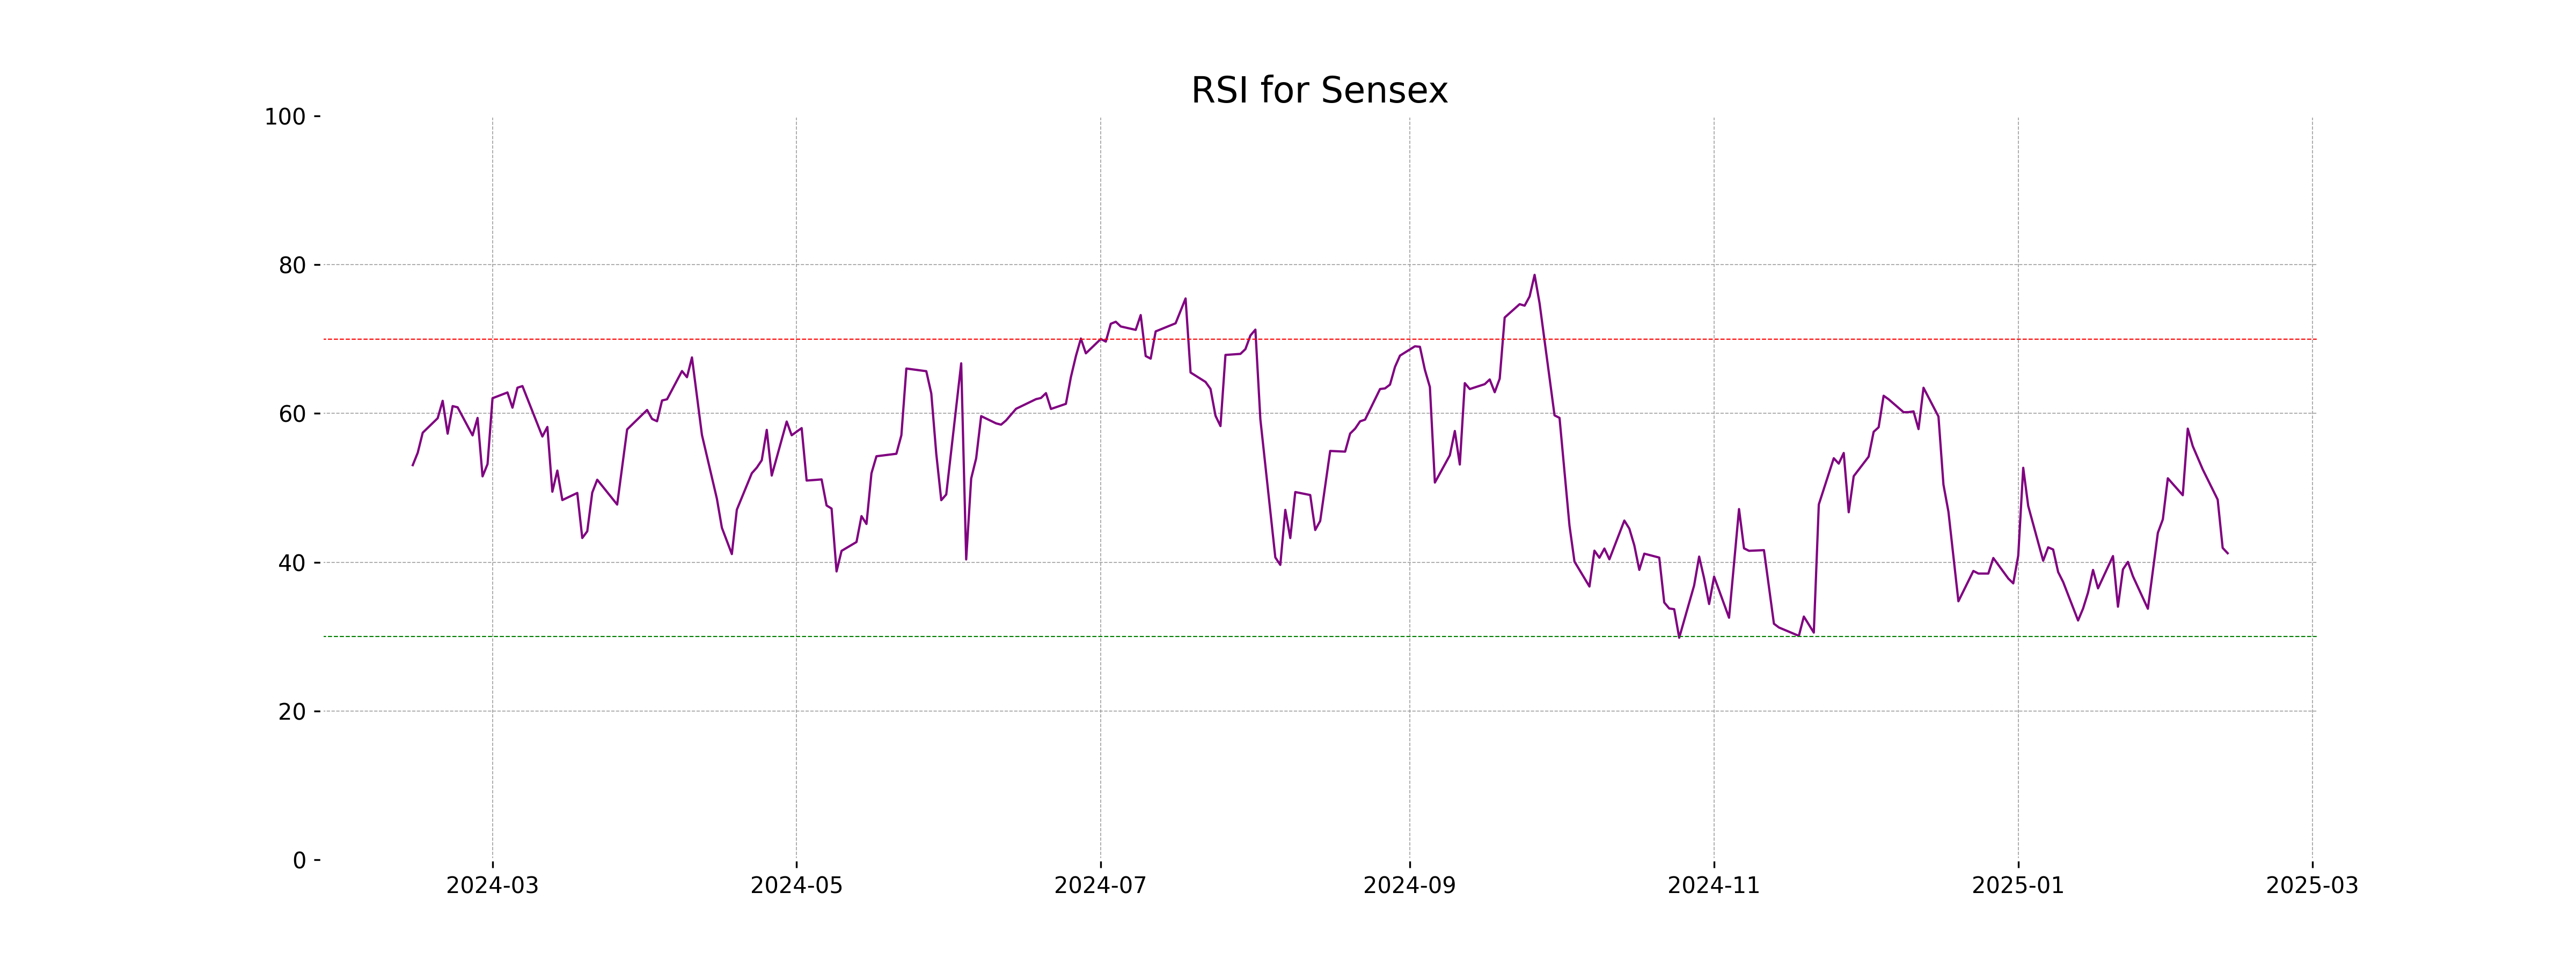
The Sensex opened at 76,188.24 and closed slightly lower at 76,171.08, registering a decline of 0.16% or 122.52 points from the previous close of 76,293.60. Despite the negative movement, the indices displayed high volatility with a day's high of 76,459.72 and a low of 75,388.39. Technical indicators like RSI indicate weak momentum with a value of 41.21, and the MACD suggests a bearish trend as it is negative.
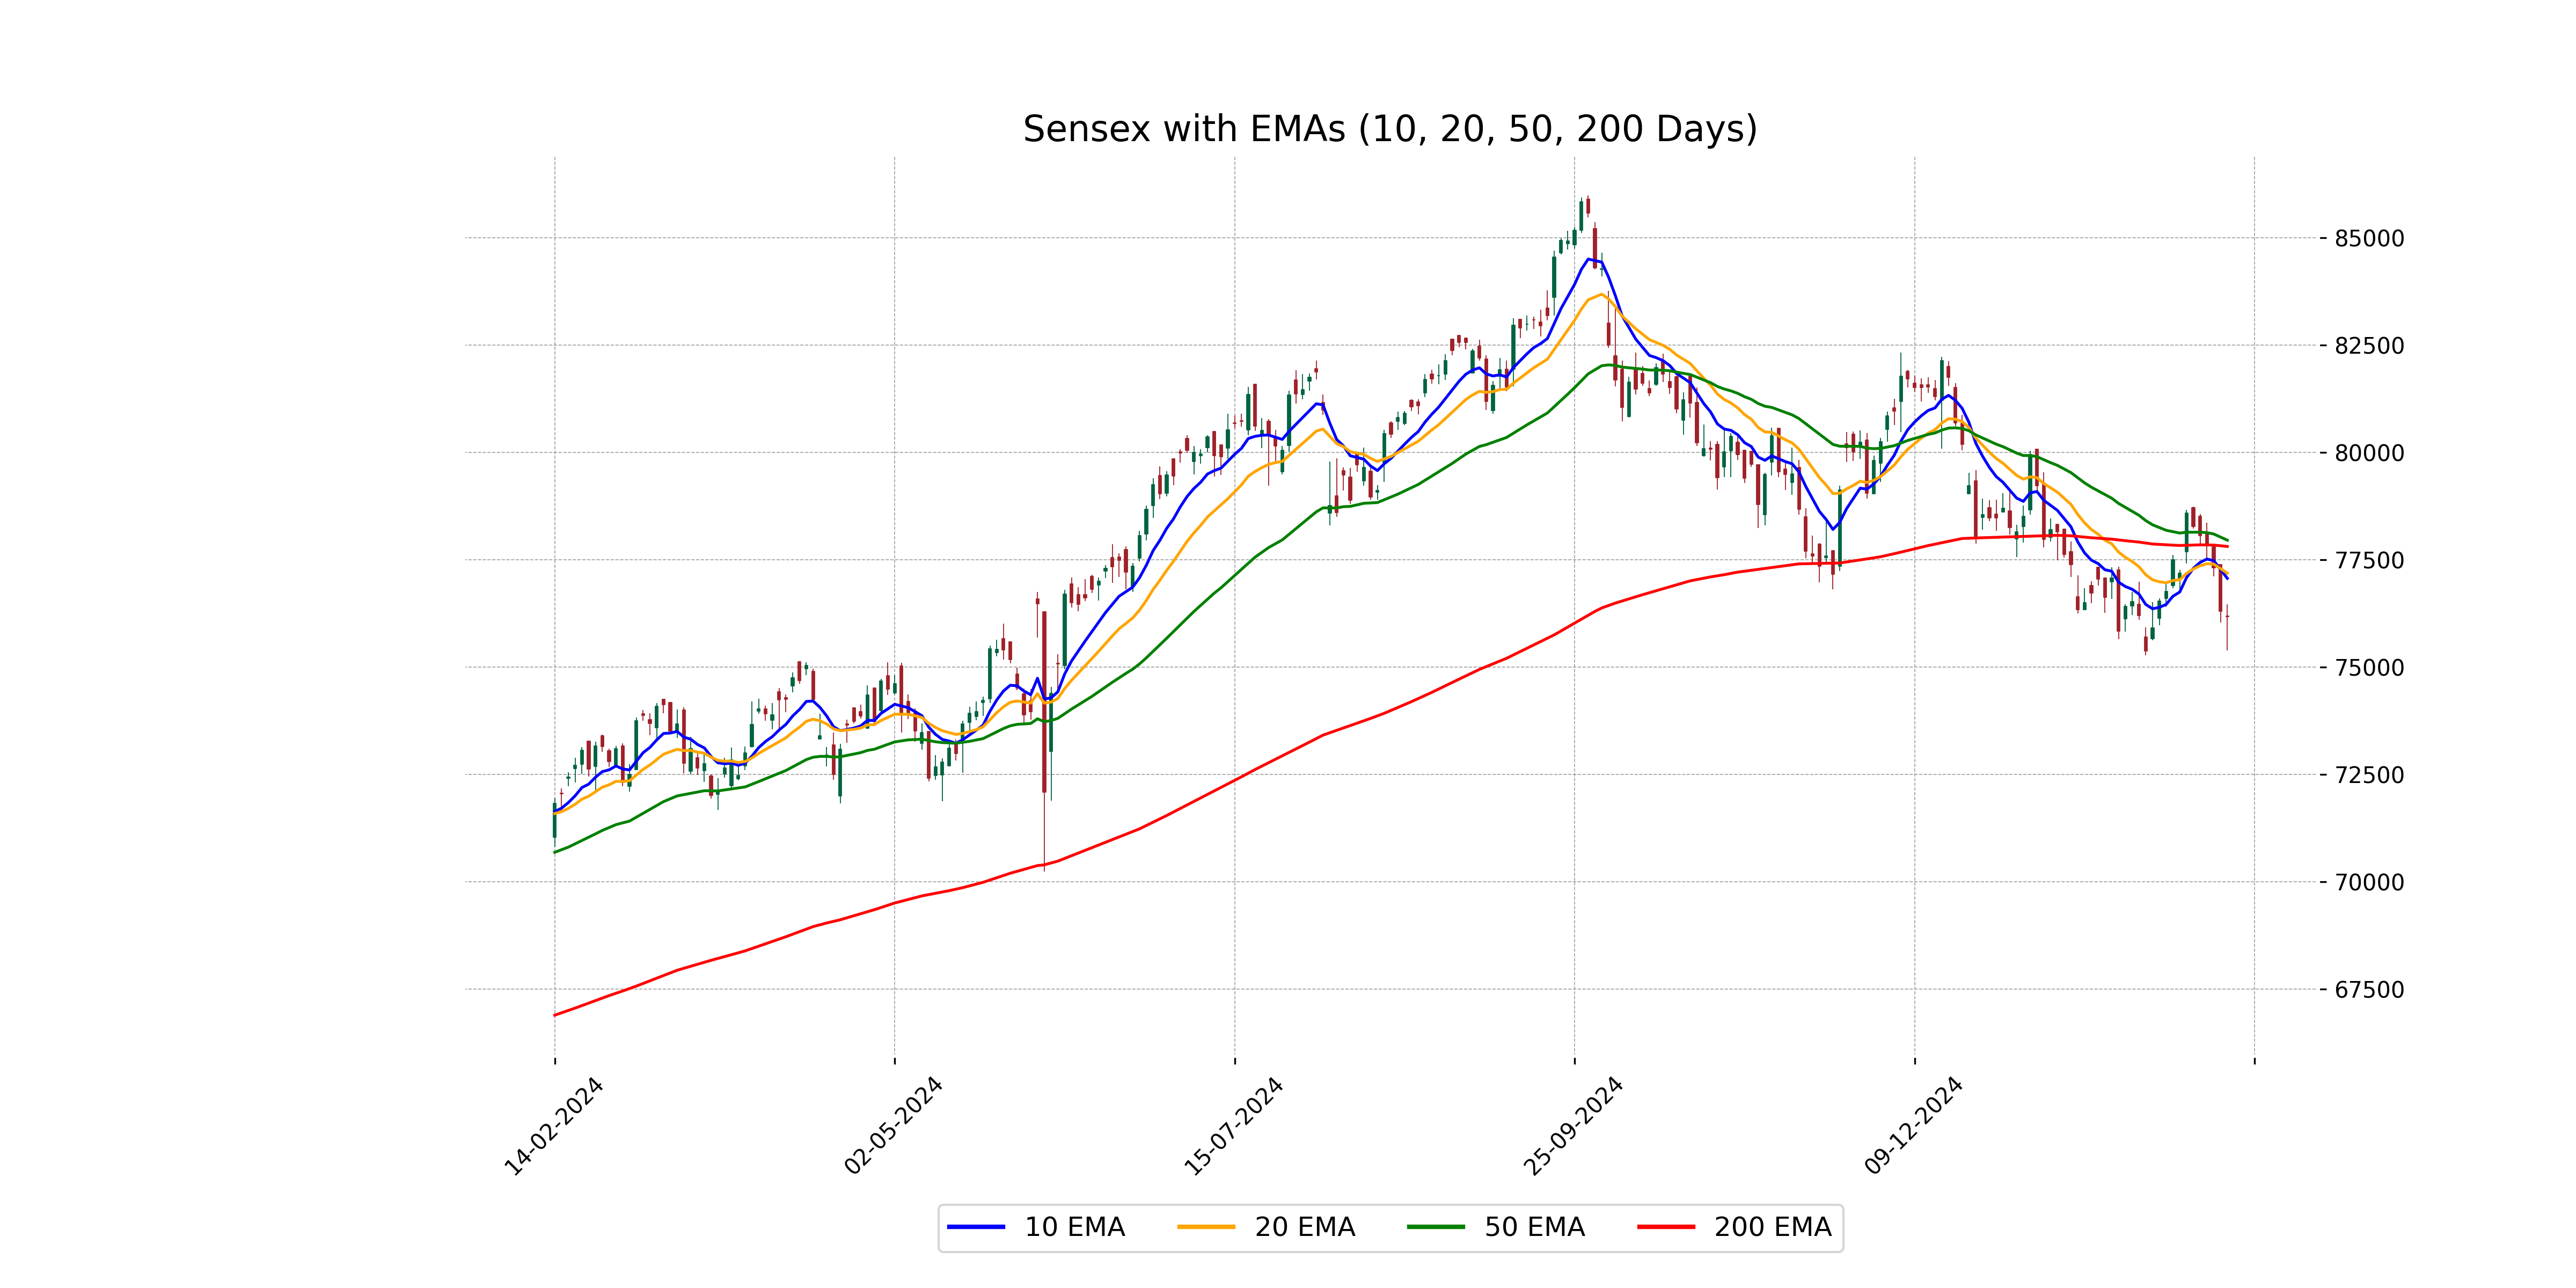
Relationship with Key Moving Averages
The closing price of Sensex at 76,171.078125 is below its 50-day EMA (77,950.982) and 200-day EMA (77,804.957), indicating a bearish trend. Additionally, the price is also below the 10-day EMA (77,062.059) and 20-day EMA (77,182.659), suggesting short-term weakness.
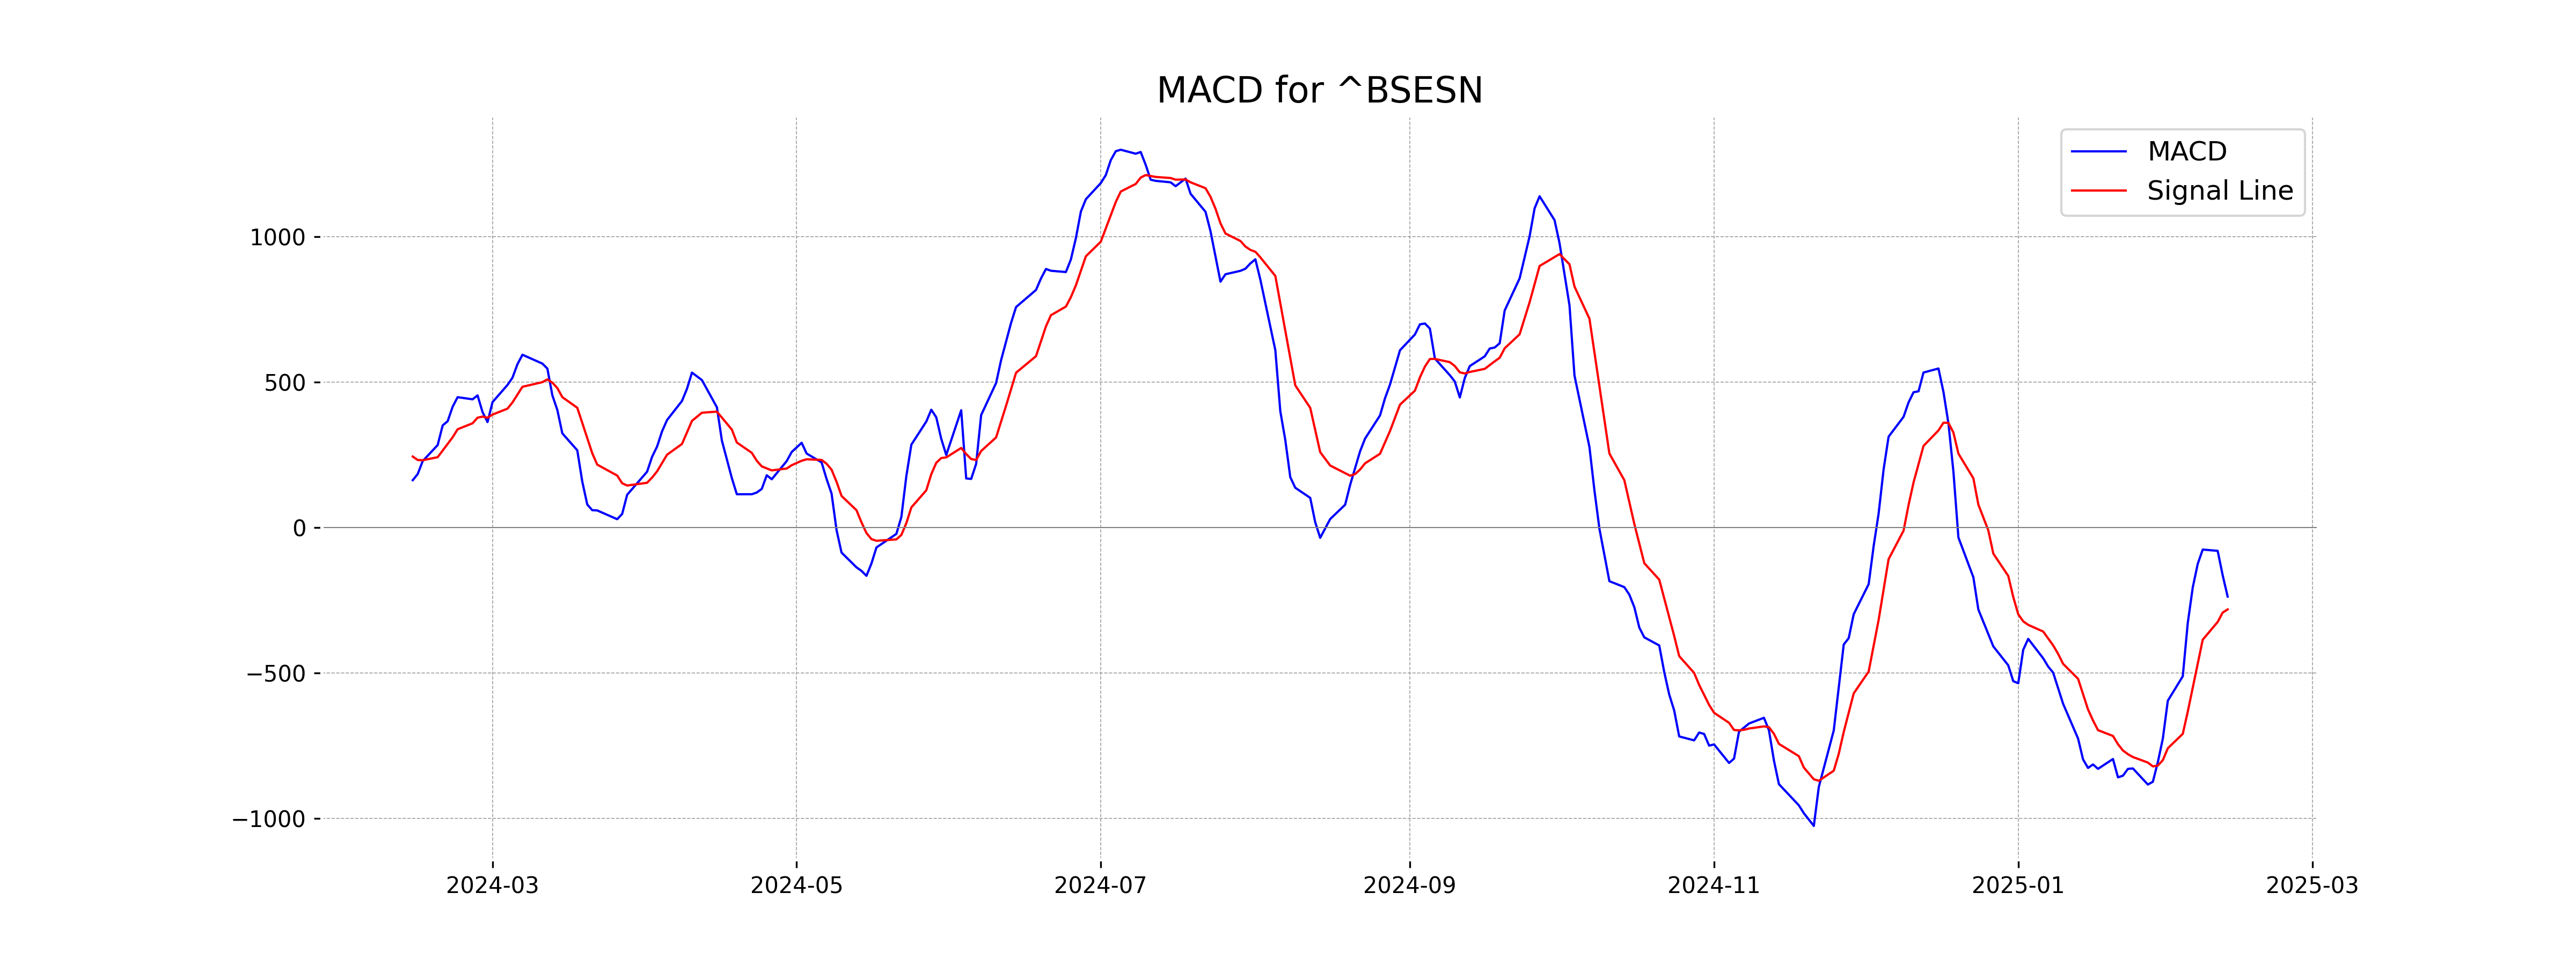
Moving Averages Trend (MACD)
The MACD for Sensex indicates a bearish trend with a value of -237.49, as it is below the signal line at -281.42. This suggests a continuation of downward momentum in the market.
RSI Analysis
The Sensex has an RSI value of 41.21, indicating that it is approaching the oversold territory, though it is not yet there. Typically, an RSI below 30 signals oversold conditions, suggesting potential for an upward price reversal, but at 41.21, it suggests weaker momentum without strong overselling.
Analysis for Dow Jones Industrial Average (US) - February 12, 2025

The Dow Jones Industrial Average (US) opened at 44,401.38 and closed at 44,593.65, showing a positive points change of 123.24 and a percentage change of 0.28%. The index experienced a high of 44,640.60 and a low of 44,319.51 during the trading session. The RSI indicates a moderately strong trend at 57.88, while the MACD is slightly below its signal line.
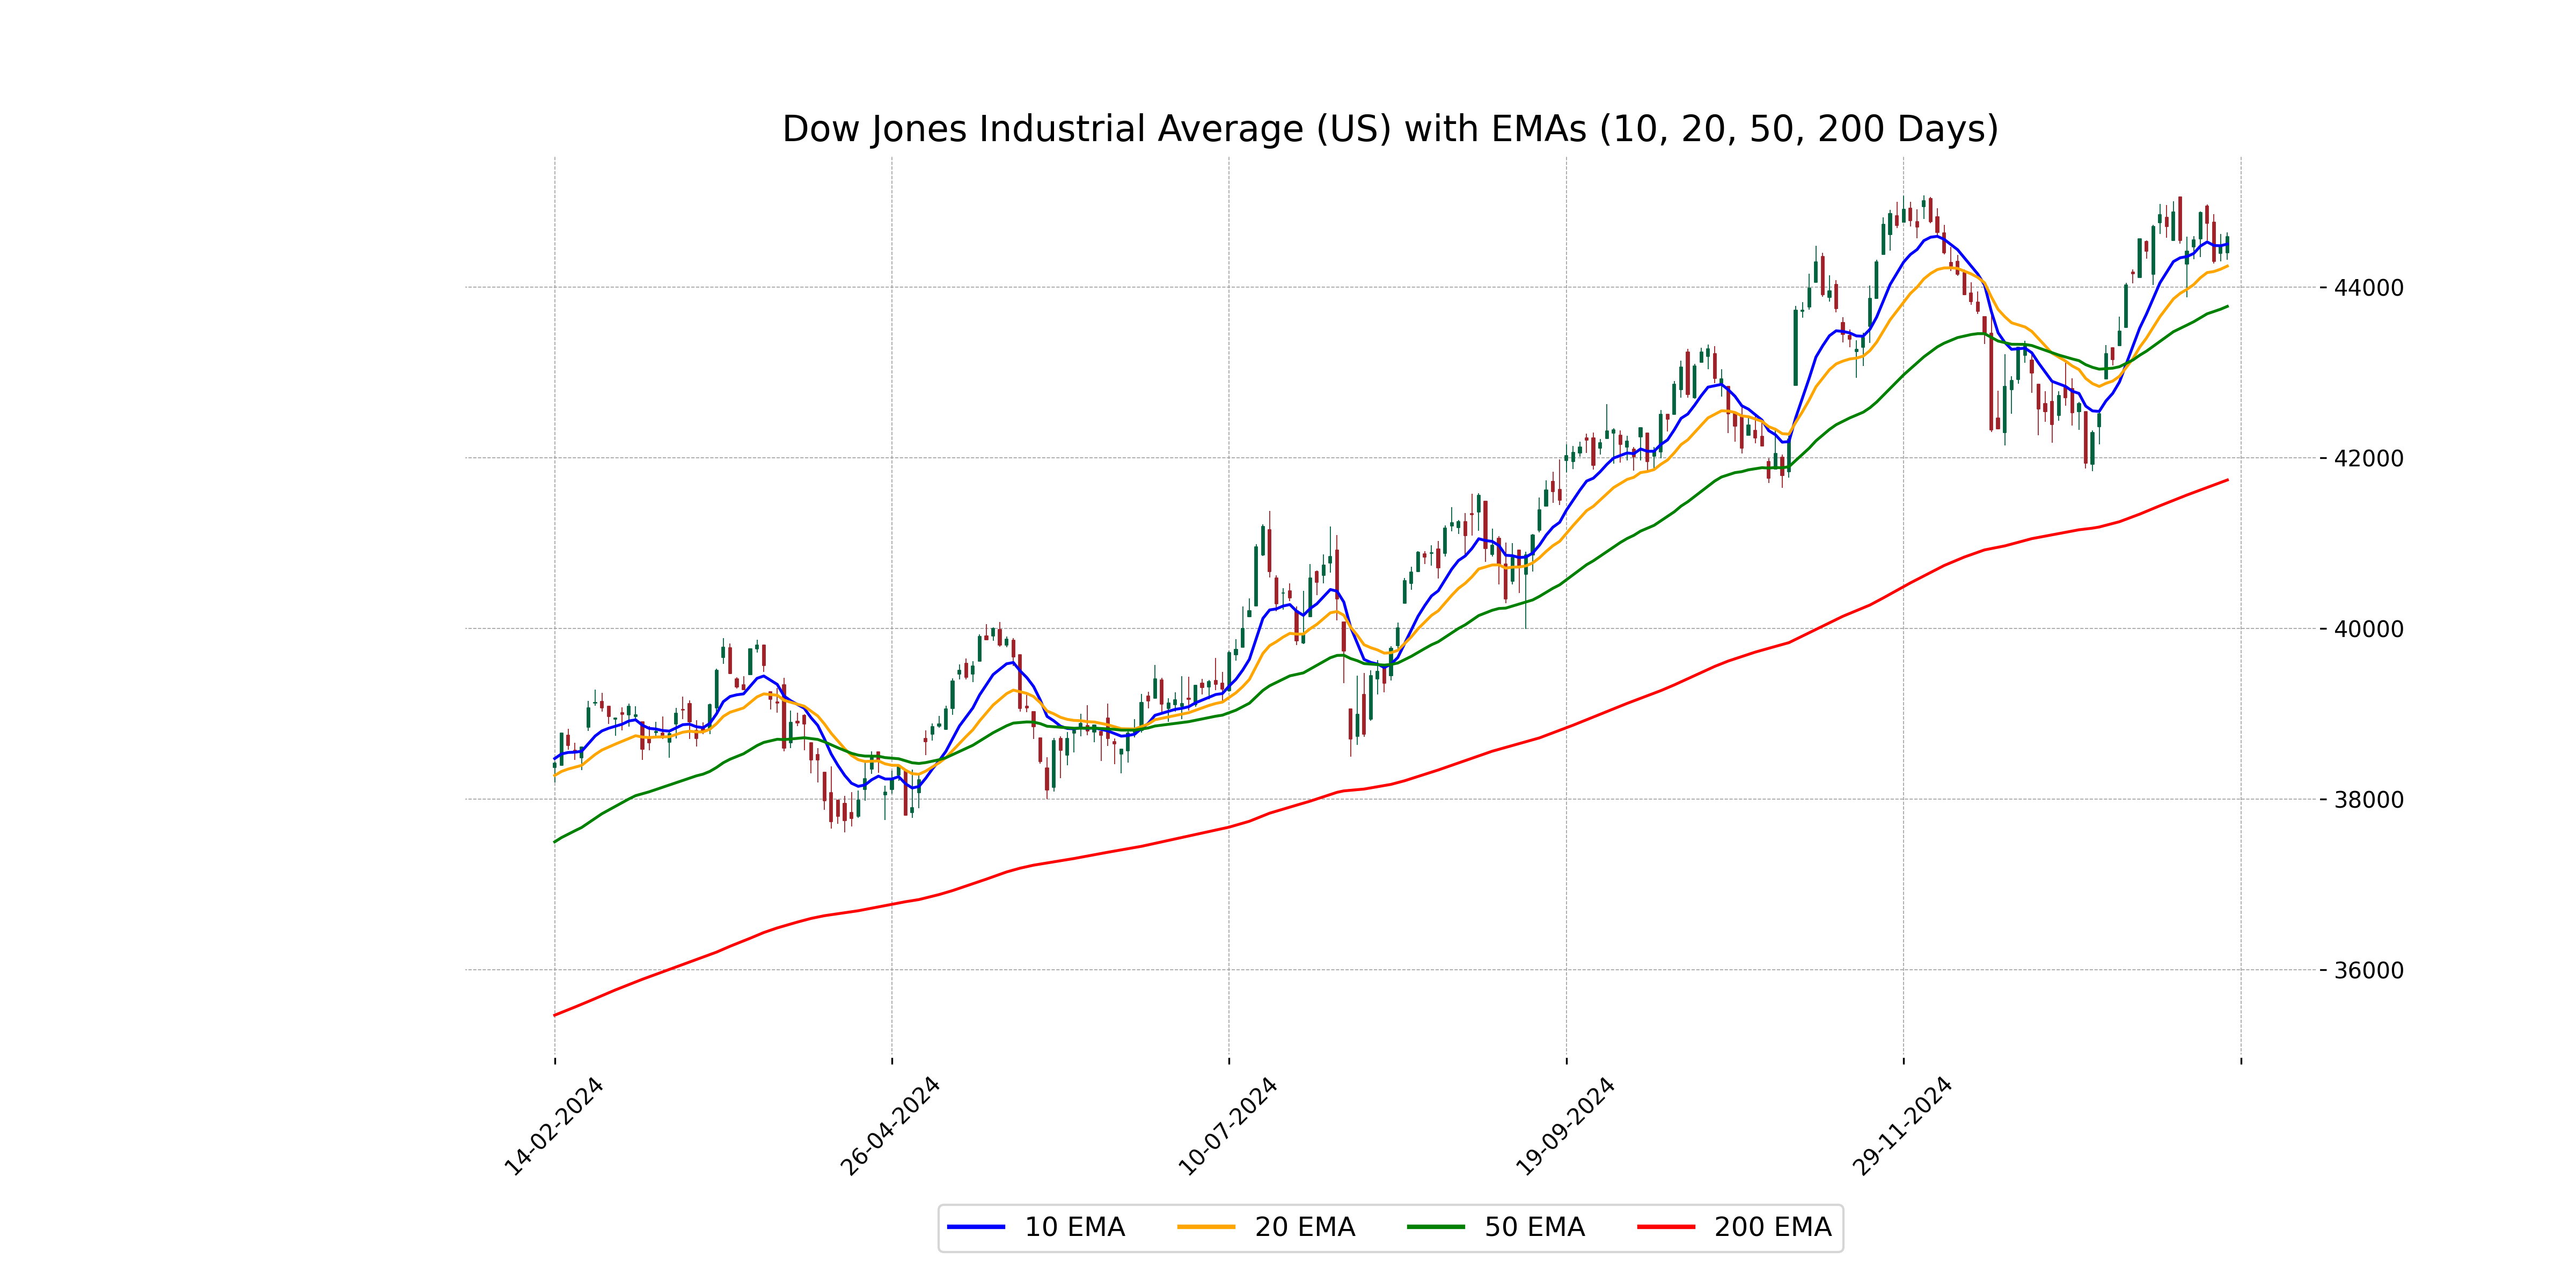
Relationship with Key Moving Averages
The Dow Jones Industrial Average's closing price of 44,593.65 is above its 50-EMA of 43,775.28, suggesting a potential uptrend. It also exceeds both the 10-EMA of 44,505.06 and the 20-EMA of 44,247.30, indicating short-term bullish momentum. However, the MACD is slightly below its signal line, which may suggest slowing momentum.
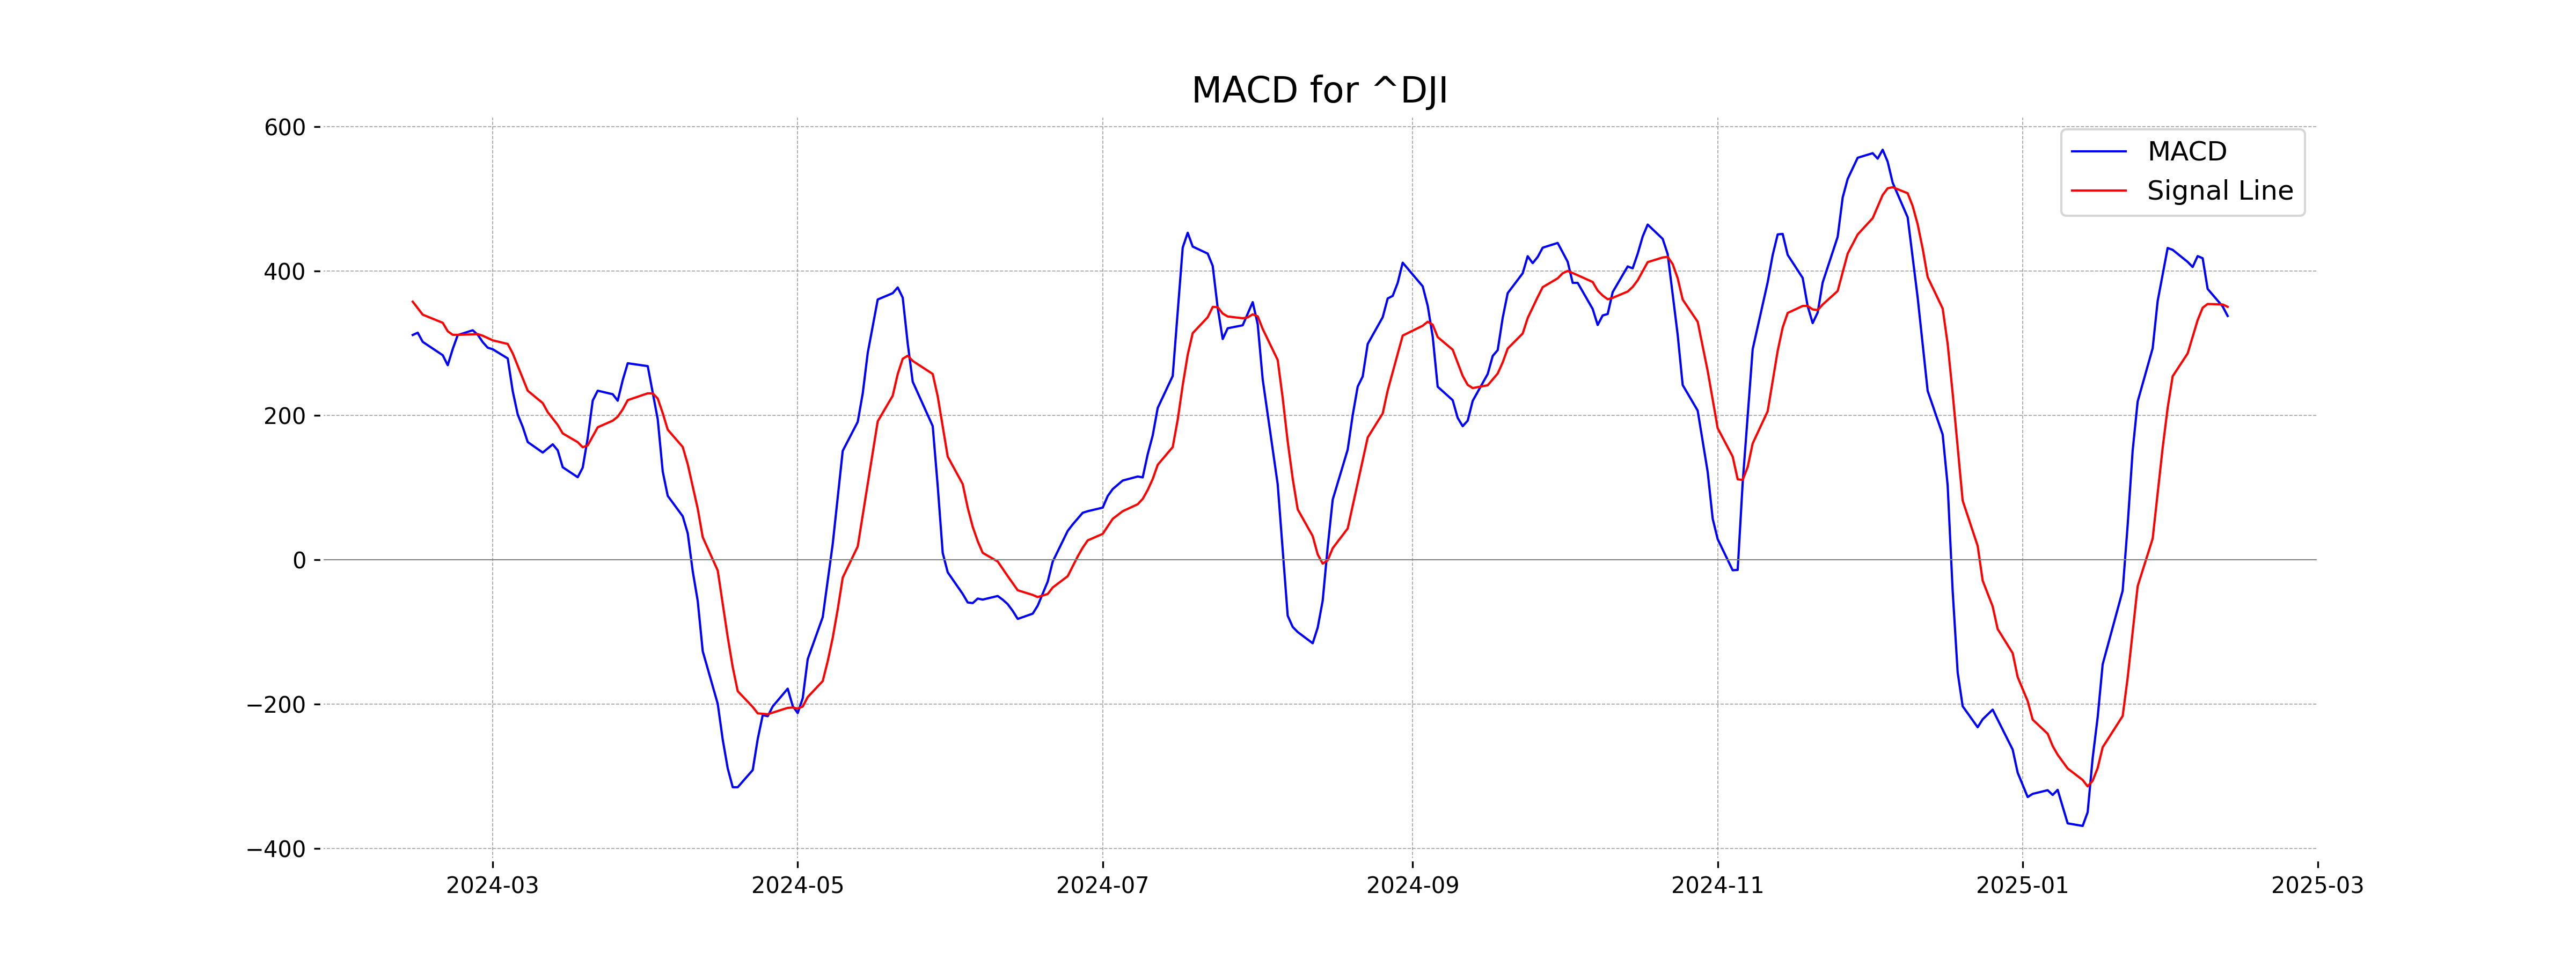
Moving Averages Trend (MACD)
The Dow Jones Industrial Average's MACD is currently at 337.80, which is below the MACD Signal line of 350.53. This indicates a bearish signal, suggesting potential downward momentum or a slowdown in upward movement.
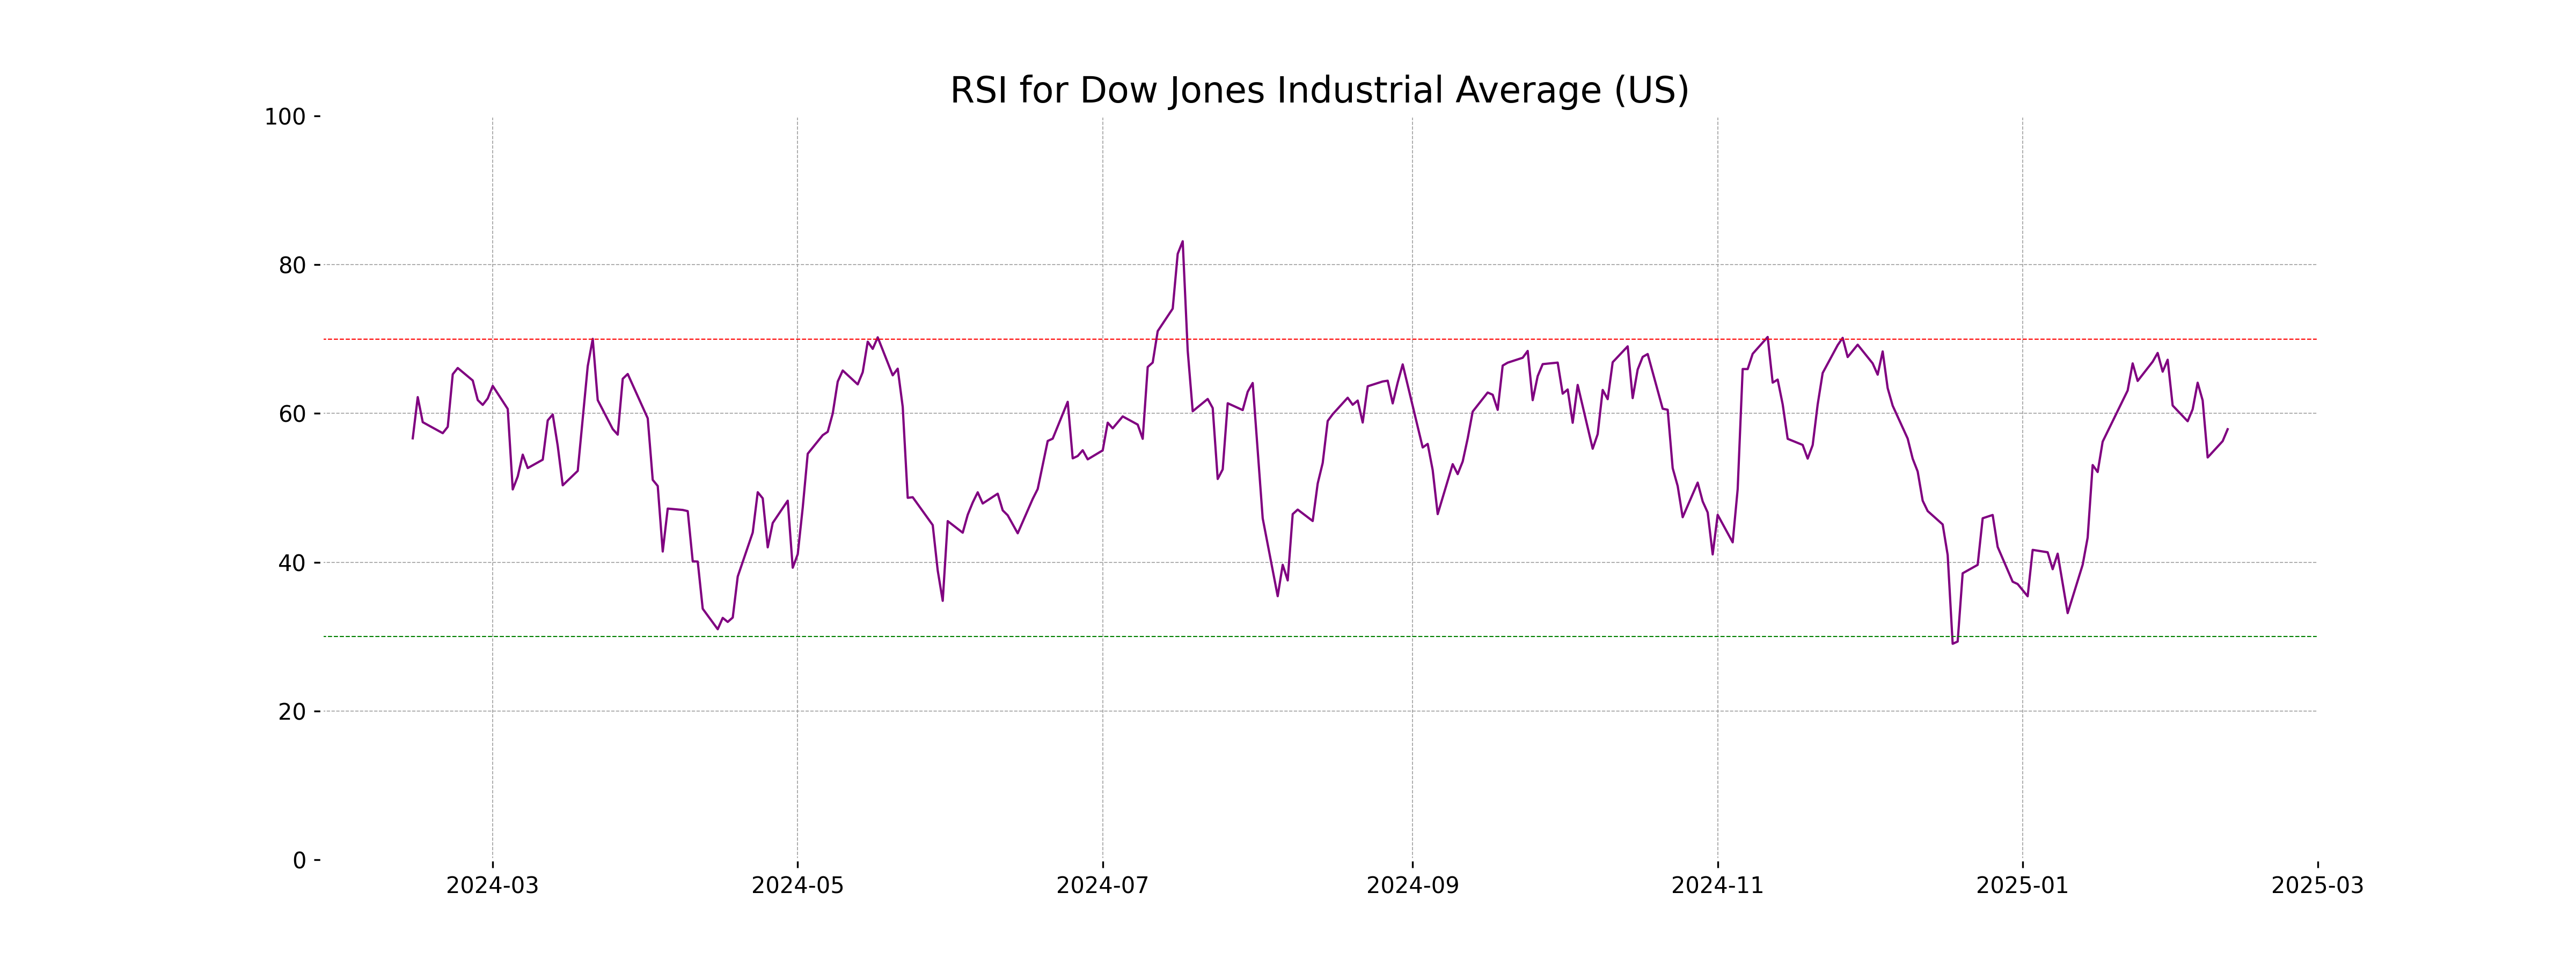
RSI Analysis
The current RSI for Dow Jones Industrial Average is 57.88, which suggests a neutral trend. It indicates that the index is neither overbought nor oversold, lying in a balanced position where price movements could stabilize or transition depending on market conditions.
Analysis for CAC 40 (France) - February 12, 2025
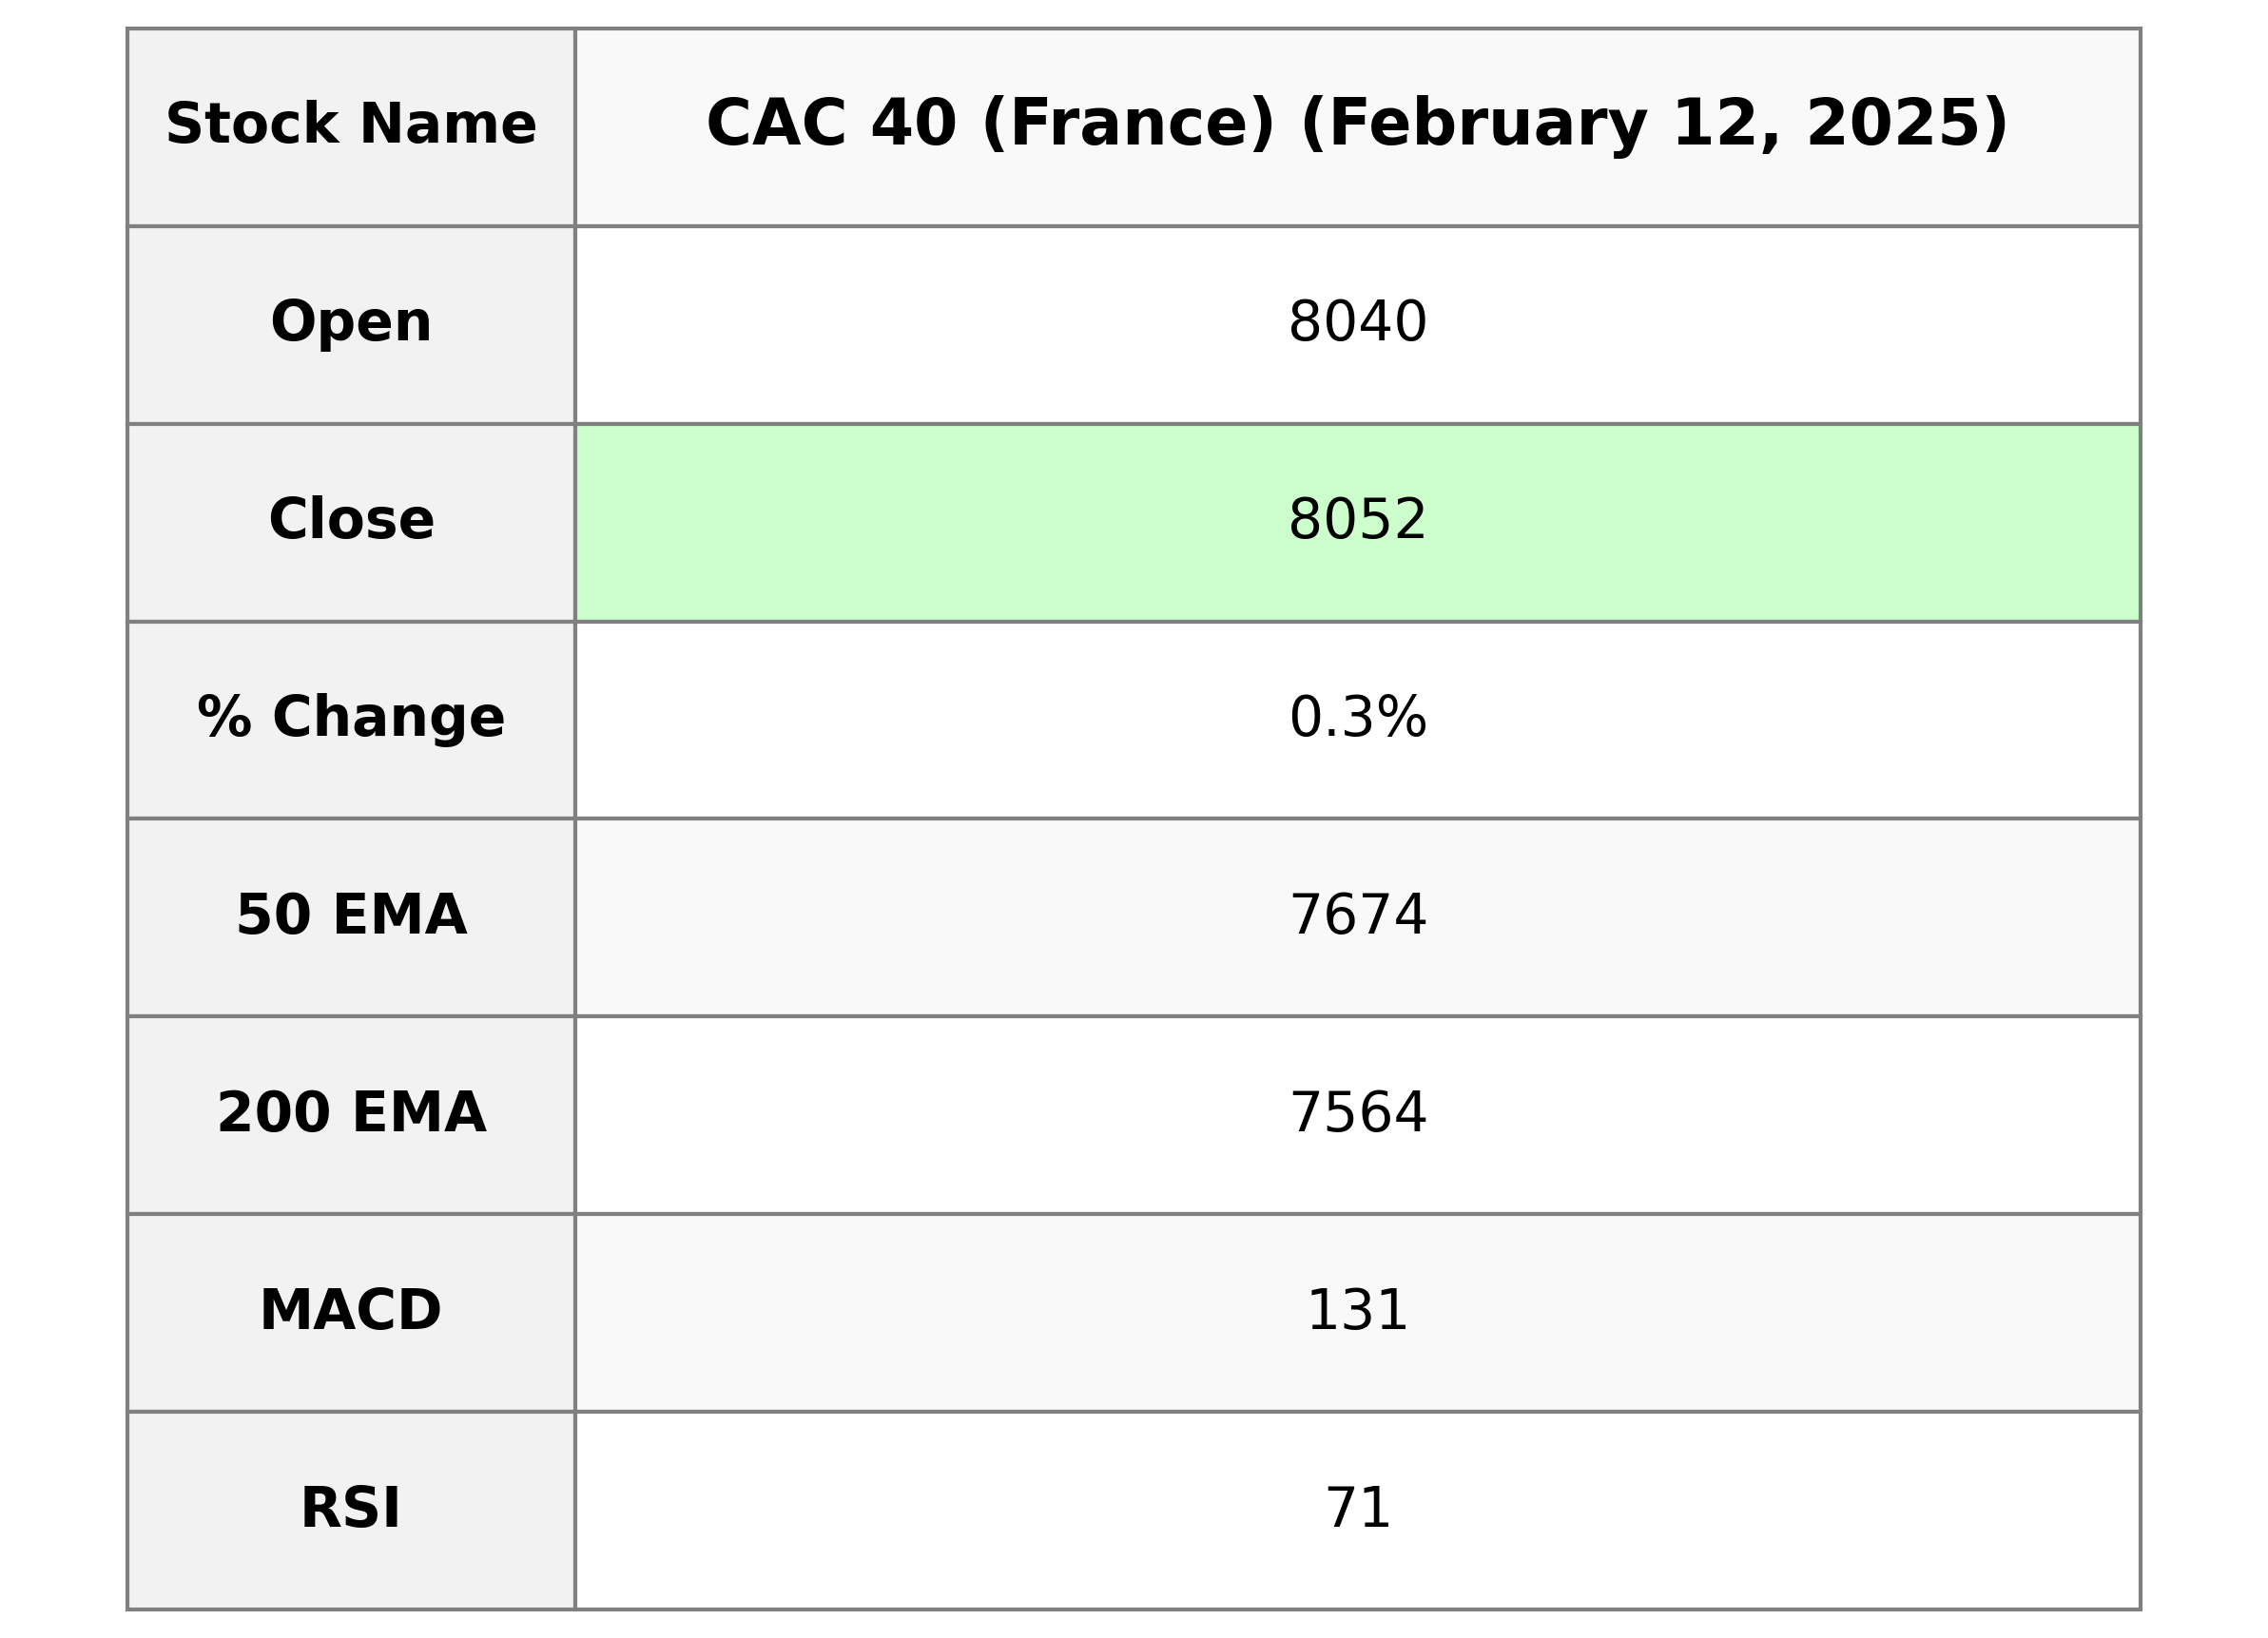
**CAC 40 (France) Performance:** On the latest trading day, CAC 40 opened at 8039.61 and closed at 8051.88, marking a slight increase of 0.29% with a points change of 22.98 from the previous close of 8028.90. The market showed strength with an RSI of 71.06, indicating a potentially overbought condition. The MACD of 131.23 suggests a positive momentum as it is above the MACD Signal line of 130.56.
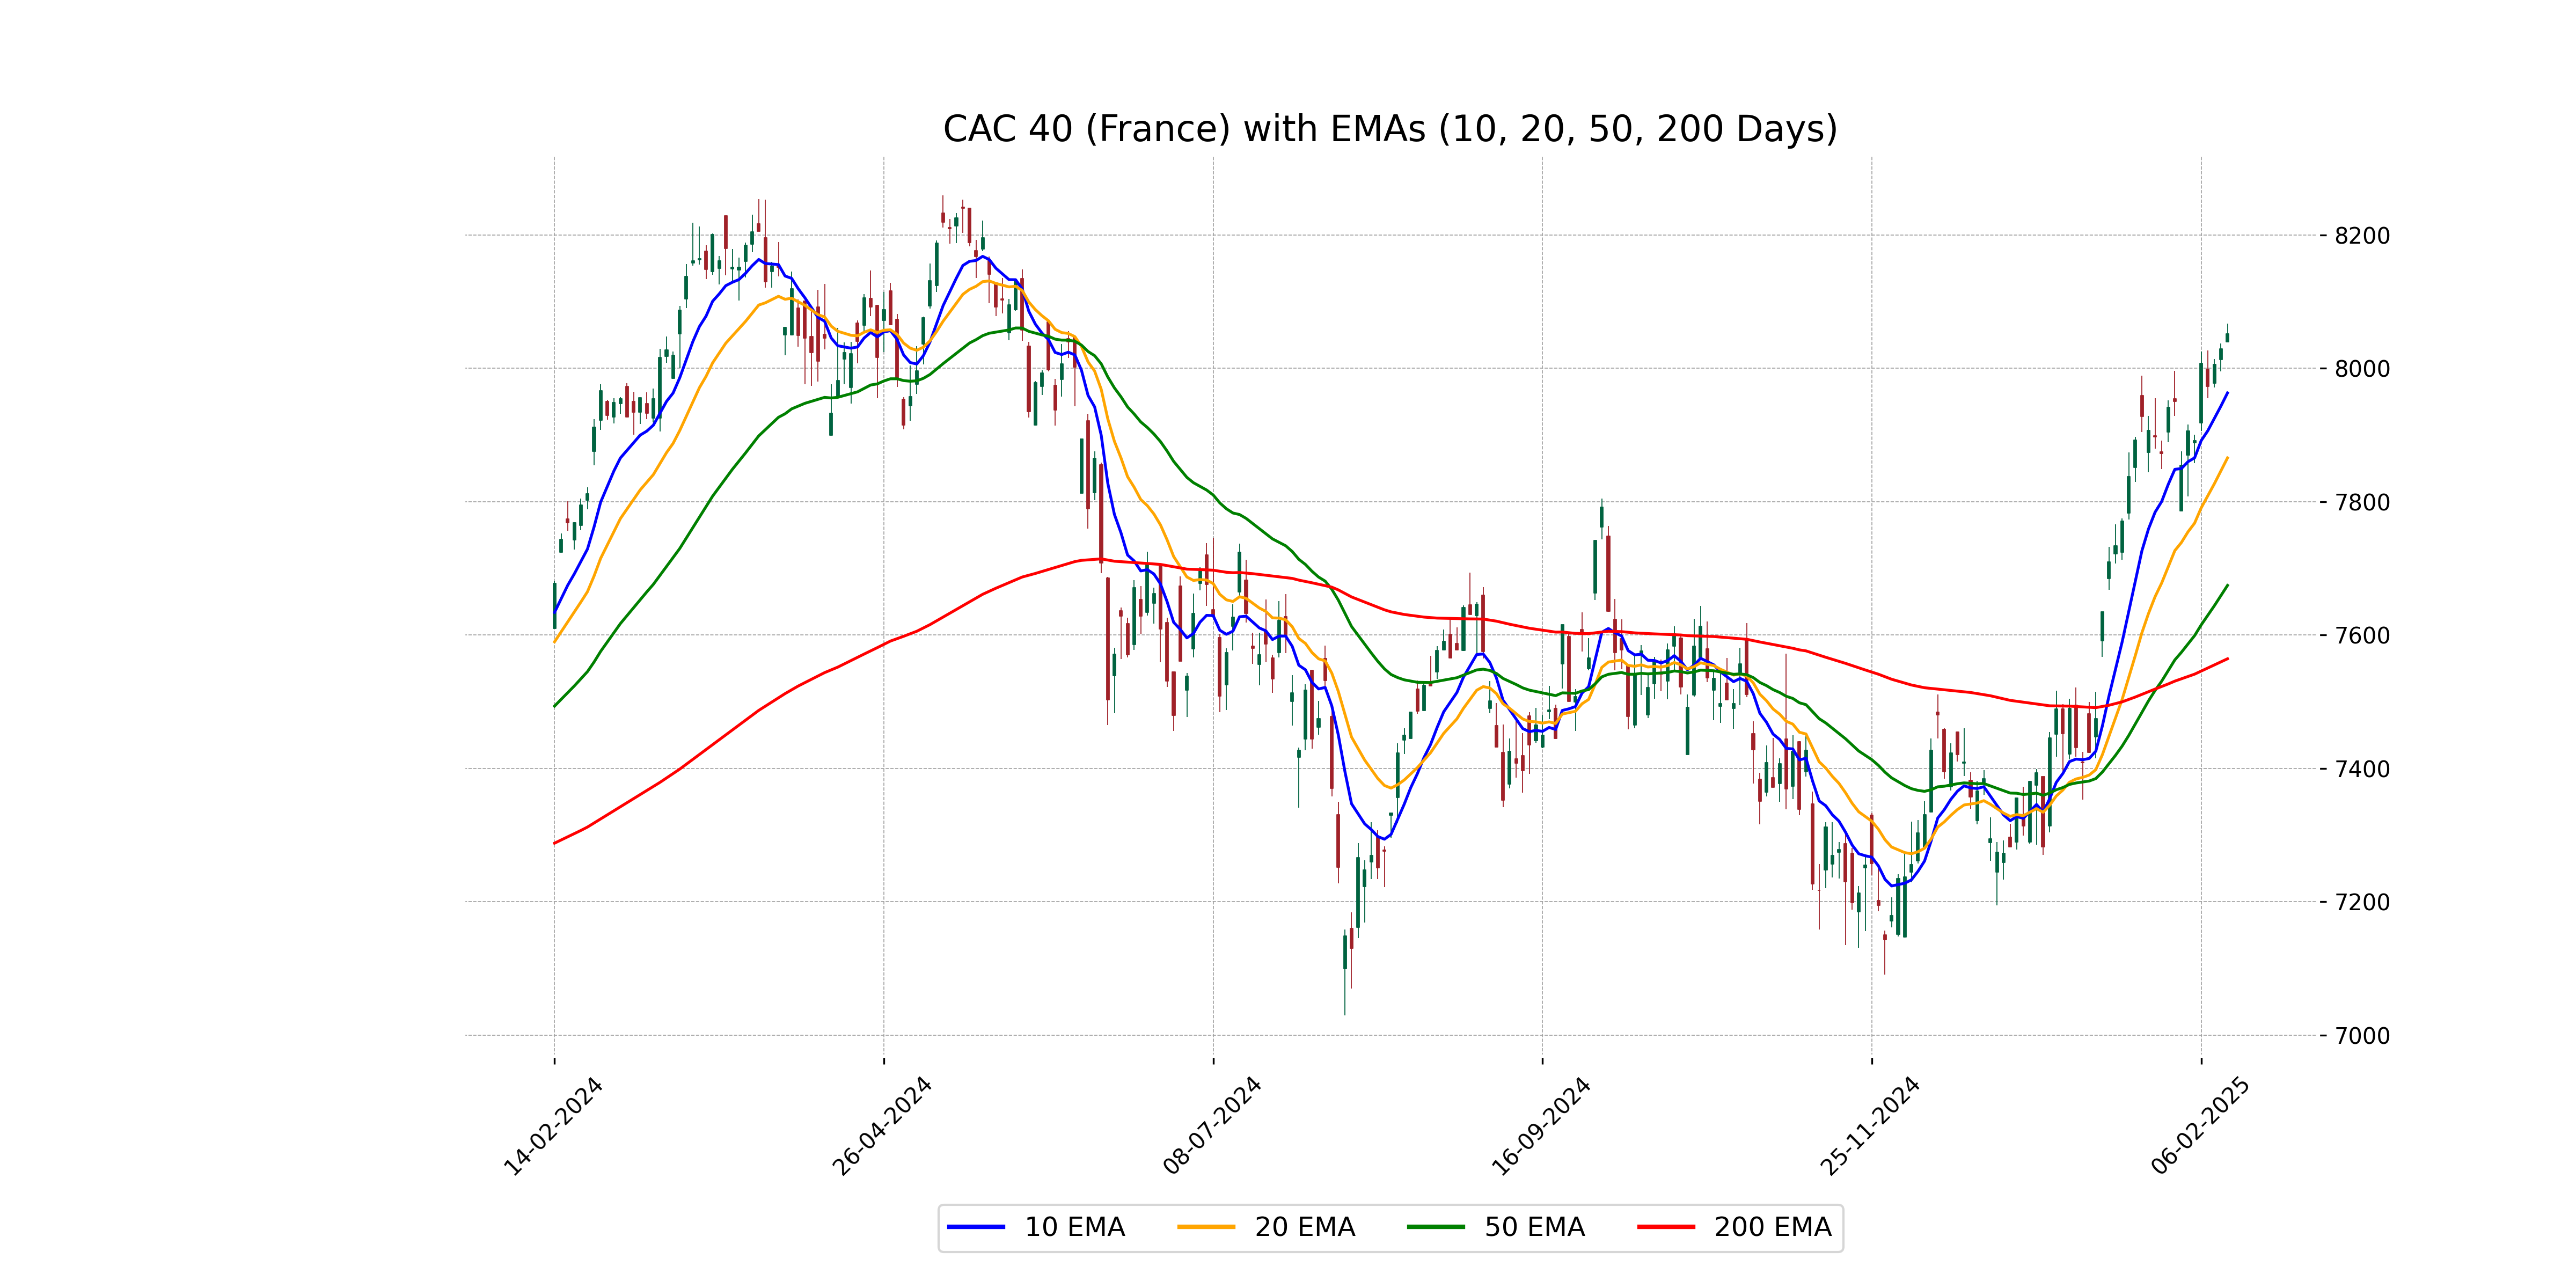
Relationship with Key Moving Averages
The CAC 40 index shows a close price of 8051.88, which is above its 50-day EMA of 7674.50, indicating a bullish short-term trend. Its 10-day EMA of 7963.21 and 20-day EMA of 7865.76 are also below the current close, supporting the strength of this upward momentum.
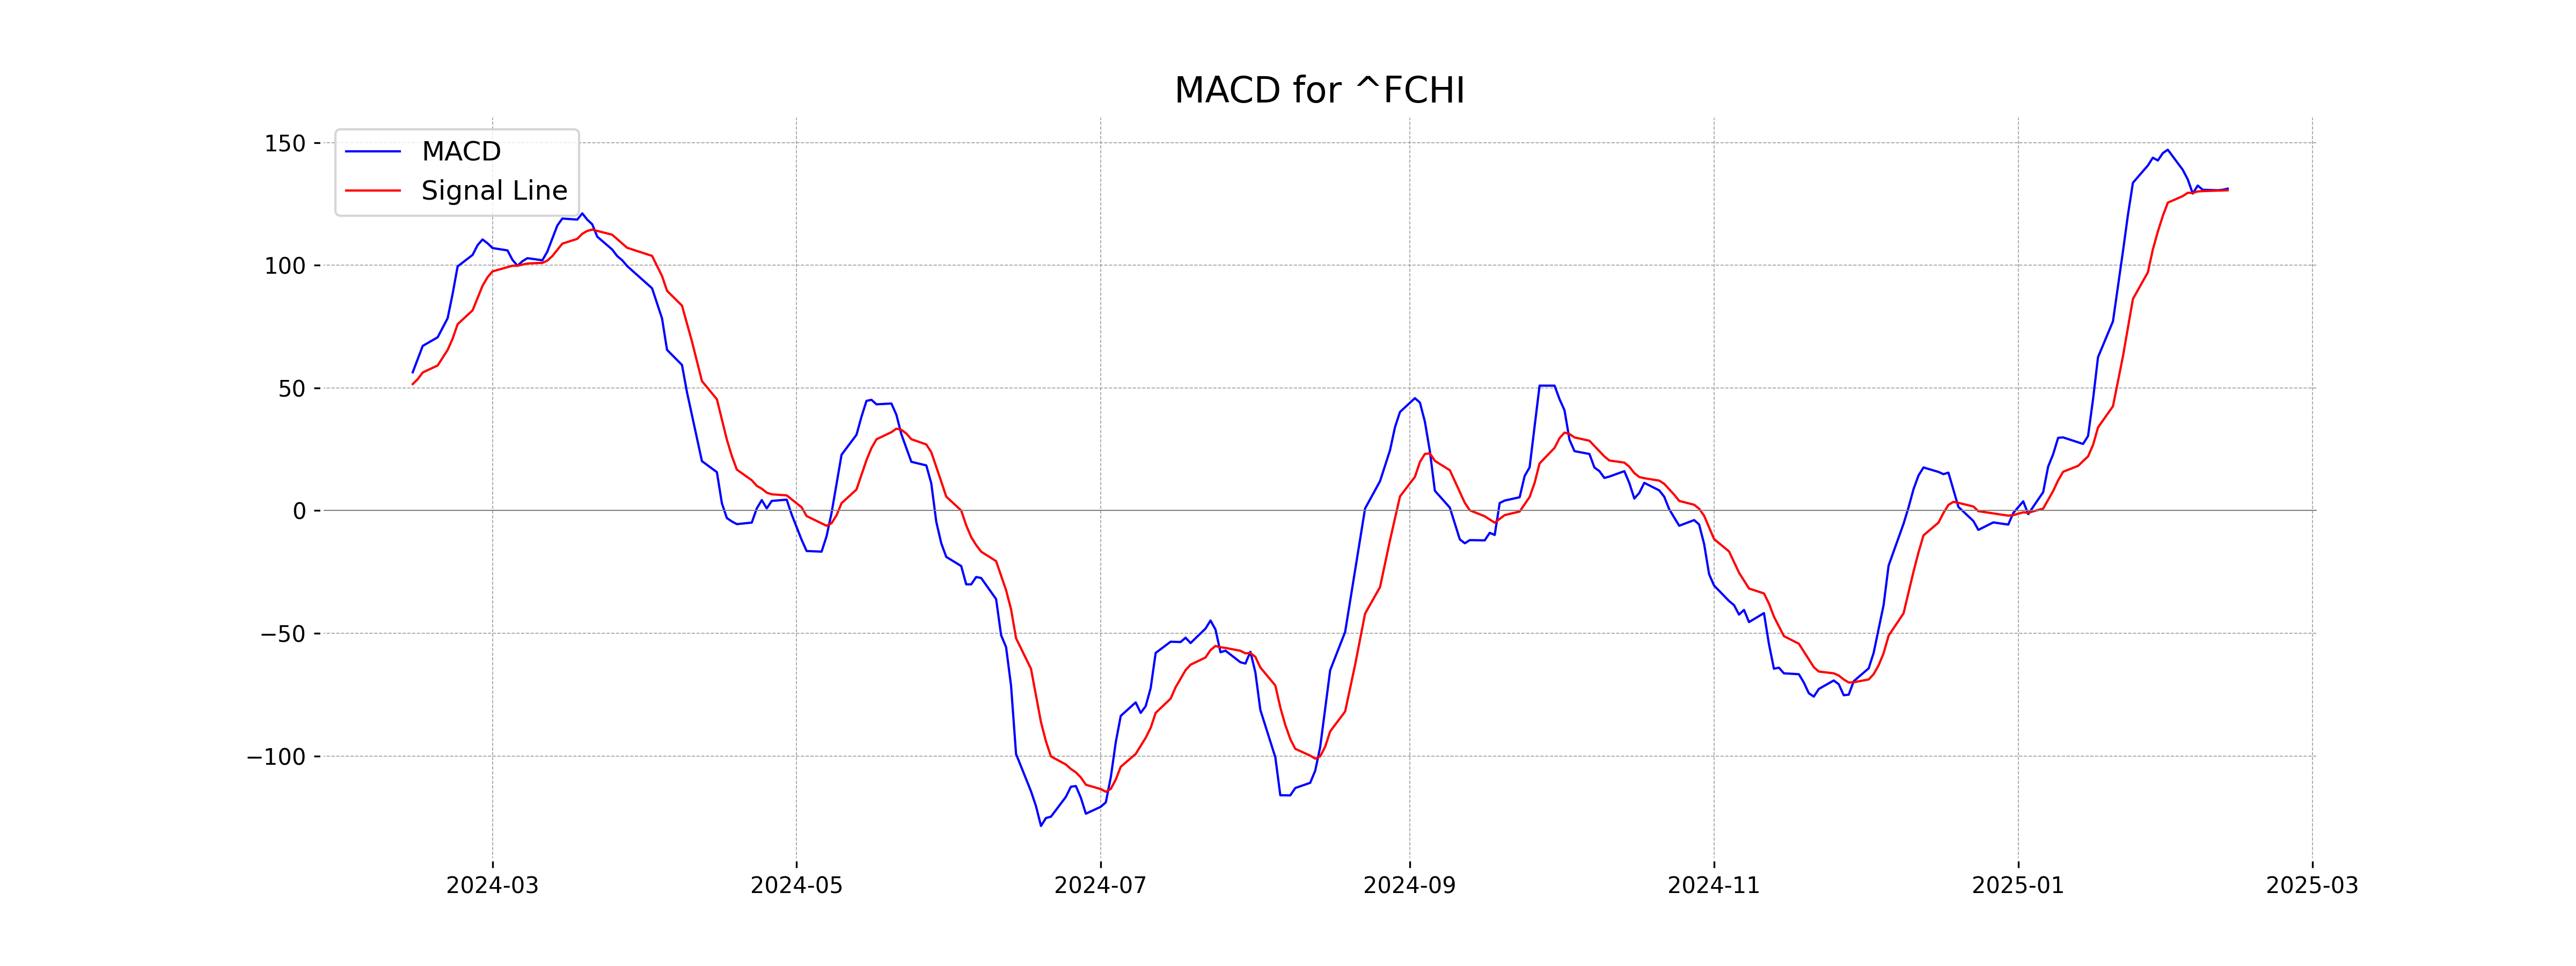
Moving Averages Trend (MACD)
The MACD for CAC 40 (France) is at 131.23, with the MACD Signal line at 130.56, indicating a potential bullish signal as the MACD is above the signal line. This suggests upward momentum in the market.
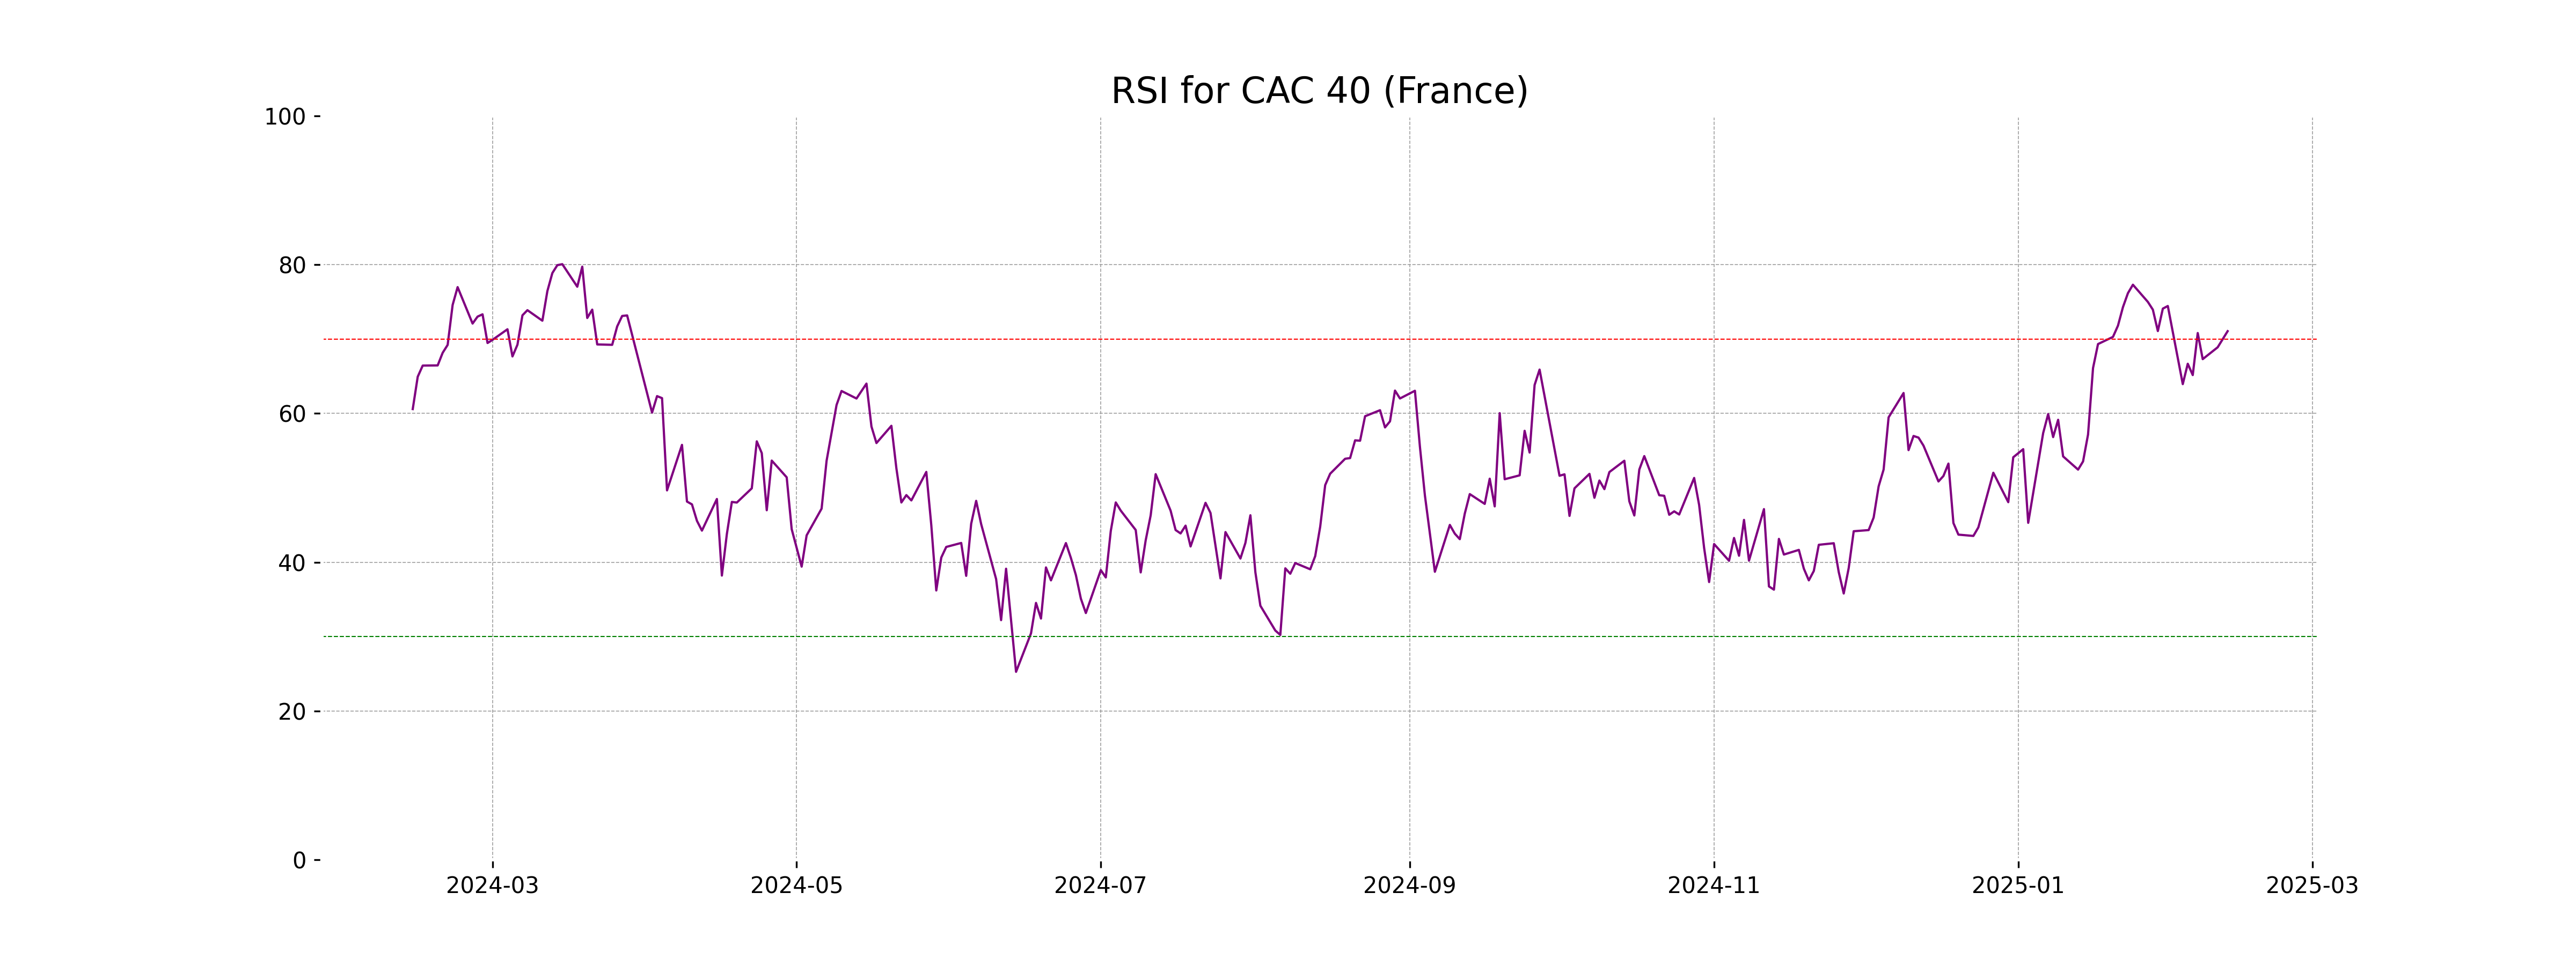
RSI Analysis
The RSI value for CAC 40 (France) is 71.06, indicating that the index is in the overbought territory as it exceeds the typical overbought threshold of 70. This suggests potential for a price pullback or consolidation in the near term.
Analysis for FTSE 100 (UK) - February 12, 2025
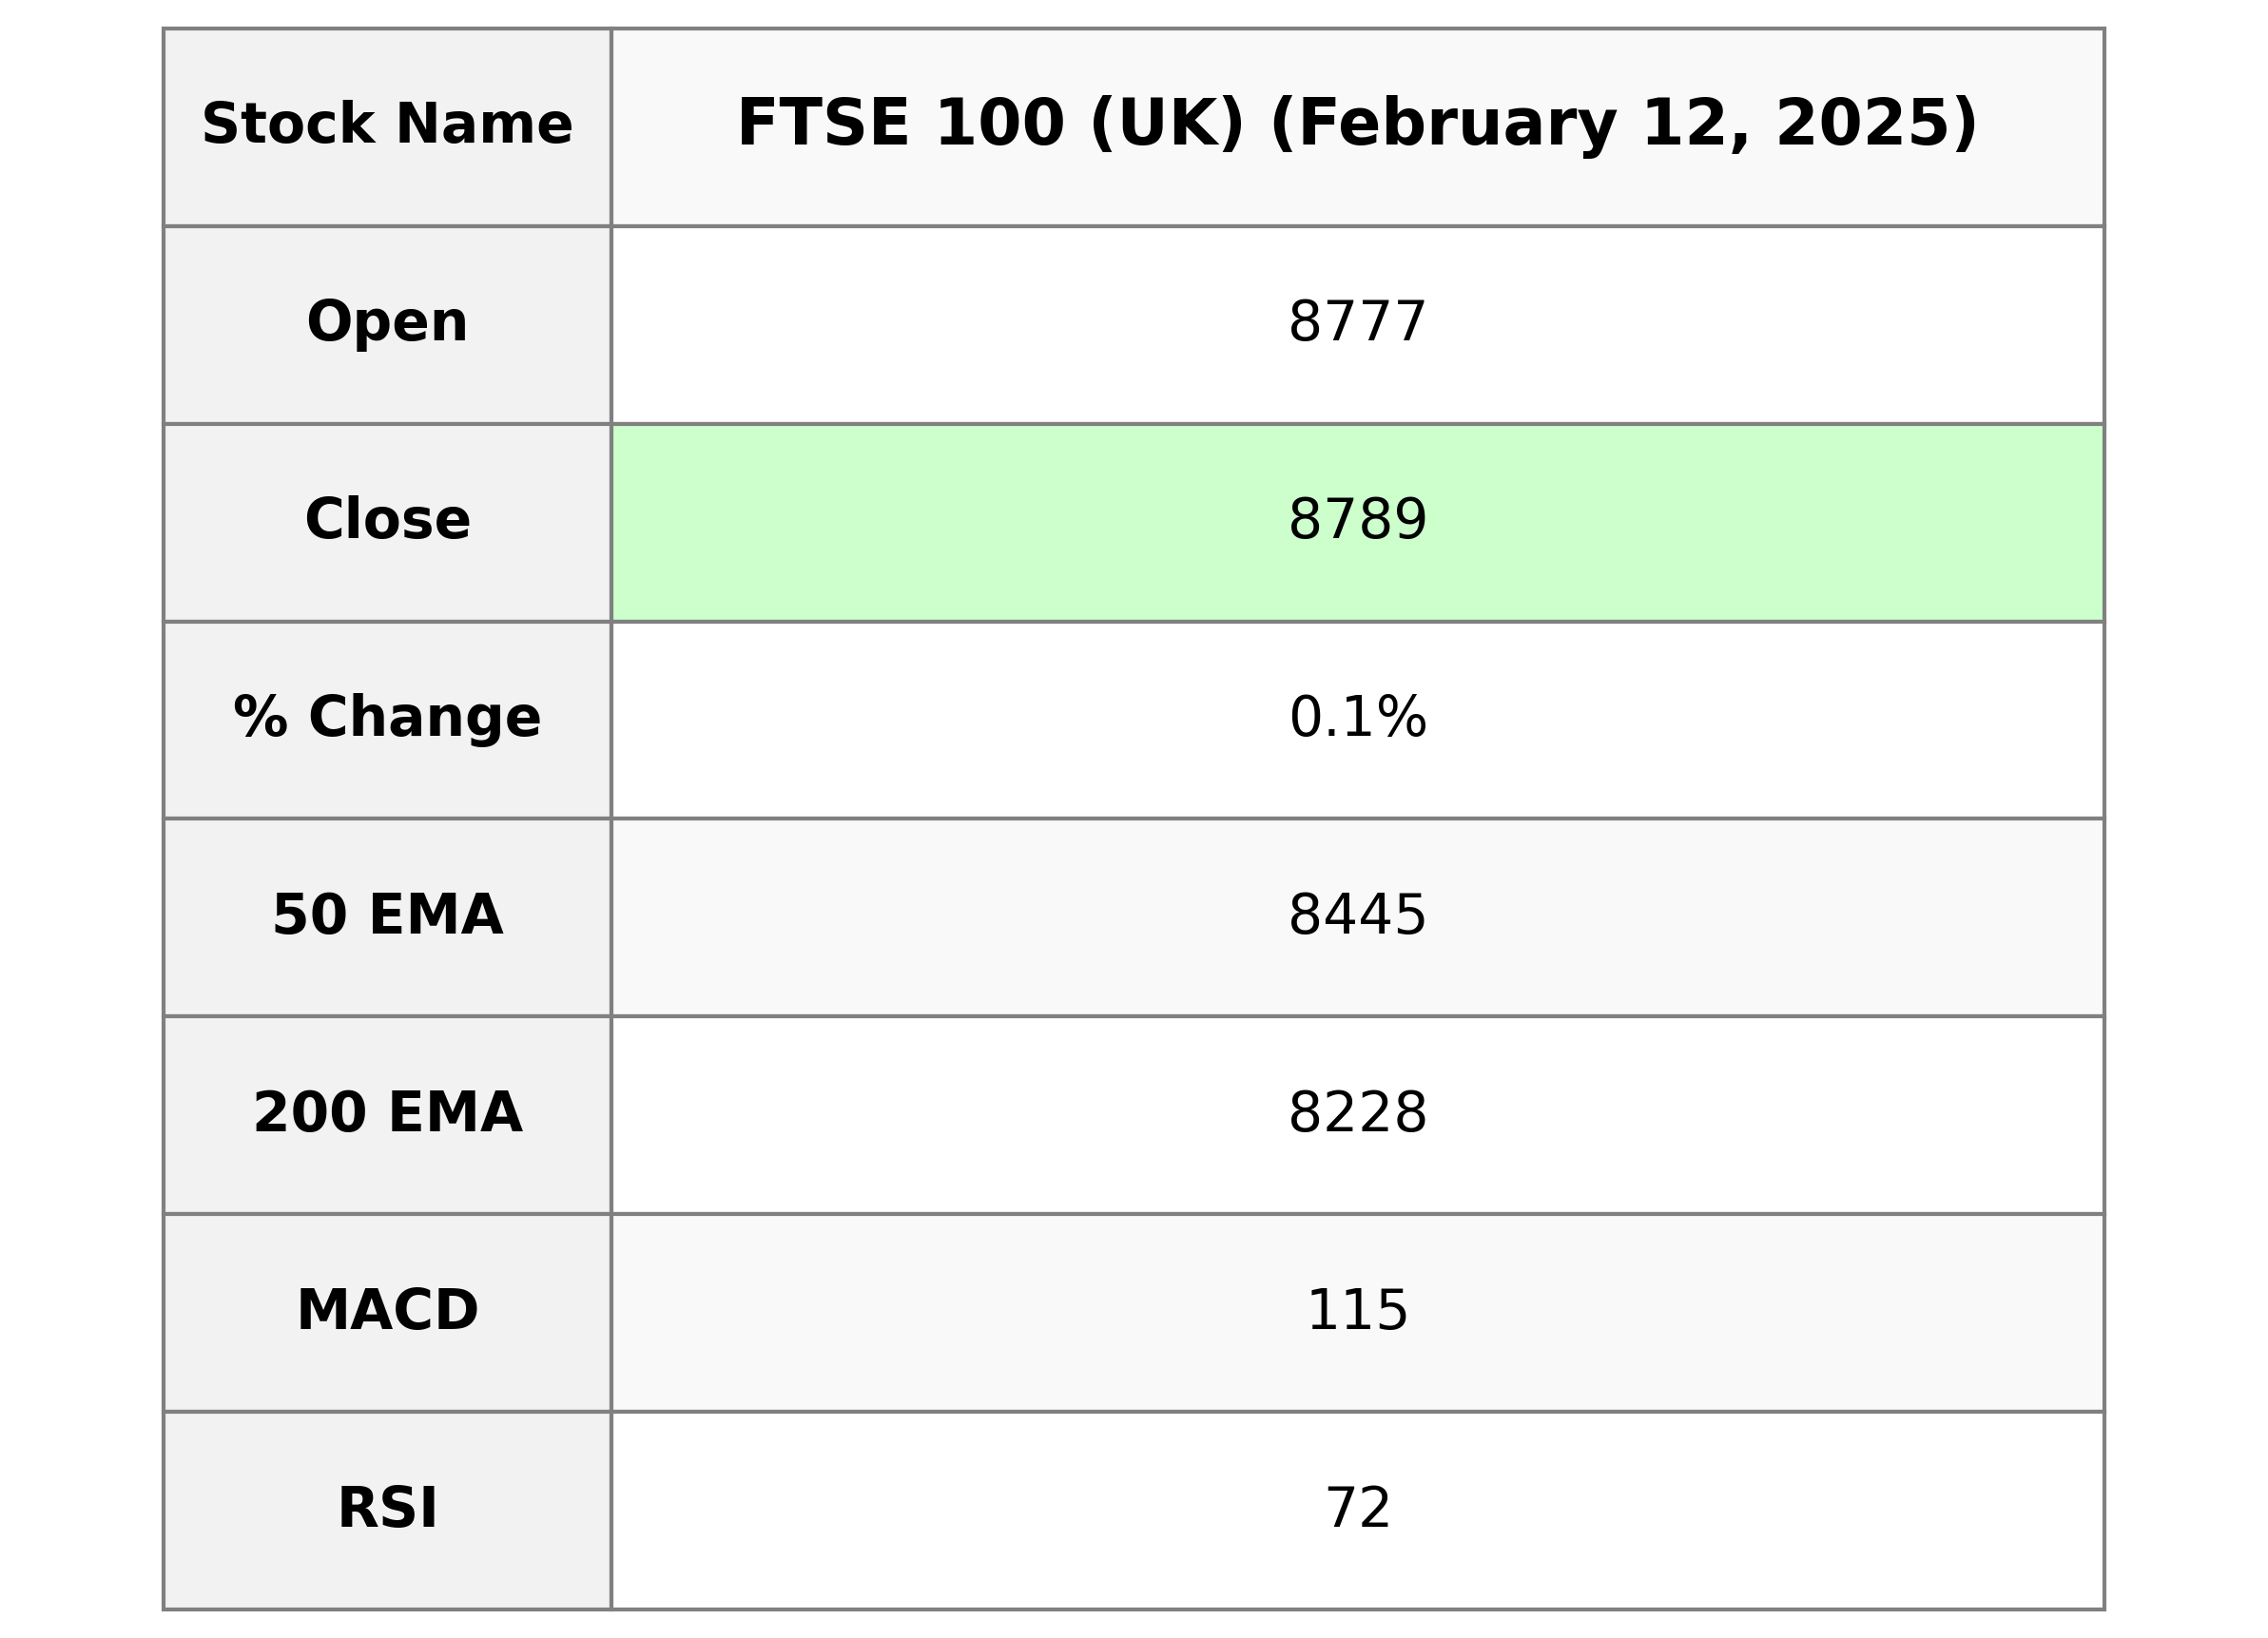
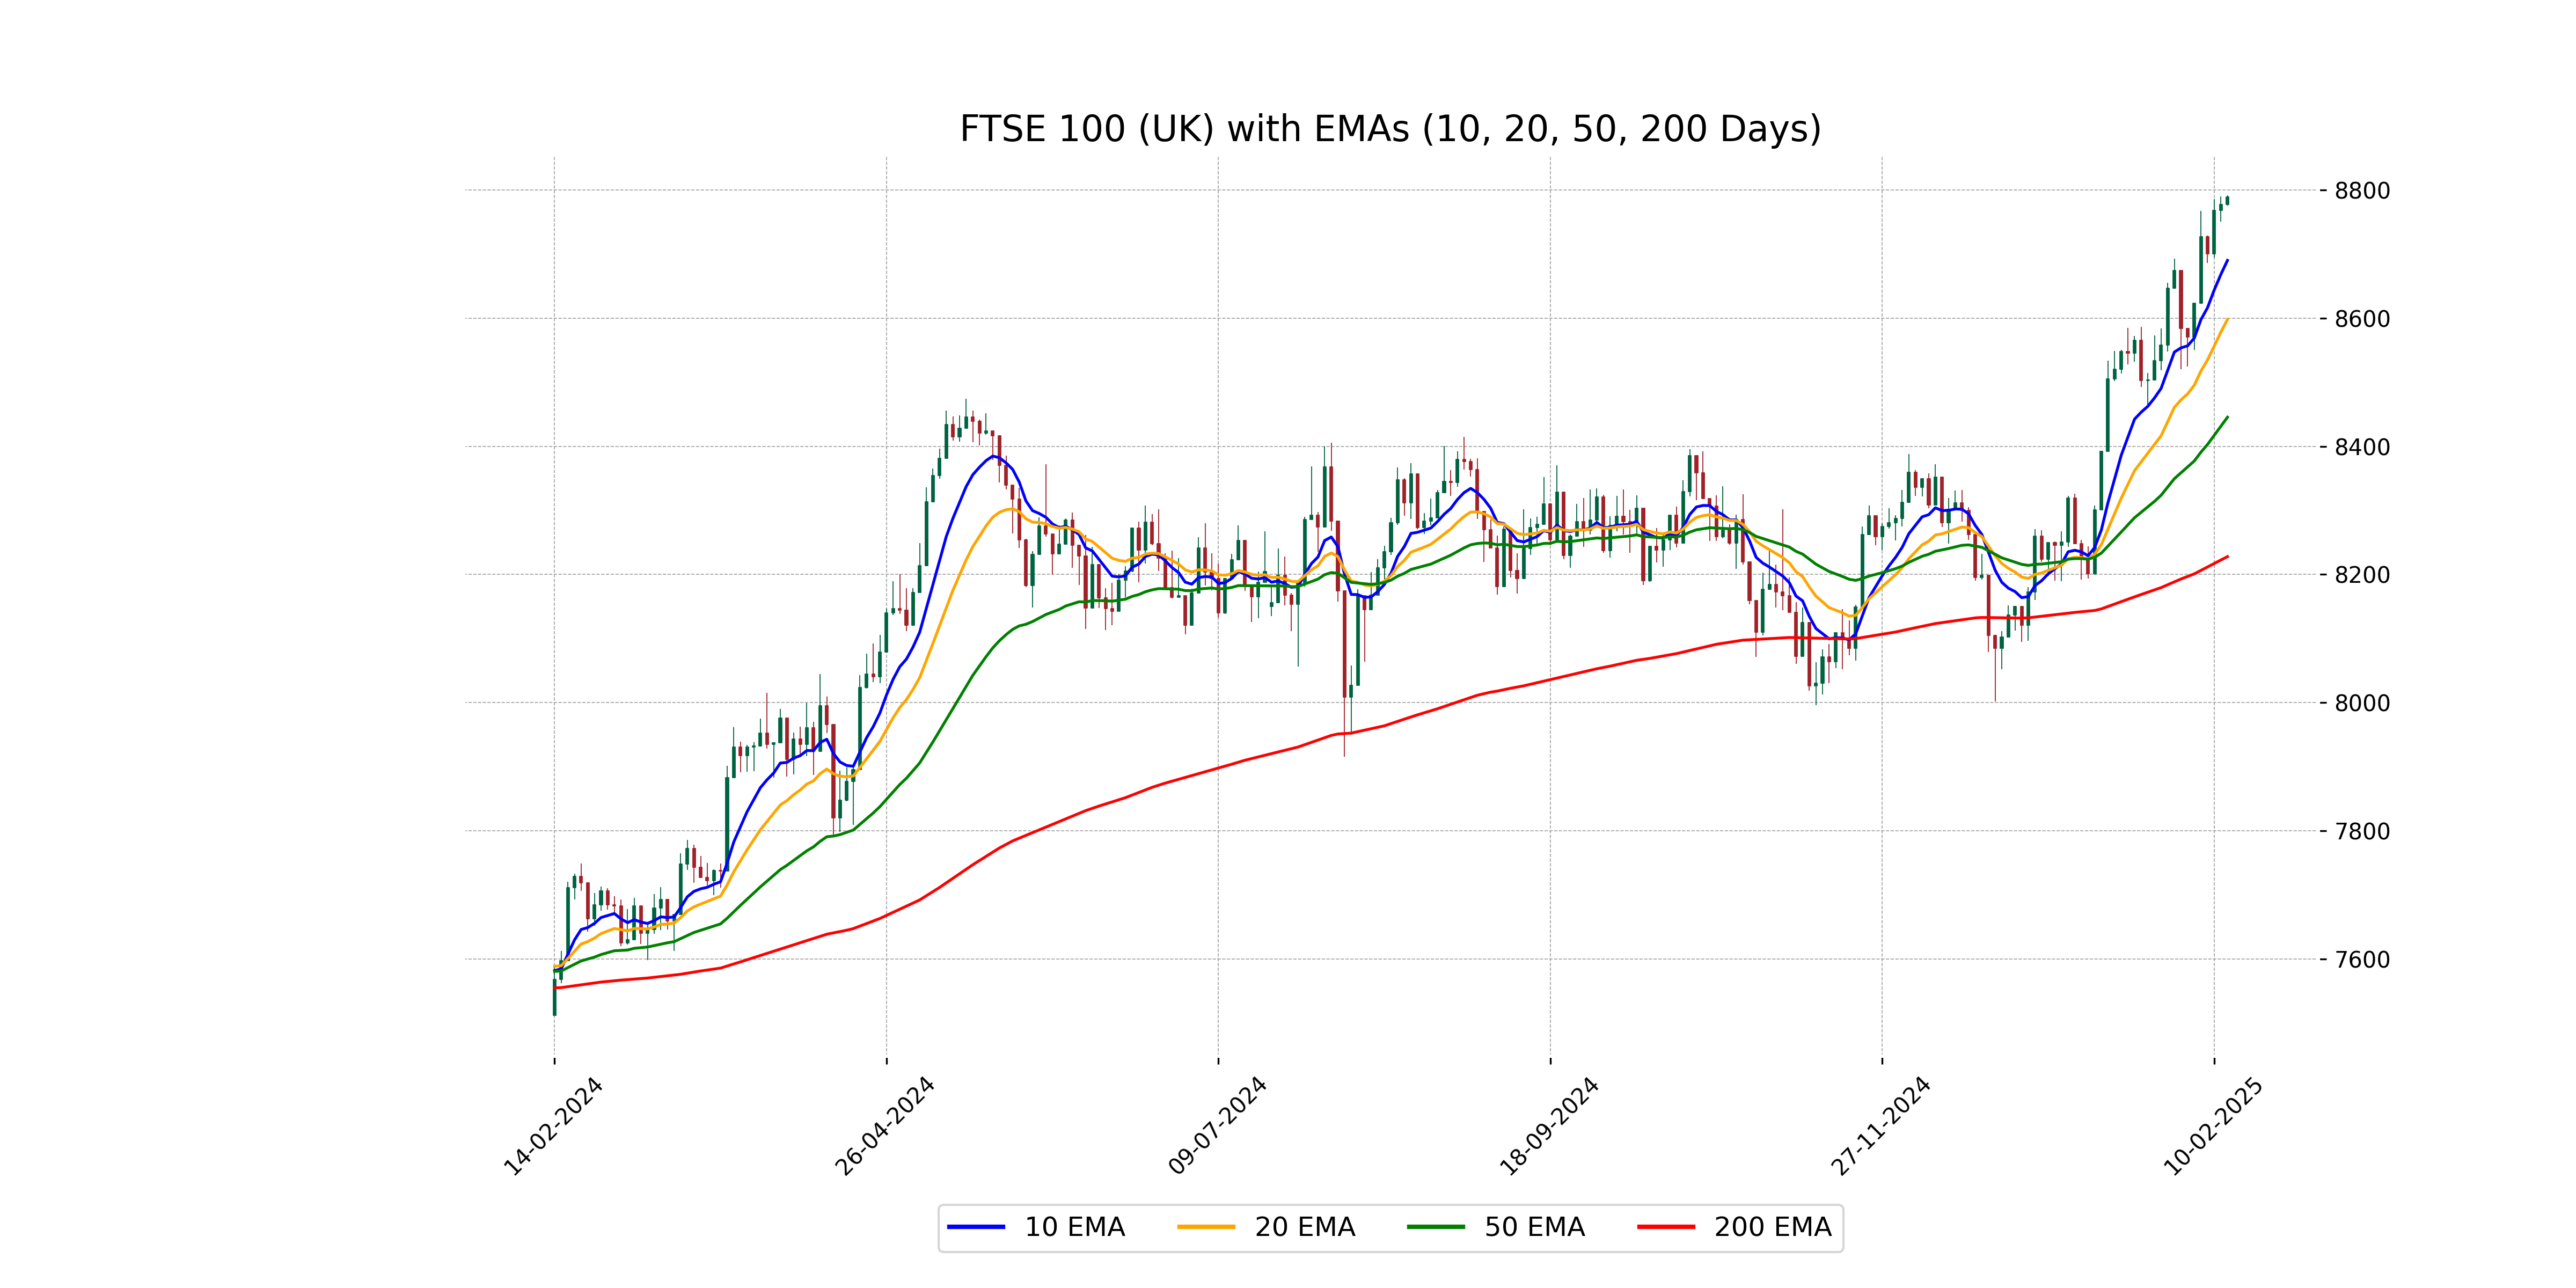
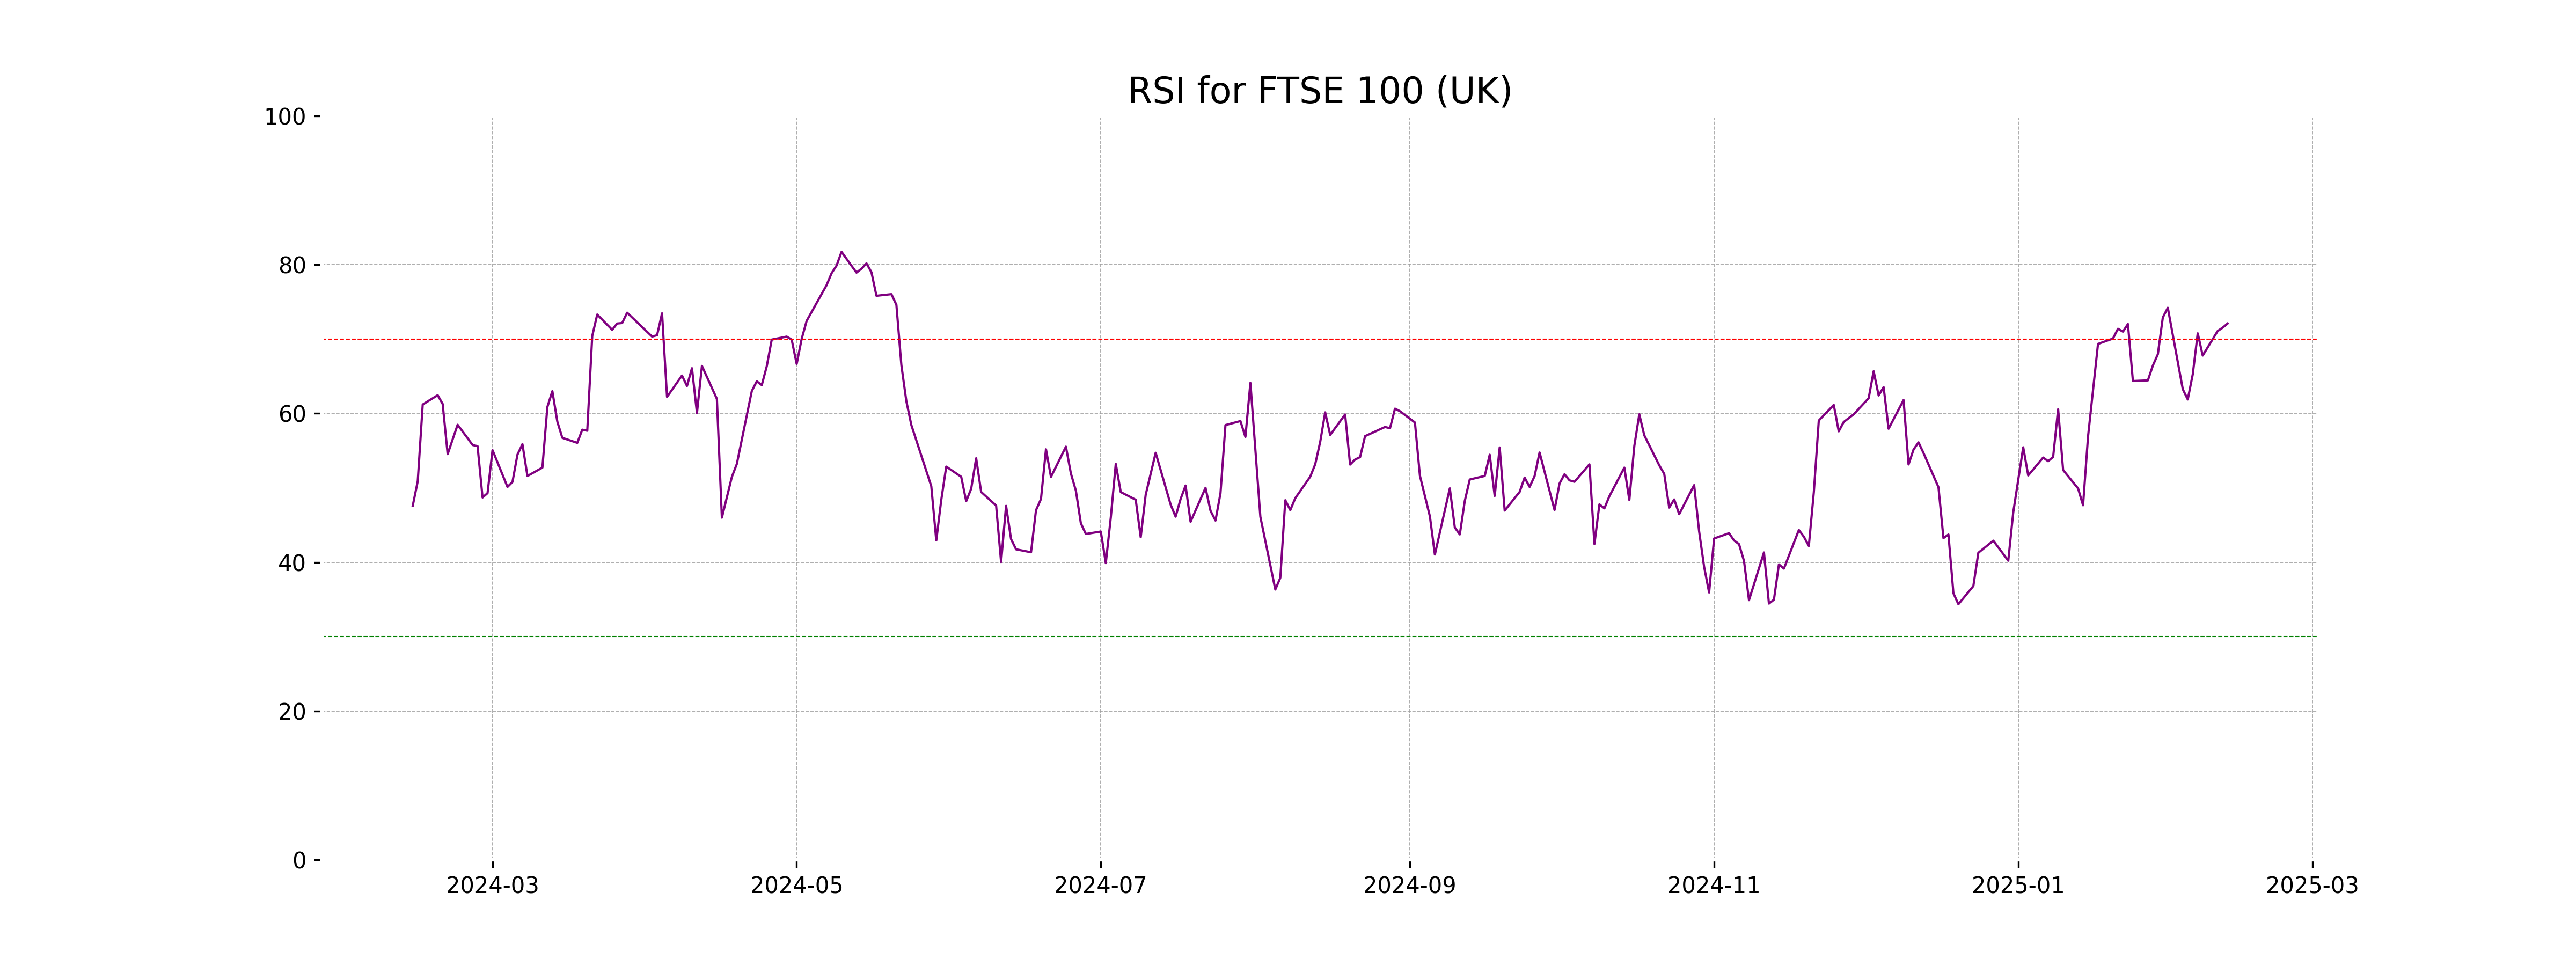
The FTSE 100 Index opened at 8777.39, reaching a high of 8791.34 and closing at 8789.05, reflecting a percentage change of 0.13% with a points increase of 11.65. The 50-day EMA stands at 8445.42, while the 10-day EMA is at 8690.17, indicating a bullish trend supported by an RSI of 72.10.
Relationship with Key Moving Averages
FTSE 100 is trading above its 50-day, 200-day, 10-day, and 20-day exponential moving averages (EMAs), indicating a strong upward trend. The 50-day EMA is at 8445.42, the 200-day EMA at 8227.92, while the close price is at 8789.05, suggesting bullish momentum.
Moving Averages Trend (MACD)
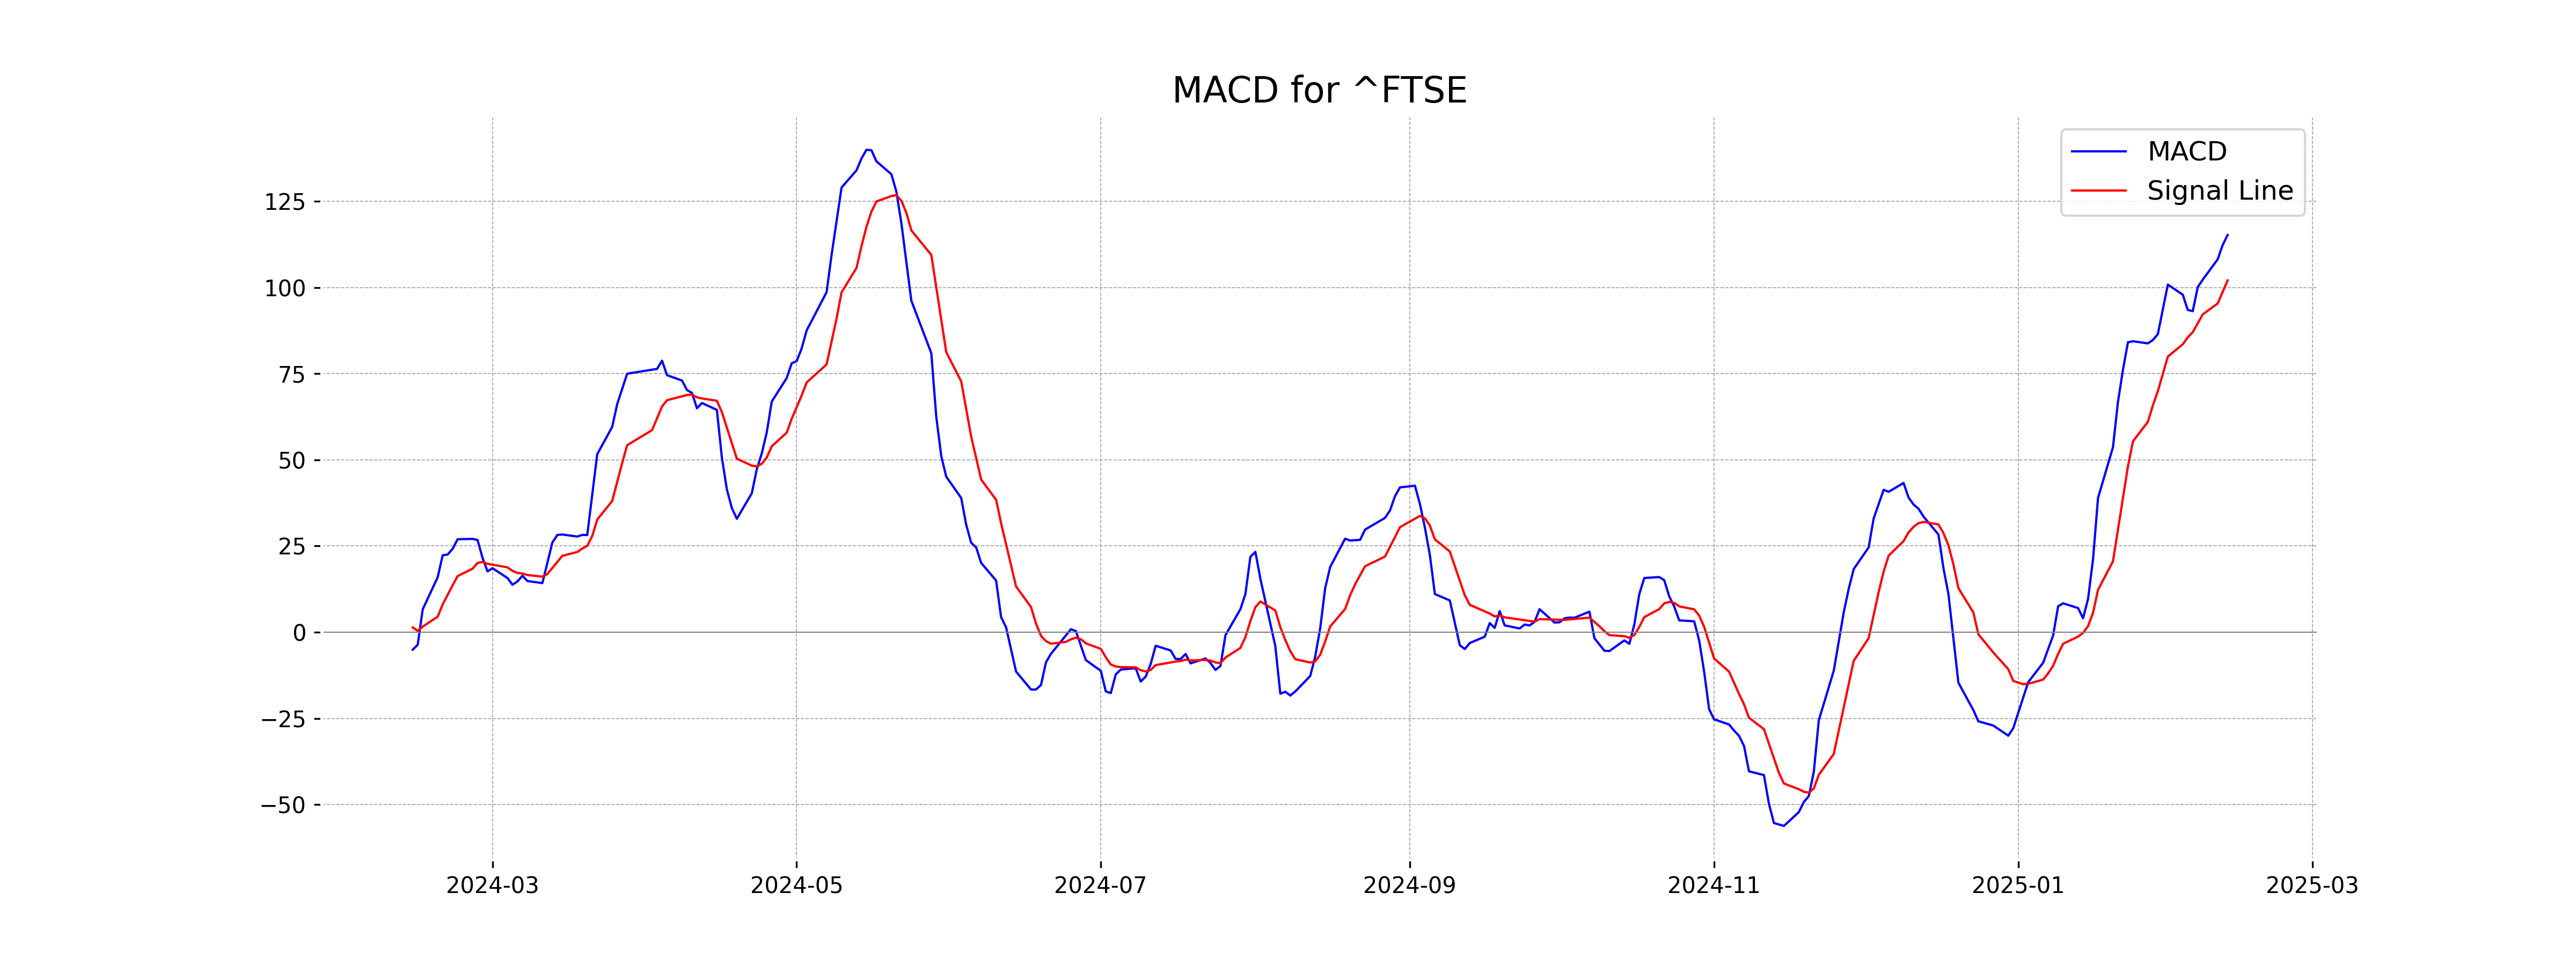
The MACD for FTSE 100 is 115.26, which is above the MACD Signal of 102.08, indicating a bullish signal. This suggests that the FTSE 100 may experience upward momentum in the short term.
RSI Analysis
The RSI for FTSE 100 currently stands at 72.10, indicating that the index is in overbought territory. This suggests that the index might be due for a price correction or consolidation soon.
Analysis for DAX (Germany) - February 12, 2025
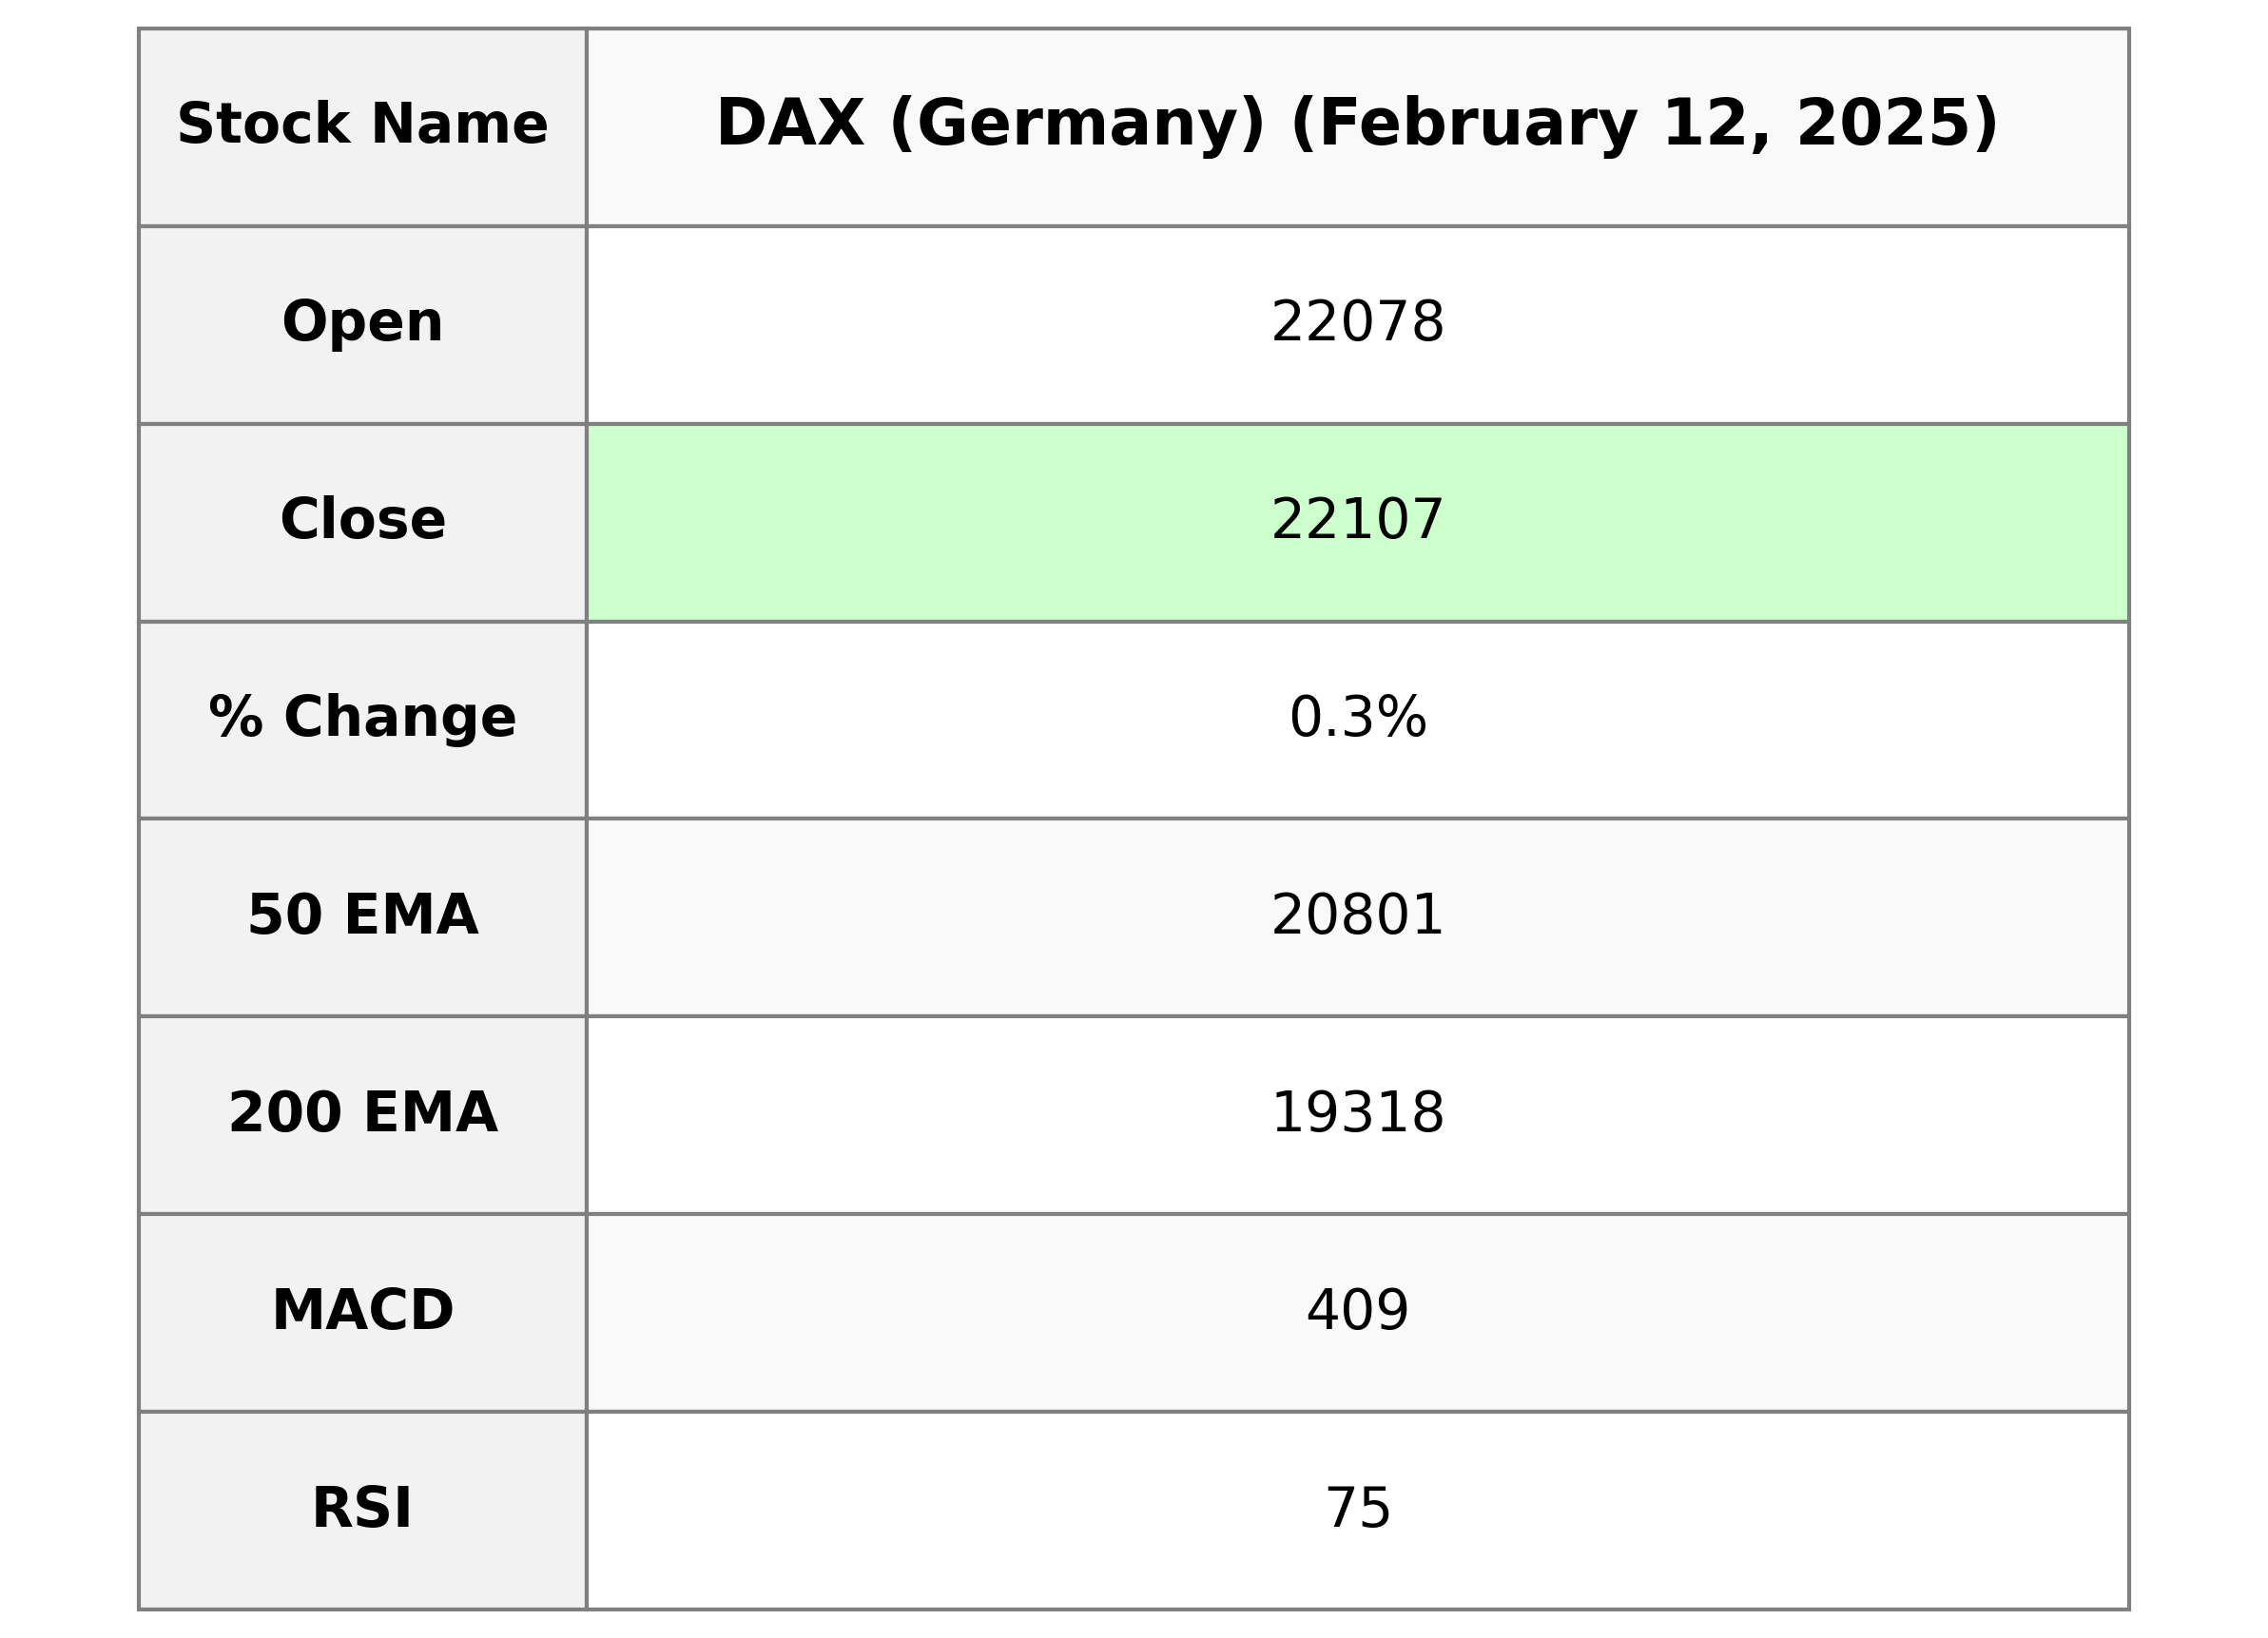
The DAX (Germany) opened at 22,077.82 and closed at 22,106.68, marking a positive points change of 68.85 with a percentage increase of 0.31% from its previous close. The Relative Strength Index (RSI) stands at 74.70, indicating a strong upward momentum. Notably, the MACD value is above its signal line, supporting a bullish trend.
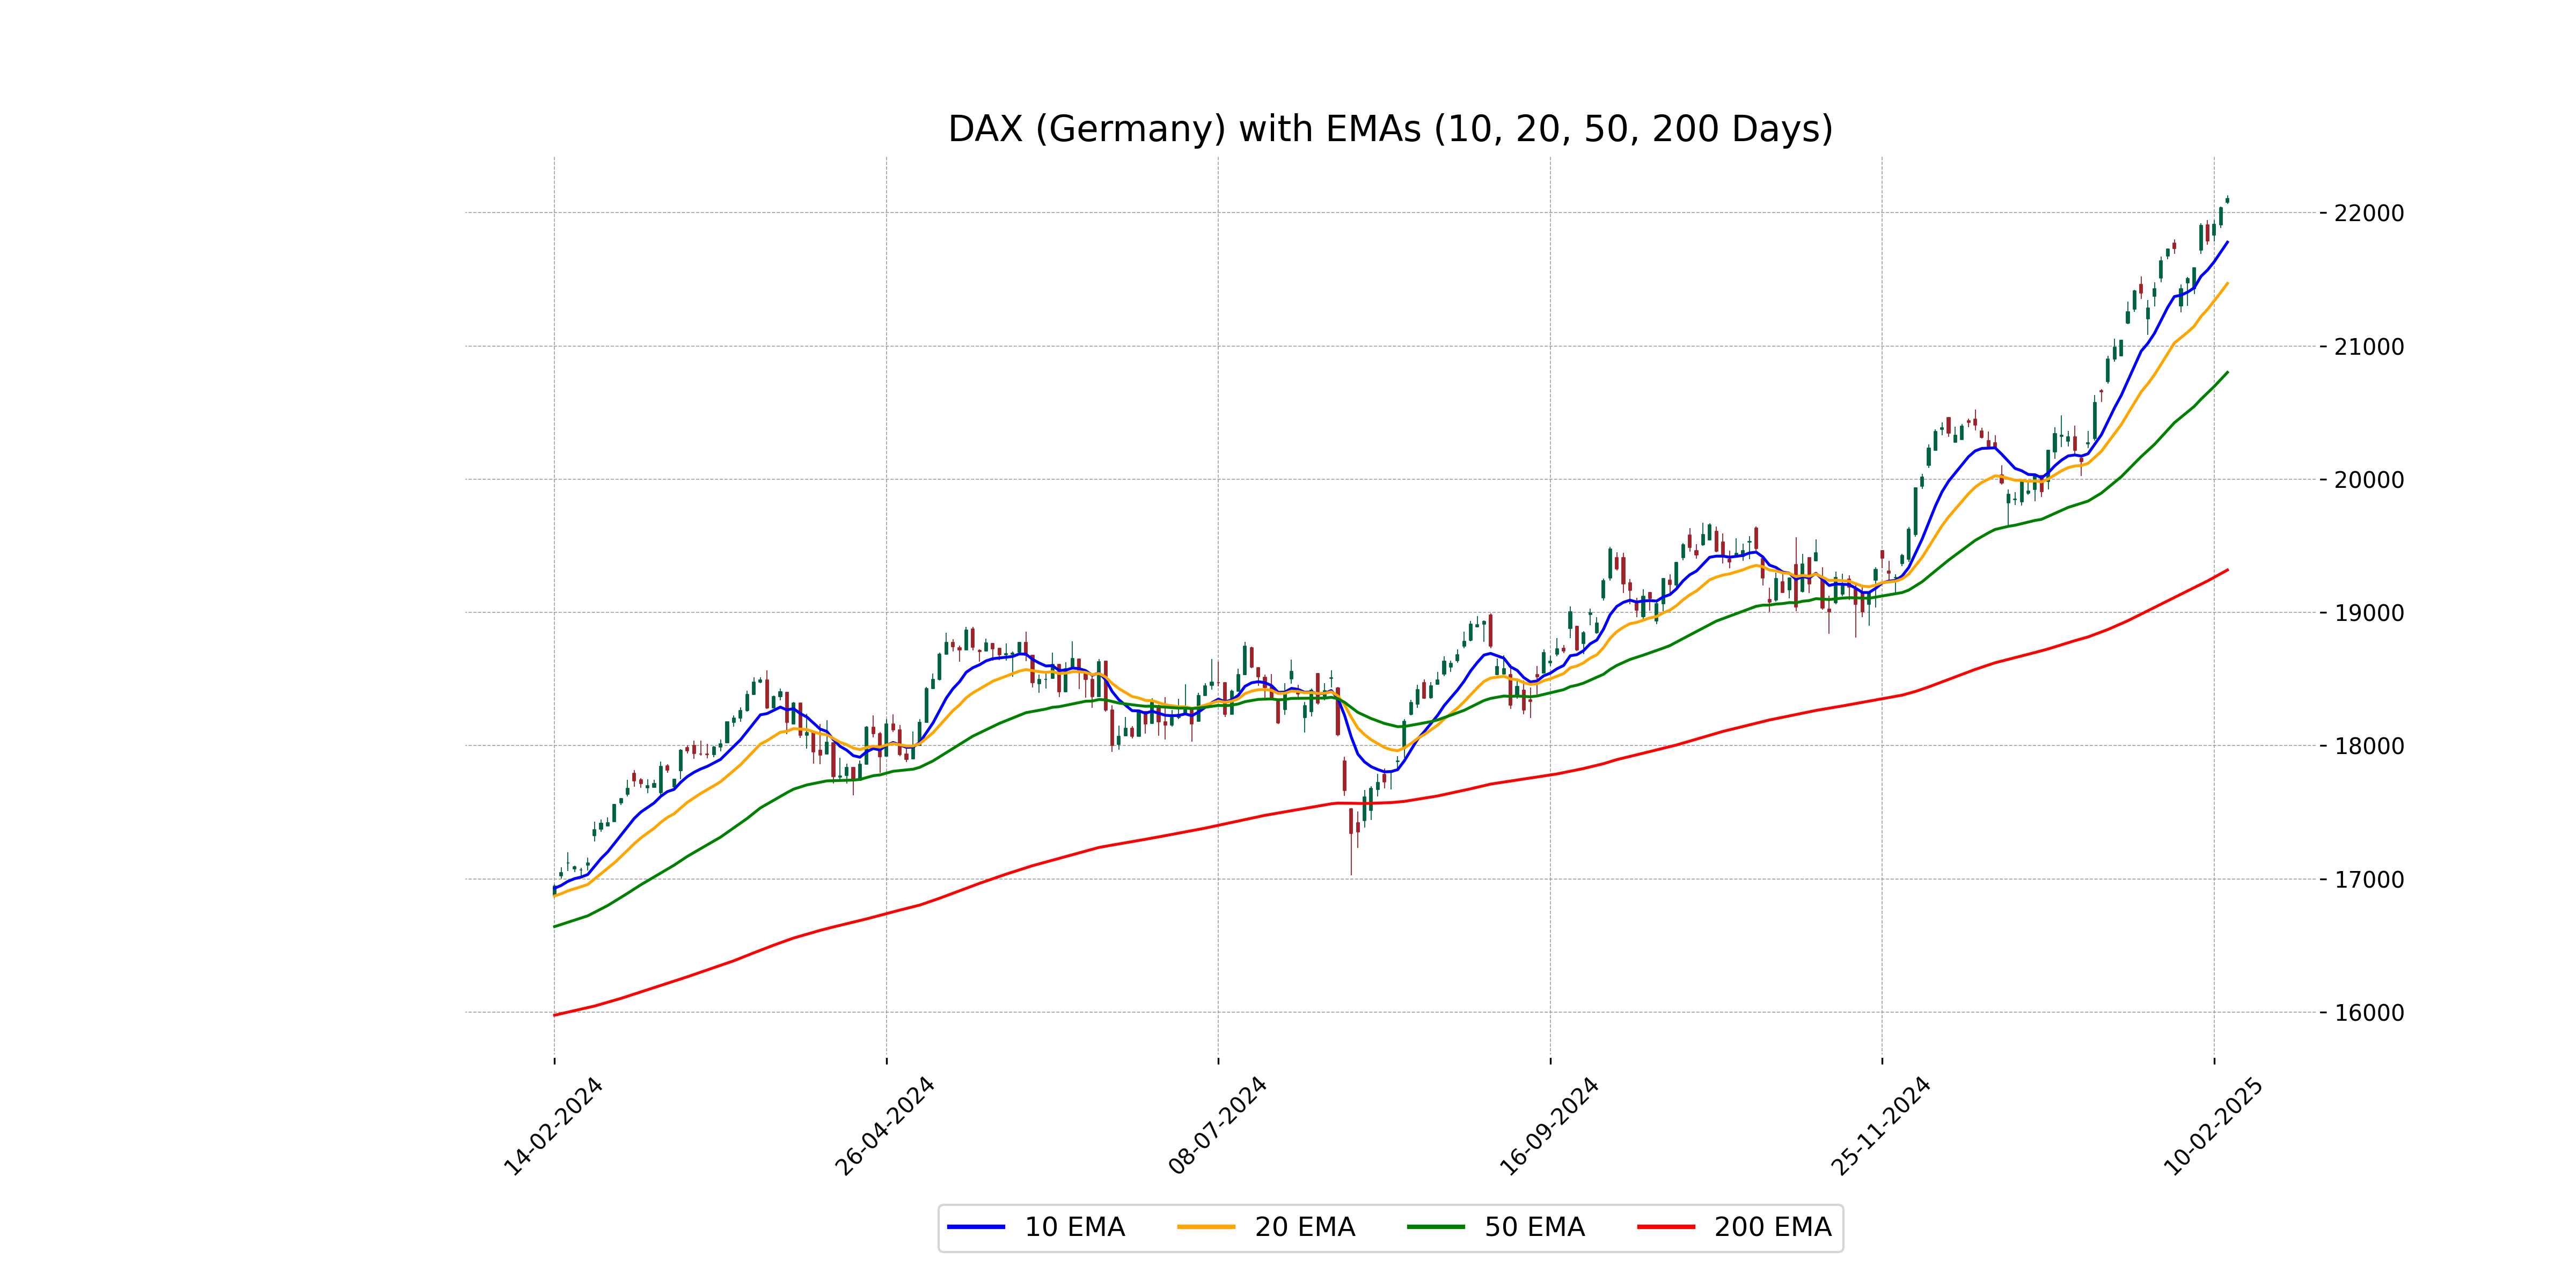
Relationship with Key Moving Averages
DAX (Germany) is trading above its 50-day and 200-day EMAs with current levels significantly higher, indicating a bullish trend. The close value also exceeds the 10-day and 20-day EMAs, reinforcing upward momentum.
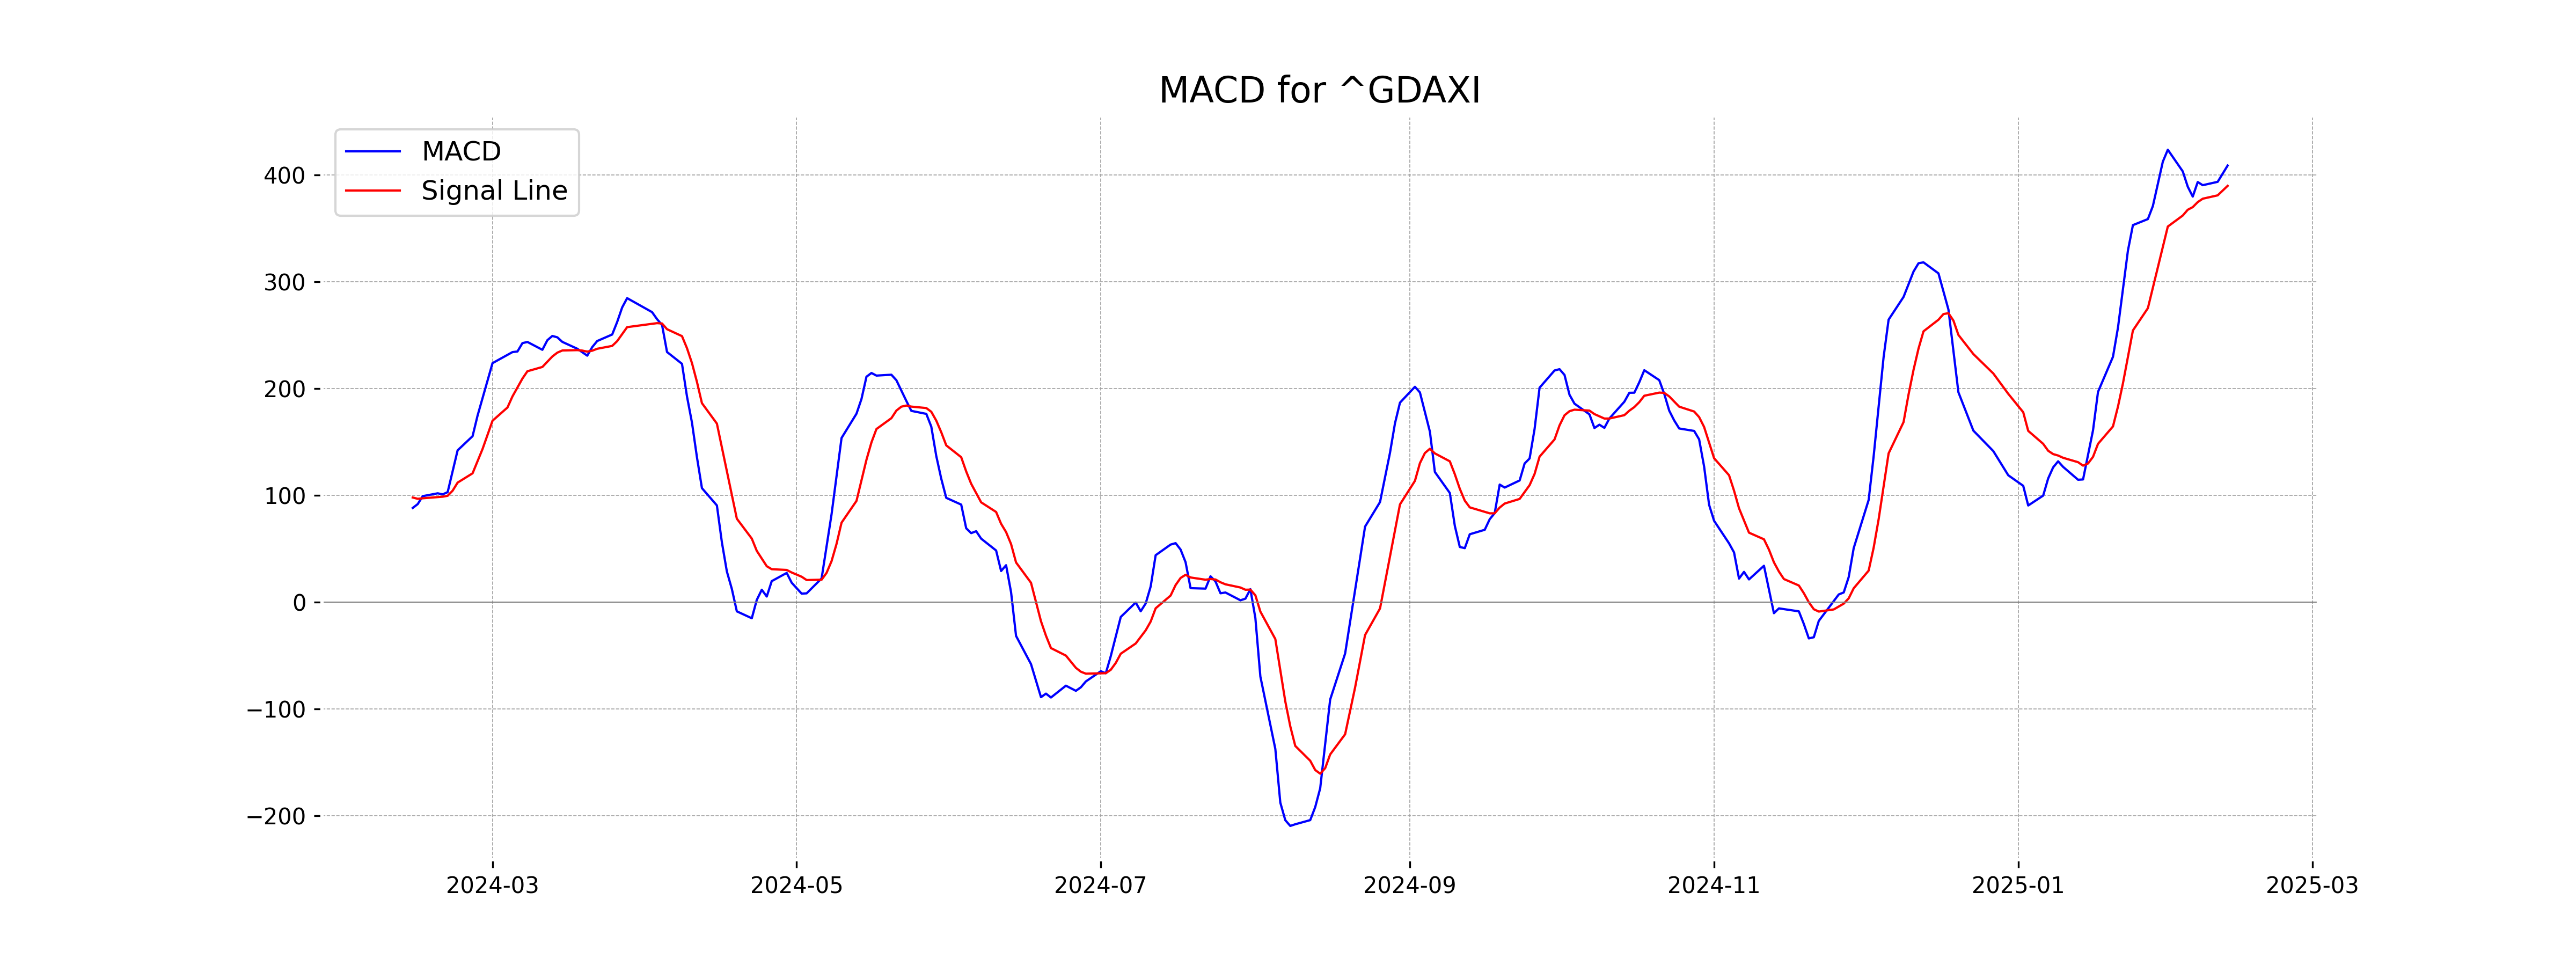
Moving Averages Trend (MACD)
The MACD for DAX, with a value of 408.99, is above the MACD Signal line at 389.97, indicating a bullish trend. This suggests potential upward momentum, as the MACD is positive and above the signal line, which is often a buy signal in technical analysis.
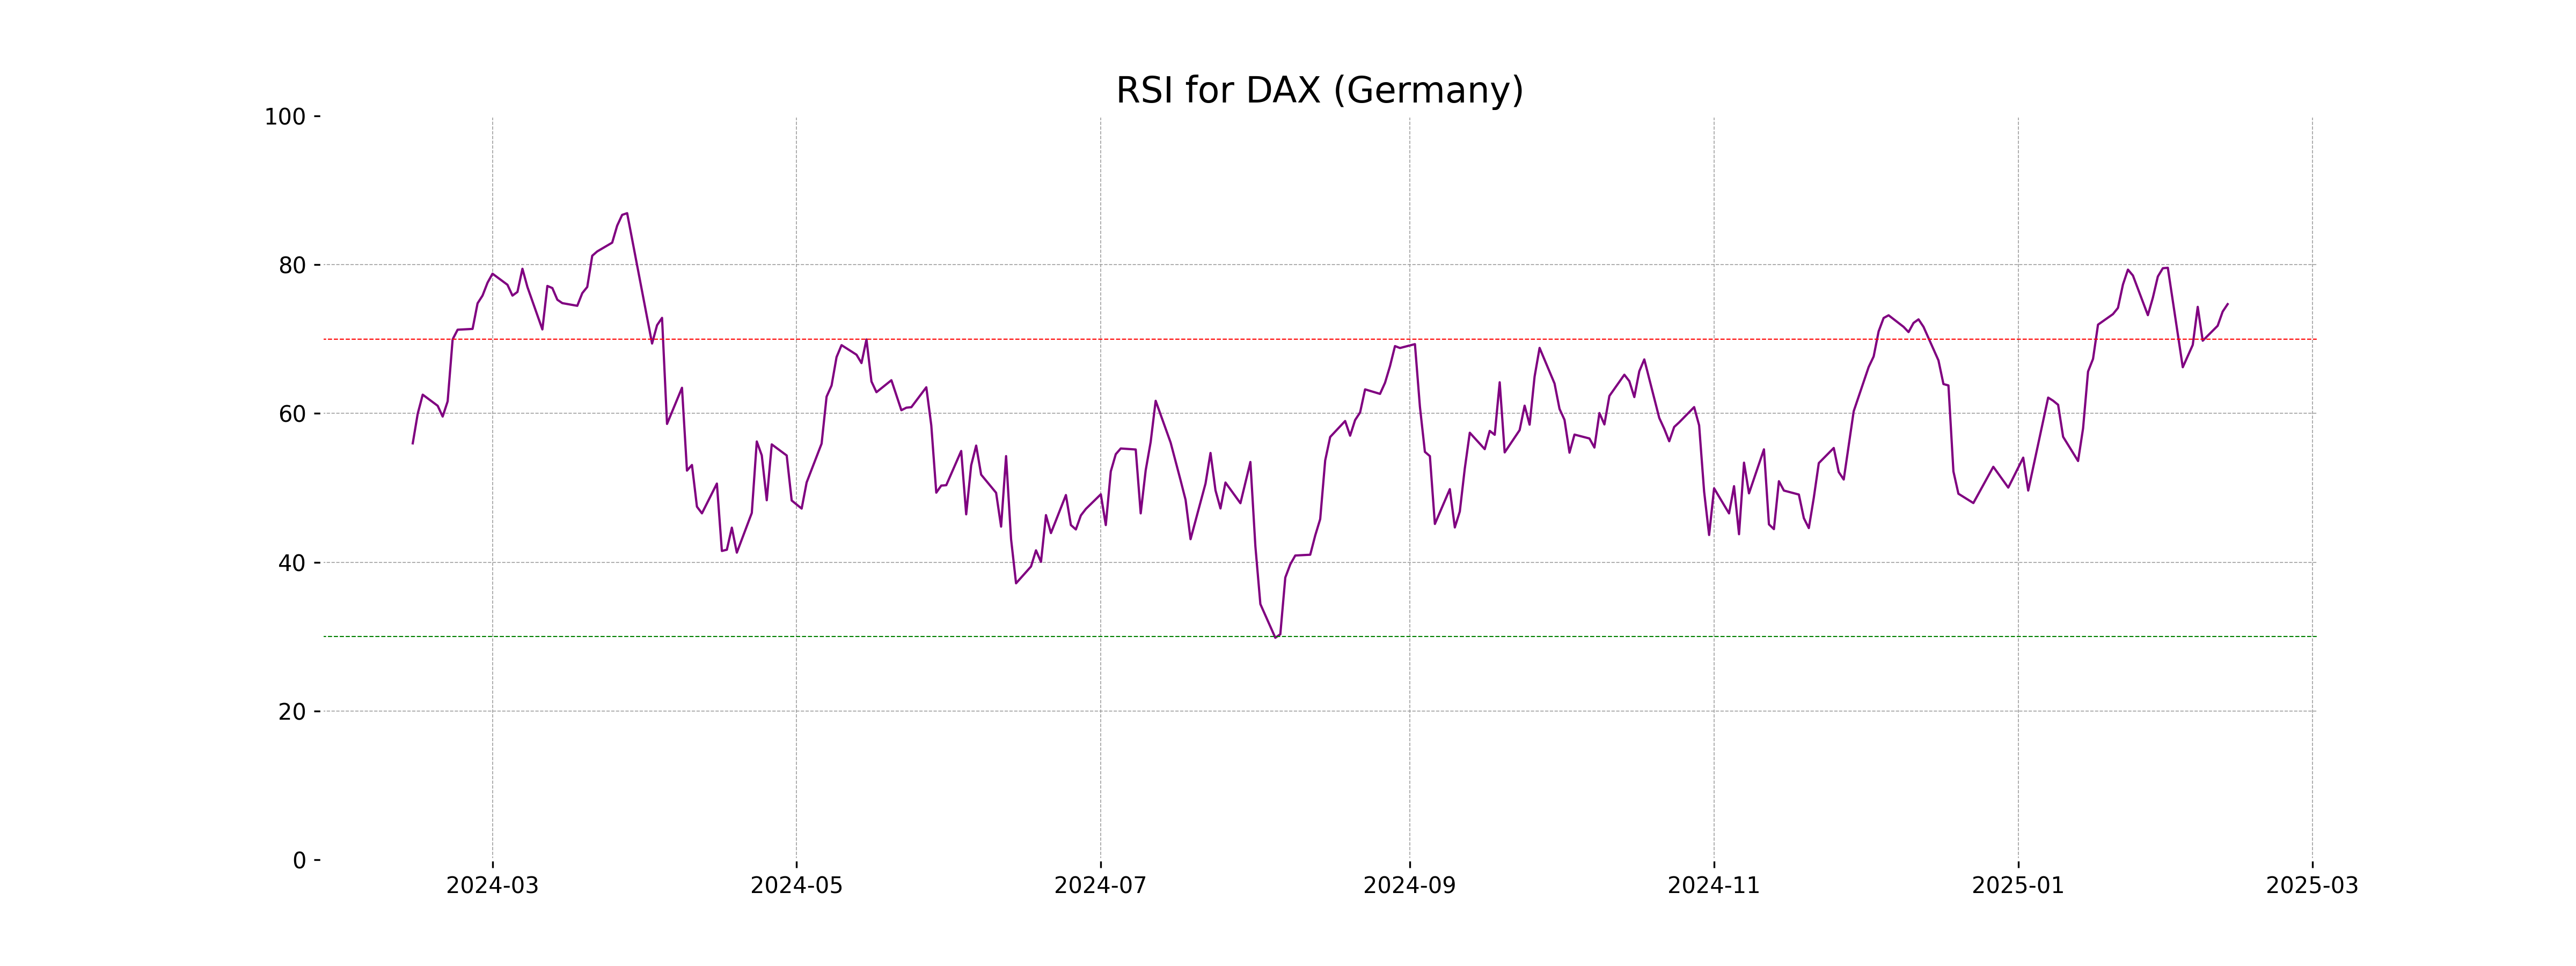
RSI Analysis
The RSI value of 74.70 indicates that the DAX (Germany) is currently in the overbought territory, suggesting possible price consolidation or a potential corrective pullback in the near term. A value above 70 typically signals that the security is overvalued and might be due for a trend reversal or pullback.
Analysis for S&P 500 (US) - February 12, 2025
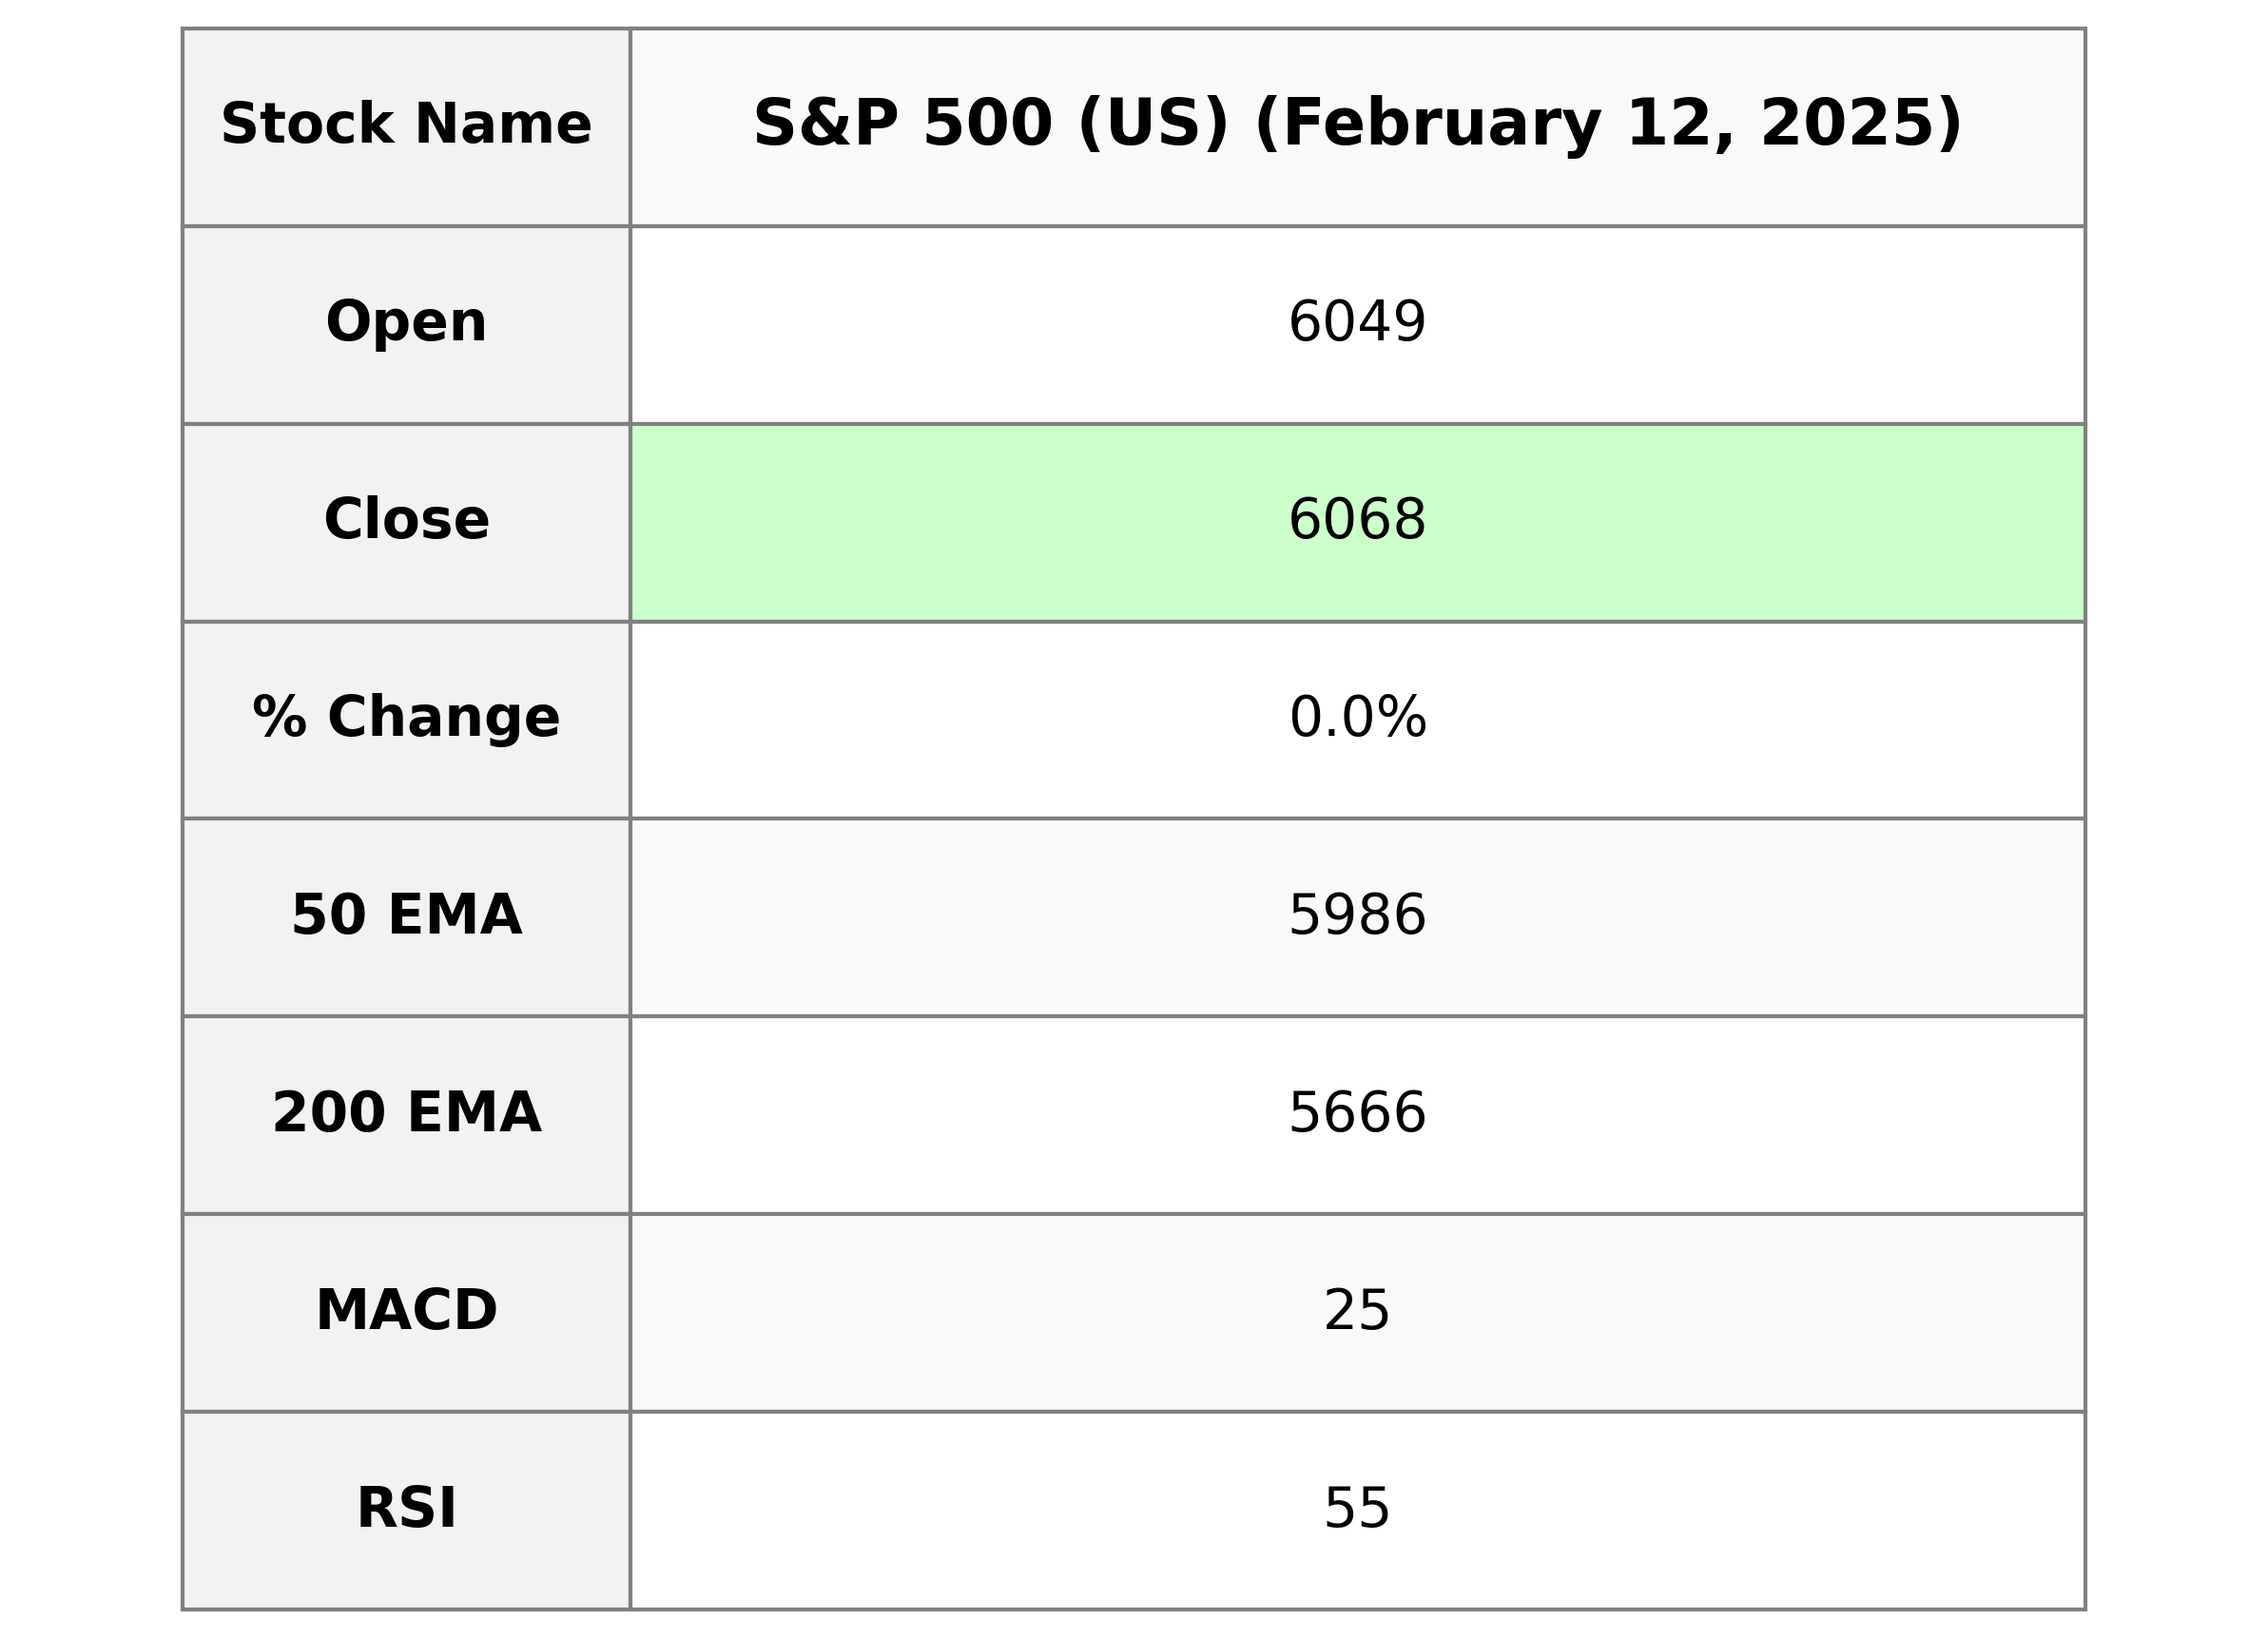
The S&P 500 index opened at 6049.32 and closed slightly higher at 6068.5, marking a percentage change of 0.03% and a points increase of 2.06. Trading volume was robust at 4.32 billion. The index shows an RSI of 54.91, suggesting a neutral market stance, with the MACD indicating a positive momentum slightly above its signal line.
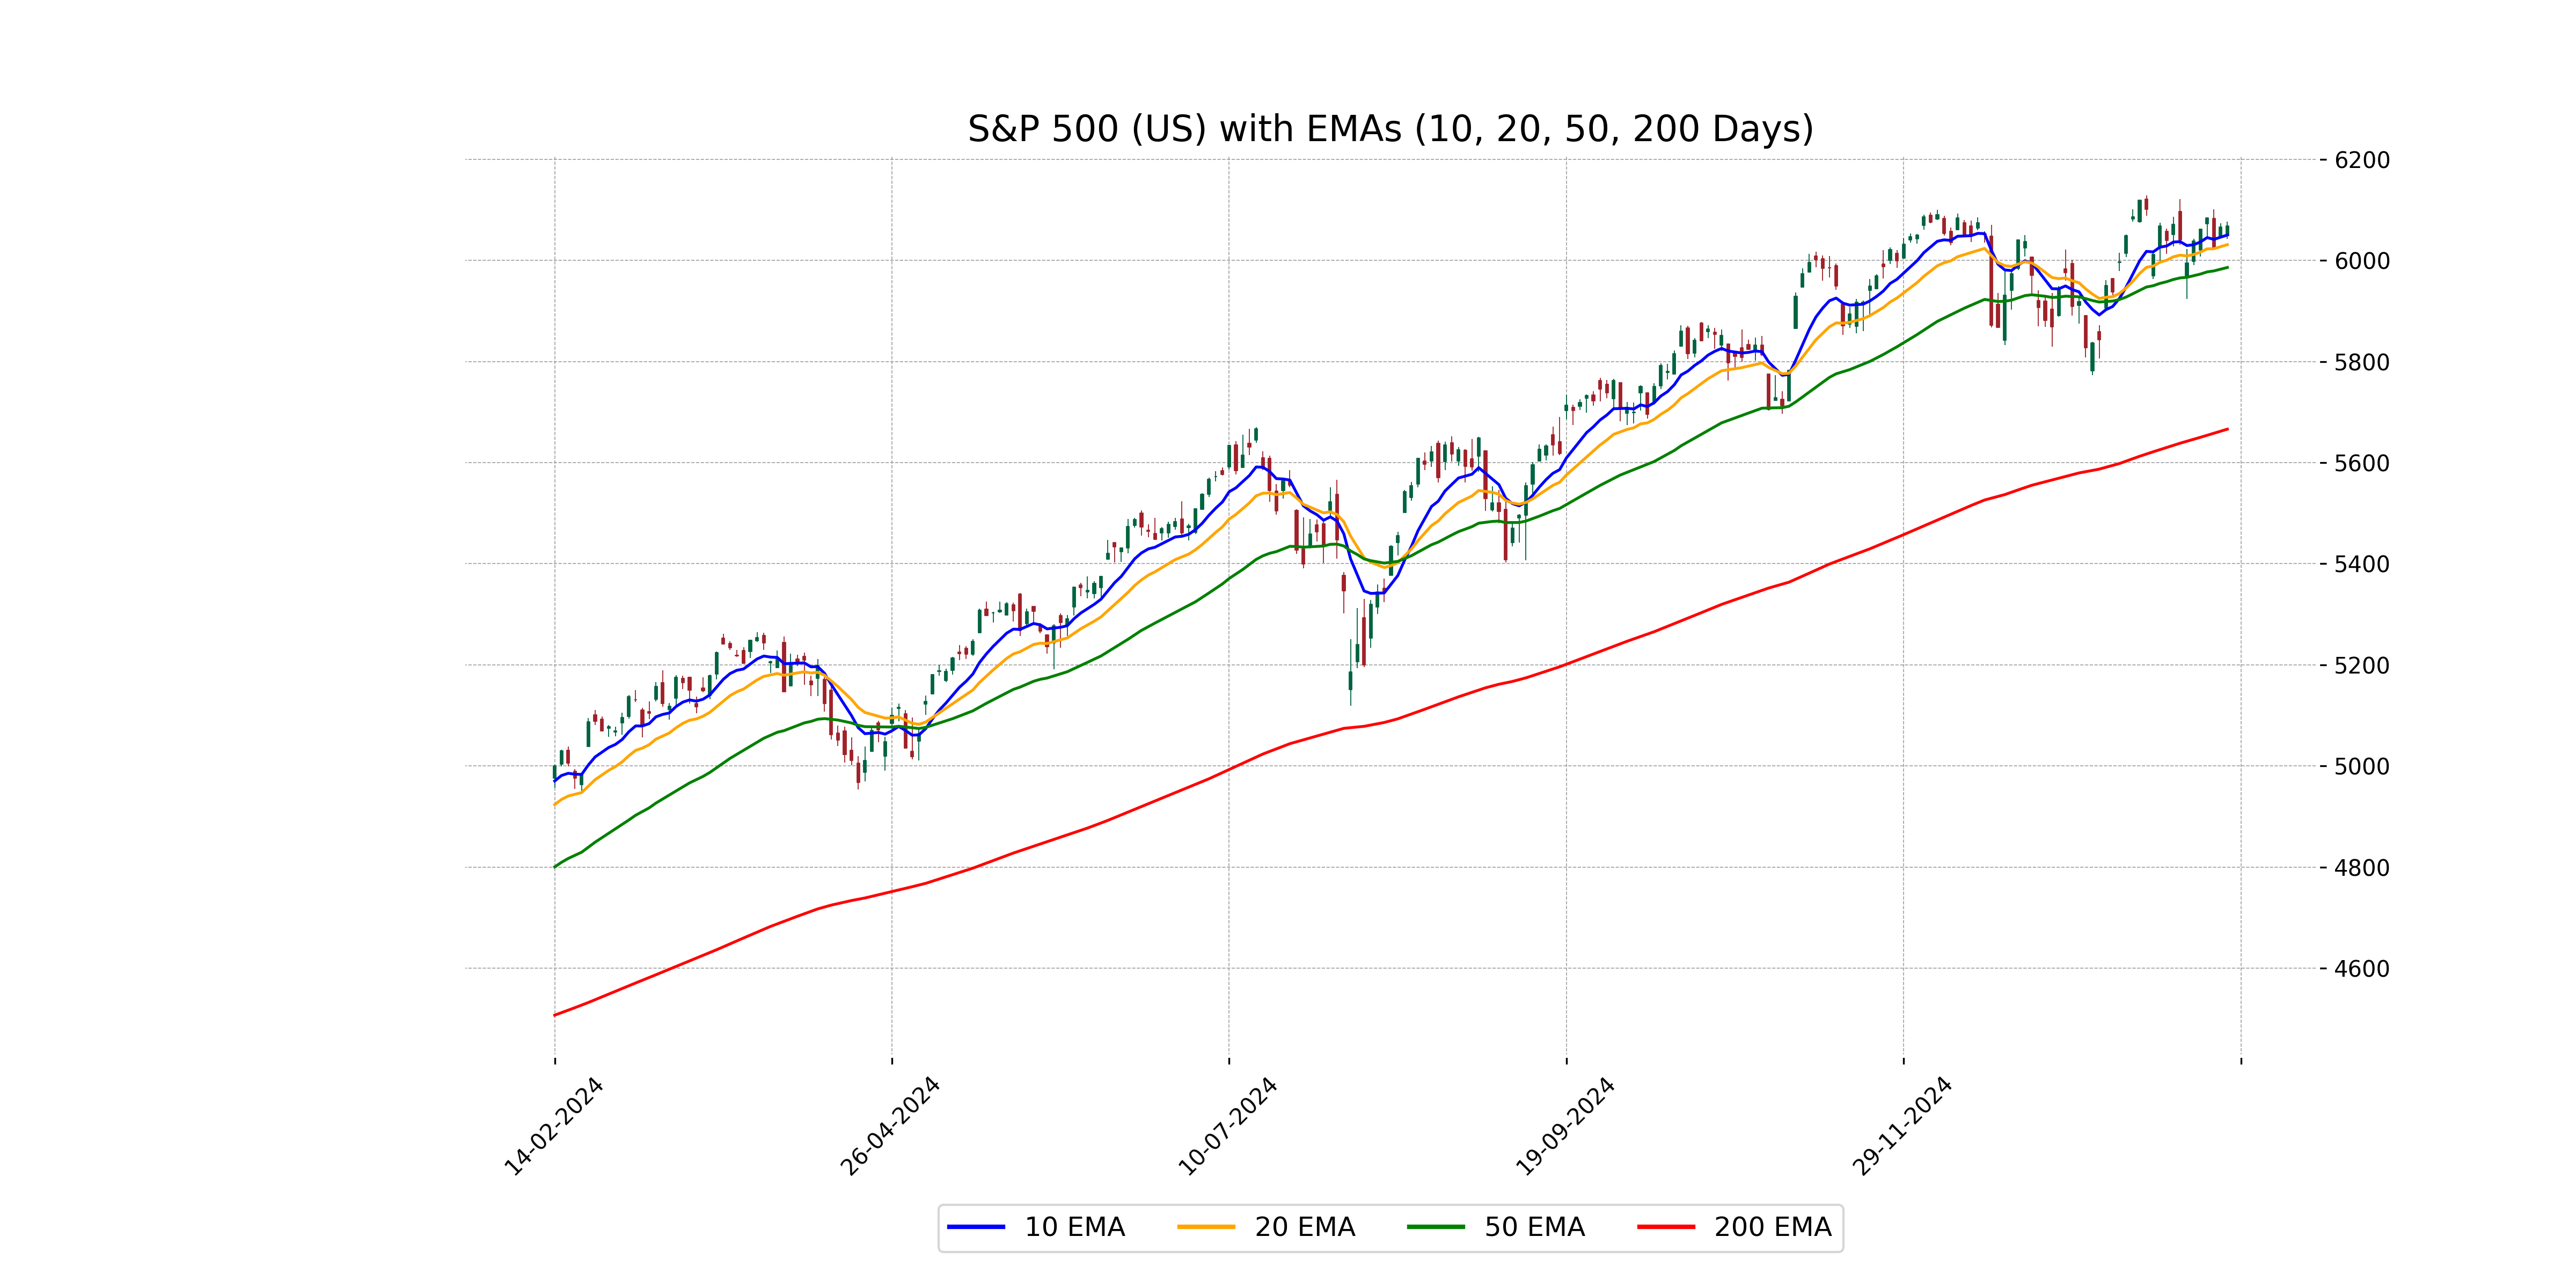
Relationship with Key Moving Averages
The S&P 500 closed above its 10 EMA and 50 EMA, indicating a short-term bullish momentum. Additionally, it is significantly above the 200 EMA, suggesting a strong long-term upward trend.
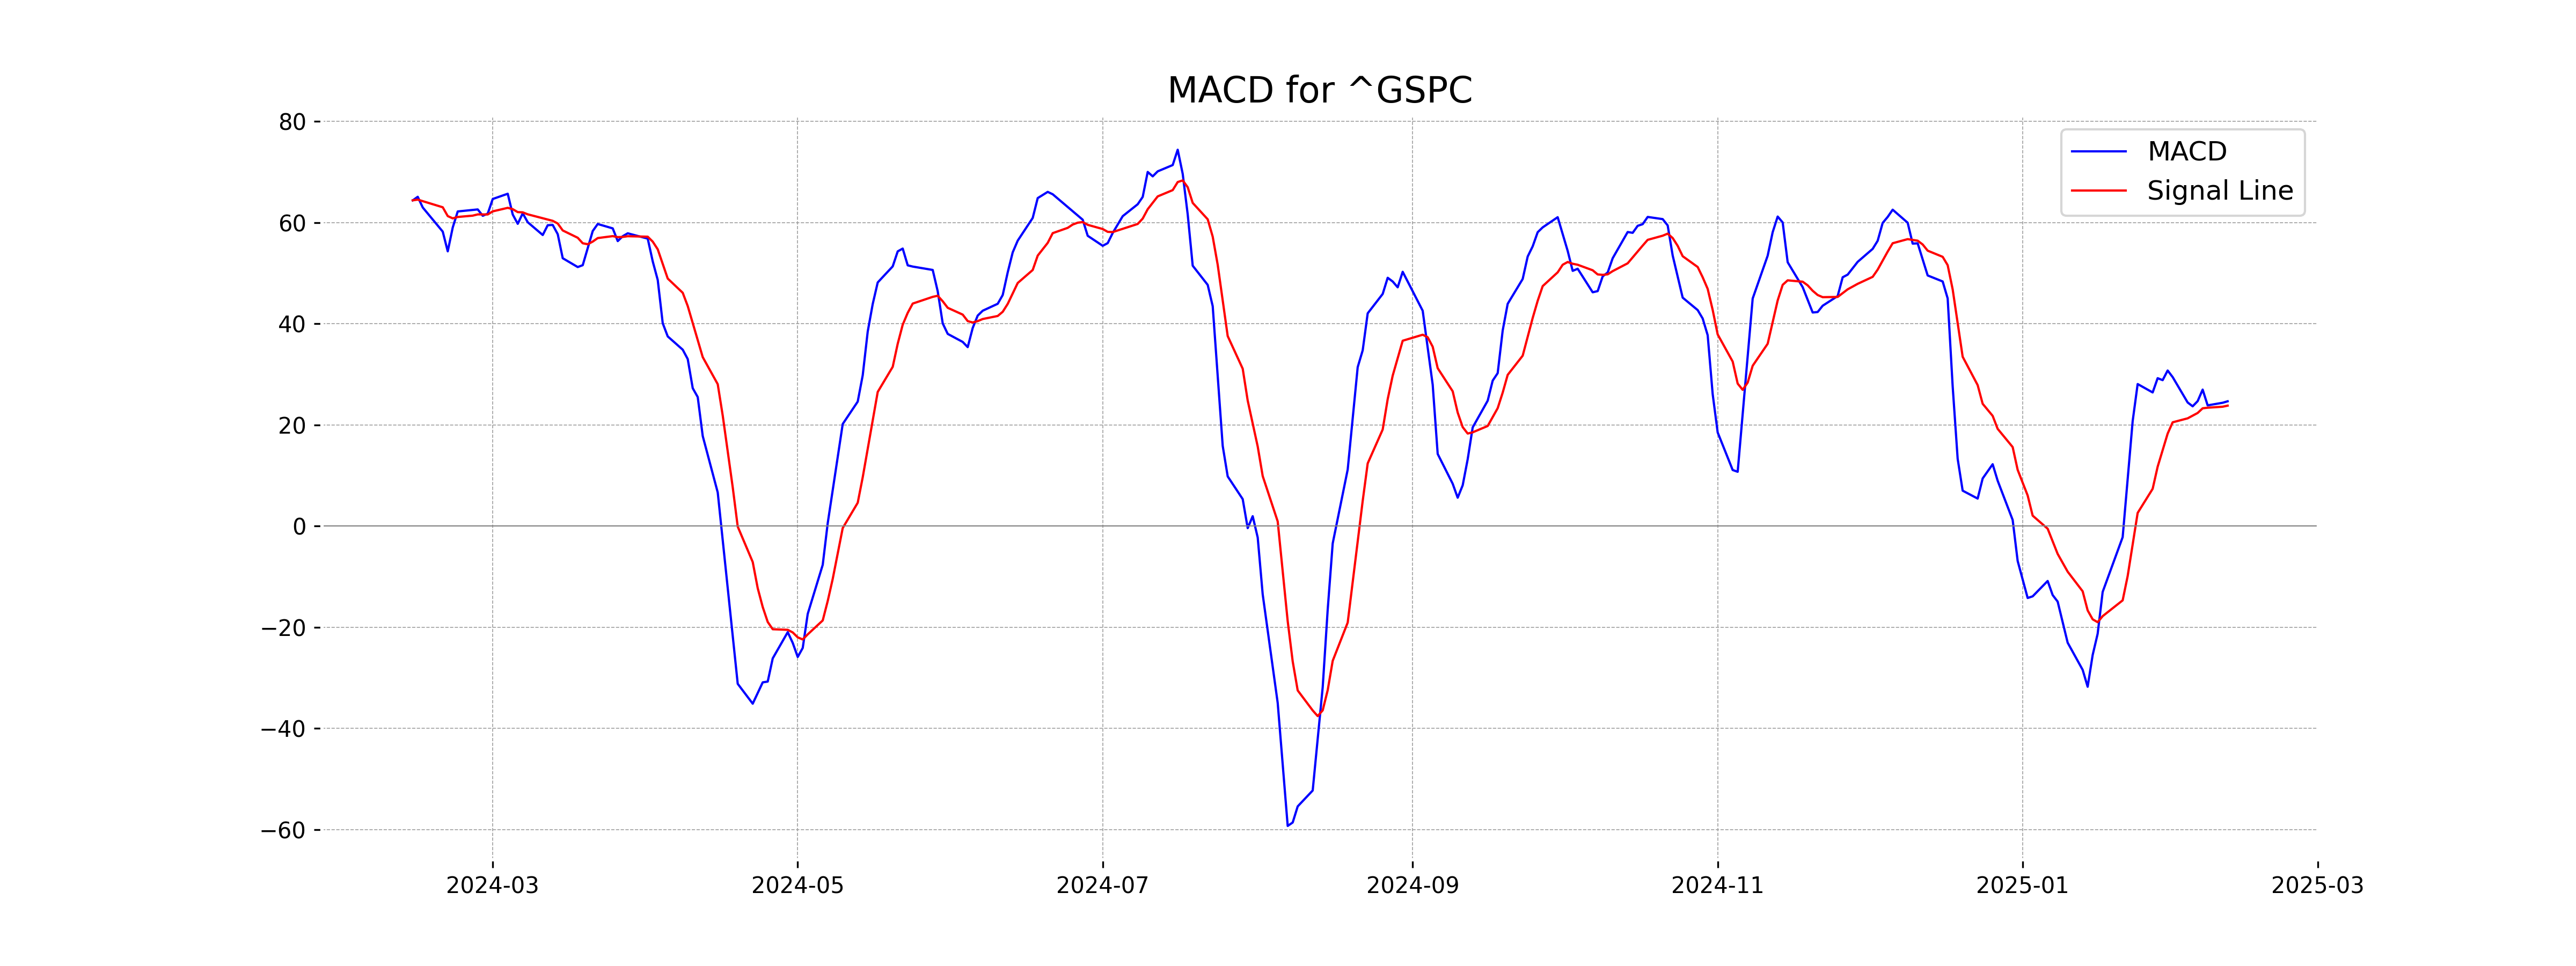
Moving Averages Trend (MACD)
The MACD value for S&P 500 (US) is 24.66, which is above the MACD Signal of 23.80. This suggests a potential bullish trend, as the MACD line crossing above the signal line is often considered a positive sign.
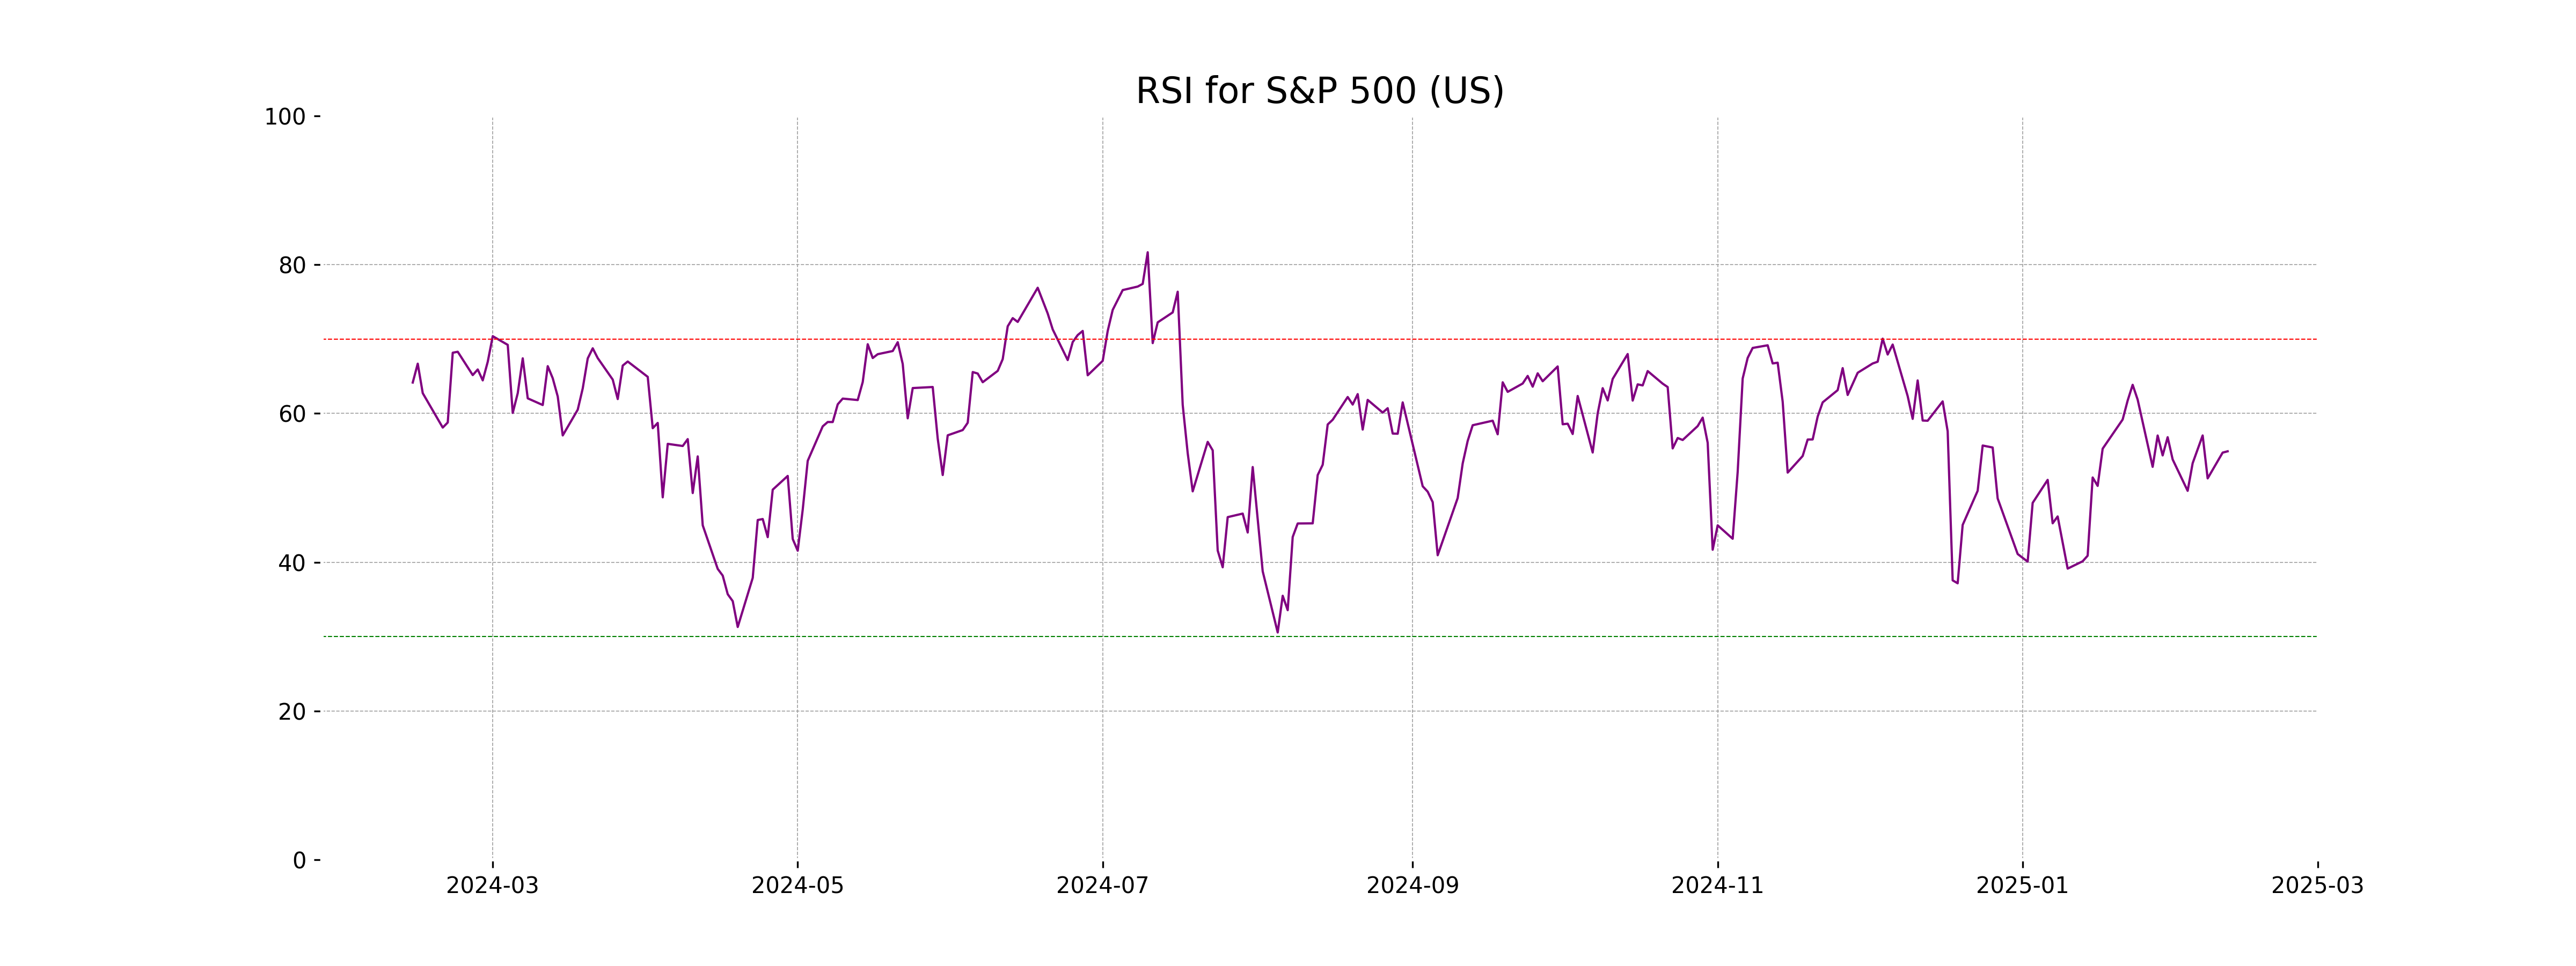
RSI Analysis
The RSI for the S&P 500 is 54.91, which suggests that the index is in a neutral position, neither overbought nor oversold. This indicates a balanced market sentiment, with no strong momentum in either direction.
Analysis for Hang Seng Index (Hong Kong) - February 12, 2025
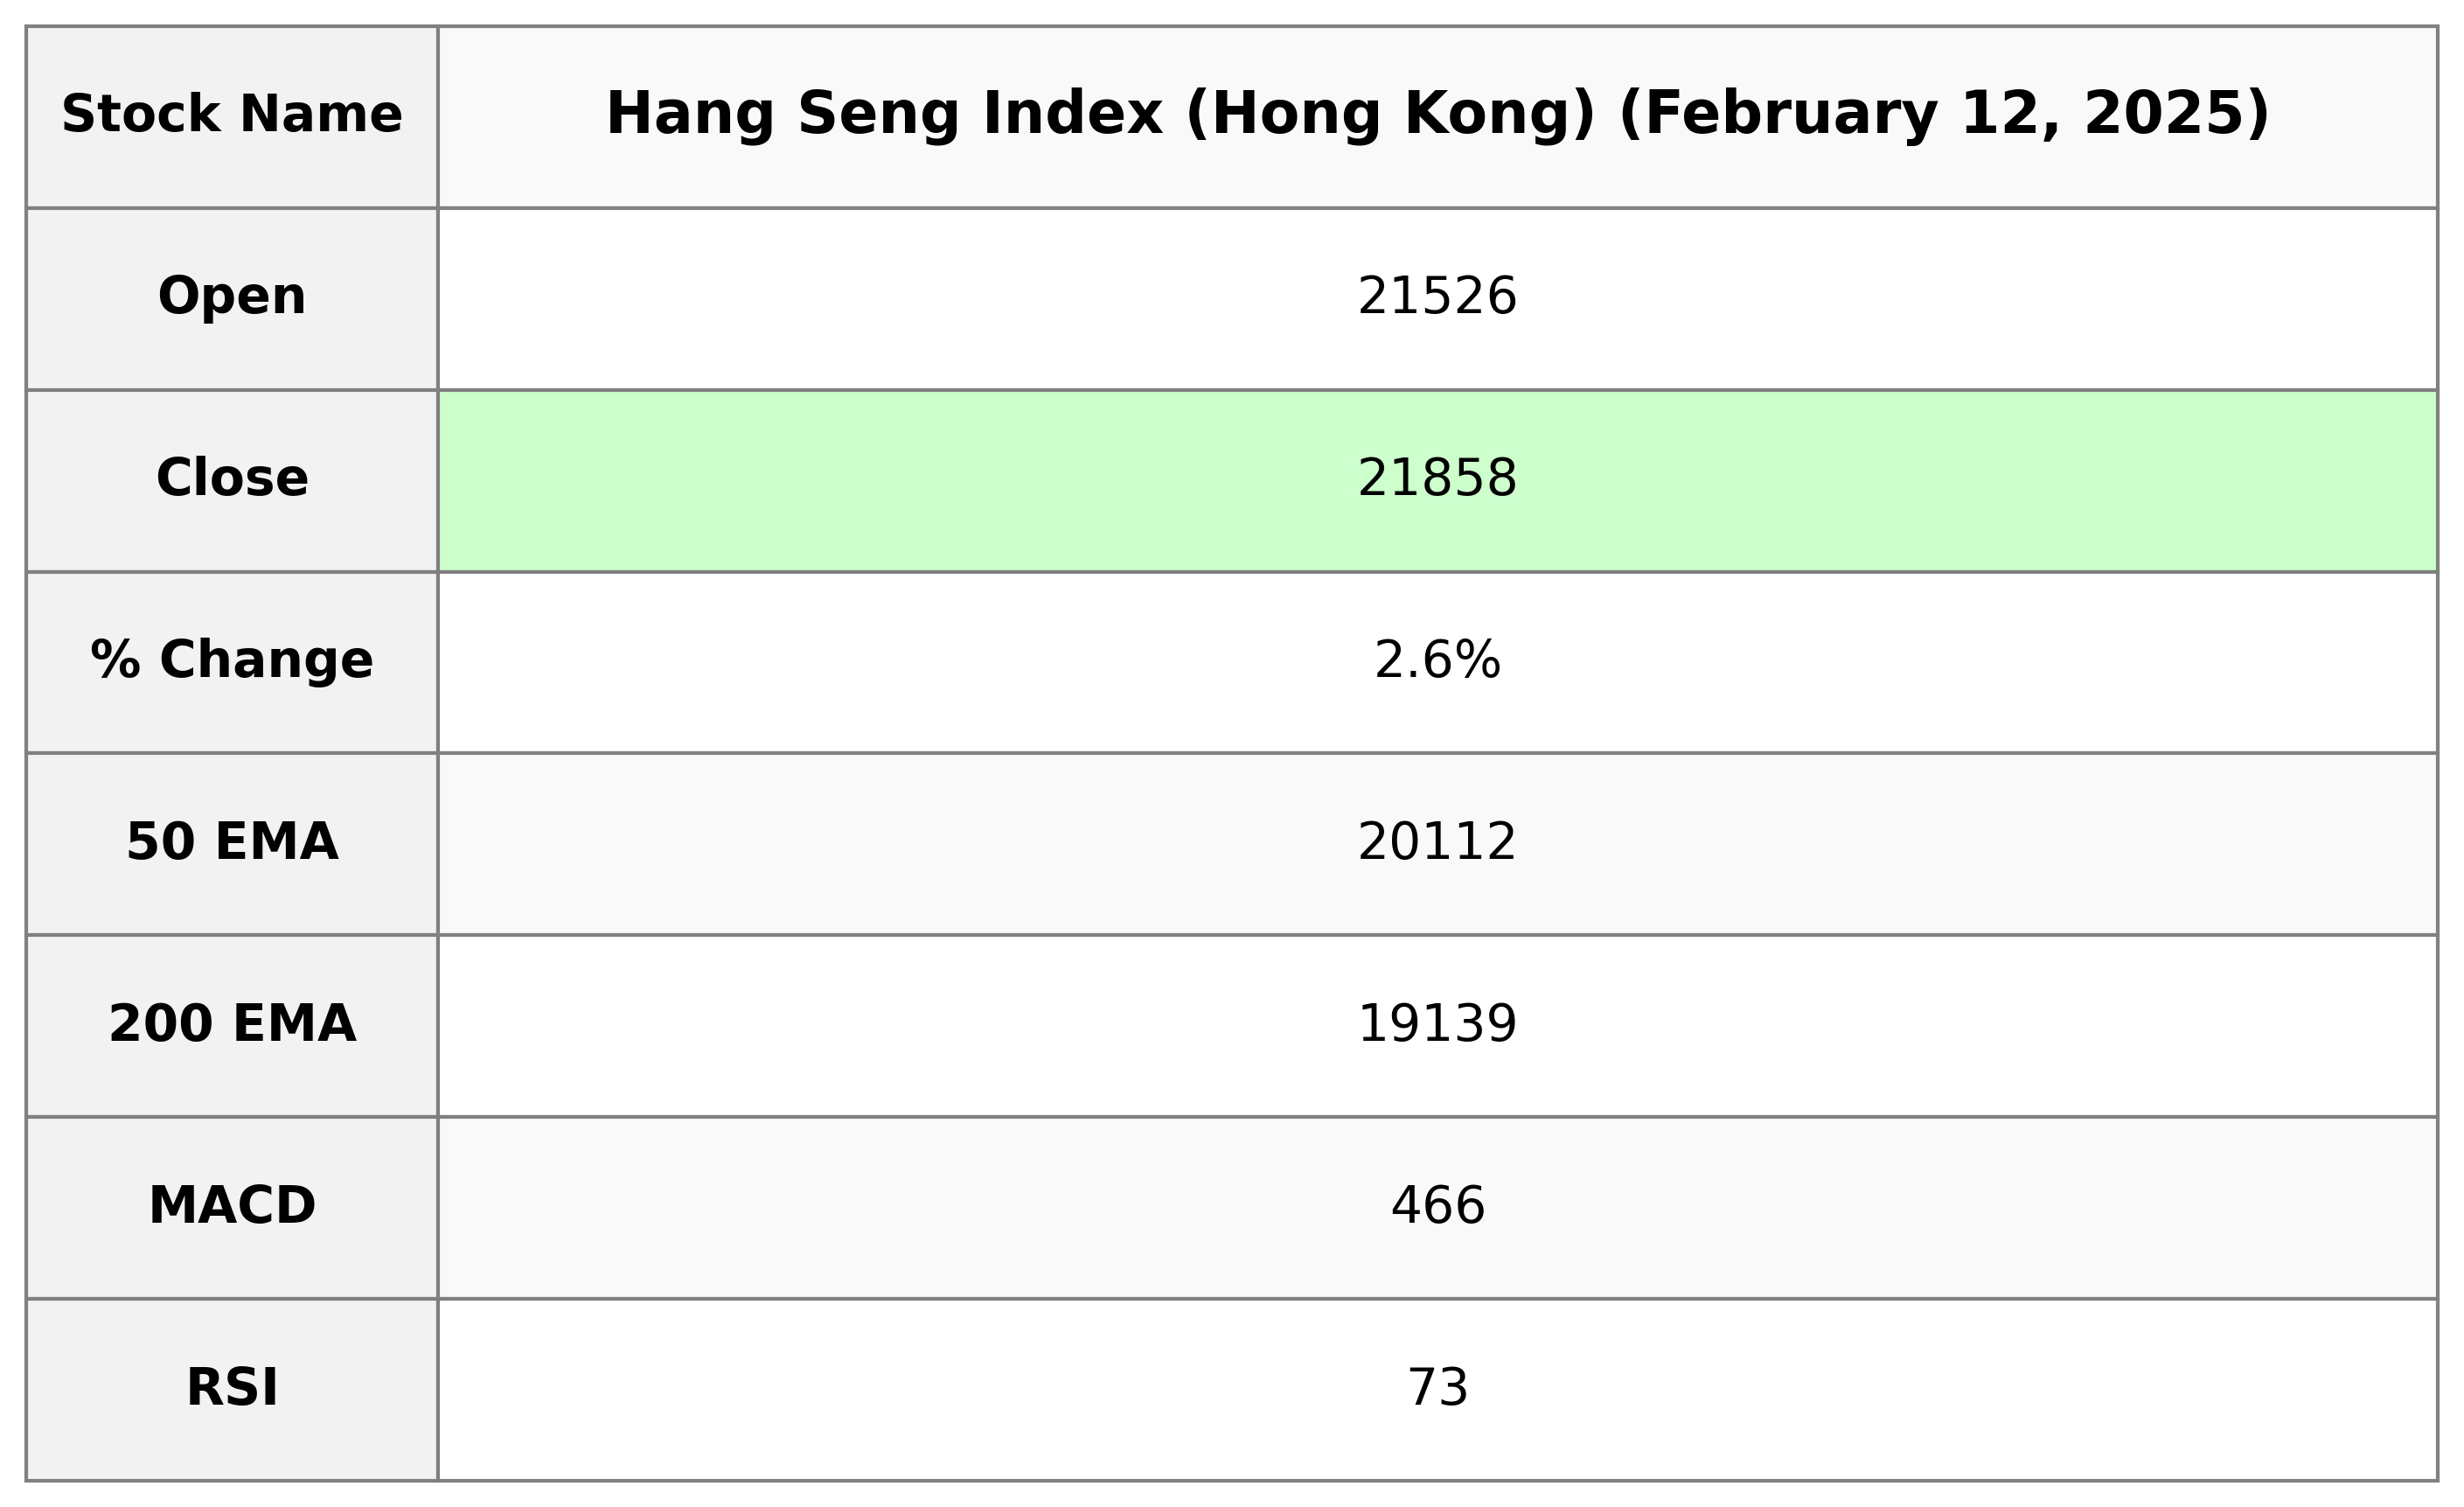
The Hang Seng Index (Hong Kong) saw a significant increase, closing at 21,857.92 with a 2.64% rise from the previous close. The index's performance is strong with an RSI of 73.45, indicating a potentially overbought condition, and a significant positive MACD divergence reflecting bullish momentum.
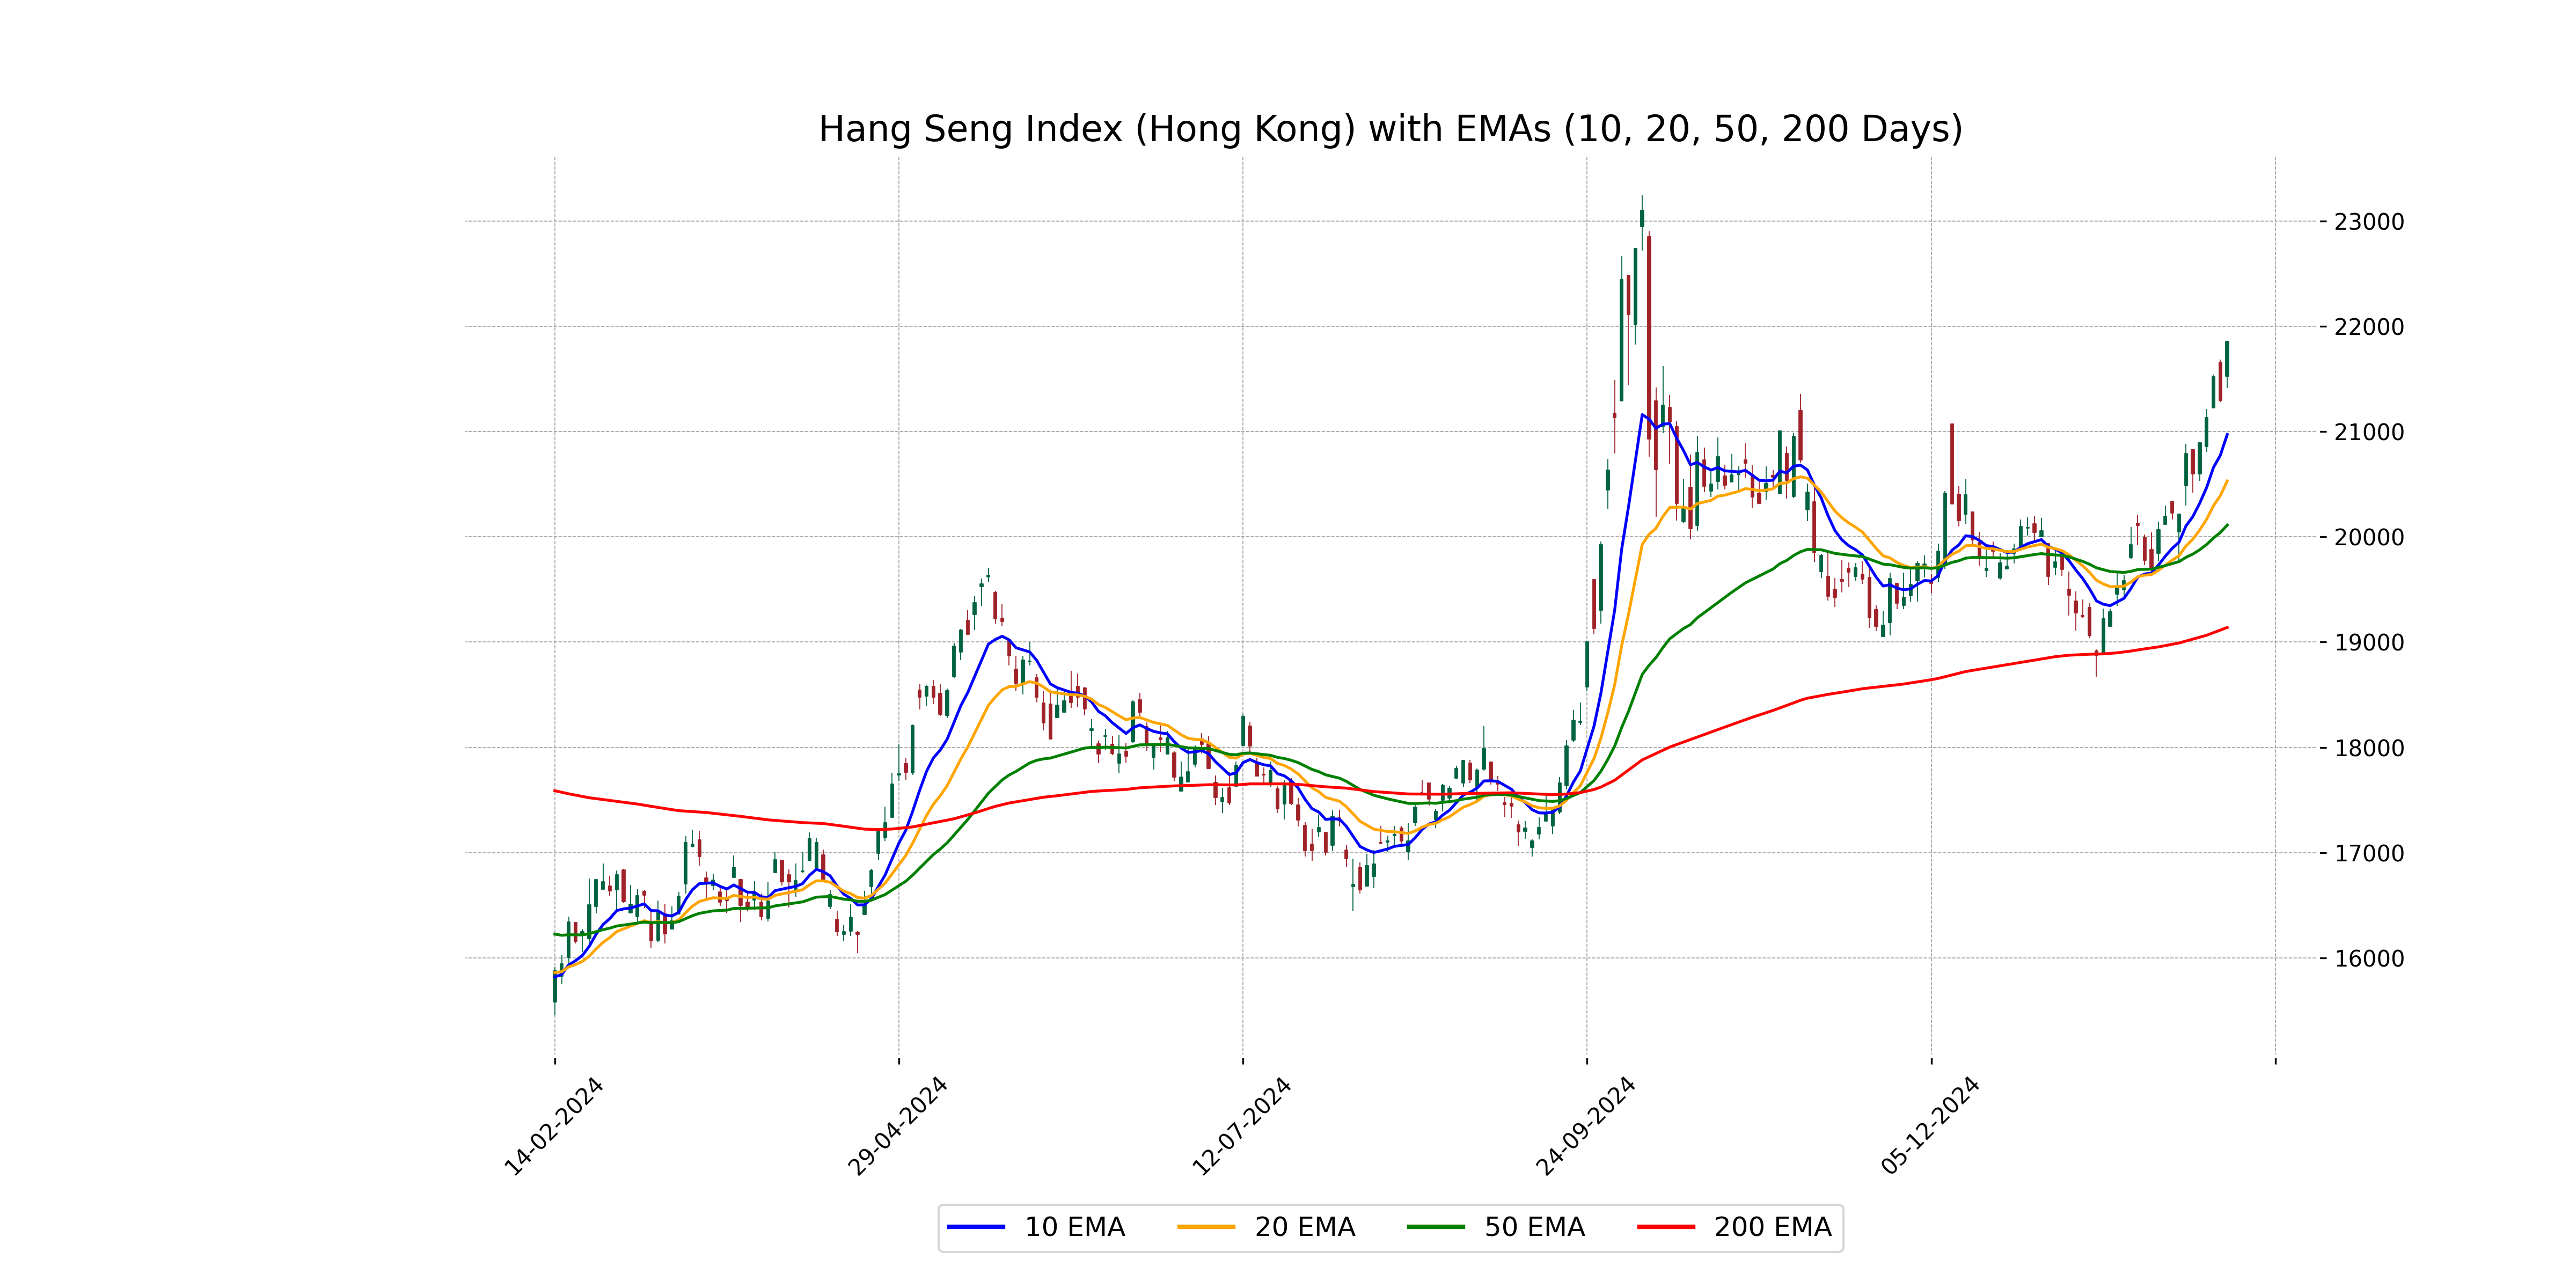
Relationship with Key Moving Averages
The Hang Seng Index closed at 21857.92, above its 10-day EMA of 20971.75, 20-day EMA of 20530.55, 50-day EMA of 20111.73, and 200-day EMA of 19138.70, indicating a strong upward trend. The RSI of 73.45 suggests it is overbought, supported by a positive MACD of 466.06 above its signal line.
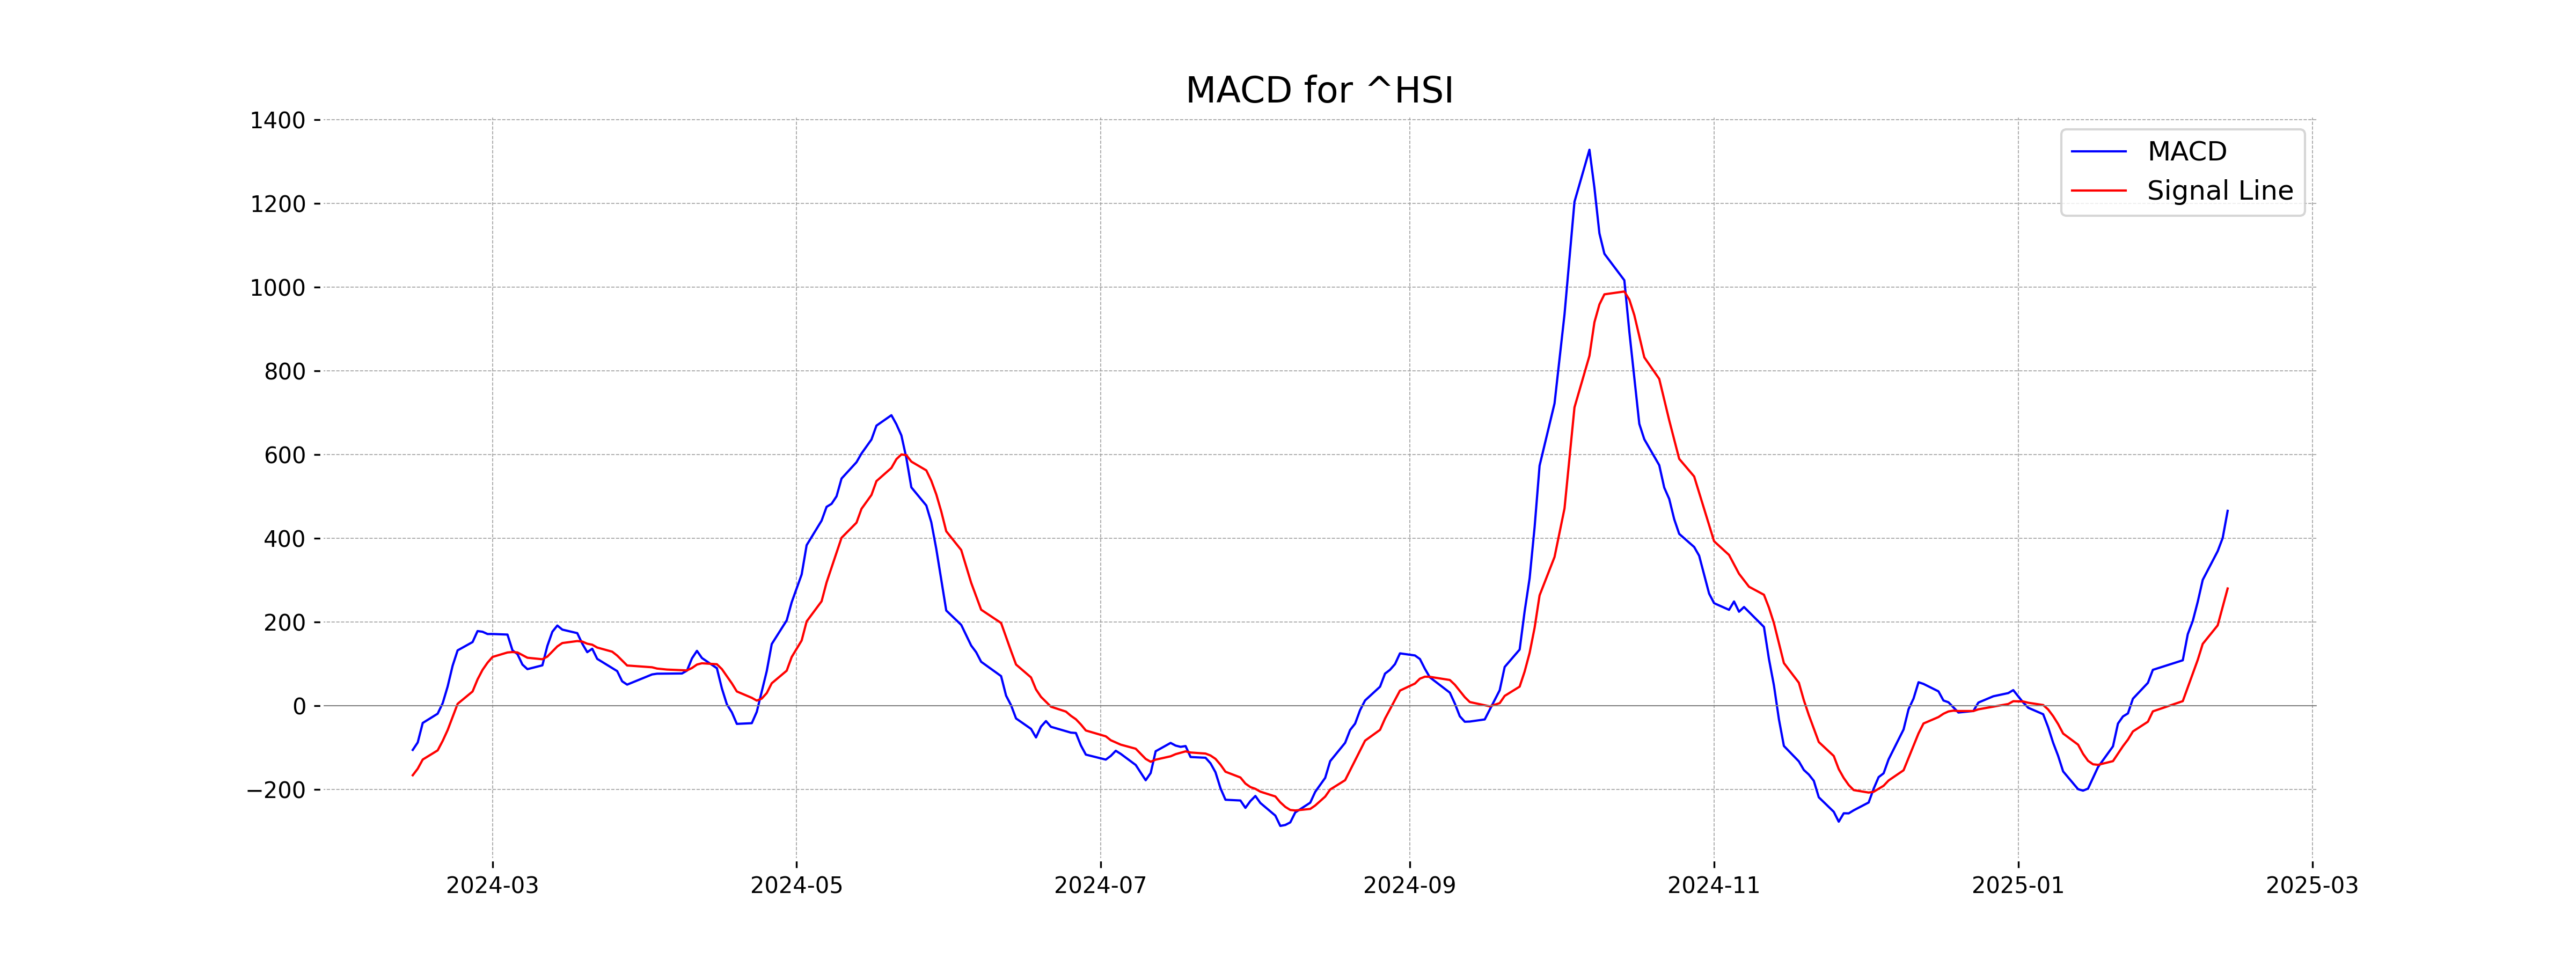
Moving Averages Trend (MACD)
The MACD value for Hang Seng Index is 466.06, which is above the MACD Signal value of 280.59. This suggests a bullish signal, indicating potential upward momentum in the market. The positive crossover is often viewed as a buying opportunity.
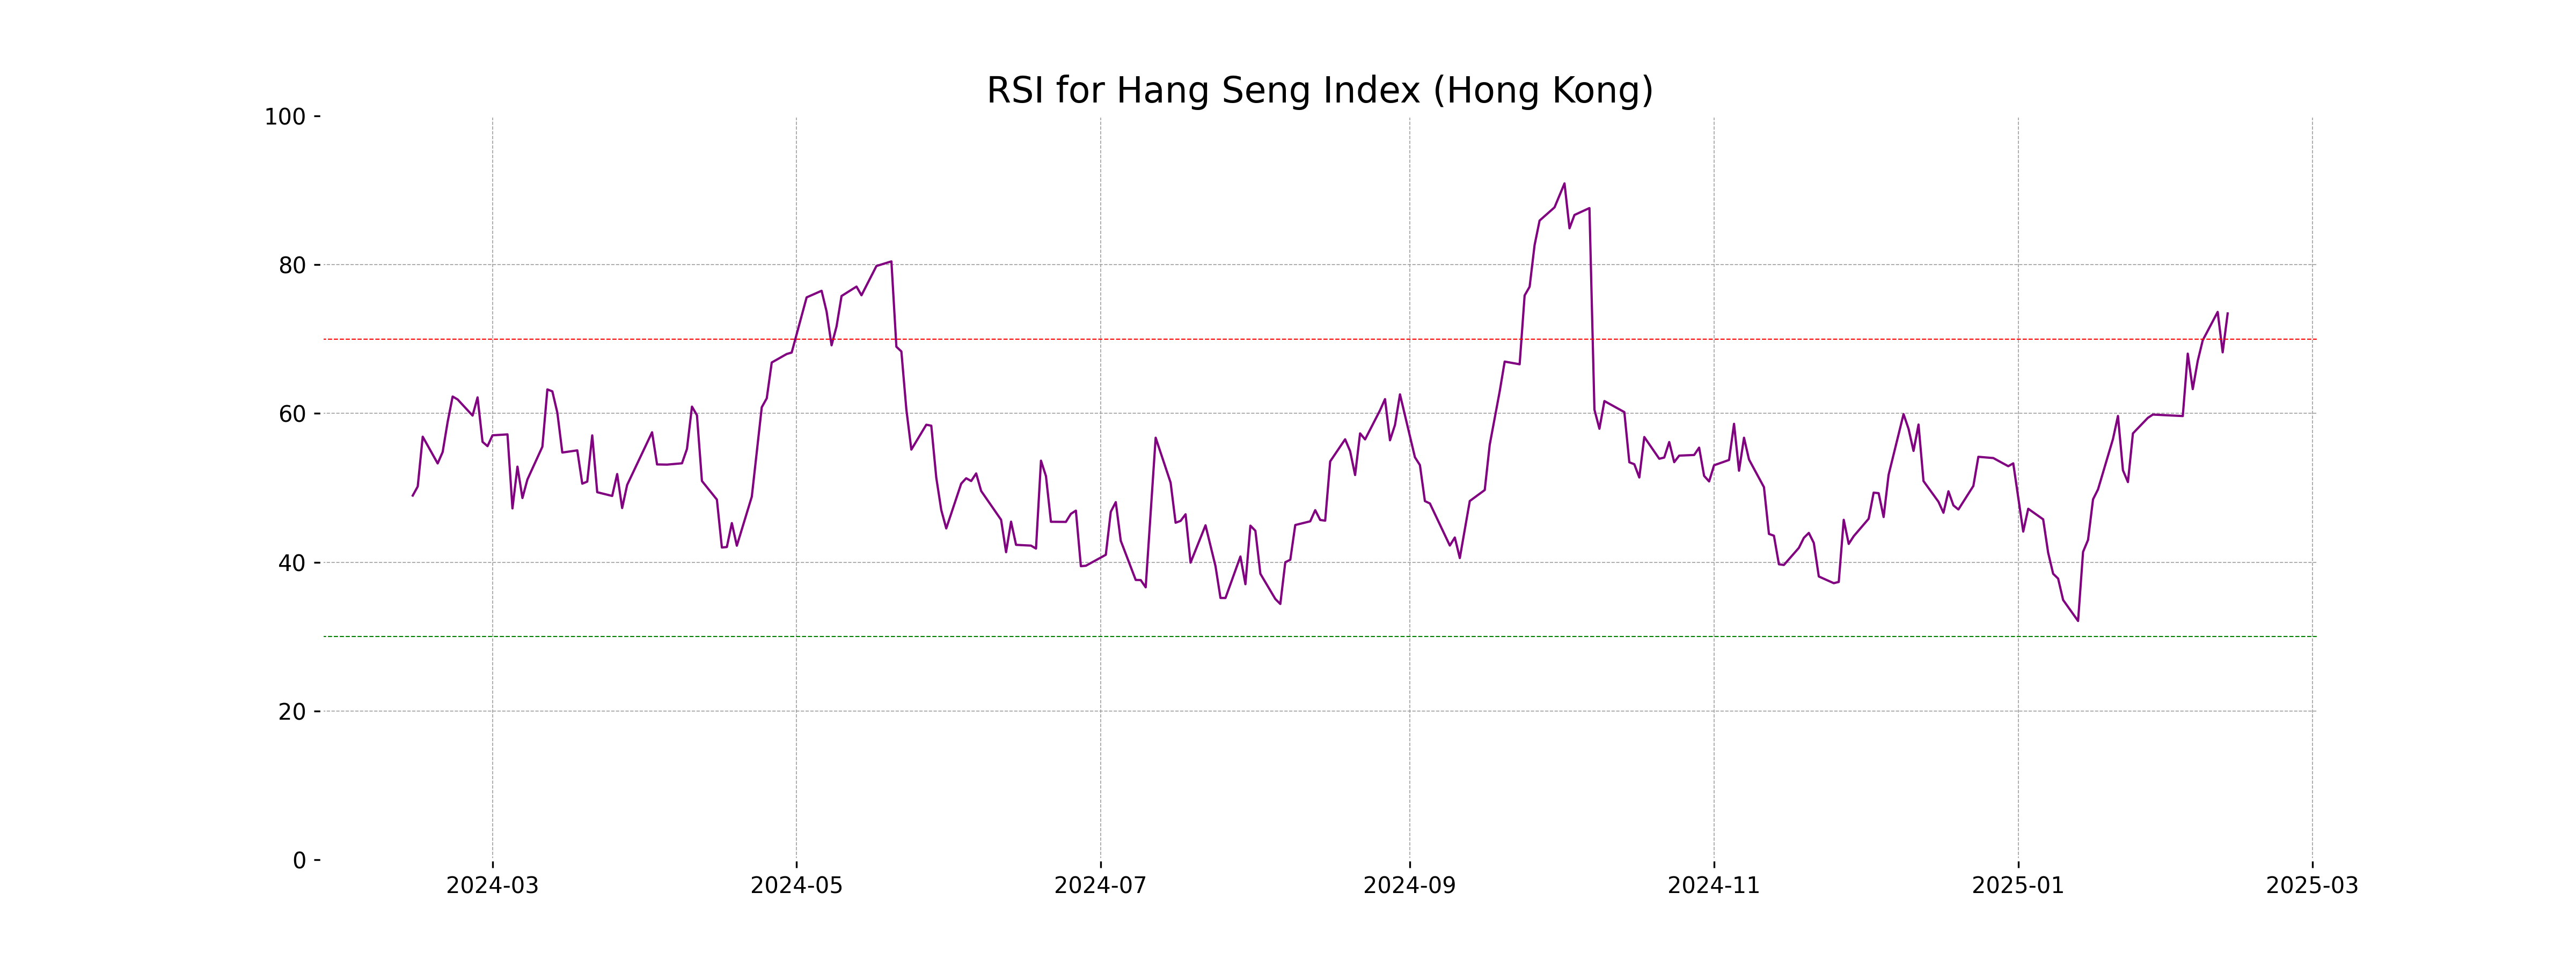
RSI Analysis
The RSI value of 73.45 for the Hang Seng Index indicates that it is currently in the overbought territory, suggesting strong upward momentum. This could imply potential profit-taking or a correction in the near term if the buying pressure subsides.
Analysis for IBEX 35 (Spain) - February 12, 2025

The IBEX 35 index, based in Spain, opened at 12,814.80 and closed at 12,861.20, reflecting a % change of 0.68% and a points increase of 86.40 from the previous close of 12,774.80. The index exhibits a strong RSI of 76.30, suggesting it might be overbought. Moreover, the MACD line is above the signal line, indicating a bullish trend.
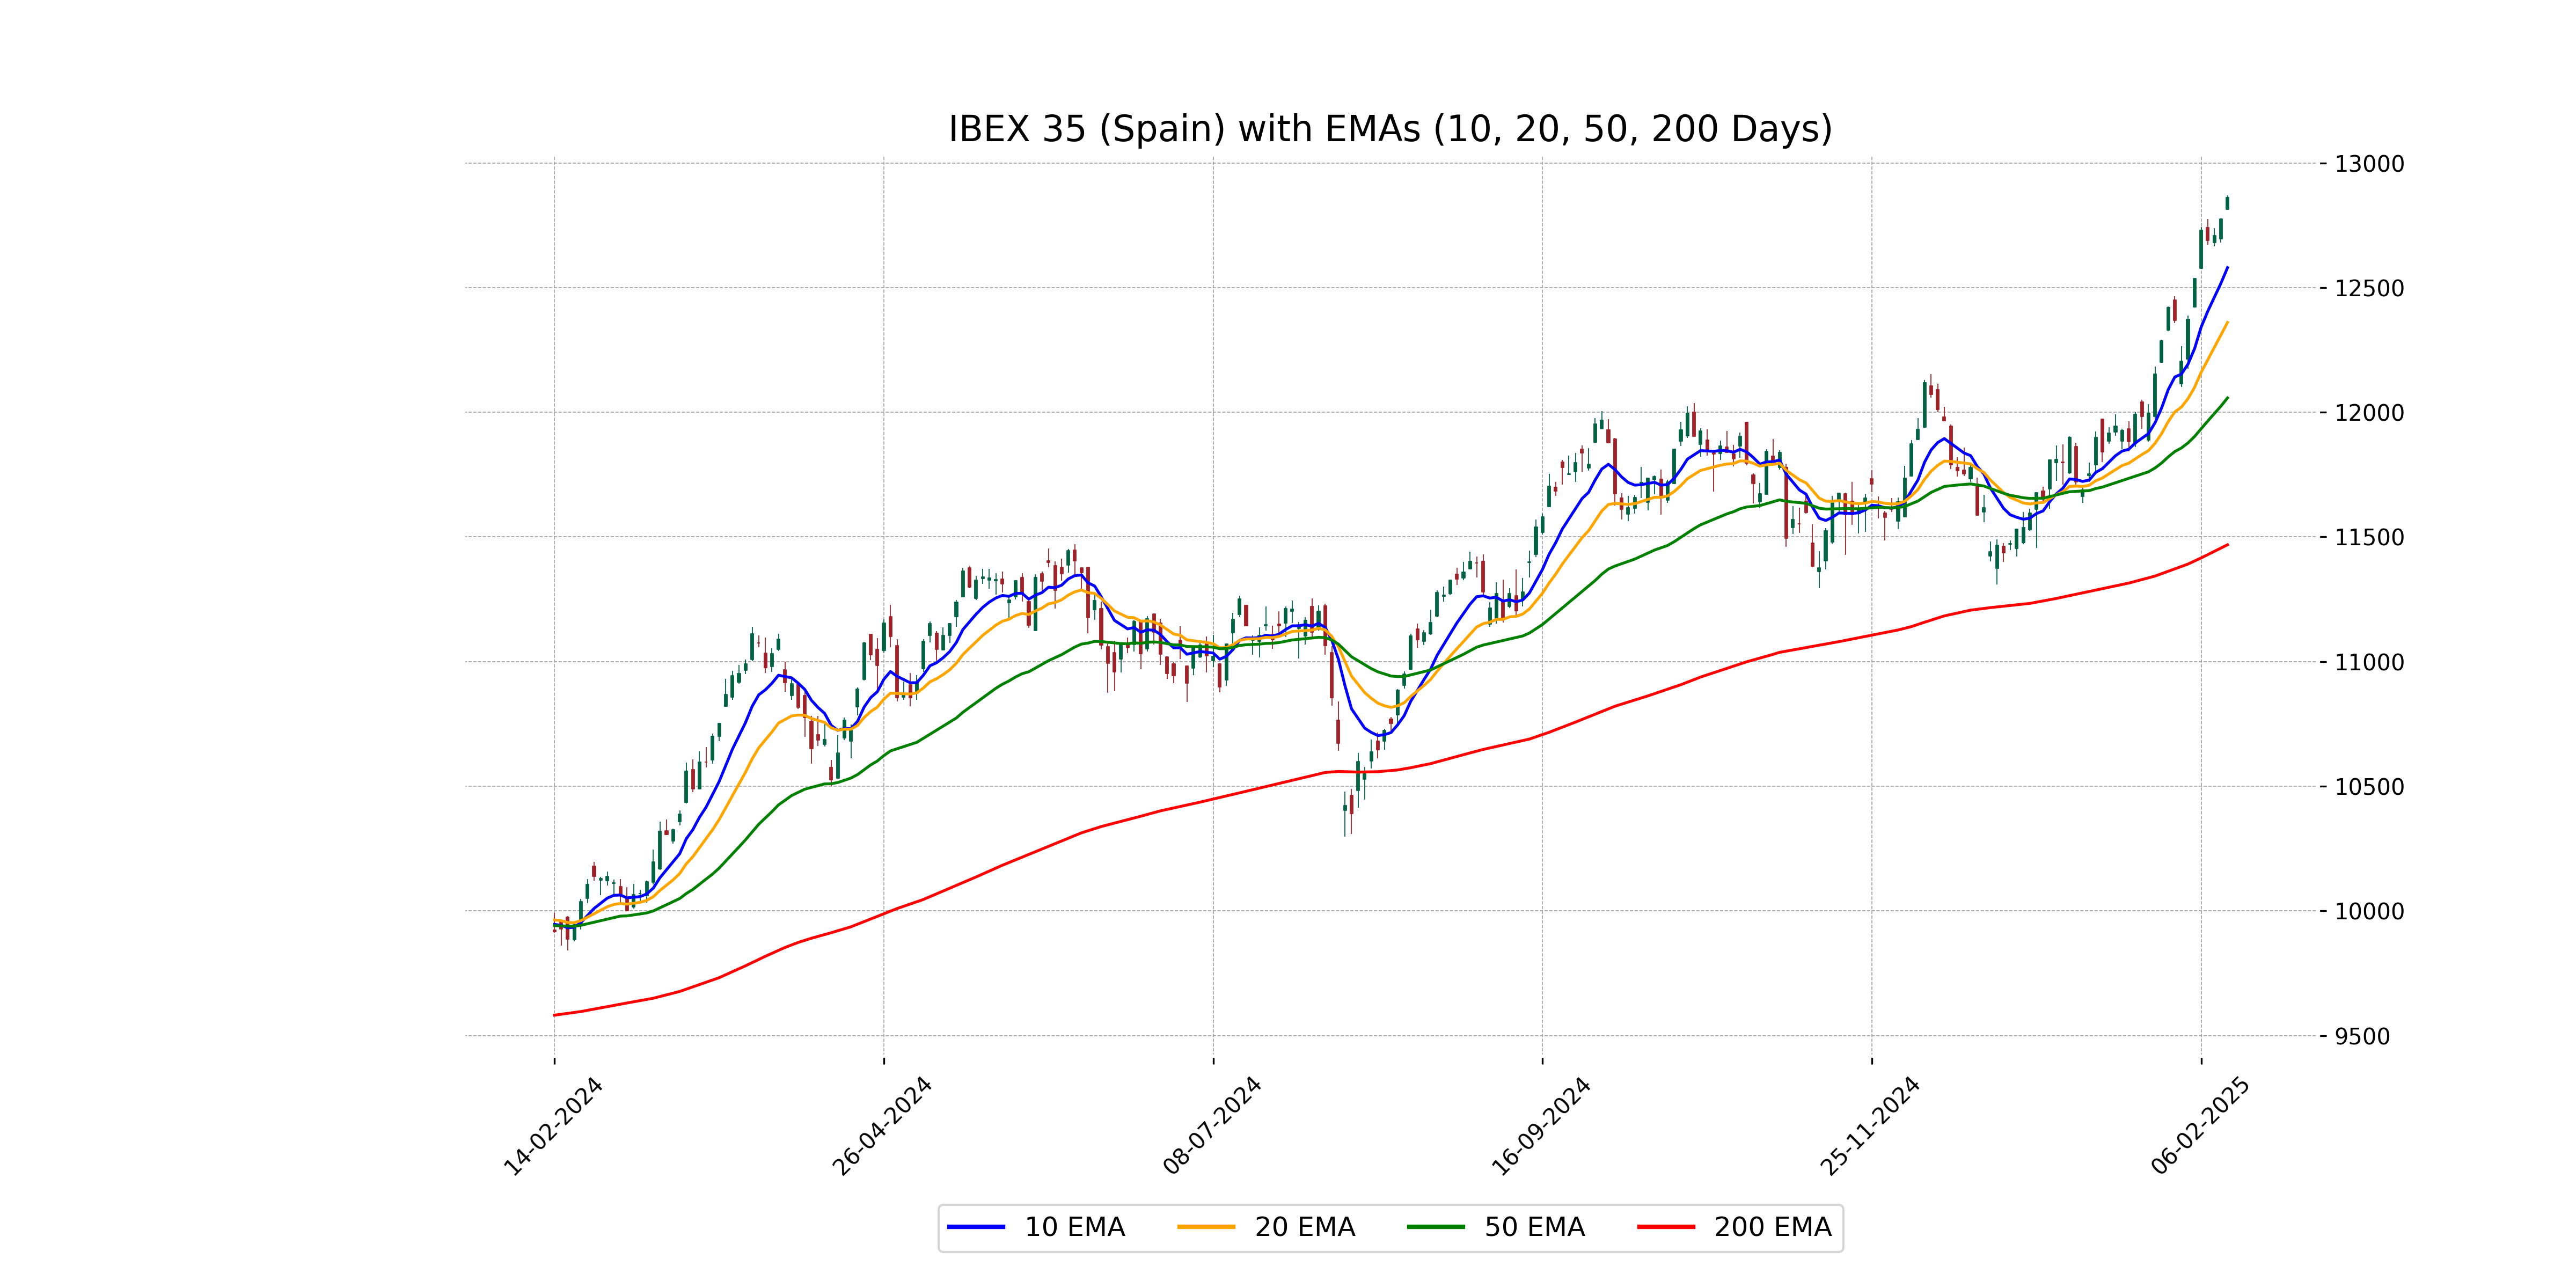
Relationship with Key Moving Averages
IBEX 35 (Spain) is currently trading above its short, medium, and long-term moving averages, with the 10 EMA at 12579.96, 20 EMA at 12360.12, 50 EMA at 12057.46, and 200 EMA at 11468.56. This suggests a strong bullish trend, corroborated by a high RSI of 76.30, indicating overbought conditions.
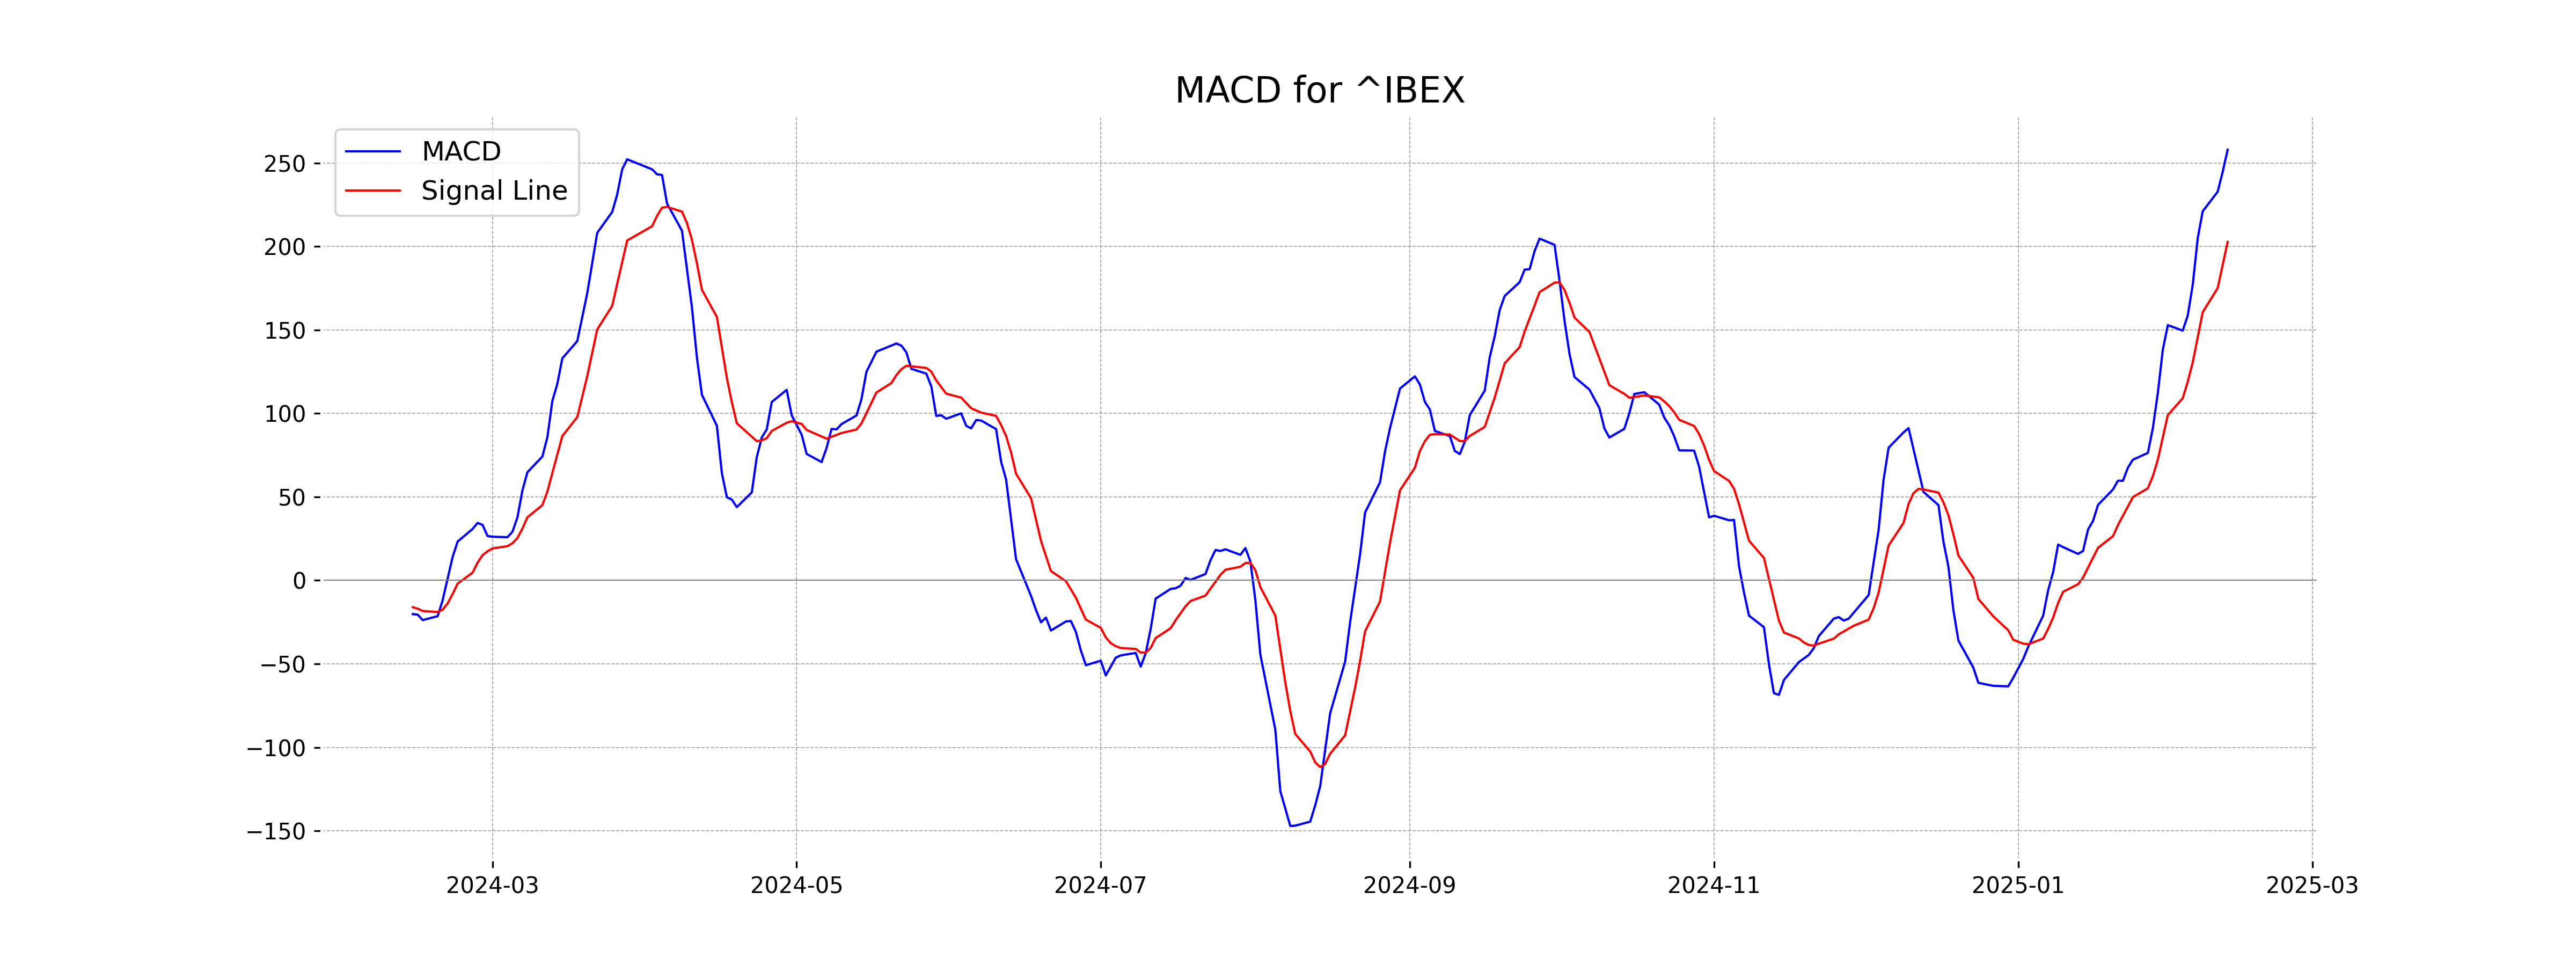
Moving Averages Trend (MACD)
The MACD for IBEX 35 (Spain) is 257.89, which is above the MACD Signal line at 202.71, indicating a bullish trend. The positive difference suggests that the recent price momentum may continue upward.
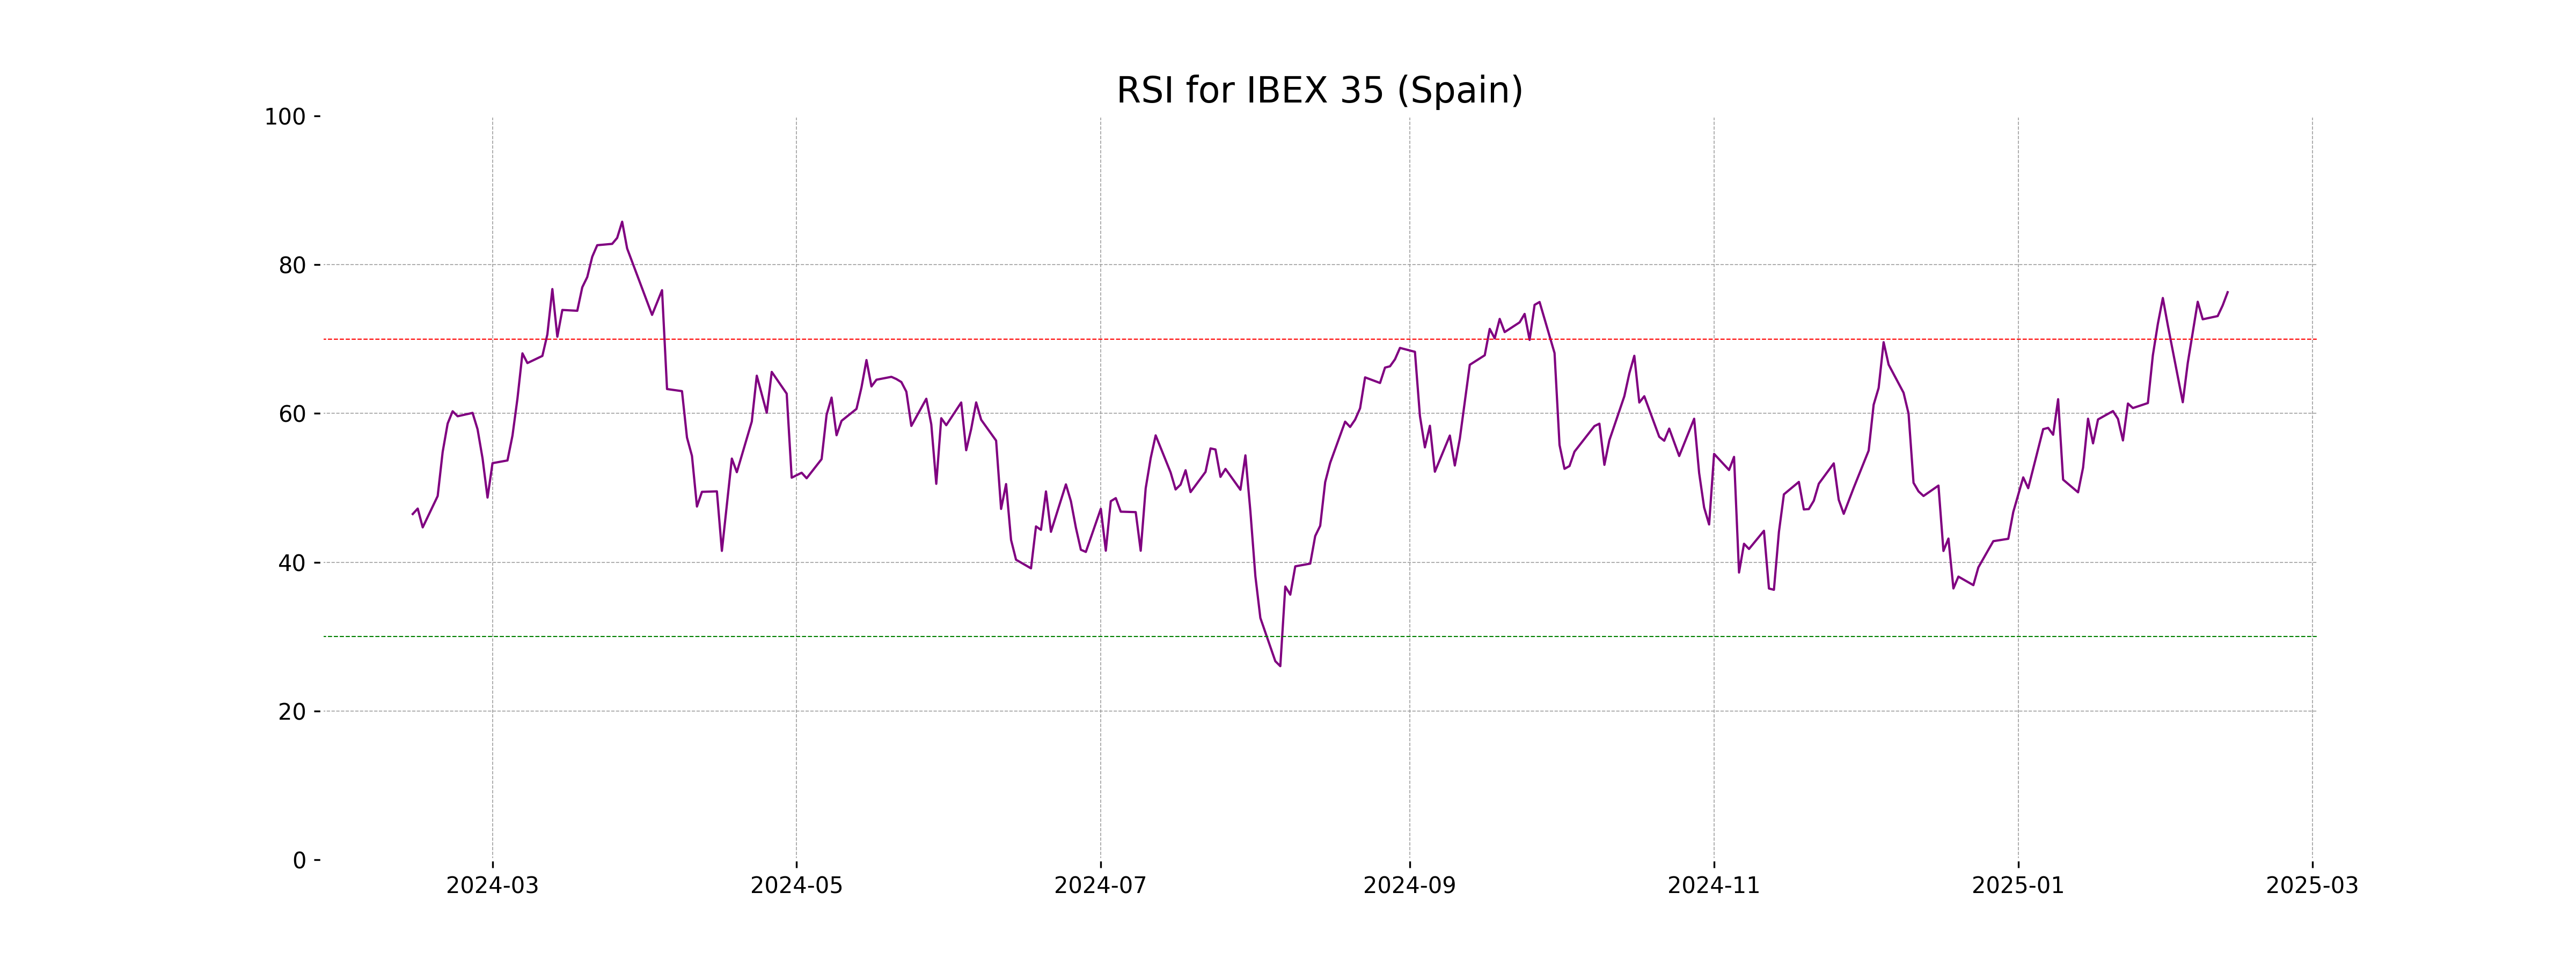
RSI Analysis
The RSI of IBEX 35 is 76.30, indicating an overbought condition as it is above 70. This suggests that the index may experience a potential price correction or consolidation in the near term. Investors should be cautious and consider this factor in their decision-making.
Analysis for NASDAQ Composite (US) - February 12, 2025
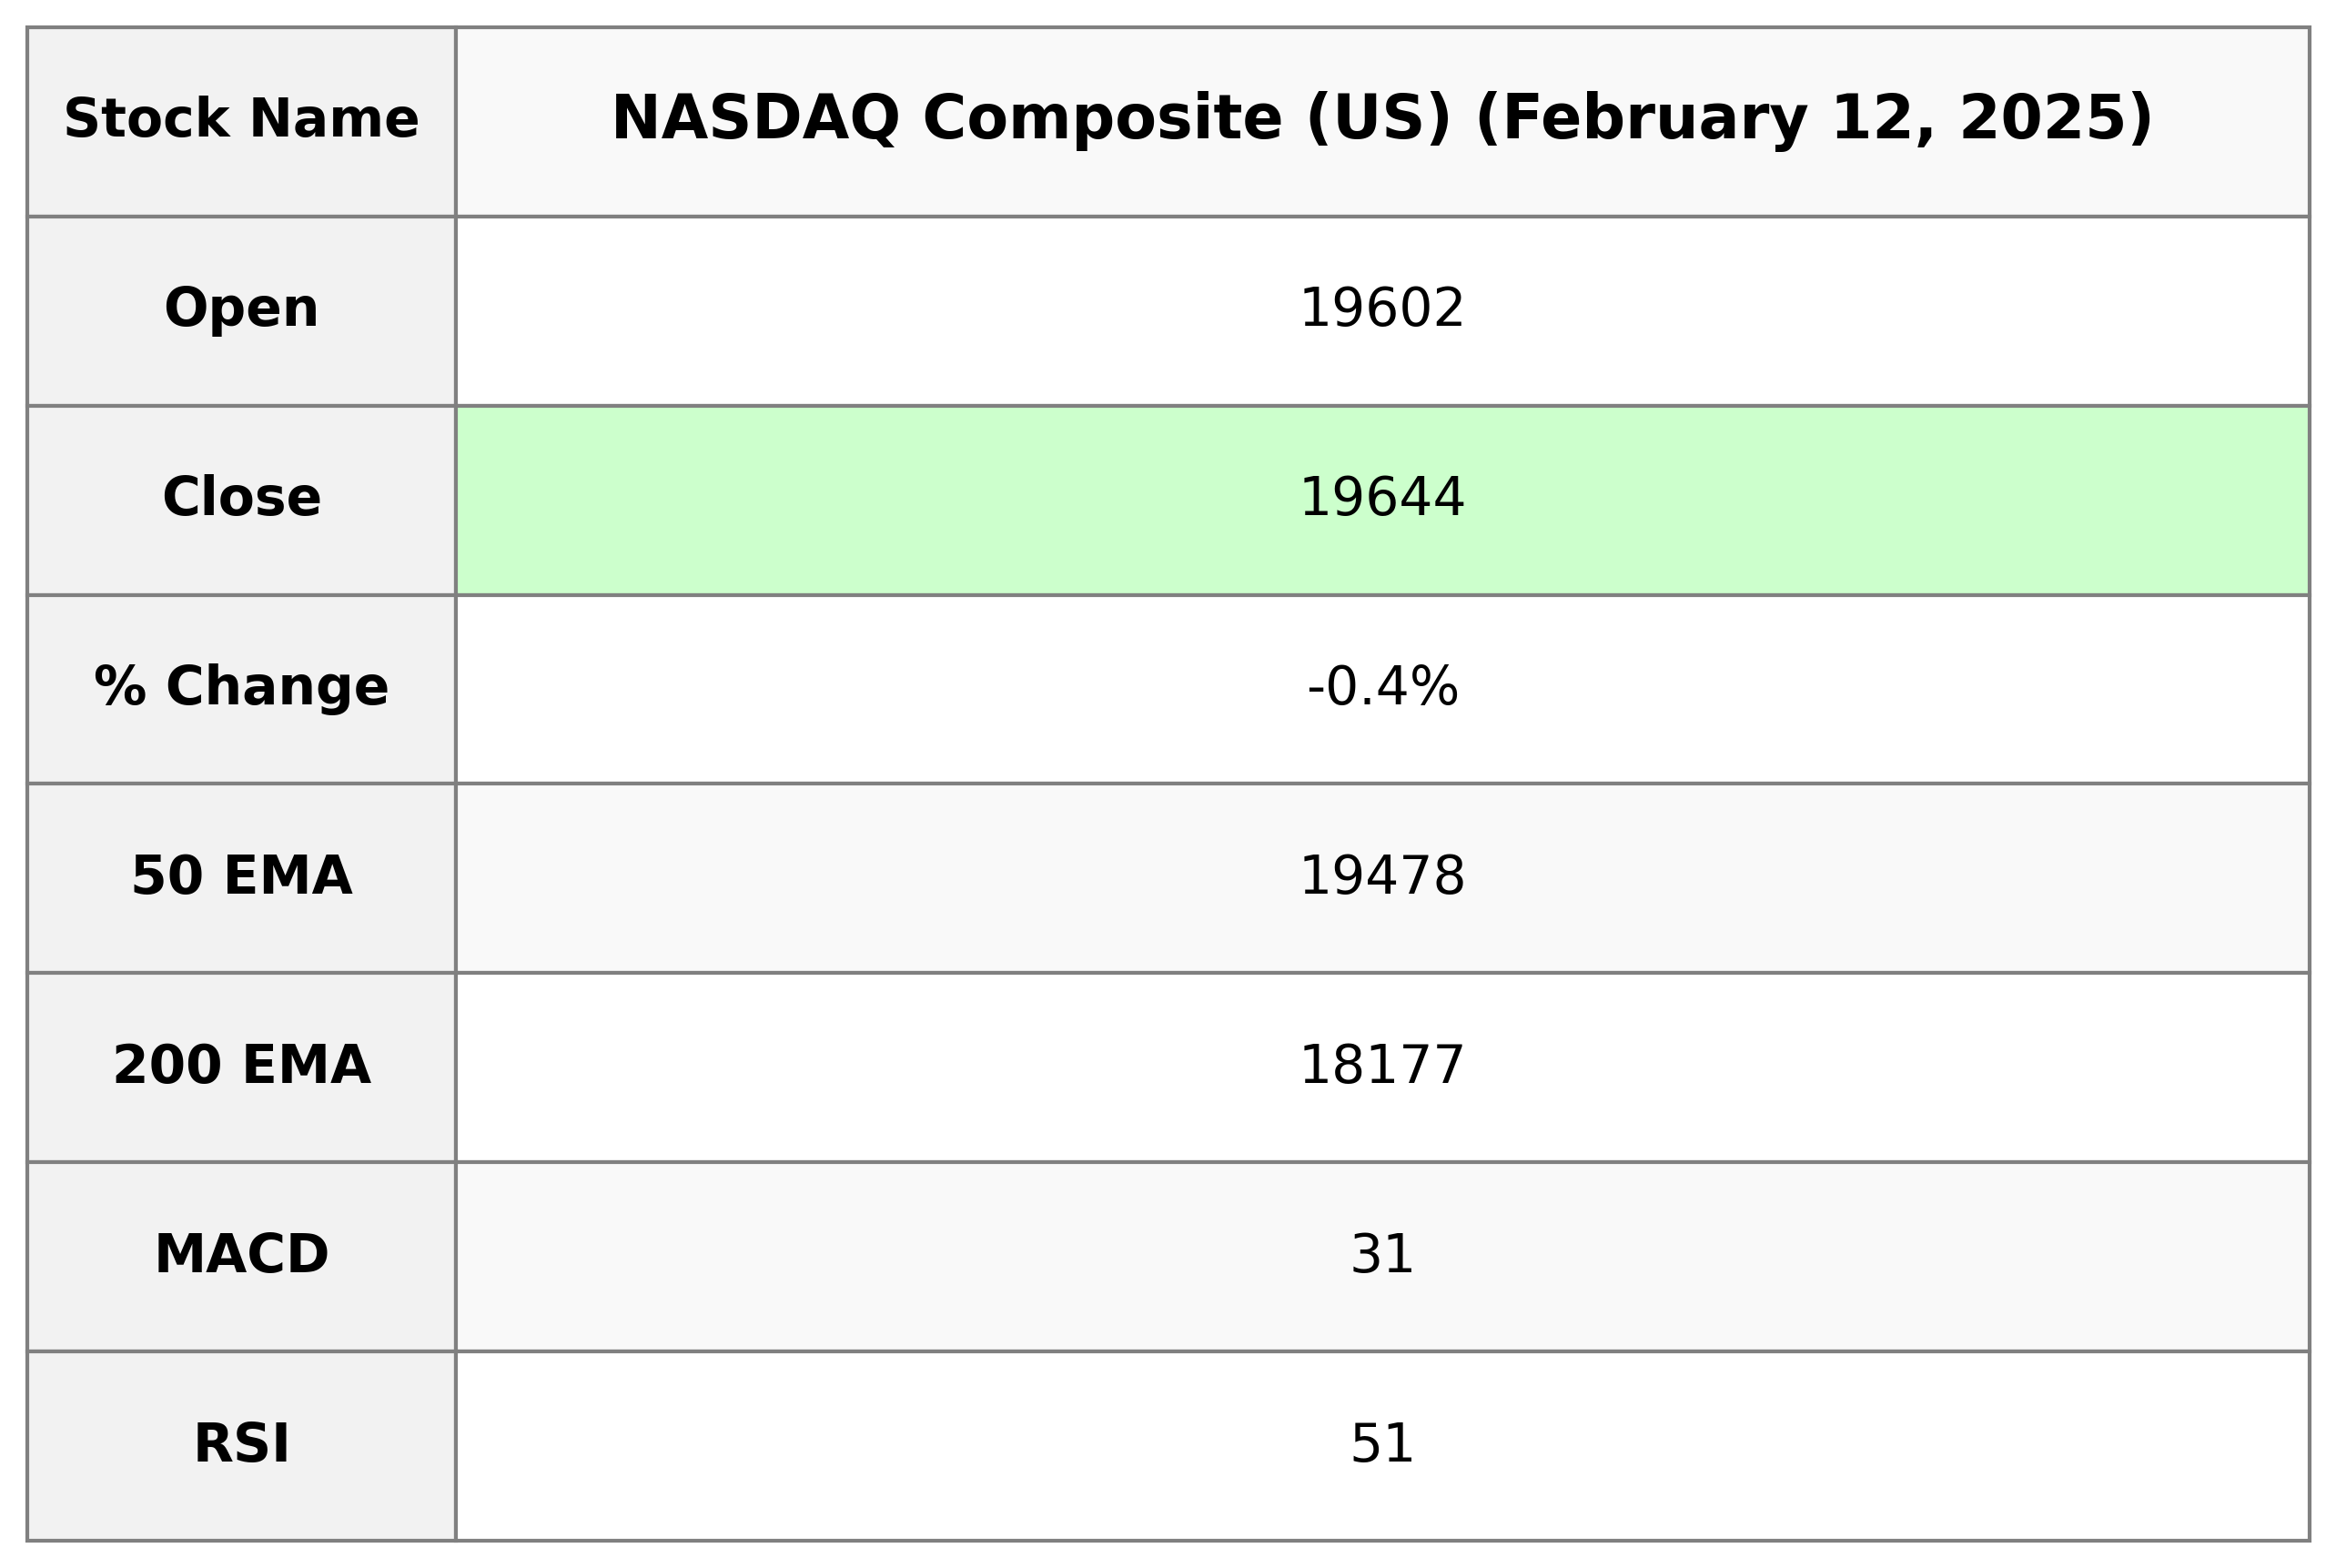
NASDAQ Composite (US) opened at 19,602.11, reached a high of 19,731.93, and closed at 19,643.86 with a decline of 0.36% from the previous close of 19,714.27. The index showed a slight bearish trend with a slight RSI of 50.69, neutral momentum signified by MACD of 31.14 below the signal line, and traded with high volume around 9.27 billion.
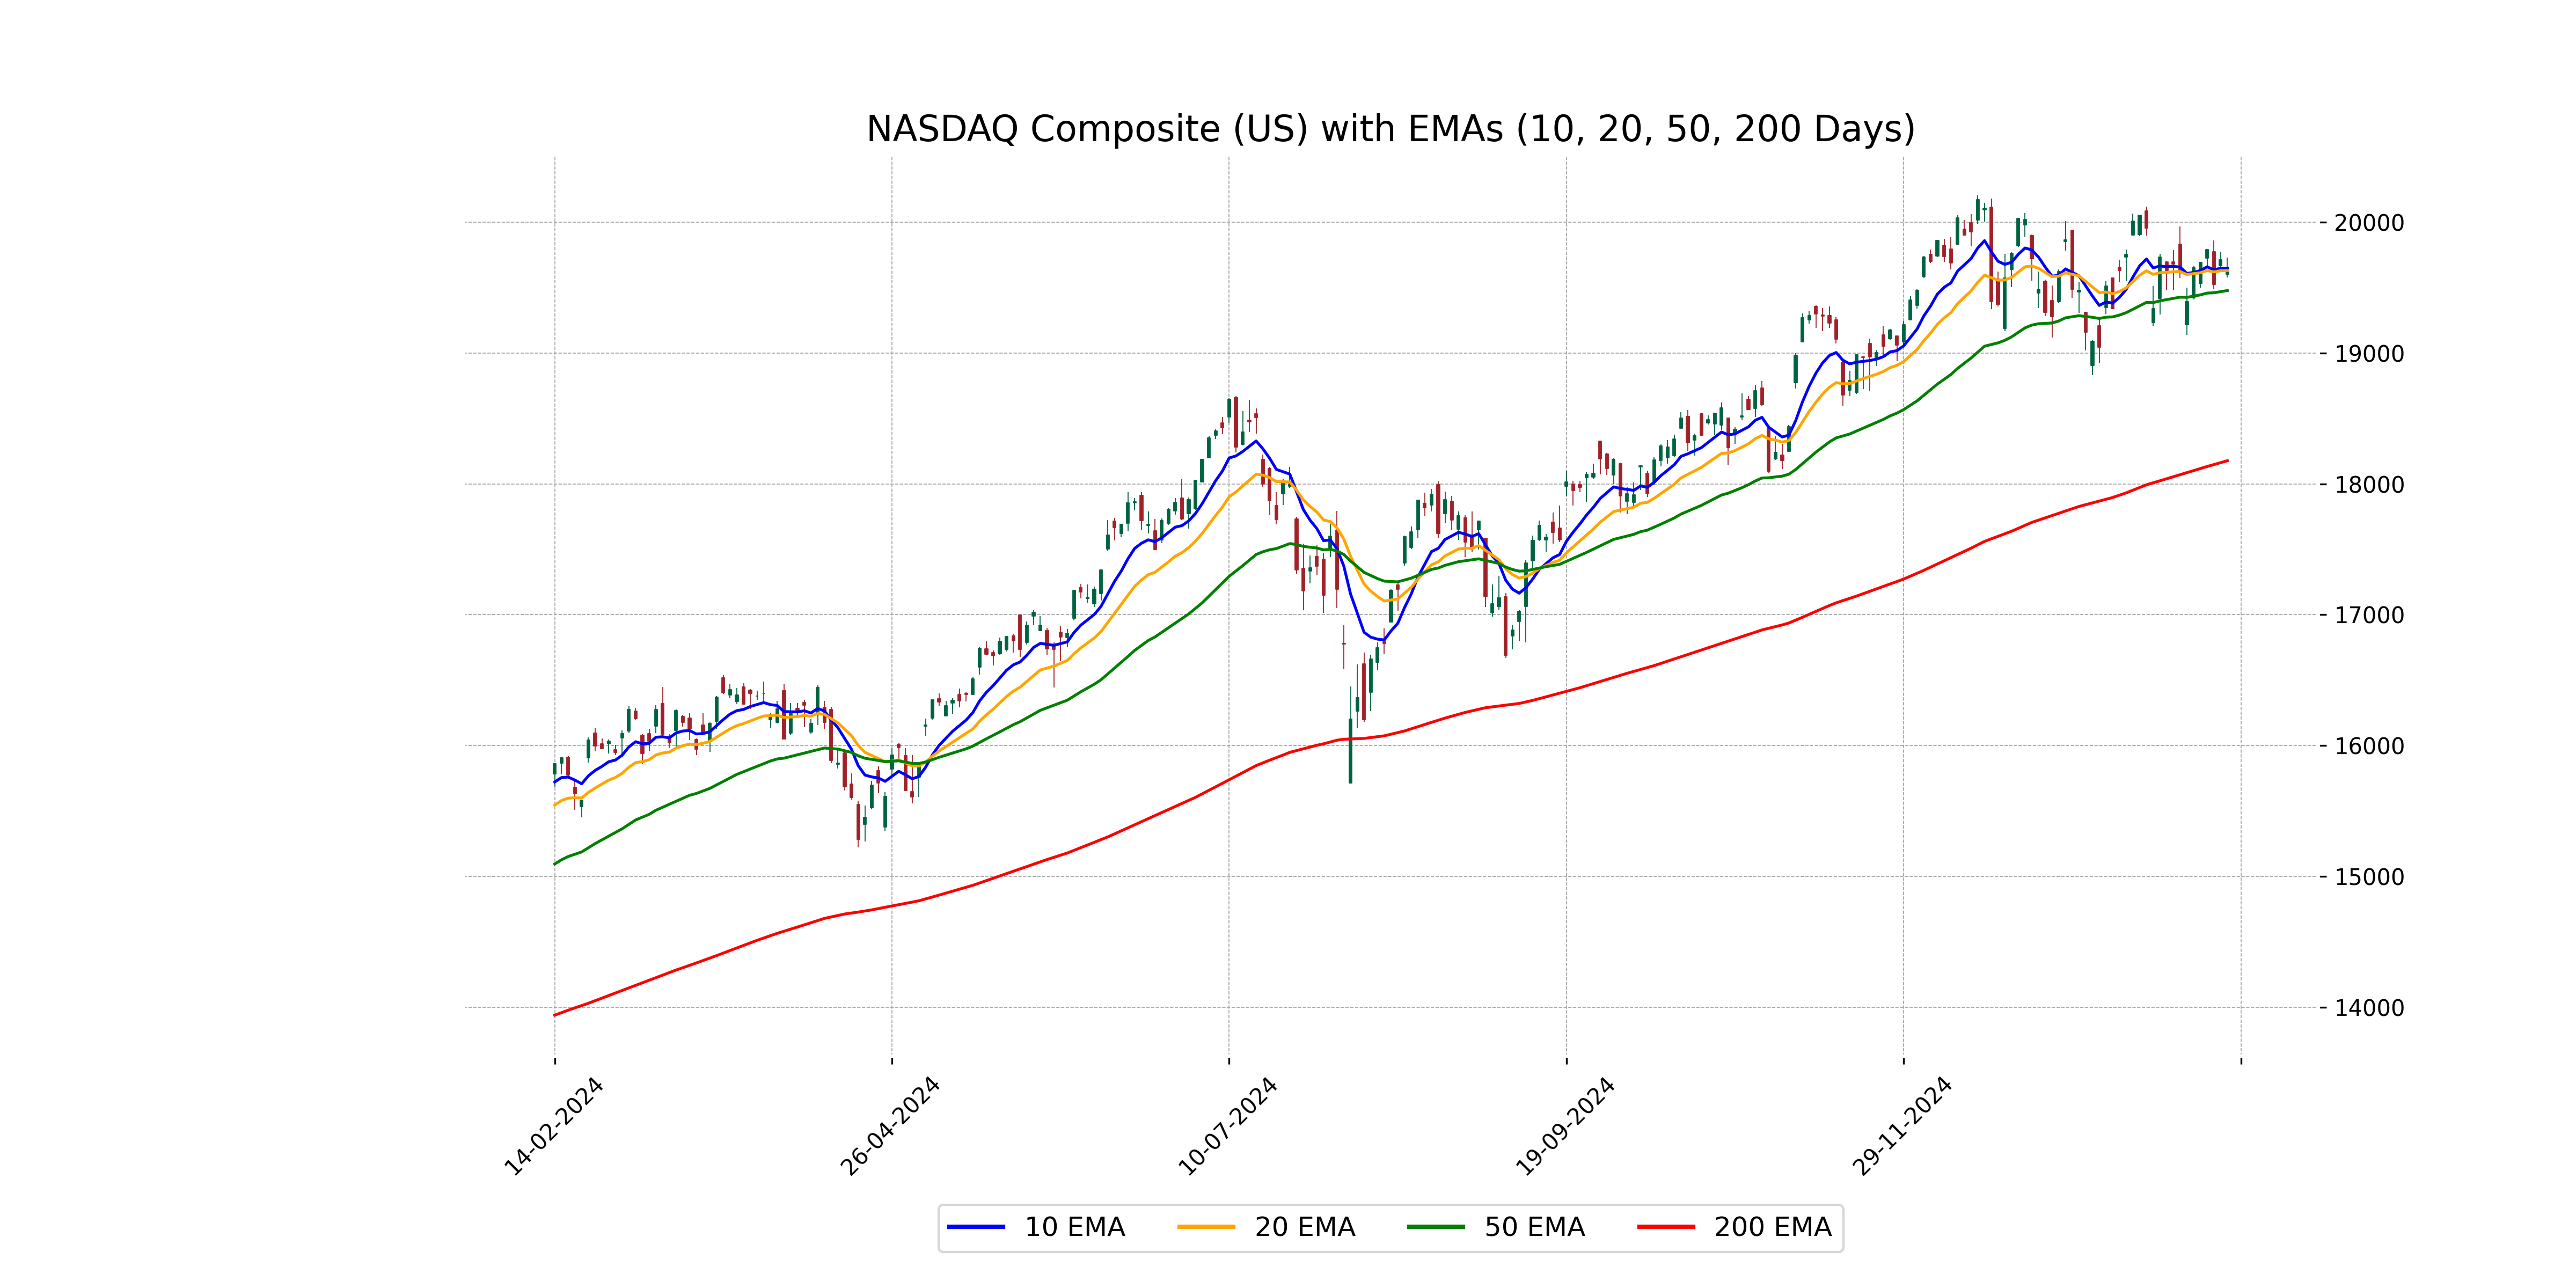
Relationship with Key Moving Averages
NASDAQ Composite (US) closed just below its 10-day EMA but above its 50-day EMA, indicating a short-term weakness while maintaining a larger upward trend. The close is significantly above the 200-day EMA, suggesting a long-term bullish outlook.
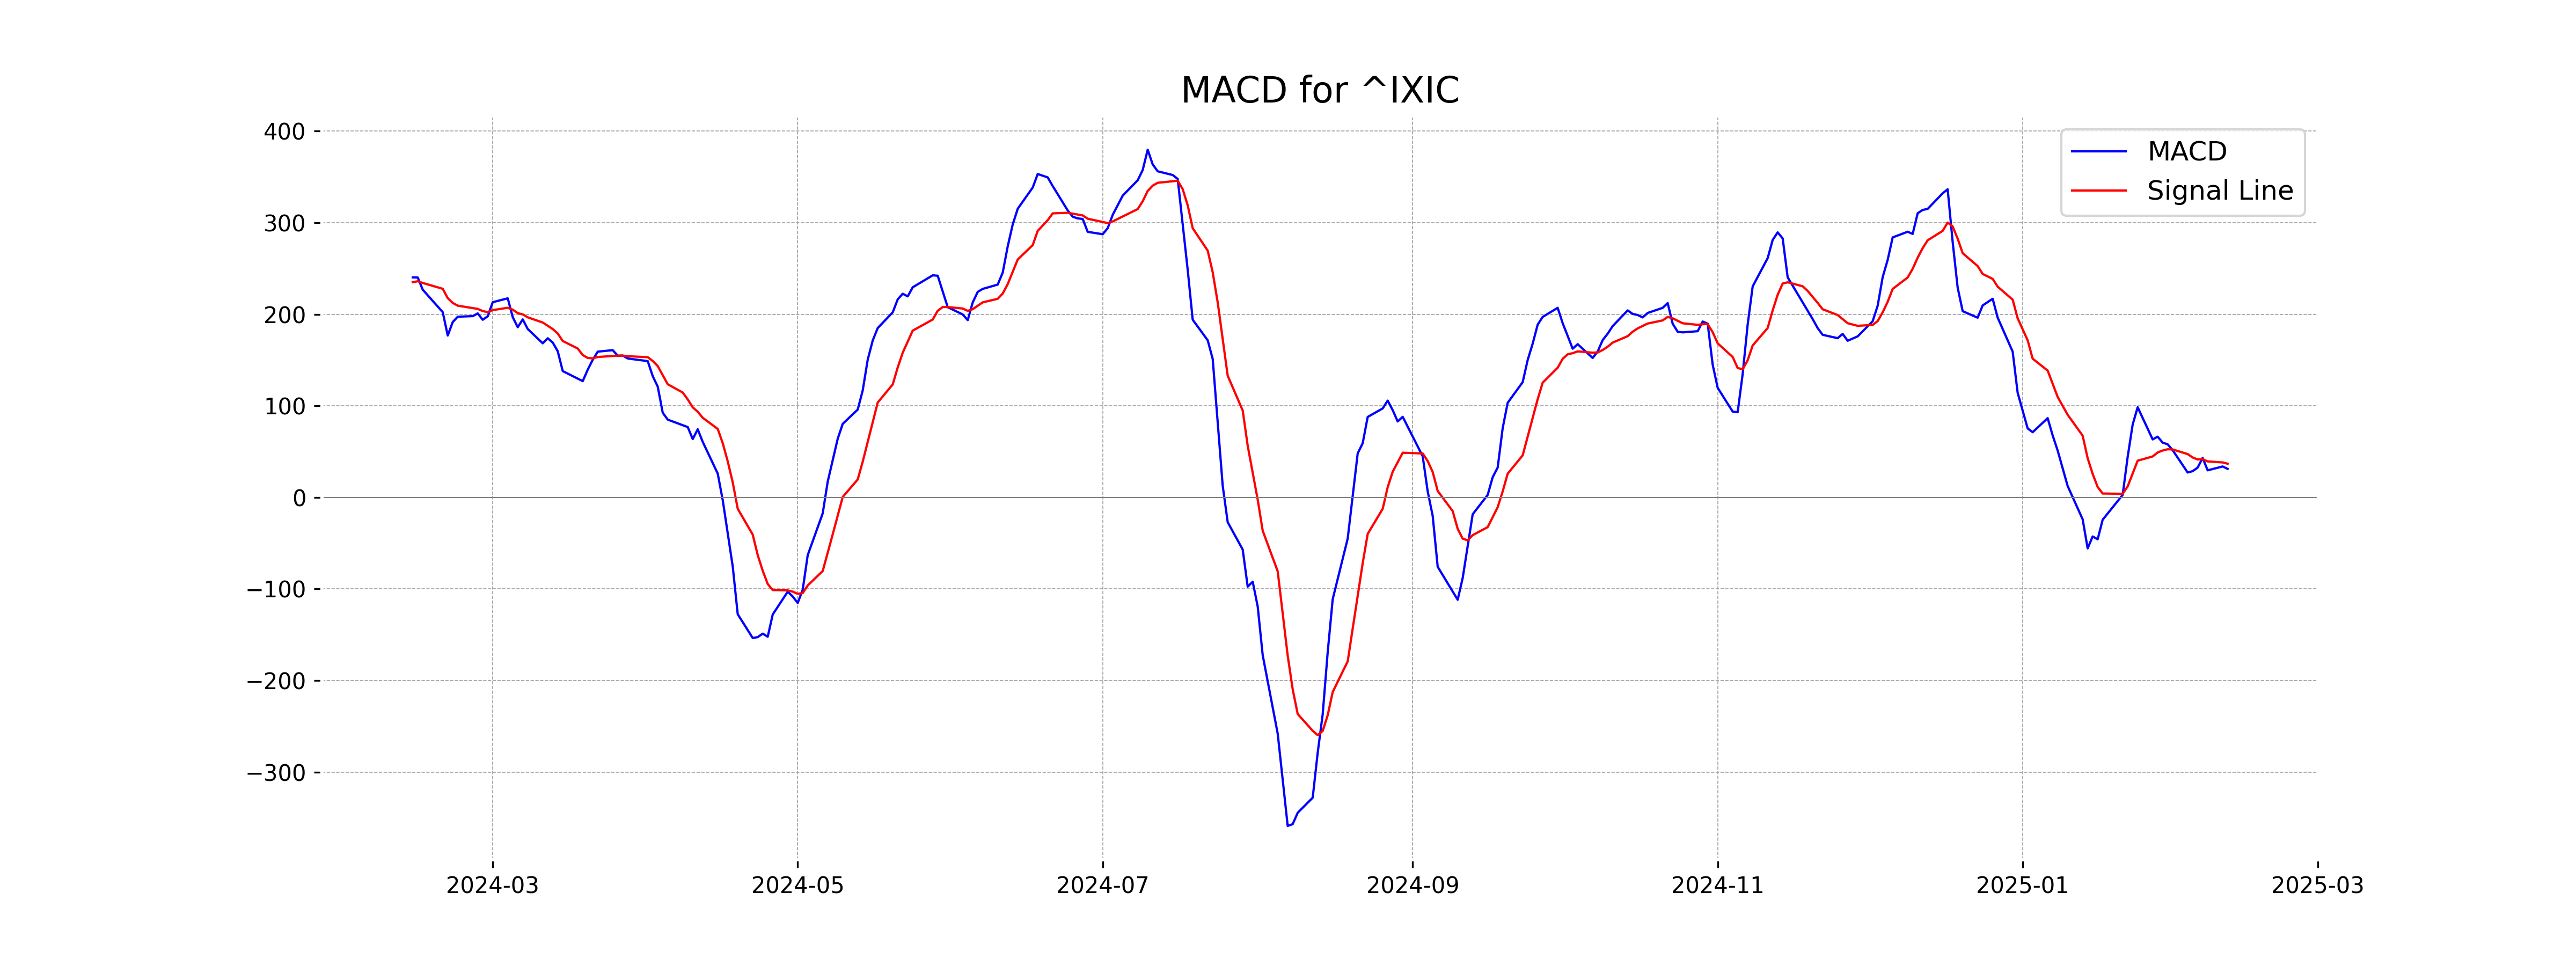
Moving Averages Trend (MACD)
The MACD for NASDAQ Composite is at 31.14, which is below the MACD Signal line at 36.81. This indicates a bearish signal or potential downtrend. Investors should consider this as a possible indicator of declining momentum.
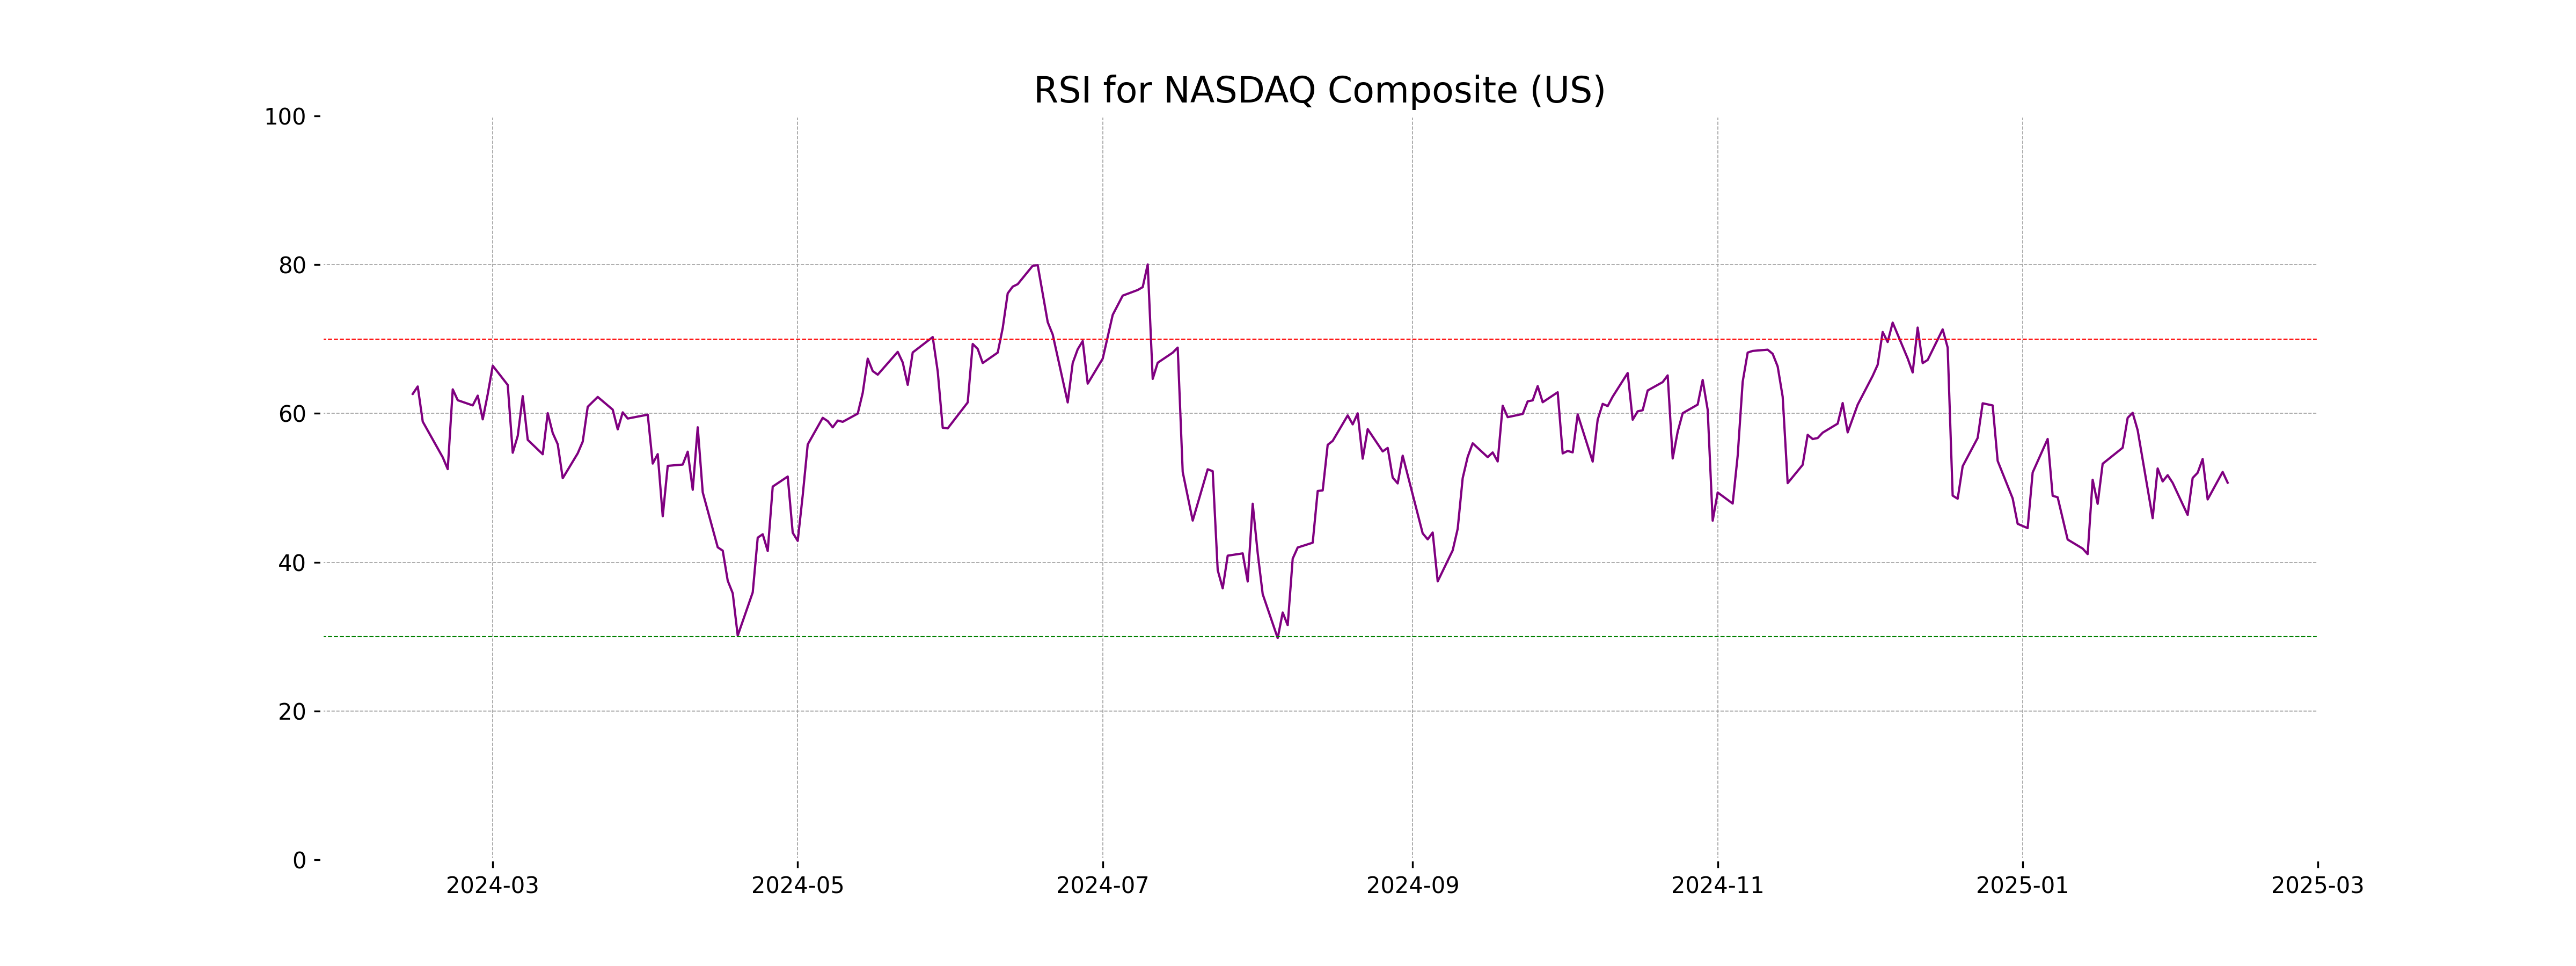
RSI Analysis
The RSI (Relative Strength Index) for the NASDAQ Composite stands at approximately 50.69, which indicates a neutral position and suggests that the index is neither overbought nor oversold. This suggests that the market could move in either direction, with no strong momentum currently evident.
Analysis for Nikkei 225 (Japan) - February 12, 2025
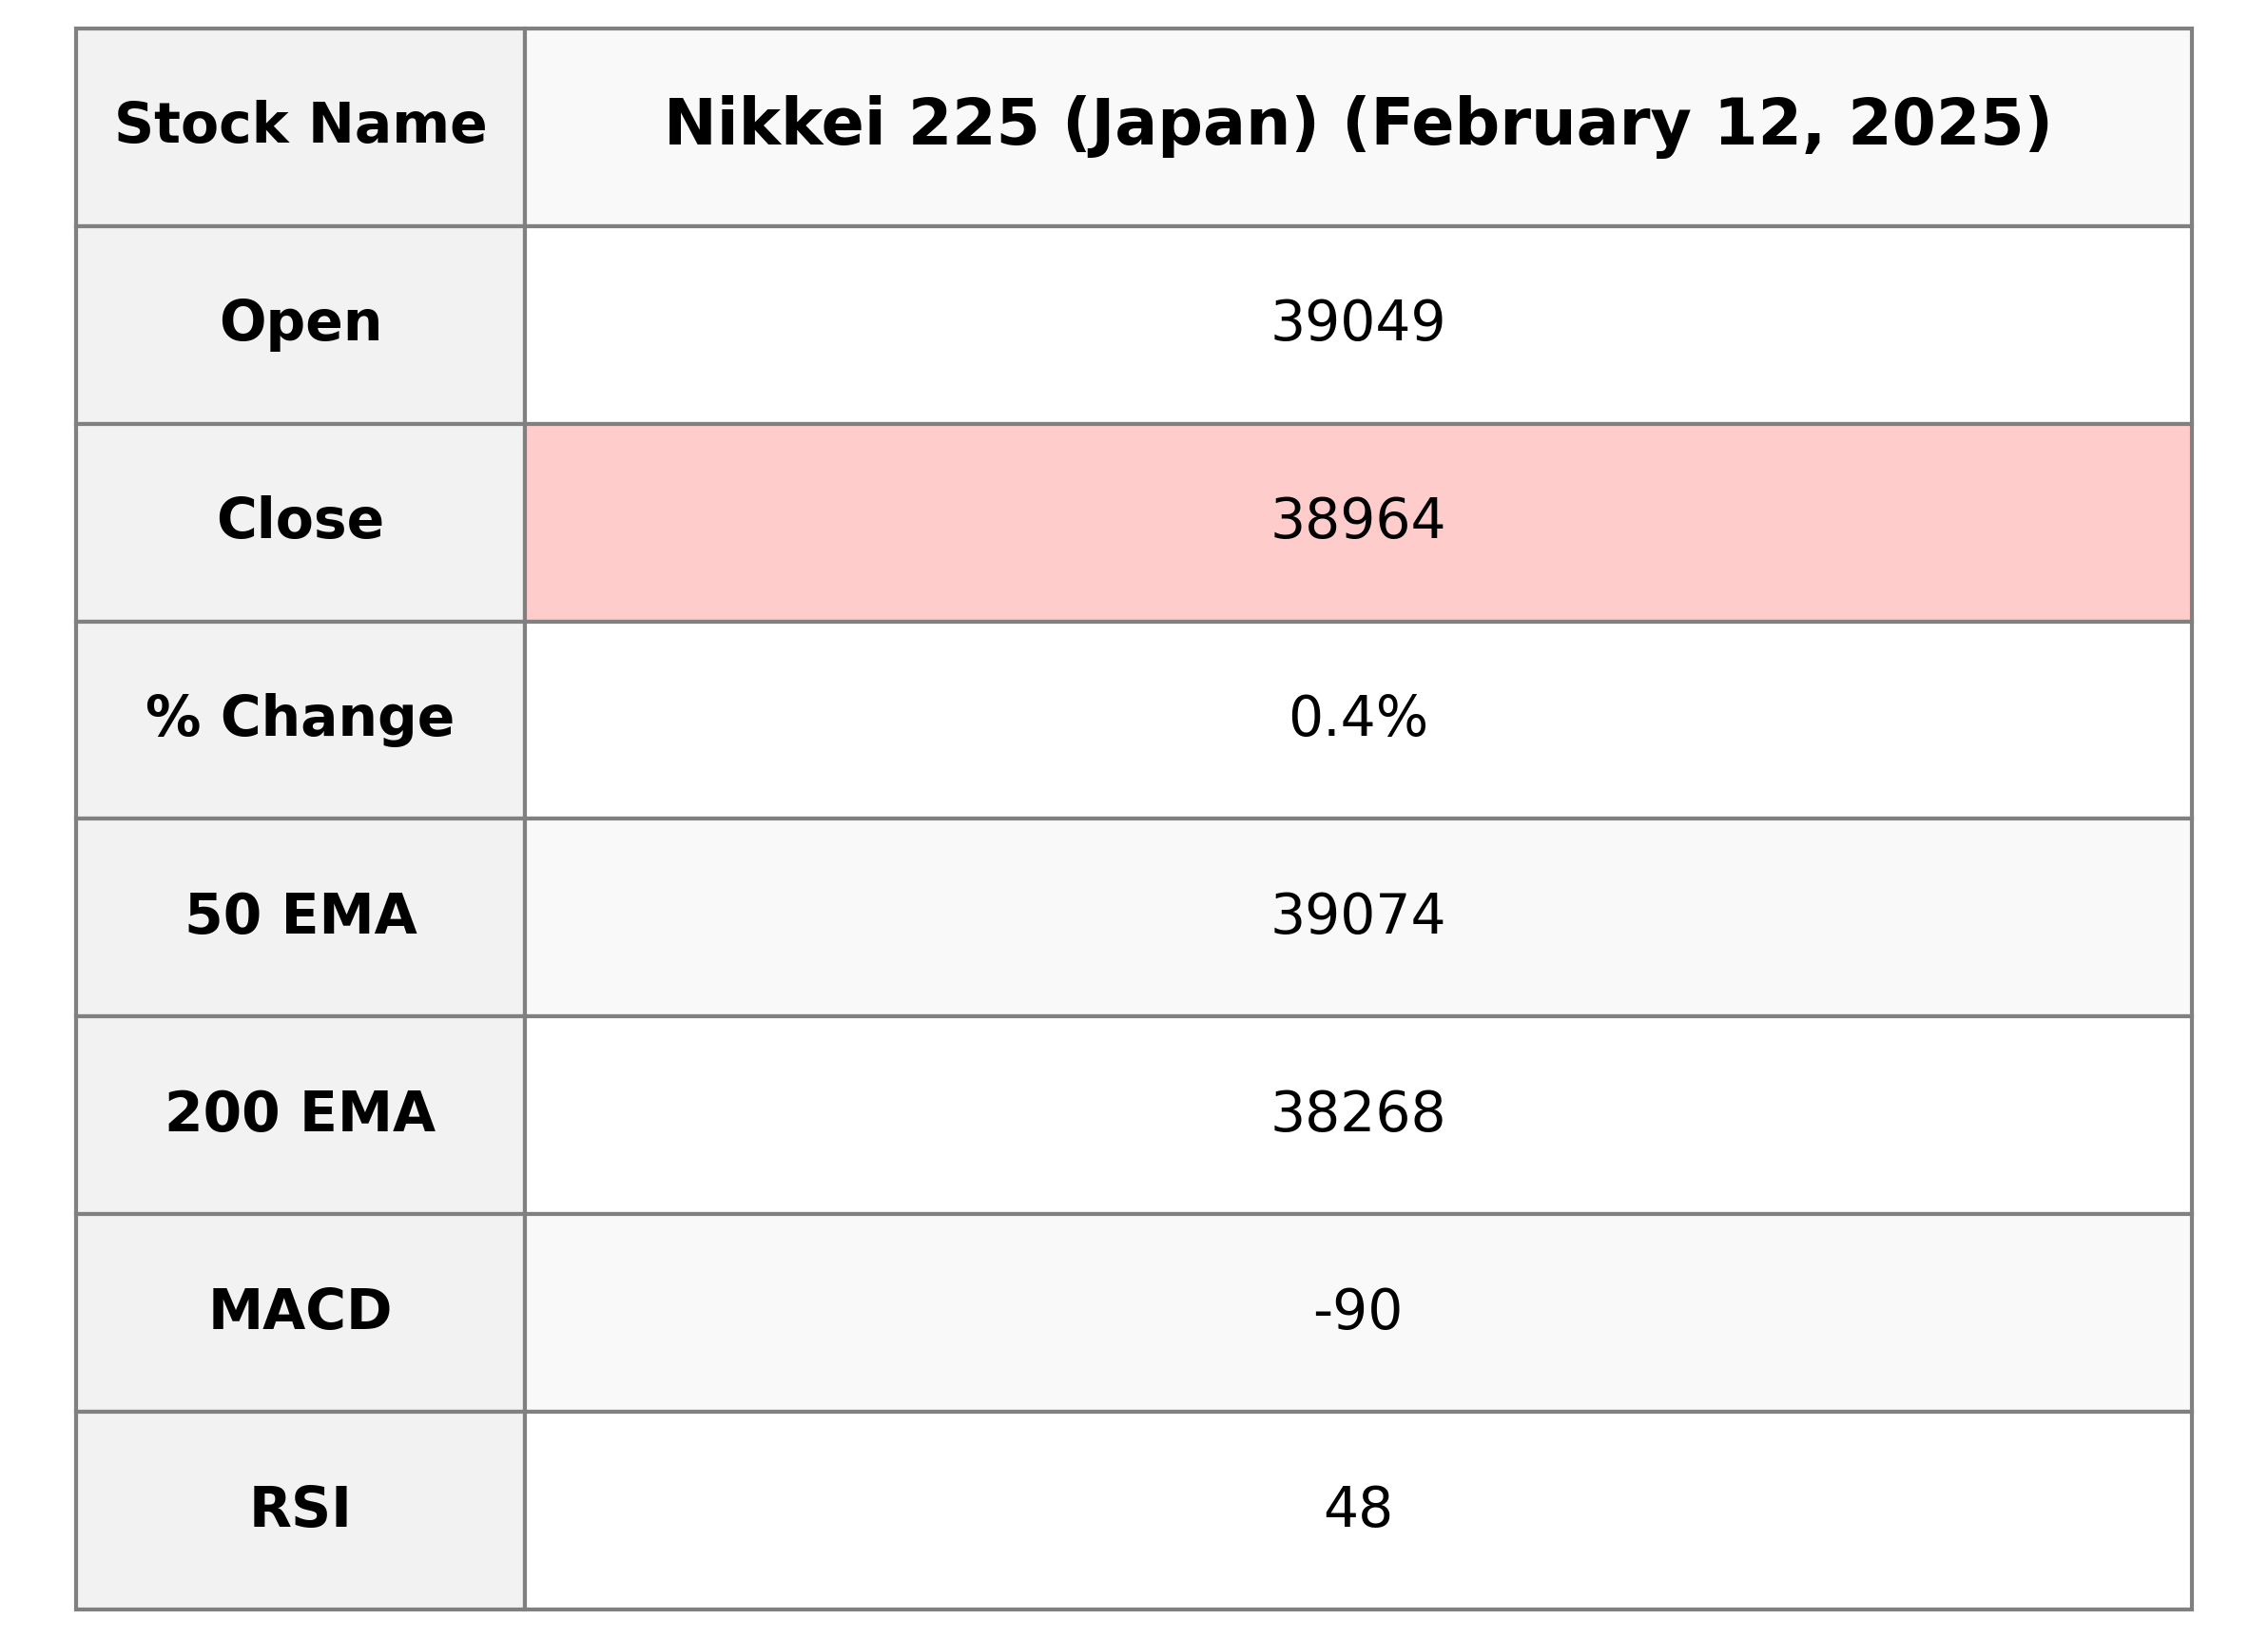
Nikkei 225 (Japan) opened at 39,049.12, reached a high of 39,102.65, and a low of 38,794.24 before closing at 38,963.70. The index saw a points change of 162.53 from the previous close, with a slight percentage increase of 0.42%. Notably, the RSI indicates neutrality at 48, and the MACD is showing a bearish signal with a value of -89.54.
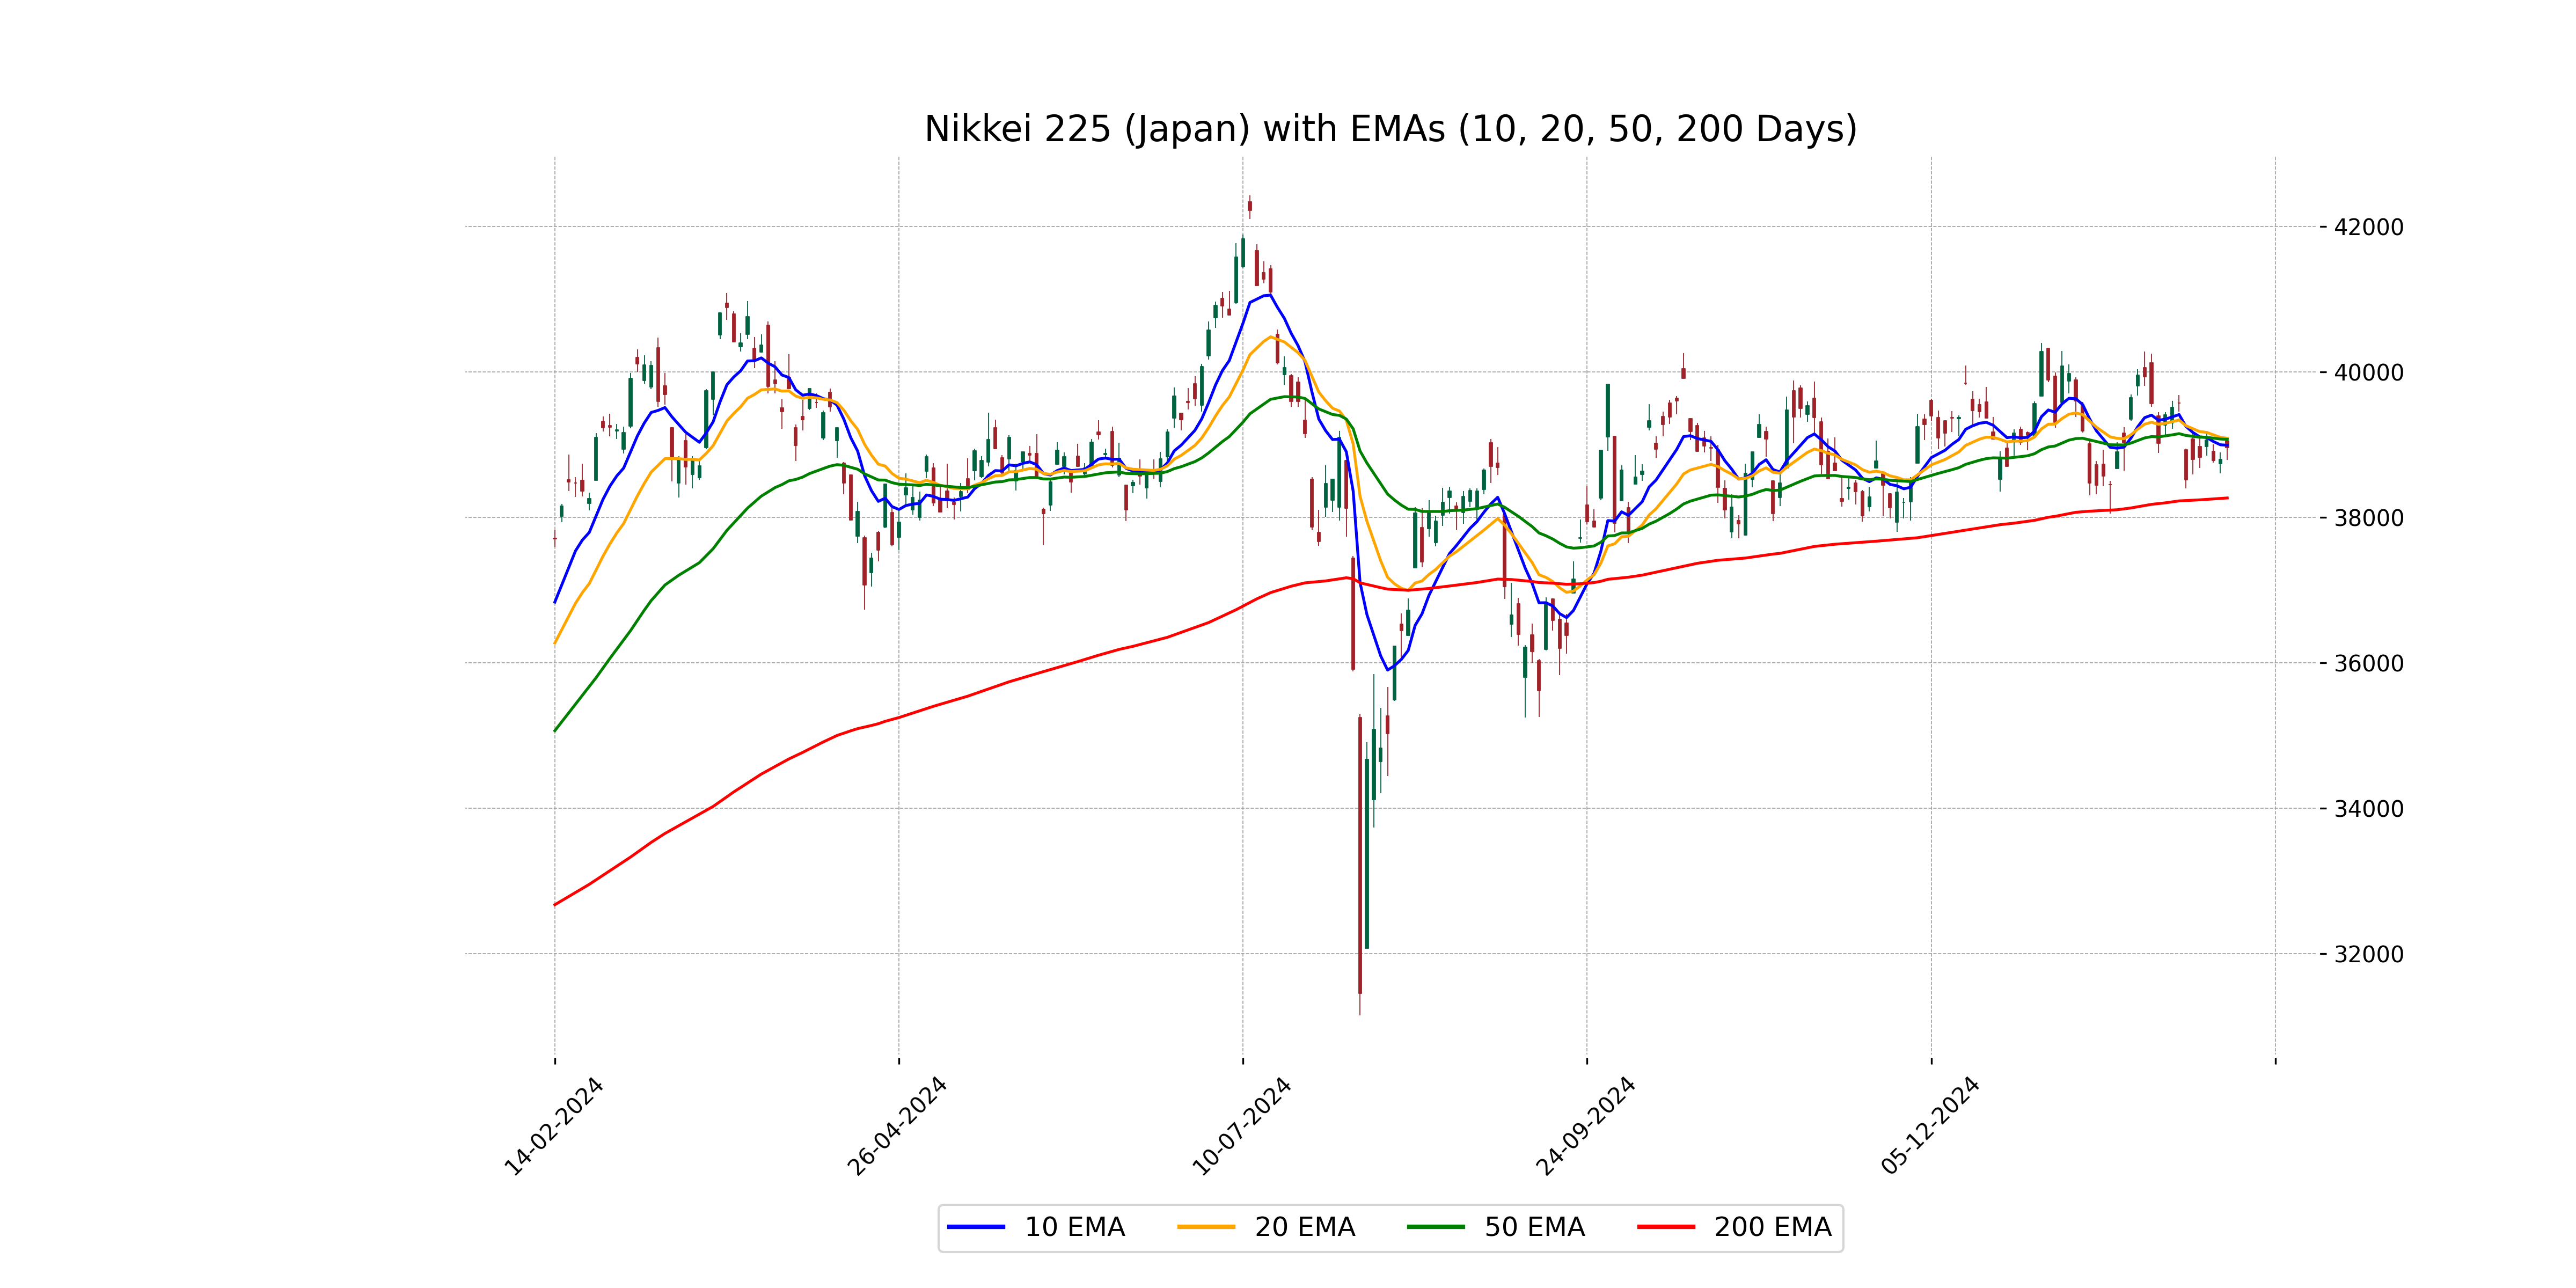
Relationship with Key Moving Averages
The Nikkei 225's current closing price of 38,963.70 is below its 50-day EMA of 39,074.32 and 20-day EMA of 39,088.76, suggesting potential short-term bearish sentiment. However, it remains above its 200-day EMA of 38,268.18, indicating a longer-term bullish trend.
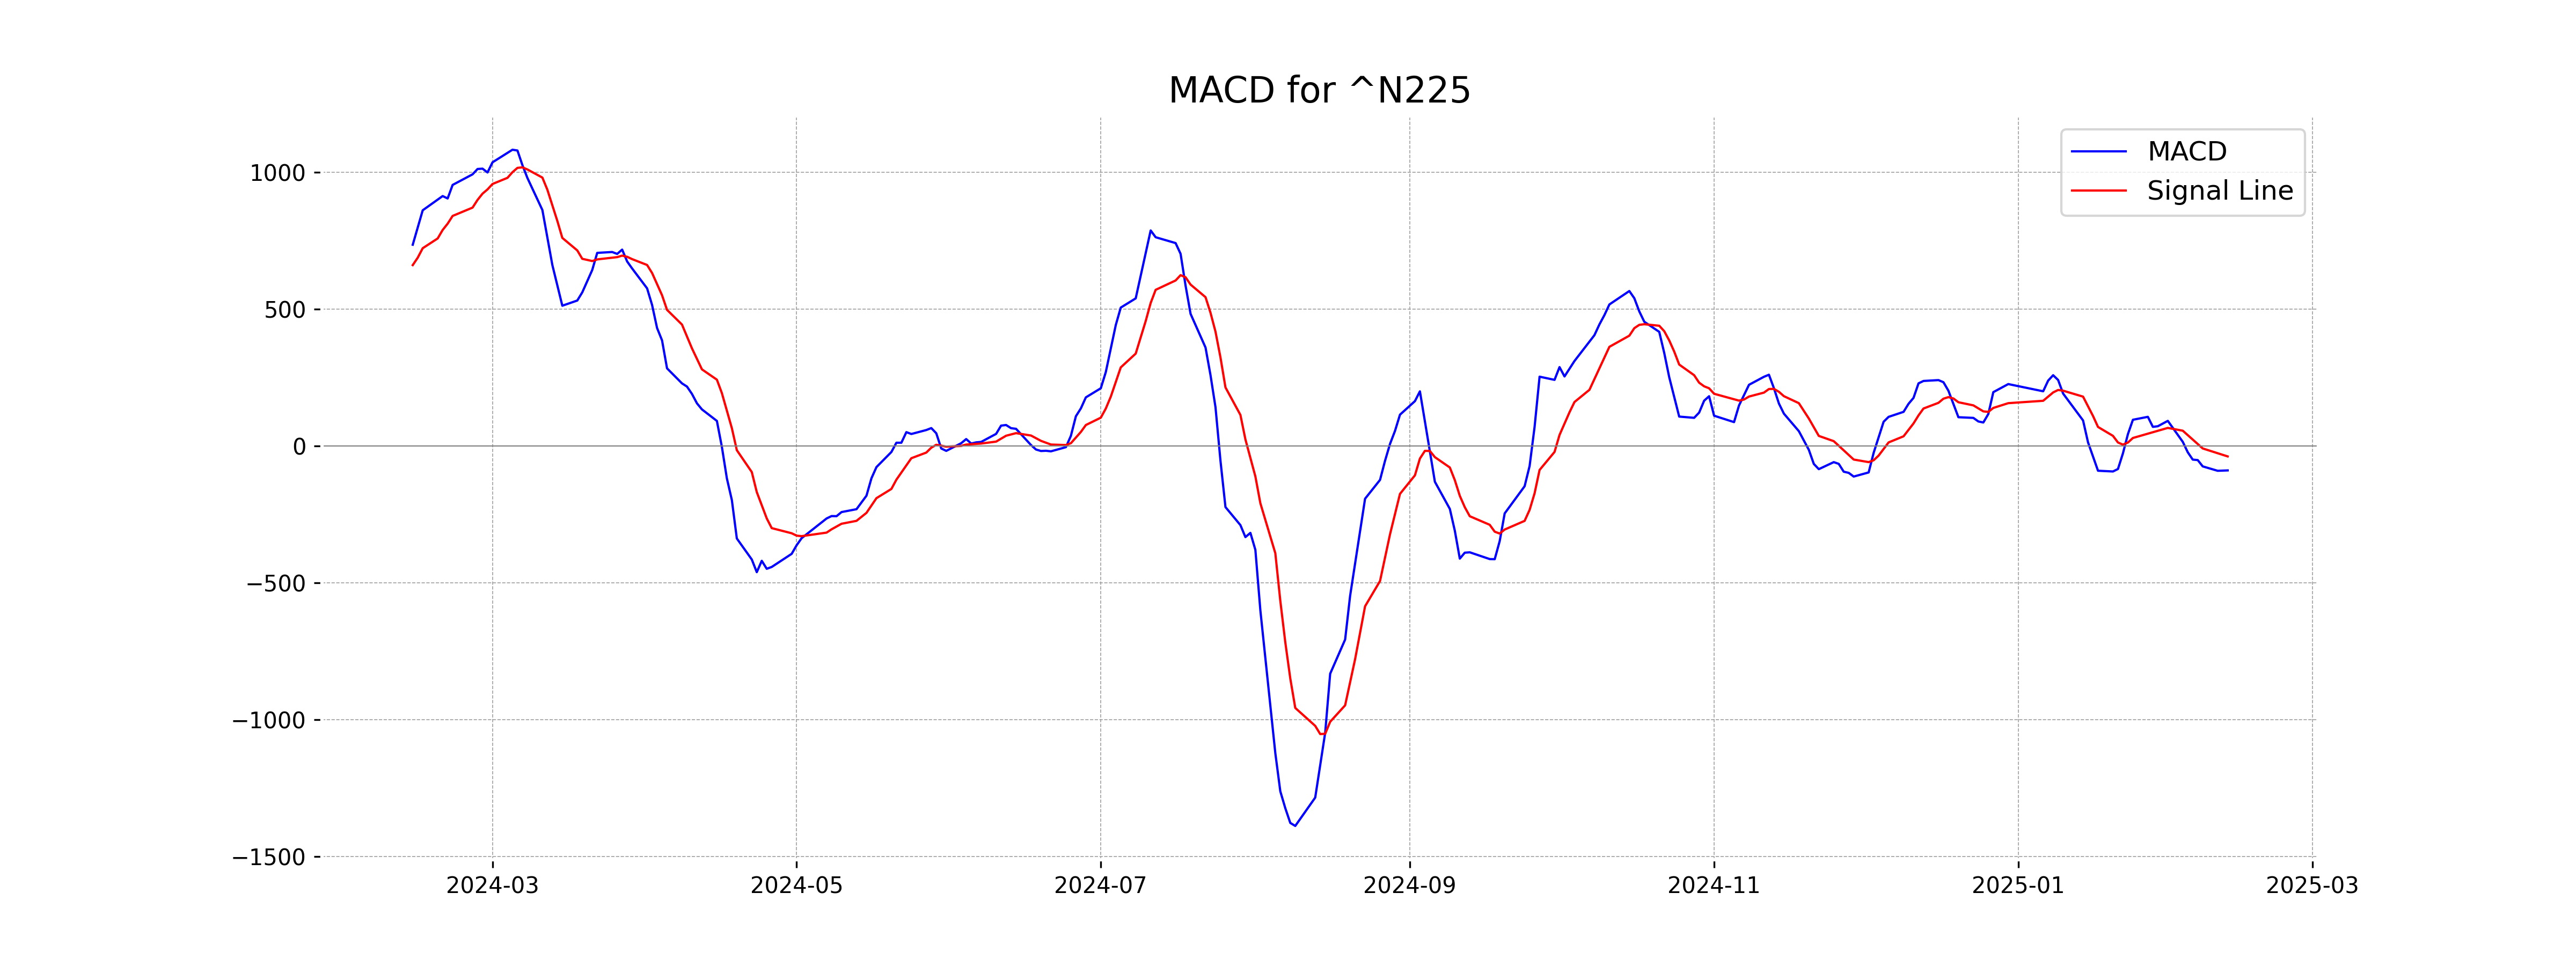
Moving Averages Trend (MACD)
The MACD value for Nikkei 225 (Japan) is -89.54, which is below its MACD Signal line of -38.42. This indicates a bearish trend, suggesting potential downward momentum in the market.
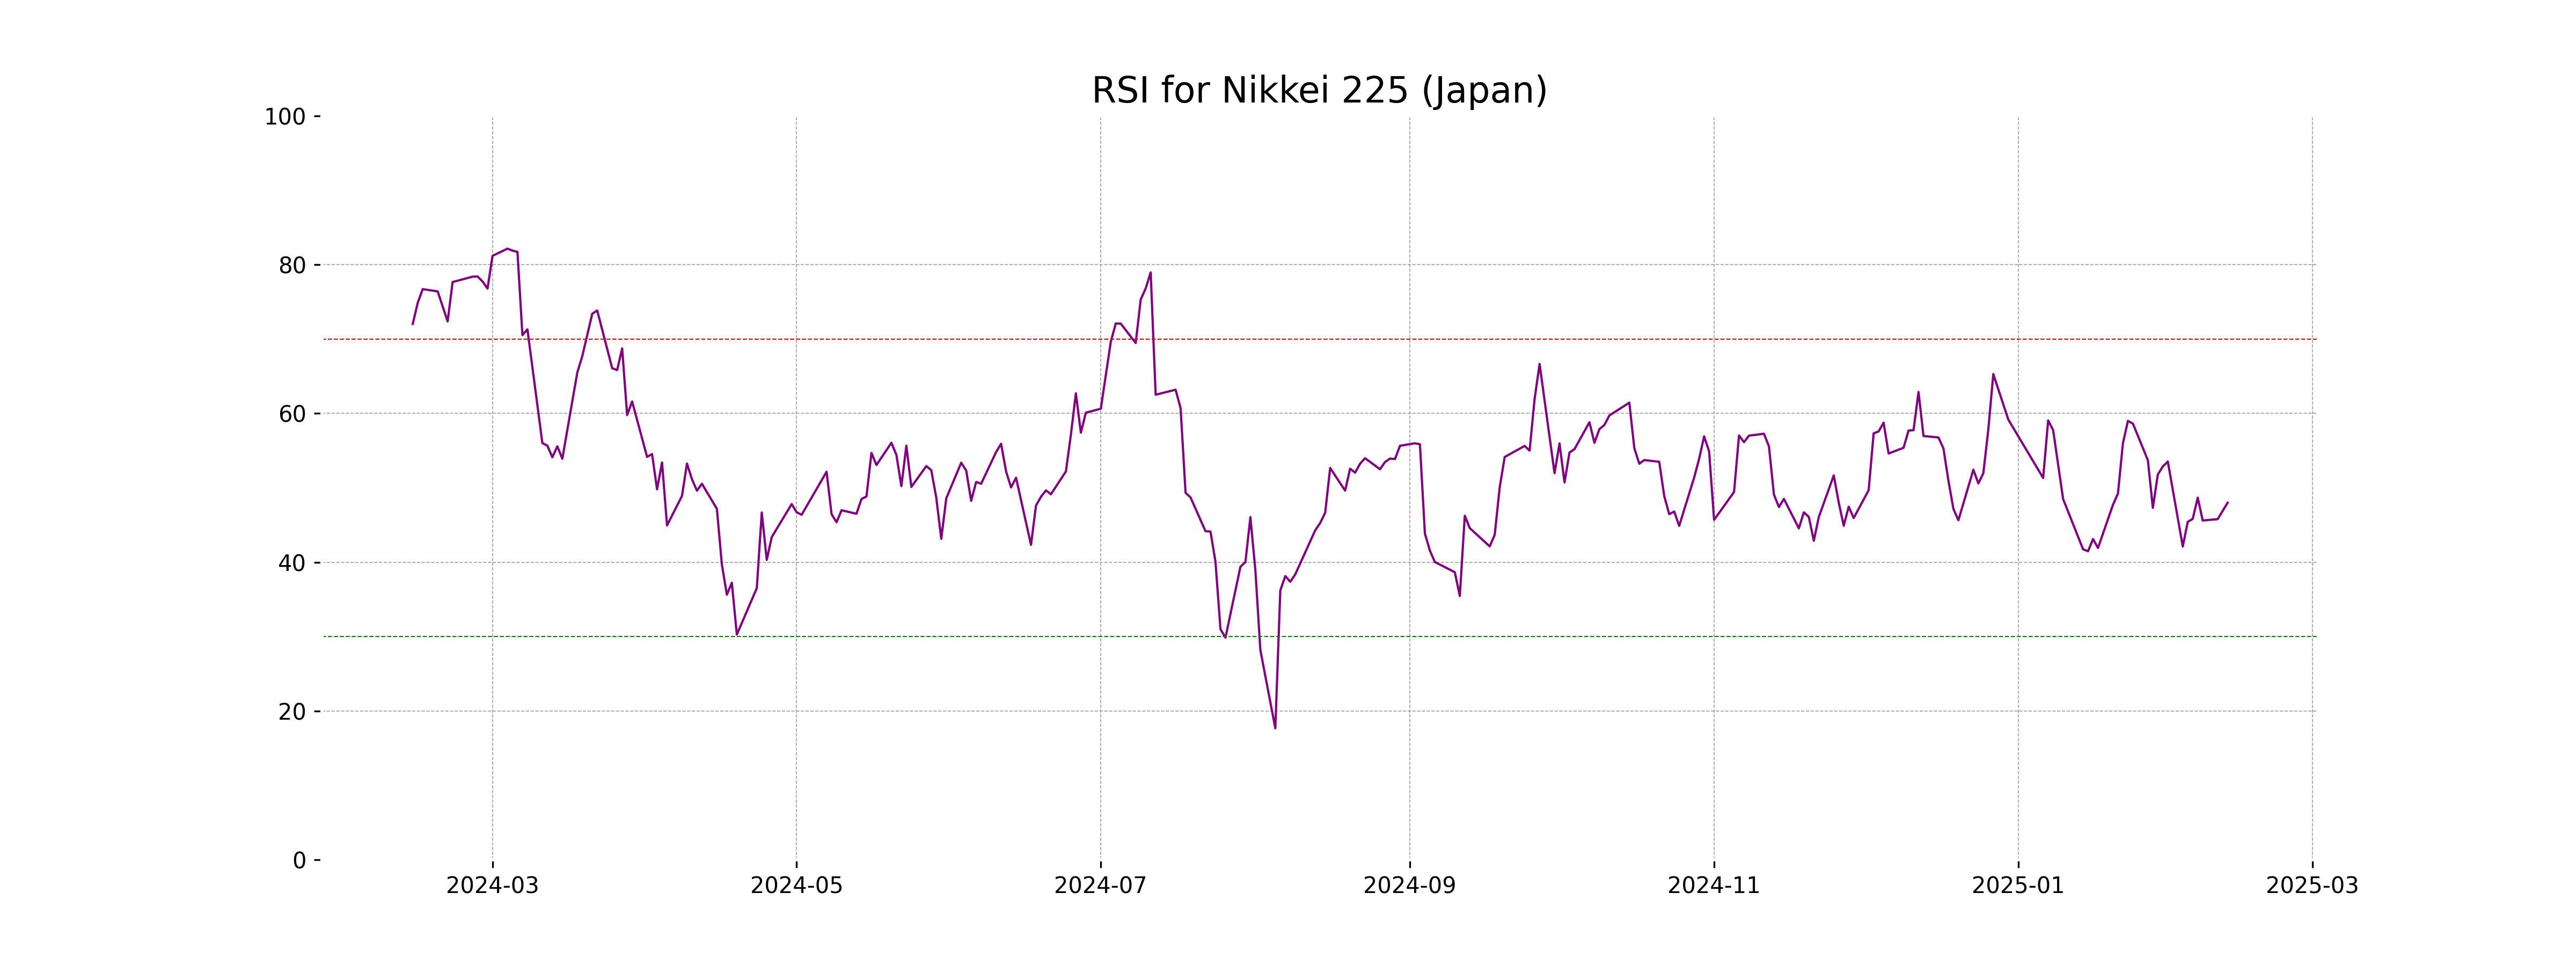
RSI Analysis
The RSI for Nikkei 225 is 48.00, indicating a market that is relatively neutral without any clear overbought or oversold conditions. An RSI around 50 suggests consolidation, and traders might wait for further price action for clearer direction.
Analysis for Nifty Bank - February 12, 2025
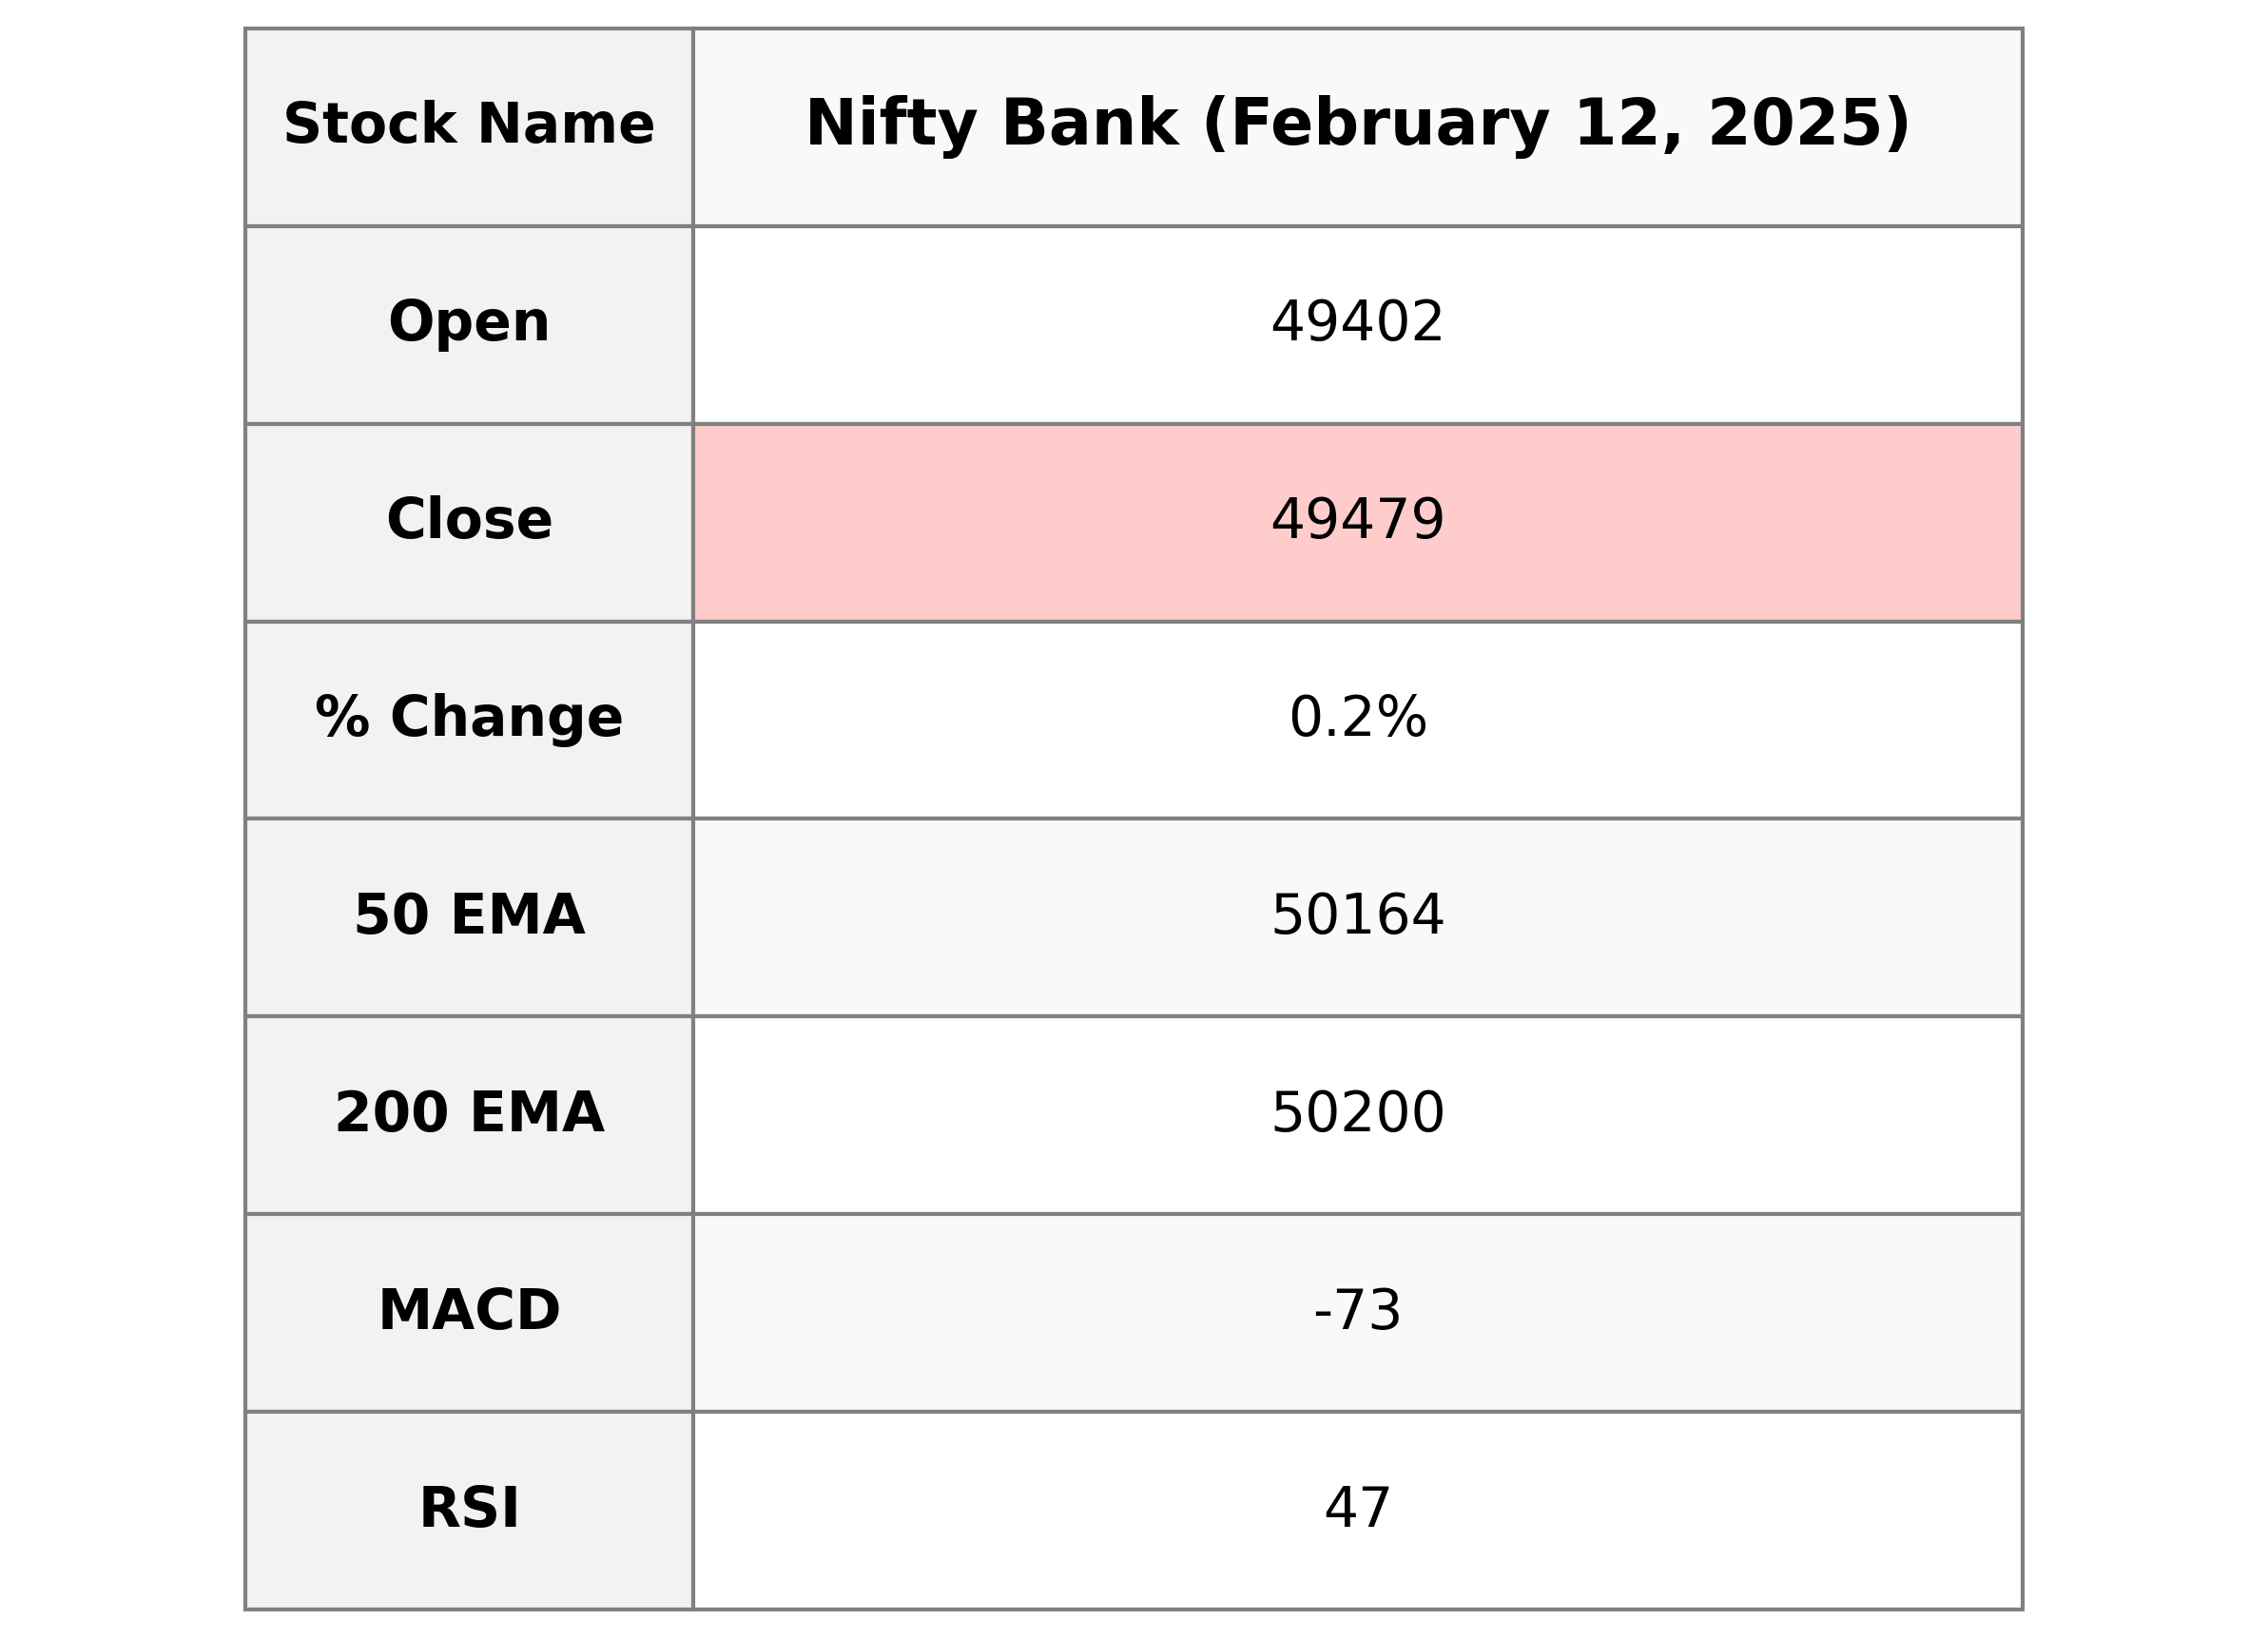
Nifty Bank opened at 49402.25, reached a high of 49702.35, and closed at 49479.45, resulting in a minor gain of 0.15% from the previous close. The Relative Strength Index (RSI) is at 47.45, indicating neutral momentum, while both the 50 and 200-day EMAs show a downtrend with prices below these moving averages.
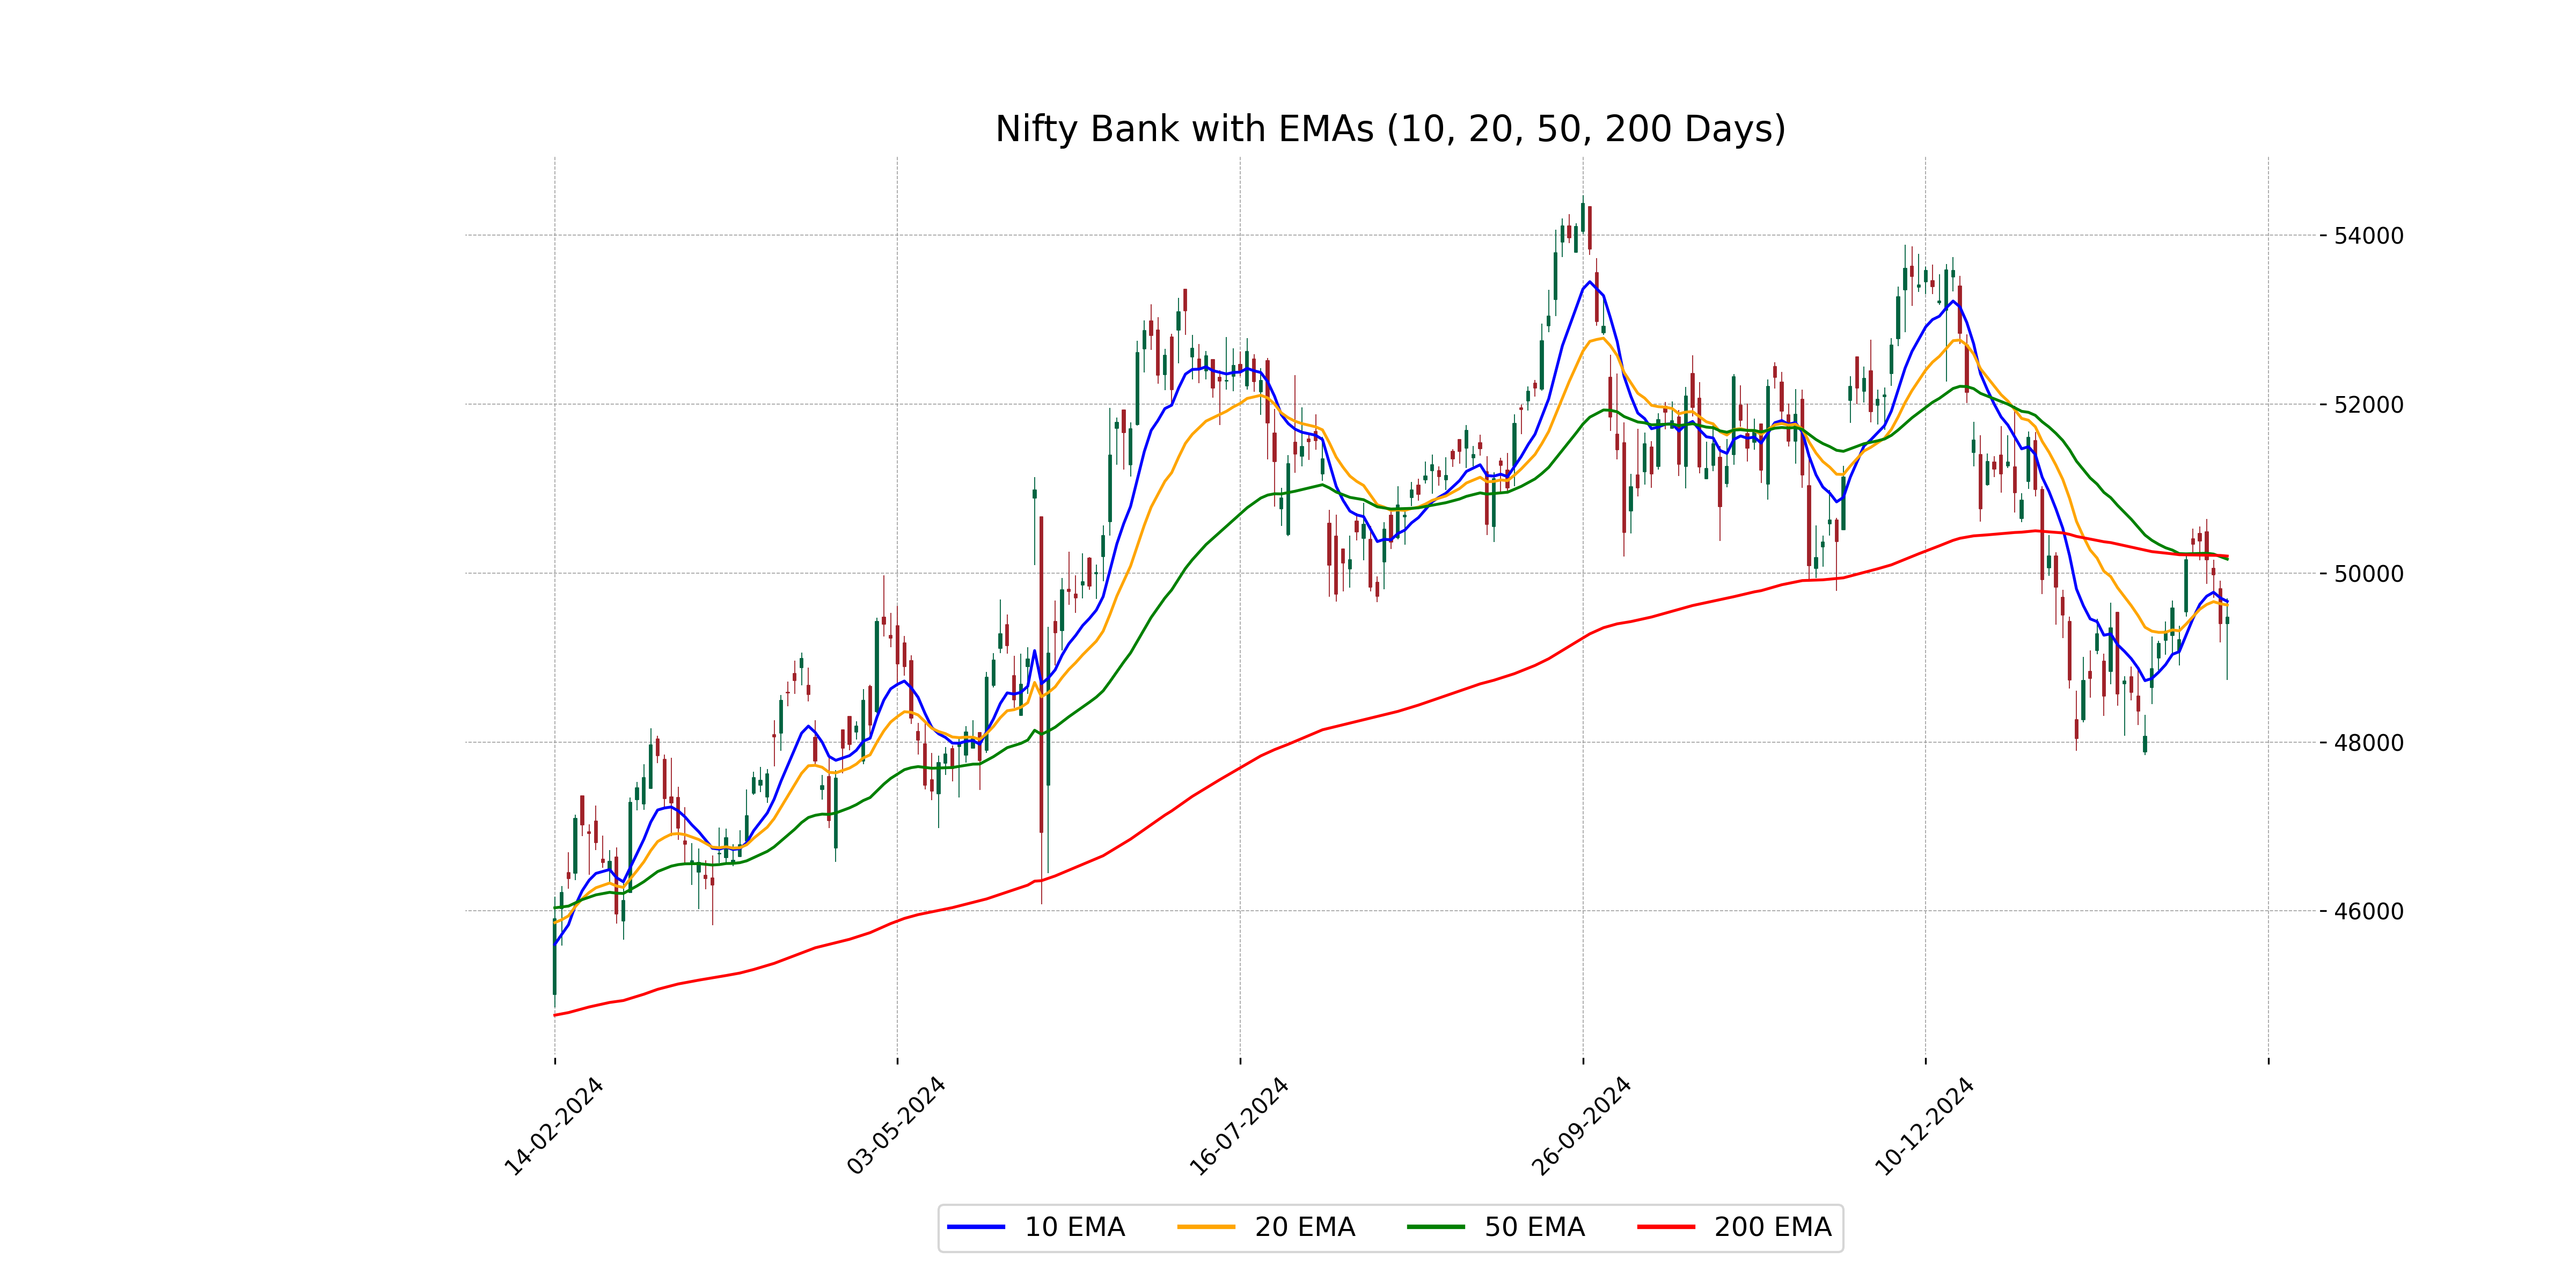
Relationship with Key Moving Averages
The current close of Nifty Bank is 49,479.45, which is below its 50-day EMA of 50,163.95 and 200-day EMA of 50,200.45, indicating a potential bearish trend. However, it is above the 10-day EMA of 49,664.18 and the 20-day EMA of 49,621.41, suggesting short-term bullish momentum.
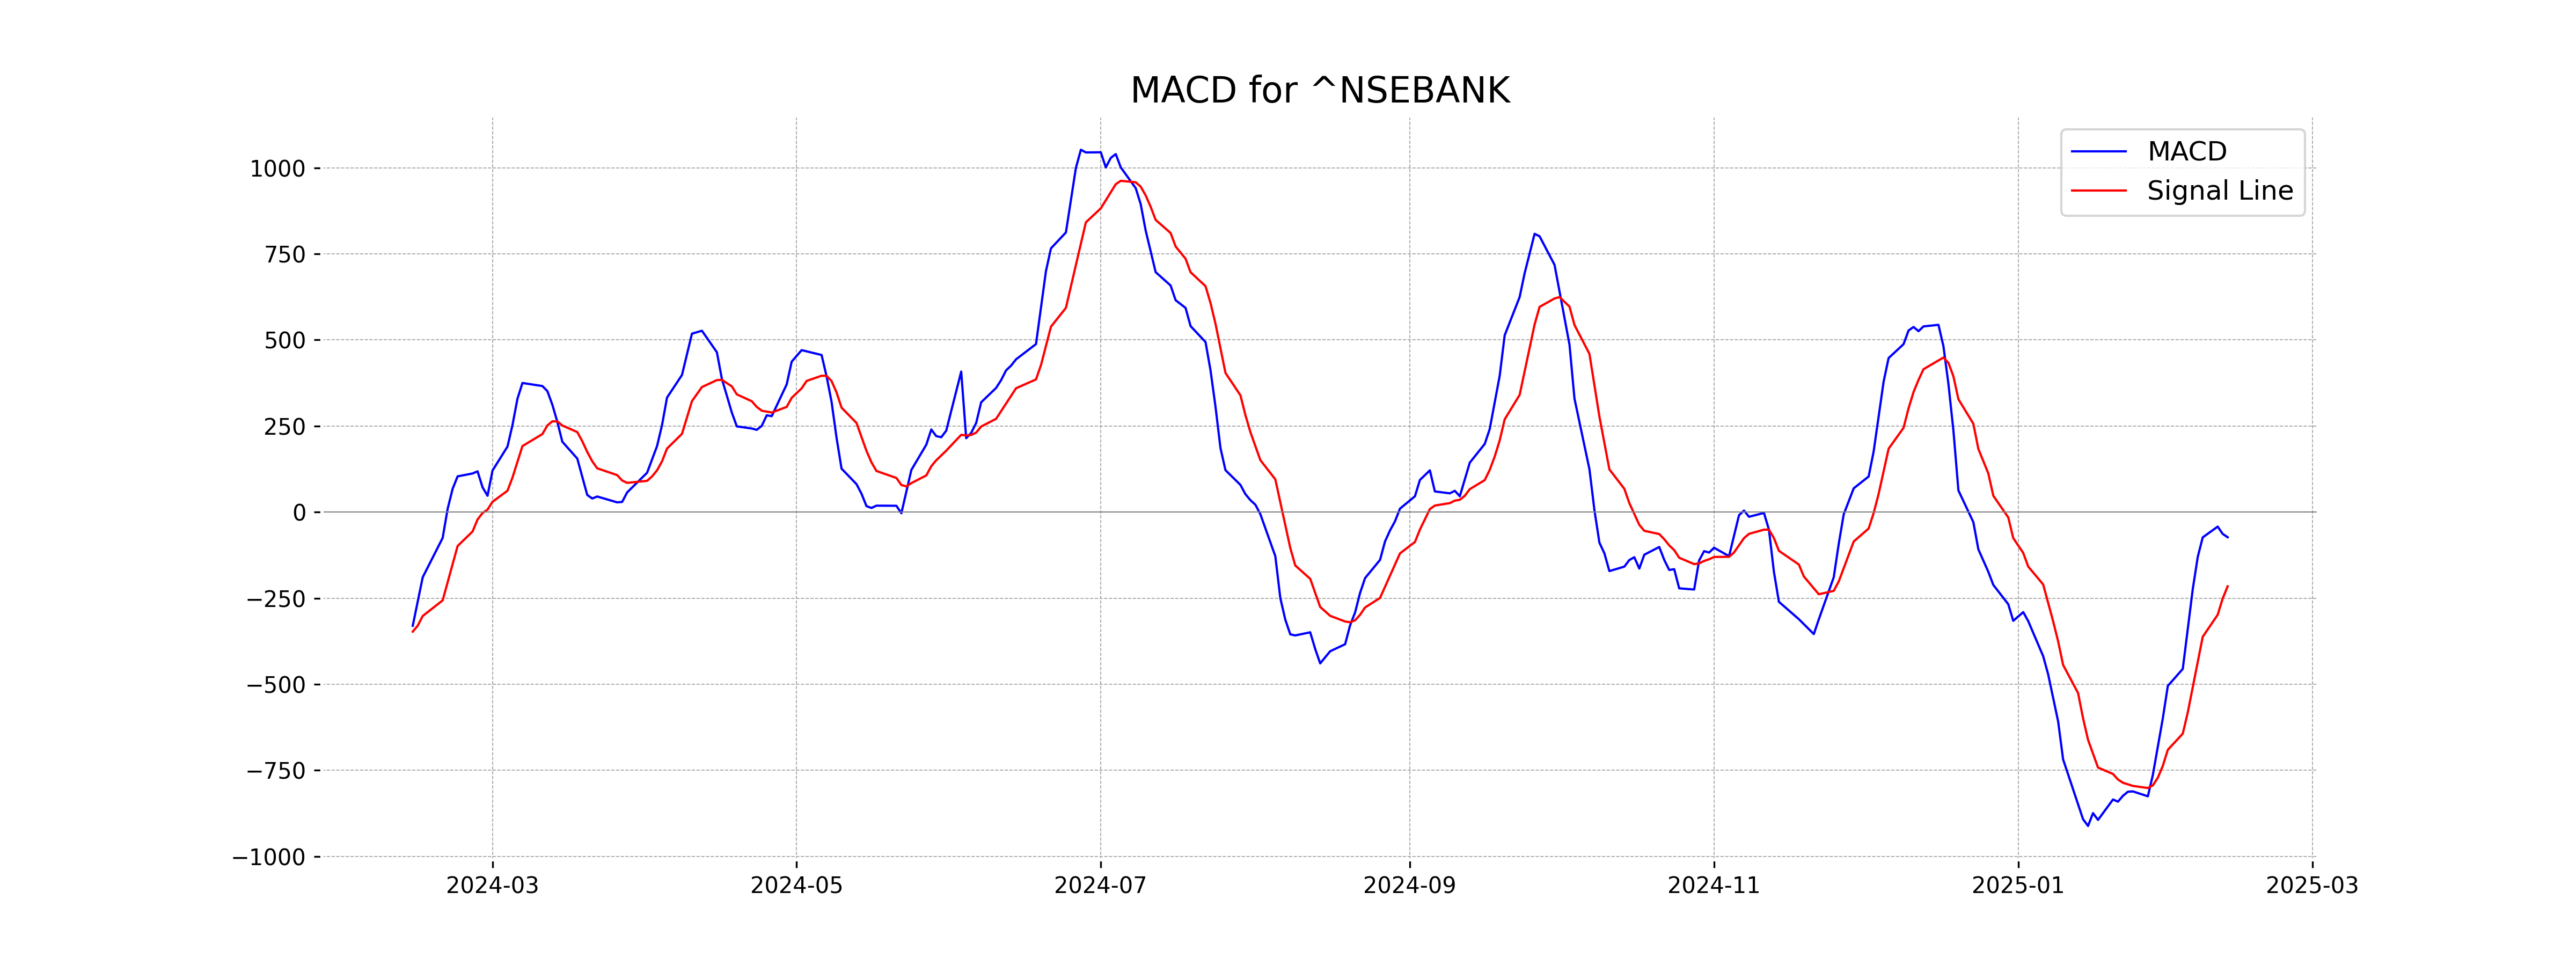
Moving Averages Trend (MACD)
The MACD value for Nifty Bank is -73.09, while the MACD Signal is -215.61. This indicates that Nifty Bank is currently in a bearish trend, as the MACD is above the MACD Signal, though it is converging, suggesting potential weakening of the bearish momentum.
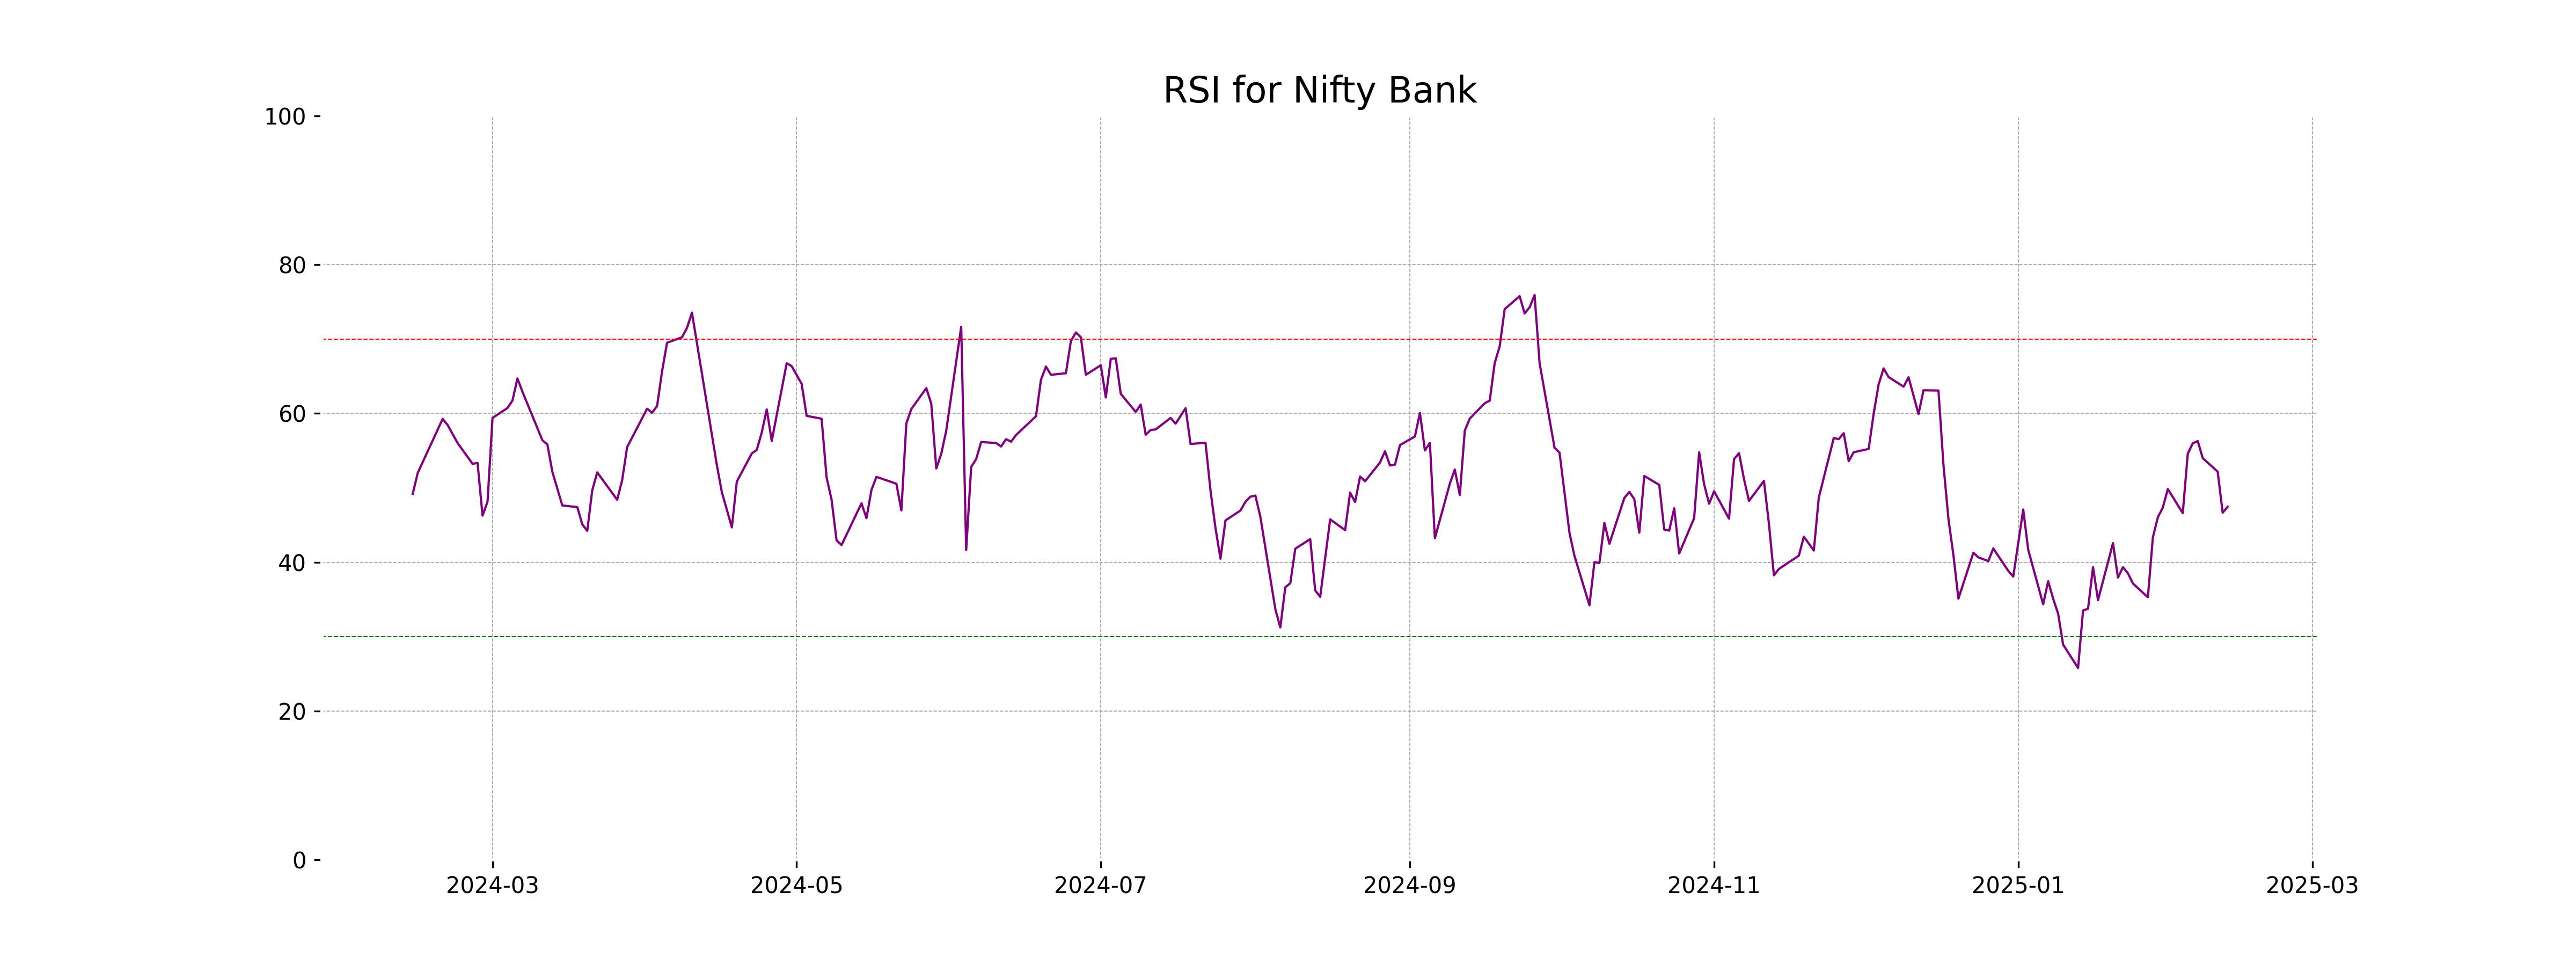
RSI Analysis
The Relative Strength Index (RSI) for Nifty Bank is currently at 47.45. This suggests that the stock is in a neutral state on the RSI scale, which ranges from 0 to 100. Since the RSI is neither in the overbought (above 70) nor oversold (below 30) range, it indicates a balanced momentum without any strong upward or downward pressure.
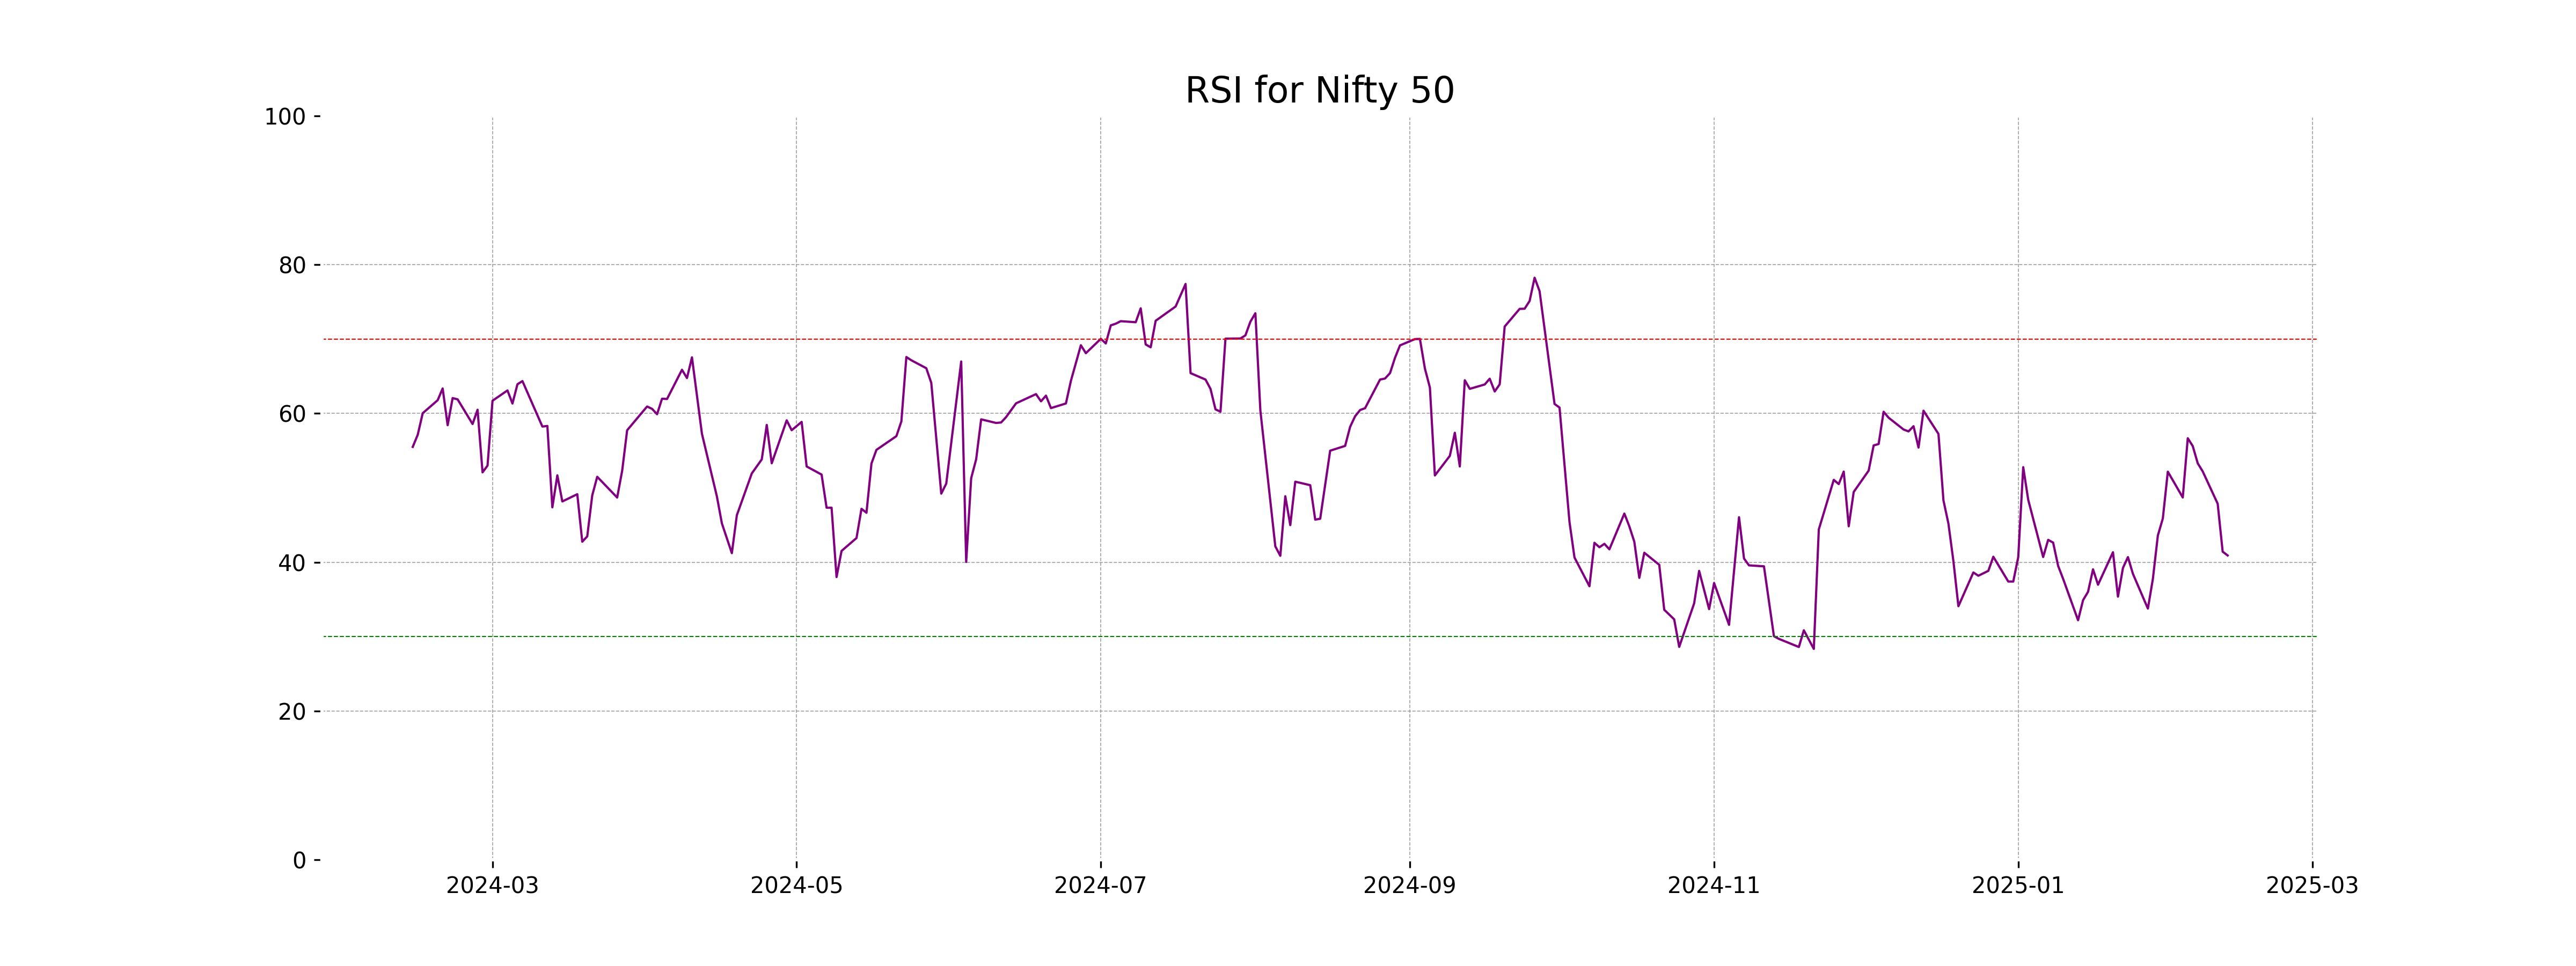
Analysis for Nifty 50 - February 12, 2025
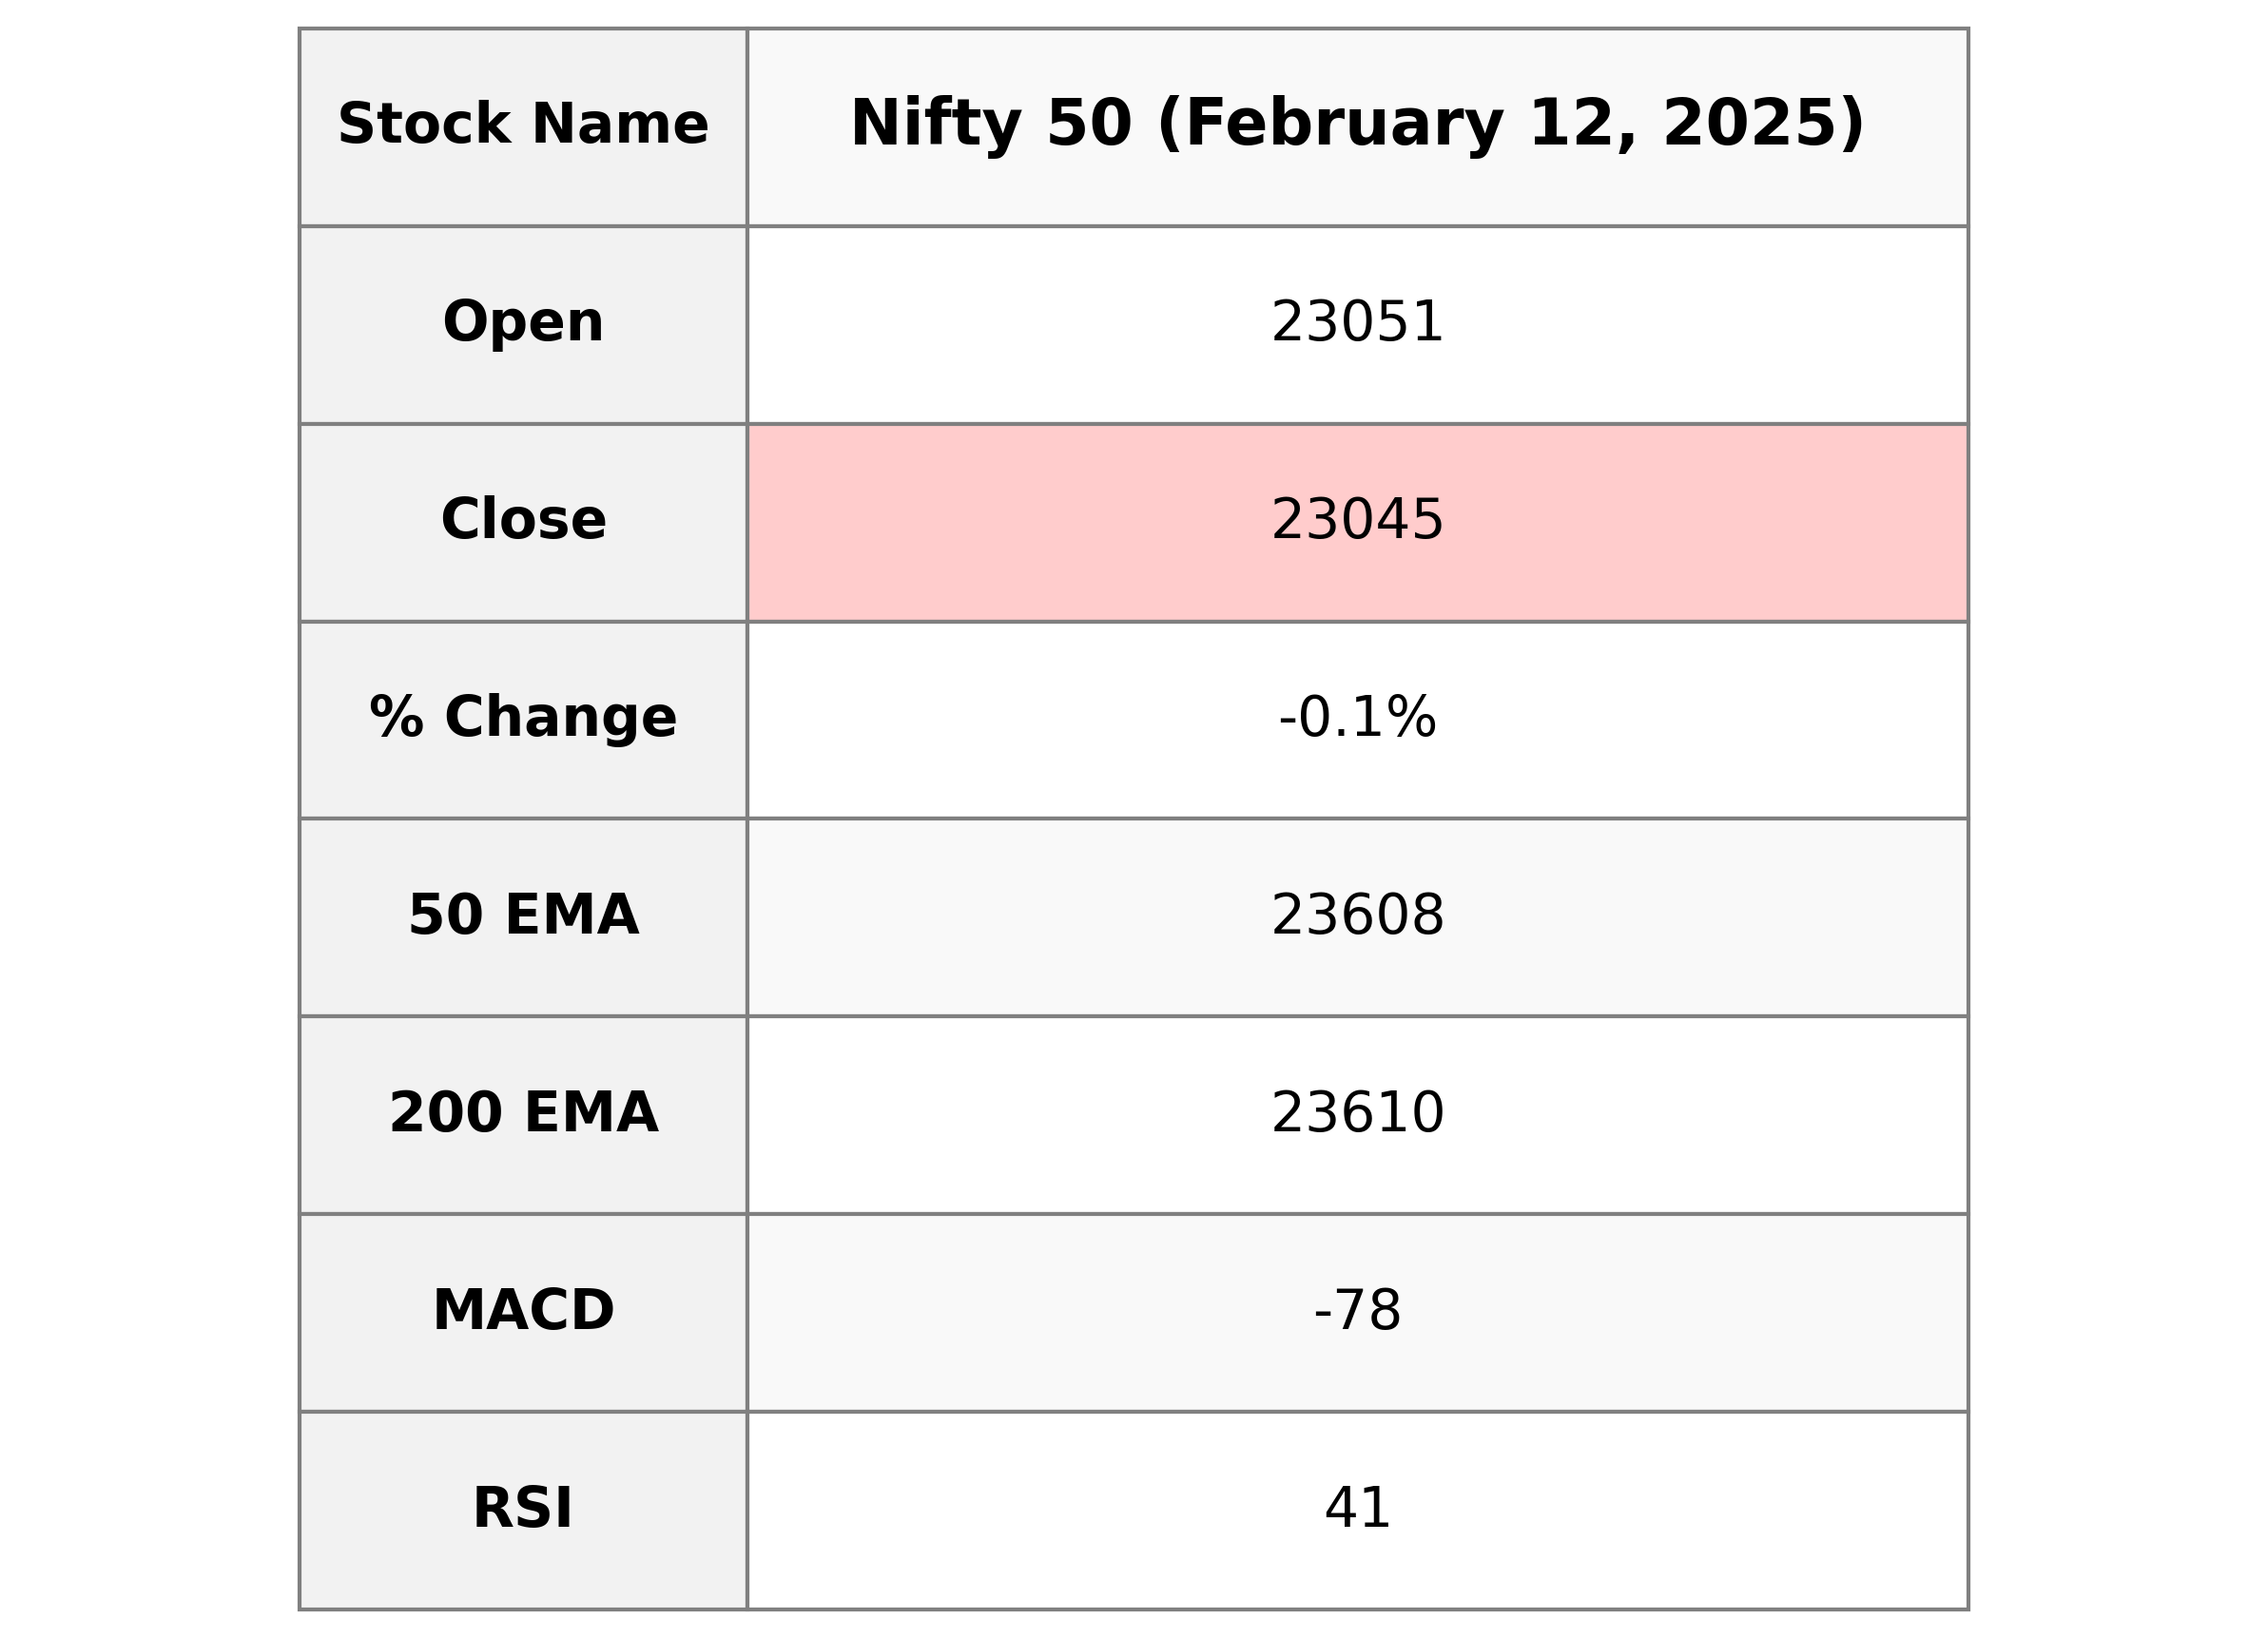
Nifty 50 opened at 23050.80 and closed slightly lower at 23045.25, marking a decrease of about 0.12%. The index experienced a daily low of 22798.35 and a high of 23144.70. Technical indicators show that the Relative Strength Index (RSI) is at 40.91, suggesting weak momentum, while the MACD indicates a bearish trend.
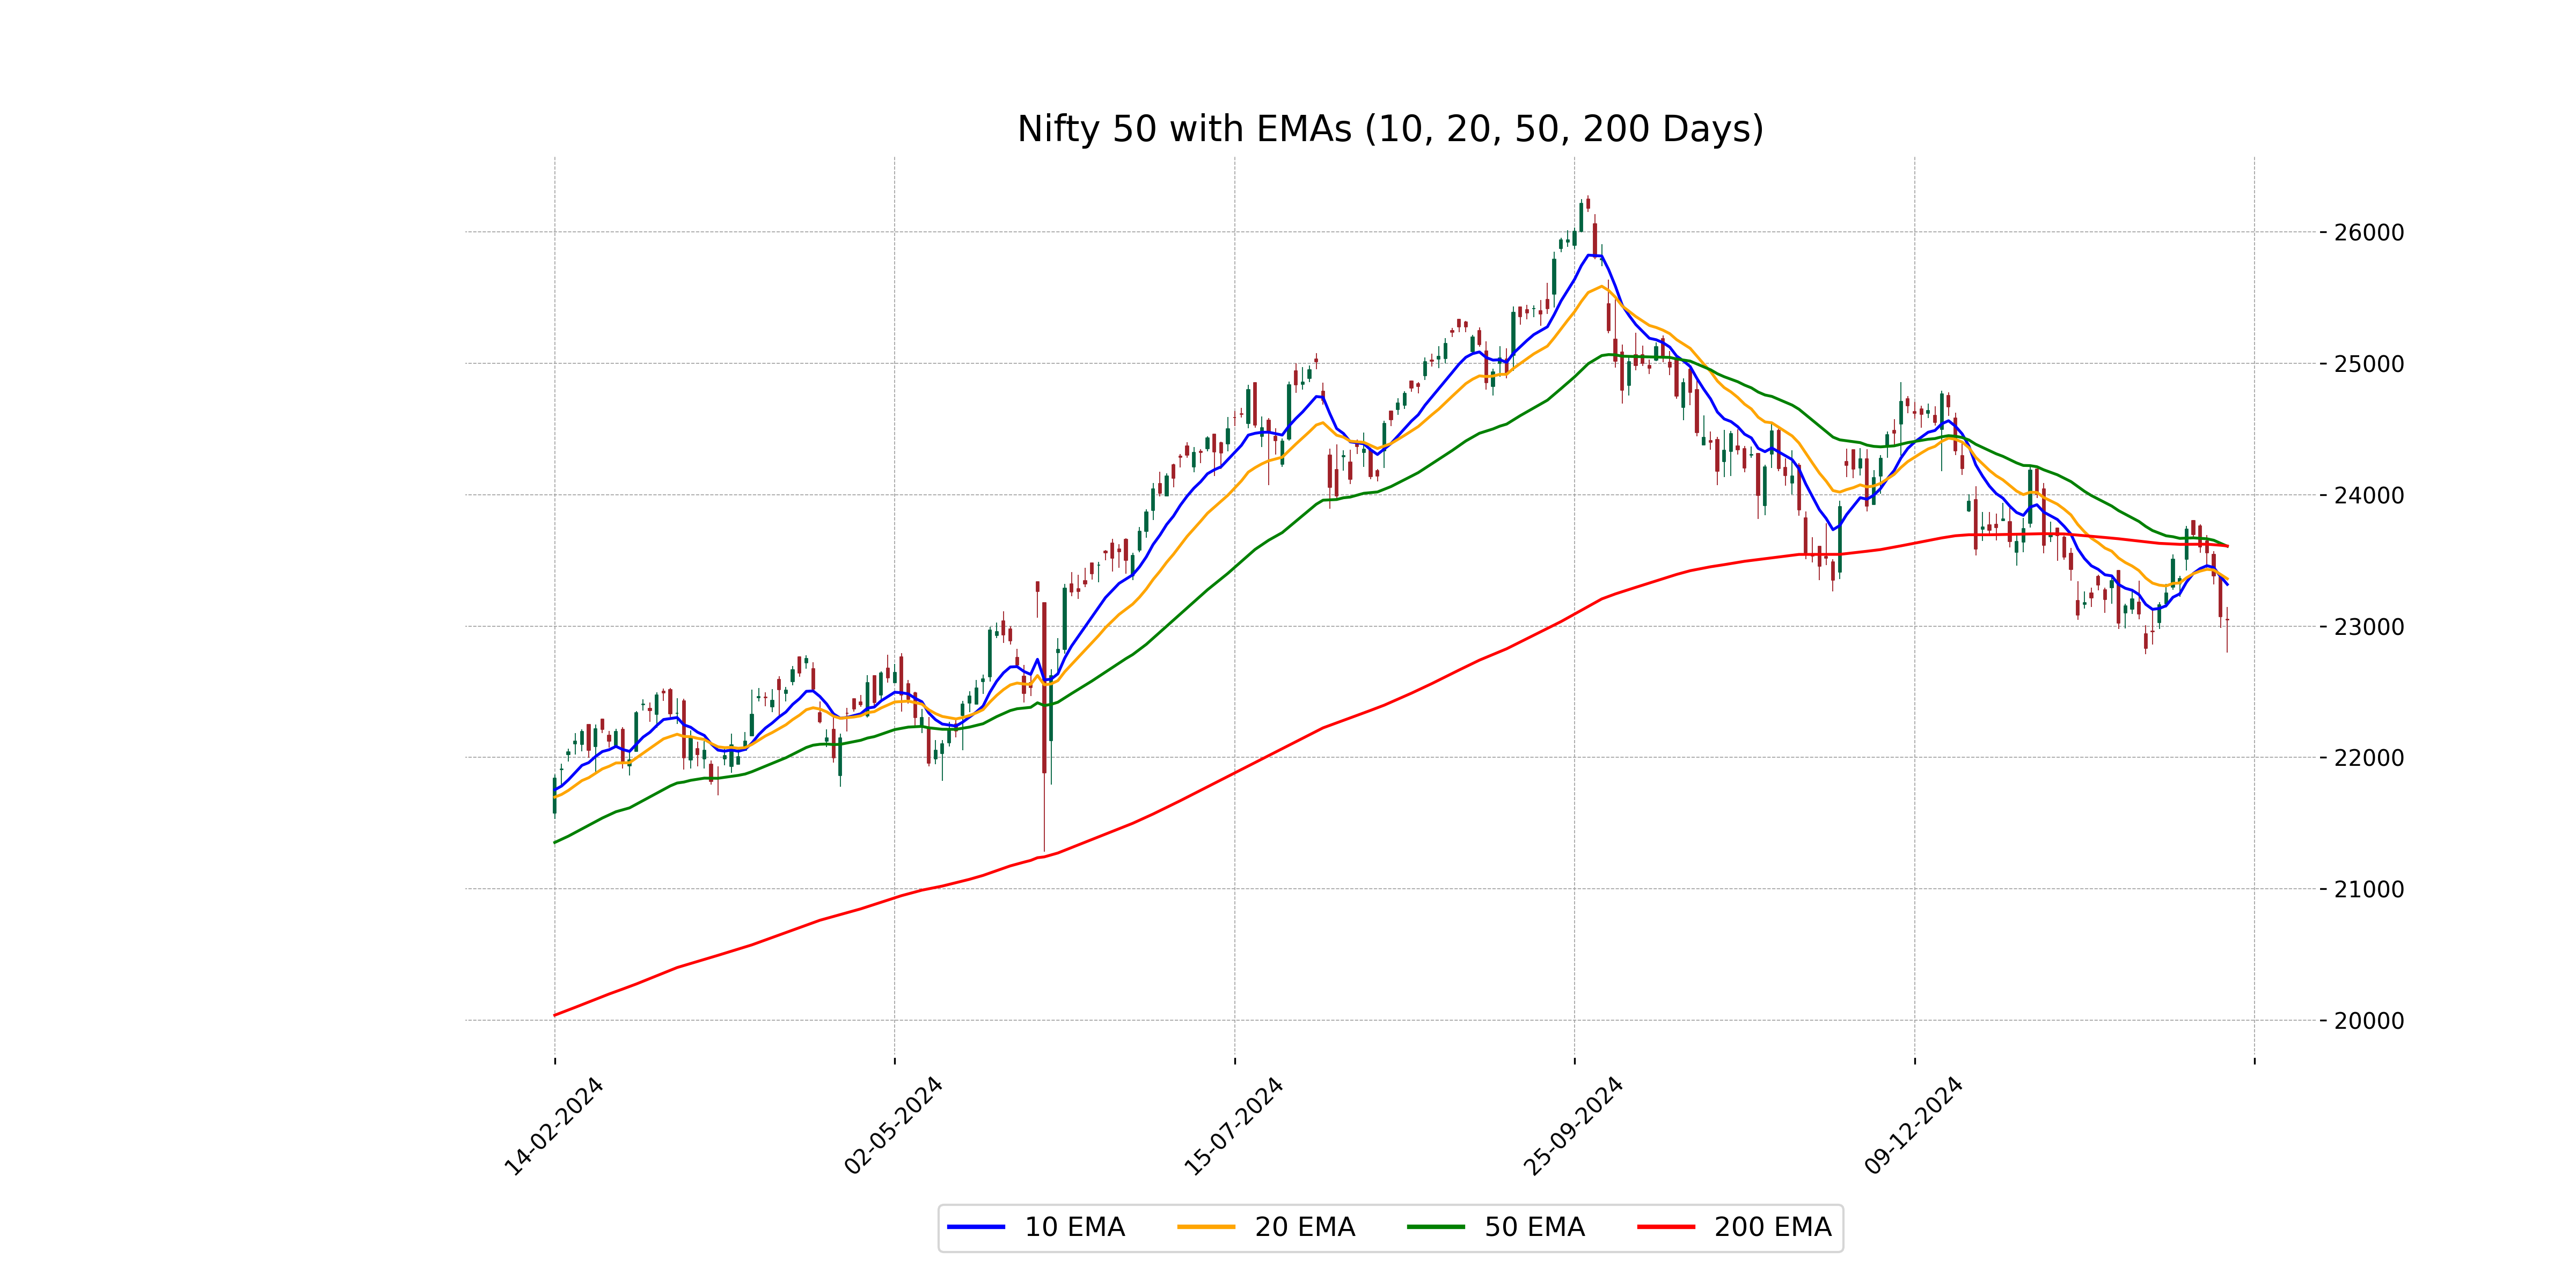
Relationship with Key Moving Averages
The Nifty 50 is trading below its key moving averages, with a current close of 23045.25, which is below the 10 EMA (23317.14), 20 EMA (23359.96), 50 EMA (23607.59), and the 200 EMA (23609.57). This indicates a bearish trend in the short to long term.
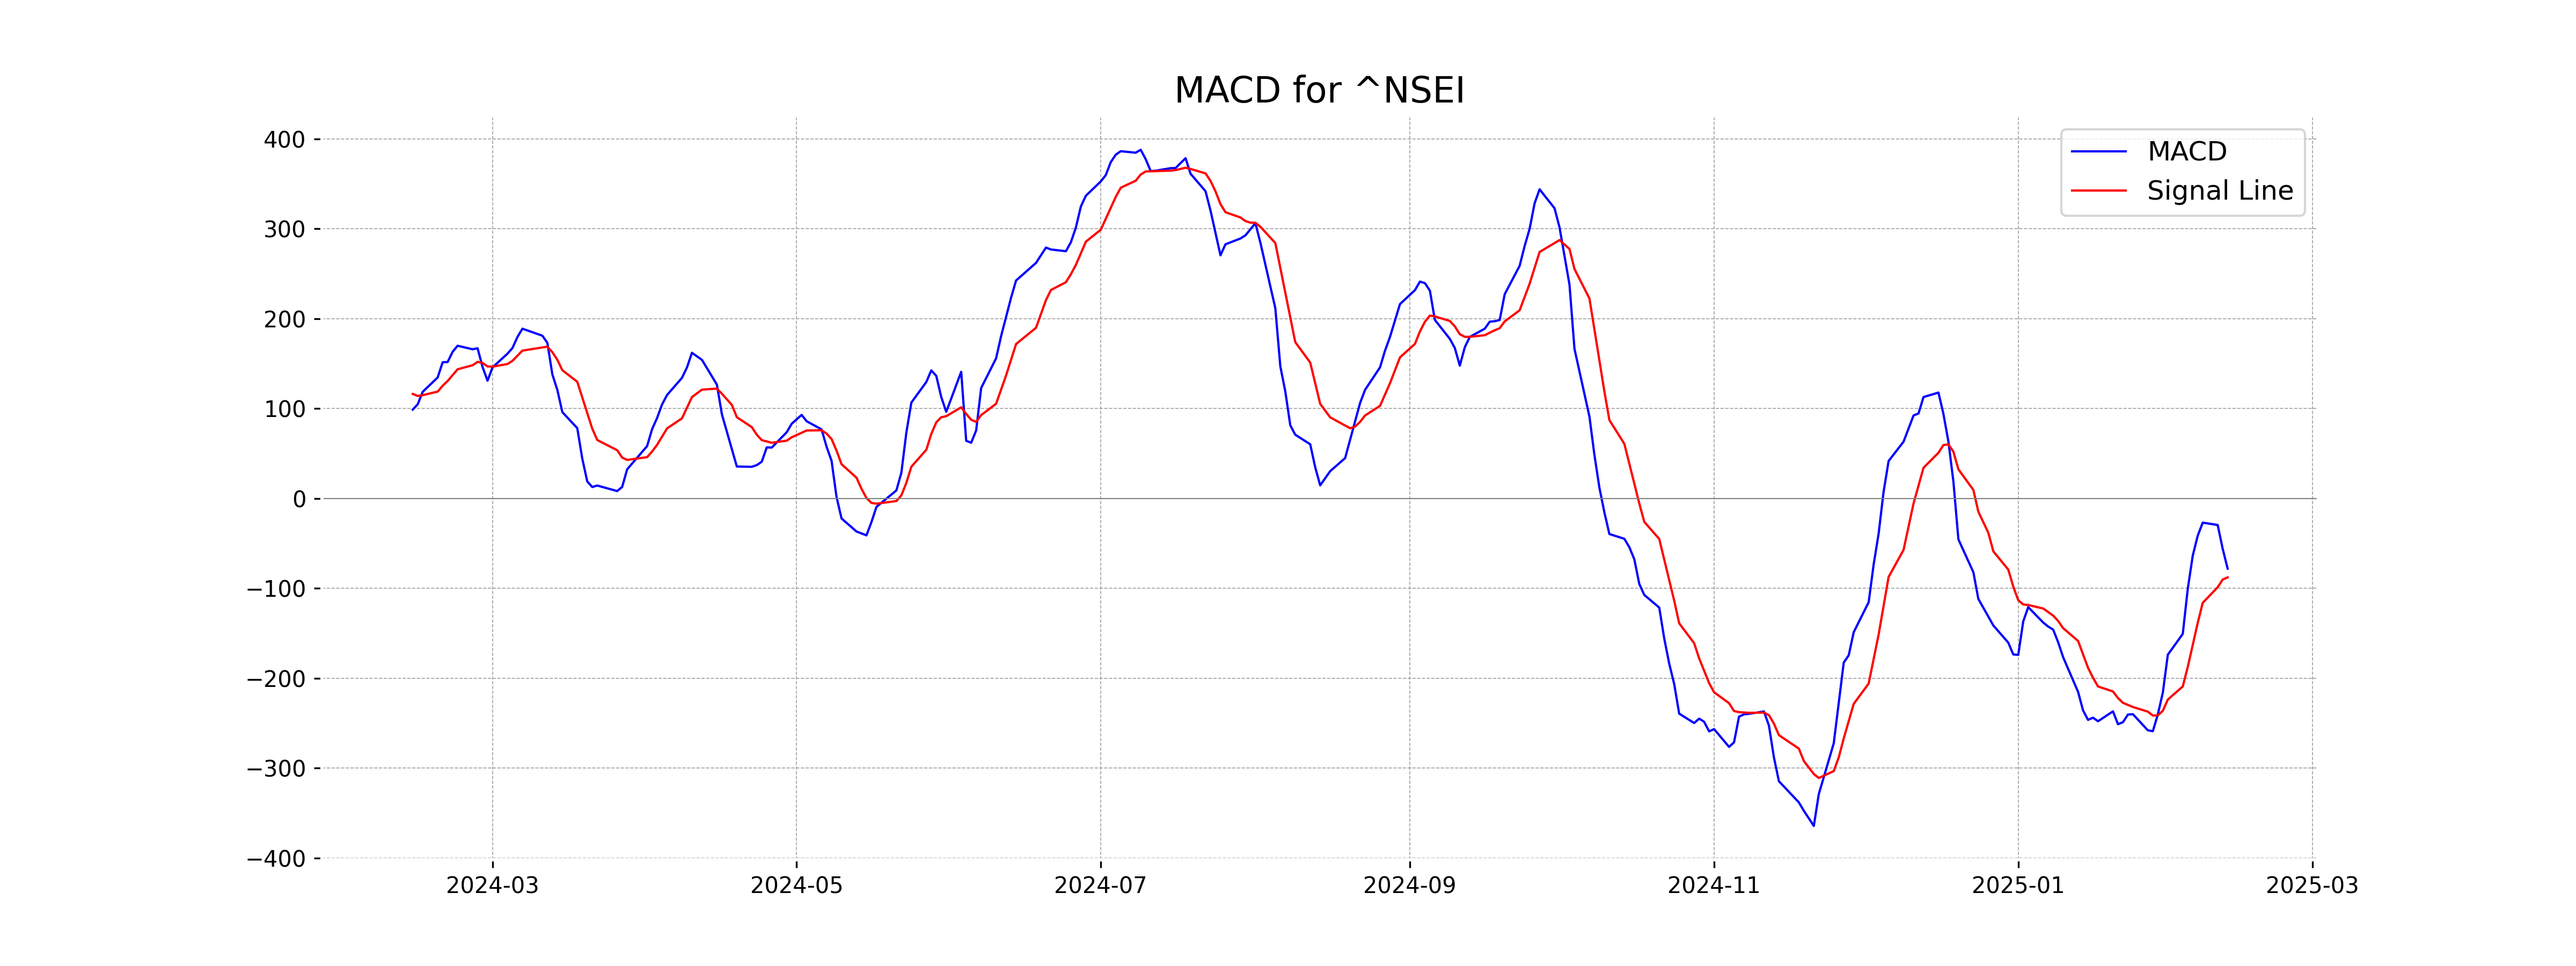
Moving Averages Trend (MACD)
The MACD for Nifty 50 is at -78.08 while the MACD signal line is at -87.78. This indicates that the MACD line is above the signal line, suggesting a potential bullish crossover. However, since both values are negative, it reflects an overall bearish trend in the current market conditions.
RSI Analysis
The Relative Strength Index (RSI) for Nifty 50 is 40.91, which suggests that the index is approaching the oversold territory. An RSI below 30 typically indicates that a security is oversold, so the current RSI suggests cautious monitoring for potential buying opportunities.