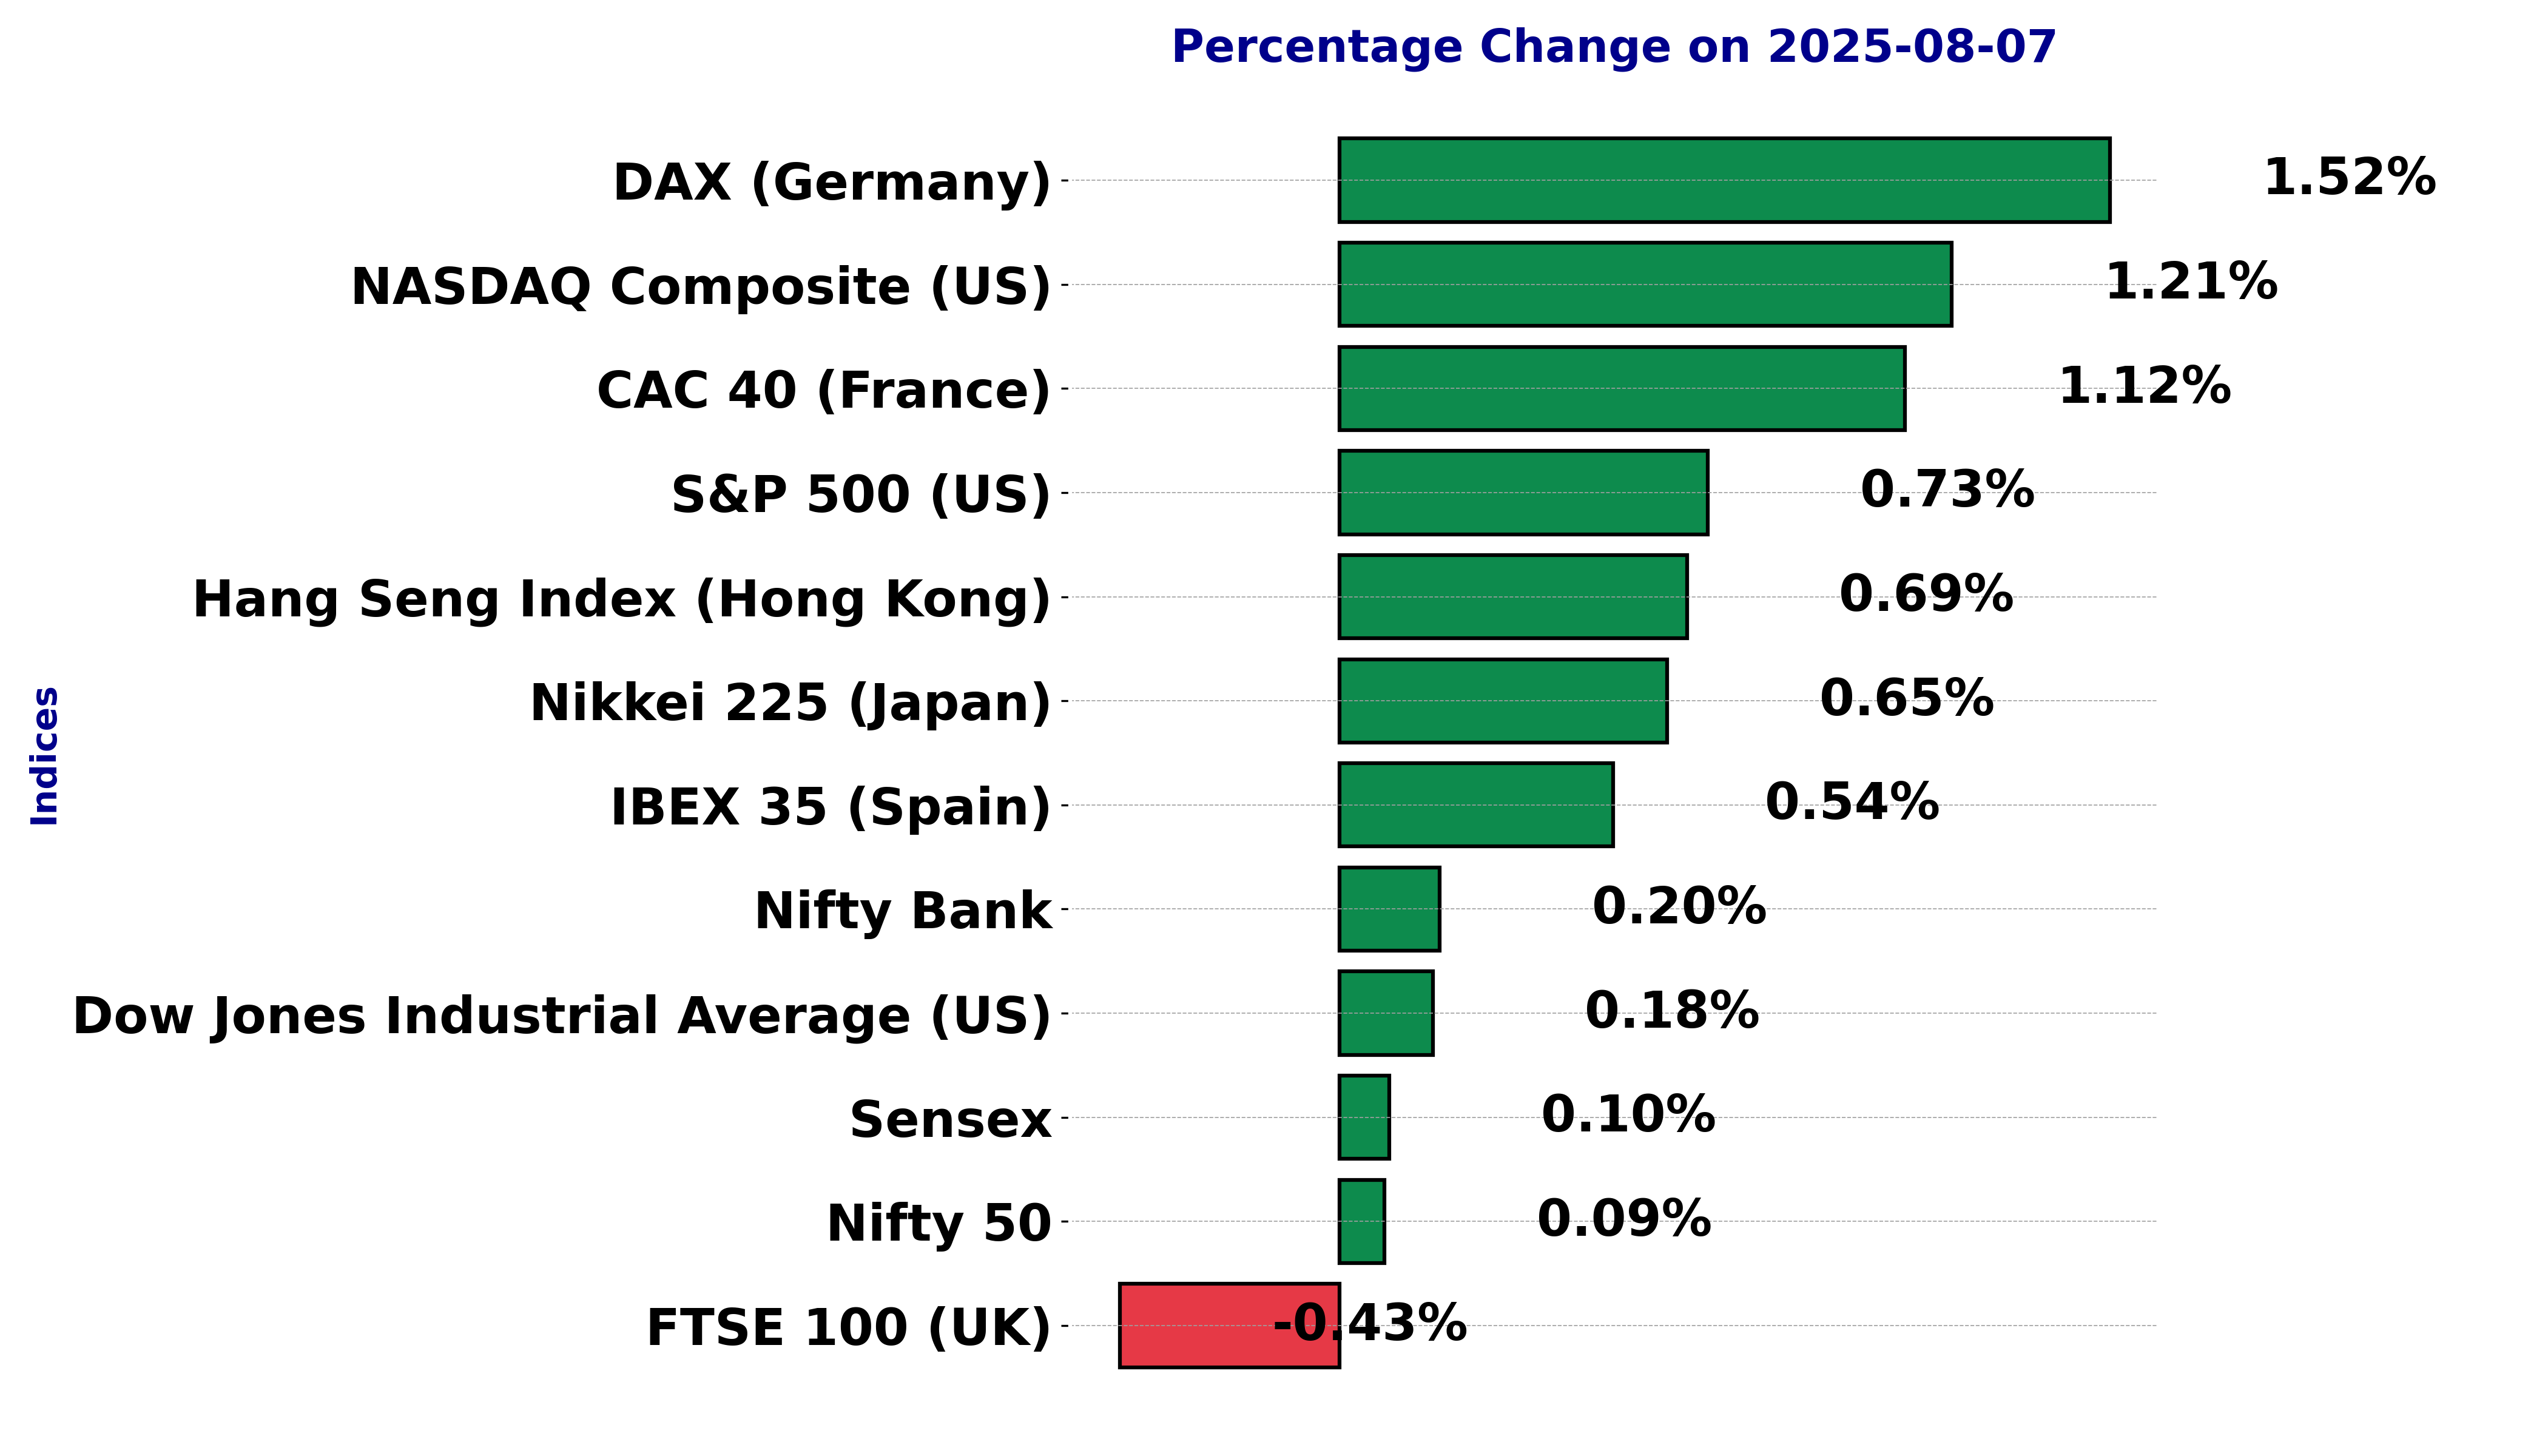
Global stock market indices: How the world markets performed today - 07 August 2025
The international stock market indices showed varied performances on August 07, 2025, reflecting the economic sentiment across different regions.
In this article, we analyze the performance of key global indices including the S&P 500, Dow Jones Industrial Average, NASDAQ Composite, FTSE 100, DAX, CAC 40, IBEX 35, Nikkei 225, Hang Seng, Nifty 50, and BSE Sensex.
Analysis for Sensex - August 07, 2025
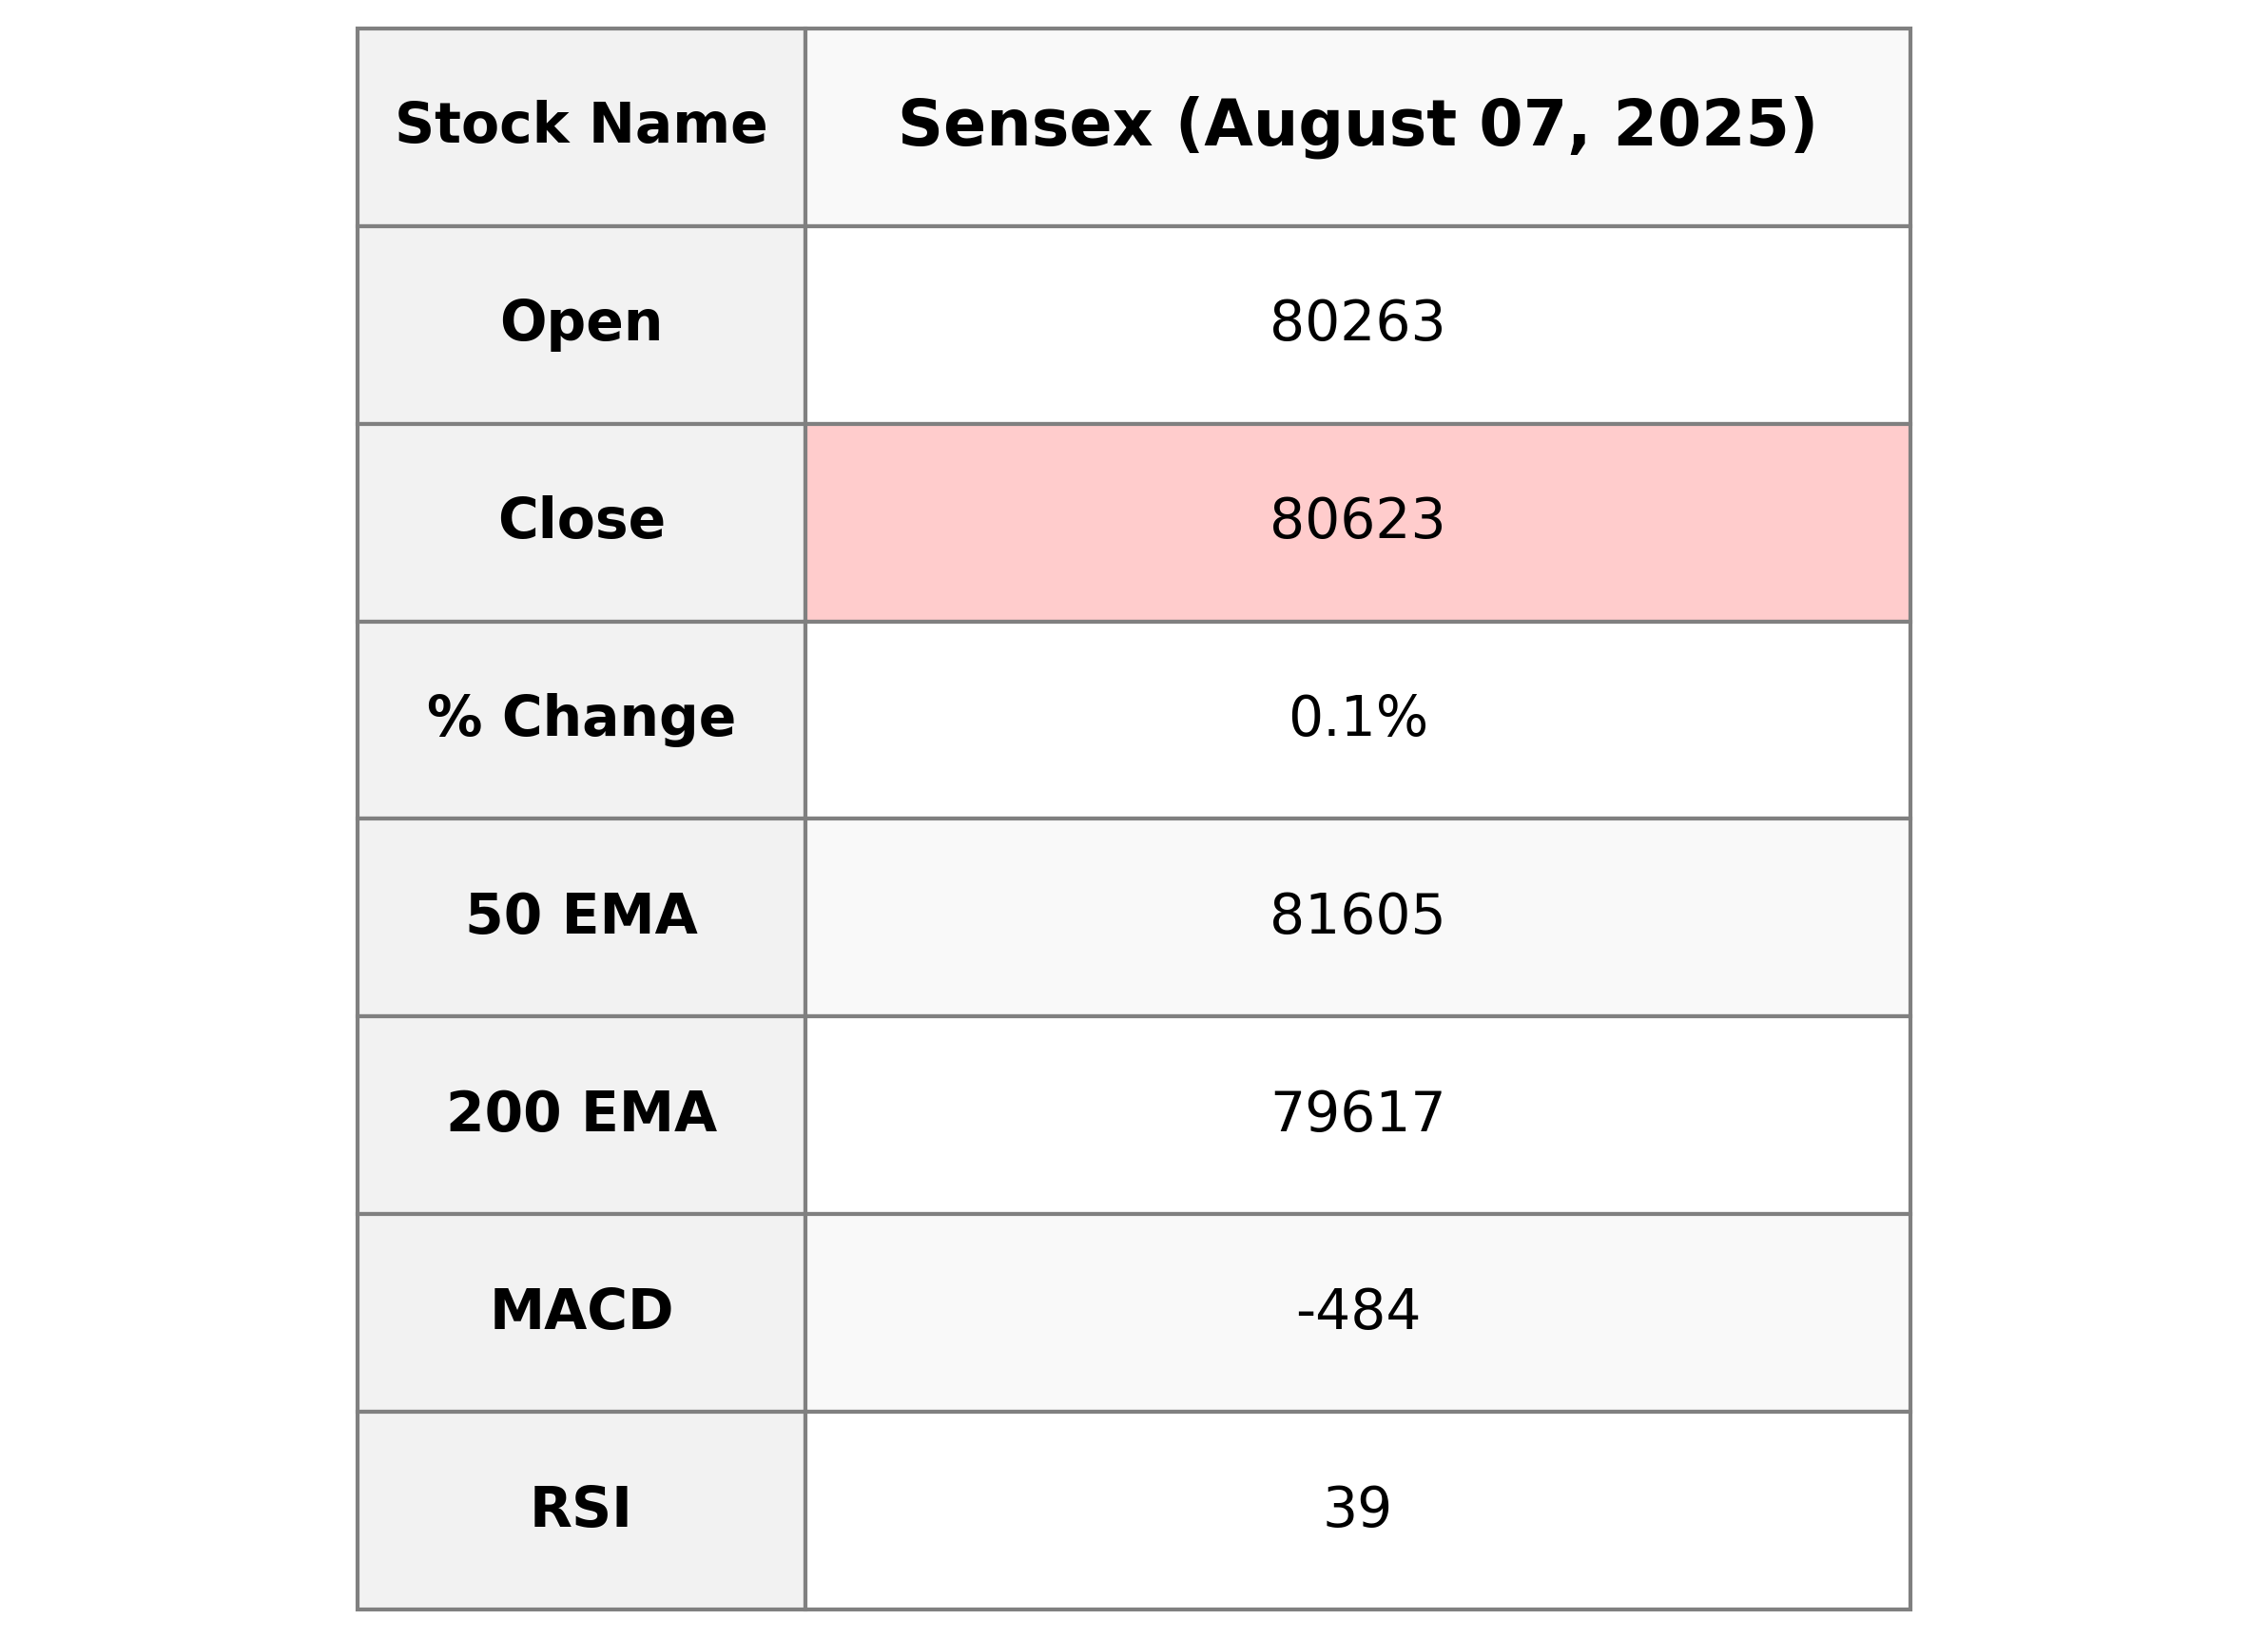
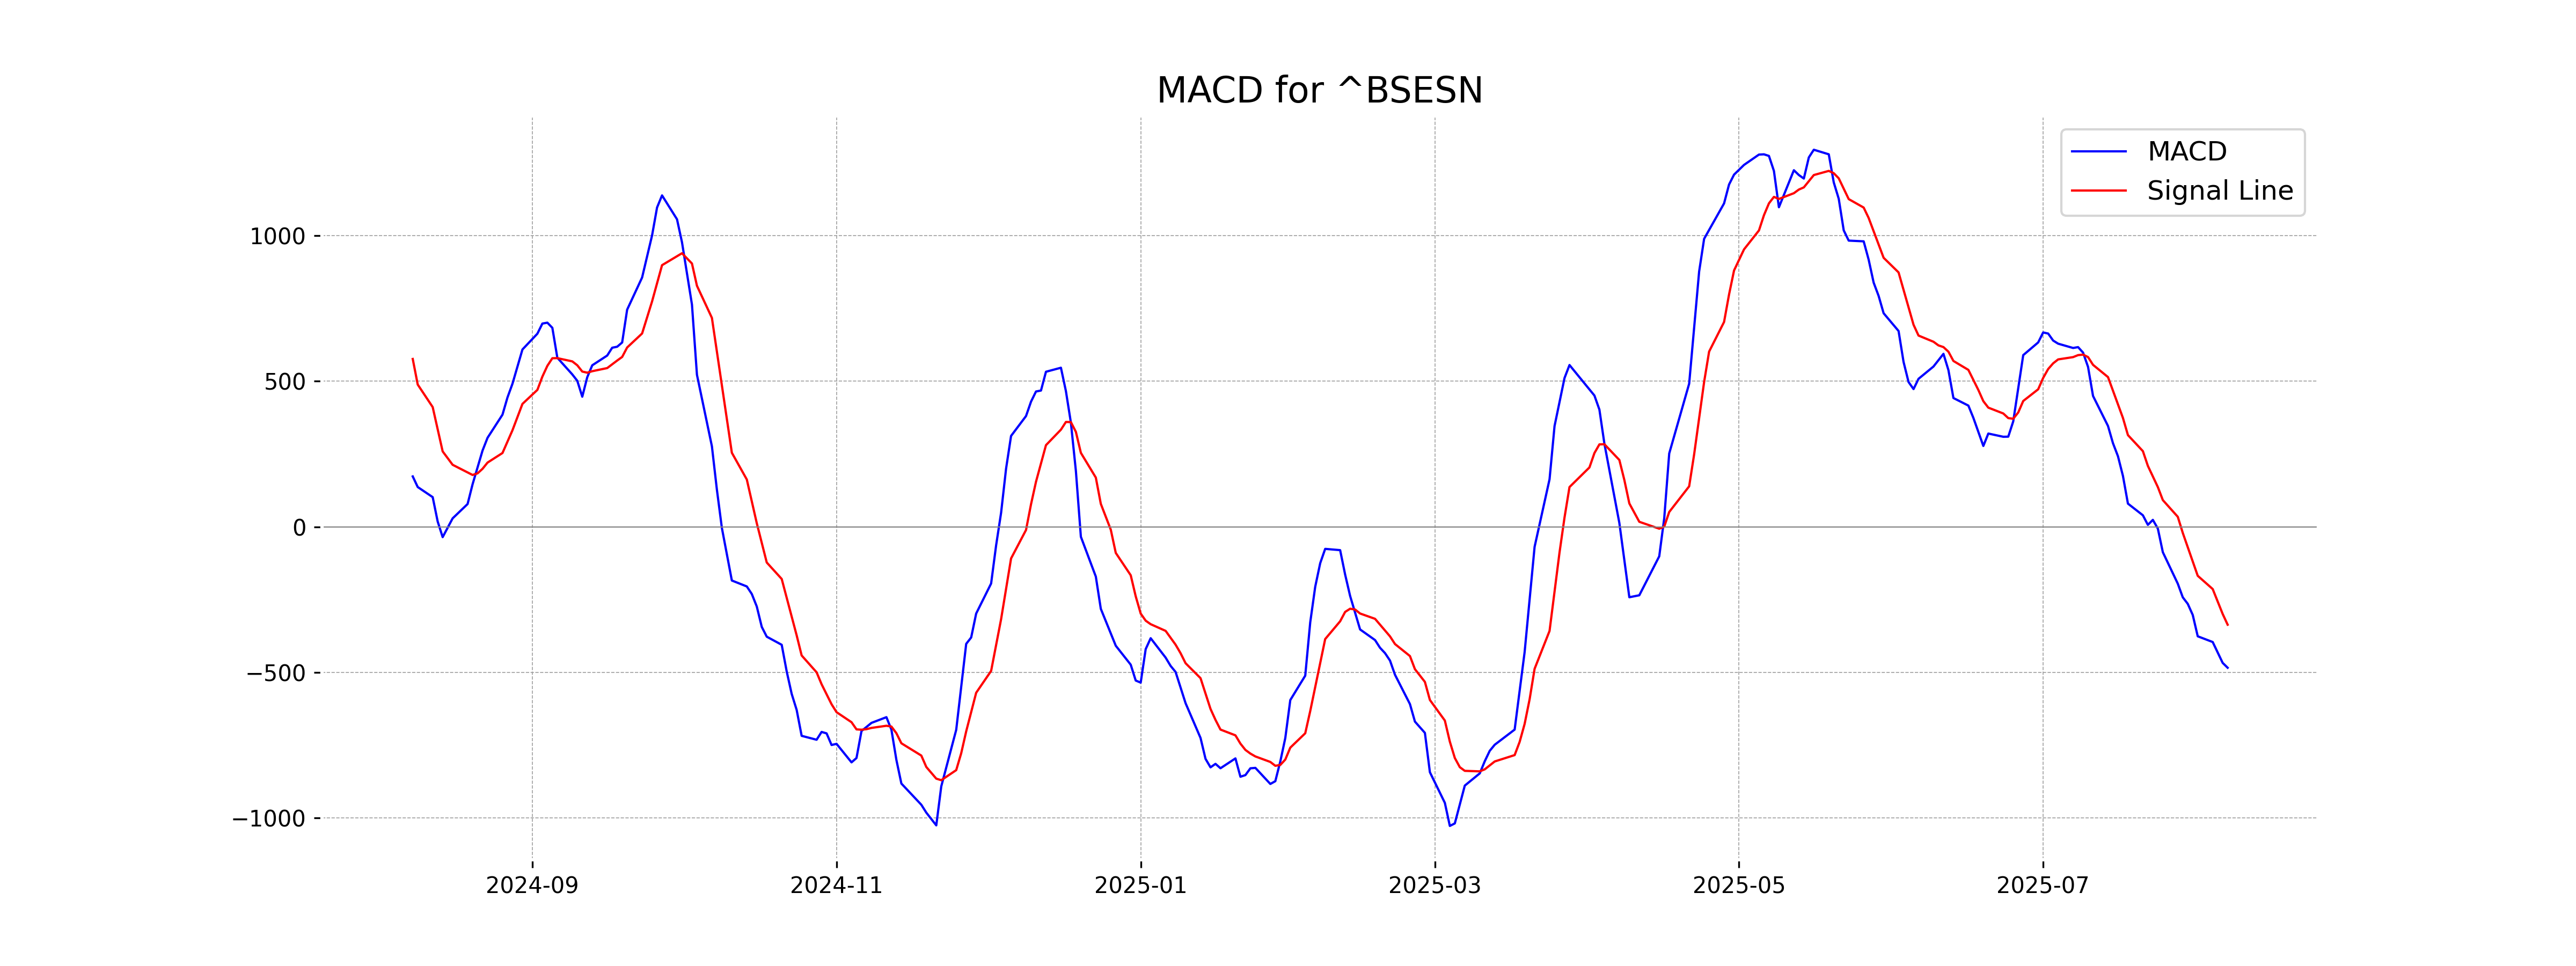
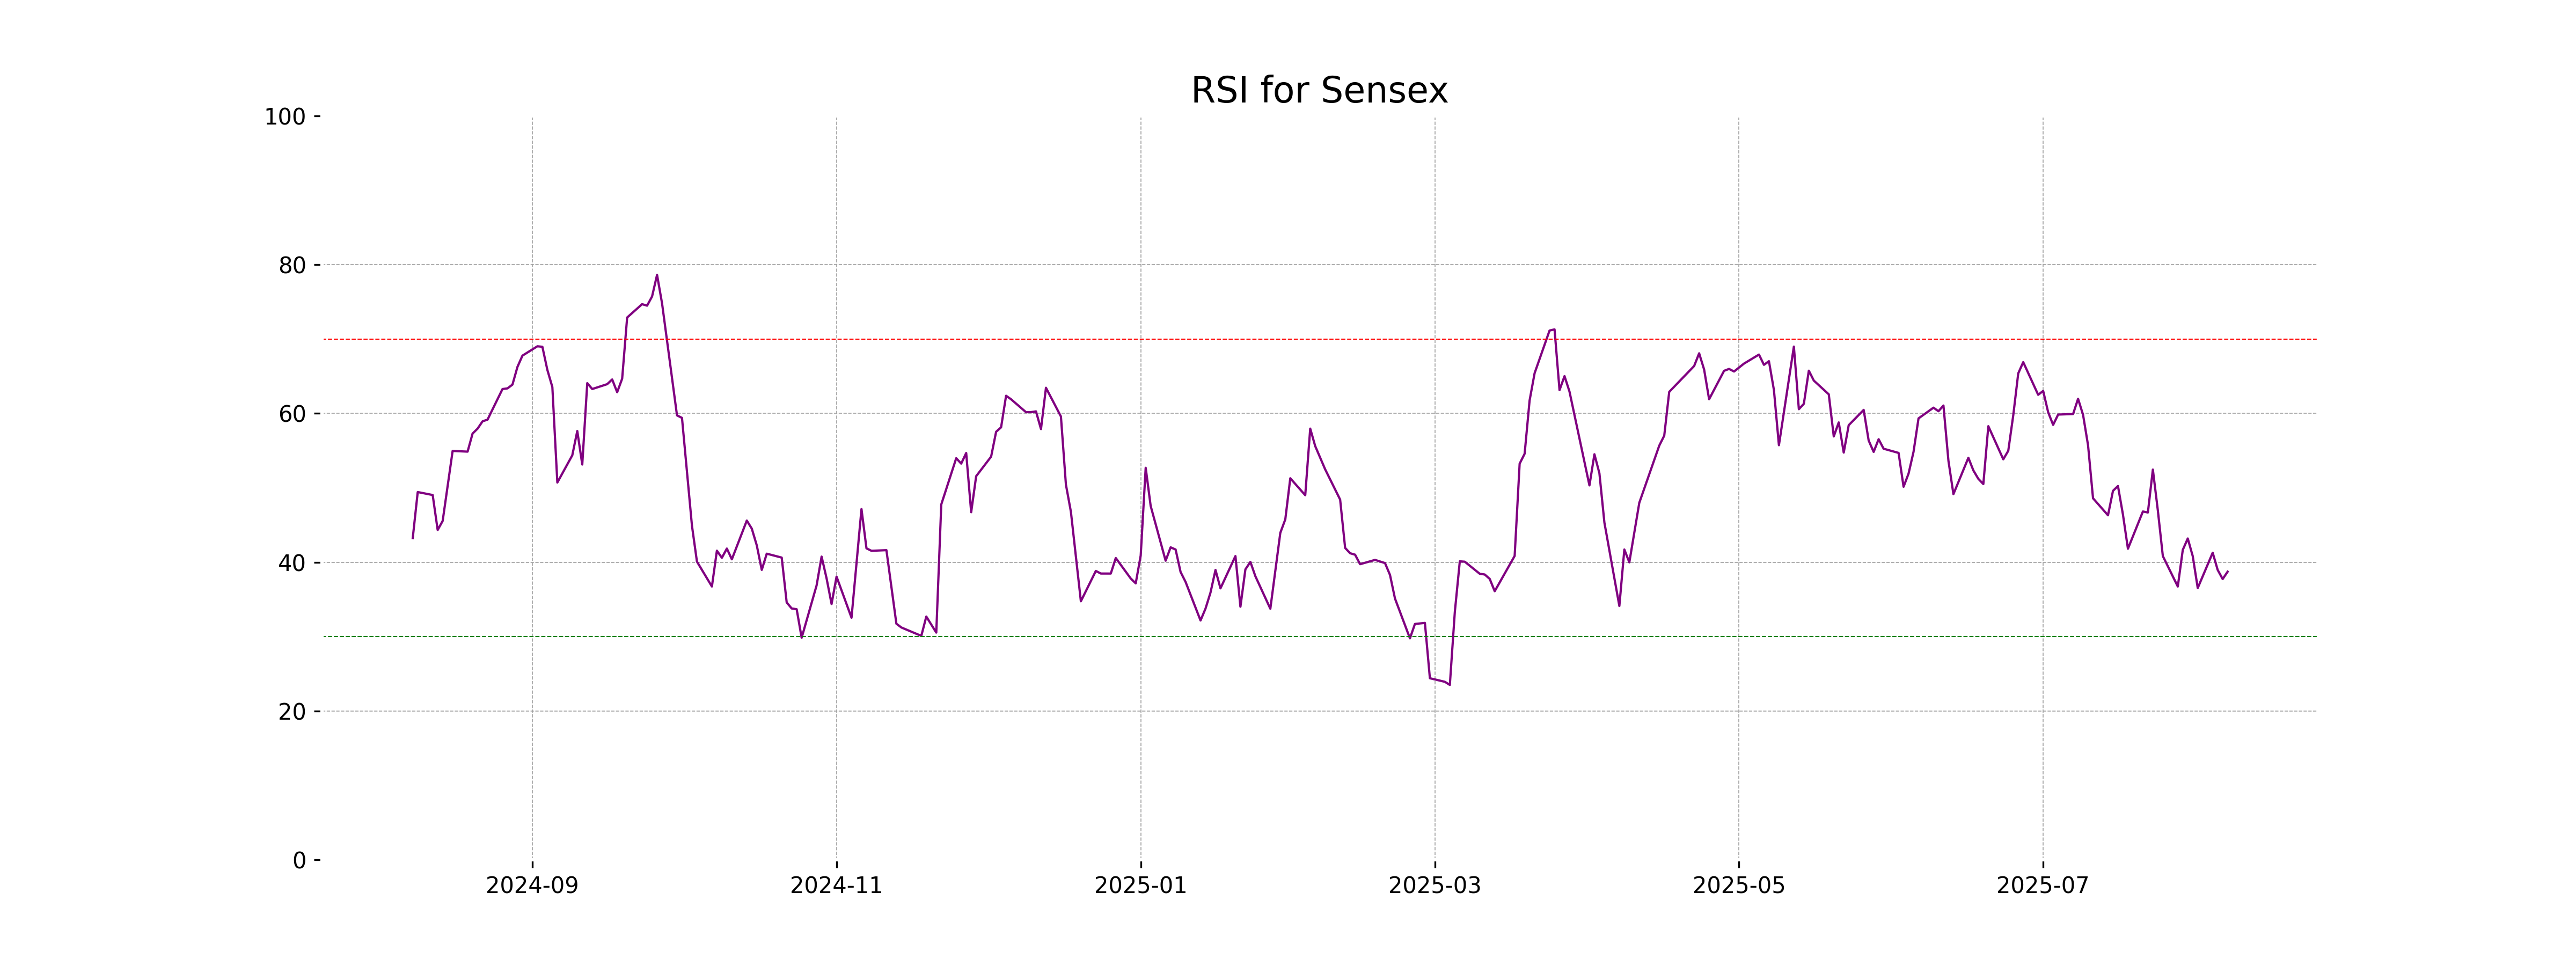
The Sensex opened at 80,262.98 and closed at 80,623.26, showing a slight positive change of 0.098% with a gain of 79.27 points. The RSI is at 38.73, indicating potential undervaluation, while the MACD suggests a bearish trend with a negative value of -484.05.
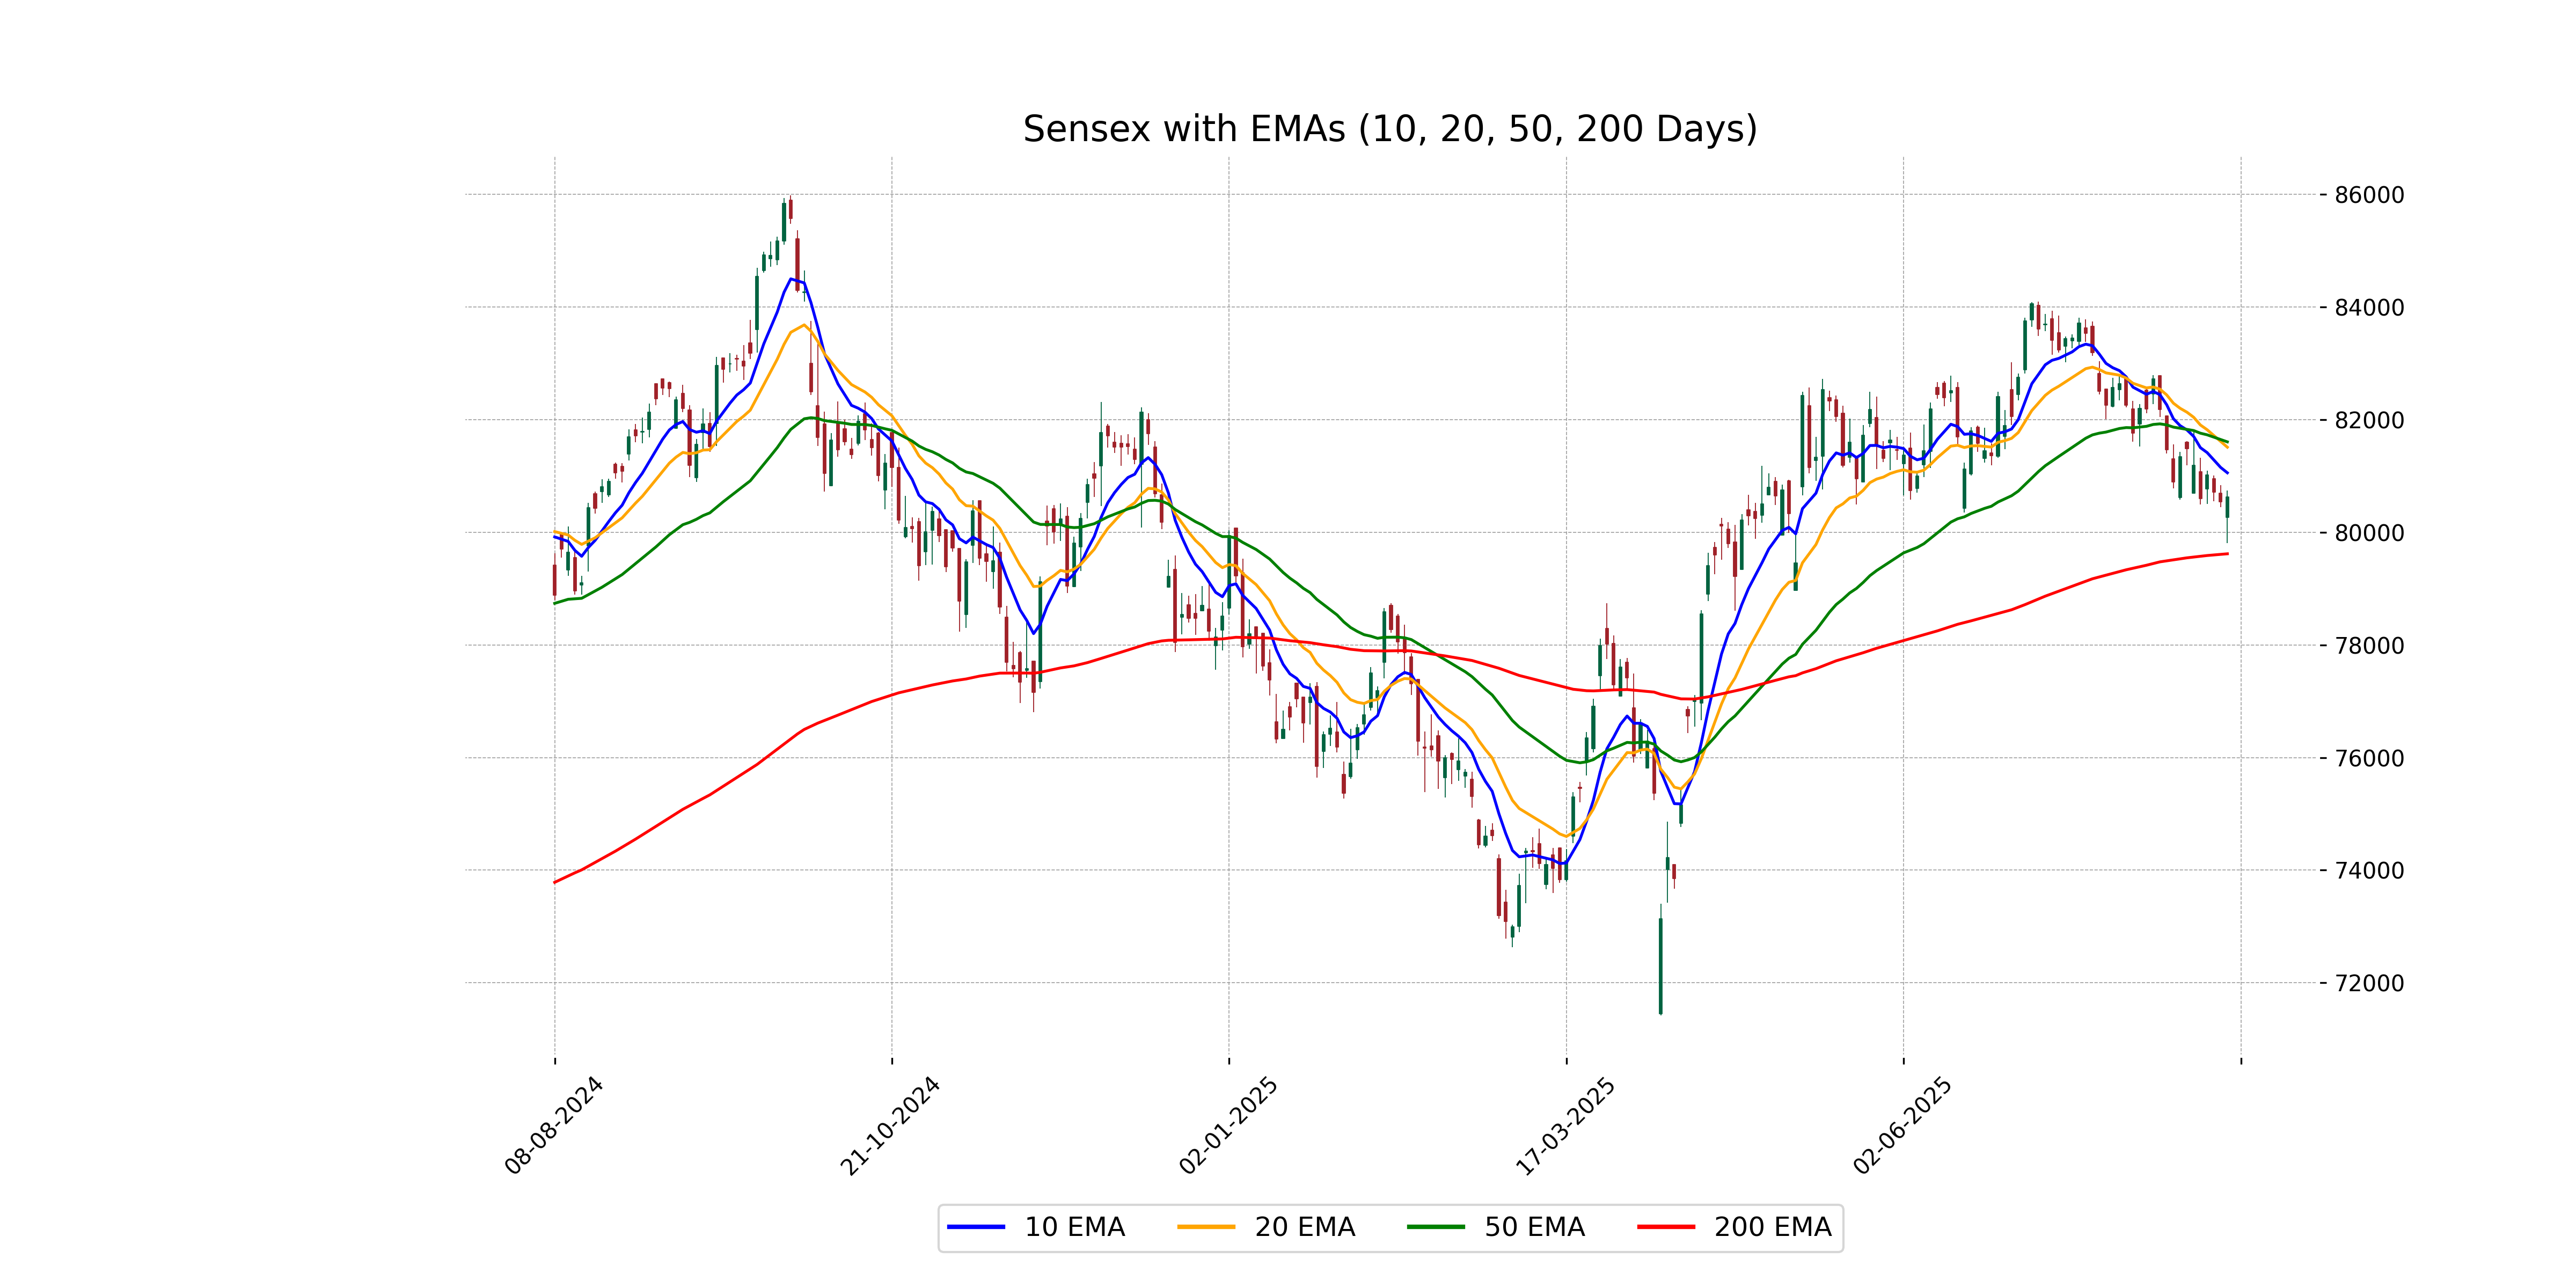
Relationship with Key Moving Averages
The Sensex closed at 80,623.26, which is below the 50-day EMA of 81,604.69, indicating potential bearish momentum. It is slightly above the 200-day EMA of 79,617.34, suggesting the index is above its longer-term trend but still facing shorter-term resistance. The 10-day and 20-day EMAs are also above the current close, reinforcing short-term bearish sentiment.
Moving Averages Trend (MACD)
The MACD for the Sensex is currently showing a value of -484.05, which indicates a bearish trend as it is below the MACD Signal line of -336.26. This suggests that the index might continue to face downward pressure in the short term.
RSI Analysis
The RSI for Sensex is 38.73, which suggests that the index is approaching oversold territory. Typically, an RSI below 30 indicates oversold conditions, which could lead to a potential price reversal. However, the current RSI still indicates bearish sentiment.
Analysis for Dow Jones Industrial Average (US) - August 07, 2025
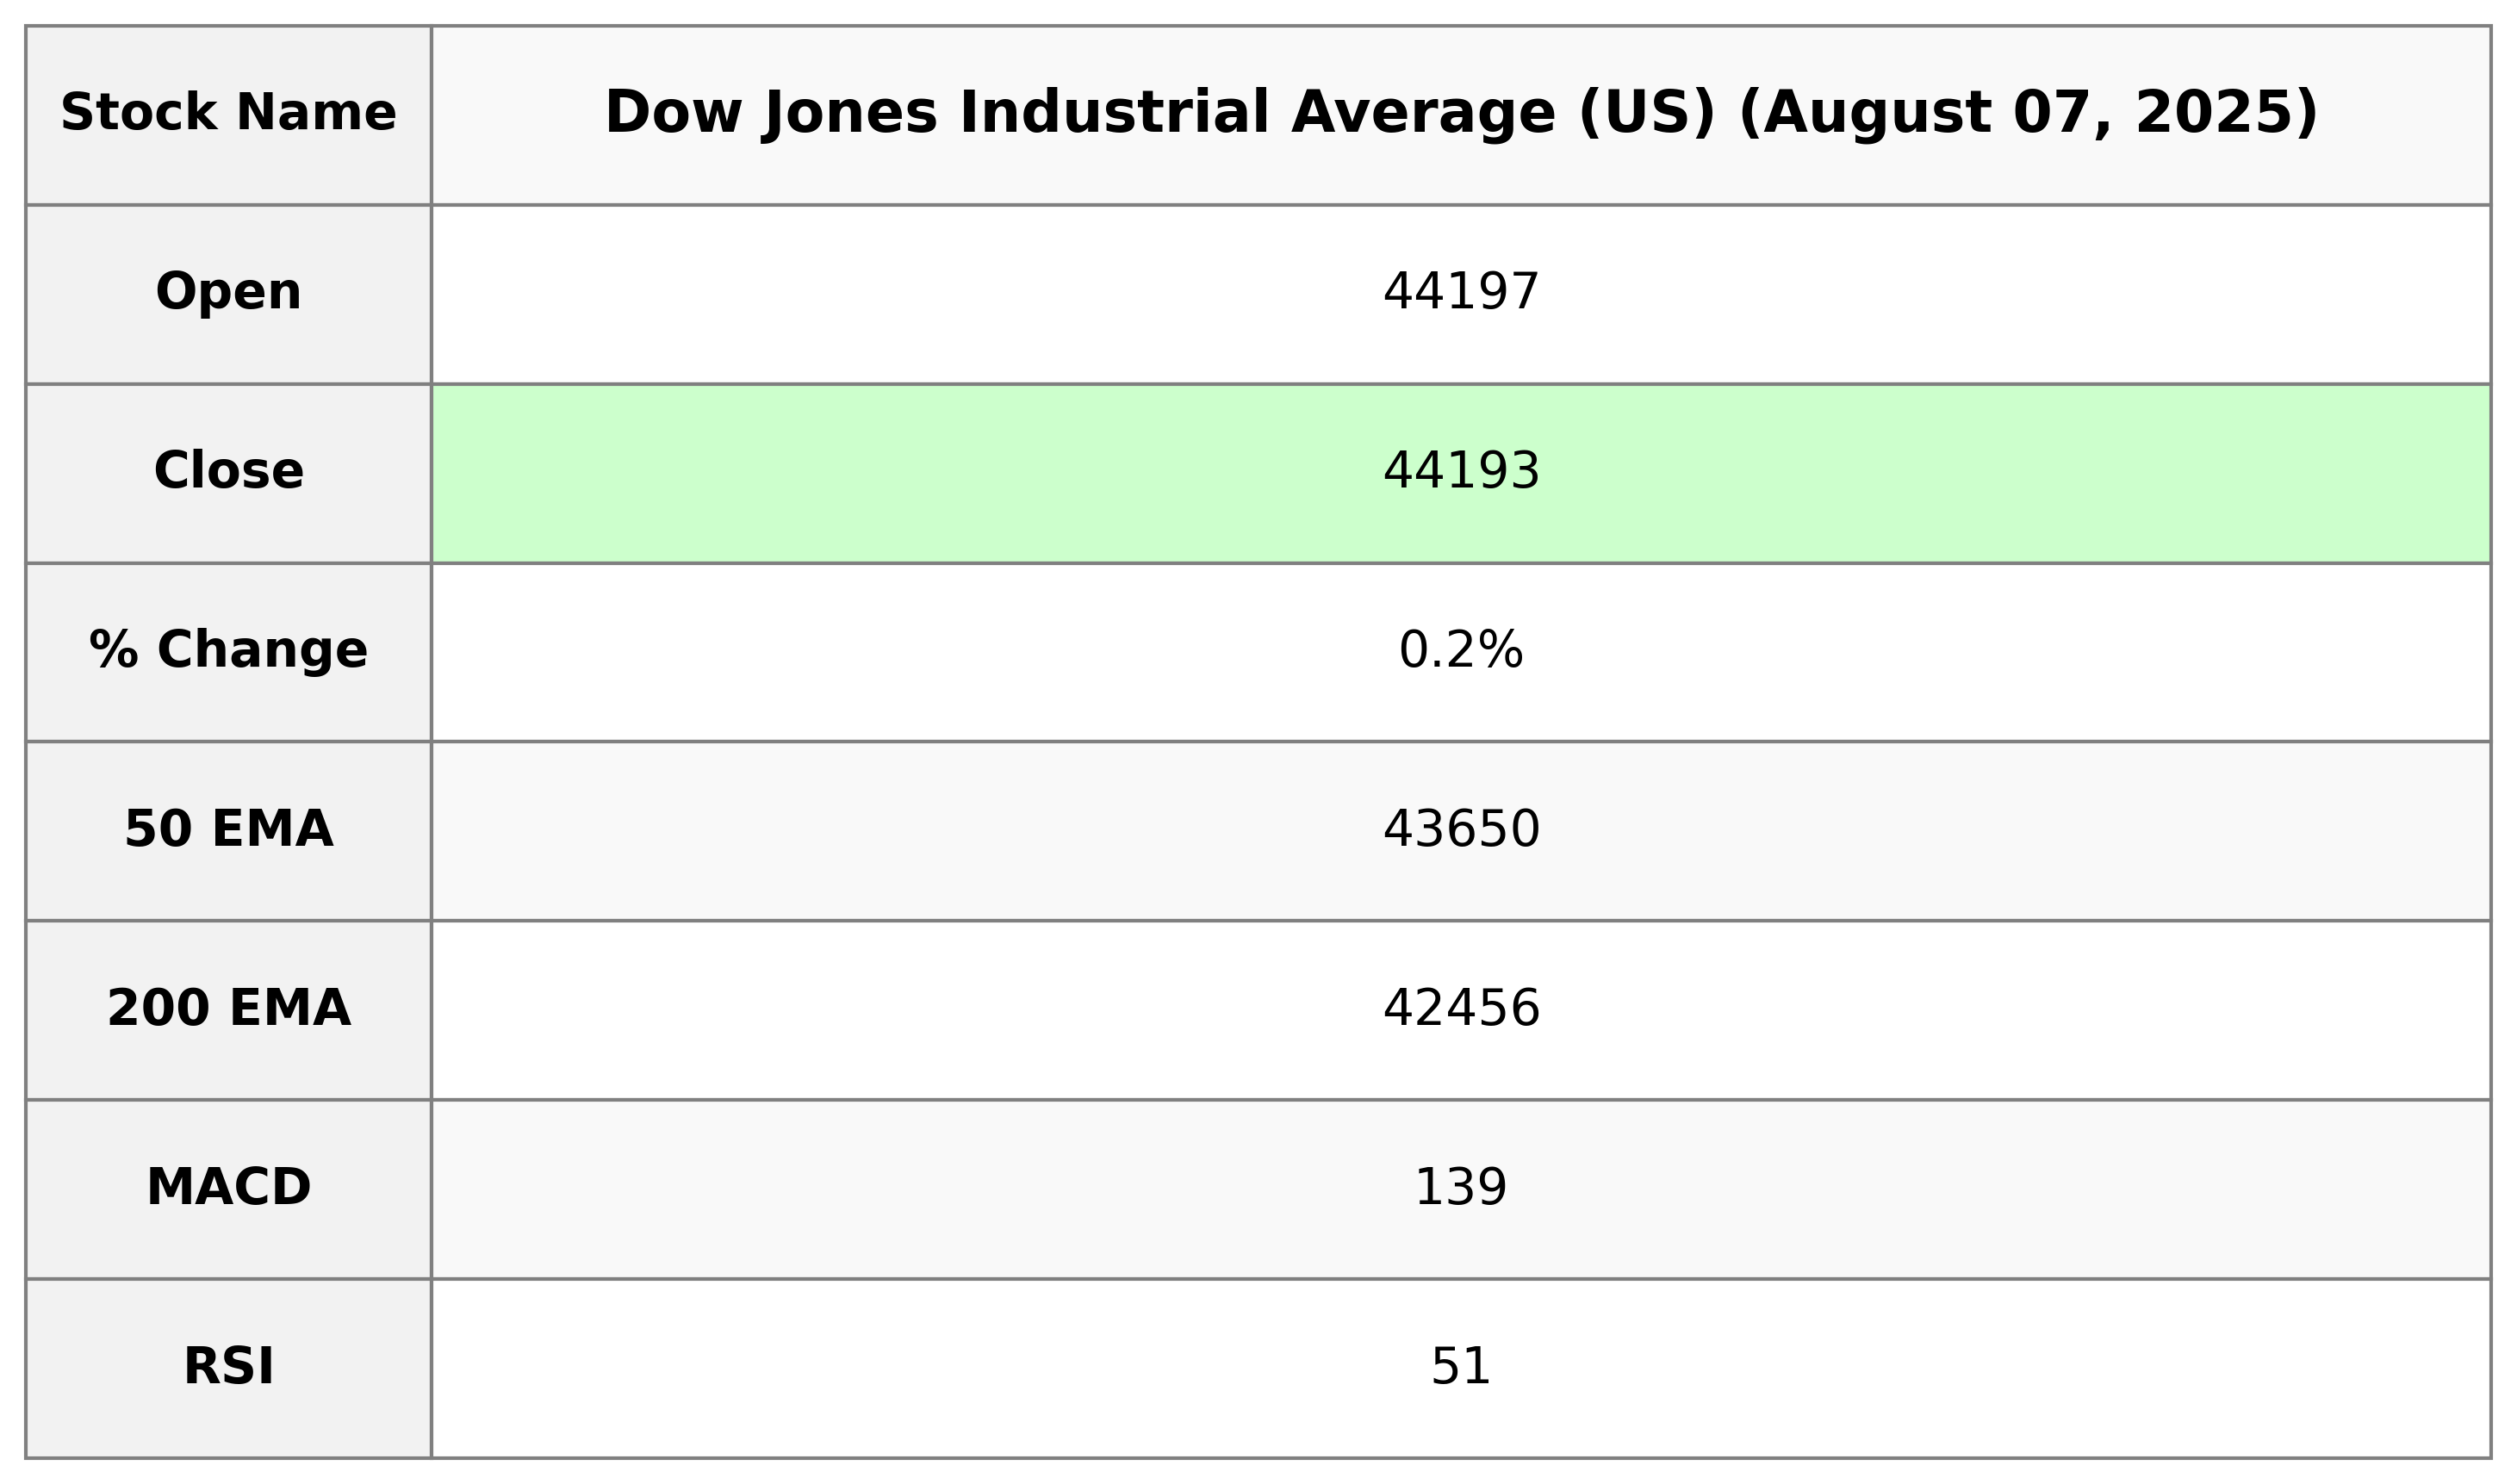
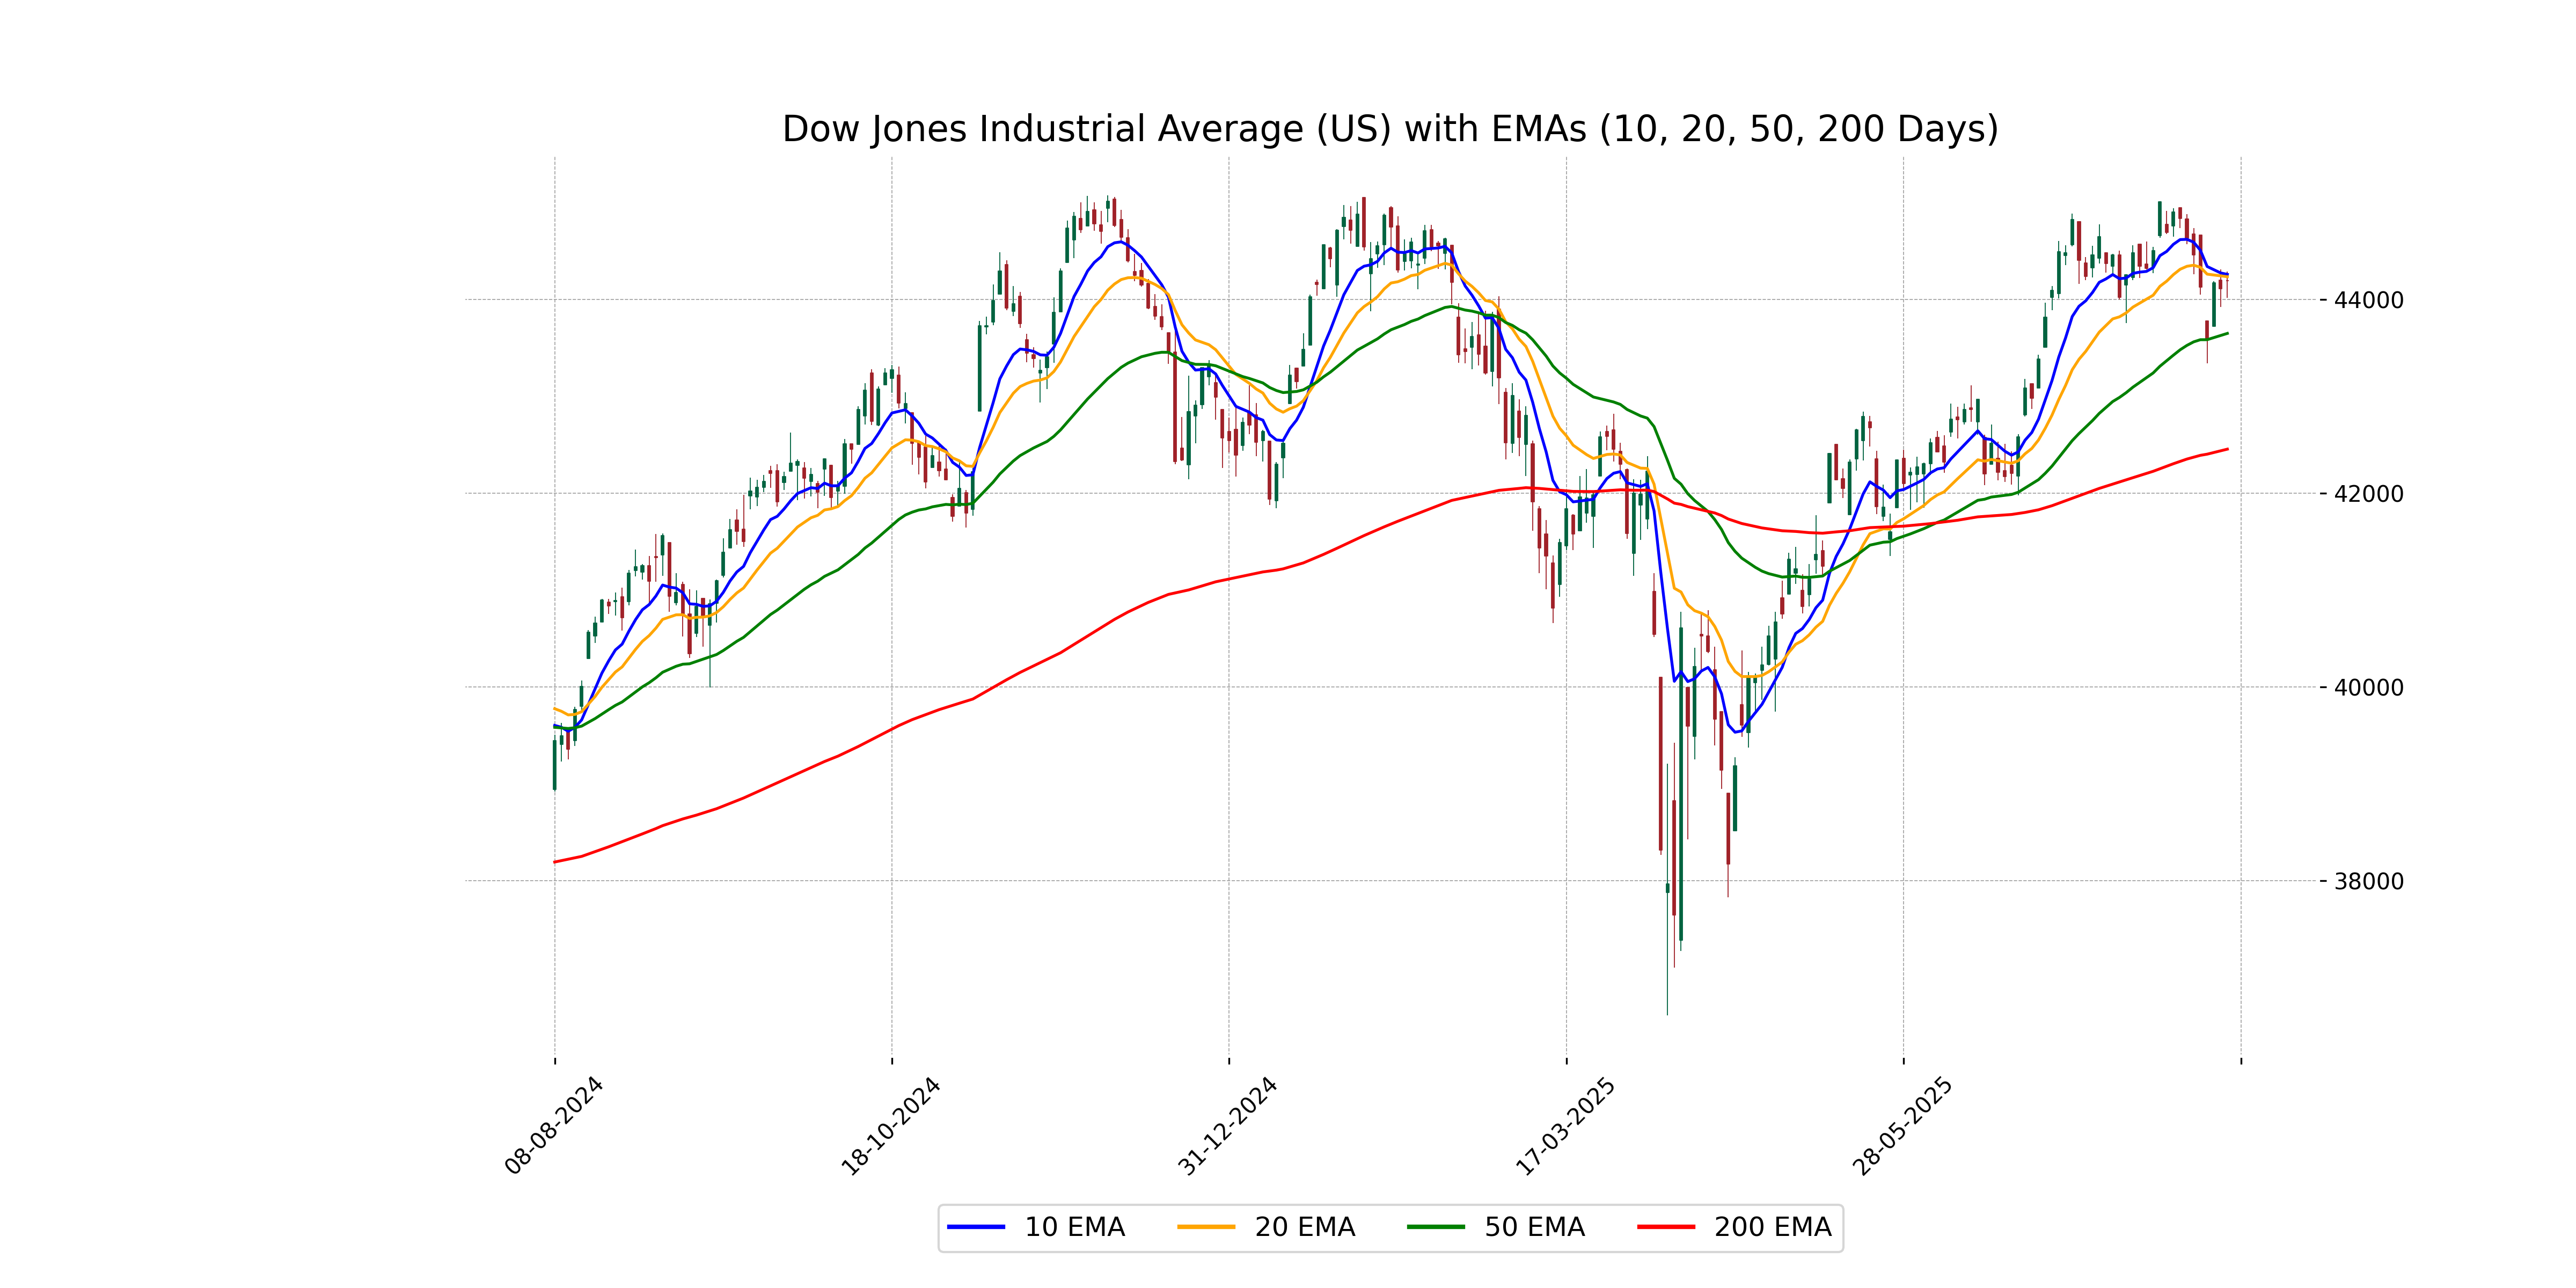
The Dow Jones Industrial Average (US) opened at 44,196.61, with a high of 44,290.09 and a low of 44,017.71, closing at 44,193.12. It showed a slight increase with a 0.18% change and a points change of 81.38. The RSI stands at 51.13, suggesting a neutral momentum.
Relationship with Key Moving Averages
For Dow Jones Industrial Average (US), the latest close of 44193.1211 is above its 50-day EMA of 43650.3913 and significantly above the 200-day EMA of 42455.5164, indicating a general uptrend. However, it falls below the 10-day EMA of 44259.7592 and the 20-day EMA of 44235.7928, suggesting some recent downward pressure in the short term.
Moving Averages Trend (MACD)
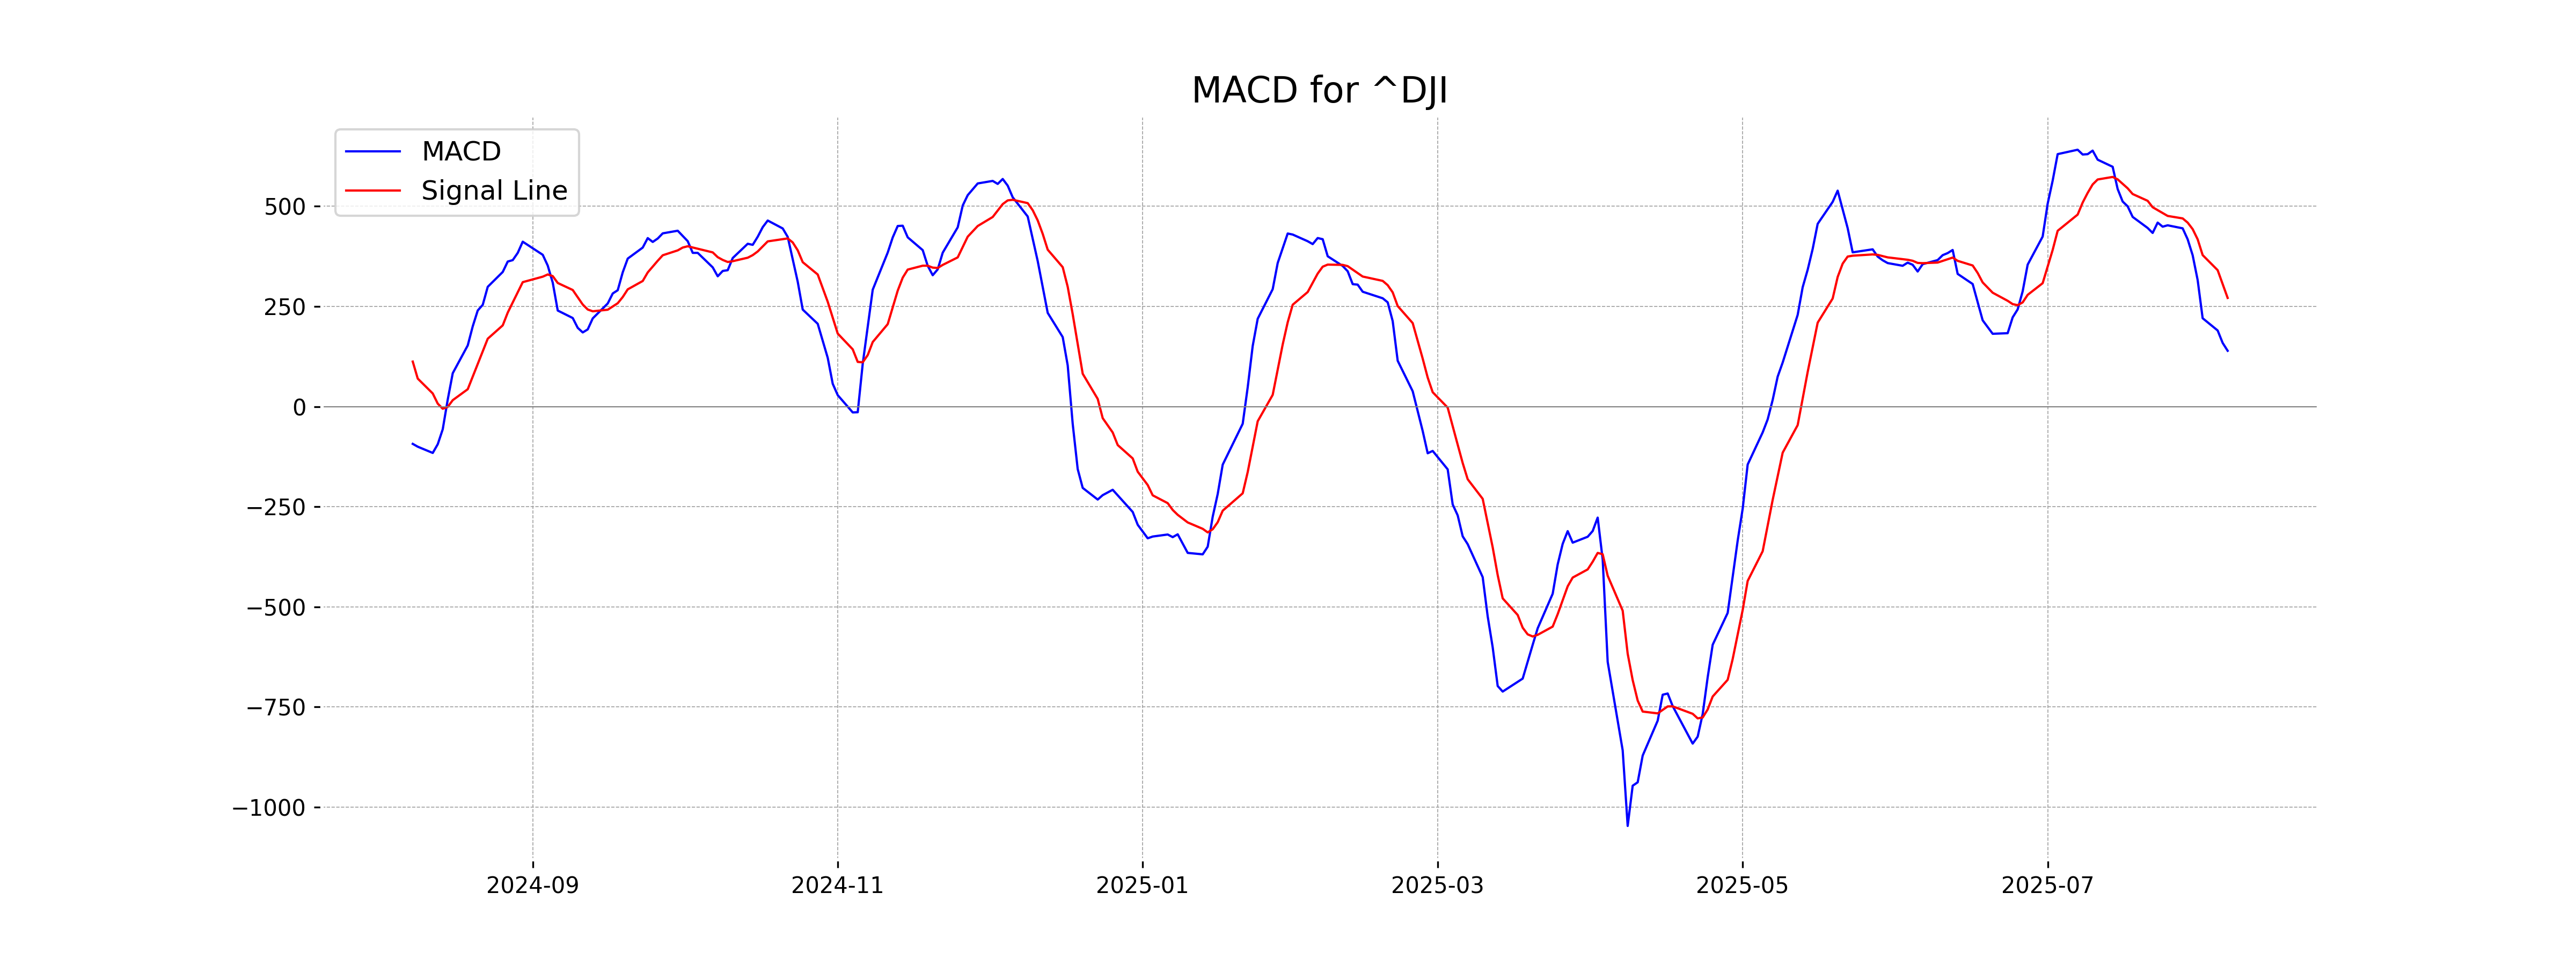
The MACD value for the Dow Jones Industrial Average is 139.29, which is below the MACD Signal line at 271.22. This indicates a potential bearish signal as the MACD line is under the signal line, suggesting weakened momentum in the short term.
RSI Analysis
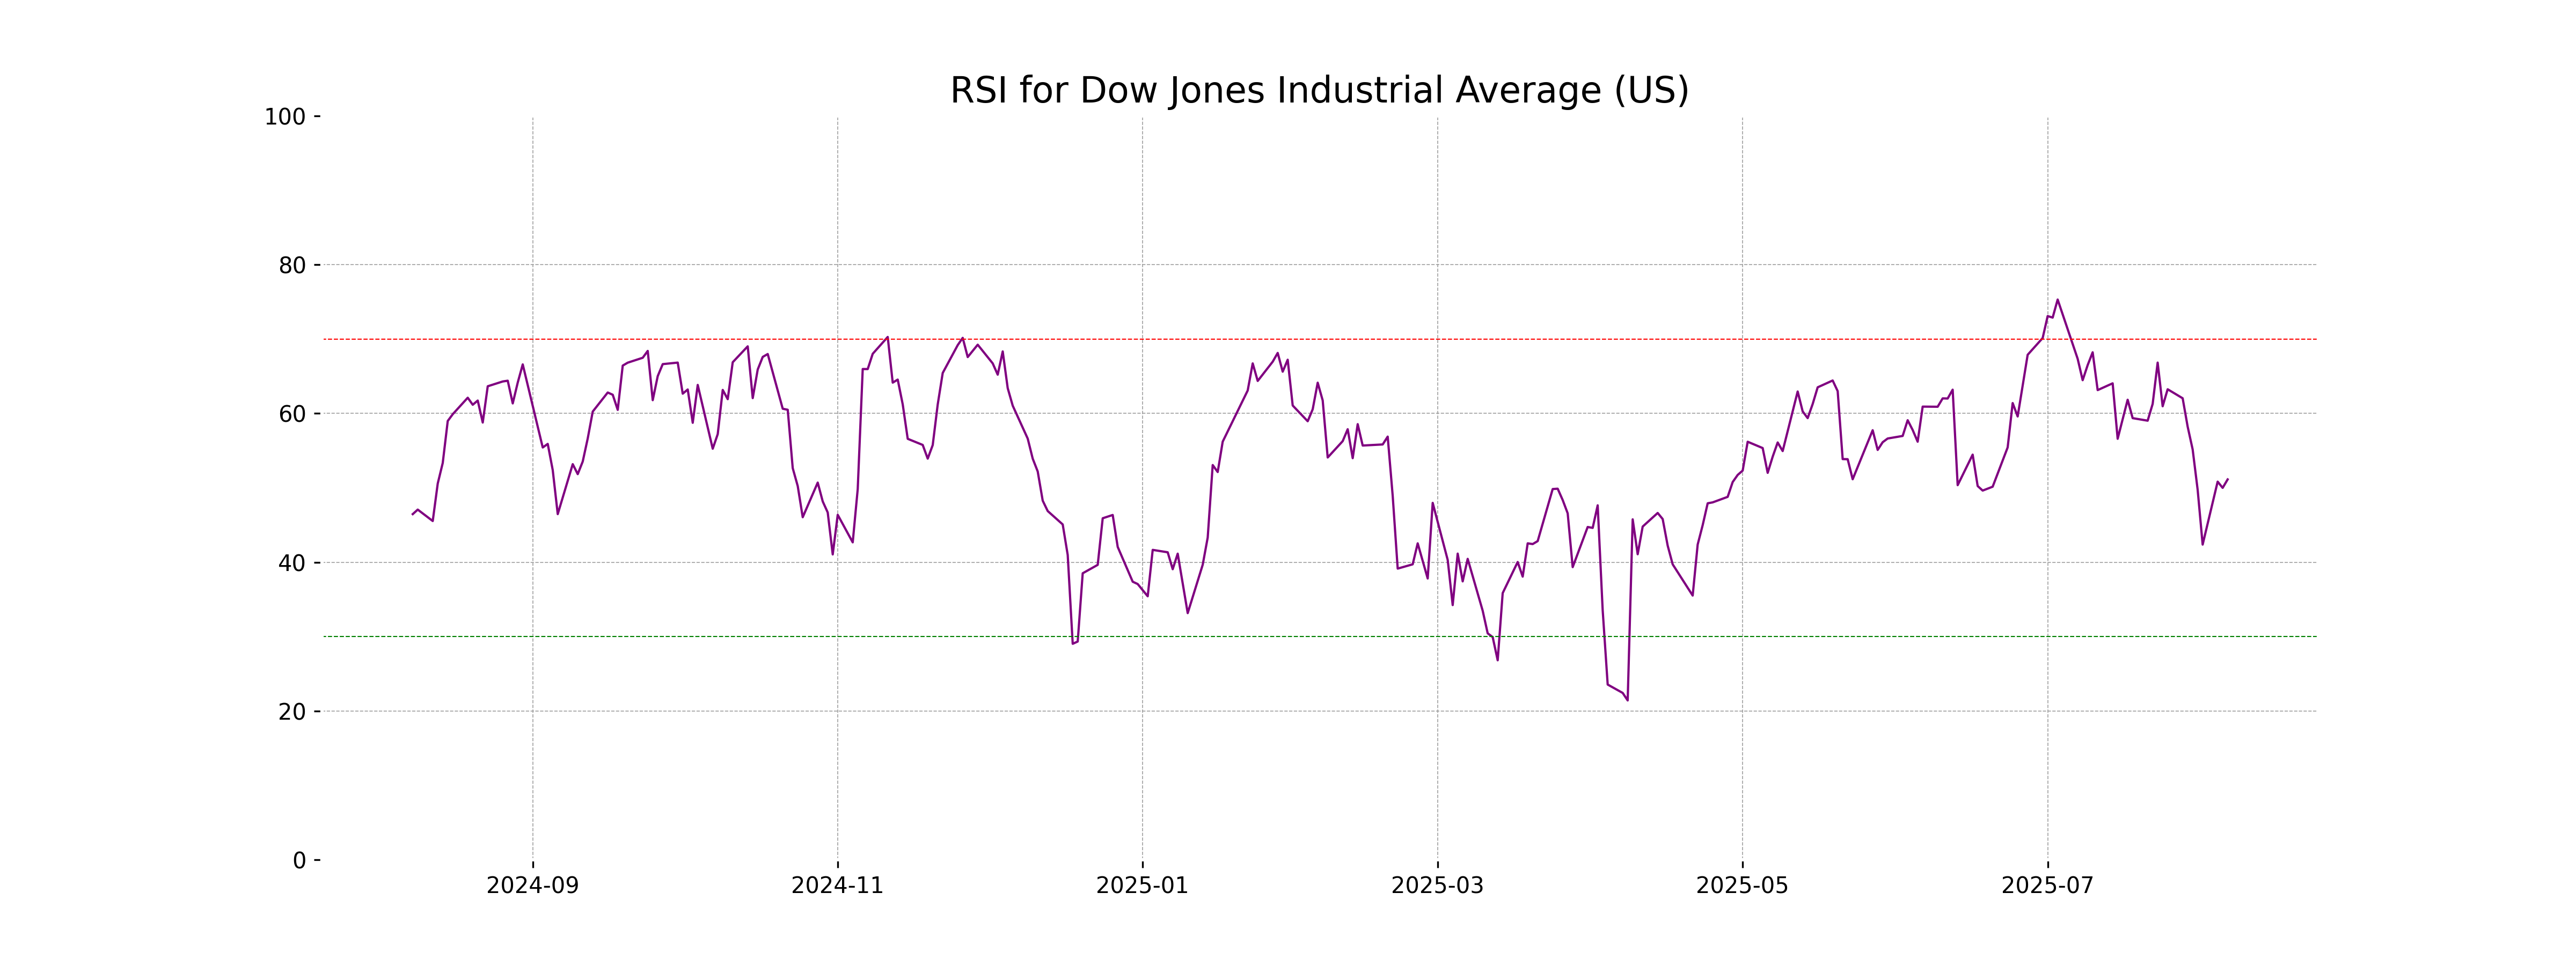
Dow Jones Industrial Average RSI Analysis: The RSI for the Dow Jones Industrial Average is 51.13, indicating a neutral momentum. This level suggests neither overbought nor oversold conditions, which may signal a period of consolidation or potential trend continuation.
Analysis for CAC 40 (France) - August 07, 2025
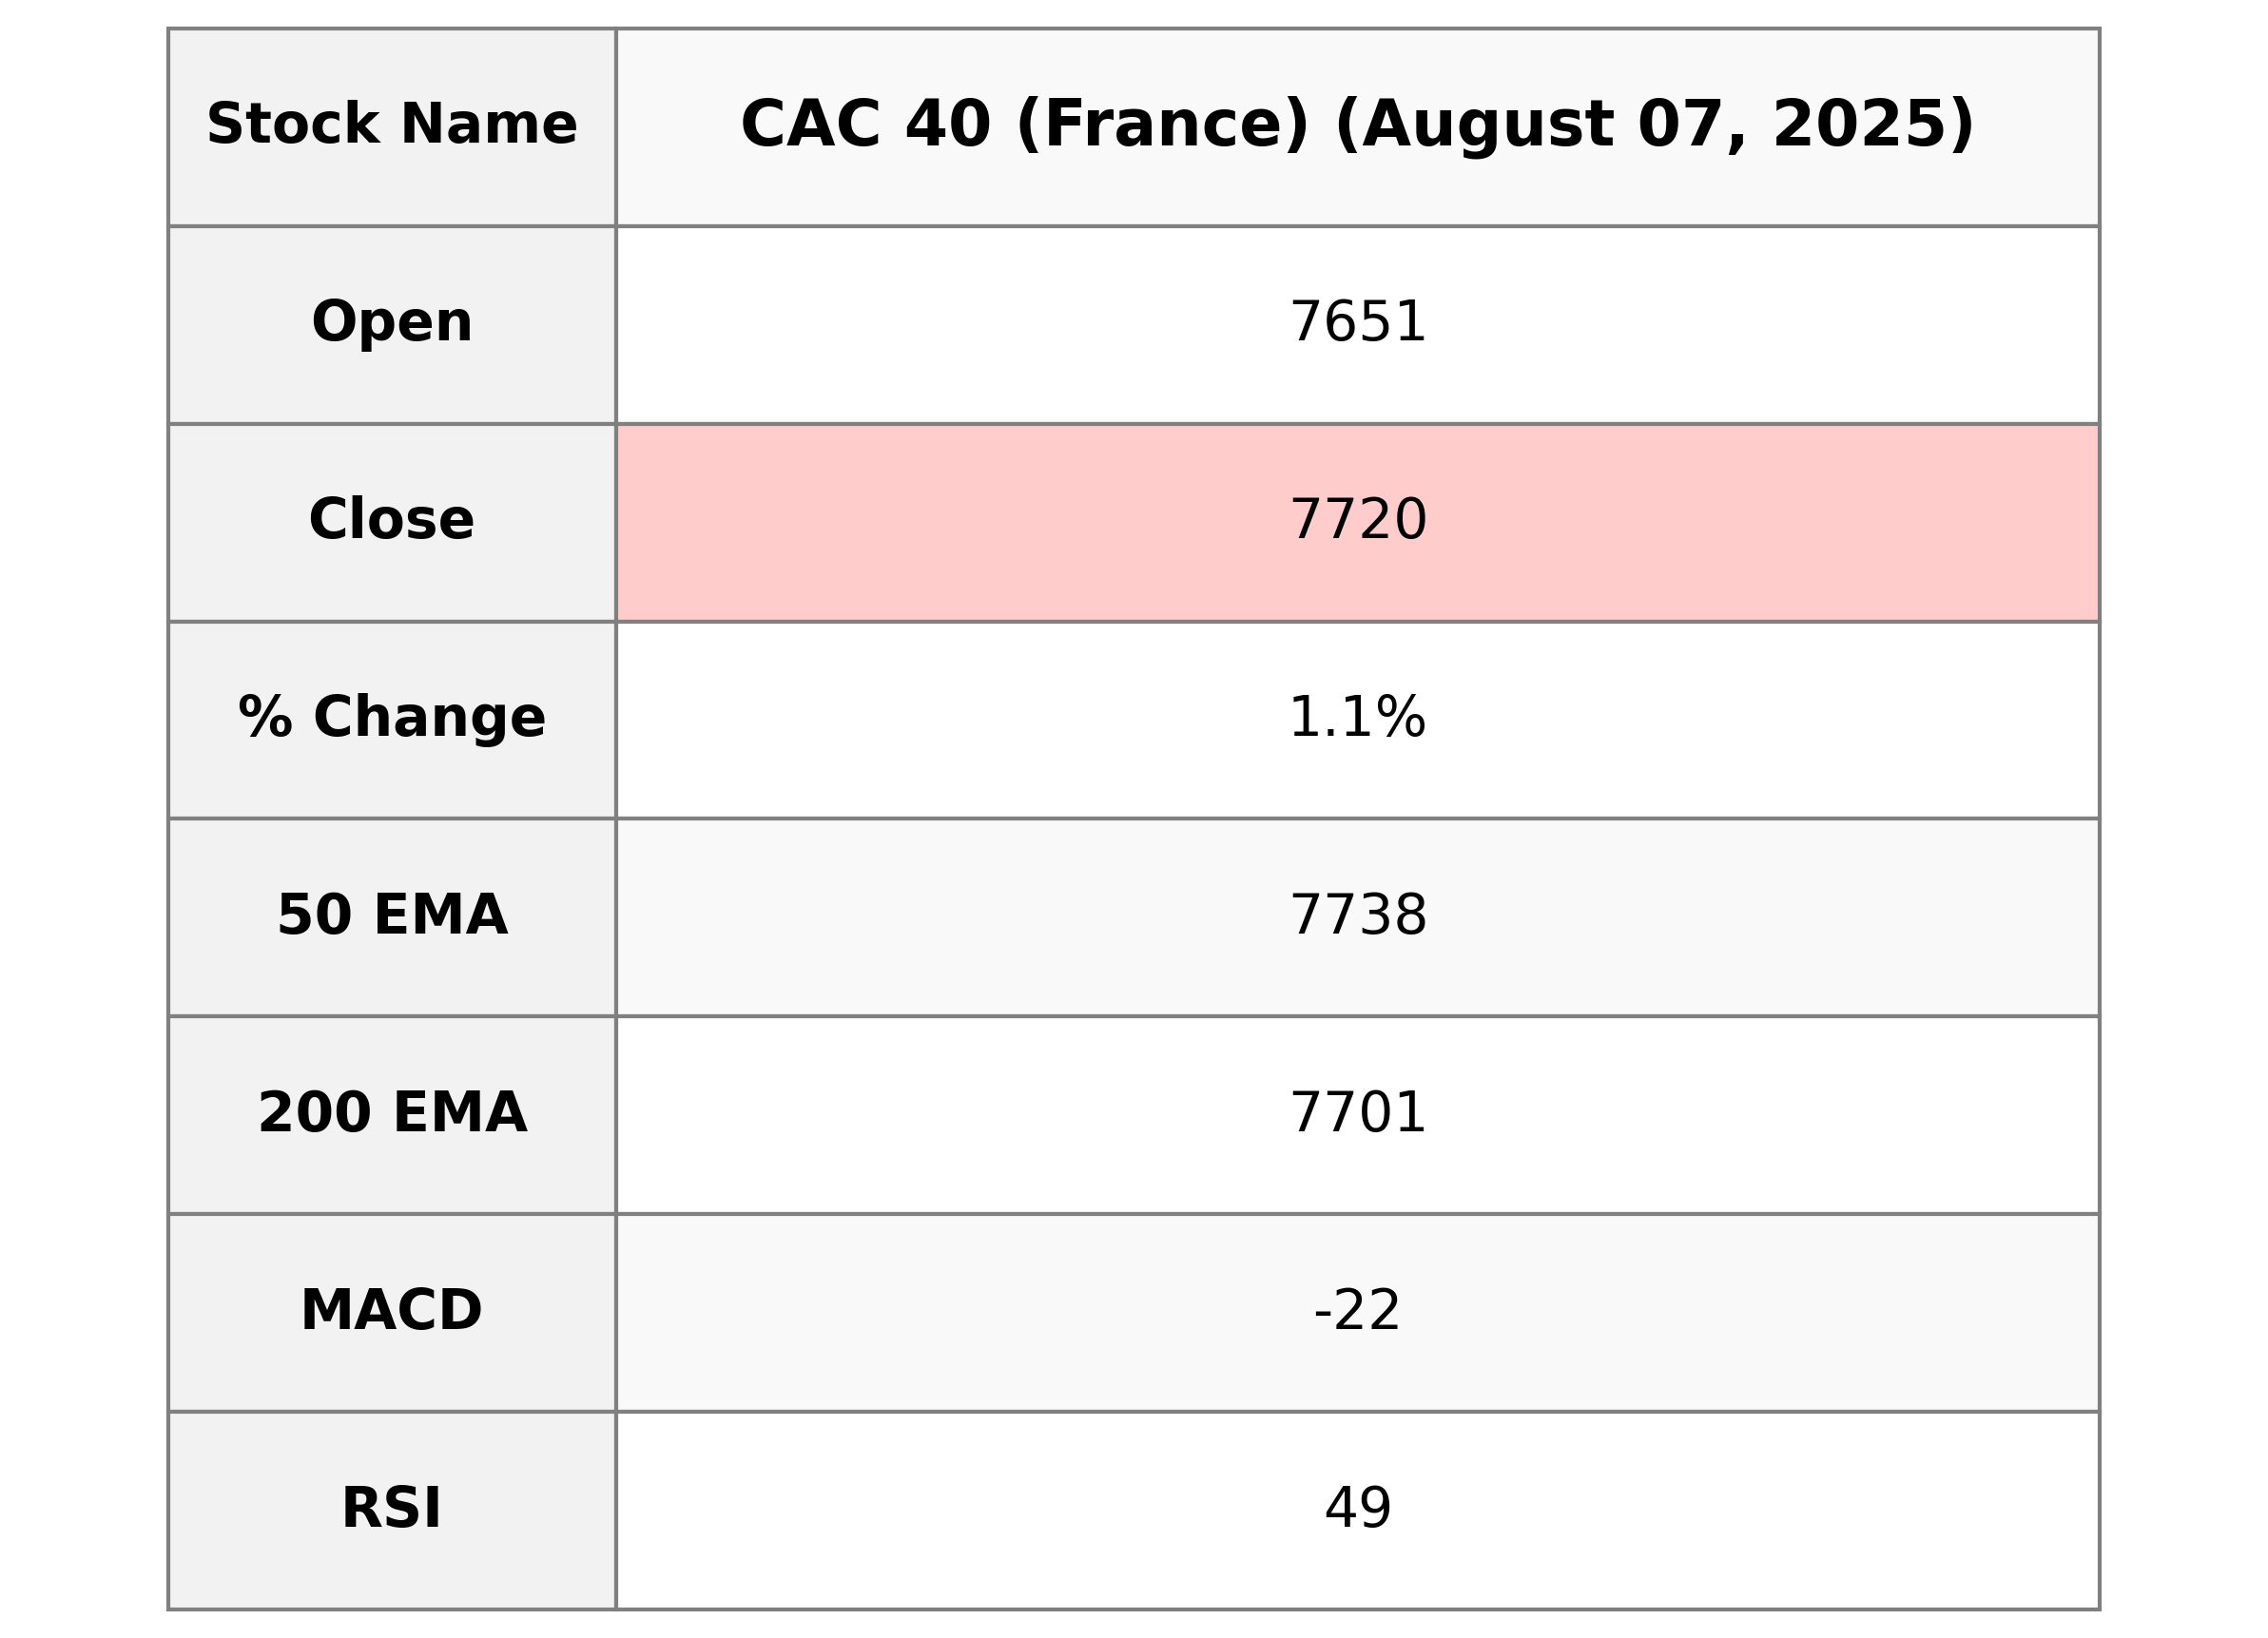
CAC 40 (France) opened at 7651.40 and closed higher at 7720.31, marking a 1.12% increase from the previous close of 7635.03, with a points change of 85.28. Despite the positive daily performance, the index is below its 50-Day EMA of 7738.13 and its MACD of -21.84 indicates a bearish trend, while the RSI of 48.85 suggests a neutral market sentiment.
Relationship with Key Moving Averages
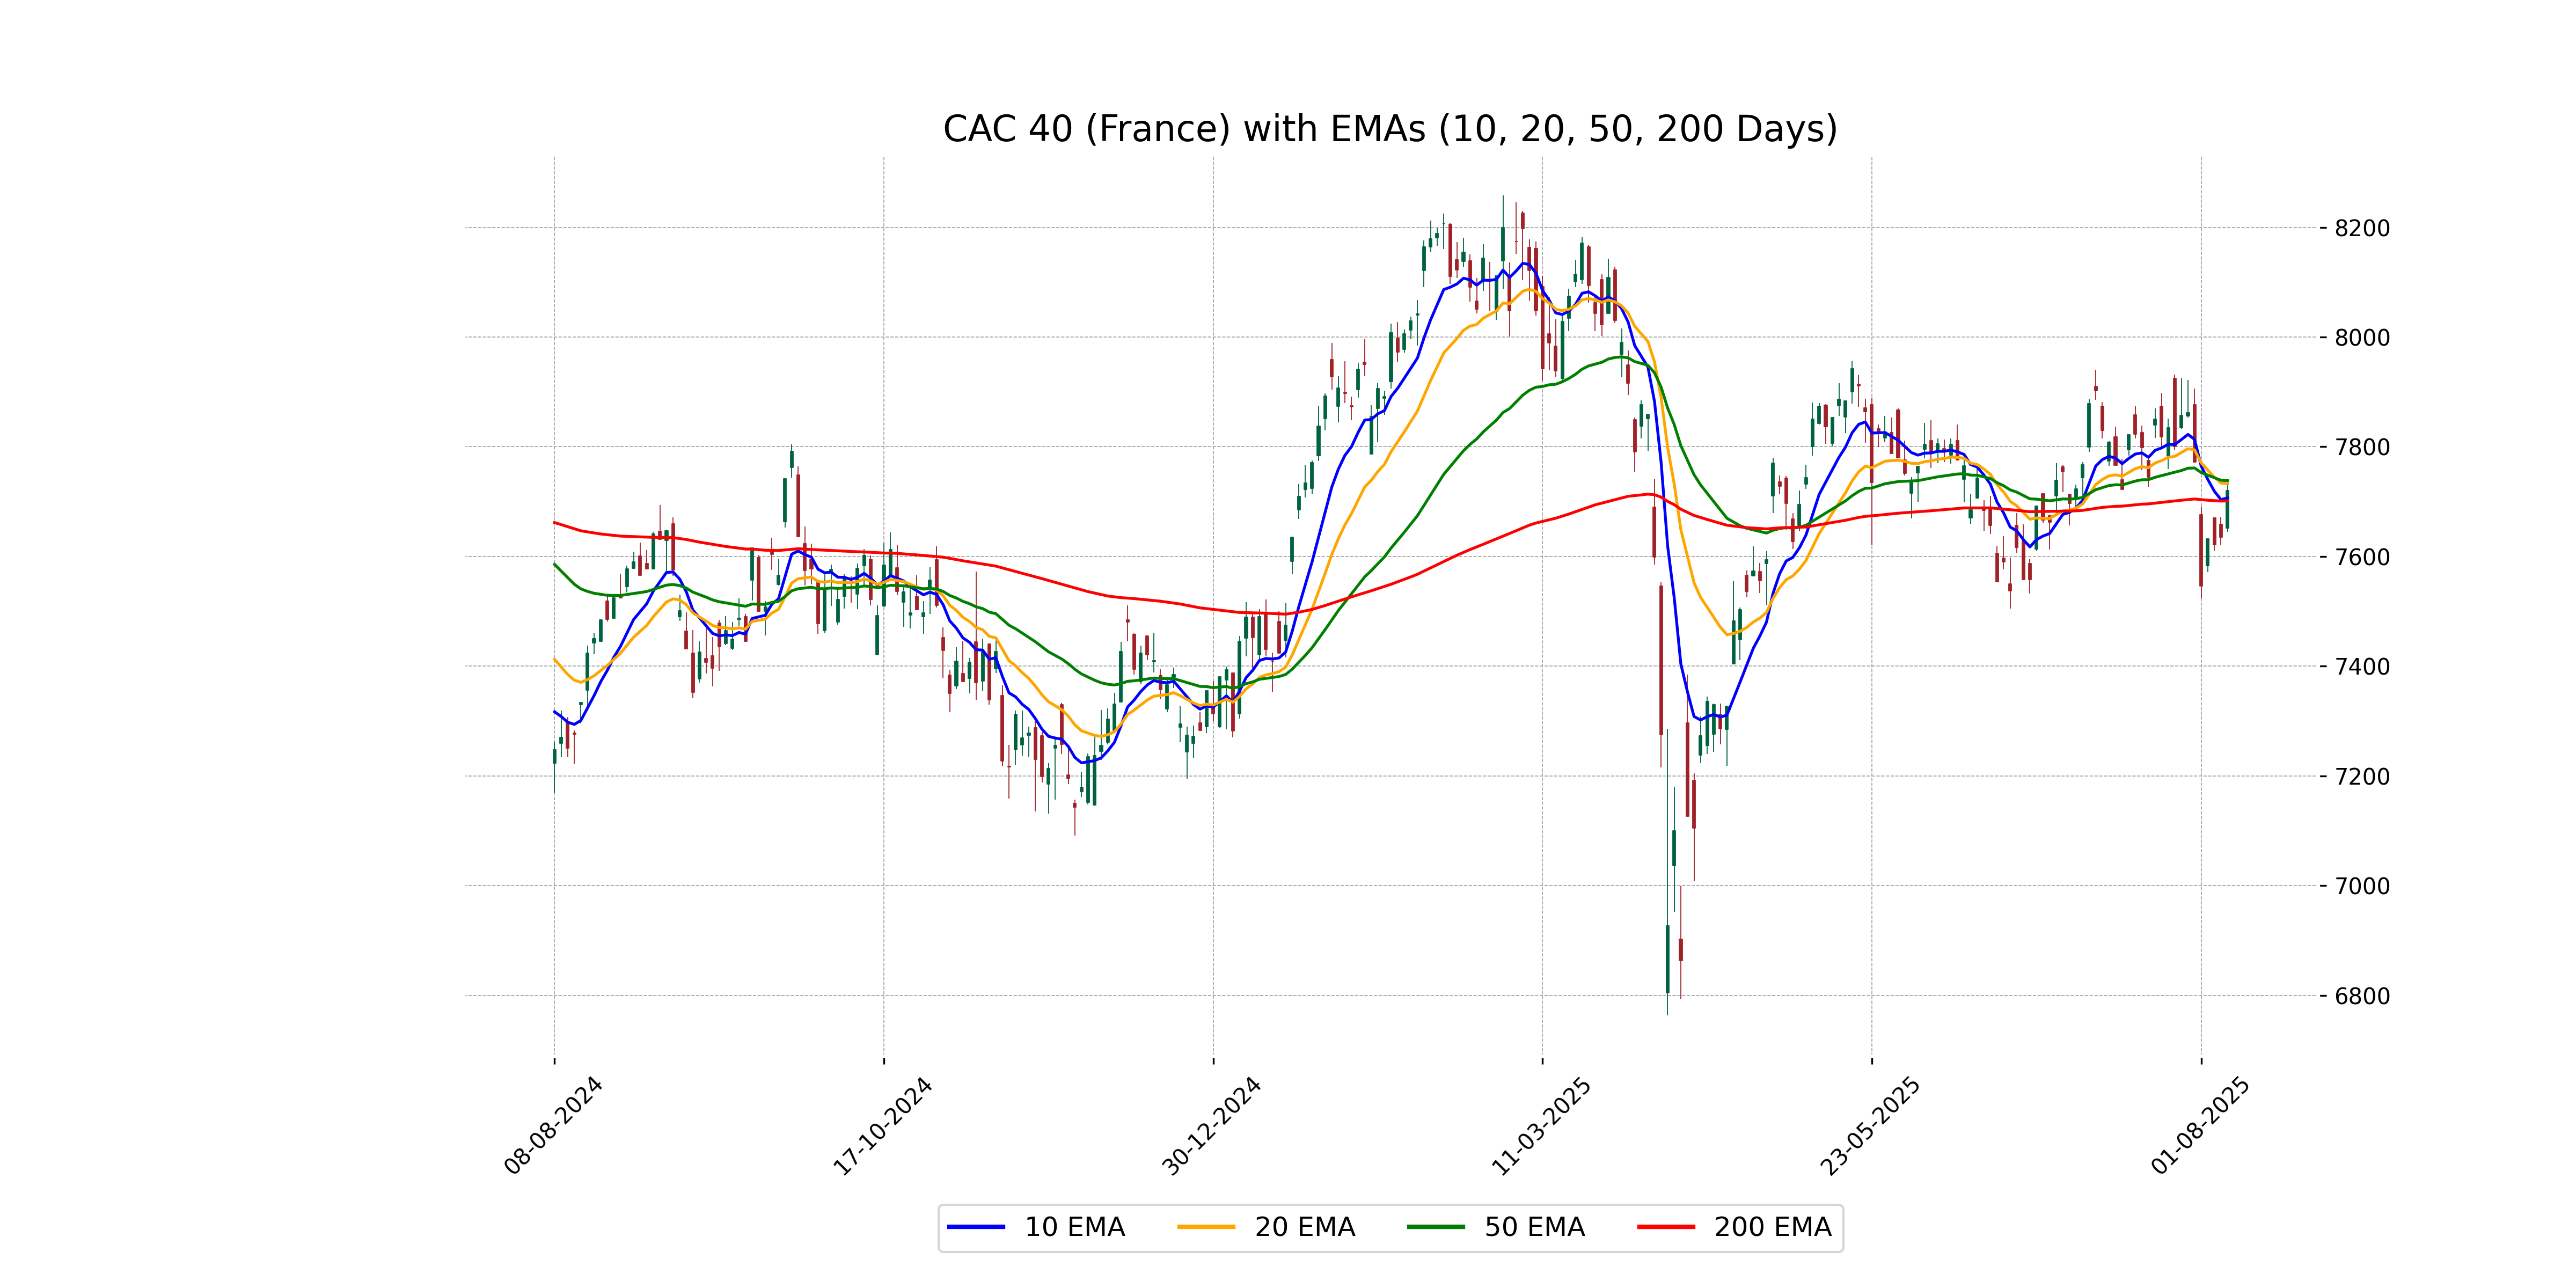
The CAC 40 index closed at 7720.31, which is slightly below its 50-day EMA (7738.13) and just below the 20-day EMA (7732.64), indicating potential resistance near these levels. However, it is slightly above the 10-day EMA (7706.63) and the 200-day EMA (7701.16), suggesting mild bullish momentum in the short term.
Moving Averages Trend (MACD)
The MACD for CAC 40 (France) is currently negative at -21.84, indicating potential bearish momentum, as it is below the MACD Signal line of -2.40. This suggests that the recent trend may continue downwards unless a reversal occurs.
RSI Analysis
The RSI for CAC 40 (France) is 48.85, indicating that the index is in a neutral zone. An RSI around 50 suggests the market is neither overbought nor oversold, showing a balanced momentum.
Analysis for FTSE 100 (UK) - August 07, 2025
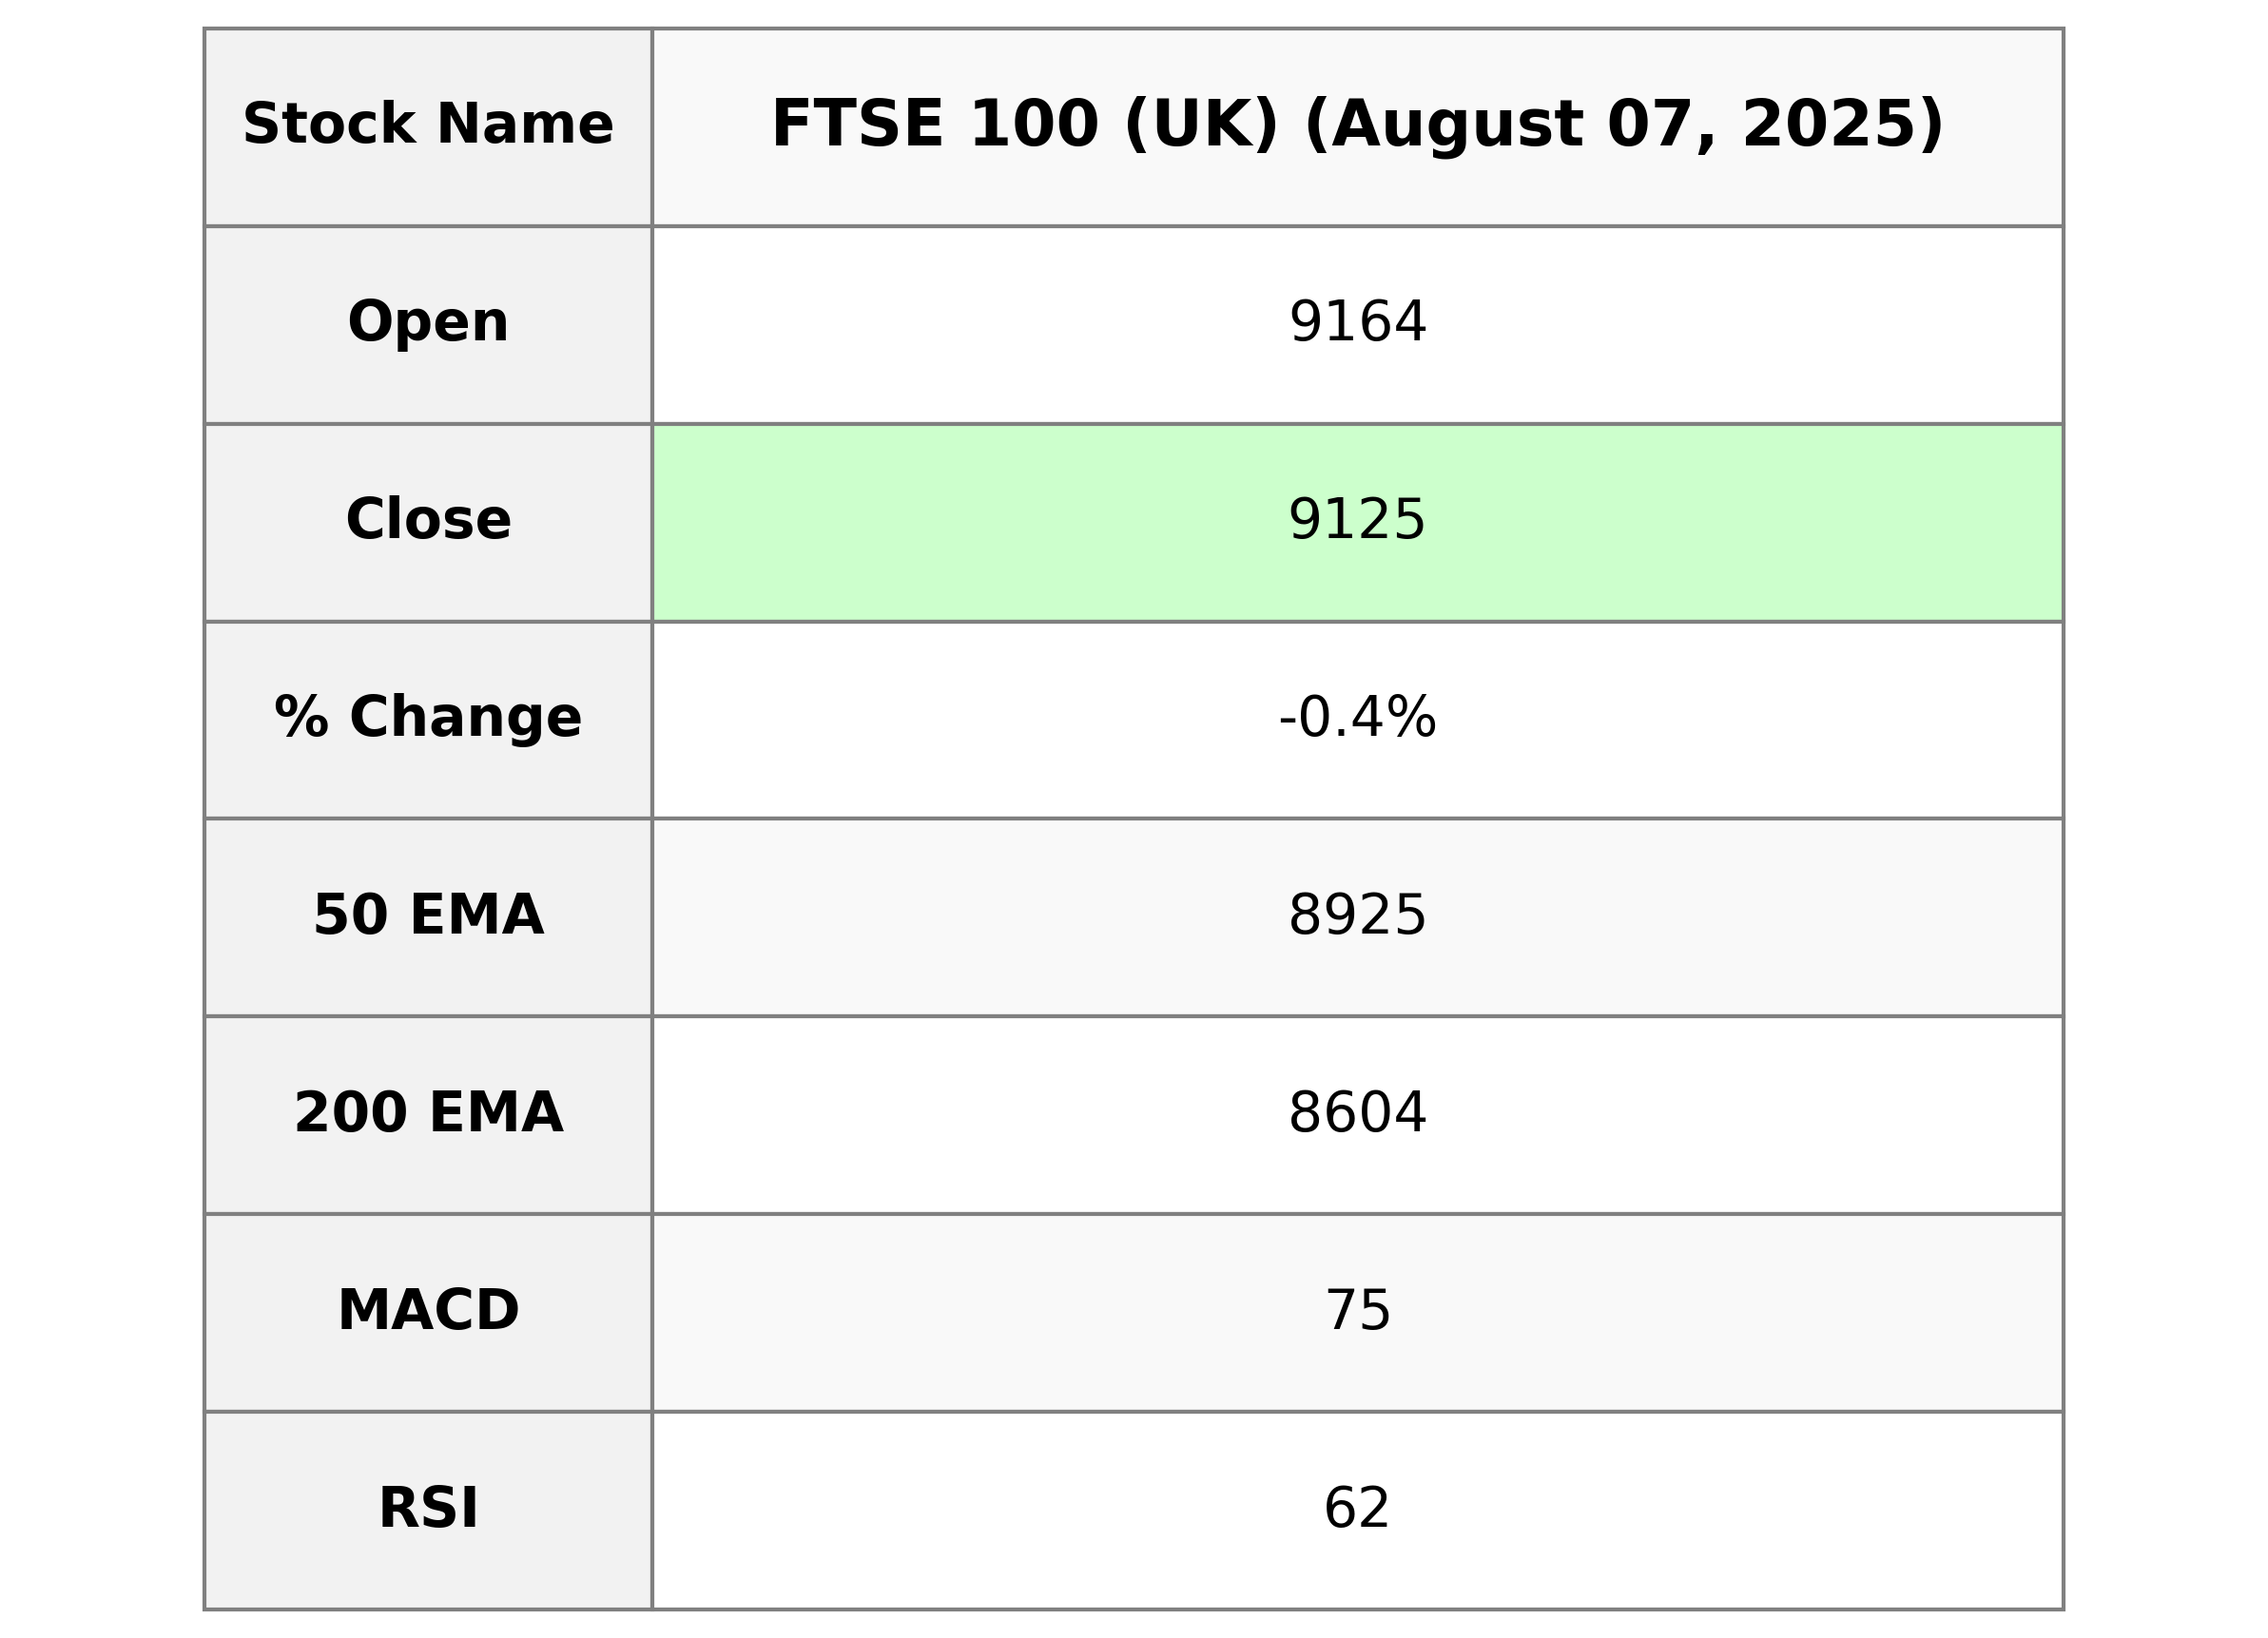
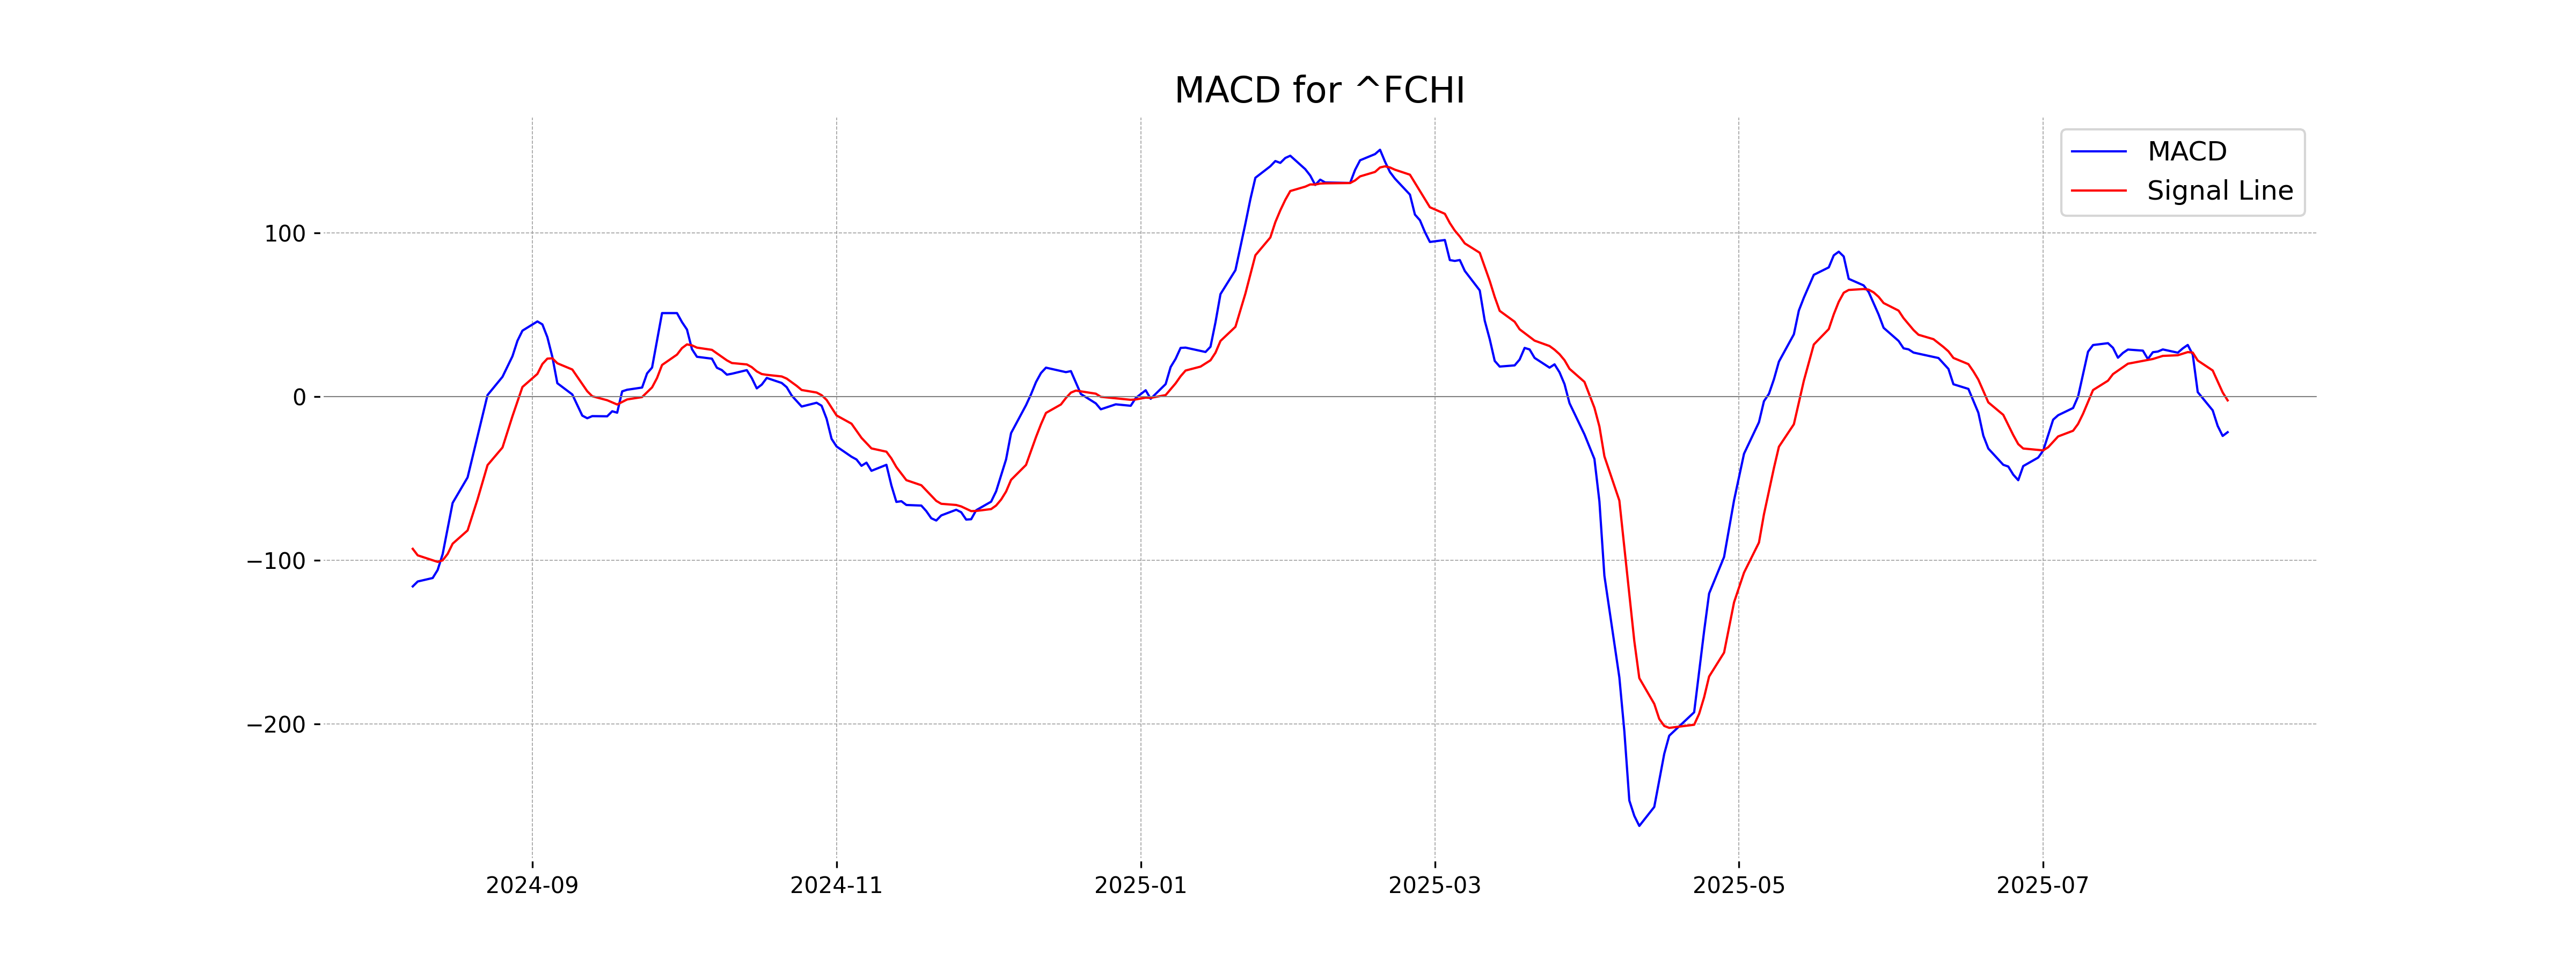
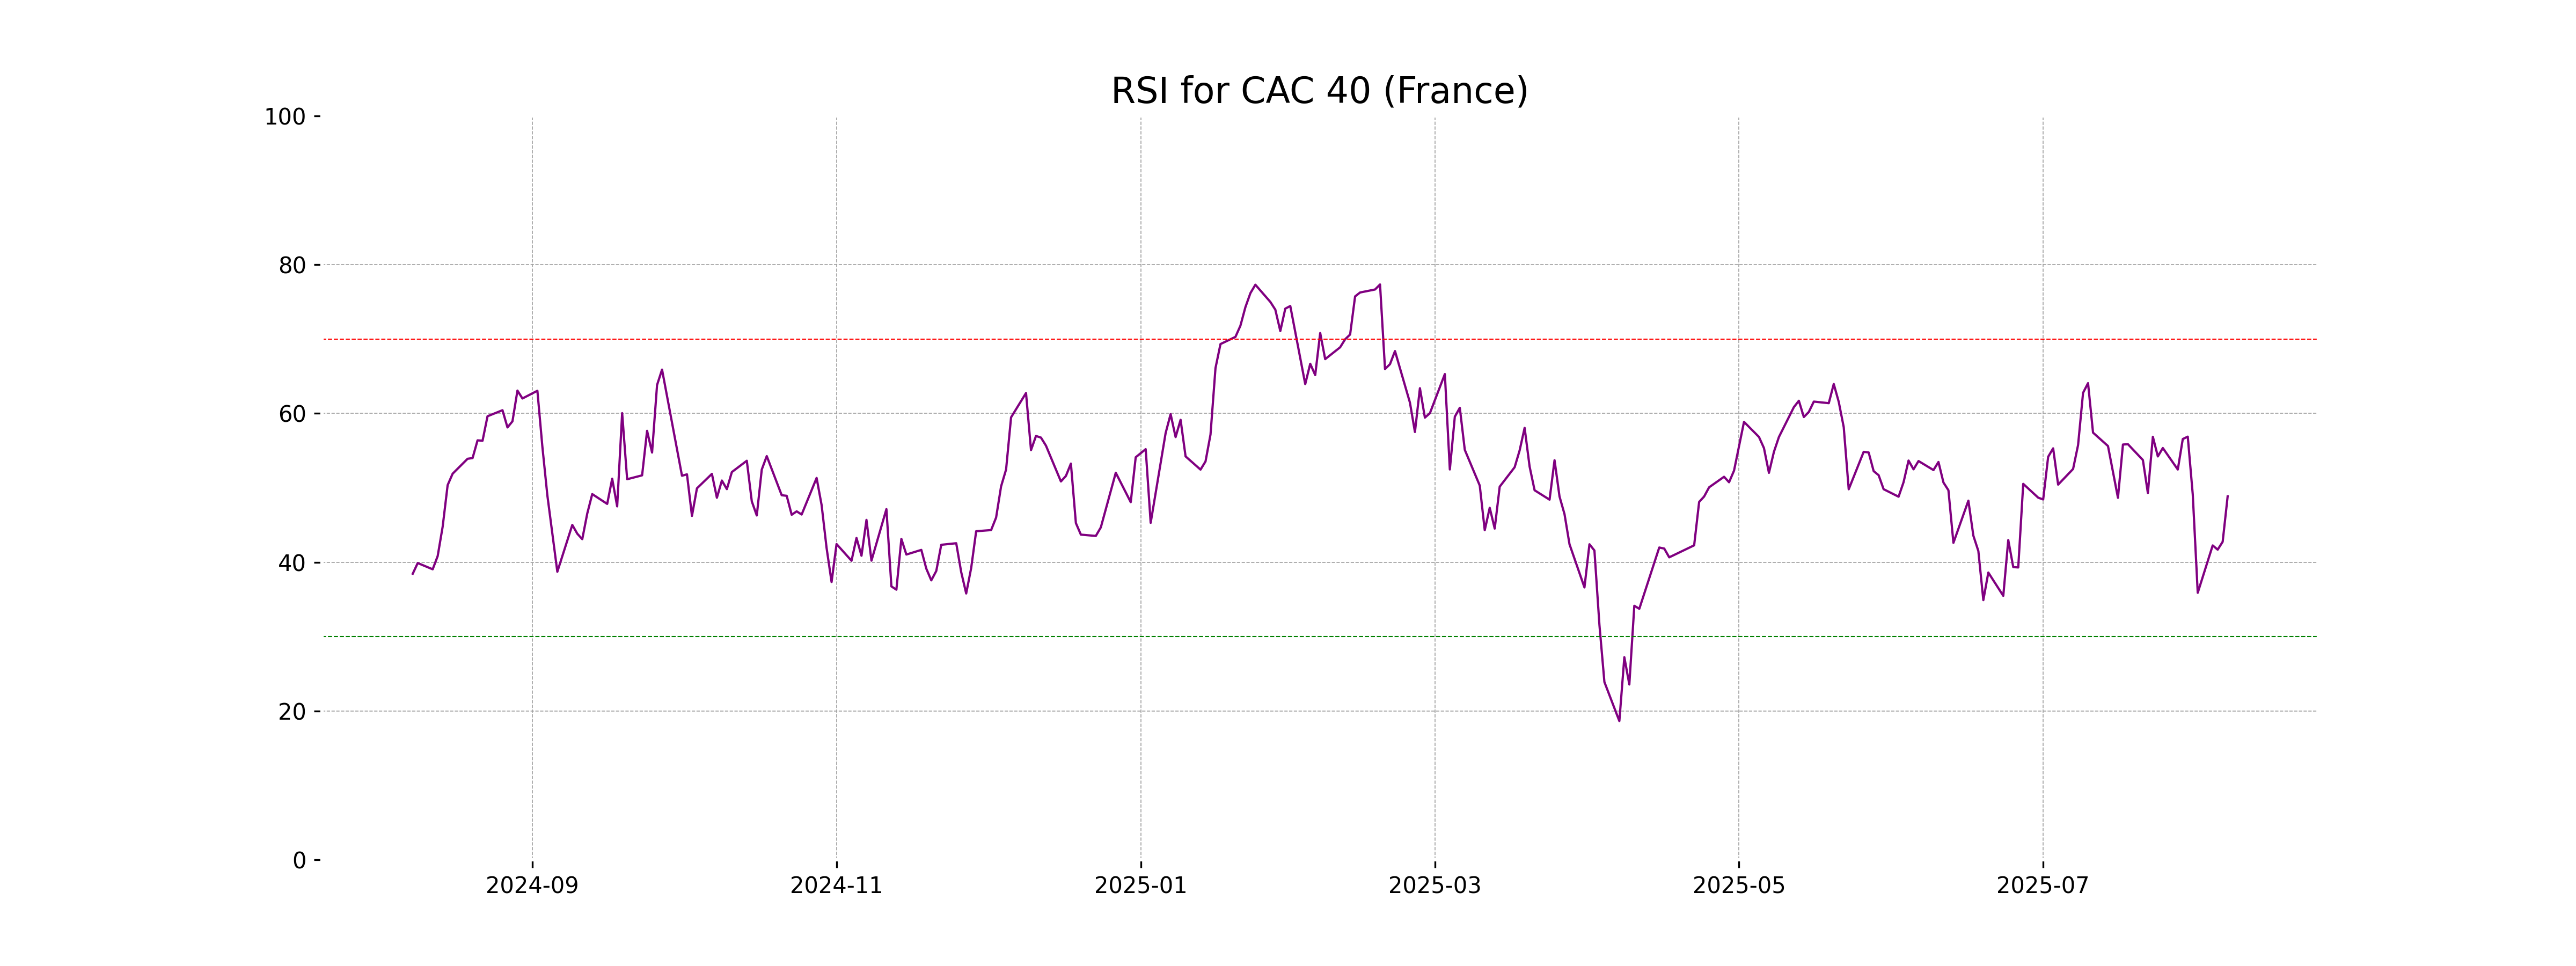
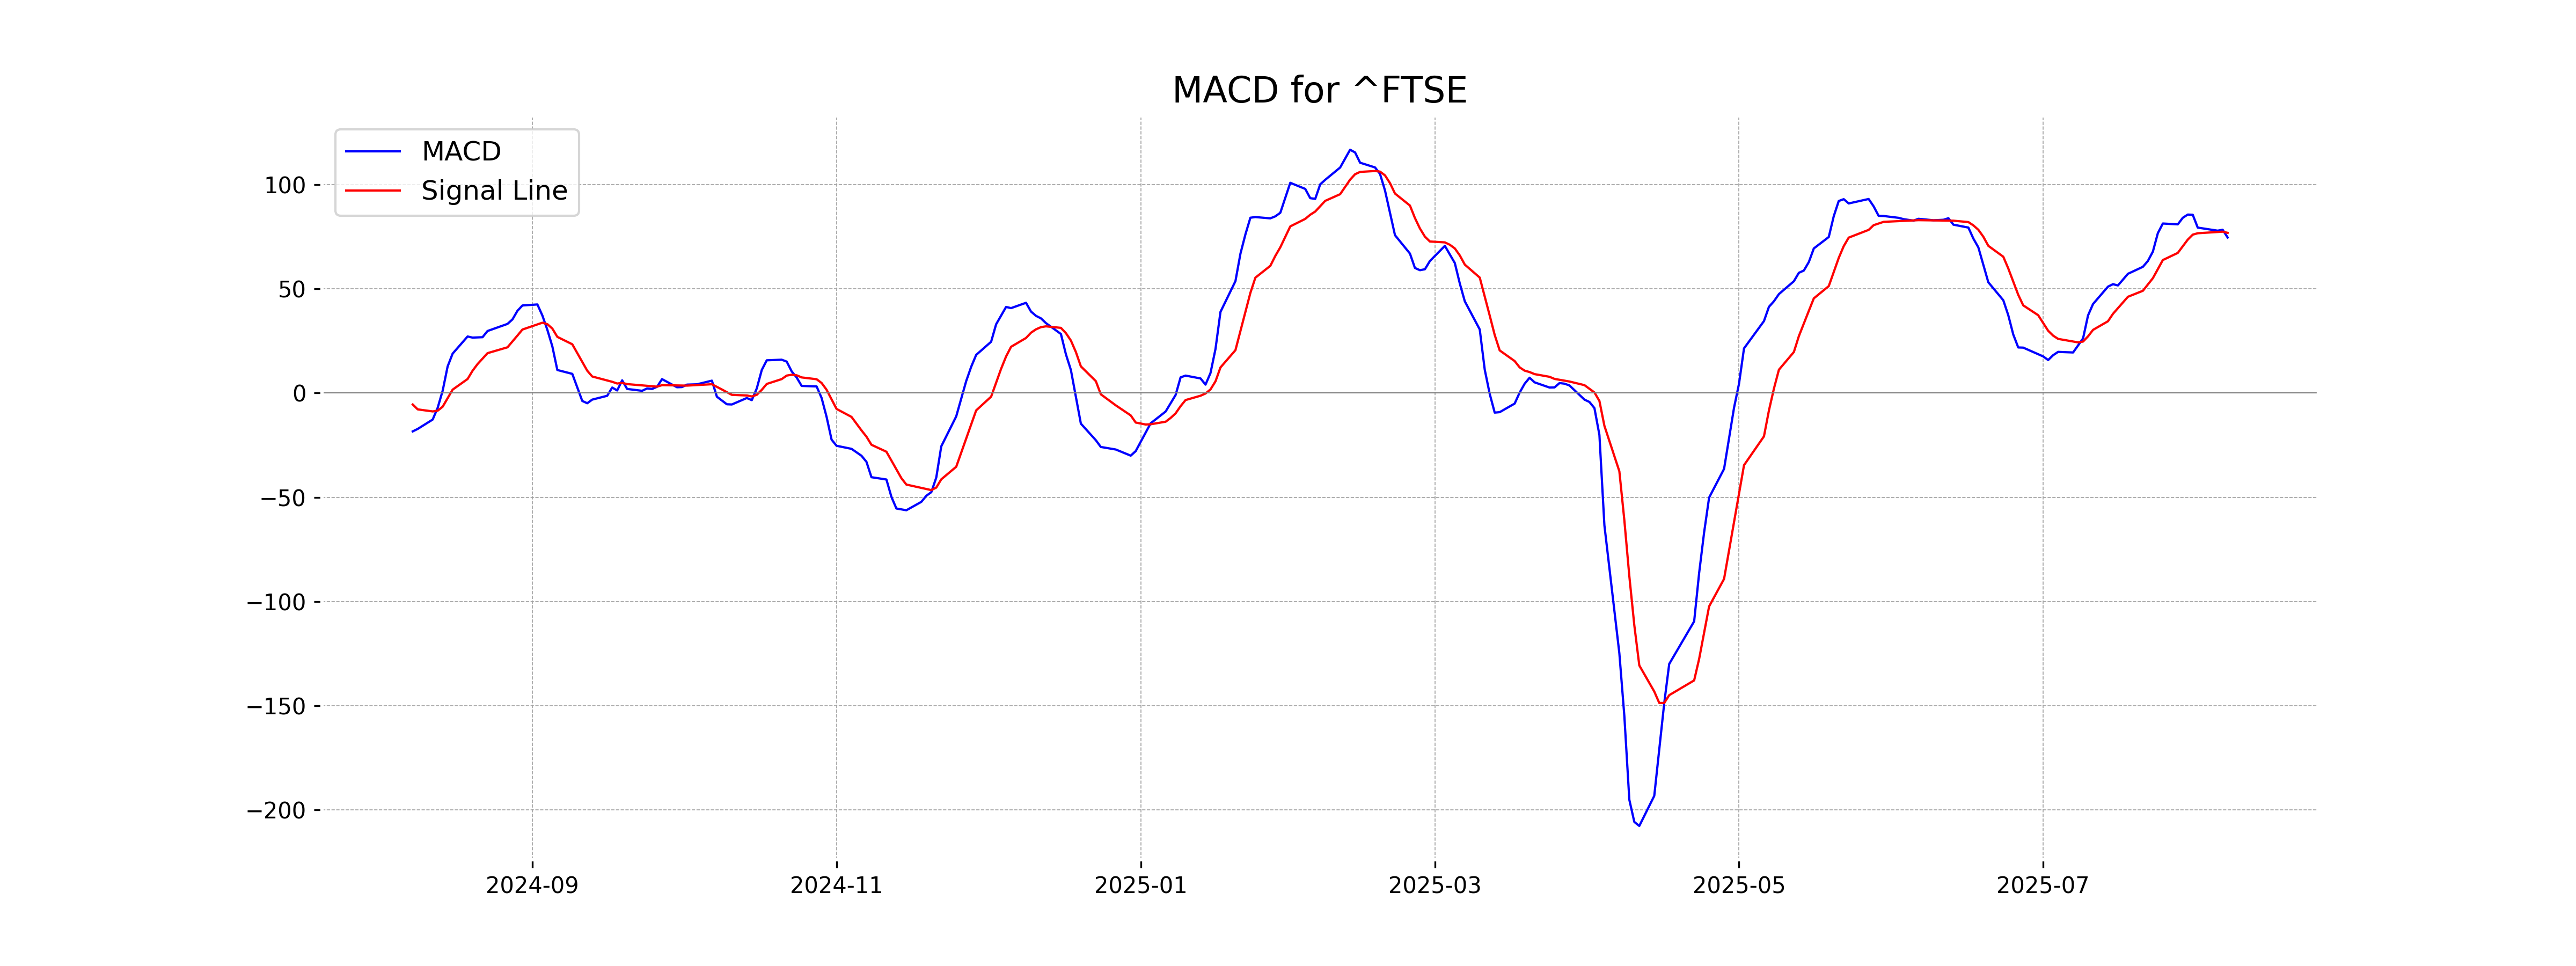
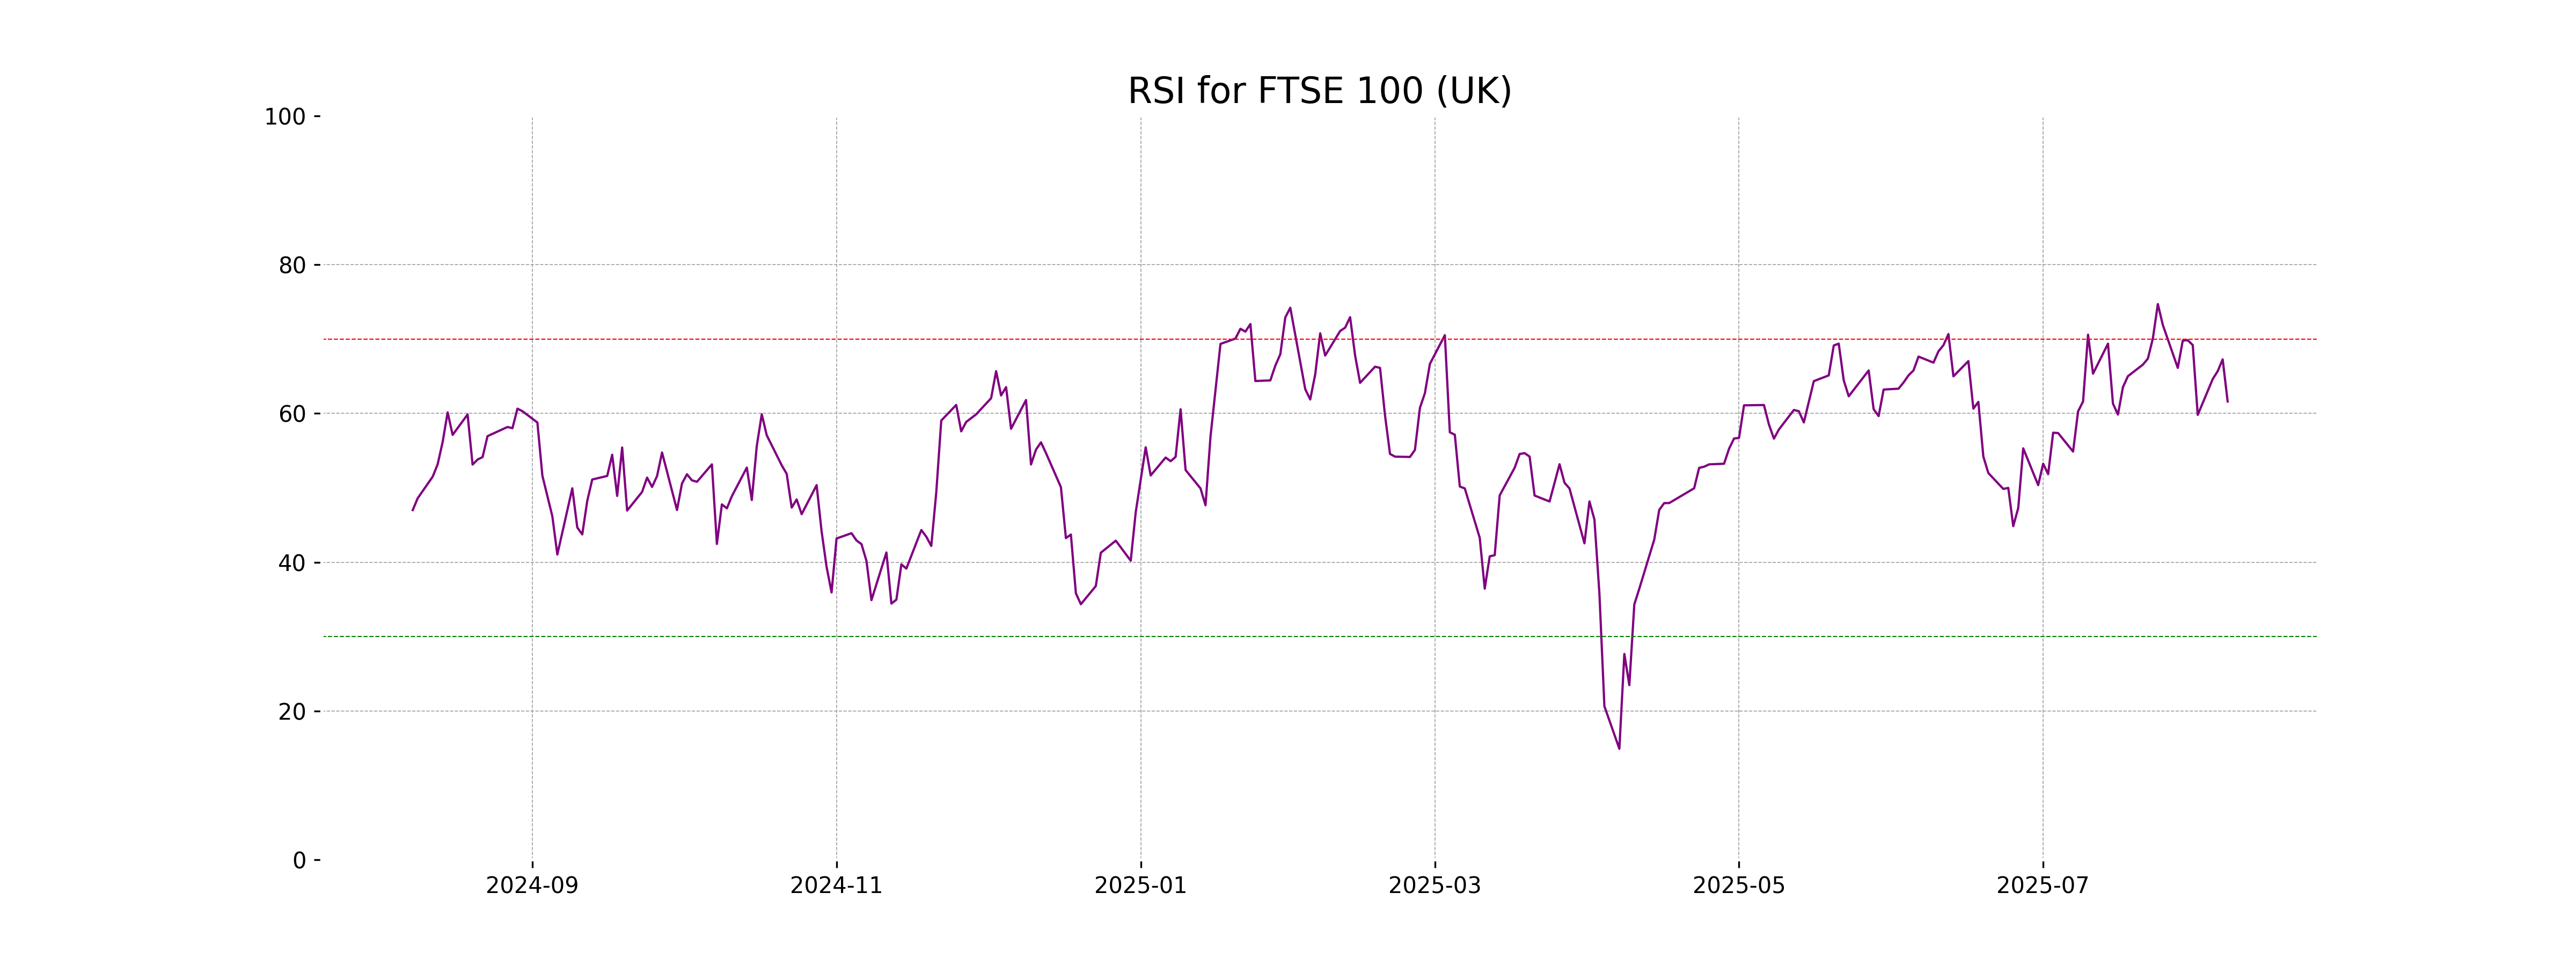
FTSE 100 (UK) opened at 9164.31, with a high of 9164.31 and a low of 9123.03, closing at 9124.56. The index experienced a decline with a points change of -39.74, reflecting a percentage change of -0.43%. The RSI indicates moderate strength at 61.61, while the MACD at 74.61 is slightly below its signal line of 76.85.
Relationship with Key Moving Averages
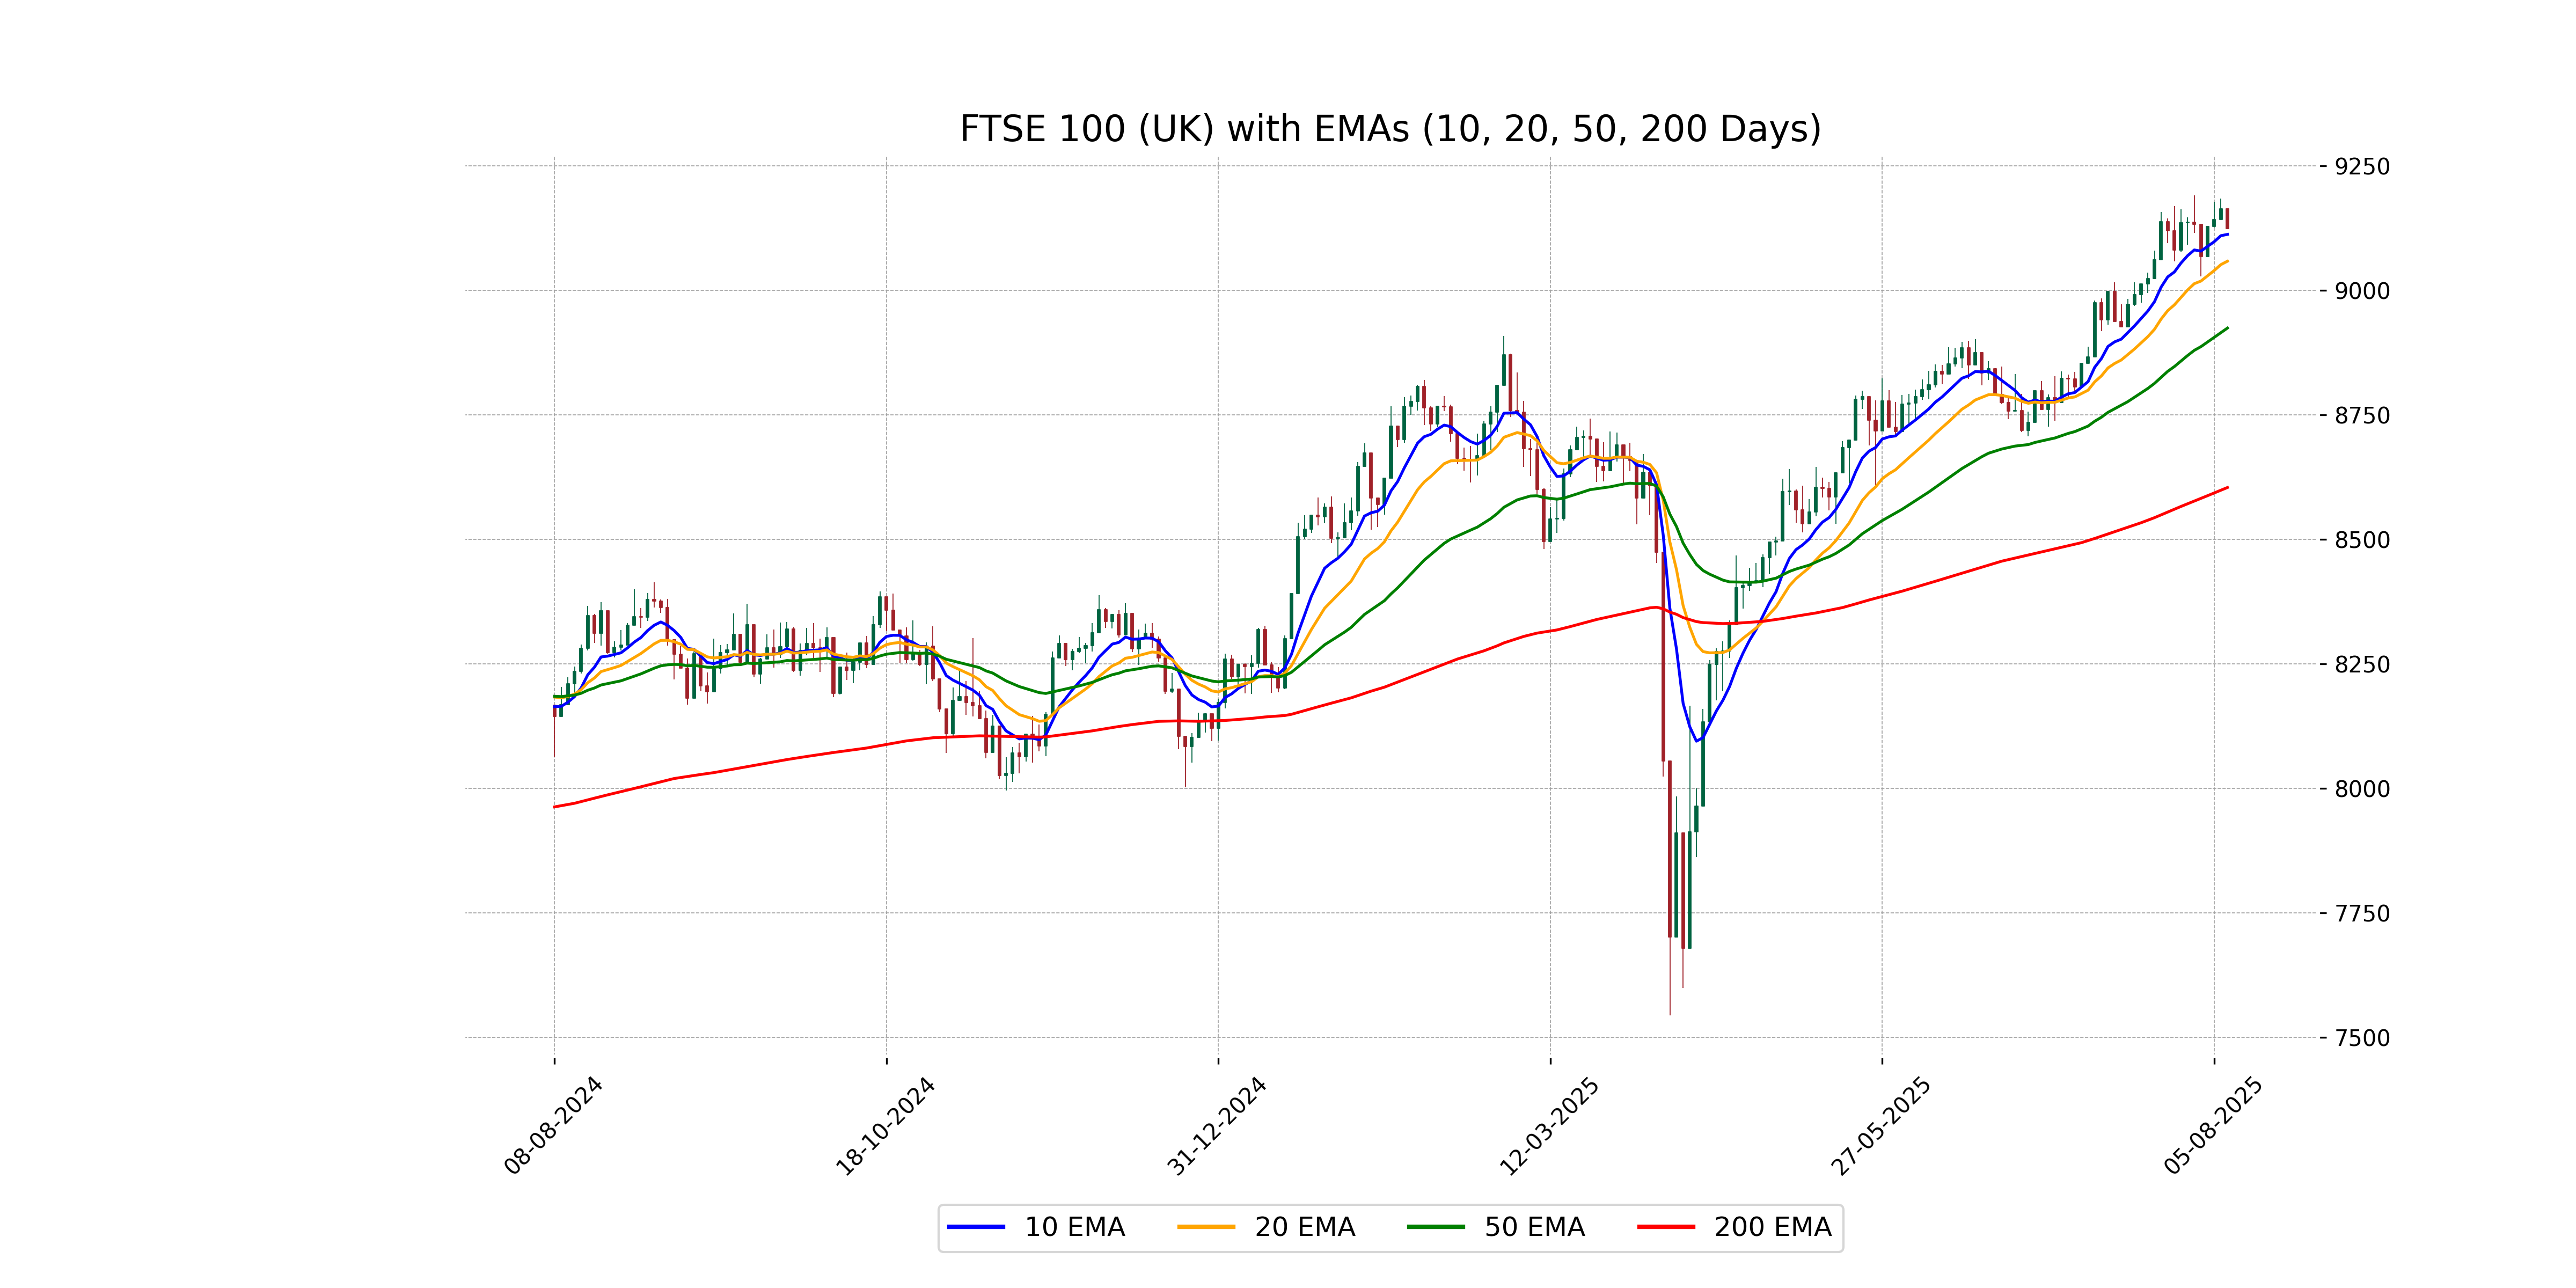
FTSE 100 (UK) closed at 9124.56, which is above its 20-day EMA of 9058.88 and 200-day EMA of 8604.42, indicating a potentially bullish trend in the short and long term. However, it is slightly above its 10-day EMA of 9112.69, suggesting a closer alignment with recent price movements.
Moving Averages Trend (MACD)
Based on the provided stock data, the FTSE 100 (UK) shows a MACD of 74.61 compared to the MACD Signal of 76.85, indicating a bearish crossover as the MACD line is below the signal line. This suggests a potential continuation of downward momentum unless reversed.
RSI Analysis
FTSE 100: The Relative Strength Index (RSI) for the FTSE 100 is at 61.61, which indicates that the index is in a neutral zone. It is not overbought or oversold, suggesting a balanced market sentiment at this level.
Analysis for DAX (Germany) - August 07, 2025

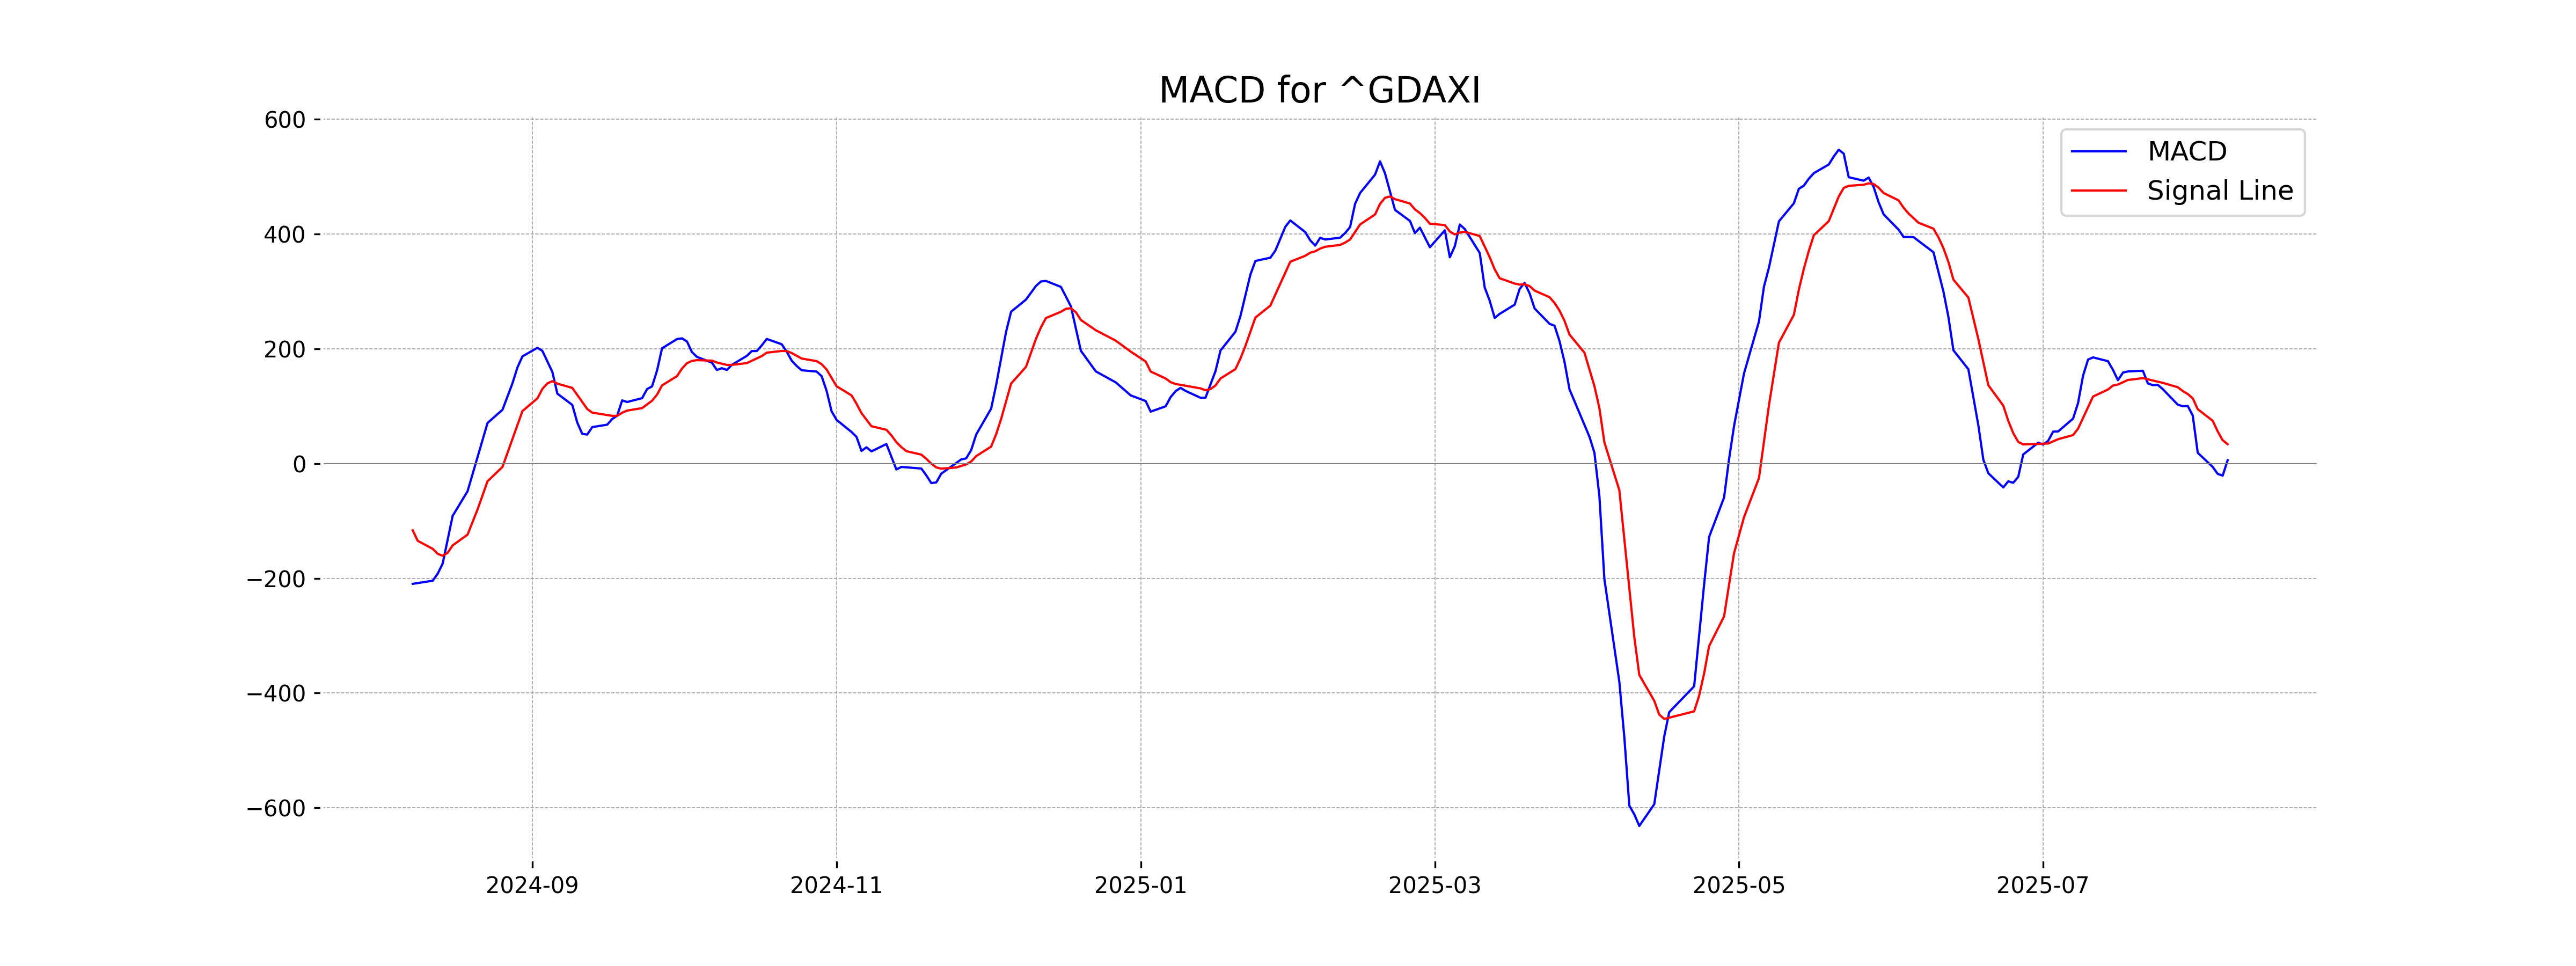
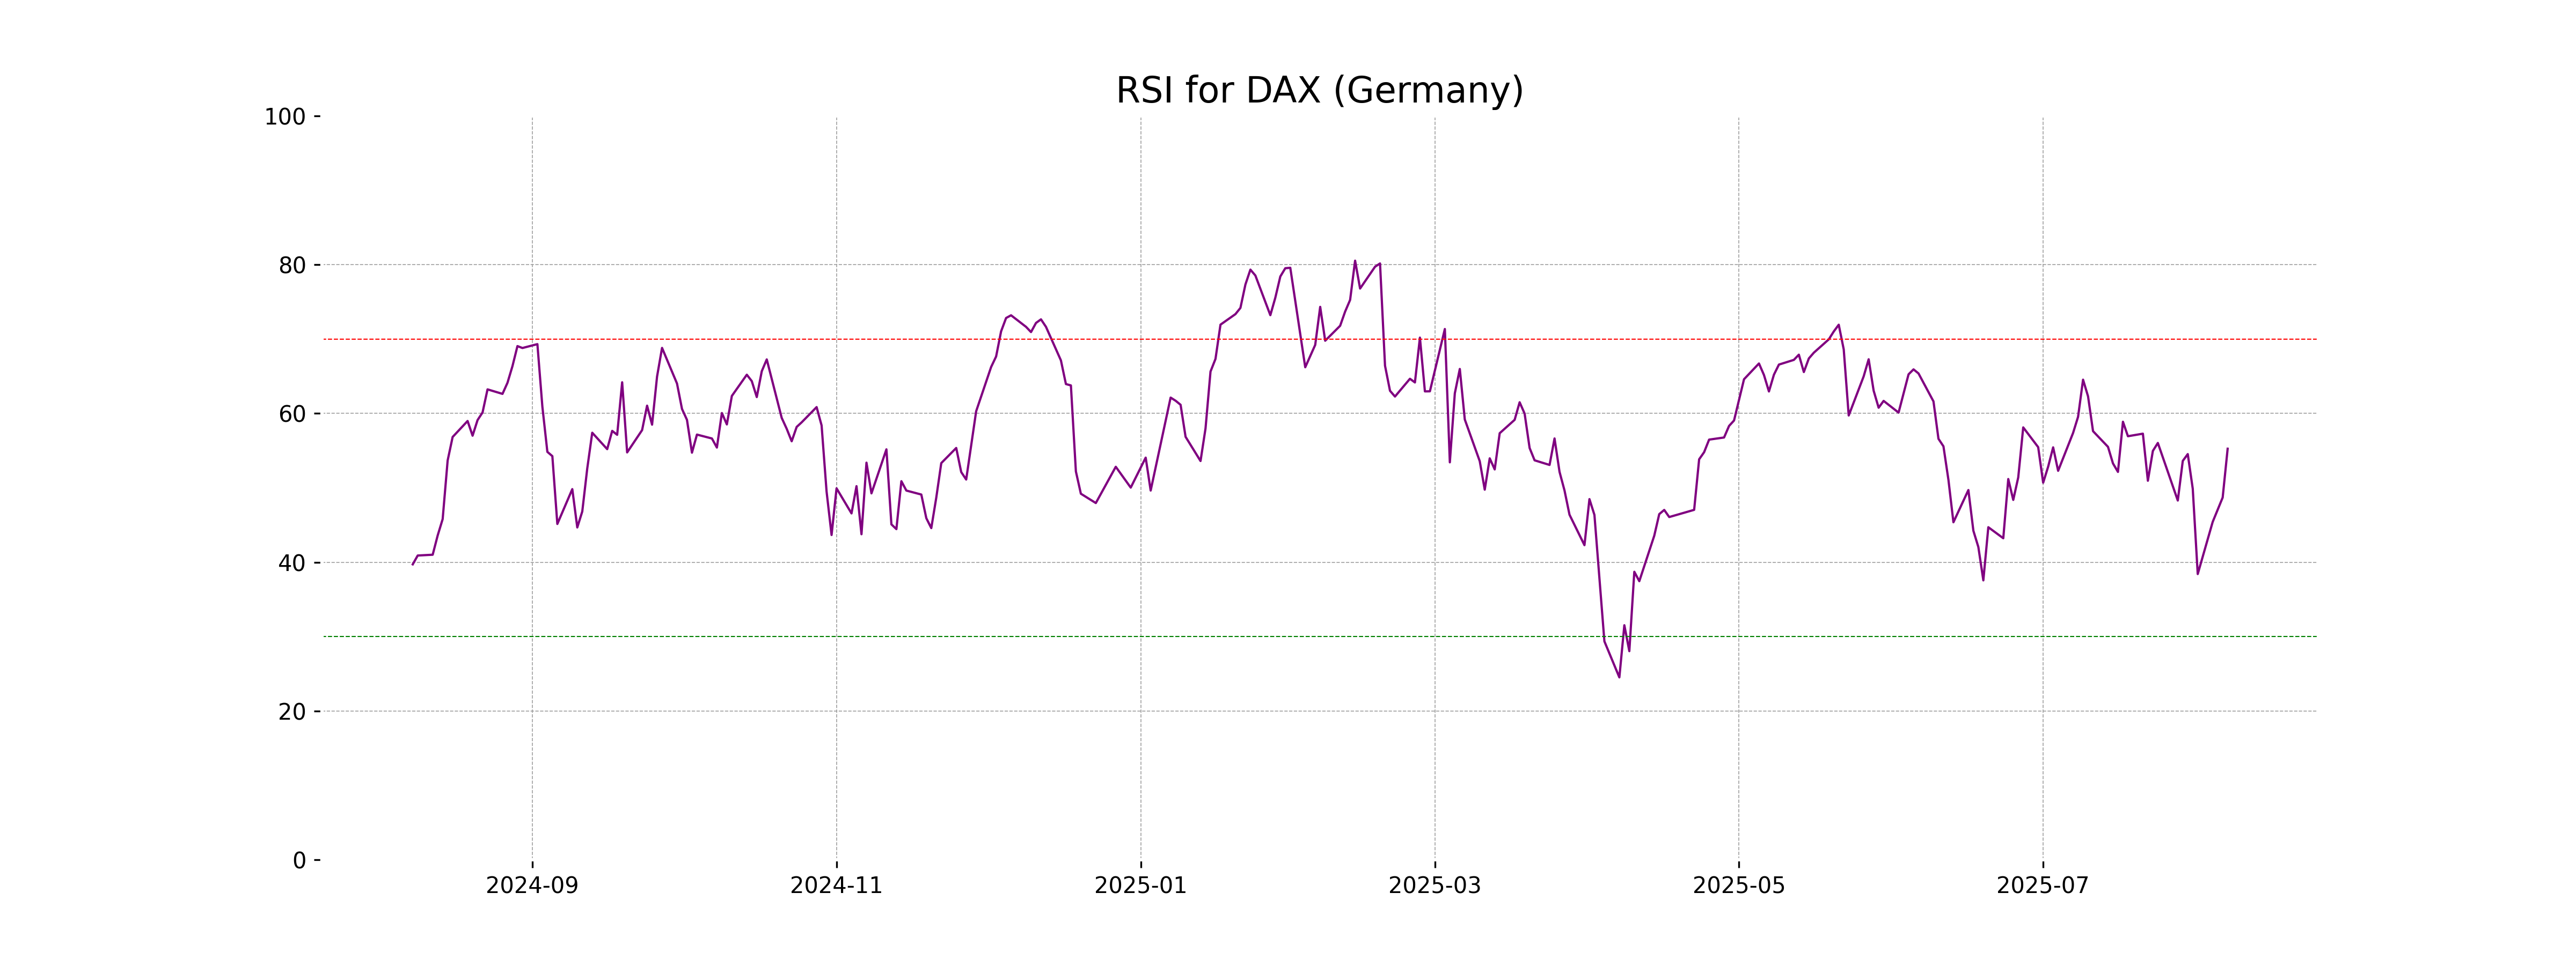
DAX (Germany) Performance: The DAX index opened at 23,910.87 and closed at 24,288.42, marking a positive change of 1.52%, or 364.06 points. The RSI at 55.26 suggests moderate momentum, with the MACD indicator showing a lower positive value compared to its signal line, which could imply a potential upcoming trend change.
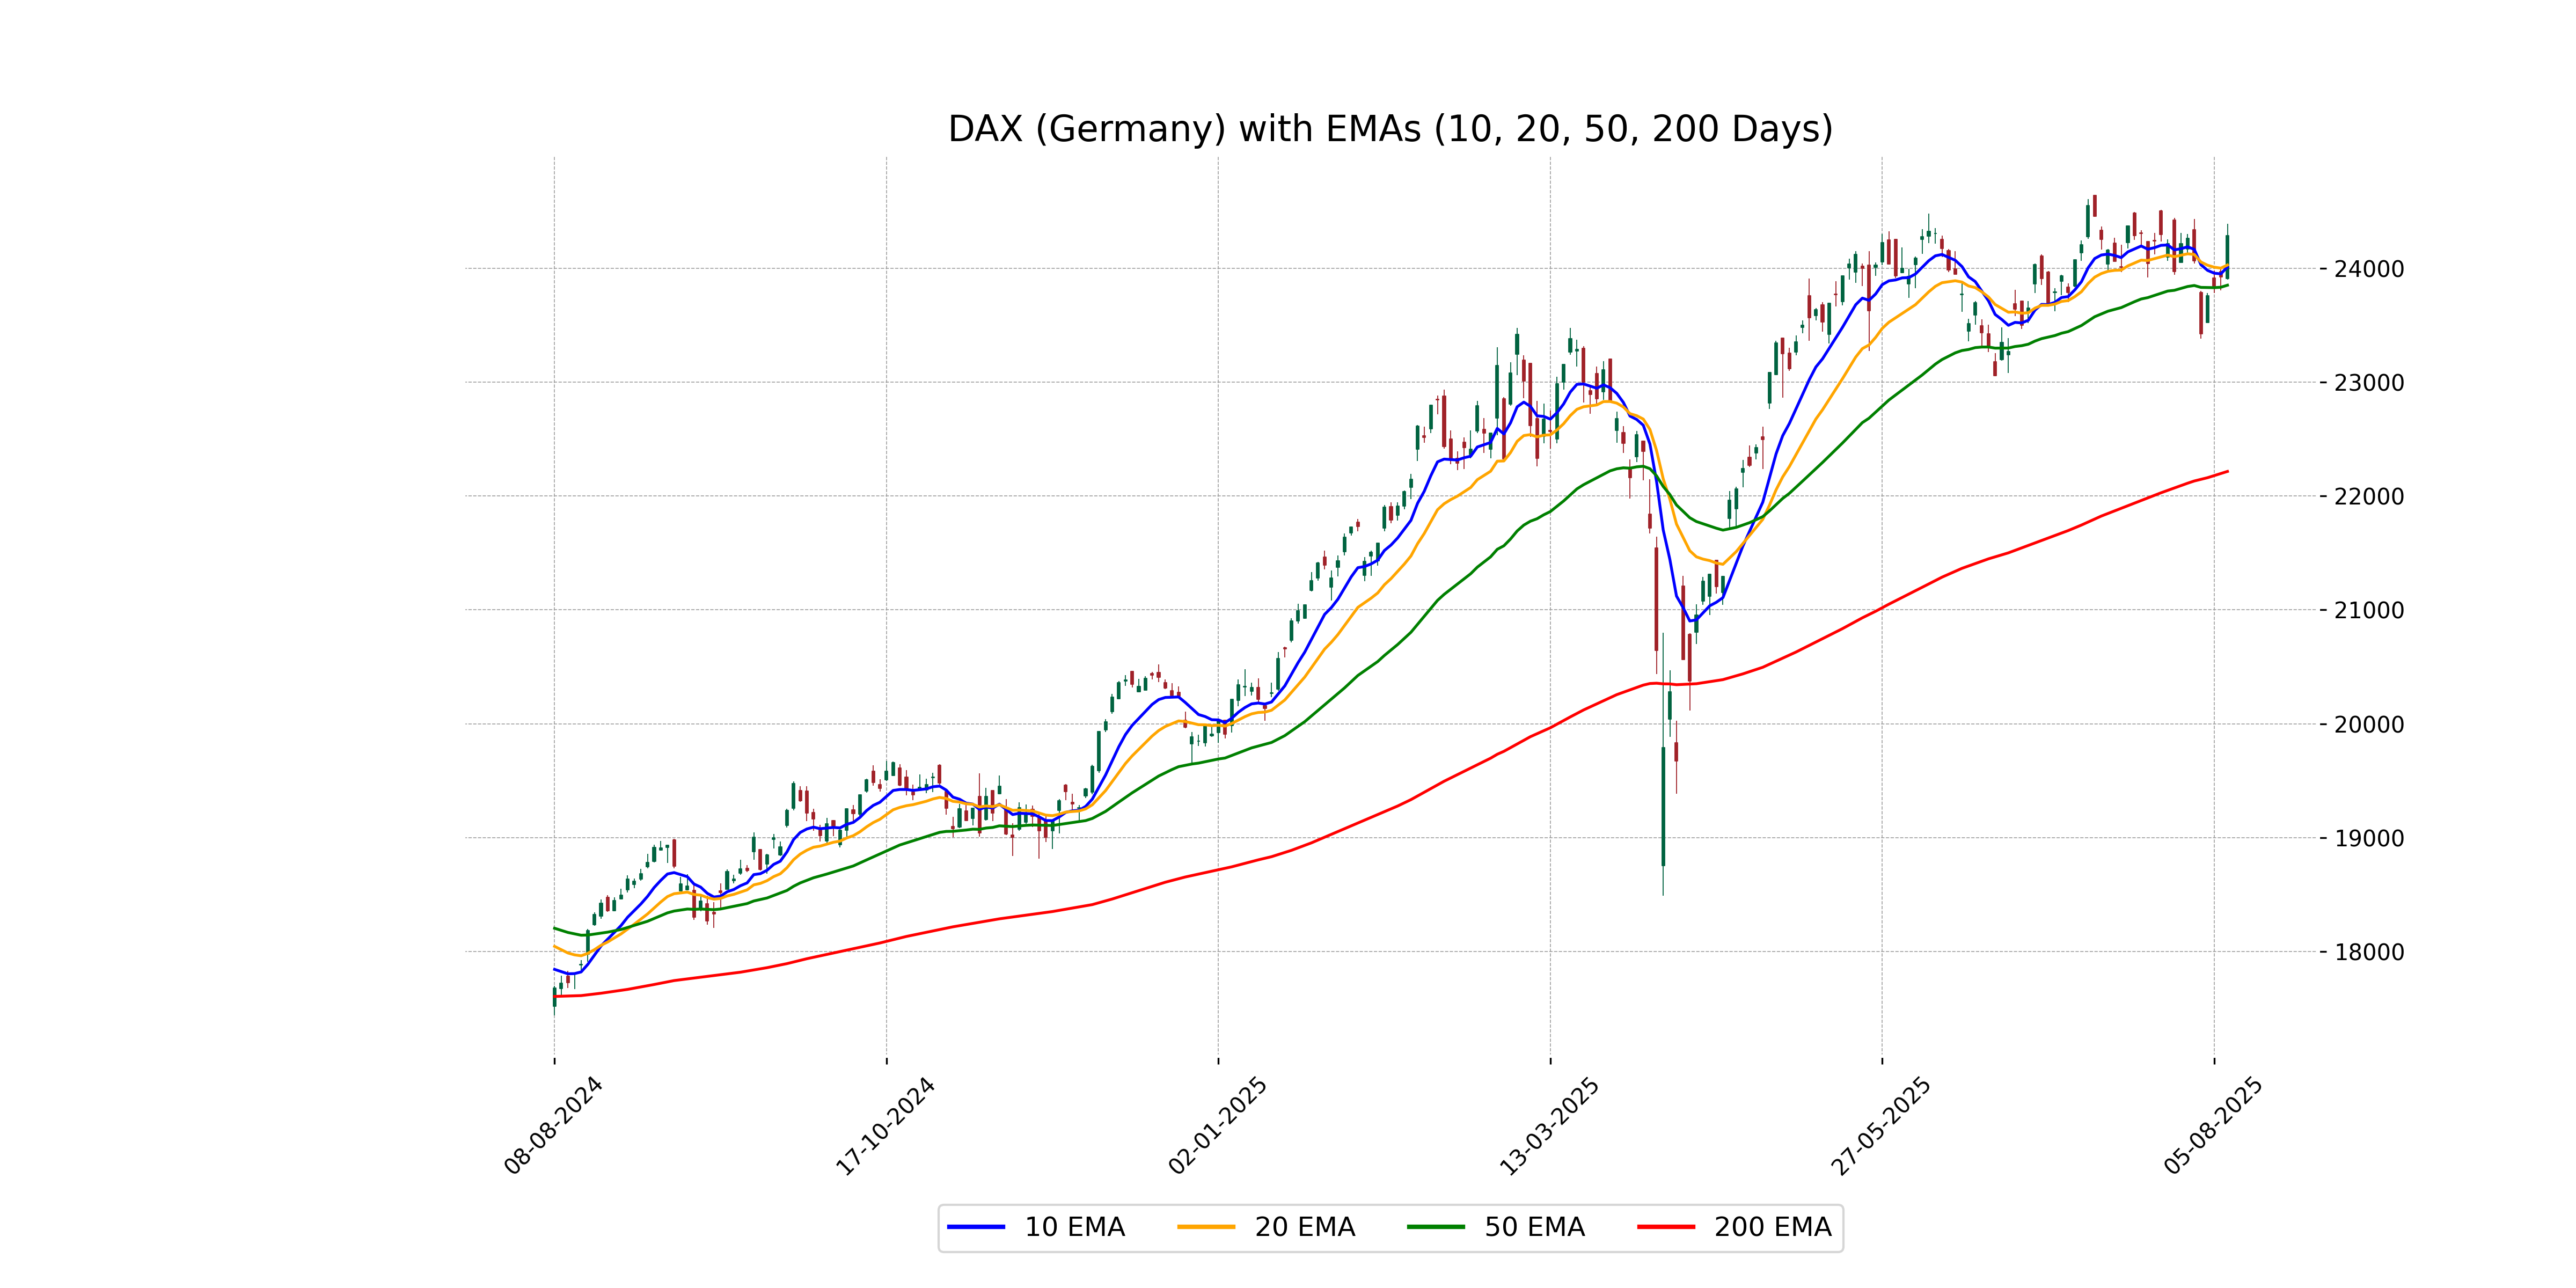
Relationship with Key Moving Averages
The DAX (Germany) has a close price of 24,288.42, which is above the 50-day EMA of 23,851.61 and significantly above the 200-day EMA of 22,215.89, indicating a strong upward trend. Additionally, it is also above the 10-day EMA of 24,012.48 and the 20-day EMA of 24,028.85, confirming short-term bullish momentum.
Moving Averages Trend (MACD)
The MACD value for DAX is 5.82, which is below the MACD Signal of 33.73. This indicates that the DAX is experiencing weak upward momentum and may potentially face resistance.
RSI Analysis
The RSI for DAX (Germany) is at 55.26, indicating a neutral stance as it is neither in the overbought (above 70) nor oversold (below 30) territory. This suggests a balance between buying and selling pressures, without a strong directional bias at the moment.
Analysis for S&P 500 (US) - August 07, 2025

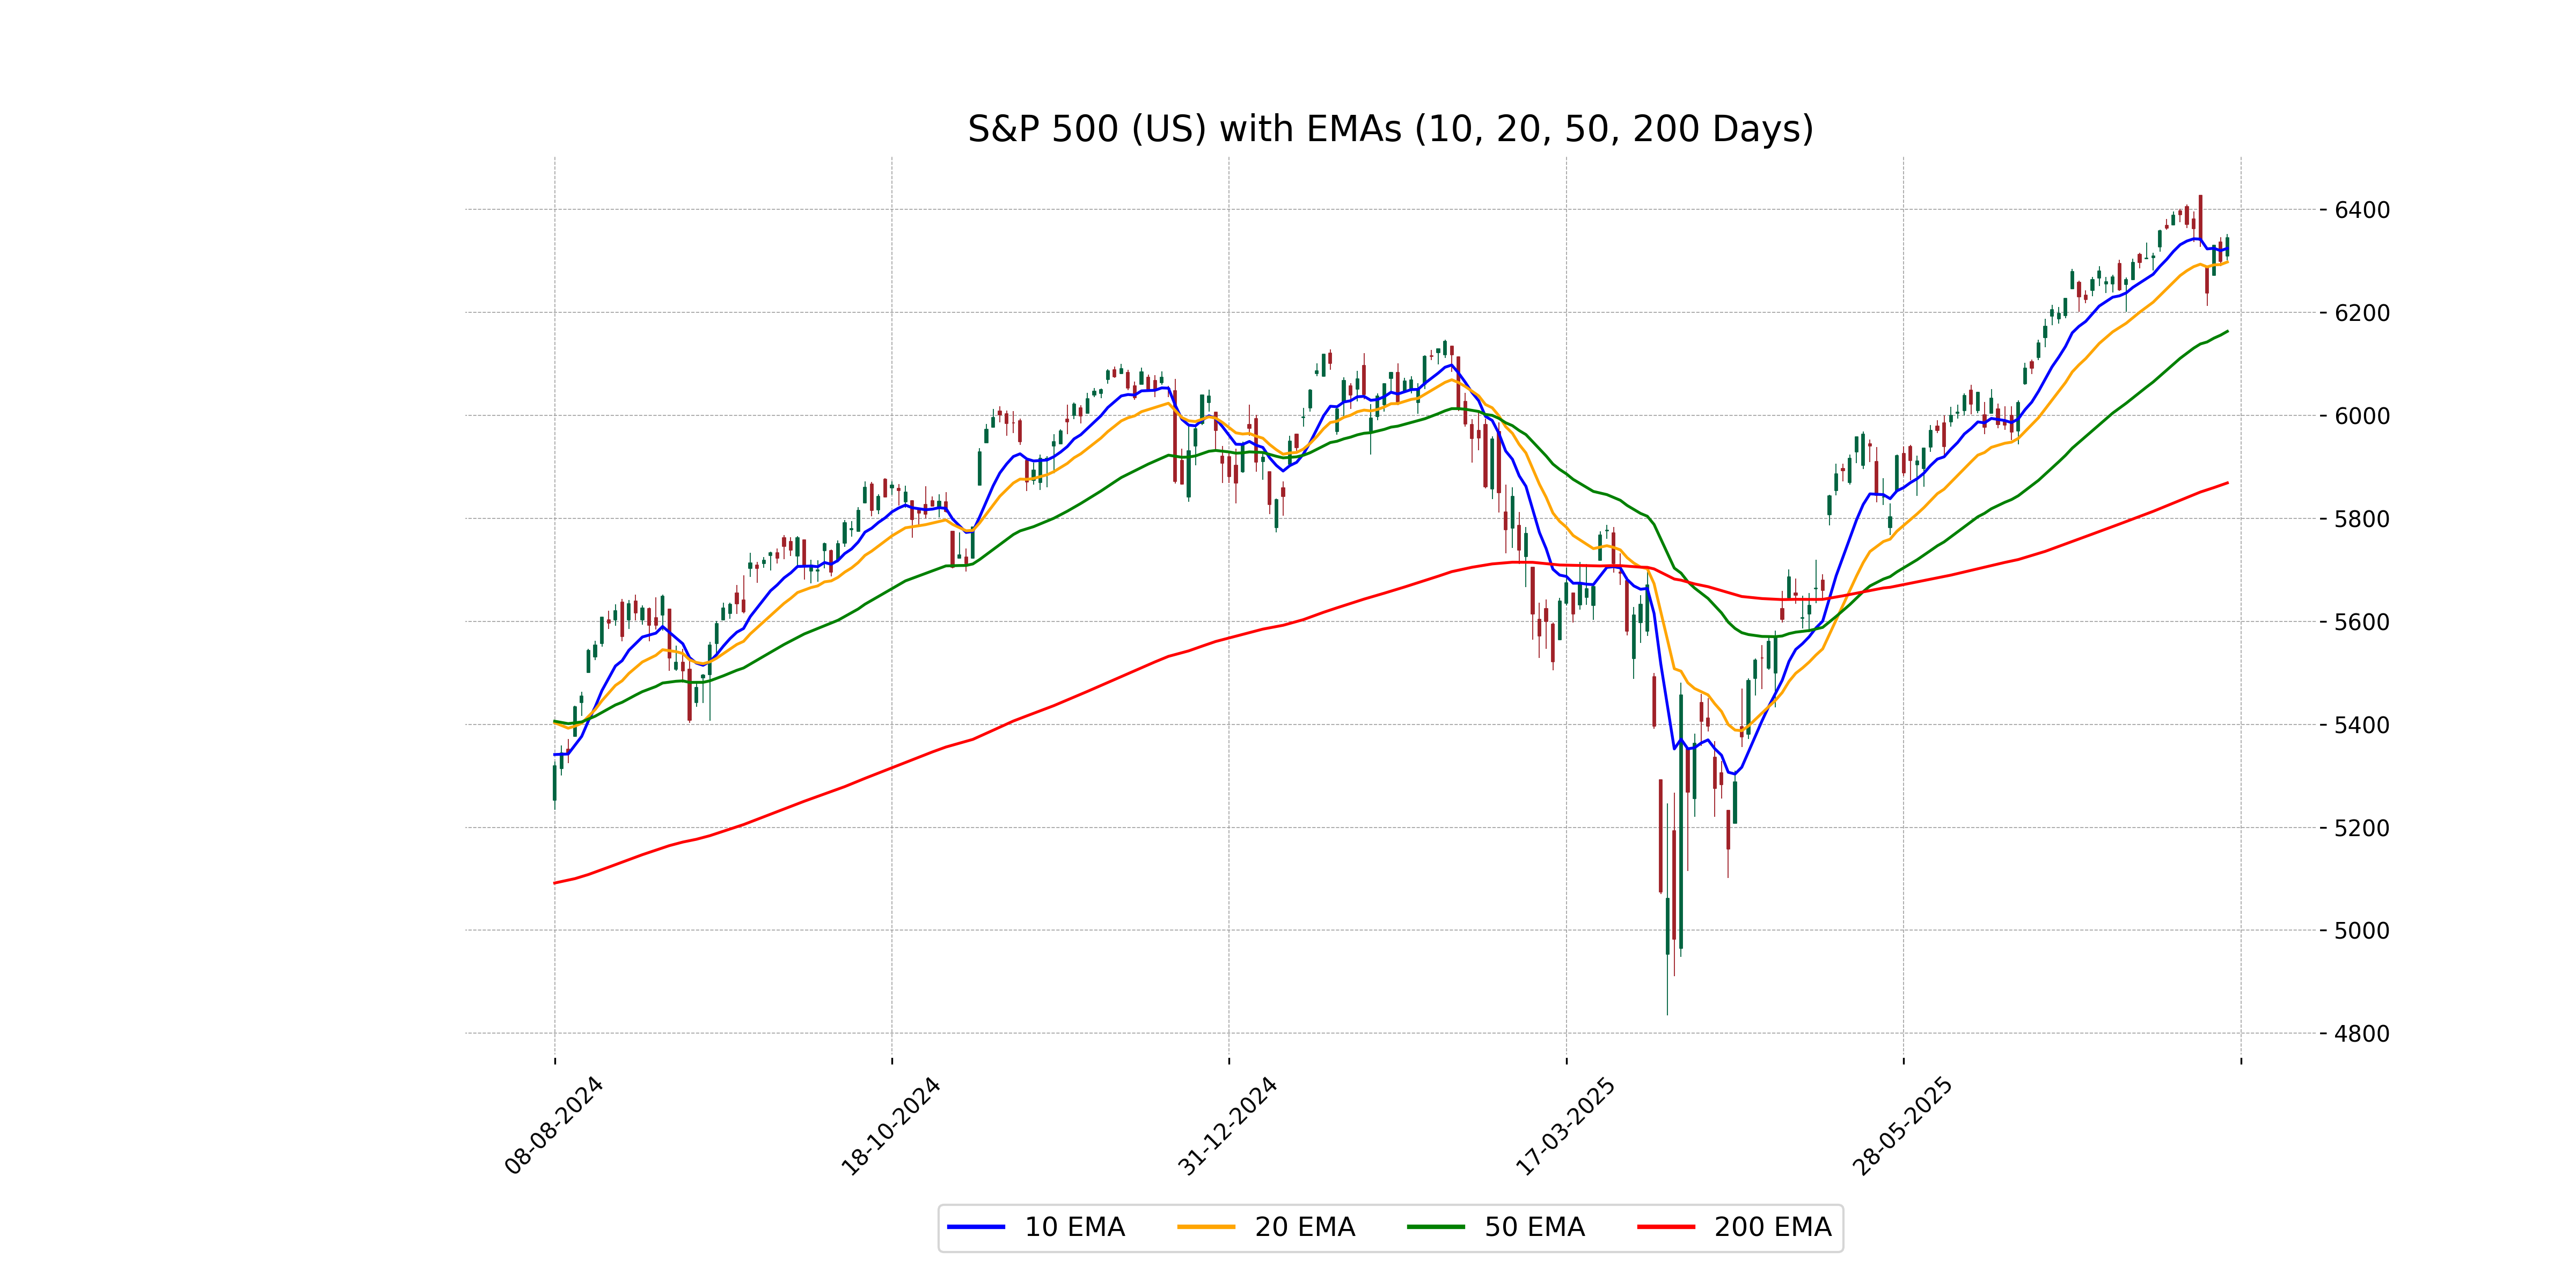
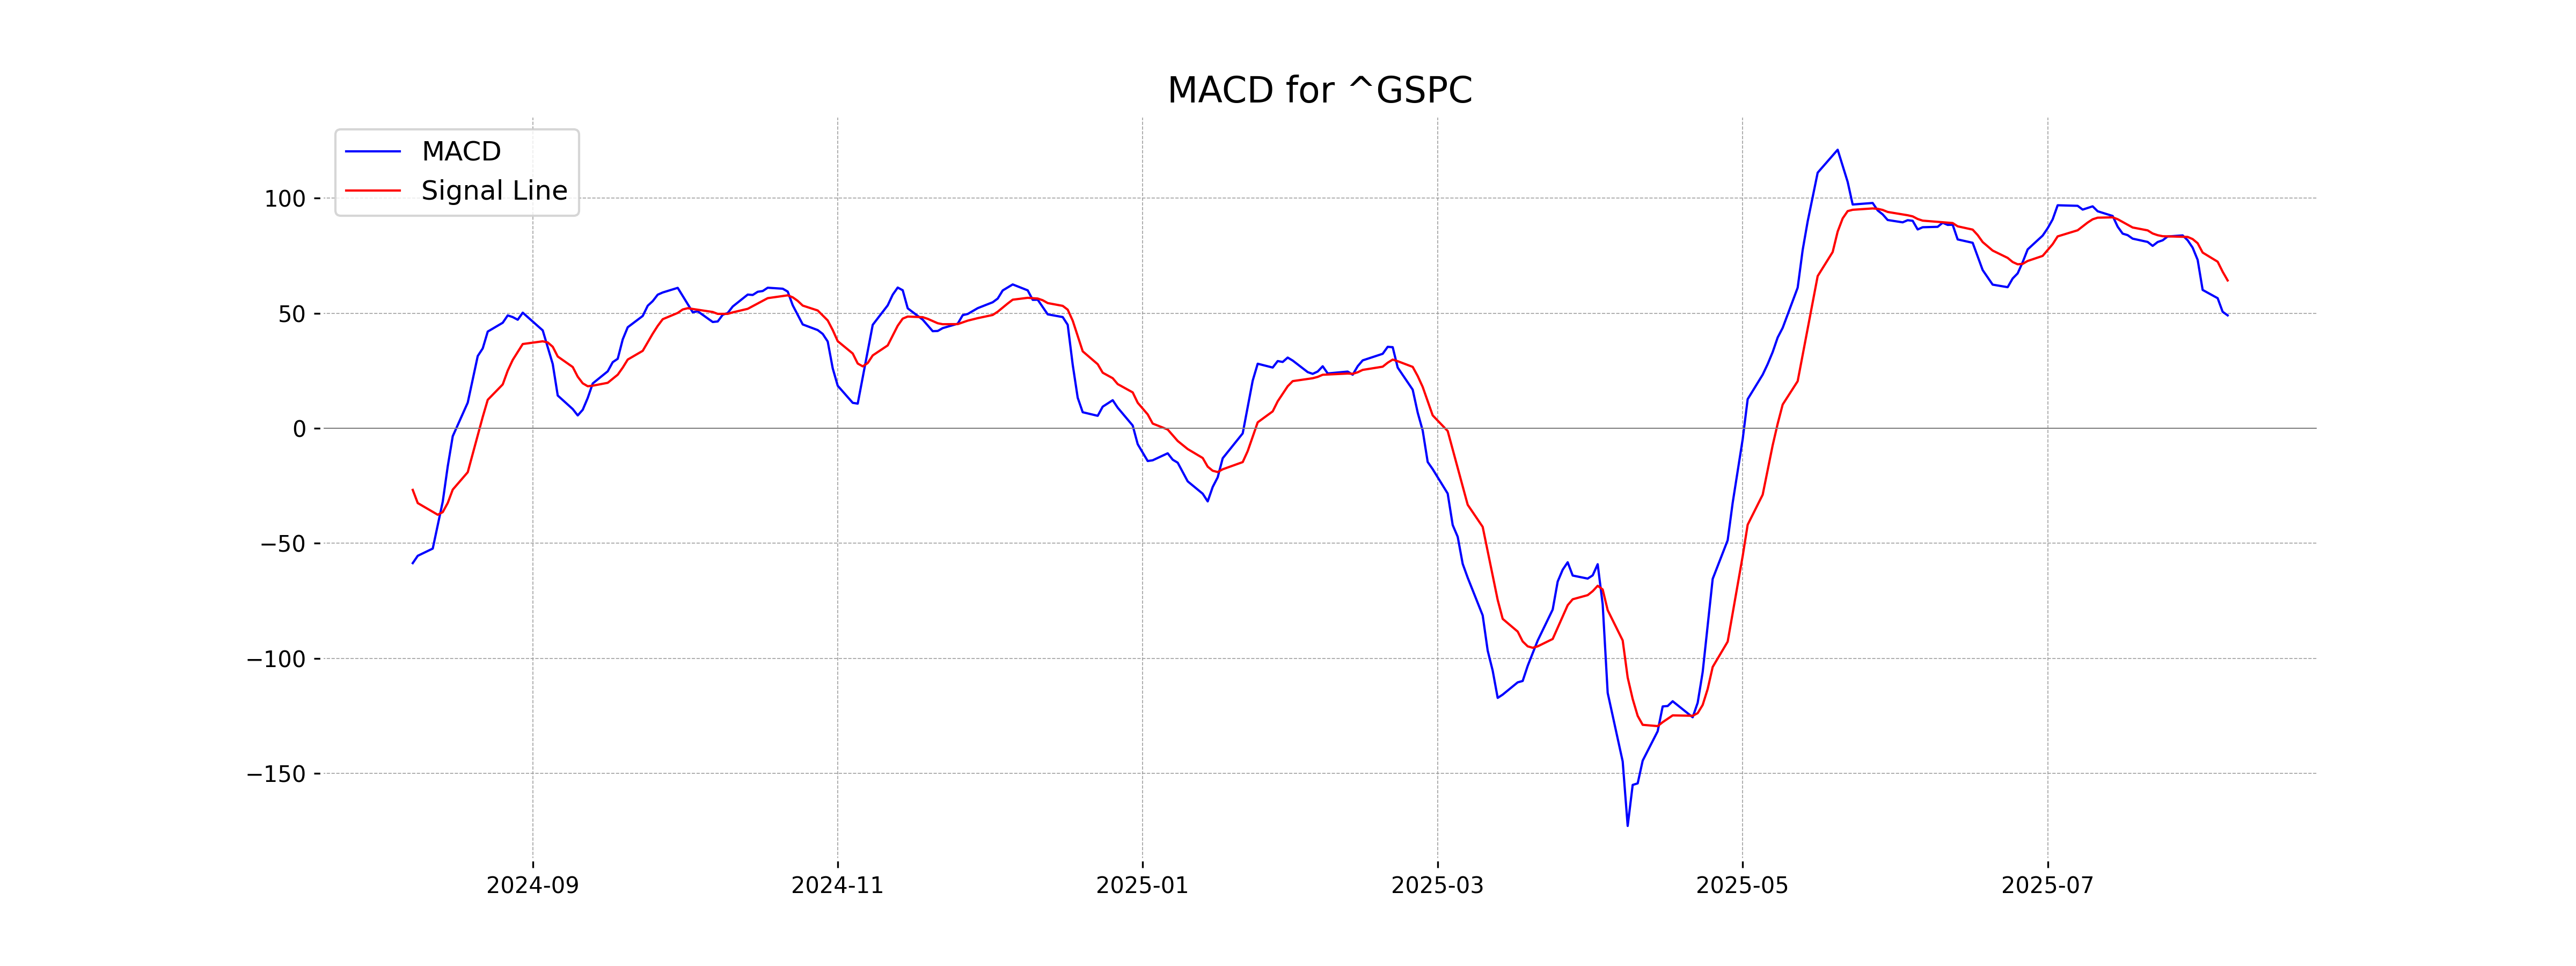
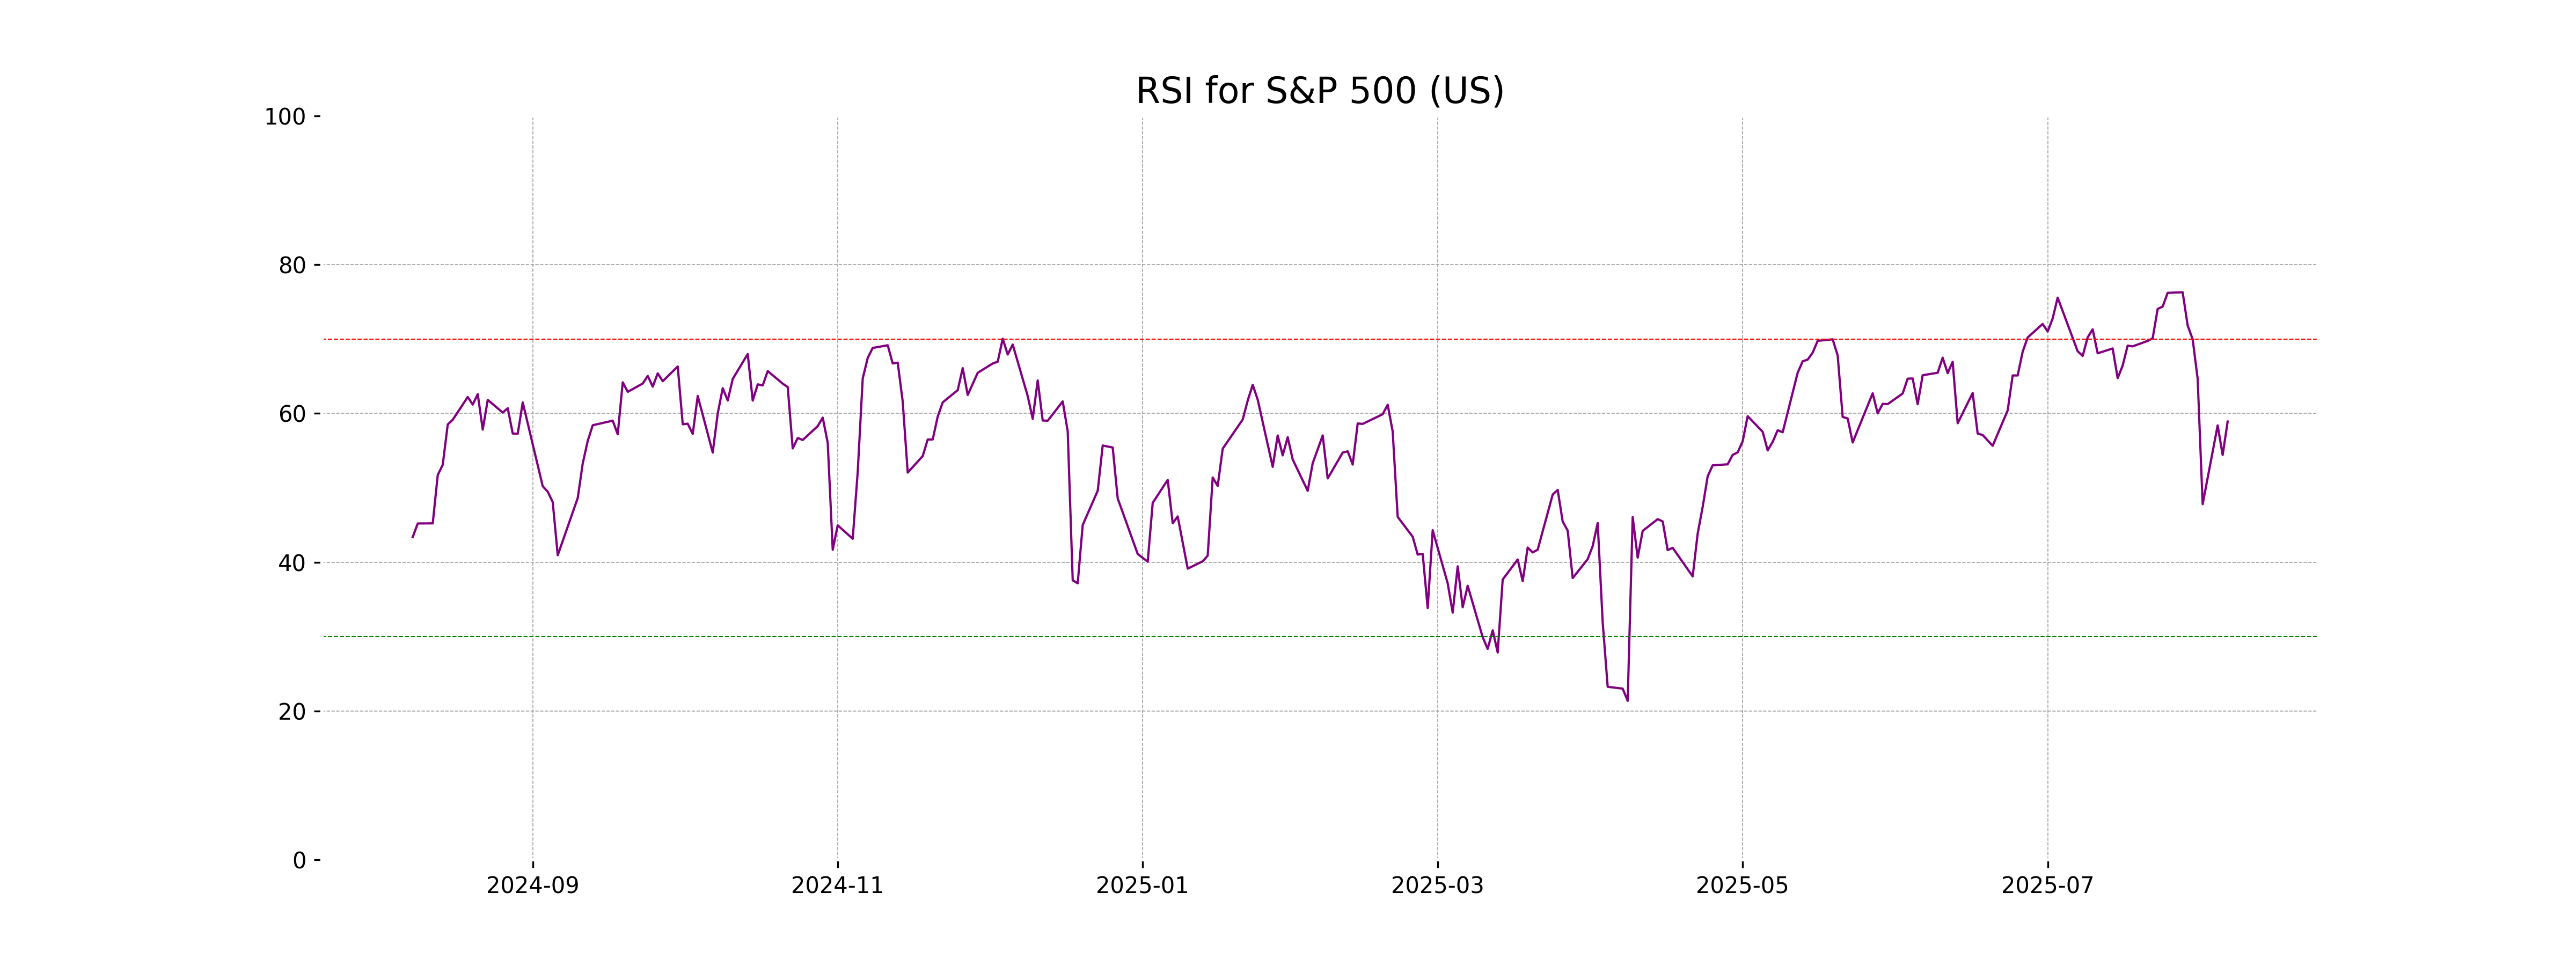
The S&P 500 (US) opened at 6309.30, reached a high of 6352.83 and a low of 6301.11, closing at 6345.06. The performance showed a 0.73% increase with a points change of 45.87 from the previous close at 6299.19. The trading volume was 5.41 billion, with the 10-day EMA above the closing price, suggesting short-term bullish momentum. The RSI of 58.92 indicates moderate strength, while the MACD at 49.09 is below its signal line of 64.27, highlighting a possible weakening momentum.
Relationship with Key Moving Averages
S&P 500's recent close at 6345.06 is above its 50-day EMA of 6163.27 and its 200-day EMA of 5868.89, suggesting a strong upward momentum. It is also above its 10-day EMA and 20-day EMA, indicating short-term bullish trends.
Moving Averages Trend (MACD)
MACD Analysis for S&P 500 (US): The MACD value of 49.09 compared to its Signal Line at 64.27 suggests a potential bearish crossover, indicating that momentum might be slowing down. With the current RSI at 58.92, the index is neither overbought nor oversold, suggesting a cautious outlook.
RSI Analysis
The Relative Strength Index (RSI) for the S&P 500 is 58.92, indicating a neutral zone. This suggests the index is not currently overbought or oversold, providing a balanced momentum in the market.
Analysis for Hang Seng Index (Hong Kong) - August 07, 2025
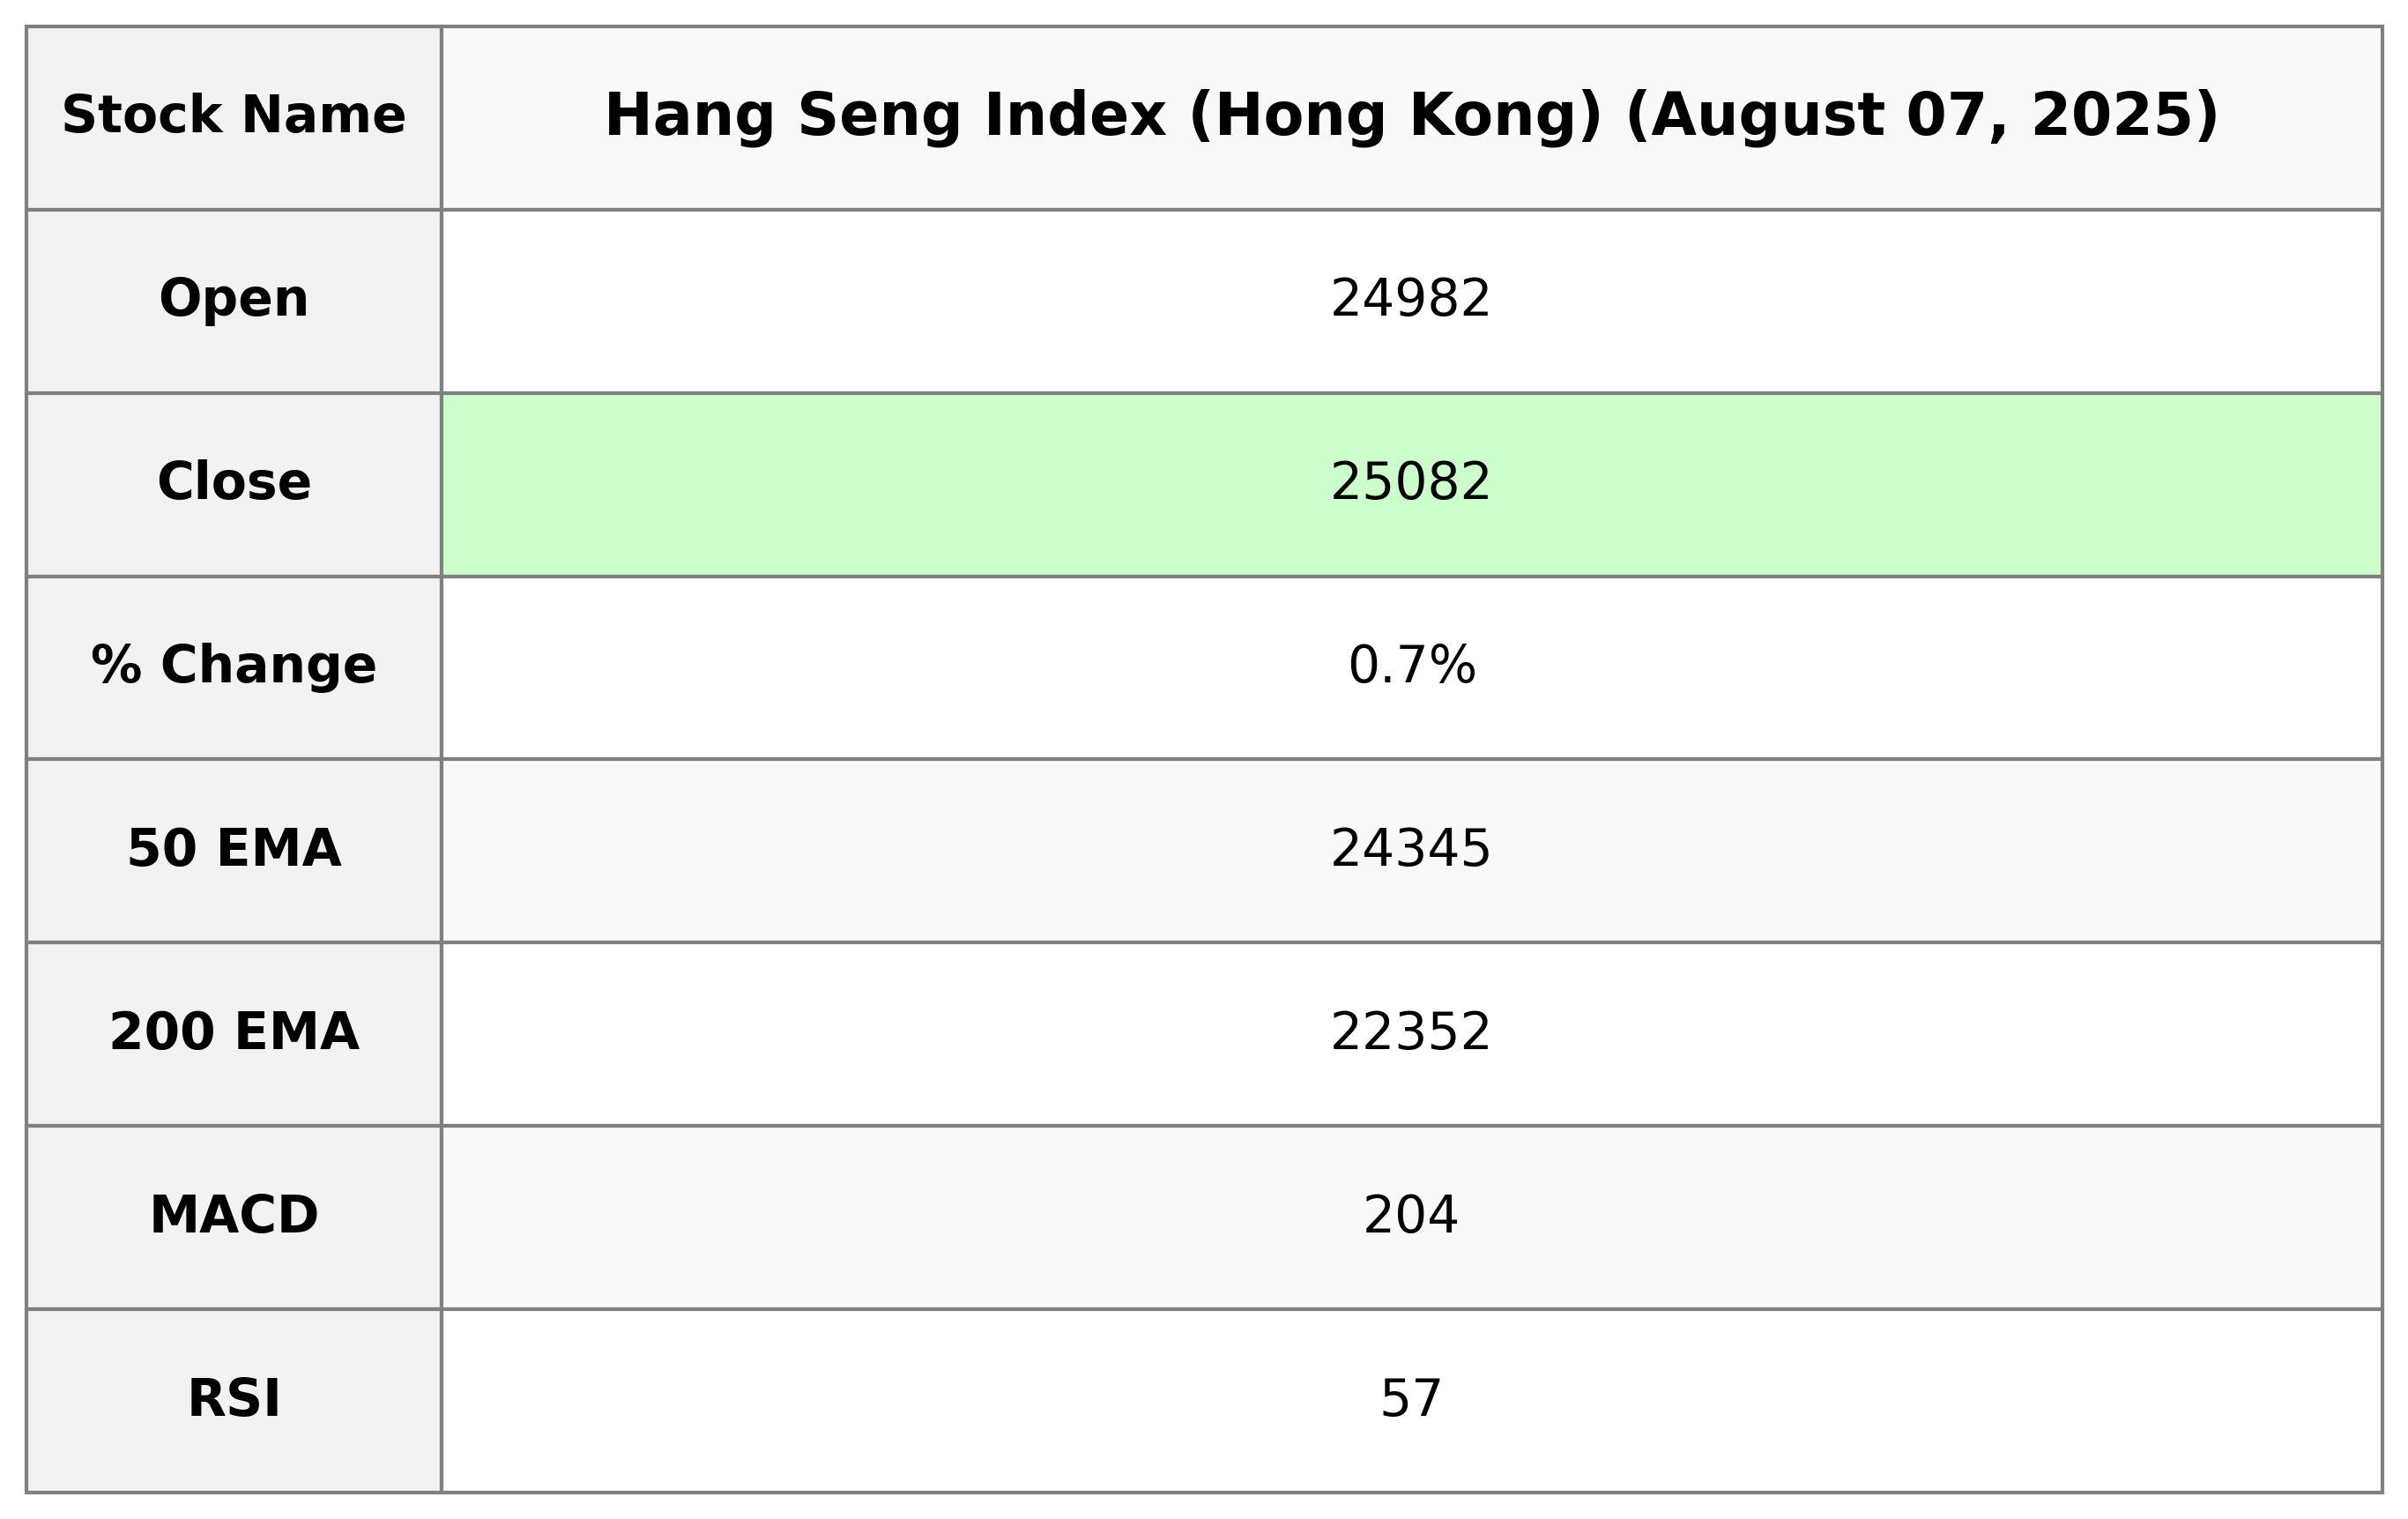
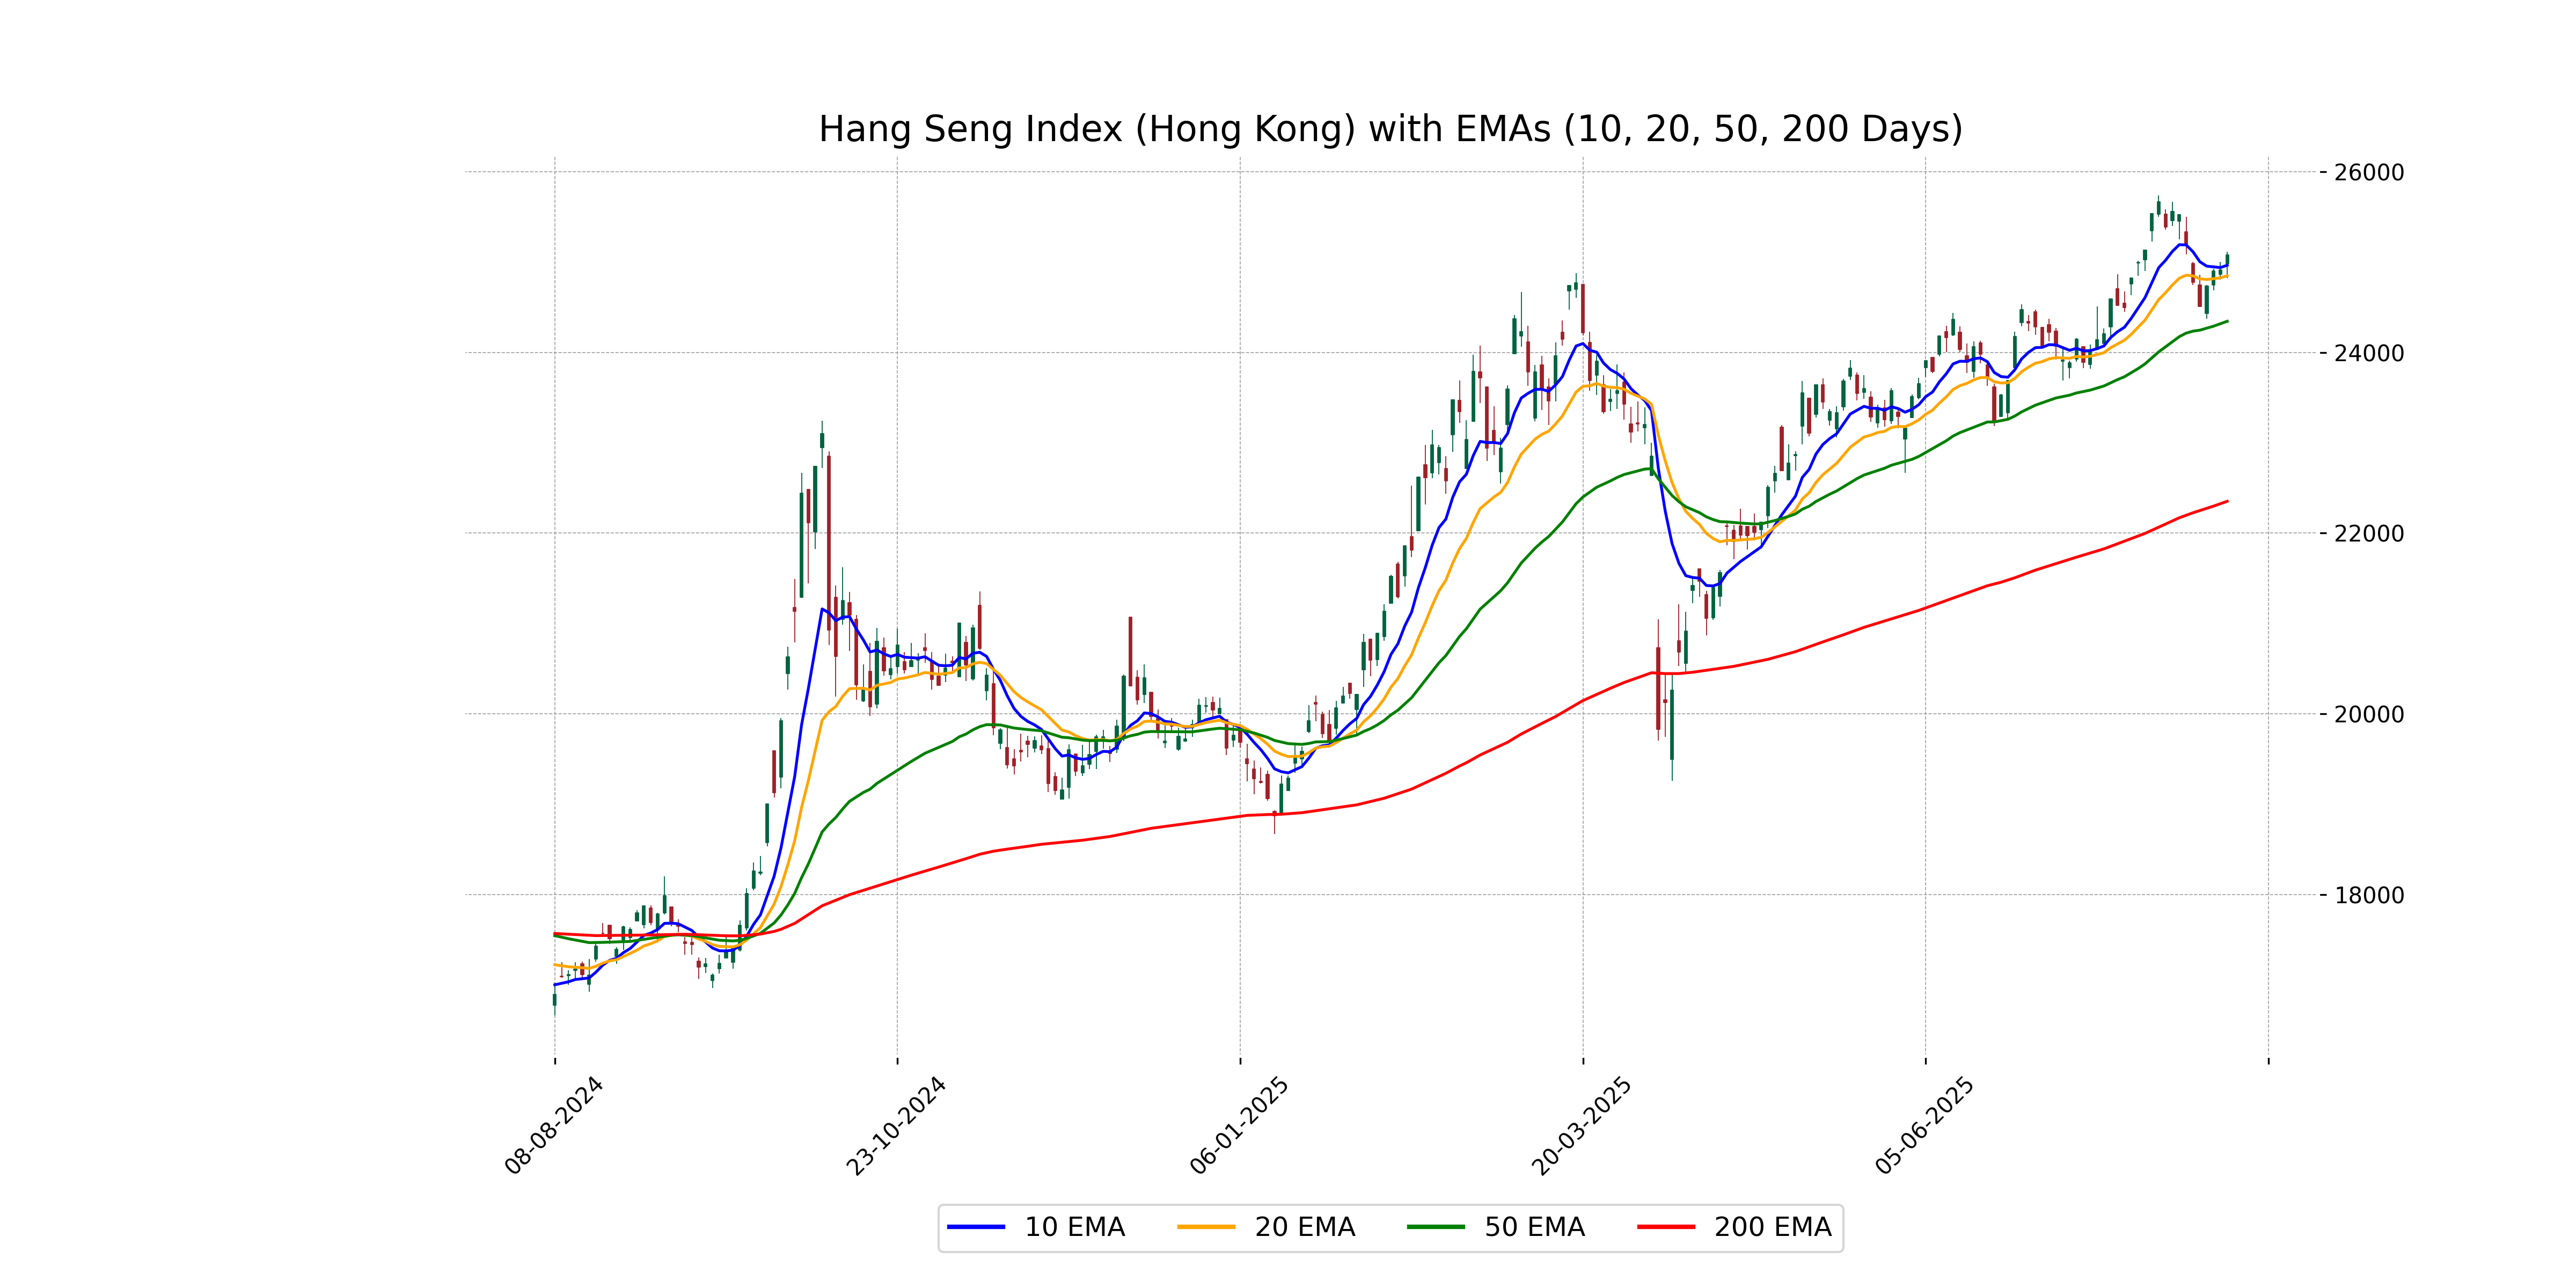
Hang Seng Index (Hong Kong) closed at 25081.63, up 0.69% from the previous close of 24910.63, marking a points change of 171. Despite a slight upward trajectory, with an RSI of 56.80, the index remains relatively neutral. The 50-day EMA stands at 24344.51 and the 200-day EMA at 22352.35, both below the current closing value, suggesting a potential continuation of the upward trend.
Relationship with Key Moving Averages
Hang Seng Index is currently trading above its 10-day, 20-day, 50-day, and 200-day exponential moving averages, indicating a short-term bullish trend. The MACD is below the MACD Signal, suggesting potentially decreasing positive momentum. The RSI is at 56.80, showing a moderate momentum without being overbought or oversold.
Moving Averages Trend (MACD)
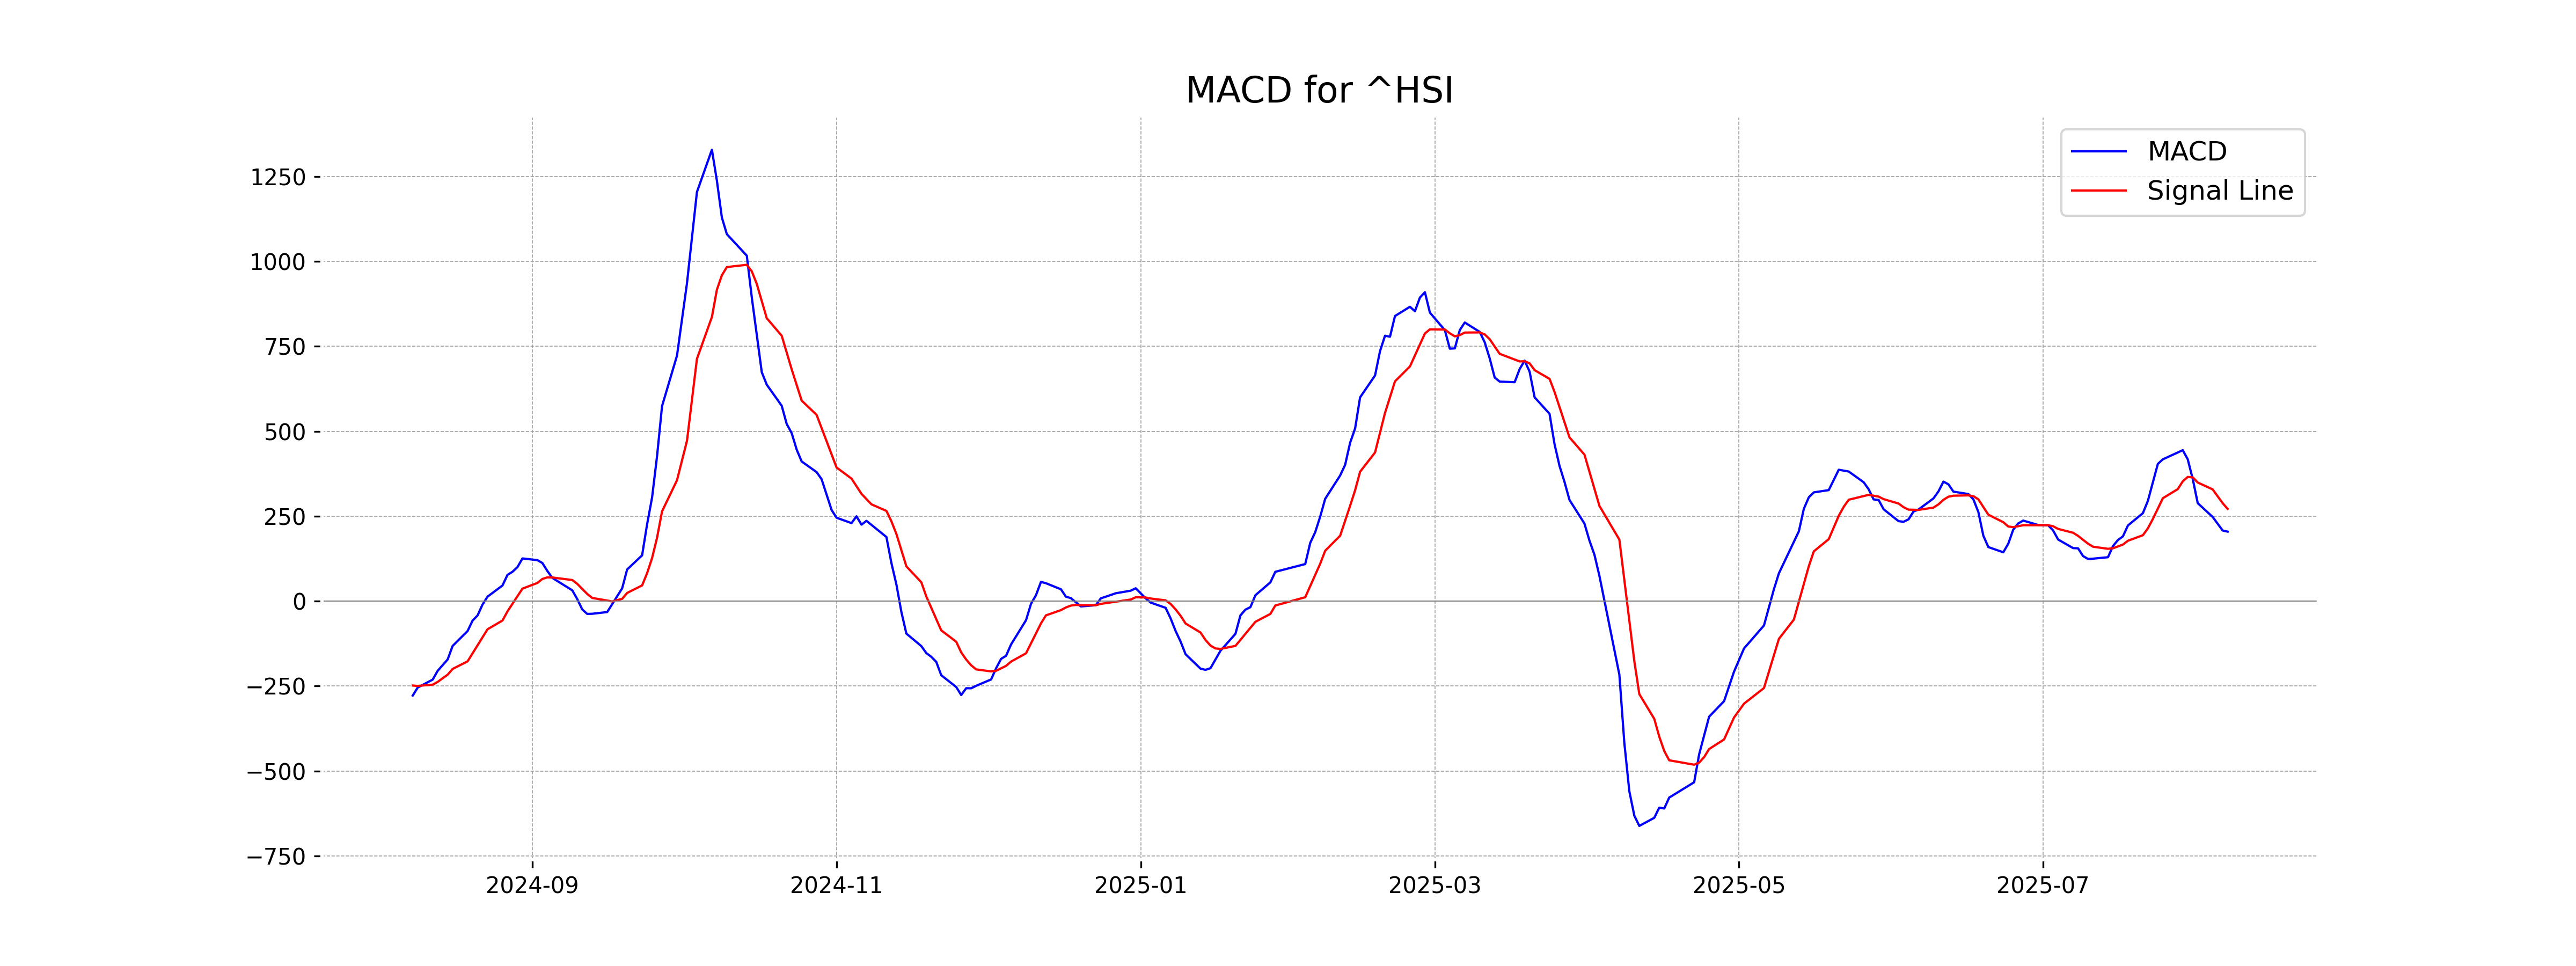
The MACD for the Hang Seng Index currently stands at 204.45, while the MACD Signal is higher at 271.44. This indicates a bearish signal since the MACD line is below the Signal line, suggesting potential momentum to the downside.
RSI Analysis
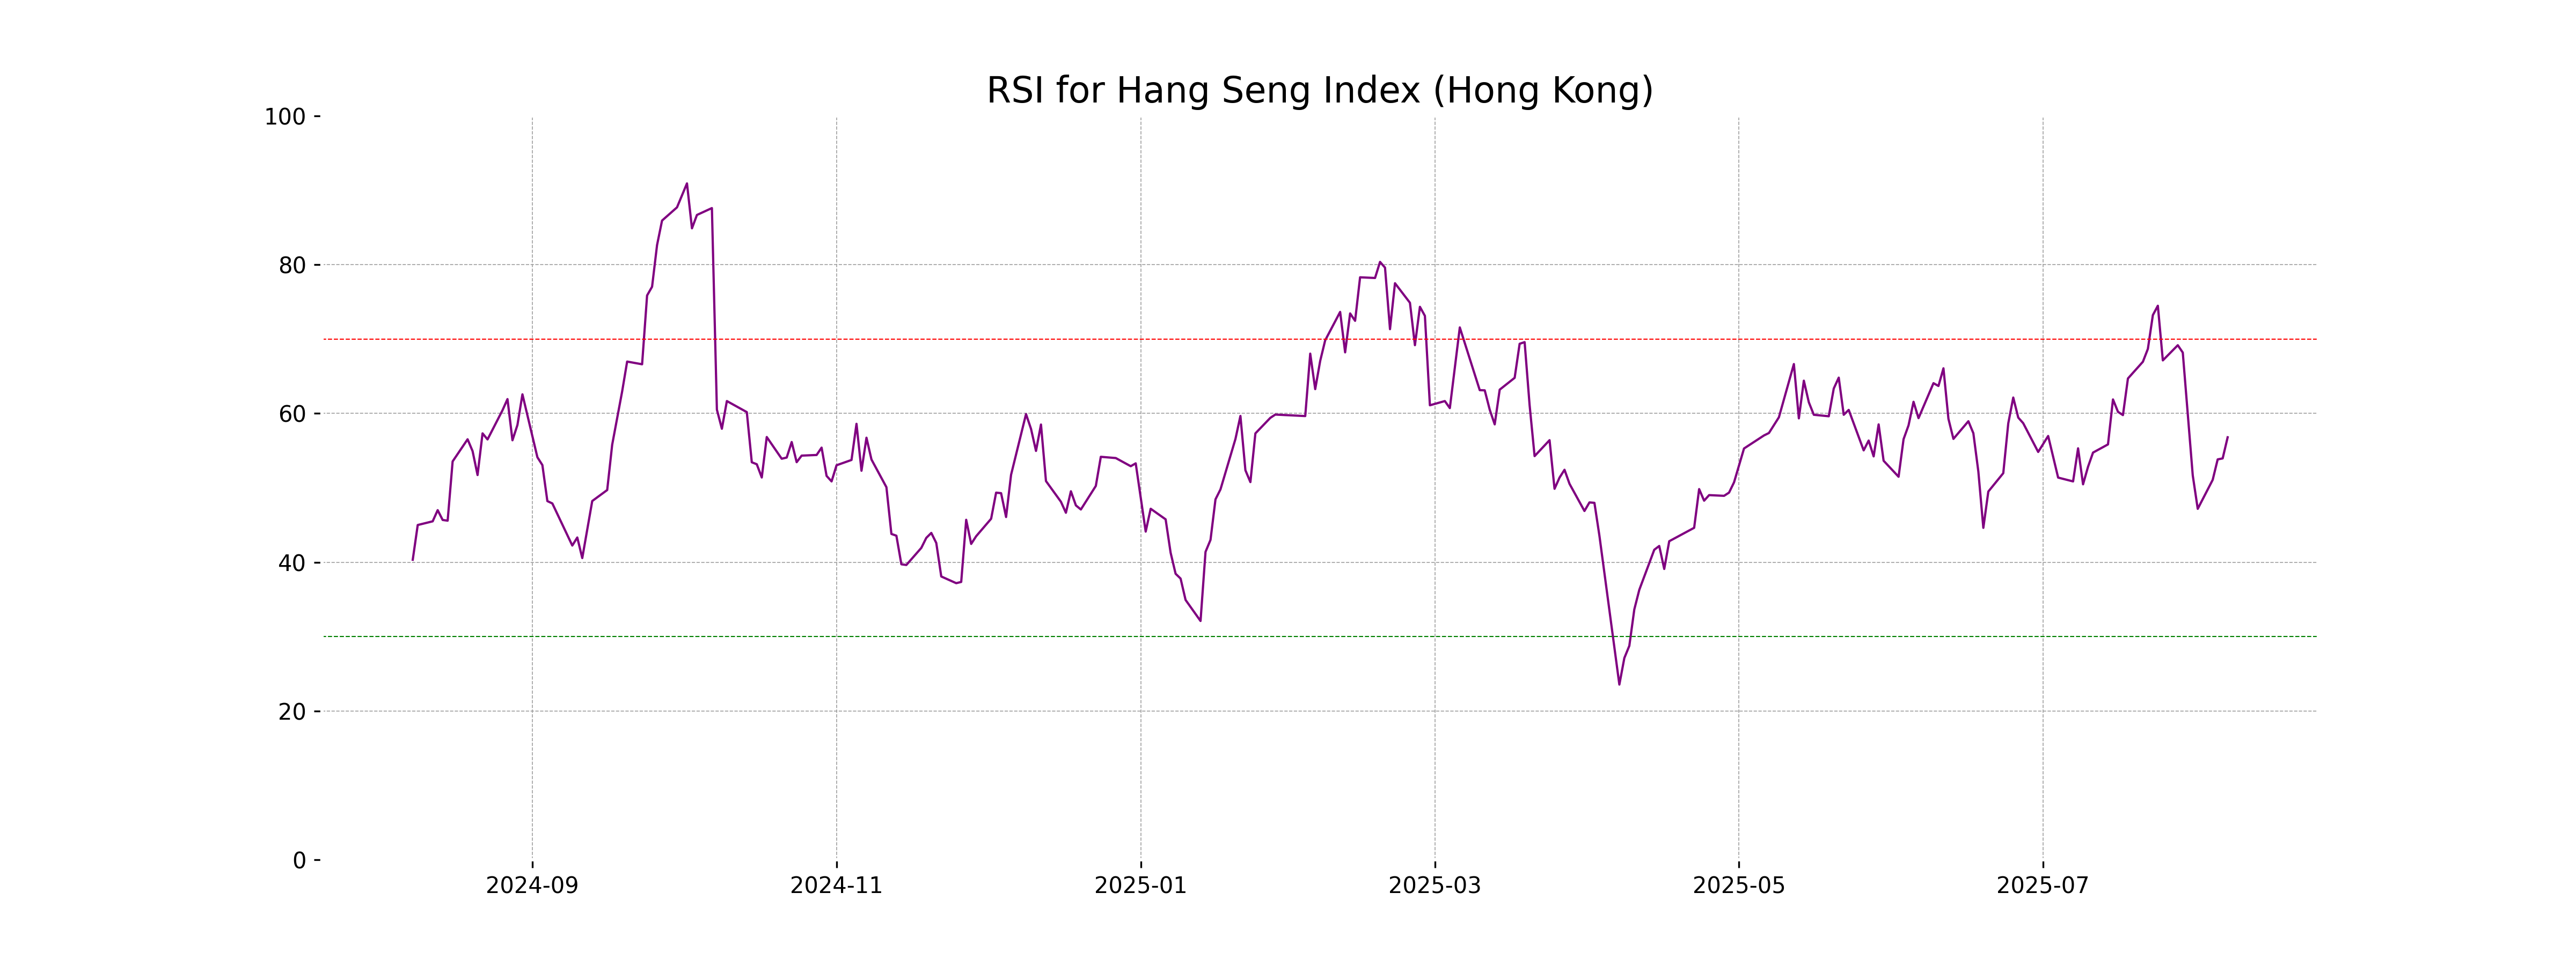
RSI Analysis for Hang Seng Index The RSI value of 56.80 suggests that the Hang Seng Index is in a neutral zone, indicating there is no immediate overbought or oversold condition. This suggests potential stability in the current trend, with neither bullish nor bearish momentum dominating strongly.
Analysis for IBEX 35 (Spain) - August 07, 2025
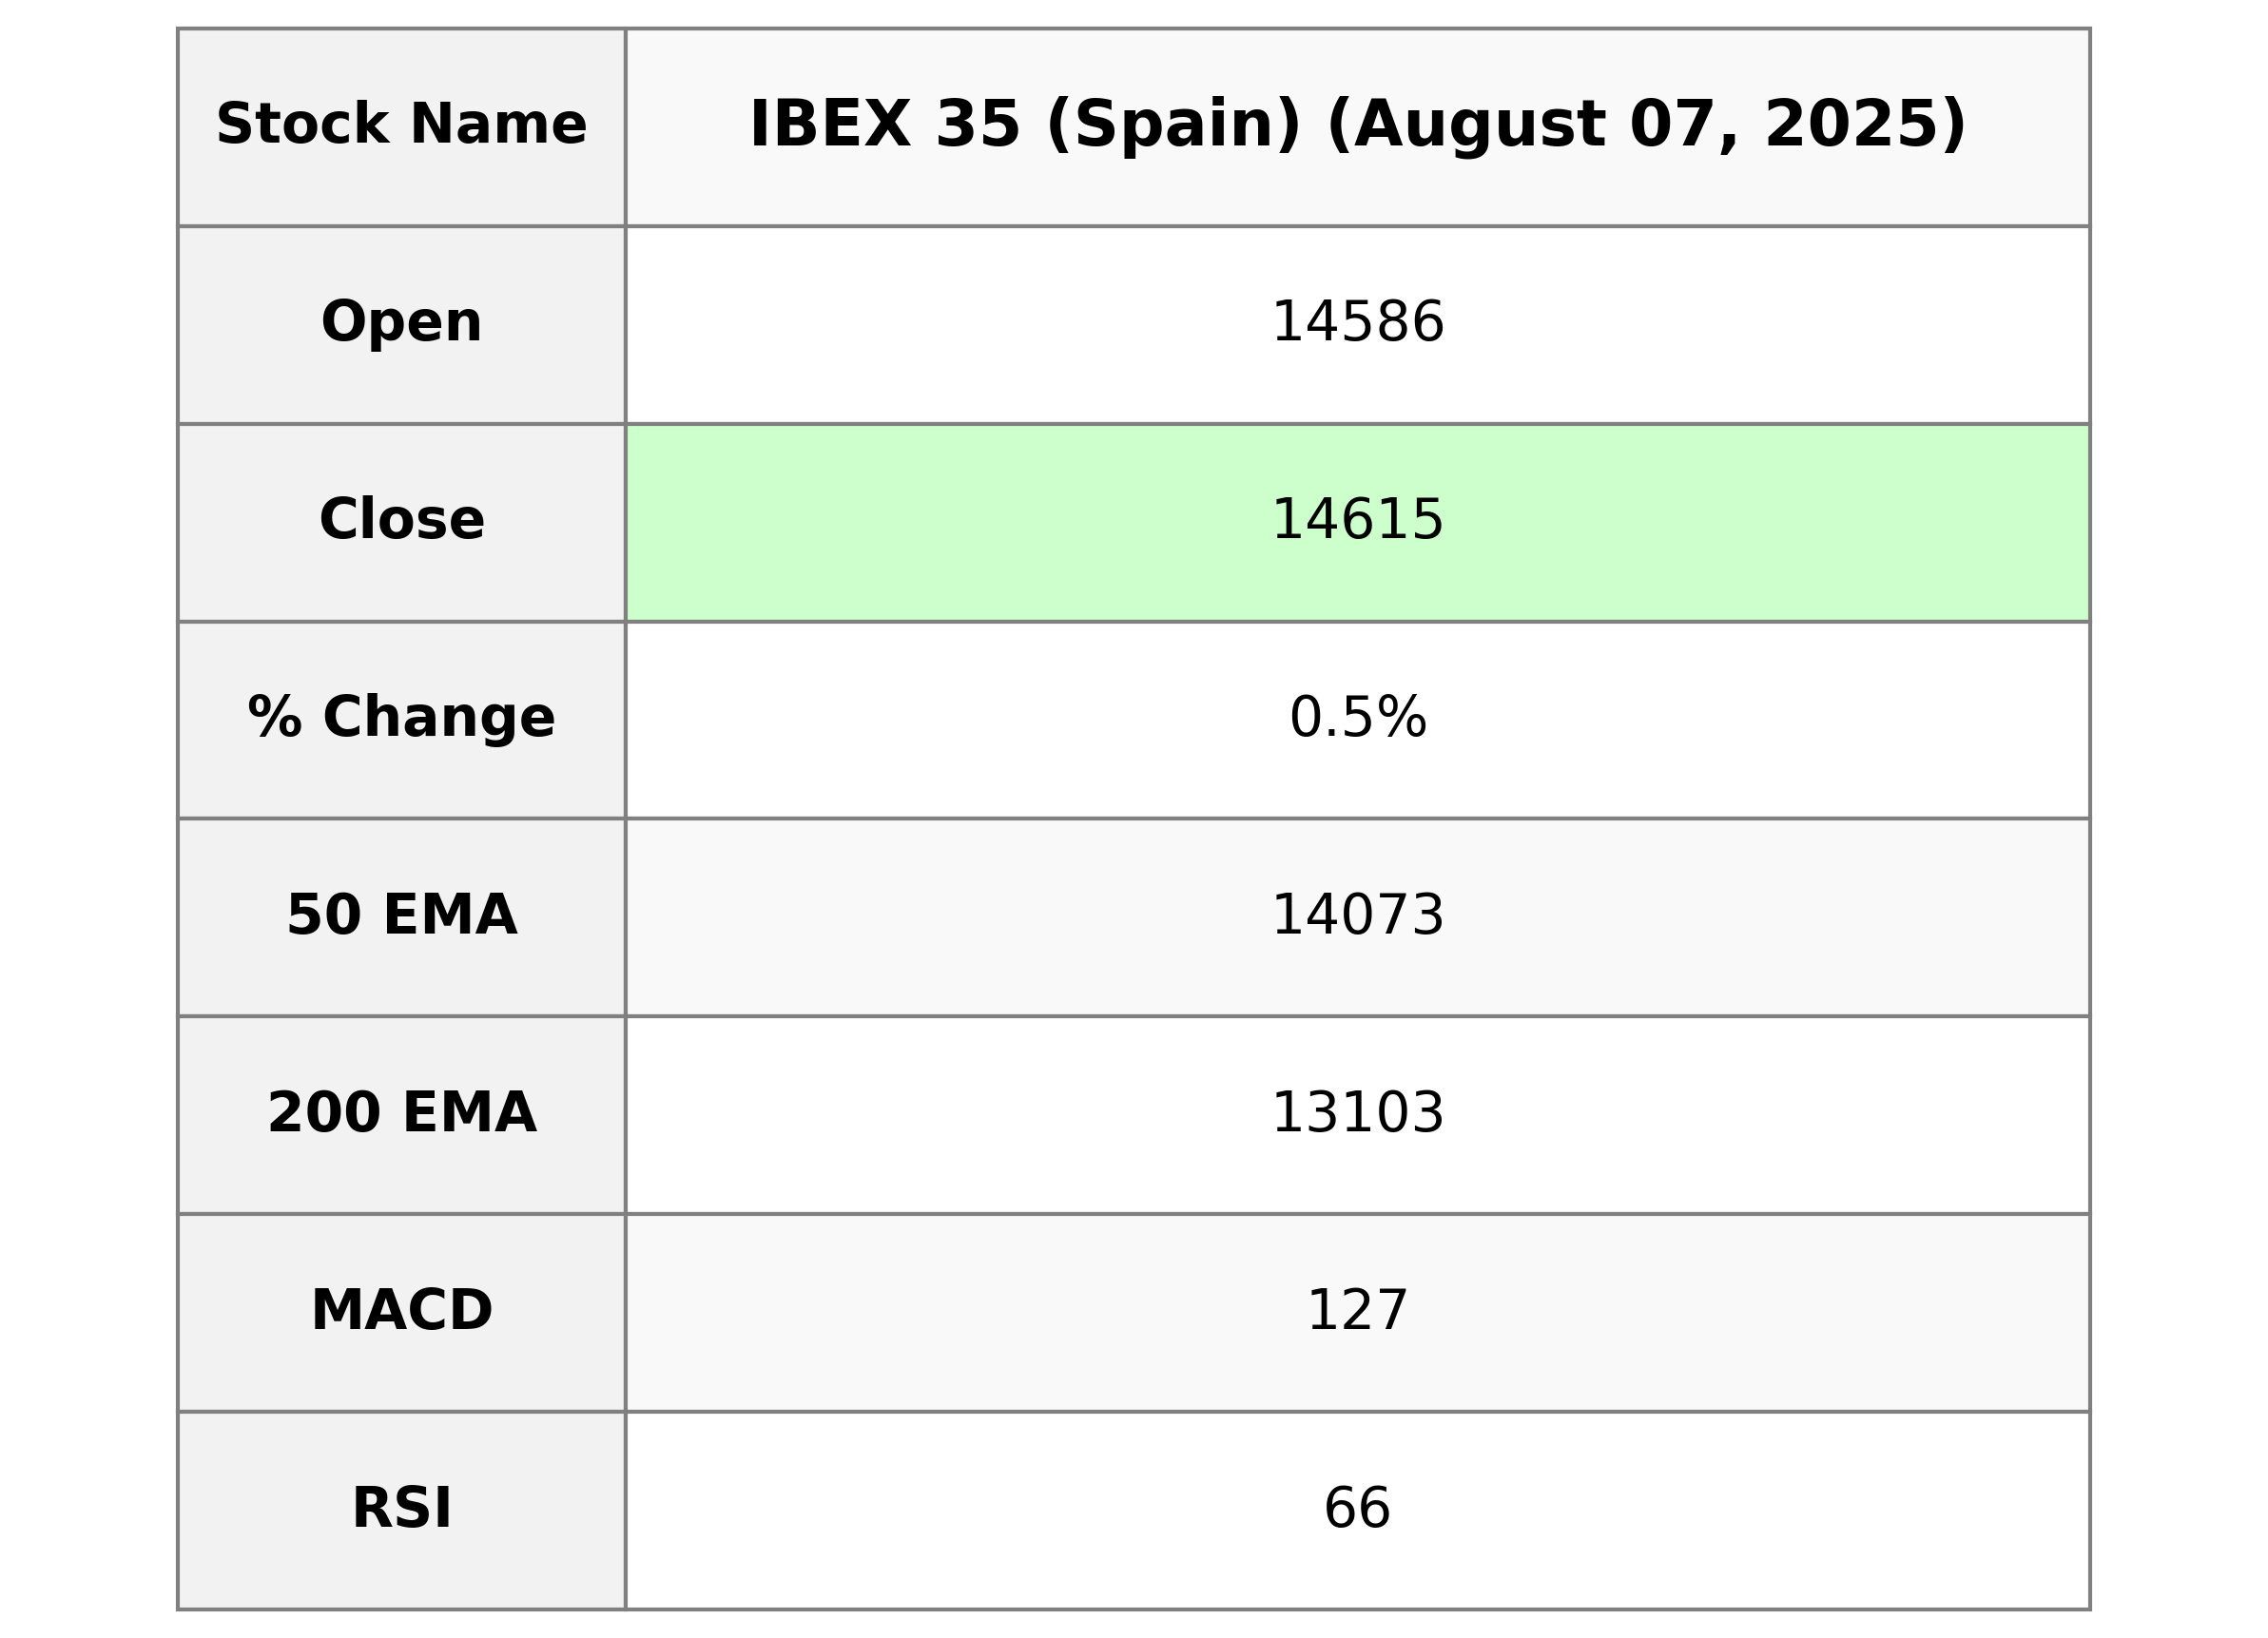
The IBEX 35 Index opened at 14,586.5 and closed at 14,615.20 with a gain of 0.54%, reflecting a points increase of 78.60. The index experienced a trading range with a high of 14,672.40 and a low of 14,586.5, on a trading volume of 35,616,643. The RSI indicates a relatively strong position at 66.34, supported by a MACD above its signal line, suggesting positive momentum.
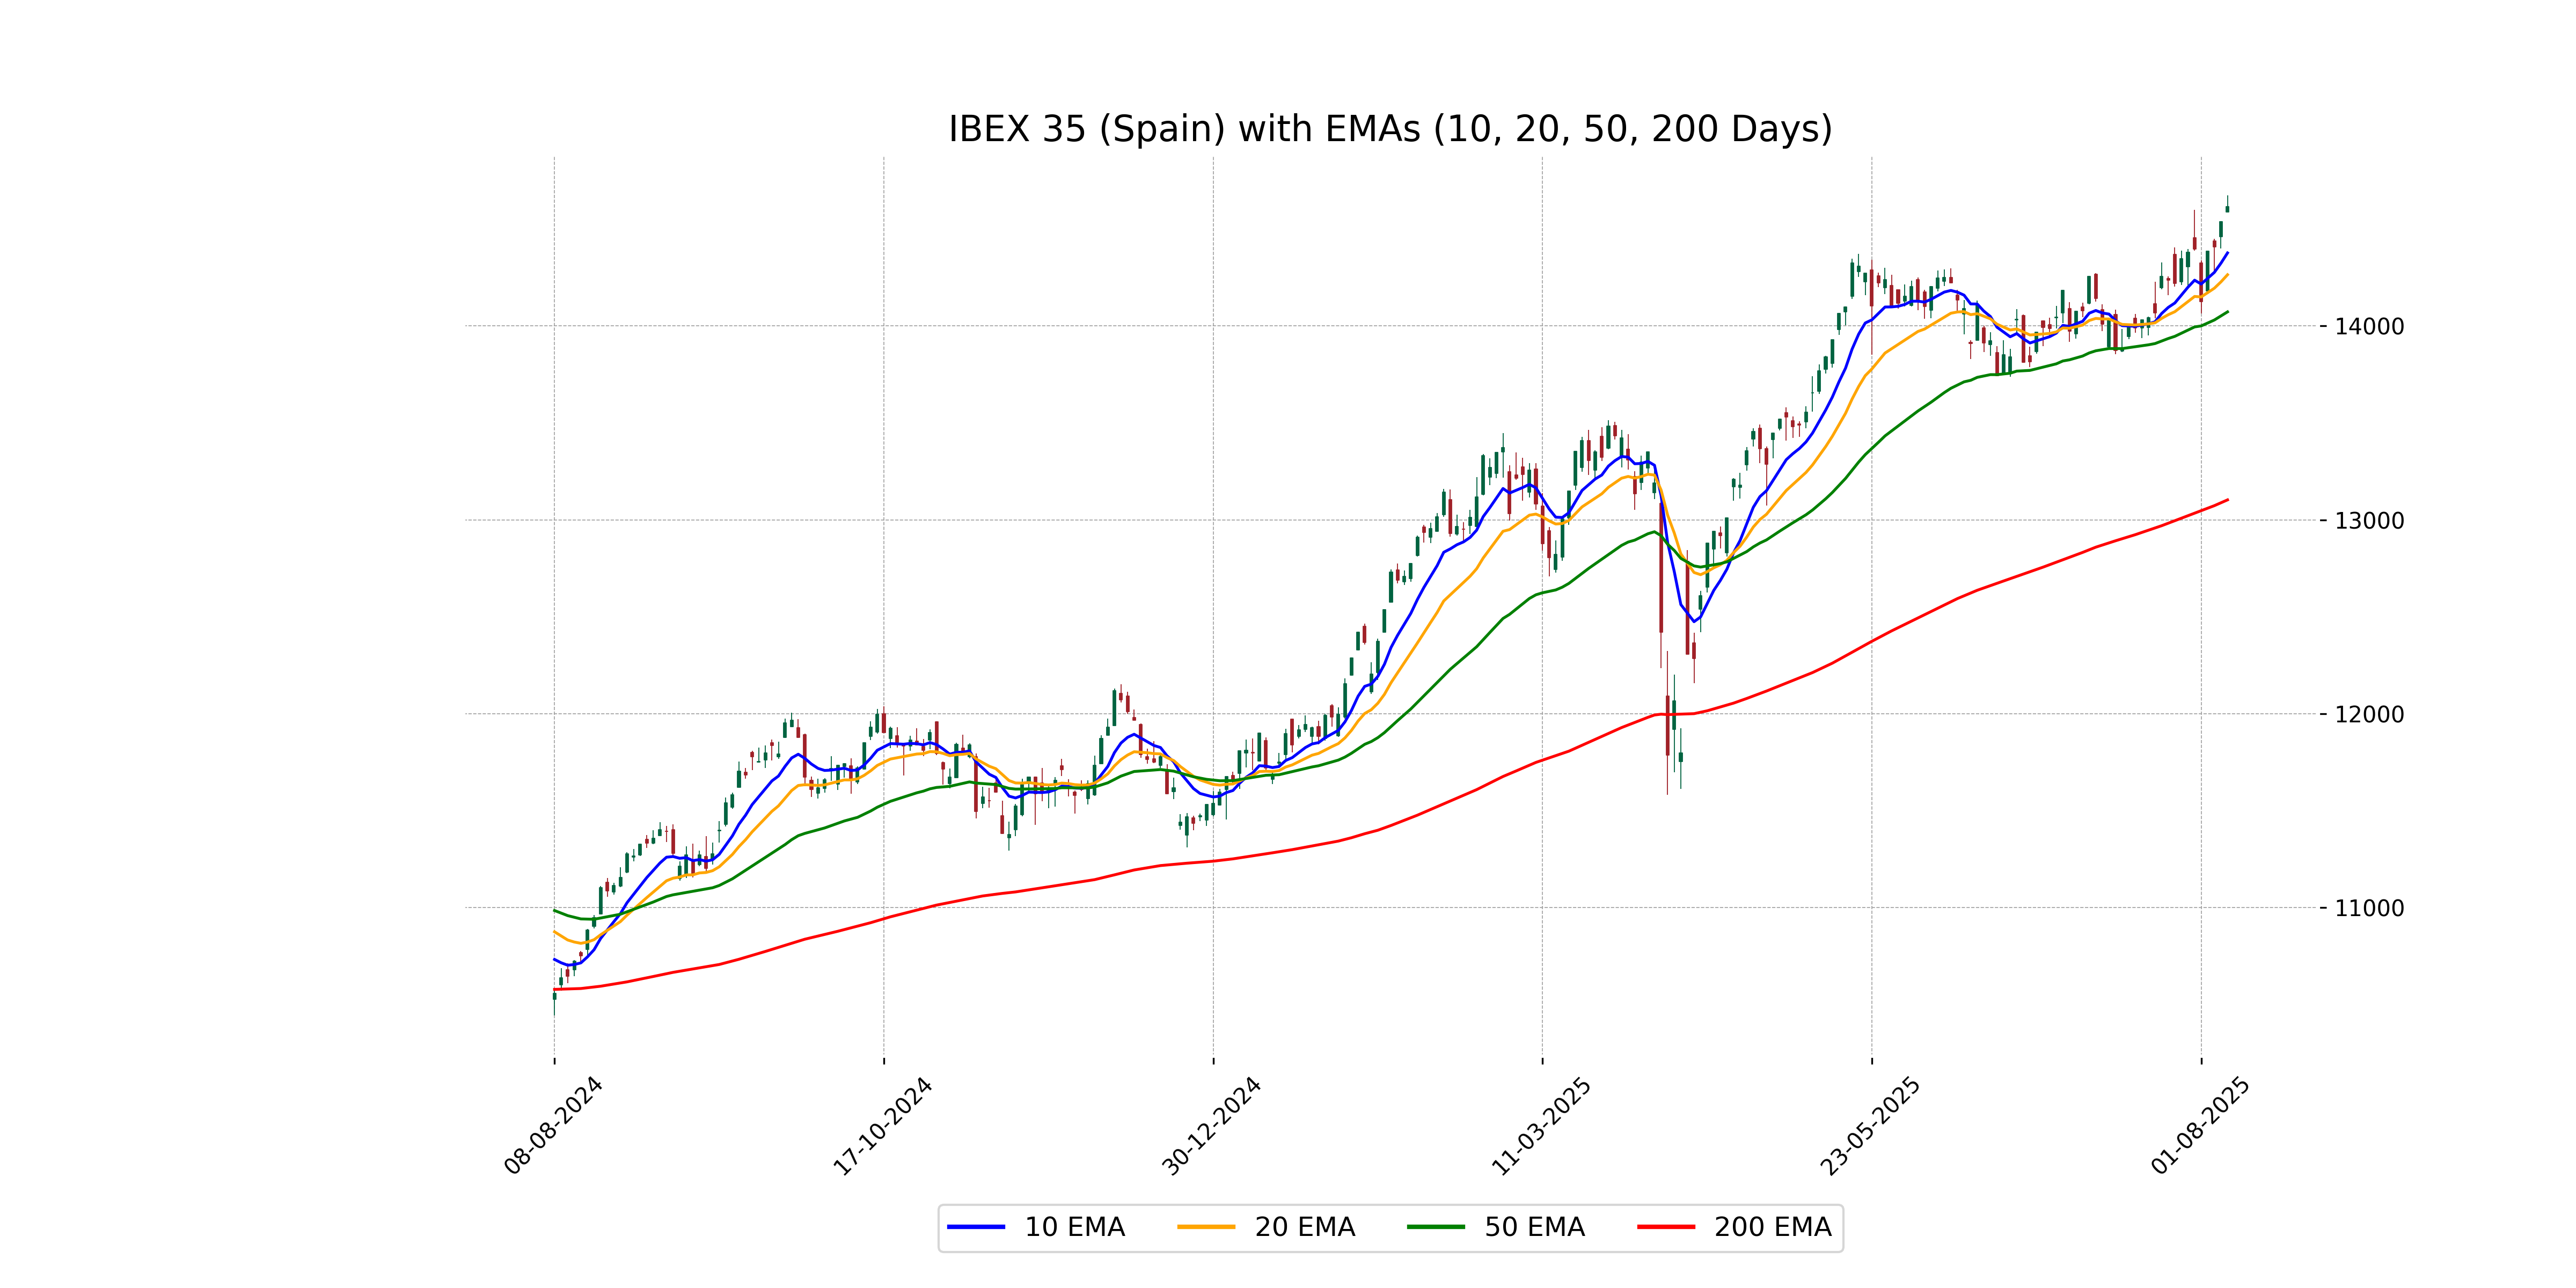
Relationship with Key Moving Averages
The IBEX 35 closed at 14615.20, which is above its 10 EMA (14376.54), 20 EMA (14264.09), 50 EMA (14072.54), and 200 EMA (13102.99), indicating a strong uptrend. The closing price is particularly bullish, maintaining a healthy momentum as reflected by its positive MACD.
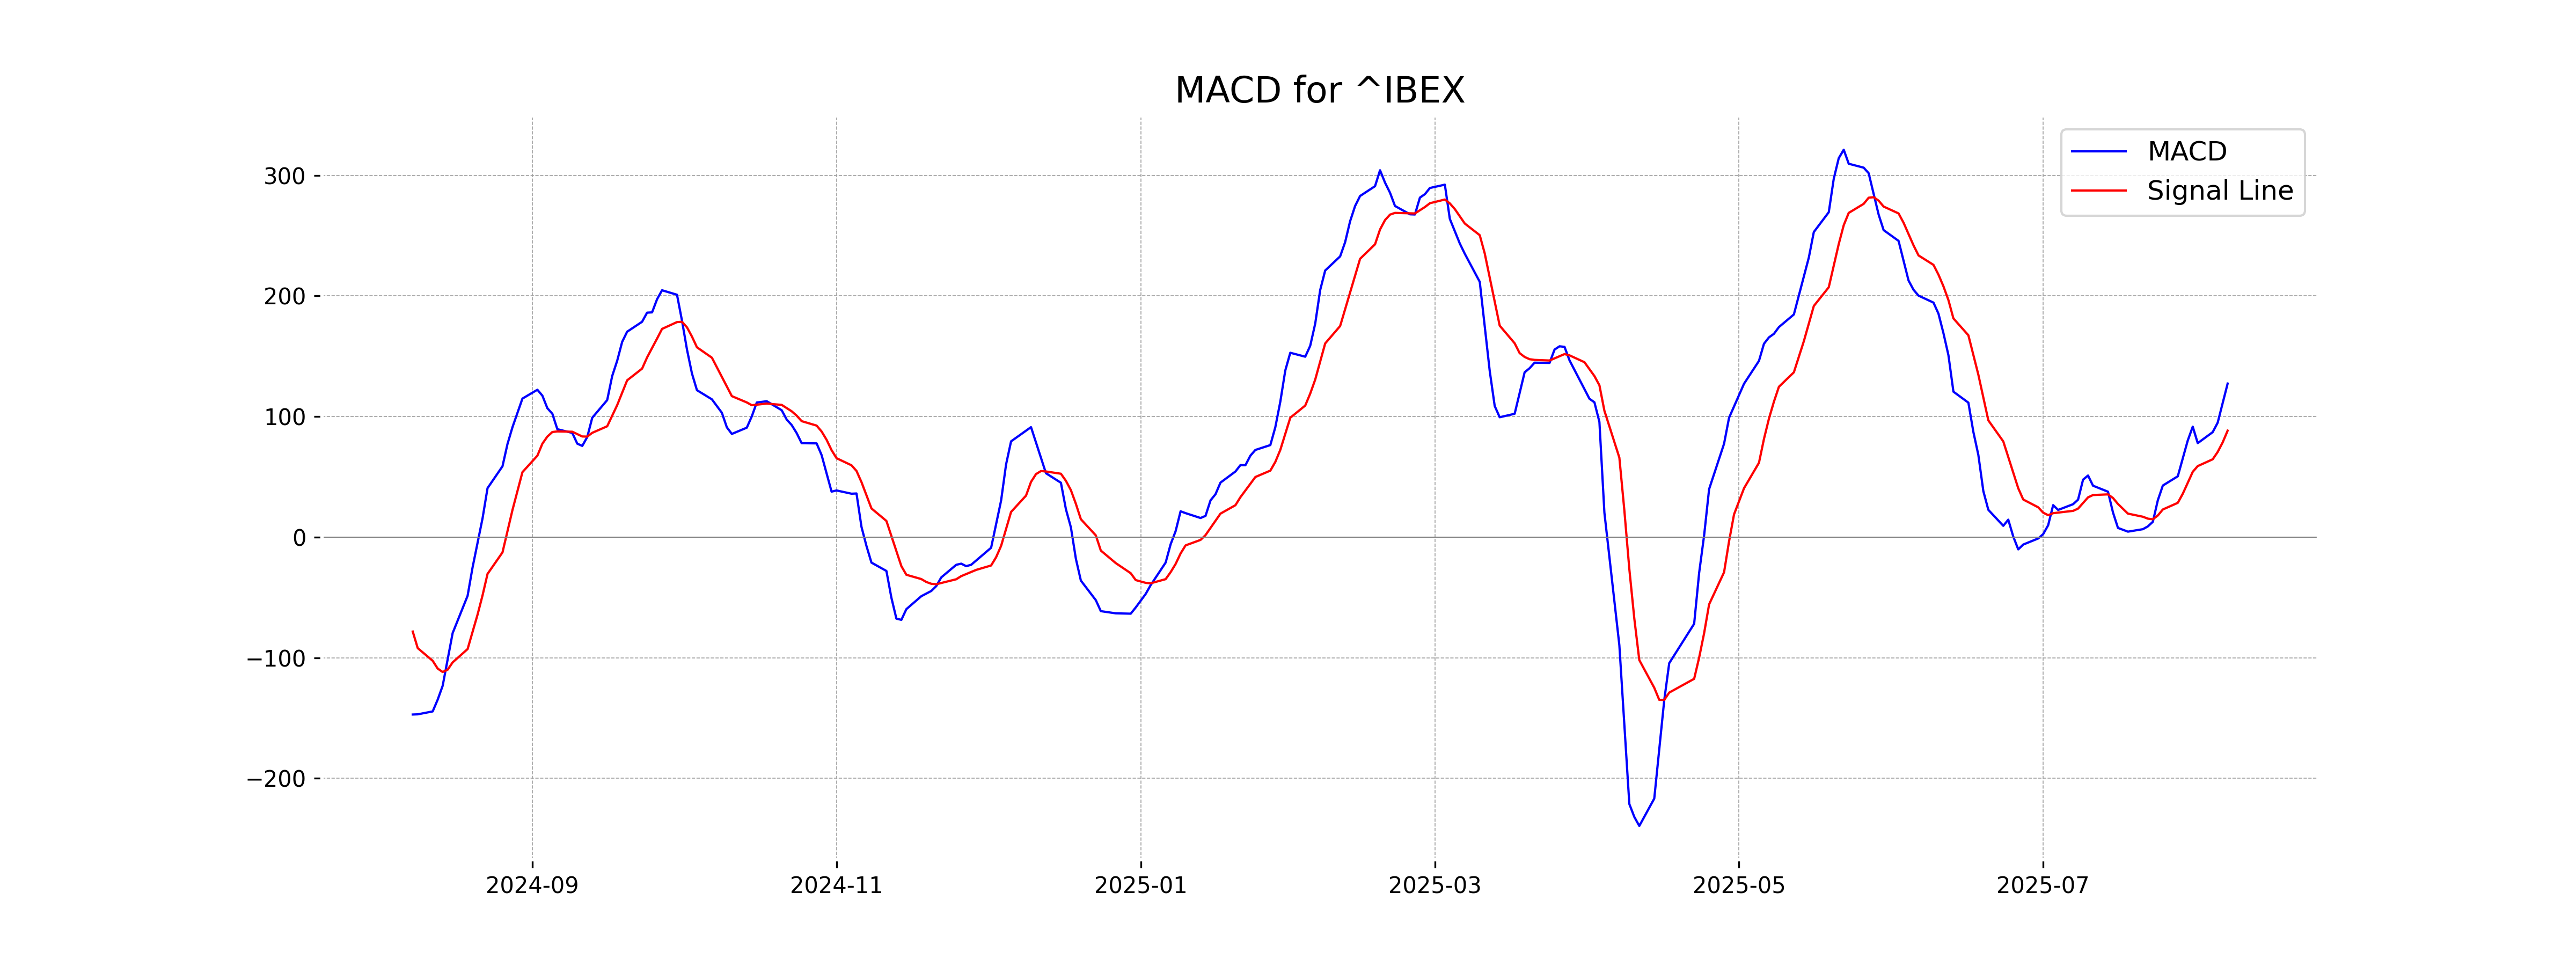
Moving Averages Trend (MACD)
The IBEX 35 index shows a bullish trend, as indicated by the MACD of 127.32 being above the MACD Signal line of 88.29. This suggests that the upward momentum might continue.
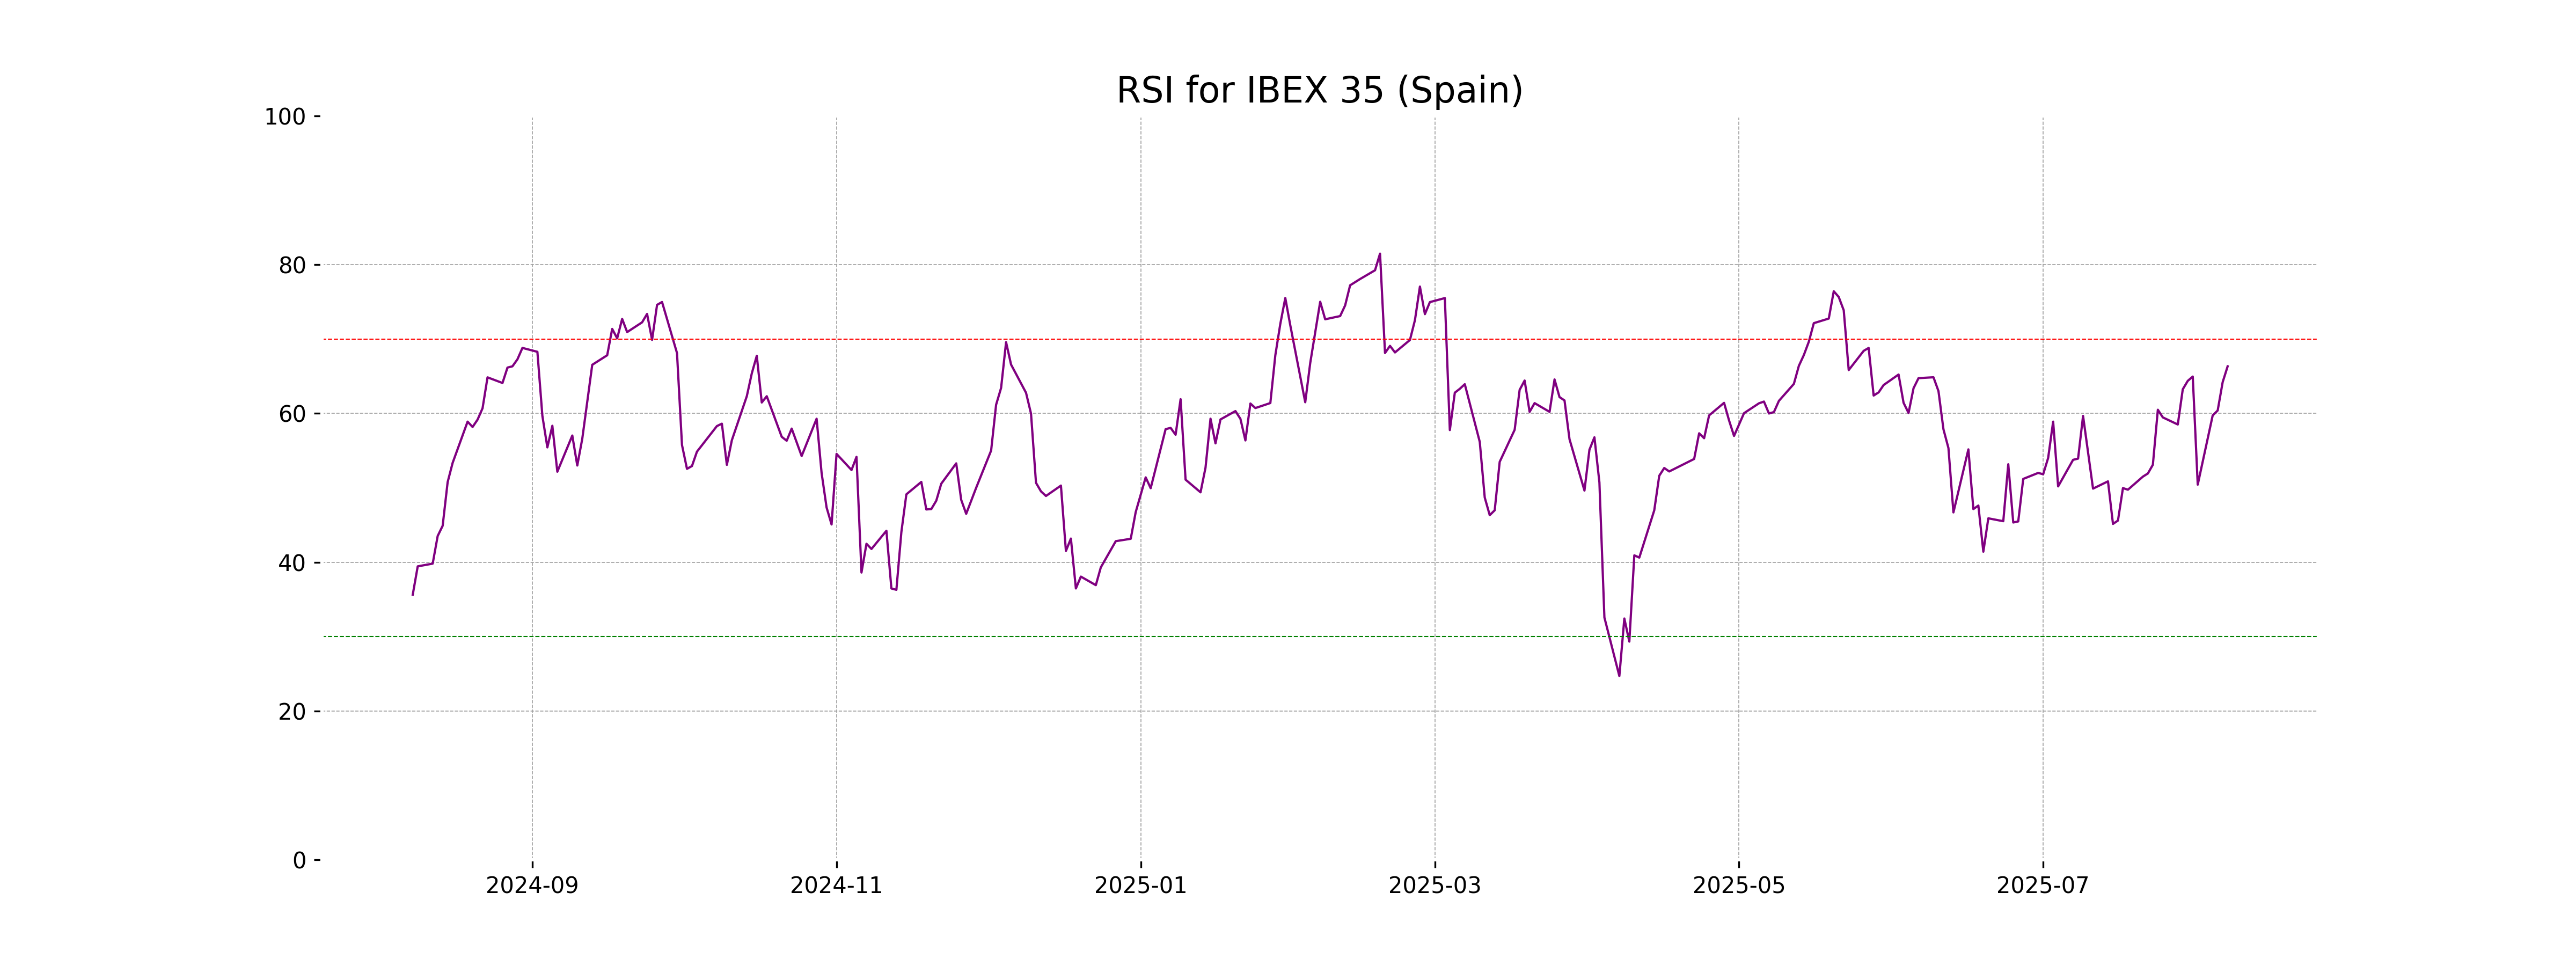
RSI Analysis
The RSI value for IBEX 35 is 66.34, indicating that the index is approaching the overbought territory. Generally, an RSI above 70 suggests that the asset may be overbought, potentially signaling a reversal or pullback. However, with the current reading, it is still slightly below that level, suggesting moderate bullish momentum.
Analysis for NASDAQ Composite (US) - August 07, 2025
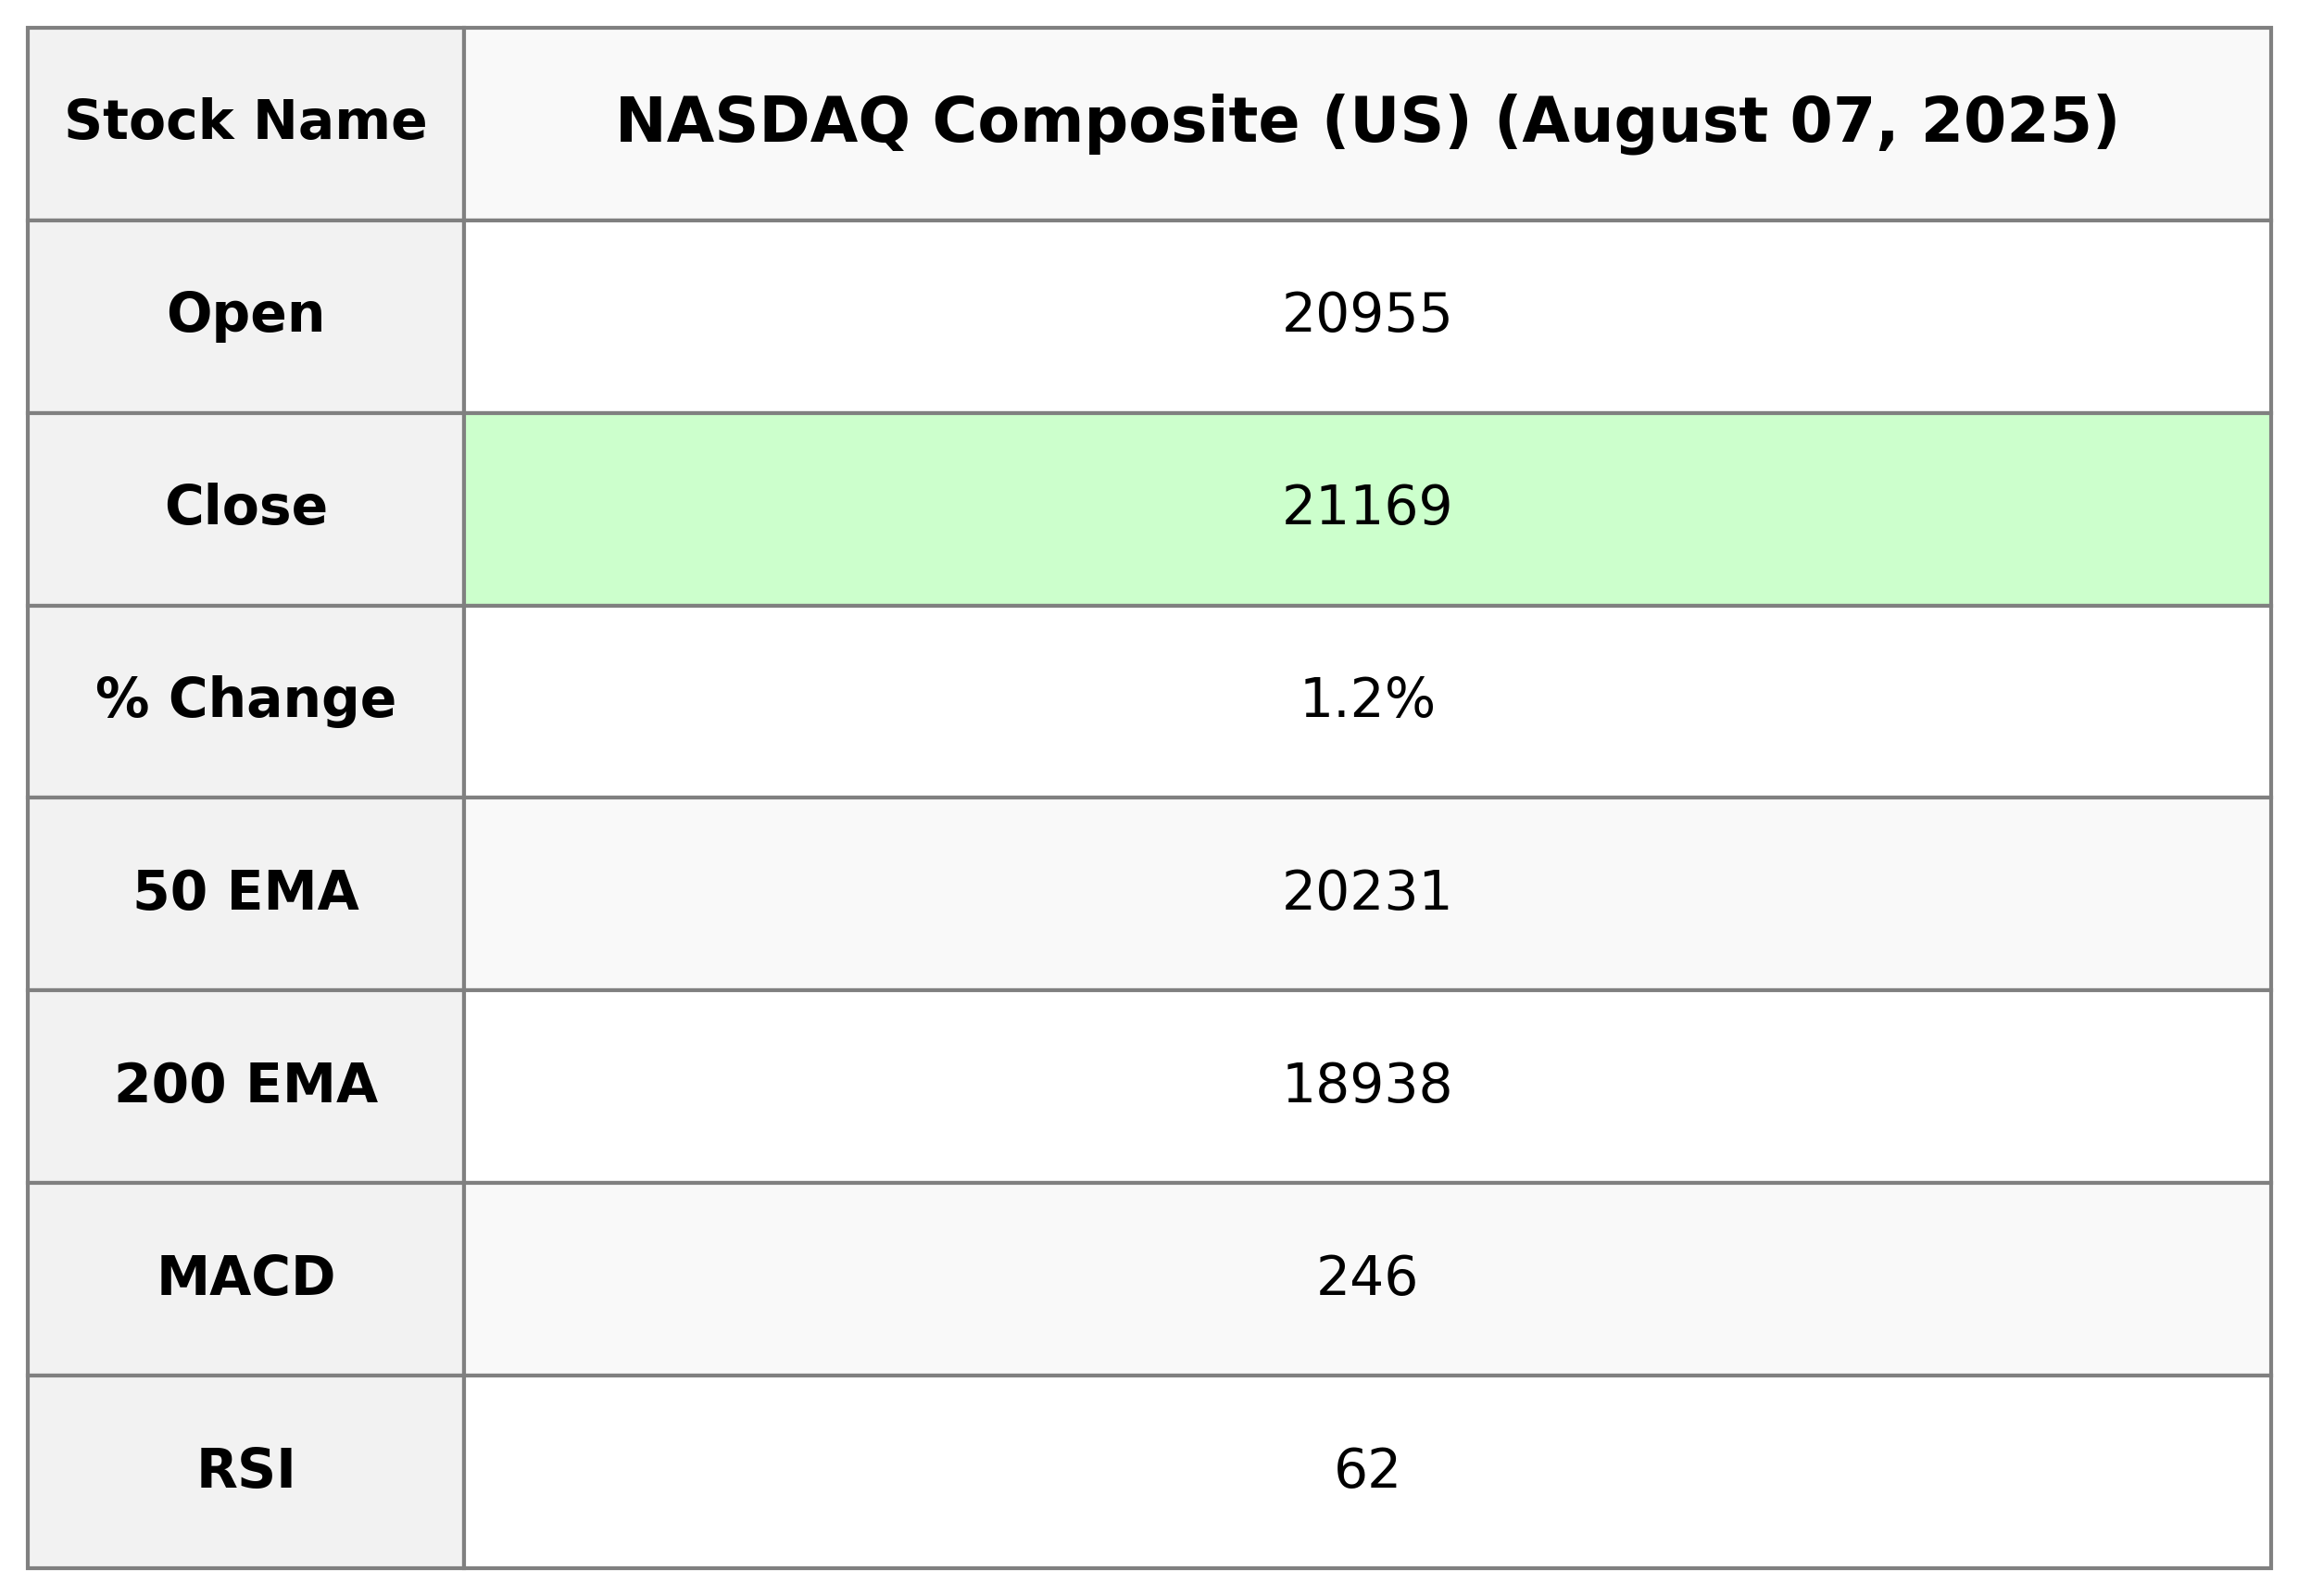
The NASDAQ Composite (US) opened at 20,955.22, reached a high of 21,183.88, and closed at 21,169.42, marking a 1.21% increase with a 252.87-point change from the previous close. The trading volume was notable at 8.58 billion. The current RSI at 62.23 indicates a moderately strong momentum, and the MACD suggests a potential trend continuation.
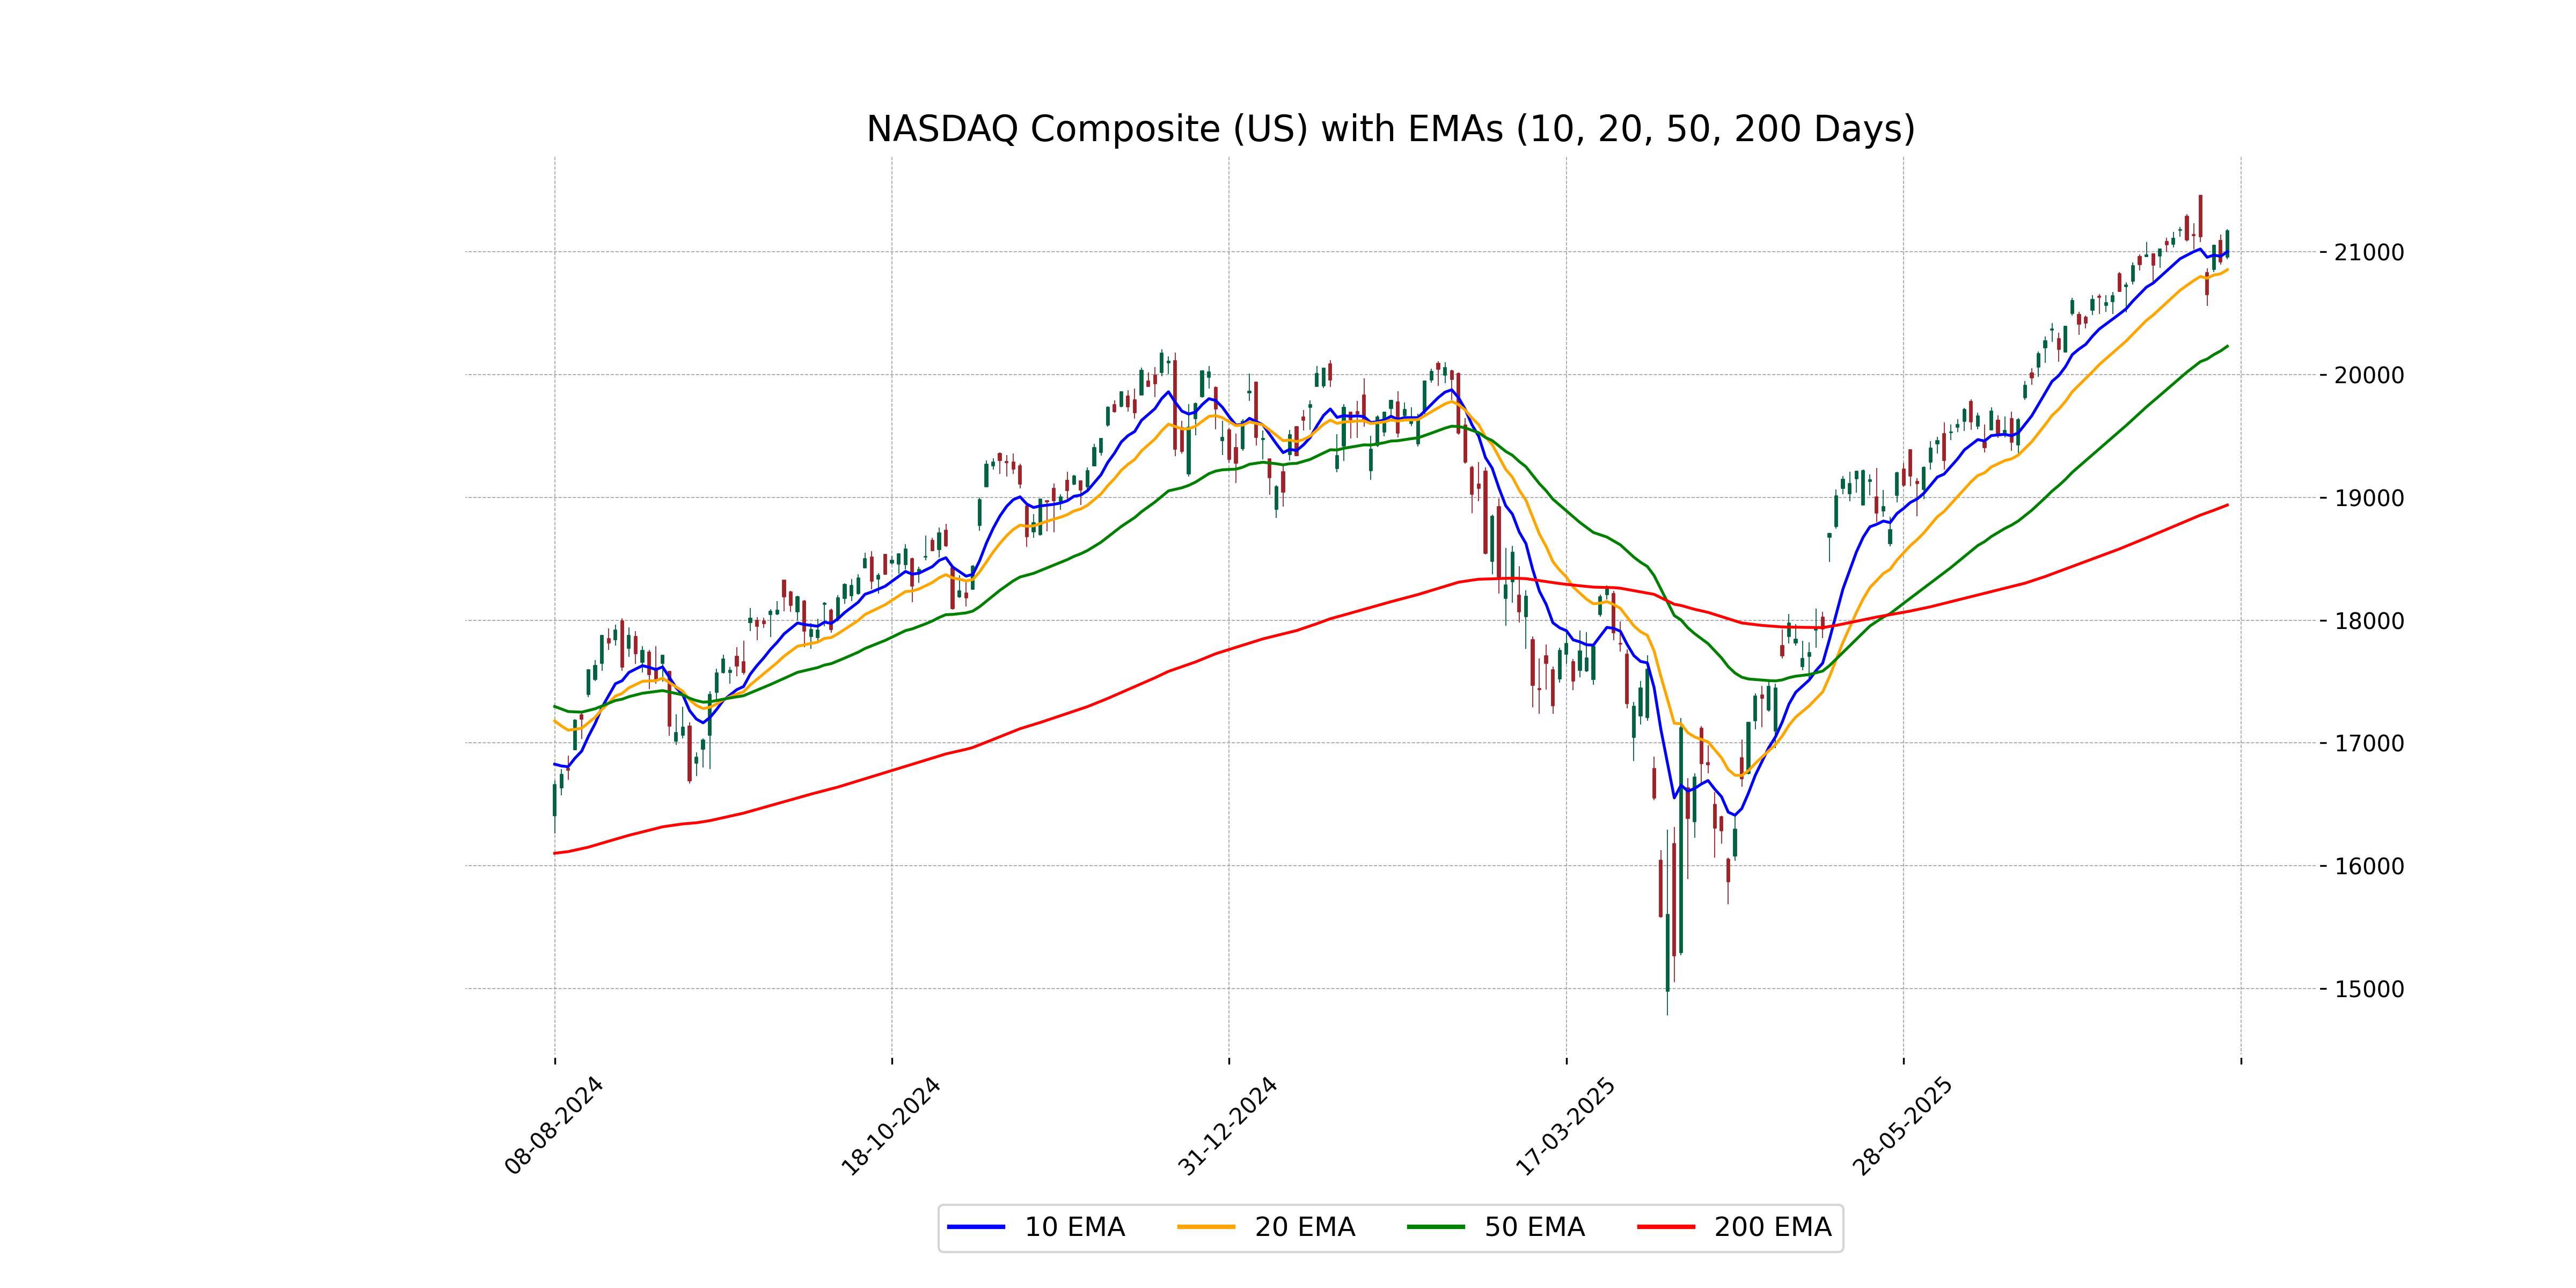
Relationship with Key Moving Averages
NASDAQ Composite (US) closed at 21169.42, which is above its 10 EMA of 21000.10, 20 EMA of 20853.41, and 50 EMA of 20230.56, indicating a bullish trend over these time frames. The current price is also significantly higher than the 200 EMA of 18937.68, suggesting a strong upward momentum in the longer term as well.
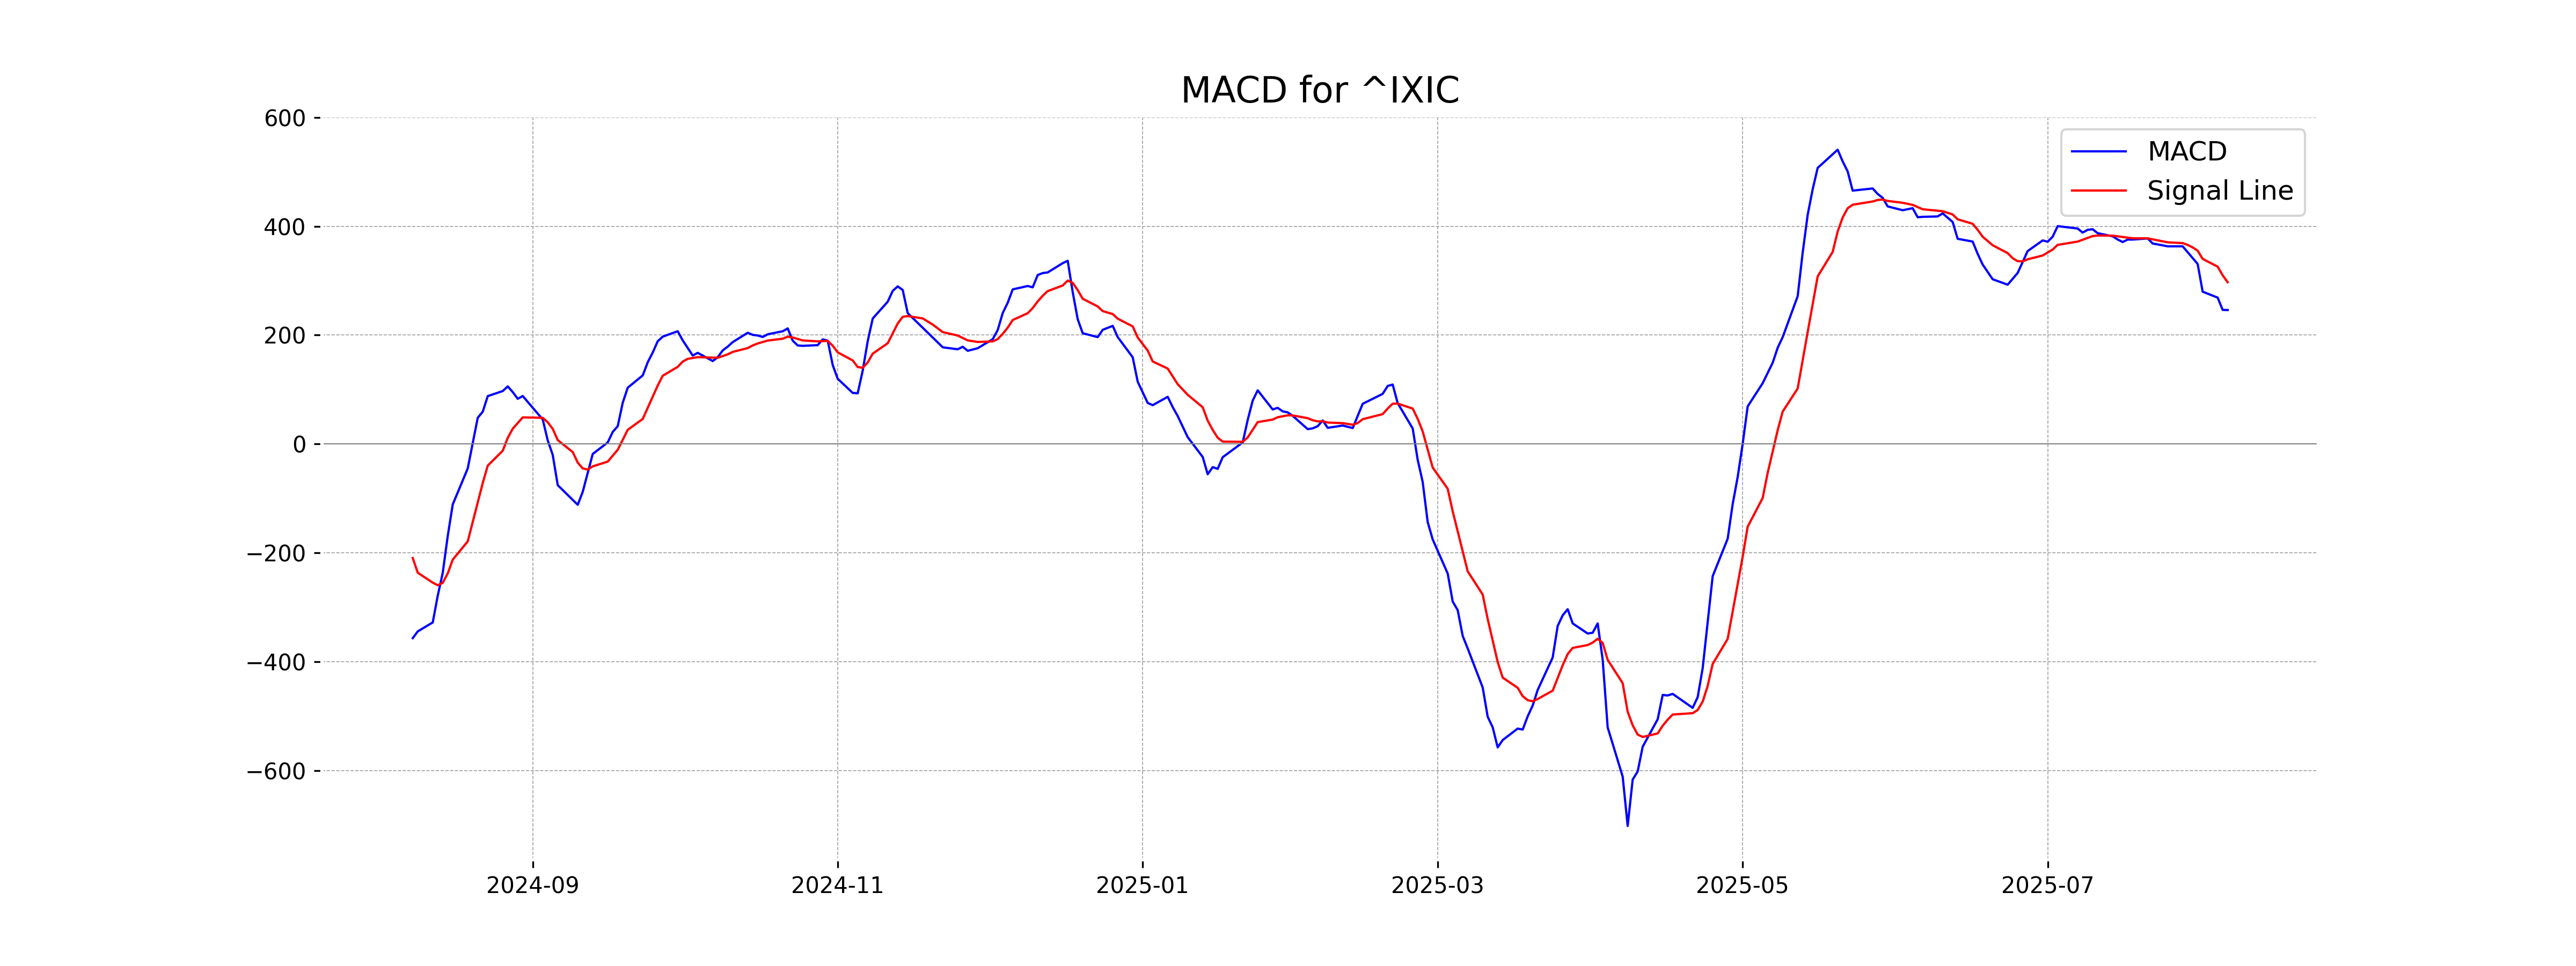
Moving Averages Trend (MACD)
The MACD for the NASDAQ Composite (US) is 246.00, while the MACD Signal is 297.09. Since the MACD is below the Signal line, this might suggest bearish momentum in the short term.
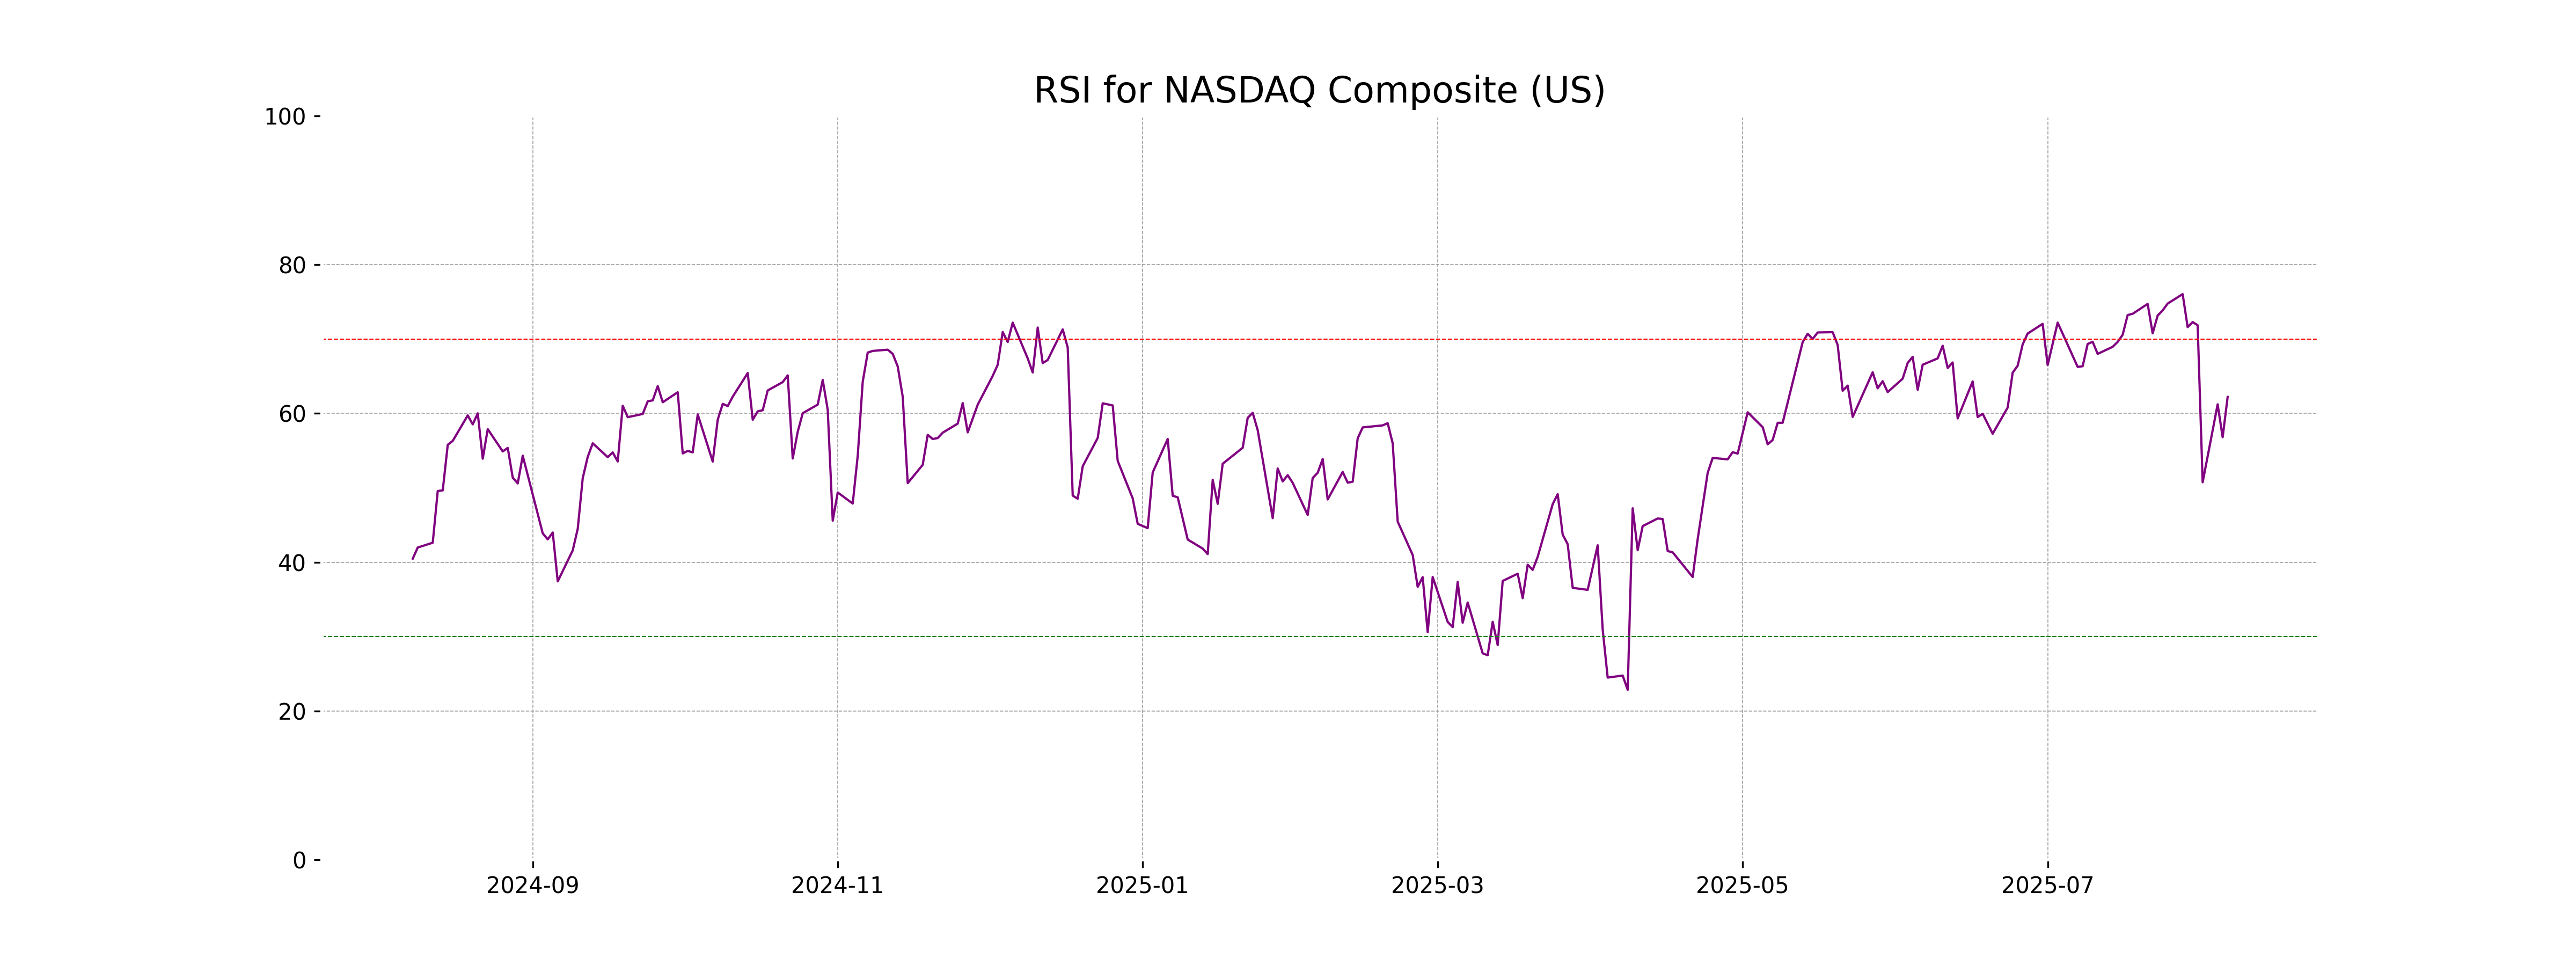
RSI Analysis
RSI Analysis for NASDAQ Composite The RSI (Relative Strength Index) for NASDAQ Composite is 62.23, which suggests that the index is in a neutral to slightly bullish zone. RSI values above 70 generally indicate overbought conditions, whereas values below 30 indicate oversold conditions. At 62.23, NASDAQ Composite is neither overbought nor oversold, suggesting moderate upward momentum.
Analysis for Nikkei 225 (Japan) - August 07, 2025
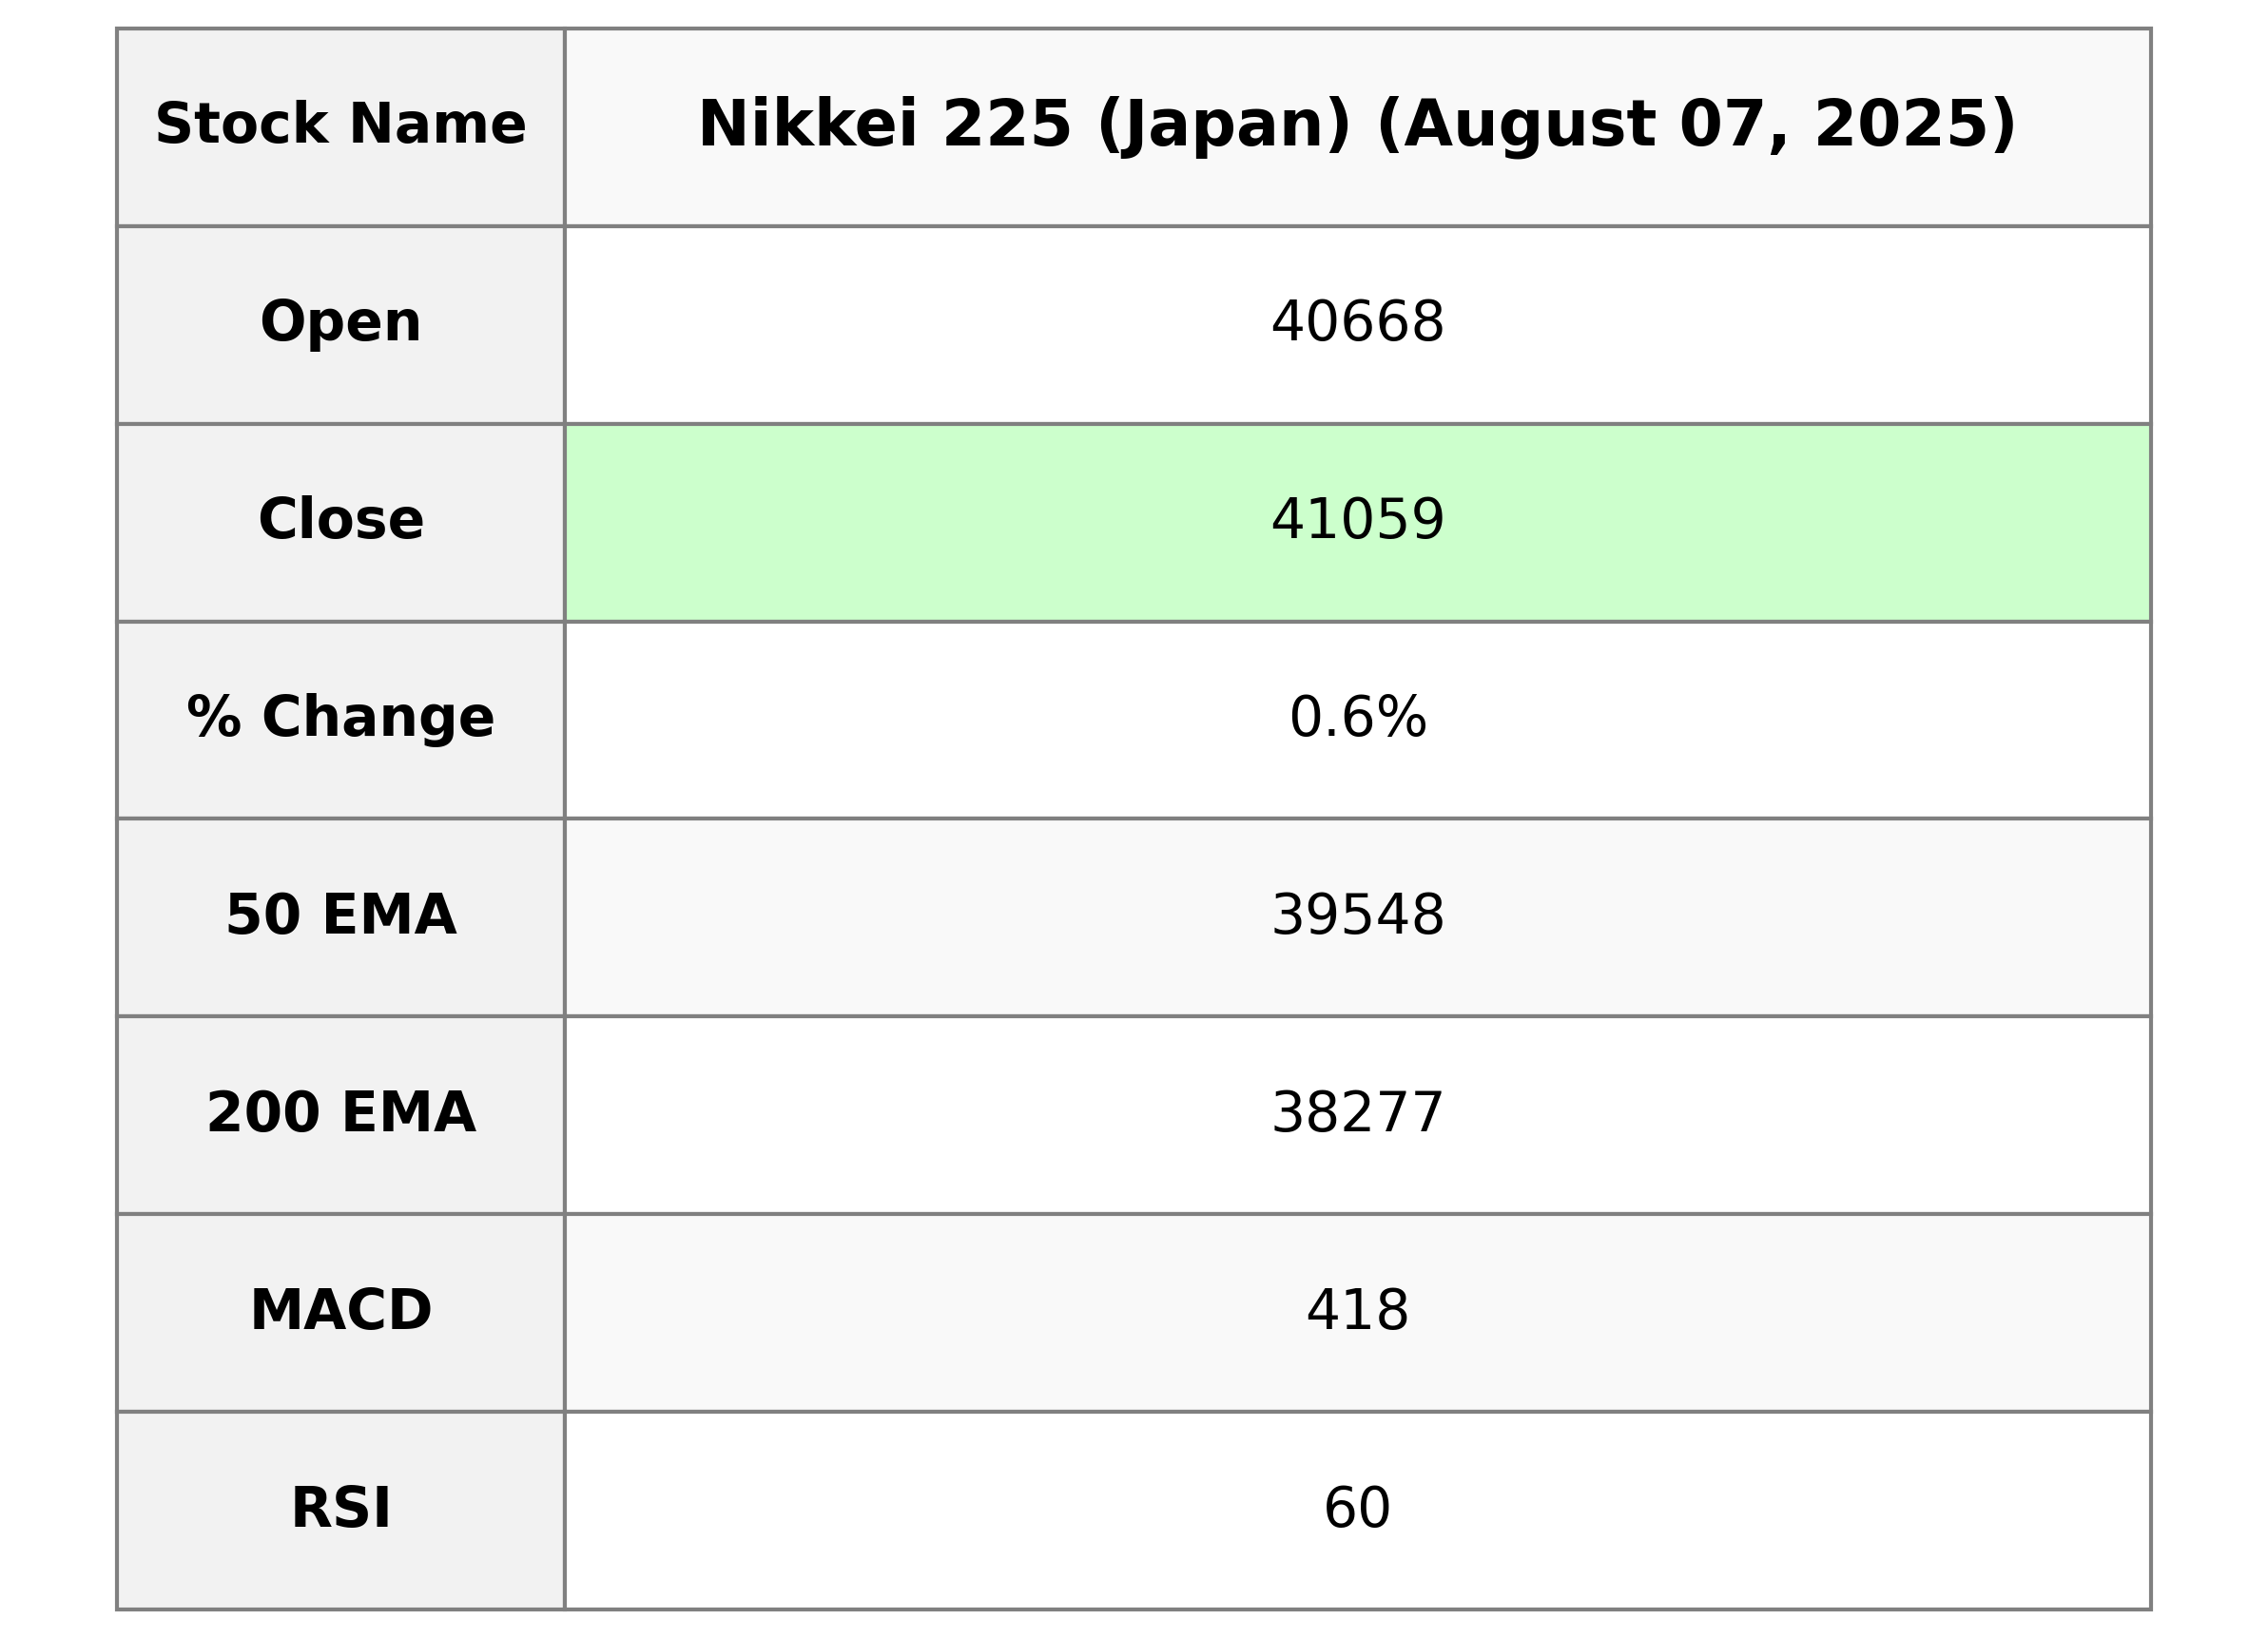
The Nikkei 225 opened at 40,668.19, reached a high of 41,164.10, and closed at 41,059.15, with a notable percentage change of 0.65% and a points change of 264.29. The 50-day and 200-day EMAs are 39,548.00 and 38,276.66 respectively, reflecting a bullish trend with an RSI of 60.28. The MACD indicates momentum at 418.20, slightly below the signal line of 474.69.
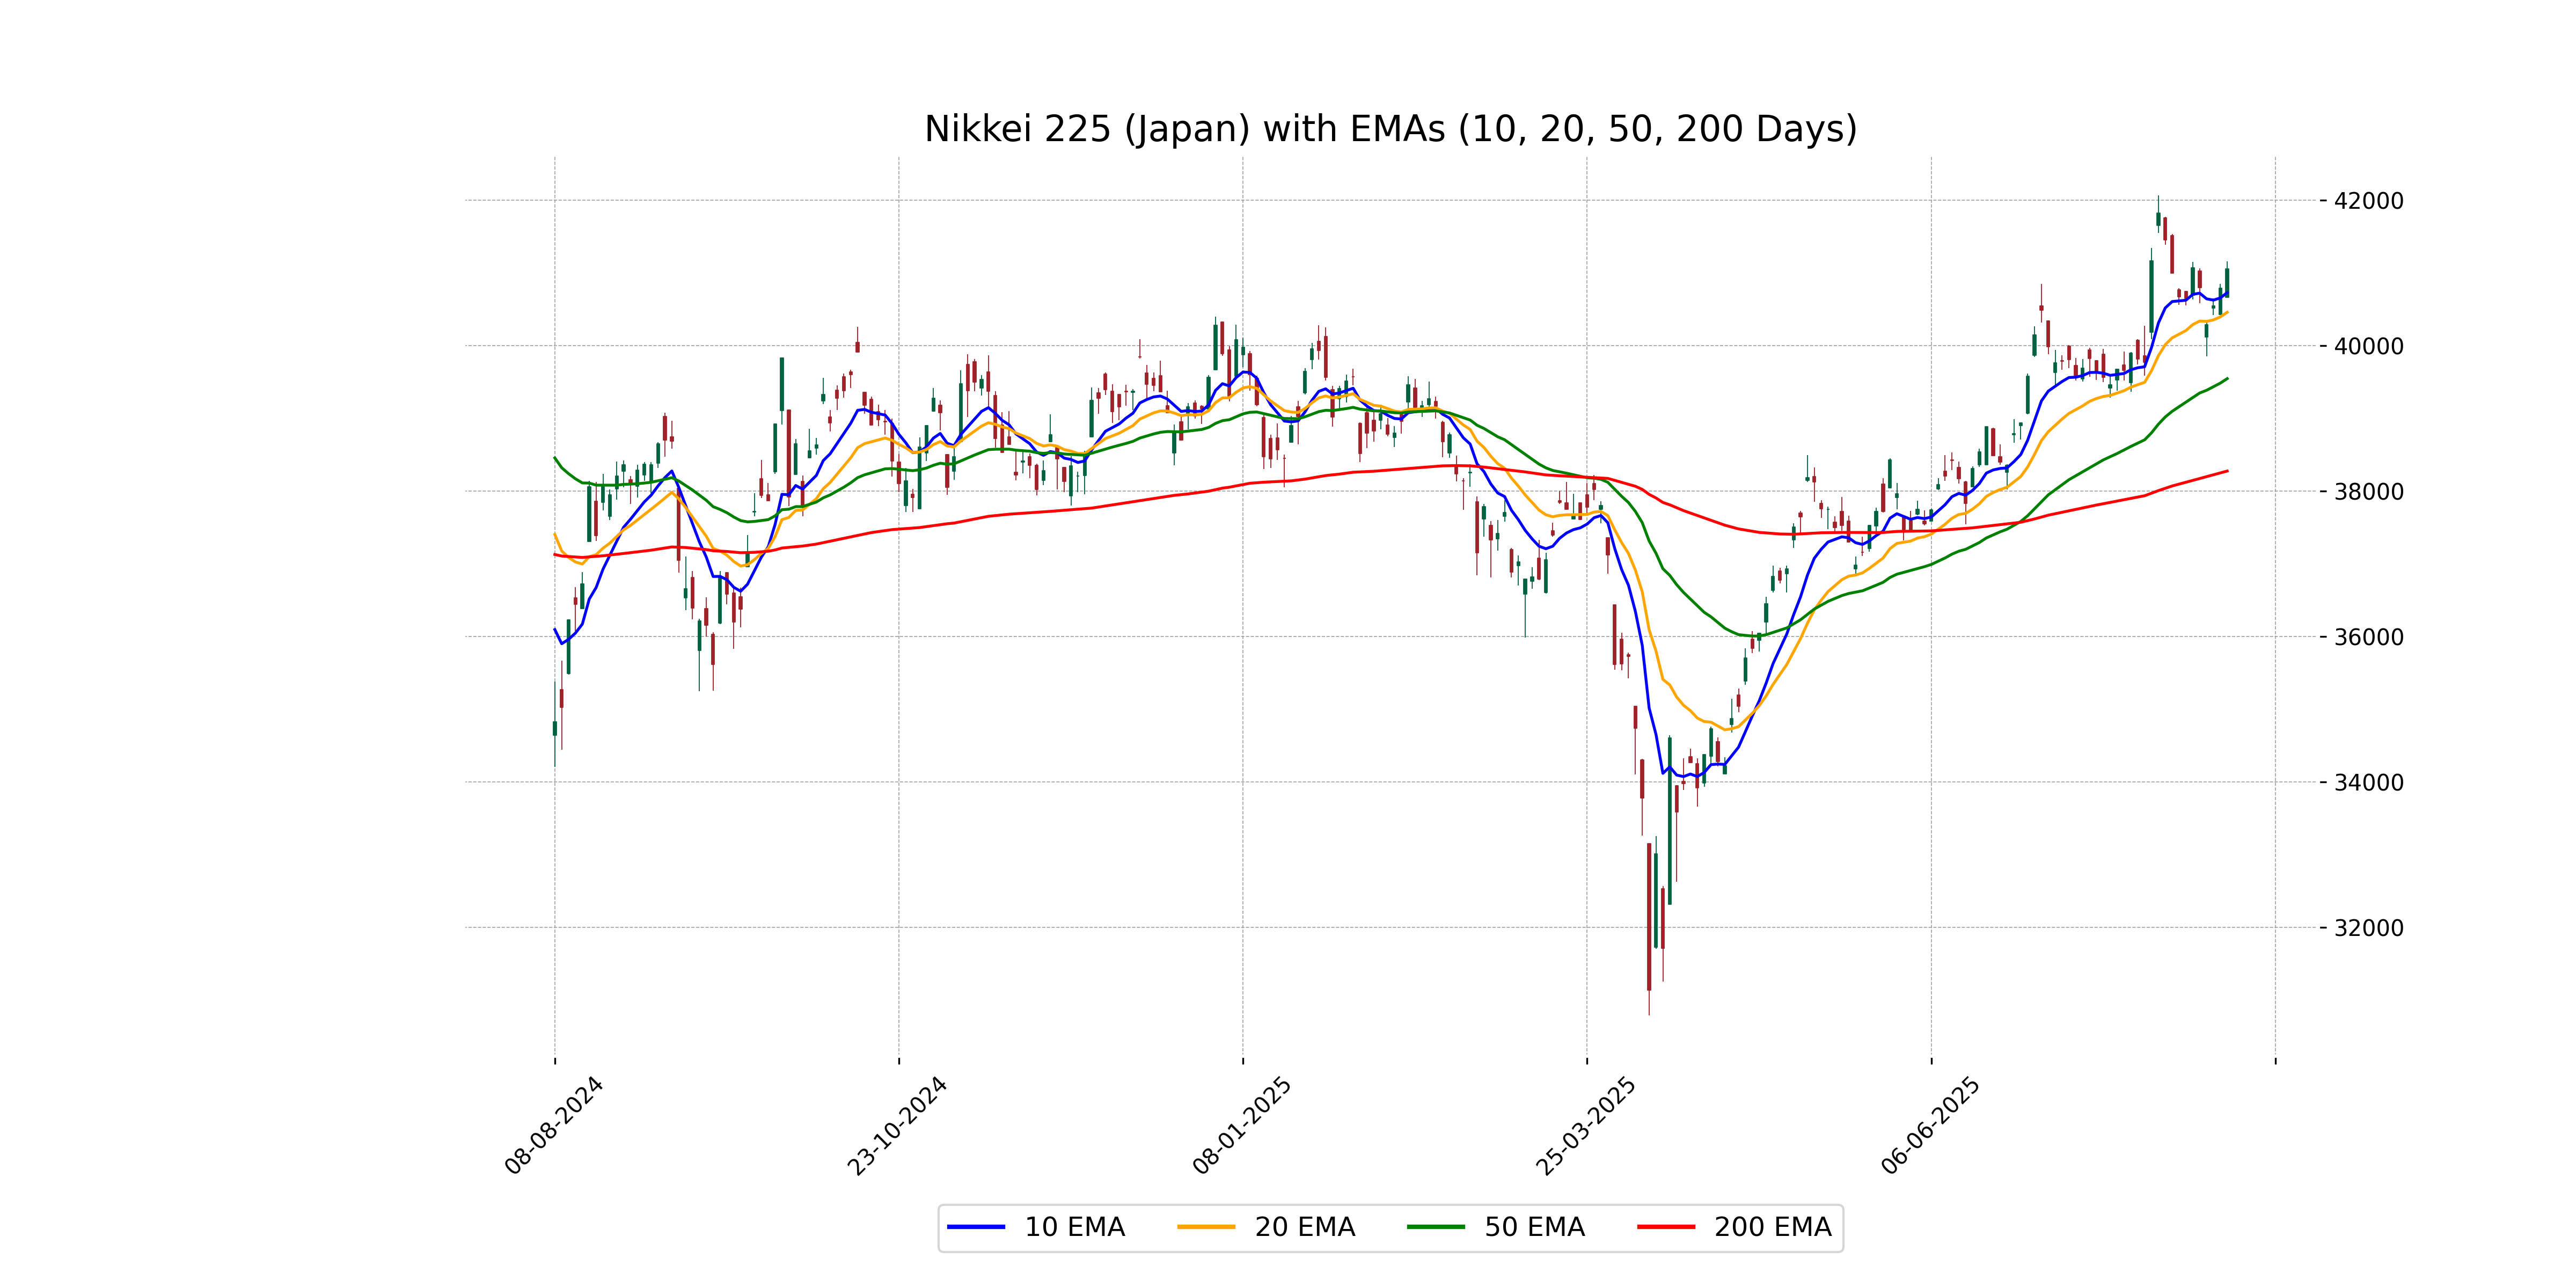
Relationship with Key Moving Averages
The Nikkei 225 is currently above its 10 EMA, 20 EMA, 50 EMA, and 200 EMA, indicating a bullish trend and strong market momentum. The close at 41059.1484375 surpasses all these moving averages, with the 50 EMA at 39548.00 and the 200 EMA at 38276.66, supporting the upward trend sentiment.
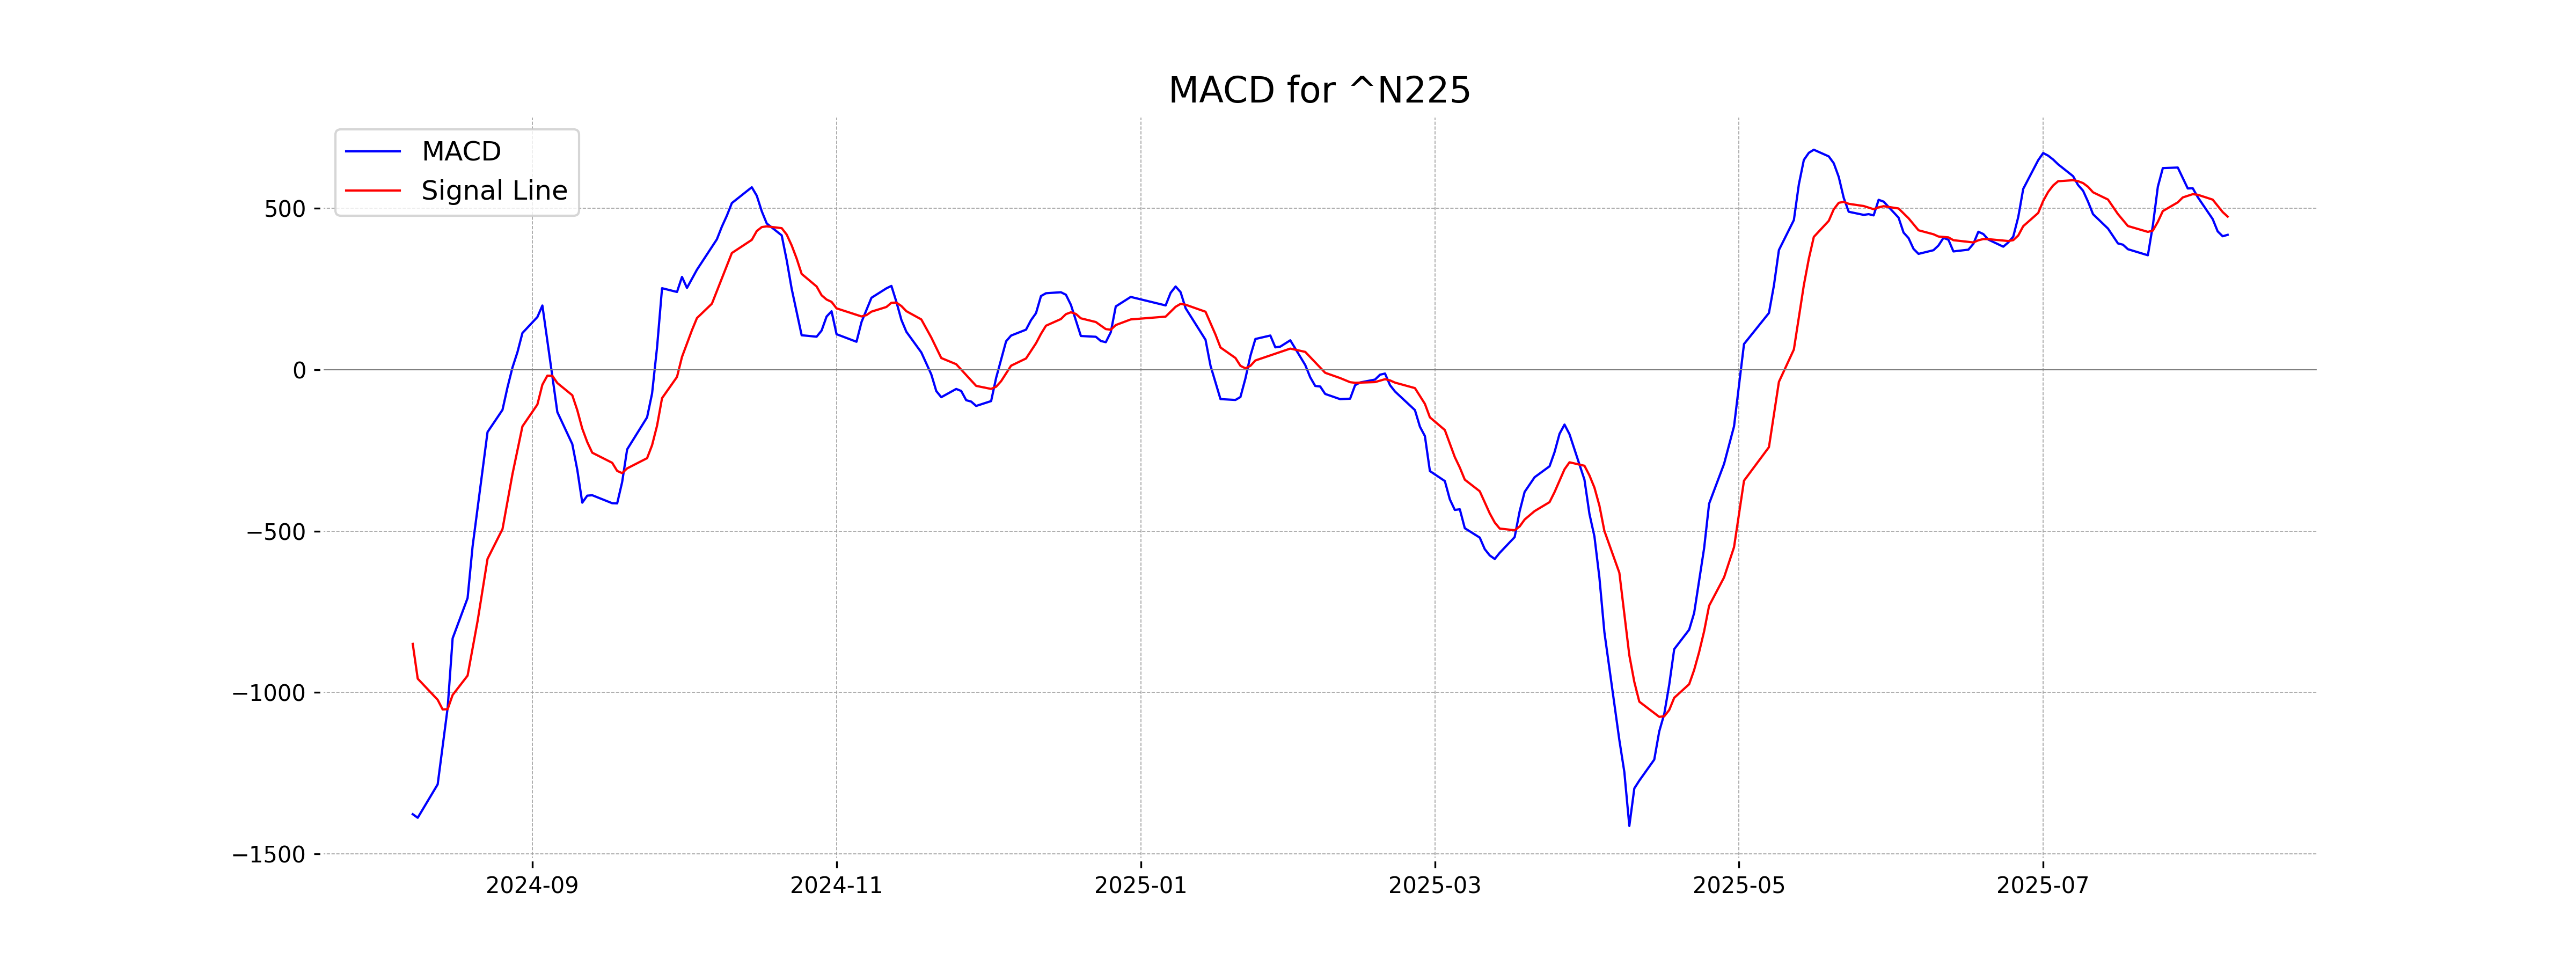
Moving Averages Trend (MACD)
The Nikkei 225 (Japan) shows a MACD of 418.20, which is lower than the MACD Signal of 474.69. This indicates a potential bearish trend, as the MACD line is below the signal line.
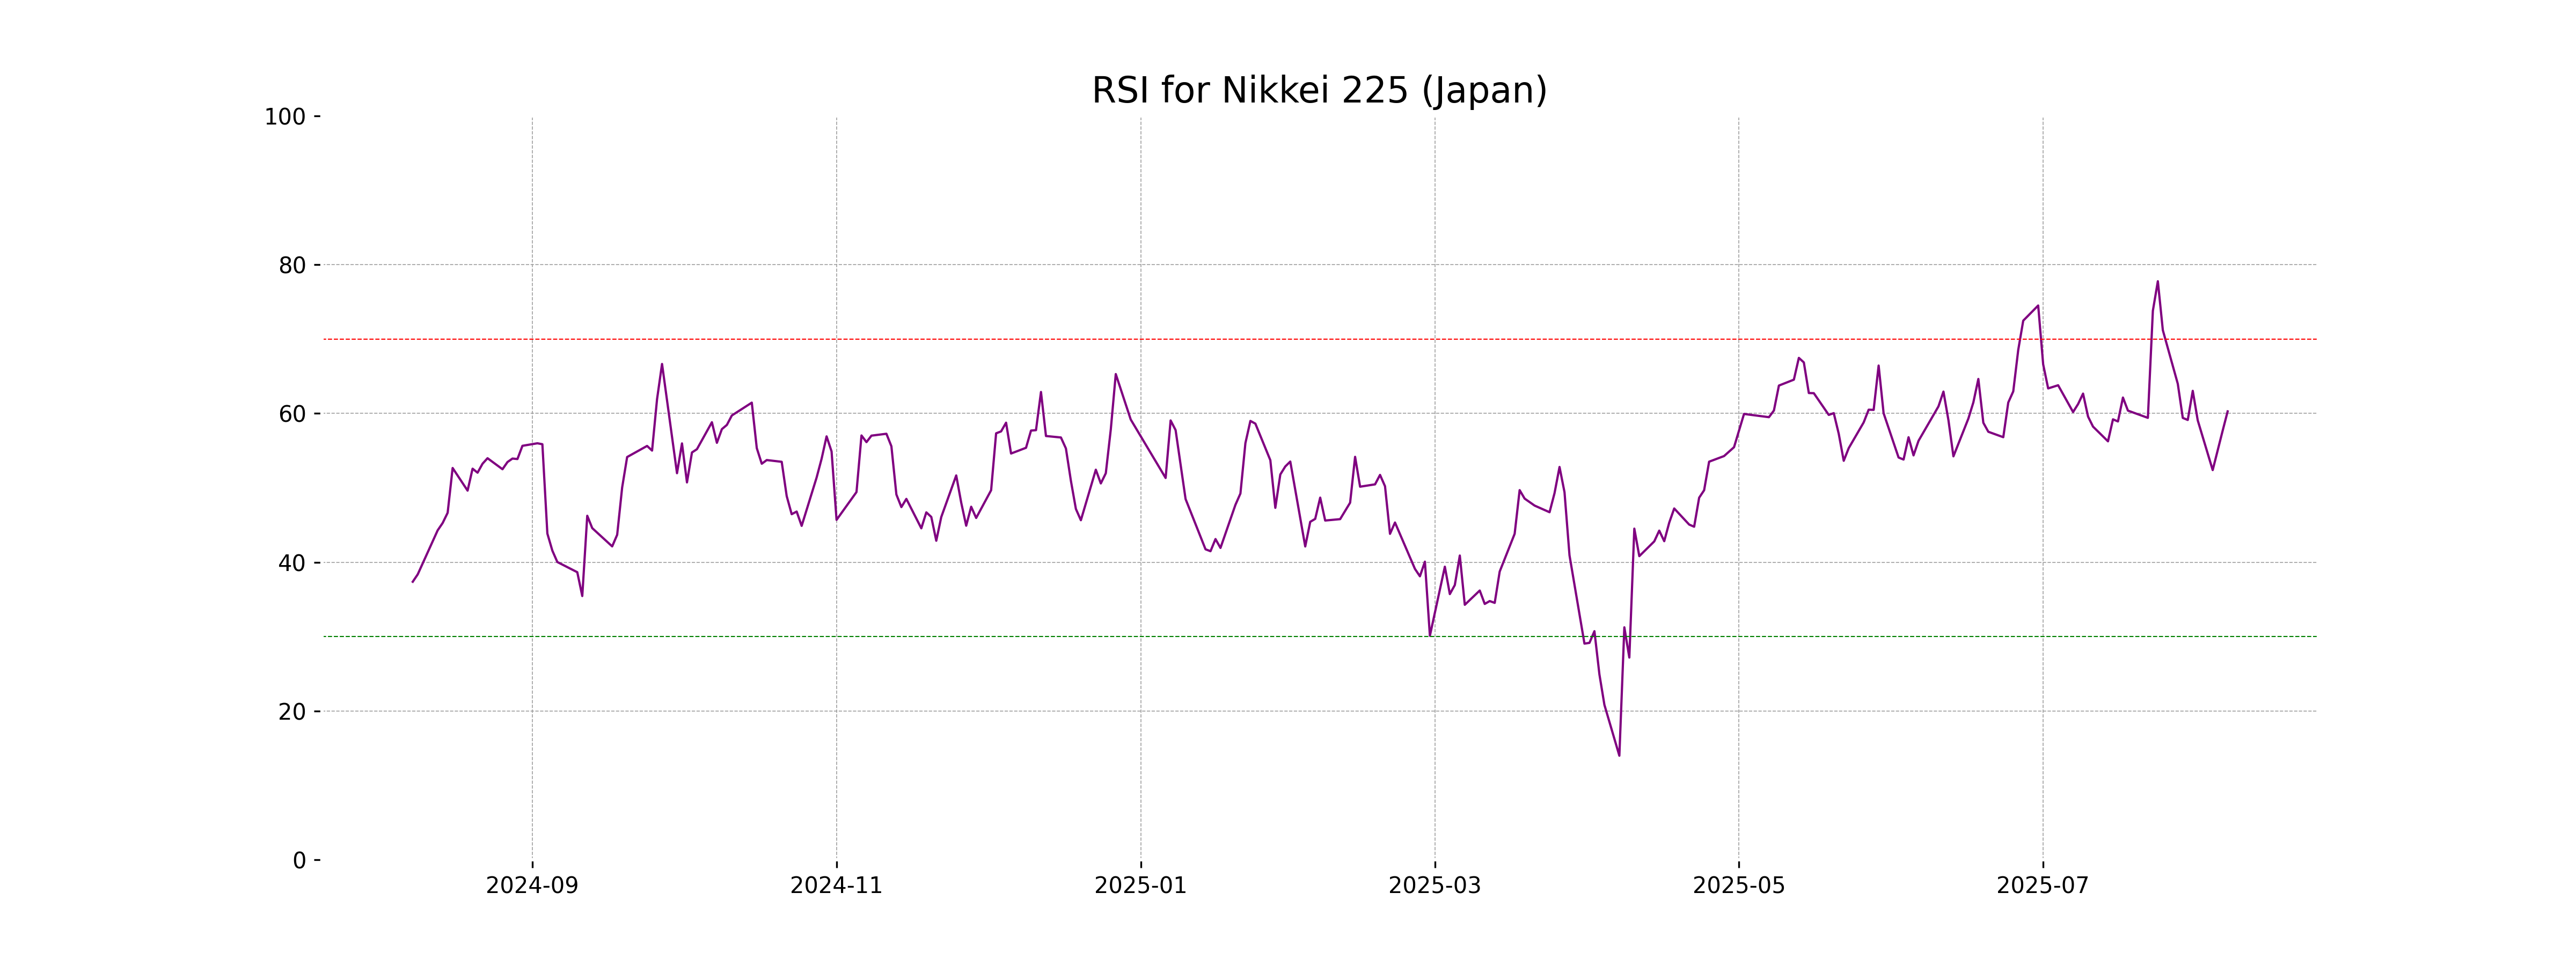
RSI Analysis
The RSI for Nikkei 225 is 60.28, indicating a relatively neutral momentum but slightly leaning towards overbought conditions. Generally, an RSI above 70 would indicate an overbought state, suggesting a potential pullback, whereas below 30 would indicate an oversold state, suggesting a potential upward reversal. Currently, the index is neither in a strong overbought nor oversold position.
Analysis for Nifty Bank - August 07, 2025
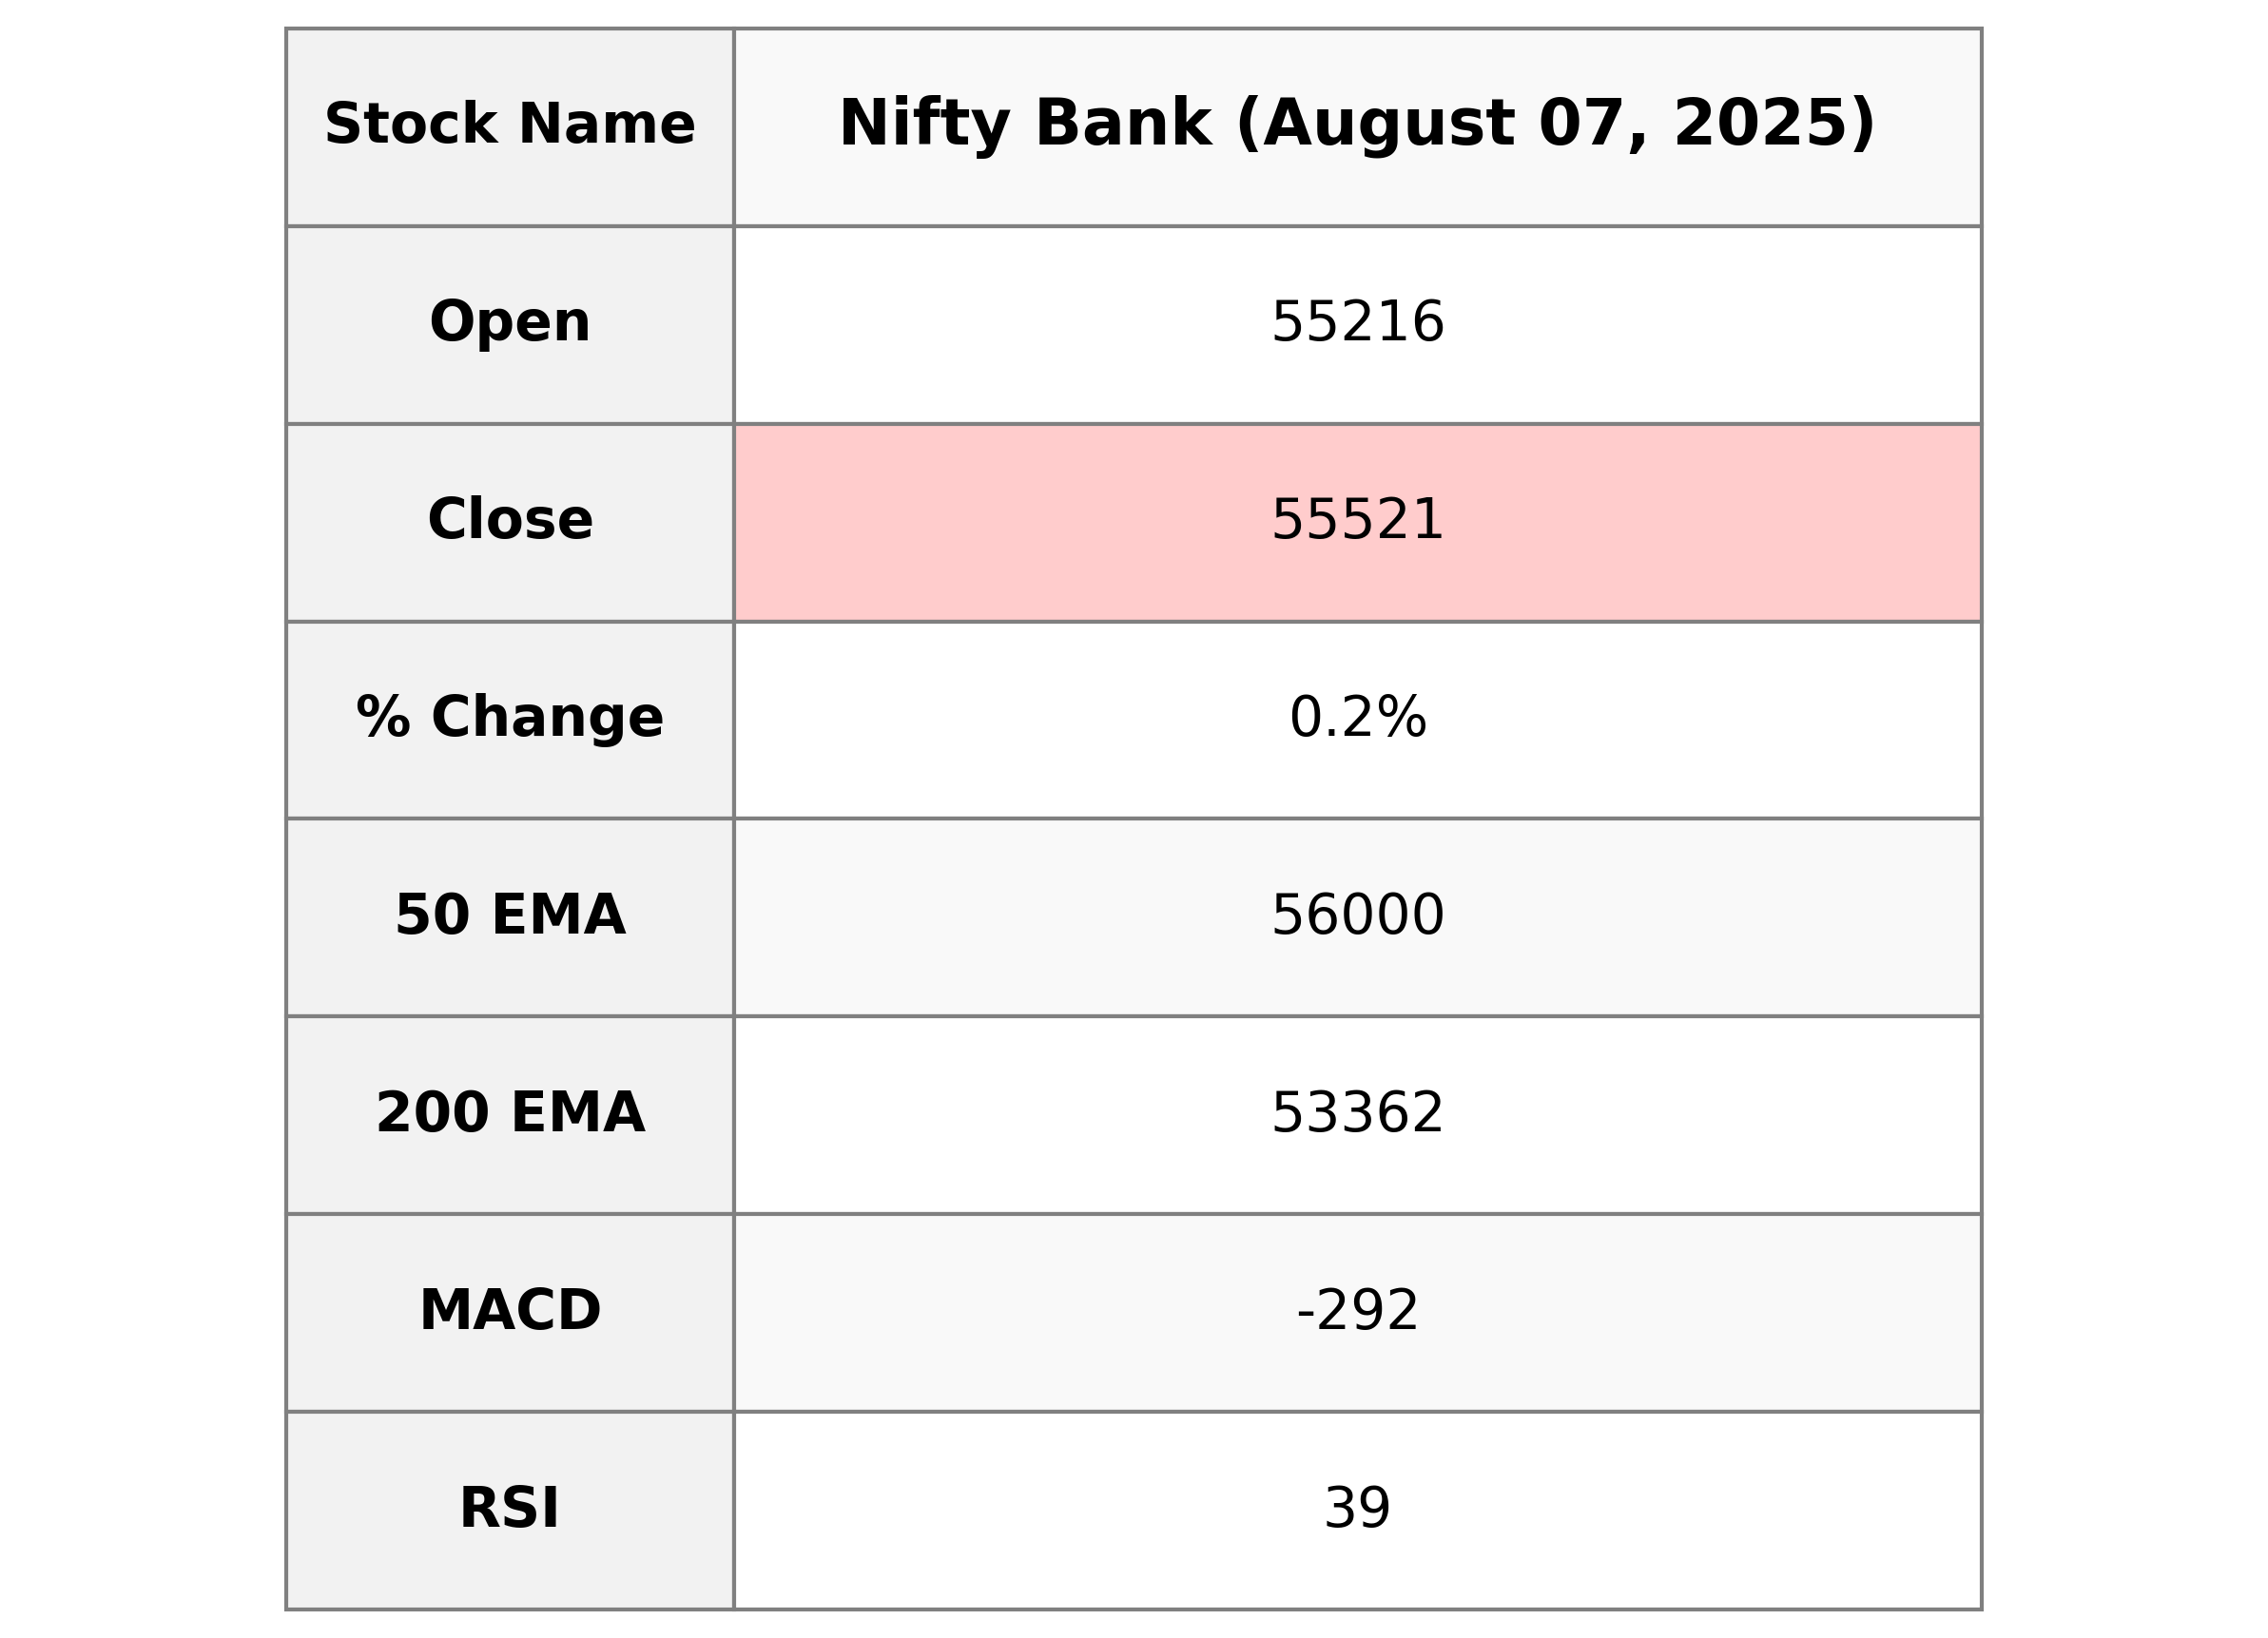
Nifty Bank opened at 55,215.65 and closed slightly higher at 55,521.15, marking a percentage change of 0.20% with a points increase of 110.00 from the previous close. The current RSI stands at 38.76, indicating a potential oversold market condition, while the MACD is negative at -292.30, suggesting bearish momentum.
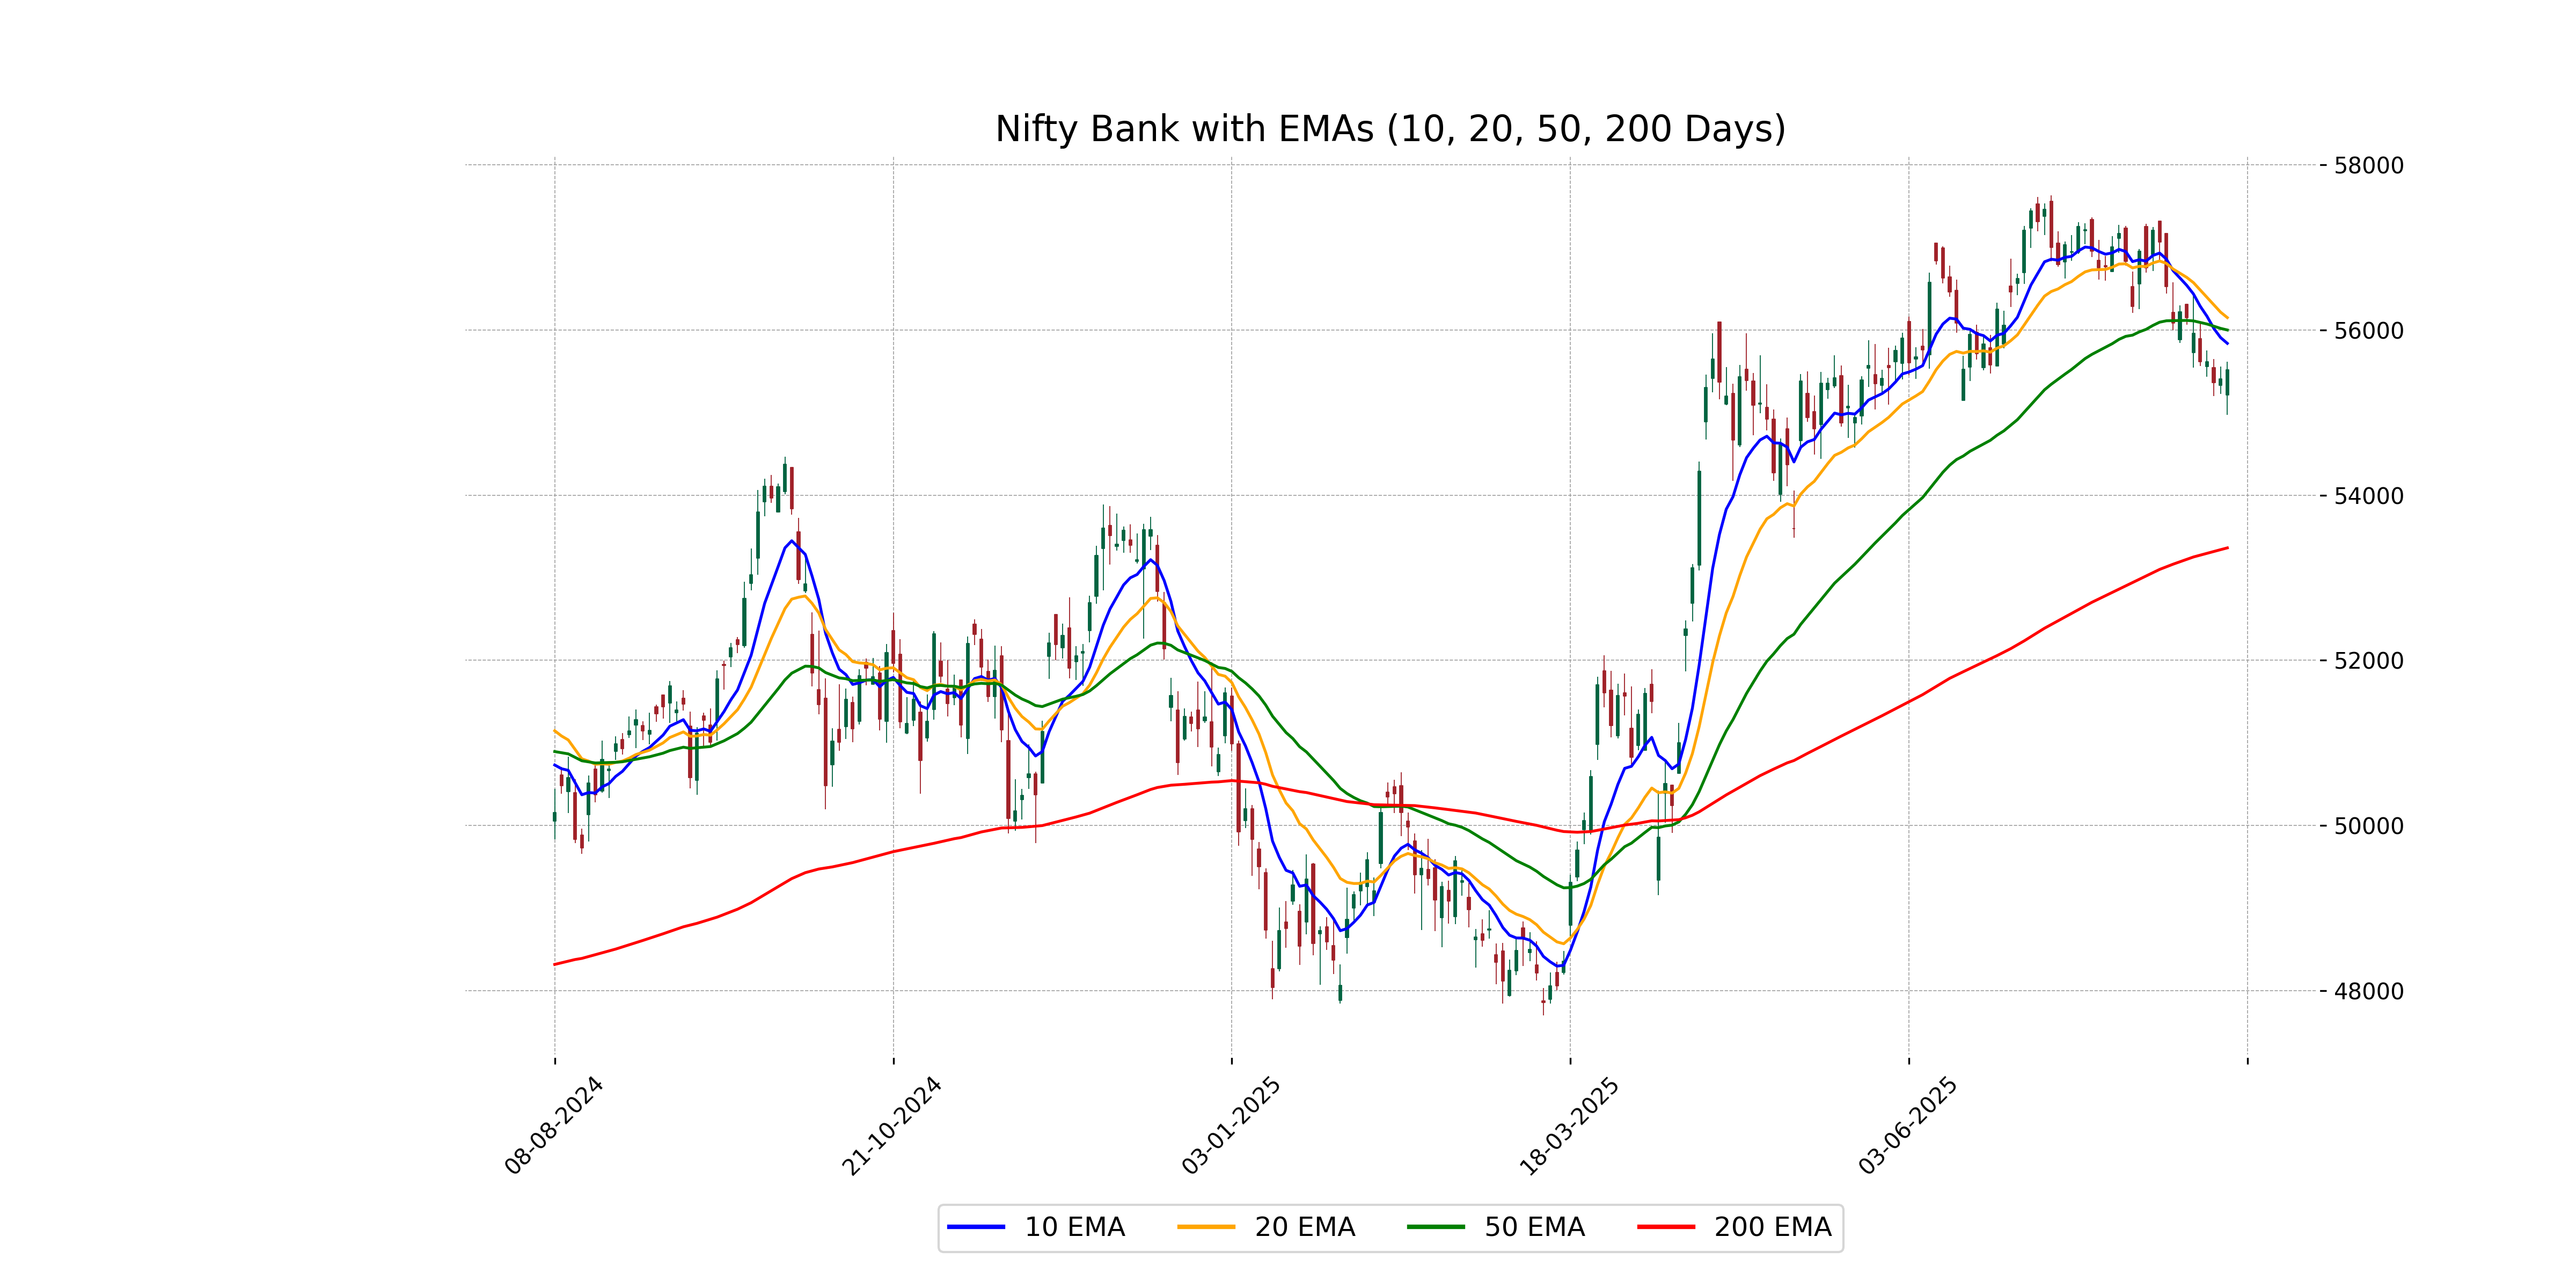
Relationship with Key Moving Averages
Nifty Bank closed at 55,521.15, which is below its 10-day EMA of 55,838.21, 20-day EMA of 56,150.11, and 50-day EMA of 56,000.26. This indicates a short-term bearish trend as the index is trading below these key moving averages.
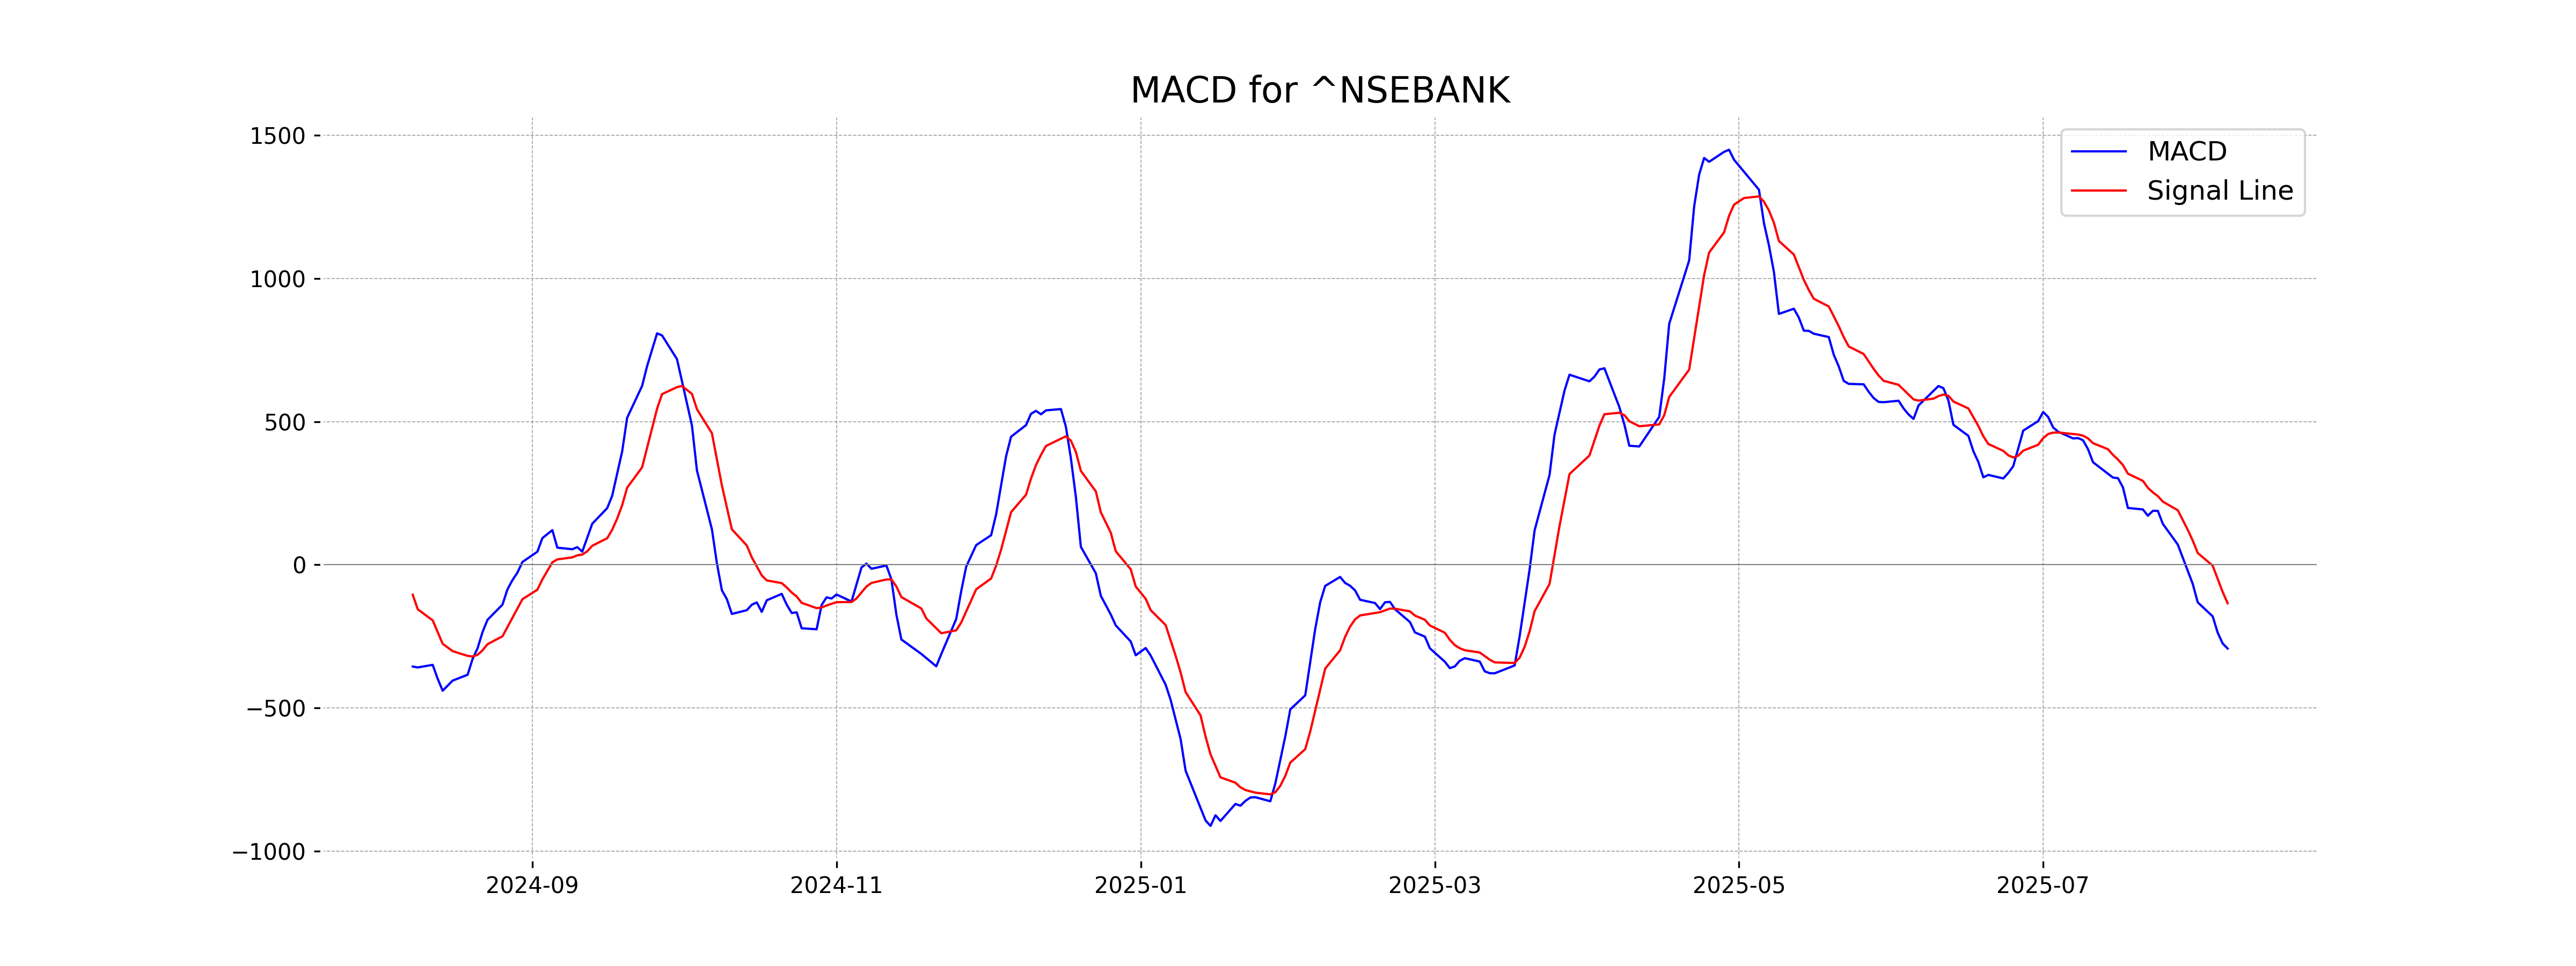
Moving Averages Trend (MACD)
MACD Analysis for Nifty Bank The current MACD value for Nifty Bank is -292.30, which is below the MACD Signal value of -134.20. This indicates bearish momentum, suggesting the possibility of a continued downtrend. Investors may want to exercise caution or look for confirmation from other indicators before making trading decisions.
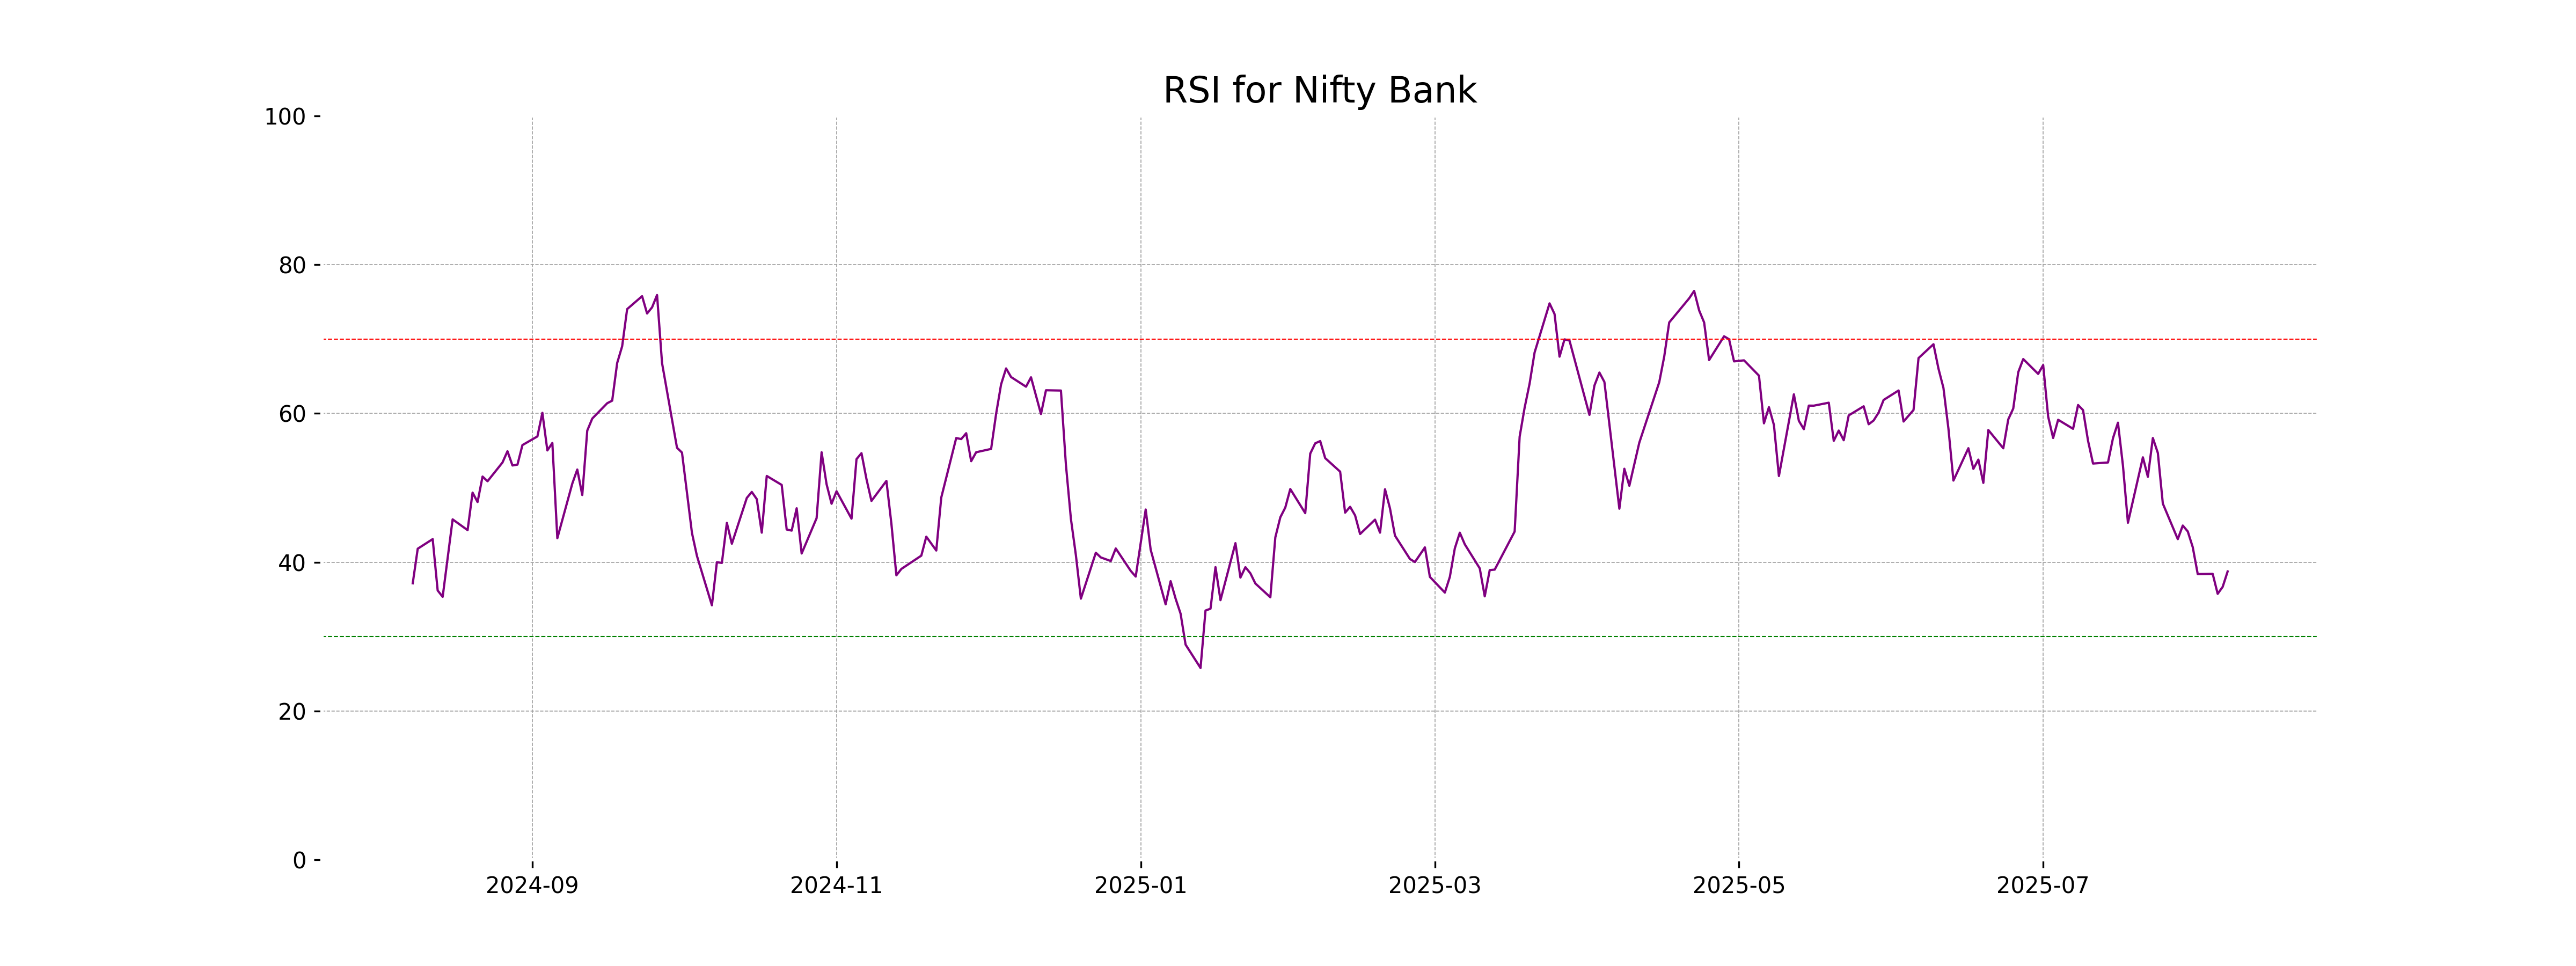
RSI Analysis
The Relative Strength Index (RSI) for Nifty Bank is 38.76, indicating that it is close to being oversold, with a typical oversold threshold being below 30. This suggests that the market sentiment may be bearish, but it could also be an opportunity for potential buying as prices may rebound if conditions improve.
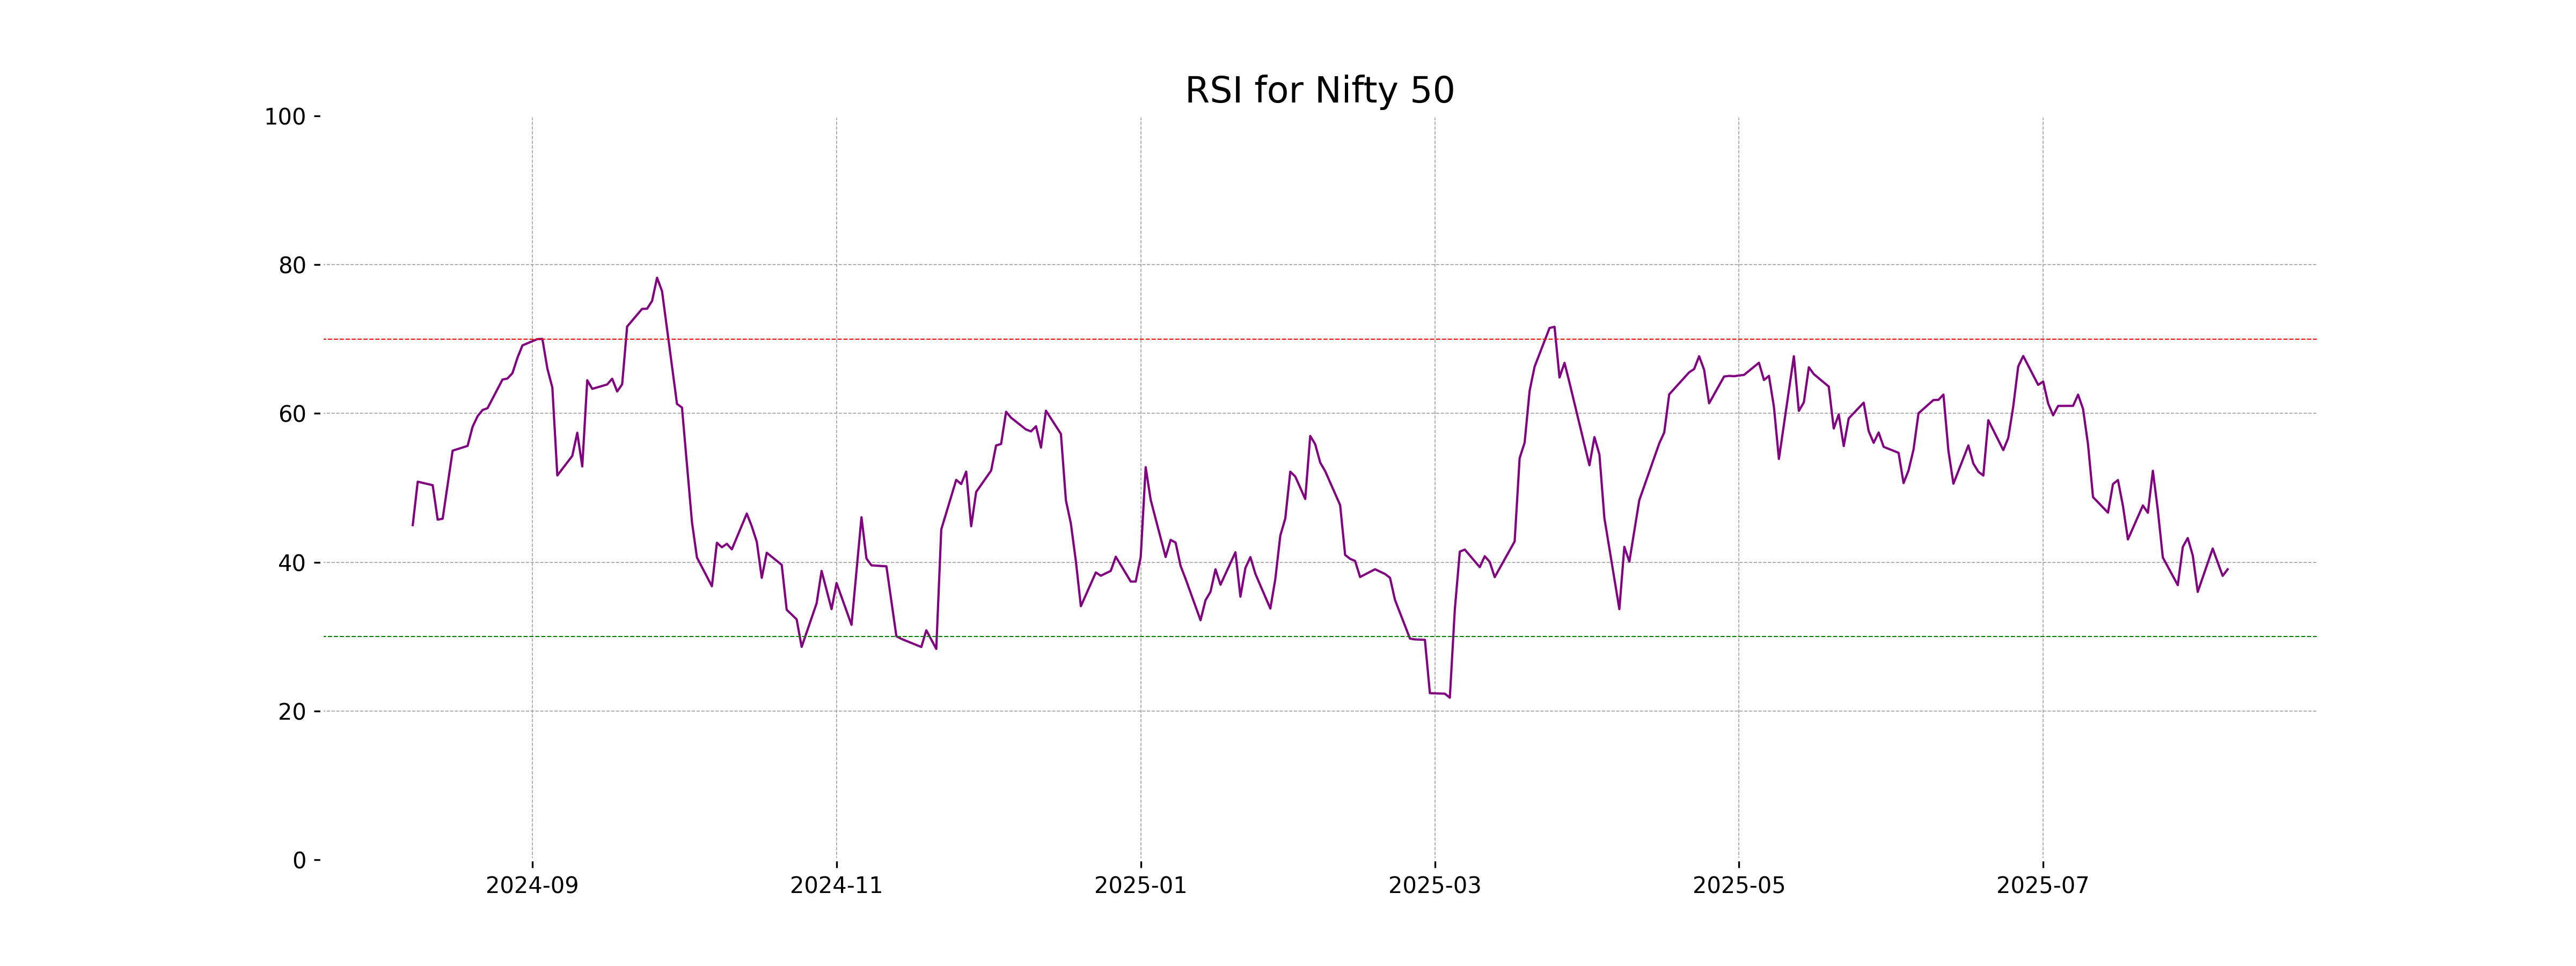
Analysis for Nifty 50 - August 07, 2025
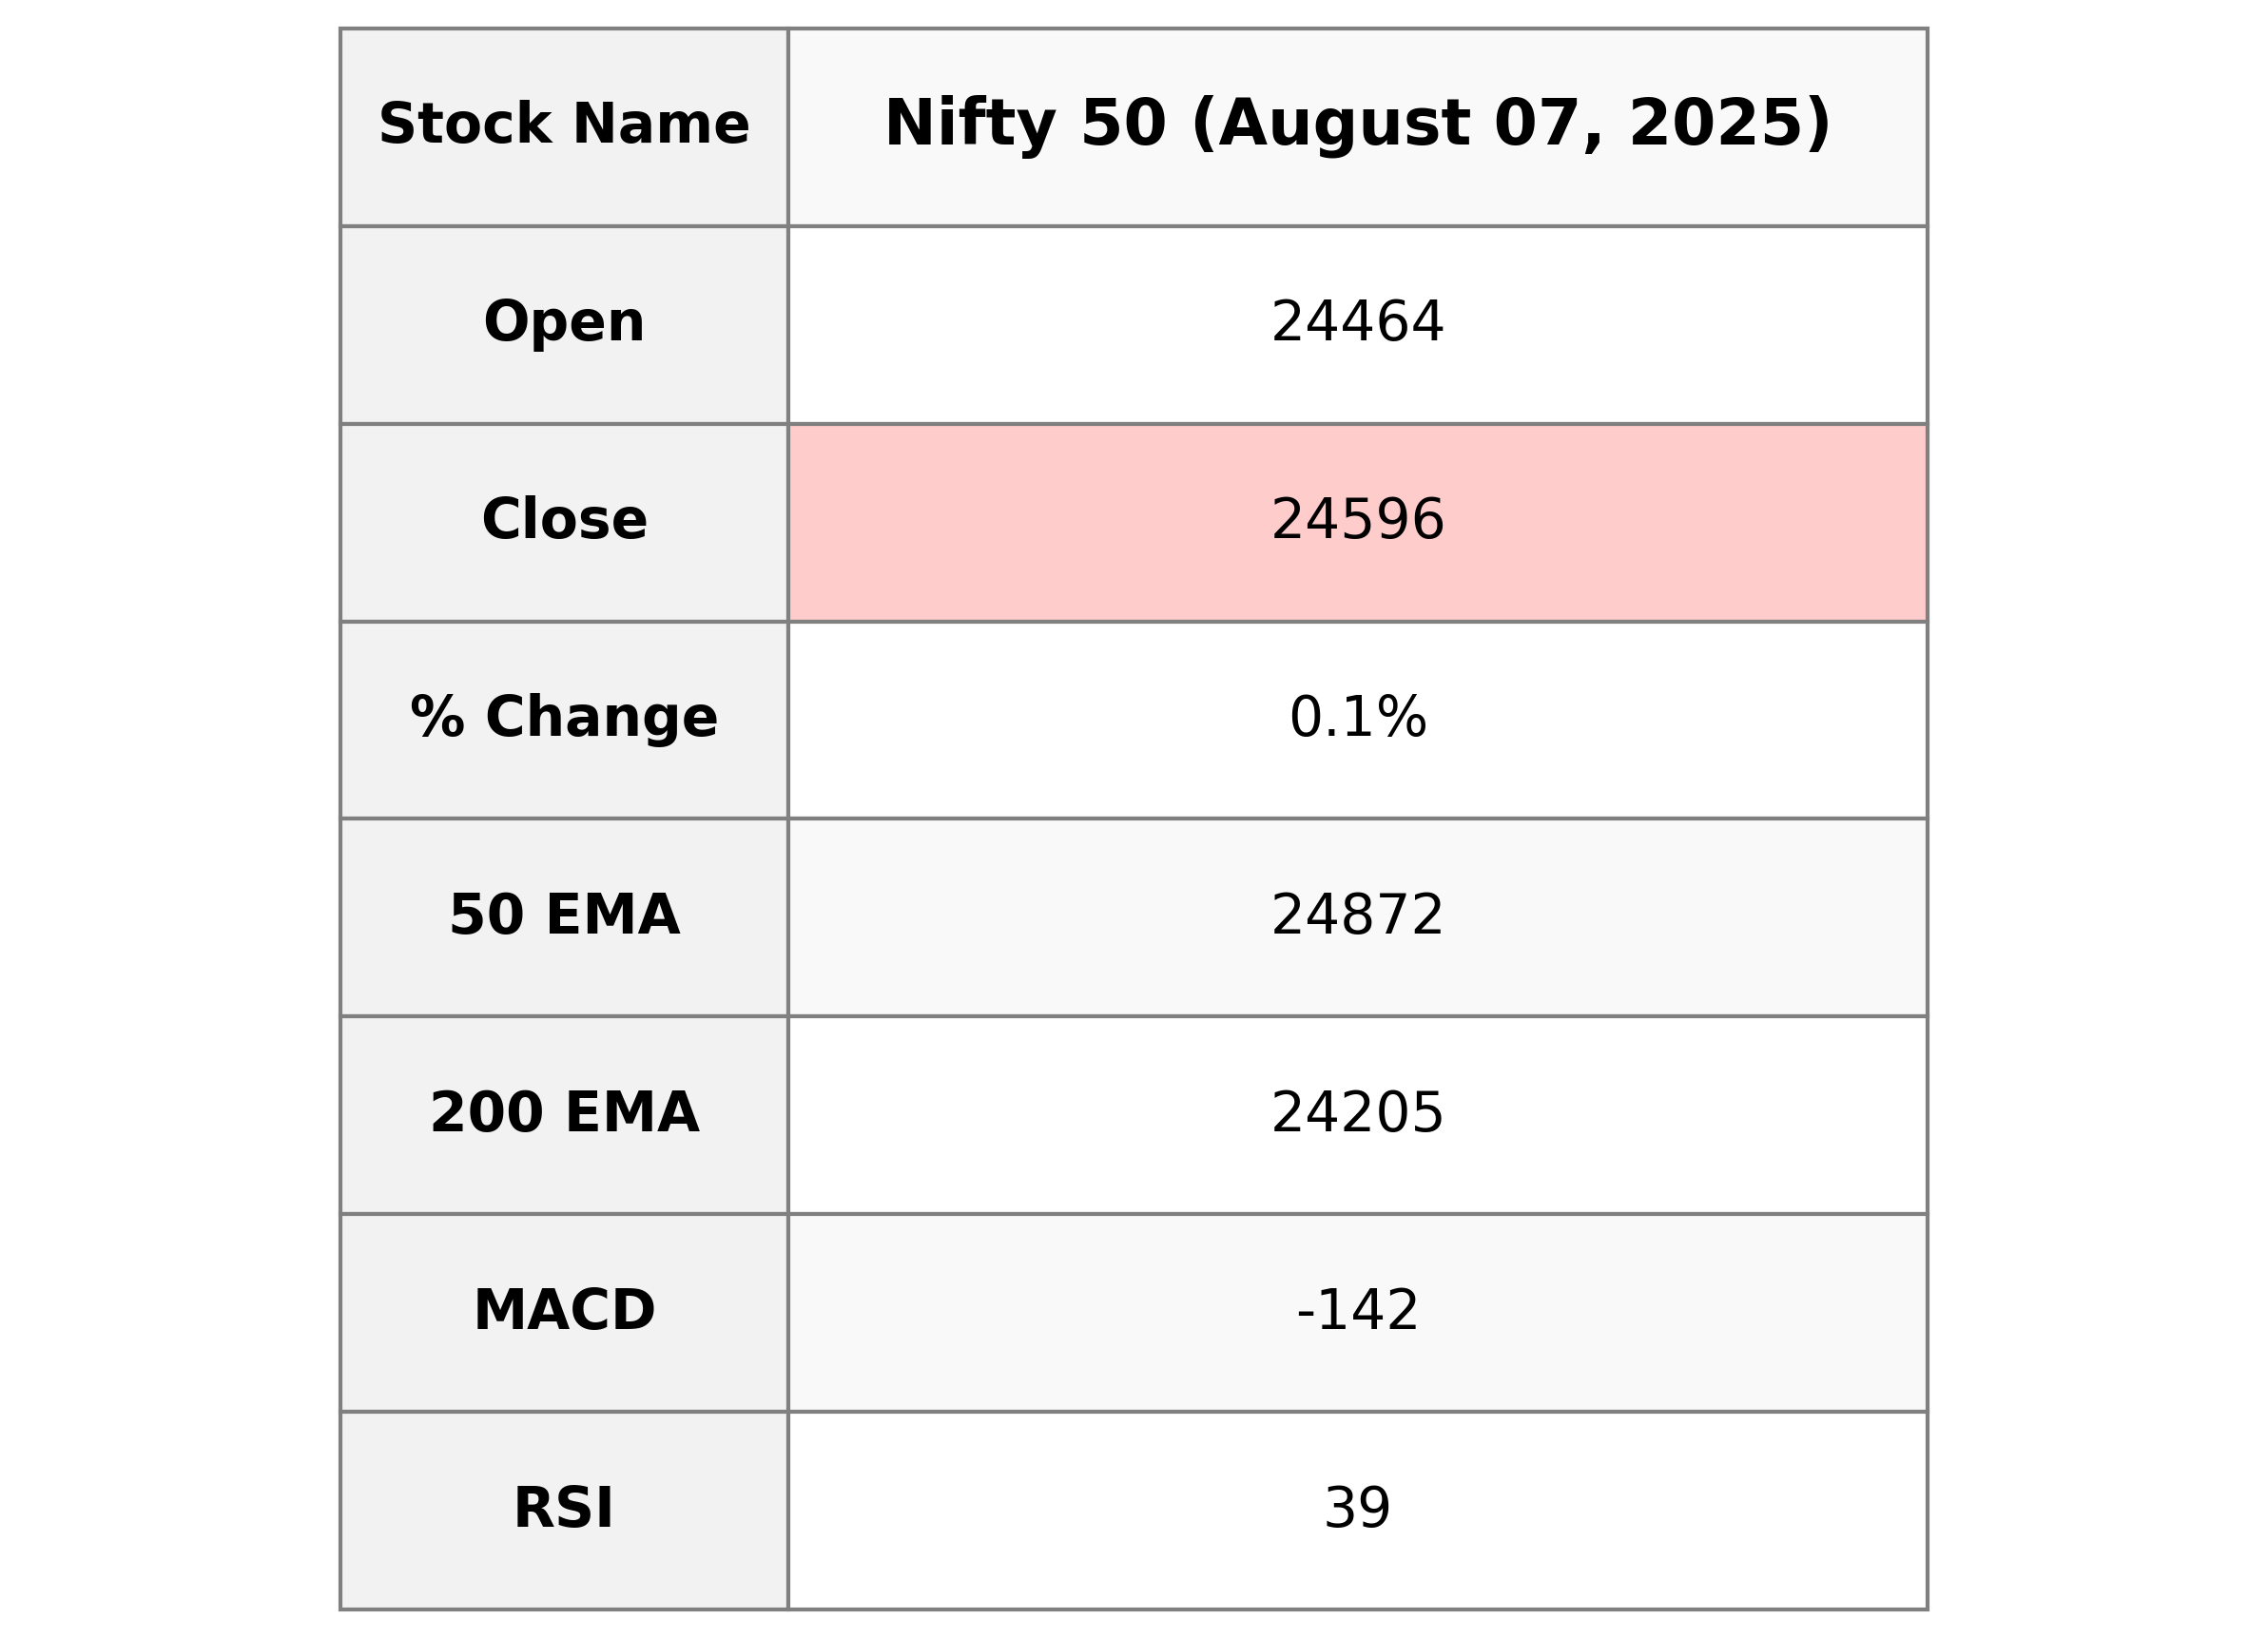
Nifty 50 started the session at 24,464.20 and closed slightly higher at 24,596.15, marking a modest increase of 0.09% with a points gain of 21.95. Despite closing above the previous day's close of 24,574.20, the index is below several Exponential Moving Averages (EMAs) indicating potential bearish momentum, coupled with a low Relative Strength Index (RSI) of 39.05 and a negative MACD, suggesting a cautious market outlook.
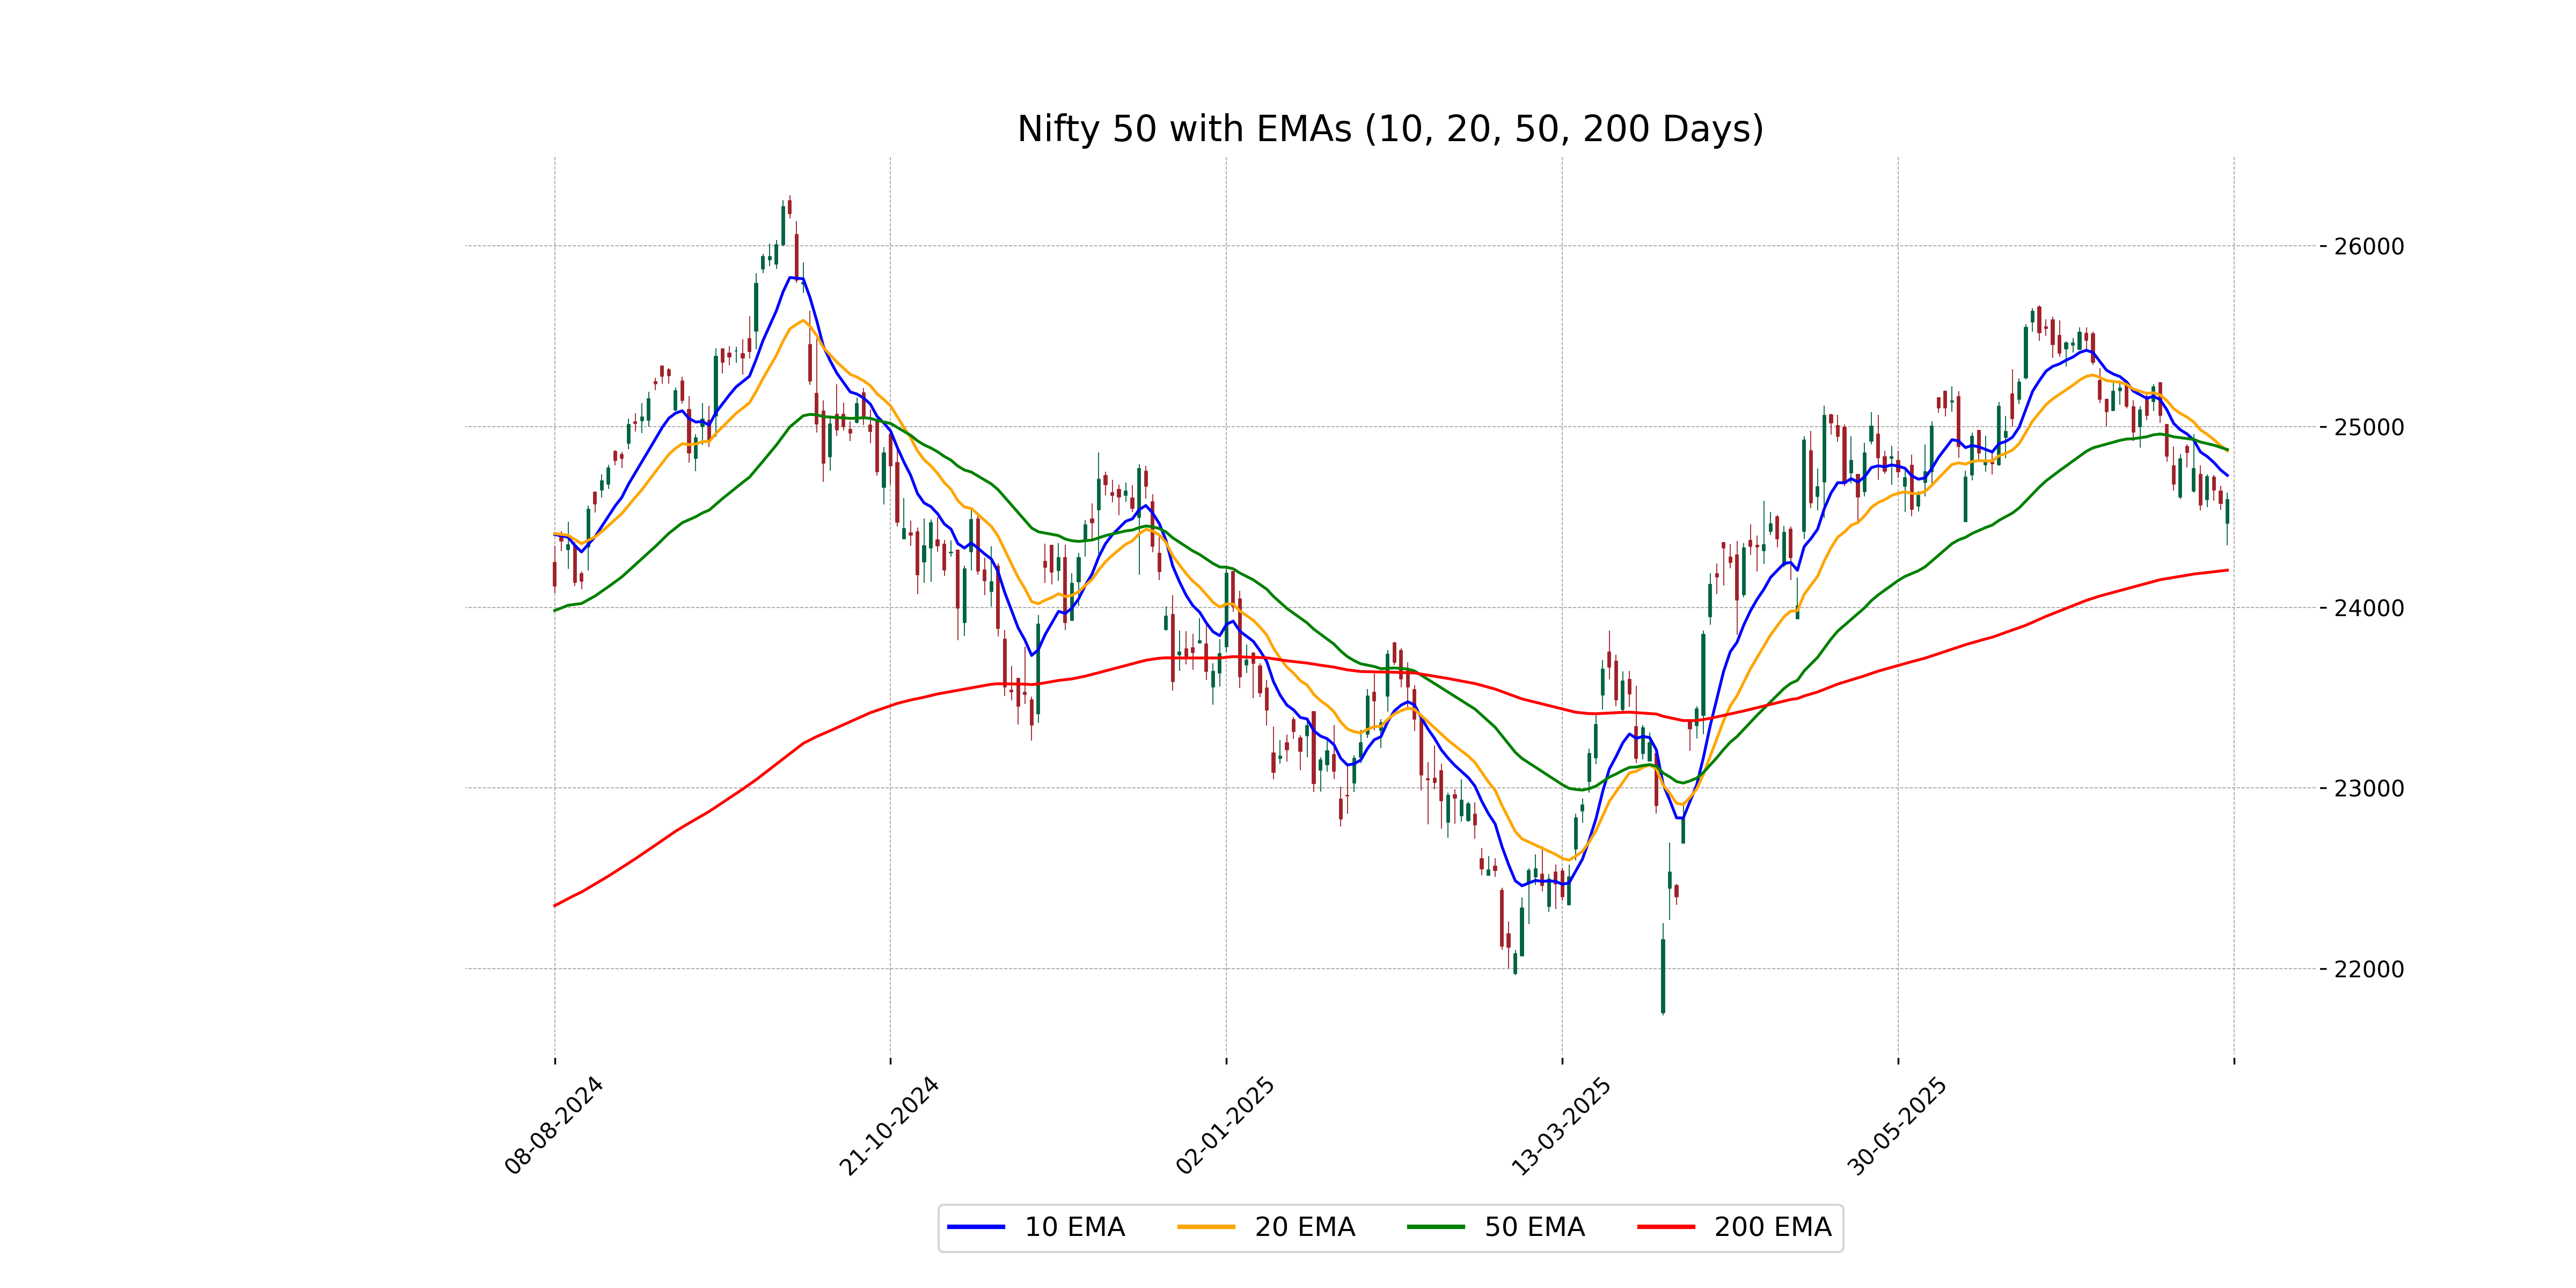
Relationship with Key Moving Averages
For Nifty 50, the current close is 24,596.15, which is below its 10 EMA (24,729.61) and 50 EMA (24,872.47), indicating a short-term downtrend. However, it remains above the 200 EMA (24,205.09), suggesting a possible longer-term support.
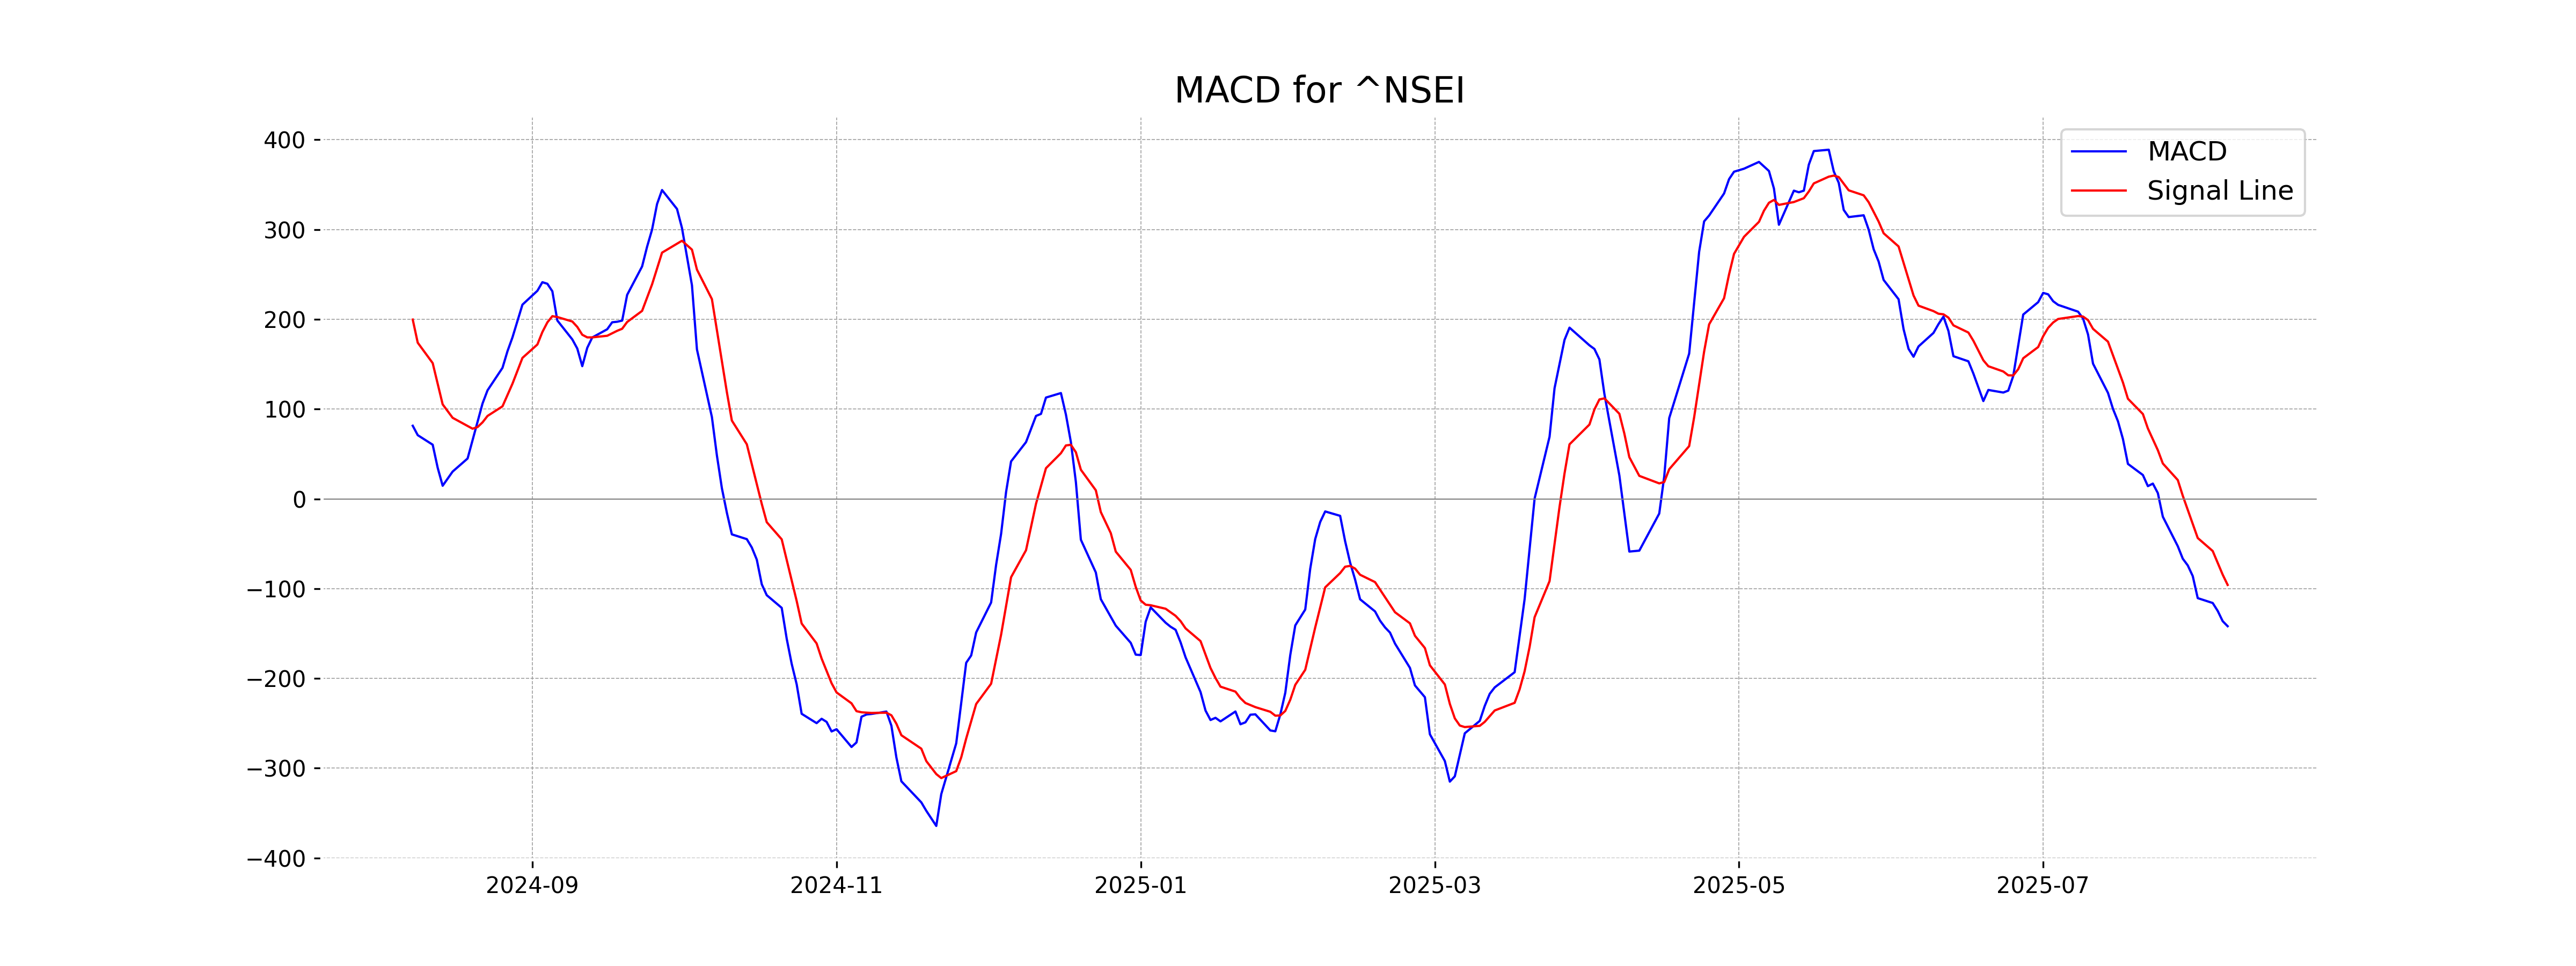
Moving Averages Trend (MACD)
The MACD for Nifty 50 is -141.90, which is below its signal line of -95.90. This indicates a bearish signal as the MACD is in negative territory and declining further below the signal line, suggesting that downward momentum might be gaining traction.
RSI Analysis
The Relative Strength Index (RSI) for Nifty 50 is at 39.05, suggesting that the market is in the lower range of the neutral zone. This level of RSI indicates a potential for the market to be approaching oversold conditions, which could precede a buying opportunity if other indicators align.