Global stock market indices: How the world markets performed today - 28 April 2025
The international stock market indices showed varied performances on April 28, 2025, reflecting the economic sentiment across different regions.
In this article, we analyze the performance of key global indices including the S&P 500, Dow Jones Industrial Average, NASDAQ Composite, FTSE 100, DAX, CAC 40, IBEX 35, Nikkei 225, Hang Seng, Nifty 50, and BSE Sensex.

Analysis for Sensex - April 28, 2025

The BSESN opened at 79343.63 and closed at 80218.37, showing a positive change of 1.27% with a points increase of 1005.84. The index reached a high of 80321.88 and a low of 79341.35 during the trading session. The RSI is at 65.73, indicating a bullish momentum, supported by a MACD of 1110.43 which is above its signal line.
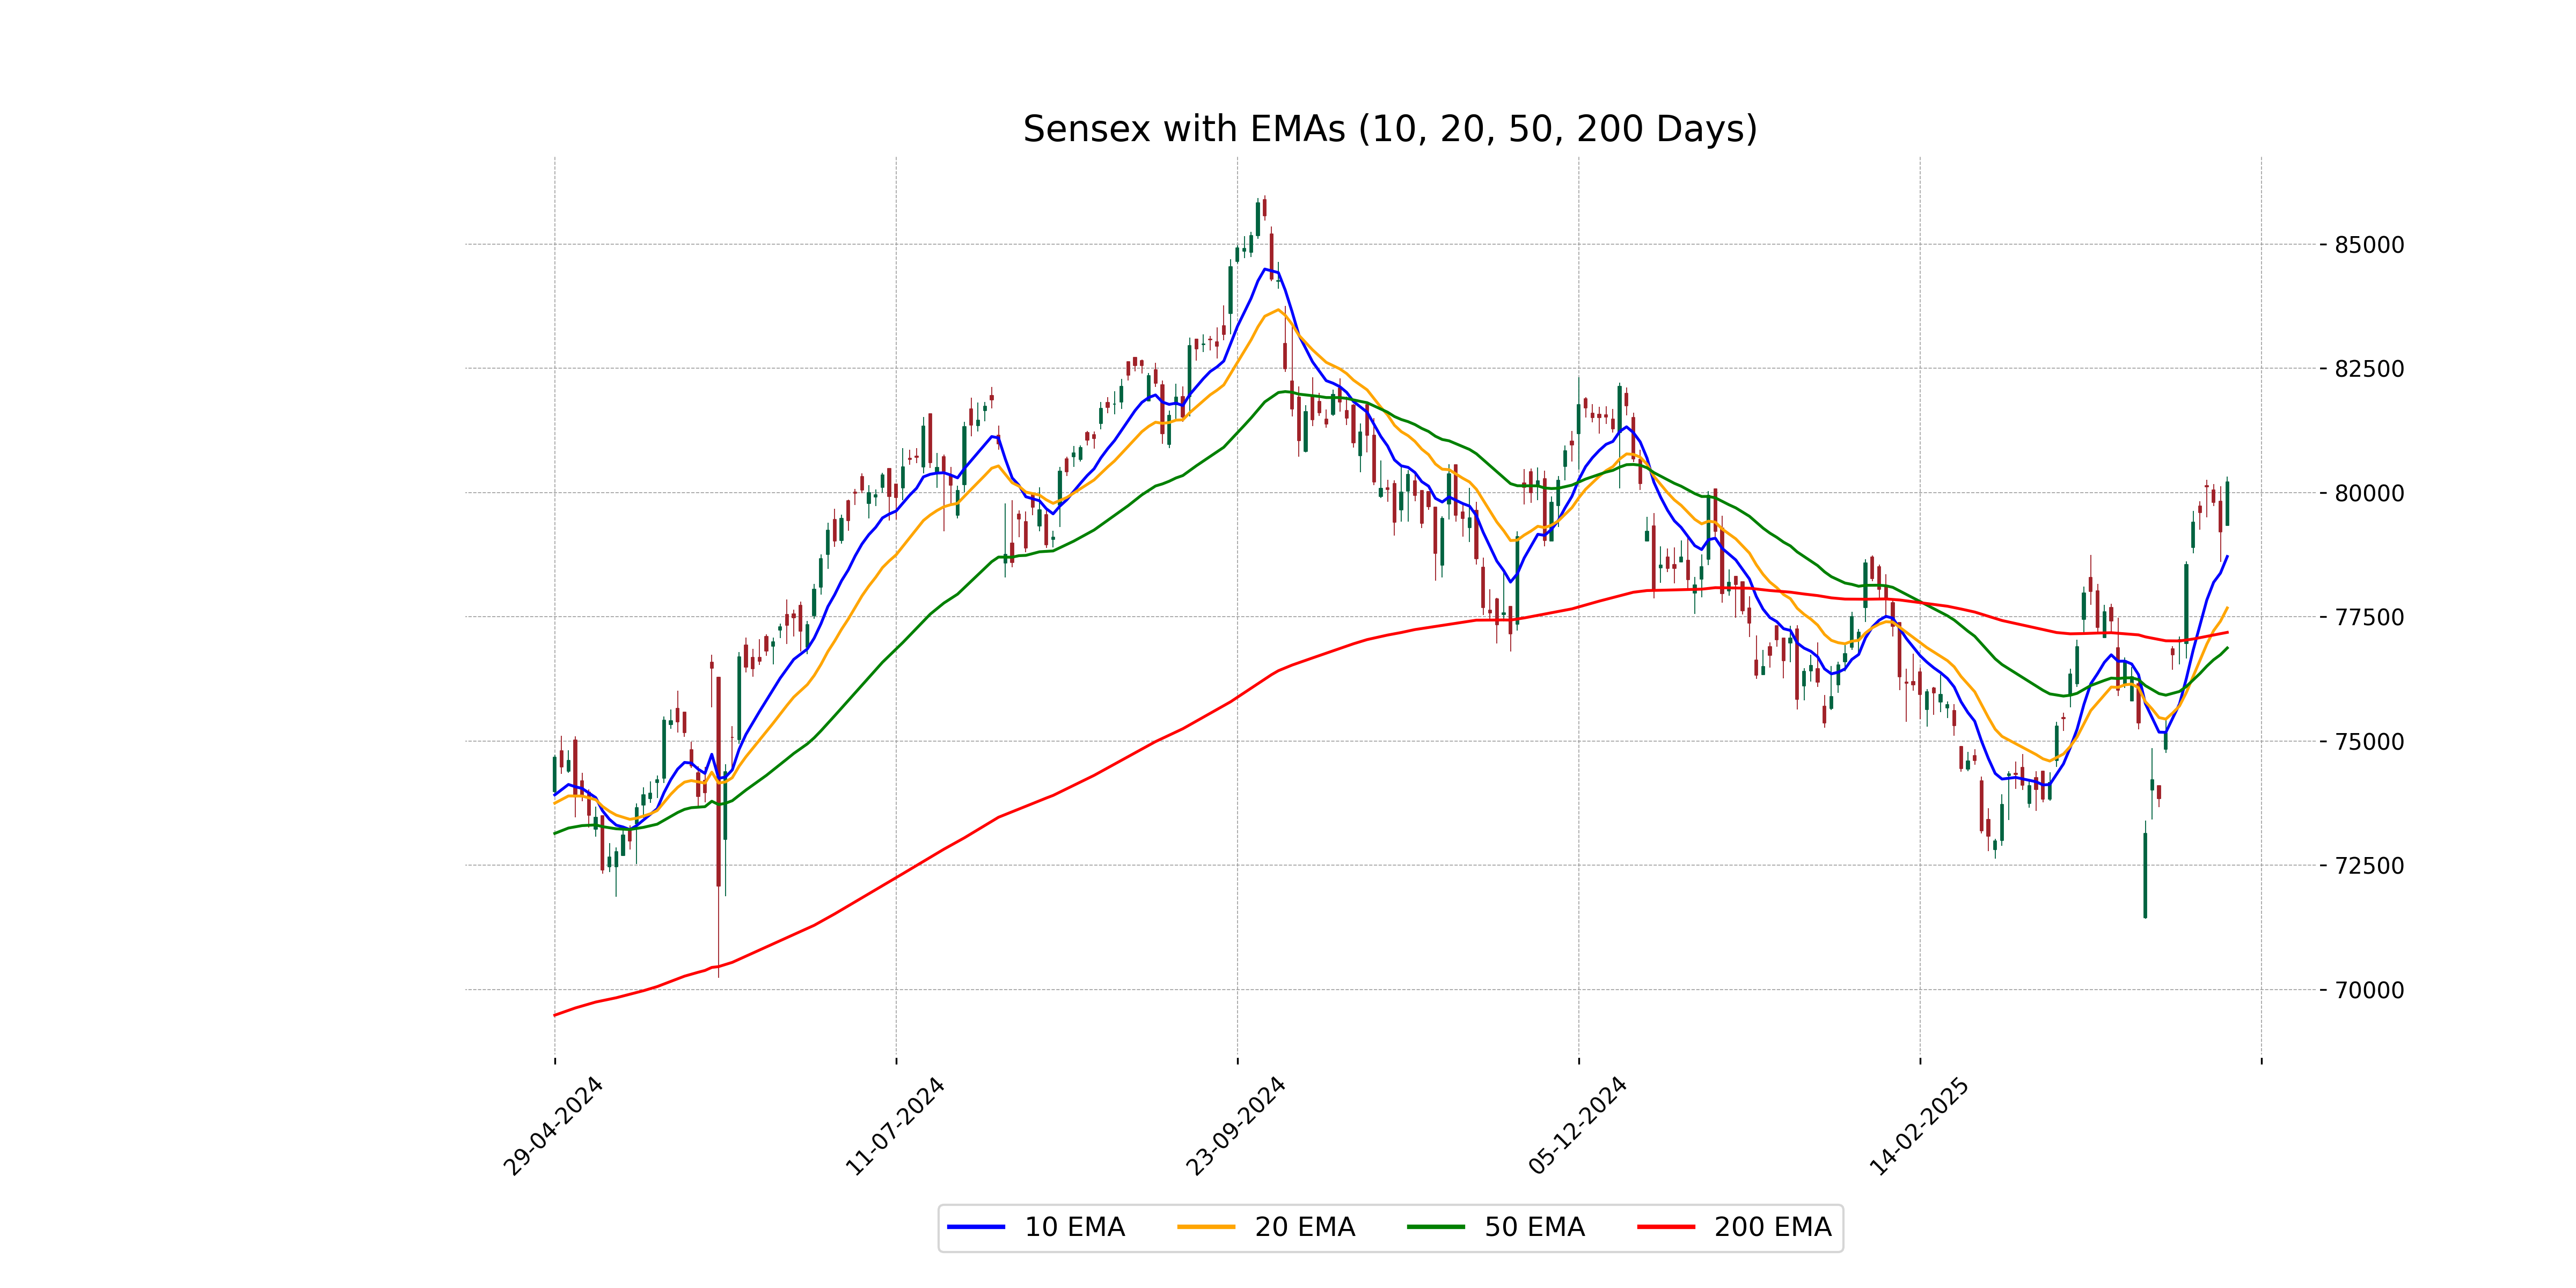
Relationship with Key Moving Averages
The Sensex closed at 80,218.37, which is above its 10-day EMA of 78,715.05, suggesting positive short-term momentum. It also closed significantly above the 50-day EMA of 76,875.04 and the 200-day EMA of 77,188.59, indicating a strong overall upward trend.
Moving Averages Trend (MACD)
The MACD for Sensex is at 1110.43, with a MACD Signal of 703.31. Since the MACD is above the signal line, it indicates a potential bullish trend. Additionally, the MACD's divergence from the signal line suggests strengthening momentum in the upward direction.

RSI Analysis
The relative strength index (RSI) of Sensex is 65.73, indicating a moderately strong momentum. Typically, an RSI above 70 is considered overbought, while below 30 is considered oversold. Therefore, Sensex is approaching overbought territory but is not yet there, suggesting positive momentum with caution for potential resistance ahead.

Analysis for Dow Jones Industrial Average (US) - April 28, 2025

The Dow Jones Industrial Average (US) opened at 40045.73, reached a high of 40137.31, and closed at 40113.5. The index experienced a marginal increase with a percentage change of 0.05%, equating to a points change of 20.10. The RSI indicates a neutral position at 48.04, and the MACD shows a bearish trend with a negative value, suggesting potential downward momentum.

Relationship with Key Moving Averages
The Dow Jones Industrial Average (US) closed above its 10-day EMA but slightly below the 20-day EMA, indicating short-term strength with a close alignment to its 20-day EMA. However, it remains beneath both the 50-day and 200-day EMAs, suggesting an overall bearish trend in a longer-term perspective.
Moving Averages Trend (MACD)
The MACD for the Dow Jones Industrial Average shows a value of -594.55, which indicates a bearish momentum since it is below the zero line. Additionally, the MACD is above the signal line of -723.79, suggesting some potential weakening in the downward momentum.

RSI Analysis
The RSI value for Dow Jones Industrial Average is 48.04, indicating a neutral position. An RSI between 30 and 70 typically suggests that the stock is neither overbought nor oversold. Thus, the market sentiment is relatively balanced at present.

Analysis for CAC 40 (France) - April 28, 2025

CAC 40 (France) opened at 7564.26, reaching a high of 7605.97 and closing at 7596.24, with a positive change of 0.80% or 59.98 points from the previous close. The Relative Strength Index (RSI) stands at 52.30, indicating mild momentum, while the MACD suggests a bearish signal below its MACD signal line.

Relationship with Key Moving Averages
The CAC 40 opened at 7564.26 and closed at 7596.24, remaining below its 50-day EMA of 7649.12 and 200-day EMA of 7650.46, suggesting it is experiencing downward pressure in the short term. However, the close above the 10-day EMA of 7436.65 and 20-day EMA of 7482.60 indicates recent bullish momentum.
Moving Averages Trend (MACD)
The CAC 40's MACD is -96.29, indicating a bearish trend as the MACD is below the signal line, which is at -156.15. This suggests a potential decrease in momentum or continuation of a downward trend.

RSI Analysis
Based on the stock data for the CAC 40 index in France, the RSI is 52.30, indicating a neutral position. This suggests that the index is neither overbought nor oversold, and it may not currently be in a clearly defined trend direction.

Analysis for FTSE 100 (UK) - April 28, 2025

FTSE 100 (UK) opened at 8415.25, reaching a high of 8452.62 and closing at 8443.89, indicating a positive performance with a 0.34% increase from the previous close. The index demonstrated a positive momentum with a 28.59 points gain, although trading volumes were not disclosed. The RSI of 54.34 suggests a neutrally poised market, while MACD values reflect continuing bearish tendencies.

Relationship with Key Moving Averages
FTSE 100 is trading above its 50-day EMA (8415.38) and significantly above its 10-day EMA (8324.04) and 20-day EMA (8324.76), indicating a potential positive short-term trend. However, the presence of a negative MACD value (-34.25) suggests that bearish momentum might still be present despite the current price position relative to the moving averages.
Moving Averages Trend (MACD)
The MACD value of -34.25 for FTSE 100 indicates bearish momentum as it is below the MACD Signal value of -88.73. This suggests that the recent price trend has been downward, although the crossover where the MACD is above the Signal line may indicate potential for reversal.

RSI Analysis
The FTSE 100's RSI is 54.34, suggesting it is neither overbought nor oversold. This indicates a relatively balanced momentum, with potential for either continuation or reversal trends depending on market conditions.

Analysis for DAX (Germany) - April 28, 2025

DAX (Germany) opened at 22,339.89 and closed at 22,394.74, marking a gain of 0.68% with a points change of 152.29. The index experienced a high of 22,443.41 and a low of 22,289.18, with no volume reported. Technical indicators include a 50-EMA at 21,770.28, 200-EMA at 20,449.60, and an RSI of 57.93, suggesting a moderately bullish outlook.

Relationship with Key Moving Averages
The DAX (Germany) closed above its 50 EMA (21,770.28) and 200 EMA (20,449.60), indicating a bullish trend as the price (22,394.74) is higher than these moving averages. Additionally, the DAX is trading above its 10 EMA (21,711.99) and 20 EMA (21,658.73), further supporting short-term bullish momentum.
Moving Averages Trend (MACD)
The MACD for DAX (Germany) is currently at -49.33, while the MACD Signal is -264.35, indicating that the MACD line is above the signal line, which could suggest a potential bullish trend reversal. However, the MACD being negative overall may indicate that the market is still in a bearish phase.

RSI Analysis
The RSI for DAX (Germany) is 57.93, indicating a neutral momentum as it is between the typical overbought and oversold levels of 70 and 30, respectively. This suggests that the market is currently neither overbought nor oversold, and there is no strong trend in either direction.

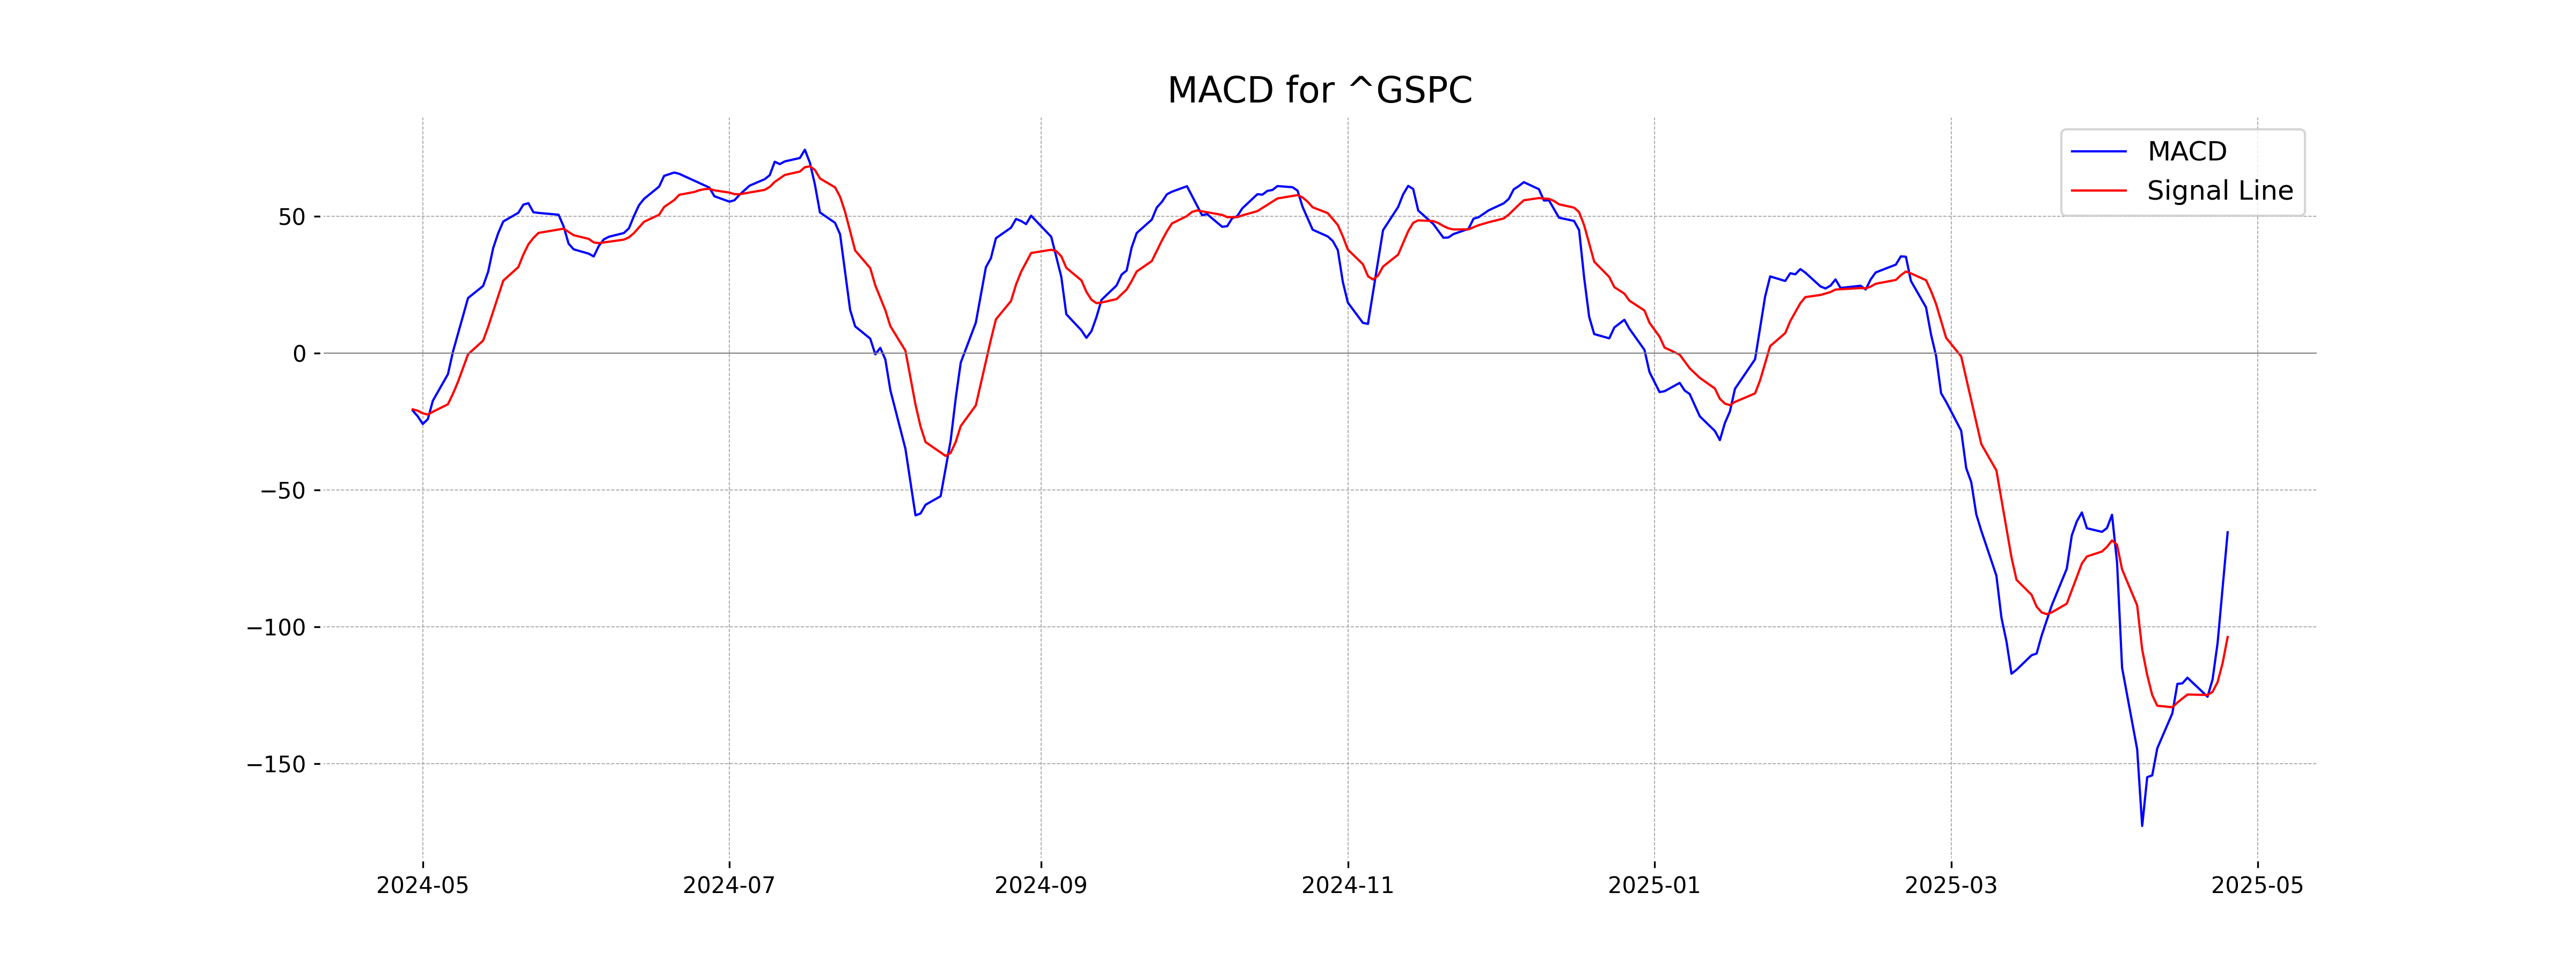
Analysis for S&P 500 (US) - April 28, 2025

The S&P 500 (US) index opened at 5489.73, reaching a high of 5528.11 and a low of 5455.86, closing at 5525.21. This represents a positive change of 0.74% or an increase of 40.44 points from the previous close of 5484.77. The RSI is at 53.03, indicating a neutral market condition, while the MACD value of -65.46 suggests a bearish trend. The volume traded was 4.24 billion.

Relationship with Key Moving Averages
The S&P 500 closed at 5525.21, which is below its 50-day EMA of 5572.39 and its 200-day EMA of 5643.42, suggesting potential short- and long-term bearish trends. However, its 10-day and 20-day EMAs are lower, at 5379.54 and 5409.09, respectively, indicating a recent upward price movement.
Moving Averages Trend (MACD)
The MACD for S&P 500 is -65.46, which is above its signal line of -103.74, indicating a potential bullish trend reversal or weakening bearish momentum. Since the MACD is still negative, it suggests that the market is not yet in a strong positive trend, but there are signs of potential recovery.
RSI Analysis
The Relative Strength Index (RSI) for the S&P 500 is 53.03. This value suggests a neutral market condition, indicating neither overbought nor oversold levels. It can imply that the S&P 500 might remain stable in its current trend direction.

Analysis for Hang Seng Index (Hong Kong) - April 28, 2025

The Hang Seng Index (Hong Kong) opened and reached its high at 22072.35, with a low of 21817.85, closing slightly down at 21971.96. The index experienced a negligible percentage change of -0.04%, with a minor points decrease of -8.78. Key indicators suggest the index is slightly below its 50 EMA and above its 200 EMA, with an RSI of 48.93, indicating a neutral stance in momentum.

Relationship with Key Moving Averages
The Hang Seng Index closed below its 50-day EMA and well above its 200-day EMA, indicating potential near-term bearish sentiment while maintaining a longer-term upward trend. The index is also positioned above its 10-day EMA and close to the 20-day EMA, suggesting slight short-term downward momentum.
Moving Averages Trend (MACD)
The Hang Seng Index's MACD of -294.52 suggests a downward momentum, although it is slightly above its MACD Signal of -407.35, indicating potential for bullish crossover if the current trend continues. The negative MACD values hint at waning momentum but monitor closely for any positive shifts.

RSI Analysis
The RSI of Hang Seng Index (Hong Kong) is 48.93, indicating that the market is currently in a neutral zone, with neither overbought nor oversold conditions. Traders might consider monitoring other indicators for potential market movements.

Analysis for IBEX 35 (Spain) - April 28, 2025

The IBEX 35 (Spain) opened at 13,416.10, reaching a high of 13,471.80, and closed at 13,449.30, reflecting a gain of 0.70% with a points change of 94. The 50, 20, and 10 exponential moving averages are positioned at 12,860.30, 12,962.36, and 13,063.47 respectively, indicating an upward trend. The RSI stands at 61.32, suggesting moderate buying pressure. The MACD is 76.90, well above the signal line at -29.21, showing positive momentum. Volume traded was 32,193,579, but market cap, PE ratio, and EPS are not available.

Relationship with Key Moving Averages
The close price of IBEX 35 is 13449.30, which is above its 50-day EMA of 12860.30 and 200-day EMA of 12088.40, indicating a bullish trend. It is also above the 10-day EMA of 13063.47 and the 20-day EMA of 12962.36, suggesting short-term bullish momentum as well.
Moving Averages Trend (MACD)
The MACD value of 76.90 for IBEX 35 is significantly higher than its MACD Signal value of -29.21, indicating bullish momentum. The positive MACD suggests upward price strength, typically seen as a buy signal by traders.

RSI Analysis
The RSI of IBEX 35 is 61.32, indicating a moderately strong momentum. Typically, an RSI above 50 suggests the index is gaining strength, while still being below the overbought threshold of 70. This could imply additional potential for upward movement, but caution for possible overbought conditions if the trend continues upward.

Analysis for NASDAQ Composite (US) - April 28, 2025

The NASDAQ Composite opened at 17,182.11 and closed at 17,382.94, indicating a positive percentage change of approximately 1.26% with a gain of 216.90 points. The volume was approximately 7.41 billion. The RSI suggests neutral momentum, while the MACD indicates a potential weakening trend as it is below the signal line. The index remains below both the 50-day and 200-day EMA, suggesting short to medium-term weakness in comparison to historical trends.

Relationship with Key Moving Averages
The NASDAQ Composite closed at 17,382.94, positioned below both the 50-day EMA of 17,515.90 and the 200-day EMA of 17,956.10. However, it is above the 10-day EMA of 16,736.81 and the 20-day EMA of 16,833.82, suggesting a short-term bullish movement amidst a longer-term bearish trend.
Moving Averages Trend (MACD)
The MACD for NASDAQ Composite (US) is -242.93, indicating a potential upward momentum as it is above the MACD Signal of -404.19. This crossover suggests that the recent trading activities might be moving toward a more positive outlook.

RSI Analysis
Relative Strength Index (RSI) Analysis for NASDAQ Composite (US): The RSI of 54.02 indicates that the NASDAQ Composite is in a neutral zone. It is neither overbought nor oversold, suggesting a balanced momentum and the potential for the market to move in either direction.

Analysis for Nikkei 225 (Japan) - April 28, 2025

Nikkei 225 (Japan) opened at 35,962.80 and closed at 35,839.99 with a slight increase of approximately 0.38% from the previous close of 35,705.74. Despite reaching a high of 36,075.26 during the session, the index faced some resistance, evidenced by its negative MACD value of -291.44, suggesting bearish momentum. The RSI is at 54.27, indicating a relatively neutral position.

Relationship with Key Moving Averages
Nikkei 225 closed at 35,839.99, which is below its 50 EMA of 36,006.89 and significantly below its 200 EMA of 37,435.20, suggesting a potential short-term downward trend. However, the close is above its 10 EMA of 34,909.68 and 20 EMA of 34,945.68, indicating some recent upward movement in the shorter-term.
Moving Averages Trend (MACD)
MACD Analysis for Nikkei 225 (Japan): The MACD value is -291.44, which is higher than the MACD Signal of -643.19. This indicates that the downward momentum may be slowing, suggesting a potential change in trend direction. However, the MACD is still negative, which implies caution.

RSI Analysis
Based on the stock data for Nikkei 225, the RSI is 54.27, indicating a neutral market condition. This level does not suggest any overbought or oversold conditions, as it is close to the midpoint of the typical RSI range.

Analysis for Nifty Bank - April 28, 2025

Nifty Bank opened at 54,610.30 and closed higher at 55,432.80, marking a 1.41% increase with a gain of 768.75 points. The RSI is 70.37, indicating potential overbought conditions, while the MACD is above its signal line, suggesting a bullish trend continuation. The trading volume was 0.0, and there's a strong upwards momentum as shown by the 10, 20, 50, and 200 EMA values being in an uptrend.

Relationship with Key Moving Averages
The Nifty Bank's current close at 55432.80 is above the 10 EMA, 20 EMA, 50 EMA, and 200 EMA, indicating a strong upward trend. The 10 EMA is at 54245.53, and it serves as the nearest support in this bullish momentum context. Additionally, the RSI at 70.37 suggests that the index is in an overbought territory.
Moving Averages Trend (MACD)
For Nifty Bank, the MACD value of 1441.57, which is above the MACD Signal line of 1160.46, indicates a bullish momentum. This suggests a potential upward trend continuation in the near term. Additionally, the RSI value of 70.37 is in the overbought territory, which may signal caution about possible overextended buying.

RSI Analysis
The Relative Strength Index (RSI) for Nifty Bank is 70.37, which indicates that the index is in overbought territory. This suggests that the stock may be experiencing upward momentum, and traders might consider this a signal for potential price correction or consolidation.

Analysis for Nifty 50 - April 28, 2025

The Nifty 50 index opened at 24070.25 and closed higher at 24328.5, marking a 1.20% increase with a gain of 289.15 points. The high during the day was 24355.10, with a low of 24054.05. Technical indicators show a strong momentum with the RSI at 64.95 and the MACD line above the signal line, suggesting a bullish trend.

Relationship with Key Moving Averages
The Nifty 50 closed at 24328.5, which is above the 10 EMA (23901.06), 20 EMA (23588.24), 50 EMA (23326.48), and 200 EMA (23420.63). This suggests a bullish trend as the current closing price is higher than all the key moving averages.
Moving Averages Trend (MACD)
The MACD for Nifty 50 is 340.24, with a MACD Signal of 223.63, indicating a bullish trend as the MACD Line is above the Signal Line. The positive MACD and the notable distance from the Signal Line suggest strong upward momentum.

RSI Analysis
The RSI value for Nifty 50 is 64.95, indicating that the index is approaching the overbought territory. An RSI above 70 generally suggests overbought conditions, while below 30 indicates oversold situations. With an RSI near 65, Nifty 50 shows bullish momentum but may soon face resistance if it continues to rise.
