


Highlights
- Axis Bank shows neutral-to-bullish trend near key EMAs
- Dr Reddy’s in oversold zone, bearish below EMAs
- HDFC Life weak with RSI near oversold levels
Latest news

Haier Launches HQLED P7 Pro Series TVs With Google Gemini, 50W Audio And AI Picture Enhancements

Nothing's Latest Pokémon Teasers Hint At New Hardware, RCB Collaboration May Also Be In The Works

OnePlus N6 Set To Debut With Massive 8,000mAh Battery And Long-Term Performance Focus

Roblox Introduces Age-Based Accounts for Younger Users, Expands Parental Controls Globally

IIFL Capital Launches Algo Marketplace with Over 100 Ready-Made Strategies

LUMIQ Raises INR 50 Crore Pre-Series B to Become the AI Decision Layer for Financial Services

Tay Keith, producer behind Travis Scott's 'Sicko Mode' dies at 29

GenAI could lift realty sales velocity by up to 50%, speed up launches by 30%: Report
NSE Nifty 50: Top 5 stock losers of September 29, 2025


In this article, we will explore the technical indicators of some of the low-performing stocks on the Indian stock market, including AXISBANK, DRREDDY, HDFCLIFE, LT, and MARUTI.
By looking at these stocks through the lens of key technical factors, we aim to better understand their price movements, trends, and potential future performance.

Analysis for Axis Bank - September 29, 2025
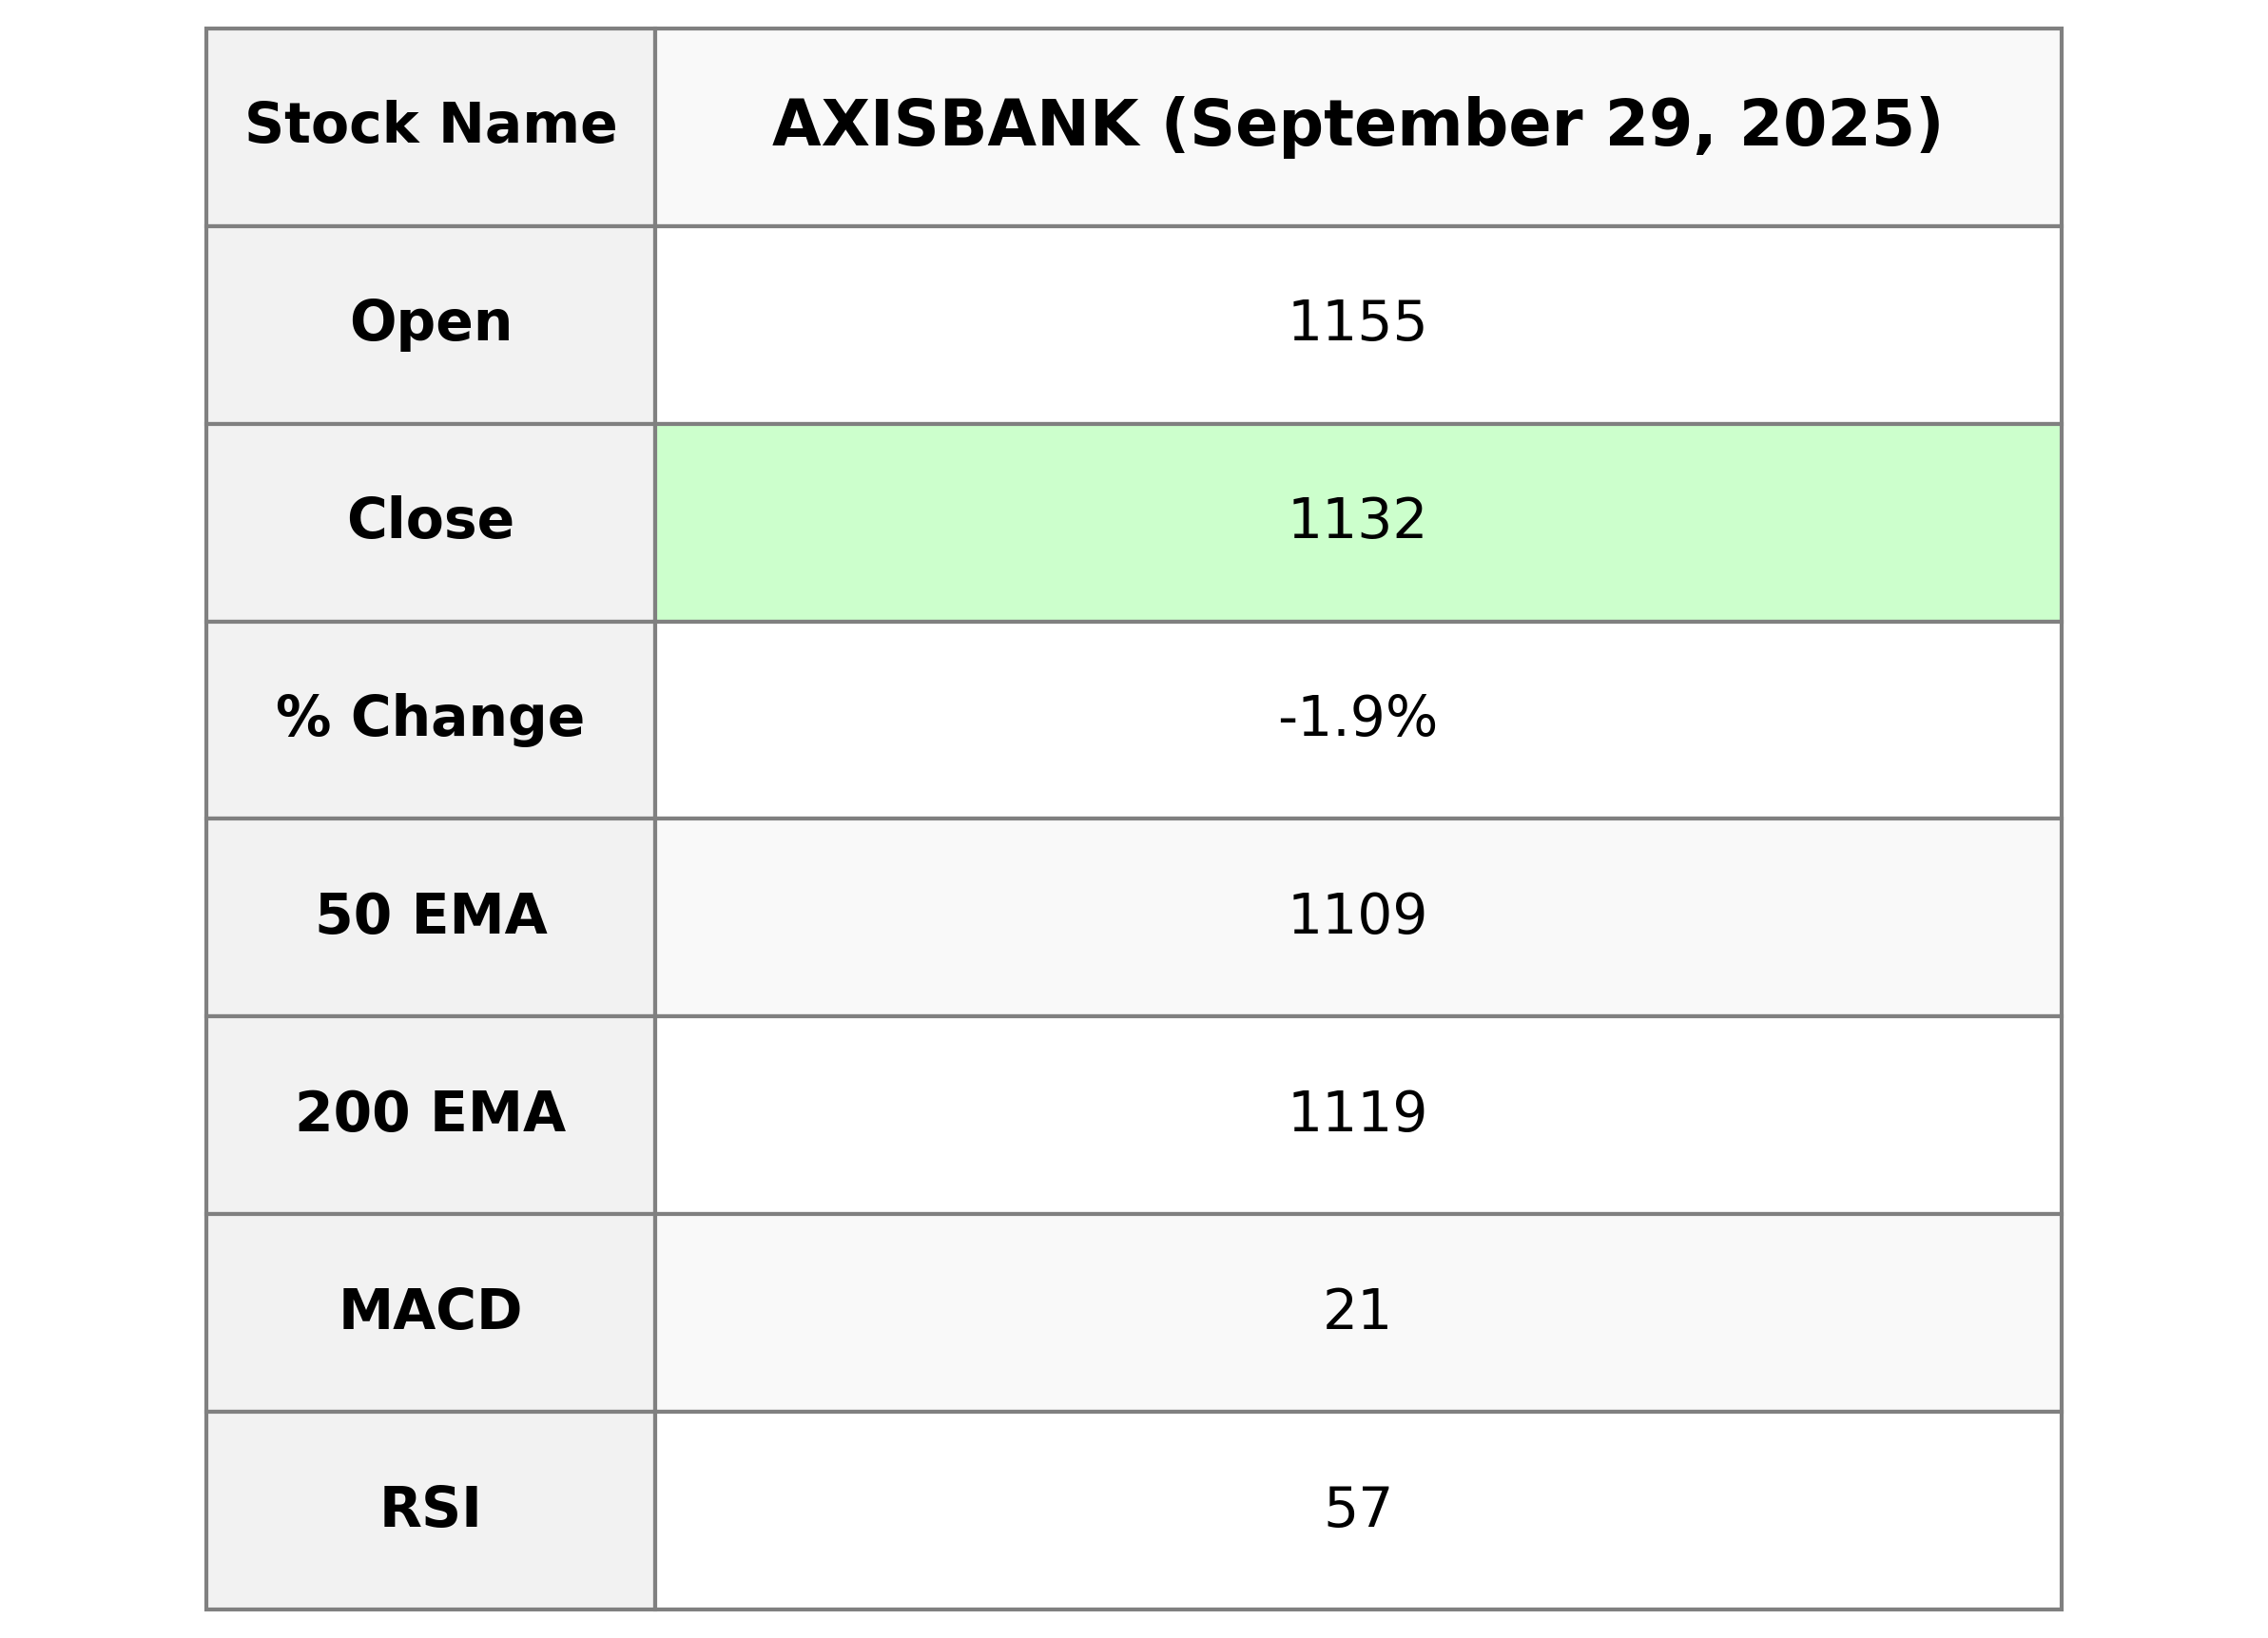
Axis Bank Performance Overview: Axis Bank recorded a closing stock price of 1132.20 on the analyzed day, reflecting a decrease of 1.89% from the previous close. The stock experienced fluctuations with a high of 1158.30 and a low of 1126.70. The Relative Strength Index (RSI) stood at 57.33, indicating a neutral position in terms of buying and selling pressure. Axis Bank operates within the financial services sector in the regional banks industry in India, boasting a market capitalization of 3,512,956,878,848 and a PE Ratio of 12.64.
Relationship with Key Moving Averages
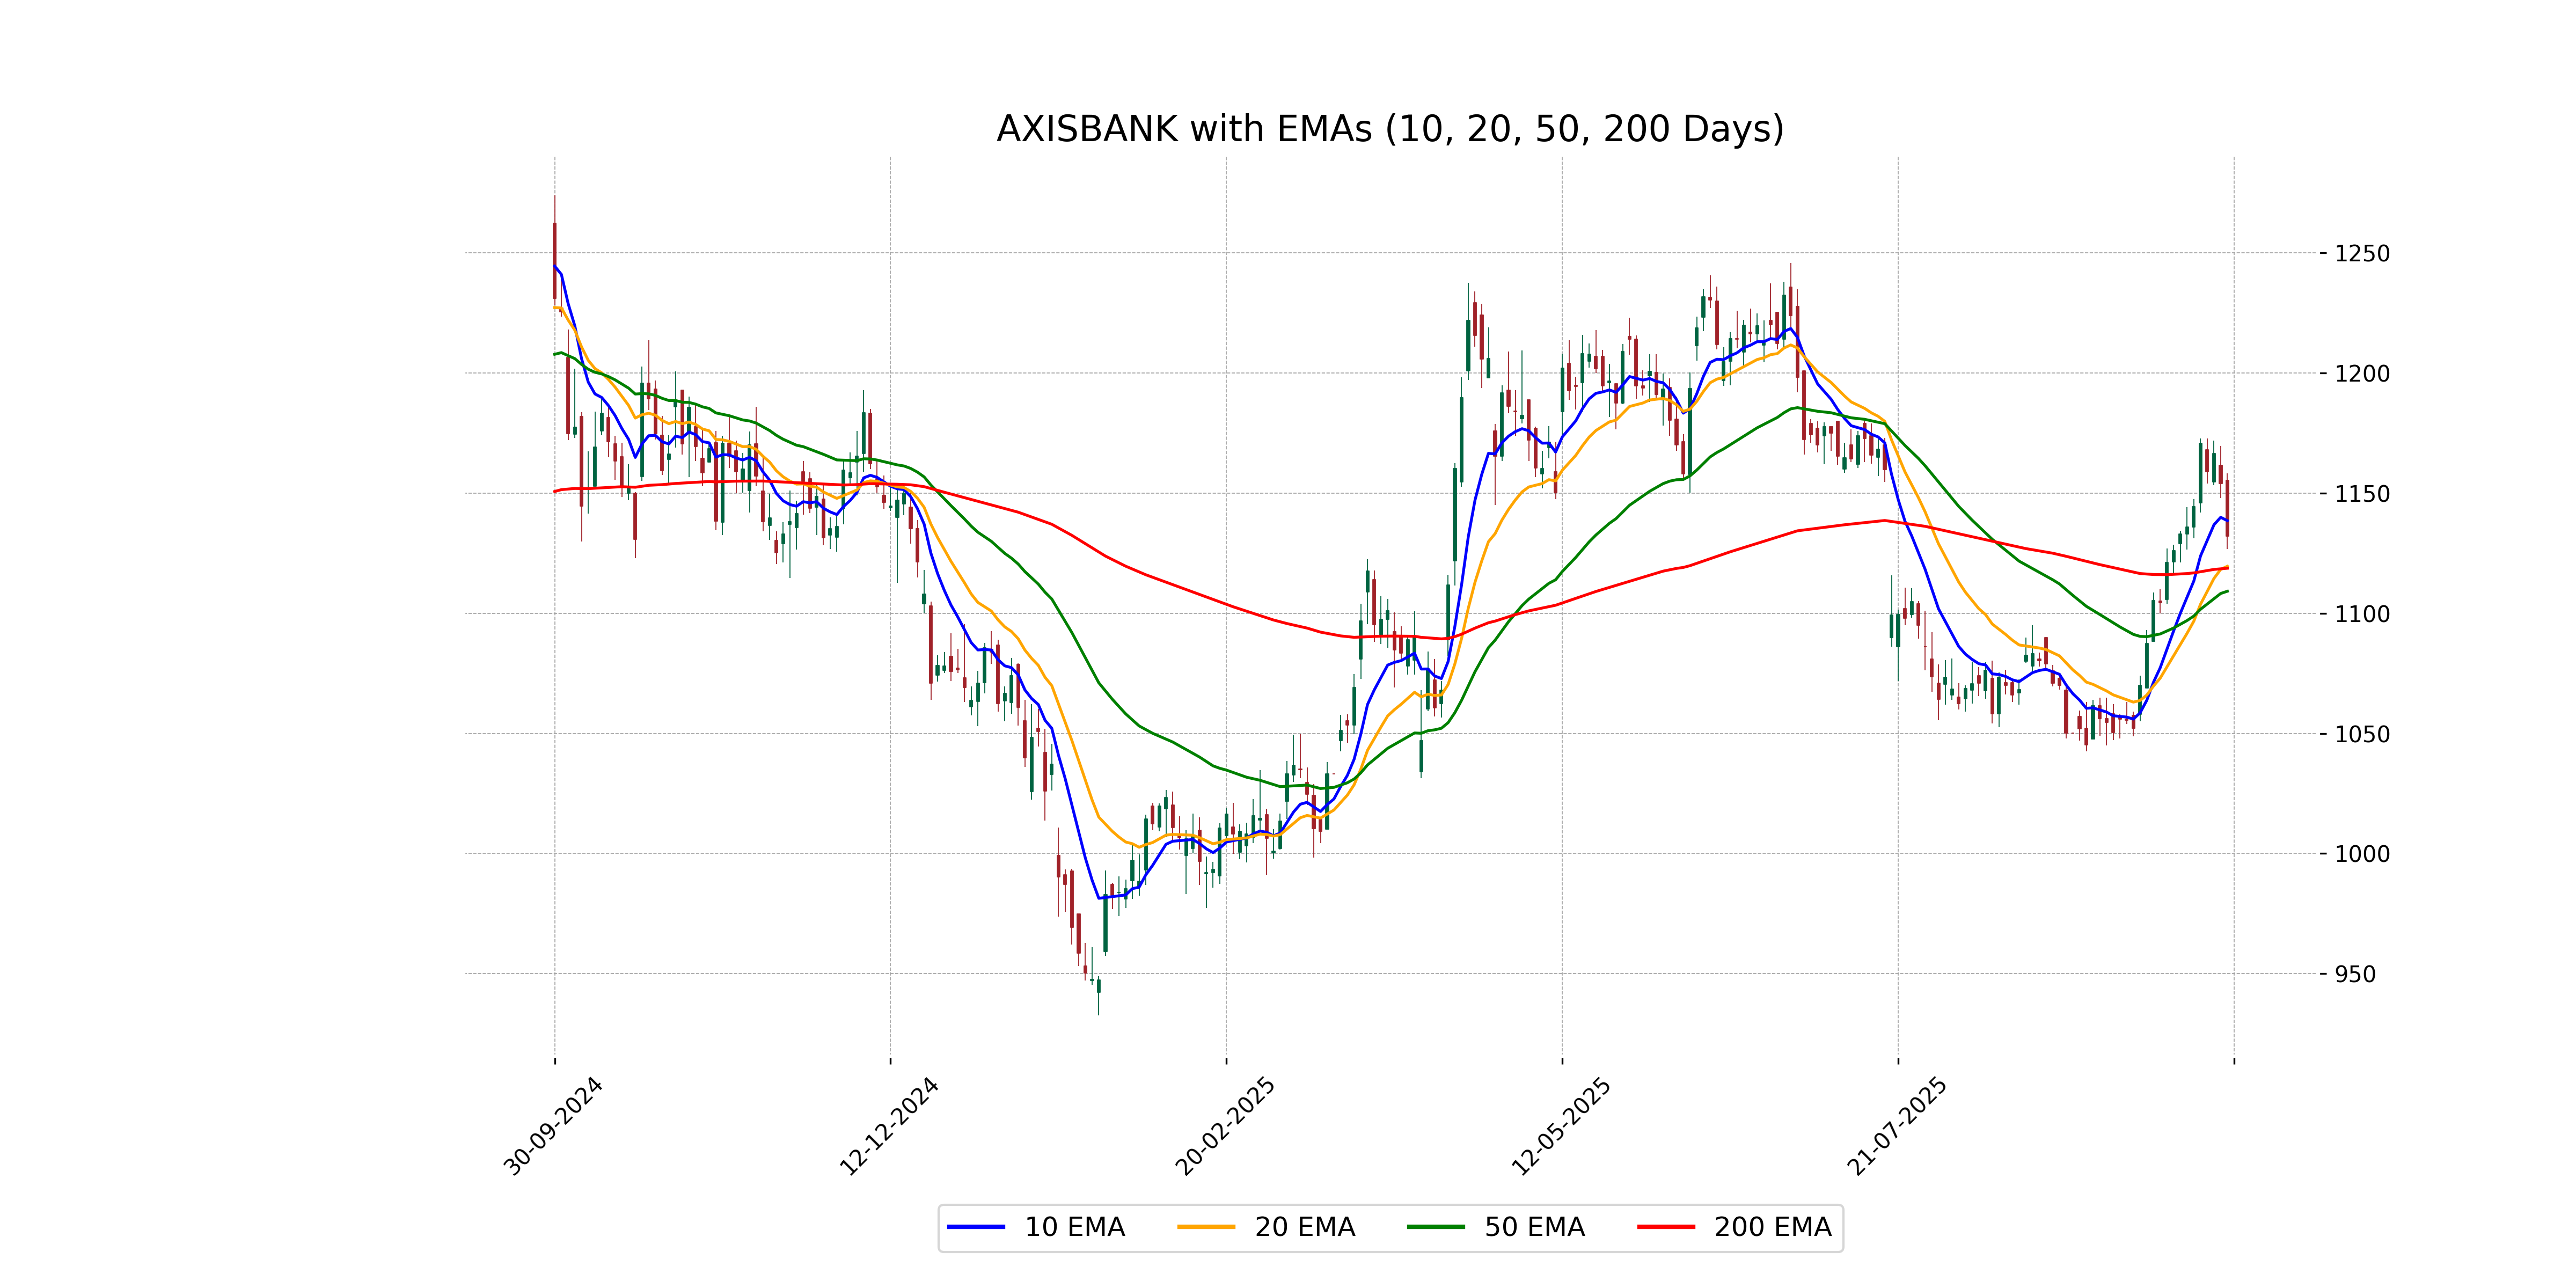
Axis Bank's stock closed at 1132.20, which is below its 10 EMA of 1138.56, suggesting potential short-term bearish trends, but it remains above the 50 EMA of 1109.19 and close to the 200 EMA of 1118.76, indicating overall supportive longer-term trends within the context of significant moving averages.
Moving Averages Trend (MACD)
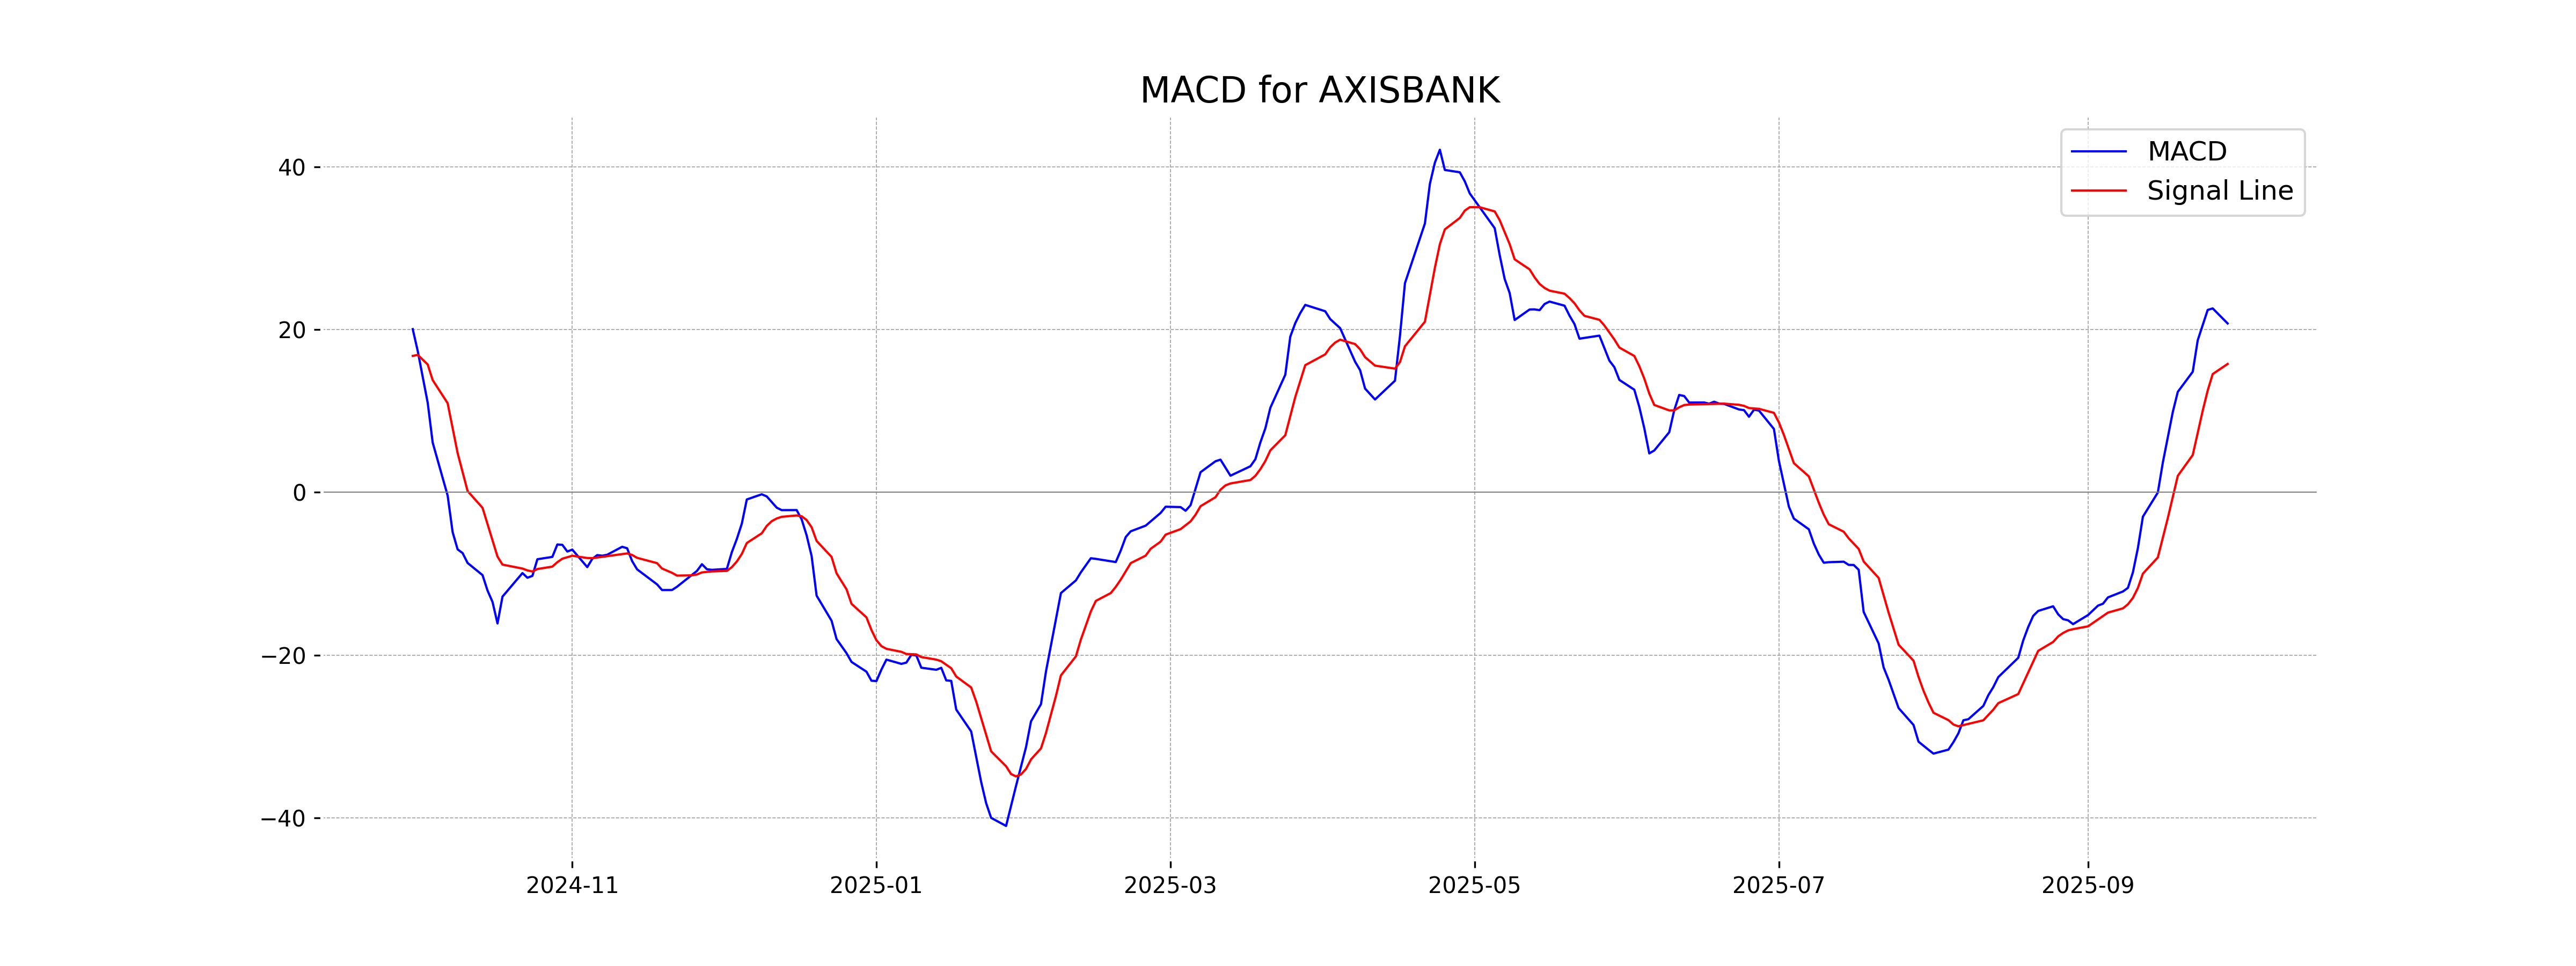
Axis Bank's MACD of 20.75 is above its MACD Signal line of 15.77, indicating a bullish trend. This suggests potential upward momentum in the stock's price. The RSI of 57.33 further supports this positive outlook, being in a neutral-to-bullish zone.
RSI Analysis
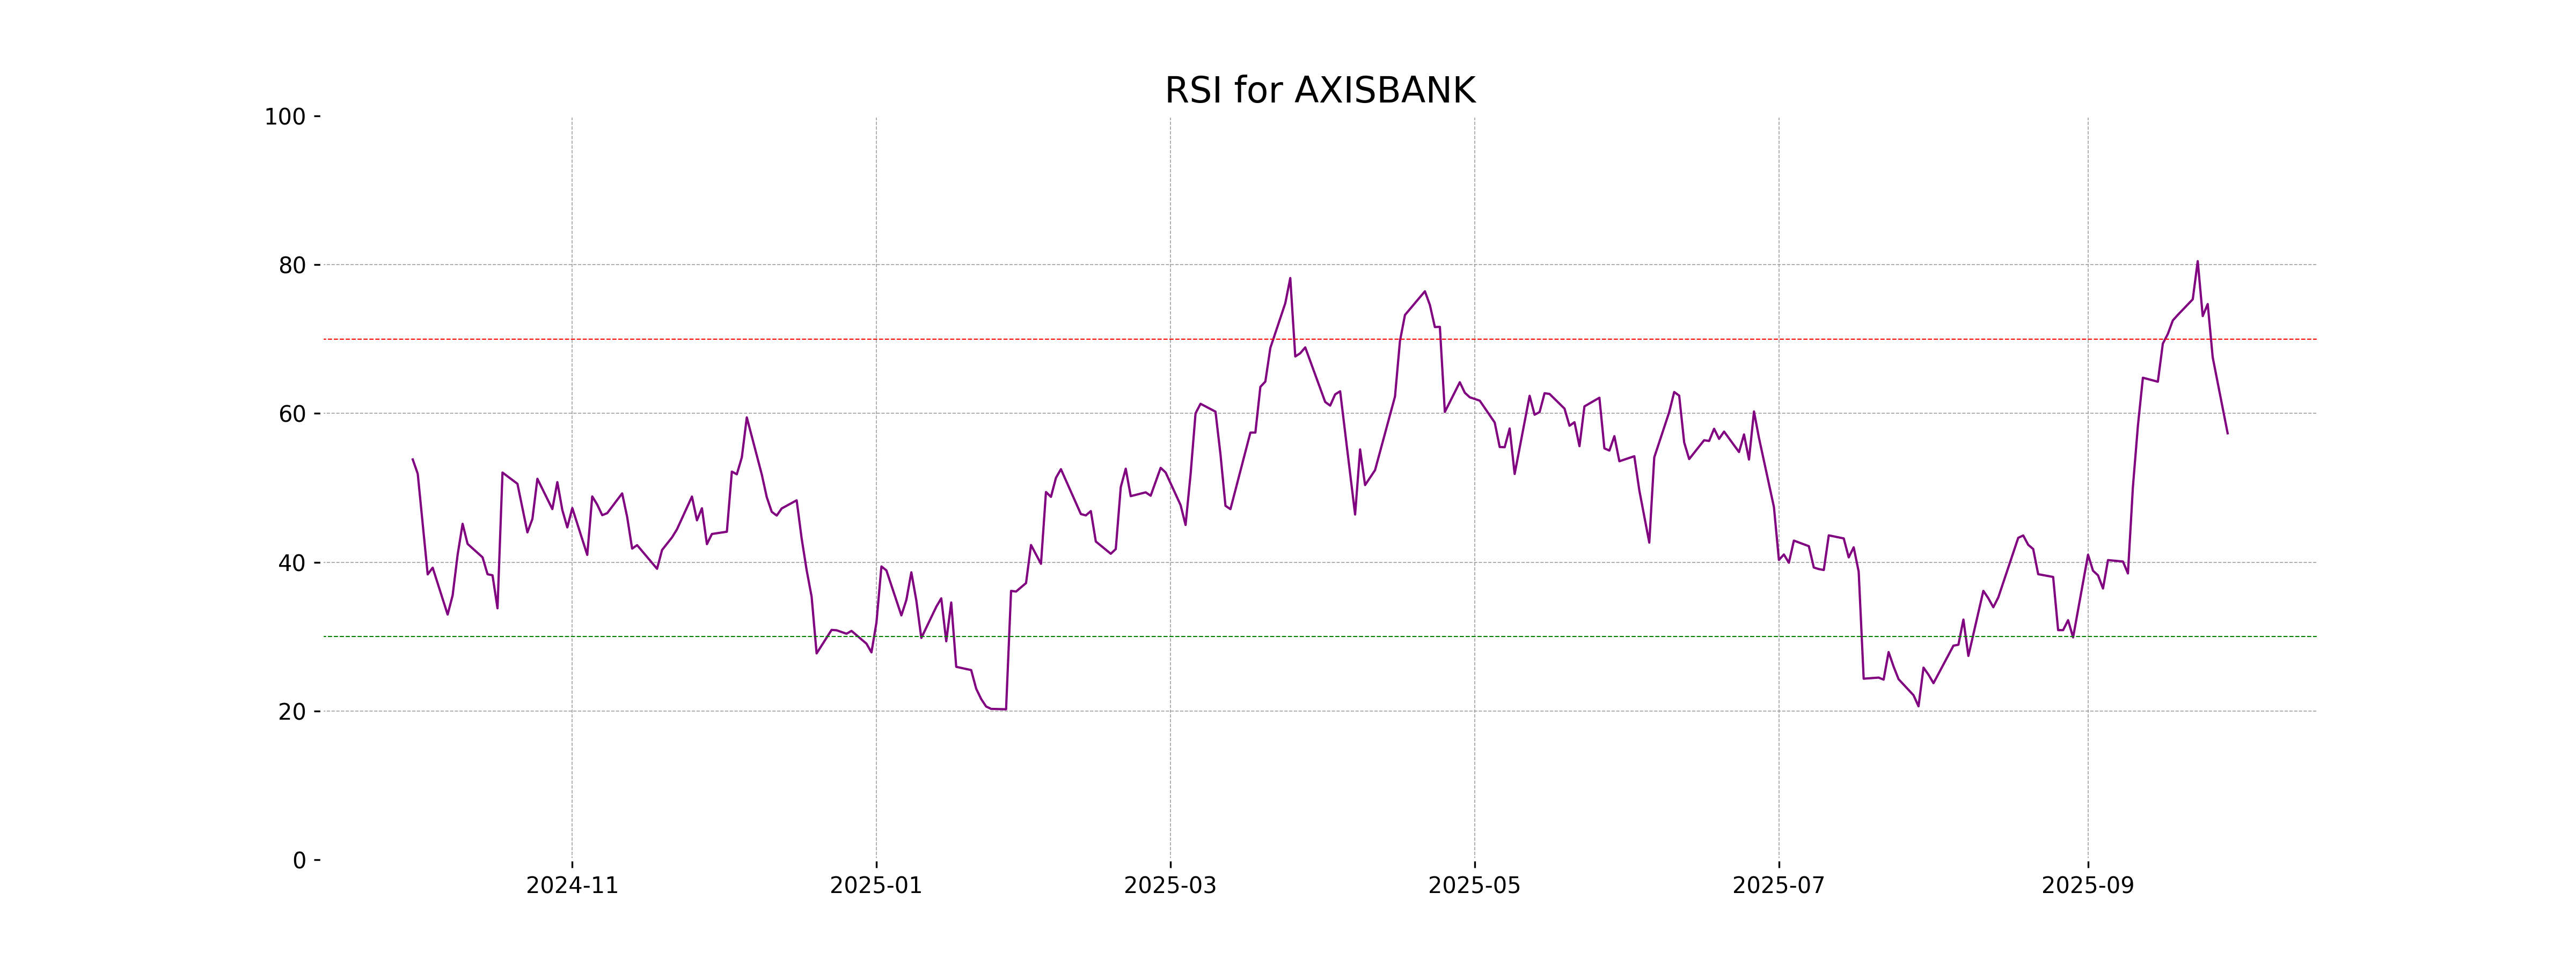
The Relative Strength Index (RSI) for Axis Bank is 57.33, indicating a neutral trend. An RSI value between 30 and 70 typically represents a stock that is neither overbought nor oversold. Therefore, Axis Bank is in a stable position with regard to its momentum, as reflected by its current RSI.
Analysis for Dr Reddys Labs - September 29, 2025
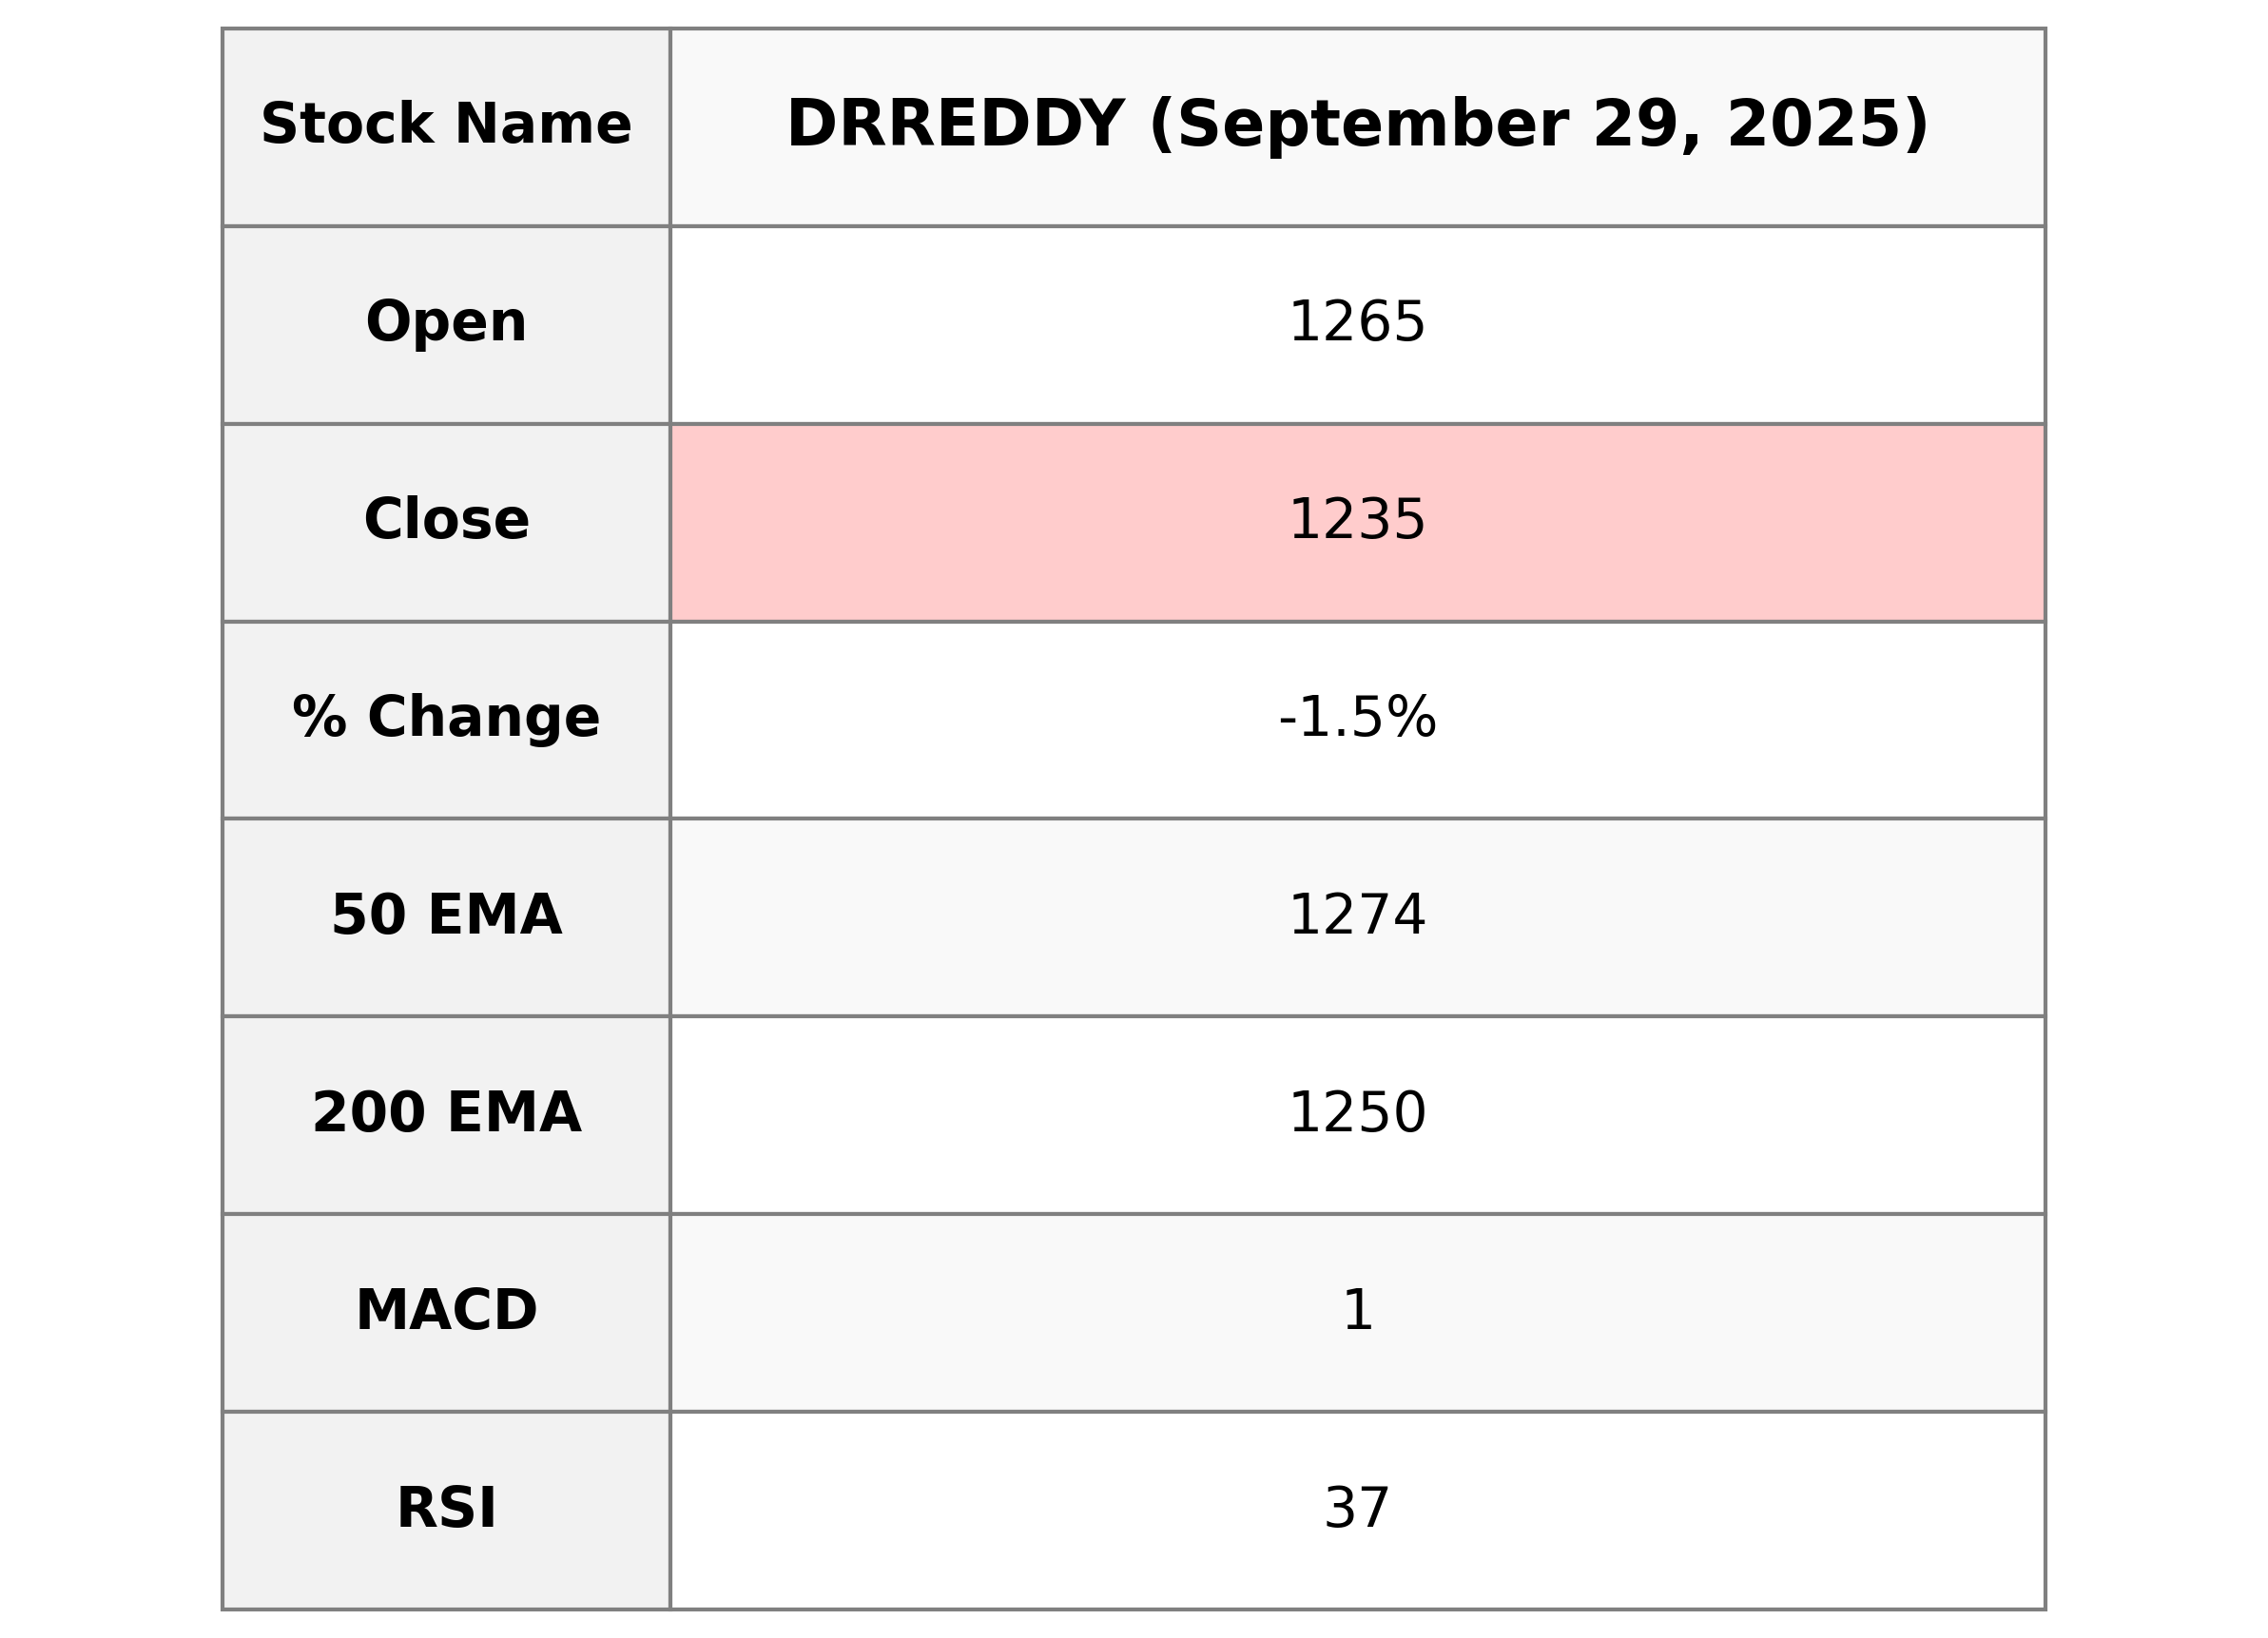
Dr Reddy's Laboratories Limited showed a downward performance on the trading day, with its stock closing at 1234.60, down from a previous close of 1253.10, reflecting a -1.48% change. The stock encountered volatility, reaching a high of 1270.00 and a low of 1231.00, while the RSI was at 36.85, indicating potential overselling. Despite a market cap of over 1 trillion, the company's stock remained below key EMAs, with a MACD considerably below its signal, highlighting bearish trends.
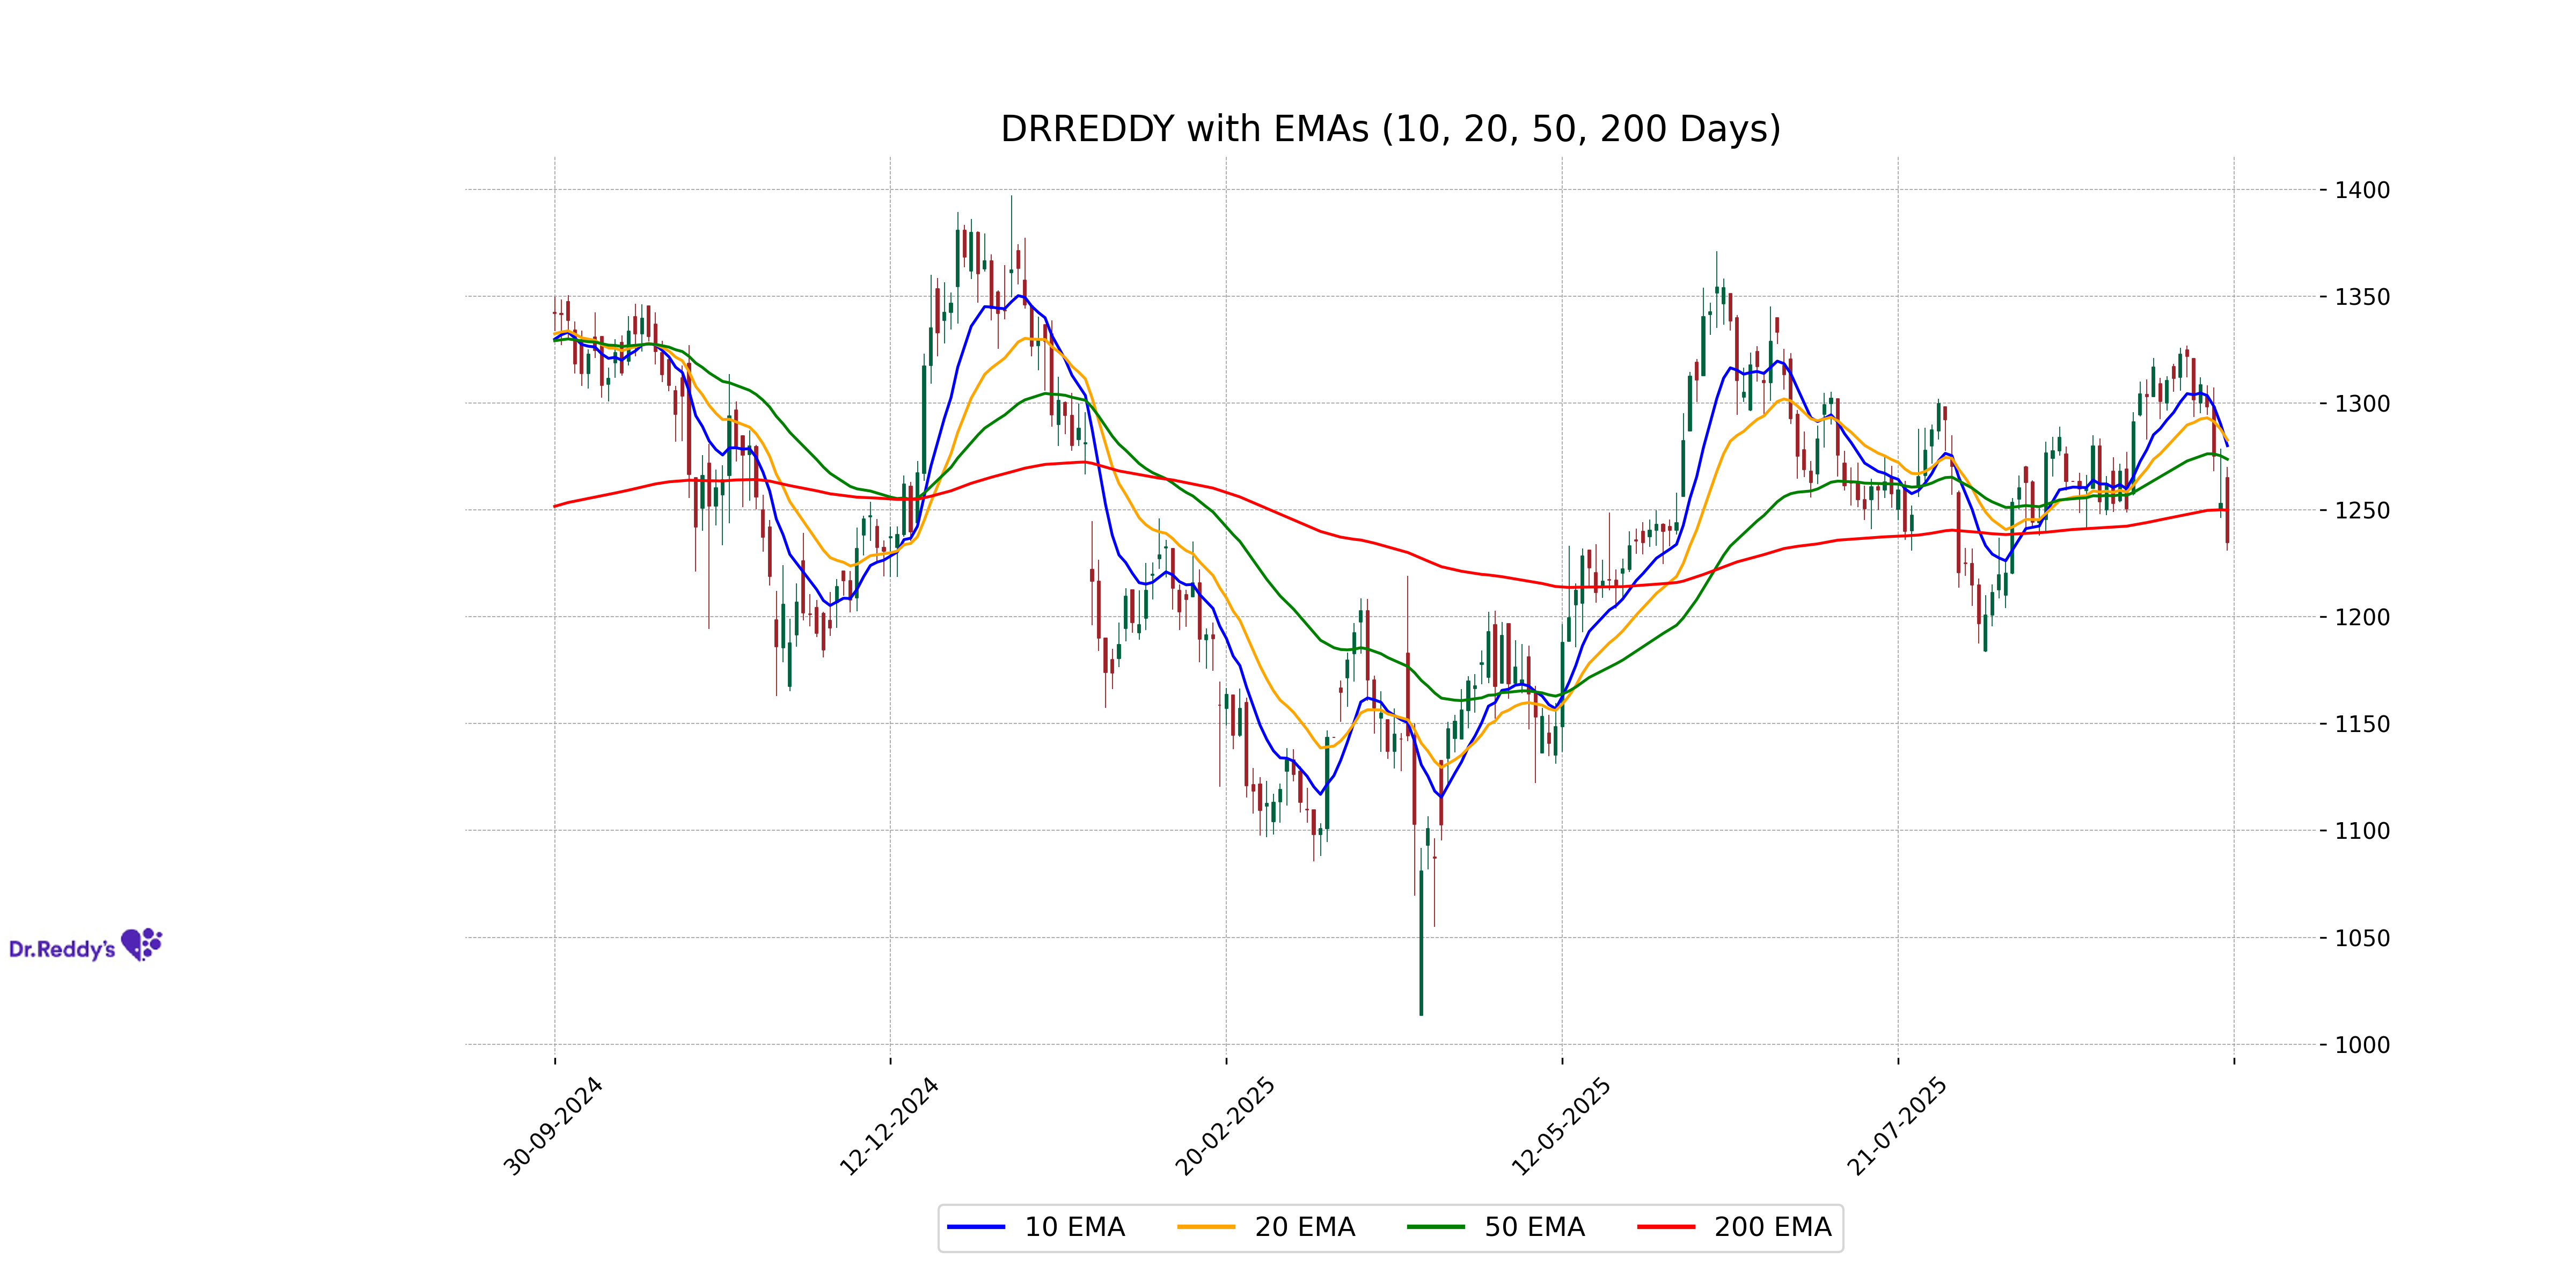
Relationship with Key Moving Averages
Dr Reddys Labs closed at 1234.60, which is below its 50 EMA (1273.67) and 10 EMA (1280.01) as well as its 20 EMA (1282.64), indicating a bearish trend. However, the close is slightly below its 200 EMA (1249.87), suggesting it is approaching long-term support levels.
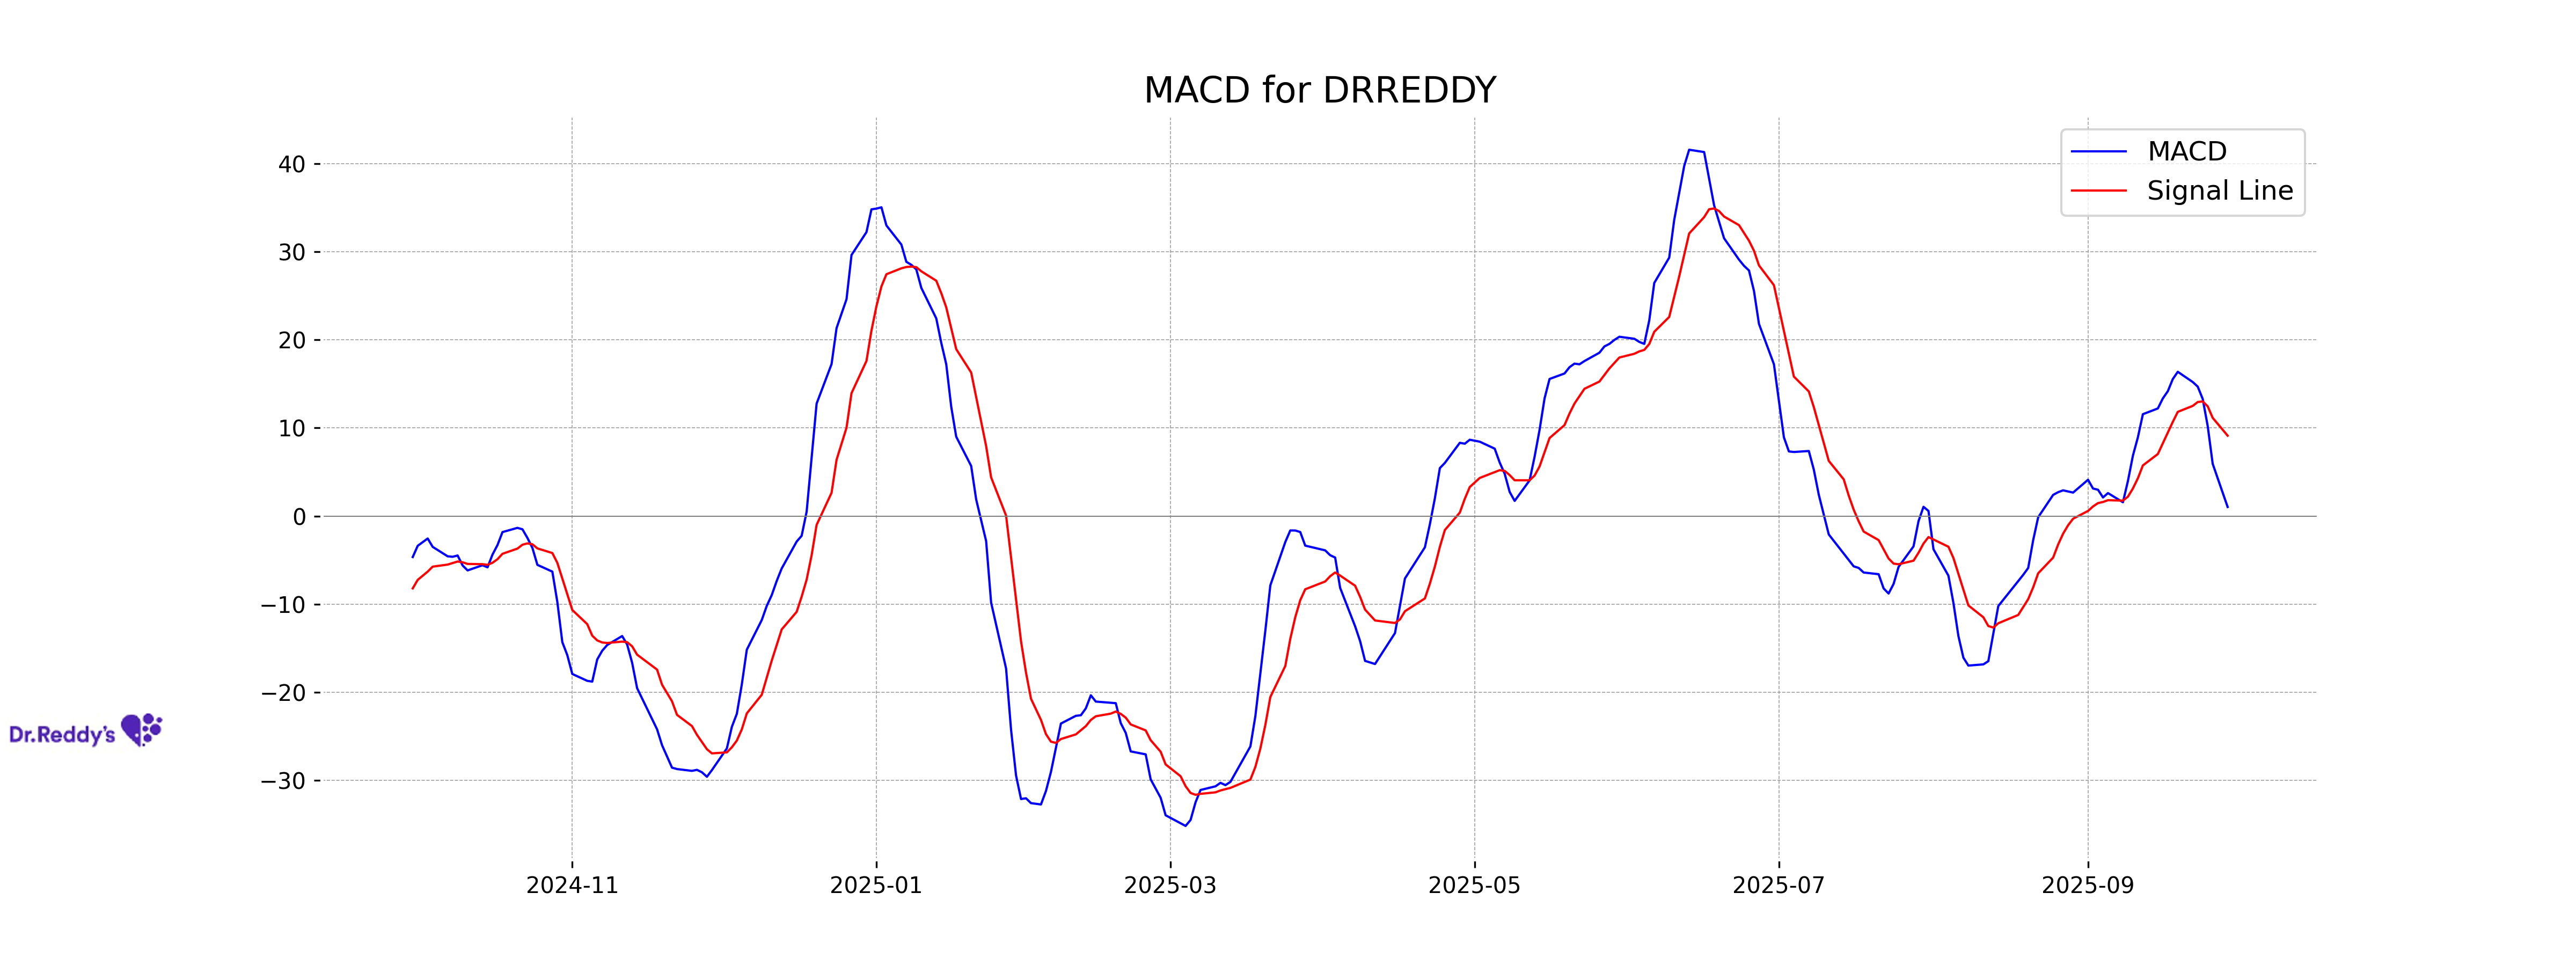
Moving Averages Trend (MACD)
Dr Reddys Labs' MACD of 1.03 indicates a slightly bullish sentiment, suggesting a potential upward momentum. However, with the MACD Signal line at 9.13, the stock might still be experiencing some bearish pressure. Caution is advised as the MACD is below the Signal line, traditionally a bearish indicator.
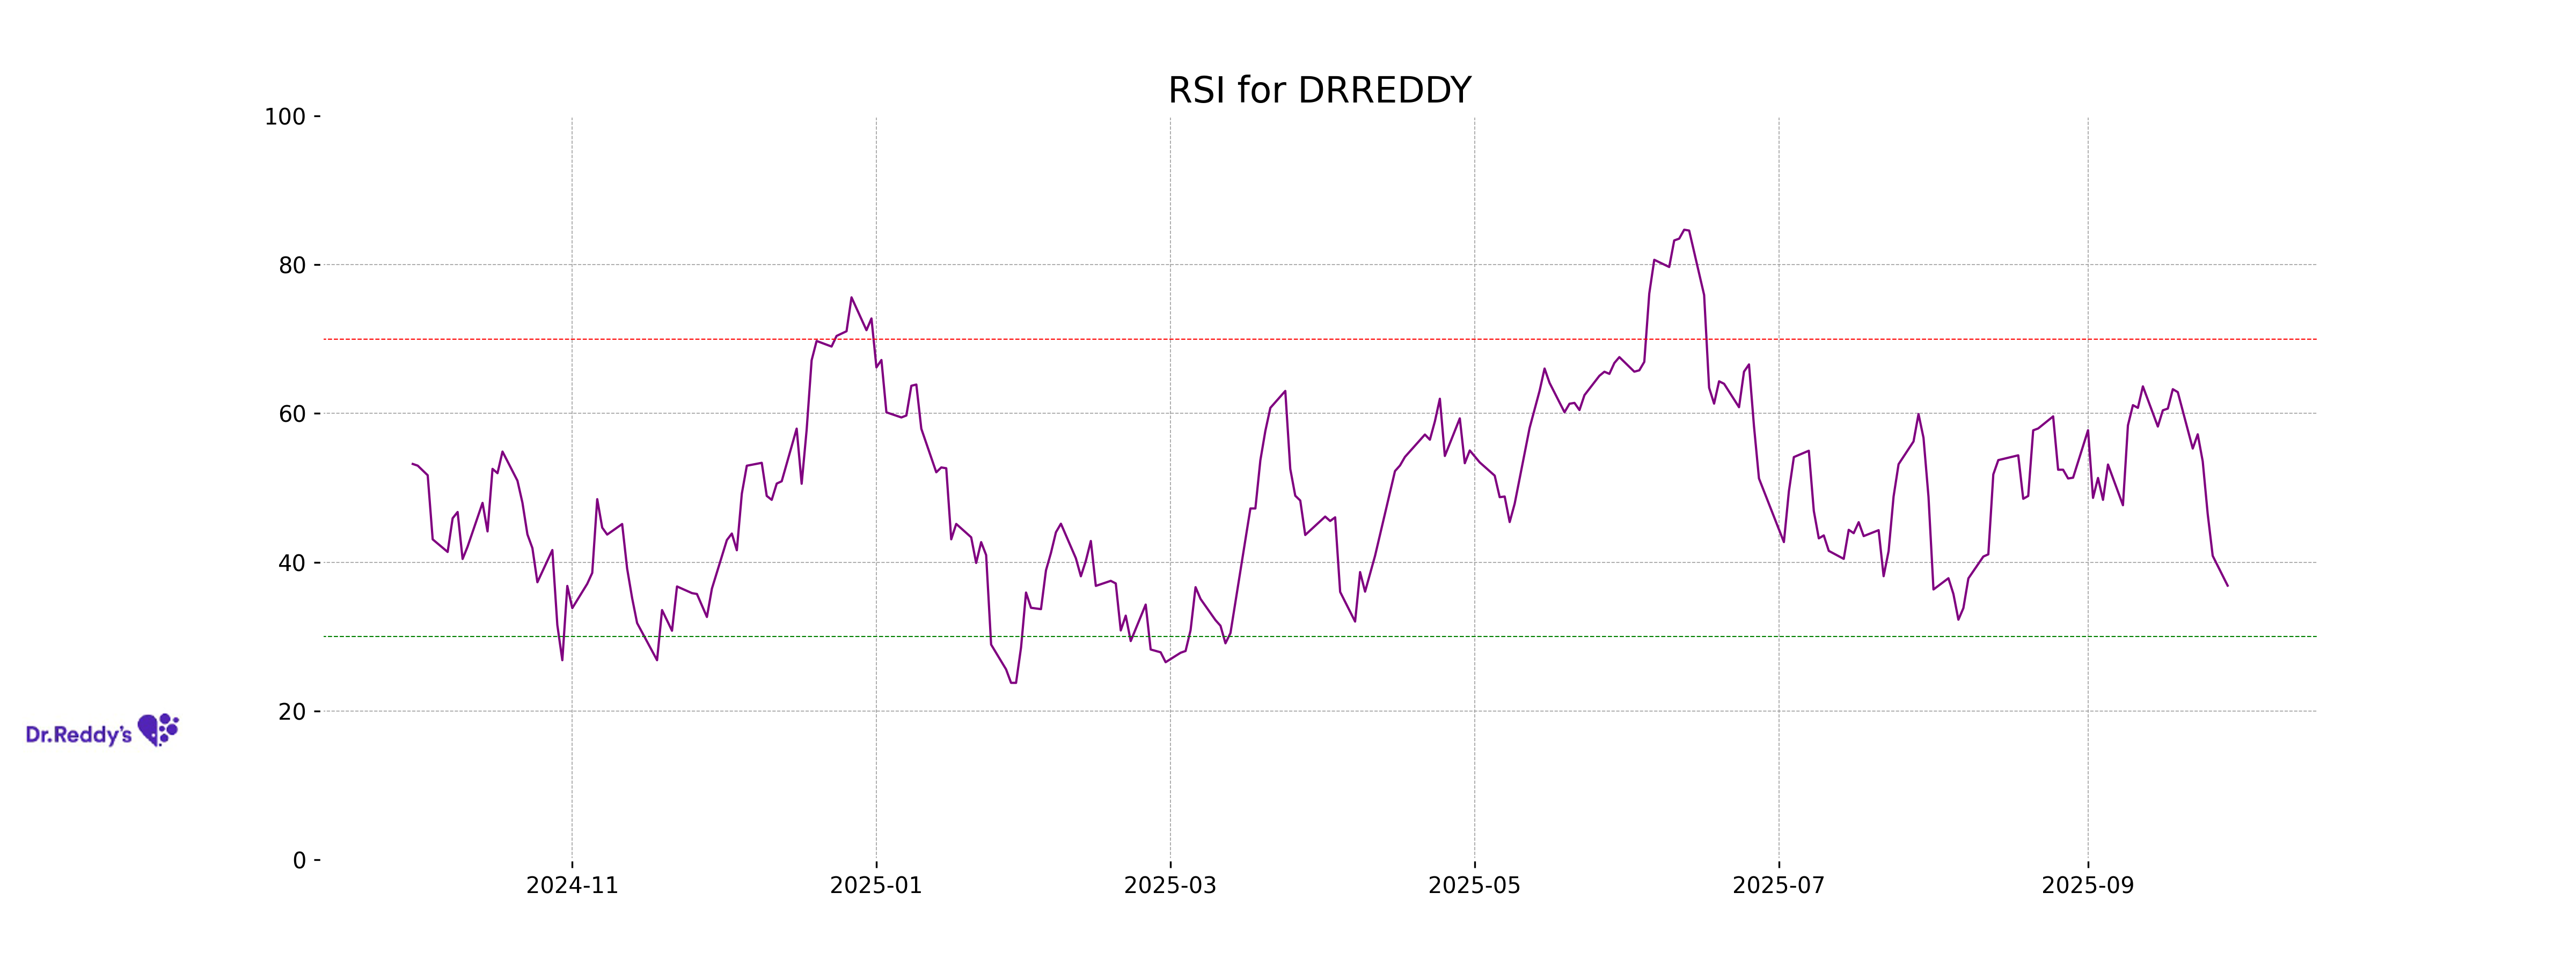
RSI Analysis
Dr Reddys Labs has a Relative Strength Index (RSI) of 36.85, indicating it is in the oversold territory. This suggests the stock may be undervalued and could present a buying opportunity for investors, but further analysis should be conducted to confirm.
Analysis for HDFC LIFE - September 29, 2025

HDFC Life Insurance has experienced a downtrend with a stock price closing at 756.60, marking a 1.02% decline from its previous close. The technical indicators also show signs of weakness, with the RSI at 40.70 indicating a bearish momentum and the MACD below the signal line. While the sector remains strong, the 50 EMA is above the current price, suggesting potential resistance.
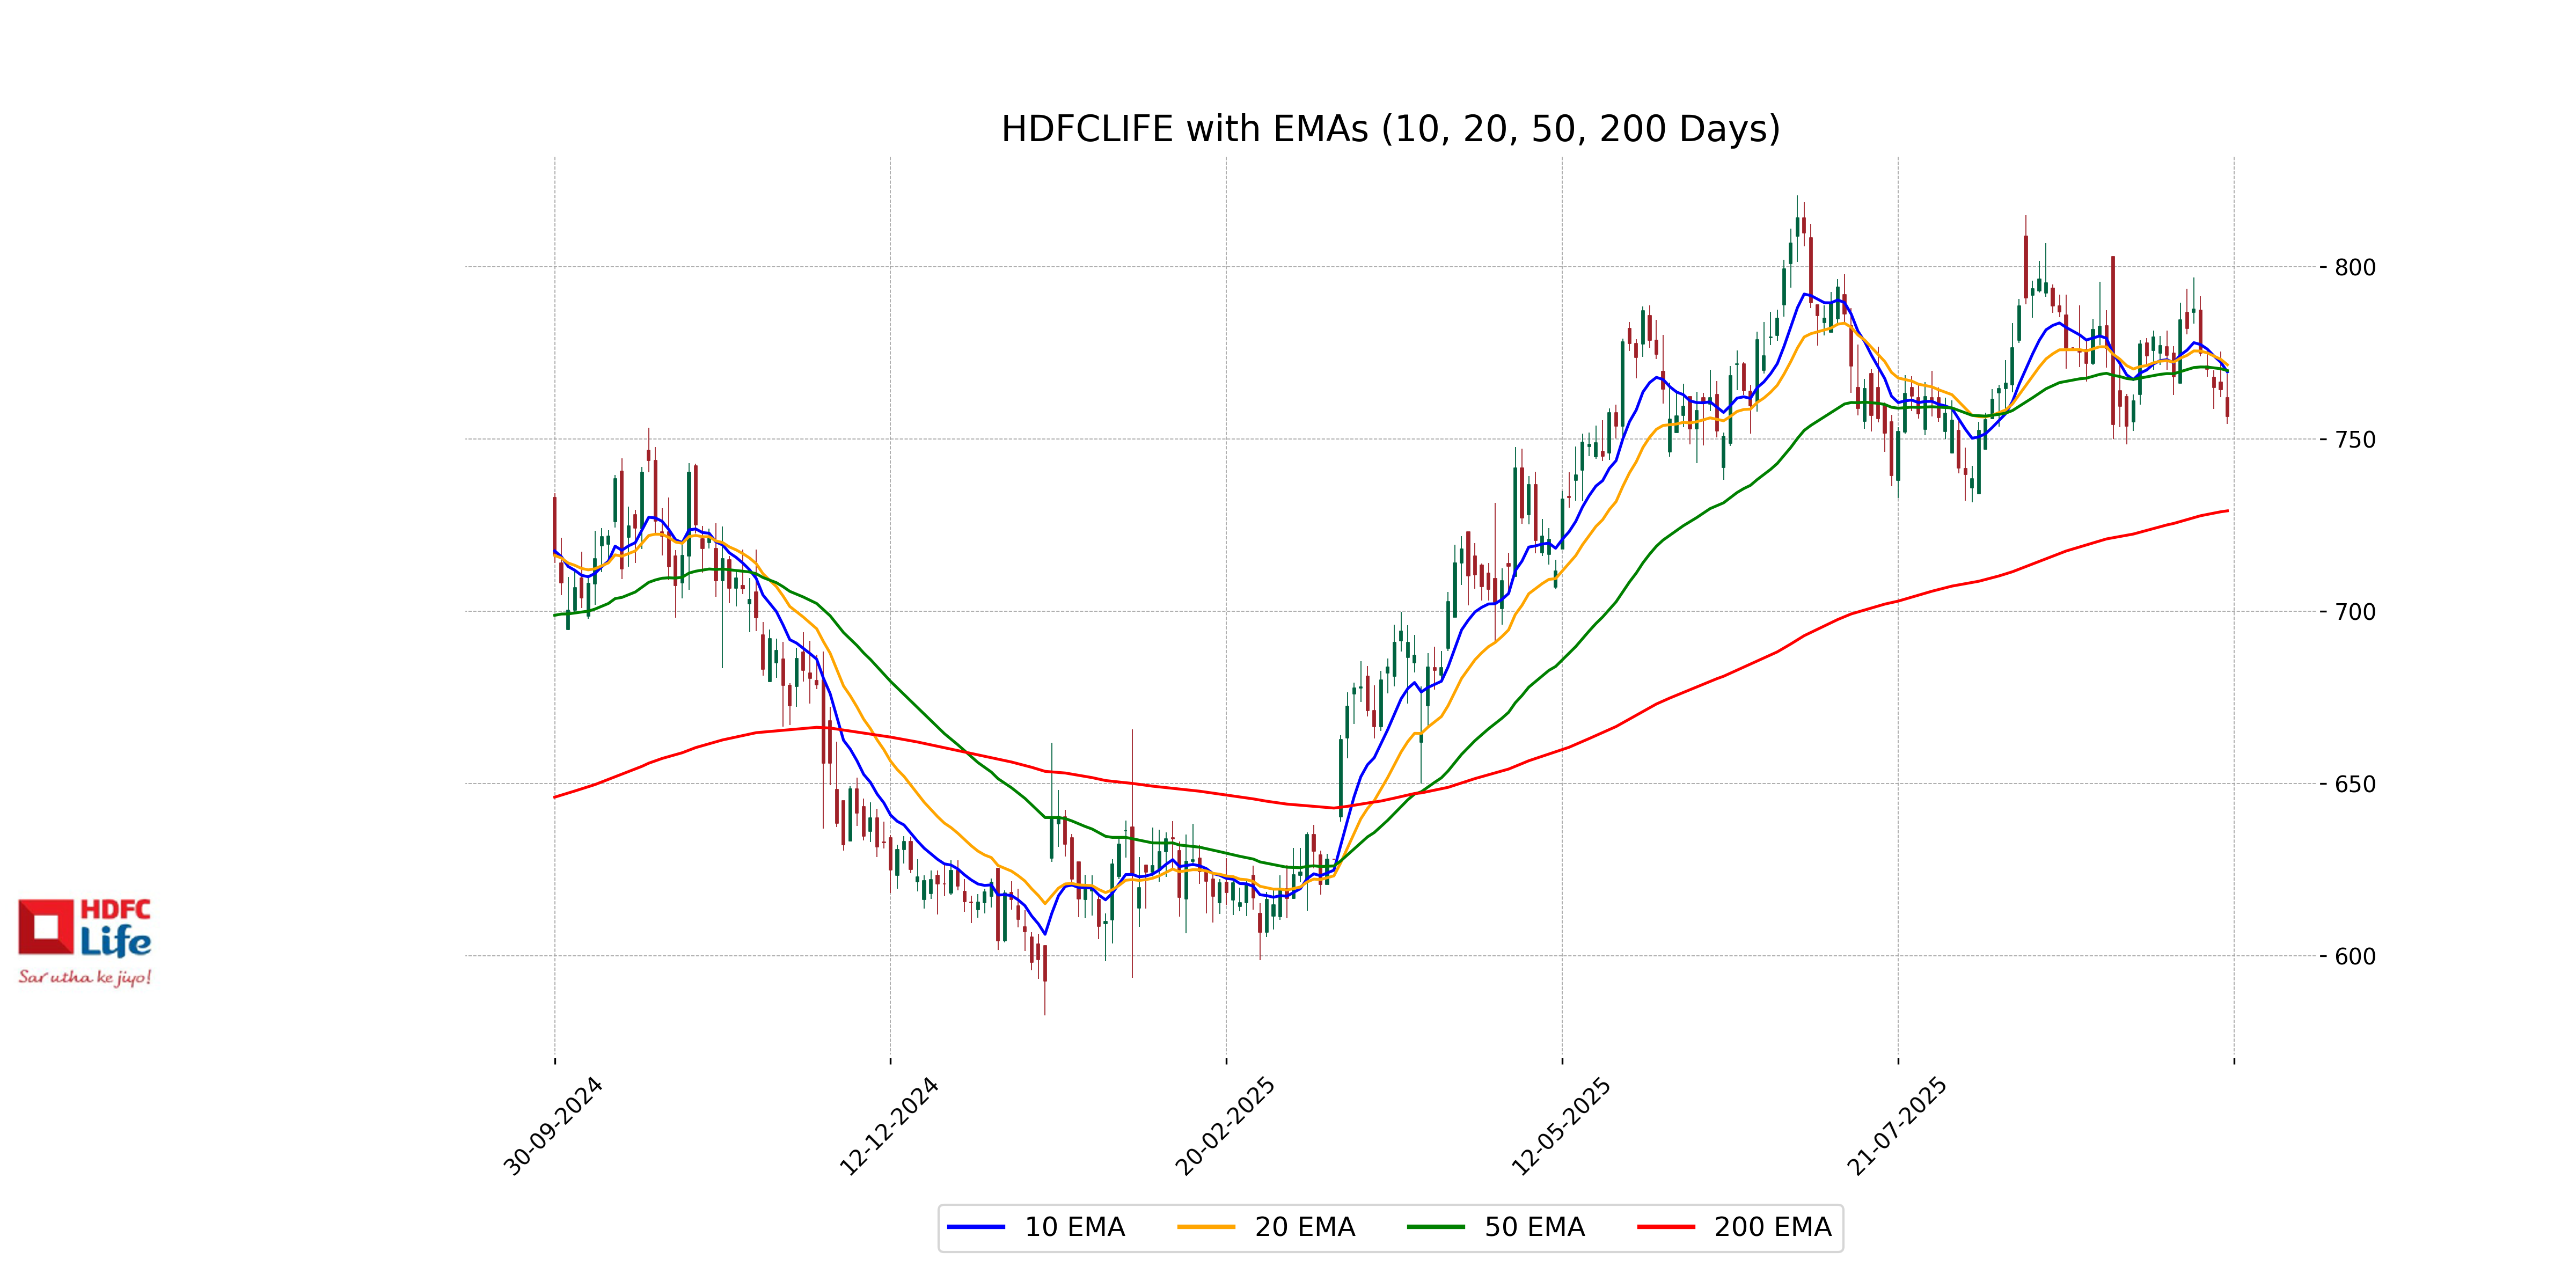
Relationship with Key Moving Averages
HDFC Life's current close price of 756.60 is below all major moving averages, including the 50 EMA at 769.91, 10 EMA at 769.50, and 20 EMA at 771.61, indicating a potential bearish trend. The difference from the moving averages suggests weakness relative to the recent averages, and with an RSI of 40.70, it may be approaching the oversold territory.
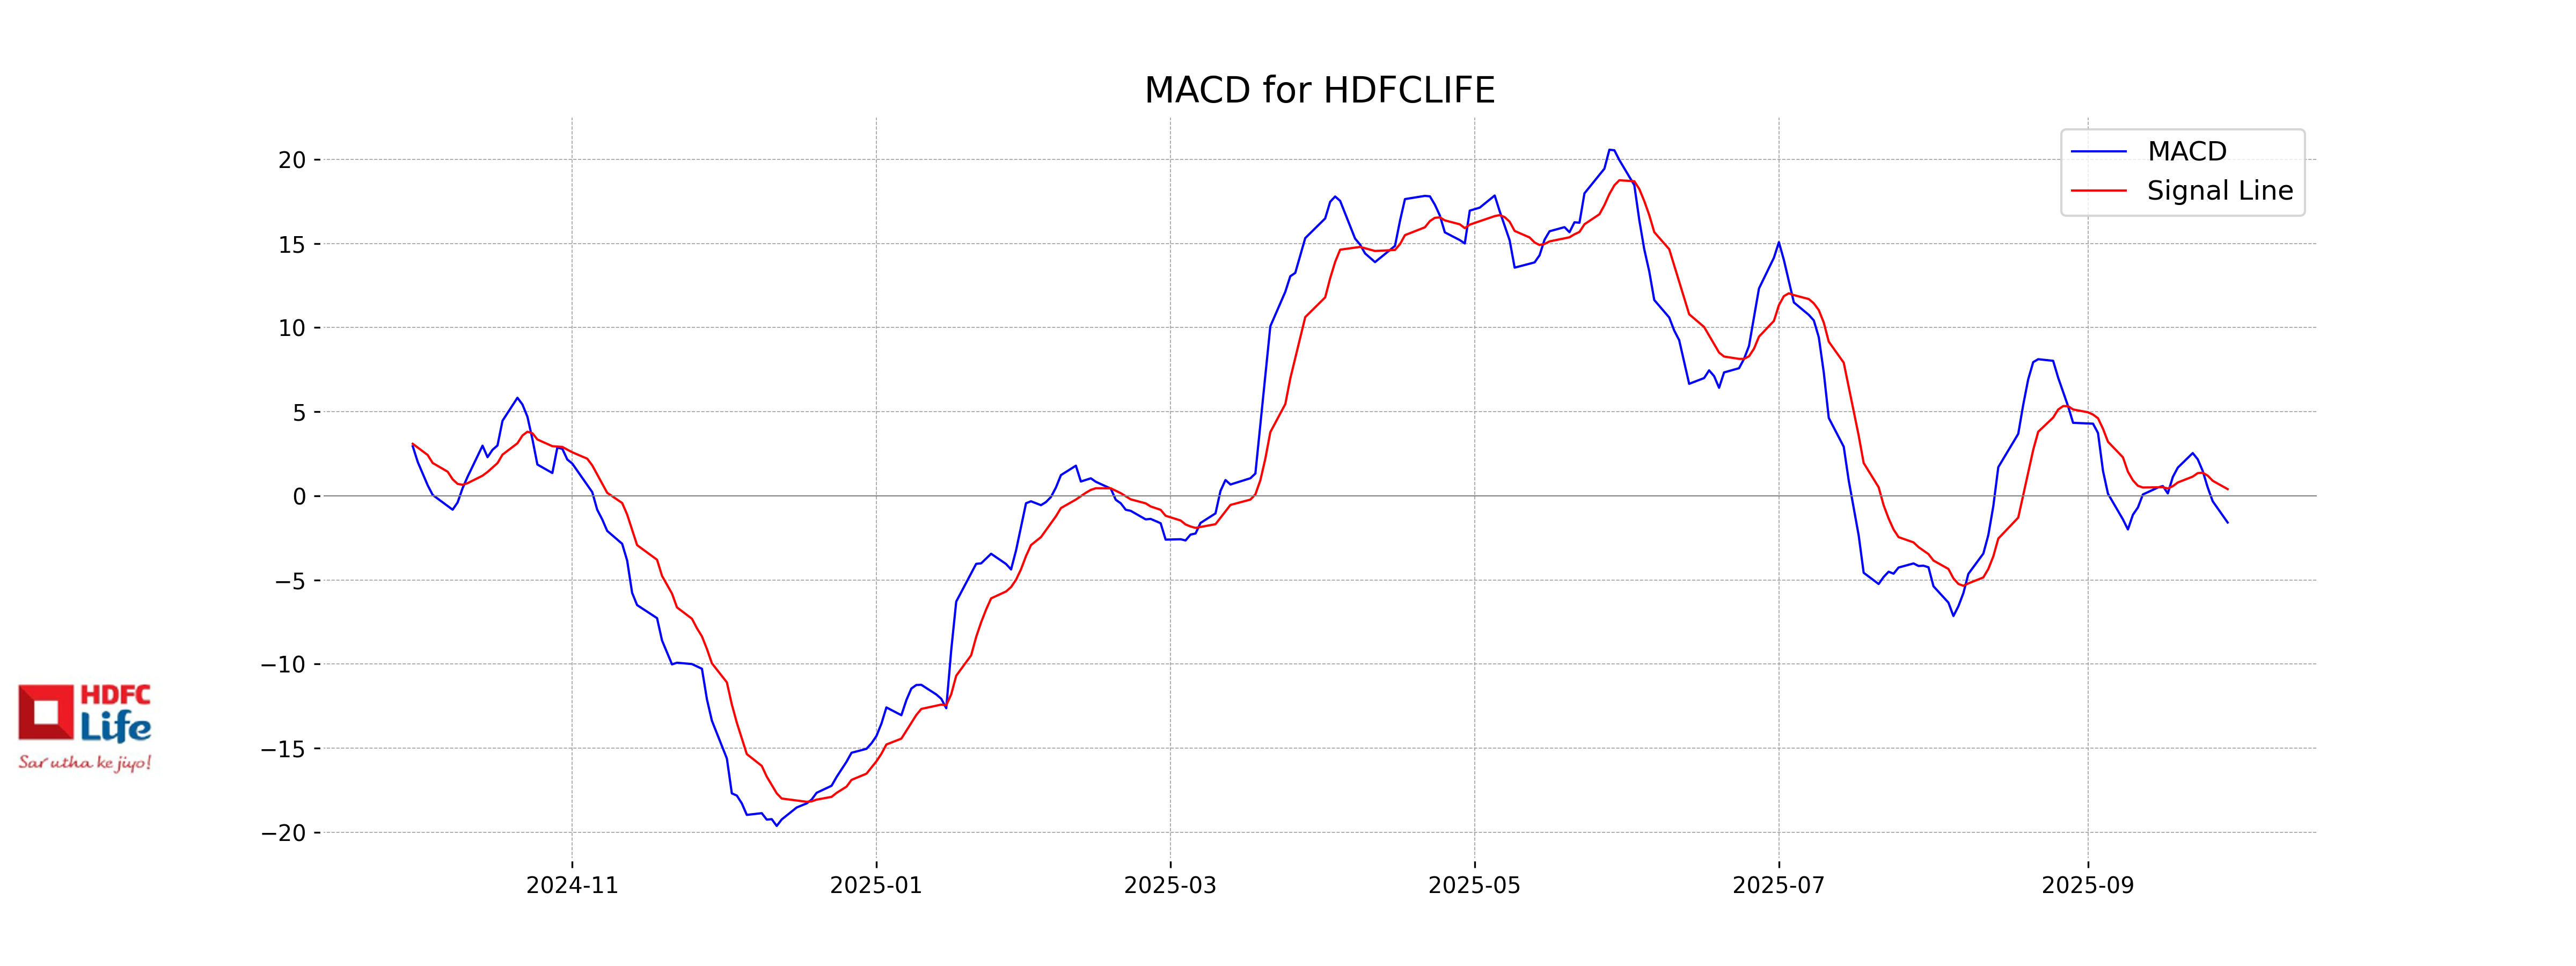
Moving Averages Trend (MACD)
The MACD value for HDFC Life is -1.58, which is below the MACD Signal value of 0.40. This suggests bearish momentum in the stock, indicating a potential downtrend. With the RSI also being relatively low at 40.70, this further supports the bearish outlook and potential for continued weakness.
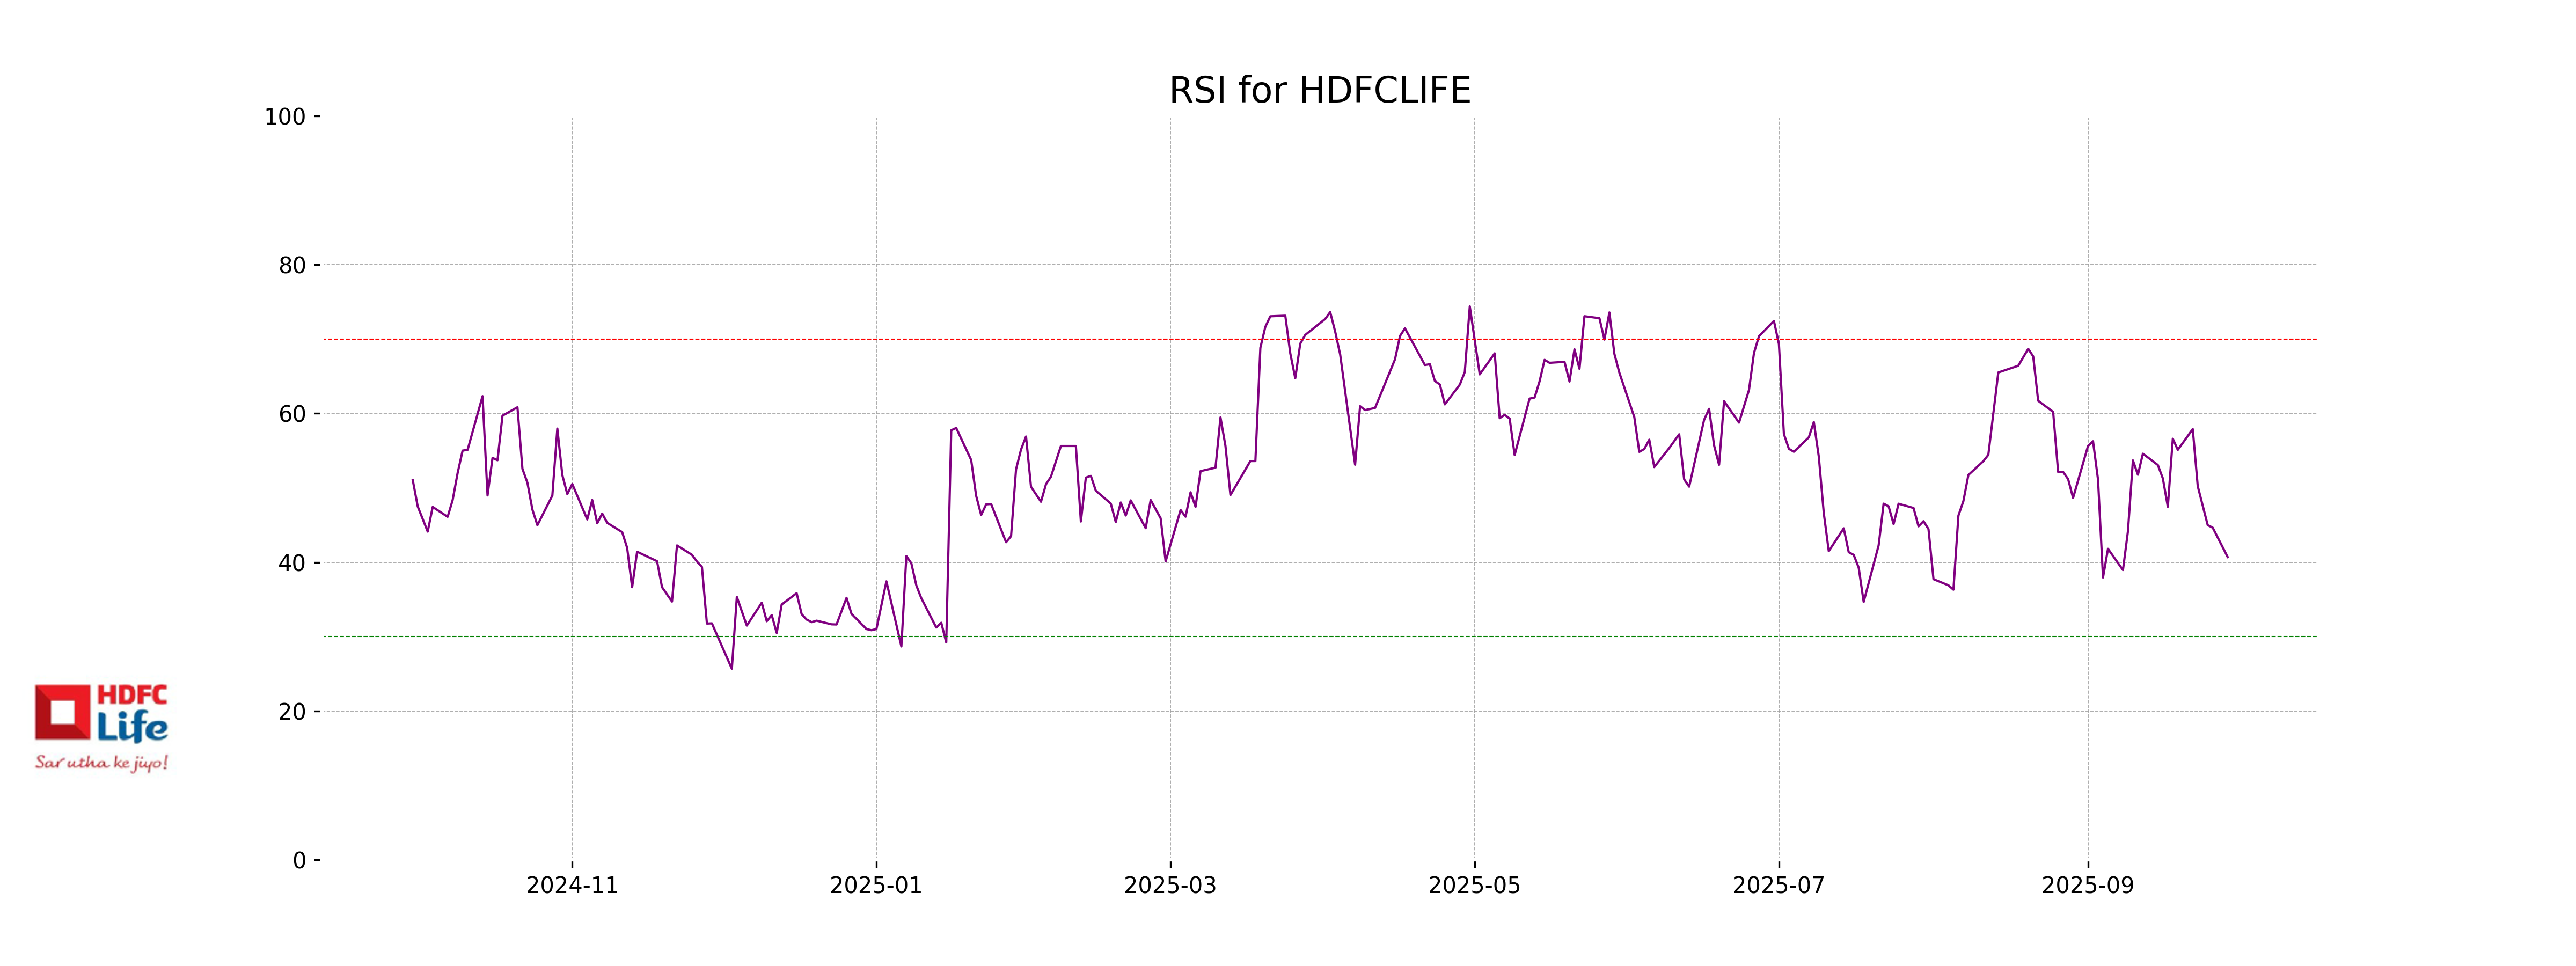
RSI Analysis
The RSI (Relative Strength Index) for HDFC Life is 40.70, which indicates that the stock is nearing the oversold territory, typically below 30. This suggests that while the stock has been experiencing selling pressure, it may potentially face a change in momentum if it moves lower, warranting closer observation for possible upside movement.
Analysis for HCL Technologies - September 29, 2025
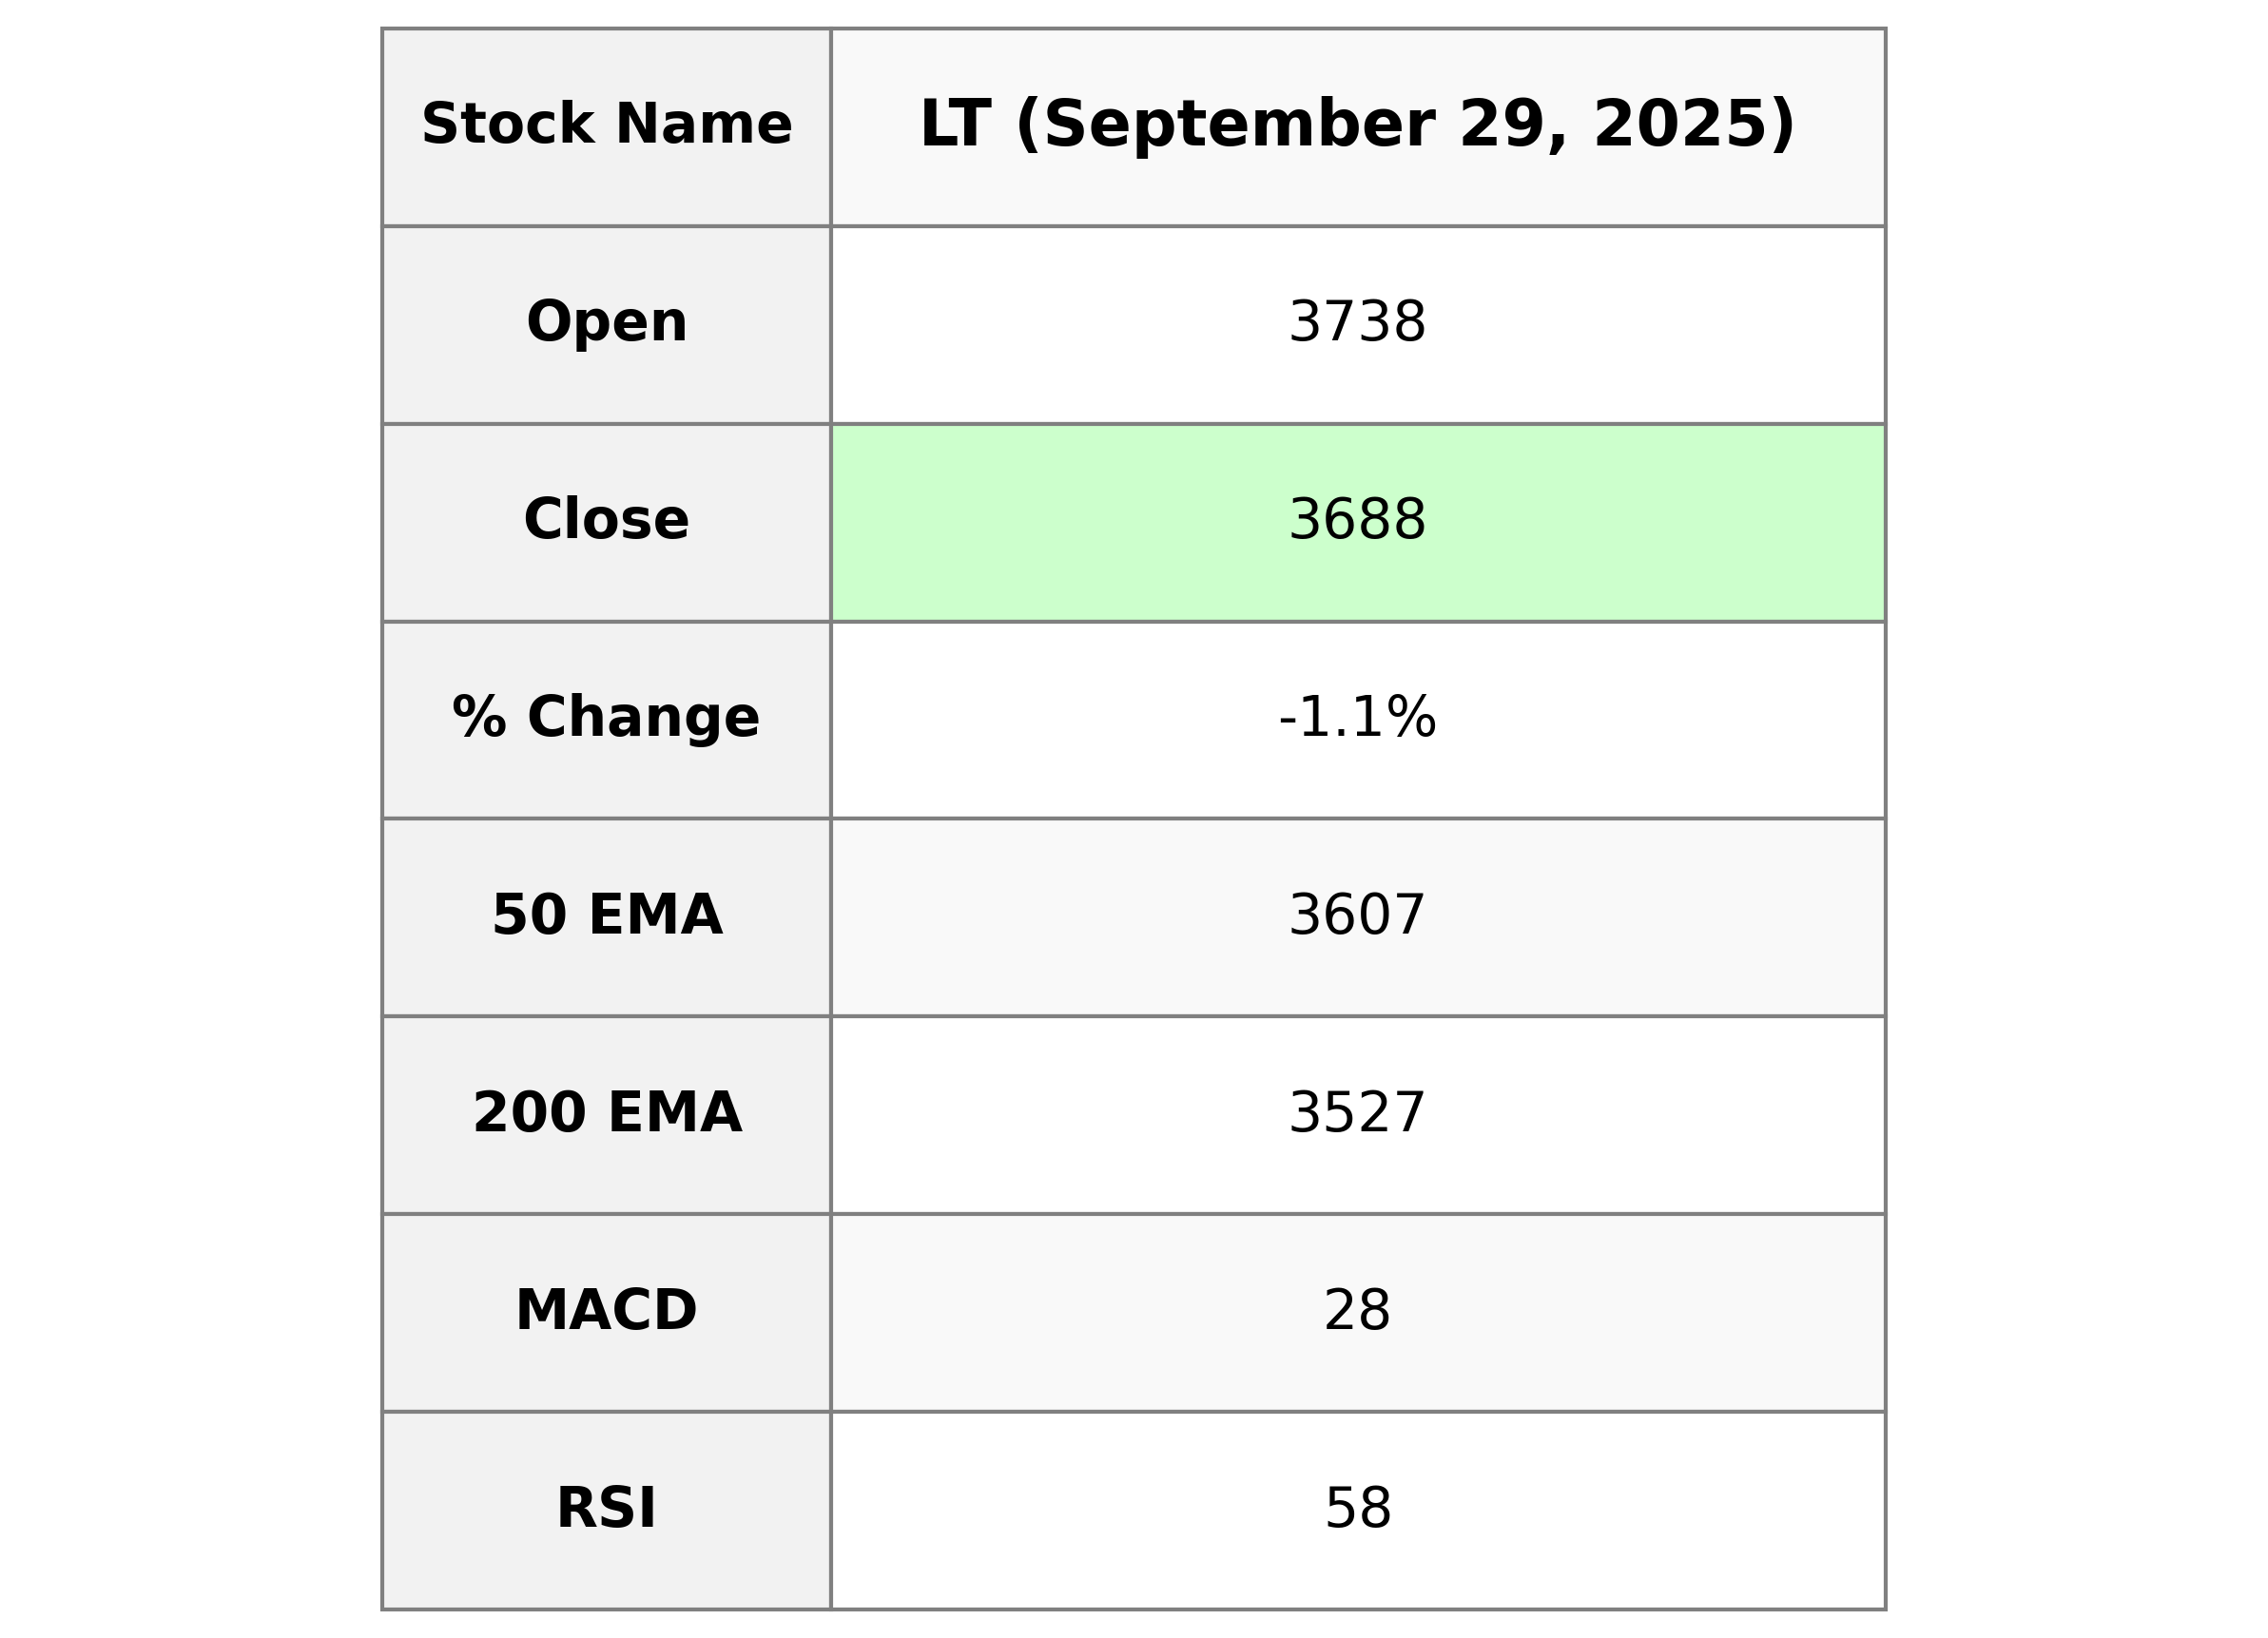
HCL Technologies Performance: Based on the provided data, Larsen & Toubro (LT) had a closing stock price of 3688.40 with a percentage change of -1.10%, indicating a slight decline from its previous close of 3729.50. The market sentiment appears moderately positive with an RSI of 57.92, suggesting some bullish momentum, and it operates in the Industrial sector within Engineering & Construction in India.
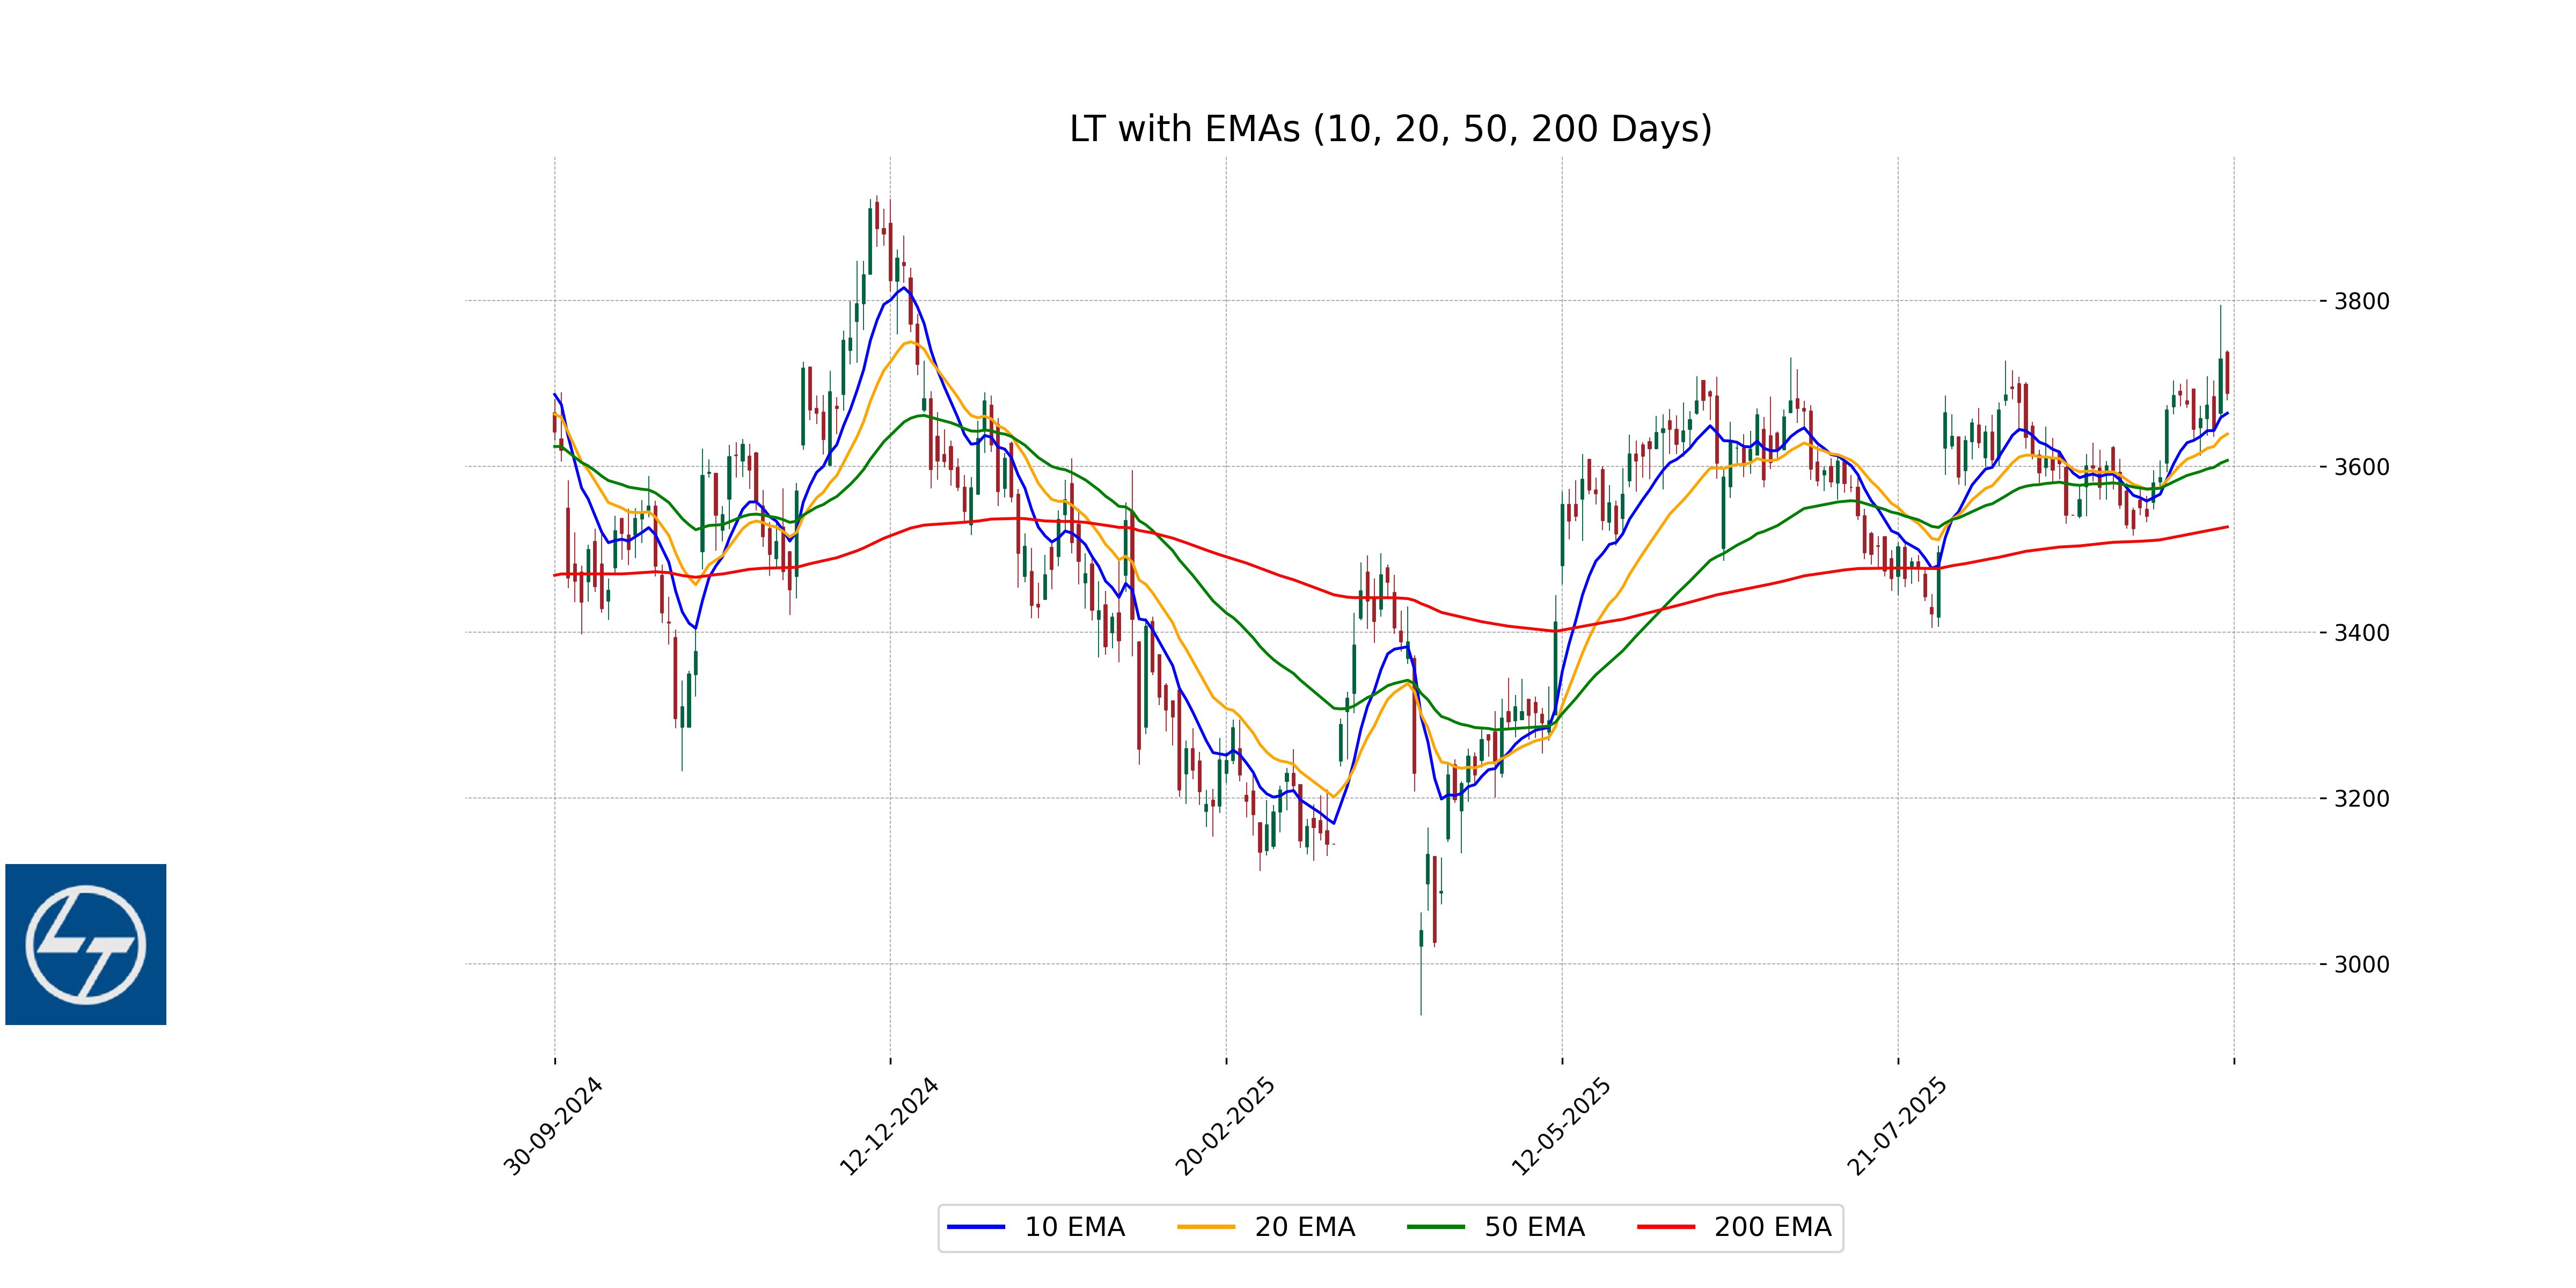
Relationship with Key Moving Averages
Based on the data provided, the closing price of Larsen & Toubro is currently below its 50-day and 200-day exponential moving averages (EMAs), suggesting potential downward momentum. However, it is trading above the 10-day and 20-day EMAs, indicating some short-term strength.
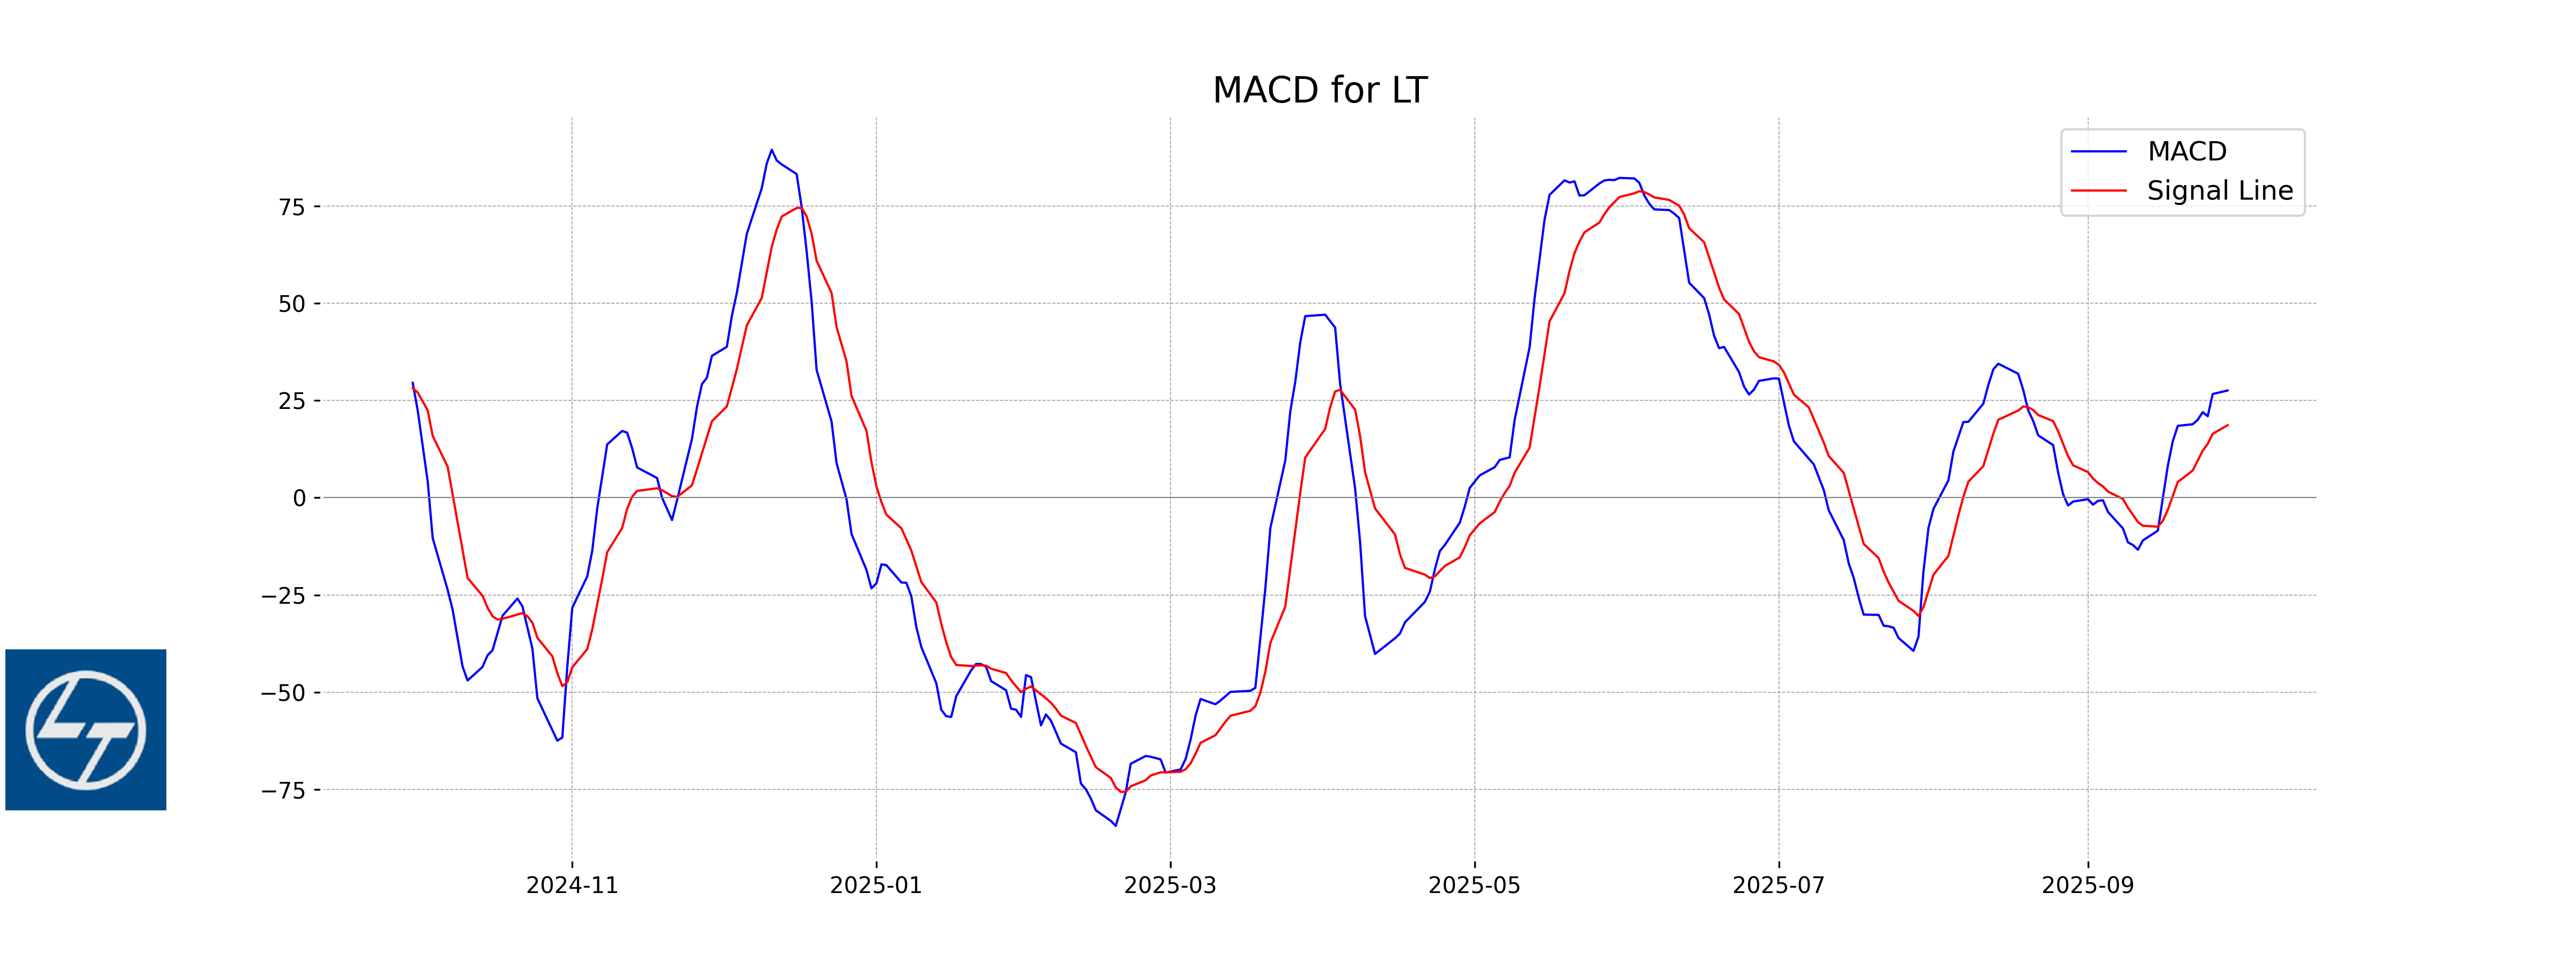
Moving Averages Trend (MACD)
I do not have the specific MACD data for HCL Technologies at the moment. However, a positive and rising MACD line above the MACD signal line generally indicates a bullish trend, while a negative MACD crossing below the signal line suggests a potential bearish trend. For detailed analysis, please check the latest technical charts for HCL Technologies.
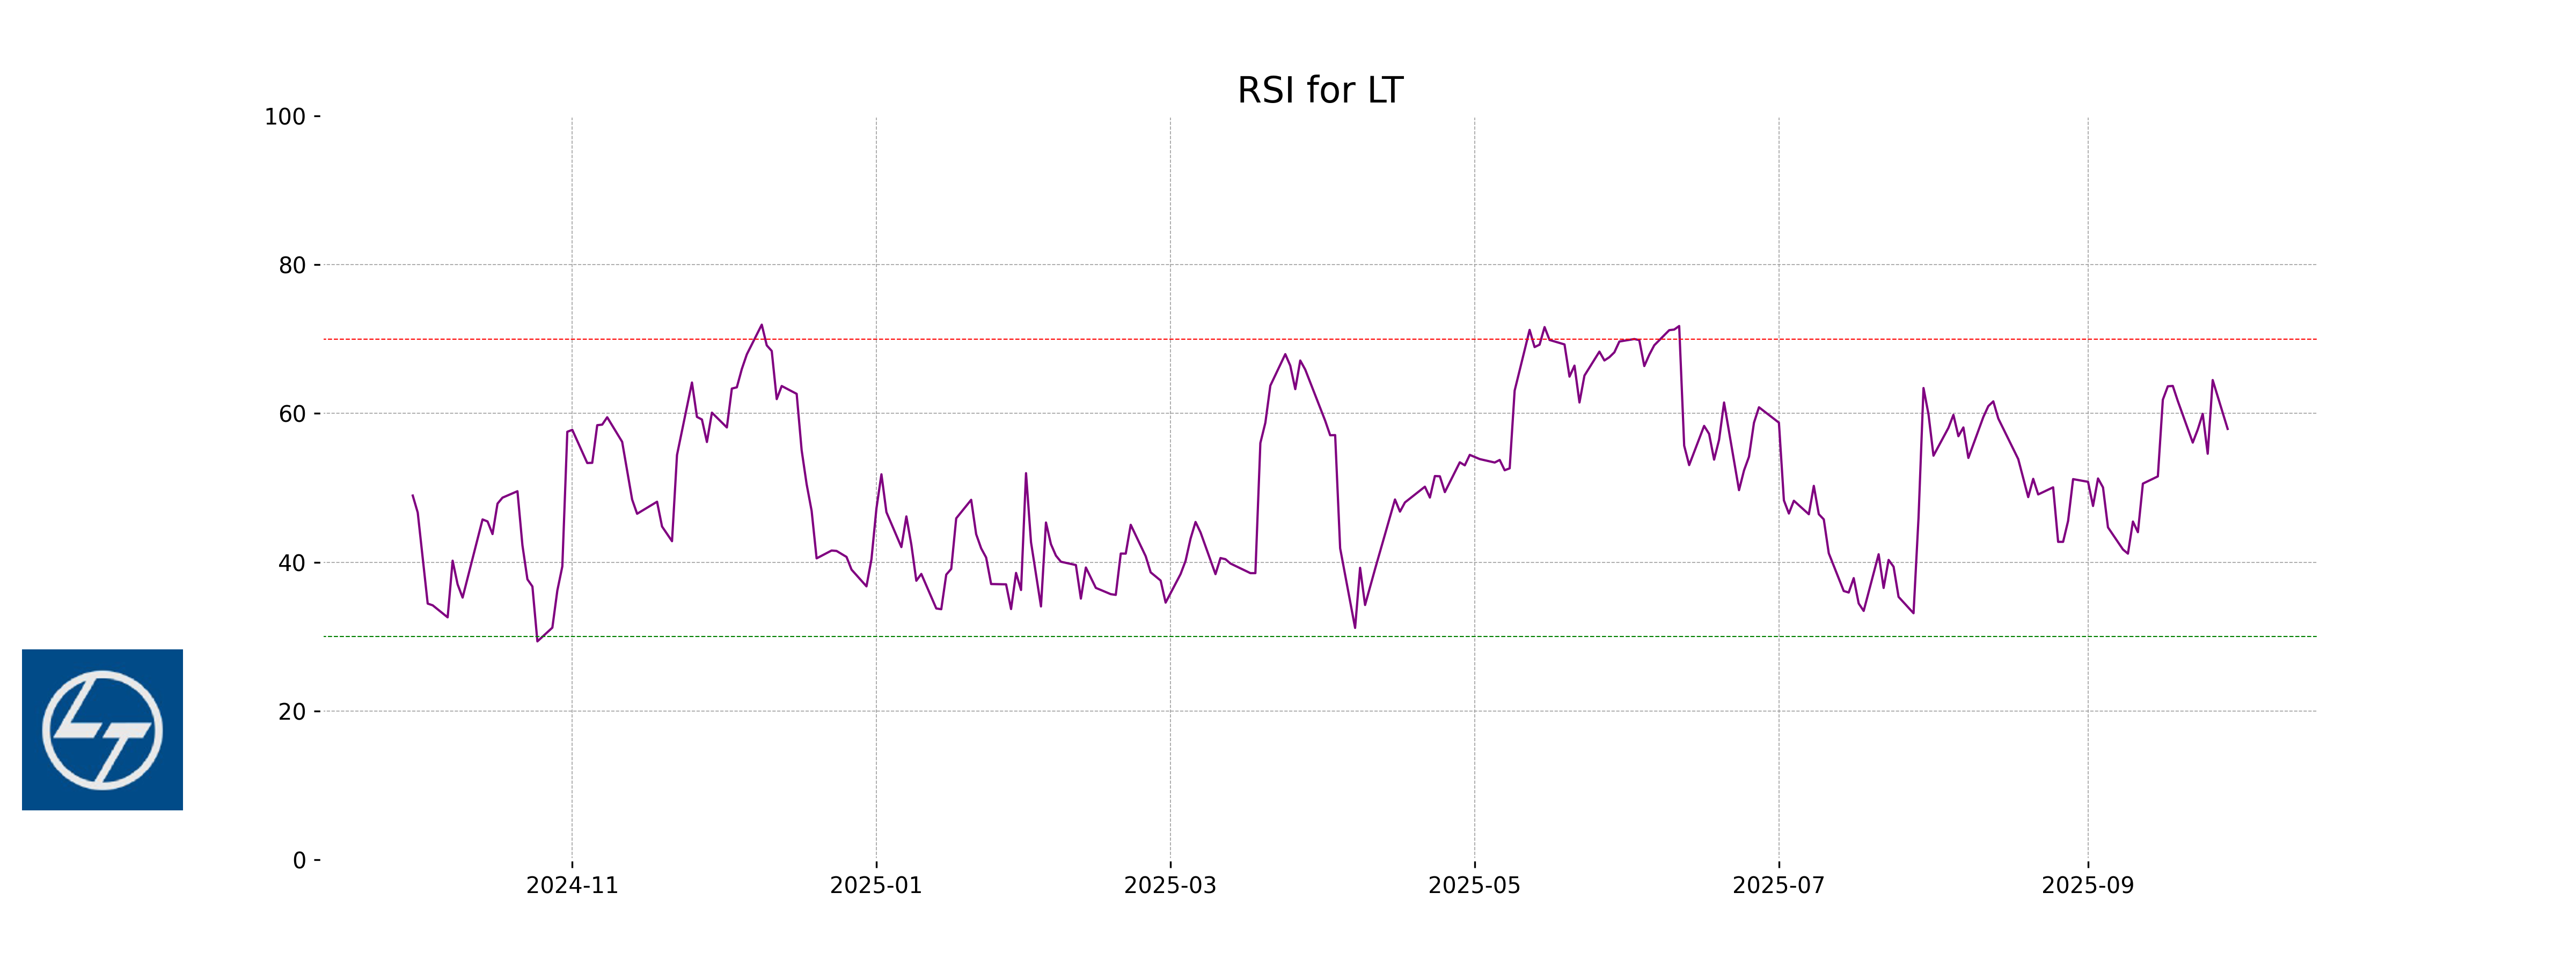
RSI Analysis
RSI (Relative Strength Index) analysis for HCL Technologies indicates whether the stock is in overbought or oversold territory. With an RSI of 57.92, the stock is neither overbought nor oversold, suggesting a neutral momentum. Investors might view this as a sign of market stability, with no significant imminent trend reversal predicted.
Analysis for Maruti Suzuki - September 29, 2025
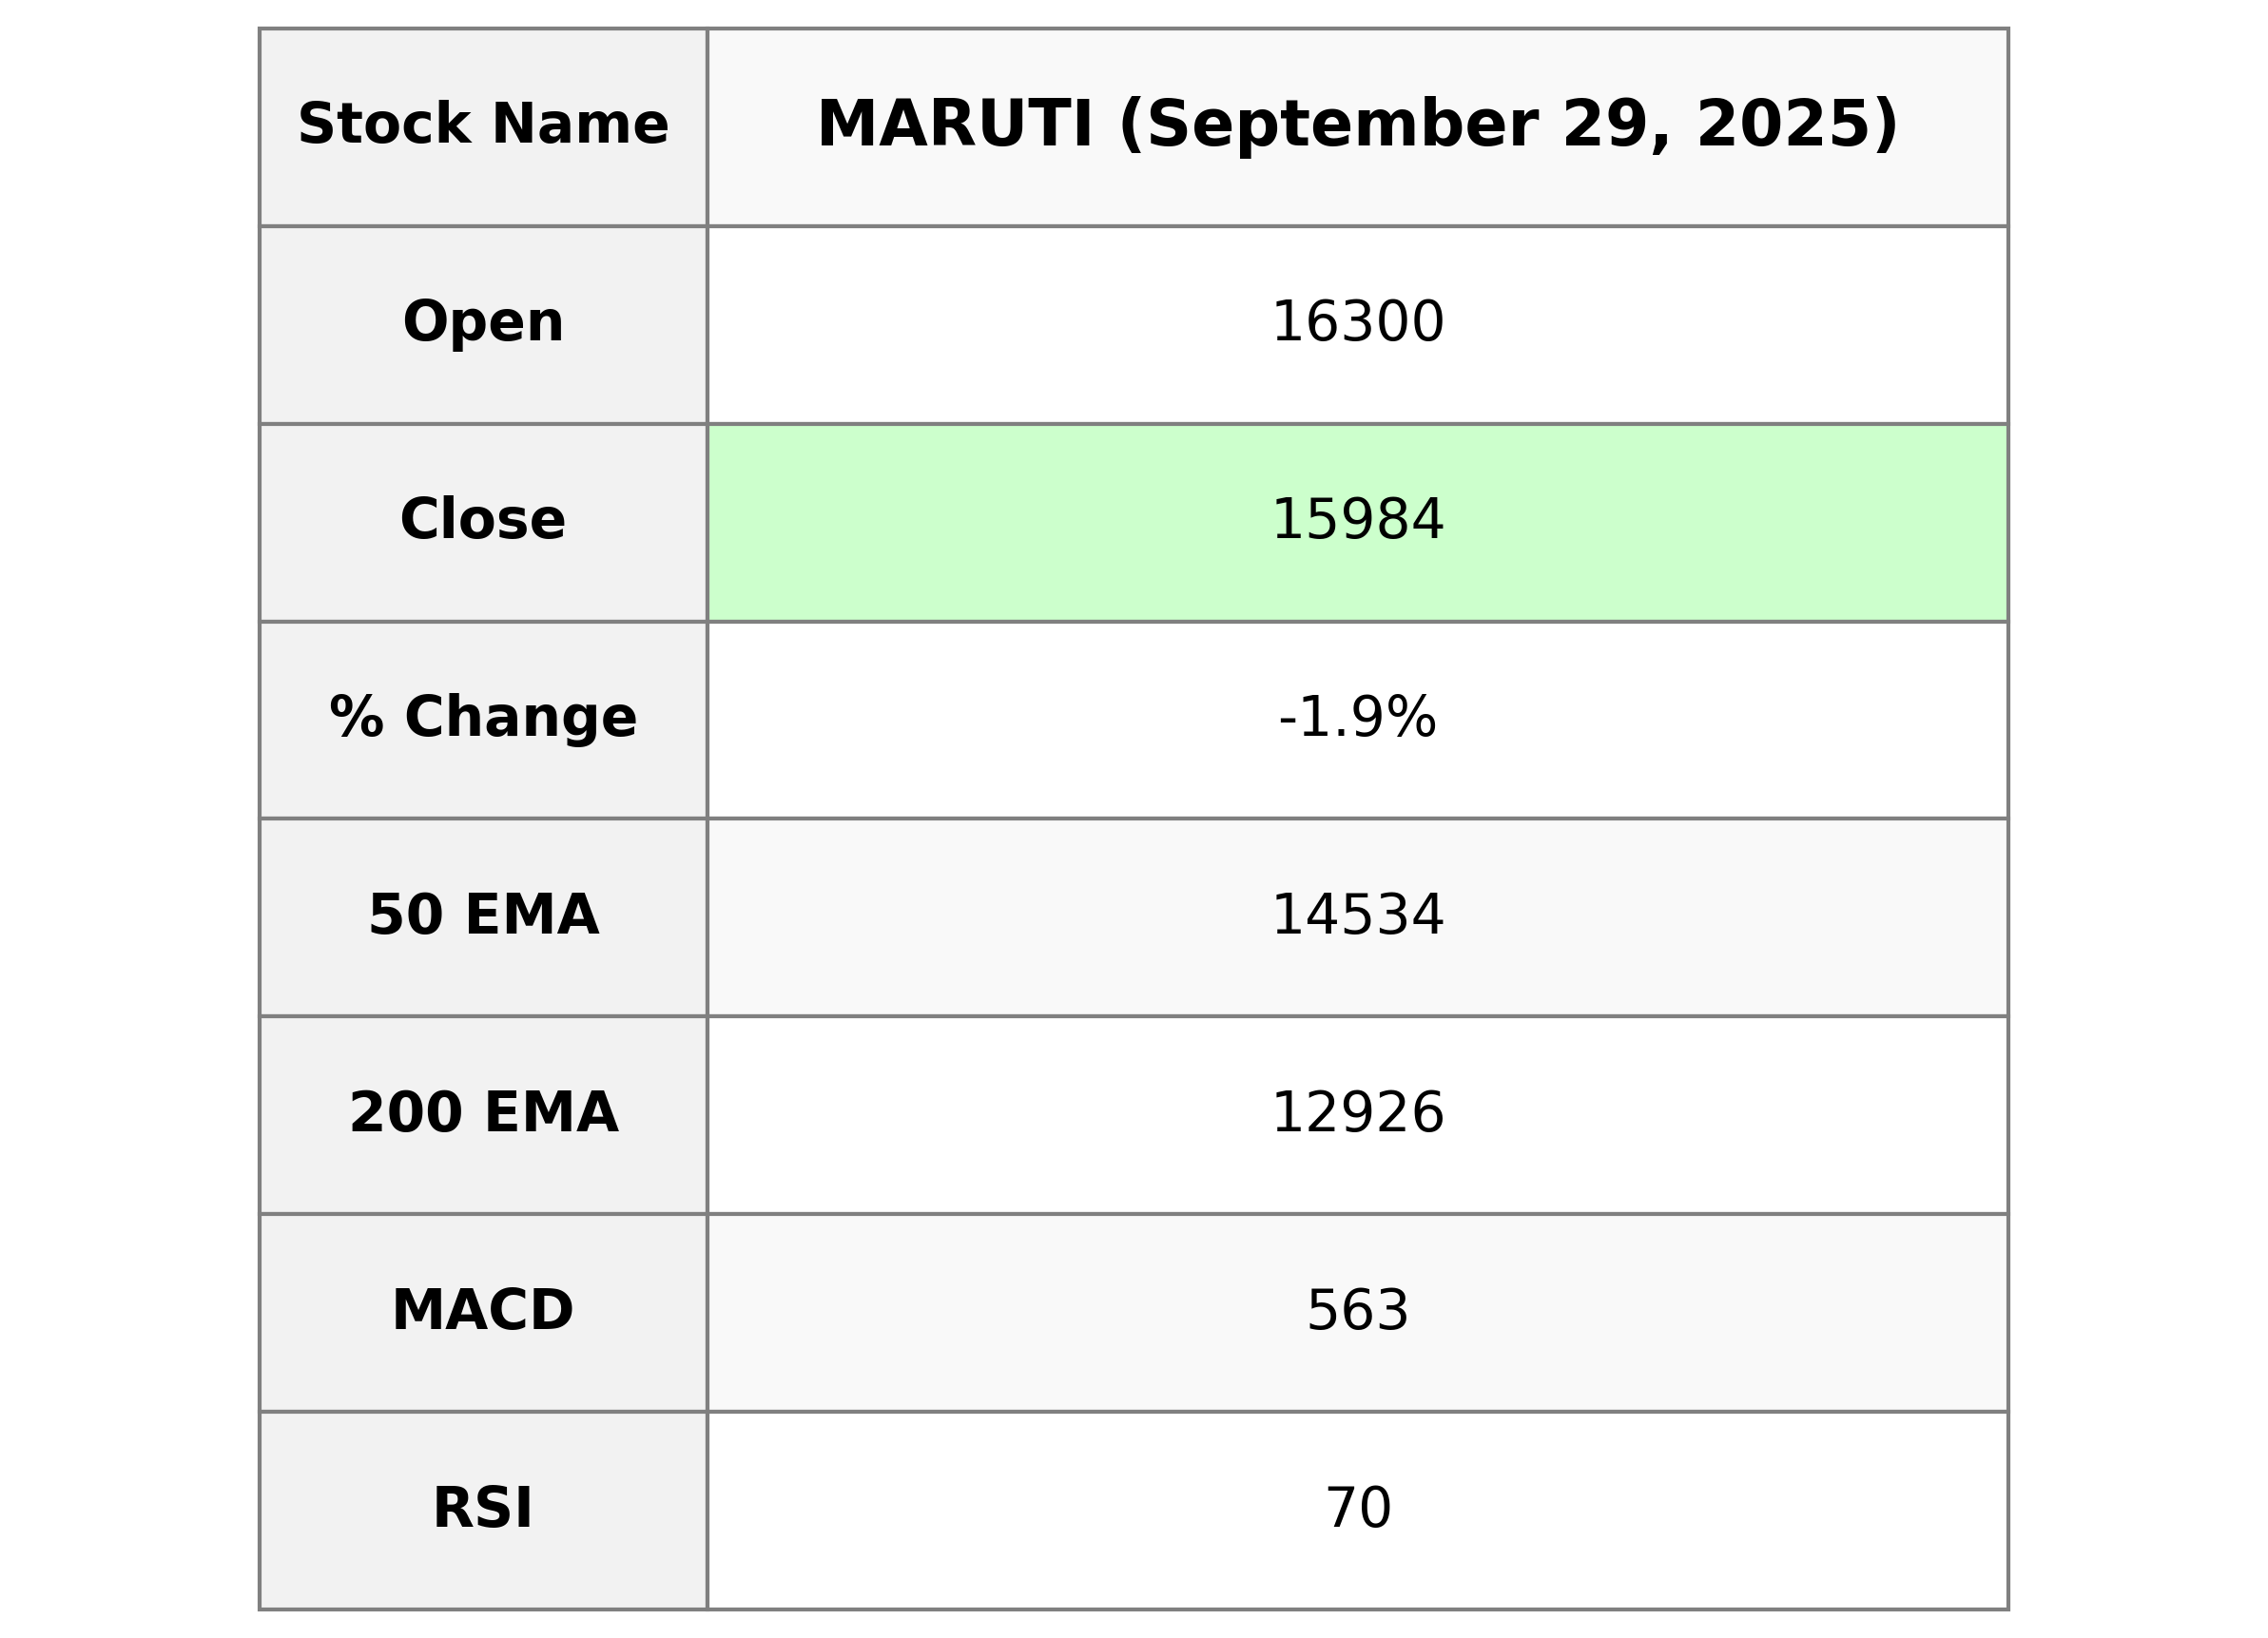
Maruti Suzuki Performance: Maruti Suzuki experienced a decrease in its stock price with a closing value of 15,984, reflecting a 1.85% drop from the previous close of 16,286. The Relative Strength Index (RSI) stands at 69.84, indicating the stock is nearing overbought territory. Despite a dip in daily performance, its overall market position remains robust with a Market Cap of approximately 5 trillion INR and a strong PE Ratio of 34.56, signaling investor confidence in its long-term growth potential within the Auto Manufacturers industry.
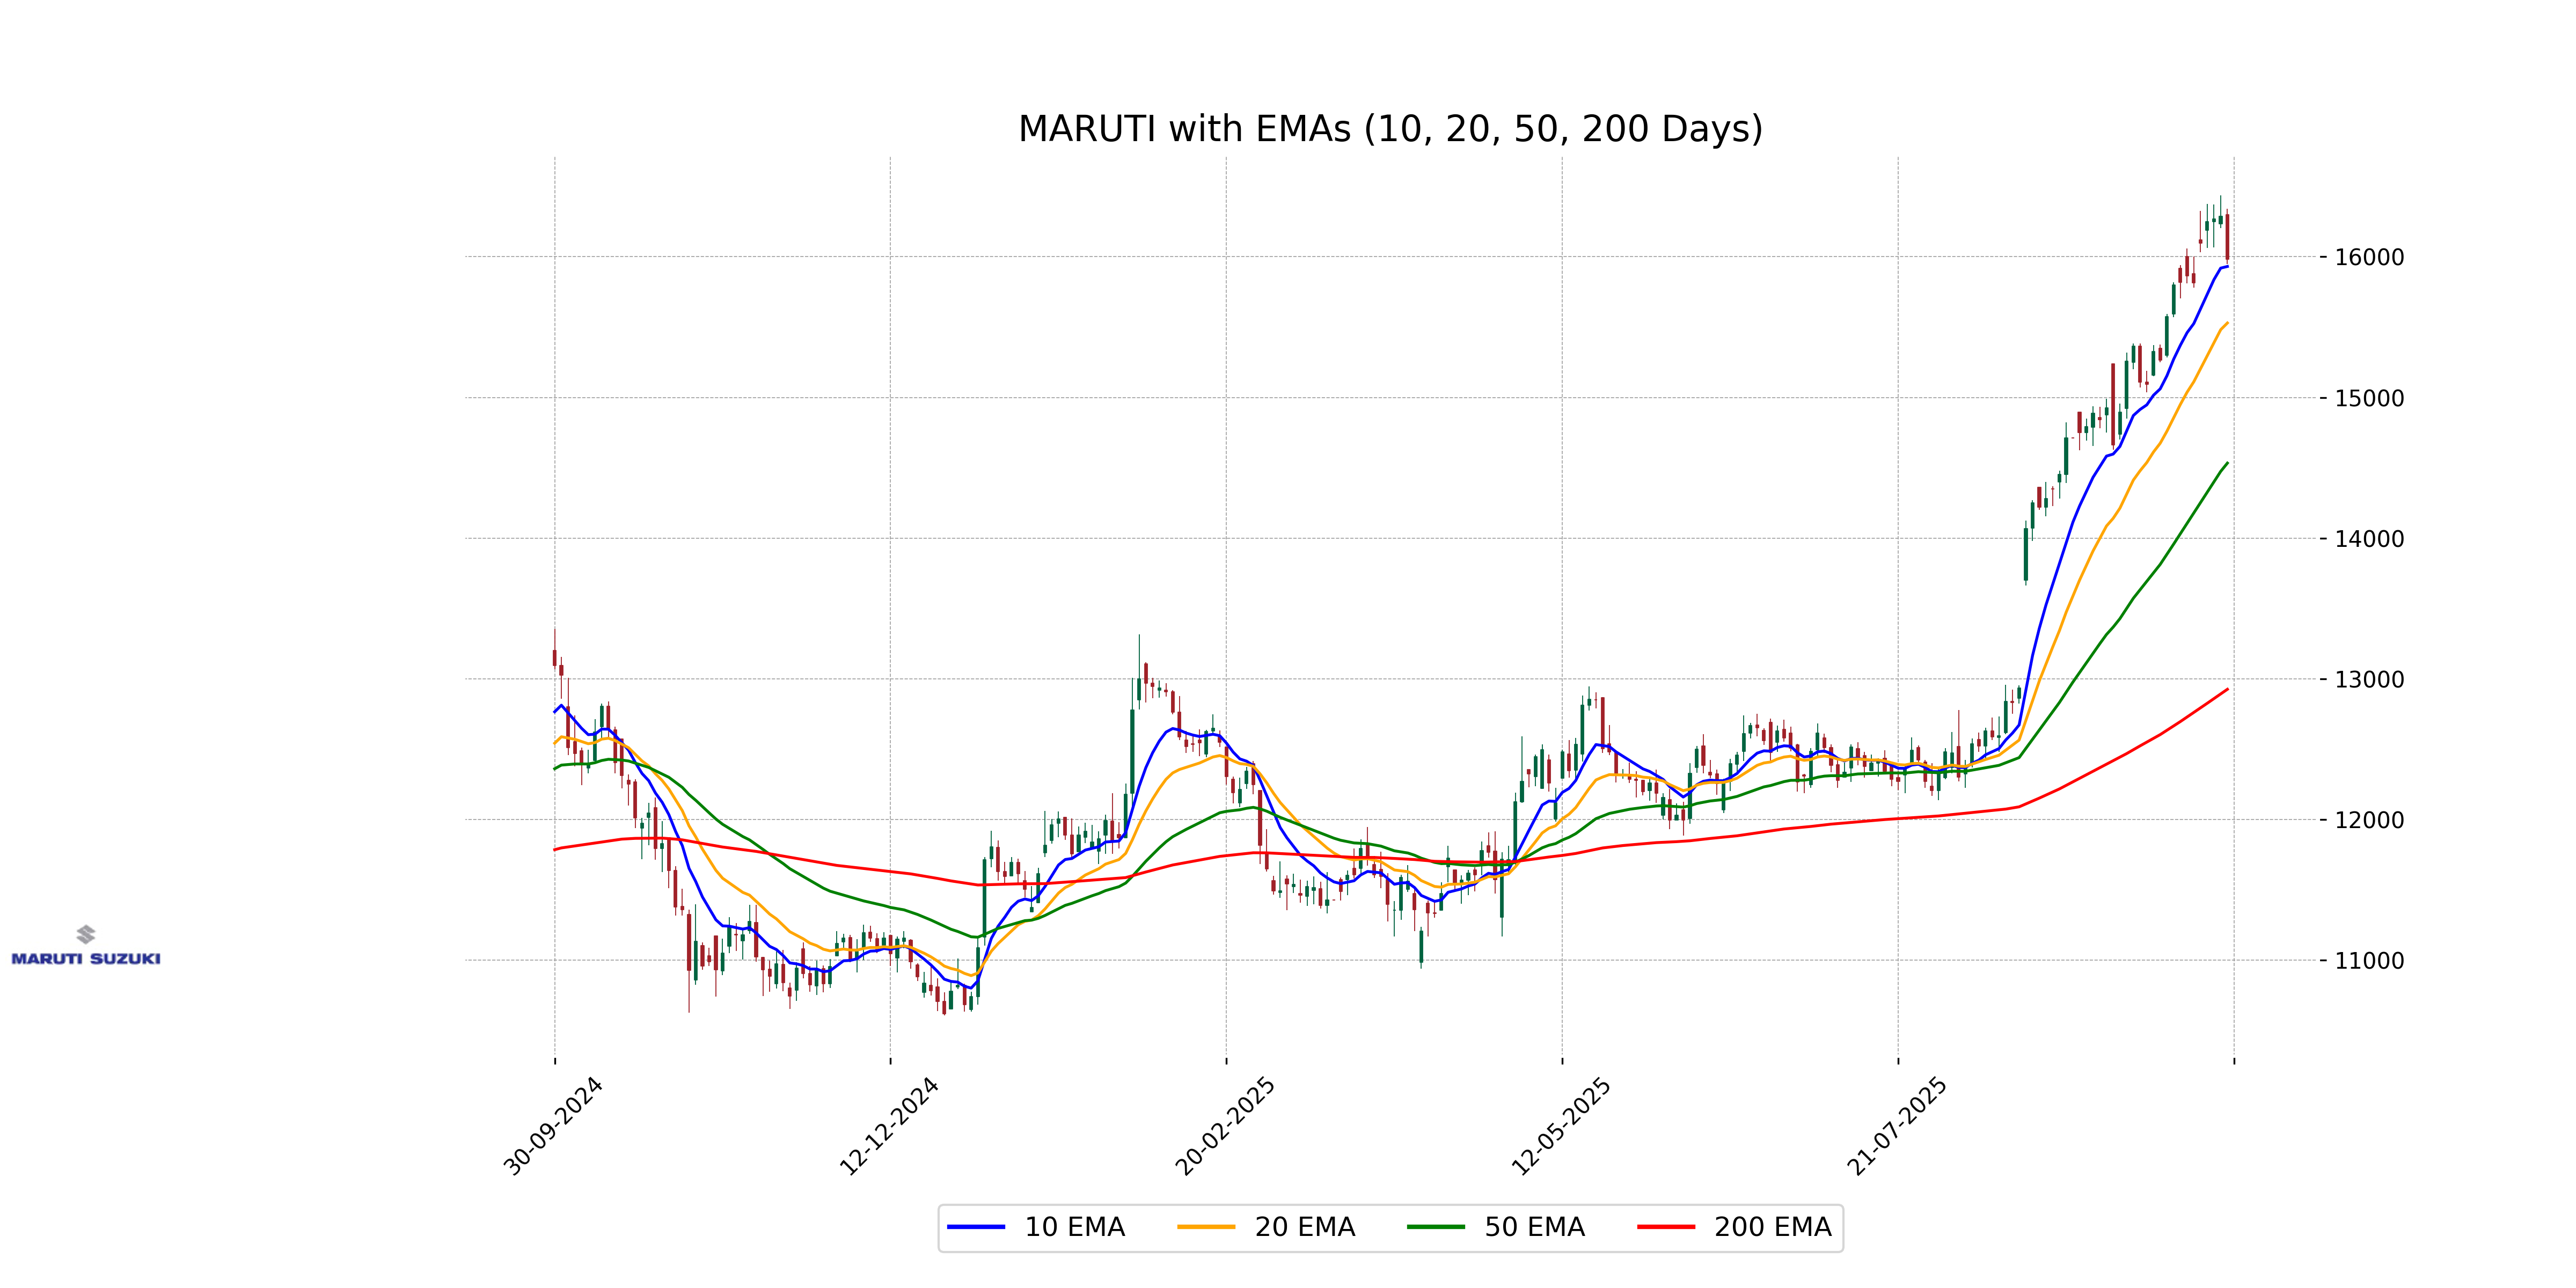
Relationship with Key Moving Averages
The current closing price of Maruti Suzuki at 15,984 is slightly above the 10 EMA of 15,931.02, indicating it traded close to its short-term moving average. It is significantly above the 50 EMA (14,533.61) and the 200 EMA (12,926.20), suggesting a strong bullish trend in the medium to long term relative to past data.
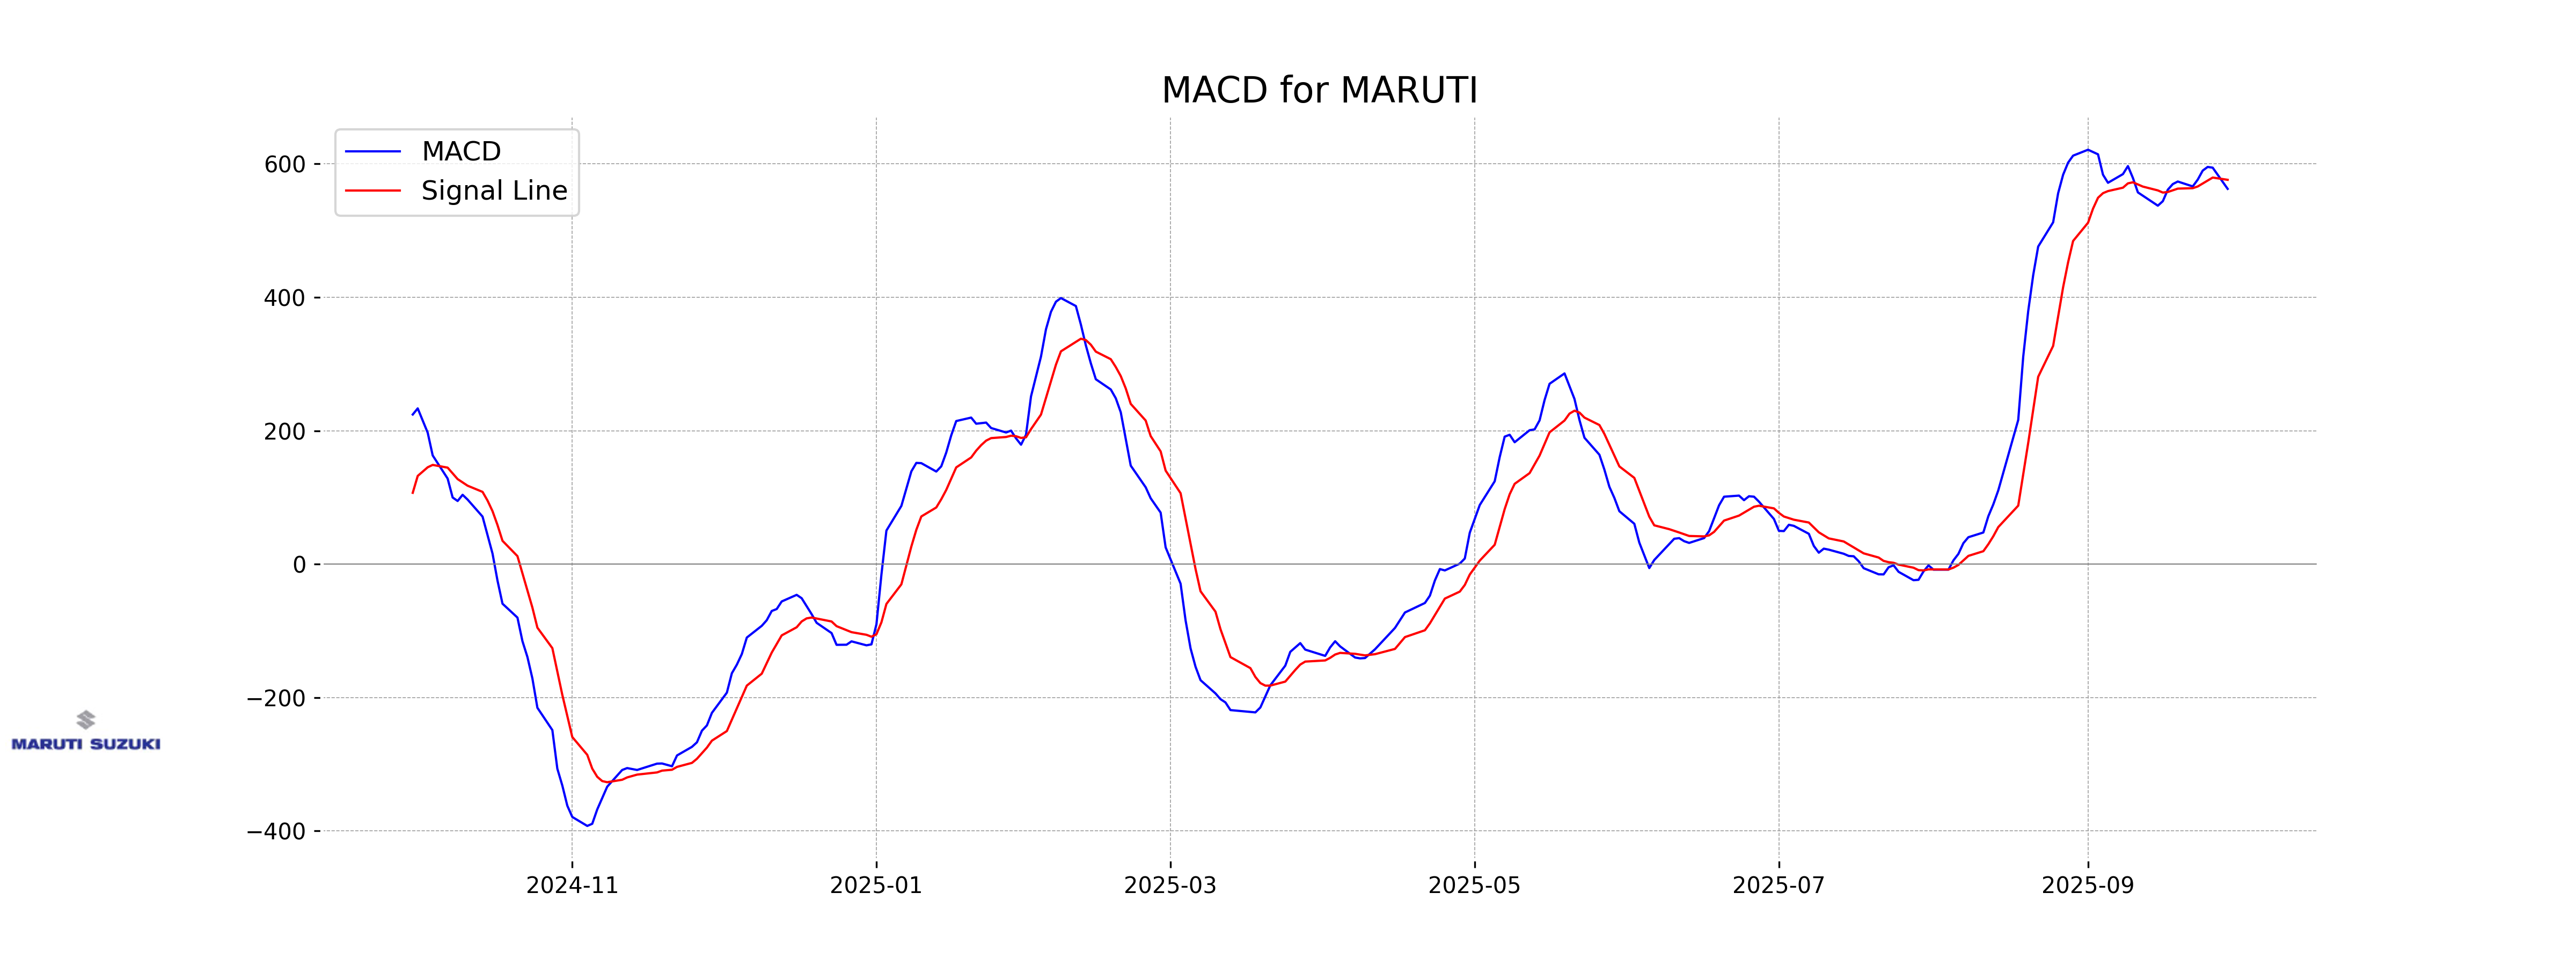
Moving Averages Trend (MACD)
Maruti Suzuki MACD Analysis: The MACD for Maruti Suzuki is 562.58, while the MACD Signal is 576.14. This indicates a potential bearish trend, as the MACD line is below the MACD Signal line, which could suggest a possible weakening of the upward momentum.
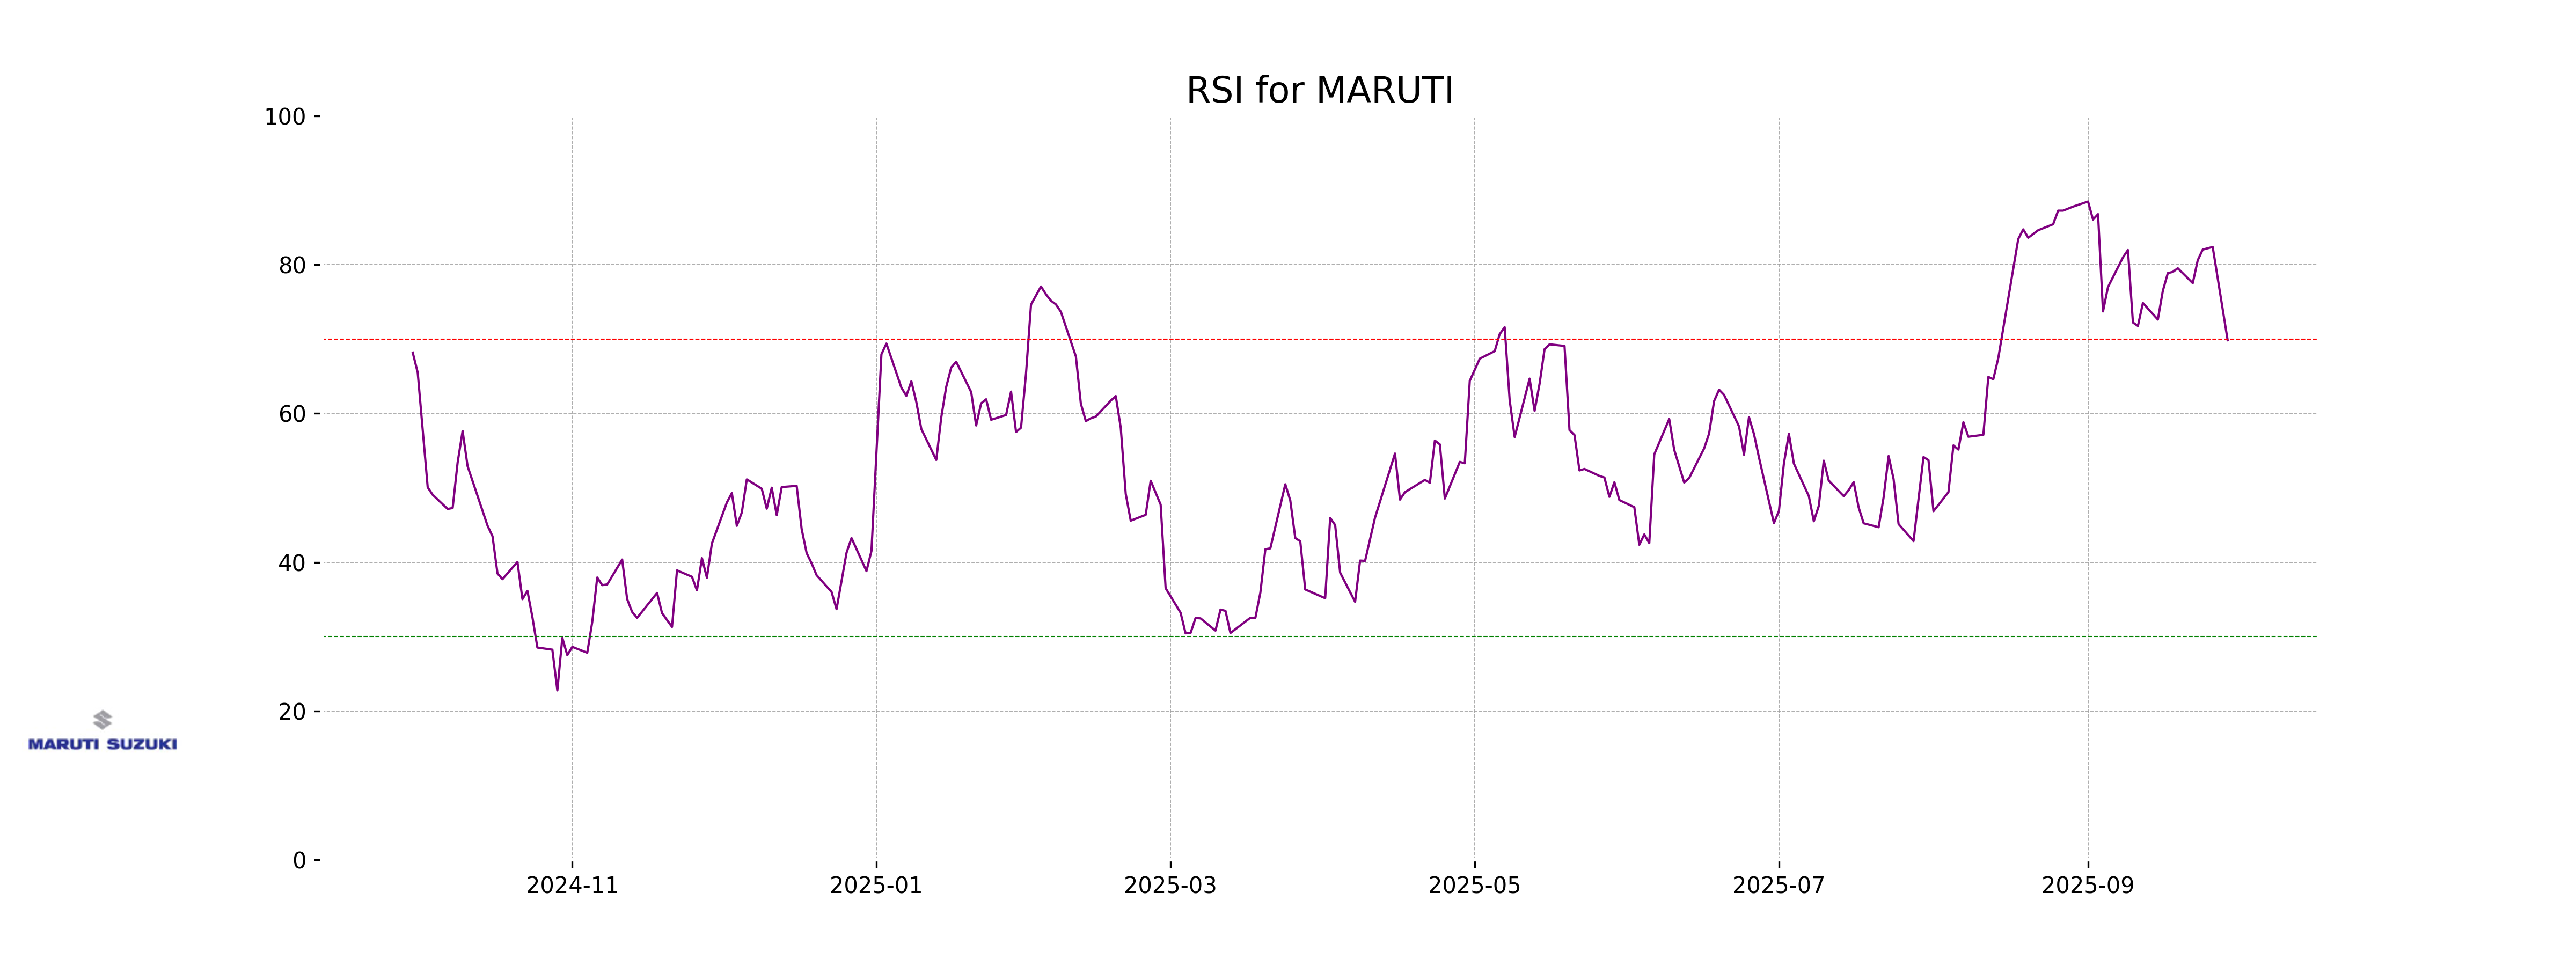
RSI Analysis
The RSI (Relative Strength Index) for Maruti Suzuki is at 69.84, which suggests that the stock is approaching overbought territory, as an RSI above 70 is typically considered overbought. Investors may want to monitor this level to determine if a price correction could be on the horizon.
Up Next
NSE Nifty 50: Top 5 stock losers of September 29, 2025

Honda Activa 6G: Everything You Need to Know Before Buying

How much does a ULIP plan really cost? A break-down of all charges

Centre plans to borrow Rs 8.20 lakh cr from market in first half of FY27

Reliance denies buying Iranian oil amid US sanctions waiver

Premium petrol price up Rs 2, industrial diesel up Rs 22; no change in normal petrol, diesel rates

More videos

India's GDP expected to register over 8 pc growth in Sep-Dec: Report

Govt announces seven measures to help boost exports

RBI keeps interest rates on hold after US trade deal boosts outlook

RBI proposes to compensate customers up to Rs 25,000 loss due to fraud

RBI raises GDP growth projection of Q1, Q2 of FY27

RBI pauses rate cuts, retains interest rate at 5.25 pc

Rupee jumps 122 paise to close at 90.27 against US dollar on India-US trade deal

Stock markets cheer India-US trade deal: Sensex, Nifty surge 2.5 pc

UPI transactions hit record high of Rs 230 lakh crore in 2025-26 till Dec: Govt

Explained: India-US trade deal, tariffs and trade benefits