


Highlights
- JSW Steel sees steep drop, RSI weakens further
- Hero MotoCorp, Bajaj Auto trade below EMAs
- HDFC Life shows resilience despite price decline
Latest news

Exit poll predicts big BJP win in Bengal, Assam; return of DMK in TN, dead heat in Kerala

River cruise boat overturns in MP's Jabalpur district; 4 dead, 15 to 18 missing

Vaishnaw flags off Jammu-Srinagar Vande Bharat Express, promises rail link to Uri

Will win 226 seats; exit polls predictions made at BJP's behest to demoralise TMC workers: Mamata

OnePlus Pad 4 Review: This Might Be the Android Tablet to Beat

AI, aesthetics drive India's smartphone market, consumers willing to pay more for preferred choices: Report

Ammucare Advances a 22-Year Humanitarian Legacy with the Launch of Compassion on Wheels

PhonePe surpasses 700 million registered users, accelerates growth momentum
NSE Nifty 50: Top 5 stock losers of May 2, 2025


In this article, we will explore the technical indicators of some of the low-performing stocks on the Indian stock market, including BAJAJ-AUTO, EICHERMOT, HDFCLIFE, HEROMOTOCO, and JSWSTEEL.
By looking at these stocks through the lens of key technical factors, we aim to better understand their price movements, trends, and potential future performance.

Analysis for Bajaj Auto - May 02, 2025

Bajaj Auto Performance: Bajaj Auto closed at 7836.5, experiencing a decline of 2.41% from its previous close of 8030, with a points change of -193.5. The trading volume was 455,829 units, and it traded between a low of 7803 and a high of 8086. The 50-day EMA of 8071.48 and the 200-day EMA of 8689.60 indicate that the stock is currently below key moving averages, signaling potential bearish sentiment. The RSI is at 45.47, suggesting that the stock is not in overbought or oversold territory. The MACD of 31.23 is above the signal line, which may indicate a mild bullish trend. The company has a market cap of 2,188,405,243,904 INR, a P/E ratio of 29.13, and an EPS of 269.01, categorized in the Consumer Cyclical sector and Auto Manufacturers industry in India.

Relationship with Key Moving Averages
Bajaj Auto's closing price of 7836.5 is below both its 10-day EMA of 8013.38 and 50-day EMA of 8071.48, indicating a short-term bearish trend. Additionally, it is significantly below the 200-day EMA of 8689.61, suggesting a longer-term bearish outlook as well.
Moving Averages Trend (MACD)
Bajaj Auto's current MACD (31.23) is above its MACD Signal line (27.89), suggesting a bullish momentum despite the overall price decline. The MACD being positive indicates that the shorter-term EMA is above the longer-term EMA, typically a sign of potential upward movement. However, considering the negative price change, it's important to watch for further confirmations before taking action.

RSI Analysis
Bajaj Auto's RSI is currently at 45.47, indicating a neutral stance, as it is below the commonly overbought threshold of 70 and above the oversold threshold of 30. This suggests that the stock is neither in a strong buying nor selling phase, with no significant momentum in either direction presently.

Analysis for Eicher Motors - May 02, 2025

Eicher Motors recently experienced a decline in its stock performance with a closing price of 5437.5, marking a decrease of 2.33% compared to its previous close of 5567. The stock price fluctuated between a low of 5376 and a high of 5560 with a significant volume of 695,552 shares traded. Currently, the stock is slightly below its 10-day EMA, suggesting short-term downward pressure, although it remains above its 50-day and 200-day EMAs, indicating a generally strong long-term trend. The RSI is at 49.41, suggesting the stock is neither overbought nor oversold. With a market cap of approximately 1.5 trillion INR, Eicher Motors holds a robust position in the Auto Manufacturers sector in India.

Relationship with Key Moving Averages
Eicher Motors' current close of 5437.5 is below the 10 EMA of 5561.86 and the 20 EMA of 5498.76, indicating short-term bearish sentiment. However, it remains above the 50 EMA of 5325.96, suggesting longer-term support and potential stability. Additionally, being above the 200 EMA of 4956.04 indicates sustained strength over a longer duration.
Moving Averages Trend (MACD)
The MACD for Eicher Motors is currently below the MACD Signal, with values 97.96 and 120.97 respectively. This indicates a bearish signal, suggesting that the stock might be experiencing a downtrend. A bearish MACD crossover occurs when the MACD falls below the signal line, indicating momentum towards potential further price decline.

RSI Analysis
The RSI of Eicher Motors is 49.41, indicating a neutral momentum as it is close to the midpoint of 50. This suggests that the stock is neither overbought nor oversold, reflecting a balanced sentiment among traders.

Analysis for HDFC LIFE - May 02, 2025
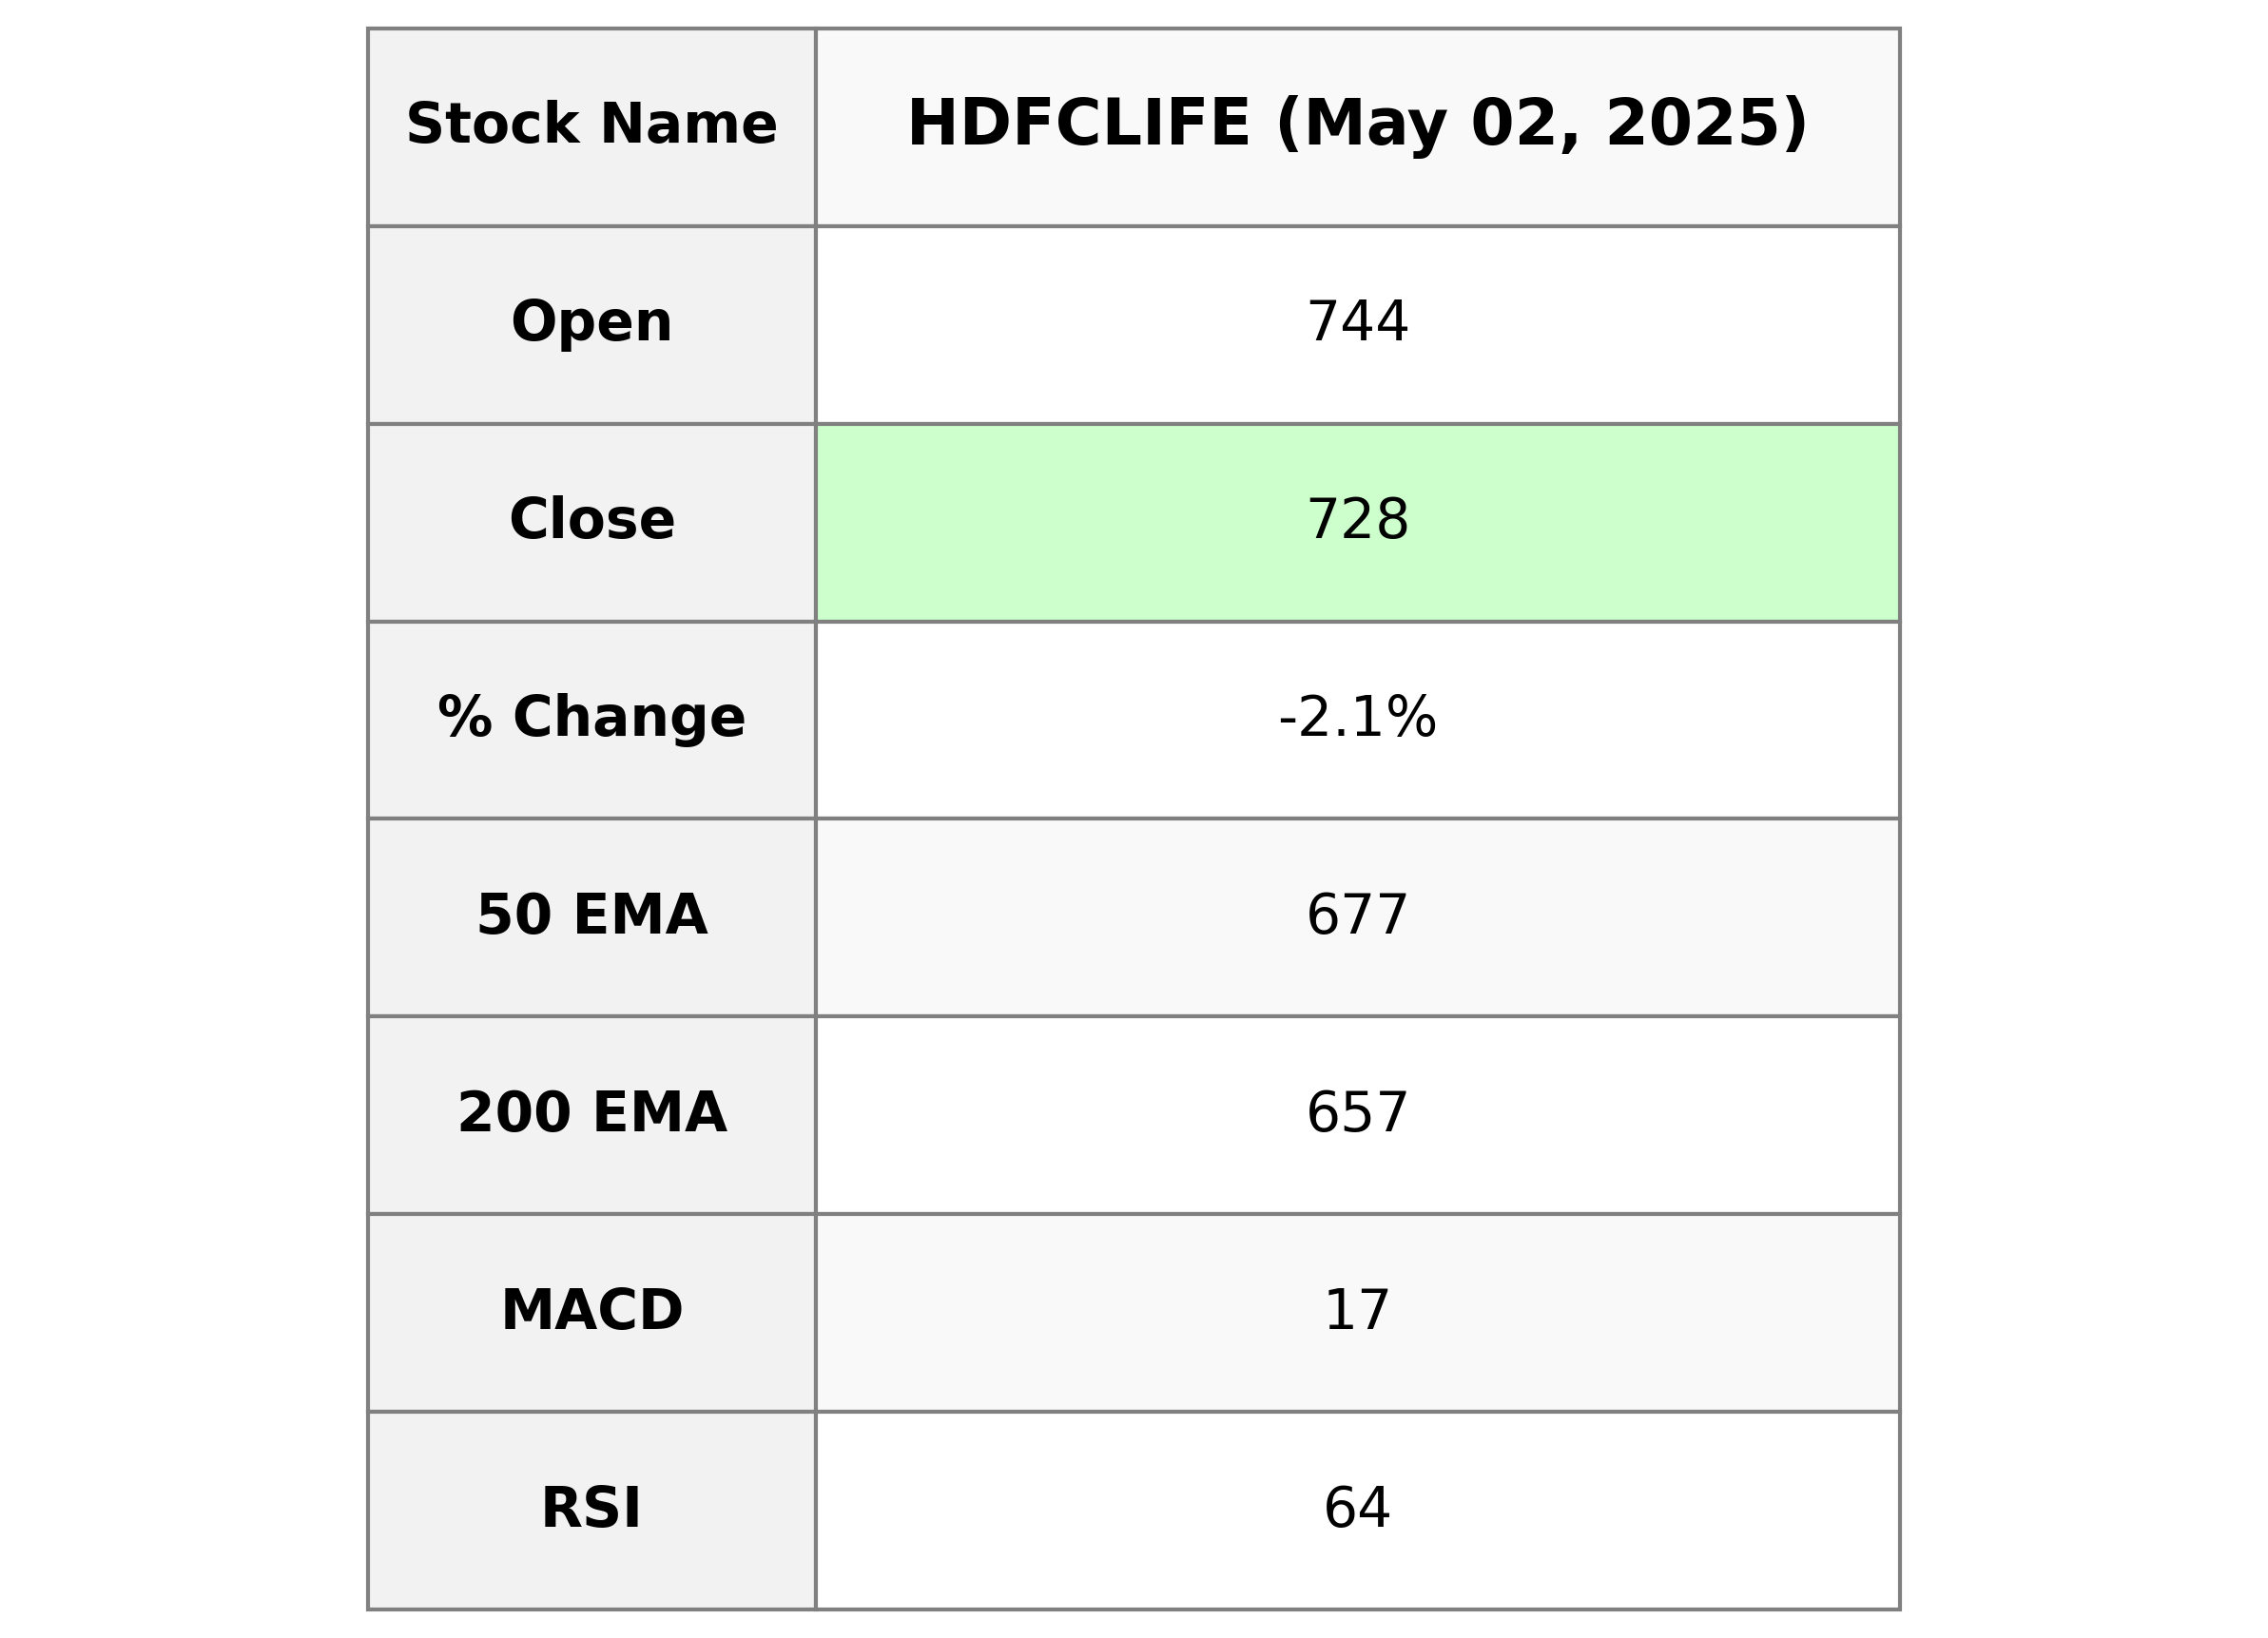
HDFC LIFE Performance HDFC LIFE's stock saw a decrease of approximately 2.14% in its closing price, ending at 727.75, compared to its previous close. Despite the dip, the stock's technical indicators such as the RSI and MACD suggest it is still on a positive momentum with values indicating a moderately strong trend. Additionally, with a PE Ratio of 86.64 and a sizable market cap, the company remains a significant player in the Indian financial services sector, specifically in life insurance.

Relationship with Key Moving Averages
HDFC Life's current closing price of 727.75 is above both its 200 EMA of 657.03 and 50 EMA of 677.36, suggesting an overall uptrend. However, it is slightly above the 10 EMA of 716.32 and significantly above the 20 EMA of 703.56, indicating a short-term bullish momentum.
Moving Averages Trend (MACD)
HDFC LIFE's MACD analysis shows that the MACD line is above the signal line, indicating a bullish trend. Although the percentage change is negative, the presence of an RSI at 64.49 suggests that the stock is not overbought, implying potential upward momentum.

RSI Analysis
RSI Analysis for HDFC Life: The RSI value is 64.49, which indicates that the stock is approaching the overbought zone but isn't quite there yet. This suggests that there may be some upward momentum, though caution is advised as the stock nears an RSI of 70.

Analysis for Hero MotoCorp - May 02, 2025

Hero MotoCorp closed at 3740.5, showing a decline of 2.27% compared to its previous close of 3827.4. The stock experienced a high of 3914.0 and a low of 3725.0 during the trading session with a volume of over 1 million shares. Despite the negative percentage change, Hero MotoCorp maintains a strong market presence with a market cap of 748 billion INR, contributing to the consumer cyclical sector in India.

Relationship with Key Moving Averages
The current close price of Hero MotoCorp at 3740.5 is below its 50-day EMA (3810.78) and significantly below its 200-day EMA (4229.52), indicating potential bearish momentum. However, it is close to the 10-day EMA (3827.30), suggesting a short-term correction might be possible.
Moving Averages Trend (MACD)
Hero MotoCorp's MACD stands at 37.49, slightly above the MACD Signal of 36.15, indicating a potential bullish momentum. The positive divergence suggests that there might be short-term buying interest, though overall performance should be monitored due to current negative price change.

RSI Analysis
The RSI (Relative Strength Index) of Hero MotoCorp is 47.19, indicating that the stock is neither overbought nor oversold. An RSI below 50 suggests that the stock has been experiencing more declining days compared to advancing days, reflecting a neutral to slightly bearish sentiment.

Analysis for JSW Steel - May 02, 2025

JSW Steel Performance: JSW Steel experienced a notable decline in its stock price, with a 5.50% drop, closing at 973.20 compared to its previous close of 1029.80. Despite a relatively high trading volume, the stock is showing bearish signals with an RSI of 40.41, and both the short and long-term EMAs indicating potential downward momentum. The stock, part of the Basic Materials sector in the Steel industry, is trading below its short-term EMAs and has a high PE ratio of 72.14, pointing towards a potential overvaluation.

Relationship with Key Moving Averages
Relationship with Key Moving Averages for JSW Steel: The closing price of JSW Steel at 973.20 is below its 50-day EMA of 1005.85 and its 10-day EMA of 1020.19, indicating a short-term bearish trend. However, it remains slightly above the 200-day EMA of 958.68, suggesting potential long-term support.
Moving Averages Trend (MACD)
JSW Steel's MACD analysis indicates that the MACD line (2.95) is below the MACD Signal line (5.47), suggesting a bearish momentum. This implies that the stock may be experiencing downward pressure in the short term. Additionally, the RSI of 40.41 suggests it's approaching oversold territory, which could indicate a potential reversal or continued weakness.

RSI Analysis
JSW Steel's RSI (Relative Strength Index) is currently at 40.41, indicating that it is in a neutral to slightly oversold territory. An RSI below 30 typically signals that a stock is oversold, so JSW Steel is approaching this zone but not quite there, suggesting potential for future buying interest if it continues to decline.

Up Next
NSE Nifty 50: Top 5 stock losers of May 2, 2025

Centre plans to borrow Rs 8.20 lakh cr from market in first half of FY27

Reliance denies buying Iranian oil amid US sanctions waiver

Premium petrol price up Rs 2, industrial diesel up Rs 22; no change in normal petrol, diesel rates

India's GDP expected to register over 8 pc growth in Sep-Dec: Report

Govt announces seven measures to help boost exports

More videos

RBI keeps interest rates on hold after US trade deal boosts outlook

RBI proposes to compensate customers up to Rs 25,000 loss due to fraud

RBI raises GDP growth projection of Q1, Q2 of FY27

RBI pauses rate cuts, retains interest rate at 5.25 pc

Rupee jumps 122 paise to close at 90.27 against US dollar on India-US trade deal

Stock markets cheer India-US trade deal: Sensex, Nifty surge 2.5 pc

UPI transactions hit record high of Rs 230 lakh crore in 2025-26 till Dec: Govt

Explained: India-US trade deal, tariffs and trade benefits

Trade deal with US adds momentum to India's growth ambition: Industry leaders

Rupee jumps 119 paise to 90.30 against the US dollar on India-US trade deal