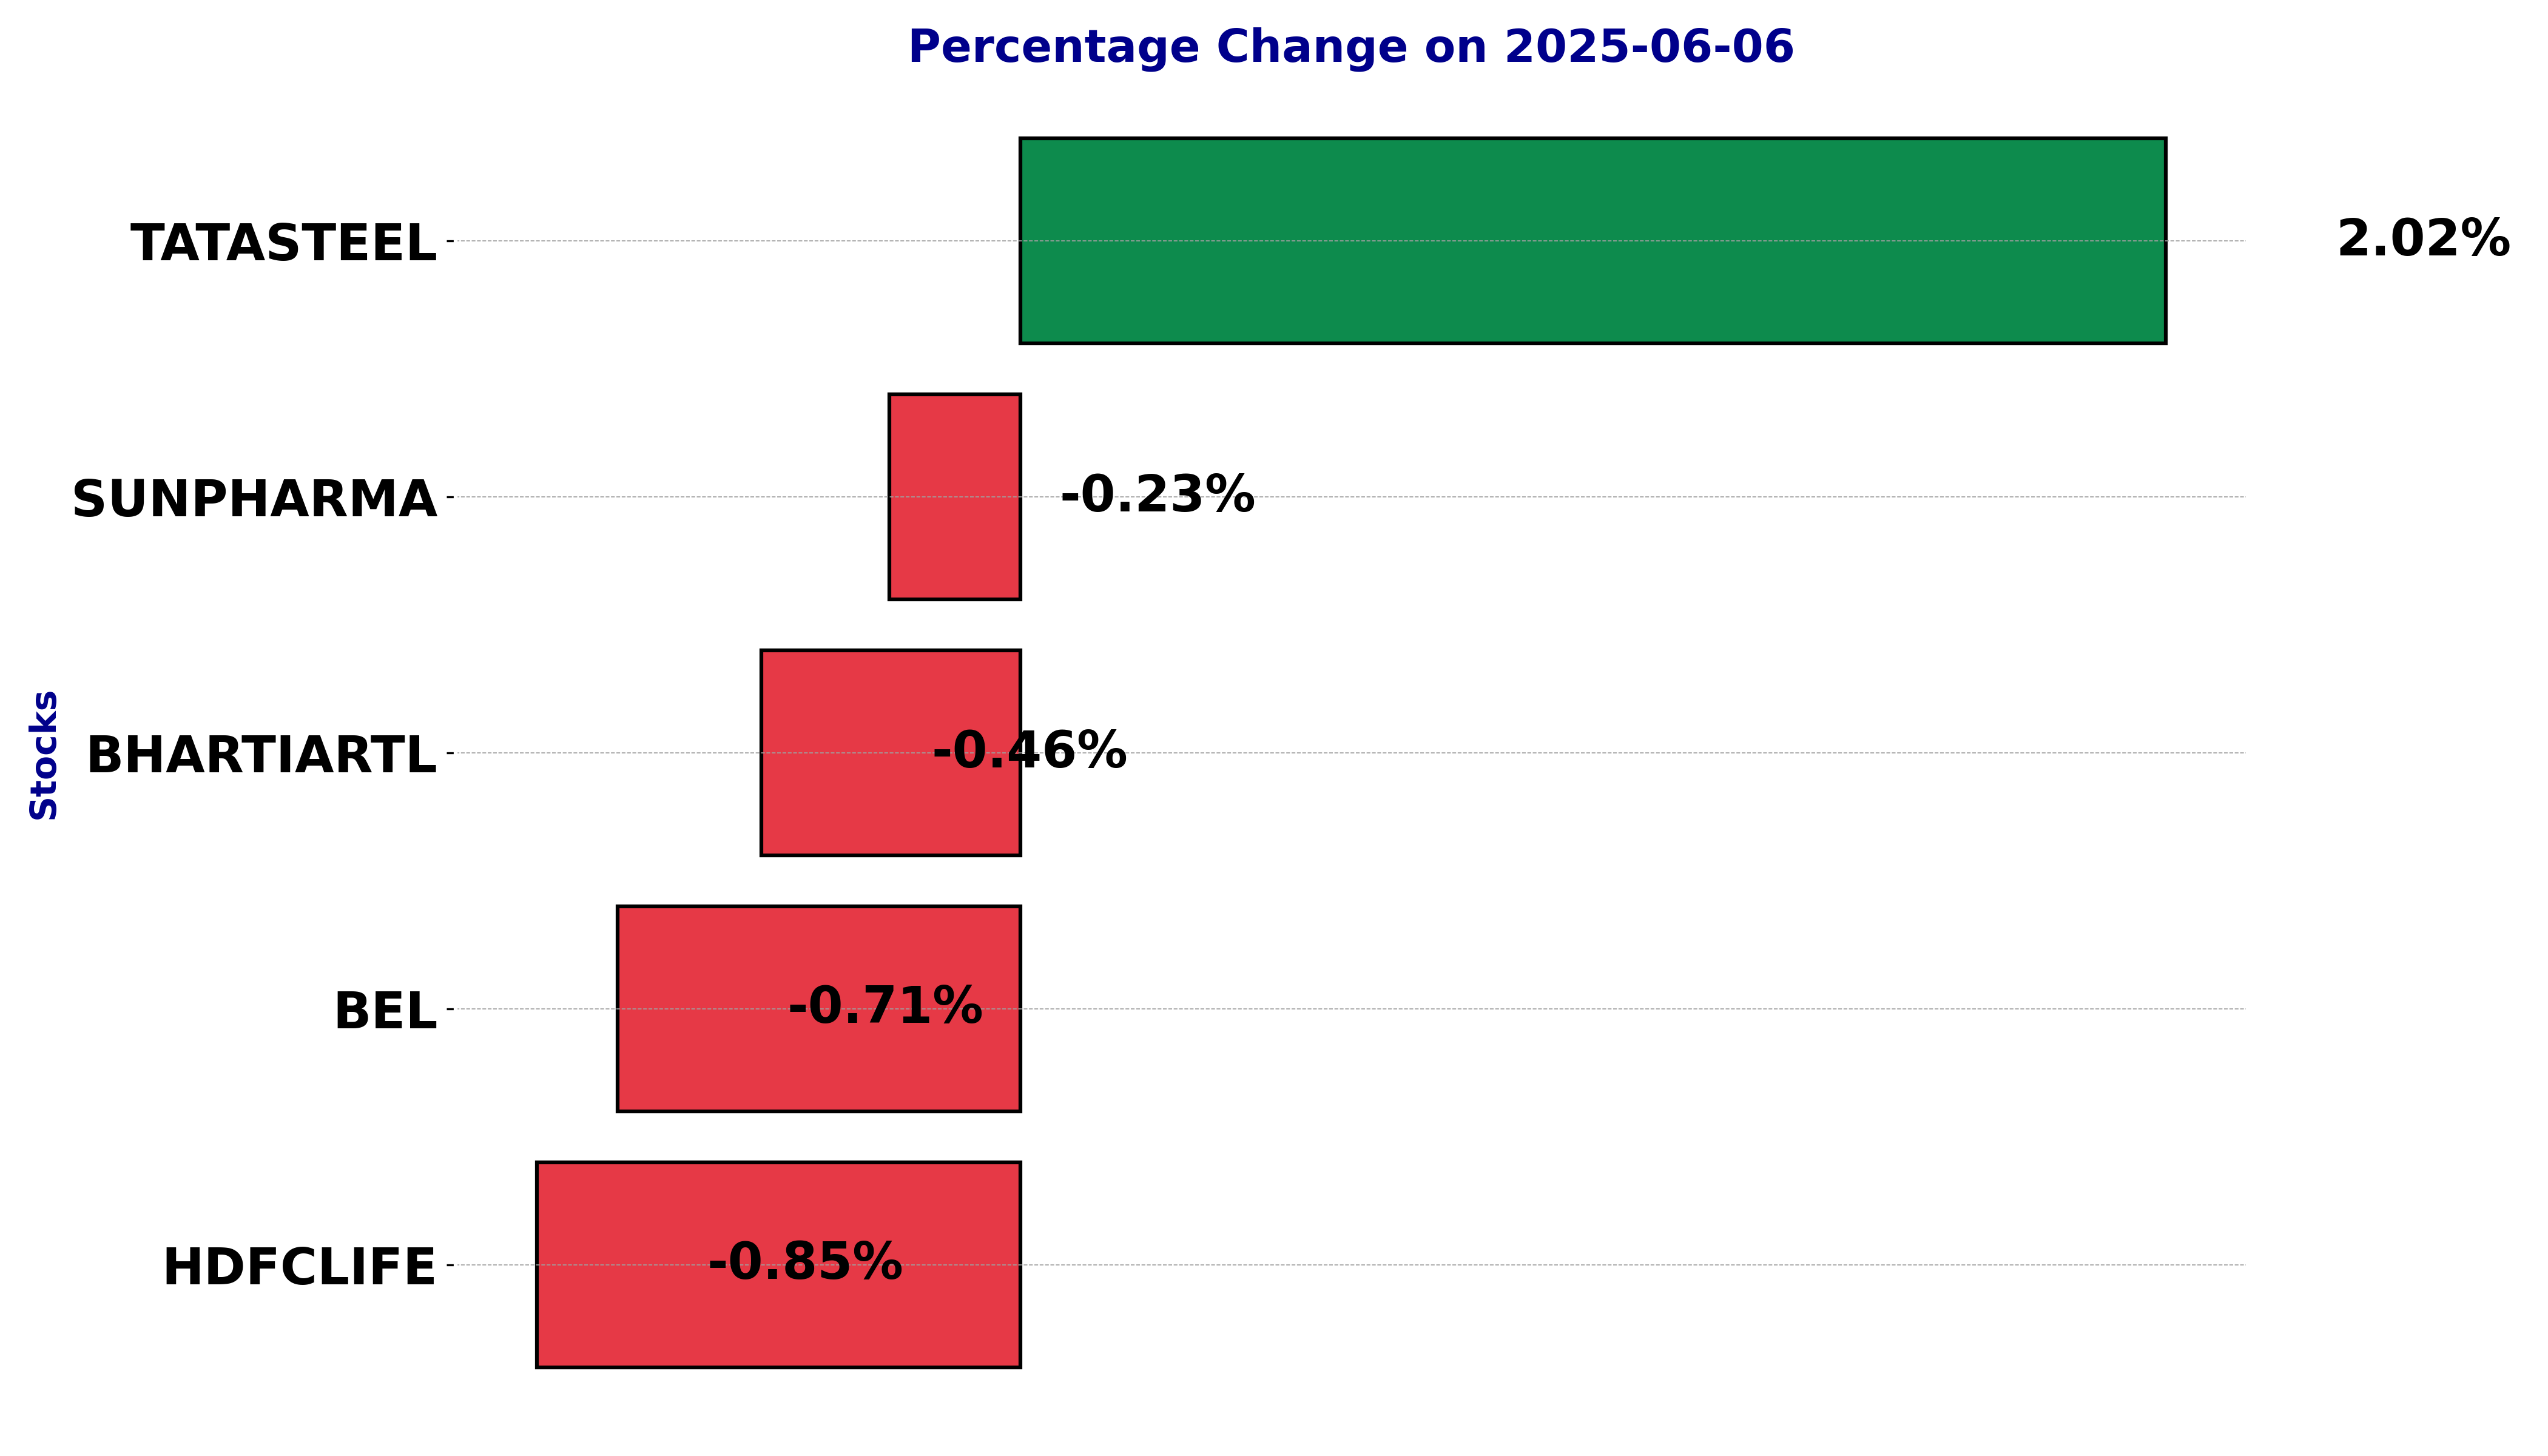
In this article, we will explore the technical indicators of some of the low-performing stocks on the Indian stock market, including BEL, BHARTIARTL, HDFCLIFE, SUNPHARMA, and TATASTEEL.
By looking at these stocks through the lens of key technical factors, we aim to better understand their price movements, trends, and potential future performance.
Analysis for Bharat Electronics - June 06, 2025
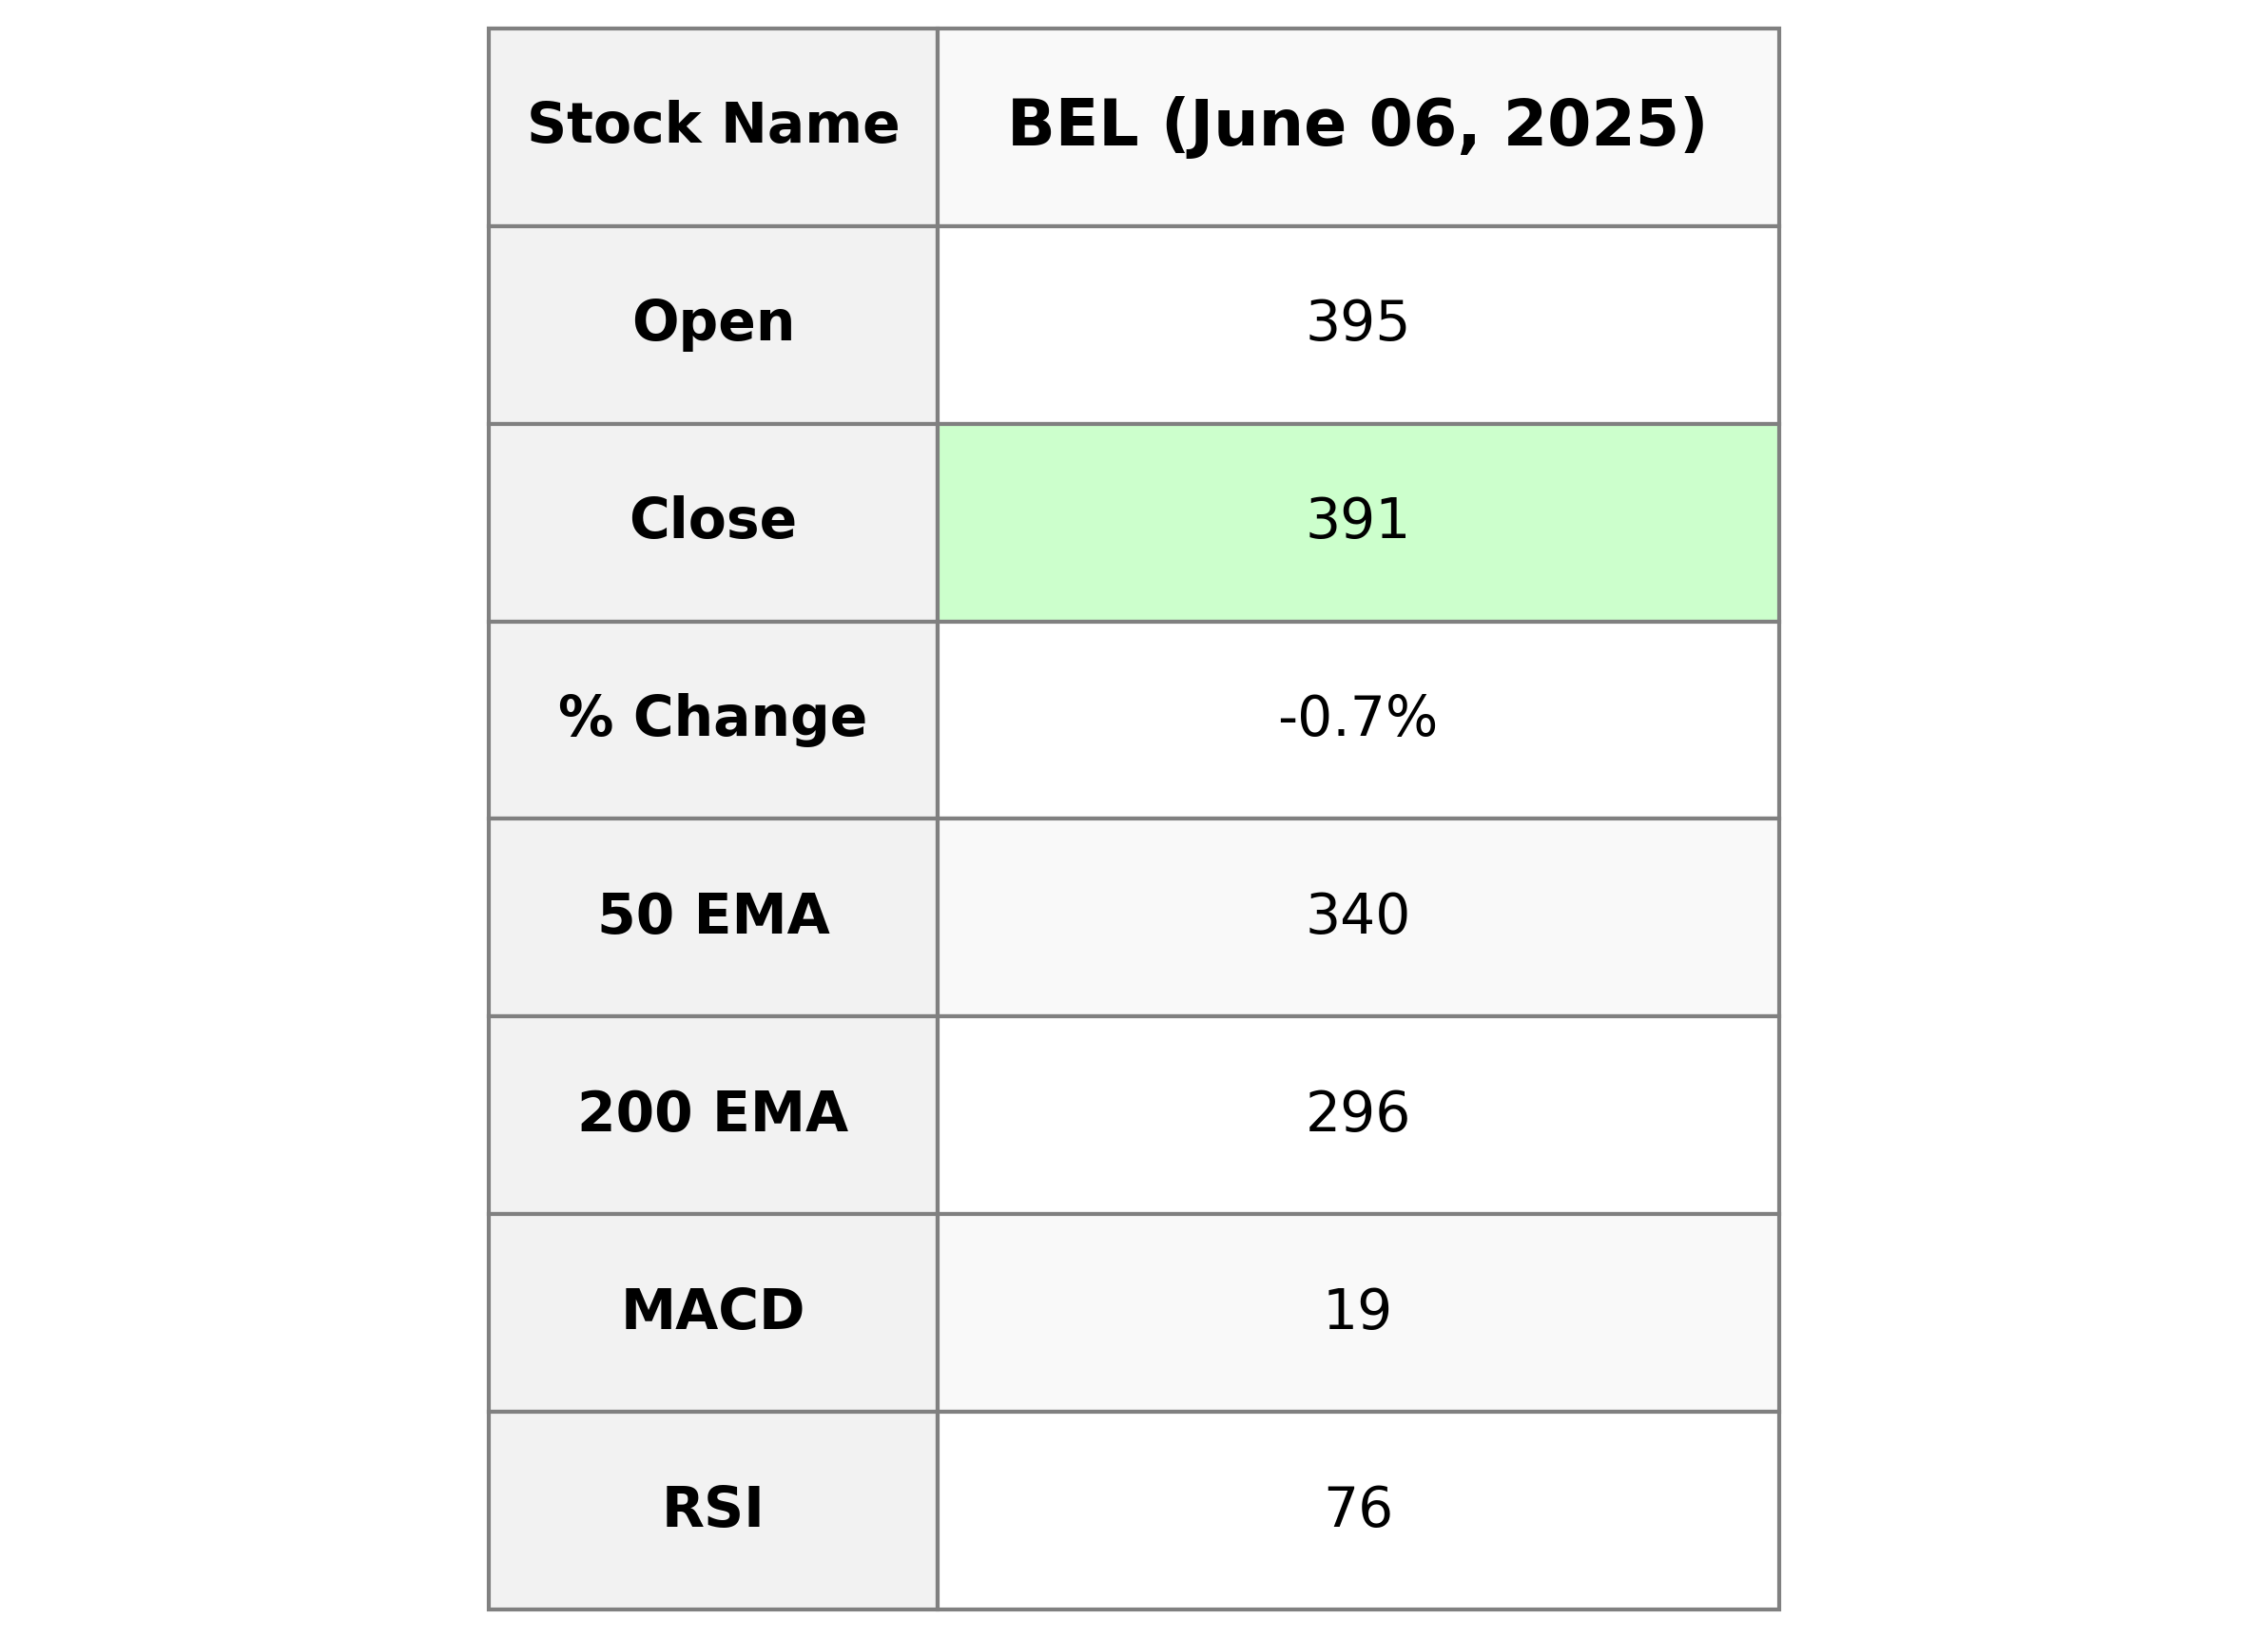
Bharat Electronics Limited has shown a slight decline in its stock performance with a closing price of 390.70 INR, which is a -0.71% decrease from its previous close. The stock experiences high volumes, with the RSI indicating an overbought condition at 76.50. Bharat Electronics operates in the "Industrials" sector, specifically in the "Aerospace & Defense" industry, and is based in India.
Relationship with Key Moving Averages
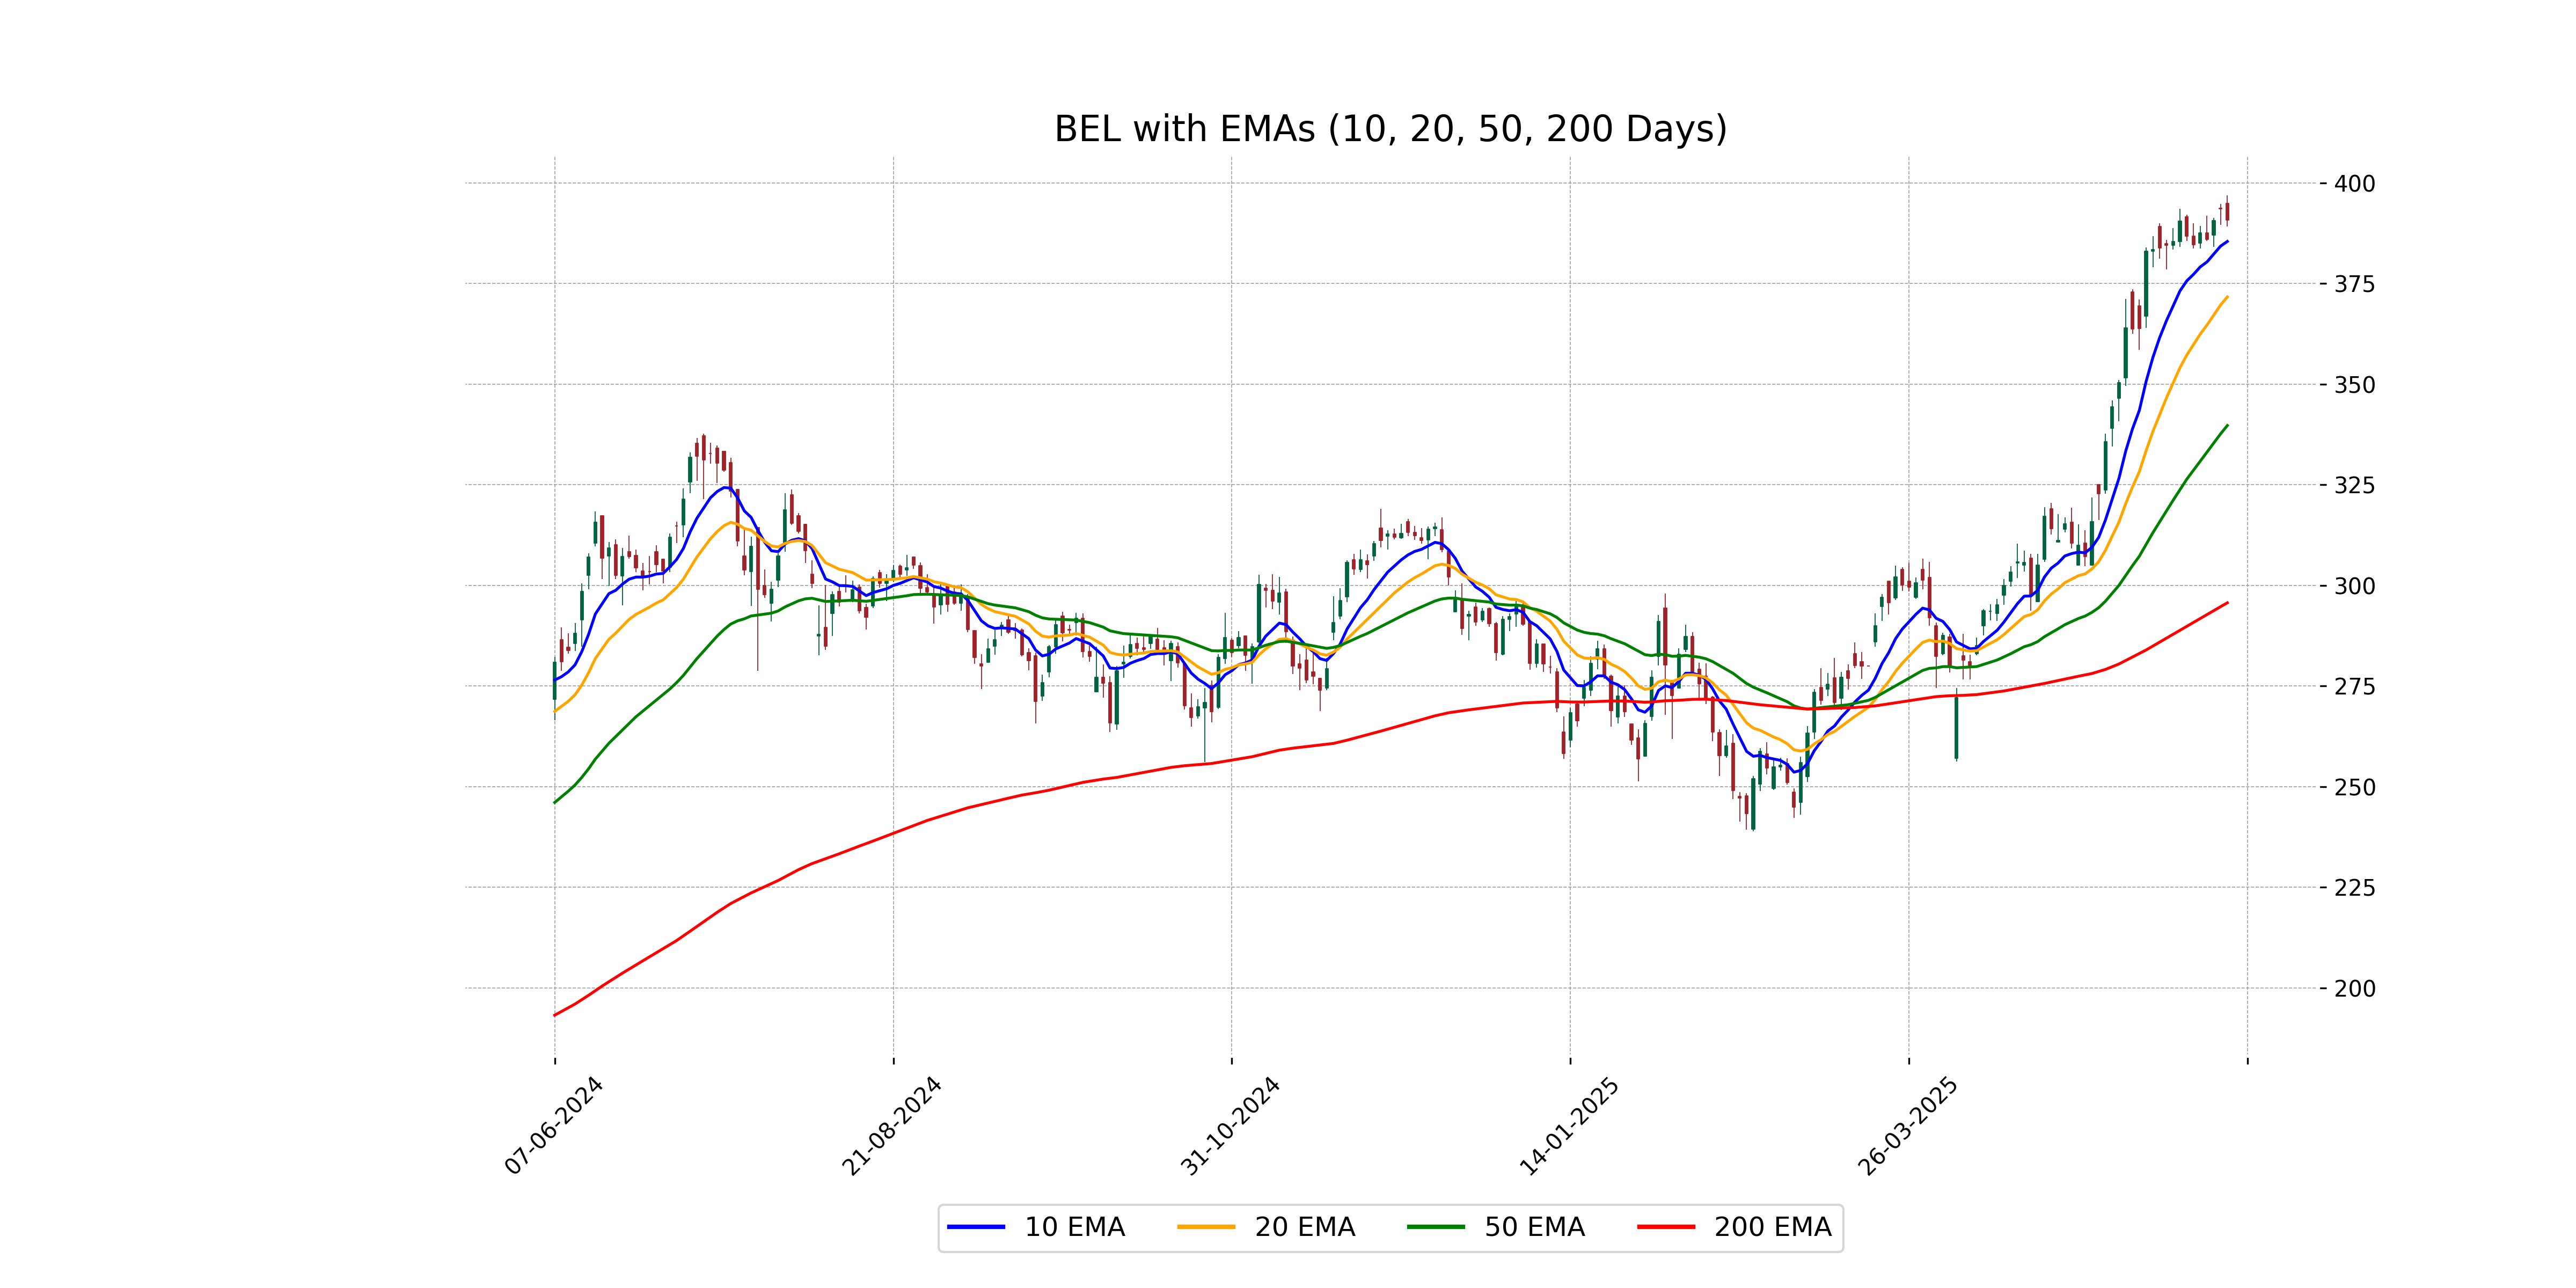
The closing price of Bharat Electronics is above its 50-day EMA and 200-day EMA, indicating a strong uptrend in the short to long term. However, it is slightly below its 10-day EMA and 20-day EMA, which may suggest a minor short-term consolidation or pullback.
Moving Averages Trend (MACD)
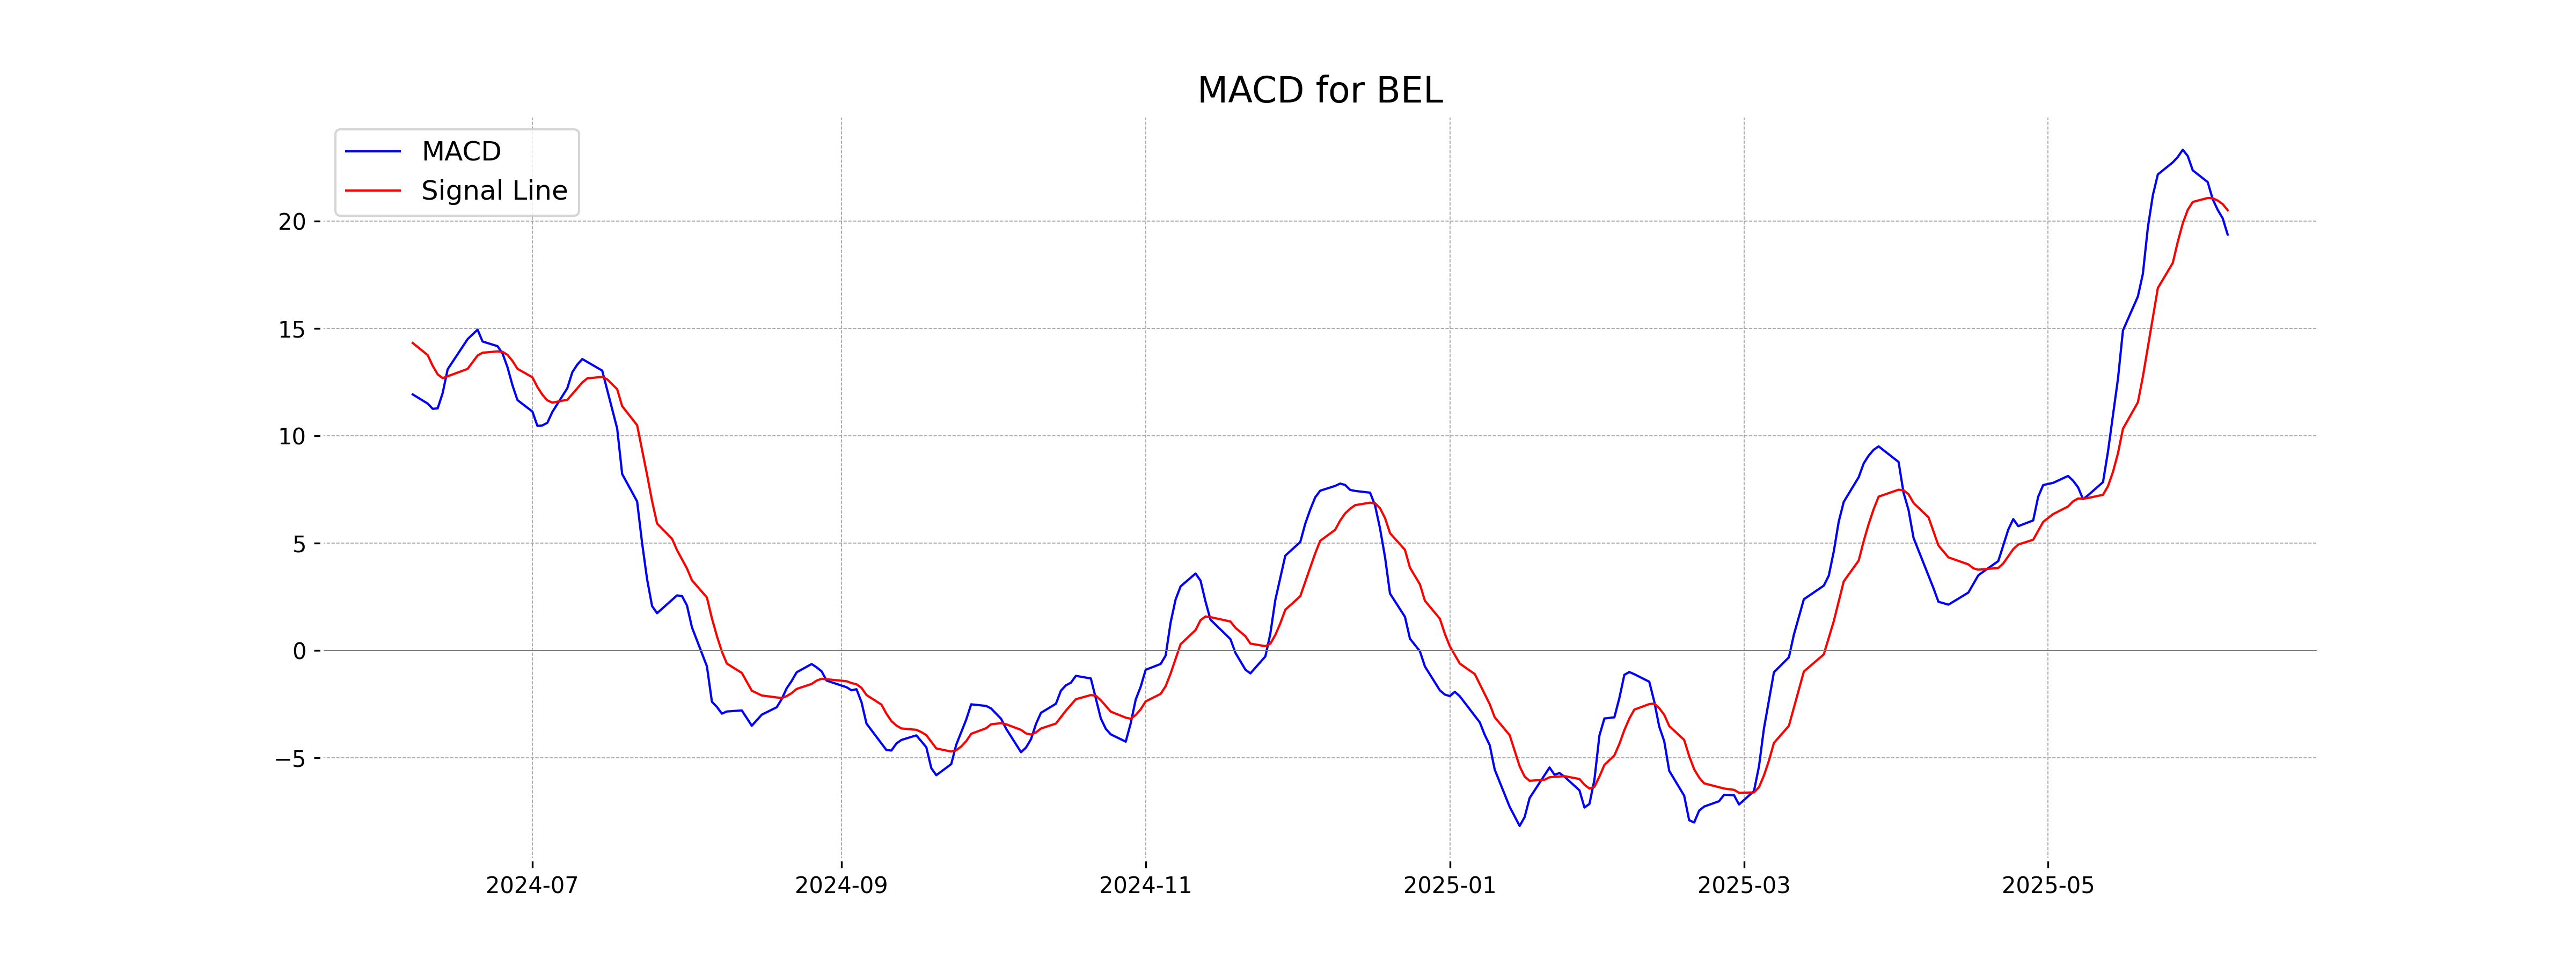
Bharat Electronics' MACD analysis shows that the MACD line at 19.37 is below the MACD Signal line at 20.51, suggesting a bearish momentum. This may indicate a potential weakening of the recent upward trend, and traders might look for further confirmation before assuming a reversal or continuation of trend.
RSI Analysis
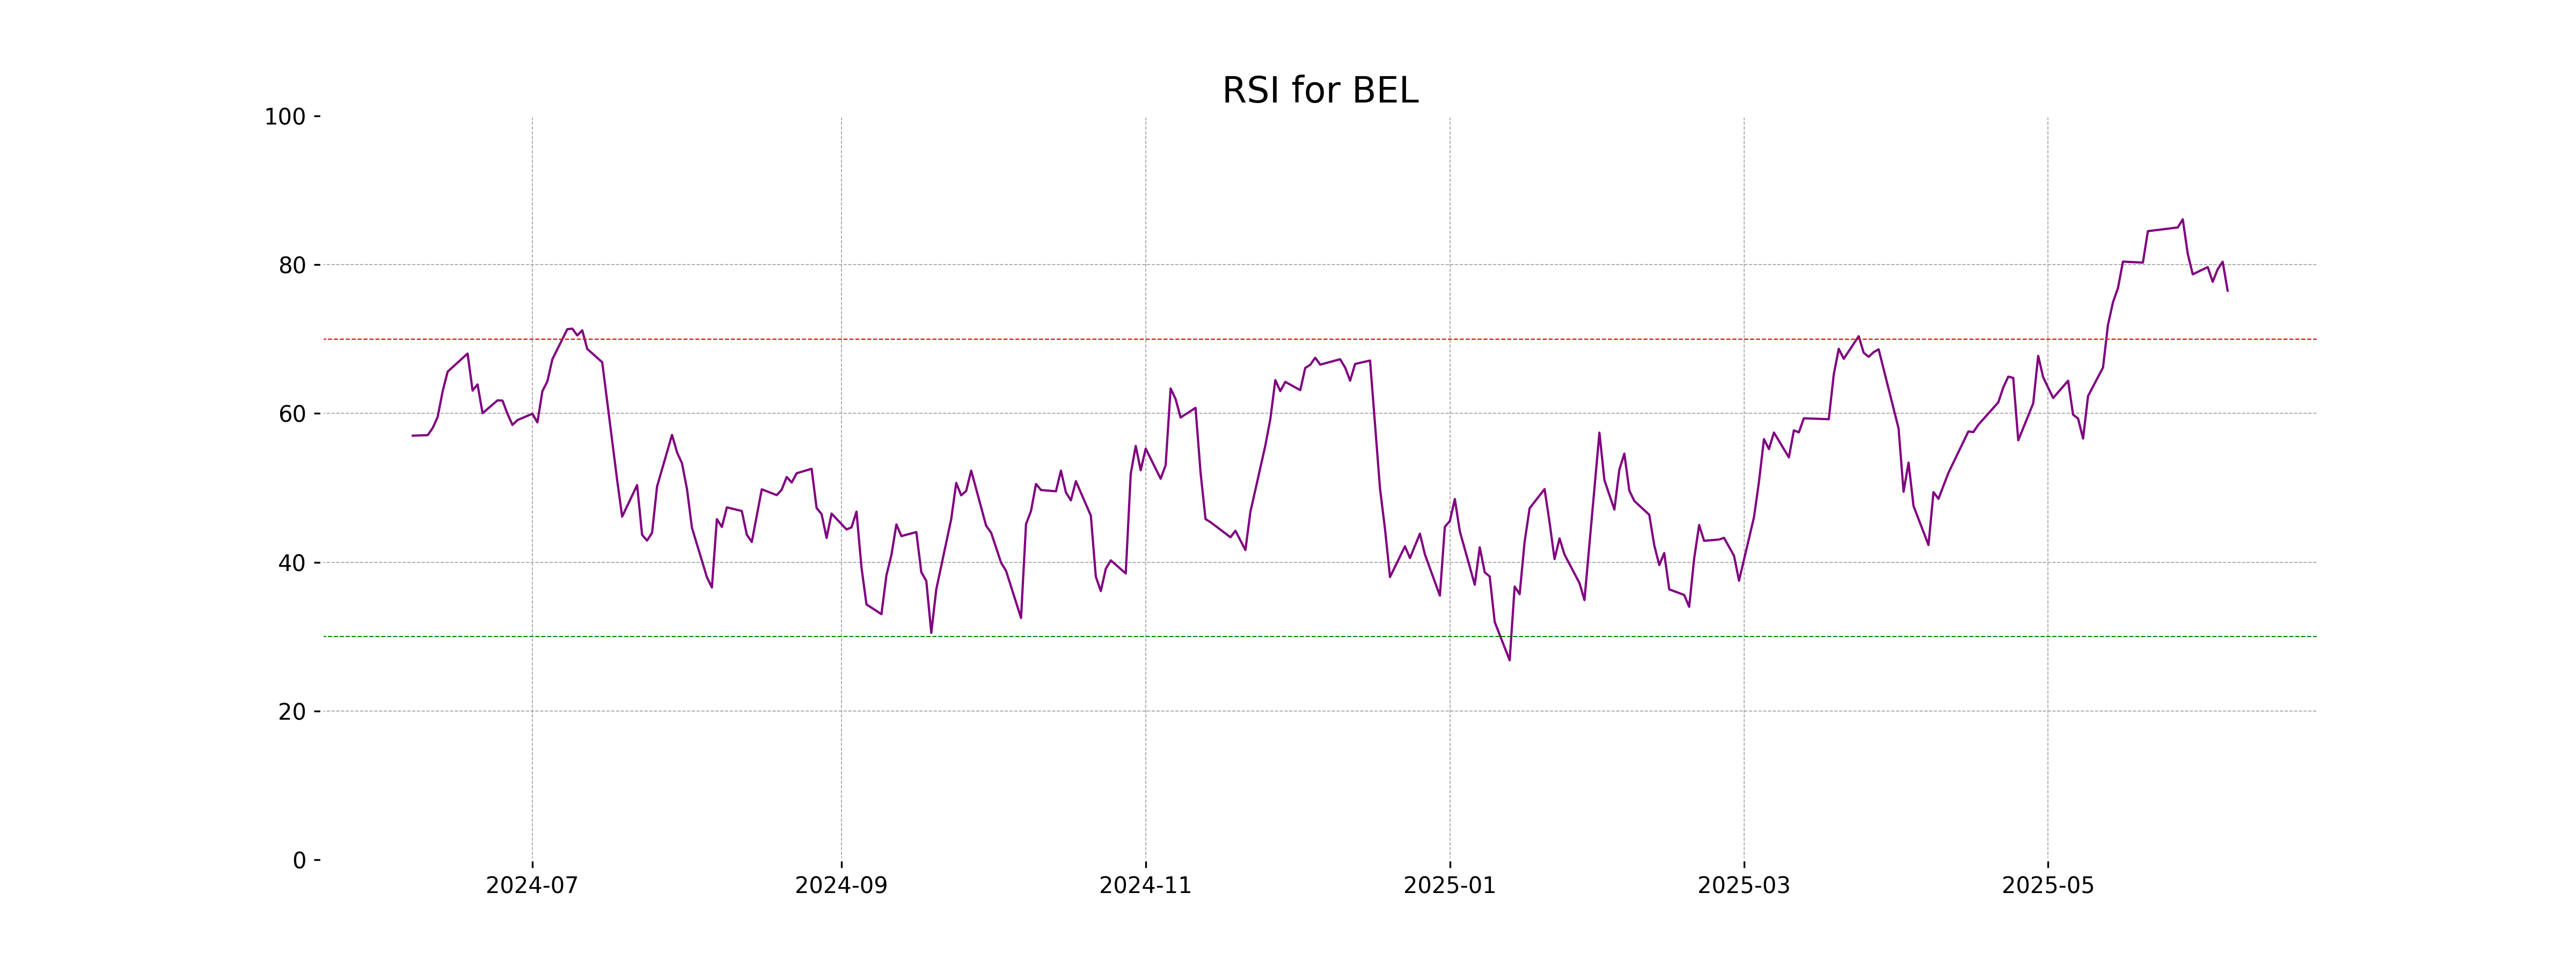
Bharat Electronics' RSI stands at 76.50, indicating that the stock is in the overbought territory. This suggests a potential overvaluation in the short term, which might precede a price correction or consolidation.
Analysis for Bharti Airtel - June 06, 2025
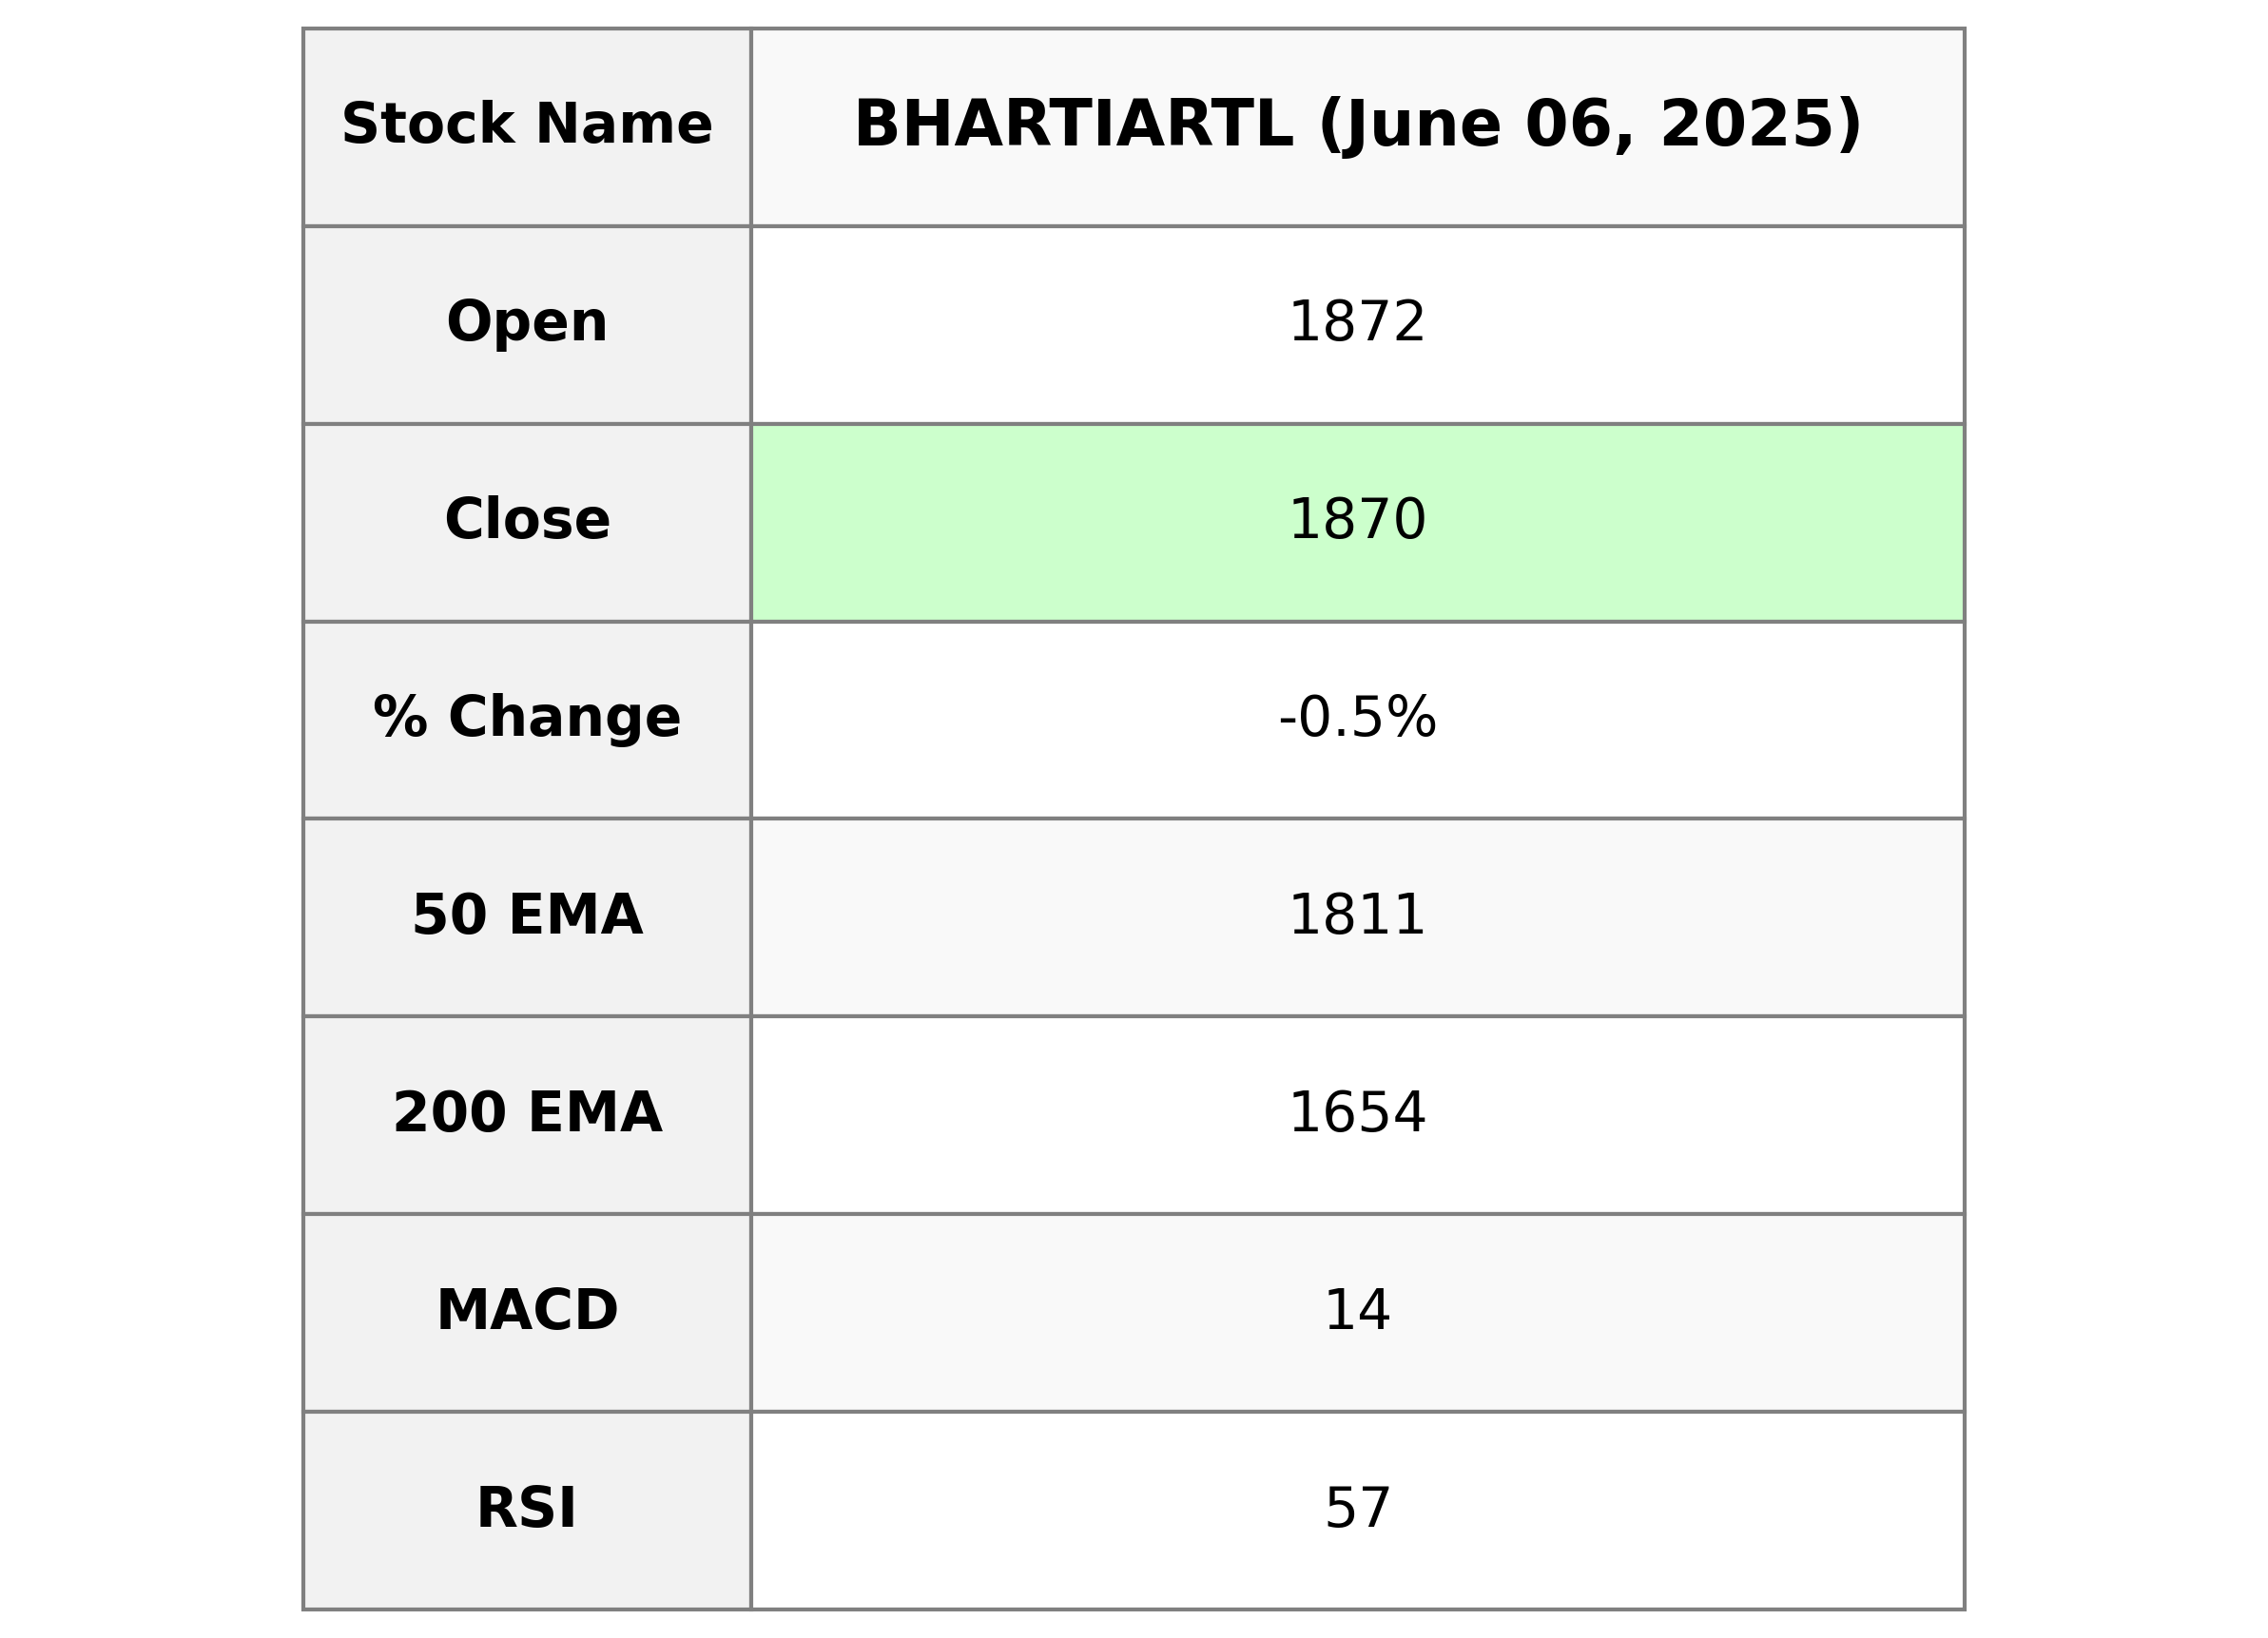
Bharti Airtel exhibited a slight decline in its stock performance, with its closing price at 1870.20, down by 0.46% from the previous close. Despite the minor dip, the stock remains above its 50 and 200-day EMAs, indicating an overall uptrend. The RSI of 56.92 suggests moderately healthy momentum, while the MACD indicates a positive, albeit weakening, bullish trend. With a market cap of approximately 11 trillion, the company remains a strong player in the Telecom Services industry within India.
Relationship with Key Moving Averages
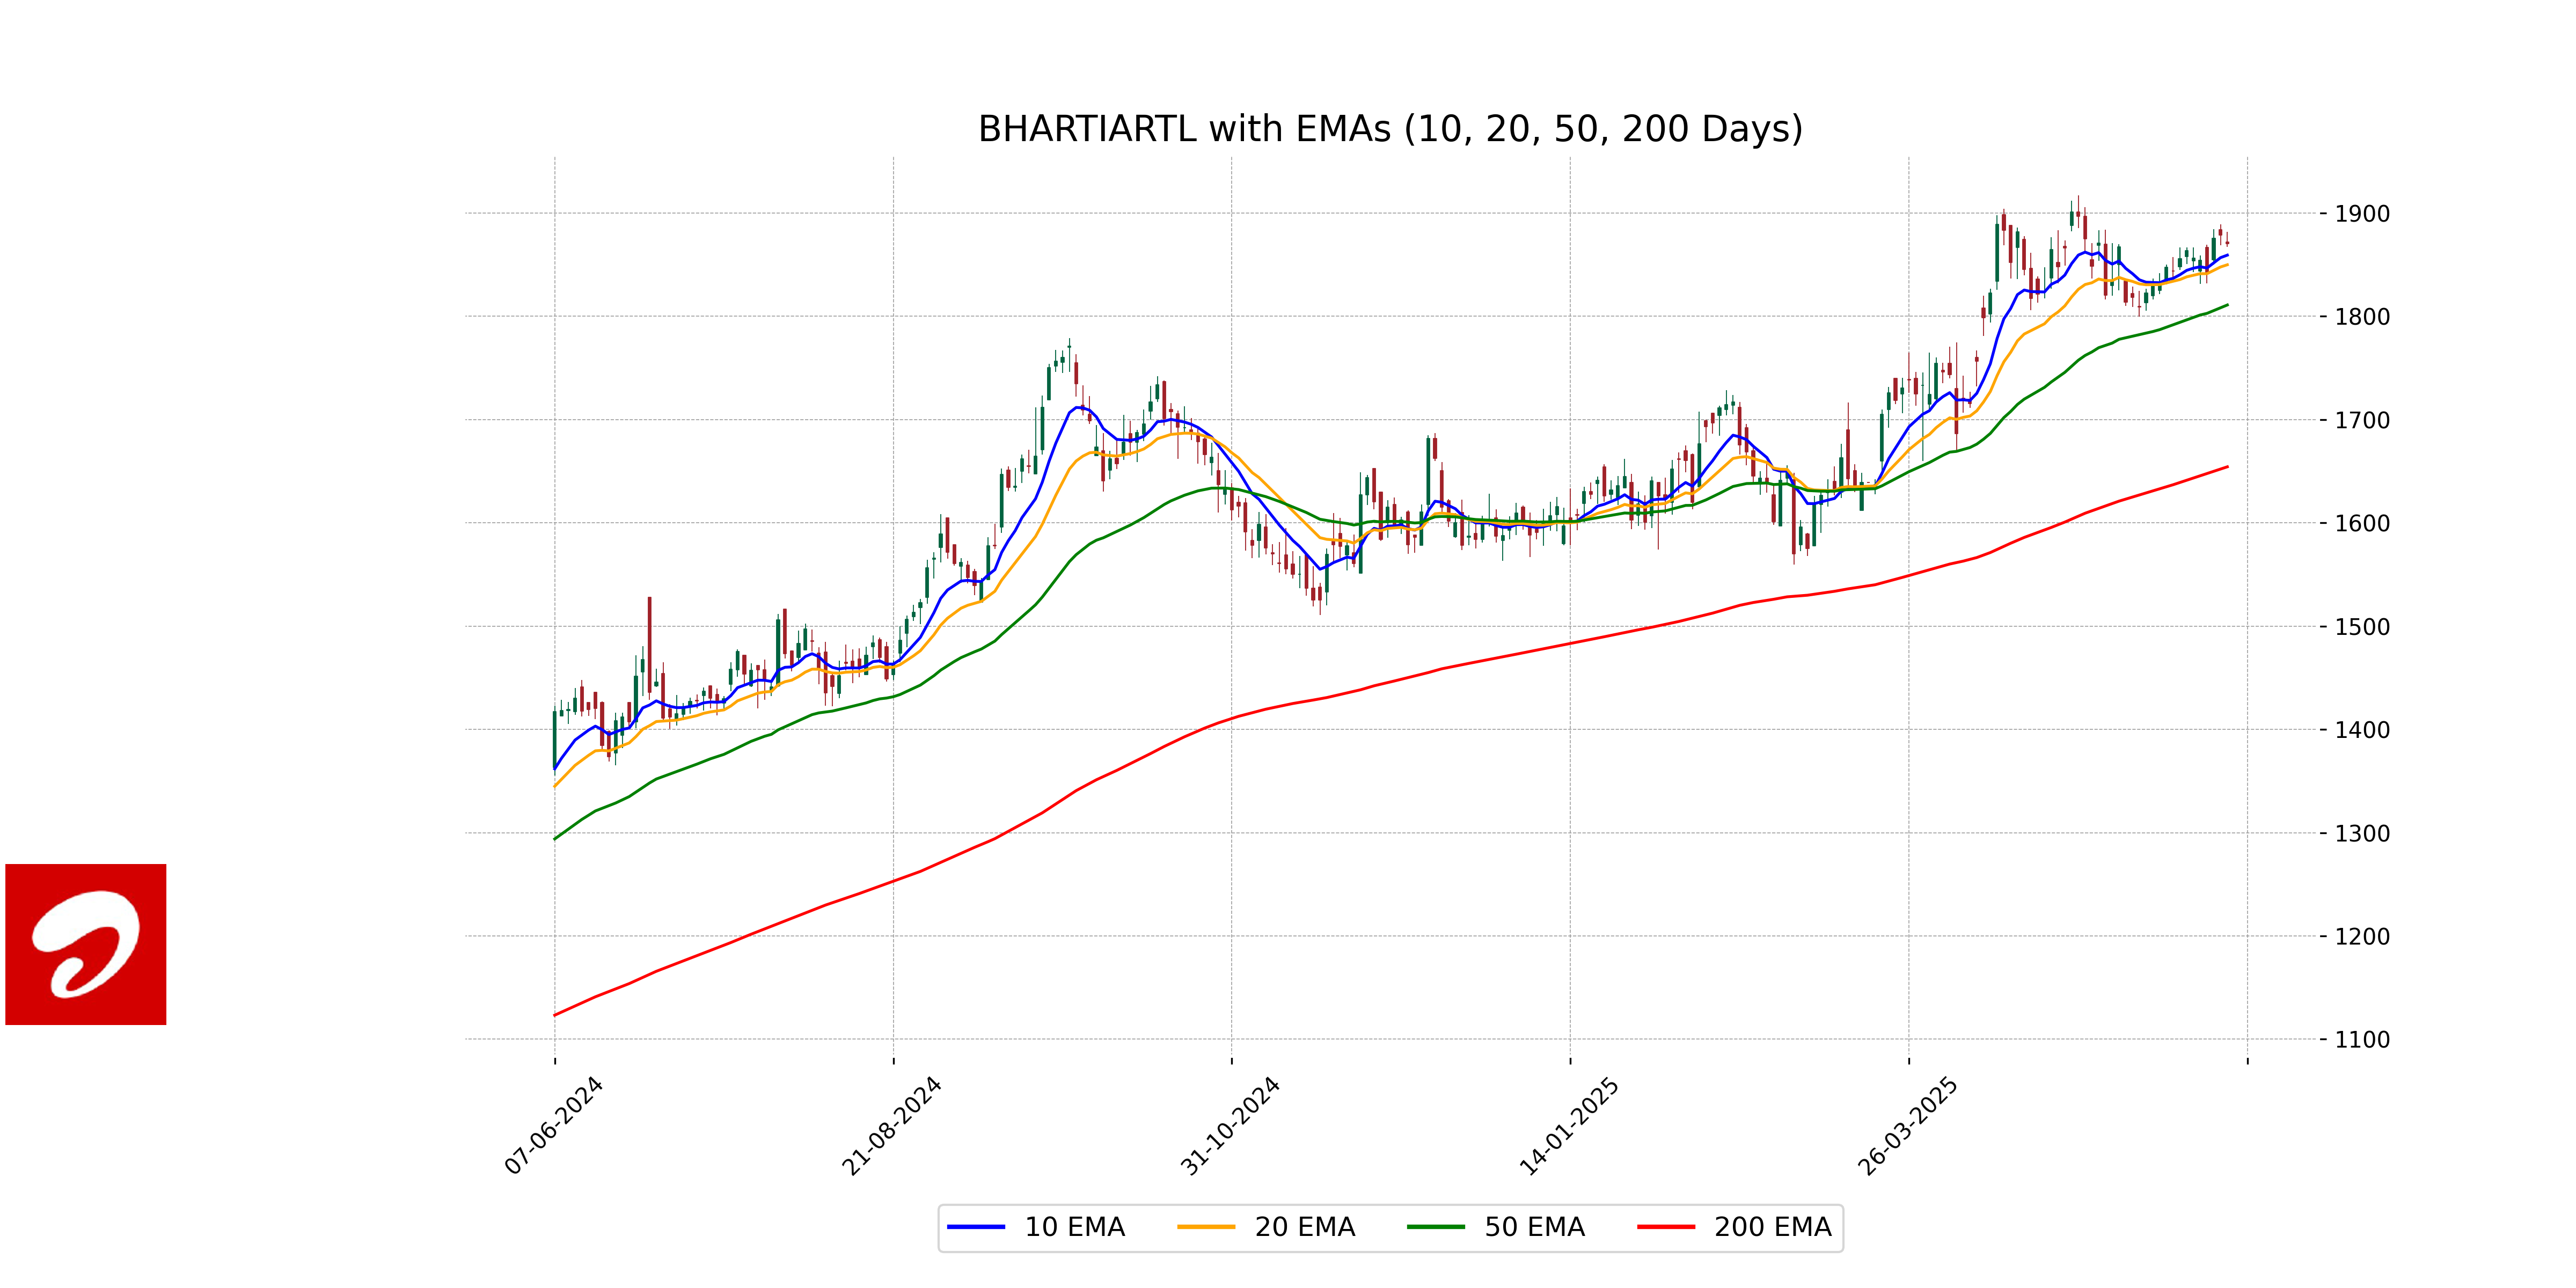
Bharti Airtel's current closing price of 1870.20 is slightly below its 10 EMA of 1859.30 and 20 EMA of 1849.96, indicating a short-term downward trend. However, the price is well above the 50 EMA of 1811.03 and significantly above the 200 EMA of 1654.30, suggesting a longer-term upward trend.
Moving Averages Trend (MACD)
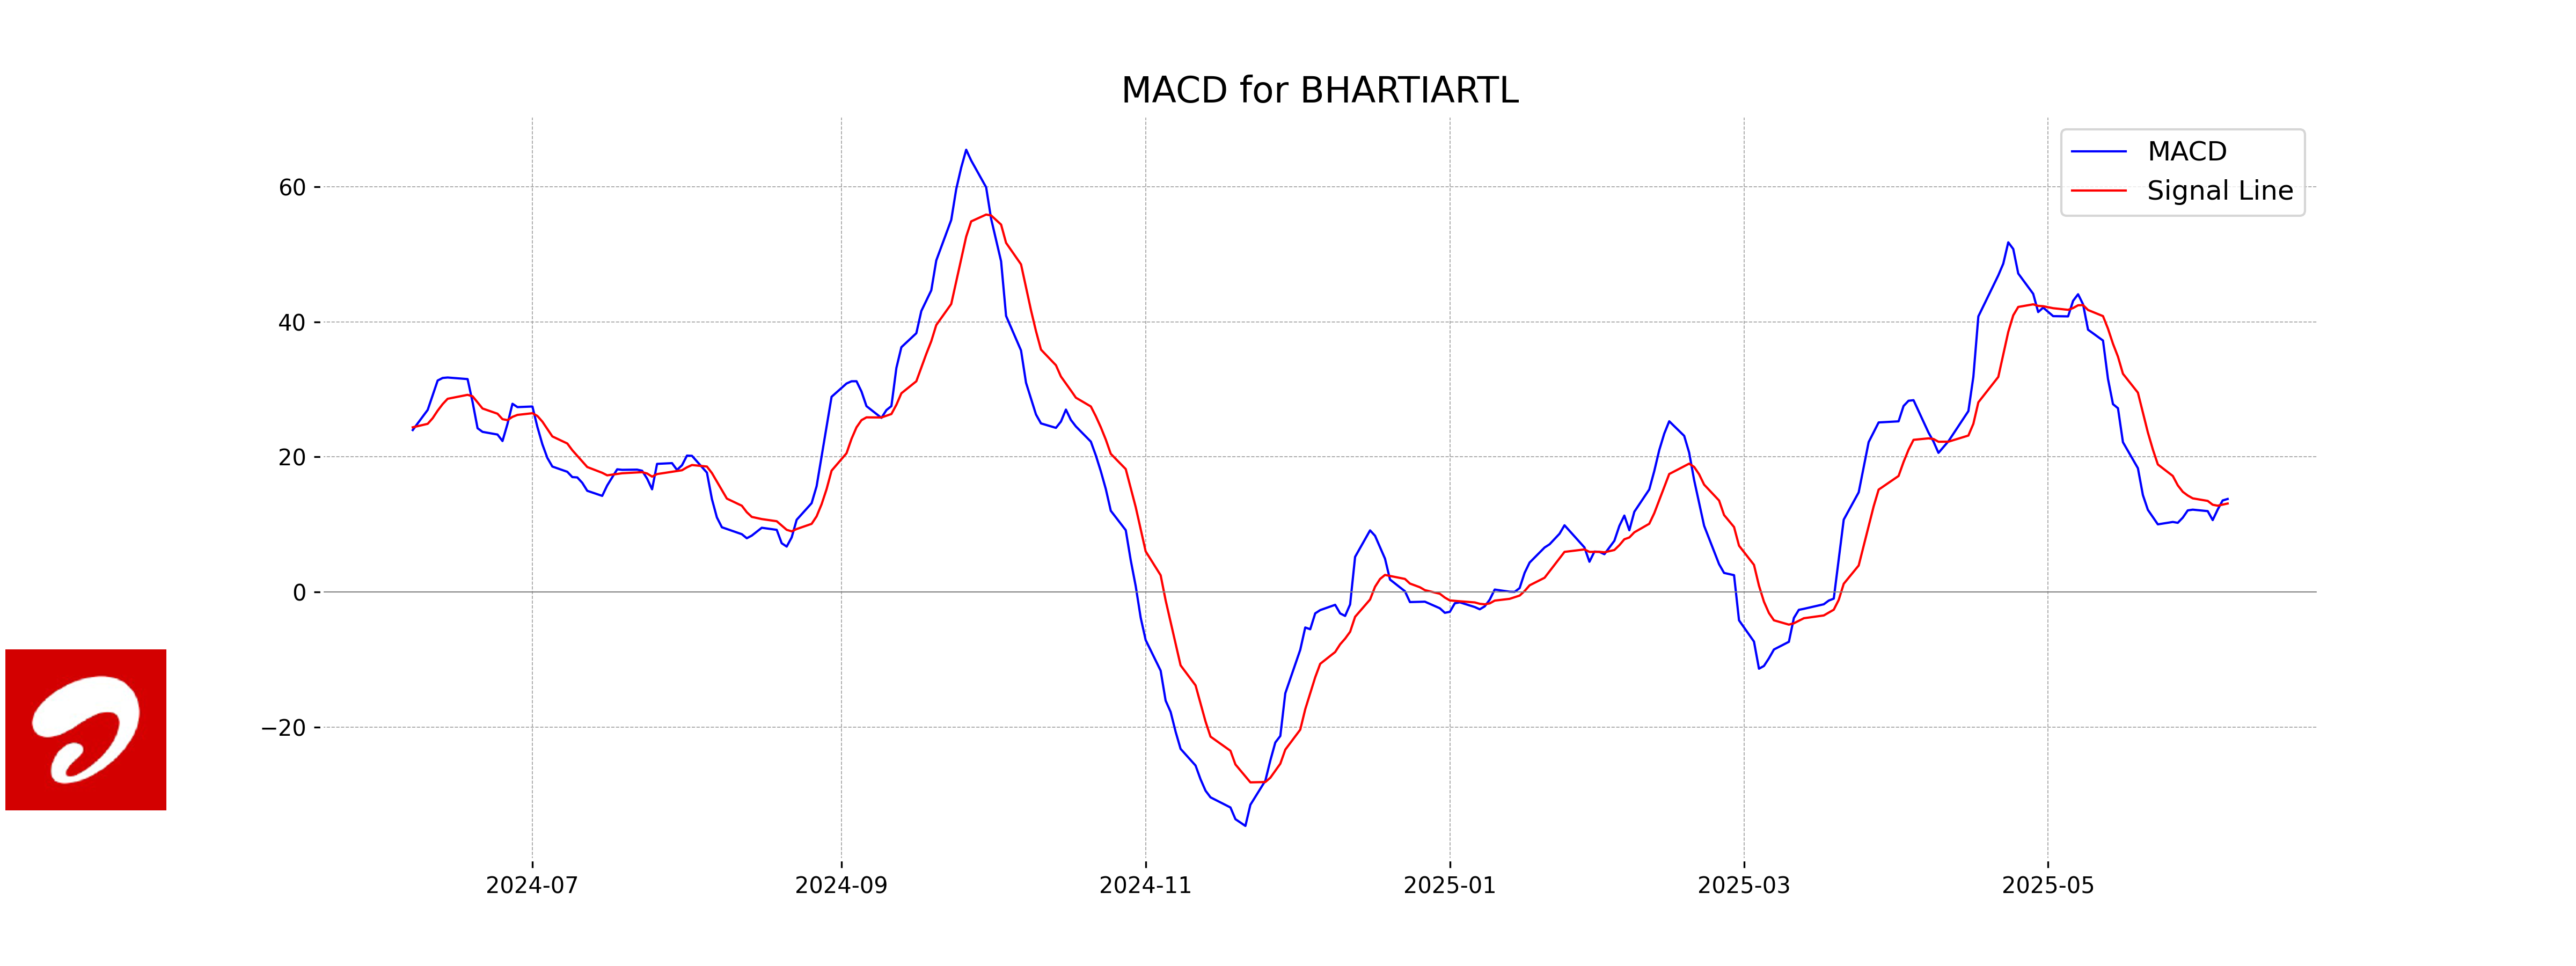
Bharti Airtel's MACD value is 13.77, which is above the MACD Signal line set at 13.10. This indicates a bullish trend, suggesting potential upward momentum in the stock price.
RSI Analysis
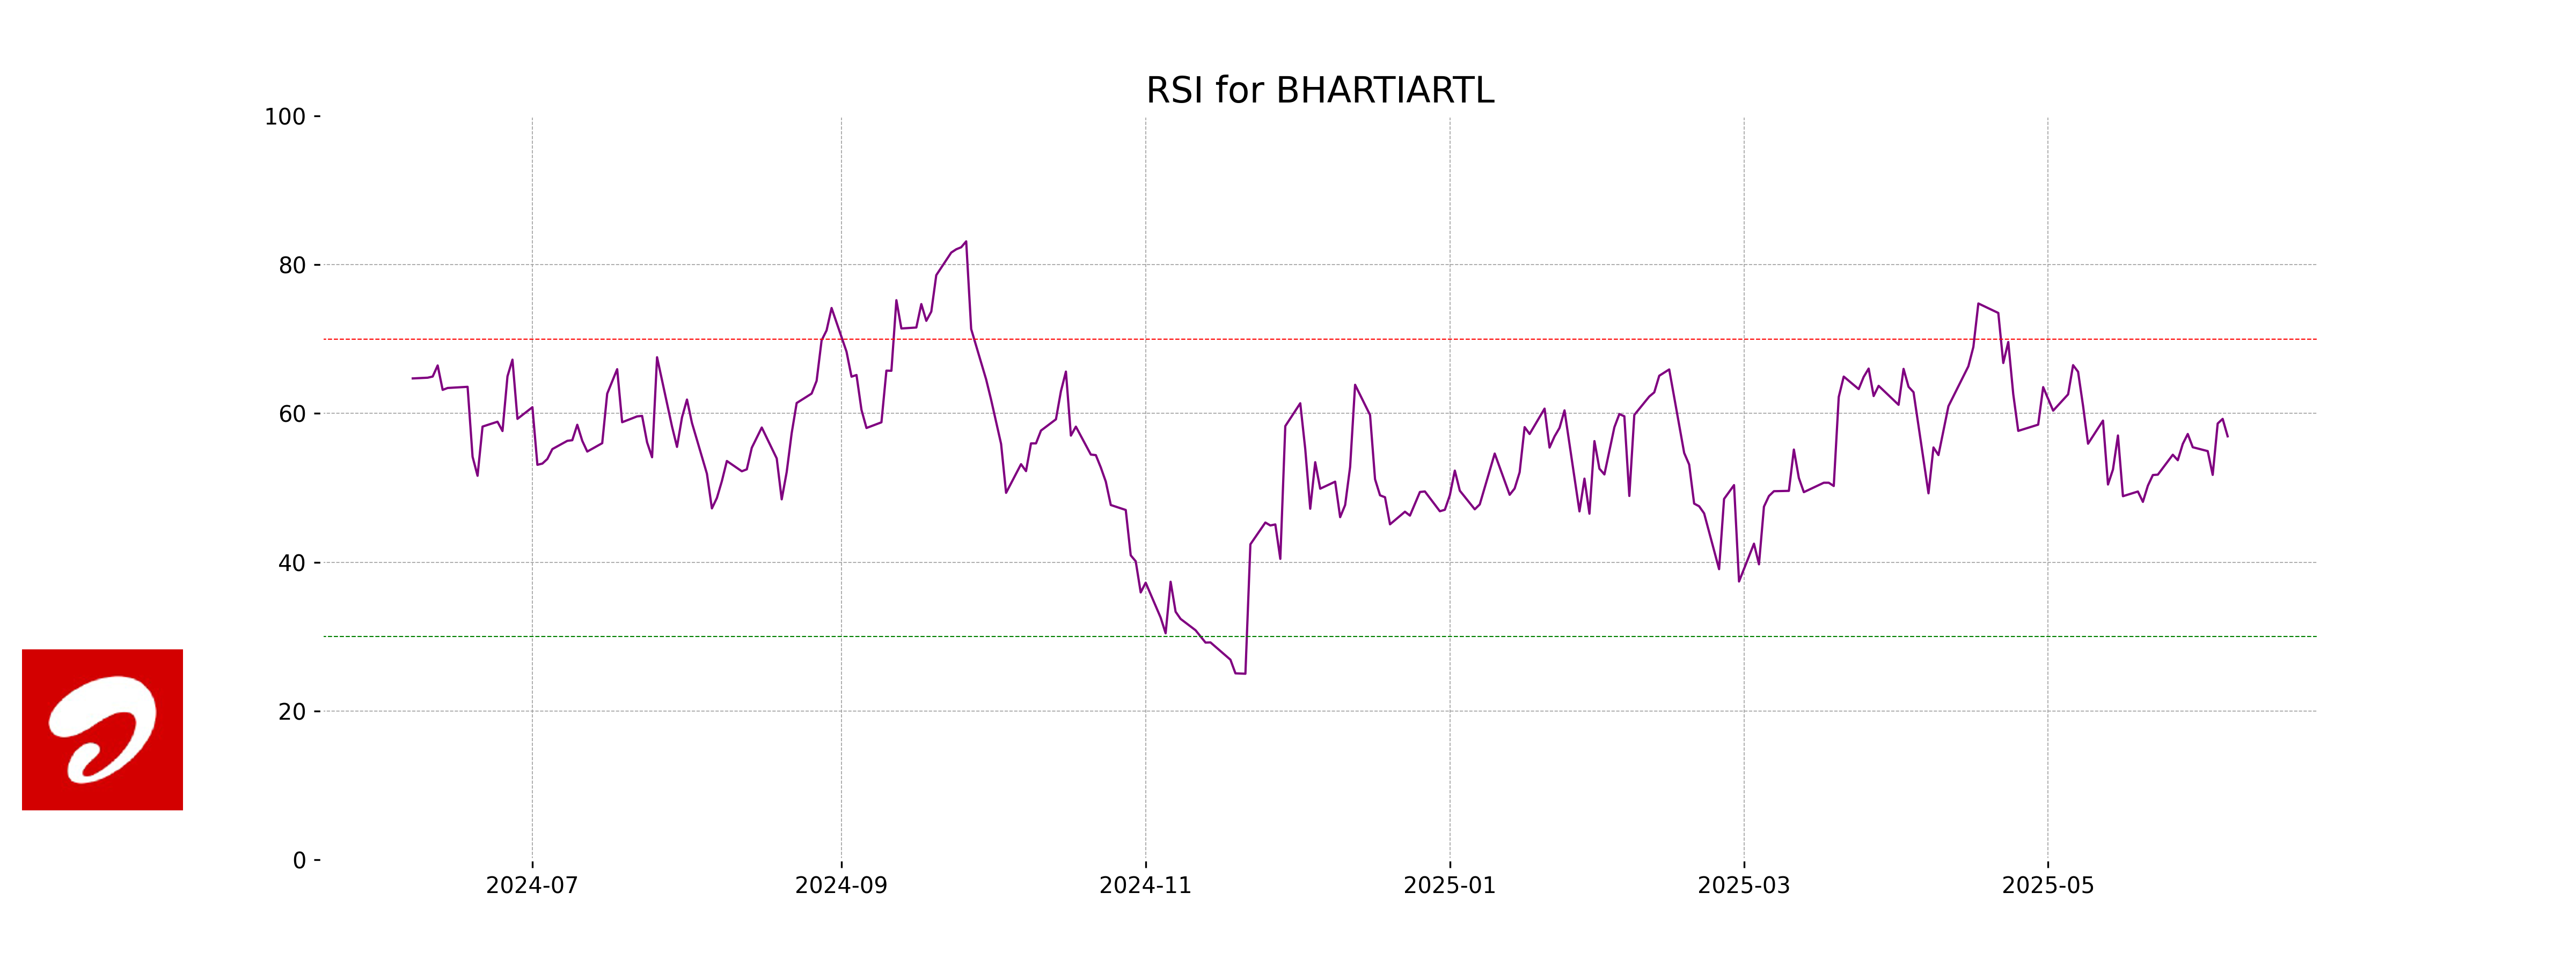
Bharti Airtel RSI Analysis: The current RSI of Bharti Airtel is 56.92, indicating that the stock is in a neutral range but slightly leaning towards being overbought. This suggests a balanced momentum, with no strong signals for either excessive buying or selling pressure at this time.
Analysis for HDFC LIFE - June 06, 2025
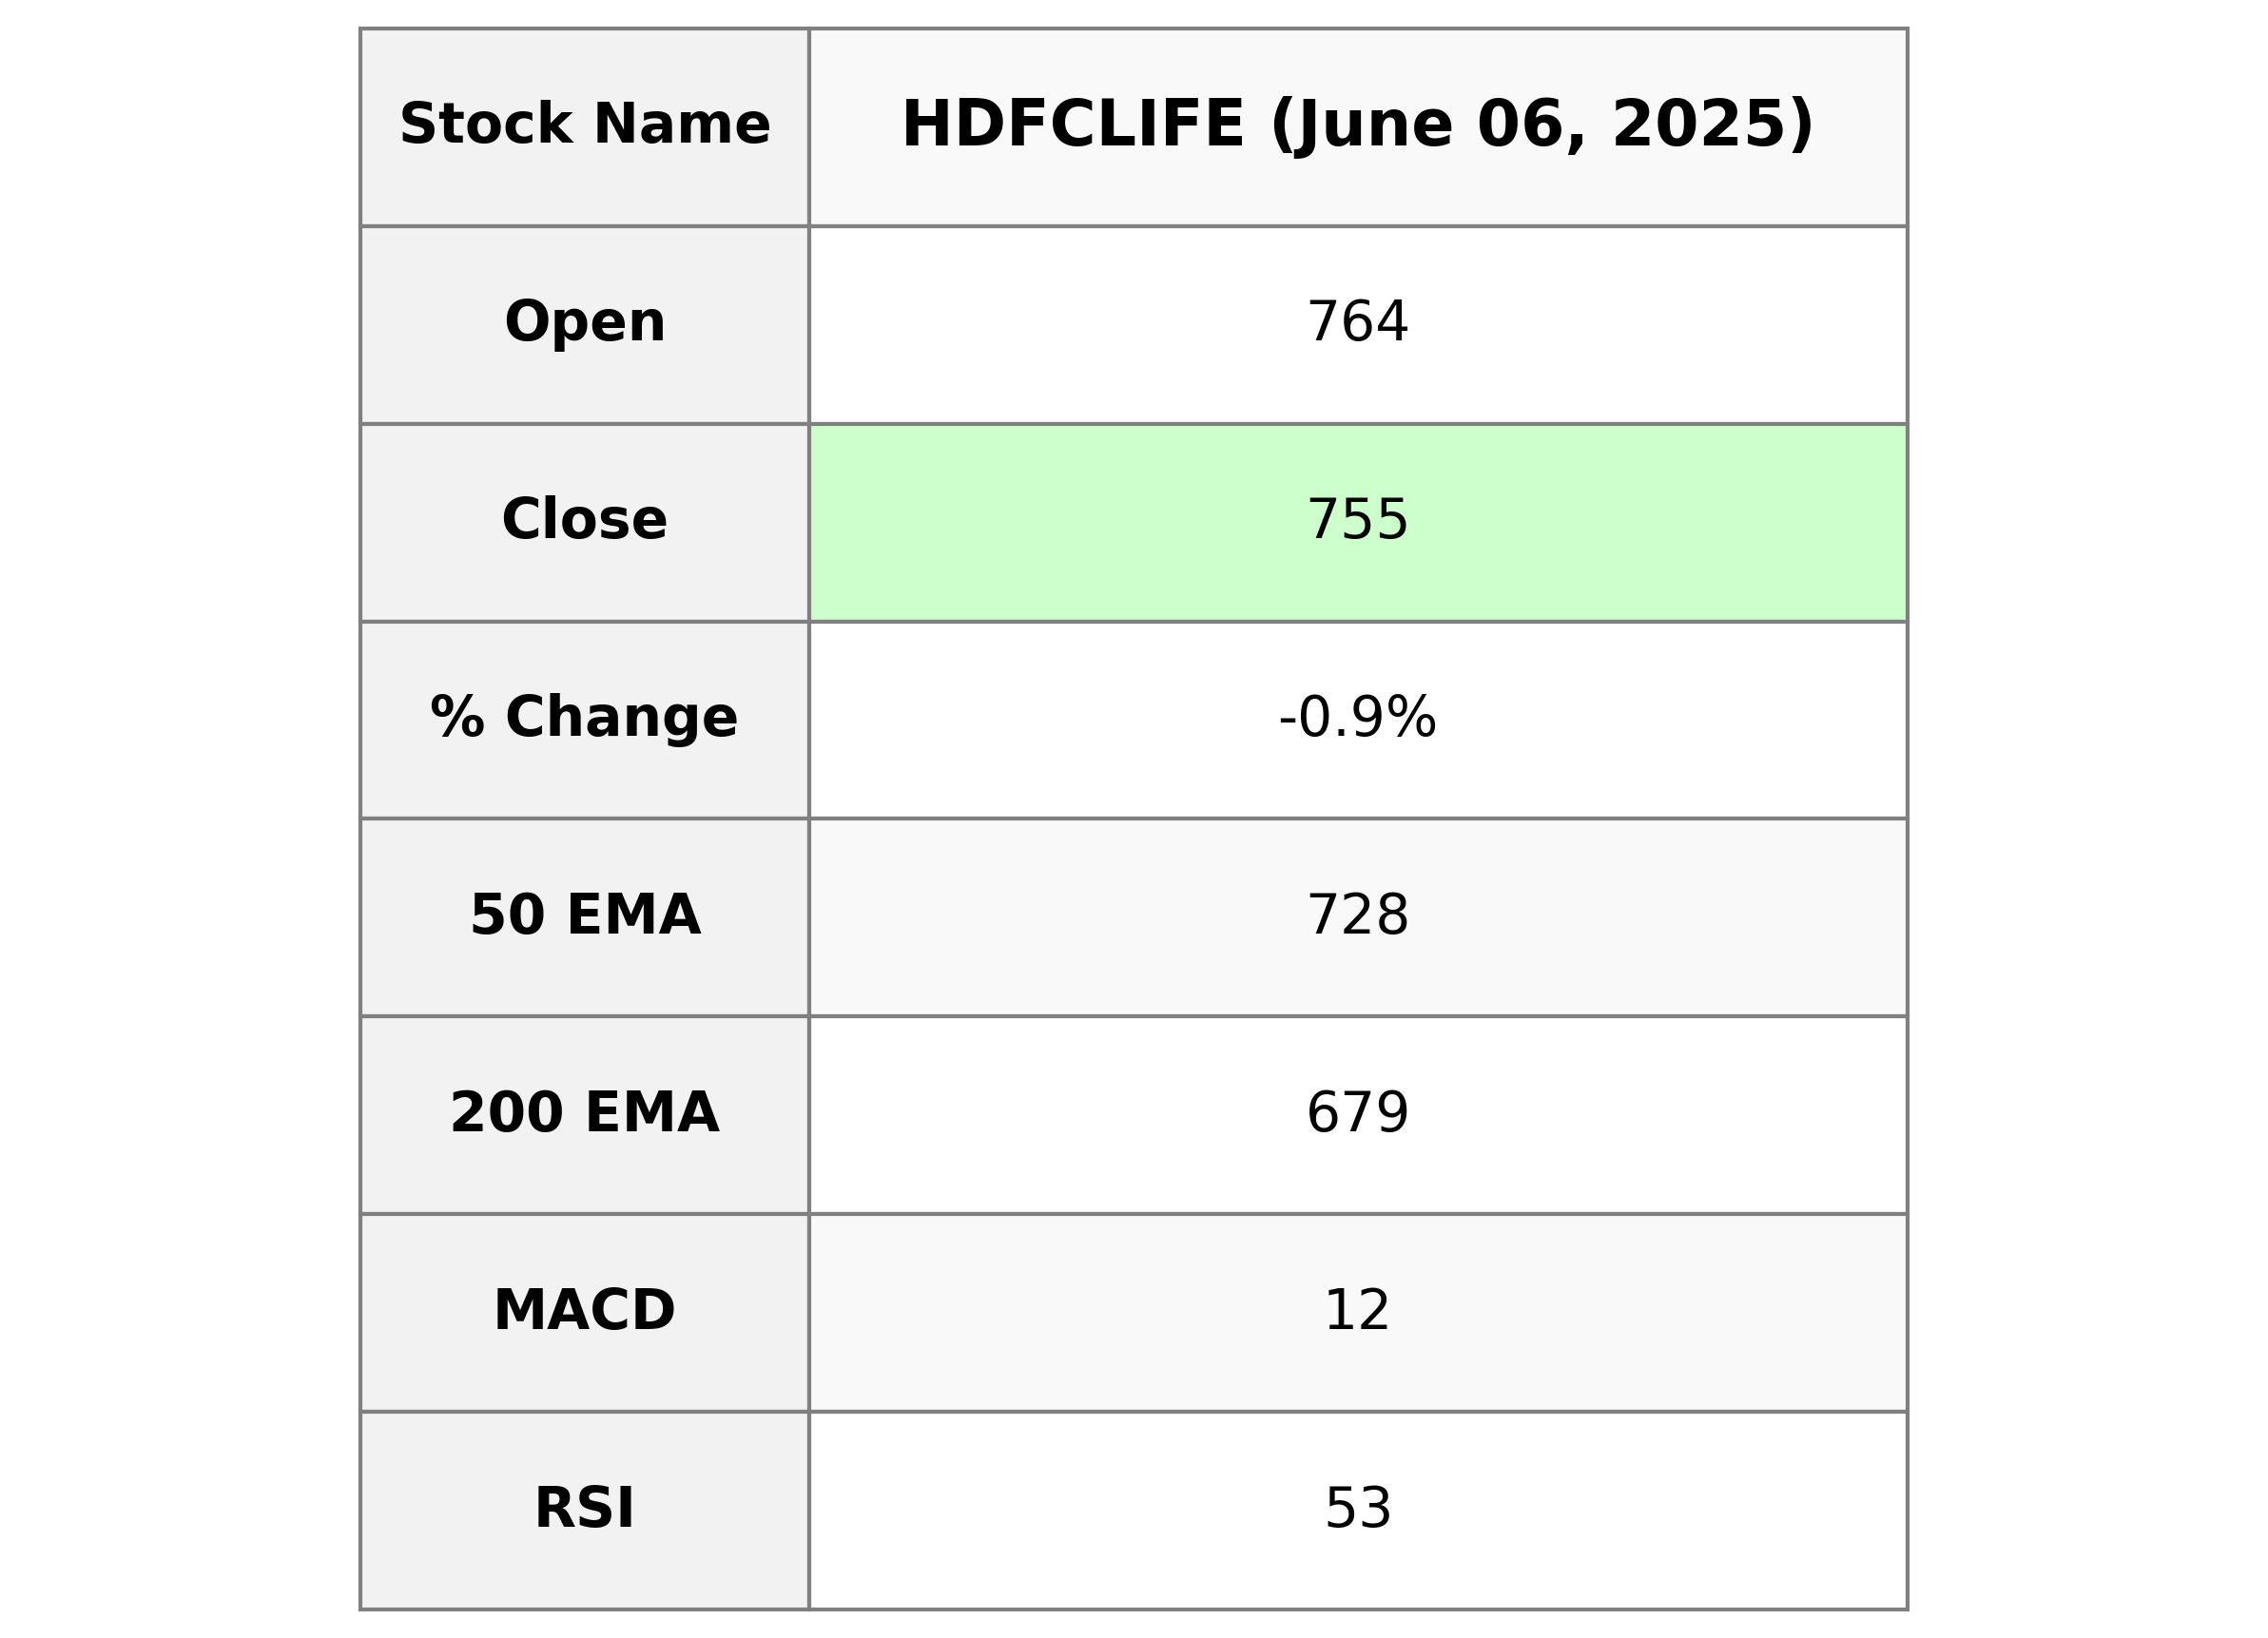
HDFC Life Insurance Company Limited HDFC Life's stock closed at 755.10 with a decrease of 0.85% from the previous close. It has a relatively high PE Ratio of 90.11, indicating investor confidence in future growth despite a recent slight drop. The stock's RSI of 52.79 suggests it is neither overbought nor oversold, maintaining a stable position in the market.
Relationship with Key Moving Averages
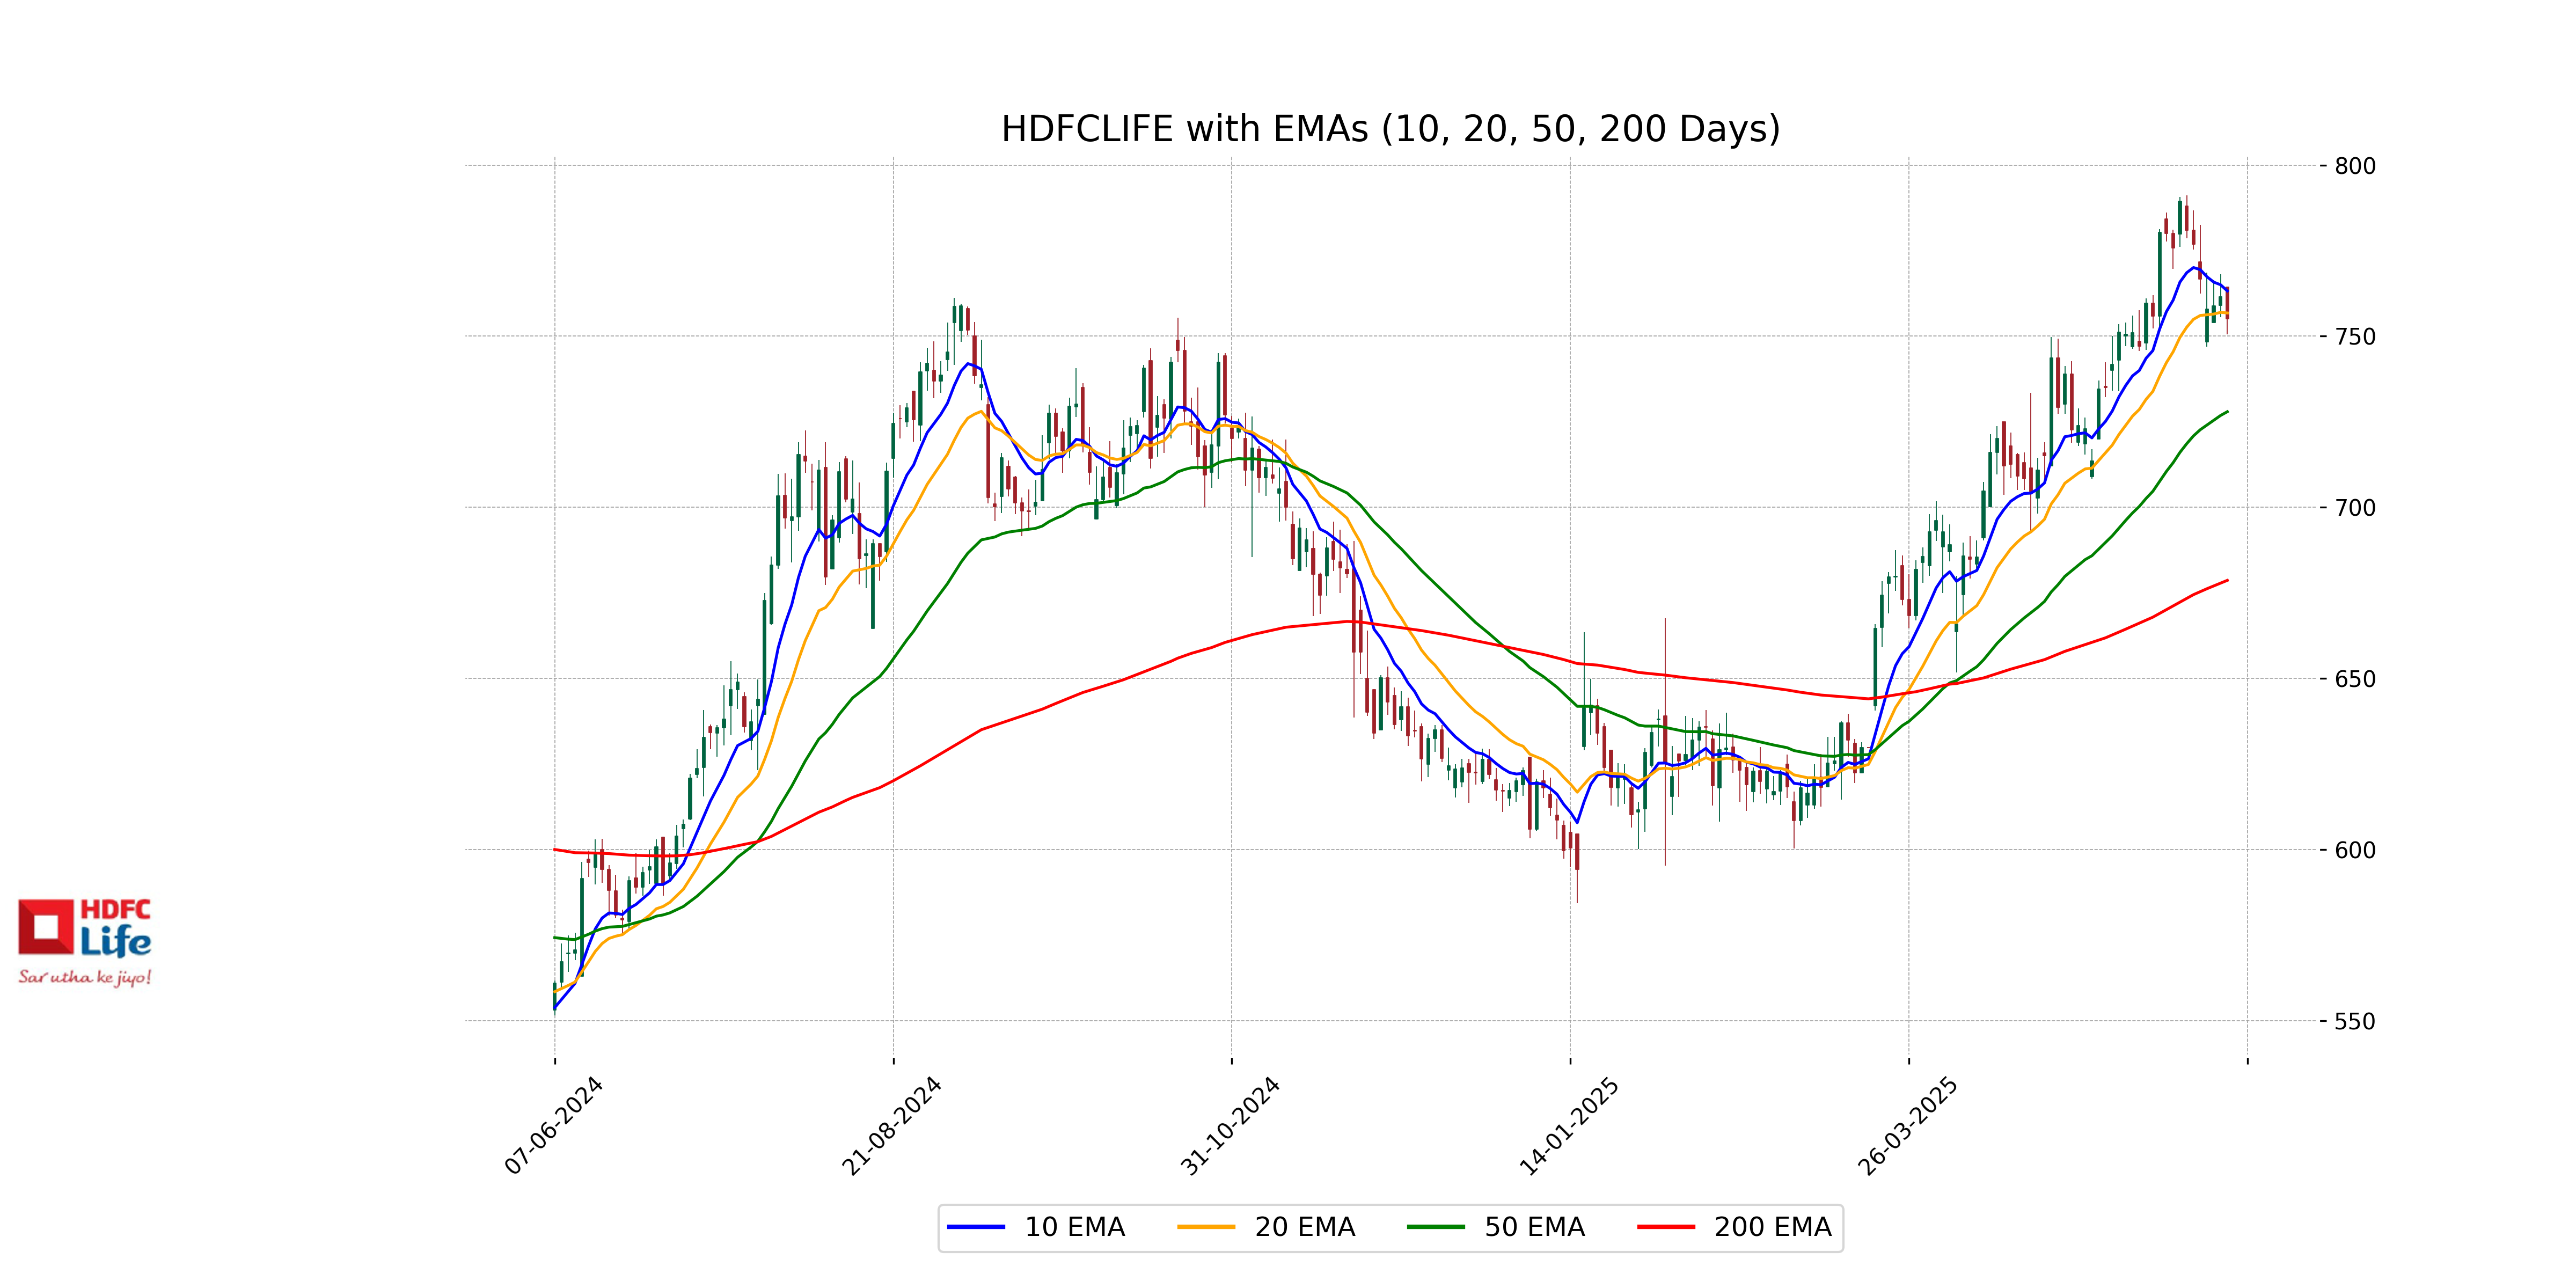
HDFC Life's current stock price of 755.10 is trading above its 50-day EMA of 727.95 and its 200-day EMA of 678.67, indicating a bullish trend. However, it is slightly below the 10-day EMA of 763.23 and close to the 20-EMA of 756.79, suggesting caution in the short term movement.
Moving Averages Trend (MACD)
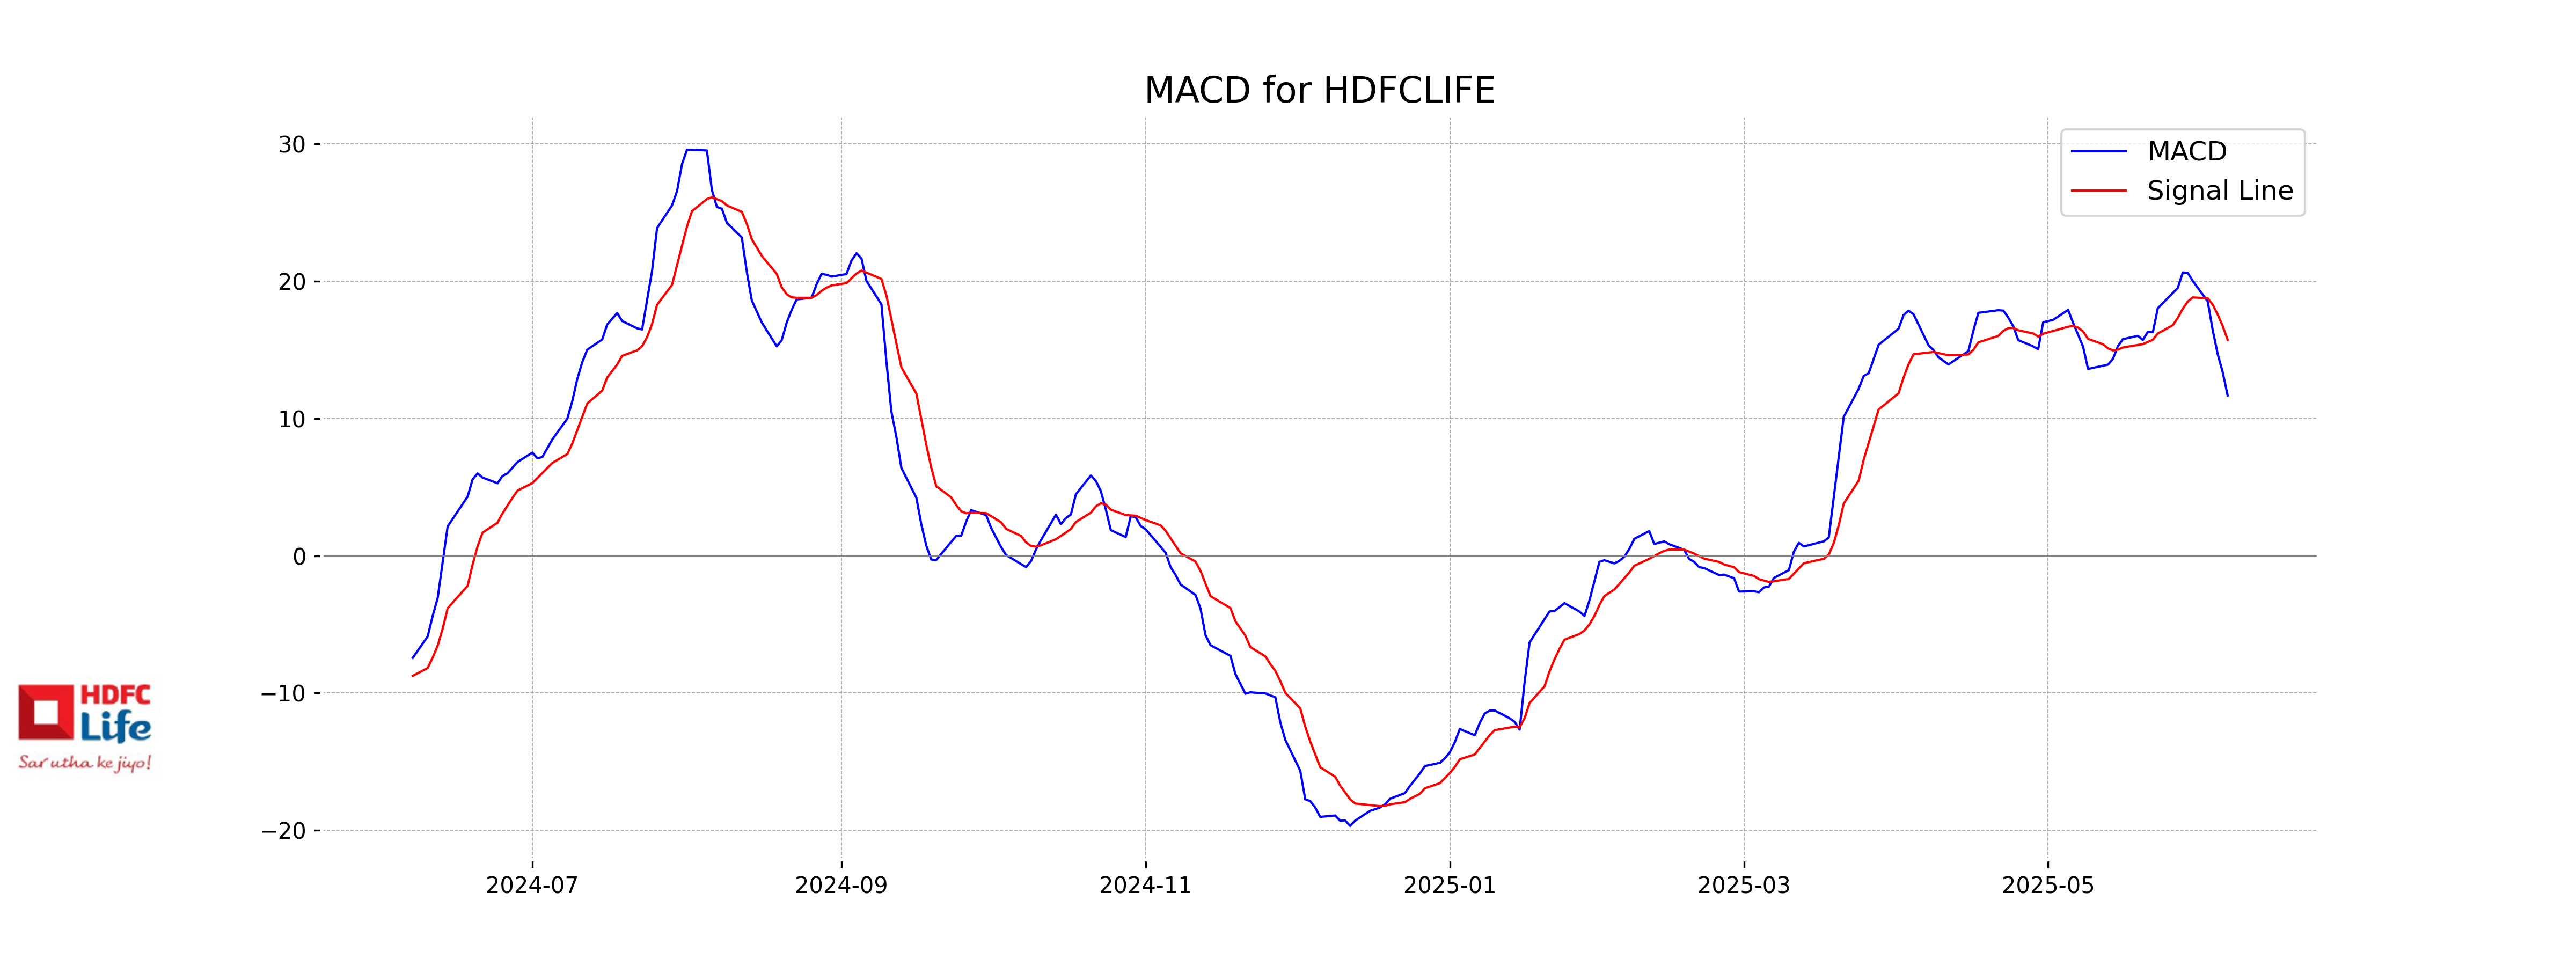
The MACD for HDFC Life shows a signal line crossover, with the MACD value of 11.67 being below the MACD Signal value of 15.72. This indicates a potential bearish trend. Investors might consider this as a sign of weakening momentum in the stock's recent performance.
RSI Analysis
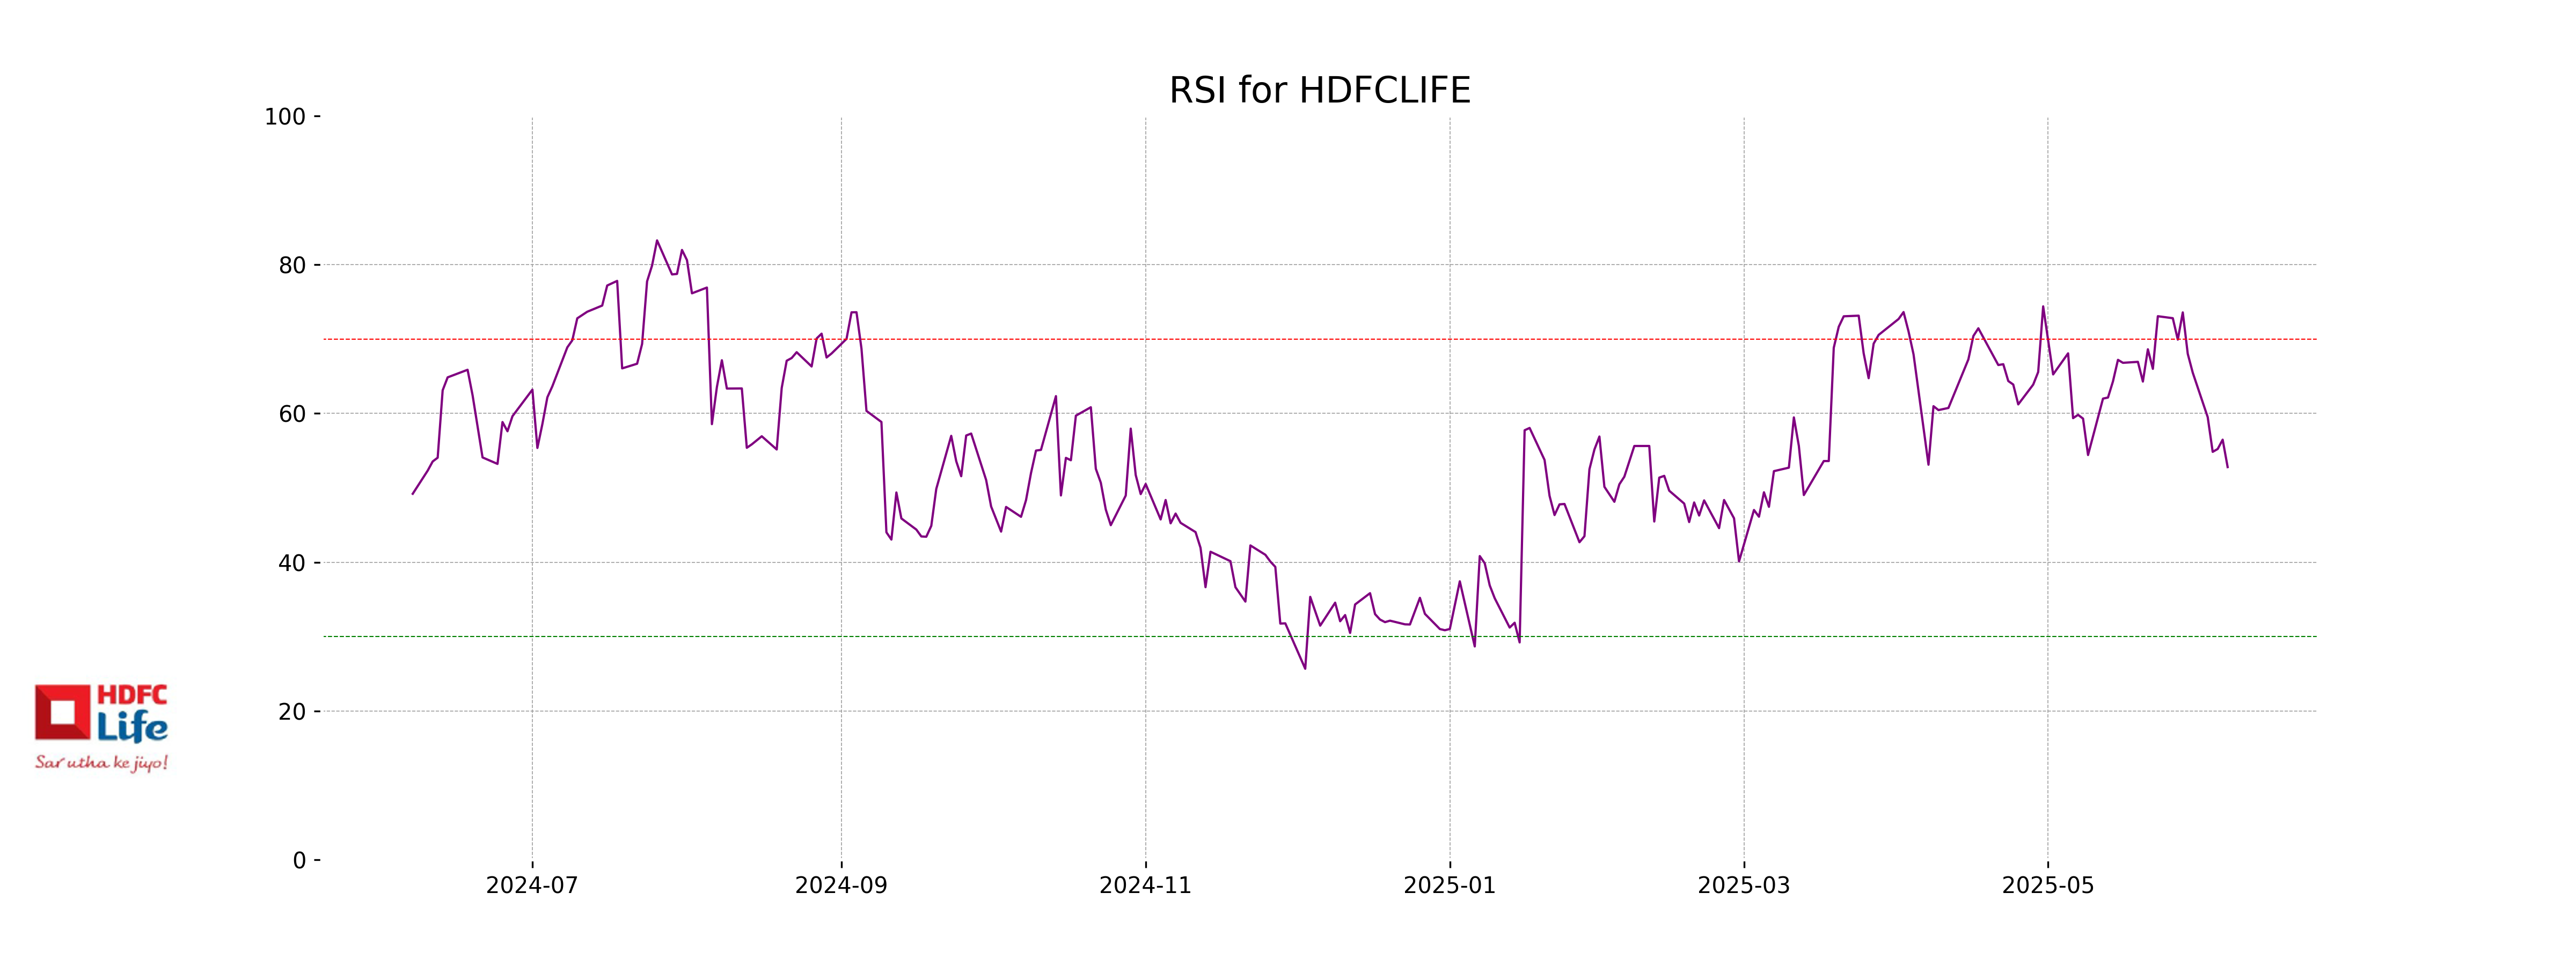
The RSI (Relative Strength Index) for HDFC Life is 52.79, which indicates a neutral trend. An RSI around 50 suggests that the stock is neither overbought nor oversold, signaling that recent price movements have been relatively balanced.
Analysis for SUN Pharma - June 06, 2025
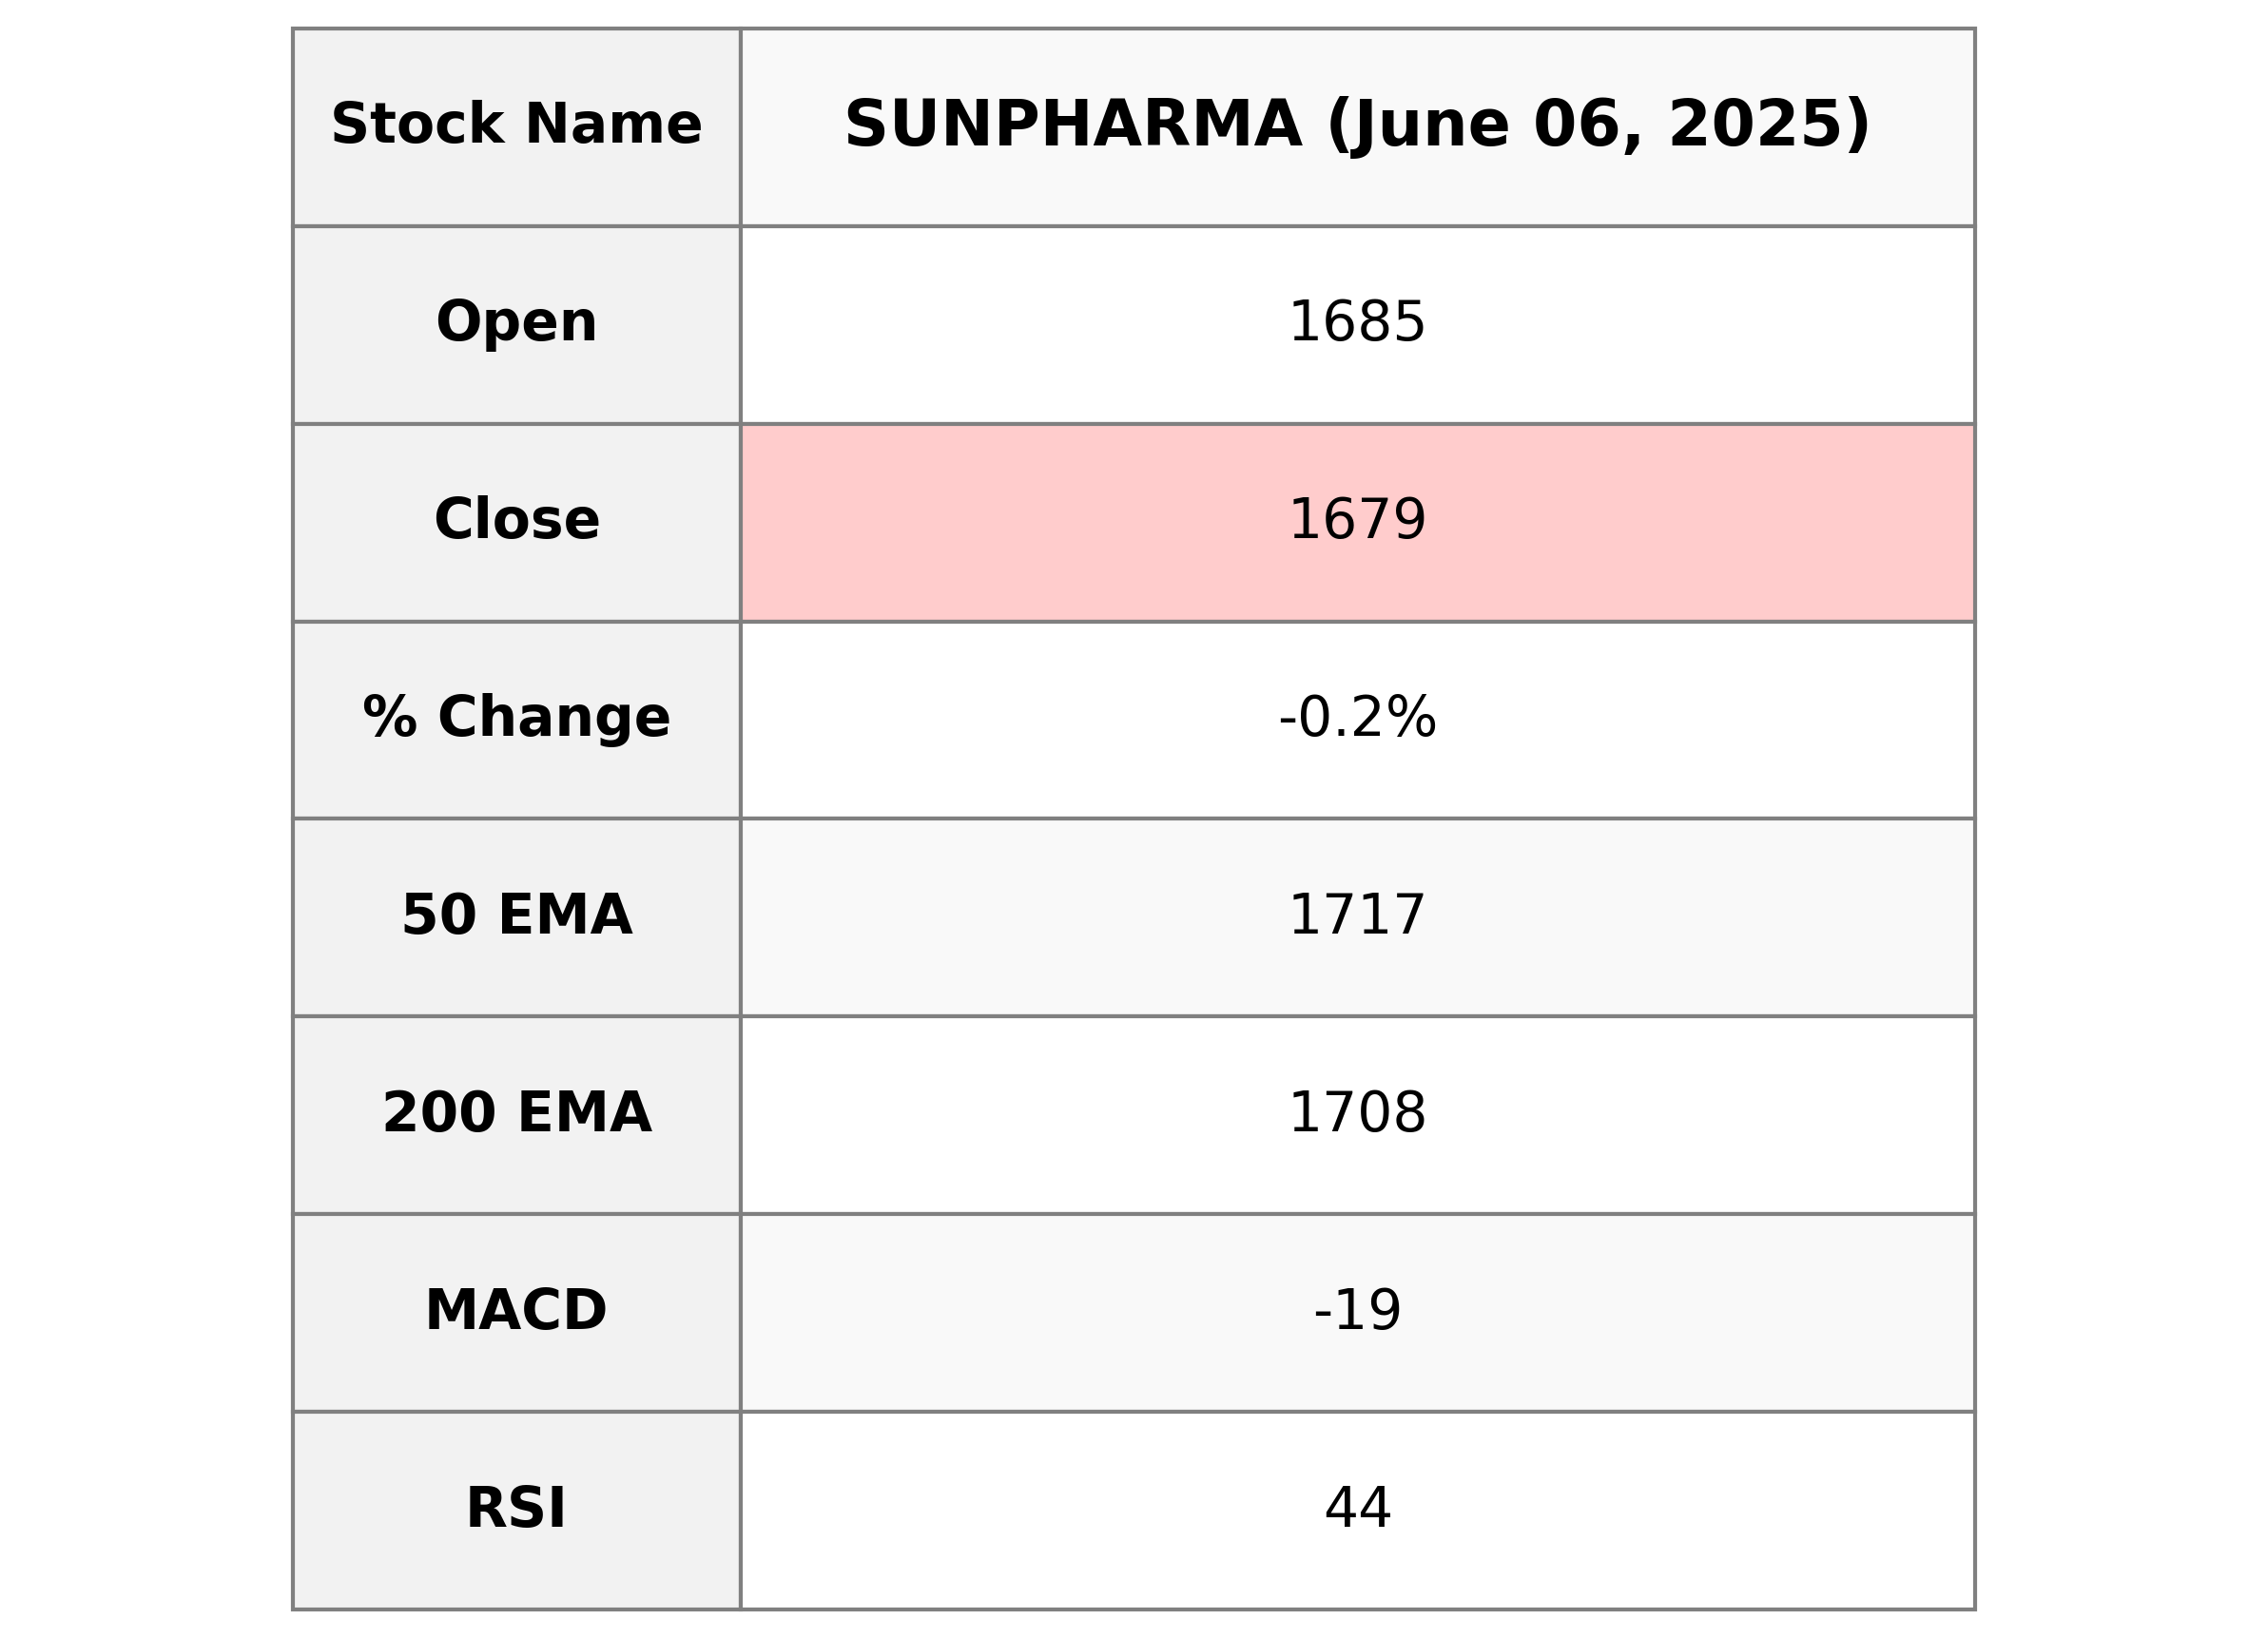
SUN Pharma Performance: The stock opened at 1685.0 and closed at 1679.20, experiencing a slight decline of 0.23% with a points change of -3.90. Trading volume was 2,500,031 shares. The stock's technical indicators suggest a bearish trend with the price trading below the 50-day and 20-day EMAs, while also facing negative MACD values. RSI indicates relatively weak momentum at 43.95. The company's market cap stands at approximately 4.03 trillion INR, with a PE ratio of 36.82. SUN Pharma operates within the Healthcare sector, specifically in the Drug Manufacturers - Specialty & Generic industry in India.
Relationship with Key Moving Averages
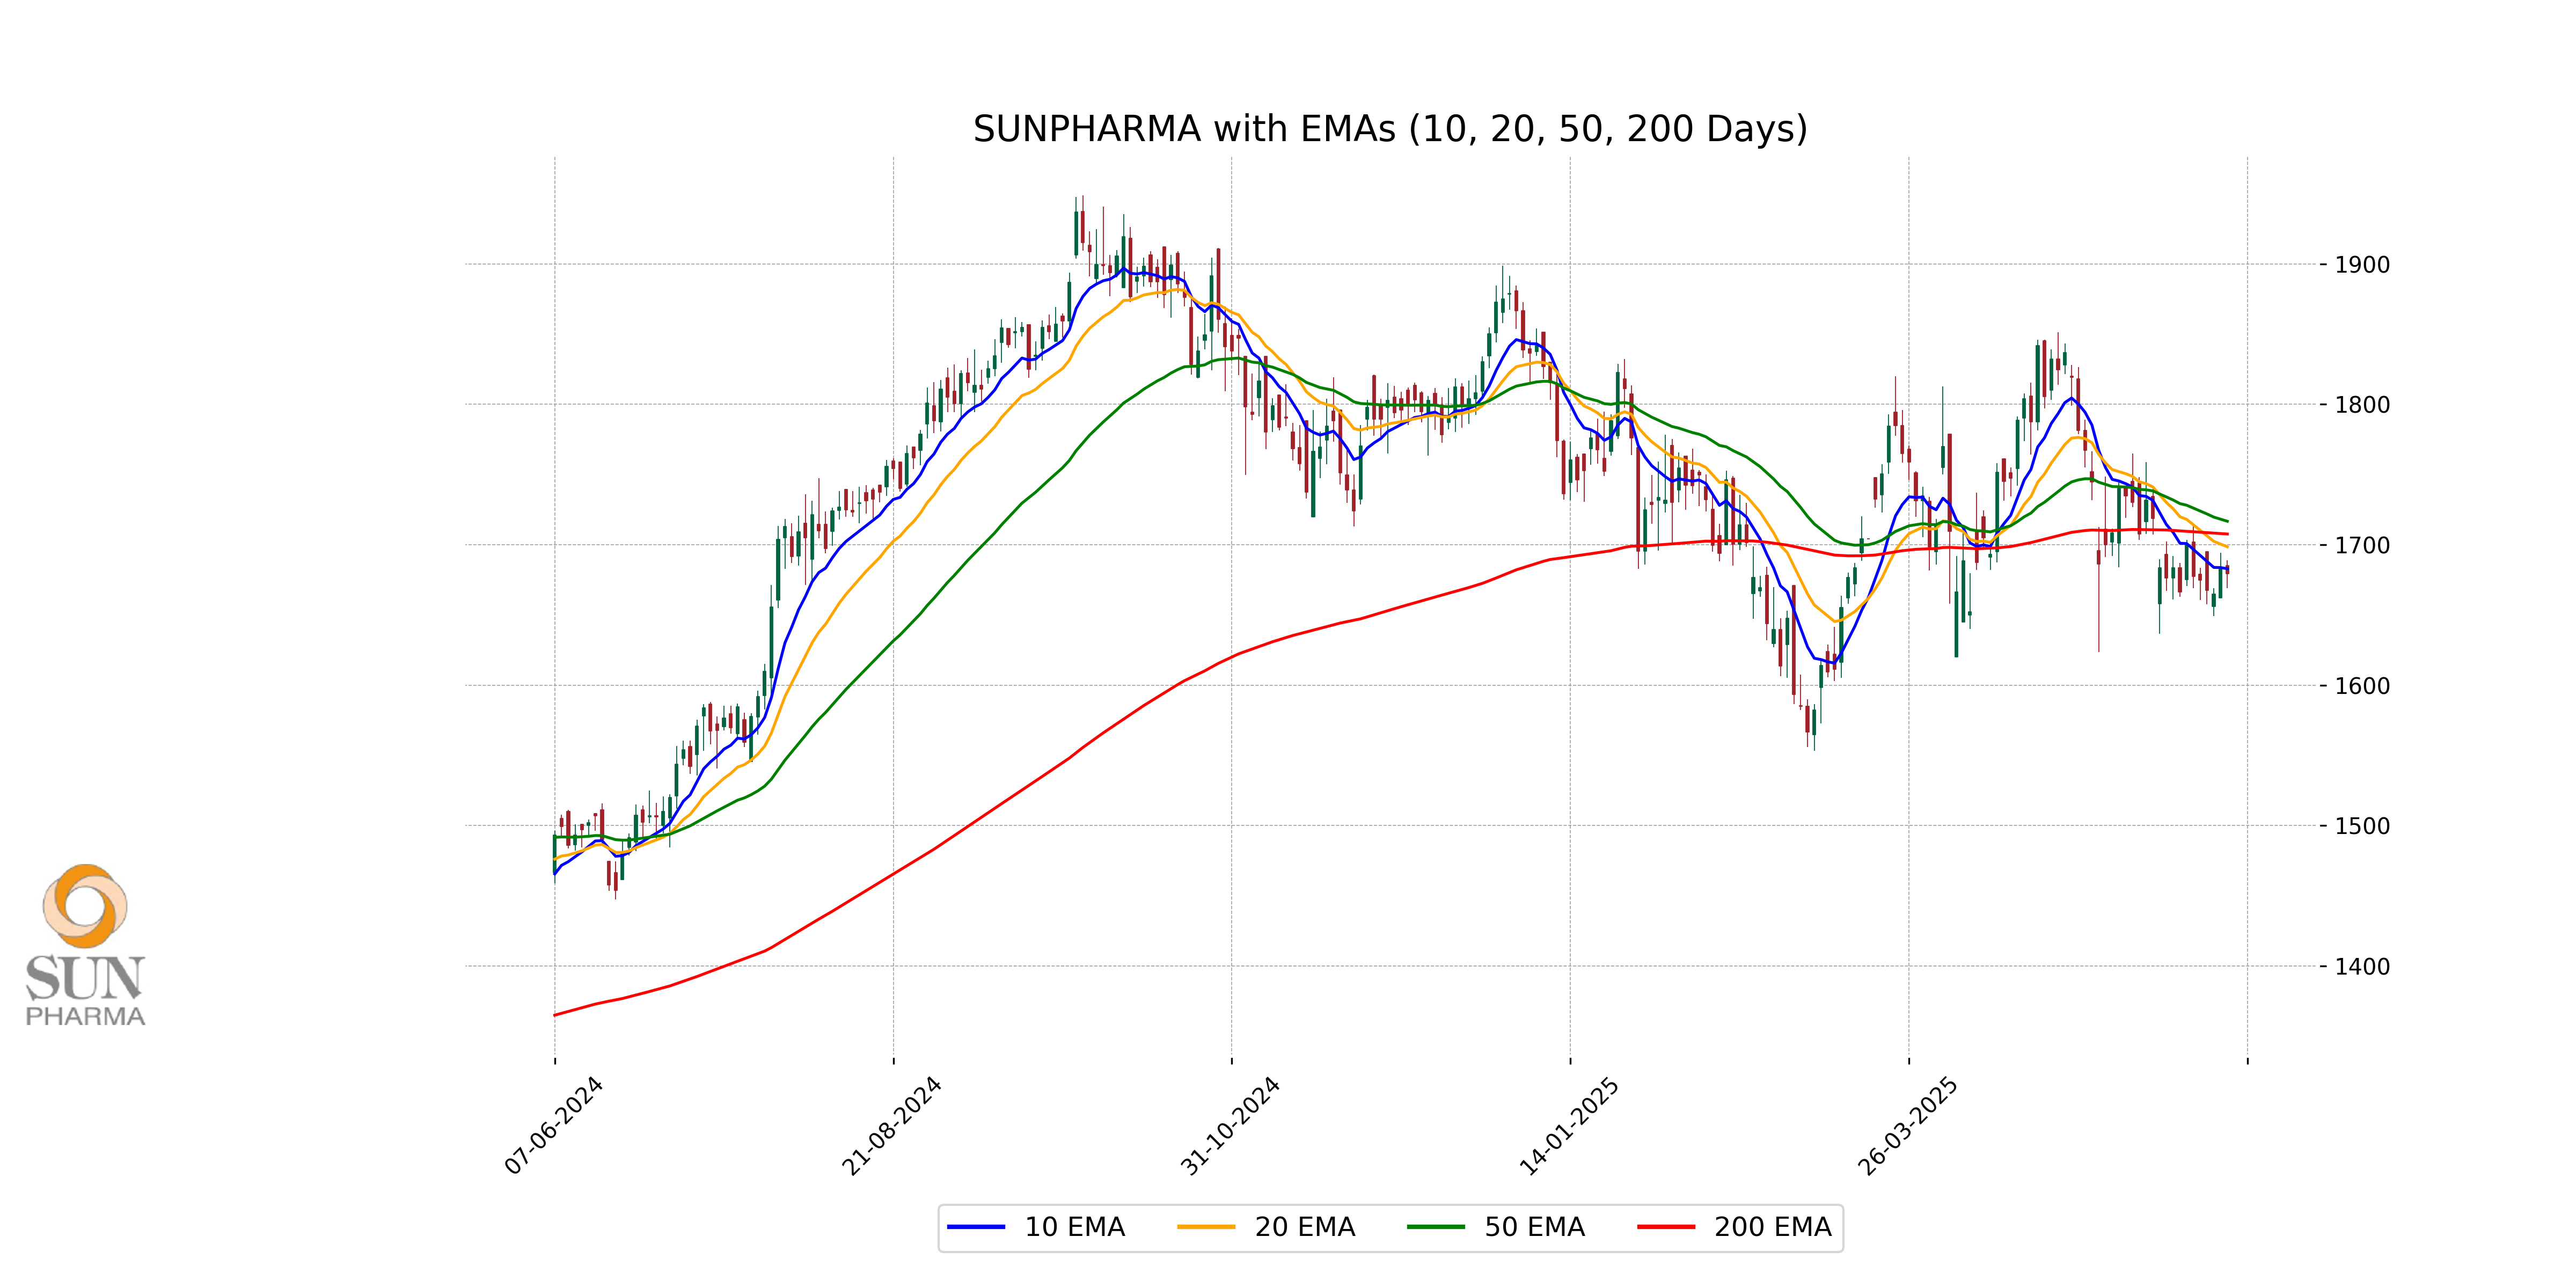
SUN Pharma's current stock price of 1679.20 is below its 50-day EMA of 1716.67, indicating a potential downtrend. It is also below its 200-day EMA of 1707.59, suggesting bearish momentum. However, it is slightly below the 10-day EMA of 1682.87, hinting at possible short-term consolidation or support.
Moving Averages Trend (MACD)
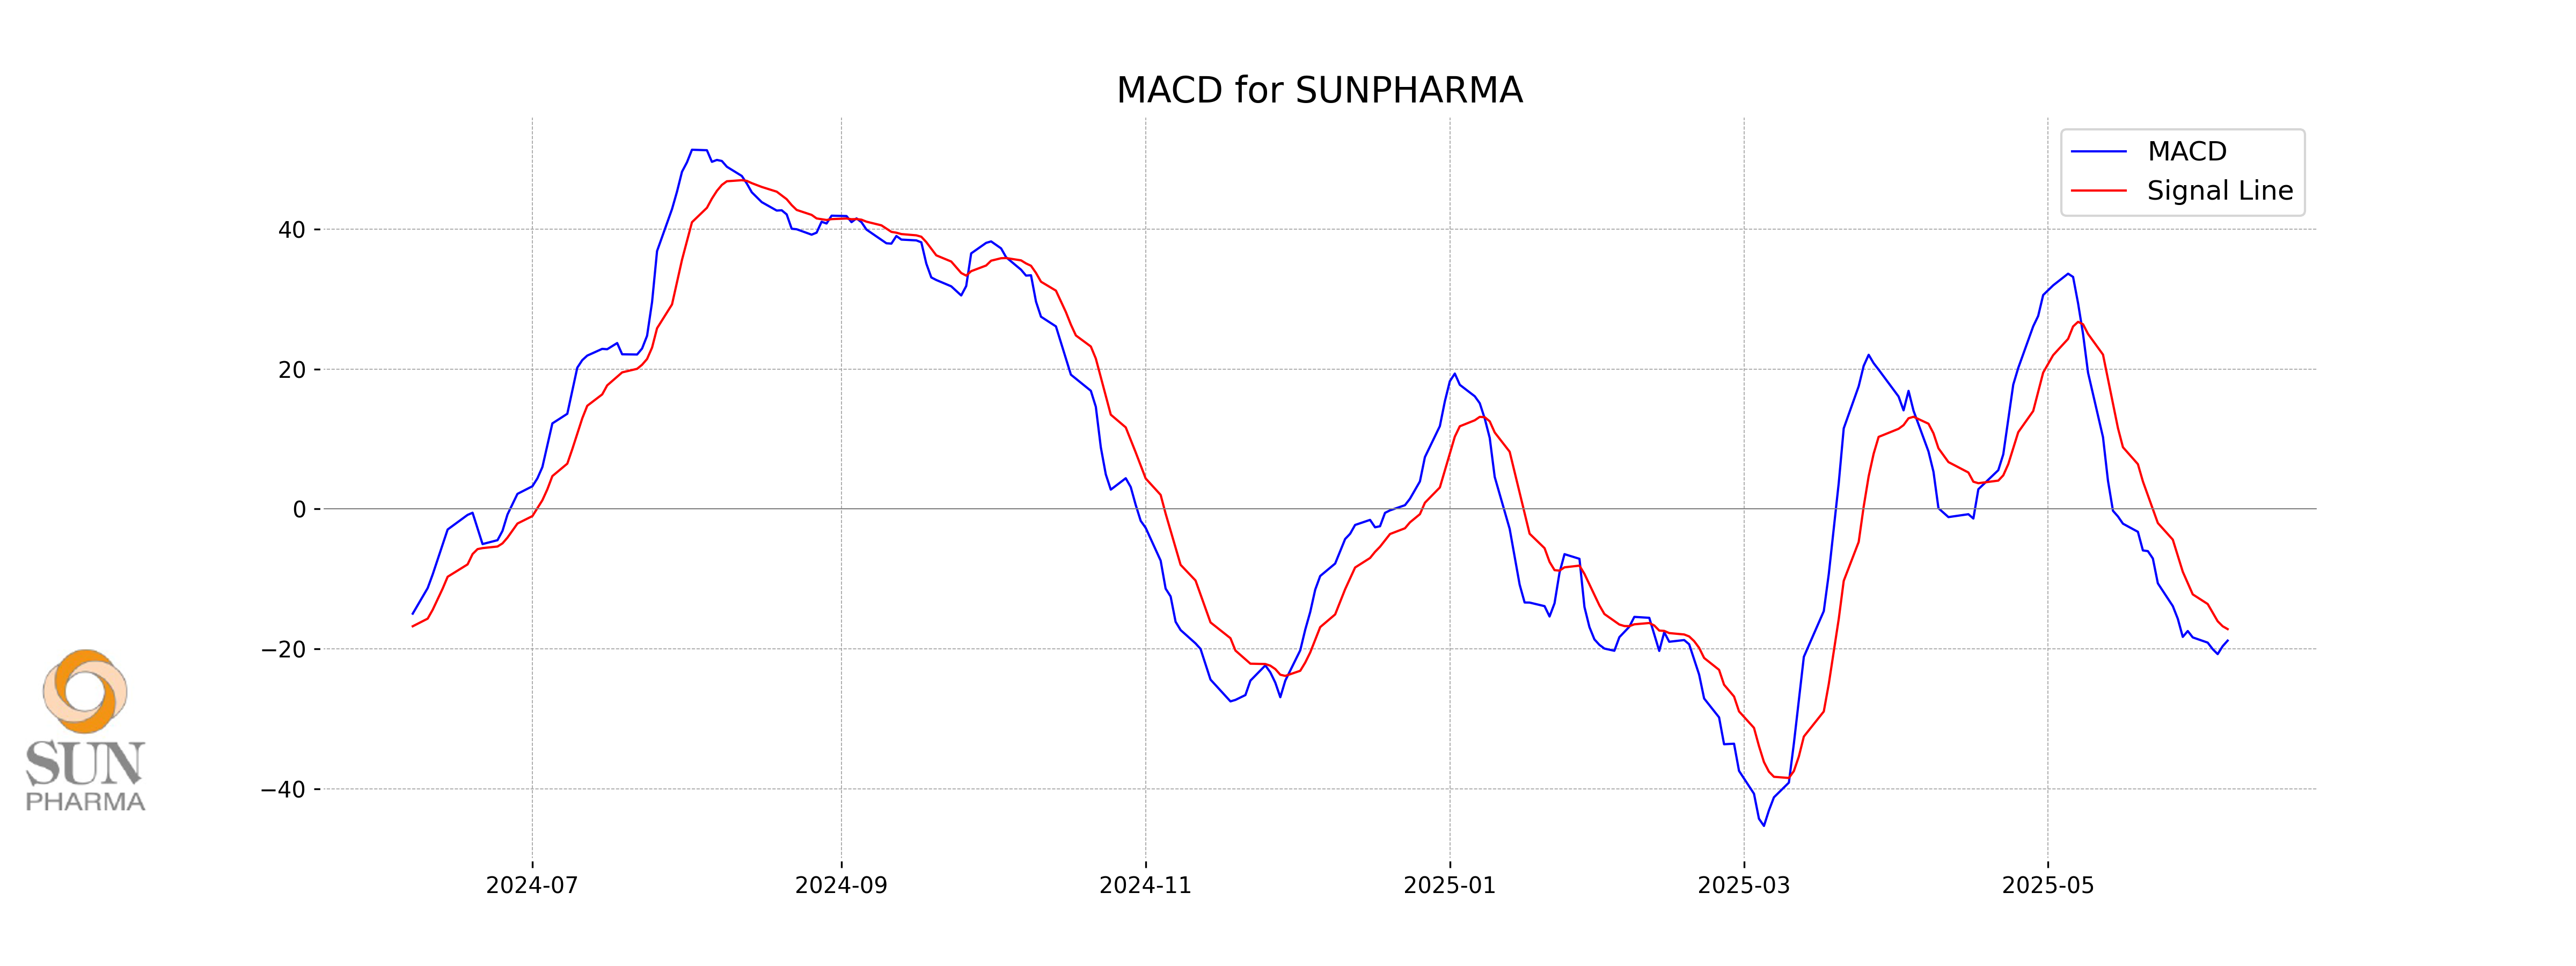
Based on the provided data, Sun Pharma's MACD is currently at -18.83, which is below the MACD Signal line of -17.19. This suggests a bearish trend, indicating that the stock may continue to face downward momentum in the short term.
RSI Analysis
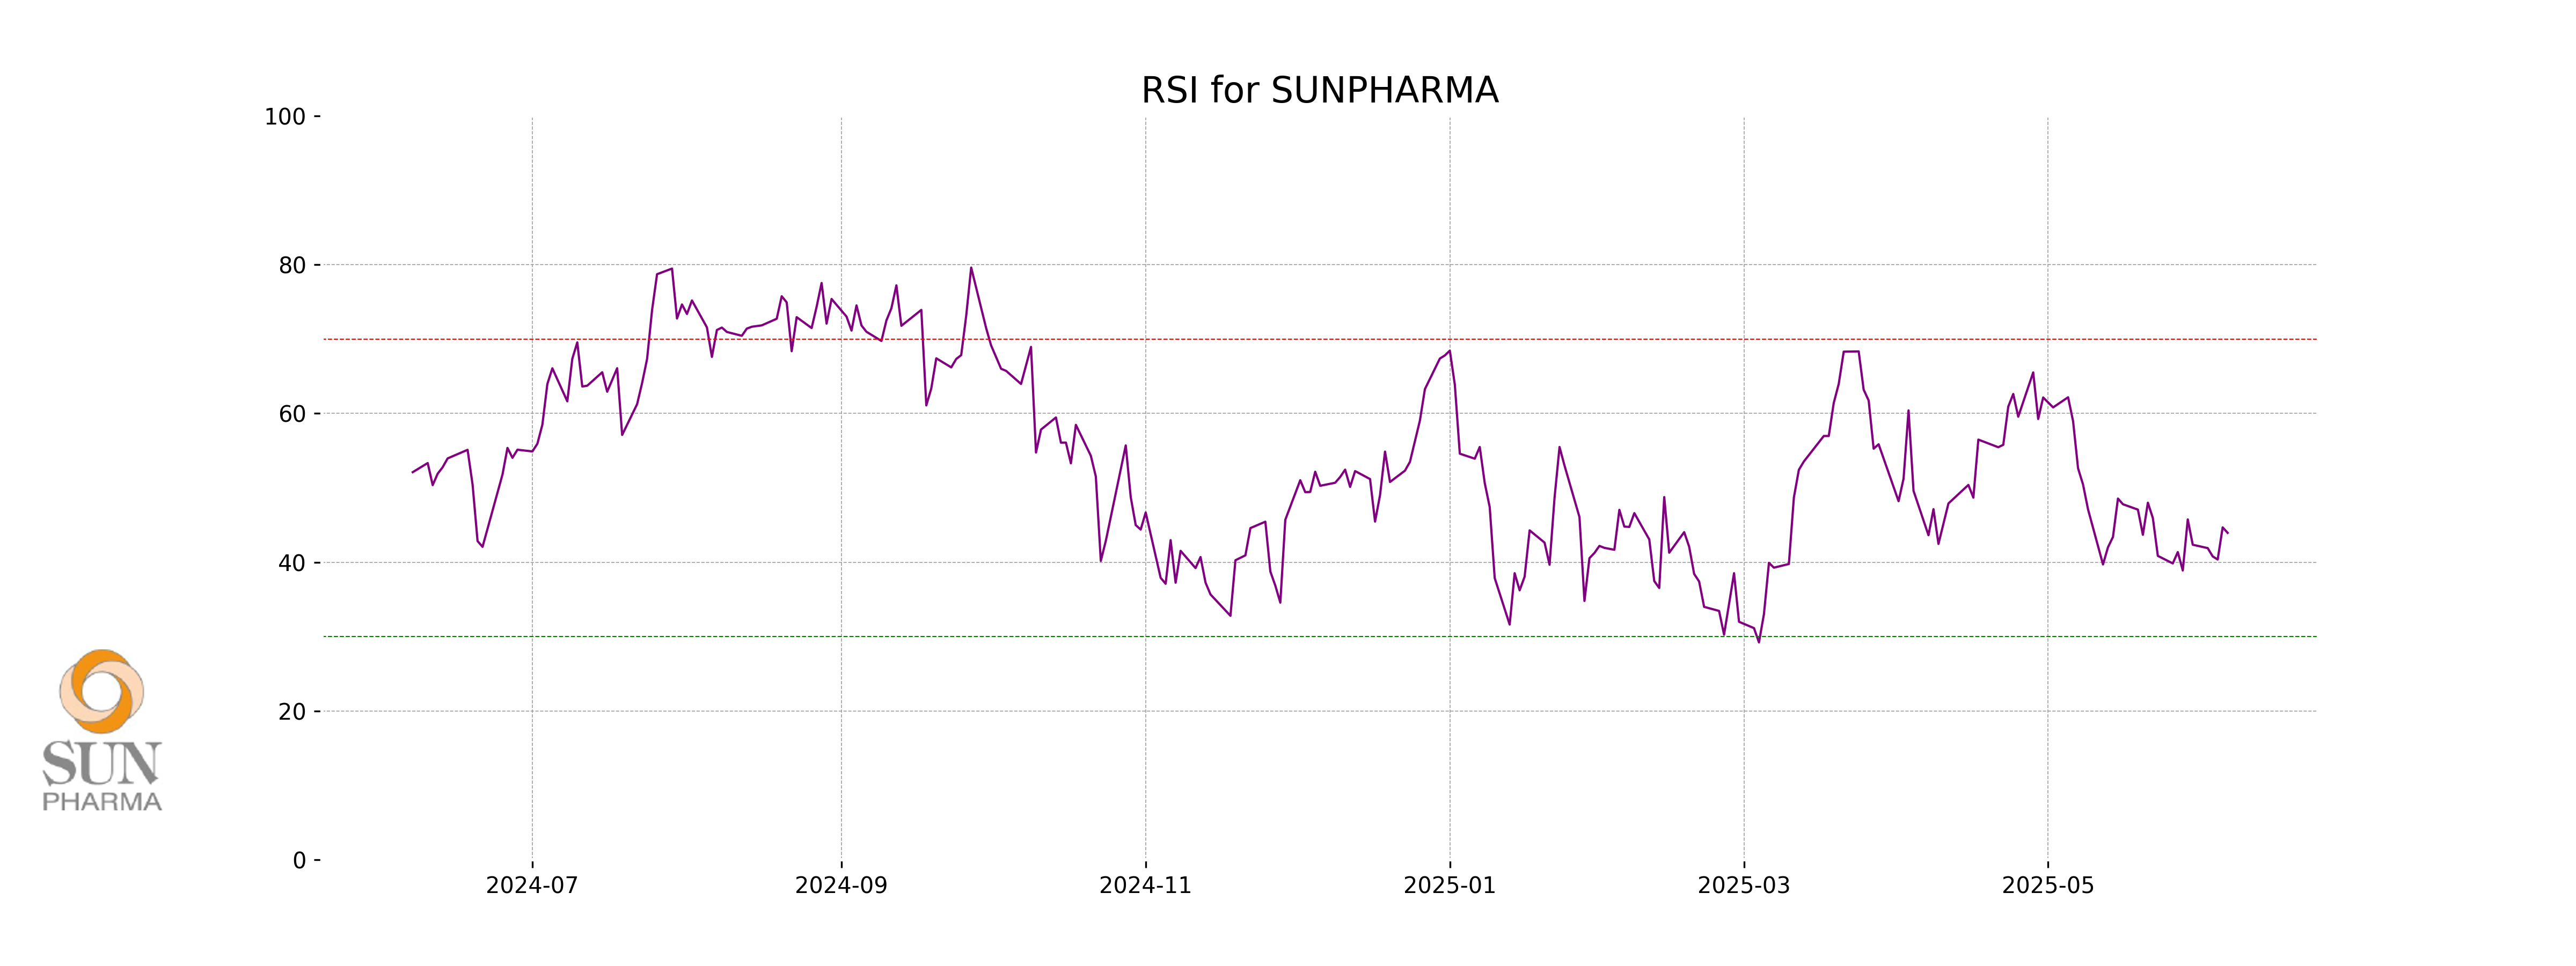
The RSI (Relative Strength Index) for SUN Pharma is 43.95, which suggests that the stock is relatively neutral but slightly leaning toward the oversold territory as it is below 50. A value below 30 typically indicates oversold conditions, potentially signaling a buying opportunity, while values above 70 indicate overbought conditions.
Analysis for Tata Steel - June 06, 2025
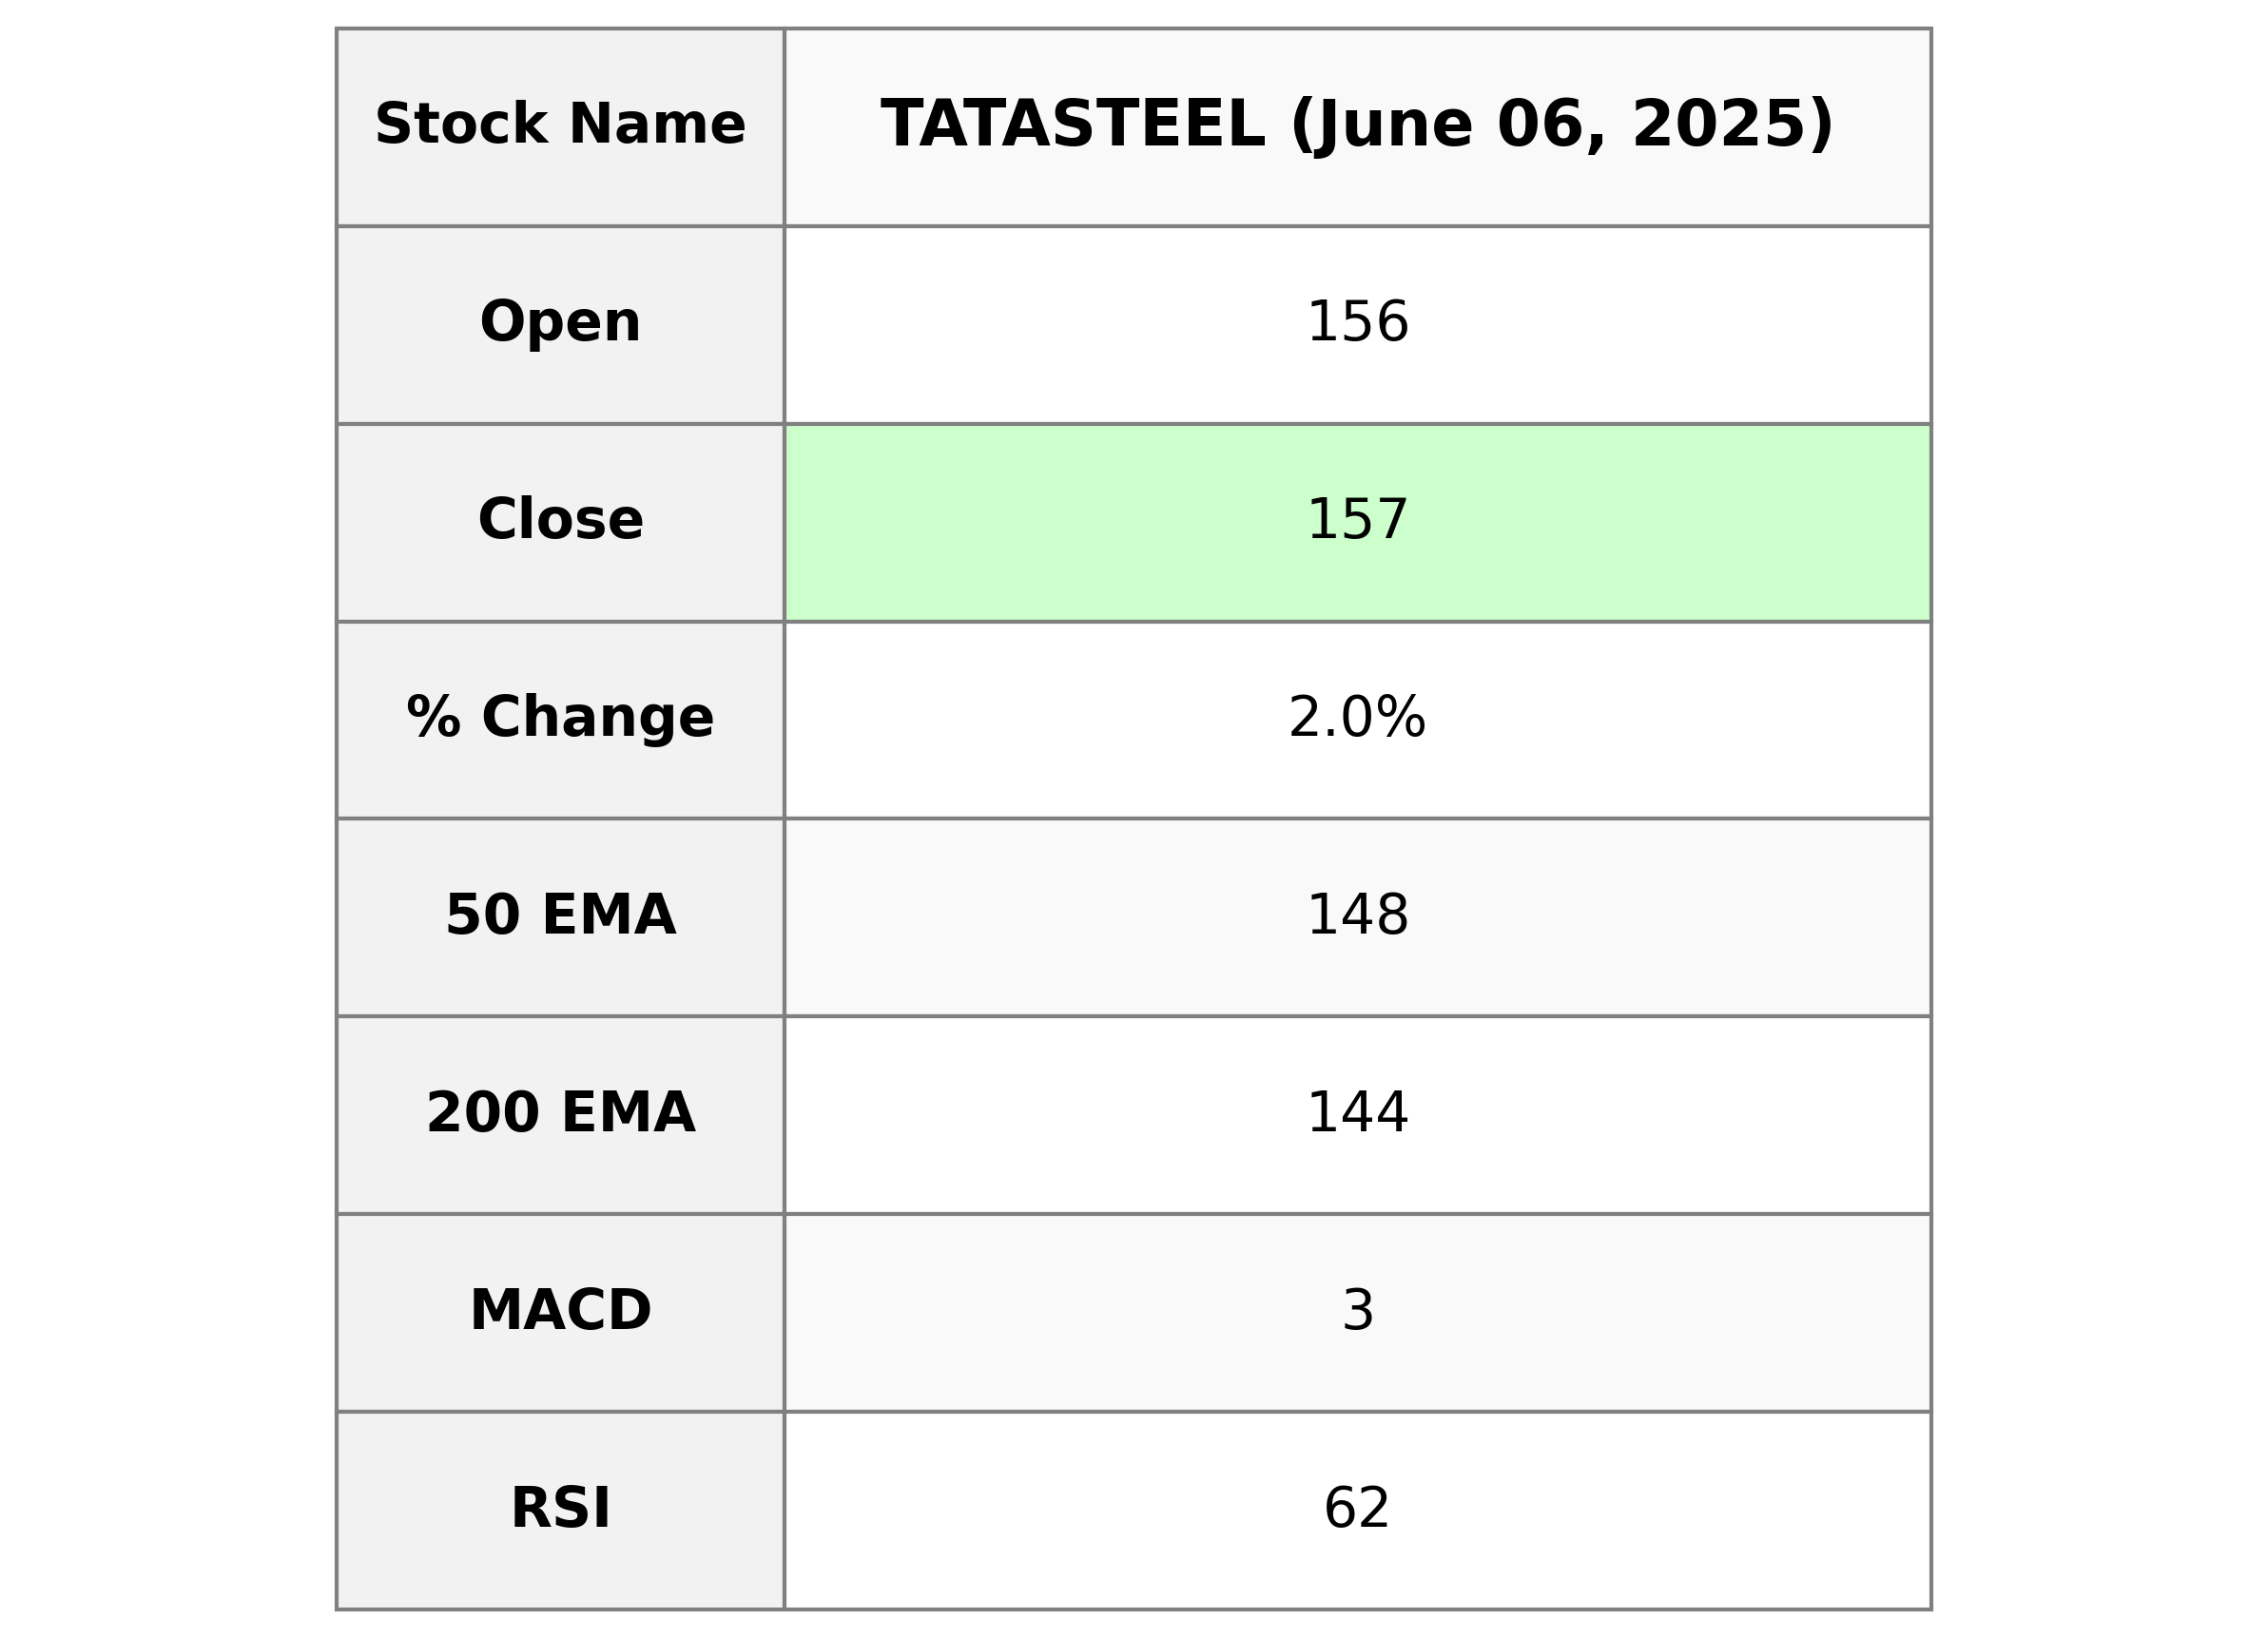
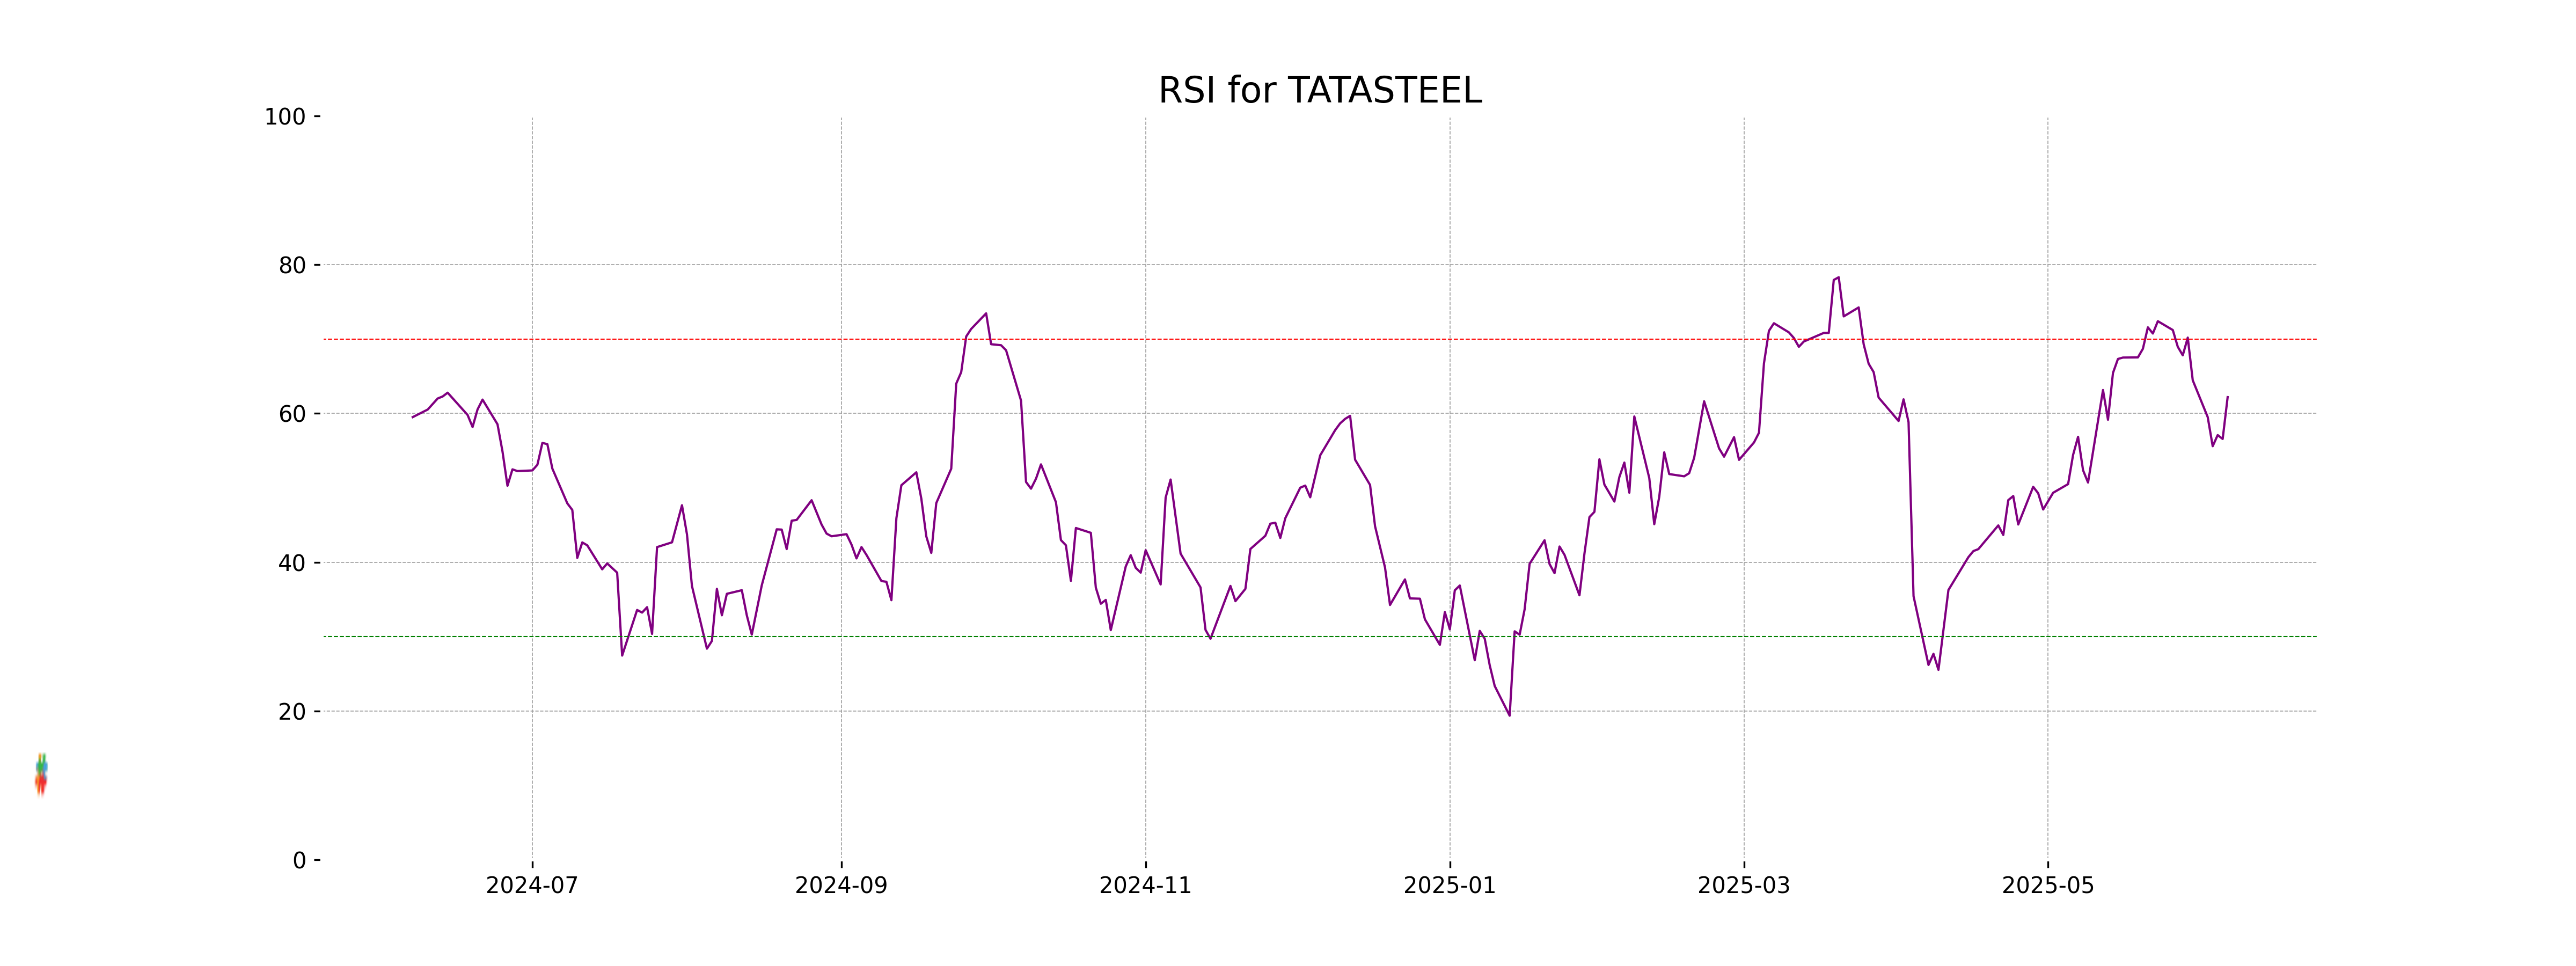
Tata Steel exhibited a positive performance with a closing price of 157.49, marking a 2.02% increase from the previous close. The stock traded significantly above both its 50-day and 200-day EMAs, indicating a strong upward trend. With an RSI of 62.20, the stock suggests a mildly bullish momentum.
Relationship with Key Moving Averages
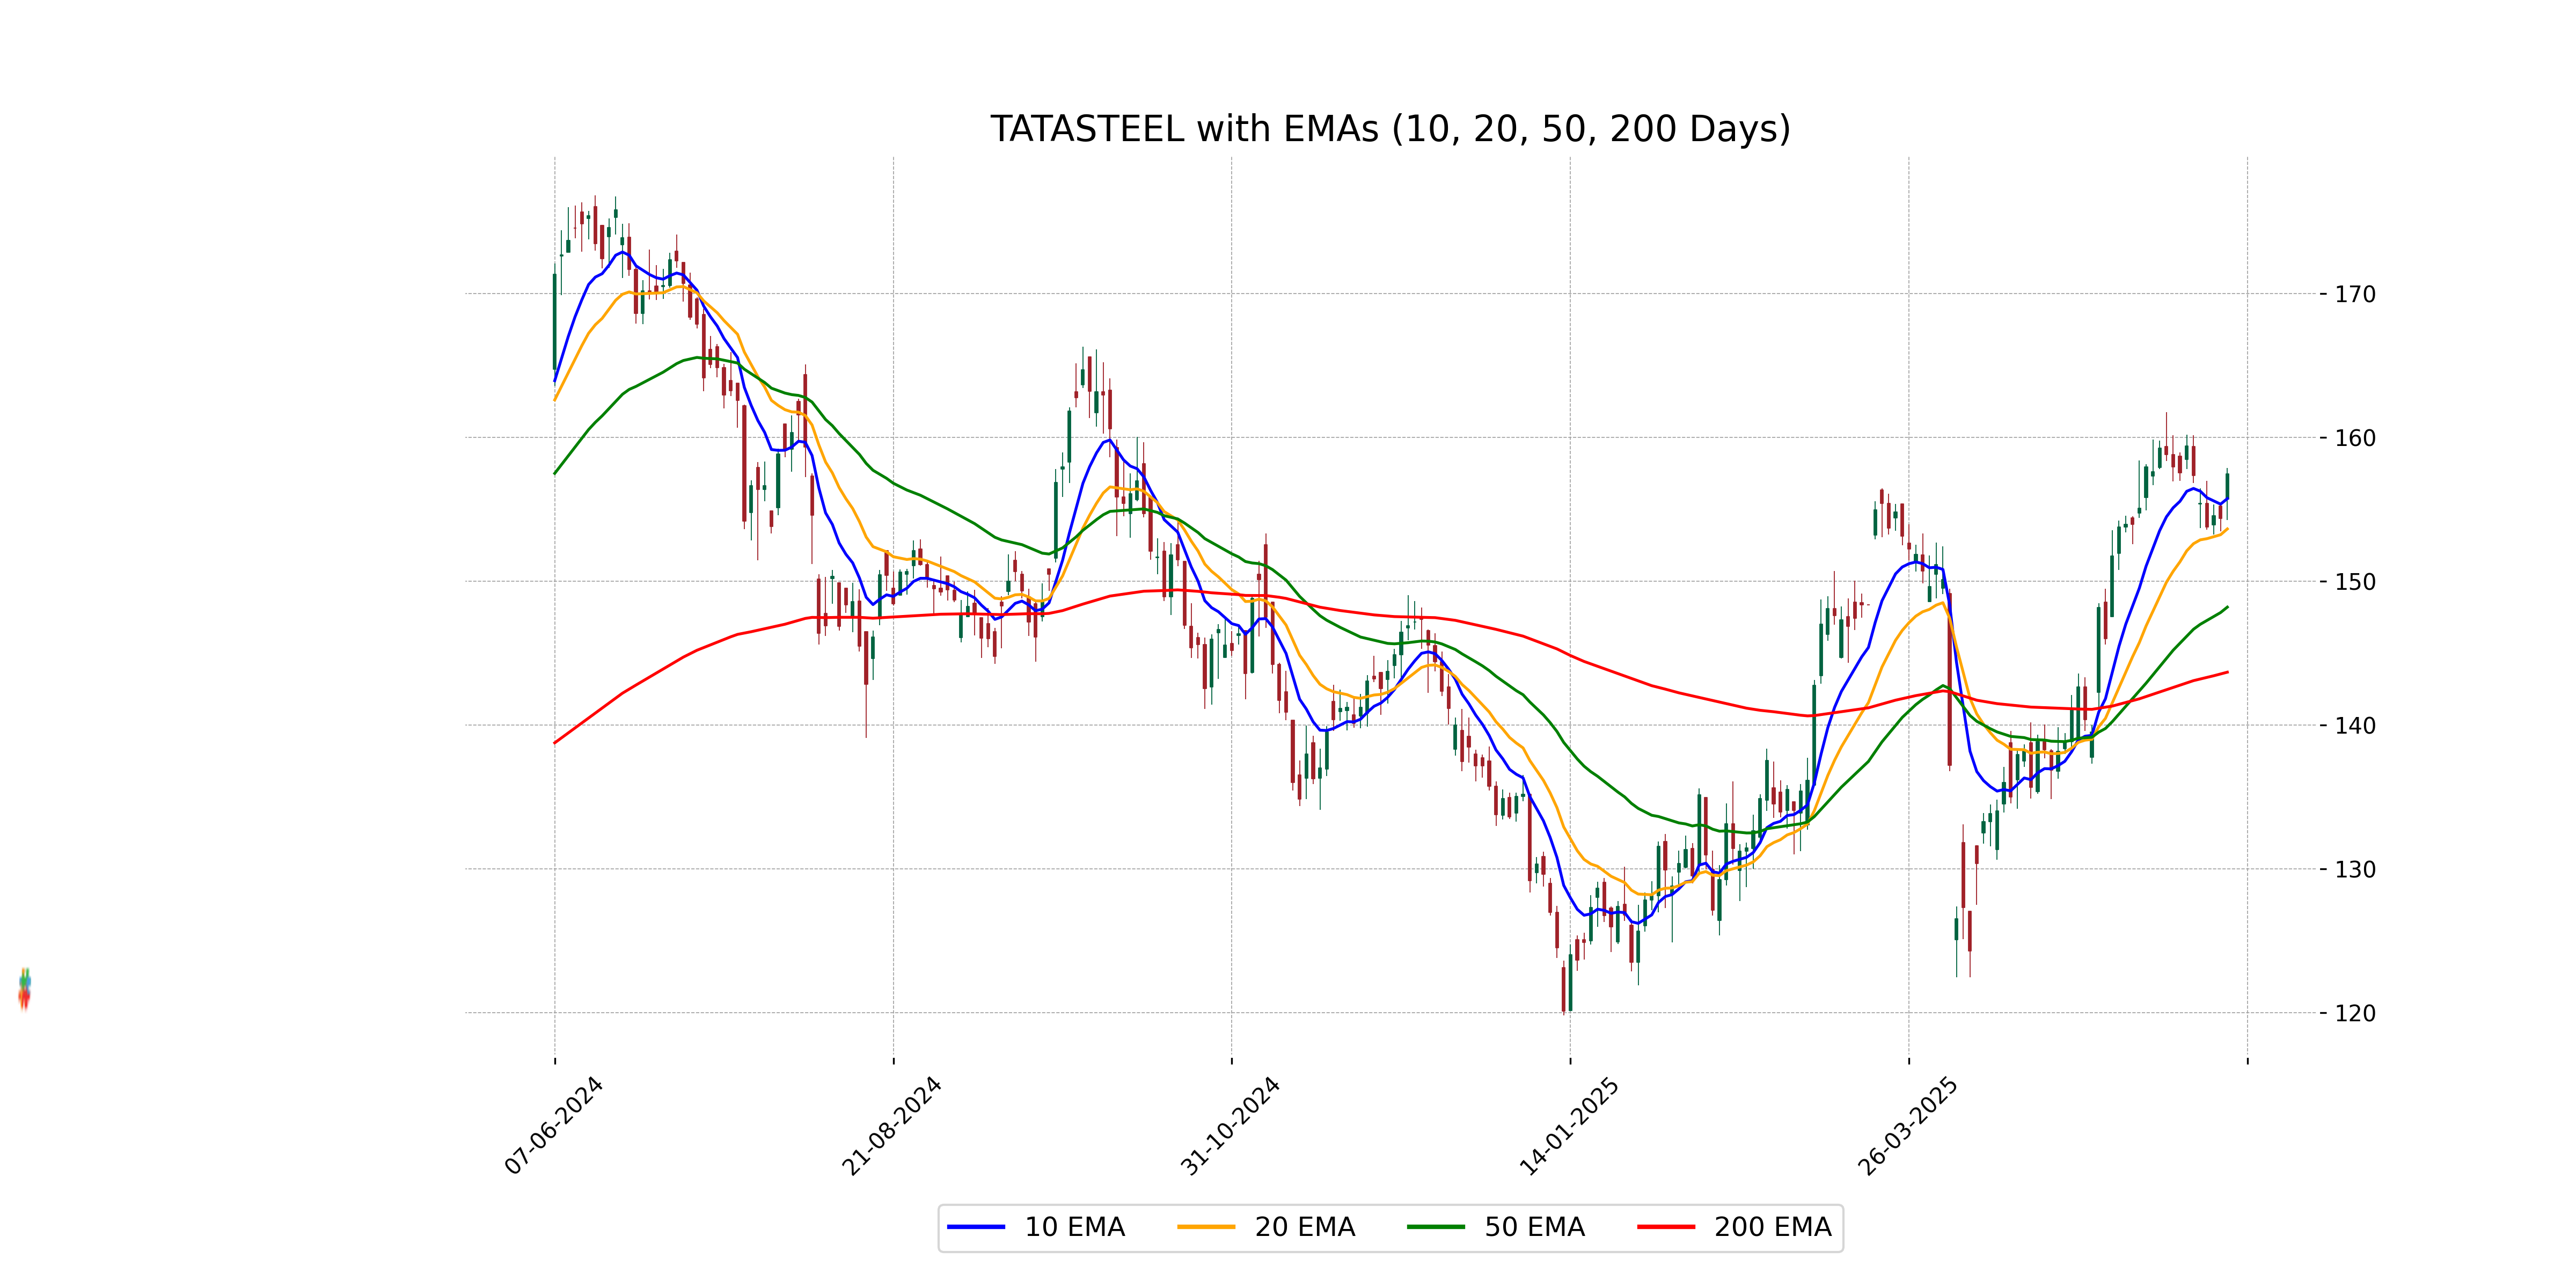
For Tata Steel, the closing price of 157.49 is above the 50-day EMA (148.21), 200-day EMA (143.68), 10-day EMA (155.75), and 20-day EMA (153.64), indicating a strong positive trend. This suggests continued bullish momentum as the stock trades above major moving averages.
Moving Averages Trend (MACD)
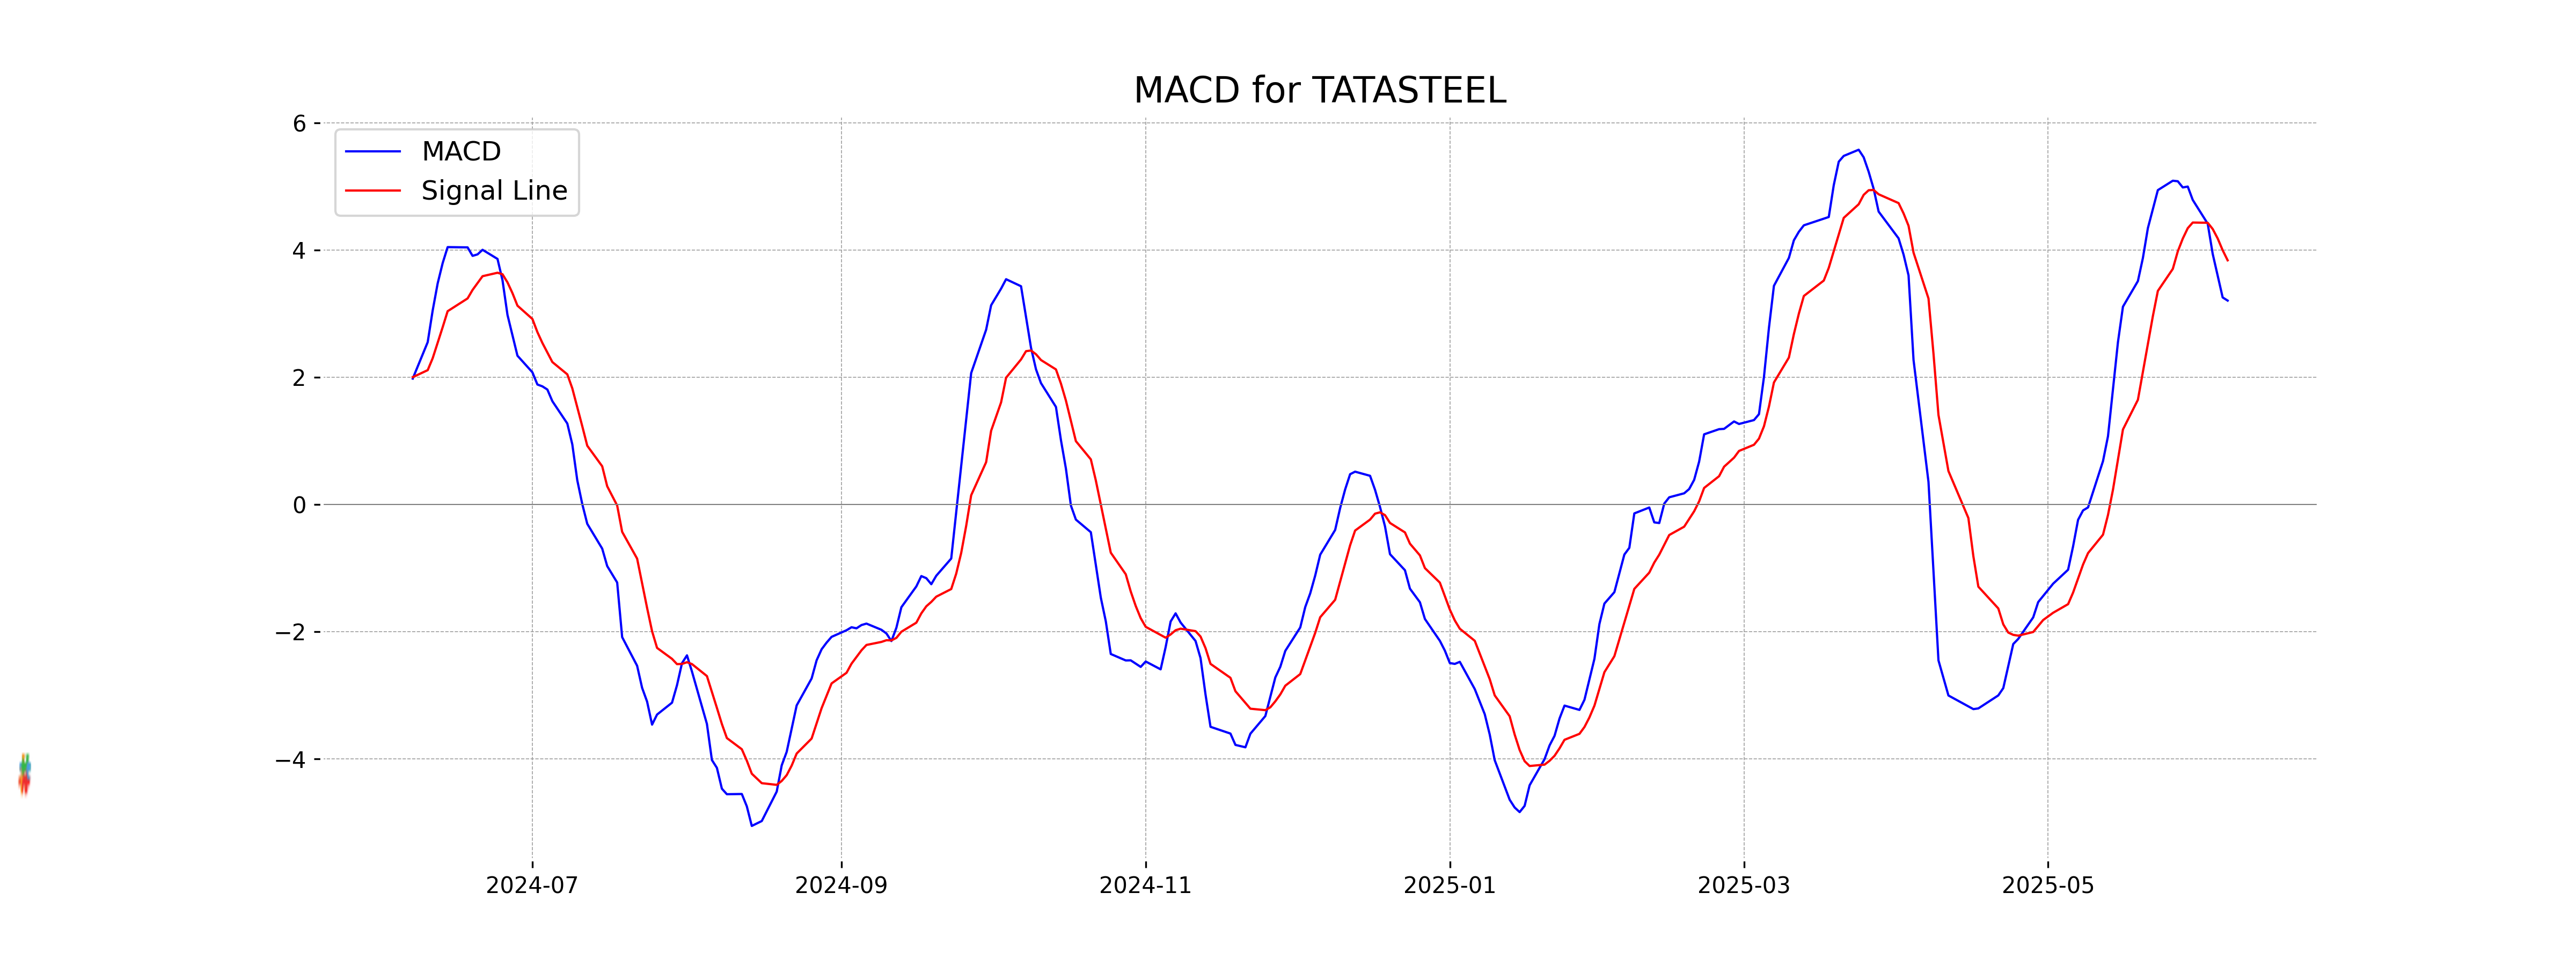
Tata Steel's current MACD value is below its MACD Signal line, indicating potential bearish momentum. With the MACD at 3.20 and the Signal at 3.84, the stock might experience some short-term selling pressure. Investors should monitor the MACD line for a potential crossover as an indicator of a trend reversal.
RSI Analysis
The Relative Strength Index (RSI) for Tata Steel is 62.20, which suggests that the stock is currently in a neutral to slightly overbought zone. With the RSI above 60, it indicates that the stock might be experiencing a stronger upward momentum, though it has not yet reached overbought conditions typically defined by an RSI of 70 or above.
