


Highlights
- Adani Ports surges above EMAs with bullish MACD
- Reliance, SBI Life enter overbought RSI territory
- IndusInd Bank, Bajaj Finance show mixed momentum
Latest news

Gabion Technologies India Limited Announces H2 FY26 & FY26 Results

moto g37 Power With 7000 mAh Battery Goes on Sale at Rs. 15,999; moto g37 & moto buds 2 Now Available From Rs. 13,999 & Rs. 2,799

GAIL net profit reached Rs 6,968 crore in FY26 amid global geopolitical headwinds

Bihar AI Summit 2026 highlights Bihar's vision to lead India's intelligence revolution through Artificial Intelligence and emerging technologies

SIDBI partners with RRBs to expand MSME loans in rural India: CMD Manoj Mittal

Marushika Technology Limited Achieves FY26 Revenue of RS 11,643 Lakhs; PAT Rises 43% YoY

How a Demat Account Works and What to Expect When You Open One

How Meta is reshaping its operations to become an AI powerhouse
Top 5 Nifty 50 gainers today – May 2, 2025: Biggest stock moves


In this article, we will explore the technical indicators of some of the high-performing stocks on the Indian stock market, including ADANIPORTS, BAJFINANCE, INDUSINDBK, RELIANCE, and SBILIFE.
By looking at these stocks through the lens of key technical factors, we aim to better understand their price movements, trends, and potential future performance.

Analysis for Adani Ports - May 02, 2025

Stock Name: Adani Ports Performance Description: Adani Ports opened at 1255.0 and closed at 1267.10, marking a 4.16% increase with a points change of 50.60. It showed strong performance compared to its previous close of 1216.5 and is trading above key EMAs. The volume was 12,022,967, with a robust RSI of 64.06 indicating positive momentum. The market cap stands at 2,738,240,880,640 INR, and its PE Ratio is 27.05, situating it within the Industrials sector, specifically in Marine Shipping in India.

Relationship with Key Moving Averages
Adani Ports closed at 1267.10, which is above its 50-day EMA of 1179.54 and 200-day EMA of 1219.98, indicating a bullish trend against these averages. Additionally, it is also above the 10-day EMA of 1223.46 and 20-day EMA of 1206.82, suggesting short-term positive momentum.
Moving Averages Trend (MACD)
MACD Analysis for Adani Ports: Adani Ports' MACD value is 21.69, with a signal line of 20.31. The MACD being above the signal line indicates bullish momentum, suggesting a potential upward trend.

RSI Analysis
The RSI (Relative Strength Index) for Adani Ports is 64.06, which suggests that the stock is approaching the overbought territory. This indicates that the stock is experiencing upward momentum, but traders should be cautious of potential pullbacks.

Analysis for Bajaj Finance - May 02, 2025
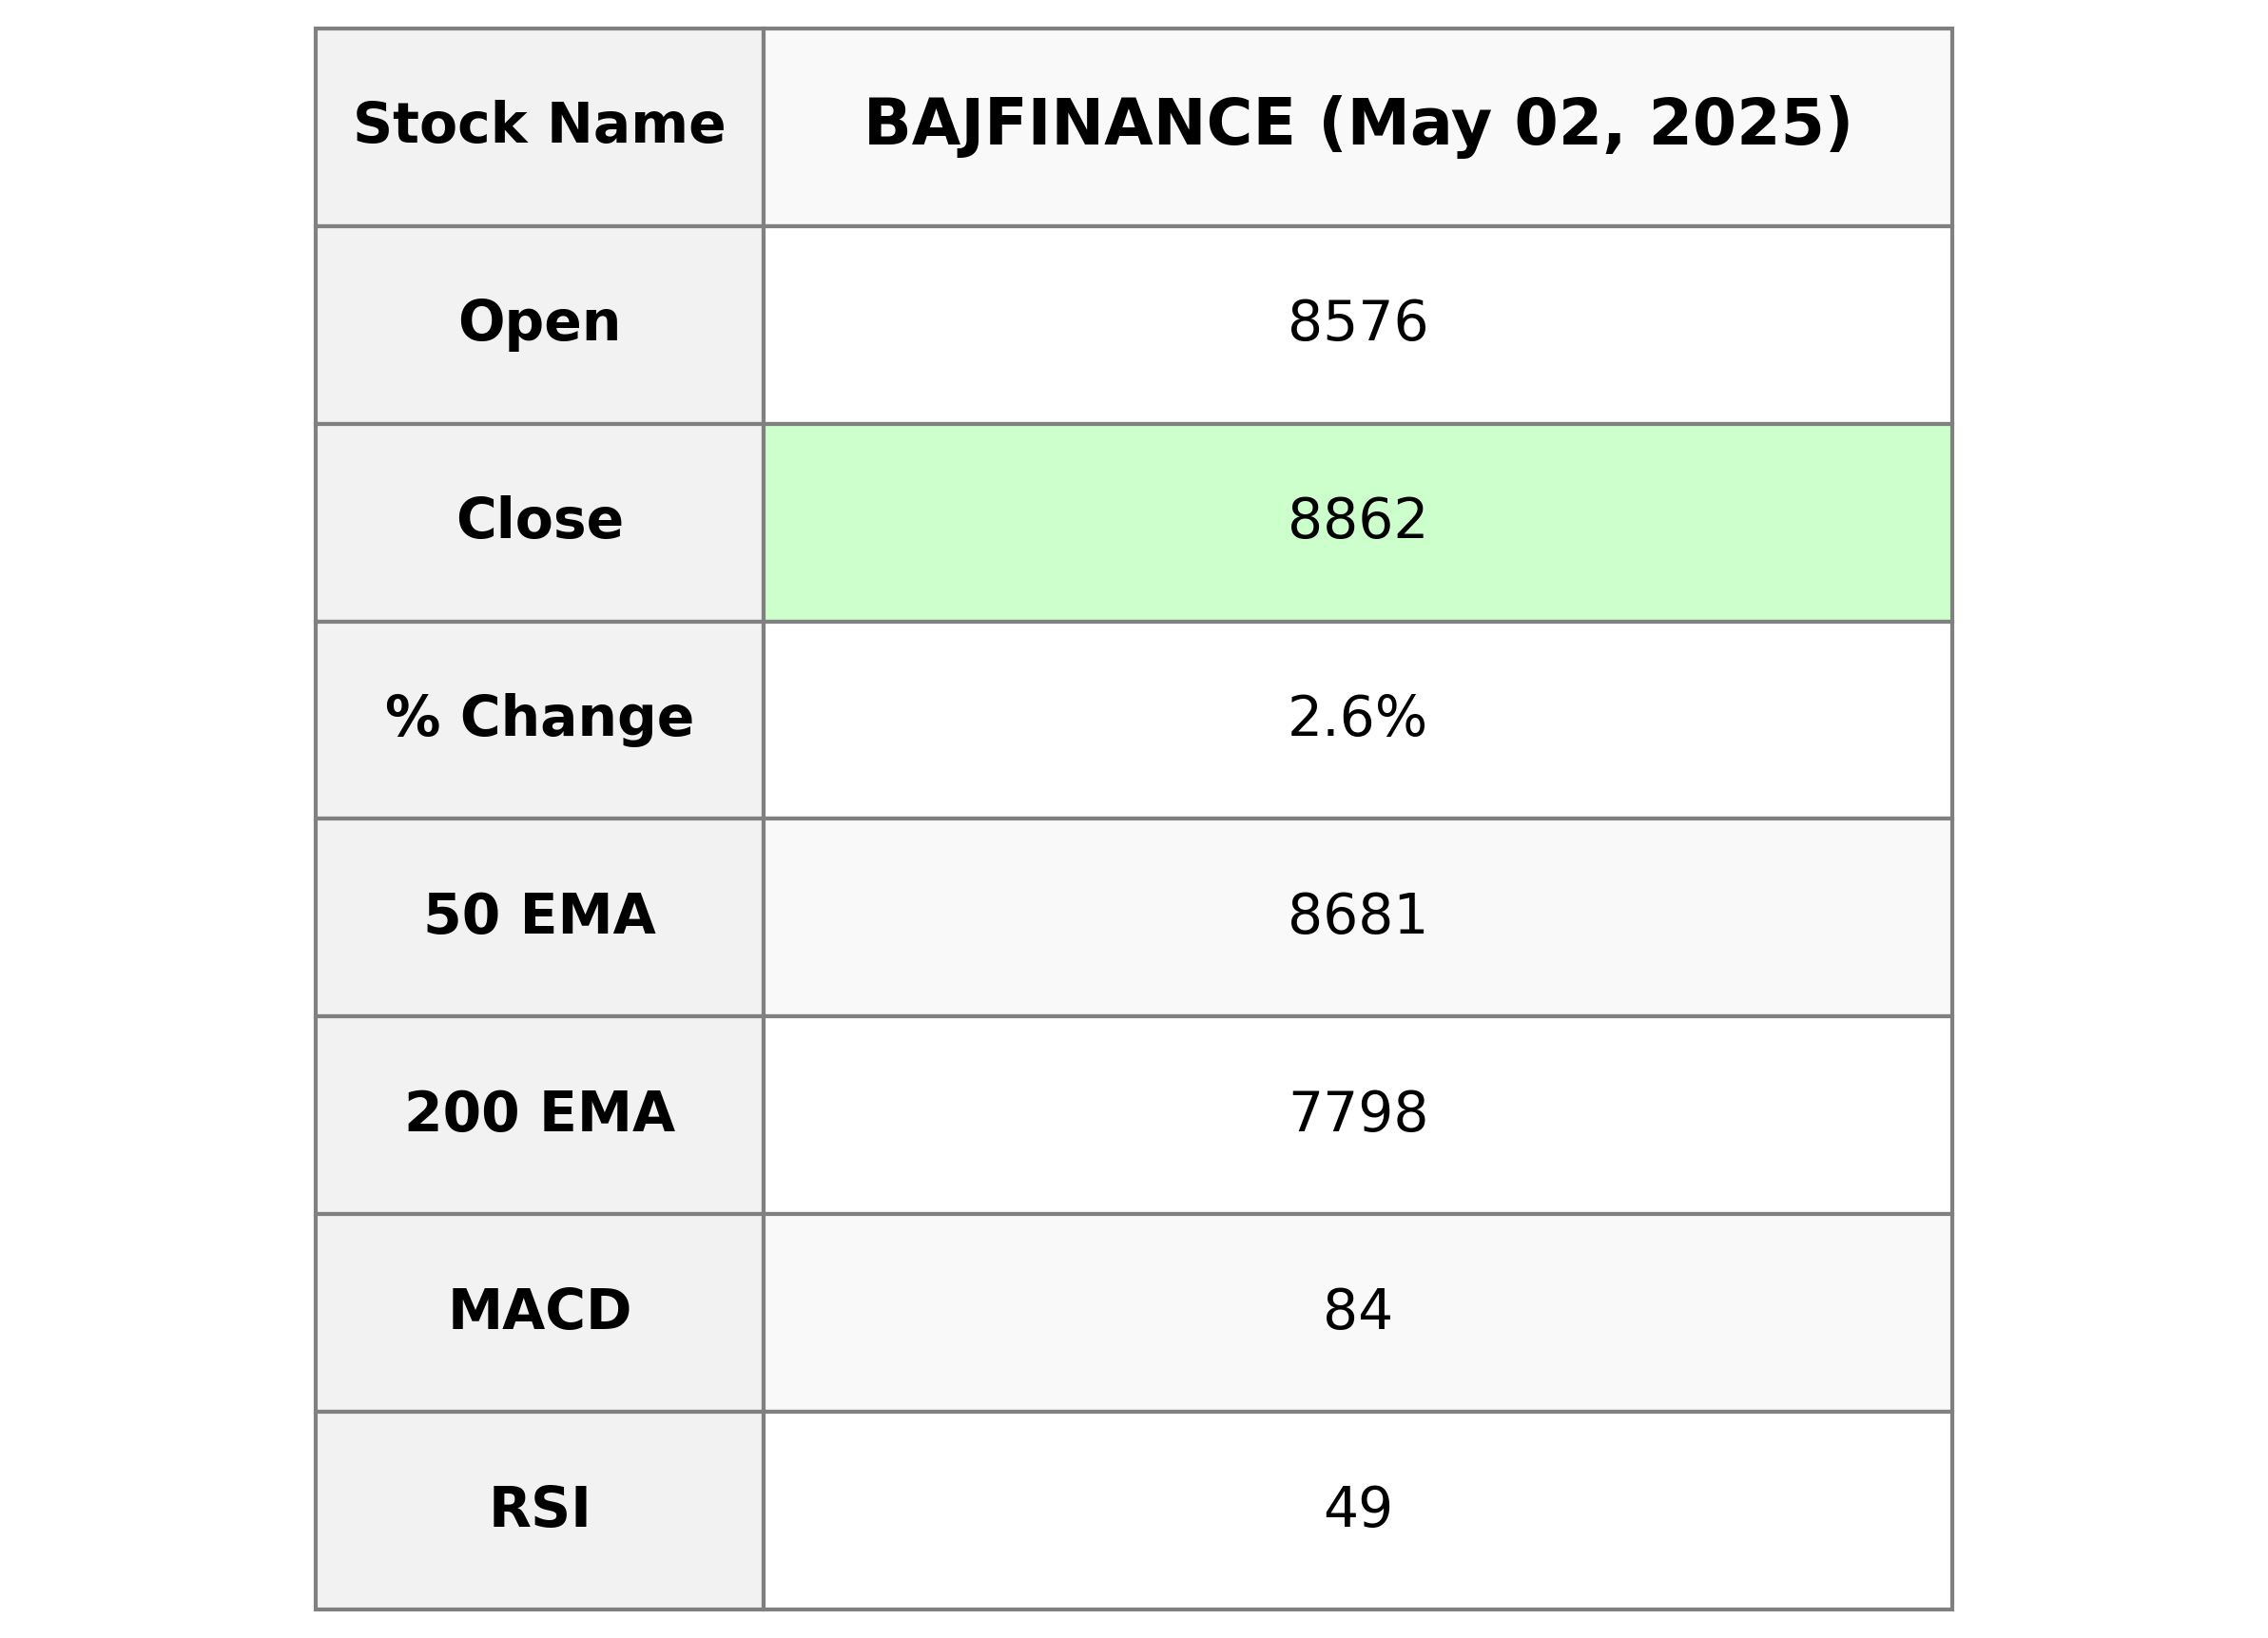
Bajaj Finance experienced a positive trading session with its stock opening at 8575.5 and closing at 8862.5. The stock saw a percentage change of 2.64%, indicating a strong upward trend. With its RSI at 48.71 and a PE Ratio of 33.00, Bajaj Finance is performing well in the financial services sector, particularly within credit services in India.

Relationship with Key Moving Averages
Bajaj Finance closed at 8862.5, which is above its 50 EMA of 8681.39, indicating a short-term positive sentiment relative to this average. However, it is below its 10 EMA of 8997.97 and 20 EMA of 8962.12, suggesting some resistance or recent downward movement in the shorter-term averages.
Moving Averages Trend (MACD)
Bajaj Finance is currently showing a weakening bullish momentum with a MACD value of 84.22, which is below the MACD Signal line at 136.41. This suggests that the stock might be experiencing a bearish crossover that could indicate a potential decline if the trend continues.

RSI Analysis
The RSI (Relative Strength Index) for Bajaj Finance is 48.71, which is close to the neutral line of 50. This indicates a balanced momentum without a strong trend towards being overbought or oversold, suggesting a period of consolidation in the stock's price movement.

Analysis for IndusInd Bank - May 02, 2025

IndusInd Bank showed a positive performance, closing at 853.0 with a percentage change of approximately 1.74% and a points change of 14.60. The bank's Relative Strength Index (RSI) indicates a solid momentum at 64.06, while its Market Cap stands at approximately 664.5 billion INR.

Relationship with Key Moving Averages
The closing price of IndusInd Bank at 853.0 is above the 50-day EMA (817.97) and the 10-day EMA (814.20), indicating a bullish position in the short term. However, it remains below the 200-day EMA (1041.51), suggesting some long-term bearish pressure.
Moving Averages Trend (MACD)
The MACD for IndusInd Bank is 18.83, which is significantly above the MACD Signal of 1.41, indicating a bullish trend in its price movement. The positive MACD value suggests that the stock's momentum is currently strong, with buyers potentially having more control.

RSI Analysis
The RSI of IndusInd Bank is 64.06, indicating that the stock is approaching the overbought territory, as RSI values above 70 typically suggest an overbought condition. However, it is not yet overbought, so investors might consider further analysis or monitoring before making decisions.

Analysis for Reliance - May 02, 2025

Reliance The stock opened at 1414.0 and closed at 1422.4, showing a positive change of 1.24% from the previous close. With a high volume of 17,532,762, the stock's RSI is at 78.45, indicating it might be overbought. Its MACD is 40.40, suggesting positive momentum above the signal line of 21.91. The PE ratio stands at 27.81, with an EPS of 51.14, indicating strong earnings performance in the energy sector, specifically in oil and gas refining and marketing.

Relationship with Key Moving Averages
Reliance's stock price is trading above its 50-day, 200-day, 10-day, and 20-day Exponential Moving Averages (EMAs), indicating a strong upward momentum. The current closing price of 1422.40 is significantly higher than the respective EMAs, highlighting positive market sentiment. Additionally, the high RSI suggests the stock might be overbought at current levels.
Moving Averages Trend (MACD)
The MACD for Reliance indicates bullish momentum, as the MACD value of 40.40 is significantly higher than the MACD Signal of 21.91. This suggests potential upward price movement, supported by the positive % Change of 1.24%.

RSI Analysis
Reliance's RSI is at 78.45, which indicates that the stock is in the overbought territory. This suggests potential price corrections, as the stock might be overvalued at current levels.

Analysis for SBI Life - May 02, 2025

### SBI Life Performance Description SBI Life, operating within the Financial Services sector, specifically under the Life Insurance industry in India, closed at 1764.70, experiencing a small decline of 0.06% from its previous close. Despite this minor dip, the stock maintains a strong bullish momentum with an RSI of 77.47 and a MACD above its signal line. The company's market capitalization stands robust at over 1.76 trillion INR.

Relationship with Key Moving Averages
SBI Life closed at 1764.70, which is significantly above its 50-day EMA of 1554.37 and its 200-day EMA of 1531.07, indicating strong bullish momentum. The stock's 10-day EMA at 1685.46 and 20-day EMA at 1627.40 are also below the current closing price, suggesting continued upward pressure.
Moving Averages Trend (MACD)
For SBI Life, the MACD value of 66.32 being above the MACD Signal of 47.94 suggests a bullish momentum. This indicates the potential for upward price movement, supported by the strong RSI of 77.47.

RSI Analysis
The RSI (Relative Strength Index) for SBI Life is 77.47, which suggests that the stock is currently in overbought territory. This typically indicates that the stock might be due for a pullback or correction soon. Investors should be cautious and may consider a closer examination of other indicators before making decisions.

Up Next
Top 5 Nifty 50 gainers today – May 2, 2025: Biggest stock moves

How much does a ULIP plan really cost? A break-down of all charges

Centre plans to borrow Rs 8.20 lakh cr from market in first half of FY27

Reliance denies buying Iranian oil amid US sanctions waiver

Premium petrol price up Rs 2, industrial diesel up Rs 22; no change in normal petrol, diesel rates

India's GDP expected to register over 8 pc growth in Sep-Dec: Report

More videos

Govt announces seven measures to help boost exports

RBI keeps interest rates on hold after US trade deal boosts outlook

RBI proposes to compensate customers up to Rs 25,000 loss due to fraud

RBI raises GDP growth projection of Q1, Q2 of FY27

RBI pauses rate cuts, retains interest rate at 5.25 pc

Rupee jumps 122 paise to close at 90.27 against US dollar on India-US trade deal

Stock markets cheer India-US trade deal: Sensex, Nifty surge 2.5 pc

UPI transactions hit record high of Rs 230 lakh crore in 2025-26 till Dec: Govt

Explained: India-US trade deal, tariffs and trade benefits

Trade deal with US adds momentum to India's growth ambition: Industry leaders