


Highlights
- UltraTech Cement shows strong bullish trend momentum
- Dr Reddy’s, Grasim stocks display rising strength
- IndusInd Bank and Tata Motors gain traction
Latest news

Samsung Galaxy Z Fold 8, Fold 8 Ultra & Z Flip 8: A More Mature Foldable Family

Dell Launches New Alienware 16X Aurora, 16 Area-51 and 18 Area-51 Gaming Laptops in India

Samsung Takes on Premium Home Audio With New Music Studio Series

The End of OxygenOS: OnePlus Confirms Shift to Oppo's ColorOS

Fujifilm Instax Mini Evo Cinema Review: A Hybrid Camera That Prints Memories Differently

iQOO Teases Z11 Lite With AI Tools, Military-Grade Durability and a 6500mAh Battery

Editorji Launches Hook Global, Its International Digital News Brand

Samsung's Bespoke AI ACs Focus on Humidity, Hygiene and Smarter Cooling
Top 5 Nifty 50 gainers today – April 24, 2025: Biggest stock moves


In this article, we will explore the technical indicators of some of the high-performing stocks on the Indian stock market, including DRREDDY, GRASIM, INDUSINDBK, TATAMOTORS, and ULTRACEMCO.
By looking at these stocks through the lens of key technical factors, we aim to better understand their price movements, trends, and potential future performance.

Analysis for Dr Reddys Labs - April 24, 2025

Dr Reddy's Laboratories opened at 1179.0 and closed at 1200.5, showing a positive change of 1.22%. The stock is performing above its 50-day EMA of 1170.63 but below its 200-day EMA of 1225.70, indicating a potential upward trend. With an RSI of 61.98, the stock is neither overbought nor oversold, maintaining a balanced momentum.

Relationship with Key Moving Averages
Dr Reddy's Labs closed at 1200.5, which is above the 50-day EMA (1170.63) and the 10-day EMA (1165.51), indicating potential short-term bullish sentiment. However, the closing is below the 200-day EMA (1225.70), suggesting that the long-term trend might still be bearish.
Moving Averages Trend (MACD)
The MACD value of 5.48 for Dr Reddys Labs indicates bullish momentum, as it is above the signal line of -3.52. This suggests a positive trend in the stock's price movement.

RSI Analysis
Dr Reddy's Labs has an RSI of 61.98, indicating that the stock is approaching overbought territory but is not yet overbought. An RSI above 70 typically suggests that a stock is overbought, while an RSI below 30 would indicate it is oversold.

Analysis for Grasim Industries - April 24, 2025

Grasim Industries, operating in the Basic Materials sector, showed a positive performance with a closing price of 2729.20, which is an increase of 1.62% from its previous close. The stock's MACD value indicates positive momentum, and the RSI suggests it is in a stable condition. With a market cap of over 1.79 trillion INR, the company maintains a solid presence in the industry.

Relationship with Key Moving Averages
Grasim Industries' closing price of 2729.20 is above its 10 EMA of 2692.79, indicating short-term bullish momentum. It is also above the 50 EMA of 2558.64 and the 200 EMA of 2509.65, suggesting a positive long-term trend.
Moving Averages Trend (MACD)
The MACD analysis for Grasim Industries shows a bullish signal with the MACD line (67.57) above the MACD Signal line (61.64), indicating potential upward momentum. This suggests that the stock might continue its upward trend in the near term.

RSI Analysis
The RSI (Relative Strength Index) of Grasim Industries is 62.27, indicating a neutral to moderately bullish momentum. Being above 60 suggests that the stock is experiencing some upward strength, but it is not yet in the overbought territory, which typically starts above 70.

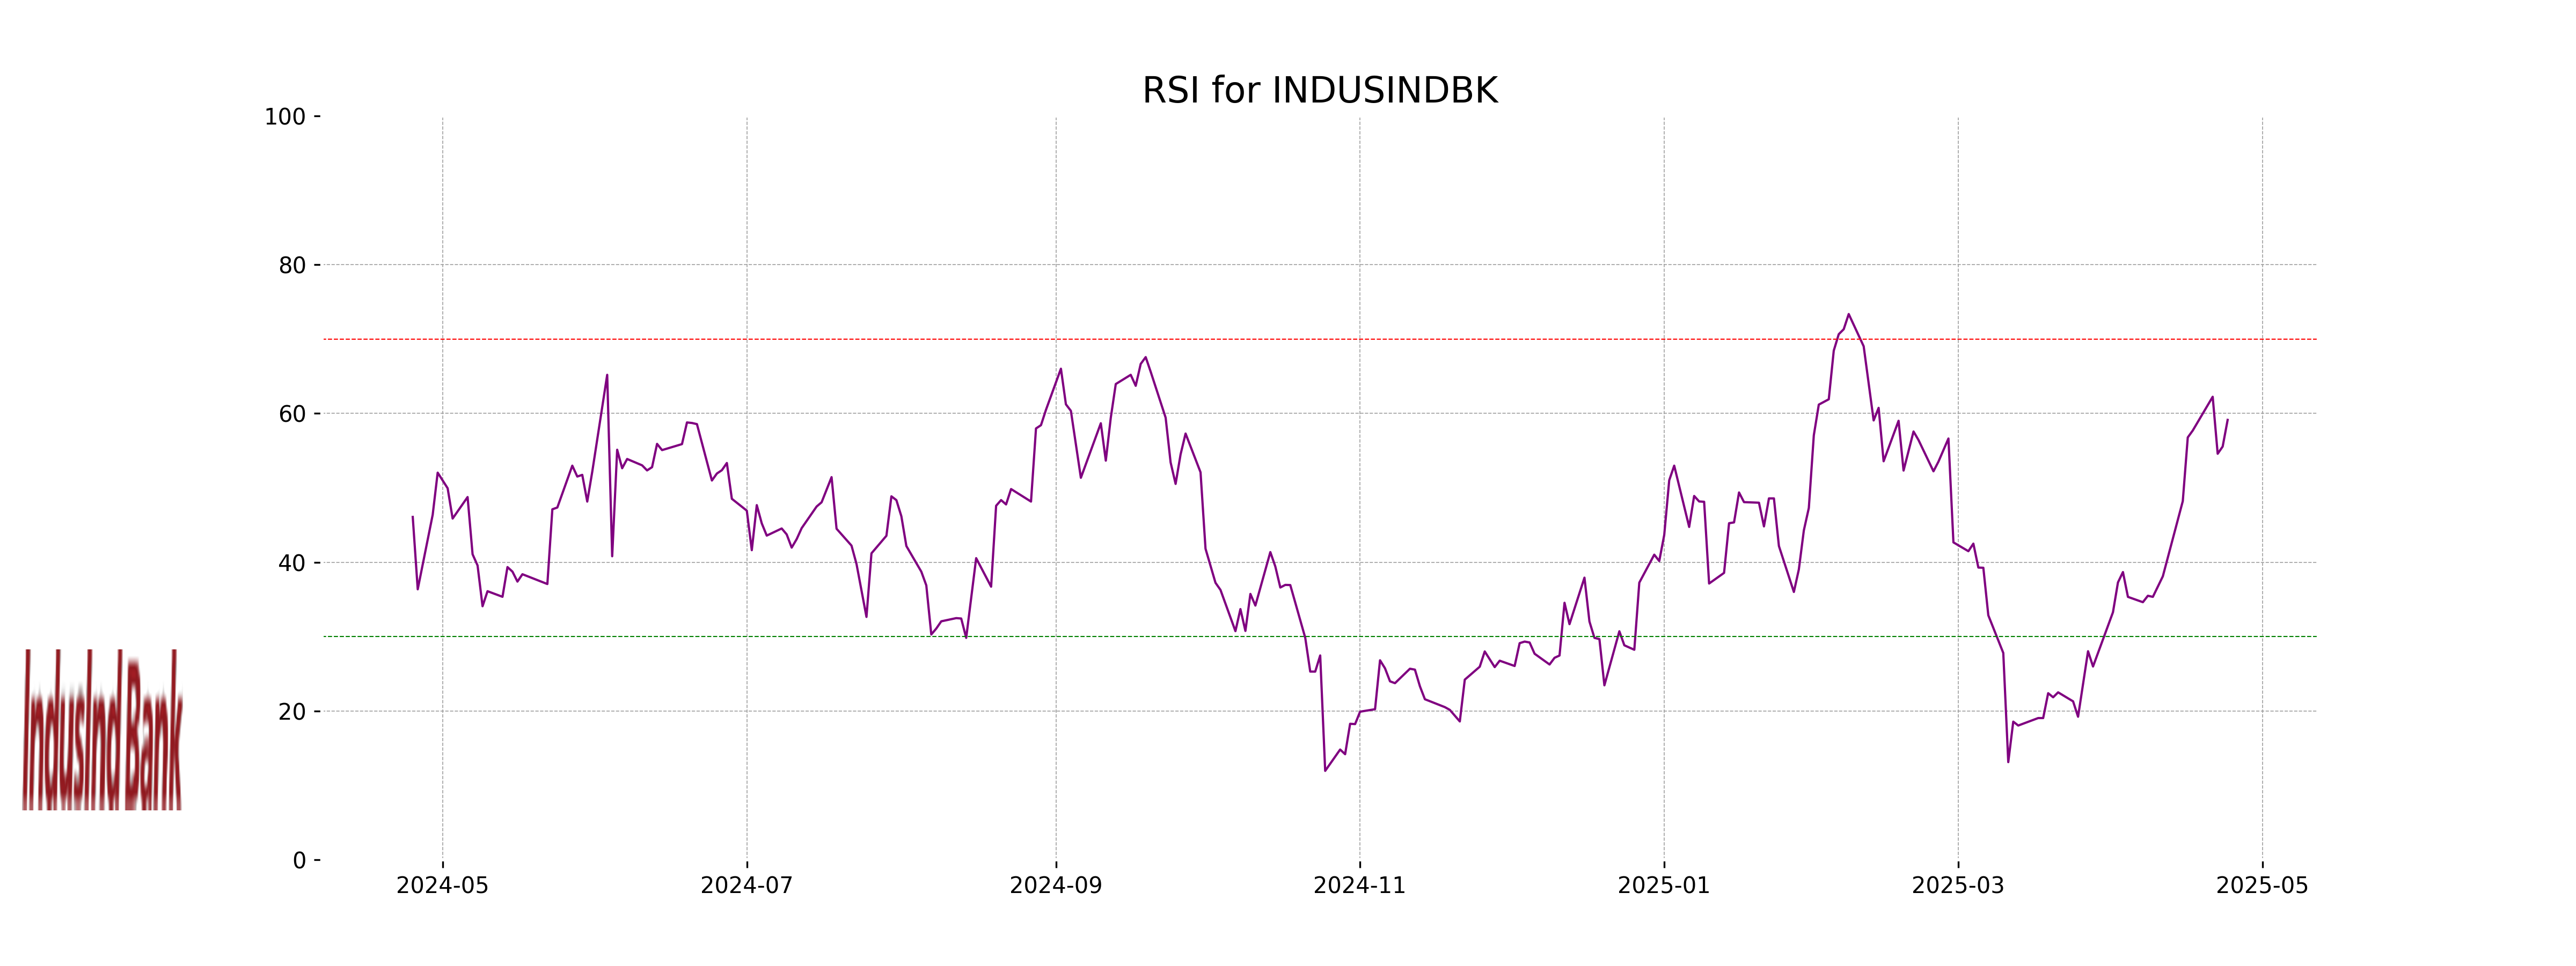
Analysis for IndusInd Bank - April 24, 2025

IndusInd Bank exhibited a notable performance with a closing price of 819.75, reflecting a 3.22% increase from its previous close of 794.20. The bank's stock encountered a considerable volume of 22,565,665 shares, showcasing investor interest. Despite the current price being slightly below its 50-day EMA of 813.79, it remains significantly under the 200-day EMA of 1052.05, indicating potential longer-term challenges.

Relationship with Key Moving Averages
IndusInd Bank's closing price of 819.75 is above its 50-day EMA of 813.79 but below its 200-day EMA of 1052.05, indicating a short-term bullishness compared to the 50-day average, while still being bearish compared to the long-term 200-day average. The 10-day EMA at 771.34 and 20-day EMA at 757.30 are both below the current price, affirming the recent upward momentum.
Moving Averages Trend (MACD)
MACD Analysis for IndusInd Bank: The MACD value for IndusInd Bank stands at 0.2504, while the MACD Signal is significantly lower at -23.8078. This positive MACD value relative to the signal line suggests bullish momentum in the stock. However, caution is advised as the MACD line has only just crossed above the signal line, indicating a nascent bullish trend.

RSI Analysis
The RSI (Relative Strength Index) for IndusInd Bank is 59.13, which suggests that the stock is neither overbought nor oversold at present levels. This indicates a balanced momentum and potential for a continued trend, though traders might want to watch for any movements toward the extremes.
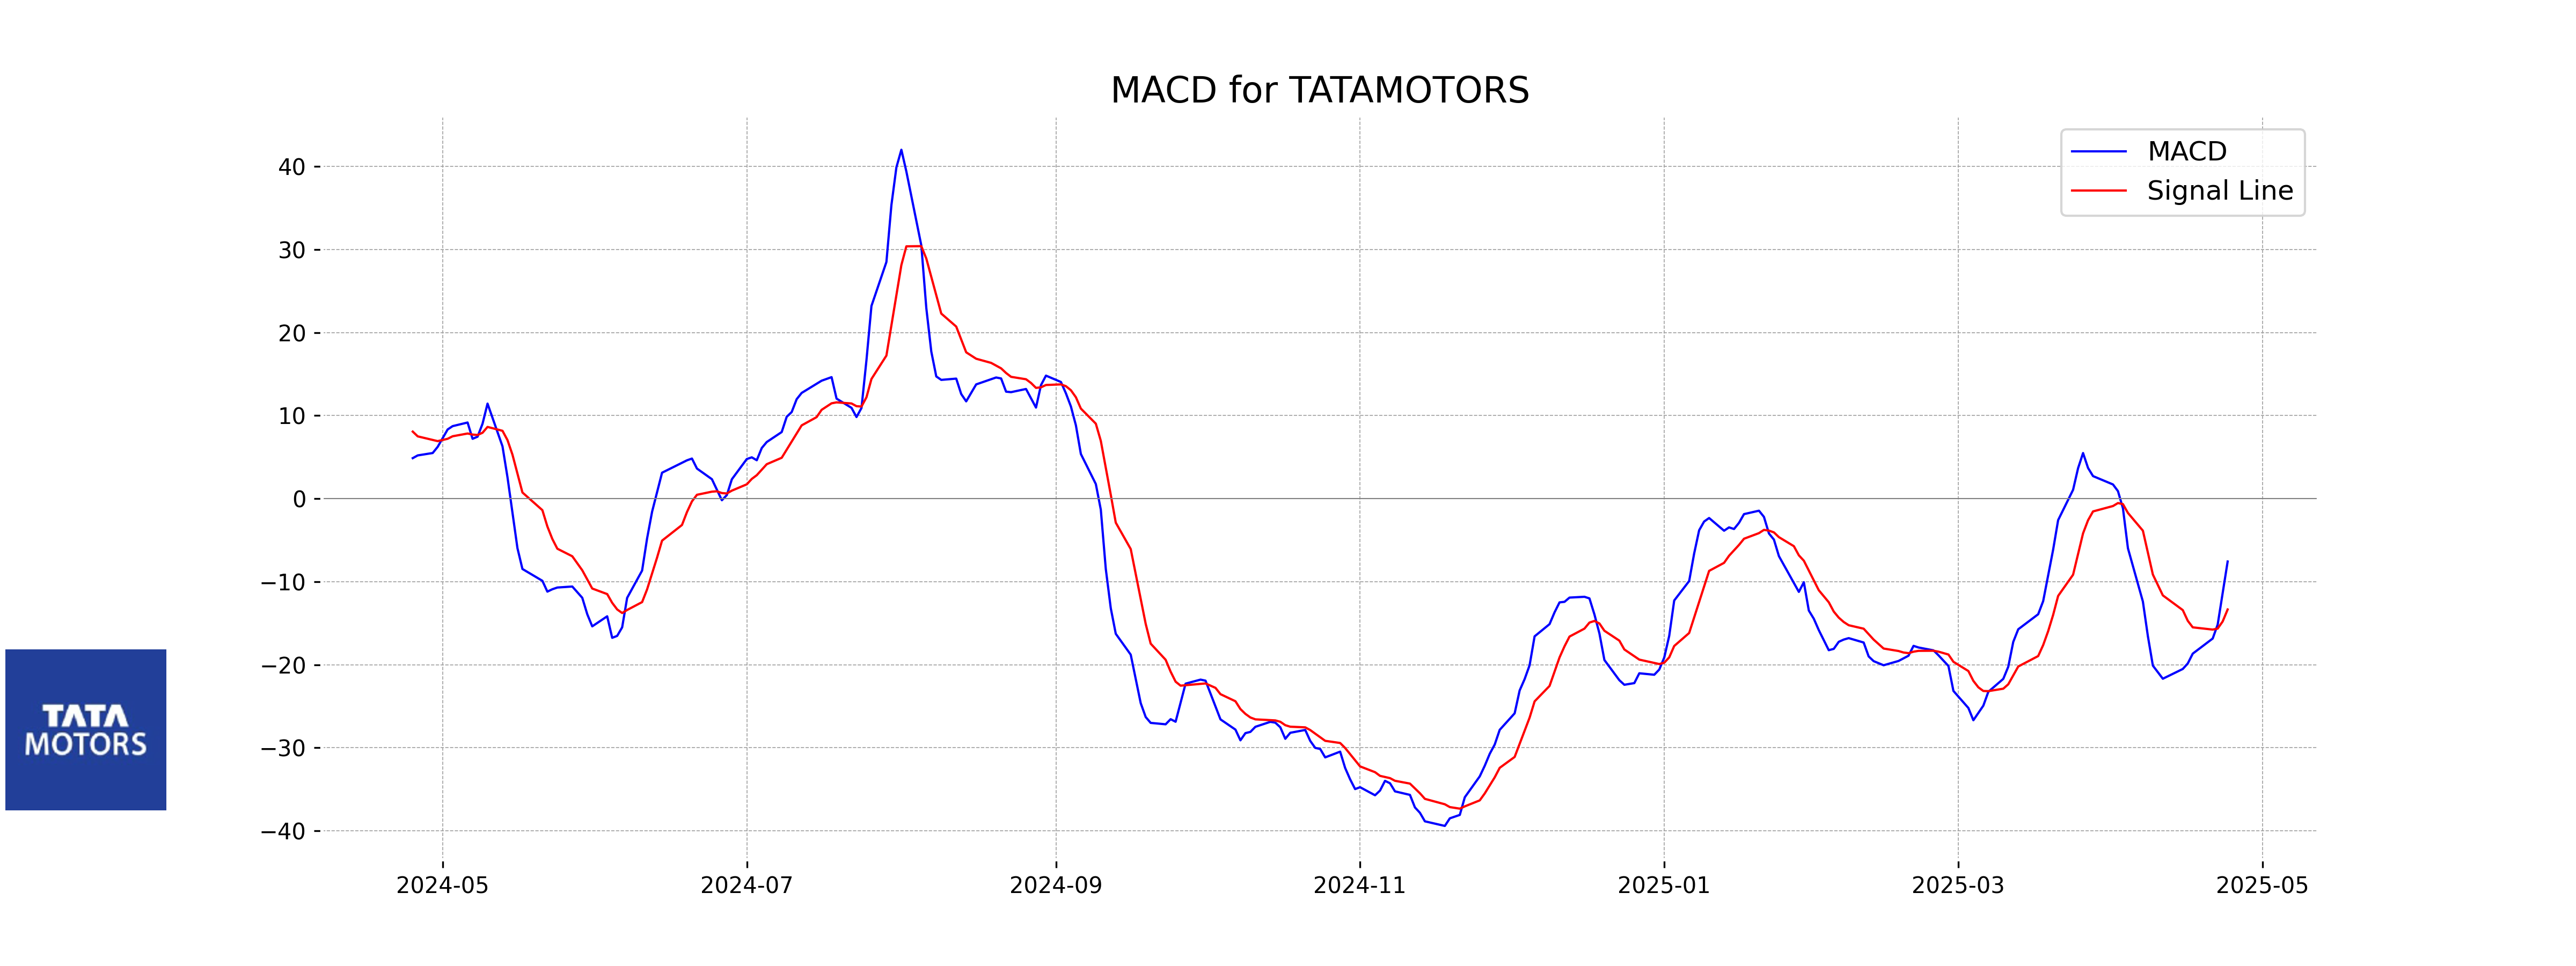
Analysis for Tata Motors - April 24, 2025

Tata Motors showed a positive performance with a closing price of 668.35, marking a 1.28% increase from the previous close. The volume of shares traded was 15,164,753, indicating active trading. With an RSI of 57.03, the stock is currently at a neutral level, suggesting neither overbought nor oversold conditions.

Relationship with Key Moving Averages
The closing price of Tata Motors at 668.35 is currently above the 50-day EMA of 664.69, indicating a short-term uptrend, but below the 200-day EMA of 773.89, suggesting a longer-term downtrend. It is also notably above both the 10-day EMA of 637.48 and the 20-day EMA of 640.57, supporting the recent strength in its price movement.
Moving Averages Trend (MACD)
MACD Analysis for Tata Motors: The MACD for Tata Motors is currently at -7.57, which is below its signal line of -13.34. This suggests a potential bullish crossover, indicating that the bearish momentum might be weakening. The RSI of 57.03 also supports a neutral to slightly bullish outlook.
RSI Analysis
The Relative Strength Index (RSI) for Tata Motors is 57.03, suggesting that the stock is currently in a neutral zone. An RSI between 30 and 70 typically indicates that the stock is neither overbought nor oversold, suggesting a balanced trading position.

Analysis for UltraTech Cement - April 24, 2025

UltraTech Cement showed a positive performance with its close price rising to 12,159.0 from a previous close of 11,949.0, marking a percentage change of 1.76%. The company operates in the Basic Materials sector, specifically within the Building Materials industry in India. It has a robust market cap of 3,576,545,411,072 and a relatively high PE Ratio of 56.22, indicating market confidence in its earnings potential.

Relationship with Key Moving Averages
UltraTech Cement's current closing price of 12,159.0 is above its 10 EMA at 11,808.70, 20 EMA at 11,580.67, 50 EMA at 11,324.78, and 200 EMA at 11,062.06, indicating a bullish trend. The stock is trading at a significant premium over these key moving averages, highlighting strong upward momentum.
Moving Averages Trend (MACD)
- MACD Analysis for UltraTech Cement: The MACD value is 264.20, which is above the MACD Signal line value of 206.53, indicating a bullish trend. This suggests potential upward momentum in the stock.

RSI Analysis
The RSI of UltraTech Cement is 71.04, which suggests that the stock is in an overbought condition. This could indicate that a price correction may be likely in the near future if the trend continues.

Up Next
Top 5 Nifty 50 gainers today – April 24, 2025: Biggest stock moves

Step-by-step guide to apply for a mortgage loan online with minimal documentation

Honda Activa 6G: Everything You Need to Know Before Buying

How much does a ULIP plan really cost? A break-down of all charges

Centre plans to borrow Rs 8.20 lakh cr from market in first half of FY27

Reliance denies buying Iranian oil amid US sanctions waiver

More videos

Premium petrol price up Rs 2, industrial diesel up Rs 22; no change in normal petrol, diesel rates

India's GDP expected to register over 8 pc growth in Sep-Dec: Report

Govt announces seven measures to help boost exports

RBI keeps interest rates on hold after US trade deal boosts outlook

RBI proposes to compensate customers up to Rs 25,000 loss due to fraud

RBI raises GDP growth projection of Q1, Q2 of FY27

RBI pauses rate cuts, retains interest rate at 5.25 pc

Rupee jumps 122 paise to close at 90.27 against US dollar on India-US trade deal

Stock markets cheer India-US trade deal: Sensex, Nifty surge 2.5 pc

UPI transactions hit record high of Rs 230 lakh crore in 2025-26 till Dec: Govt