


Highlights
- RSI and MACD highlight potential volatility, with the IT and Auto sectors
- Analysis underlines the need for investors to exercise caution
- Remain watchful of market shifts in the coming sessions
Latest news

Dell Launches New Pro Precision AI Workstations In India, Introduces Deskside Agentic AI Platform

Oppo Enco Air5 Review: Incredible Value at ₹3,099

Samsung Galaxy A27 5G Goes On Sale In India With Cashback Offers, Zero Down Payment Schemes
 First Impressions: A Strong Debut For The New 'b' Series")
Nothing Phone (4b) First Impressions: A Strong Debut For The New 'b' Series

Samsung Galaxy A27 Review: A Dependable Mid-Ranger With Few Surprises

Union Finance Minister Nirmala Sitharaman Inaugurates Muzhiyan Kulam, Restored by Lumina Datamatics and Community Stakeholders in Puducherry

"Don't think anyone will be able to break his track record": Annu Kapoor hails Big B's unmatched legacy

Rewriting the Rules of Business Education: Stride School of Business Unveils Its AI-First Campus Infrastructure
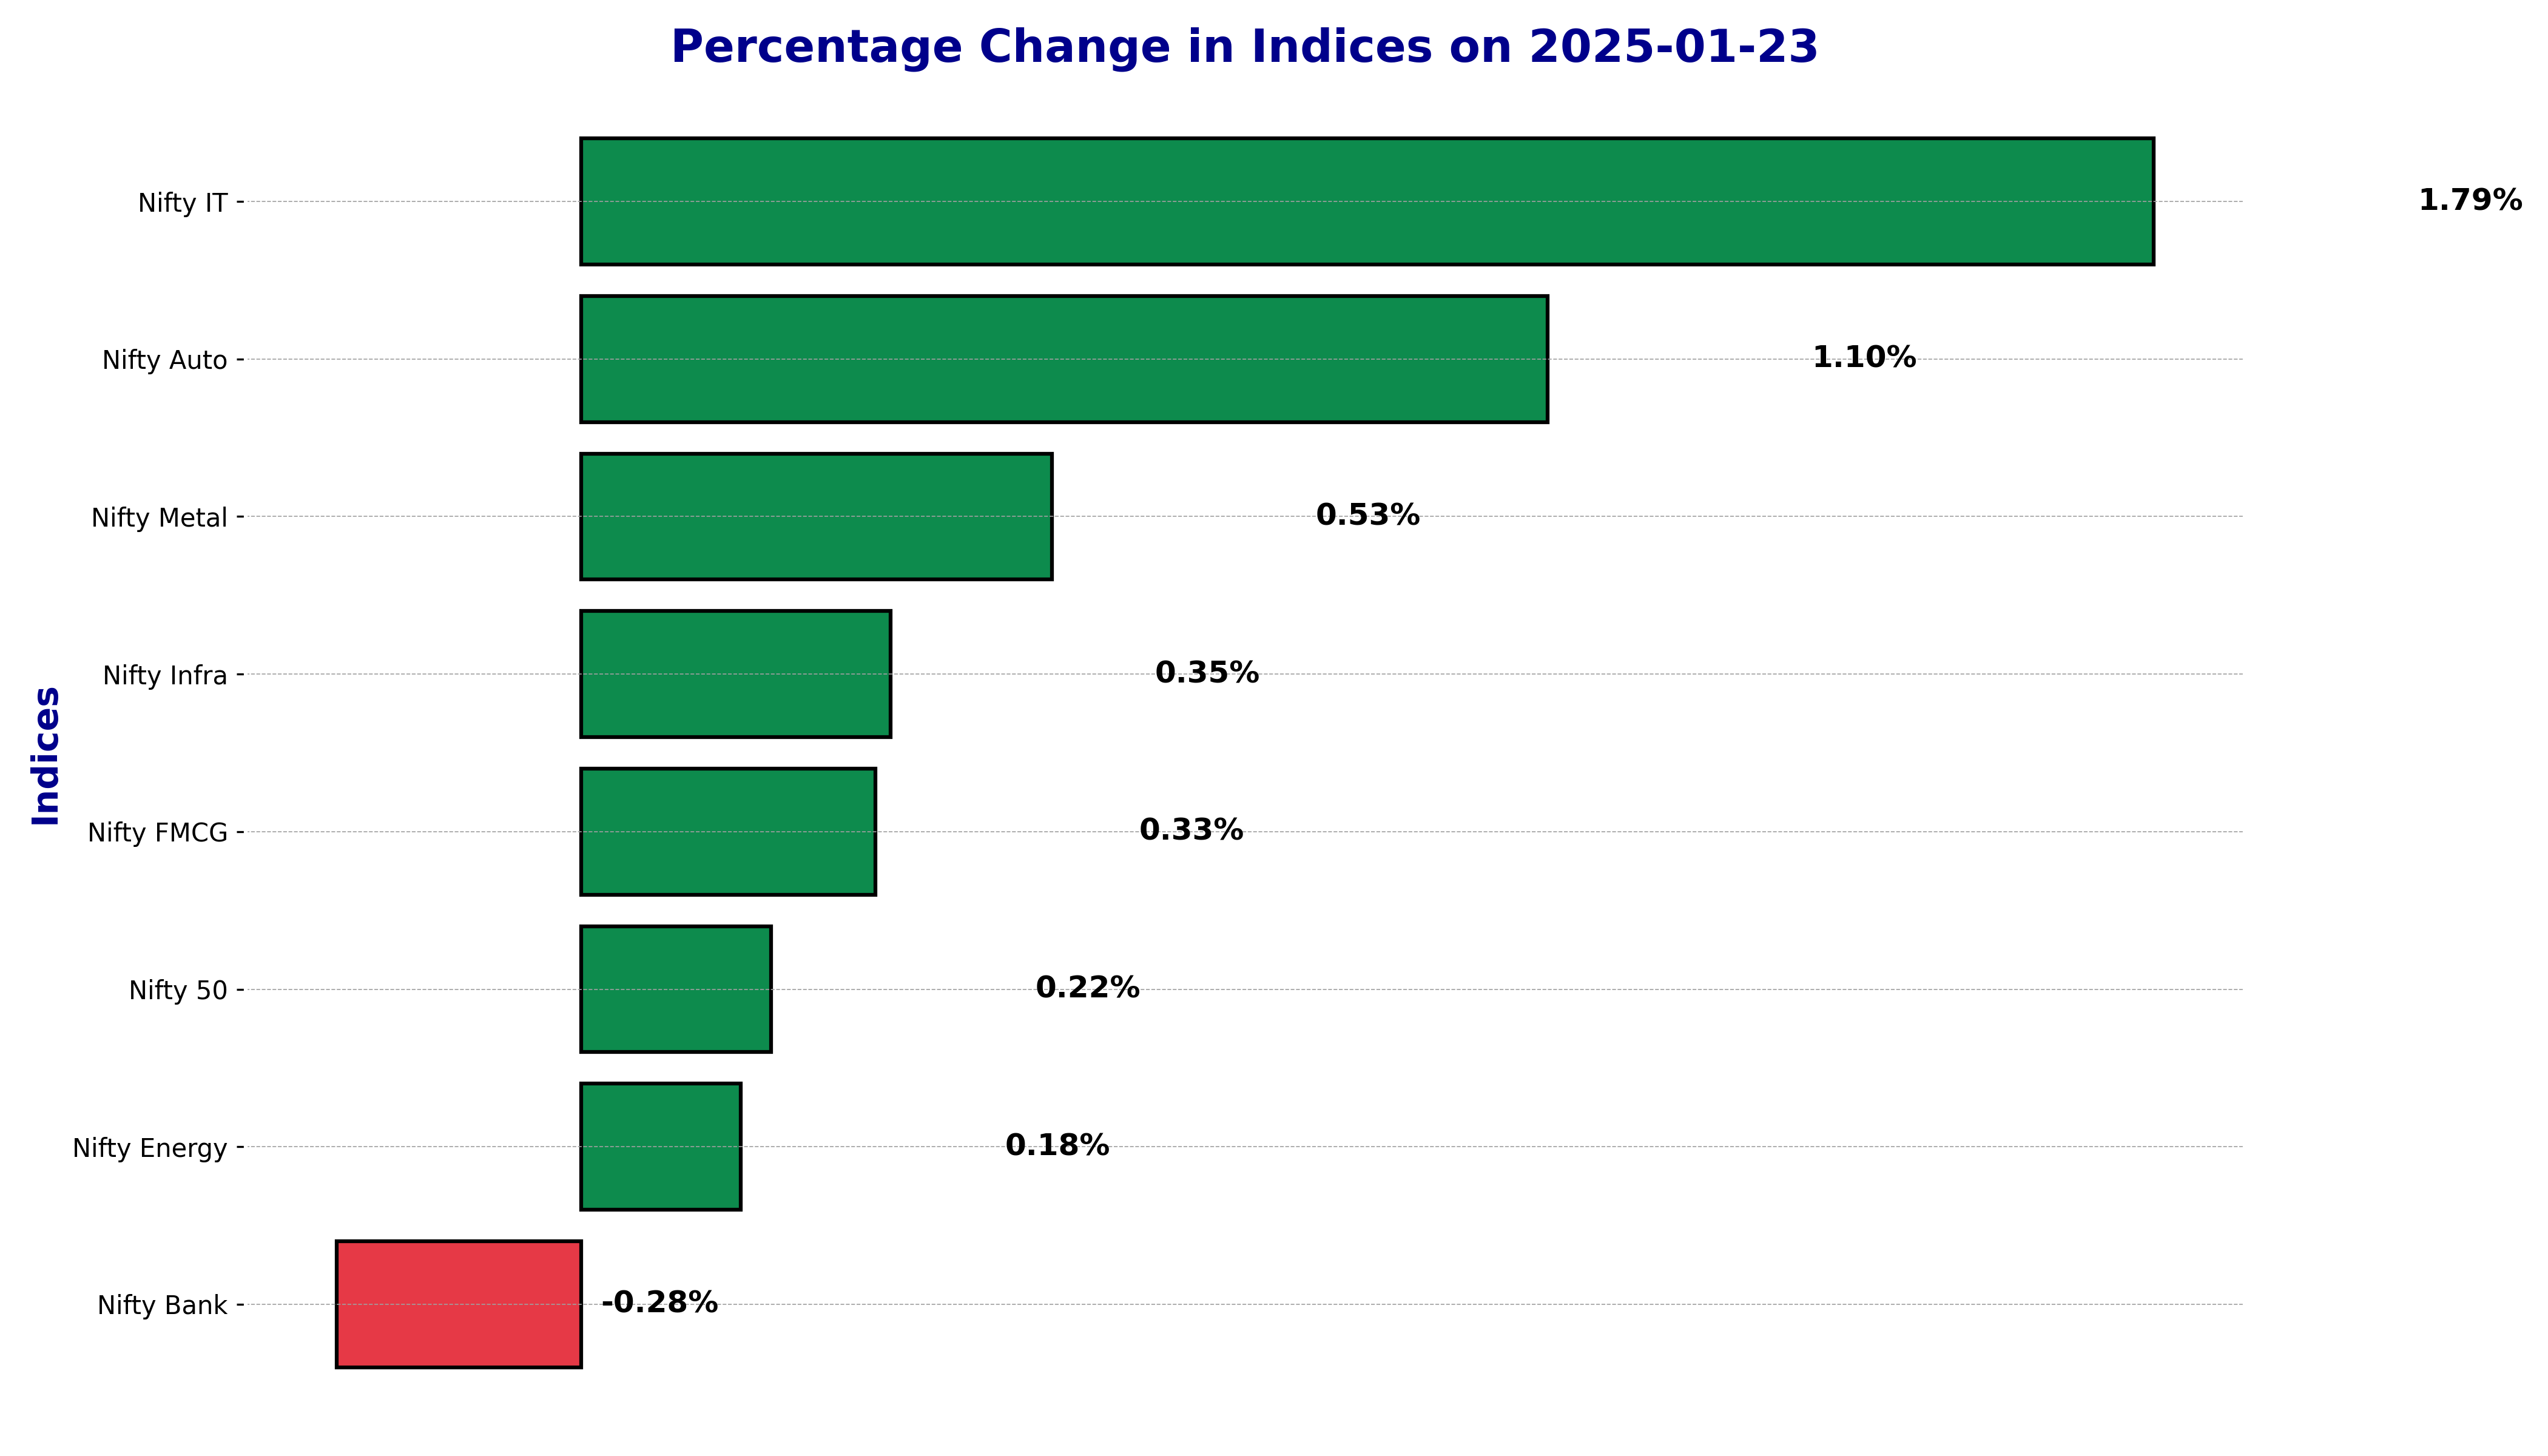
Indian stock market sector-wise performance today - January 23, 2025


The national stock market indices showed varied performances on January 23, 2025, reflecting the economic sentiment.
In this article, we analyze the performance of key national indices including the Nifty 50,Nifty Bank,Nifty IT,Nifty Auto,Nifty Pharma,Nifty FMCG,Nifty Infra,Nifty Energy and Nifty Metal.
Detailed Technical Analysis for Nifty 50 on January 23, 2025

The Nifty 50, which is one of the leading stock indices in India, showed a modest percentage change of 0.22% on January 23, 2025. This equates to a points change of 50.0 points. Below is a detailed look into the technical indicators for the Nifty 50, providing insight into the market's behavior for the day.
Technical Indicators:
50 EMA (Exponential Moving Average): The 50 EMA for Nifty 50 was calculated at 23616.91, which is higher than the closing price of 23205.35. This indicates that the Nifty 50 is trading below its recent average price over the last 50 days.
200 EMA: The 200 EMA stands at 23740.76. This longer-term average is also above the current closing price, further indicating that the index is on the lower side relative to this significant moving average that reflects the price over a much longer duration.
RSI (Relative Strength Index): The RSI value for Nifty was 38.81. Typically, an RSI below 30 suggests that the market is oversold, while an RSI above 70 implies overbought conditions. With an RSI of 38.81, the market is on the lower side but not yet in the oversold territory.
MACD (Moving Average Convergence Divergence): The MACD value was -183.02 with a signal line of -171.63. The negative MACD indicates a prevailing bearish trend, with the line below the signal line.
Market Sentiment:
Evaluating the performance of the Nifty 50 based on these technical indicators suggests a bearish sentiment in the market. The fact that the index is trading below both the 50 EMA and 200 EMA indicates a downtrend. The RSI, while not deeply in oversold territory, shows weakening momentum. Meanwhile, the MACD supports this bearish sentiment with its negative value and position below the signal line, reinforcing the downtrend momentum.
Technical Analysis for Nifty Auto on January 23, 2025

The Nifty Auto index experienced notable movement today with a % change of 1.098%, which equates to a points change of 244.60 points.
Technical Indicators:
The short-term and long-term moving averages are critical in understanding market trends. The 50 EMA is currently at 22,999.996, while the 200 EMA stands at 23,088.214. These figures indicate how the index is performing relative to its historical averages.
The Relative Strength Index (RSI) is at 41.23. RSI values below 50 typically indicate a bearish or downward trend, suggesting that Nifty Auto may be under selling pressure.
The Moving Average Convergence Divergence (MACD) is -187.472, with its signal line at -127.001. A negative MACD value suggests a bearish trend, confirmed by the MACD being below its signal line.
Market Sentiment:
The technical indicators suggest that Nifty Auto is in a downtrend. The RSI below 50 and a negative MACD indicate bearish momentum, supporting the notion that the index is currently experiencing downward pressure. The fact that both the 50 EMA and the 200 EMA are above the closing value suggests the index is trading below its usual performance, further reinforcing the downtrend narrative.
Overall, the combination of these technical indicators presents a bearish outlook for Nifty Auto. Investors should proceed with caution and consider these trends when making trading decisions.
Technical Analysis of Nifty Bank on January 23, 2025

The Nifty Bank index experienced a slight decline on January 23, 2025. The percentage change for the day was -0.28%, representing a points change of -135.40. This places the closing value of Nifty Bank at 48,589.0.
Technical Indicators
Several key technical indicators shed light on the current state of the Nifty Bank.
The 50-day Exponential Moving Average (EMA) for Nifty Bank is currently positioned at 50,172.69. The 200-day EMA is recorded at 50,606.13. When comparing these two metrics, it can be observed that the 50 EMA is below the 200 EMA, which typically suggests a bearish or downtrend condition.
The Relative Strength Index (RSI) stands at 36.35. The RSI is a momentum oscillator that measures the speed and change of price movements. An RSI reading below 30 is typically considered oversold, while a reading above 70 is seen as overbought. With the RSI at 36.35, it indicates that the market might be nearing an oversold condition, leading to potential buying interest soon.
The Moving Average Convergence Divergence (MACD) indicator is another important tool used by traders. Currently, the MACD value is -631.19, while the MACD Signal line is -624.64. Since the MACD is below the Signal line, it suggests a bearish momentum in the market.
Market Sentiment
Analyzing the technical indicators reveals that the Nifty Bank is presently in a downtrend. The relationship between the 50 EMA and 200 EMA indicates a bearish market, as the shorter-term moving average has slipped below the longer-term moving average, affirming the downward price trend.
The RSI adds a layer of context by showing near oversold conditions, which may hint at a possible upside potential if buyers start to perceive Nifty Bank as undervalued.
The MACD confirms this bearish sentiment, with its negative value and position below the Signal line, reinforcing the current downtrend.
In summary, the analyzed technical indicators depict a bearish sentiment for the Nifty Bank as of January 23, 2025. Investors and traders should remain cautious and vigilant for any potential reversals, especially if RSI continues towards the oversold threshold, which might herald a future bullish reversal.
Nifty Energy Technical Analysis for January 23, 2025

The "Nifty Energy" index, represented by the stock symbol "CNXENERGY," displayed a subtle upward movement on January 23, 2025. The index closed at 33,866.60, marking a points change of 61.40 and a percentage change of 0.18% compared to the previous close of 33,805.20.
Technical Indicators
The technical analysis of Nifty Energy is highlighted by various key indicators:
50-Day EMA (Exponential Moving Average): The index's 50-day EMA stands at 34,880.65, above the current closing price, indicating a potential bearish momentum as the price trades below this medium-term average.
200-Day EMA: Similarly, the 200-day EMA is positioned at 35,146.22. The significant gap between the current price and the 200-day EMA further implies a longer-term bearish trend.
Relative Strength Index (RSI): The RSI value is at 39.91. Typically, an RSI below 30 is considered oversold, while above 70 is overbought. Though the RSI is near the lower boundary, it has not yet reached the oversold territory, indicating weakening momentum but not a strong reversal signal.
MACD (Moving Average Convergence Divergence): The MACD line reads at -341.33, with the Signal line slightly lower at -354.68. A negative MACD suggests that the momentum is bearish, though the MACD line being above the Signal line might hint at a possible trend reversal.
Market Sentiment
Based on the technical indicators, the market sentiment for Nifty Energy on January 23, 2025, is characterized by signs of continuation in a downtrend. Stock prices trading below both the 50-day and 200-day EMAs reflect bearish control. The MACD's negative territory reinforces this outlook, albeit the convergence above the signal line could initiate cautious optimism among traders for an upcoming positive momentum shift.
The RSI, nearing the oversold level, points out that the downtrend might be approaching an end; however, confirmation from other indicators or price action is advised for a decisive conclusion on the reversal. Hence, traders should align their strategies with a vigilant eye on upcoming changes in trend indicators such as RSI and MACD for better-informed decision-making.
On January 23, 2025, the "Nifty FMCG" index observed a notable day with a percentage change of 0.3341%

and a points change of 185.75 points.
The "Nifty FMCG" is a key benchmark for tracking the FMCG sector's performance within the broader stock market. It opened at 55308.15, reached a high of 55951.25, a low of 54770.15, and closed at 55781.80.
In terms of technical indicators, the 50-day Exponential Moving Average (EMA) was at 56305.20, and the 200-day EMA was at 56377.71. The Relative Strength Index (RSI) for "Nifty FMCG" stood at 43.98, indicating a relatively neutral market sentiment, leaning slightly towards the oversold territory. The Moving Average Convergence Divergence (MACD) had a value of -237.14, while the MACD Signal line was at -147.61. This negative MACD value signifies a bearish momentum, with the MACD line below the signal line.
Evaluating the market sentiment based on these indicators, it appears that "Nifty FMCG" was experiencing a slight downtrend. The price ended below both the 50-day and 200-day EMAs, which usually suggests a bearish phase. The RSI close to 44 indicates that the downward momentum might be reversing, potentially stabilizing soon. However, the negative MACD confirms the ongoing bearish trend, signaling that sellers maintain dominance over buyers.
Overall, the trend and momentum indicators suggest "Nifty FMCG" was facing a downtrend, with cautious optimism for potential stabilization if buying pressures increase in subsequent sessions.
On January 23, 2025, the performance of Nifty IT

proved to be noteworthy with a significant % change of 1.79% and a points change of 761.05 points. This increase is a clear indicator of bullish sentiment among traders in the information technology sector.
Technical Indicators: Analyzing the technical aspects of Nifty IT, we observe the following key metrics:
- 50 EMA (Exponential Moving Average): The 50 EMA stands at 43,628.63. The current close price of 43,351.75 places it below the 50 EMA, suggesting a potential resistance level.
- 200 EMA: Positioned at 43,871.76, the 200 EMA also serves as a long-term resistance level. The close price below this level might indicate that the index is still under its longer-term trend average.
- RSI (Relative Strength Index): The RSI value of 48.68 suggests a neutral stance since it hovers around the midpoint of the 30-70 range. This indicates that the market is neither overbought nor oversold at this time.
- MACD (Moving Average Convergence Divergence): With a MACD value of -392.51 and a MACD Signal of -355.30, the negative MACD suggests bearish momentum. However, the close proximity between the MACD and its signal line might hint at a potential reversal if conditions change.
Market Sentiment: Evaluating the performance of Nifty IT using these technical indicators reveals a complex picture. While the immediate percentage and points gain suggests an uptrend when observed on a daily scale, the placement of the close price below the 50 EMA and especially the 200 EMA indicates underlying bearish or weak bullish sentiment in a longer context. The RSI's neutral figure aligns with this uncertainty, neither showing strong bullish nor bearish momentum. The MACD's negative value further supports a cautious stance, warning of potential bearish divergence unless substantial positive changes occur.
In sum, even though the daily gains evidenced an upward movement, the broader indicators advise prudence. The nuances of the RSI and MACD, along with key moving averages, provide crucial insight into the balancing act between bullish aspirations and bearish realities.
Technical Analysis of Nifty Infra on January 23, 2025

Stock Overview: The Nifty Infra showed a marginal increase as of January 23, 2025, with a percentage change of 0.35% and a points change of 29.15, closing at 8314.70. This portrays a slight upward momentum in the market's movement for the day.
Technical Indicators:
The 50-day Exponential Moving Average (EMA) is currently at 8447.27, while the 200-day EMA stands at 8499.11. These figures indicate that the stock is trading below both its 50-day and 200-day moving averages, which can often signal a bearish outlook in the market.
The Relative Strength Index (RSI) is at 42.66, which suggests that the stock is not in the overbought or oversold zone. Typically, an RSI below 30 indicates that a stock is oversold, while an RSI above 70 signifies it is overbought. Thus, the current RSI suggests that the Nifty Infra is neither trending towards extremes.
The Moving Average Convergence Divergence (MACD) value stands at -61.19, with the MACD signal line slightly lower at -70.71. A negative MACD value indicates that the stock is experiencing downward momentum, but the higher signal line than the MACD suggests a potential crossover, which could be indicative of a future price reversal.
Market Sentiment: Based on the current technical indicators, Nifty Infra appears to be in a mild downtrend. The fact that the price is below both the 50 EMA and 200 EMA supports this downtrend outlook. Although the RSI doesn't indicate any extreme conditions, its value below 50 indicates slight bearish positioning. Moreover, the MACD indicates a bearish outlook due to its negative figure, though the proximity to the MACD signal line hints at the possibility of a shift in momentum.
In conclusion, investors may want to exercise caution, given the bearish signals from the EMAs and the MACD, while also keeping an eye on potential trend reversals as indicated by the MACD line's relationship with the signal line.
Technical Analysis for Nifty Metal on January 23, 2025

The Nifty Metal index experienced a day of positive movement as it recorded a points change of 45.30, resulting in a percentage change of 0.53%. The closing price was registered at 8515.55, indicating some upward momentum.
Technical Indicators
50 EMA and 200 EMA: The 50-day Exponential Moving Average (EMA) for Nifty Metal stands at 8645.30, while the 200-day EMA is slightly higher at 8732.26. The current closing price of 8515.55 is below both the 50 EMA and the 200 EMA, suggesting a bearish tone in the medium to long term.
RSI: The Relative Strength Index (RSI) is currently at 44.44. An RSI below 50 typically signifies that the asset is facing some selling pressure, which indicates that it's neither overbought nor oversold, but there's a slight inclination towards weakness in the momentum.
MACD: The Moving Average Convergence Divergence (MACD) is at -82.58, while the MACD Signal is at -115.53. The MACD being in negative territory and above its signal line can indicate an early sign of bullish movements, assuming the trend continues in the same direction.
Market Sentiment
The overall market sentiment for Nifty Metal on this day can be considered cautiously optimistic. Despite the closing price being below the 50 EMA and the 200 EMA, implying a current downtrend, the slight closing price increase offers a hint of emerging bullish potential. However, caution is advised since the RSI indicates that selling pressure still exists. The MACD, although negative, suggests a possible trend reversal moving forward if it continues to move towards the zero line.
In conclusion, while market sentiment suggests bearishness given the price's position relative to the EMAs, the change in the MACD and a modest gain hint at a potential shift in momentum. The RSI and MACD together suggest that traders should be on the lookout for sustained changes in momentum to confirm any potential trend reversals.
Up Next
Indian stock market sector-wise performance today - January 23, 2025

Step-by-step guide to apply for a mortgage loan online with minimal documentation

Honda Activa 6G: Everything You Need to Know Before Buying

How much does a ULIP plan really cost? A break-down of all charges

Centre plans to borrow Rs 8.20 lakh cr from market in first half of FY27

Reliance denies buying Iranian oil amid US sanctions waiver

More videos

Premium petrol price up Rs 2, industrial diesel up Rs 22; no change in normal petrol, diesel rates

India's GDP expected to register over 8 pc growth in Sep-Dec: Report

Govt announces seven measures to help boost exports

RBI keeps interest rates on hold after US trade deal boosts outlook

RBI proposes to compensate customers up to Rs 25,000 loss due to fraud

RBI raises GDP growth projection of Q1, Q2 of FY27

RBI pauses rate cuts, retains interest rate at 5.25 pc

Rupee jumps 122 paise to close at 90.27 against US dollar on India-US trade deal

Stock markets cheer India-US trade deal: Sensex, Nifty surge 2.5 pc

UPI transactions hit record high of Rs 230 lakh crore in 2025-26 till Dec: Govt