


Highlights
- RSI and MACD highlight potential volatility, with the IT and Auto sectors
- Analysis underlines the need for investors to exercise caution
- Remain watchful of market shifts in the coming sessions
Latest news

Dell Launches New Pro Precision AI Workstations In India, Introduces Deskside Agentic AI Platform

Oppo Enco Air5 Review: Incredible Value at ₹3,099

Samsung Galaxy A27 5G Goes On Sale In India With Cashback Offers, Zero Down Payment Schemes
 First Impressions: A Strong Debut For The New 'b' Series")
Nothing Phone (4b) First Impressions: A Strong Debut For The New 'b' Series

Samsung Galaxy A27 Review: A Dependable Mid-Ranger With Few Surprises

Union Finance Minister Nirmala Sitharaman Inaugurates Muzhiyan Kulam, Restored by Lumina Datamatics and Community Stakeholders in Puducherry

"Don't think anyone will be able to break his track record": Annu Kapoor hails Big B's unmatched legacy

Rewriting the Rules of Business Education: Stride School of Business Unveils Its AI-First Campus Infrastructure
Indian stock market sector-wise performance today - January 23, 2025


The national stock market indices showed varied performances on January 23, 2025, reflecting the economic sentiment.
In this article, we analyze the performance of key national indices including the Nifty 50,Nifty Bank,Nifty IT,Nifty Auto,Nifty Pharma,Nifty FMCG,Nifty Infra,Nifty Energy and Nifty Metal.
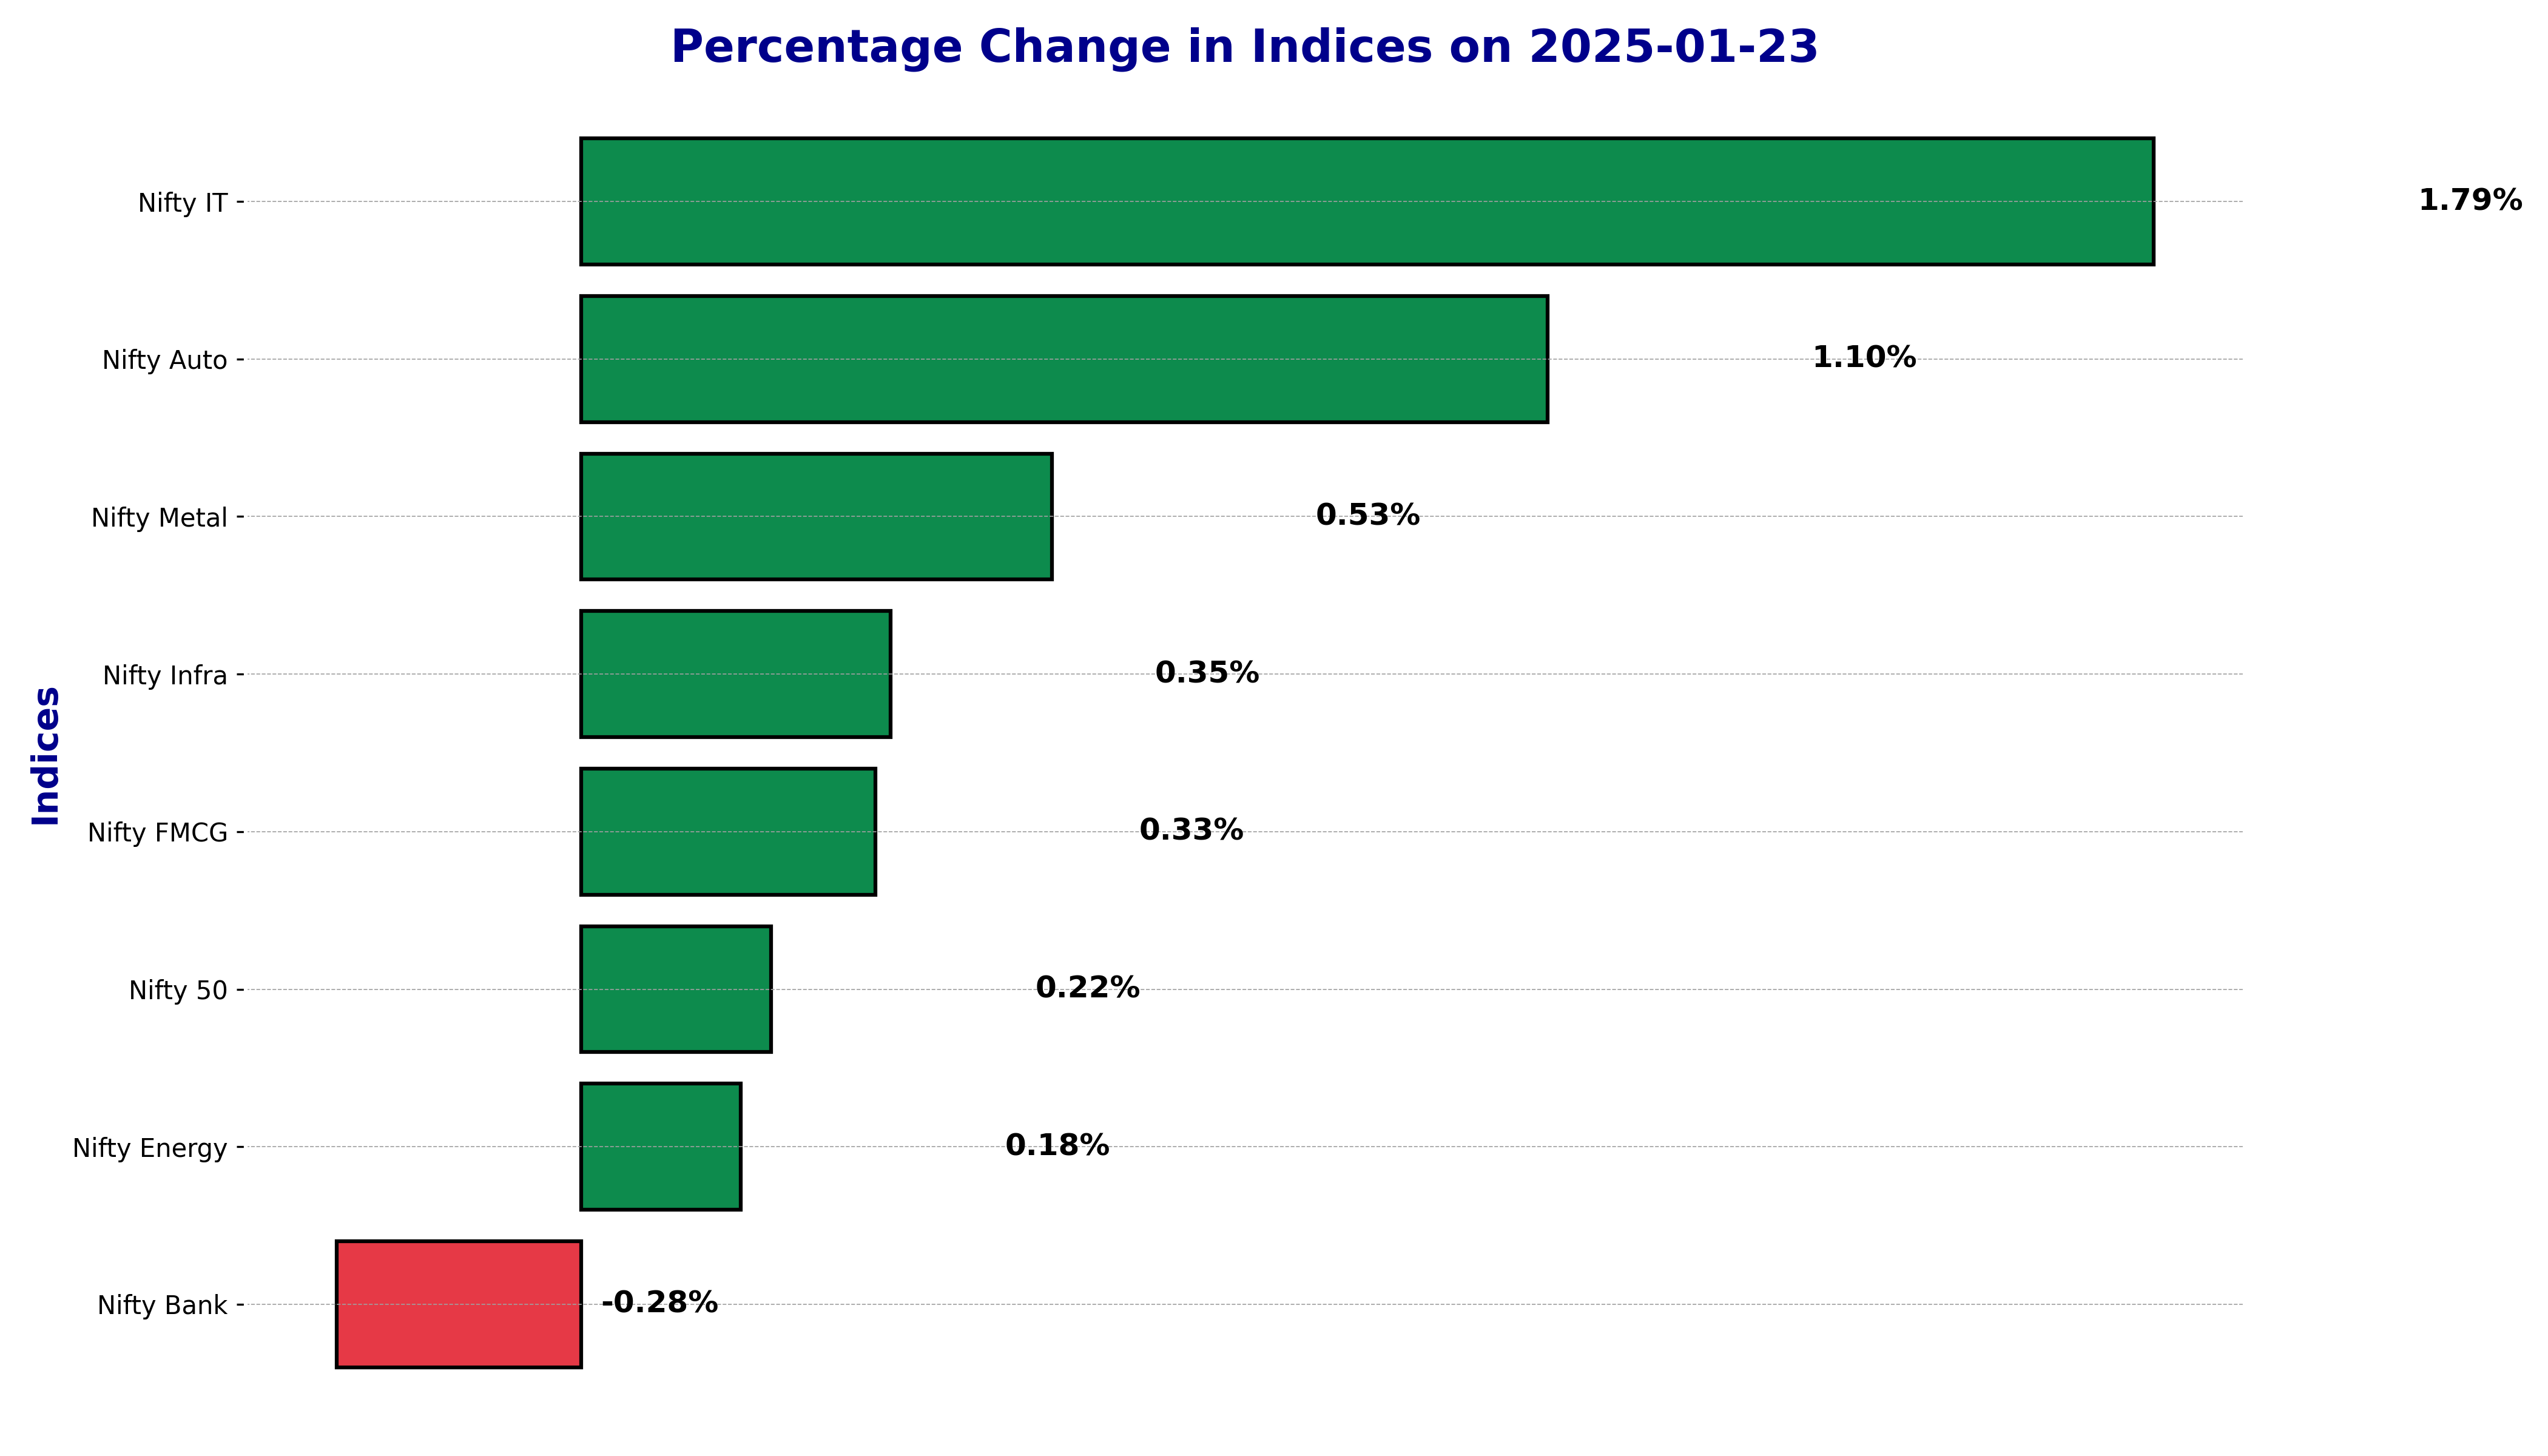
Date: January 23, 2025

The Nifty 50 exhibited a minor yet positive adjustment, recording a % change of 0.22% and a points change of 50.0 points, closing at 23,205.35. This performance of the Stock Name: Nifty 50 demonstrates intriguing market dynamics.
Technical Indicators:
The 50-day Exponential Moving Average (EMA) stands at 23,616.91, while the 200-day EMA is recorded at 23,740.76. These moving averages are crucial in assessing the longer-term market trend. The Relative Strength Index (RSI) is observed at 38.81, suggesting that the market could be approaching oversold conditions. Typically, an RSI below 30 indicates an oversold market, while one above 70 suggests an overbought market.
The Moving Average Convergence Divergence (MACD) indicator is currently at -183.02, with a MACD Signal line of -171.63. A negative MACD value, particularly when below the Signal line, can indicate a bearish market sentiment.
Market Sentiment:
Analyzing the current technical indicators, it seems that the Nifty 50 is experiencing a downtrend. This is corroborated by the MACD's negative values and the RSI reading being relatively lower than the midpoint of 50, which suggests bearish momentum. The 50 EMA being below the 200 EMA further confirms a bearish sentiment, indicating a downward market movement over the medium term.
The RSI and MACD both serve as vital tools in identifying the market trend. The RSI provides insight into the potential entries and exits based on overbought or oversold conditions, while the MACD highlights momentum shifts in the market. As the current readings suggest, the Nifty 50 may continue in a downward trajectory unless there is a significant market catalyst to shift the sentiment.
Technical Analysis of Nifty Auto on January 23, 2025

The Nifty Auto index showcased a positive momentum with a % change of 1.10% and a points change of 244.60. Heavily tracking the automotive sector, this index is a crucial indicator of the industry's overall health and aggregate performance.
Technical Indicators Overview:
The 50-day Exponential Moving Average (EMA) stands at 22999.996, which acts as a short-term resistance level. The 200-day EMA is observed at 23088.214, indicating a more stable, long-term outlook. Currently, the Nifty Auto is trading below these averages, implying potential bearish pressure in the short to medium term. The Relative Strength Index (RSI) is noted at 41.23, signifying that the market is neither overbought nor oversold but has room to decline before hitting the oversold territory. The Moving Average Convergence Divergence (MACD) is -187.47, with a MACD Signal line of -127.00. The negative MACD suggests a bearish momentum; however, a crossover above the signal line could indicate a potential reversal.
Market Sentiment:
The Nifty Auto, reflecting on its current indicators, appears to be in a consolidation phase with cautious optimism. The index's recent performance, coupled with its position relative to the EMAs, suggests it might be in a downtrend or stabilizing phase. The RSI level indicates that there is no immediate oversell situation, but traders should be wary of weakening momentum. The MACD indicator supports the narrative of ongoing bearish sentiment, but investors are keeping an eye out for a potential bullish crossover.
In summary, while the Nifty Auto showcases a gain in points, the technical indicators suggest cautiousness with mixed signals. The industry should watch for significant movements in the coming days for clearer trend directions.
Technical Analysis for Nifty Bank on January 23, 2025

The Nifty Bank index experienced a percentage change of -0.28% which equates to a points change of -135.40. This denotes a decrease in the market index's value. Let us delve deeper into the technical aspects to glean more insights into the market's behavior.
Technical Indicators Analysis:
50 EMA and 200 EMA: The 50-day Exponential Moving Average (EMA) stands at 50172.69, while the 200-day EMA is at 50606.13. Since both EMAs are higher than the current closing price of 48589.00, this indicates a bearish sentiment in the market. The price trading below major EMAs suggests that the market may be in a longer-term downtrend.
Relative Strength Index (RSI): The RSI is at 36.35, which is below the neutral 50 level. An RSI below 50 often signals that the market is currently weaker and may face selling pressure. It is still above the oversold level of 30, indicating there might be room for the market to drop further if negative sentiment persists.
MACD: The Moving Average Convergence Divergence (MACD) is -631.19, and the MACD Signal line is -624.64. The fact that the MACD is below the Signal line indicates bearish momentum. The negative values also reinforce the current downtrend sentiment.
Market Sentiment: Based on the technical indicators, the Nifty Bank is currently in a downtrend. Both larger EMAs suggest that the market is under bearish control, and there isn't a strong indicator of reversal at the moment. The RSI indicates lack of momentum, while the MACD reaffirms the downward trend. These readings highlight that sellers have the upper hand in the market currently.
Nifty Energy Technical Analysis - January 23, 2025

The Nifty Energy index closed at 33,866.60, marking a percentage change of 0.18% with a points gain of 61.40 points. The stock managed to open at 33,707.30, with the high reaching 34,095.25 and the low noted at 33,574.70.
Technical Indicators Analysis:
The 50-day Exponential Moving Average (EMA) for Nifty Energy is calculated at 34,880.65, while the 200-day EMA stands at 35,146.22. These values indicate that the short-term trend is generally below the longer-term trend, suggesting a downward trajectory over the significant timeframe.
The Relative Strength Index (RSI) is measured at 39.91, which positions it in the lower range, nearing the oversold territory. An RSI value below 40 often indicates that the stock may be under pressure, but a potential buying opportunity if other indicators align.
Looking at the Moving Average Convergence Divergence (MACD), it is noted at -341.33 with the MACD Signal Line at -354.68. Since the MACD is higher than the Signal Line, it suggests that although the overall momentum is negative, it is slightly less aggressive than earlier, hinting at possible consolidation or a slow shift.
Market Sentiment:
Currently, the market sentiment for Nifty Energy appears predominantly bearish, given the stock is trading below both its 50-EMA and 200-EMA. This indicates a downtrend over the medium to long term. The RSI nearing oversold levels could suggest a potential rebound, but caution is advised. The MACD revealing less negative momentum than the signal also hints at potential stabilization but is not strongly bullish yet.
The RSI and MACD collectively offer insights into potential trend reversals, with RSI below 40 often regarded as an undervalued region suggesting a potential bounce. Meanwhile, the MACD’s higher value compared to its Signal Line suggests that the bearish trend's momentum might be waning, albeit still within a downtrend framework.
Investors and traders should monitor future market signals closely for any signs of trend reversal or continuation.
Nifty FMCG Technical Analysis on January 23, 2025

The Nifty FMCG closed at 55,781.80 on January 23, 2025, marking a percentage change of 0.33% with a points change of 185.75. This indicates an upward adjustment within the market despite the broader technical indicators suggesting mixed sentiment.
Technical Indicators:
Analyzing the Exponential Moving Averages (EMAs), we observe that the 50 EMA stands at 56,305.20, while the 200 EMA is at 56,377.71. The price is currently below both the 50 EMA and the 200 EMA, indicating a potential bearish sentiment in the longer term.
The Relative Strength Index (RSI) is at 43.98, which is below the neutral level of 50, hinting at somewhat bearish momentum in the market. Additionally, the Moving Average Convergence Divergence (MACD) is -237.14, with its signal line at -147.61. The MACD being in negative territory, along with a negative histogram, suggests potential downward pressure.
The % change of 0.33% and points change of 185.75, however, suggests a short-term recovery attempt within the overall bearish outlook.
Market Sentiment:
Based on the technical indicators, the Nifty FMCG market appears to be in a slight downtrend. The position of the price below both the 50 EMA and 200 EMA, complemented by a sub-50 RSI reading, points to a bearish sentiment. The MACD further corroborates this with its negative value and position below the signal line, signaling possible continuation of downward pressure. In conclusion, while there was a small upward movement reflected in the % change and points change on January 23, 2025, the overall trend as identified by key technical indicators suggests a cautious bearish outlook for the Nifty FMCG. Investors should keep an eye on both the EMAs and MACD for any signs of trend reversal.
Nifty IT: Market Analysis for January 23, 2025

The "Nifty IT" experienced a noticeable change today, with the stock seeing a percentage increase of 1.79% and a points change of 761.05. This indicates a positive day for the IT sector, marked by significant growth from the previous closing.
Technical Indicators
50 EMA and 200 EMA: The 50-day Exponential Moving Average (EMA) for Nifty IT is at 43,628.63, and the 200-day EMA stands at 43,871.76. As the 50 EMA is currently below the 200 EMA, this suggests a potential downtrend over the recent period. The EMAs provide insight into the long-term and intermediate-trend dynamics, where a crossover in the future could indicate potential shifts in the current market trend.
Relative Strength Index (RSI): The RSI stands at 48.68, placing it just below the midpoint of 50, which is considered a neutral zone. This level indicates neither overbought nor oversold conditions, hinting at a balanced momentum between buyers and sellers in the current market.
MACD: The Moving Average Convergence Divergence (MACD) is at -392.51 with a MACD signal line of -355.30. The MACD being below the signal line further suggests bearish momentum, although the gap is not overly significant, indicating that momentum is weak and could potentially turn with the right conditions.
Market Sentiment
Evaluating the performance of Nifty IT based on the above technical indicators, the market currently shows subtle signs of a downtrend, primarily informed by the EMA alignment and the MACD readings. However, the overall change seen today suggests some bullish activity, though not strongly confirmed by the technical indicators.
The RSI aligns with this sentiment, sitting in a neutral territory, indicating that the market is at a crossroads, not strongly leaning towards either bullish or bearish extremes. The combination of EMA, RSI, and MACD suggests market participants are observing carefully for any potential trend reversals or continuations in the short term.
Technical Analysis of Nifty Infra on January 23, 2025

The Nifty Infra exhibited a modest gain on January 23, 2025. The index closed at 8314.70, reflecting a percentage change of 0.35% and a points change of 29.15 from the previous close of 8285.55.
Technical Indicators
The 50-day Exponential Moving Average (EMA) for Nifty Infra stands at 8447.27, while the 200-day EMA is at 8499.11. These values indicate the current moving averages that help assess the trend direction. As the current closing price of 8314.70 is below both the 50 EMA and 200 EMA, it suggests a potential bearish sentiment in the market.
Relative Strength Index (RSI) is measured at 42.66. The RSI, being below the neutral level of 50, highlights a bearish momentum but still falls short of indicating oversold conditions.
The Moving Average Convergence Divergence (MACD) is recorded at -61.19, whereas the MACD Signal stands at -70.71. The MACD is above the Signal line, signaling a slight bullish crossover; however, the negative values still suggest bearish tendencies overriding bullish sentiments.
Market Sentiment
Exploring the overall technical outlook, the Nifty Infra seems to be experiencing a downtrend, primarily sustained by its position below significant moving averages like the 50 EMA and 200 EMA. The low RSI further supports the notion of an ongoing bearish sentiment, albeit not reaching oversold levels.
The MACD indicator provides some insight into a potential reversal or slowing down of the current downtrend, with its slight crossover above the Signal line. However, the market appears to be chiefly under the influence of bearish forces, given the closing price positions relative to long-term EMAs and the general MACD negativity.
Technical Analysis of Nifty Metal on January 23, 2025:

% Change: The Nifty Metal showcased a marginal increase of 0.53% in its value.
Points Change: The index witnessed a positive movement with a points change of 45.30.
Stock Name: Nifty Metal
Technical Indicators Analysis:
50 EMA: The 50-day Exponential Moving Average (EMA) for Nifty Metal stands at 8645.30. As the closing price is below the 50 EMA, it suggests a short-term bearish sentiment.
200 EMA: The 200-day EMA is at 8732.26. The fact that the closing price is also below the 200 EMA indicates a long-term bearish market trend and potential resistance level.
RSI: The Relative Strength Index (RSI) is currently at 44.44. This is below the neutral line of 50, indicating that the Nifty Metal is neither extremely overbought nor oversold but is hovering near the lower spectrum of the scale, suggesting potential bearish pressure.
MACD: The Moving Average Convergence Divergence (MACD) is at -82.58, while the MACD Signal line is at -115.53. Since the MACD line is above the Signal line, it may point towards the start of bullish momentum, albeit weak.
Market Sentiment:
The overall analysis of the Nifty Metal based on current technical indicators suggests that the market is in a downtrend. The position of the price relative to both the 50 EMA and 200 EMA indicates ongoing negative sentiment in the broader timeframe. Meanwhile, the RSI, being below 50, is reflective of a relatively weak momentum, with the possibility of continued bearish activity. The slight convergence seen in the MACD could lead to a short-term reversal, but the prevailing setup still leans towards a bearish outlook.
Up Next
Indian stock market sector-wise performance today - January 23, 2025

Step-by-step guide to apply for a mortgage loan online with minimal documentation

Honda Activa 6G: Everything You Need to Know Before Buying

How much does a ULIP plan really cost? A break-down of all charges

Centre plans to borrow Rs 8.20 lakh cr from market in first half of FY27

Reliance denies buying Iranian oil amid US sanctions waiver

More videos

Premium petrol price up Rs 2, industrial diesel up Rs 22; no change in normal petrol, diesel rates

India's GDP expected to register over 8 pc growth in Sep-Dec: Report

Govt announces seven measures to help boost exports

RBI keeps interest rates on hold after US trade deal boosts outlook

RBI proposes to compensate customers up to Rs 25,000 loss due to fraud

RBI raises GDP growth projection of Q1, Q2 of FY27

RBI pauses rate cuts, retains interest rate at 5.25 pc

Rupee jumps 122 paise to close at 90.27 against US dollar on India-US trade deal

Stock markets cheer India-US trade deal: Sensex, Nifty surge 2.5 pc

UPI transactions hit record high of Rs 230 lakh crore in 2025-26 till Dec: Govt