


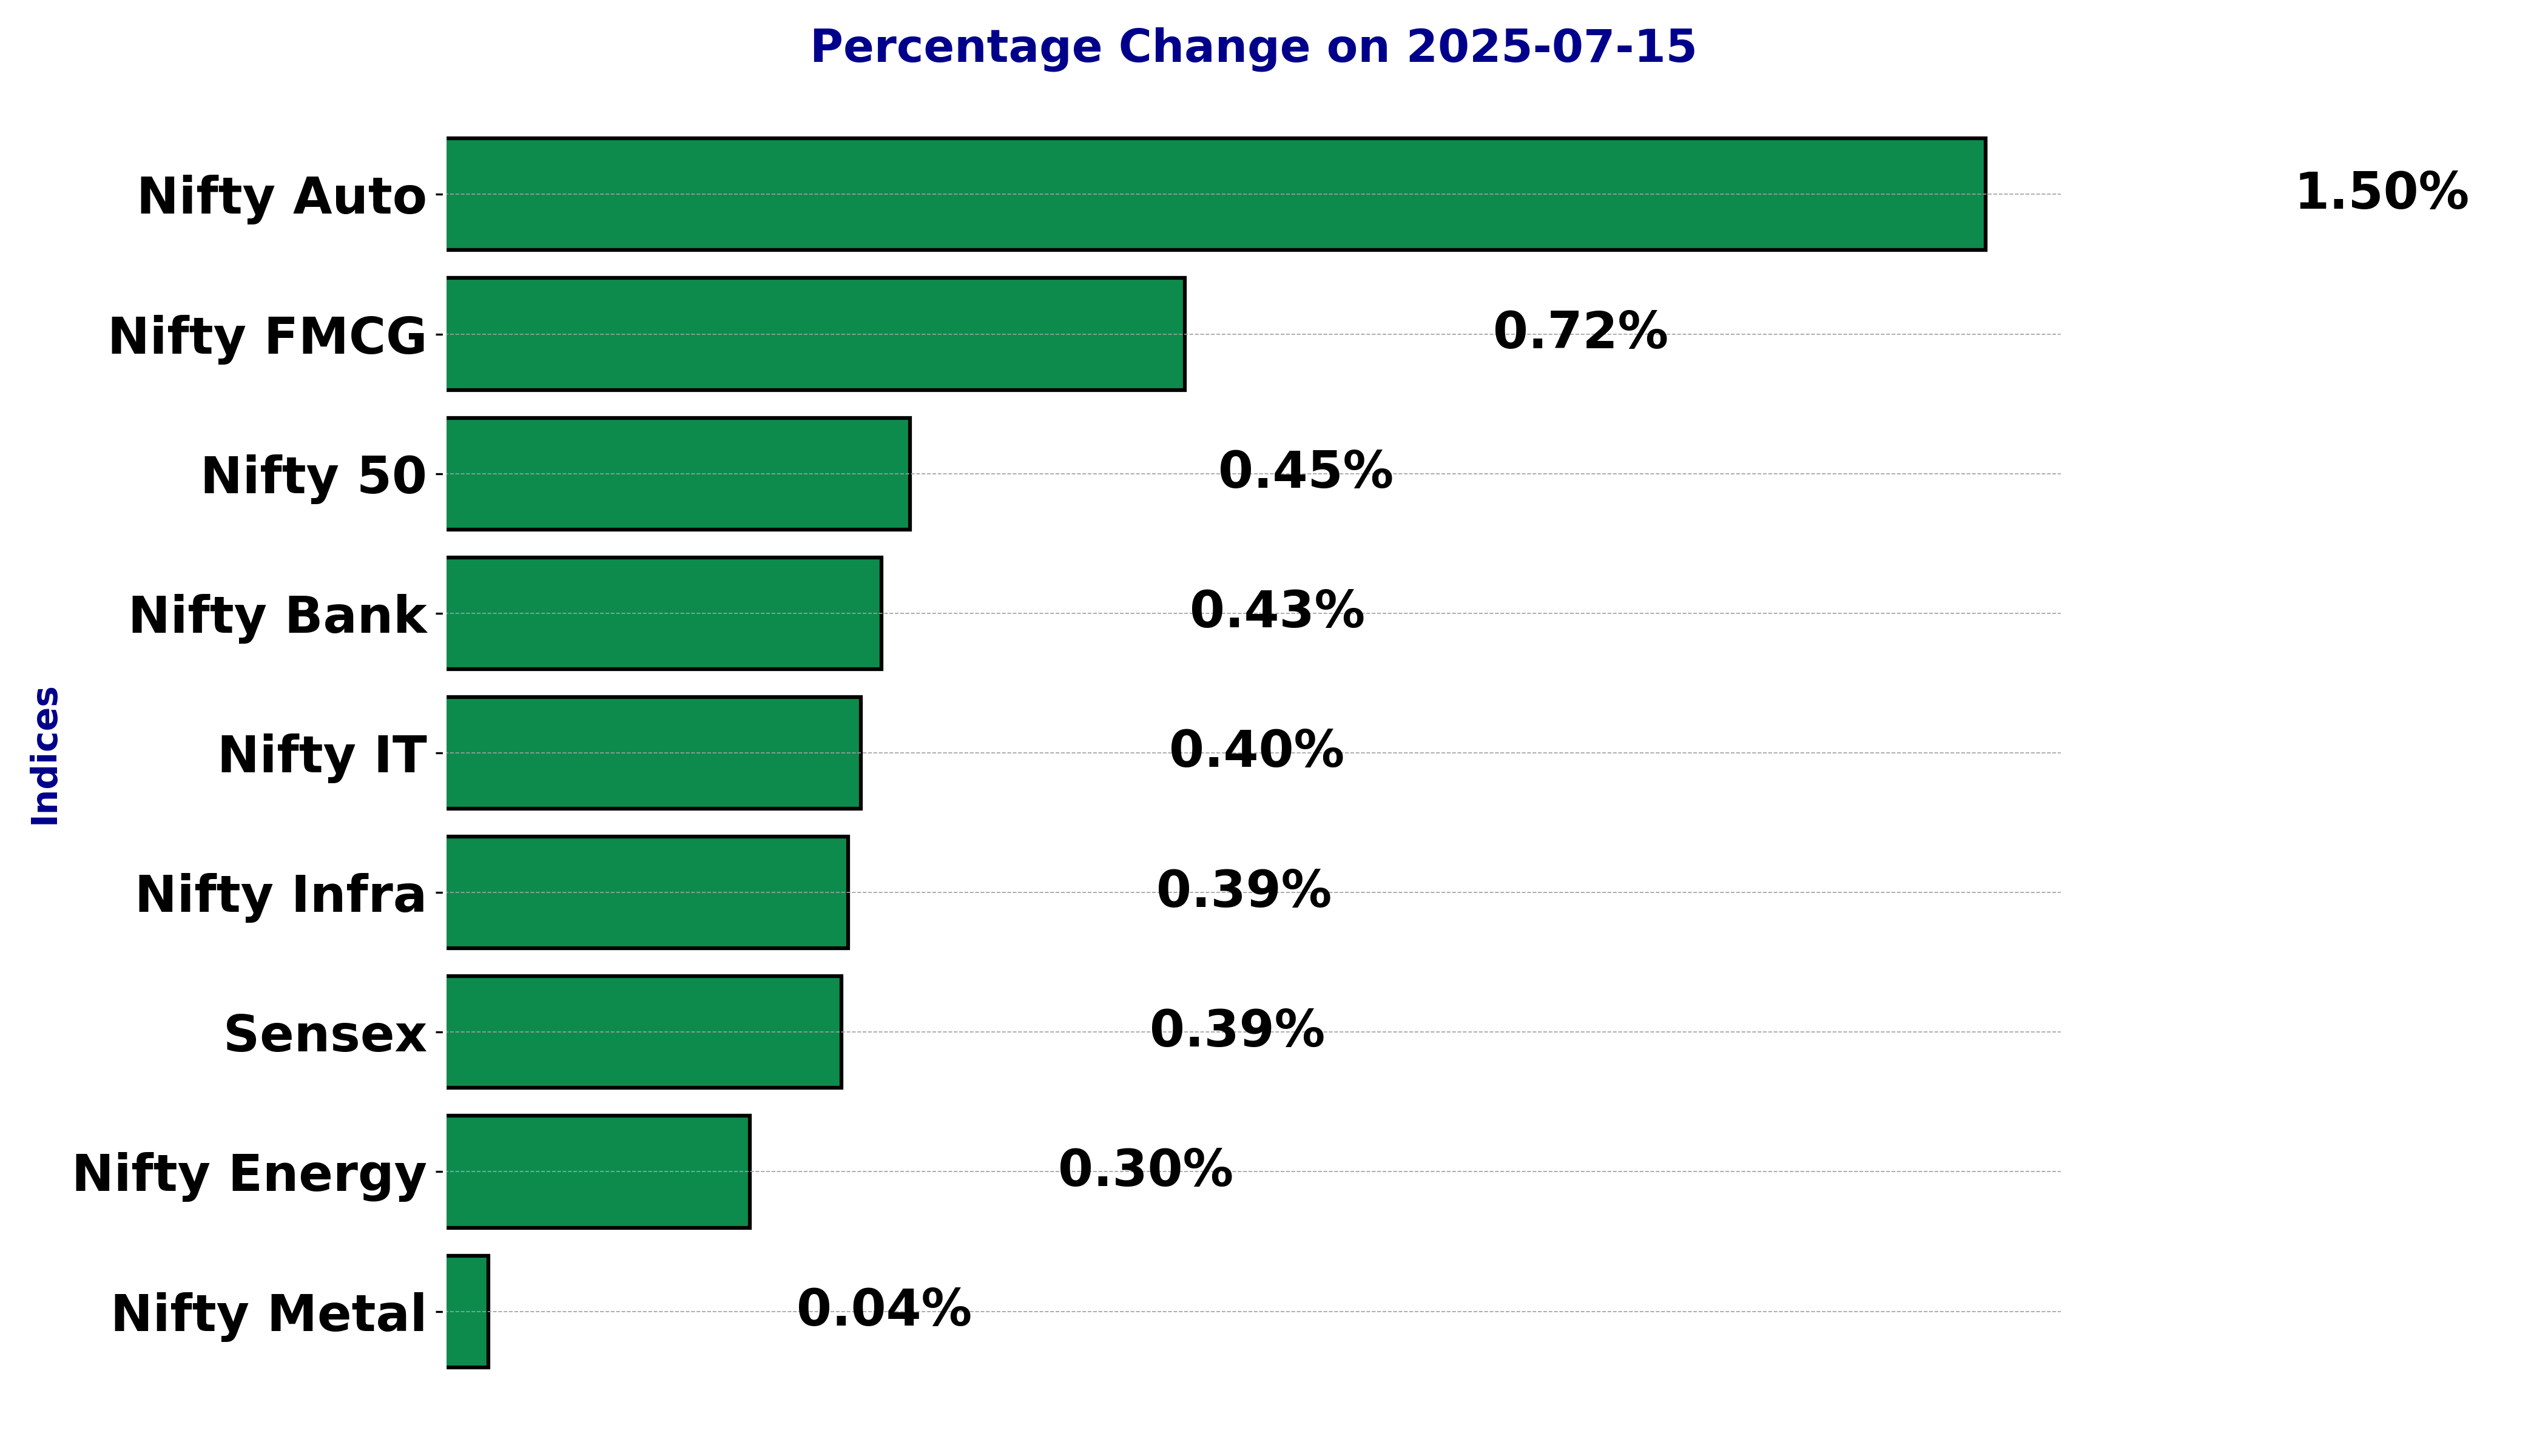
Highlights
- Nifty Auto leads with a 1.50% increase in closing
- Nifty FMCG shows positive movement with a 0.72% gain
- Nifty Metal remains almost flat with just a 0.04% change
Latest news

Samsung Galaxy Z Fold 8, Fold 8 Ultra & Z Flip 8: A More Mature Foldable Family

Dell Launches New Alienware 16X Aurora, 16 Area-51 and 18 Area-51 Gaming Laptops in India

Samsung Takes on Premium Home Audio With New Music Studio Series

The End of OxygenOS: OnePlus Confirms Shift to Oppo's ColorOS

Fujifilm Instax Mini Evo Cinema Review: A Hybrid Camera That Prints Memories Differently

iQOO Teases Z11 Lite With AI Tools, Military-Grade Durability and a 6500mAh Battery

Editorji Launches Hook Global, Its International Digital News Brand

Samsung's Bespoke AI ACs Focus on Humidity, Hygiene and Smarter Cooling
Indian stock market sector-wise performance today - July 15, 2025


The stock market on Tuesday (July 15, 2025) showed varying performances across different sectors.
The Nifty Auto index marked a significant increase, posting a 1.50% rise. This surge reflects investor optimism, potentially driven by strong automotive sales data and positive sentiment in the automotive sector.
The Nifty FMCG index also experienced a noteworthy increase of 0.72%. This indicates a solid performance possibly due to robust consumer demand and favorable market conditions for fast-moving consumer goods.
Energy, represented by the Nifty Energy index, saw a modest rise of 0.30%. While the increase was smaller compared to other sectors, it suggests steady performance amidst fluctuating oil prices and energy demands.
The Nifty 50 and Nifty Bank indices both registered a 0.45% and 0.43% gain, respectively, pointing towards overall market strength. Nifty Bank, in particular, may have benefited from reports of stable banking sector conditions and expectations of economic growth.
Nifty IT saw a modest rise of 0.40%, perhaps indicative of ongoing interest in the technology sector, despite potential headwinds such as global tech regulations and market saturation challenges.
The infrastructure-focused Nifty Infra index experienced a rise of 0.39%. Investor interest in infrastructure projects and governmental policies supporting infrastructure development could have contributed to this increase.
The benchmark index Sensex climbed by 0.39%, aligning with the broader market's upward trajectory, whereas Nifty Metal had a near-negligible increment of 0.04%, suggesting stability in metal stocks despite possible volatility in metal prices internationally.
Among the indices, Nifty IT's rise deserves closer examination. The 0.40% uptick might be owed to resilient earnings from major tech firms and ongoing digital transformation across industries. However, investors also weigh in global tech market dynamics and potential regulatory changes that could impact future growth.
In summary, the stock market exhibited a positive sentiment across most sectors, with Nifty Auto leading the charge.
Various factors, including consumer demand, sector-specific strengths, and economic outlooks, have driven these performances. The tech sector remains a point of interest as it navigates growth opportunities amid regulatory landscapes.
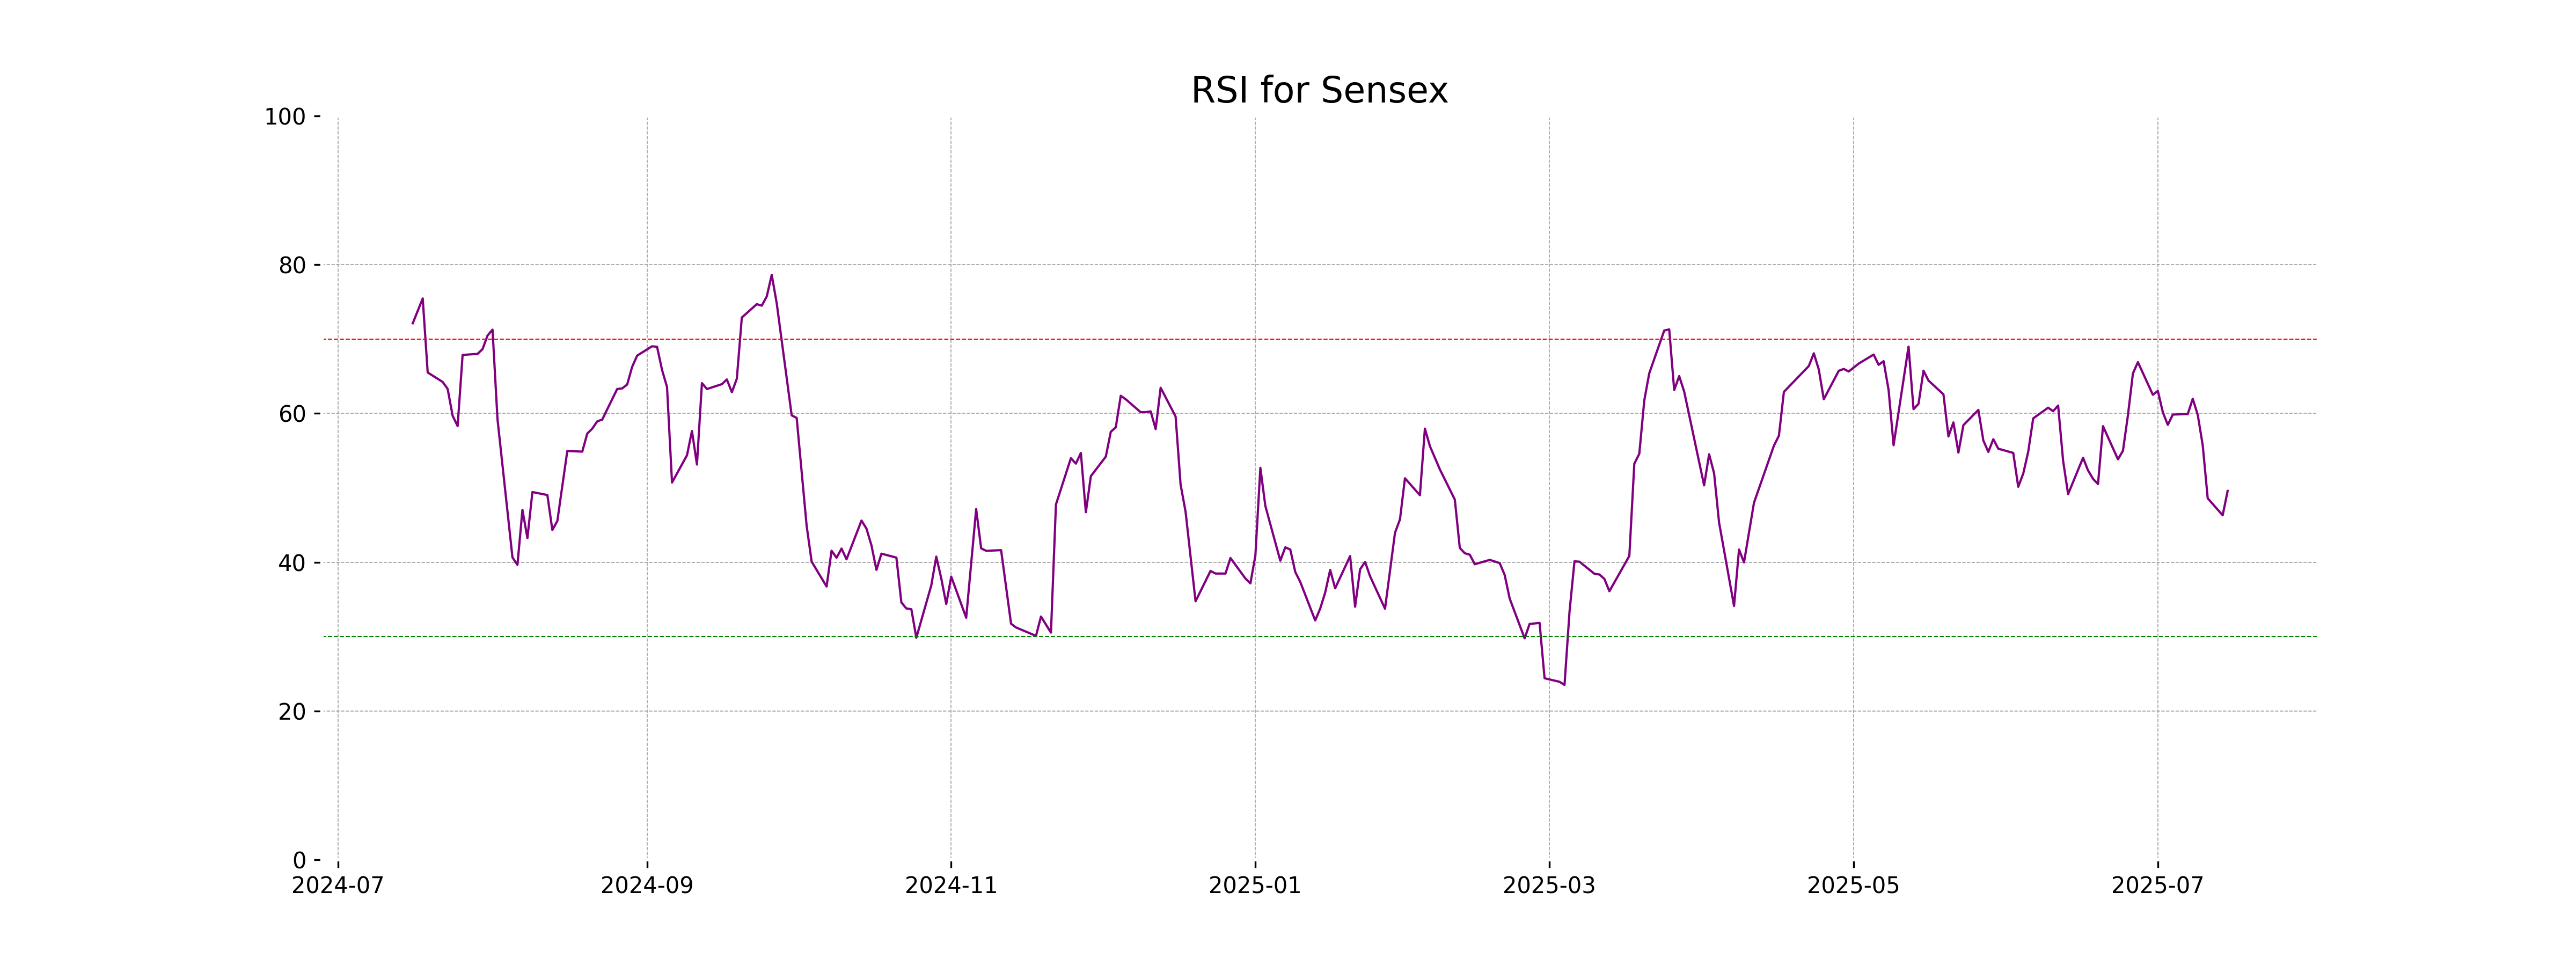
Analysis for Sensex - July 15, 2025
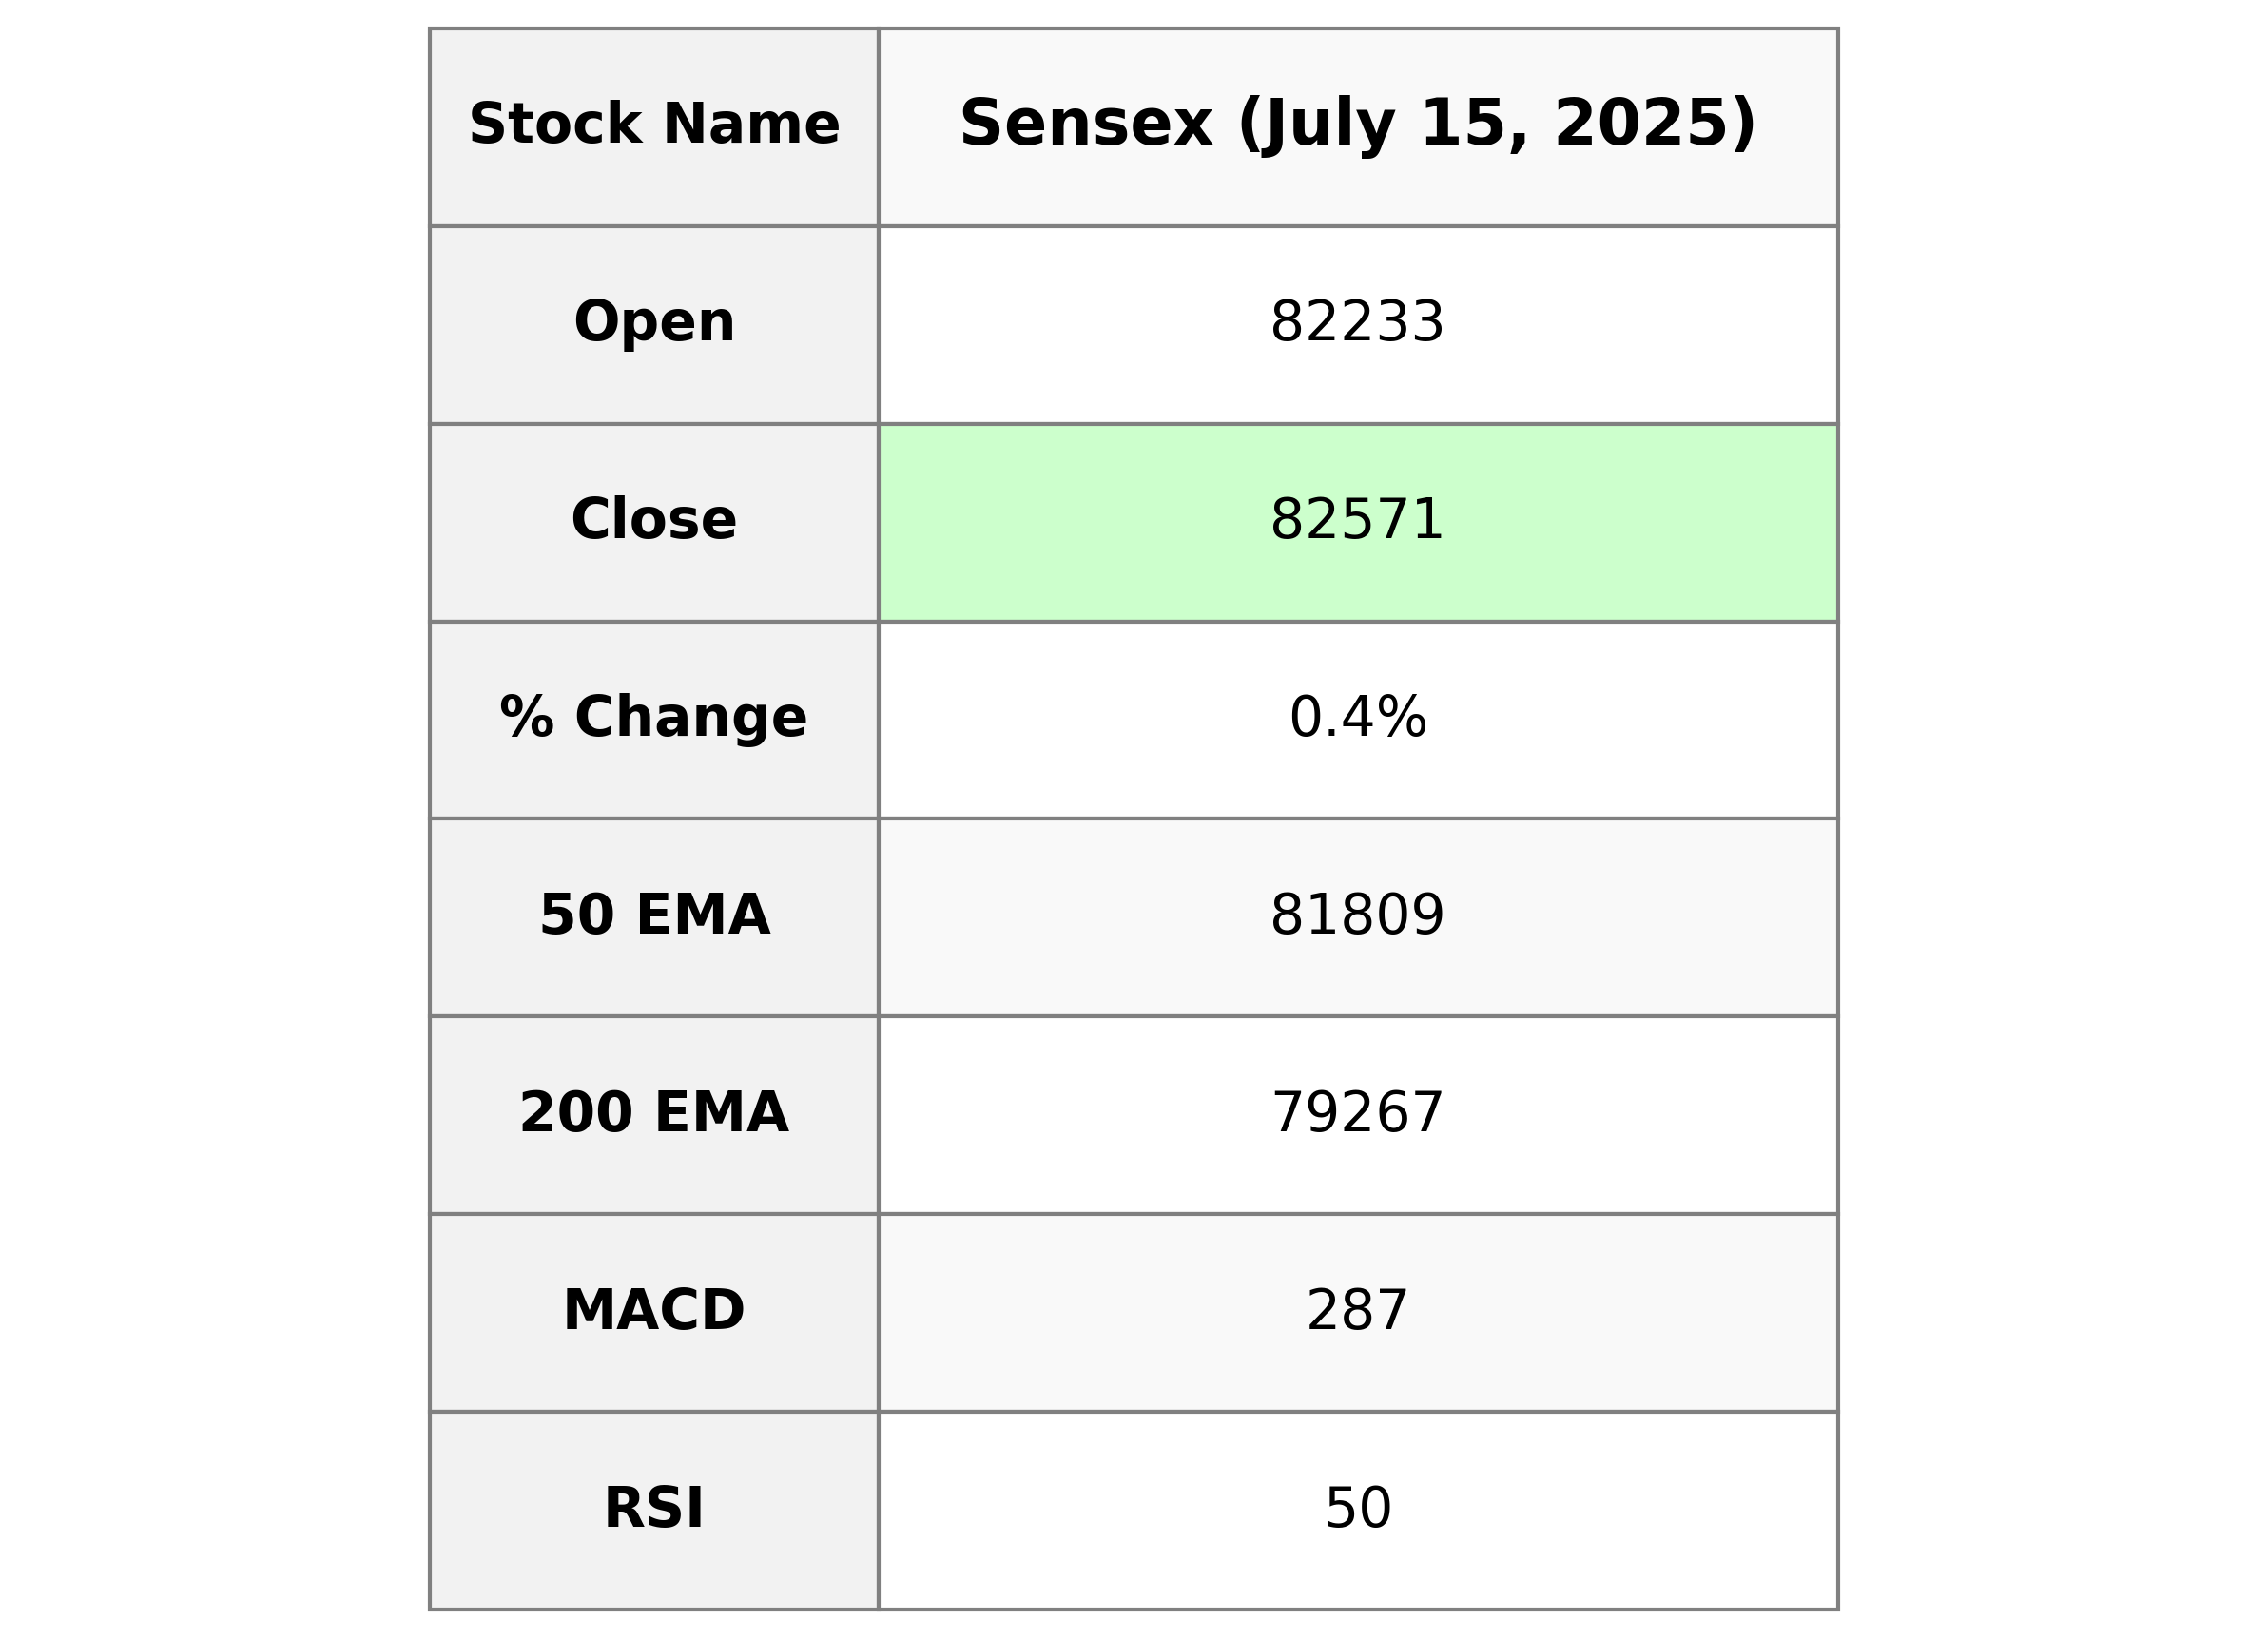
The Sensex opened at 82,233.16 and closed at 82,570.91, reflecting a gain of 317.45 points or 0.39%. The Relative Strength Index (RSI) indicates a slightly mid-range momentum at 49.59, and the MACD is below the MACD Signal, suggesting limited bullish momentum.
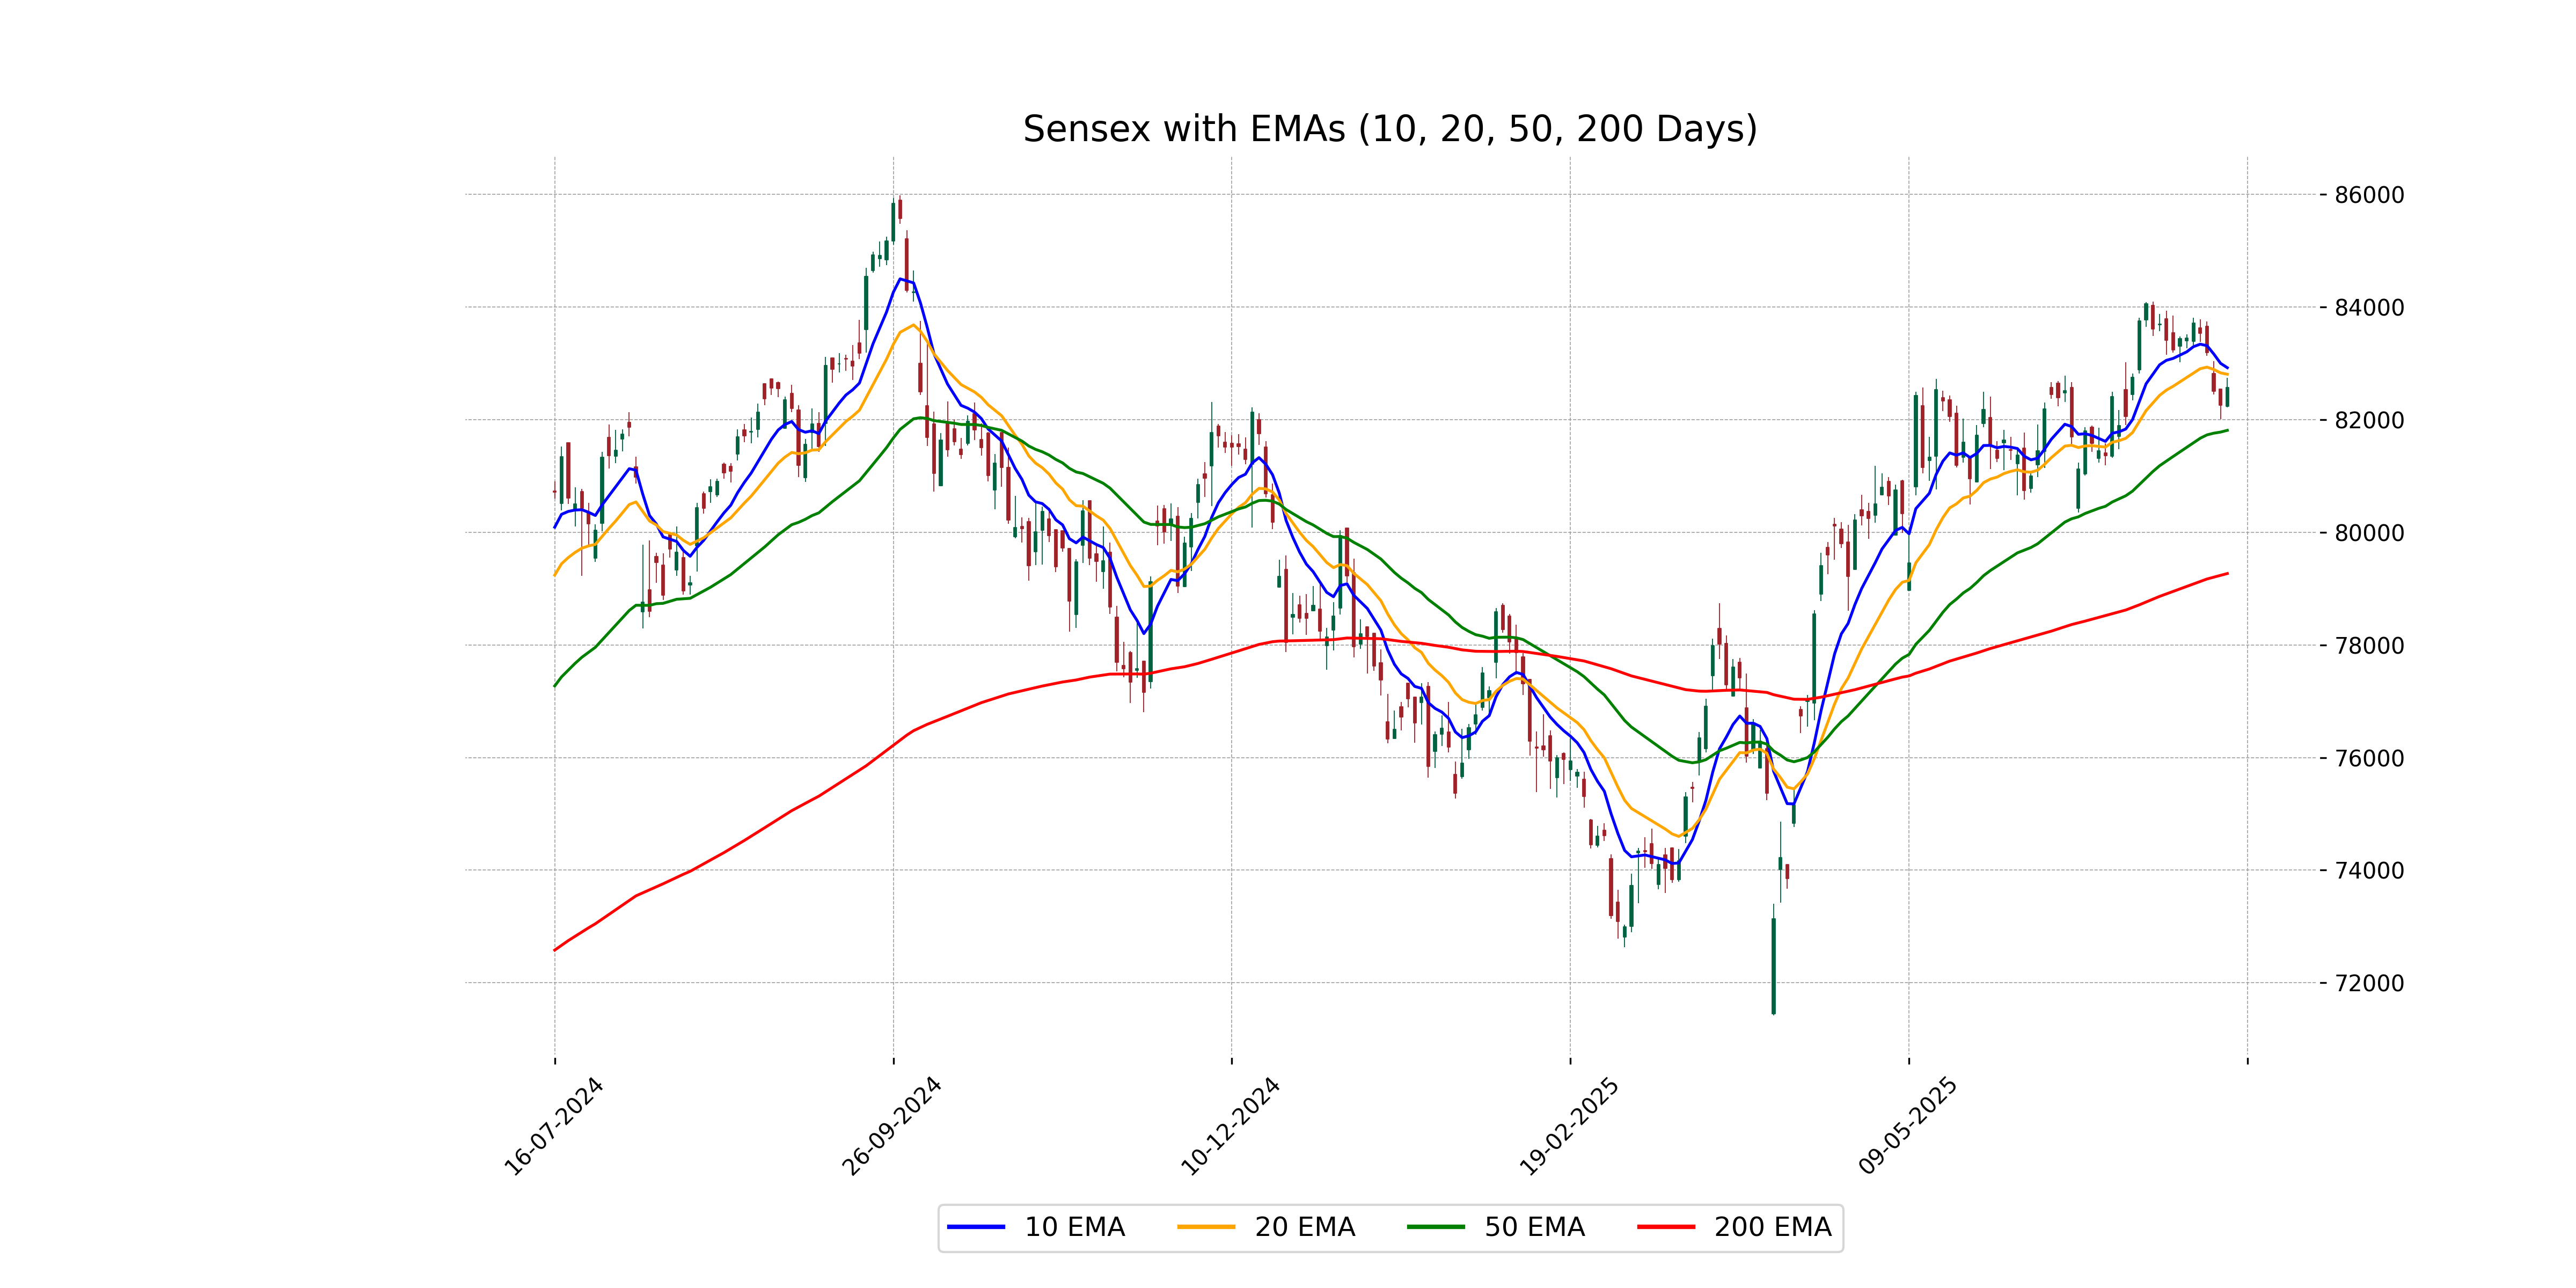
Relationship with Key Moving Averages
The Sensex closed at 82,570.91, which is above its 50 EMA of 81,809.50 and 200 EMA of 79,266.79, indicating a strong upward trend in the medium to long term. However, it's currently below its 10 EMA of 82,921.08 and 20 EMA of 82,805.03, suggesting some short-term consolidation or slight weakness.
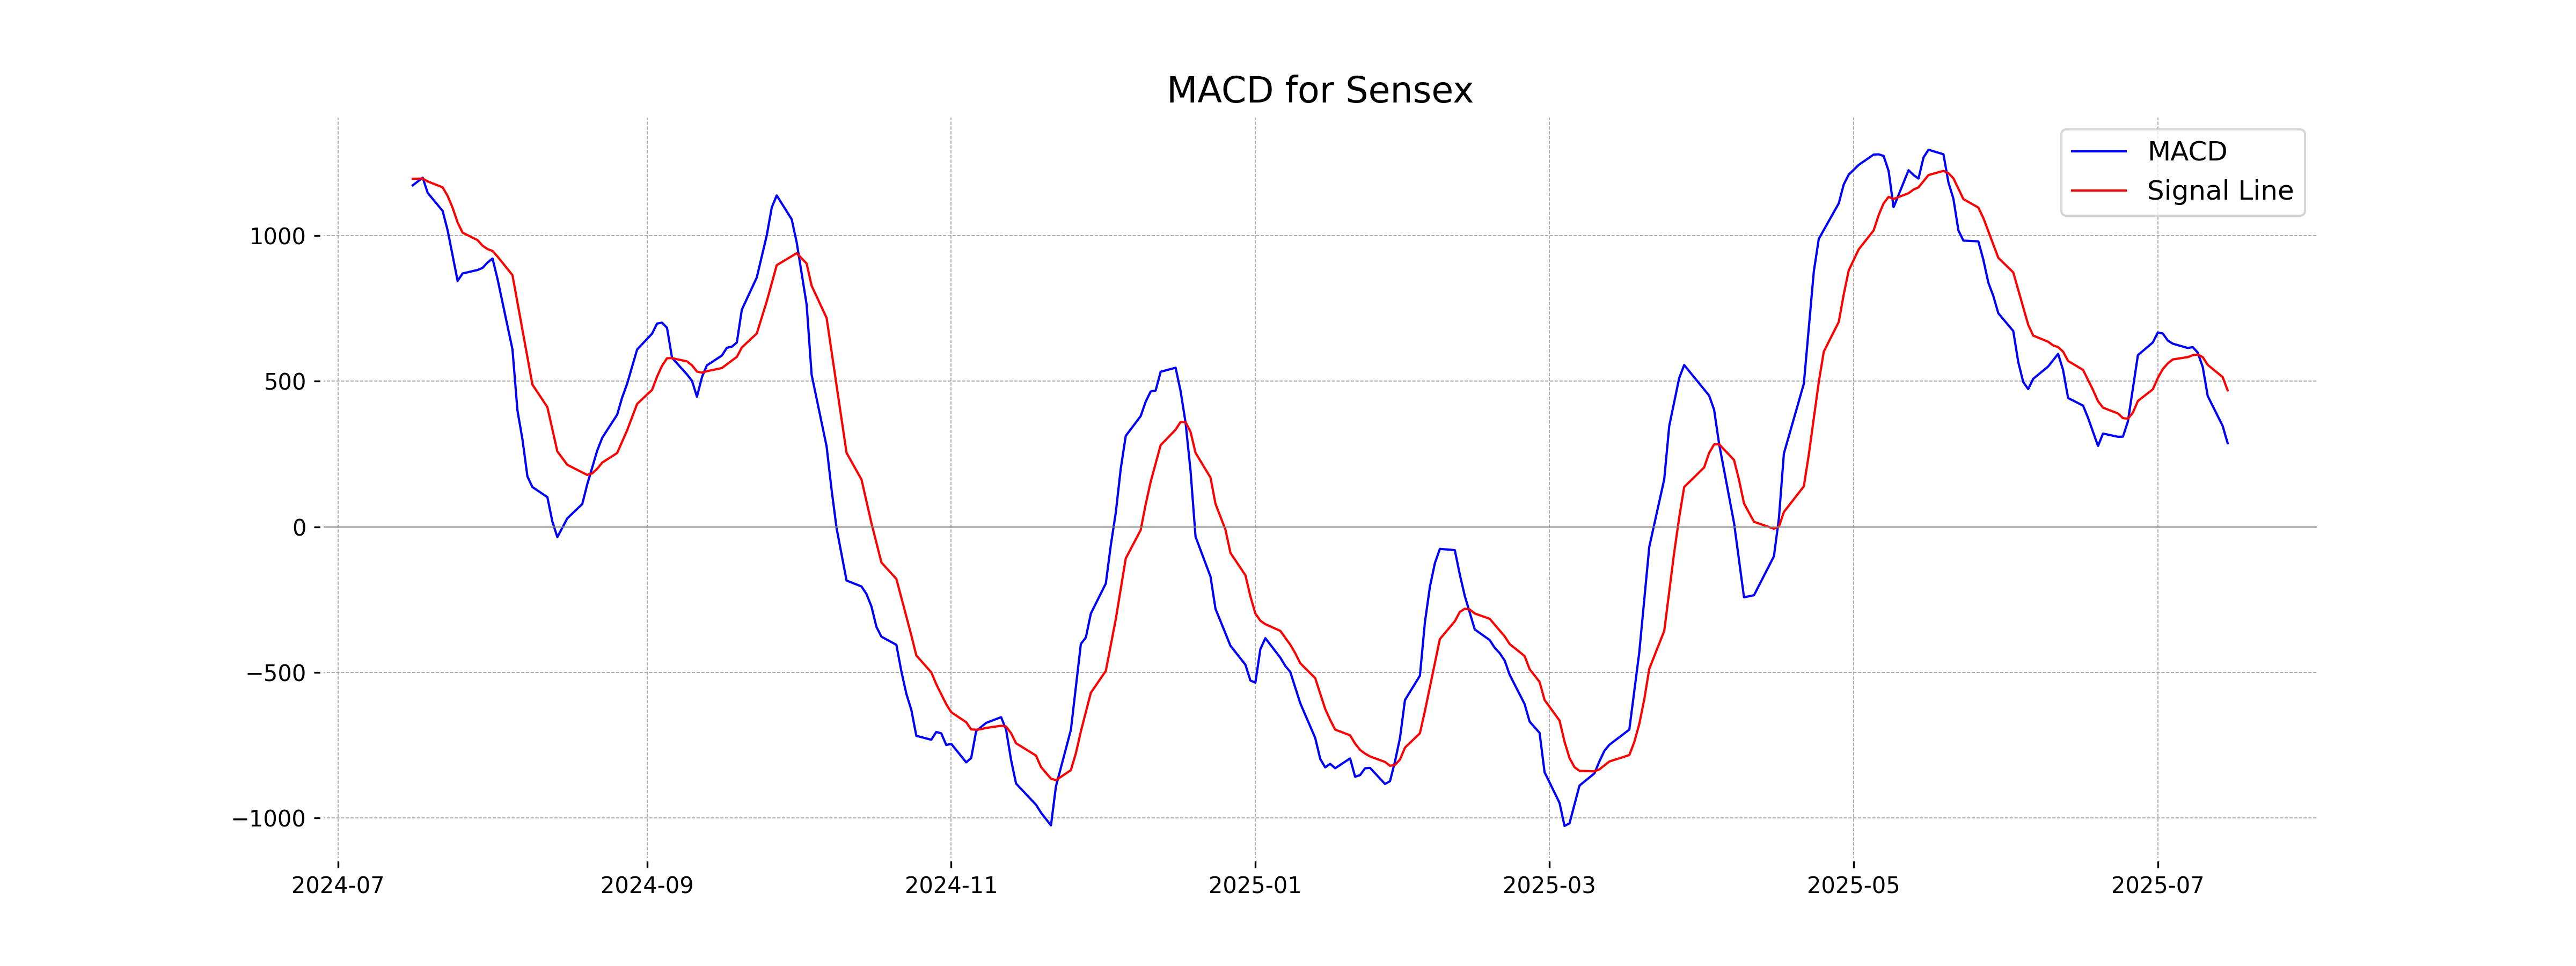
Moving Averages Trend (MACD)
MACD Analysis for Sensex: The MACD of 286.93 is lower than the MACD Signal of 468.66, indicating a bearish trend. This suggests that the current price momentum is weaker compared to previous trends, warranting cautious observation for potential further declines.
RSI Analysis
The Relative Strength Index (RSI) for Sensex is at 49.59, indicating a neutral momentum. It is neither in the overbought nor oversold territory, suggesting a balanced market condition.
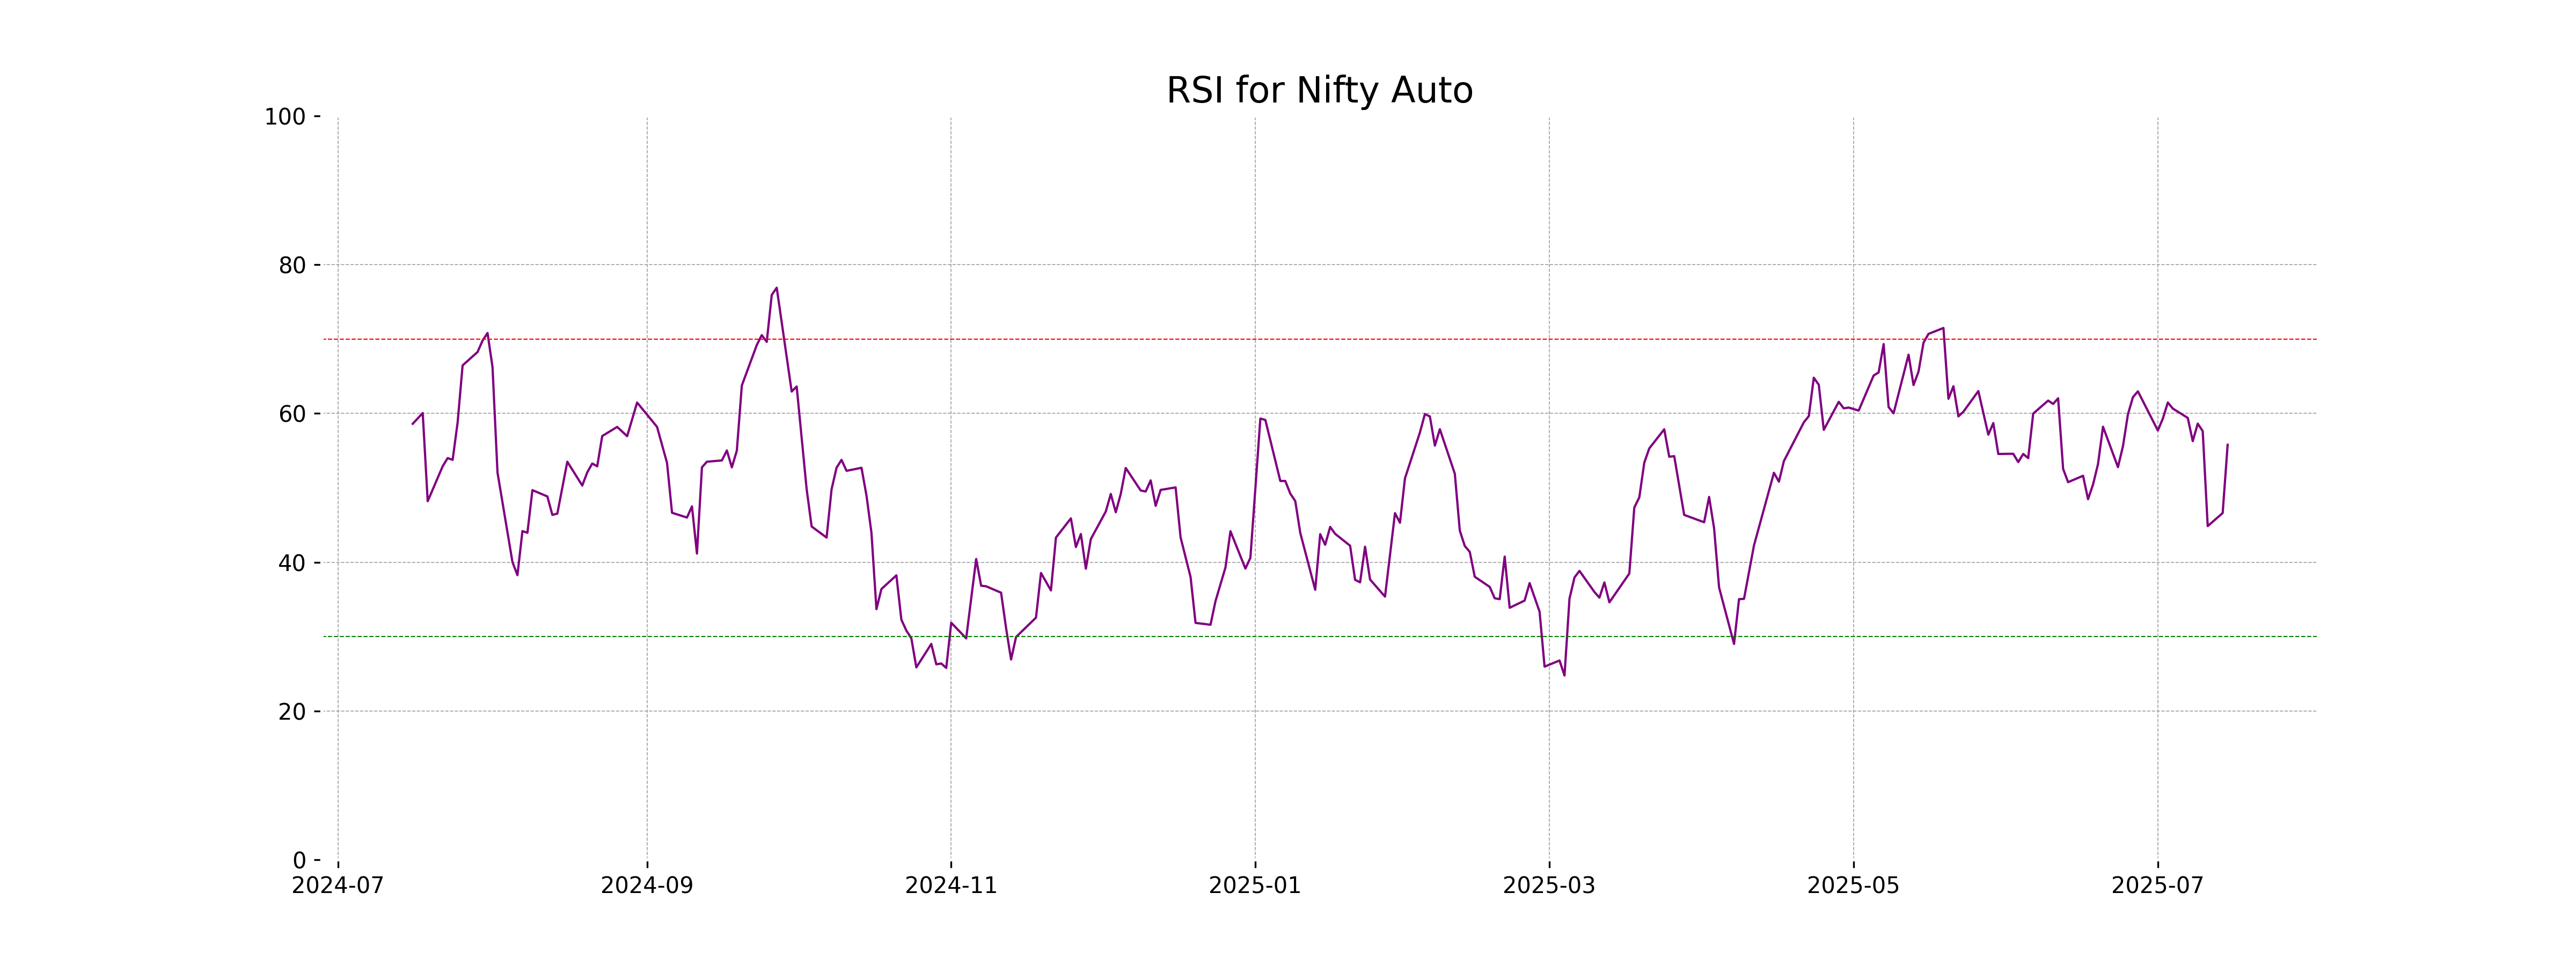
Analysis for Nifty Auto - July 15, 2025
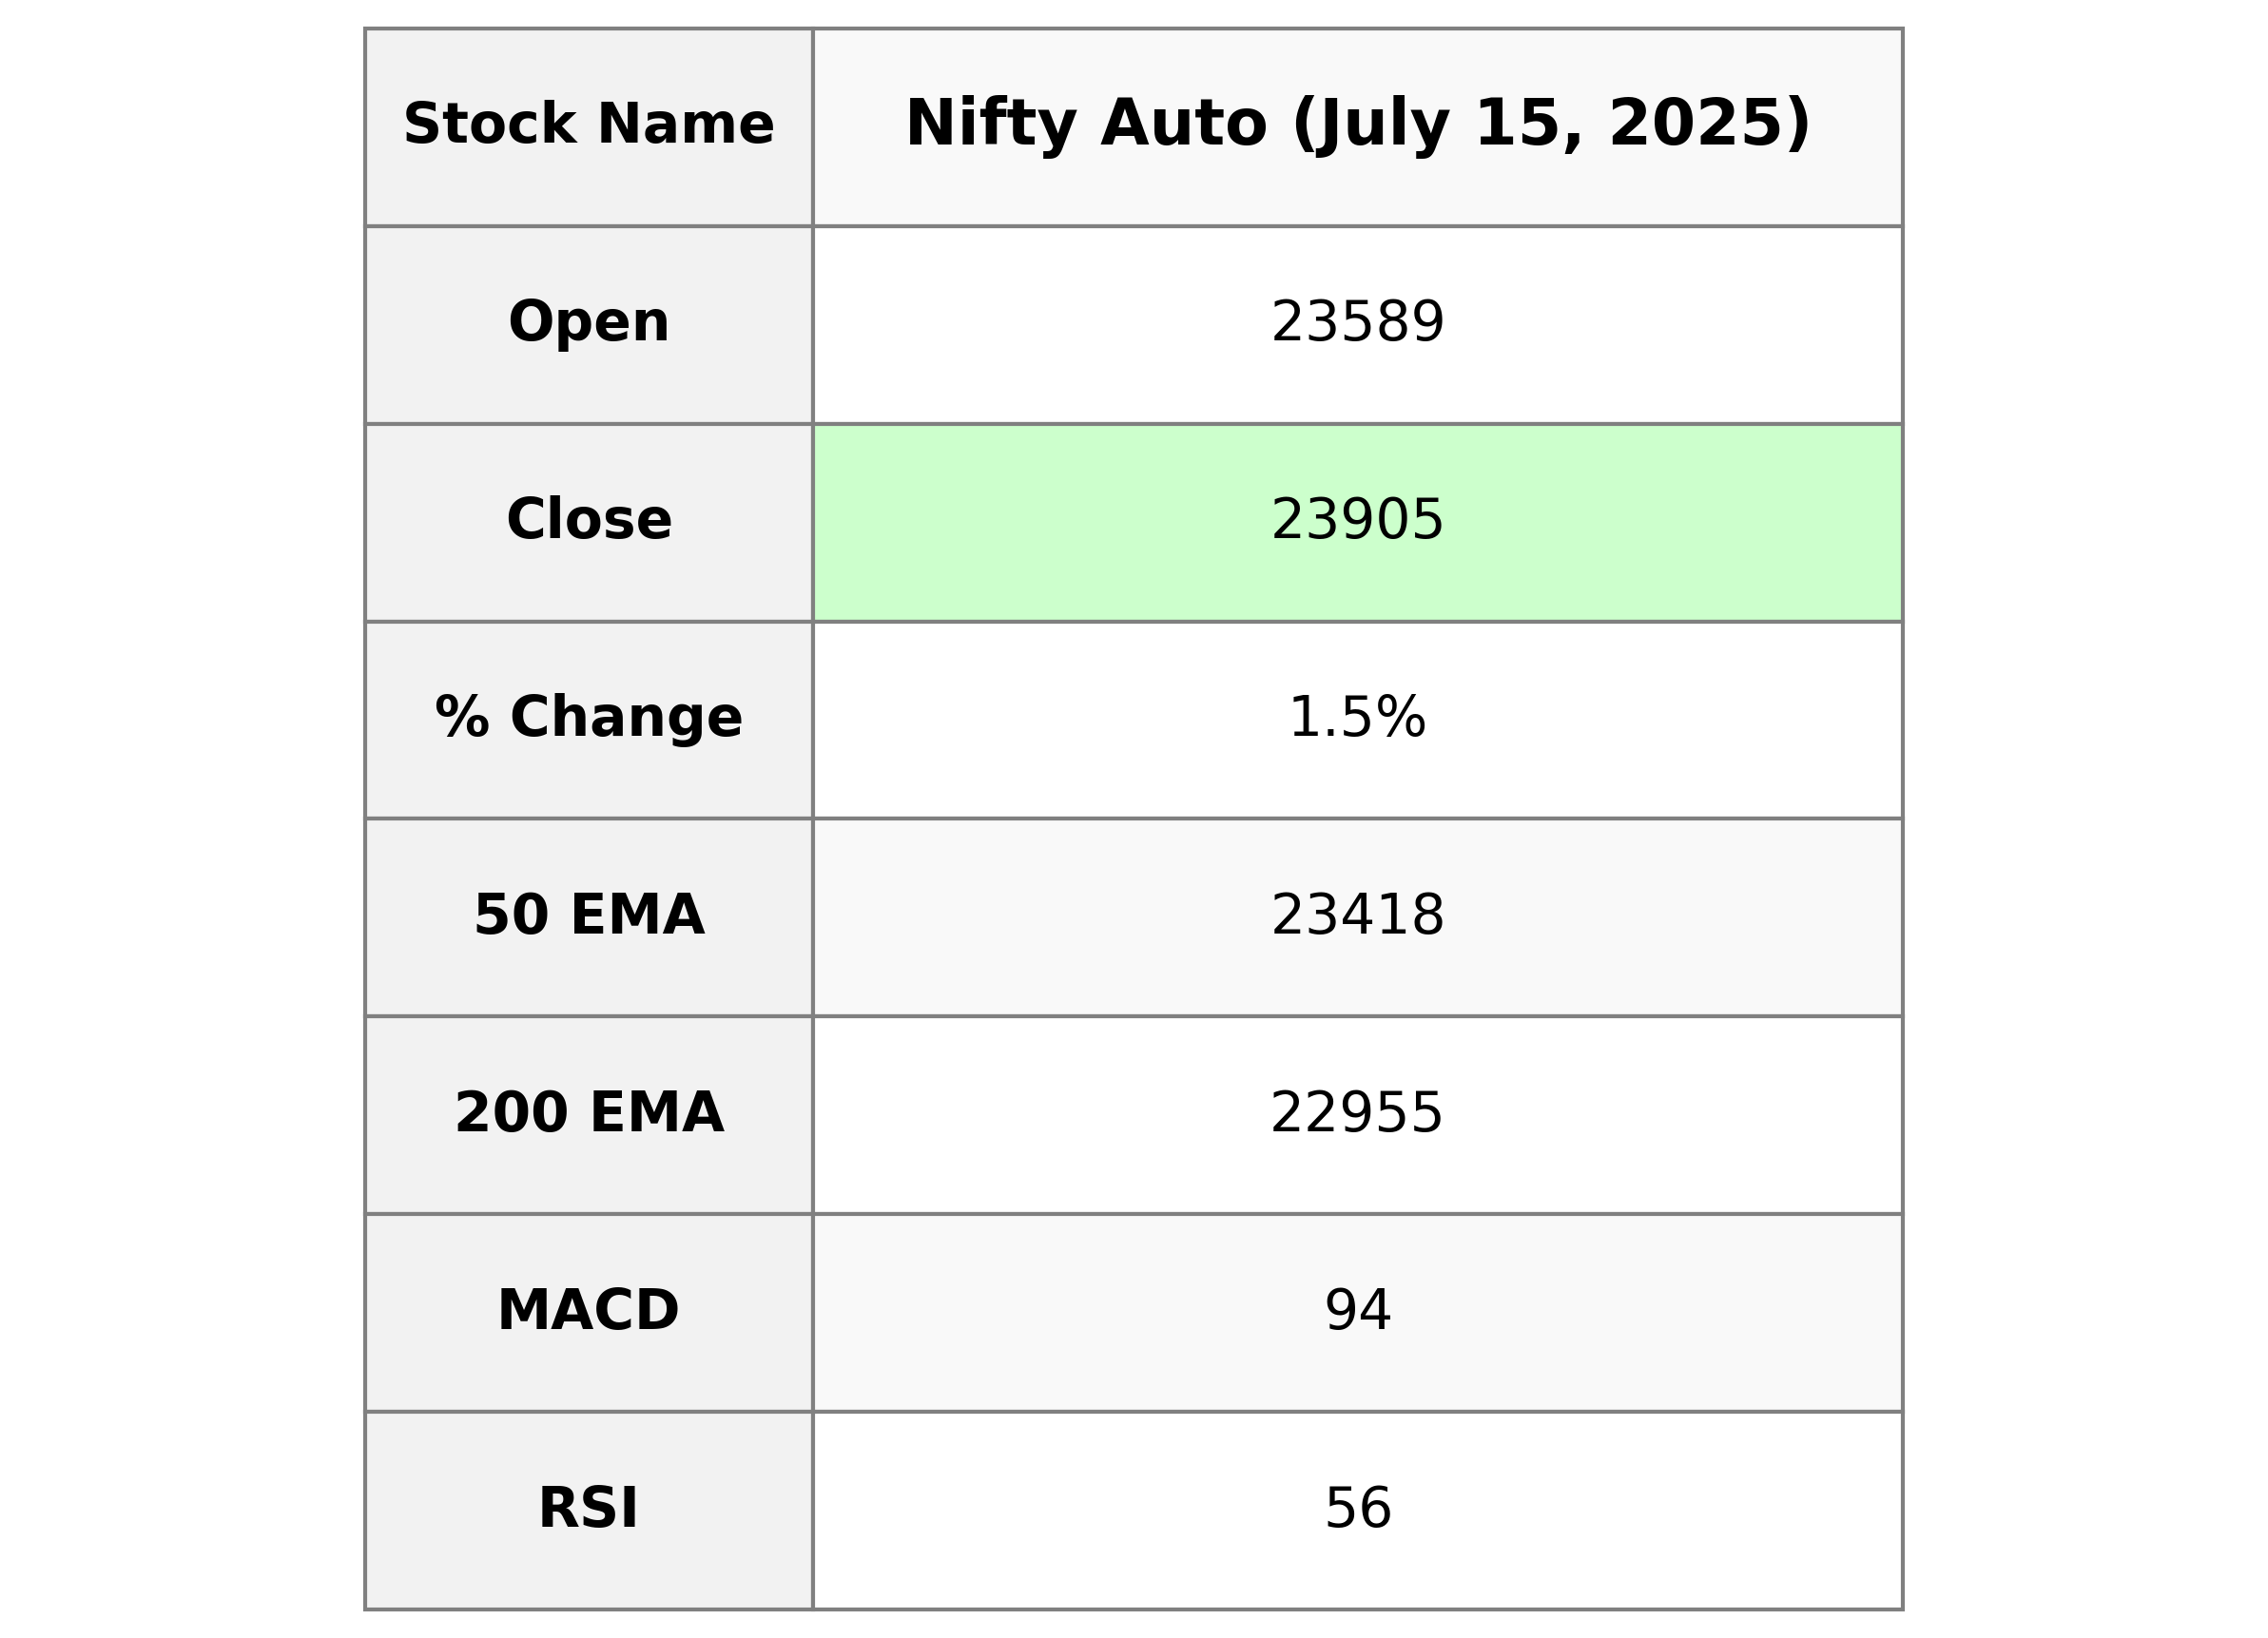
Nifty Auto Performance: Nifty Auto opened at 23,588.85 and closed at 23,905.25, showing an increase of 353.25 points or 1.50%. The index fluctuated between a low of 23,576.05 and a high of 23,951.85. The 10 EMA is at 23,790.96, and the RSI is 55.79, indicating a moderately strong market sentiment.
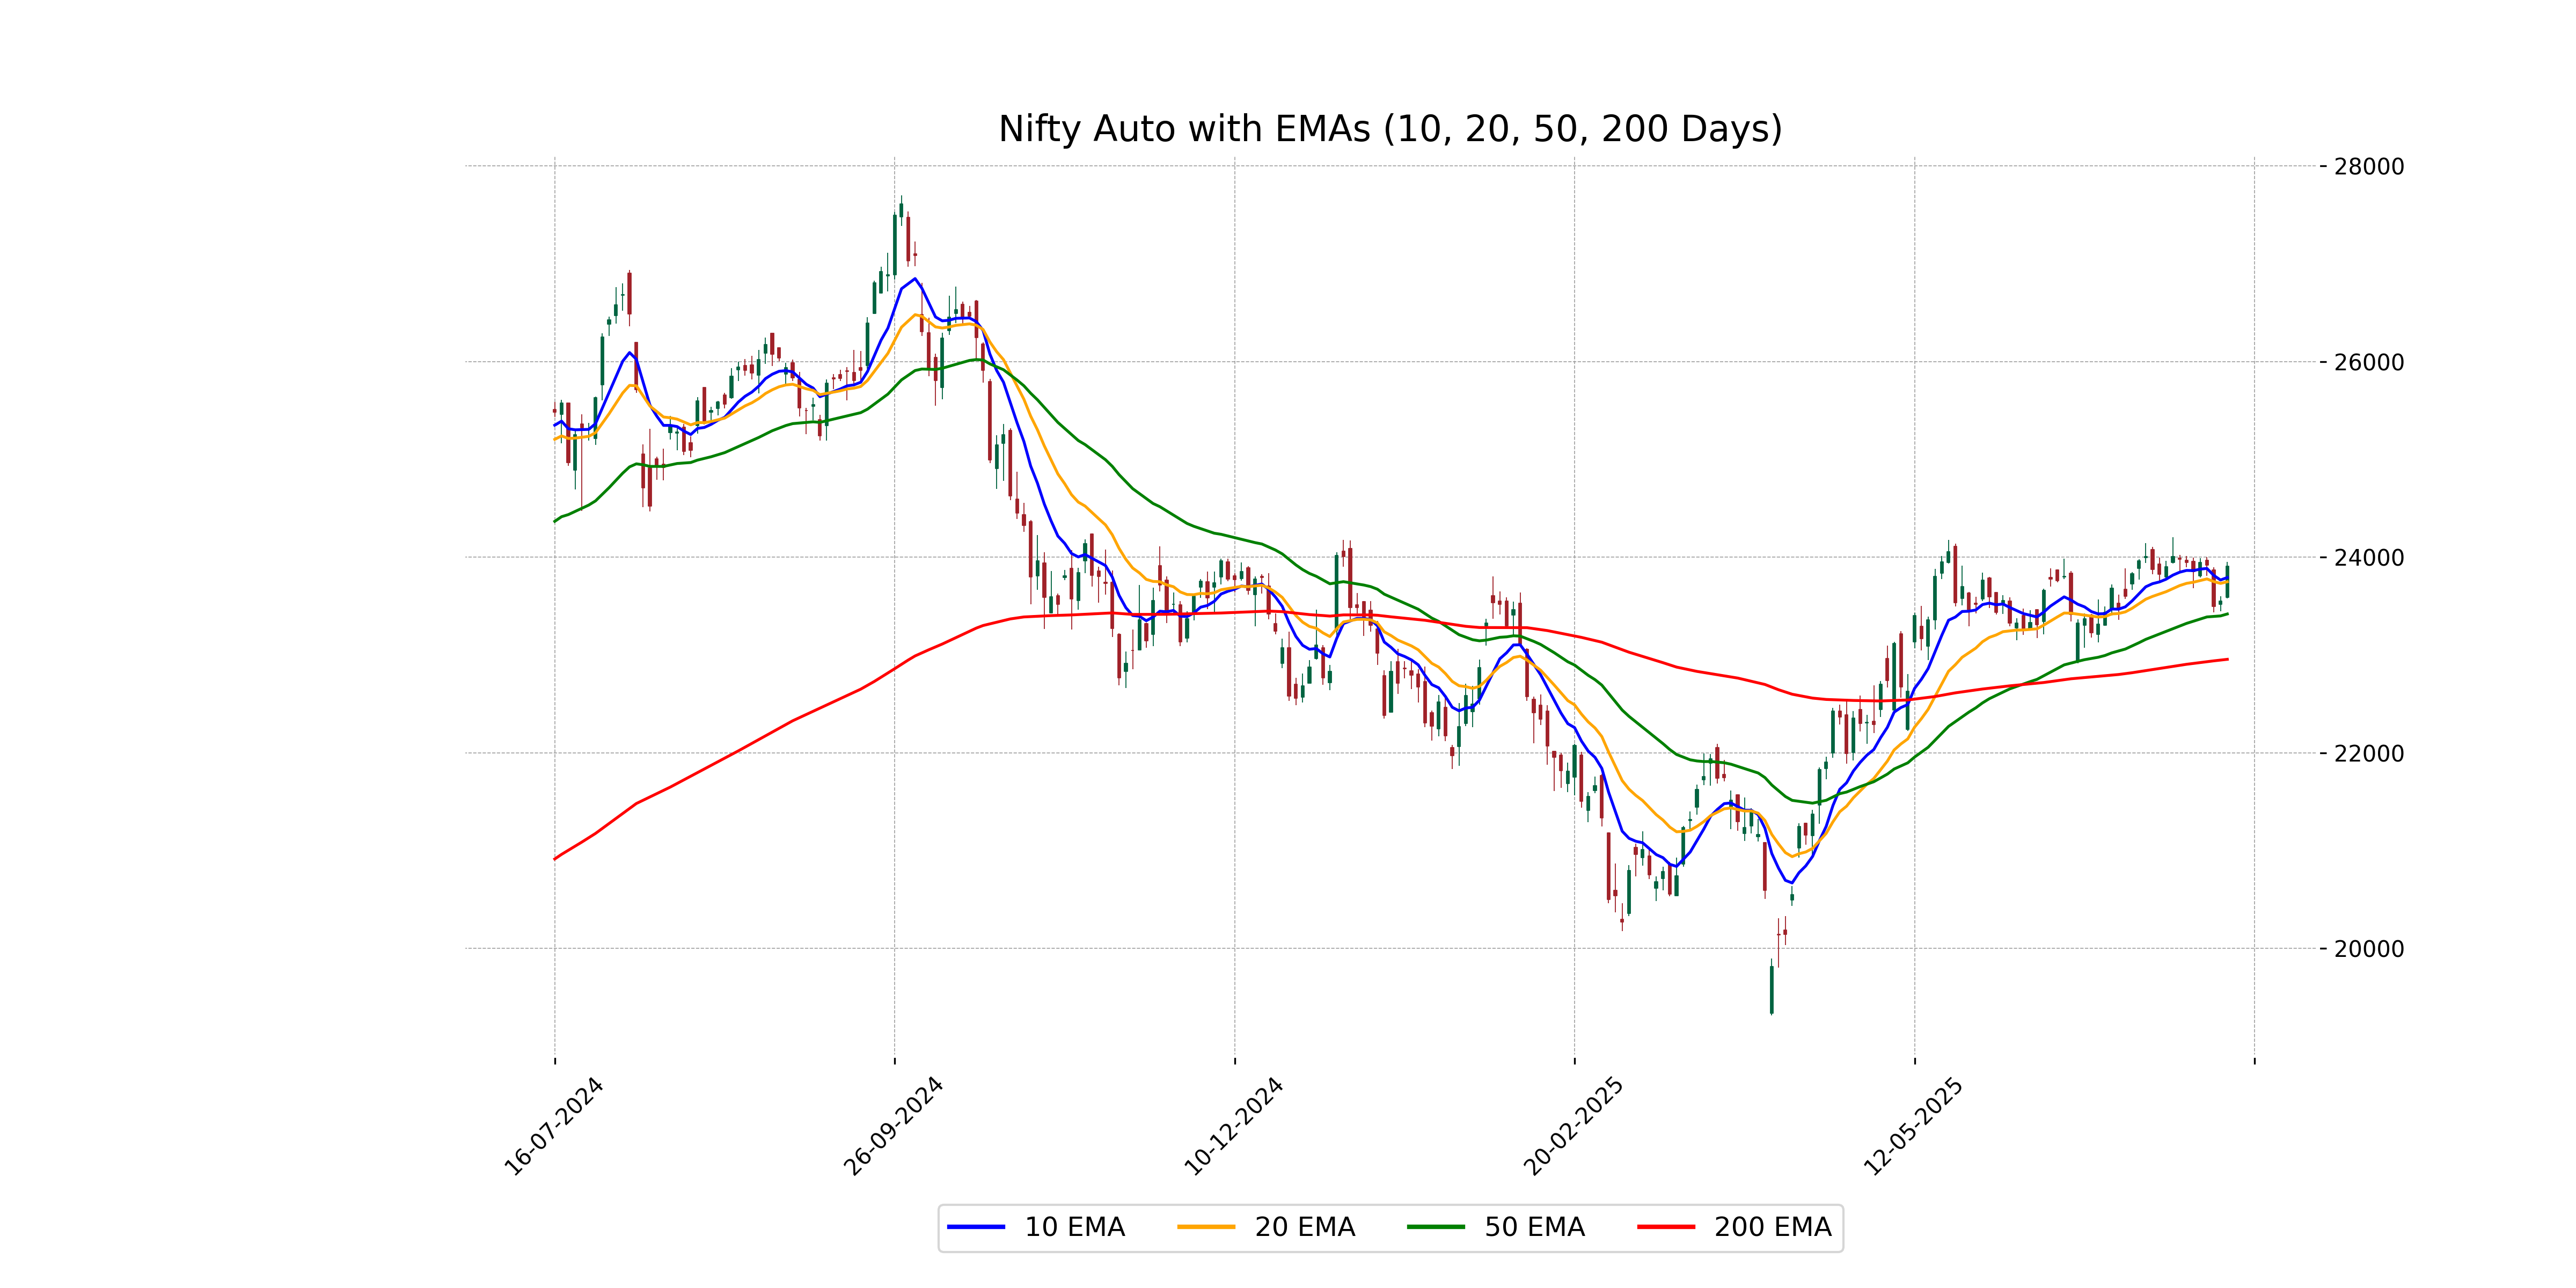
Relationship with Key Moving Averages
The Nifty Auto index closed at 23,905.25, which is above its 10-day and 20-day EMAs at 23,790.96 and 23,747.57, respectively, indicating short-term bullish momentum. It also surpassed the 50-day and 200-day EMAs at 23,418.33 and 22,954.72, respectively, suggesting a strong upward trend in both medium and long term.
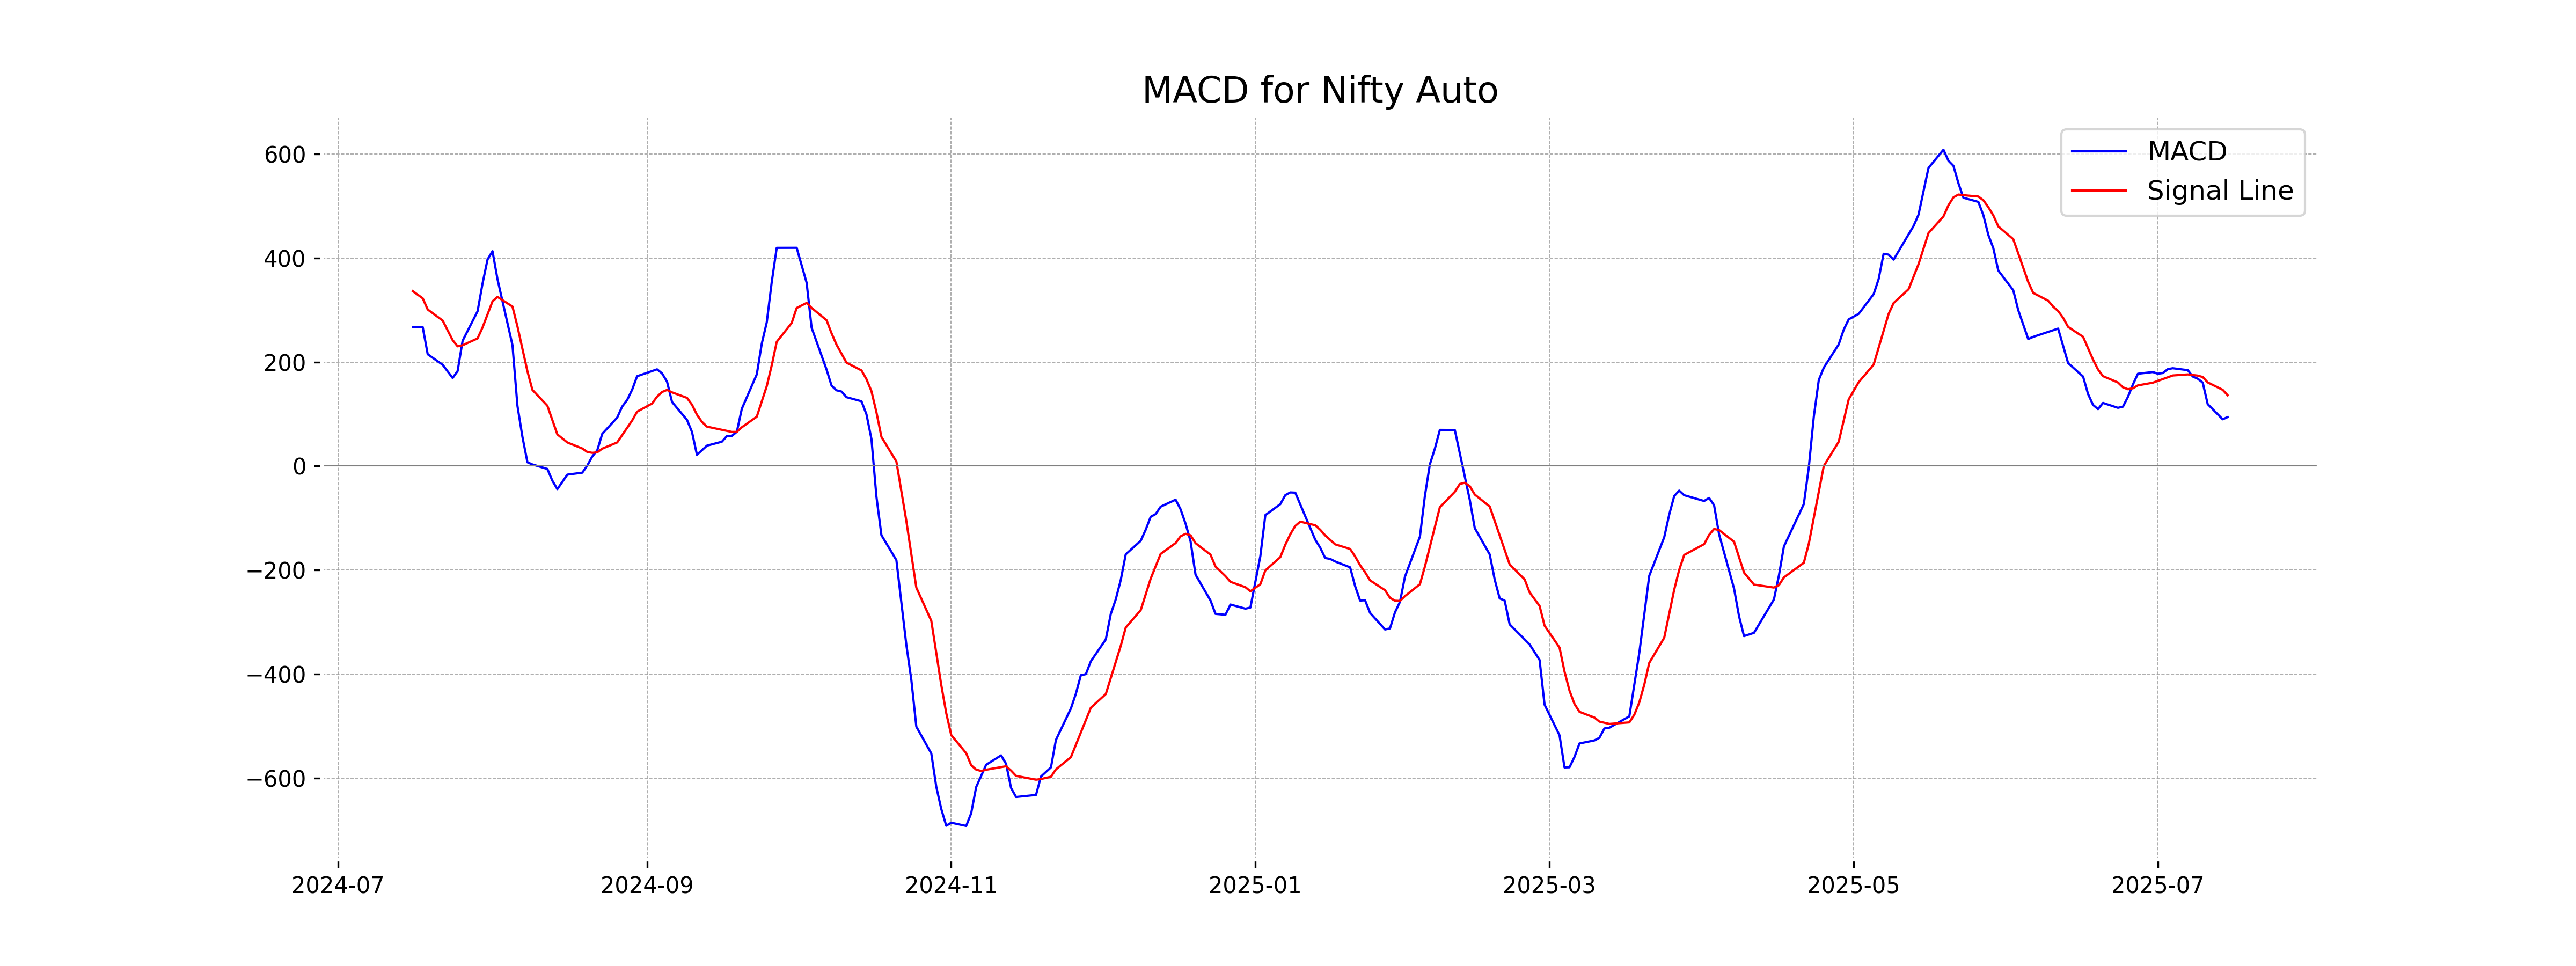
Moving Averages Trend (MACD)
MACD Analysis for Nifty Auto: The MACD value of 94.33, which is below the MACD Signal line at 136.26, suggests a bearish momentum in the short term. Despite this, the positive trend in closing prices indicates some mixed signals ahead.
RSI Analysis
The RSI for Nifty Auto stands at 55.79, indicating a neutral position. This suggests that the index is neither overbought nor oversold, implying a balanced momentum in the current market scenario.
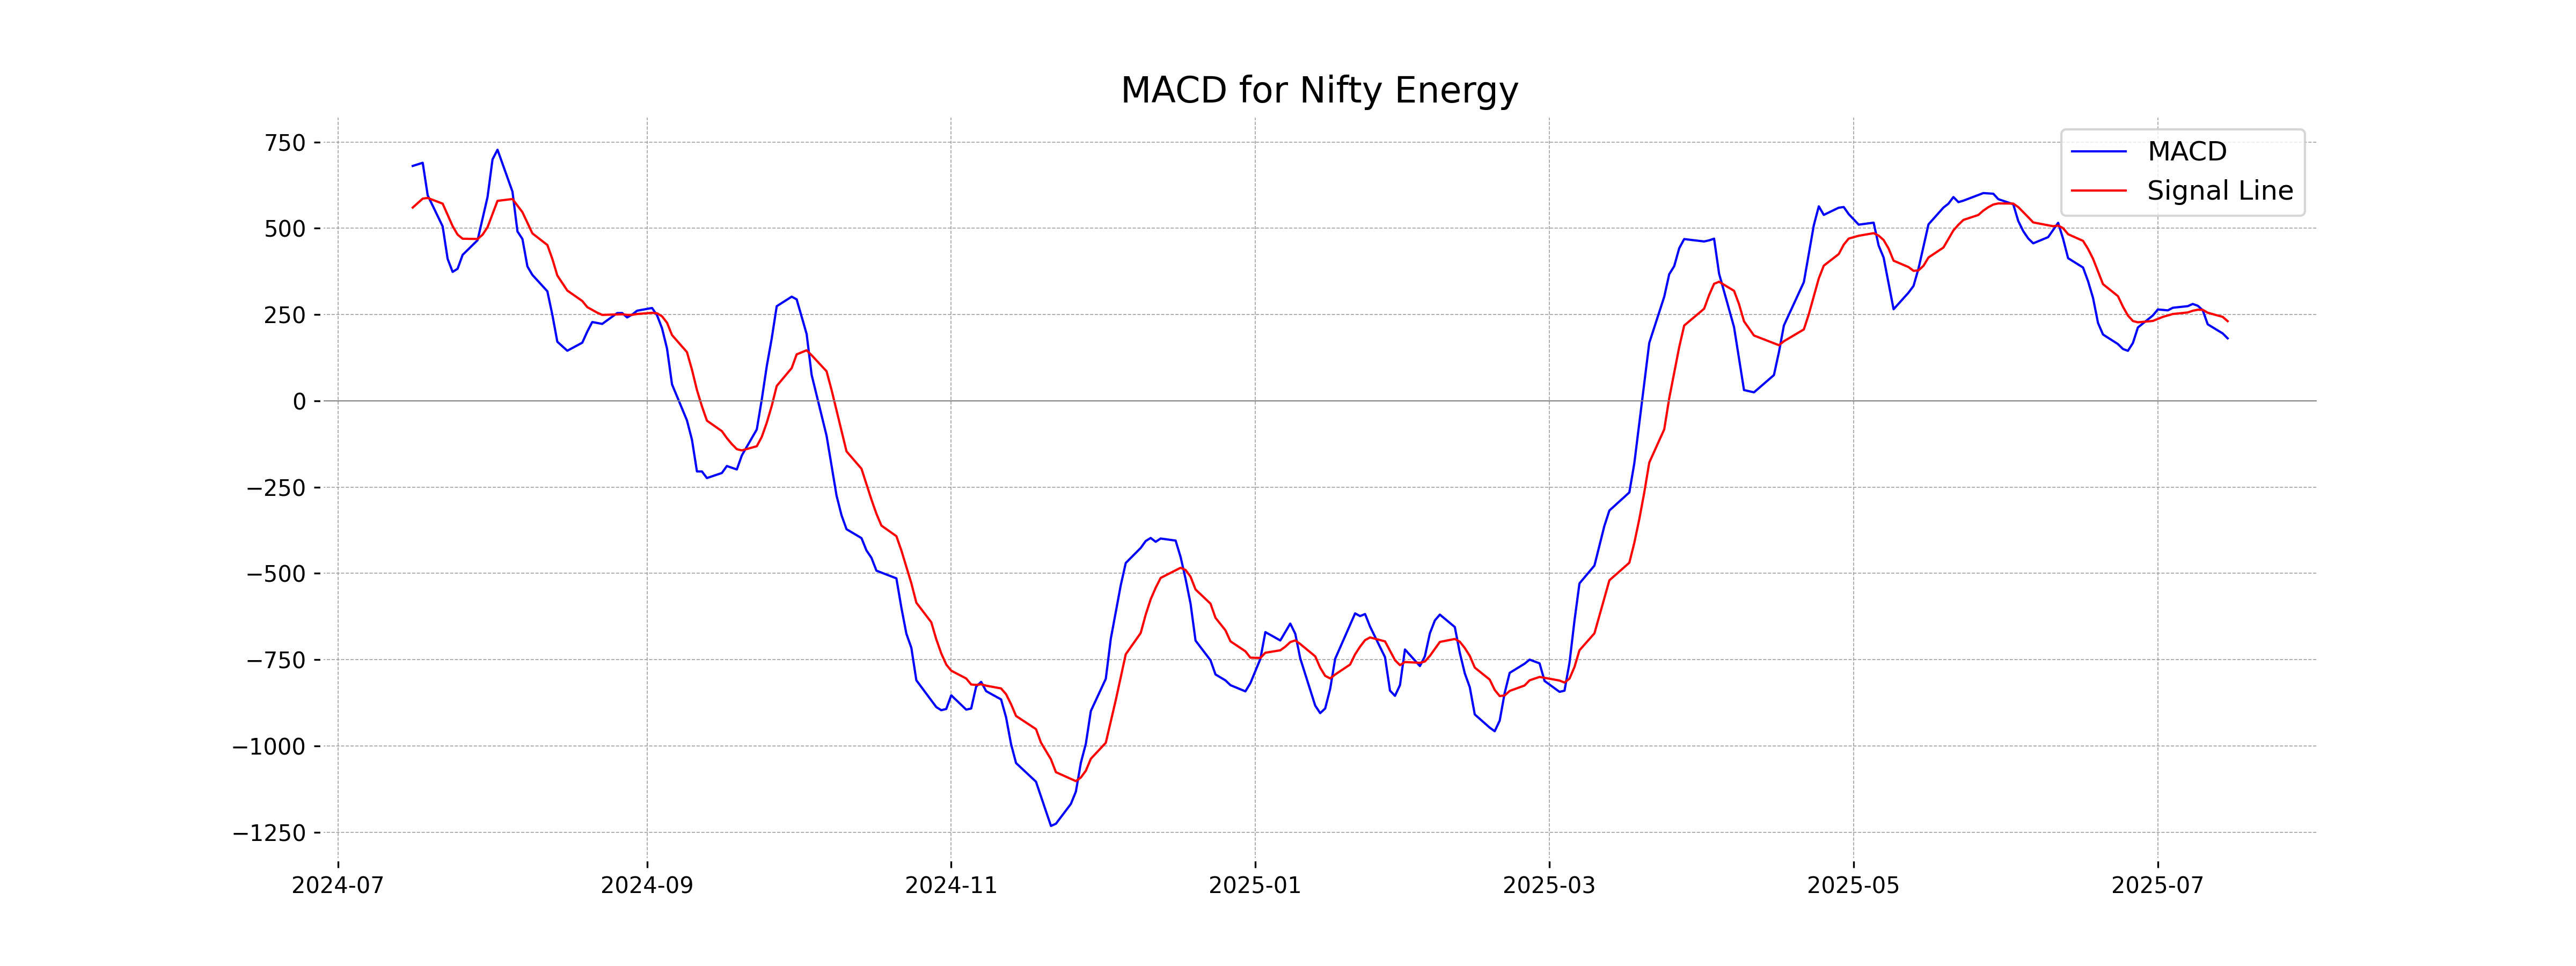
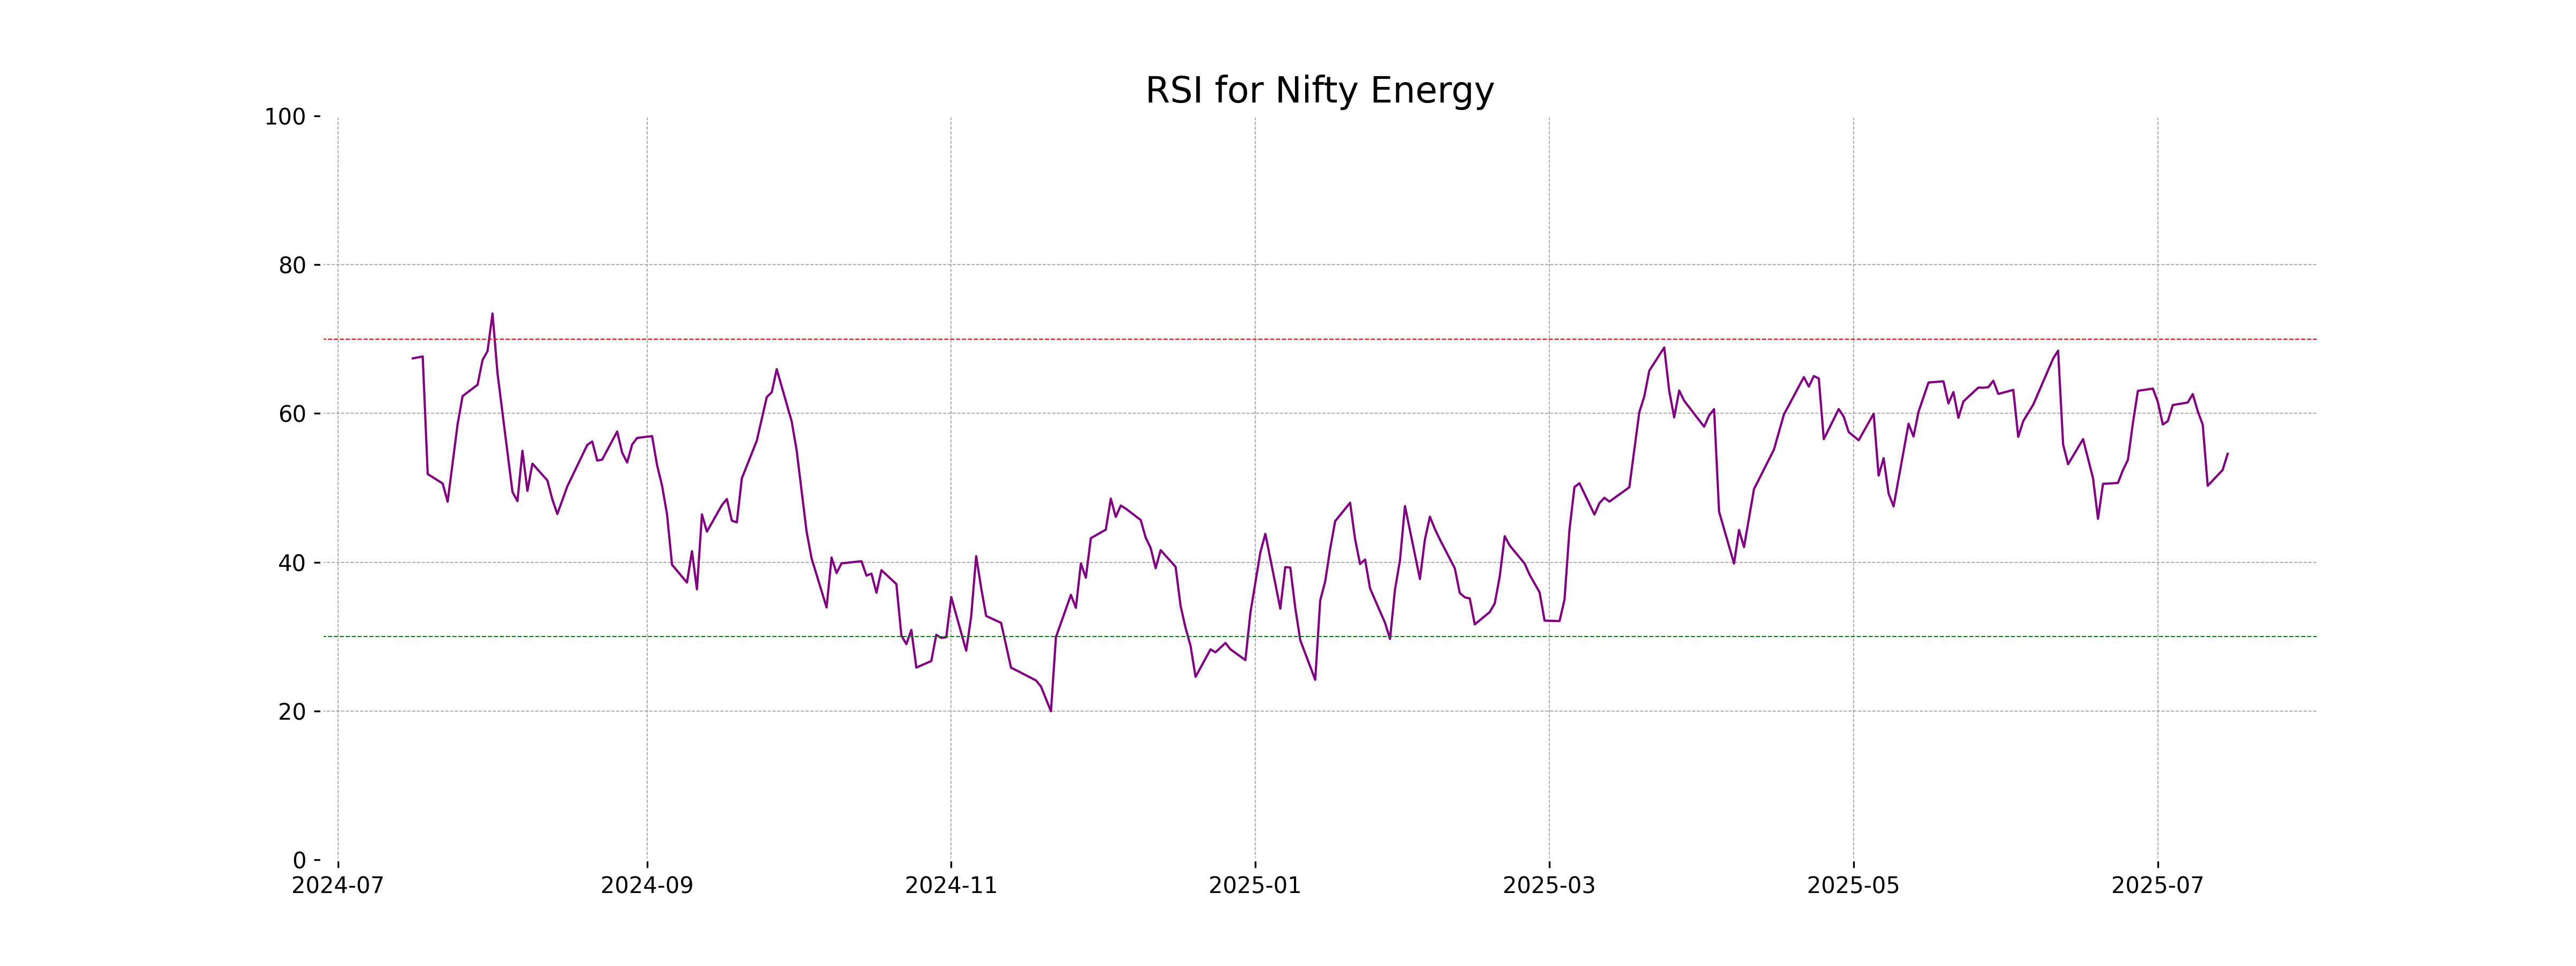
Analysis for Nifty Energy - July 15, 2025
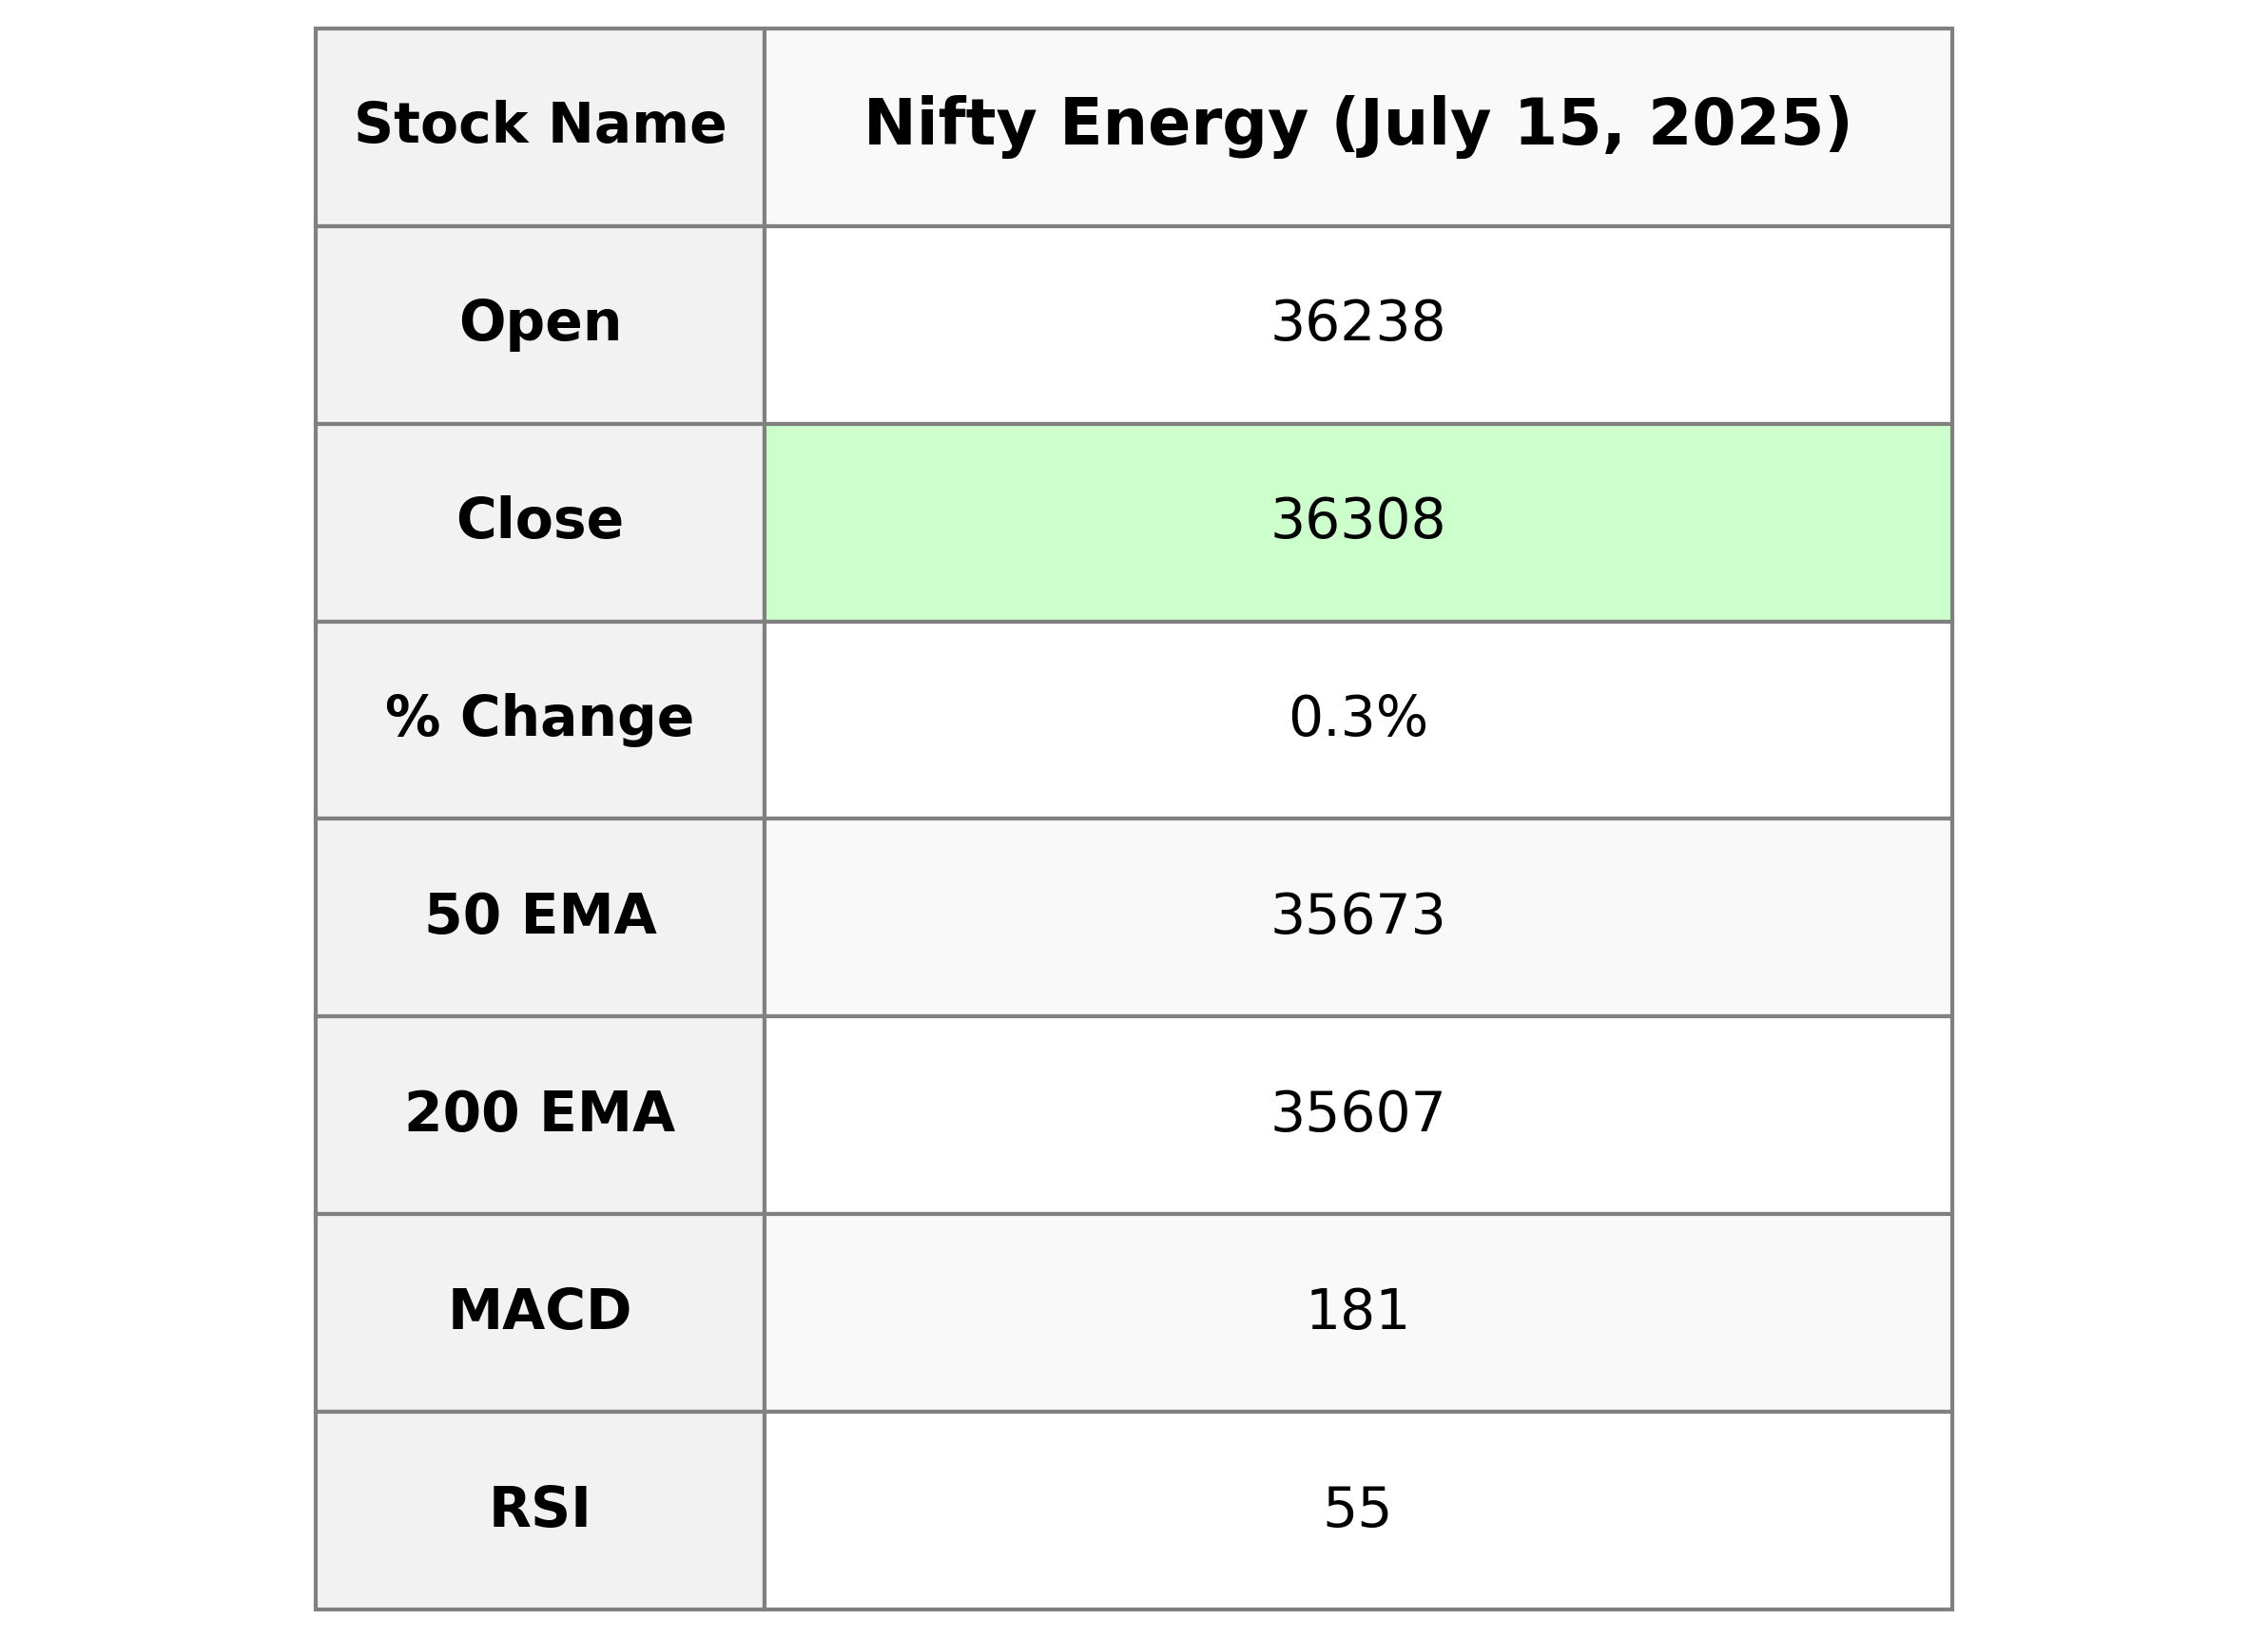
Nifty Energy Performance: Nifty Energy opened at 36,237.95 and closed at 36,308.50, reflecting a modest increase with a percentage change of 0.30% or a points change of 107.45. The Relative Strength Index (RSI) is at 54.58, indicating a neutral momentum. The MACD value is 181.12, suggesting a decreasing bullish signal as it is below the MACD Signal line.
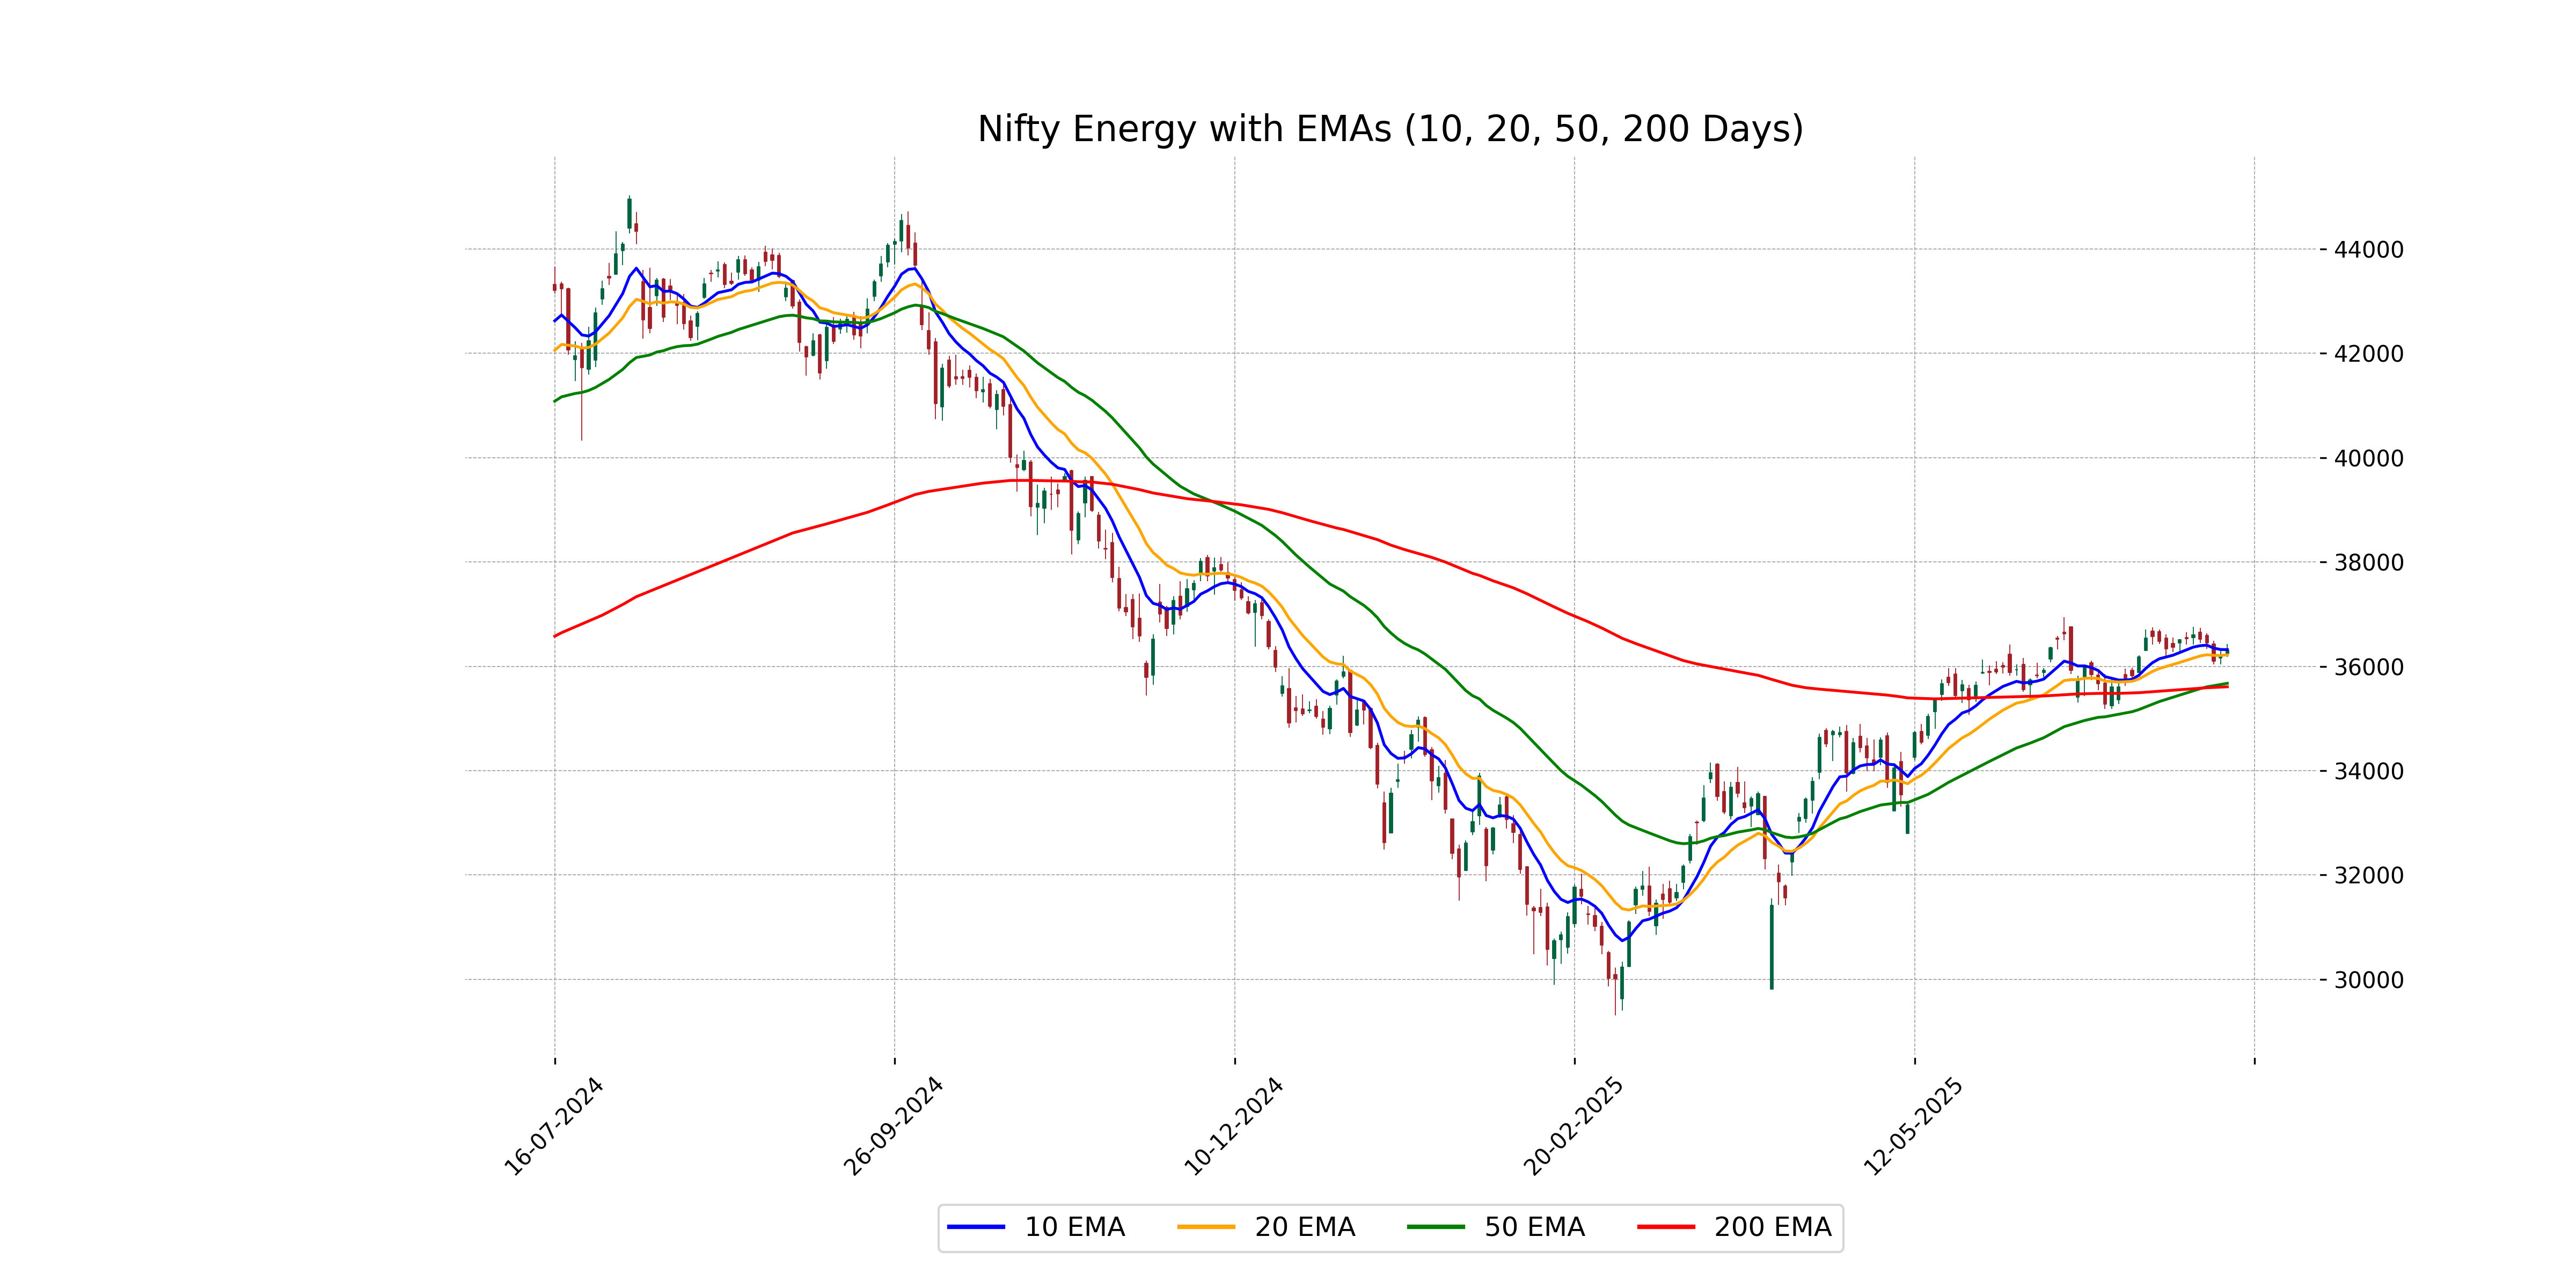
Relationship with Key Moving Averages
Nifty Energy closed at 36,308.5, above both its 50 EMA of 35,673.48 and 200 EMA of 35,606.88, indicating a potential uptrend. Meanwhile, it closed slightly below its 10 EMA of 36,319.34, suggesting a short-term consolidation.
Moving Averages Trend (MACD)
The MACD for Nifty Energy is at 181.12, which is below the MACD Signal line at 230.91. This condition suggests a potential bearish trend, as the MACD line crossing below the signal line can be an indication of decreasing momentum.
RSI Analysis
The Relative Strength Index (RSI) for Nifty Energy is 54.58, indicating that the stock is in a neutral position, neither overbought nor oversold. This suggests a potential for moderate price movement in either direction.
Analysis for Nifty FMCG - July 15, 2025

Nifty FMCG opened at 56170.60 and closed at 56429.05, marking a daily gain of approximately 0.72% with a points increase of 403.45. The index showed a positive trend, staying above its key moving averages, with an RSI of 62.91 indicating potential strength.
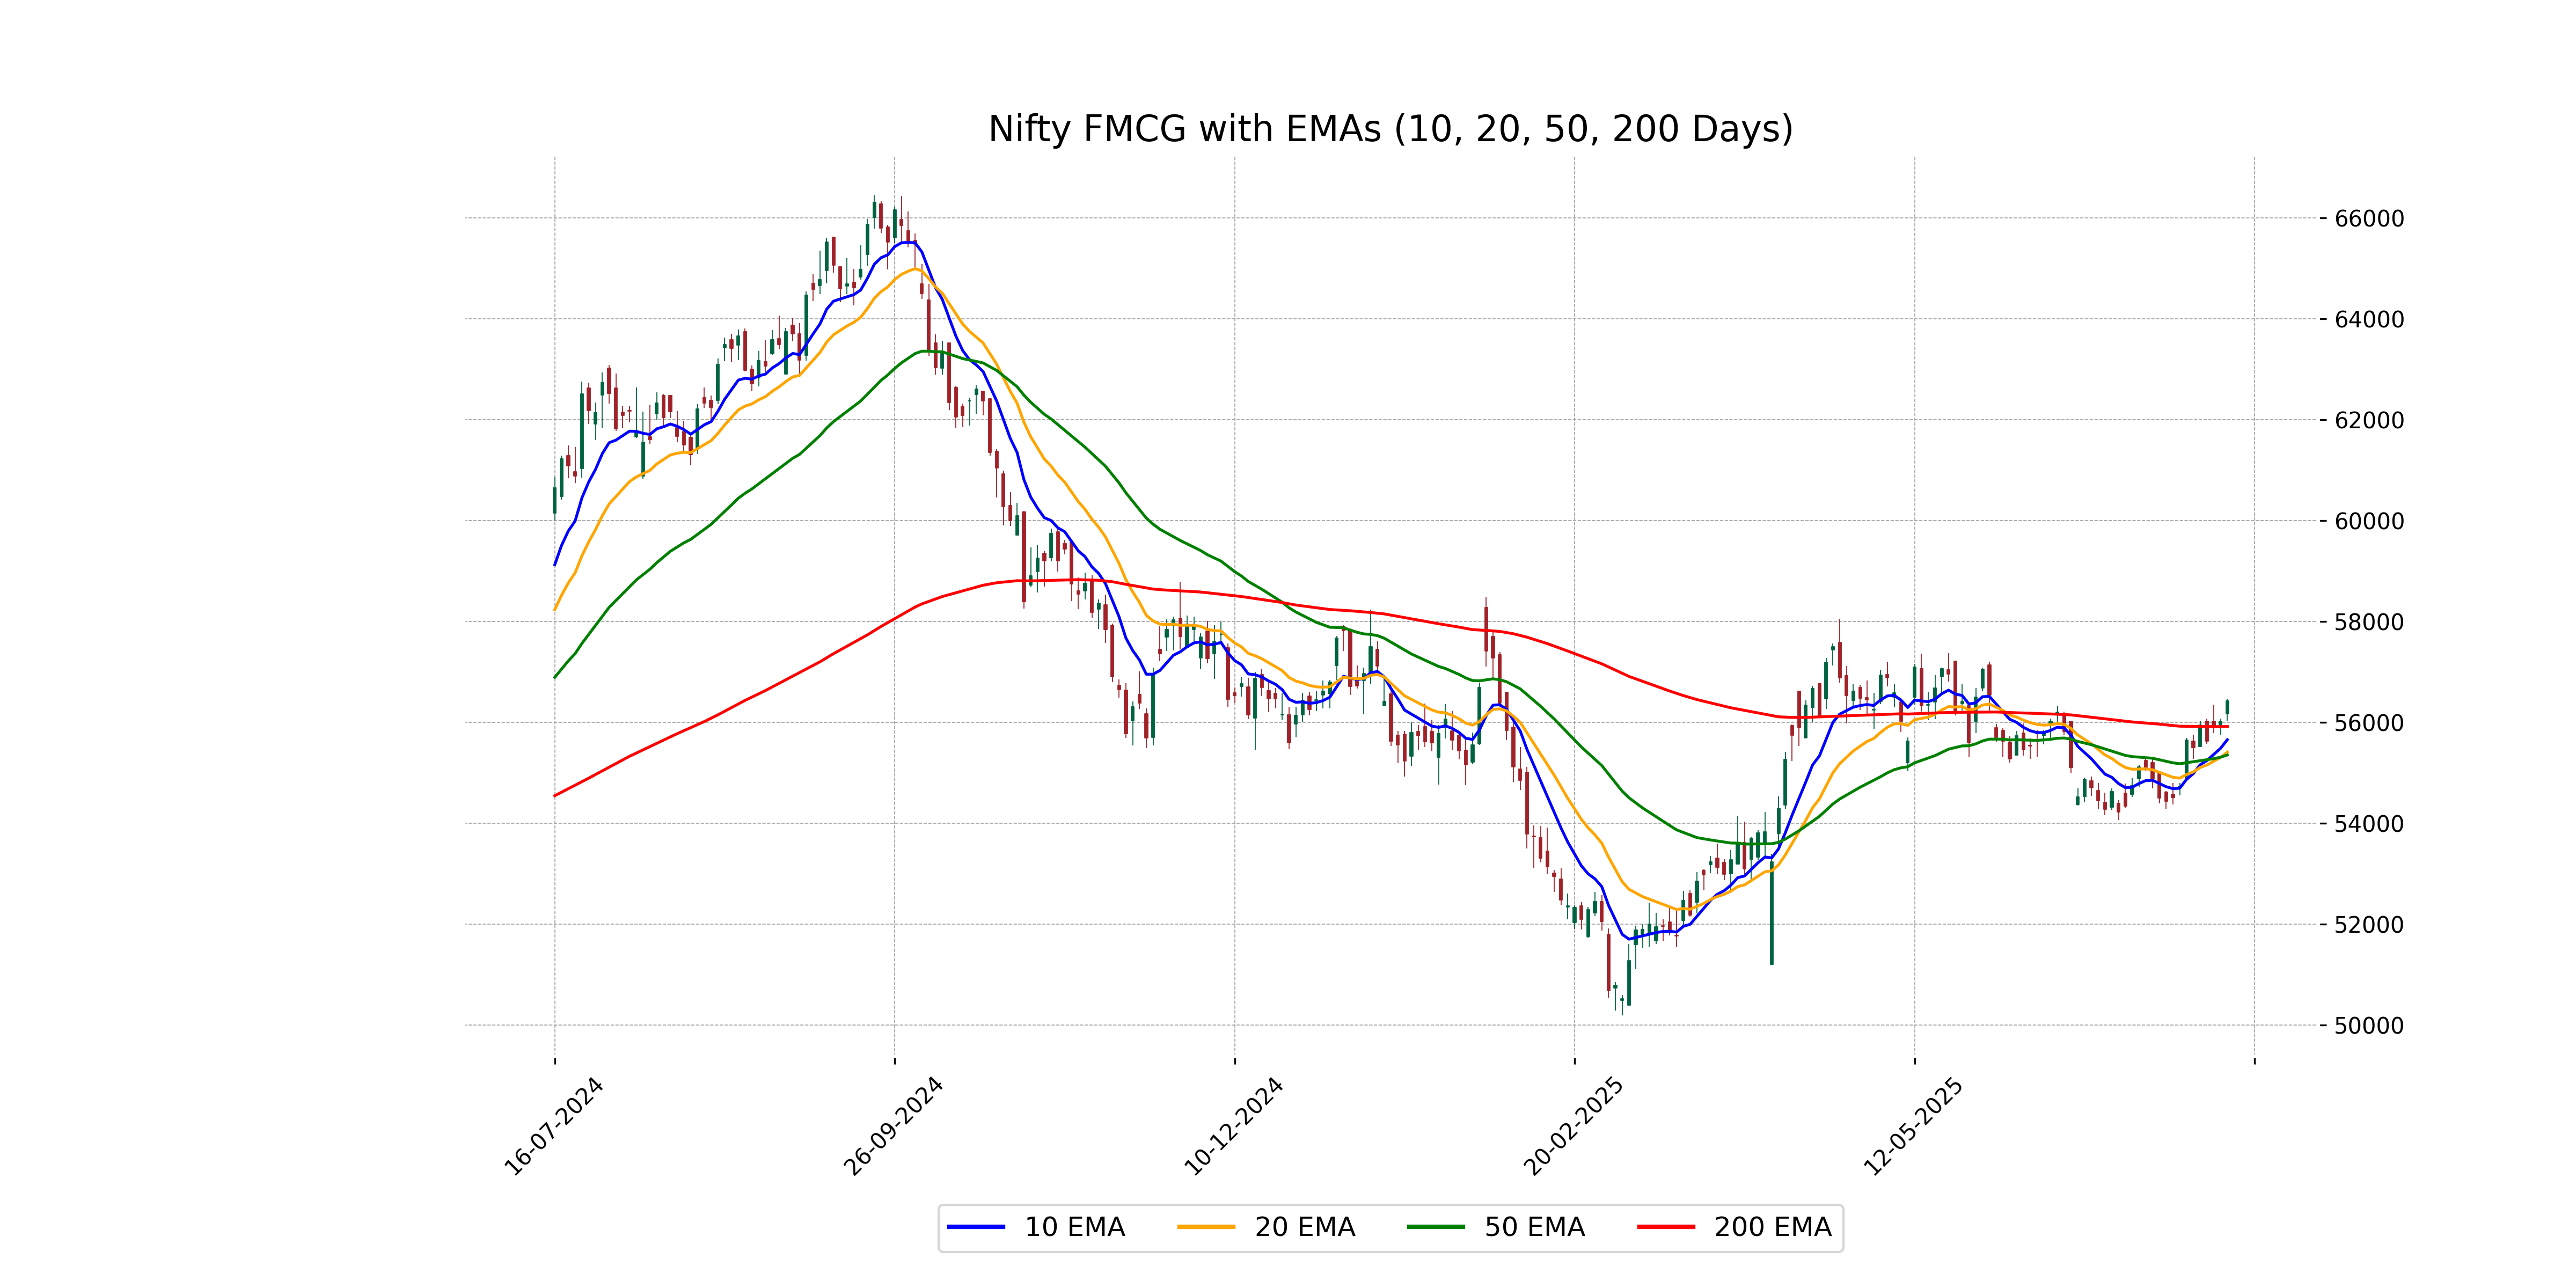
Relationship with Key Moving Averages
The closing price of Nifty FMCG at 56429.05 is above the 50 EMA (55354.29), 200 EMA (55920.99), 10 EMA (55657.56), and 20 EMA (55411.40), indicating a bullish trend with the price trading above key moving averages. Additionally, the RSI of 62.91 suggests a moderately strong positive momentum.
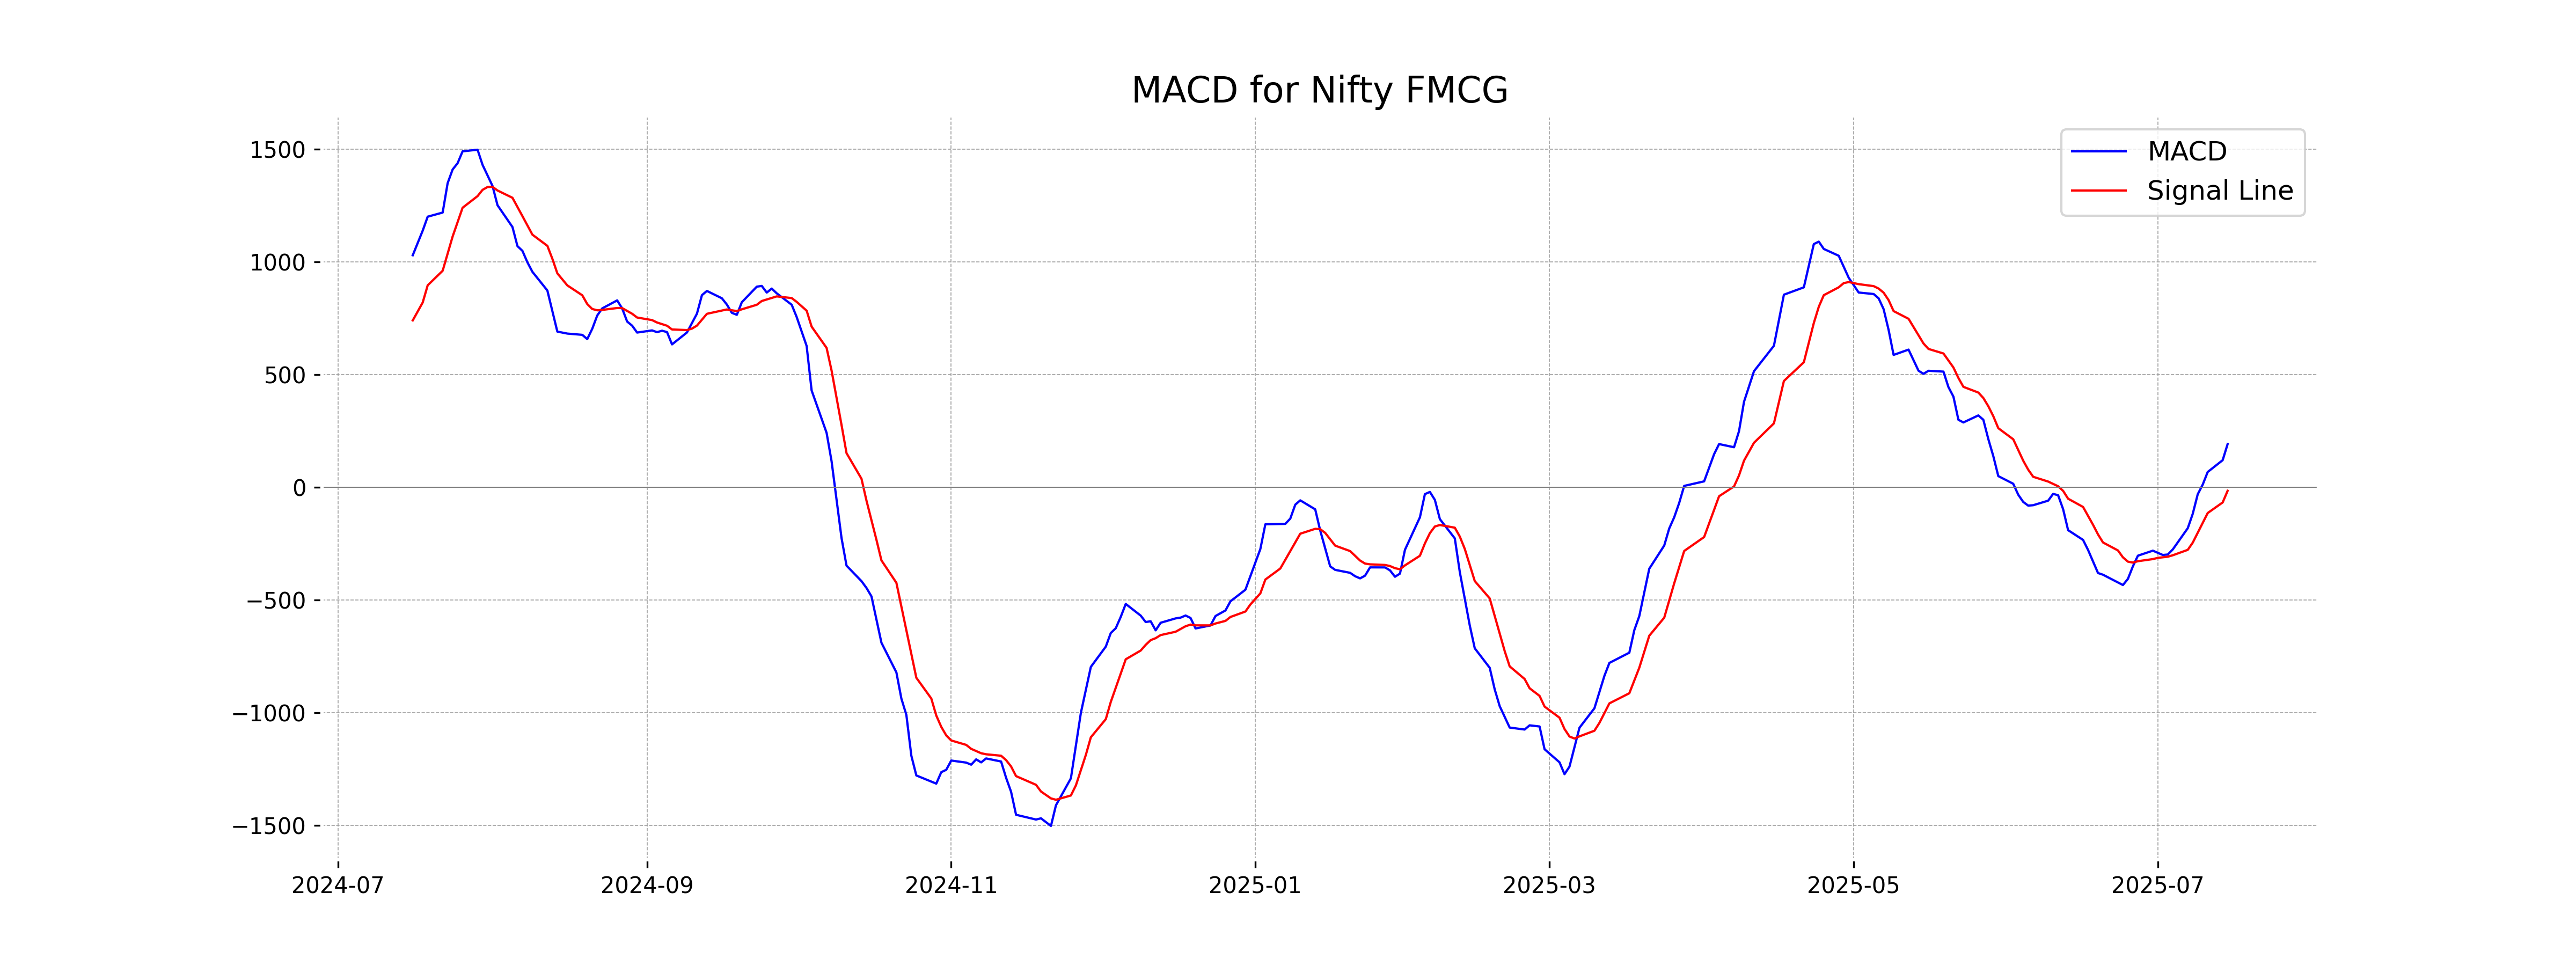
Moving Averages Trend (MACD)
The MACD value for Nifty FMCG is 192.09, which is significantly higher than the MACD Signal value of -15.25. This indicates a bullish trend as the MACD line is above the signal line, suggesting positive momentum in the market.
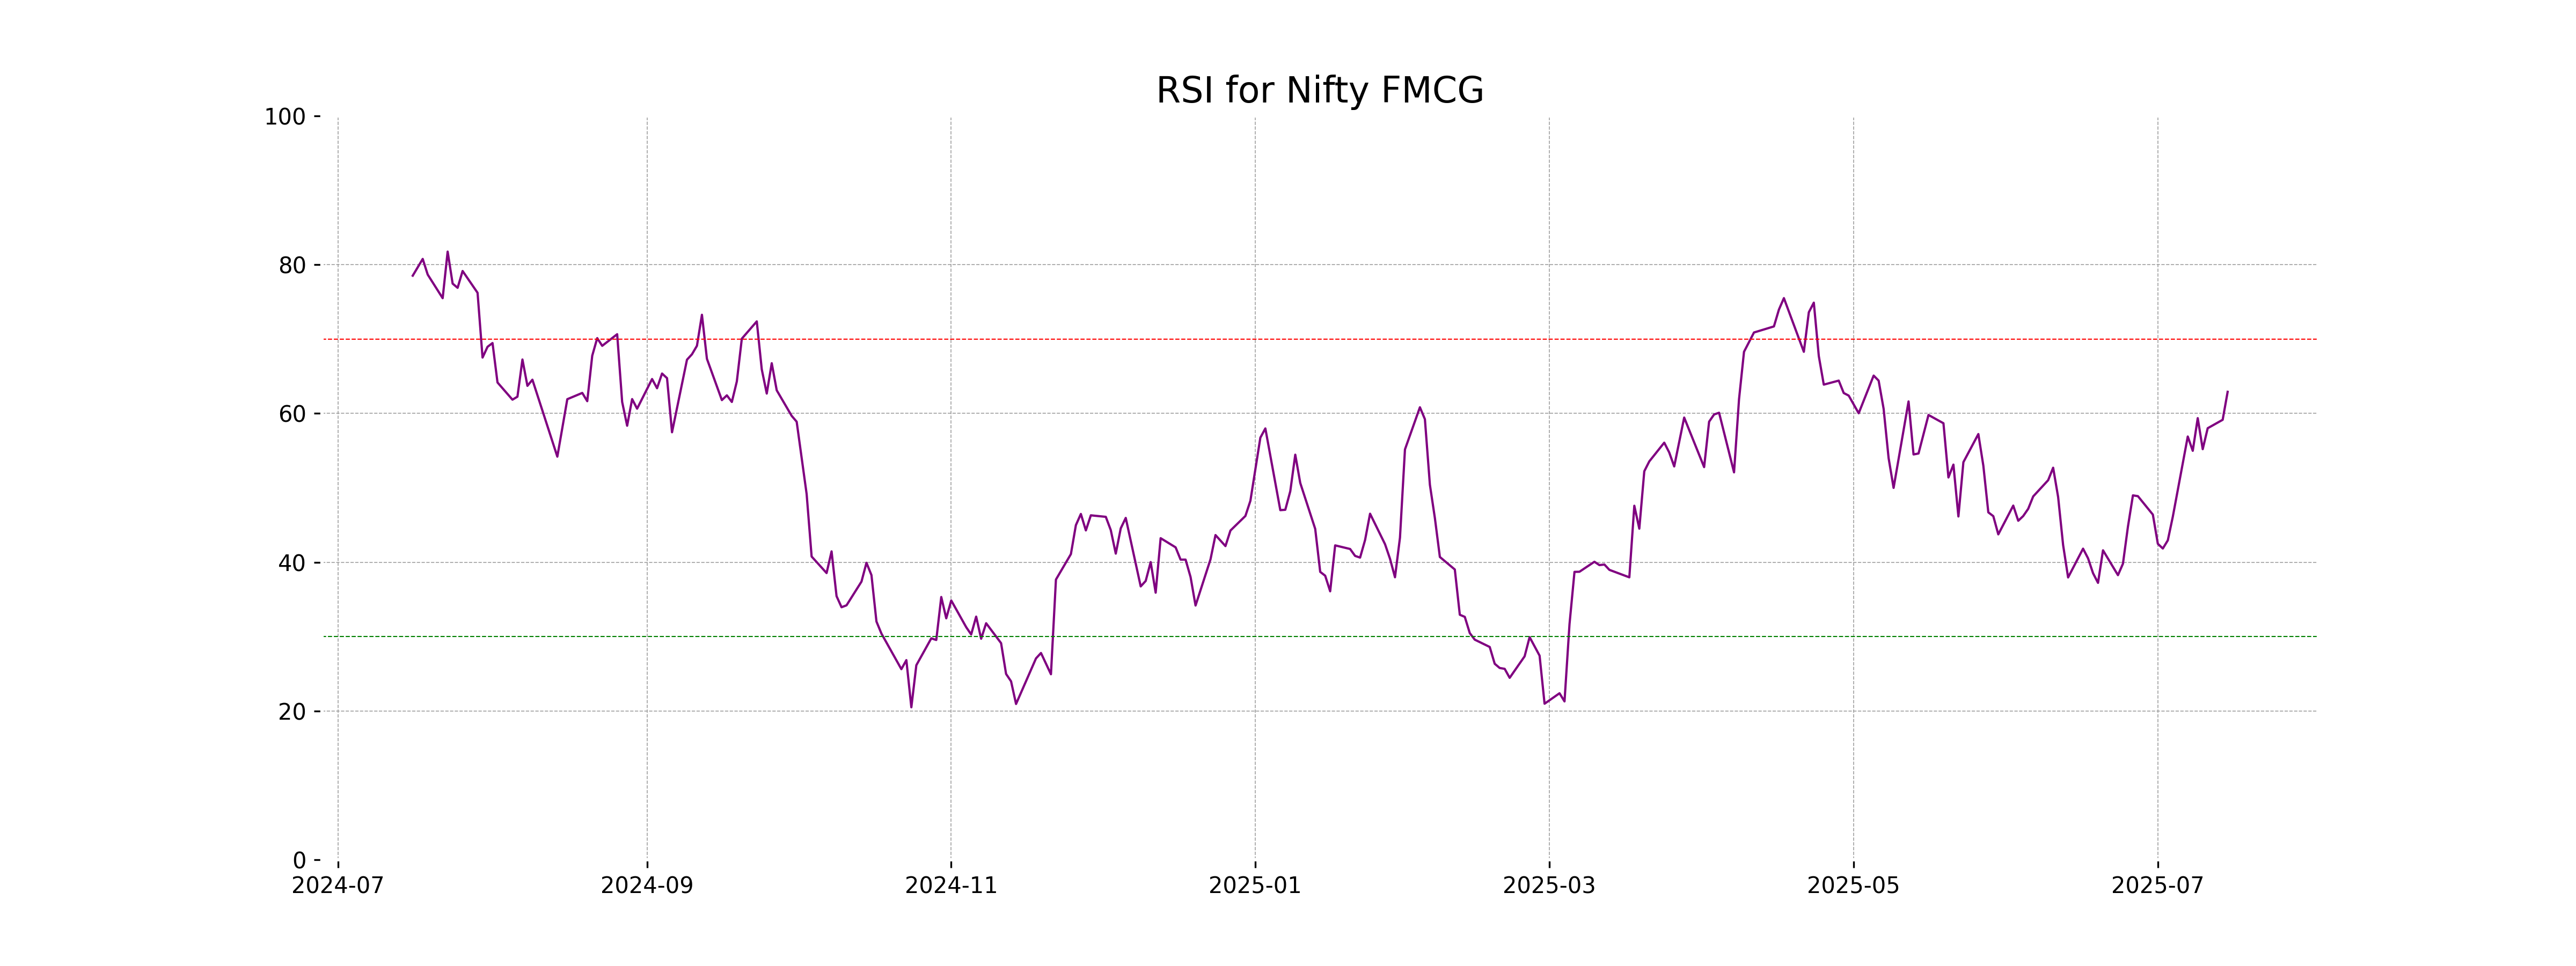
RSI Analysis
Nifty FMCG RSI Analysis: The Relative Strength Index (RSI) for Nifty FMCG stands at 62.91. This suggests a moderately strong momentum, nearing the overbought threshold of 70, indicating potential further gains but with caution towards overbought levels. Monitoring for a pullback or continuation of trend is advisable.
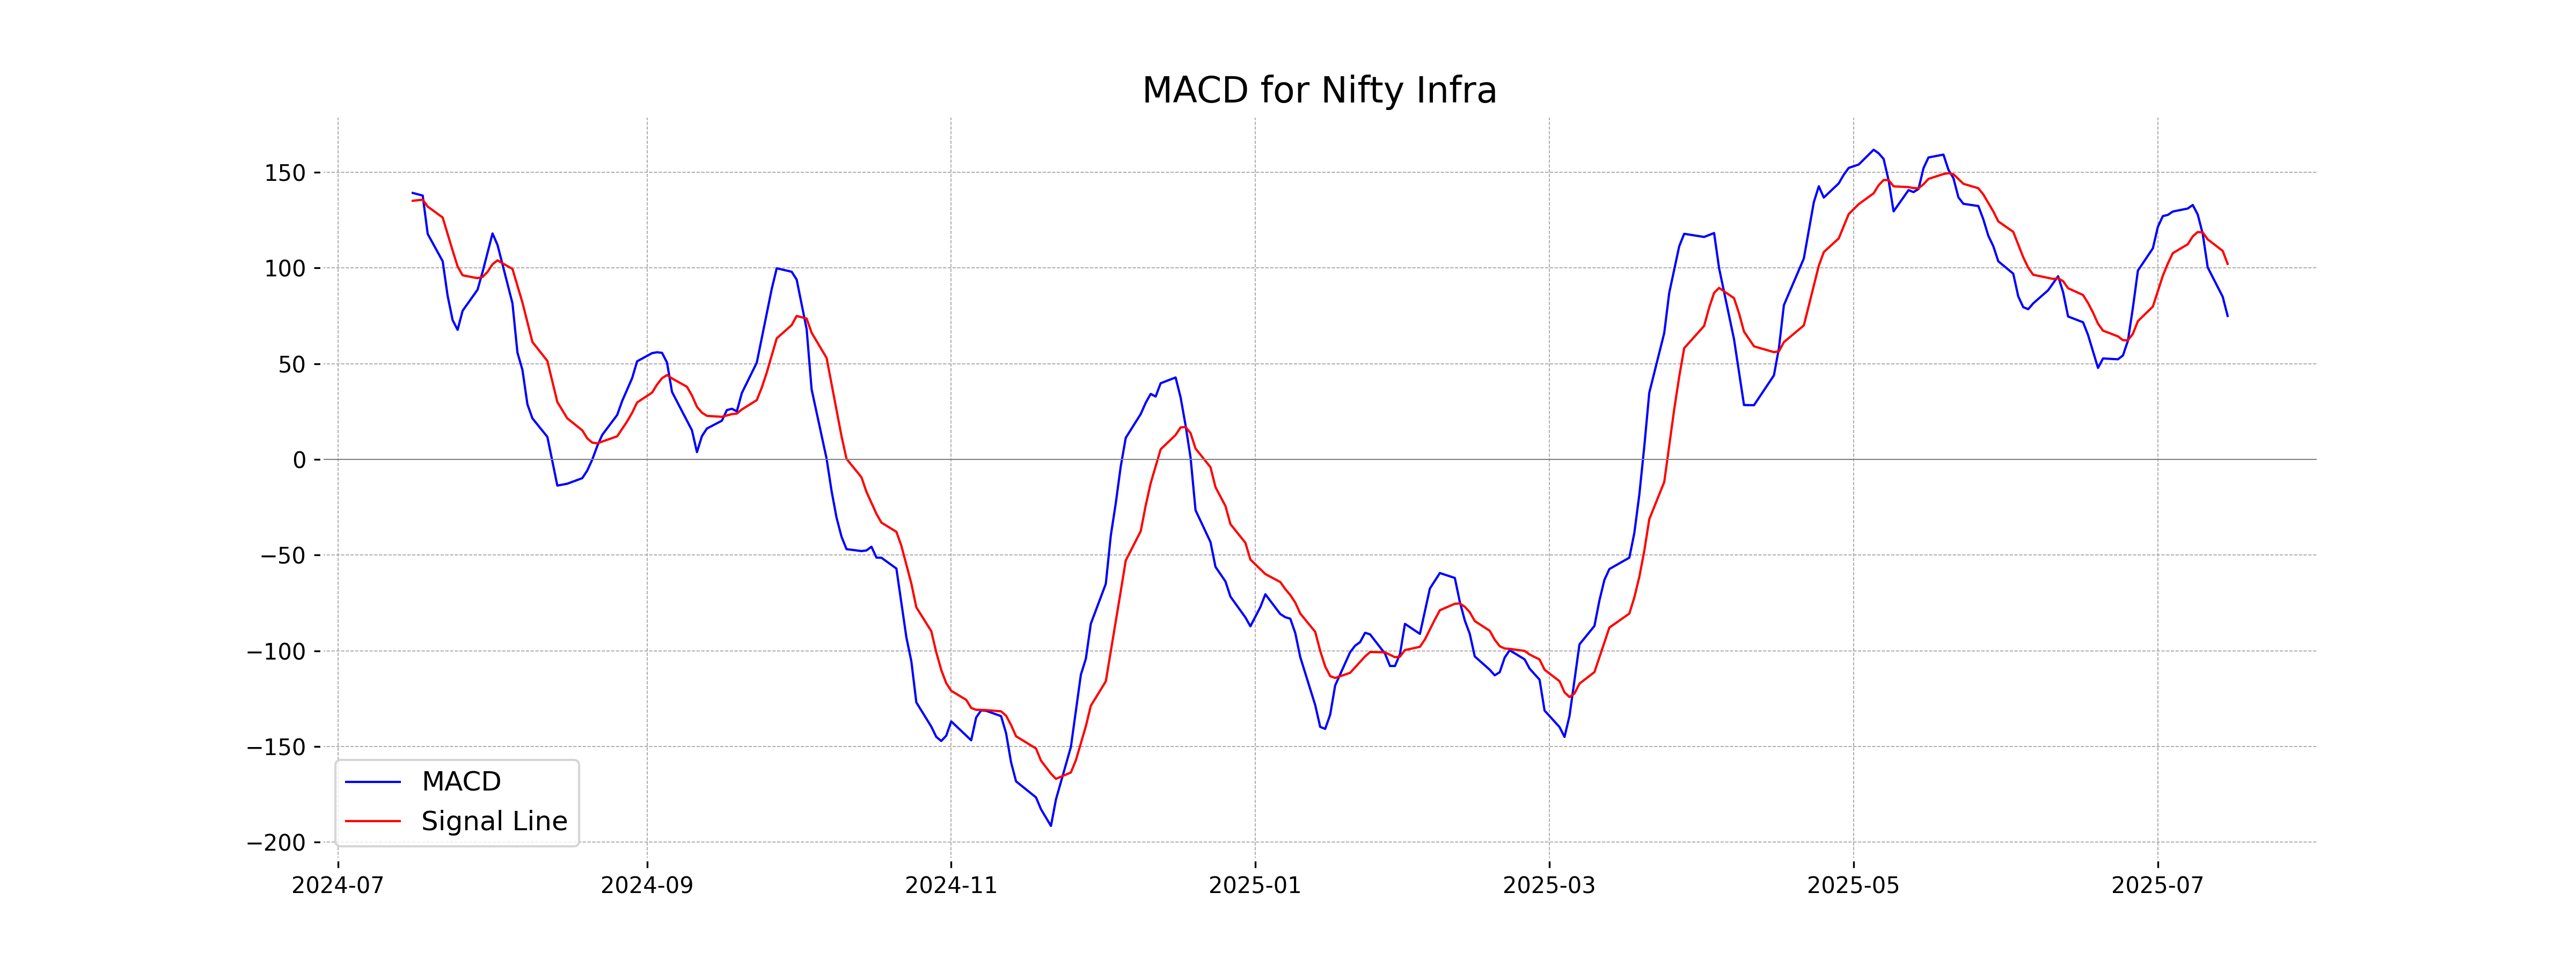
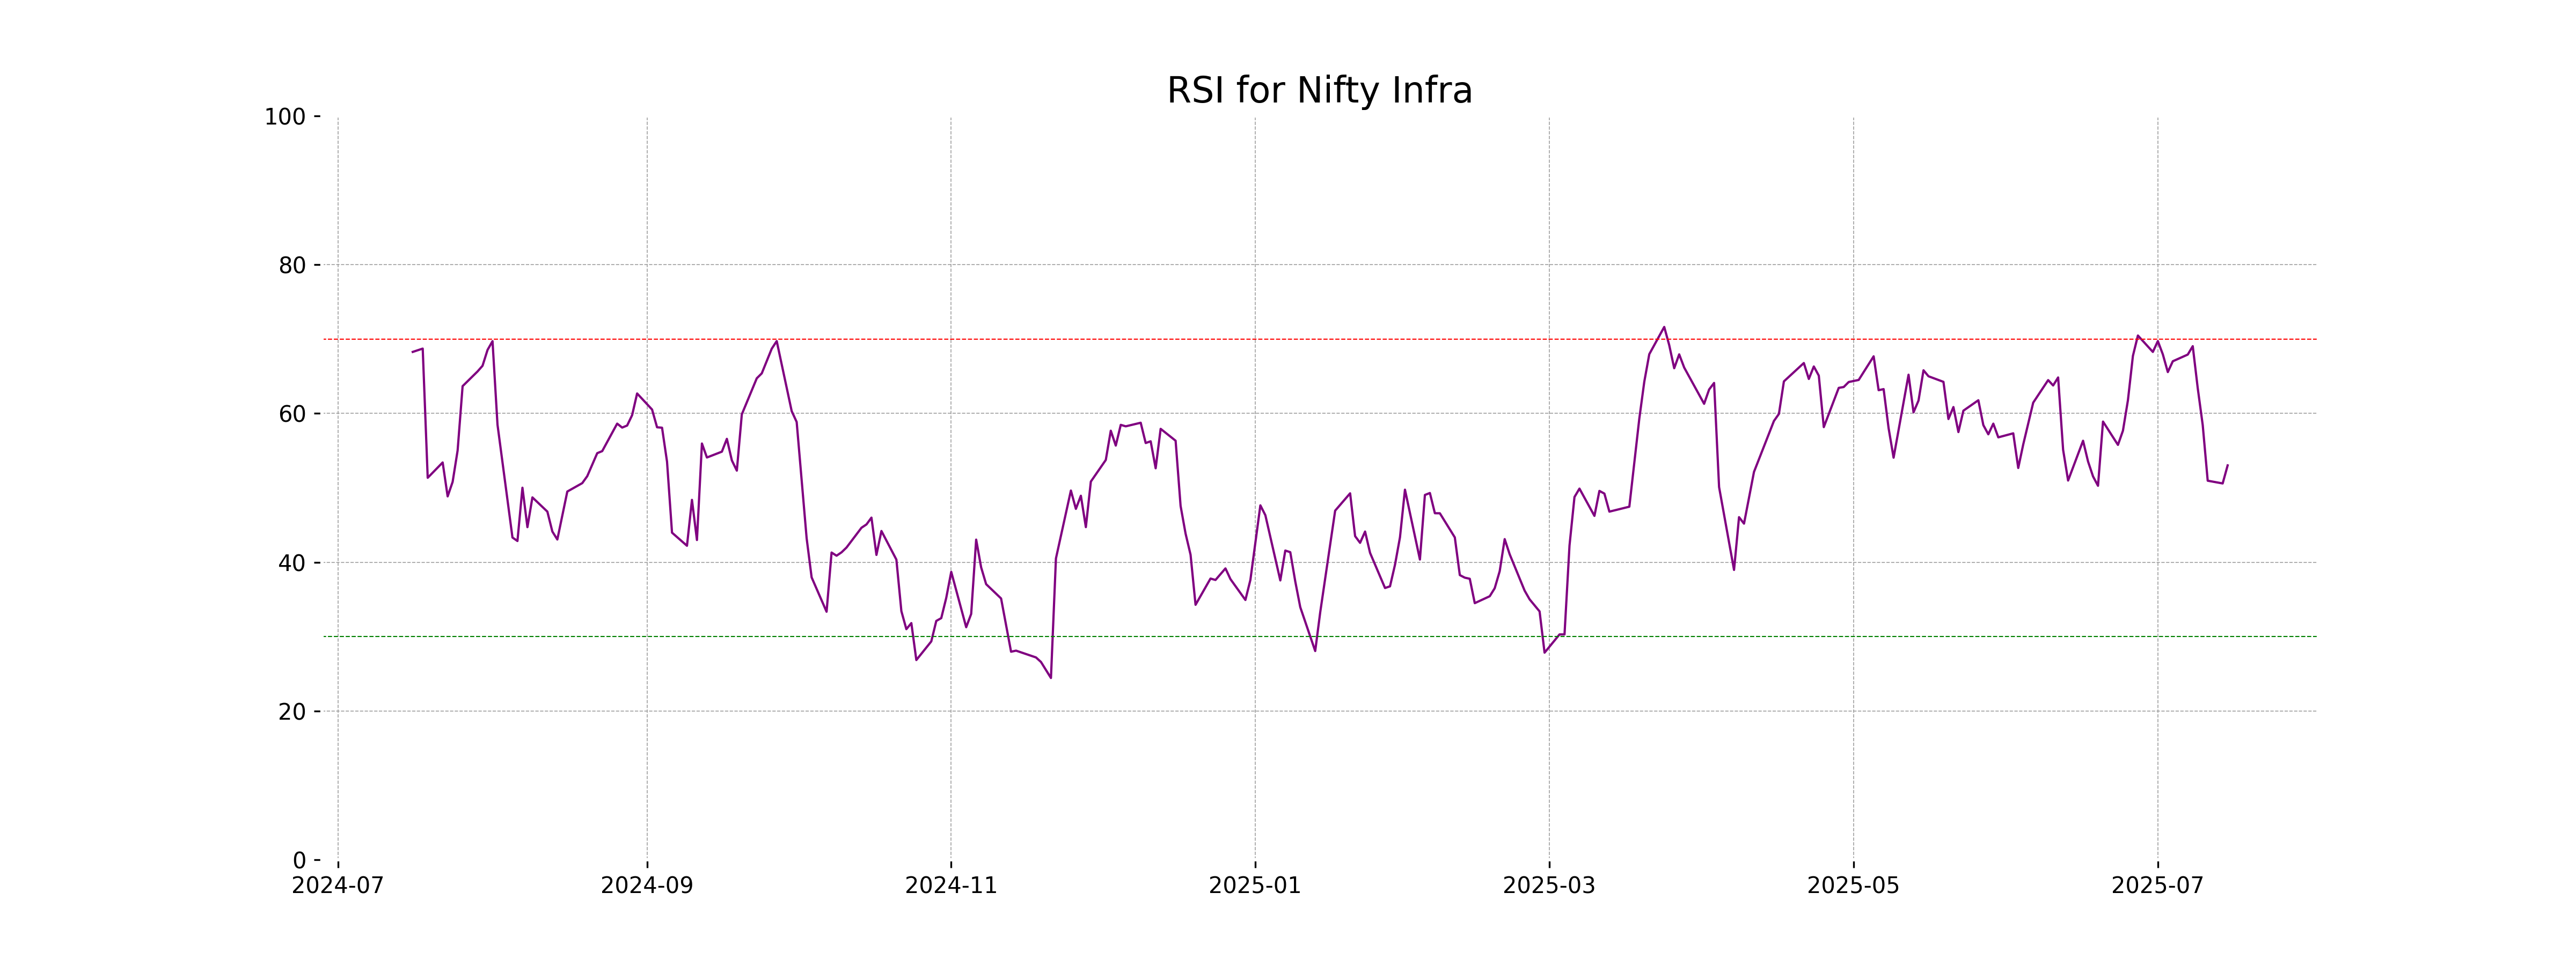
Analysis for Nifty Infra - July 15, 2025

Nifty Infra opened at 9274.70 and closed at 9287.60, with a high of 9311.55 and a low of 9253.80. The index saw a slight increase over the previous close, with a percentage change of 0.39% and a points gain of 36.30. The RSI indicates a neutral momentum at 53.02, while the MACD is below its signal line, suggesting a potential bearish trend.
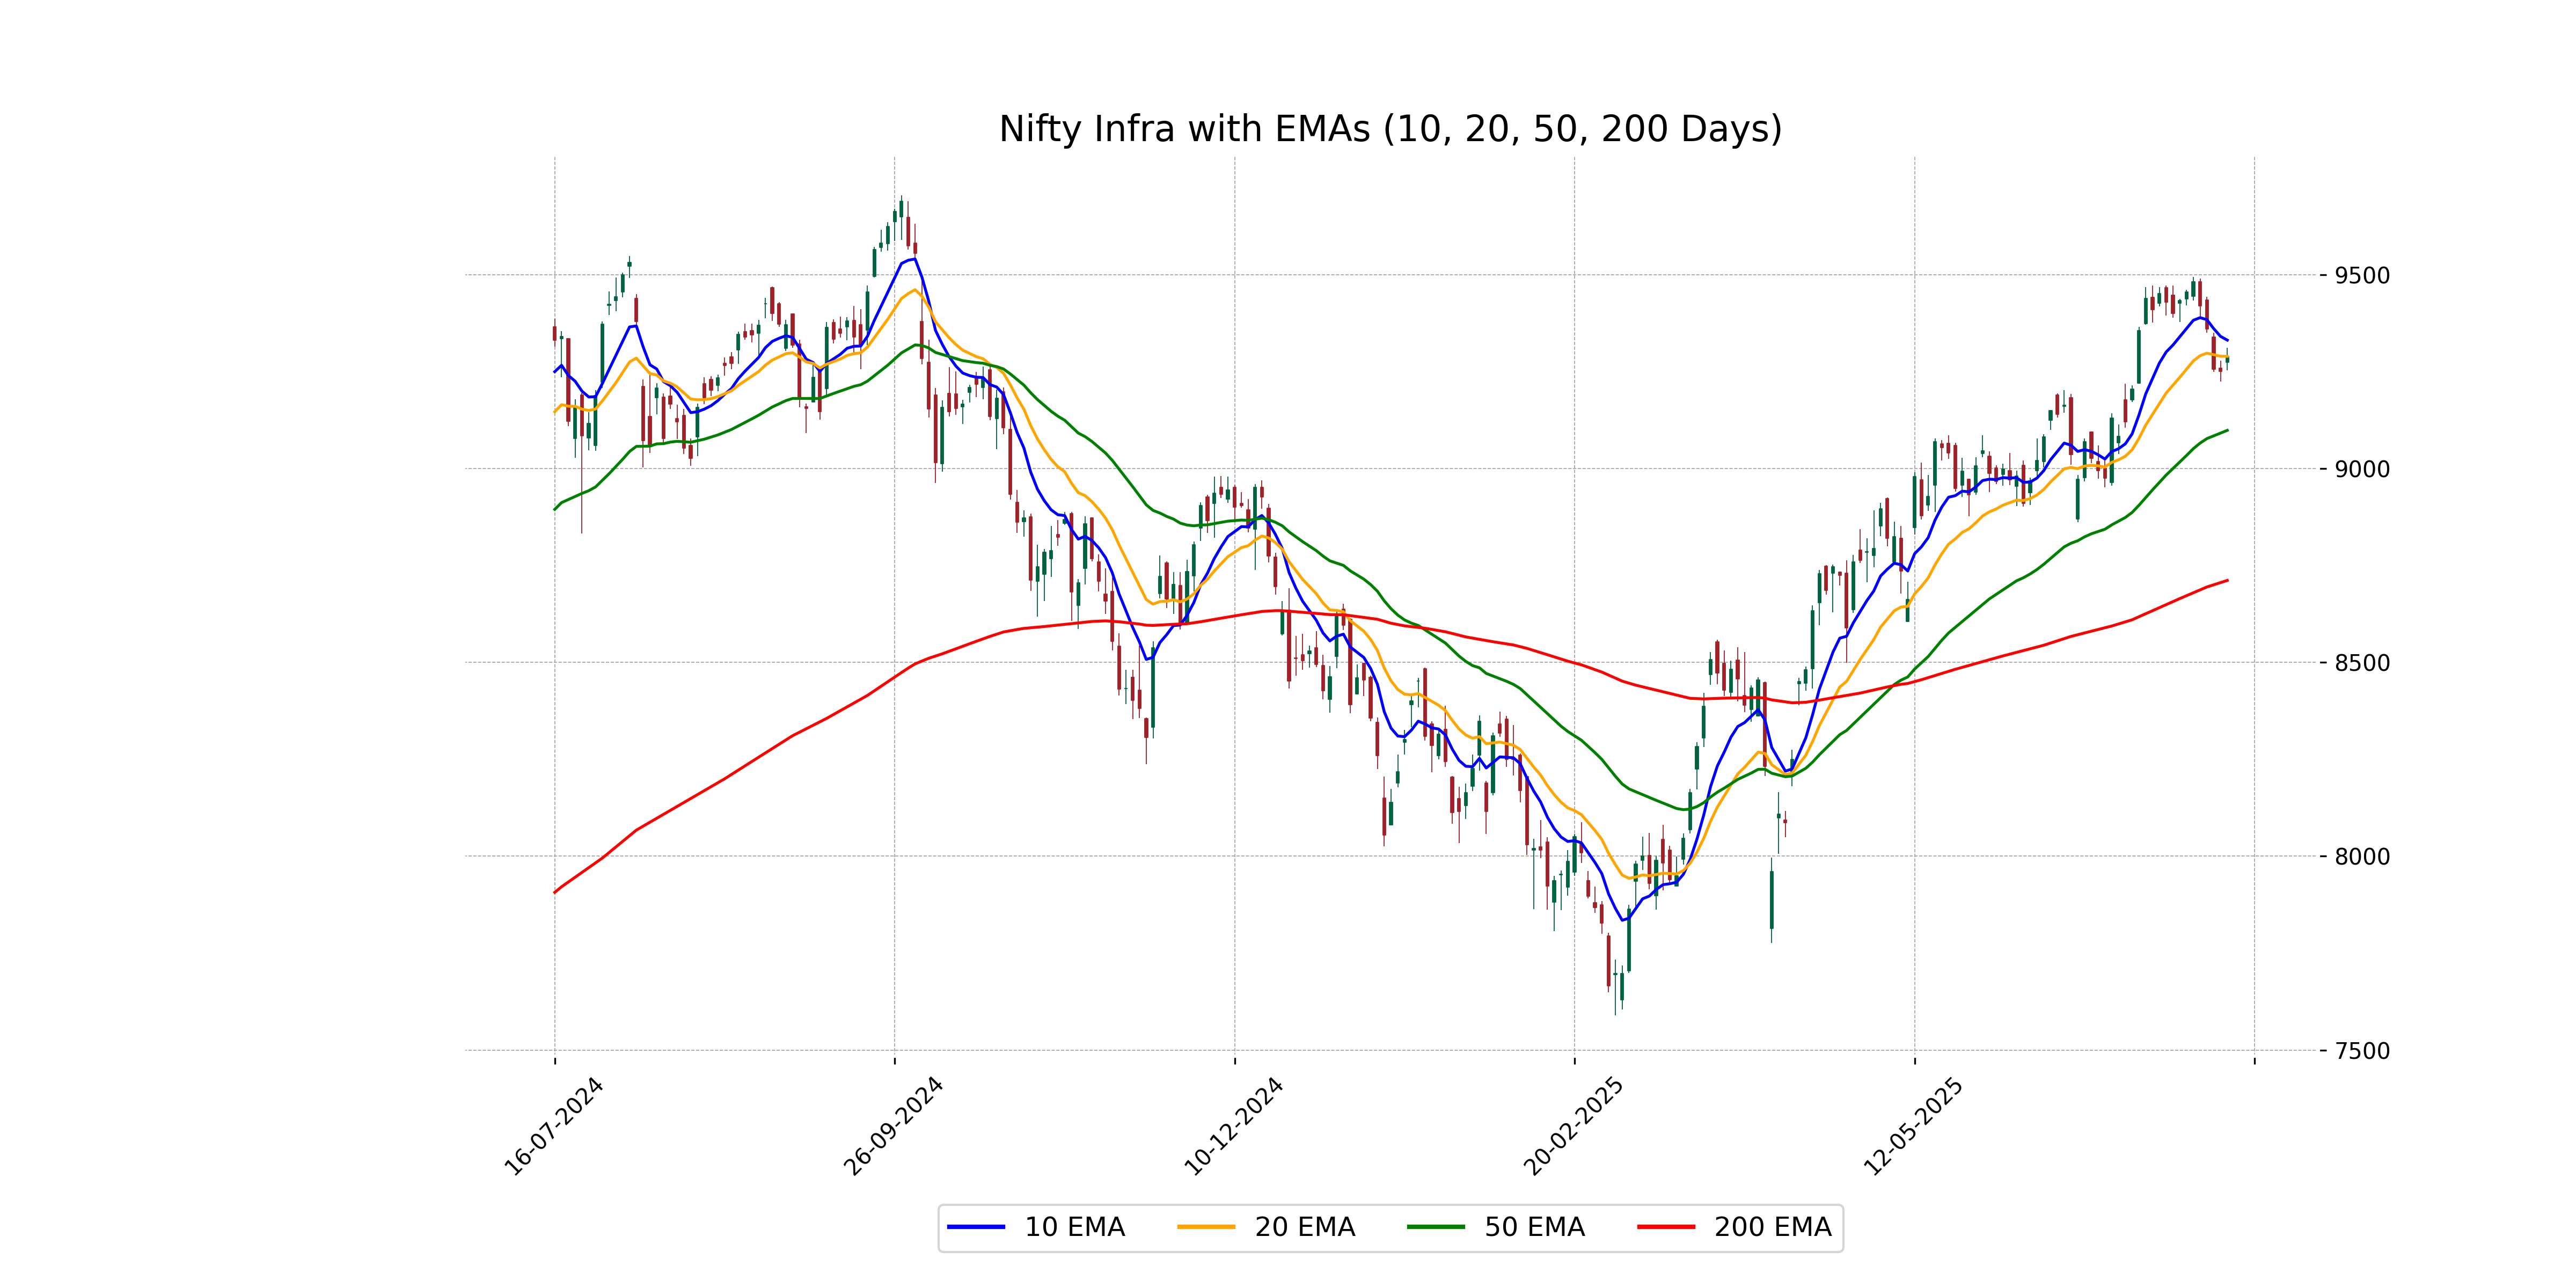
Relationship with Key Moving Averages
The Nifty Infra closed at 9287.60, which is above its 50-day EMA of 9098.53 and 200-day EMA of 8711.39, indicating a generally bullish trend. However, it is slightly below its 10-day EMA of 9331.22 and just above its 20-day EMA of 9289.49, suggesting some mixed momentum in the short term.
Moving Averages Trend (MACD)
MACD Analysis for Nifty Infra: The MACD value for Nifty Infra stands at 74.93, which is below the MACD Signal of 102.13. This indicates a bearish momentum, suggesting that the recent trend is showing signs of weakness or potential reversal if this pattern continues. Keep an eye on these metrics for shifts in trend direction.
RSI Analysis
Based on the given data, the Relative Strength Index (RSI) for Nifty Infra is 53.02. An RSI value around 50 indicates a neutral market condition, with no significant overbought or oversold pressures. This suggests a balanced momentum where neither buyers nor sellers have a distinct advantage.
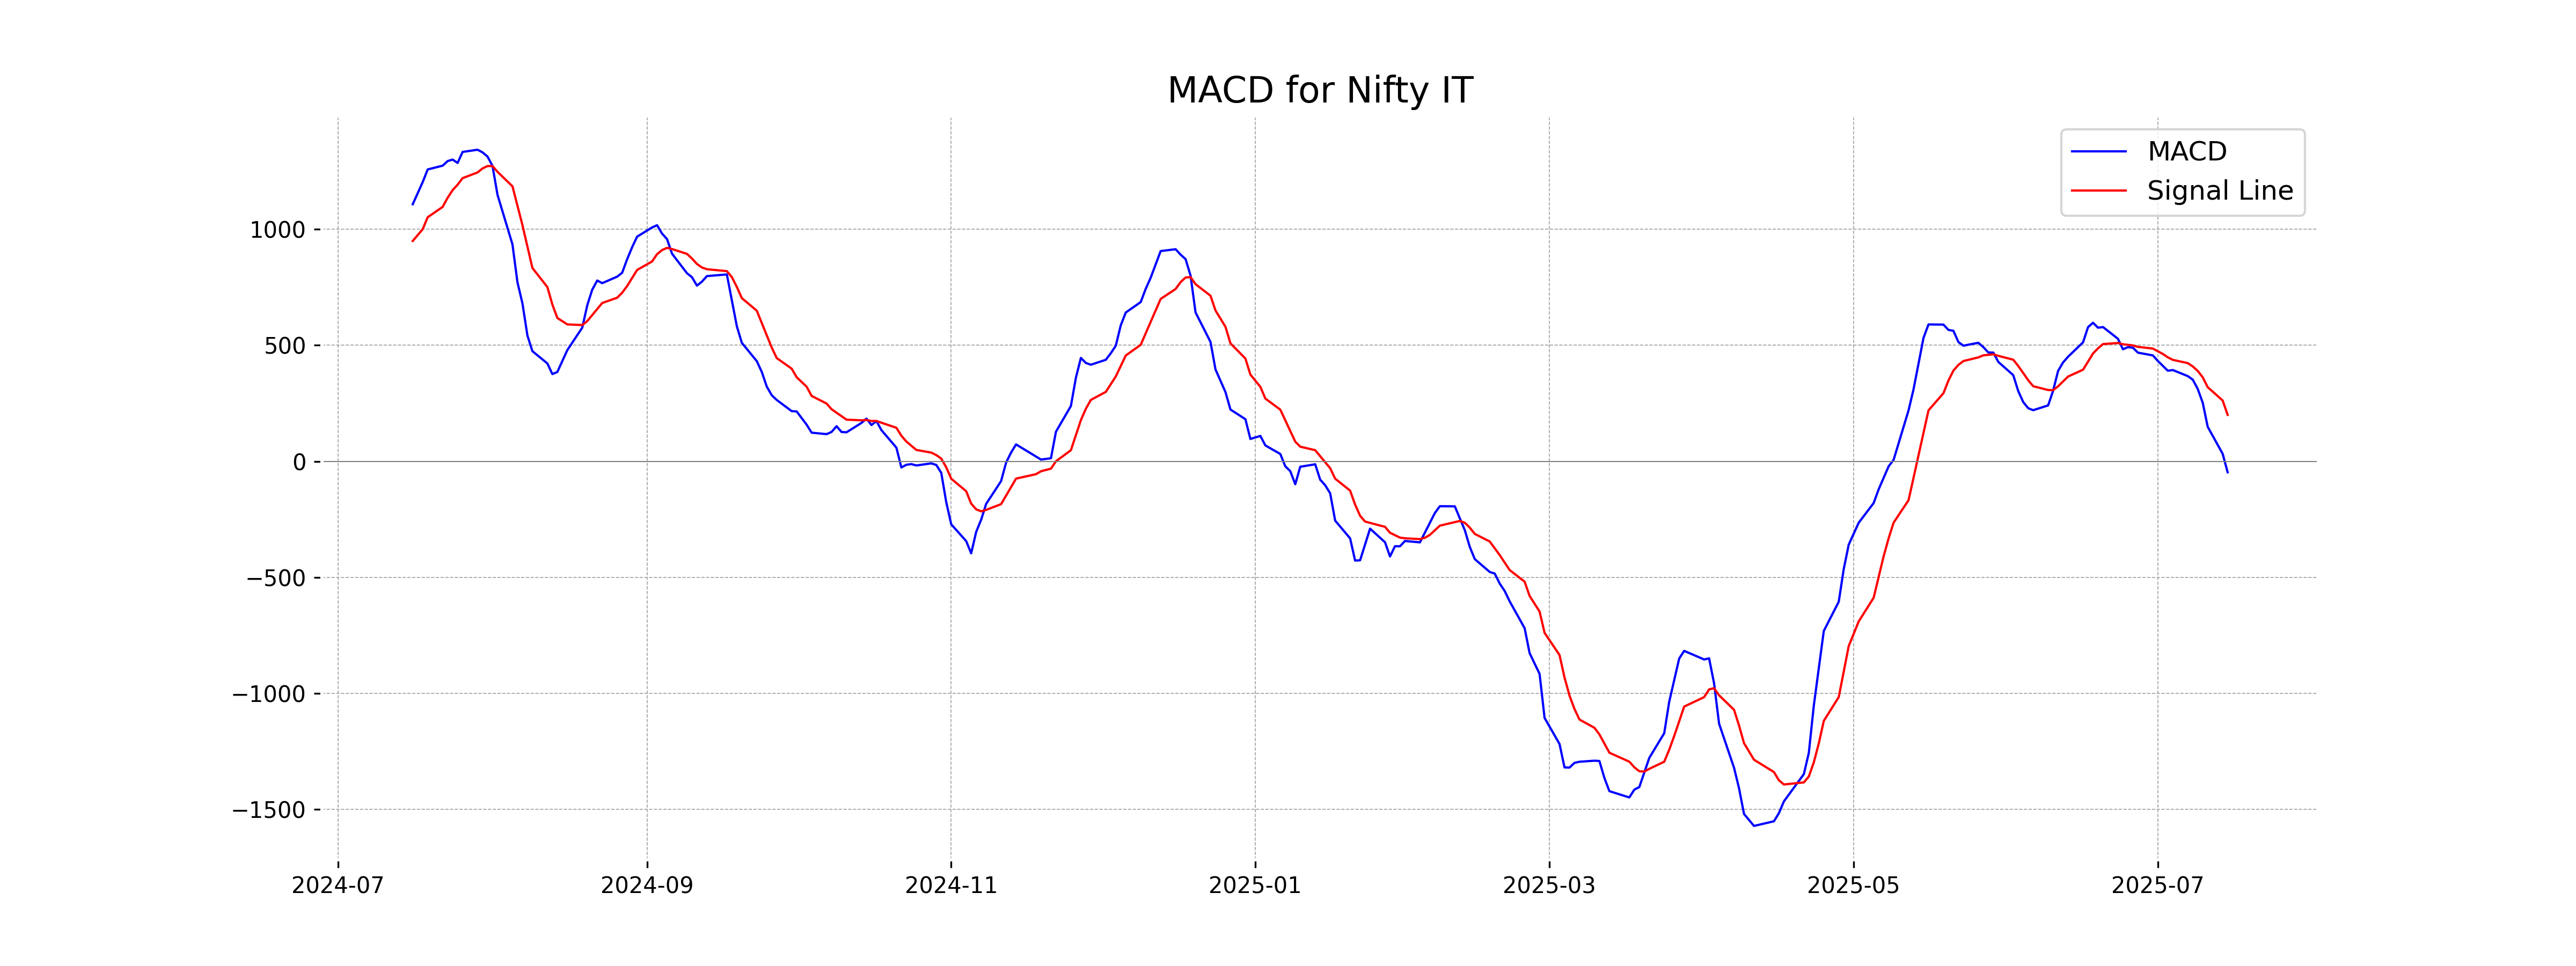
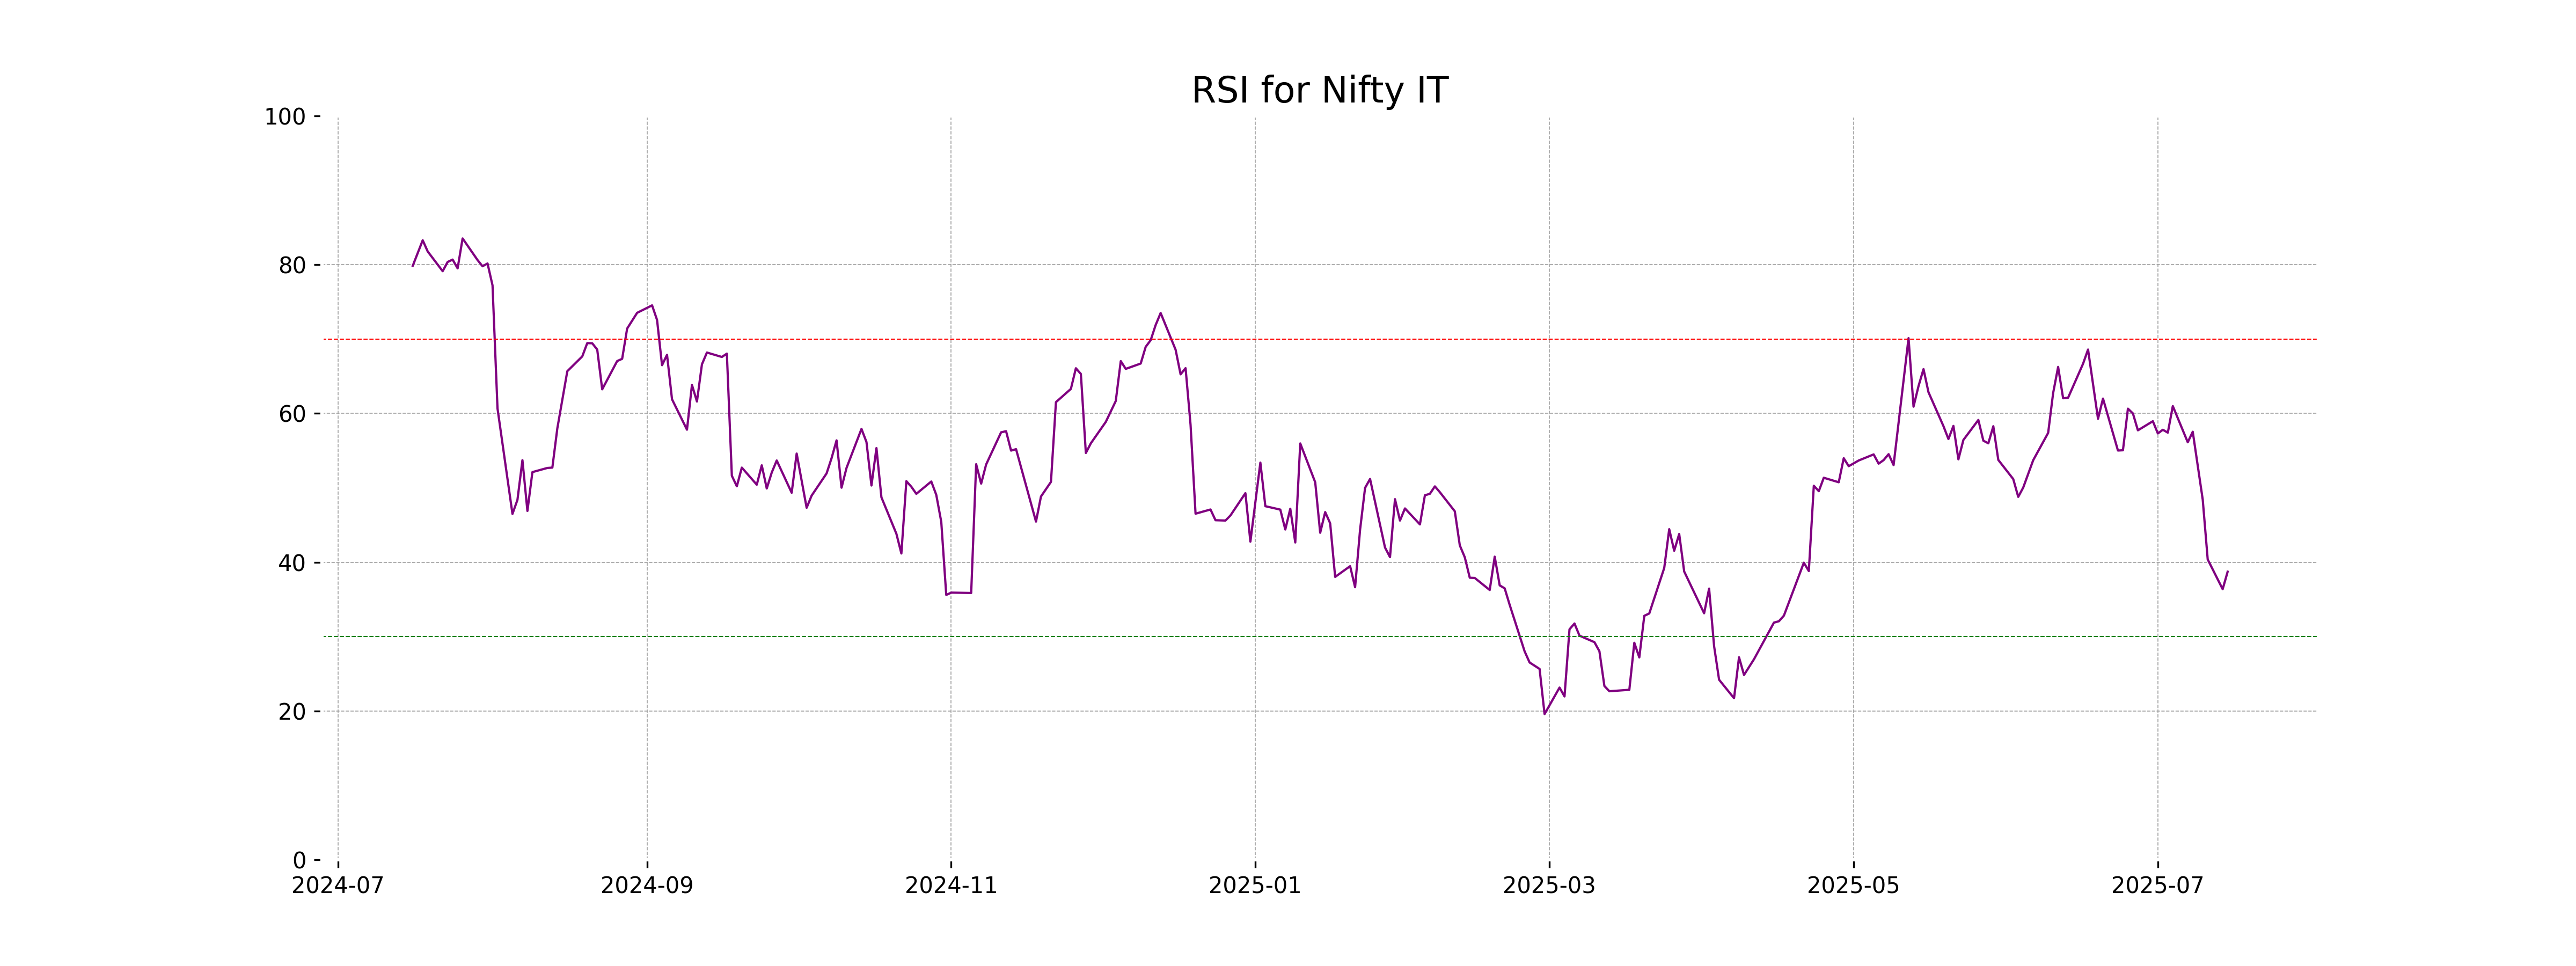
Analysis for Nifty IT - July 15, 2025
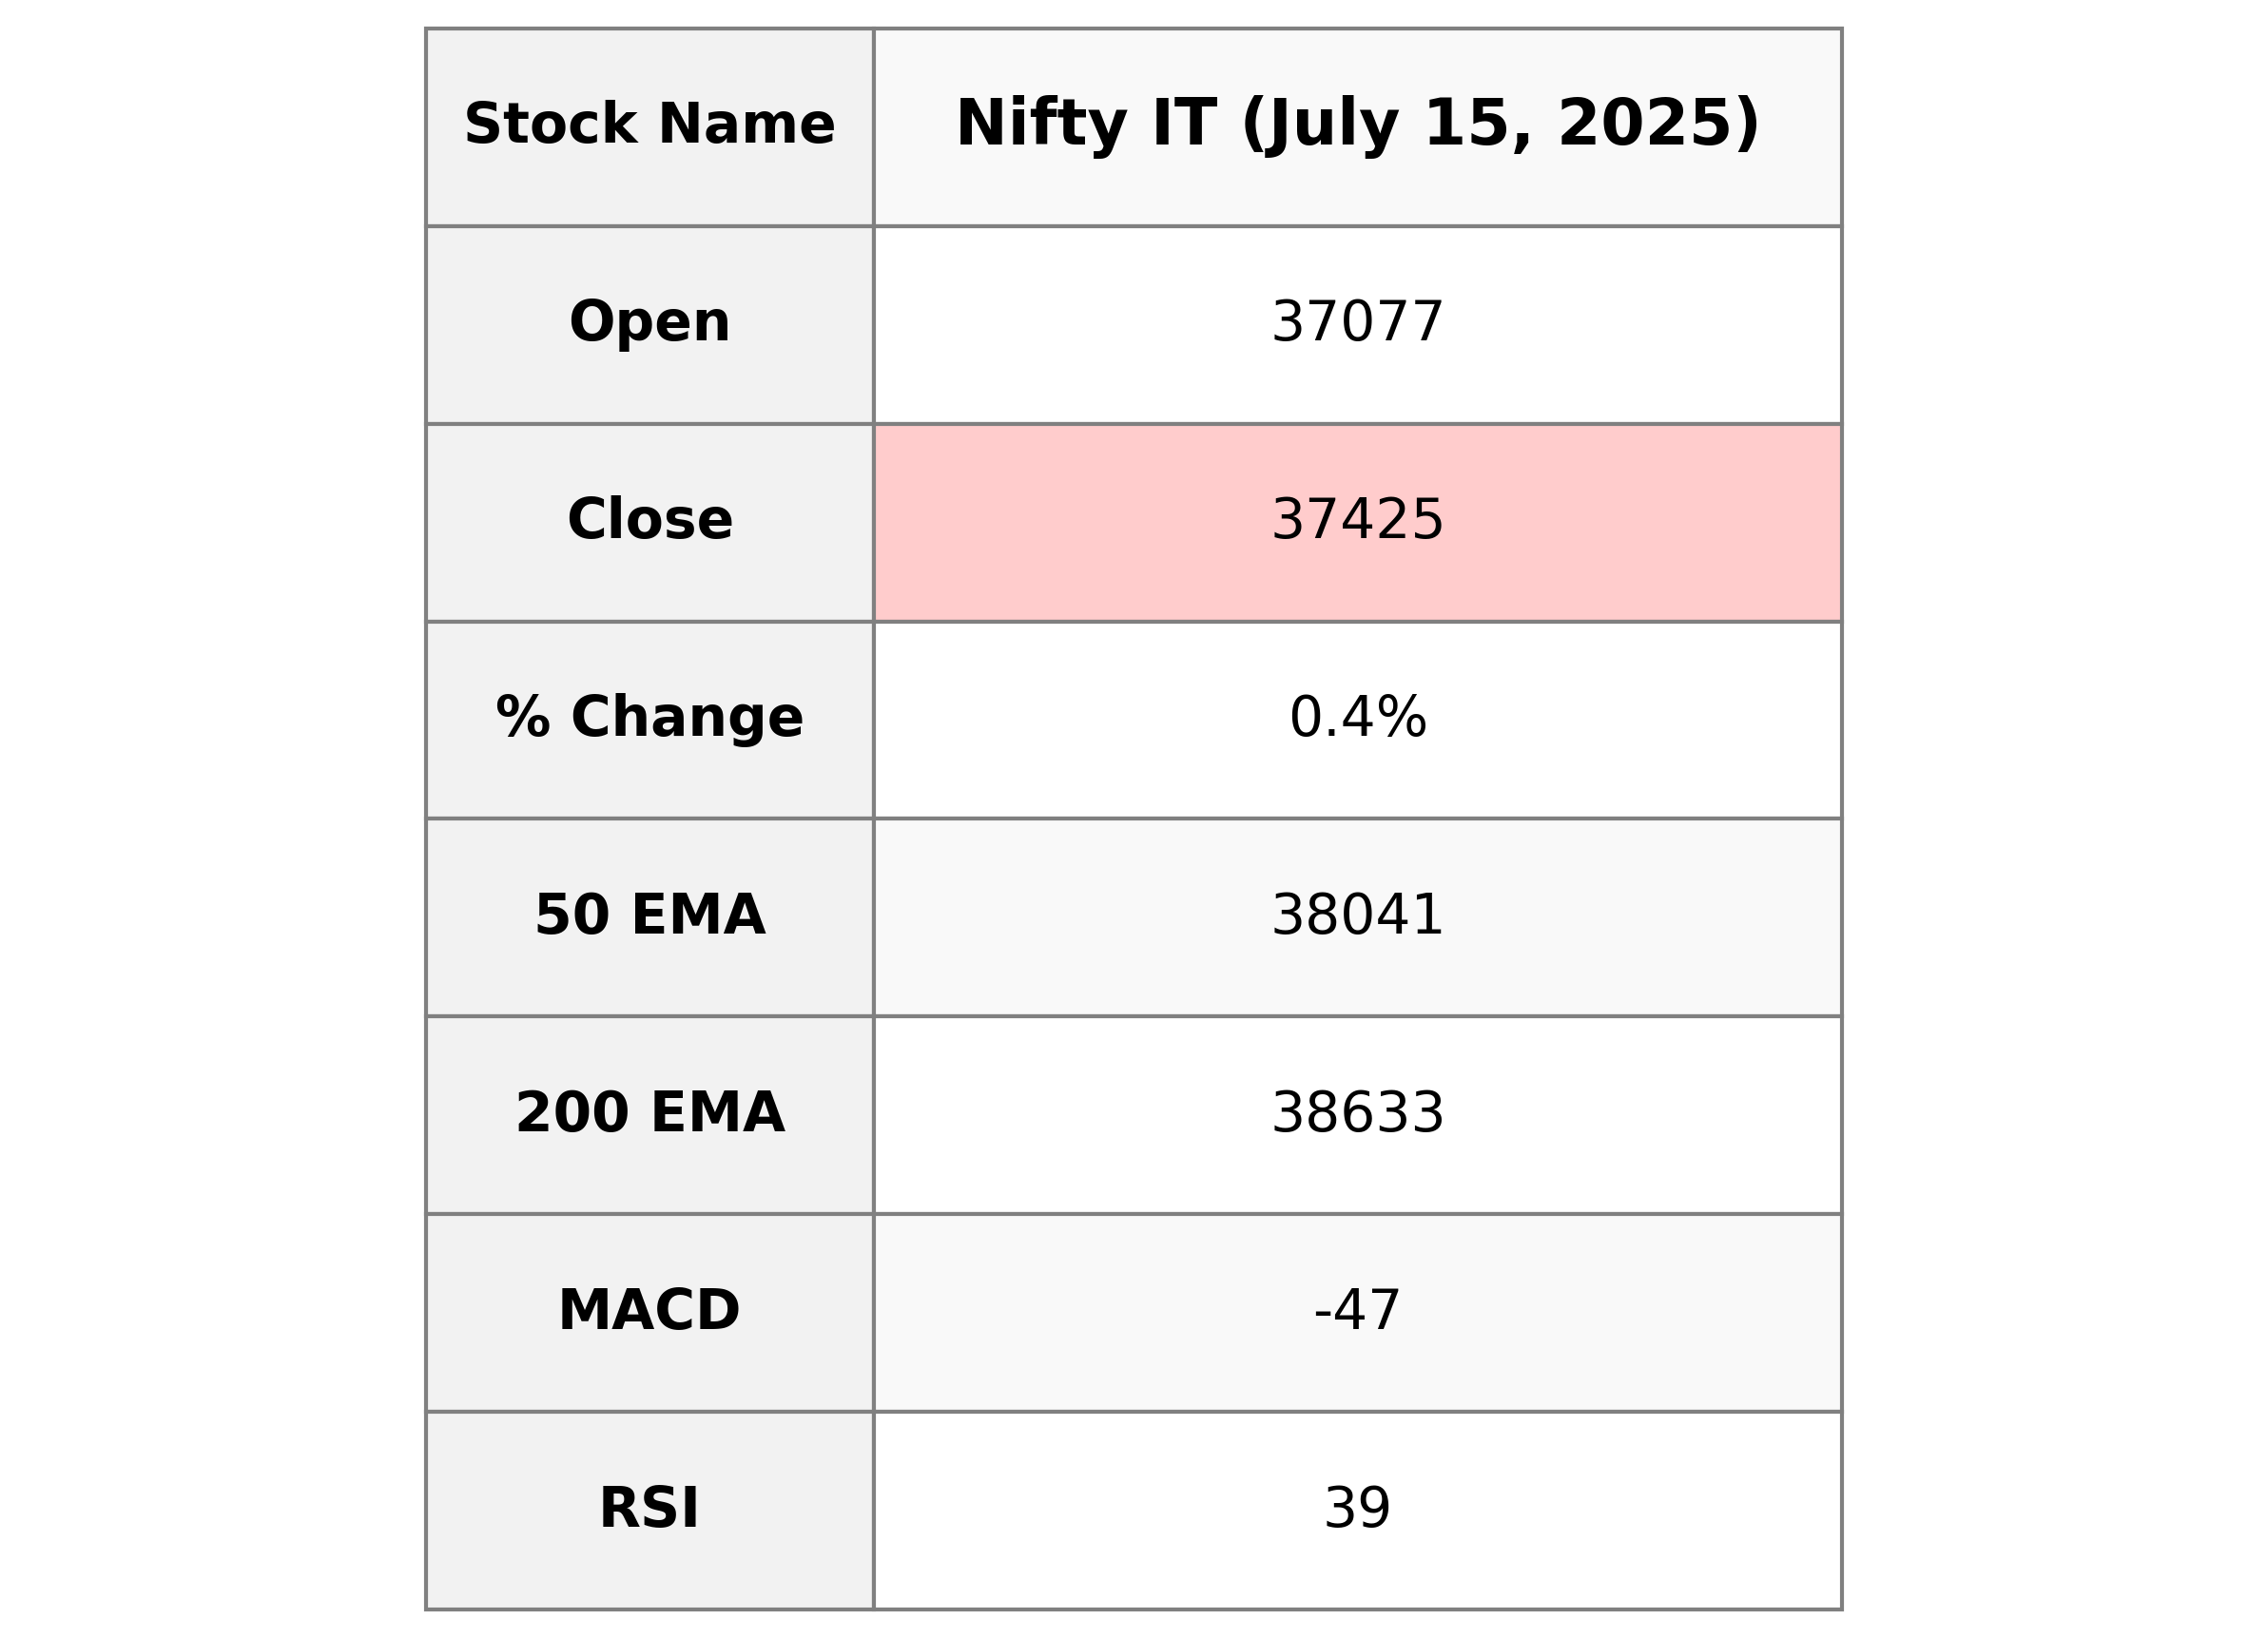
Nifty IT opened at 37077.0 and closed at 37424.6, resulting in a slight increase of 0.40% or 150.9 points from the previous close of 37273.7. The sector experienced a high of 37664.9 and a low of 37048.9 during the trading session. Despite minimal price fluctuations, the RSI indicates a relatively weaker position at 38.73, and the MACD suggests a bearish momentum as it stands below the signal line.
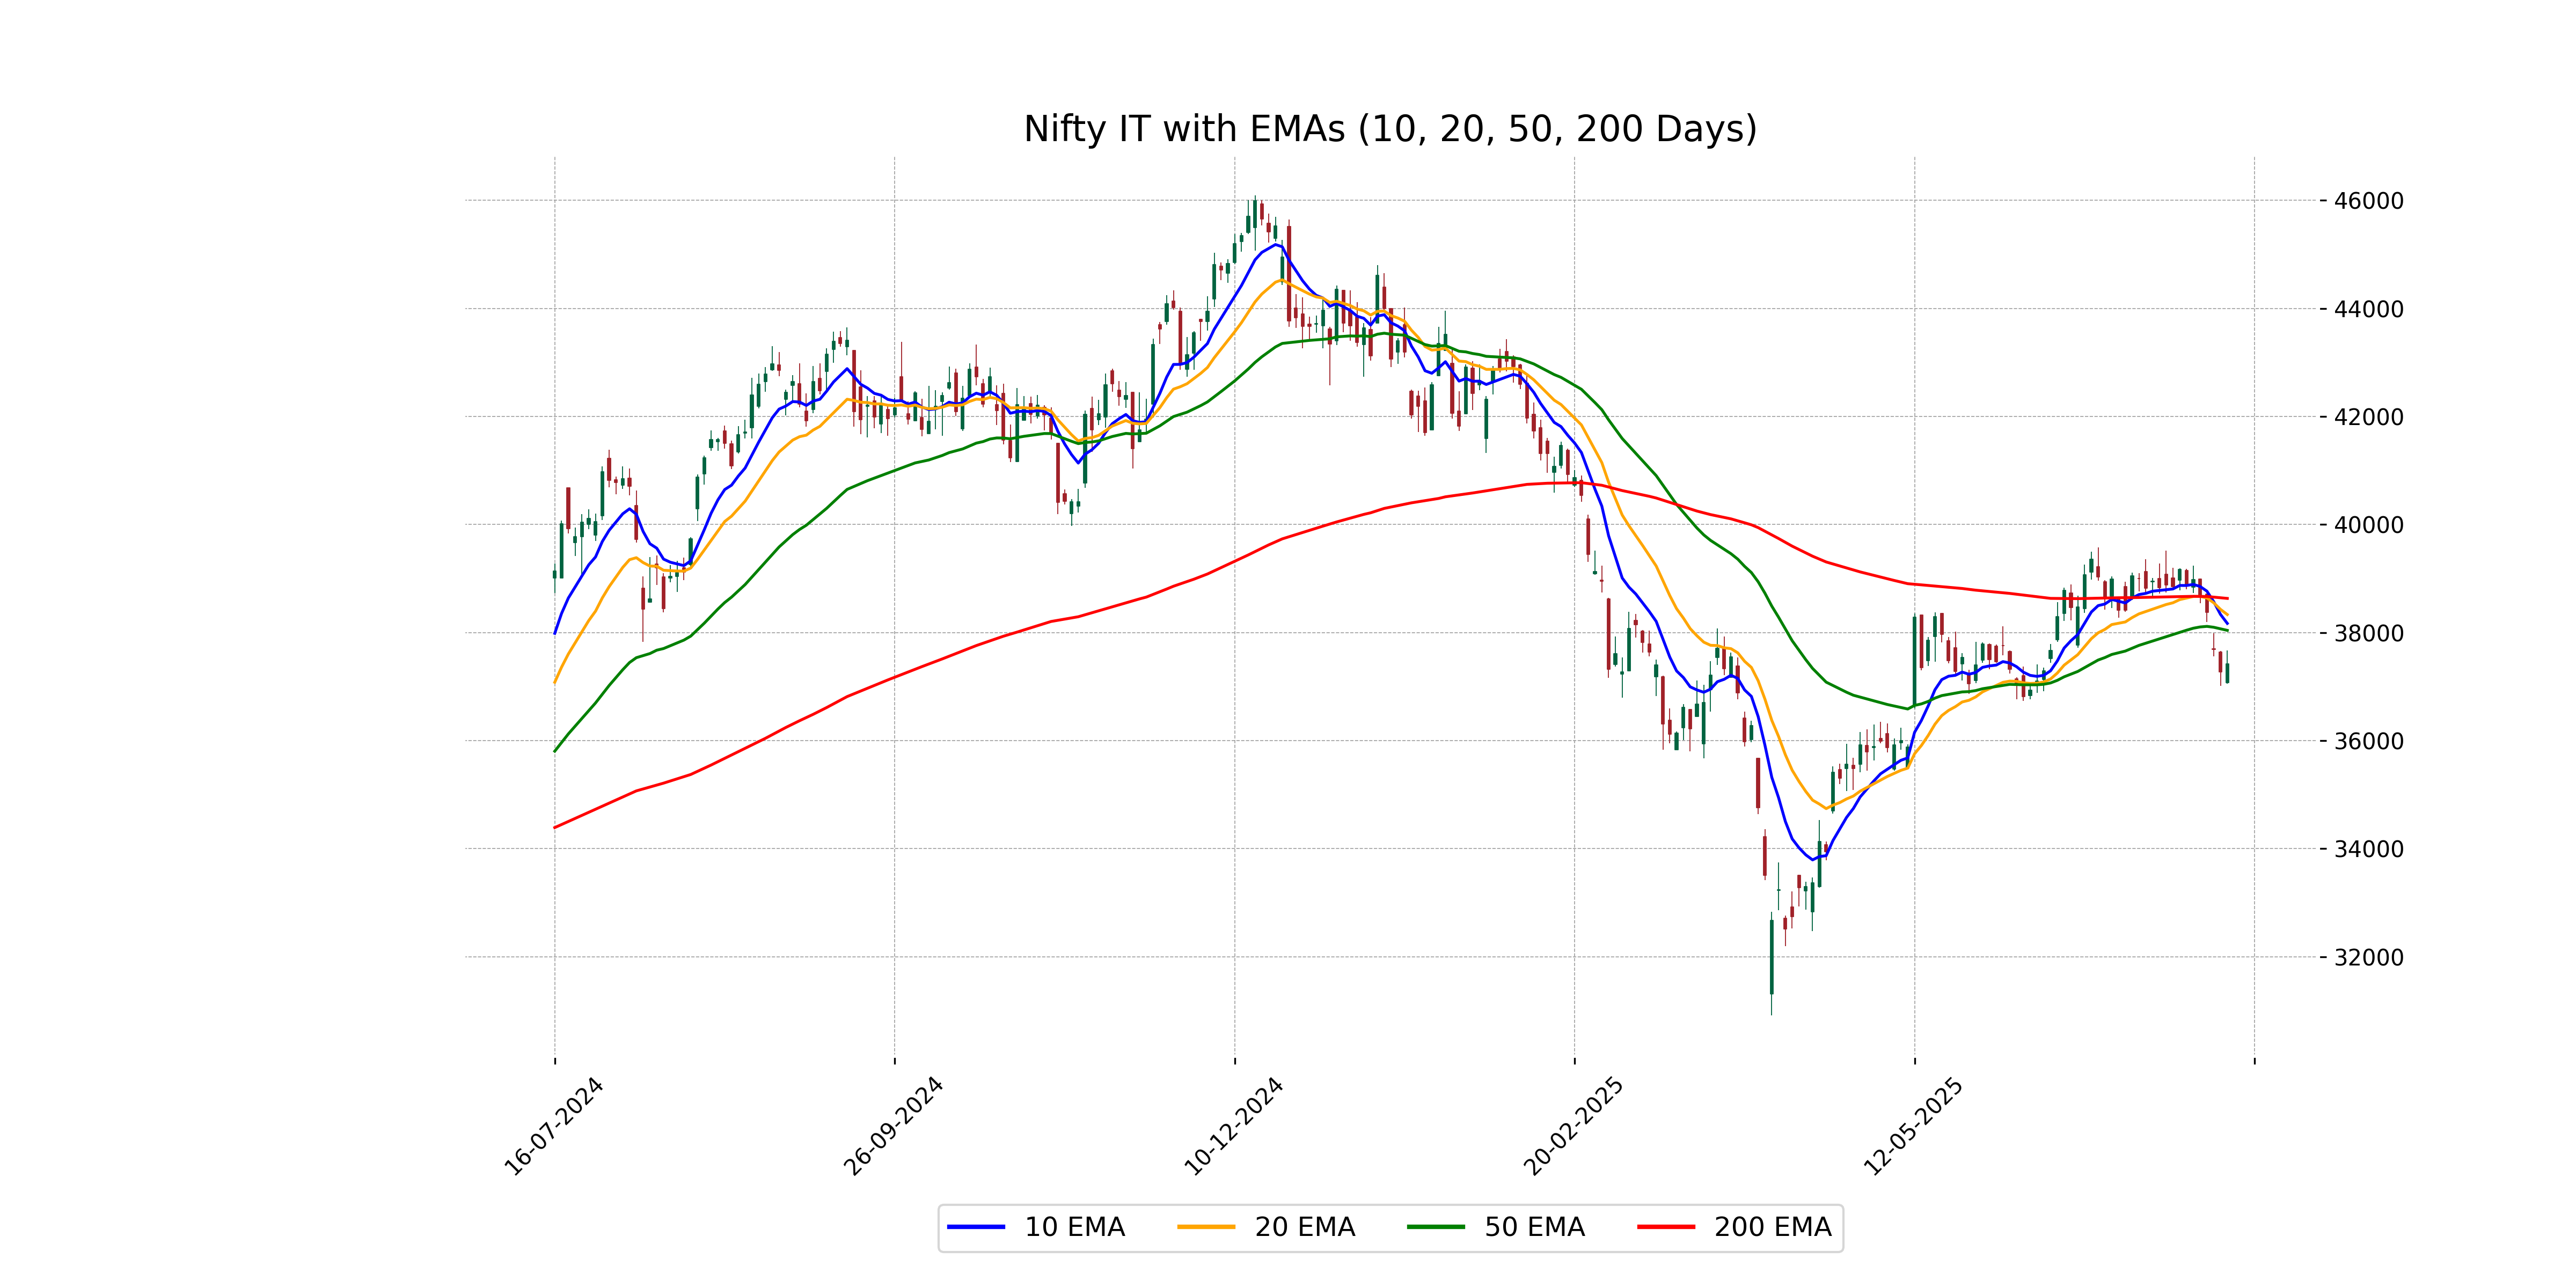
Relationship with Key Moving Averages
The Nifty IT index closed at 37,424.60, which is below its 50-day EMA of 38,041.01 and its 200-day EMA of 38,632.73. This indicates a bearish trend as it trades below key moving averages.
Moving Averages Trend (MACD)
The MACD value for Nifty IT is -47.41, which is below the MACD Signal line of 200.10, indicating a bearish trend. The negative MACD suggests that the stock may be experiencing downward momentum, and traders might consider this as a potential signal for further declines or consolidation.
RSI Analysis
Based on the given data, Nifty IT's RSI is 38.73, indicating that the index is approaching oversold conditions. An RSI value below 30 is typically considered oversold, so if the downward trend continues, it may soon reach that level, suggesting potential buying opportunities.
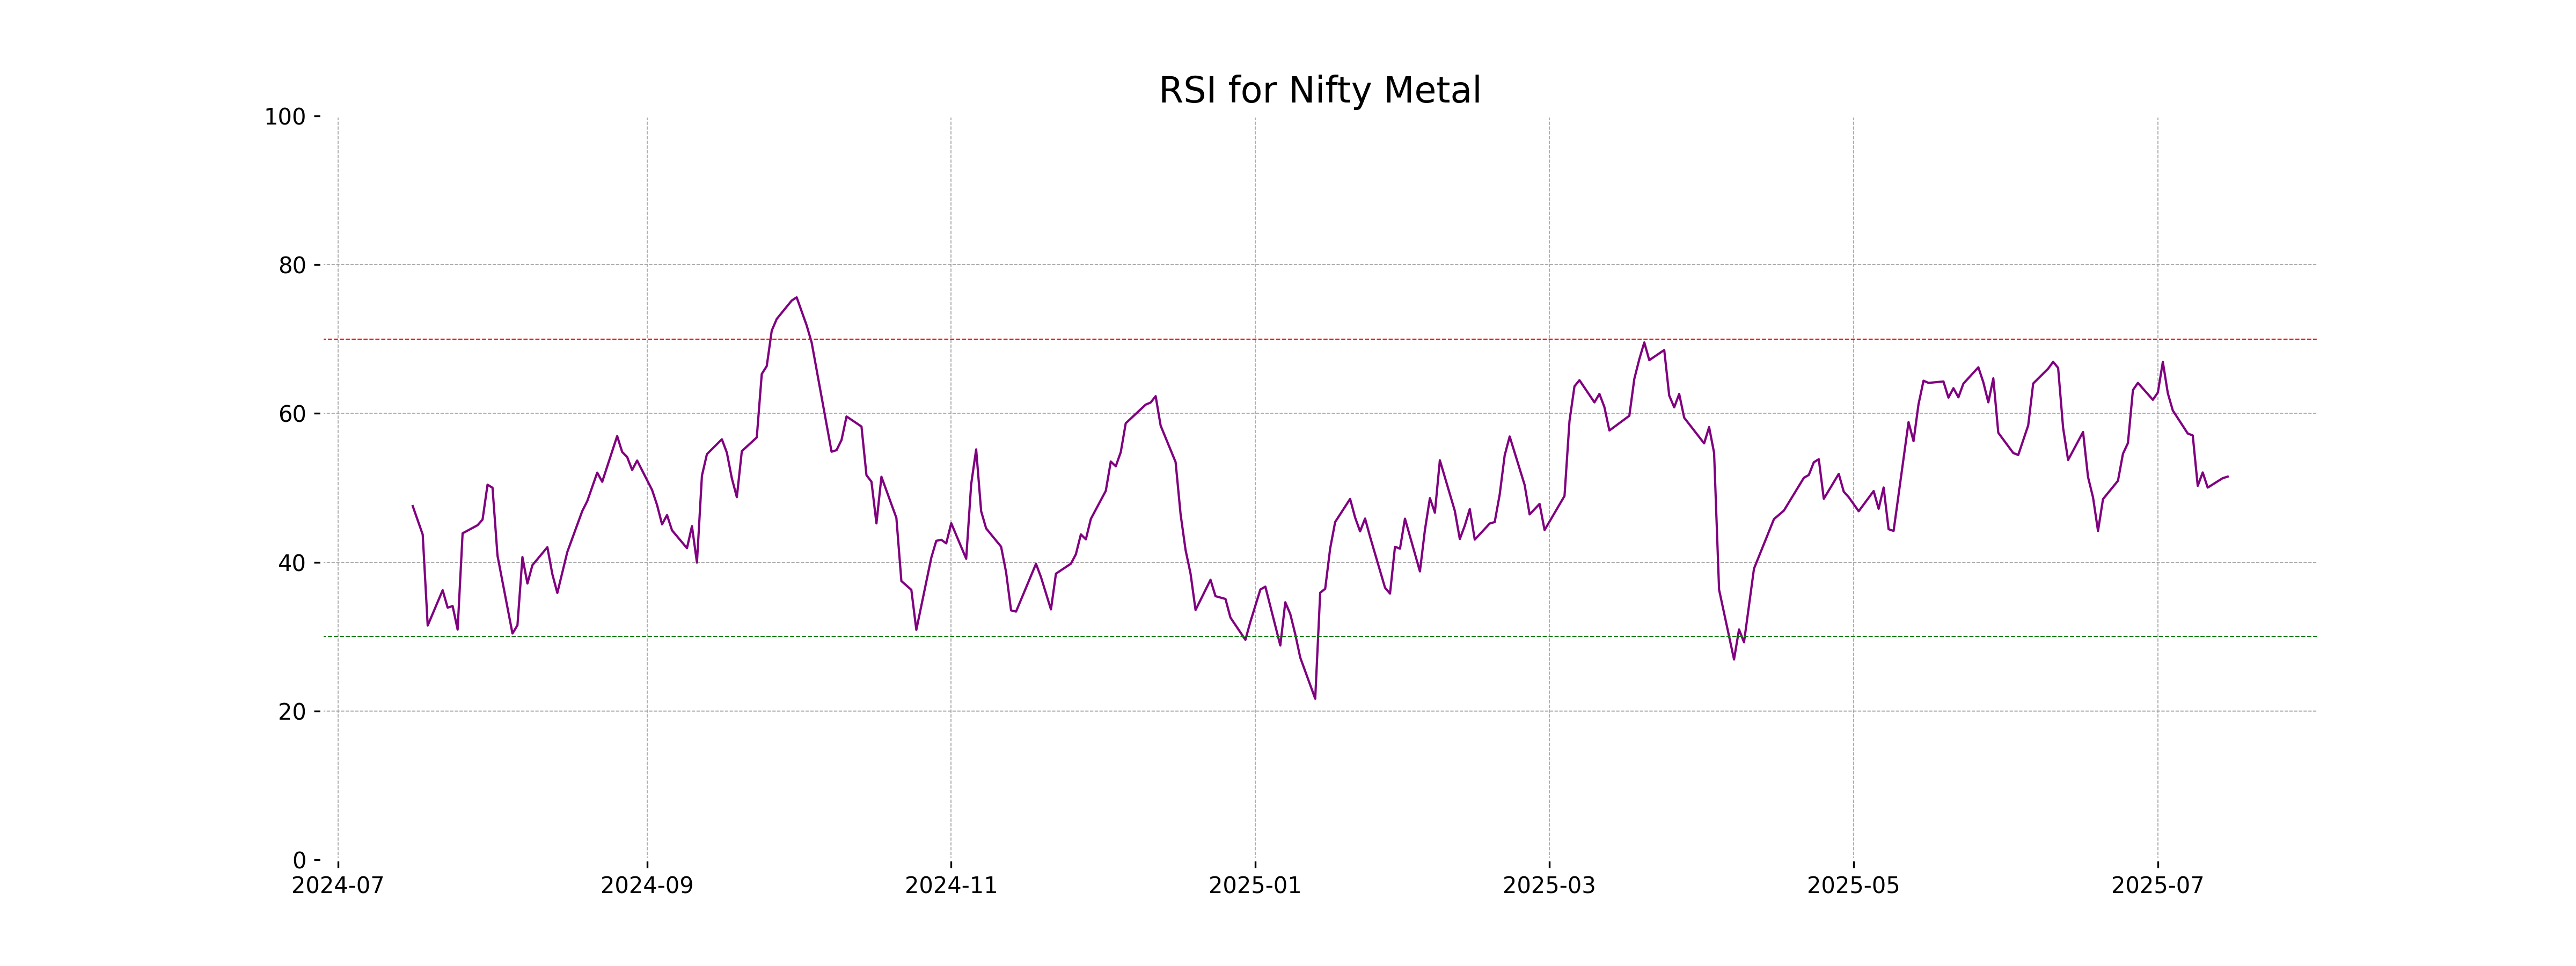
Analysis for Nifty Metal - July 15, 2025

Nifty Metal Performance: The Nifty Metal index opened at 9430.90 and closed slightly higher at 9411.95, with a modest change of 4 points from the previous close. The % change is positive at 0.04%, indicating minor upward movement. The Relative Strength Index (RSI) is at 51.51, suggesting a neutral trend. The MACD is slightly below its signal line, which might suggest a lack of strong momentum in either direction. The index is trading above its 50 and 200 EMA, indicating a longer-term uptrend, but below its 10 and 20 EMAs, hinting at short-term potential weakness. Overall, the Nifty Metal index demonstrates stability with slight bullish tendencies.
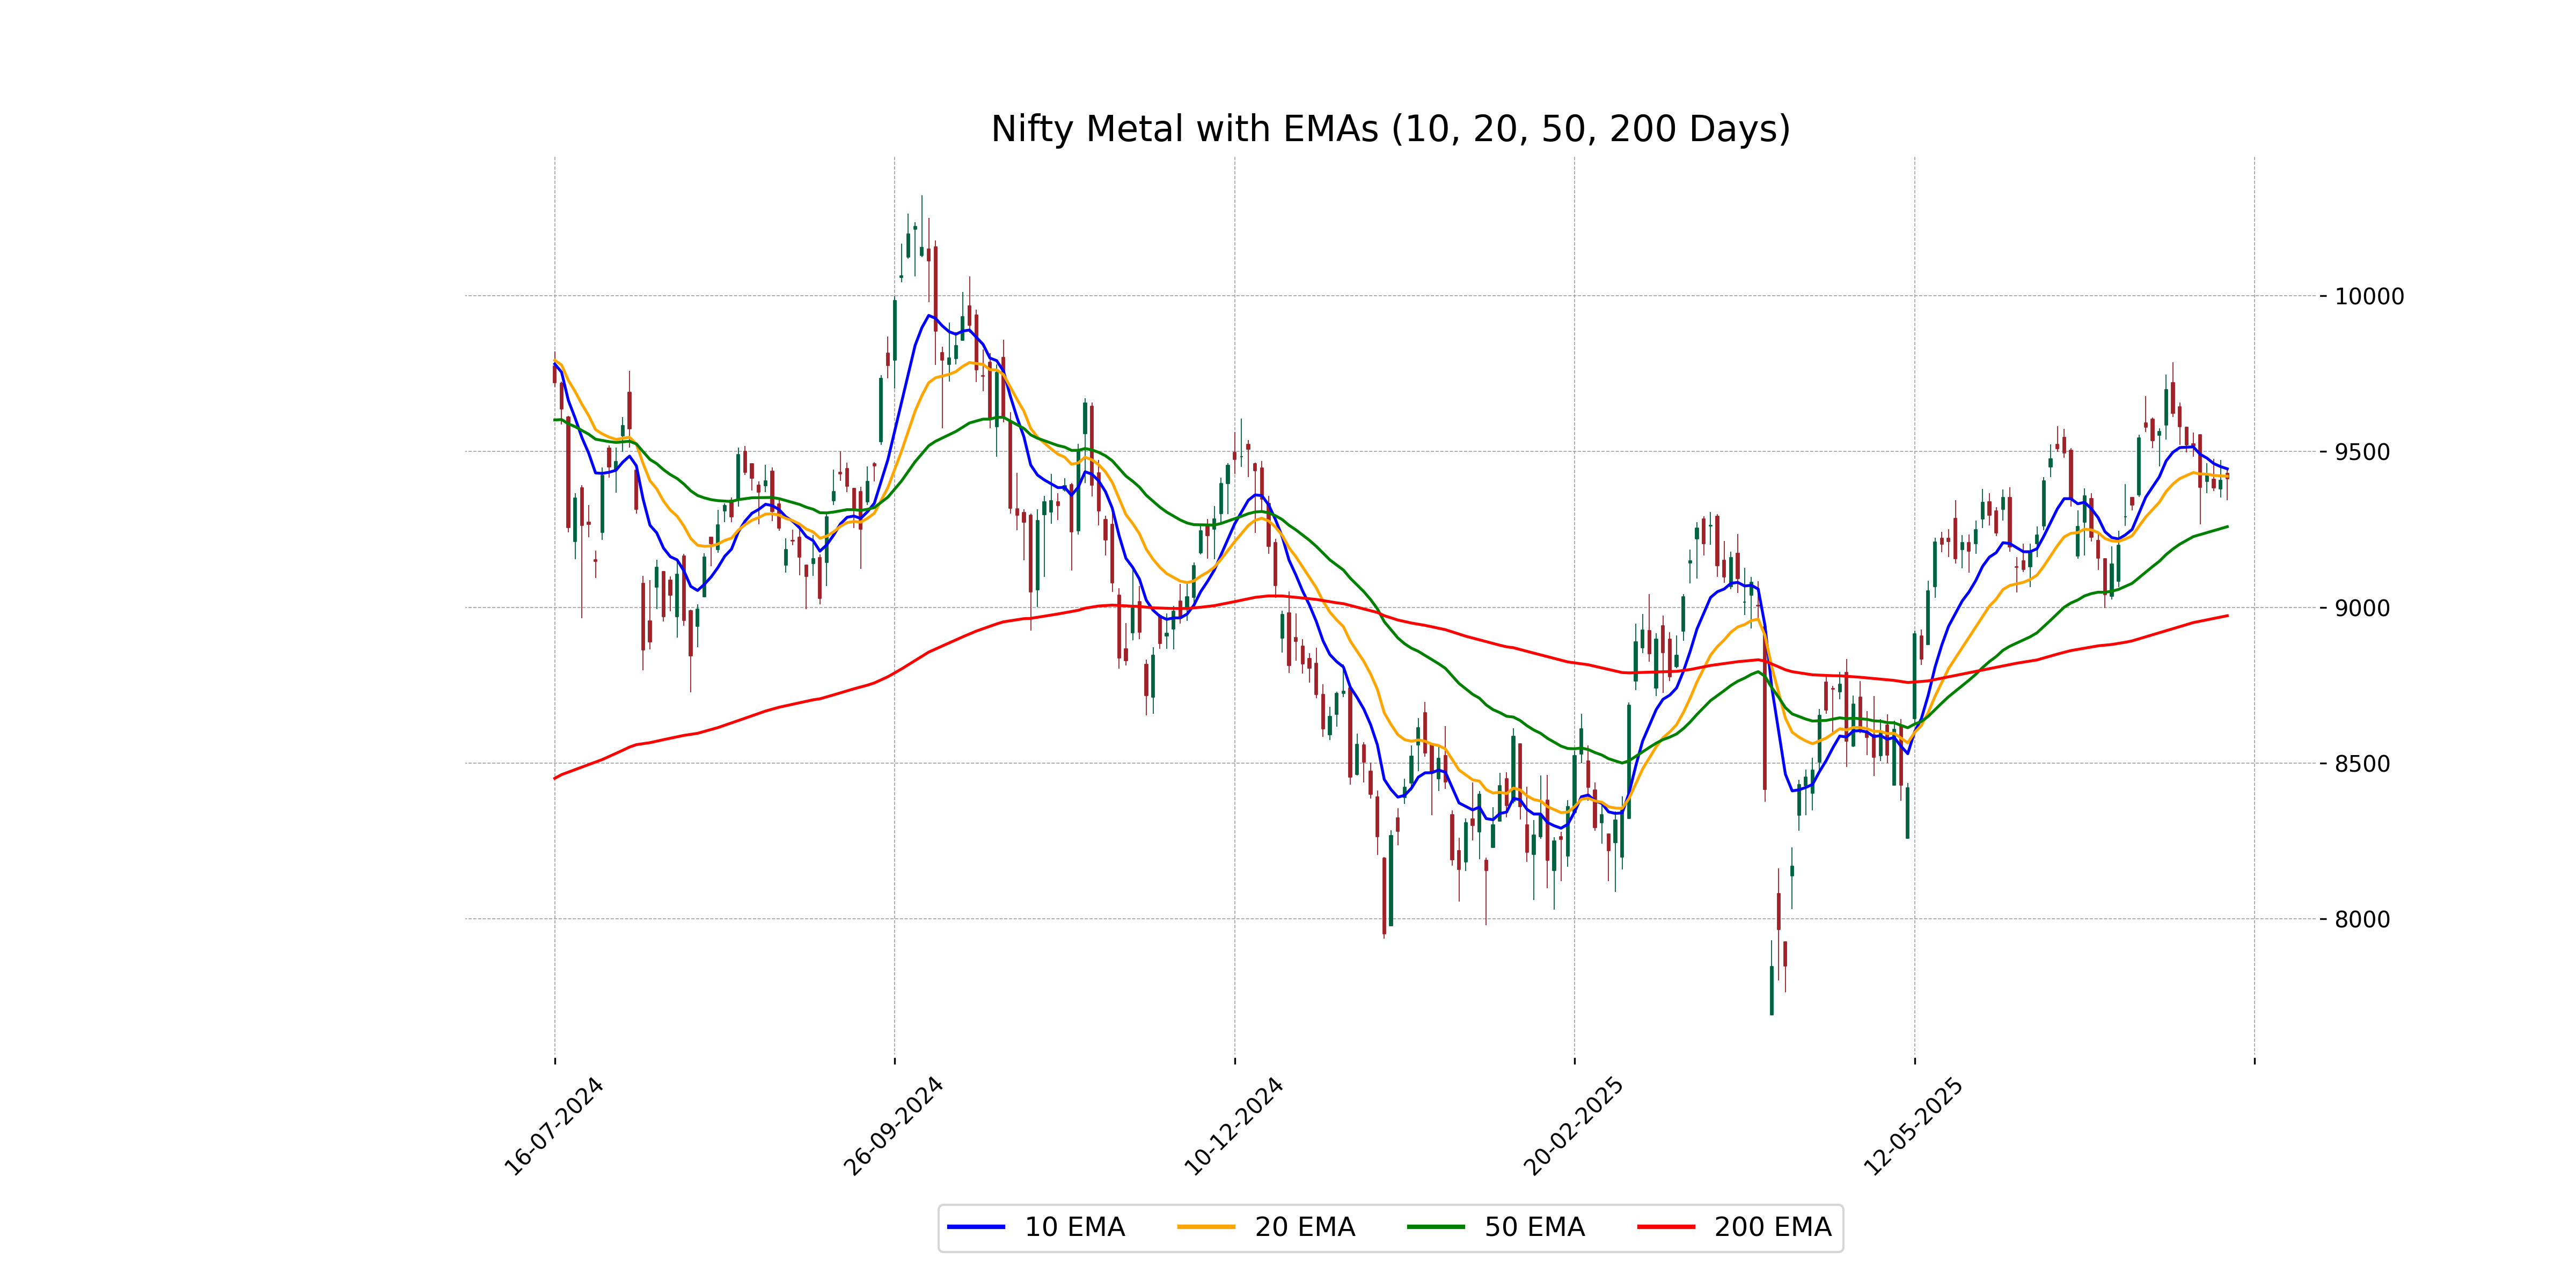
Relationship with Key Moving Averages
Nifty Metal closed at 9411.95, slightly above the 50 EMA of 9258.72 and significantly above the 200 EMA of 8972.87, indicating a stronger position relative to these key moving averages. However, it ended below the 10 EMA of 9444.51 and the 20 EMA of 9420.90, suggesting some short-term weakness.
Moving Averages Trend (MACD)
MACD Analysis for Nifty Metal: The MACD for Nifty Metal is currently below the MACD Signal line, indicating a bearish trend. At a value of 52.94 compared to the MACD Signal of 80.76, it suggests a possible continuation of downward momentum unless there is a reversal.
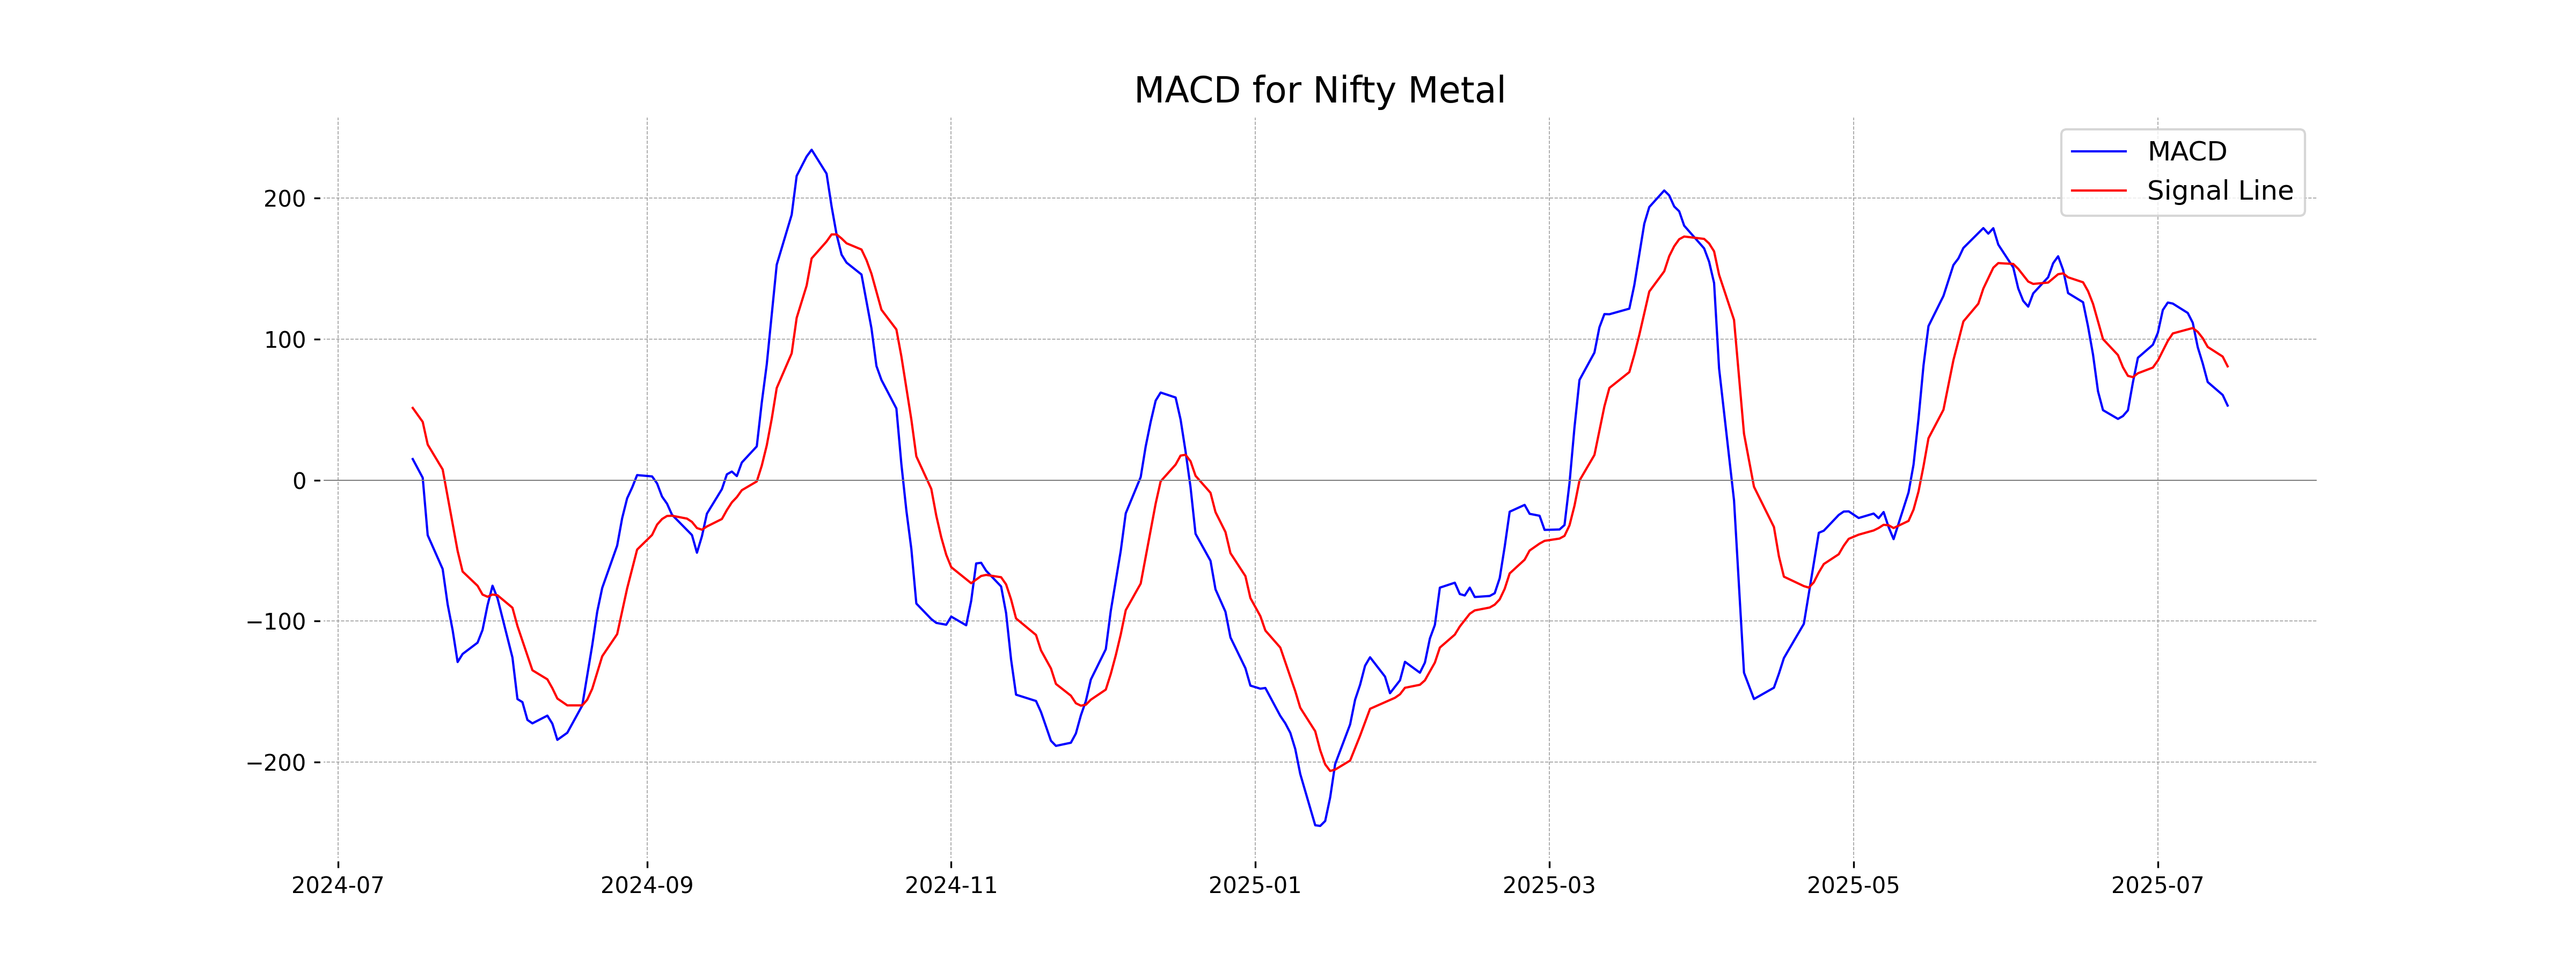
RSI Analysis
Based on the data provided, the RSI for Nifty Metal is 51.51. This indicates that the stock is in a neutral zone, suggesting neither overbought nor oversold conditions, which may imply stability in its current trend.
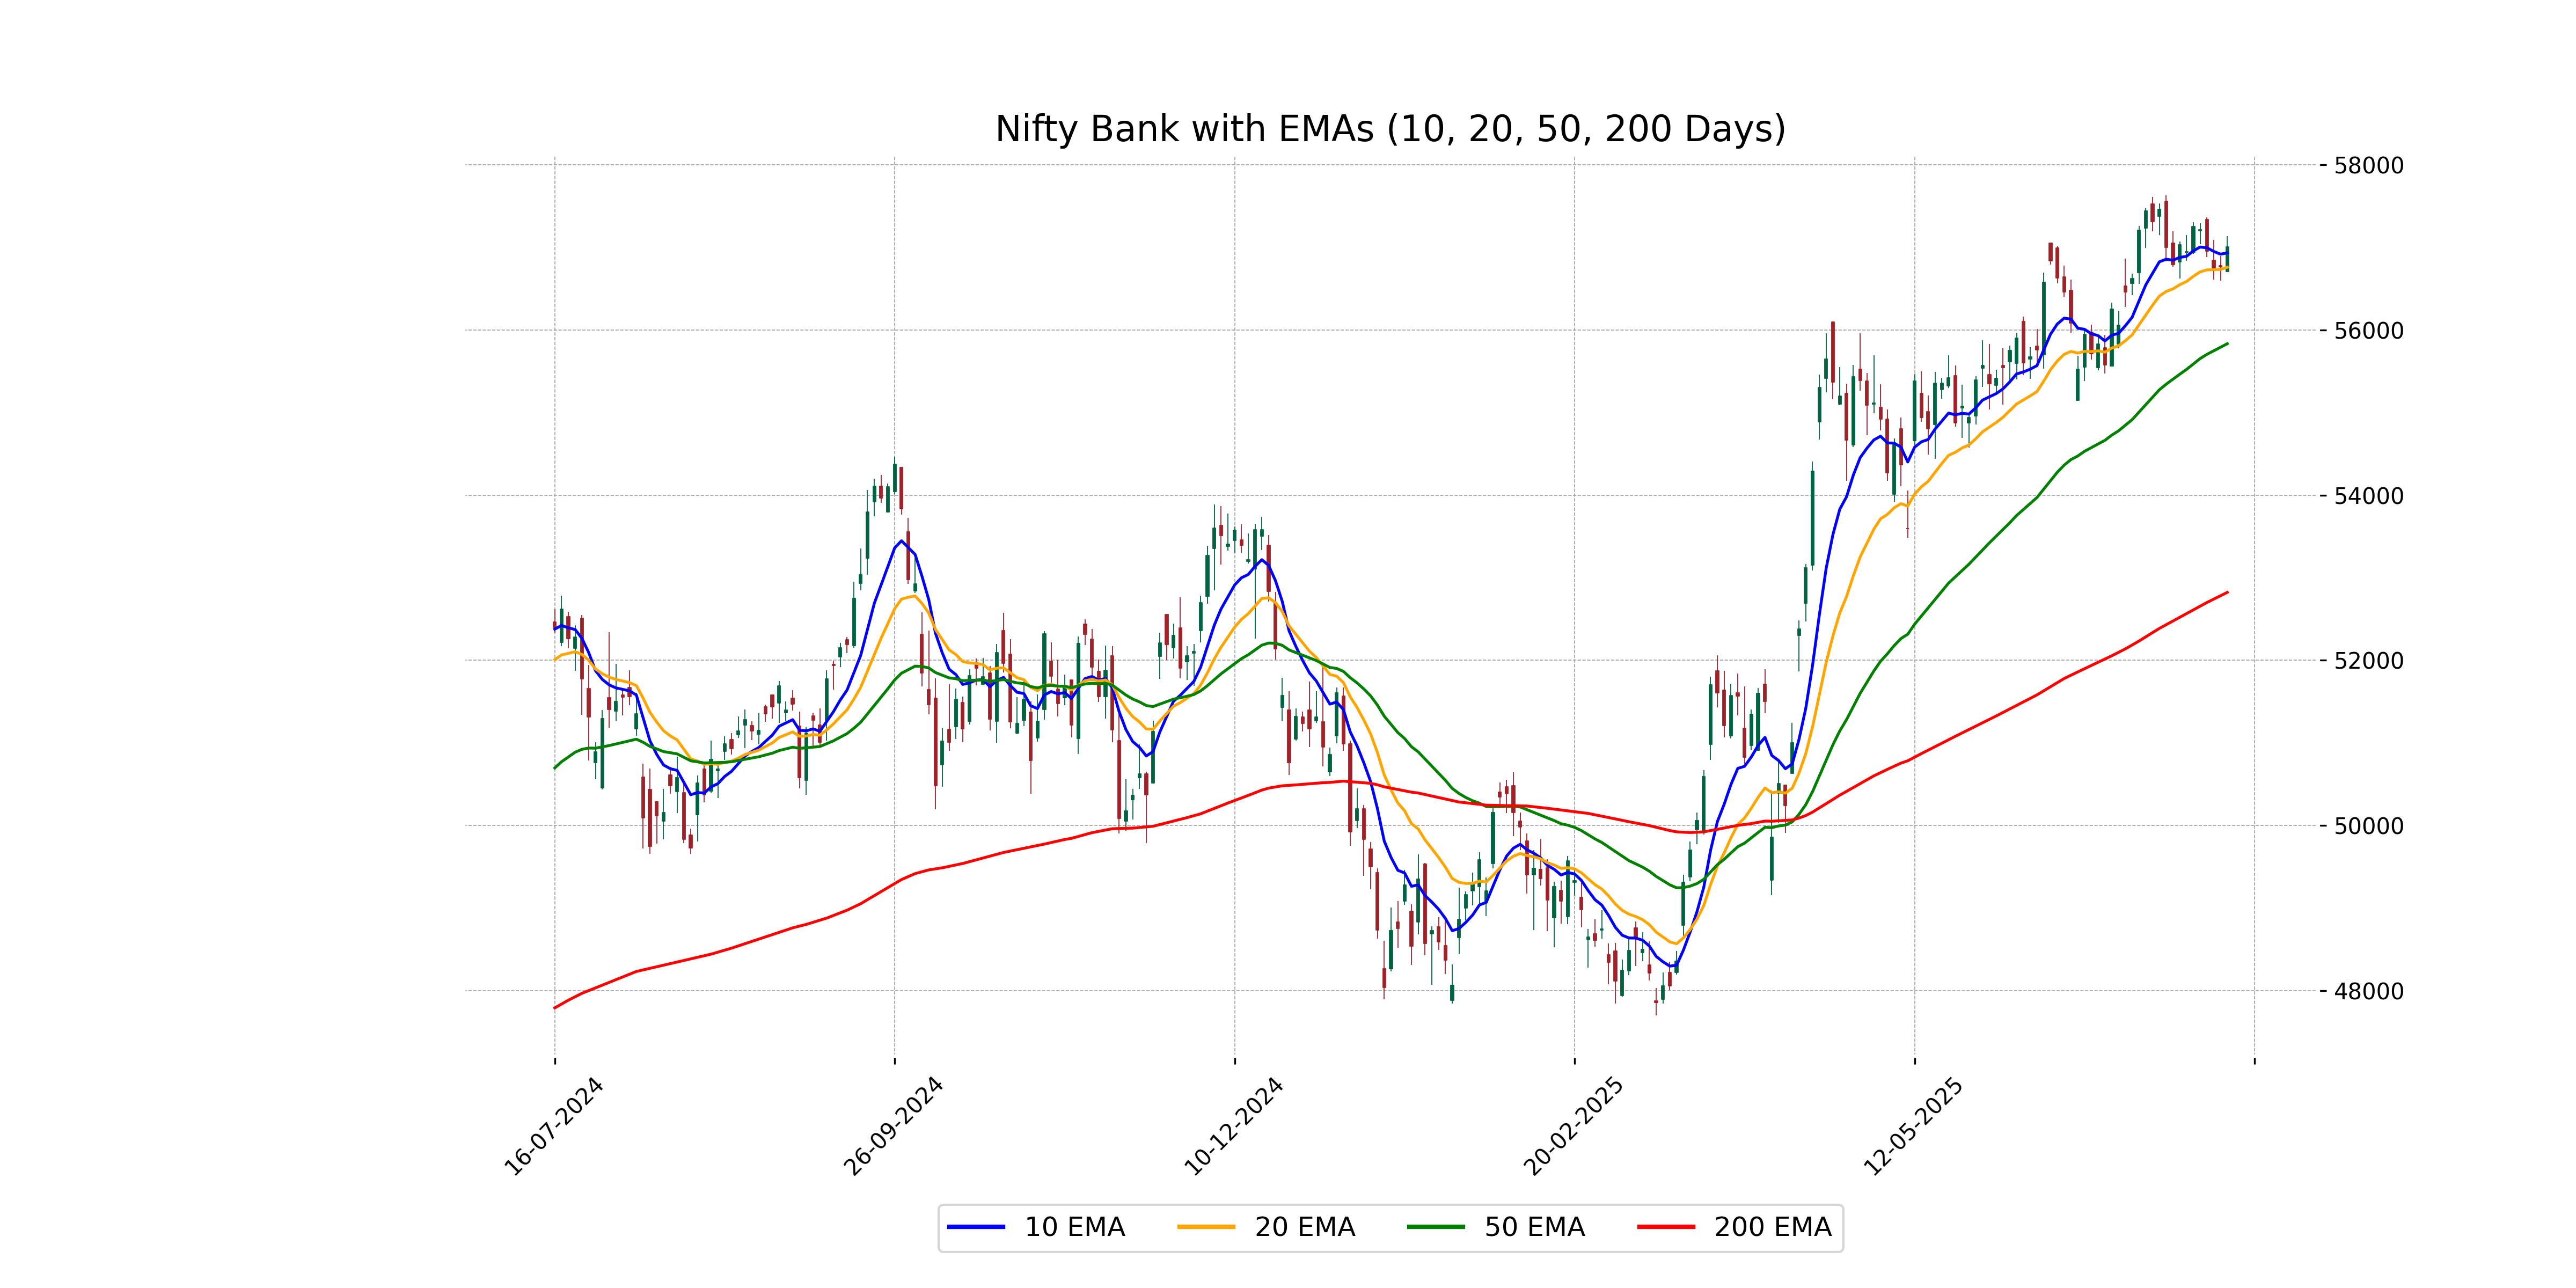
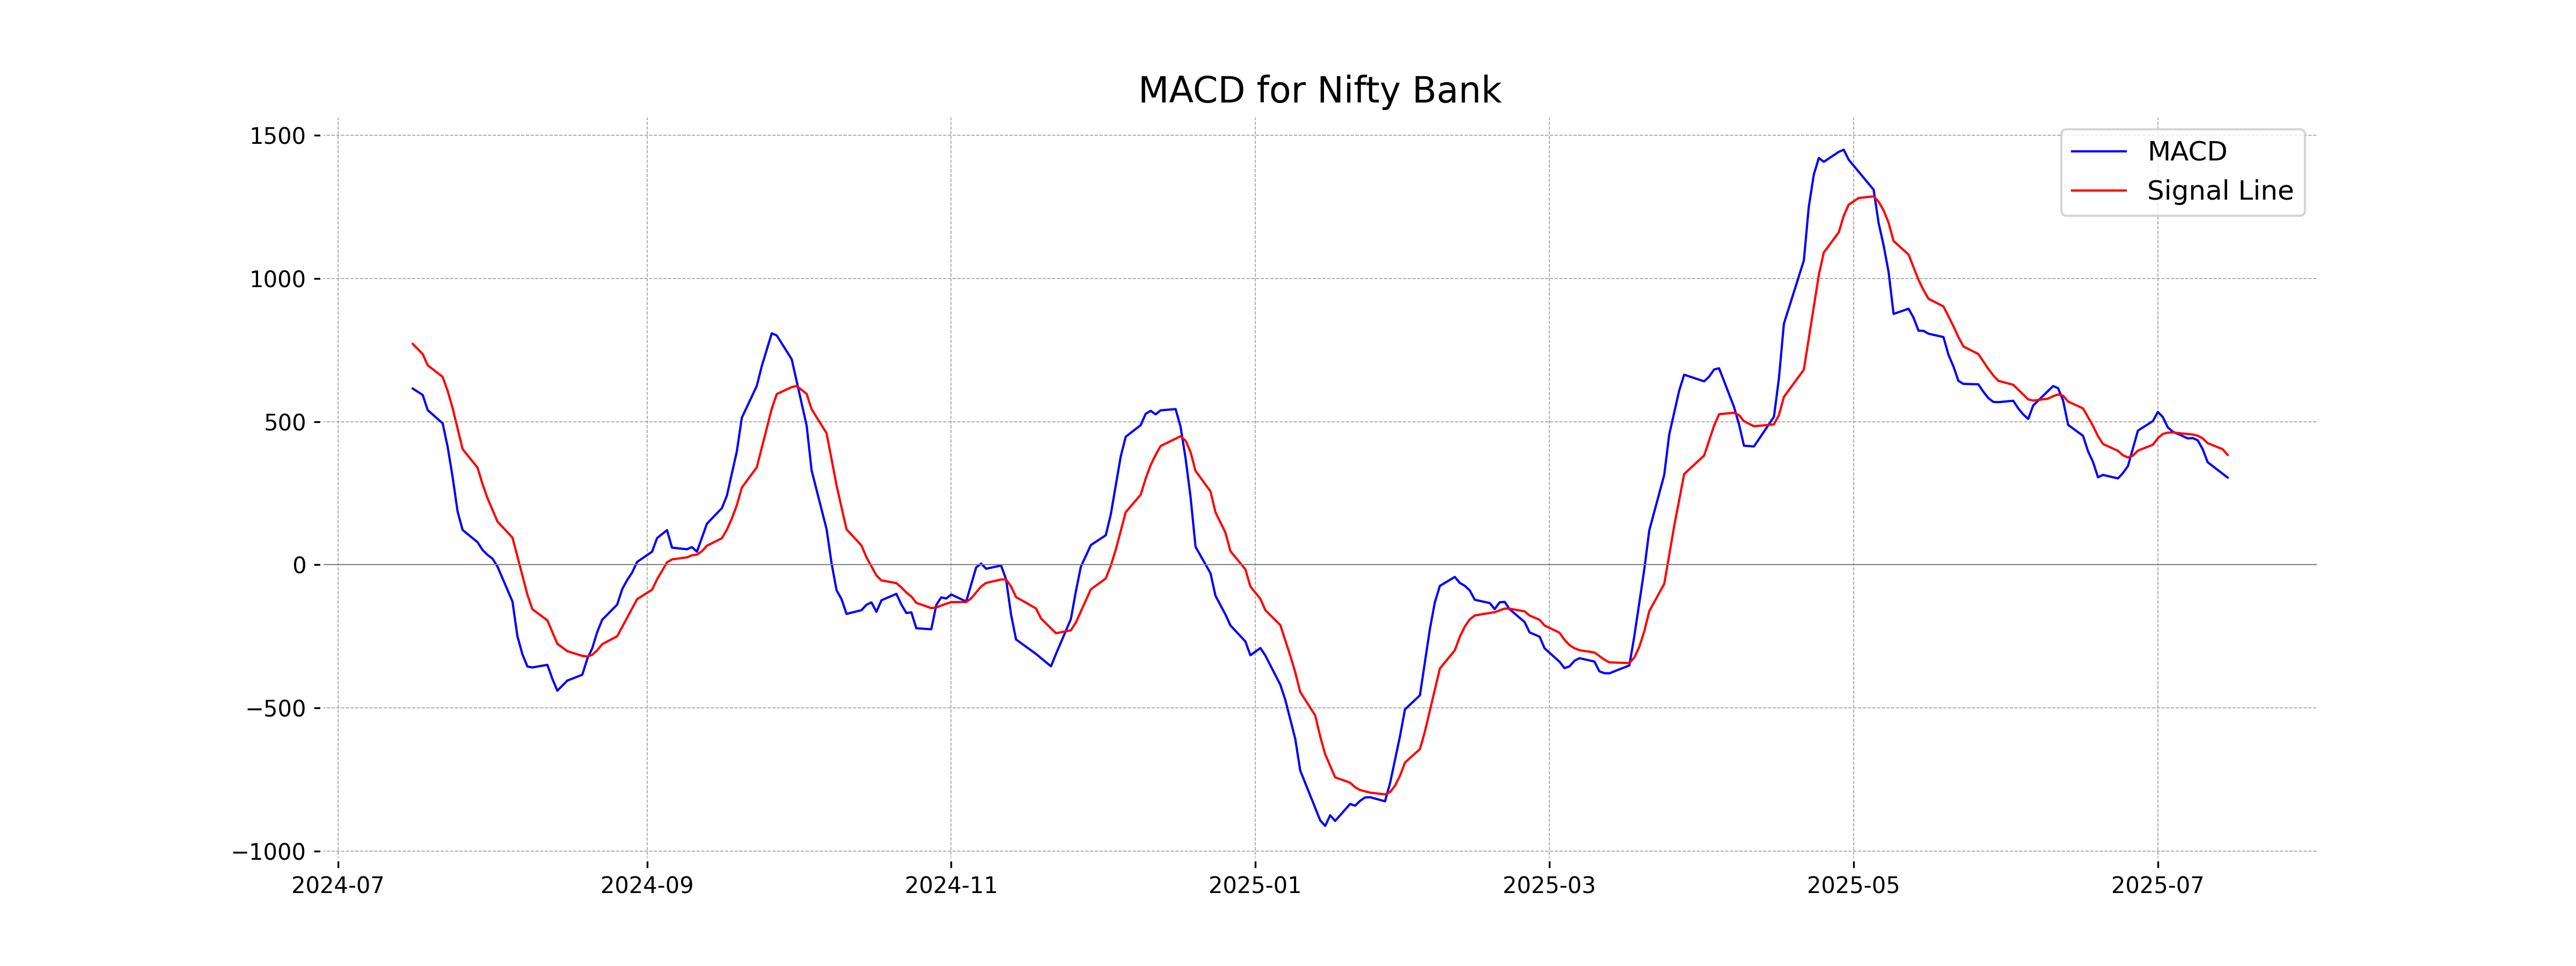
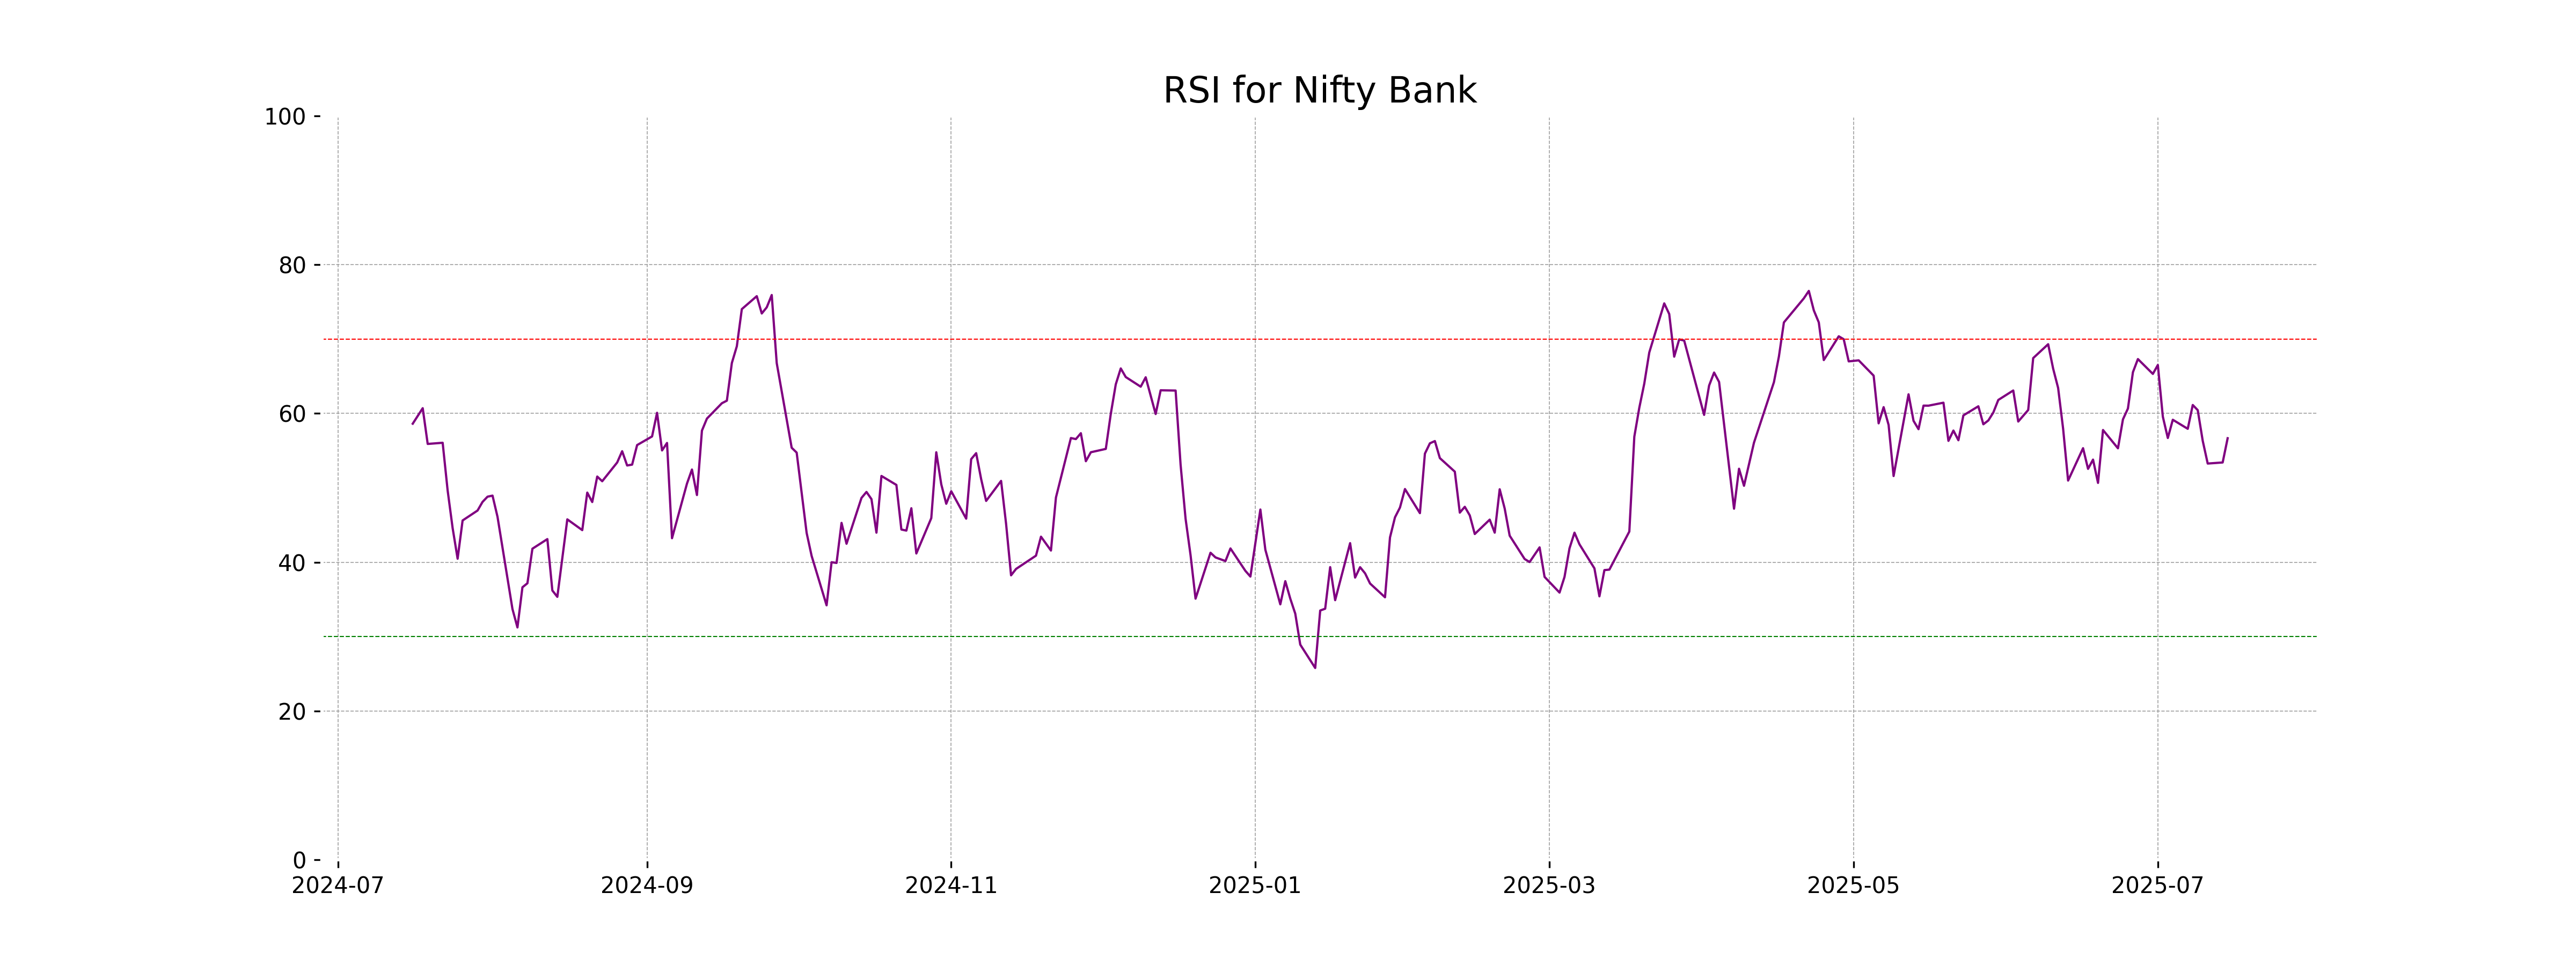
Analysis for Nifty Bank - July 15, 2025

Nifty Bank opened at 56709.20 and closed at 57006.65, reflecting a gain of 0.43% from the previous close of 56765.35, with a points change of 241.30. The 50-day EMA is 55834.22, and the 200-day EMA is 52823.09, indicating a bullish trend. The RSI value of 56.67 suggests moderately positive momentum.
Relationship with Key Moving Averages
Nifty Bank closed at 57006.65, which is above both the 50-day EMA of 55834.22 and the 200-day EMA of 52823.09, indicating strong bullish momentum. It is also slightly above the 10-day EMA of 56934.17 and the 20-day EMA of 56759.90, suggesting short-term strength.
Moving Averages Trend (MACD)
The MACD value for Nifty Bank is 304.59, which is below the MACD Signal value of 383.80. This suggests a potential bearish momentum in the short term, indicating that the stock might experience further downward movement unless a reversal occurs.
RSI Analysis
### RSI Analysis for Nifty Bank The RSI (Relative Strength Index) for Nifty Bank is 56.67, which suggests that the stock is in a neutral state. It is neither overbought nor oversold, indicating a balanced momentum at this time. A value close to 70 would indicate overbought conditions, while a value near 30 would suggest oversold conditions.
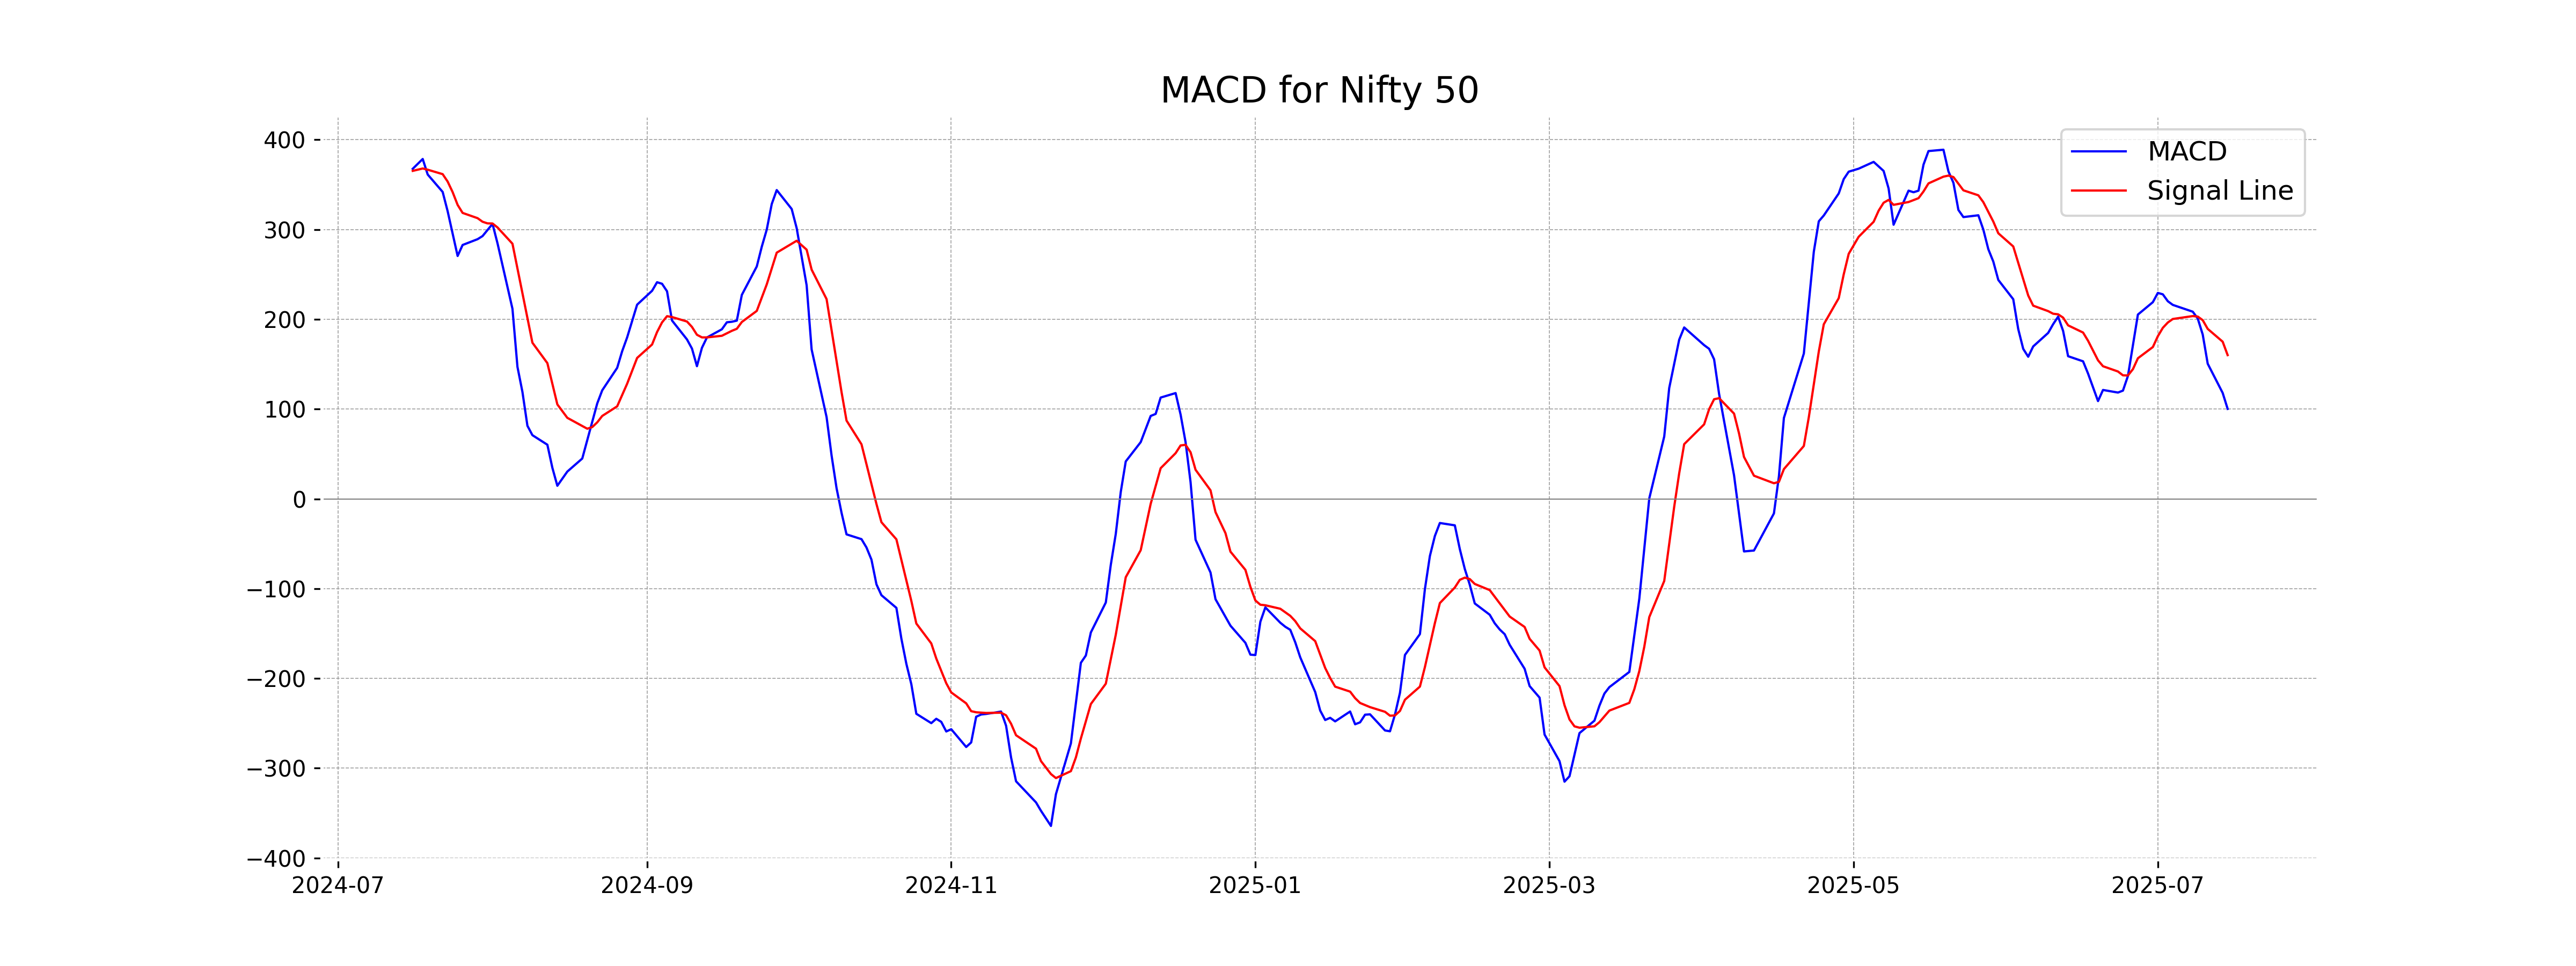
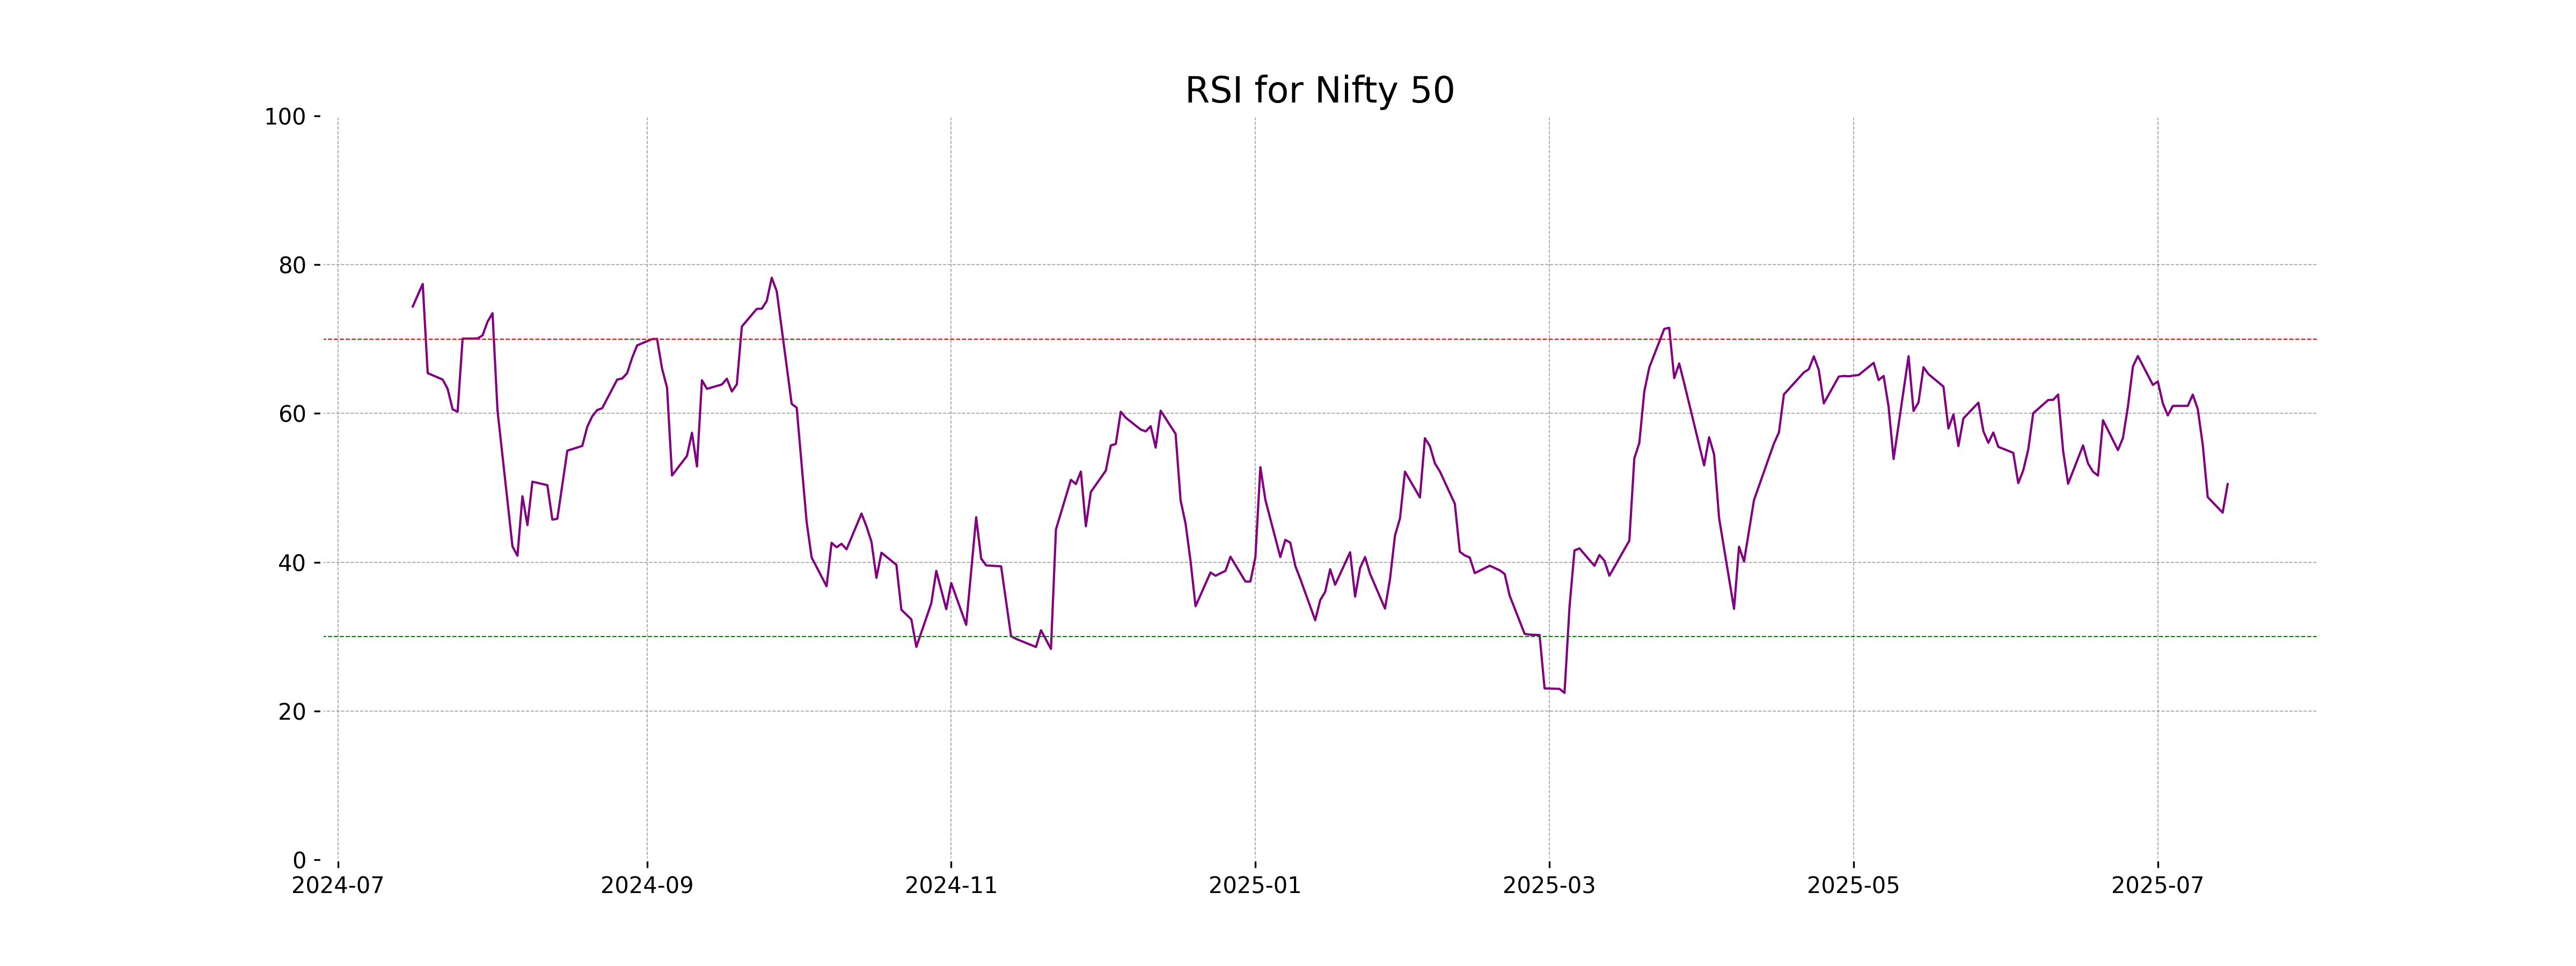
Analysis for Nifty 50 - July 15, 2025
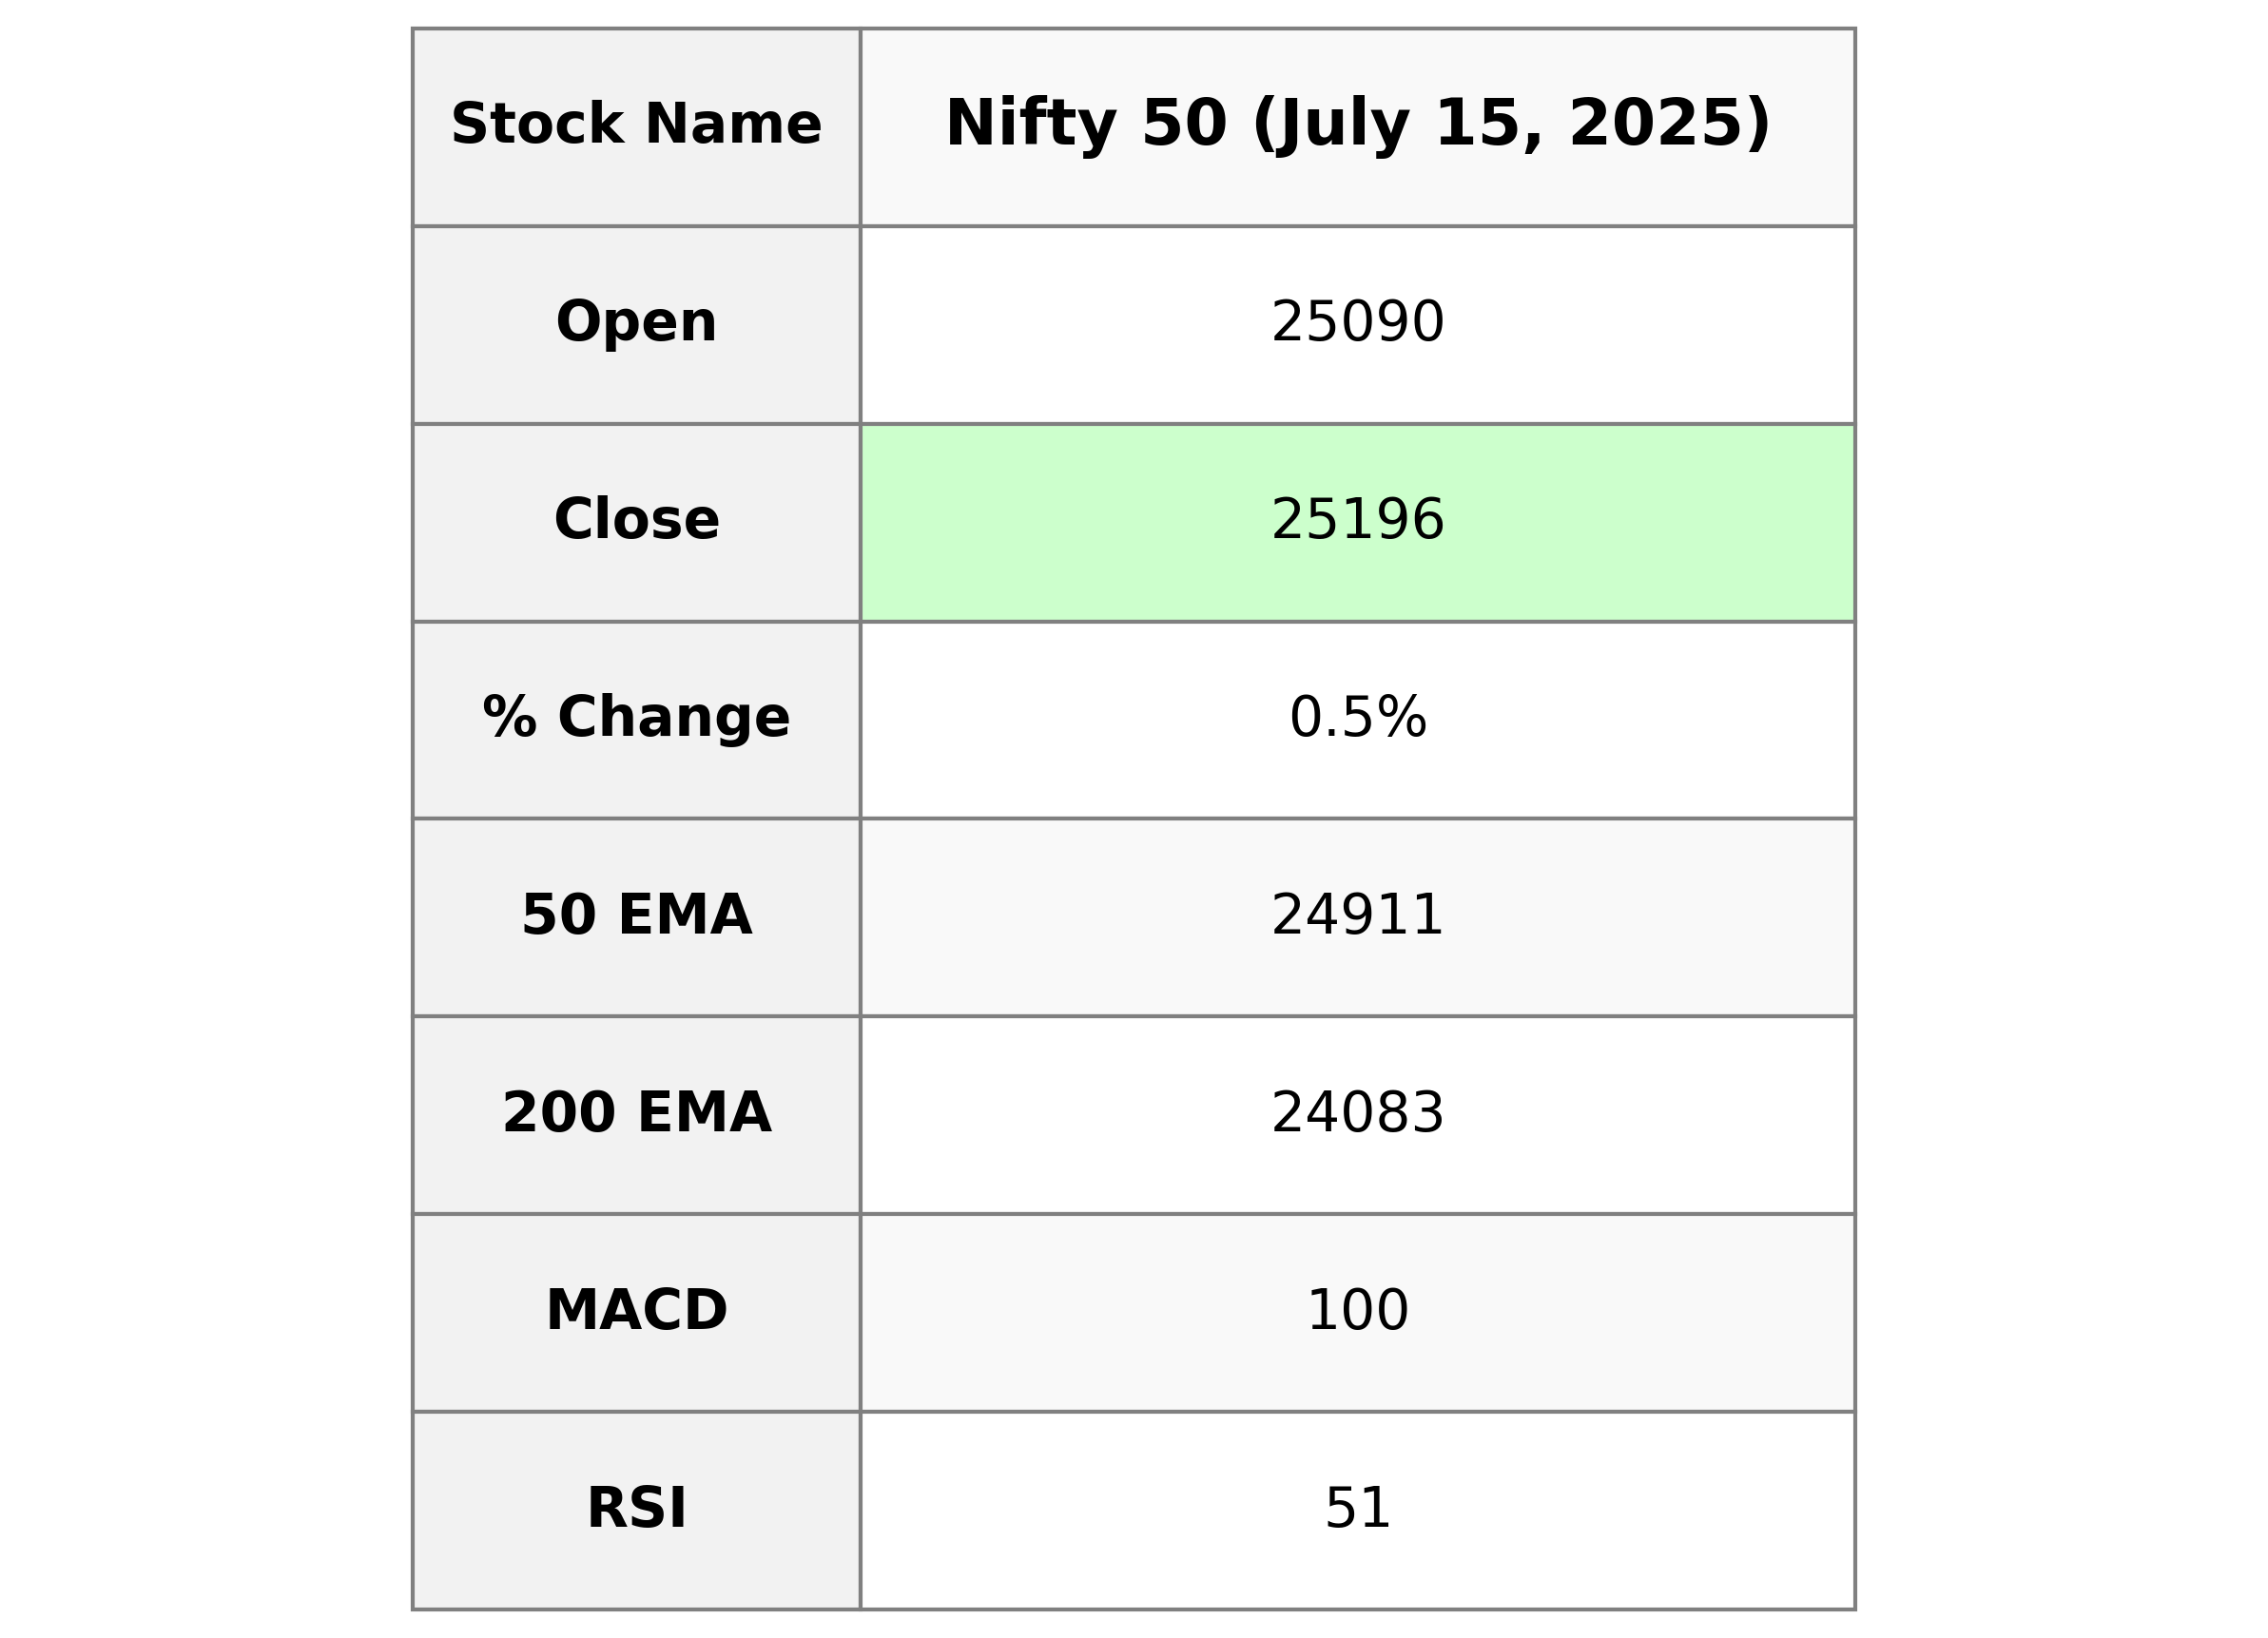
Nifty 50 opened at 25089.5 and closed slightly higher at 25195.8, showing a percentage change of 0.45% with a points increase of 113.5. The index traded within a range with a high of 25245.2 and a low of 25088.4. The relative strength index (RSI) is around 50.50, indicating neutral momentum, while the moving average convergence divergence (MACD) is below the signal line, suggesting potential bearish momentum.
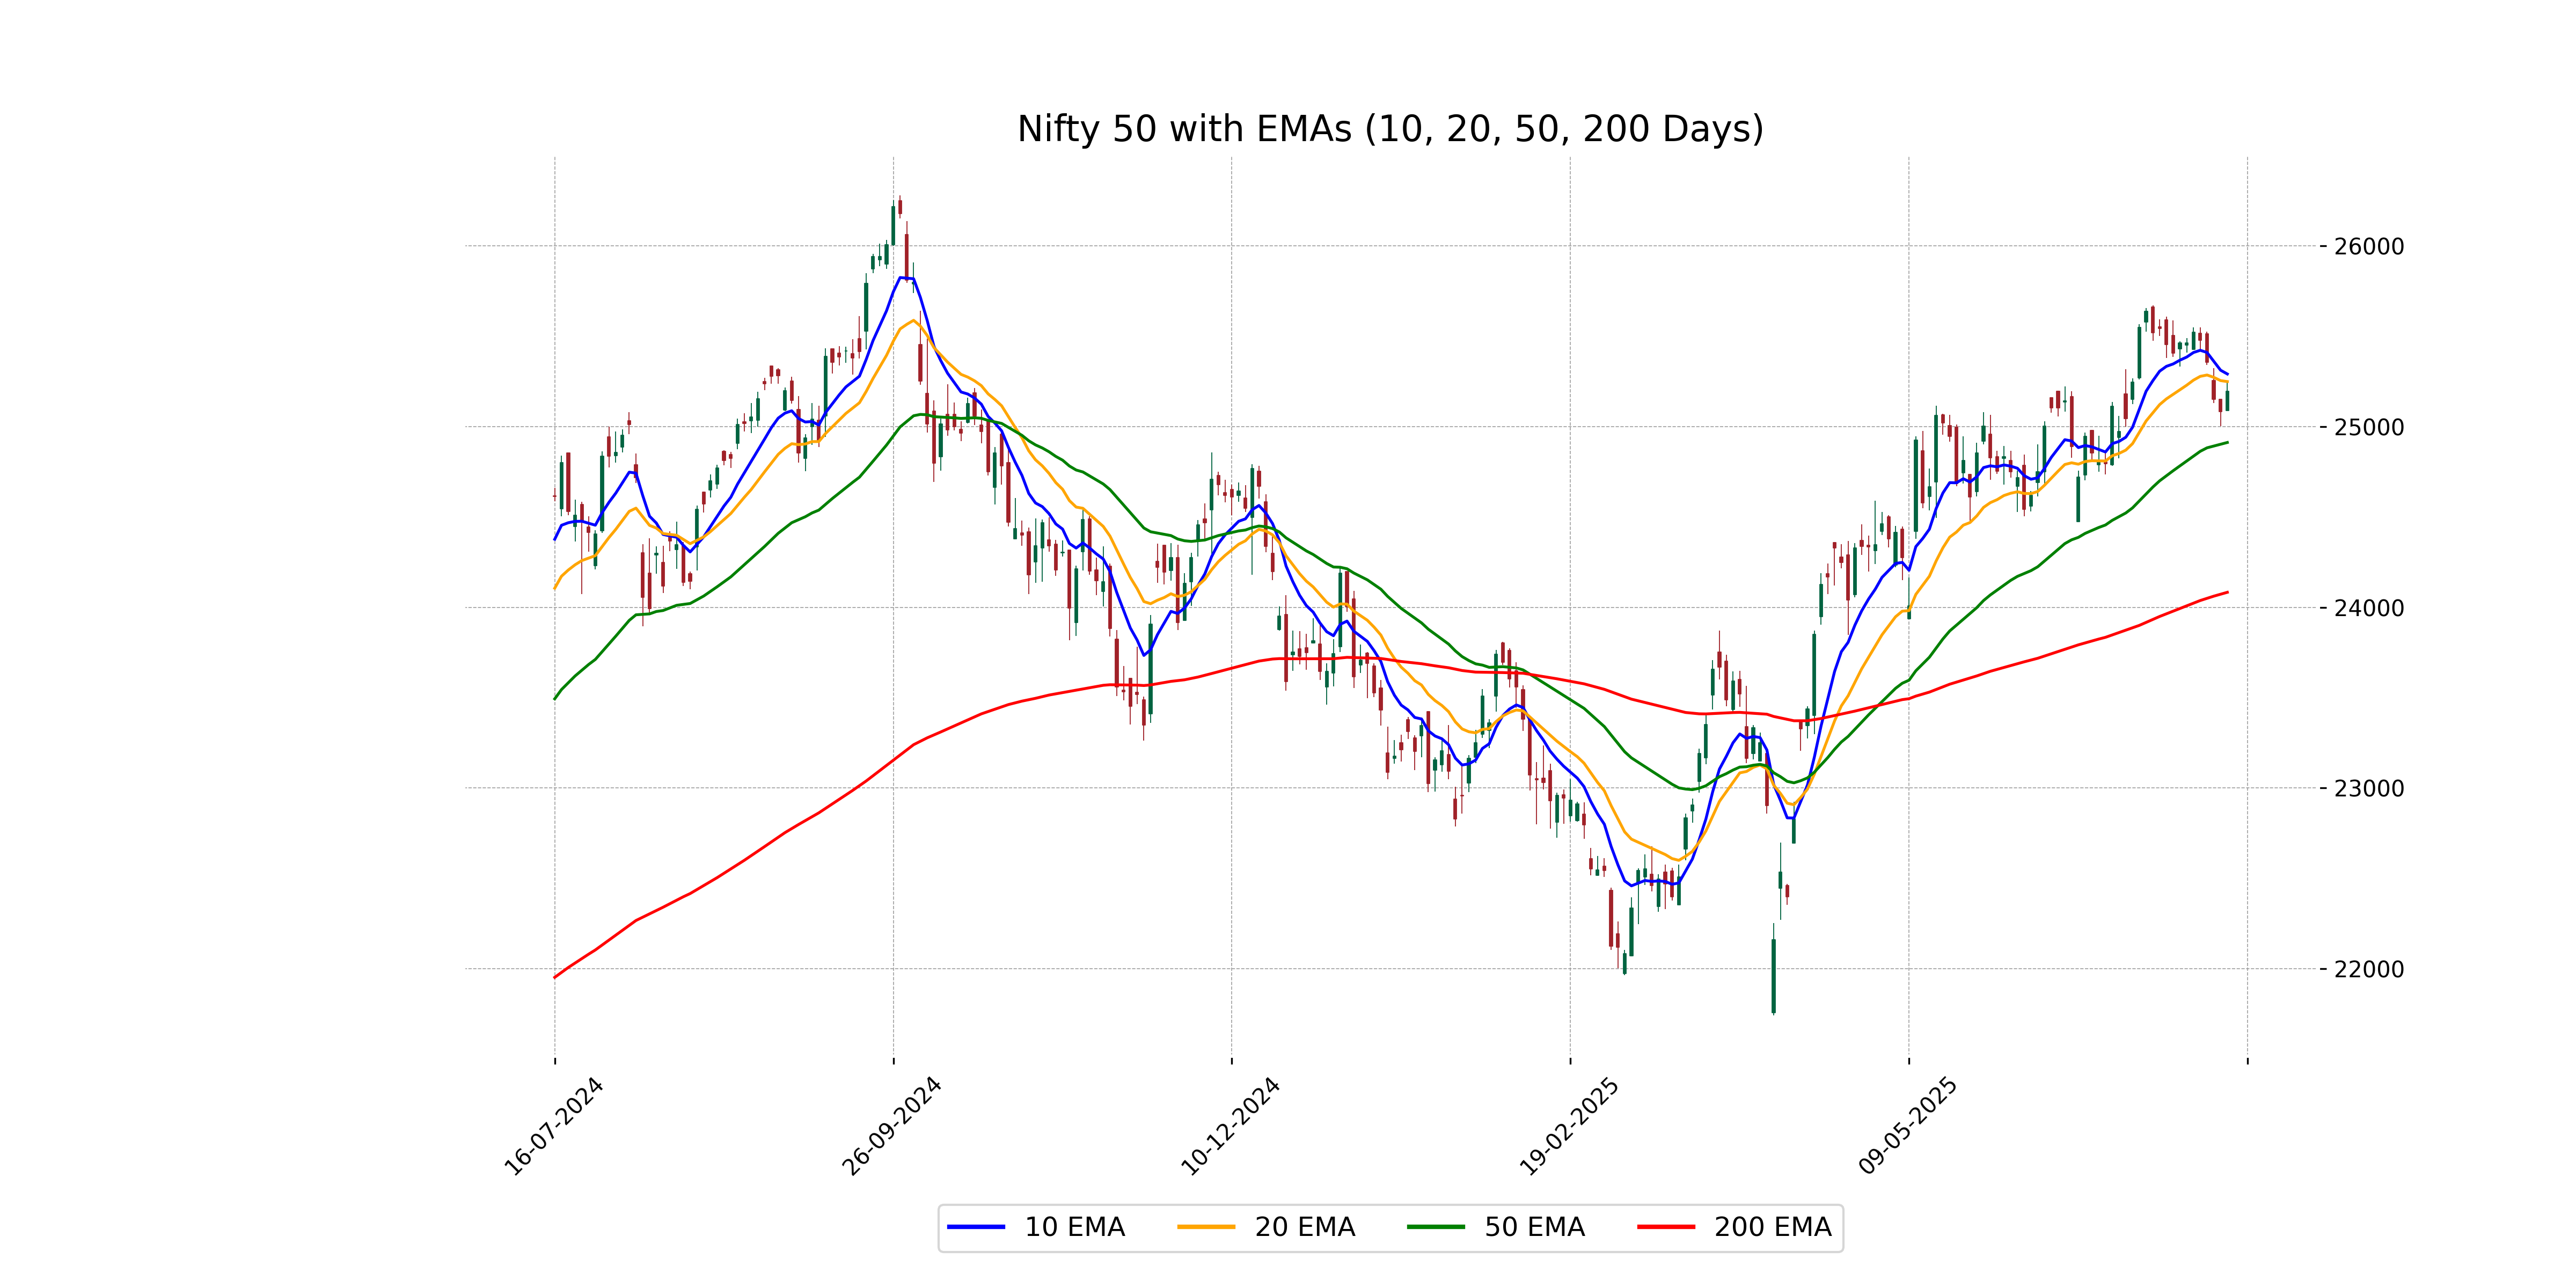
Relationship with Key Moving Averages
Based on the data, Nifty 50 closed at 25195.80, which is above its 50 EMA of 24911.47 and 200 EMA of 24082.78. This indicates a bullish trend relative to these key moving averages. However, it is slightly below its 10 EMA of 25290.26 and 20 EMA of 25248.24, suggesting a short-term bearish sentiment.
Moving Averages Trend (MACD)
The MACD for Nifty 50 is below its signal line, indicating a potential bearish signal as the MACD is 100.22 while the signal line is higher at 160.12. This suggests a possible upcoming decline or a slowdown in upward momentum unless the MACD line crosses above the signal line.
RSI Analysis
The RSI for Nifty 50 is approximately 50.50, suggesting that the index is in a neutral state without being in overbought or oversold conditions. An RSI close to 50 typically indicates a balance between bullish and bearish momentum.
Up Next

Indian stock market sector-wise performance today - July 15, 2025

Step-by-step guide to apply for a mortgage loan online with minimal documentation

Honda Activa 6G: Everything You Need to Know Before Buying

How much does a ULIP plan really cost? A break-down of all charges

Centre plans to borrow Rs 8.20 lakh cr from market in first half of FY27

Reliance denies buying Iranian oil amid US sanctions waiver

More videos

Premium petrol price up Rs 2, industrial diesel up Rs 22; no change in normal petrol, diesel rates

India's GDP expected to register over 8 pc growth in Sep-Dec: Report

Govt announces seven measures to help boost exports

RBI keeps interest rates on hold after US trade deal boosts outlook

RBI proposes to compensate customers up to Rs 25,000 loss due to fraud

RBI raises GDP growth projection of Q1, Q2 of FY27

RBI pauses rate cuts, retains interest rate at 5.25 pc

Rupee jumps 122 paise to close at 90.27 against US dollar on India-US trade deal

Stock markets cheer India-US trade deal: Sensex, Nifty surge 2.5 pc

UPI transactions hit record high of Rs 230 lakh crore in 2025-26 till Dec: Govt