


Highlights
- Sensex falls 705 points, closing at 80,080
- Nifty IT drops 1.59%, leads sectoral losses
- Nifty Auto stays above key moving averages
Latest news

Dell Launches New Pro Precision AI Workstations In India, Introduces Deskside Agentic AI Platform

Oppo Enco Air5 Review: Incredible Value at ₹3,099

Samsung Galaxy A27 5G Goes On Sale In India With Cashback Offers, Zero Down Payment Schemes
 First Impressions: A Strong Debut For The New 'b' Series")
Nothing Phone (4b) First Impressions: A Strong Debut For The New 'b' Series

Samsung Galaxy A27 Review: A Dependable Mid-Ranger With Few Surprises

Union Finance Minister Nirmala Sitharaman Inaugurates Muzhiyan Kulam, Restored by Lumina Datamatics and Community Stakeholders in Puducherry

"Don't think anyone will be able to break his track record": Annu Kapoor hails Big B's unmatched legacy

Rewriting the Rules of Business Education: Stride School of Business Unveils Its AI-First Campus Infrastructure
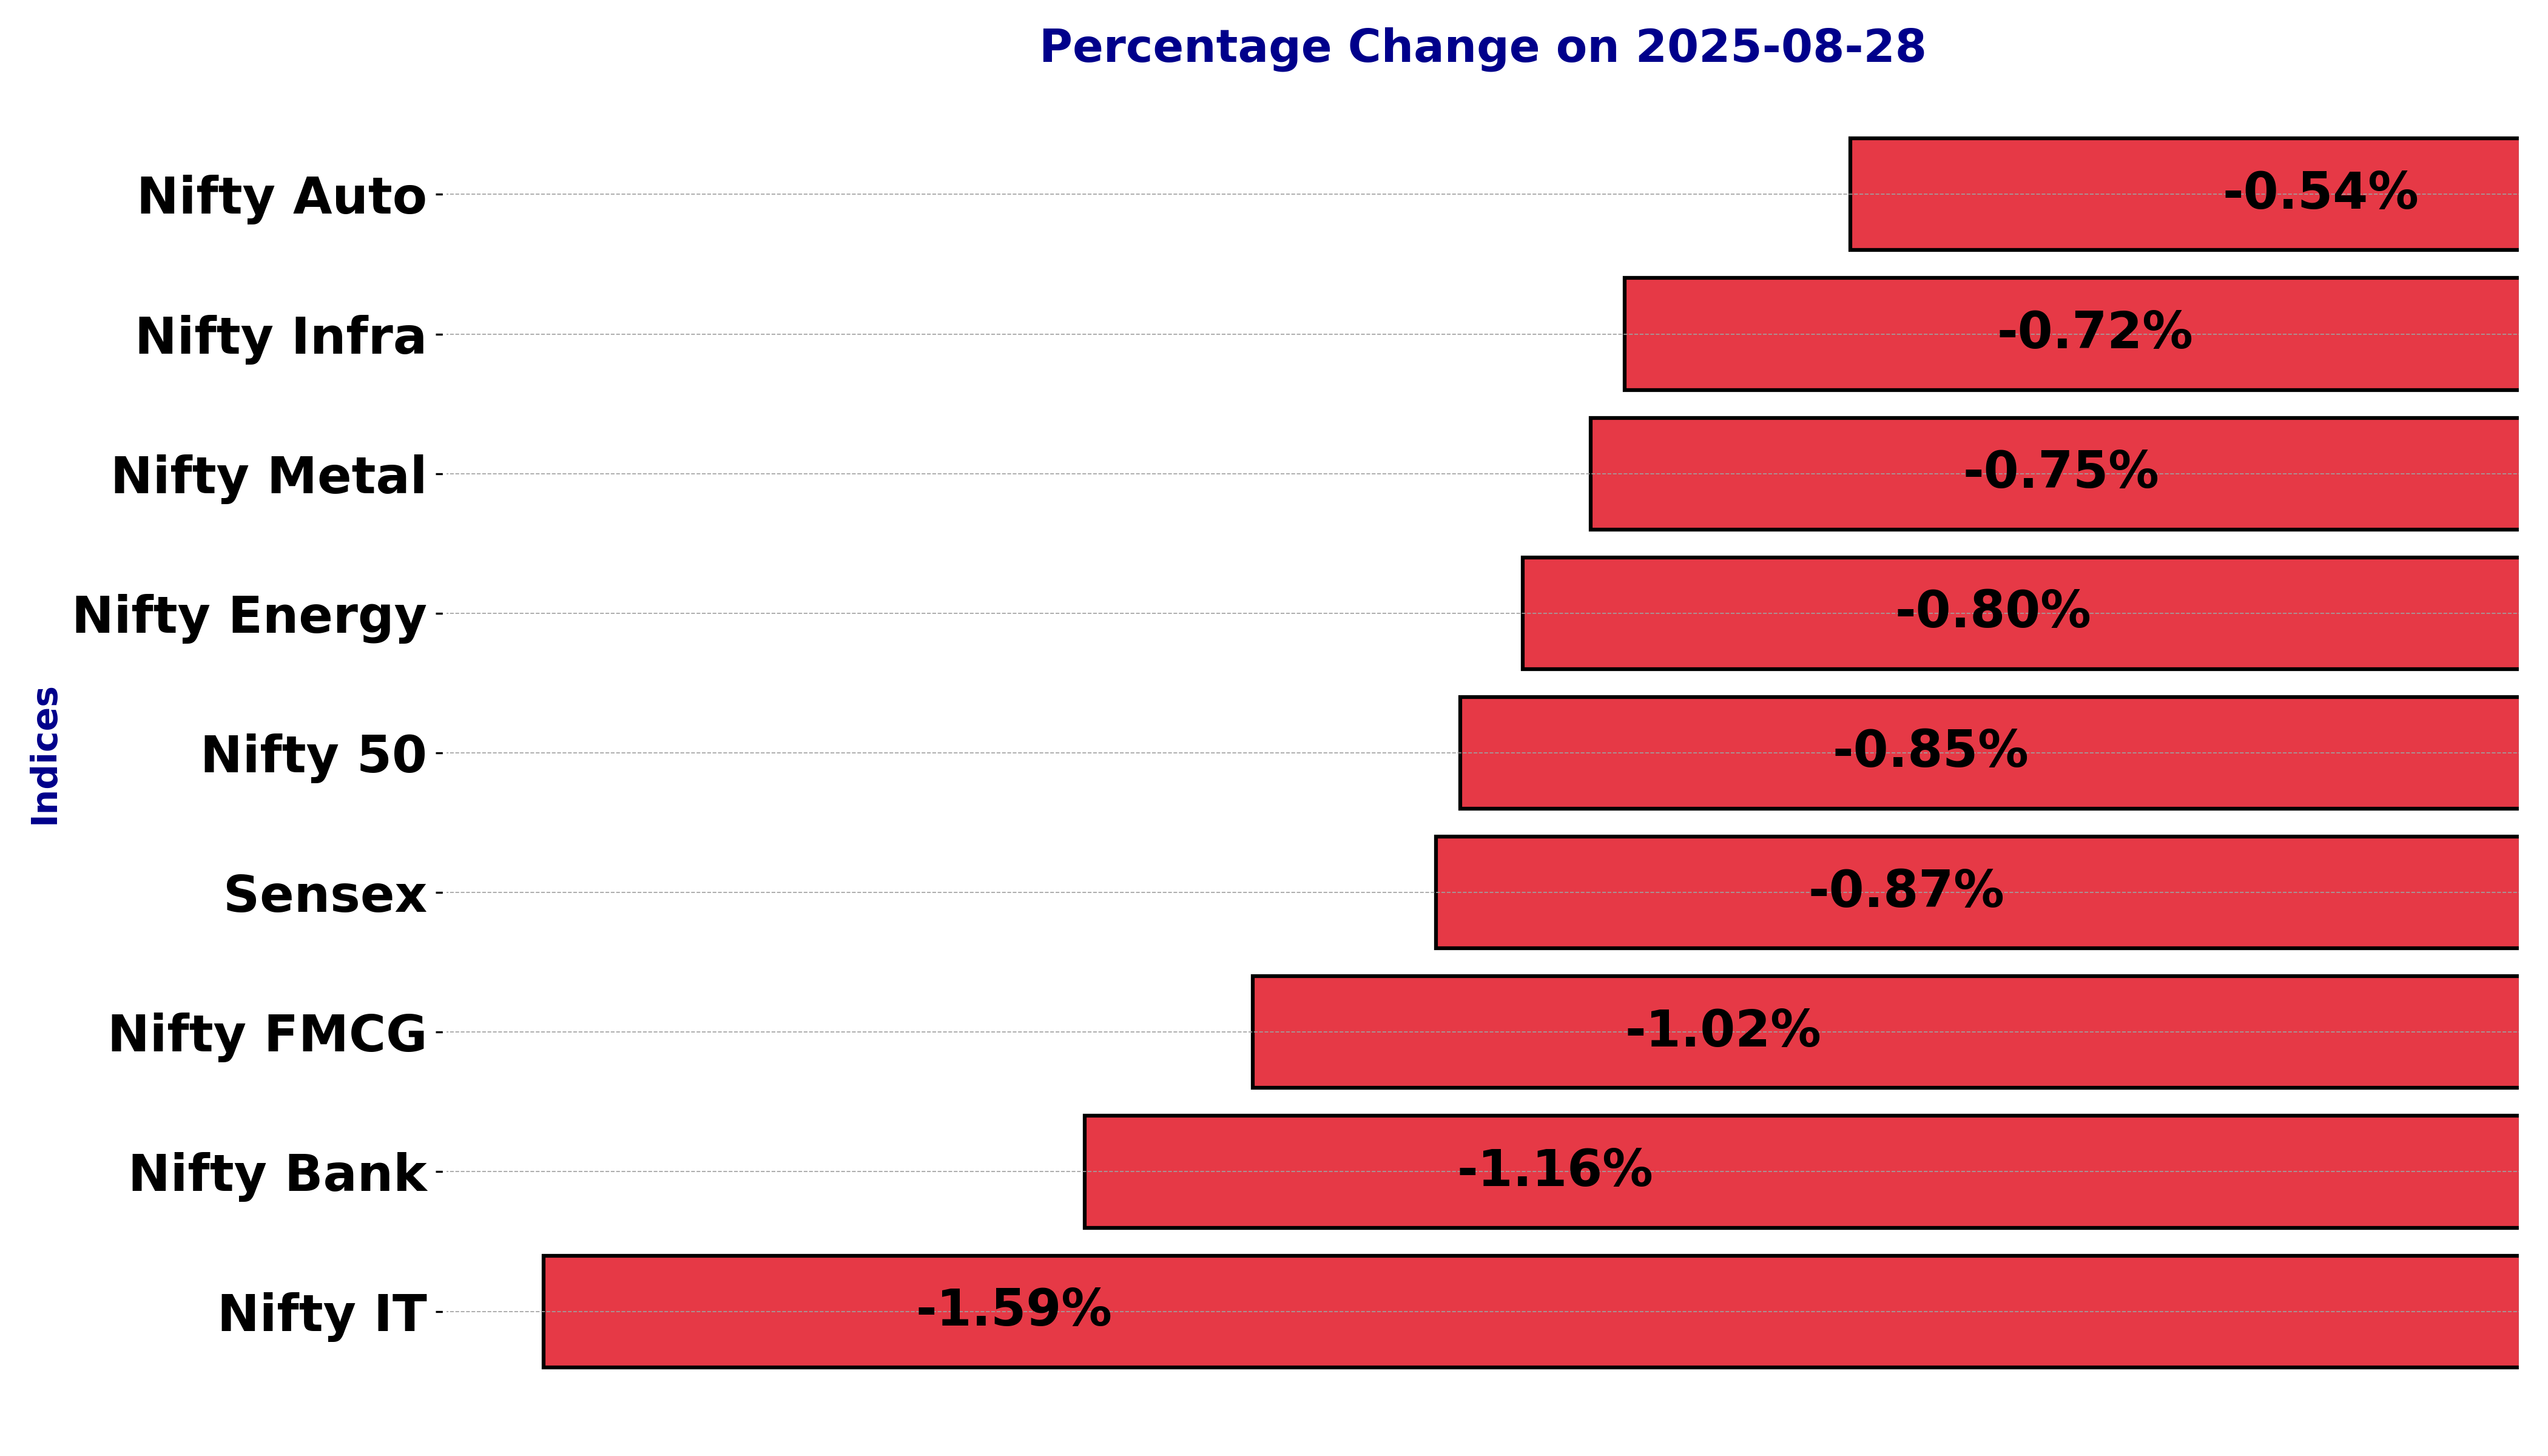
Indian stock market sector-wise performance today - August 28, 2025


The stock market on Thursday (August 26, 2025) witnessed a day of downturn, with several key indices experiencing significant declines.
The Bombay Stock Exchange Sensex saw a drop of approximately 0.87%, closing at 80,080.57.
Meanwhile, the Nifty Auto index observed a decrease of 0.54%, settling at 25,183.5. Among the sectors, Nifty FMCG sector experienced a notable decline of about 1.02%, closing at 55,612.95.
In contrast, Nifty Energy was affected significantly, experiencing an approximate drop of 0.80%, closing at 33,682.85. The Nifty Infra sector also witnessed a decrease of 0.72%, closing at 8,904.7. The most considerable impact, however, was seen in the Nifty IT sector, which experienced a sharp decline of nearly 1.59%, closing at 35,488.75.
This decline can be attributed to broader market sentiments and sector-specific challenges, such as global tech demand fluctuations and investor concerns over valuation pressures.
Nifty Metal also faced a decline, dropping by 0.75% to end at 9,210.5, while the Nifty Bank saw a fall of about 1.16%, closing at 53,820.35. Similarly, the Nifty 50 index also faced a downturn, slipping by 0.85%, closing at 24,500.90.
The broader market sentiment on this day was influenced by several factors, including global cues and investor reactions to ongoing economic data releases.
The decline in the Nifty IT sector was particularly influential, as it is a significant component of the overall market, and its downturn reflects larger investor concerns in the tech space.
Overall, the market atmosphere was bearish, driven by investor caution and sector-specific challenges, particularly affecting the IT and Energy sectors. Market participants are keenly observing upcoming economic indicators and global events to gauge future market directions.
Analysis for Sensex - August 28, 2025

Sensex Performance Summary The Sensex opened at 80,754.66 but closed lower at 80,080.57, marking a decline of 0.87% or 705.97 points from its previous close of 80,786.54. Technical indicators suggest a bearish trend, with an RSI of 39.63 indicating possible oversold conditions and a negative MACD pointing to continued downward momentum. The 50-day EMA suggests the index is trading below its medium-term moving average, while the 200-day EMA indicates it is slightly above the longer-term trend.
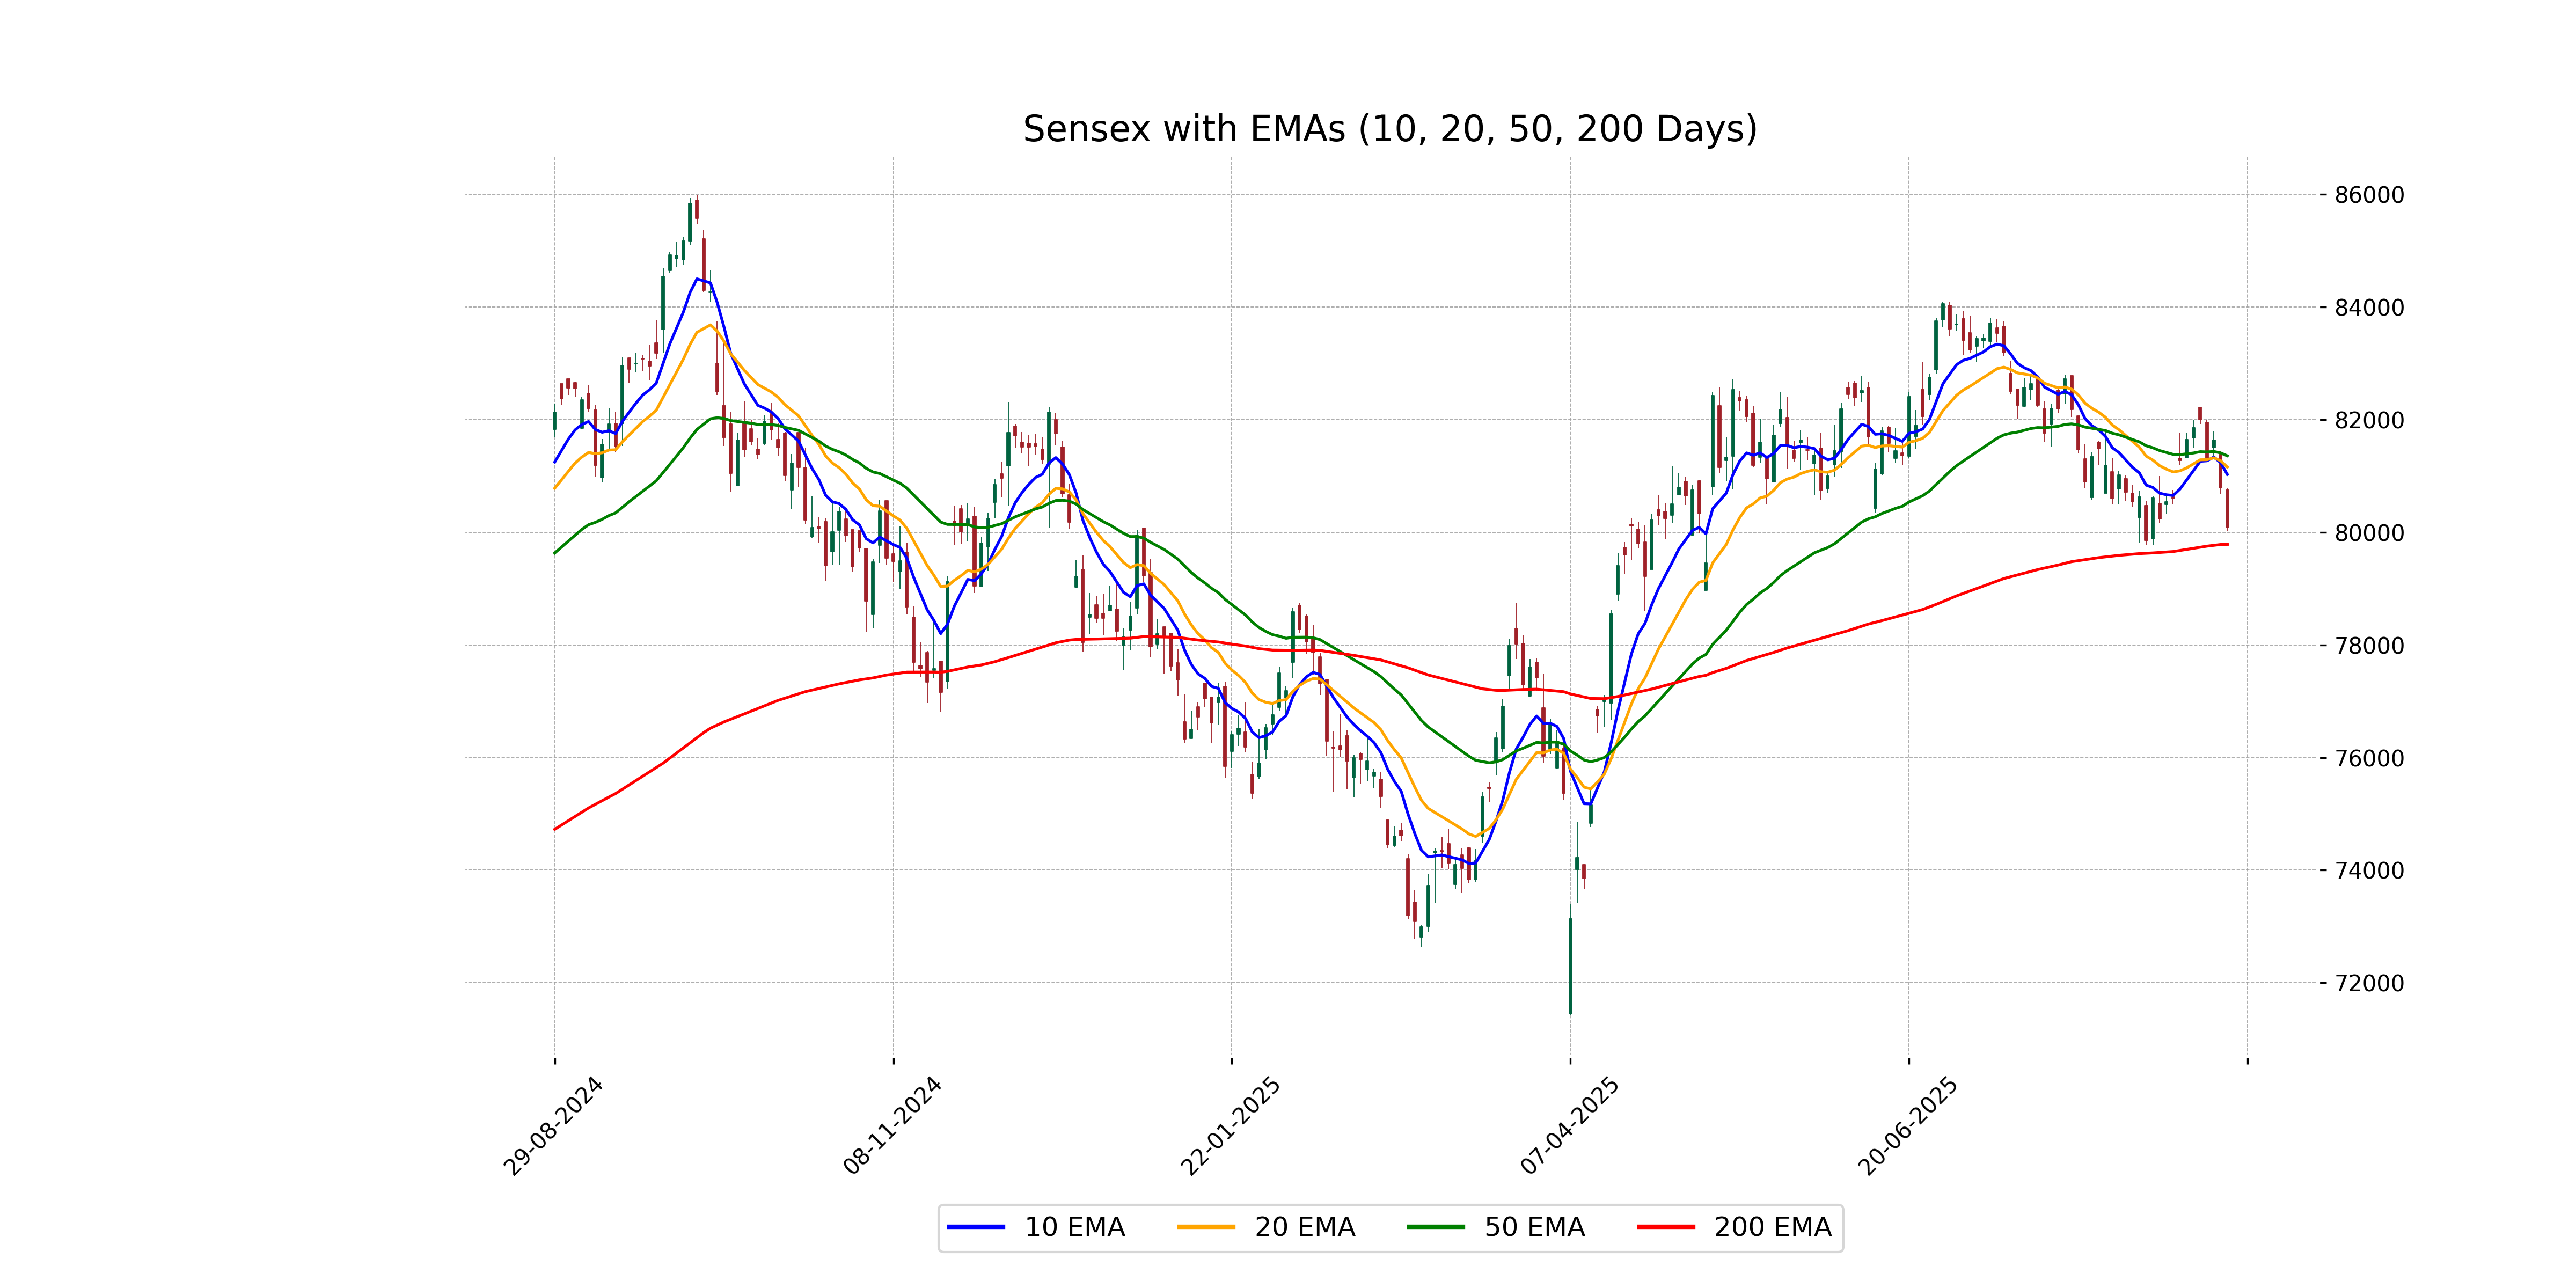
Relationship with Key Moving Averages
The Sensex closed below its 50-day EMA and 10-day EMA, indicating a short-term bearish trend, as well as below the 20-day EMA. However, it remains slightly above the 200-day EMA, suggesting a long-term uptrend might still be intact. The RSI at 39.63 suggests the market is nearing an oversold condition.
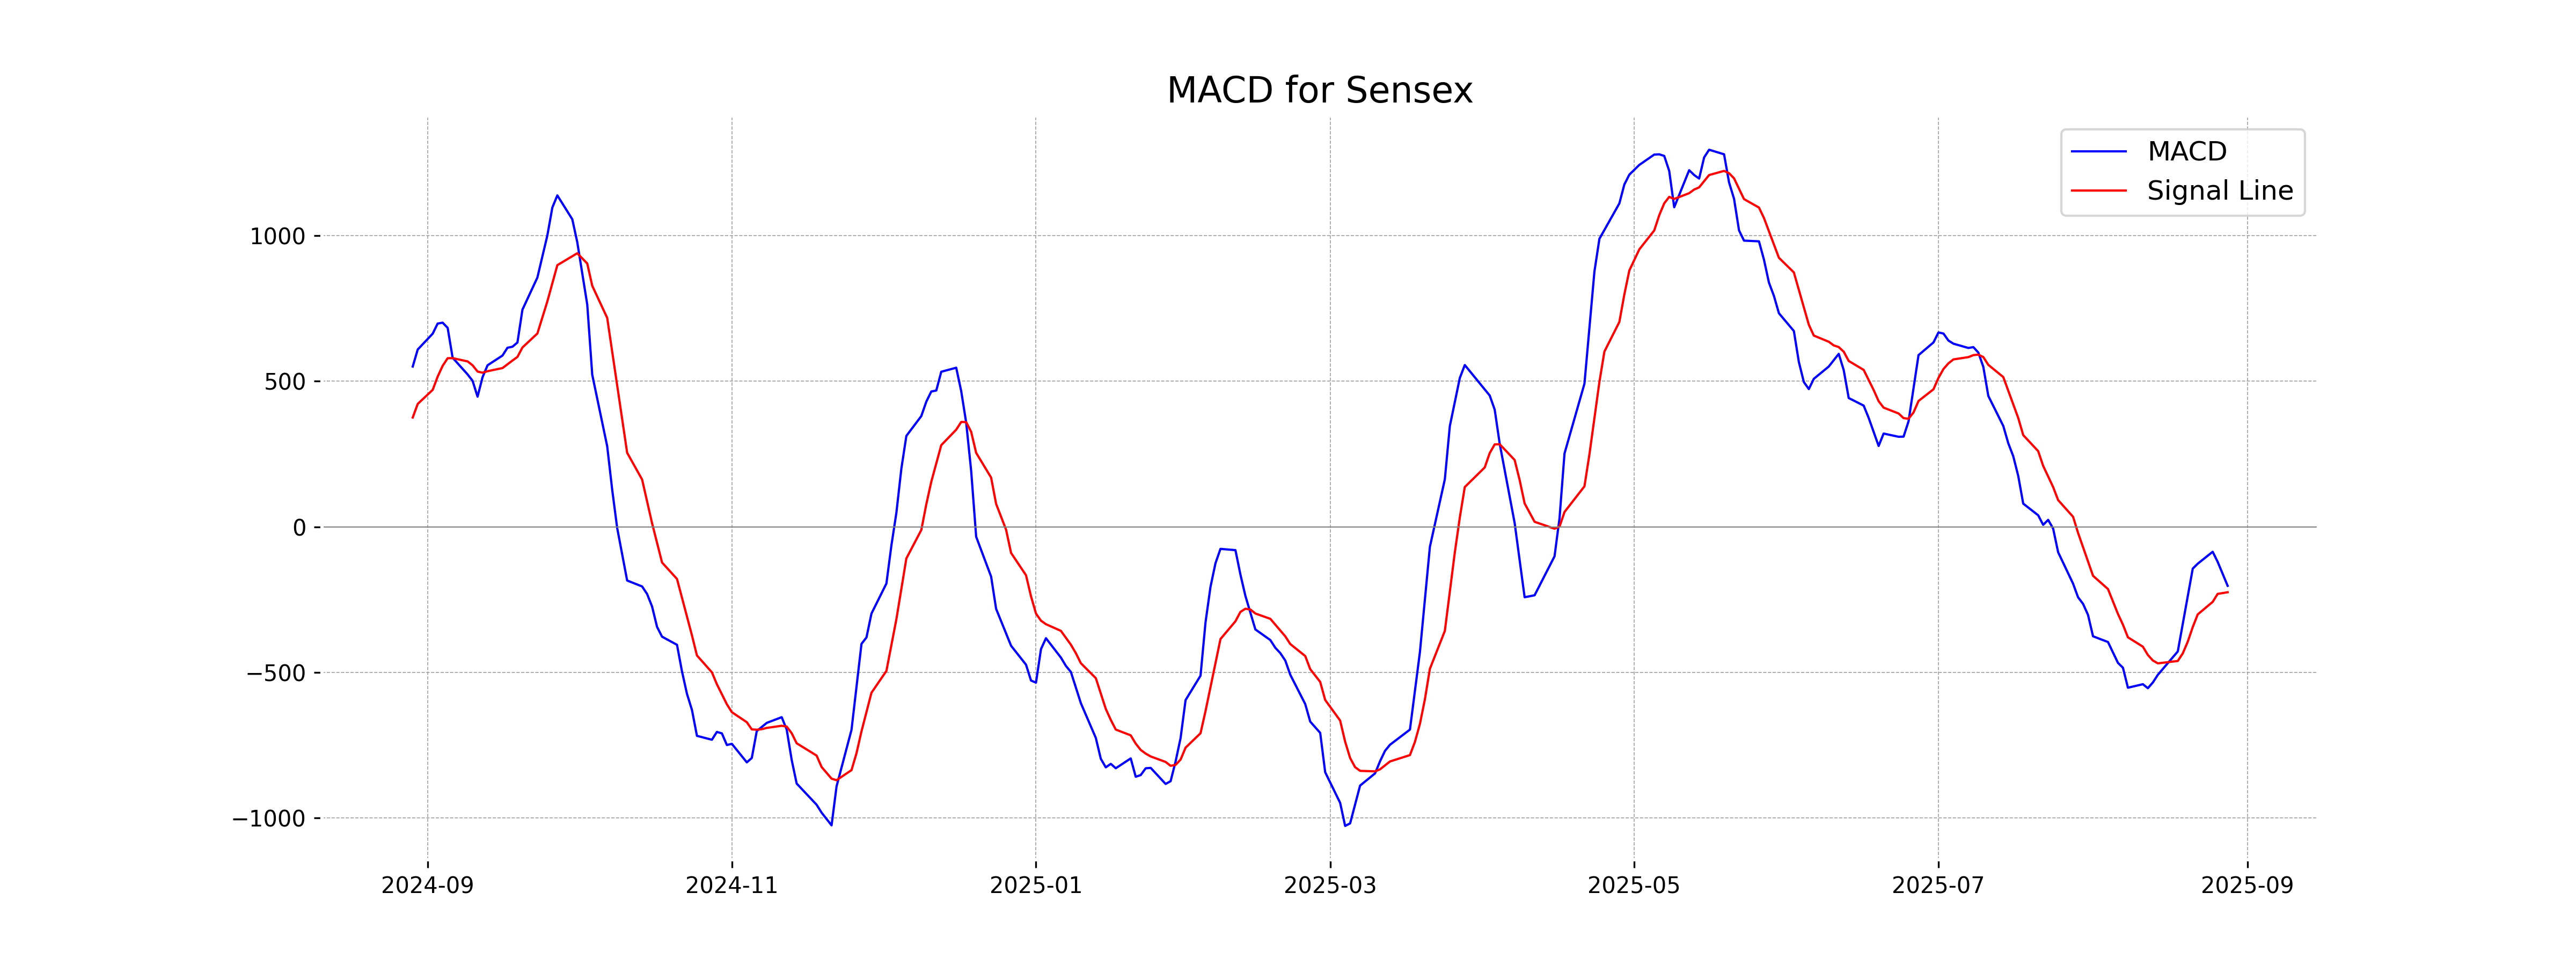
Moving Averages Trend (MACD)
Sure, here is the MACD analysis for Sensex: The MACD for Sensex is -202.69, which is above its signal line of -224.85, suggesting a potential bullish momentum. However, the negative MACD value indicates the overall trend is still bearish.
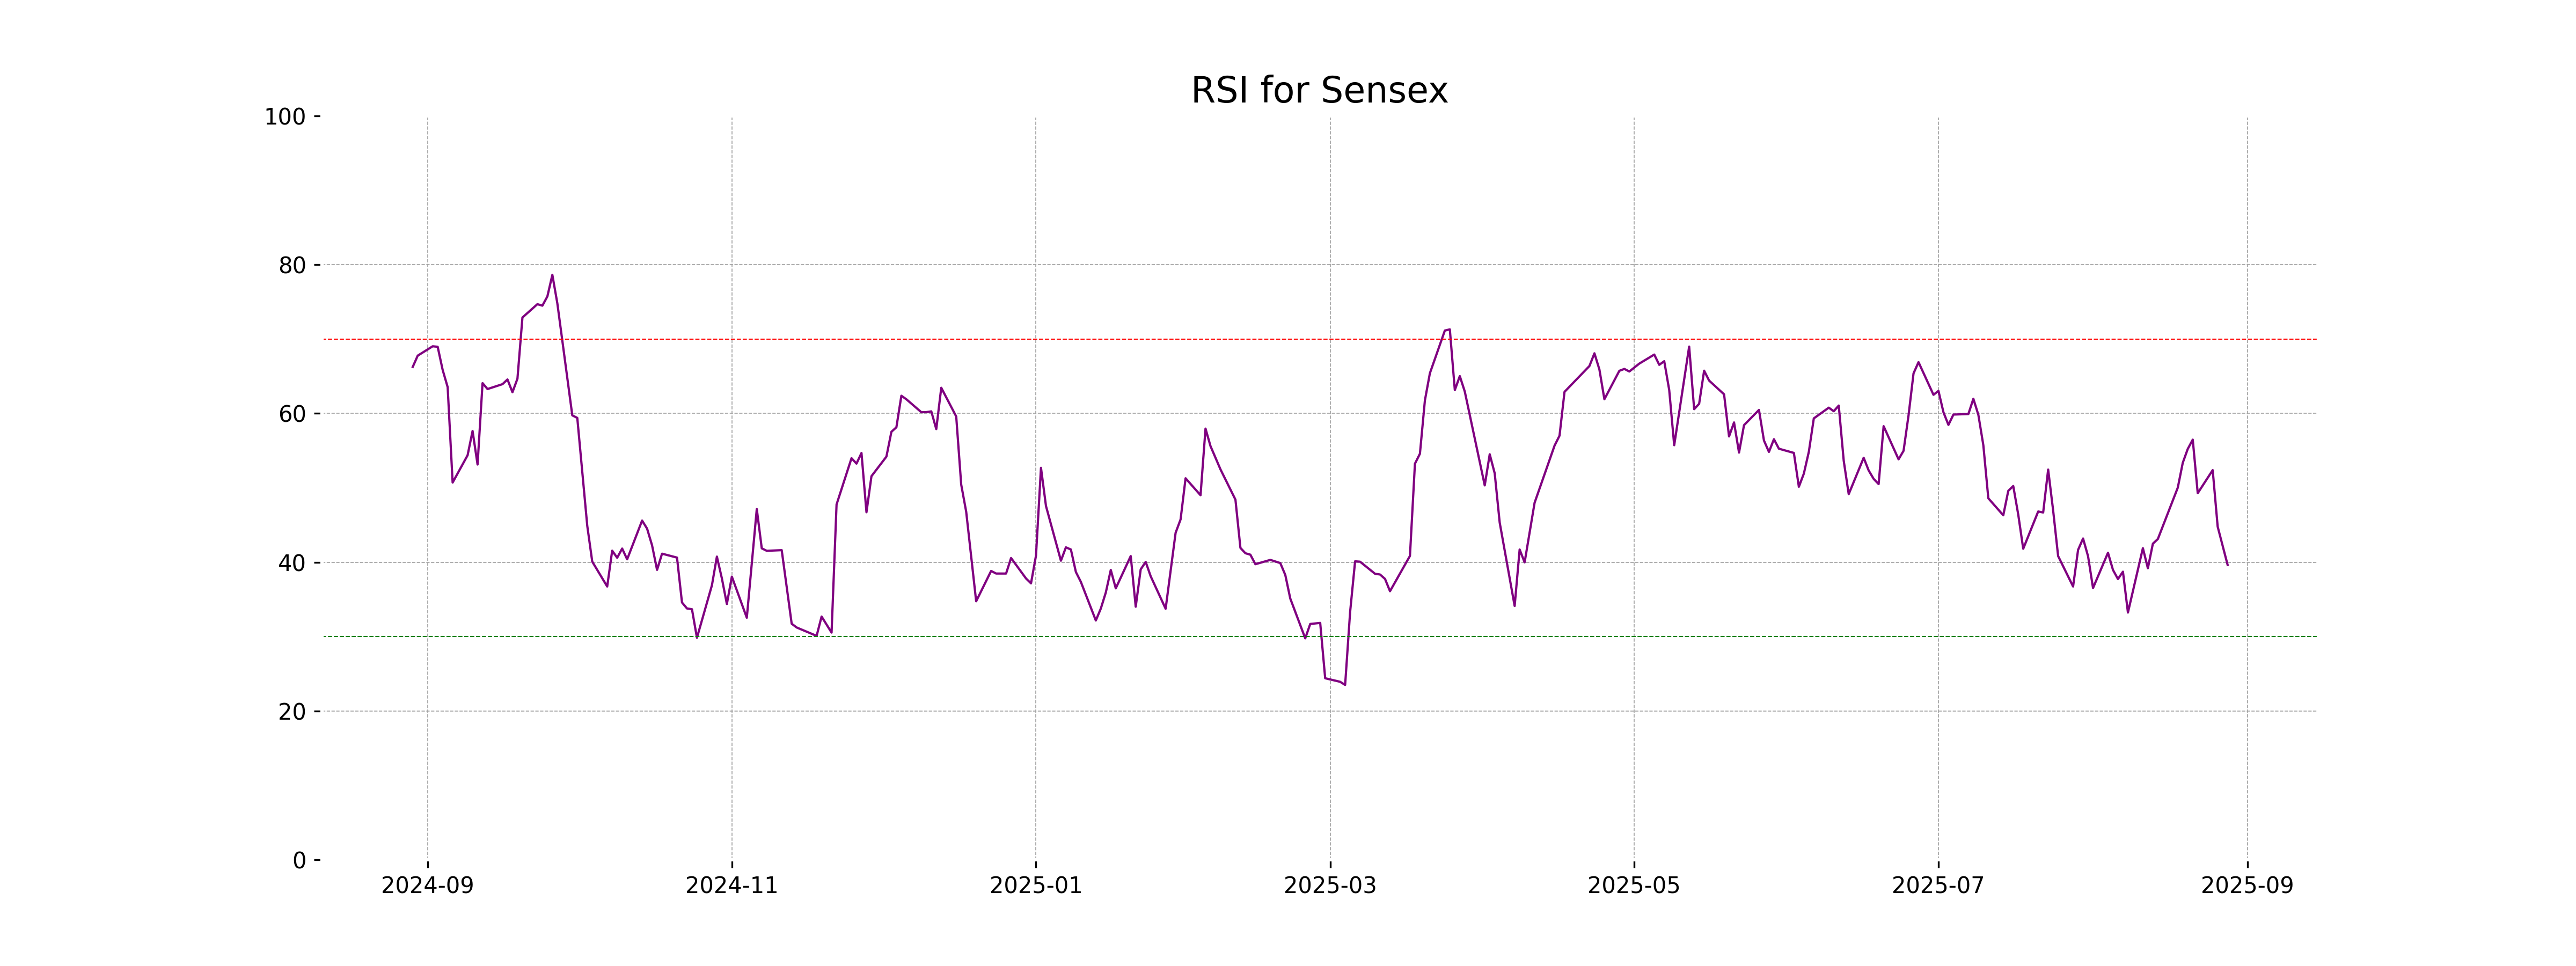
RSI Analysis
Based on the provided data, the Relative Strength Index (RSI) for Sensex is 39.63, which suggests that the index is approaching the oversold territory, as RSI levels below 30 usually indicate that a stock or index may be considered oversold. It implies that the recent selling pressure may be high, potentially leading to a reversal or bounce if the RSI continues to decline further.
Analysis for Nifty Auto - August 28, 2025

Nifty Auto Performance: The Nifty Auto index opened at 25,589.5 and closed slightly lower at 25,183.5, marking a percentage change of -0.54% with a points decrease of 136.8. The index is currently trading above both its 50-day and 200-day Exponential Moving Averages, with an RSI of 64.98 indicating a relatively strong momentum.
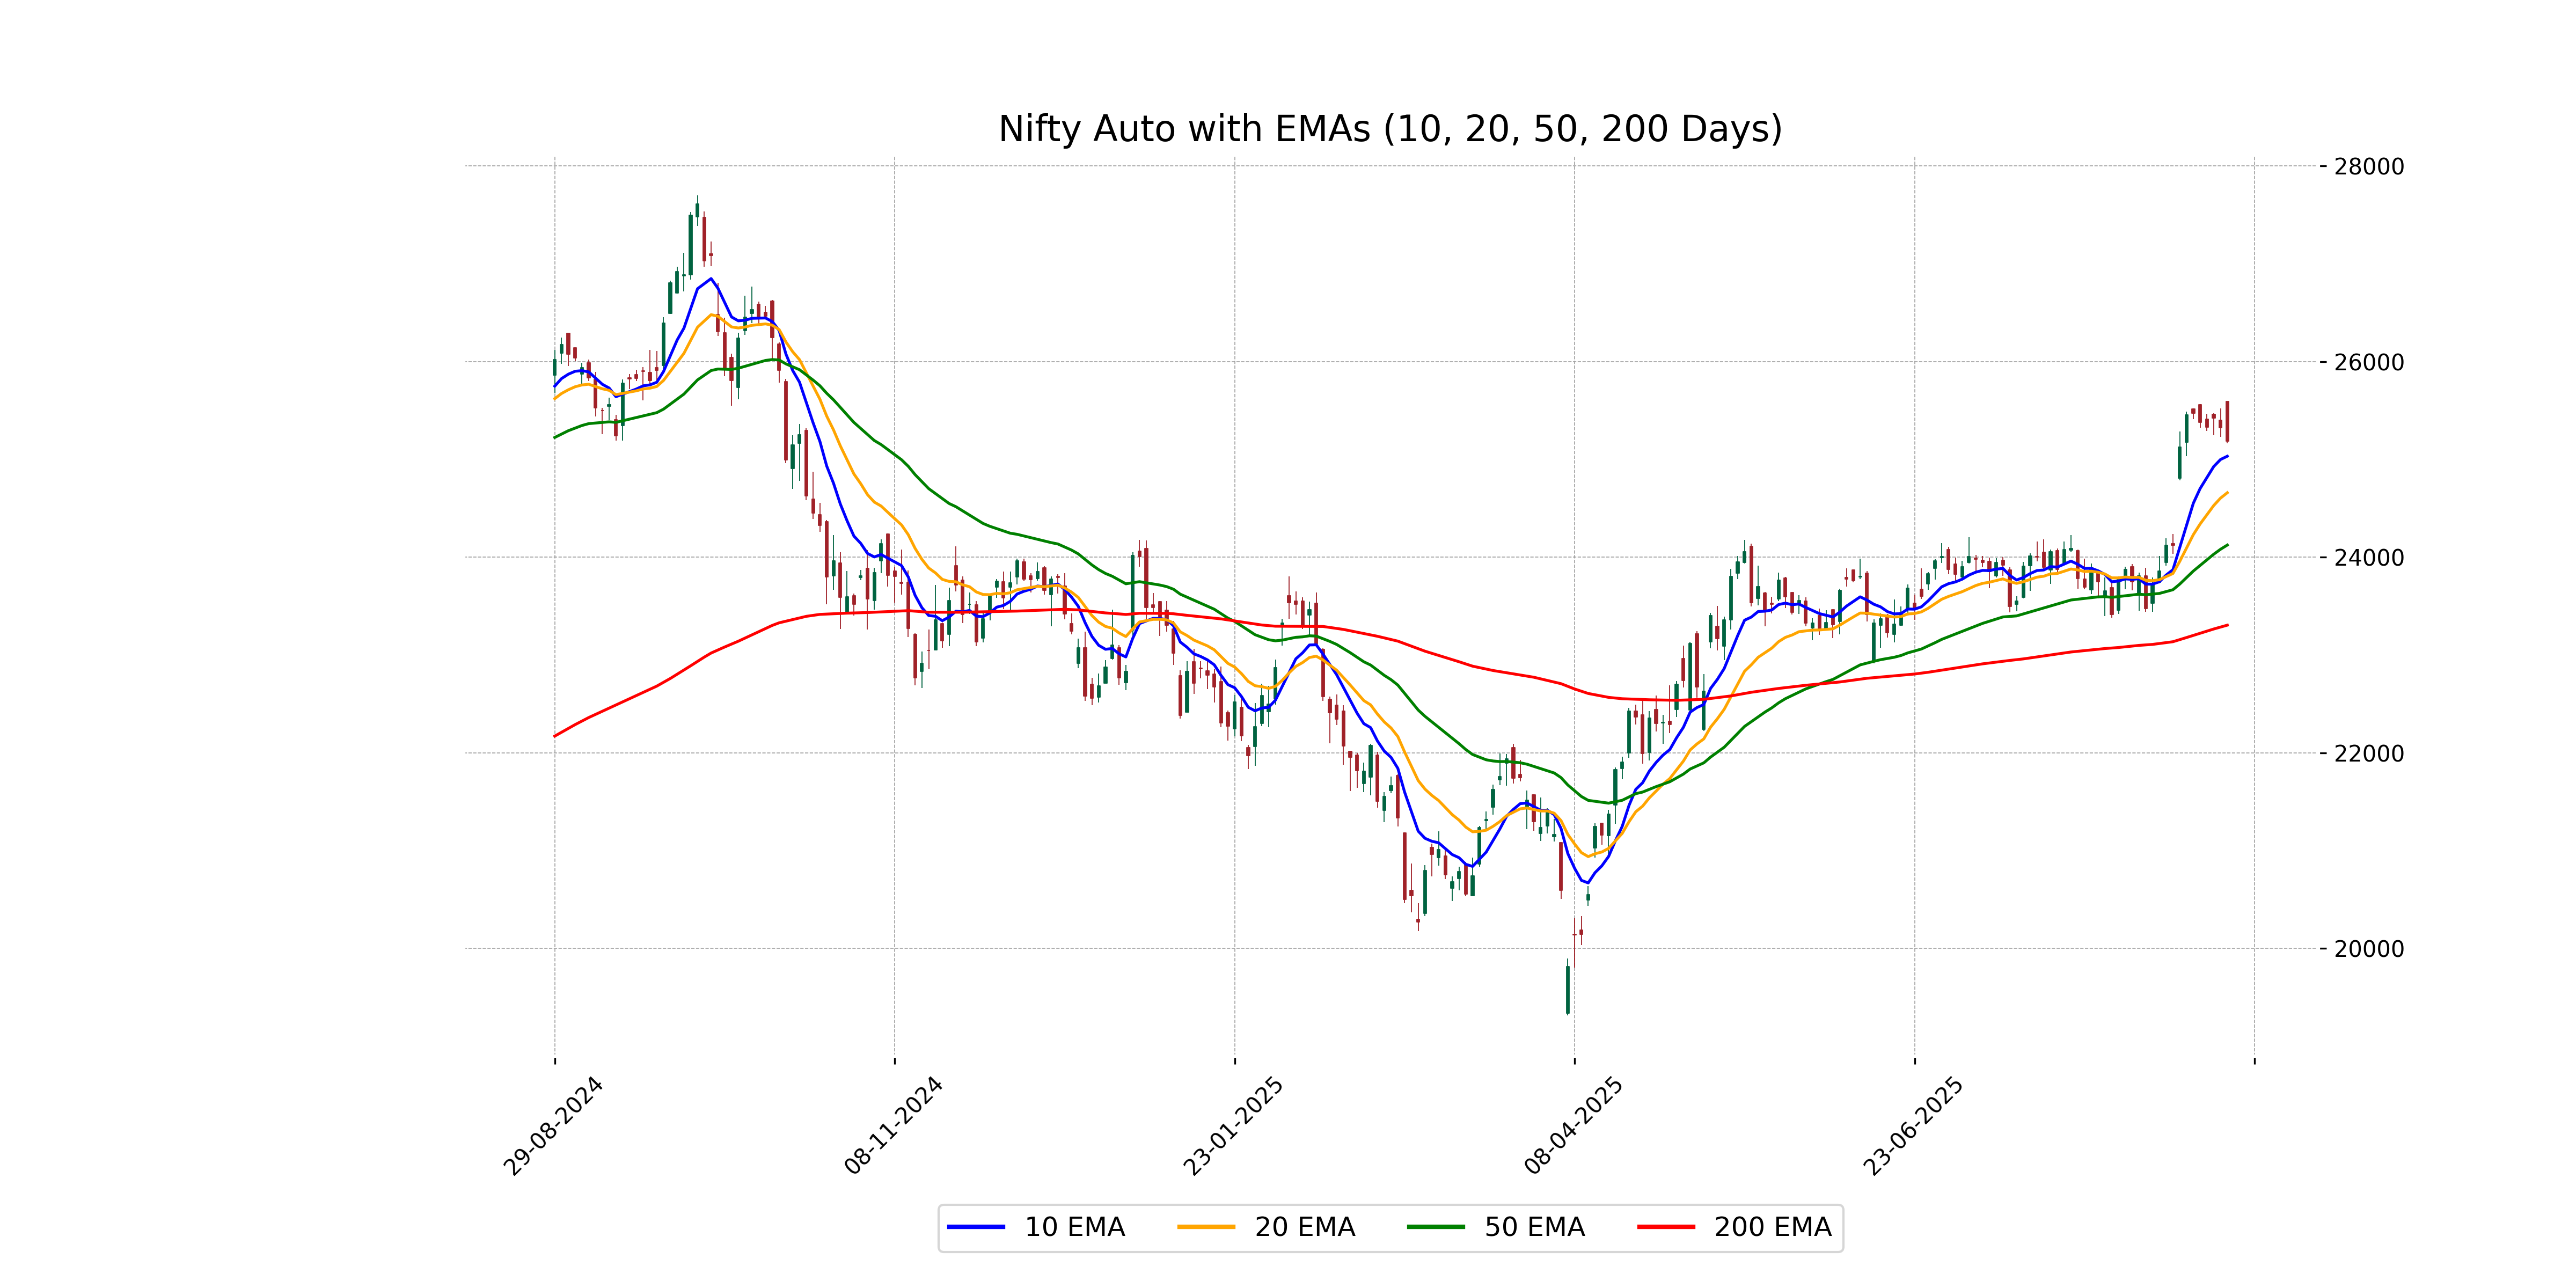
Relationship with Key Moving Averages
The Nifty Auto index closed at 25183.5, which is above its 50-day EMA of 24123.03 and the 200-day EMA of 23304.03, indicating an overall bullish trend. However, it closed slightly below the 10-day EMA of 25031.23 and 20-day EMA of 24658.01, suggesting short-term weakness in upward momentum.
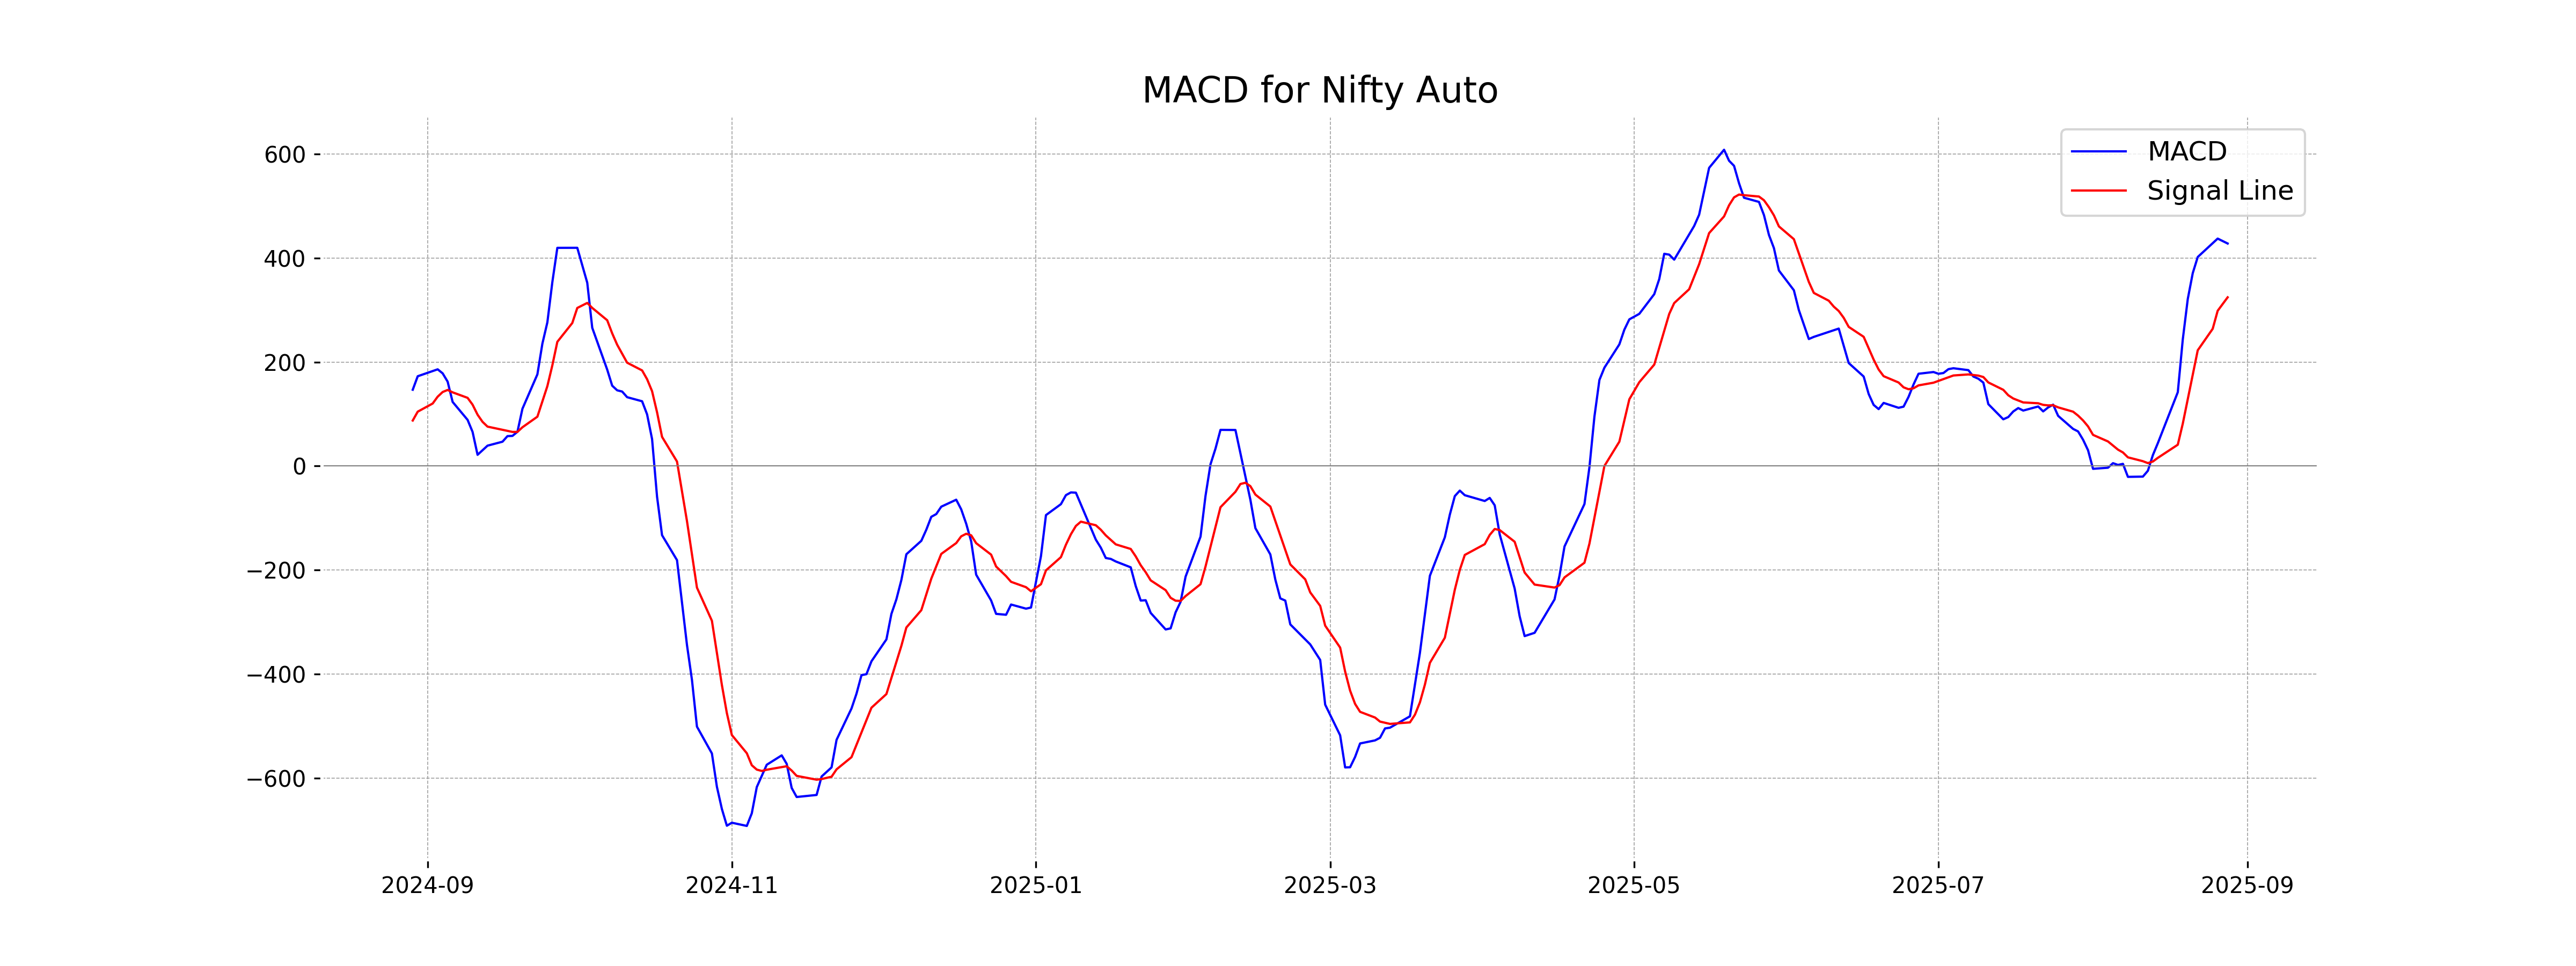
Moving Averages Trend (MACD)
Based on the data provided, Nifty Auto's MACD value is 428.17, which is above the MACD Signal line of 324.67. This suggests a bullish momentum in the stock, as the MACD line is higher, indicating potential for further upward movement.
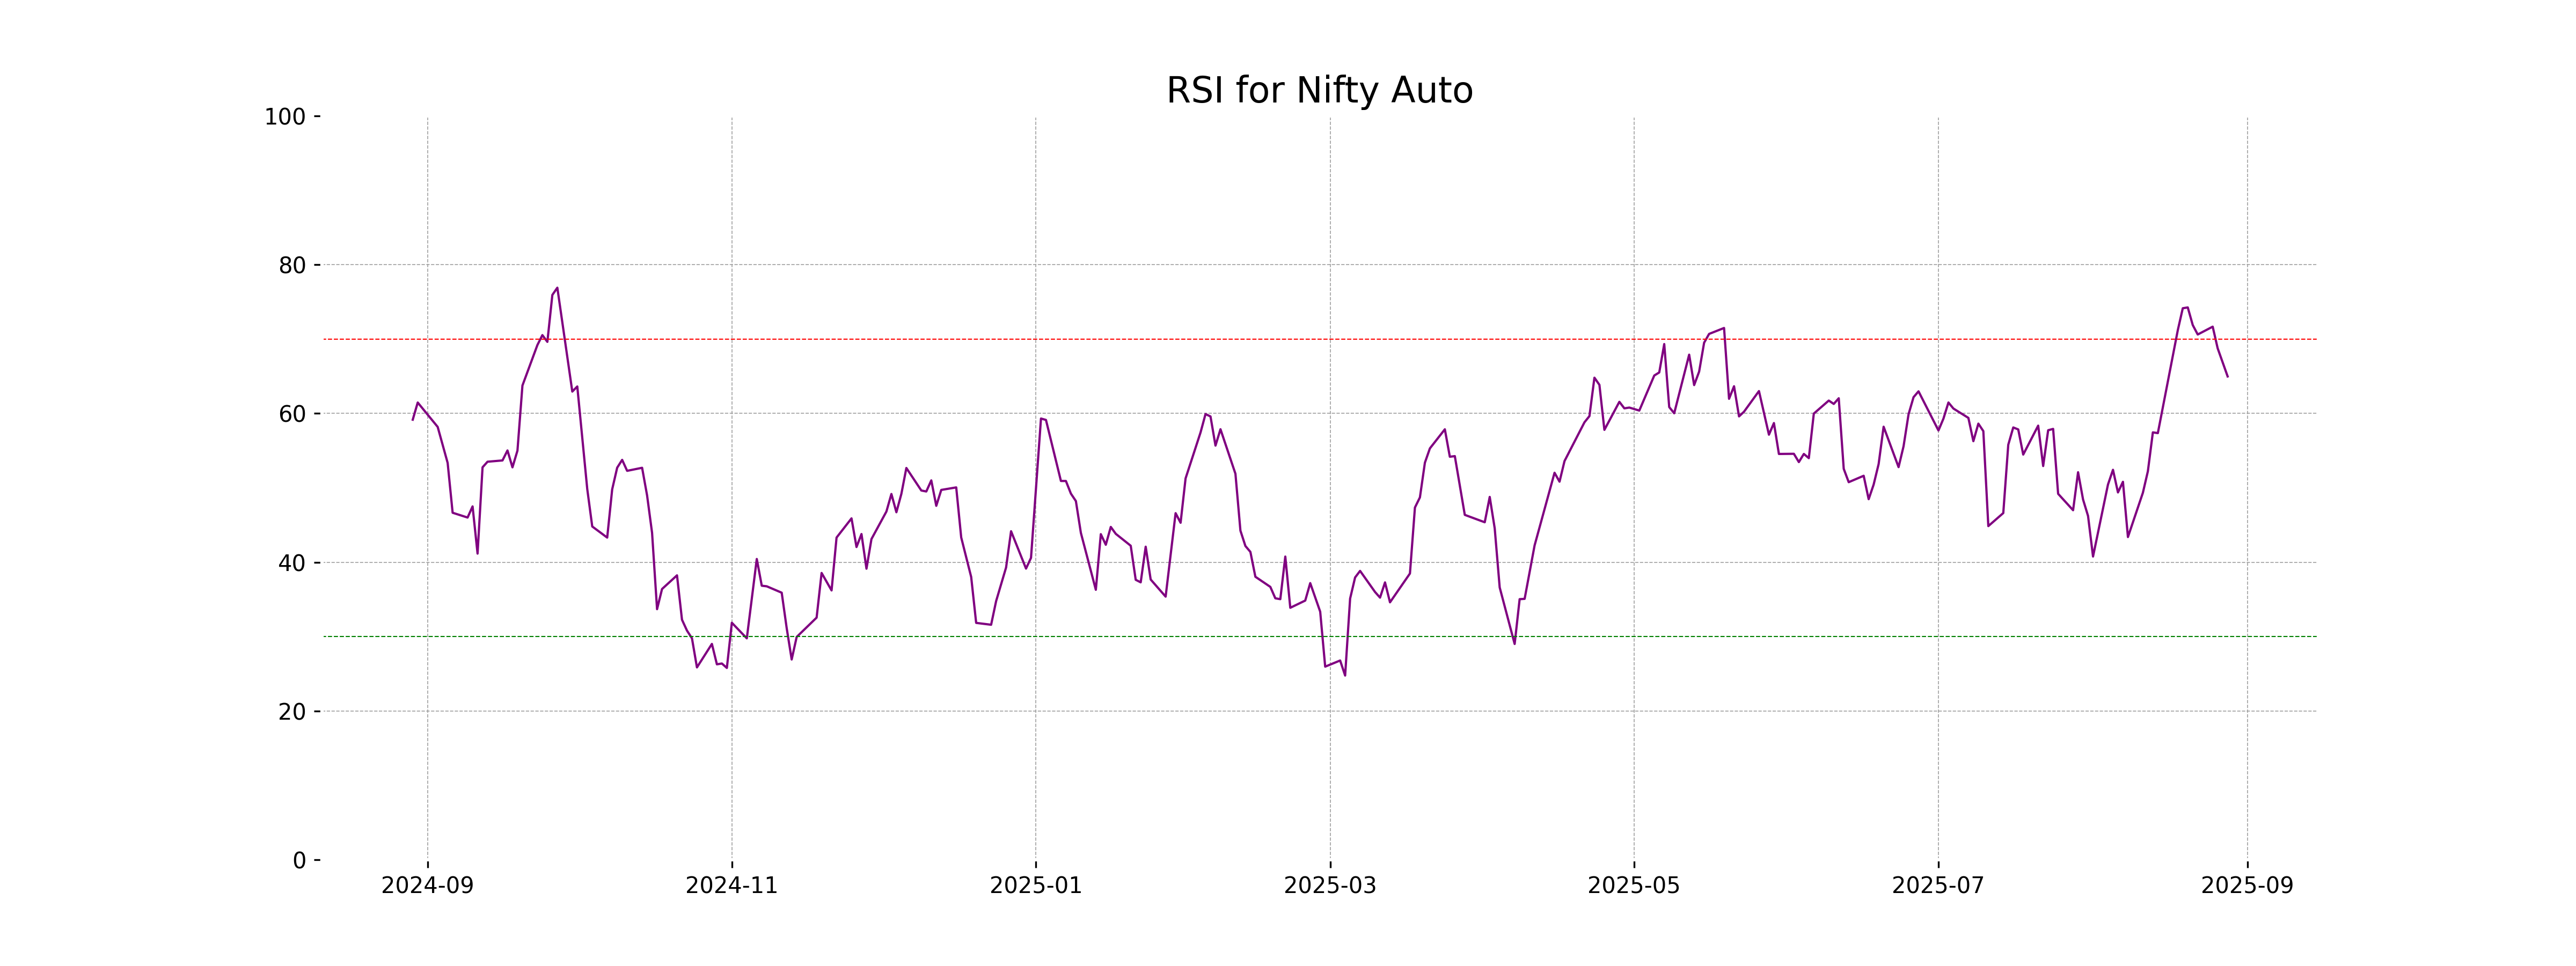
RSI Analysis
The RSI for Nifty Auto is 64.98, indicating it is approaching overbought territory. Typically, an RSI above 70 is considered overbought, while an RSI below 30 suggests oversold conditions. As the current RSI is below 70, it suggests potential for further upward movement, but caution is advised as it nears the overbought range.
Analysis for Nifty Energy - August 28, 2025
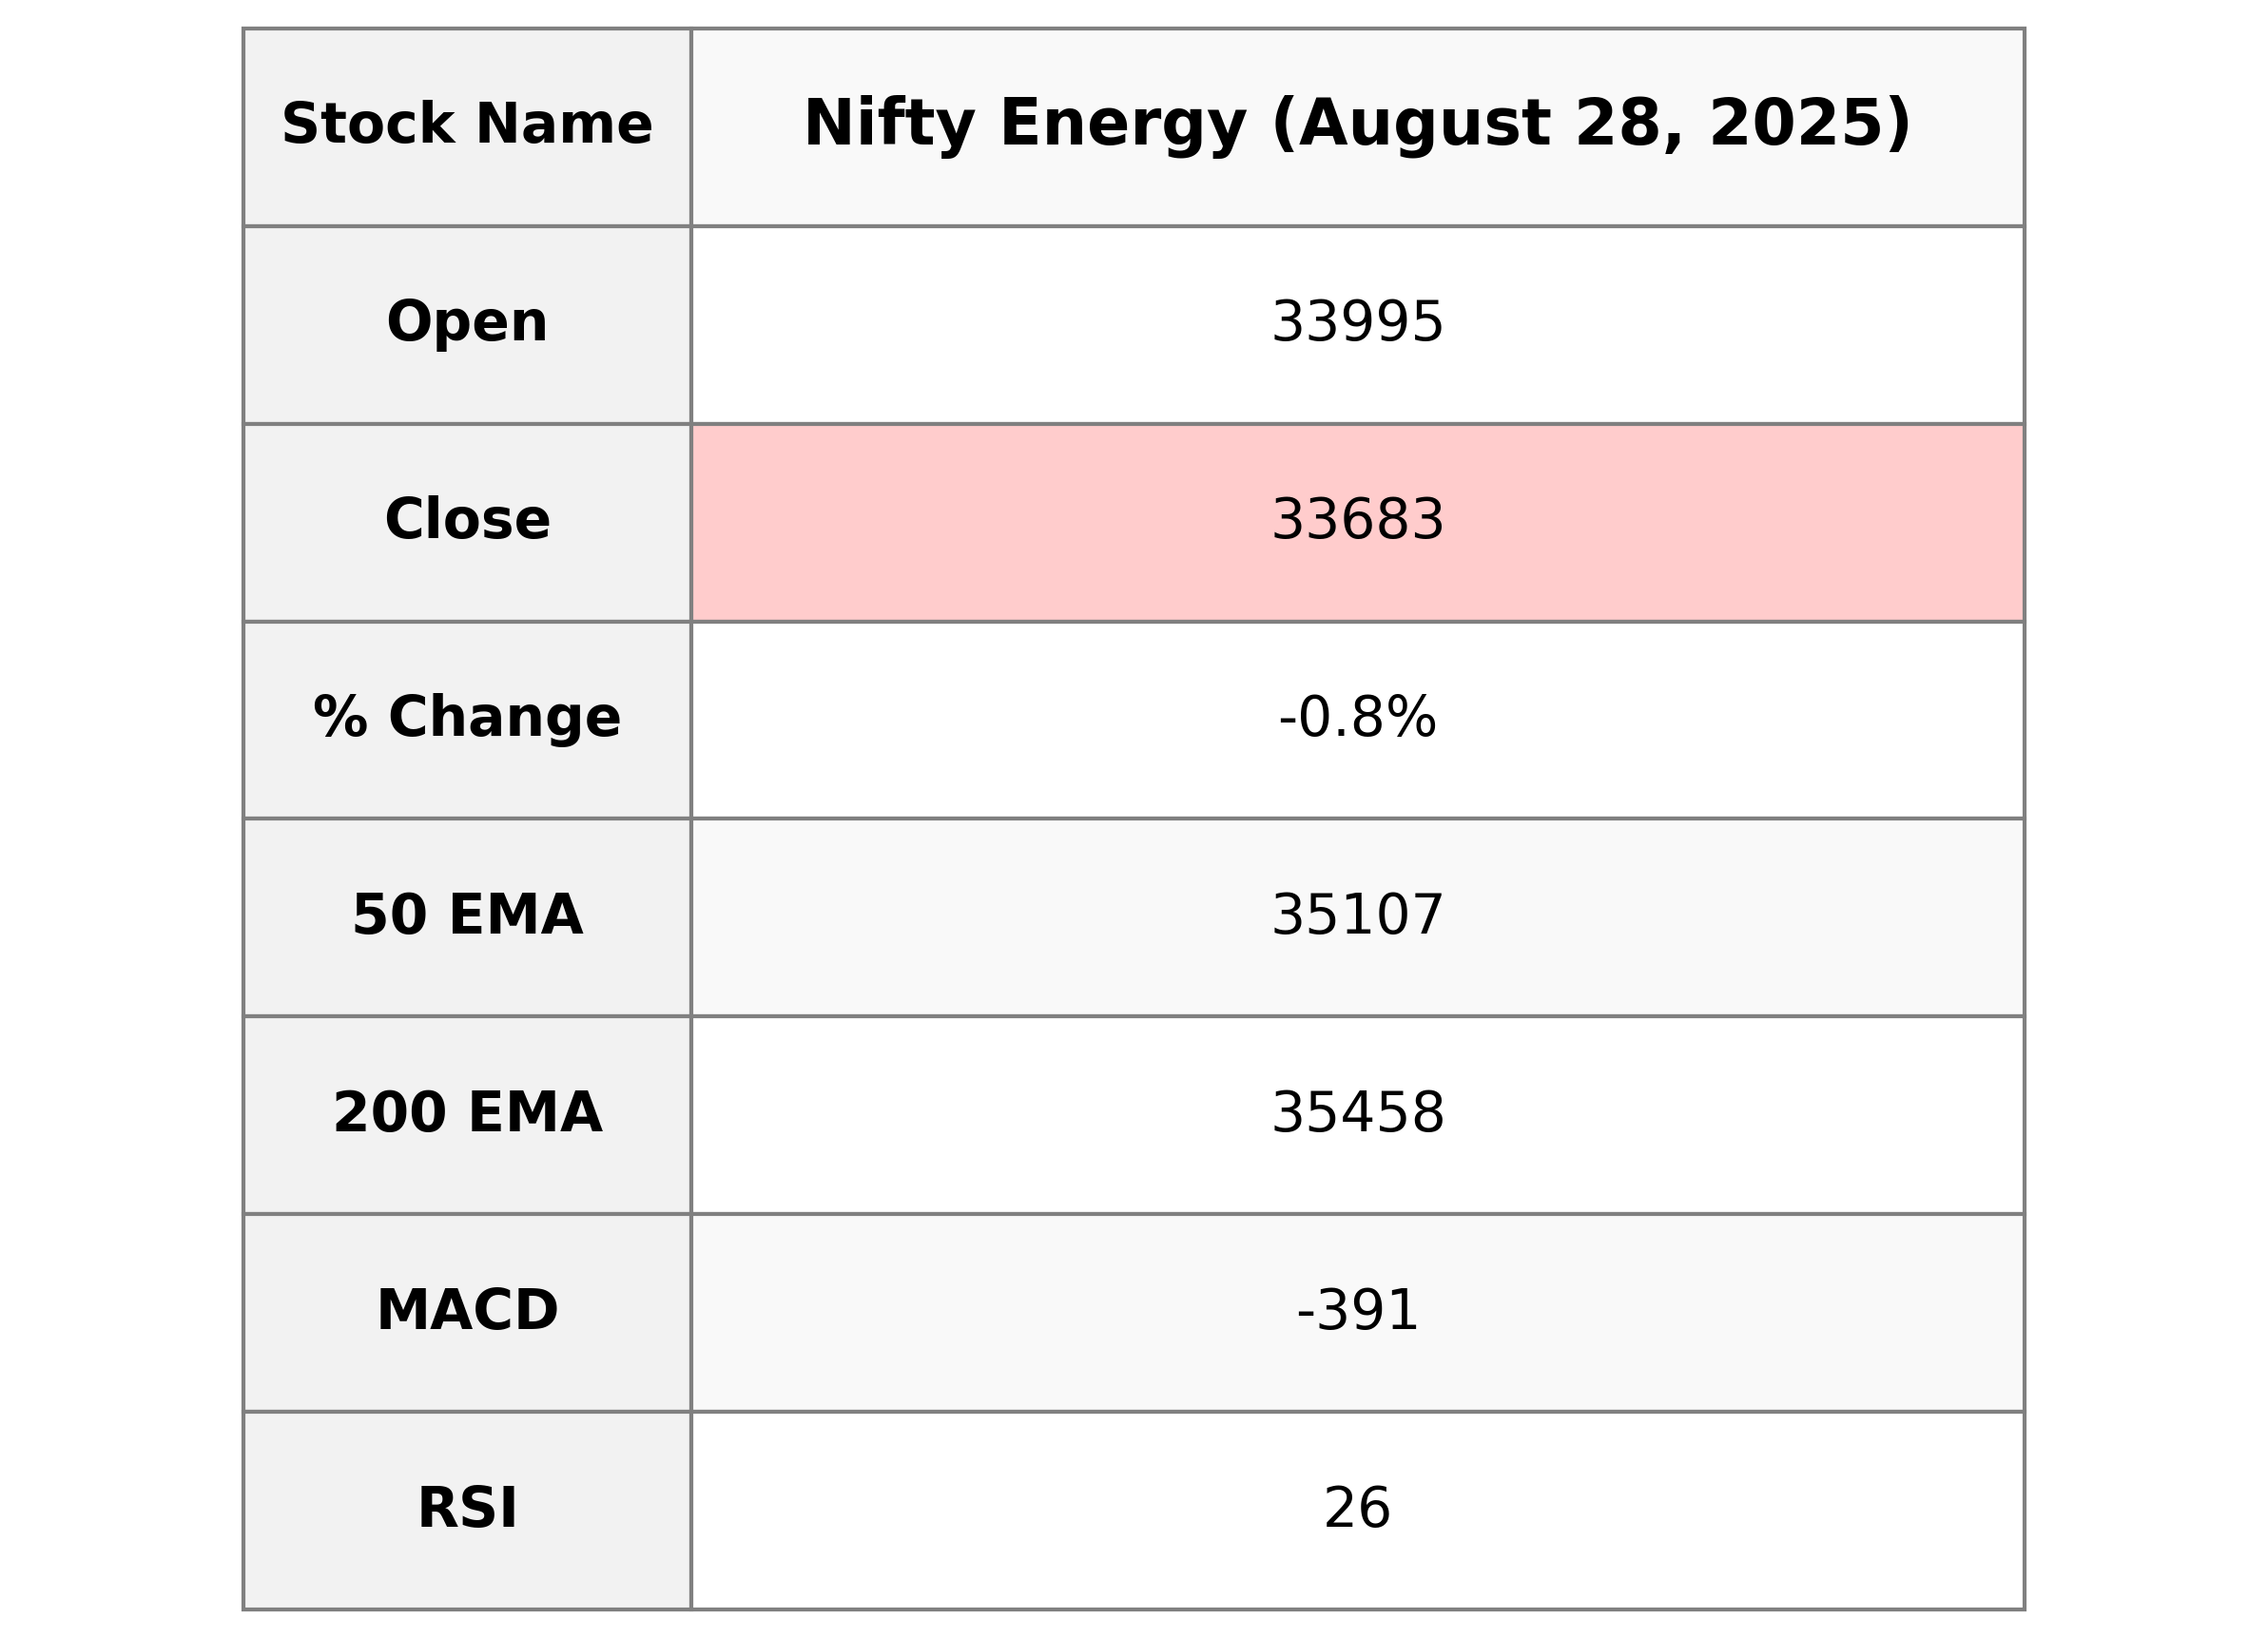
Nifty Energy Performance Description: Nifty Energy opened at 33,994.60 and closed lower at 33,682.85, a decline of 0.80% from the previous close of 33,955.95. The index experienced a points change of -273.10, while exhibiting technical indicators like a low RSI value of 25.93, suggesting it is currently oversold. The MACD is below its signal line, indicating a bearish trend.
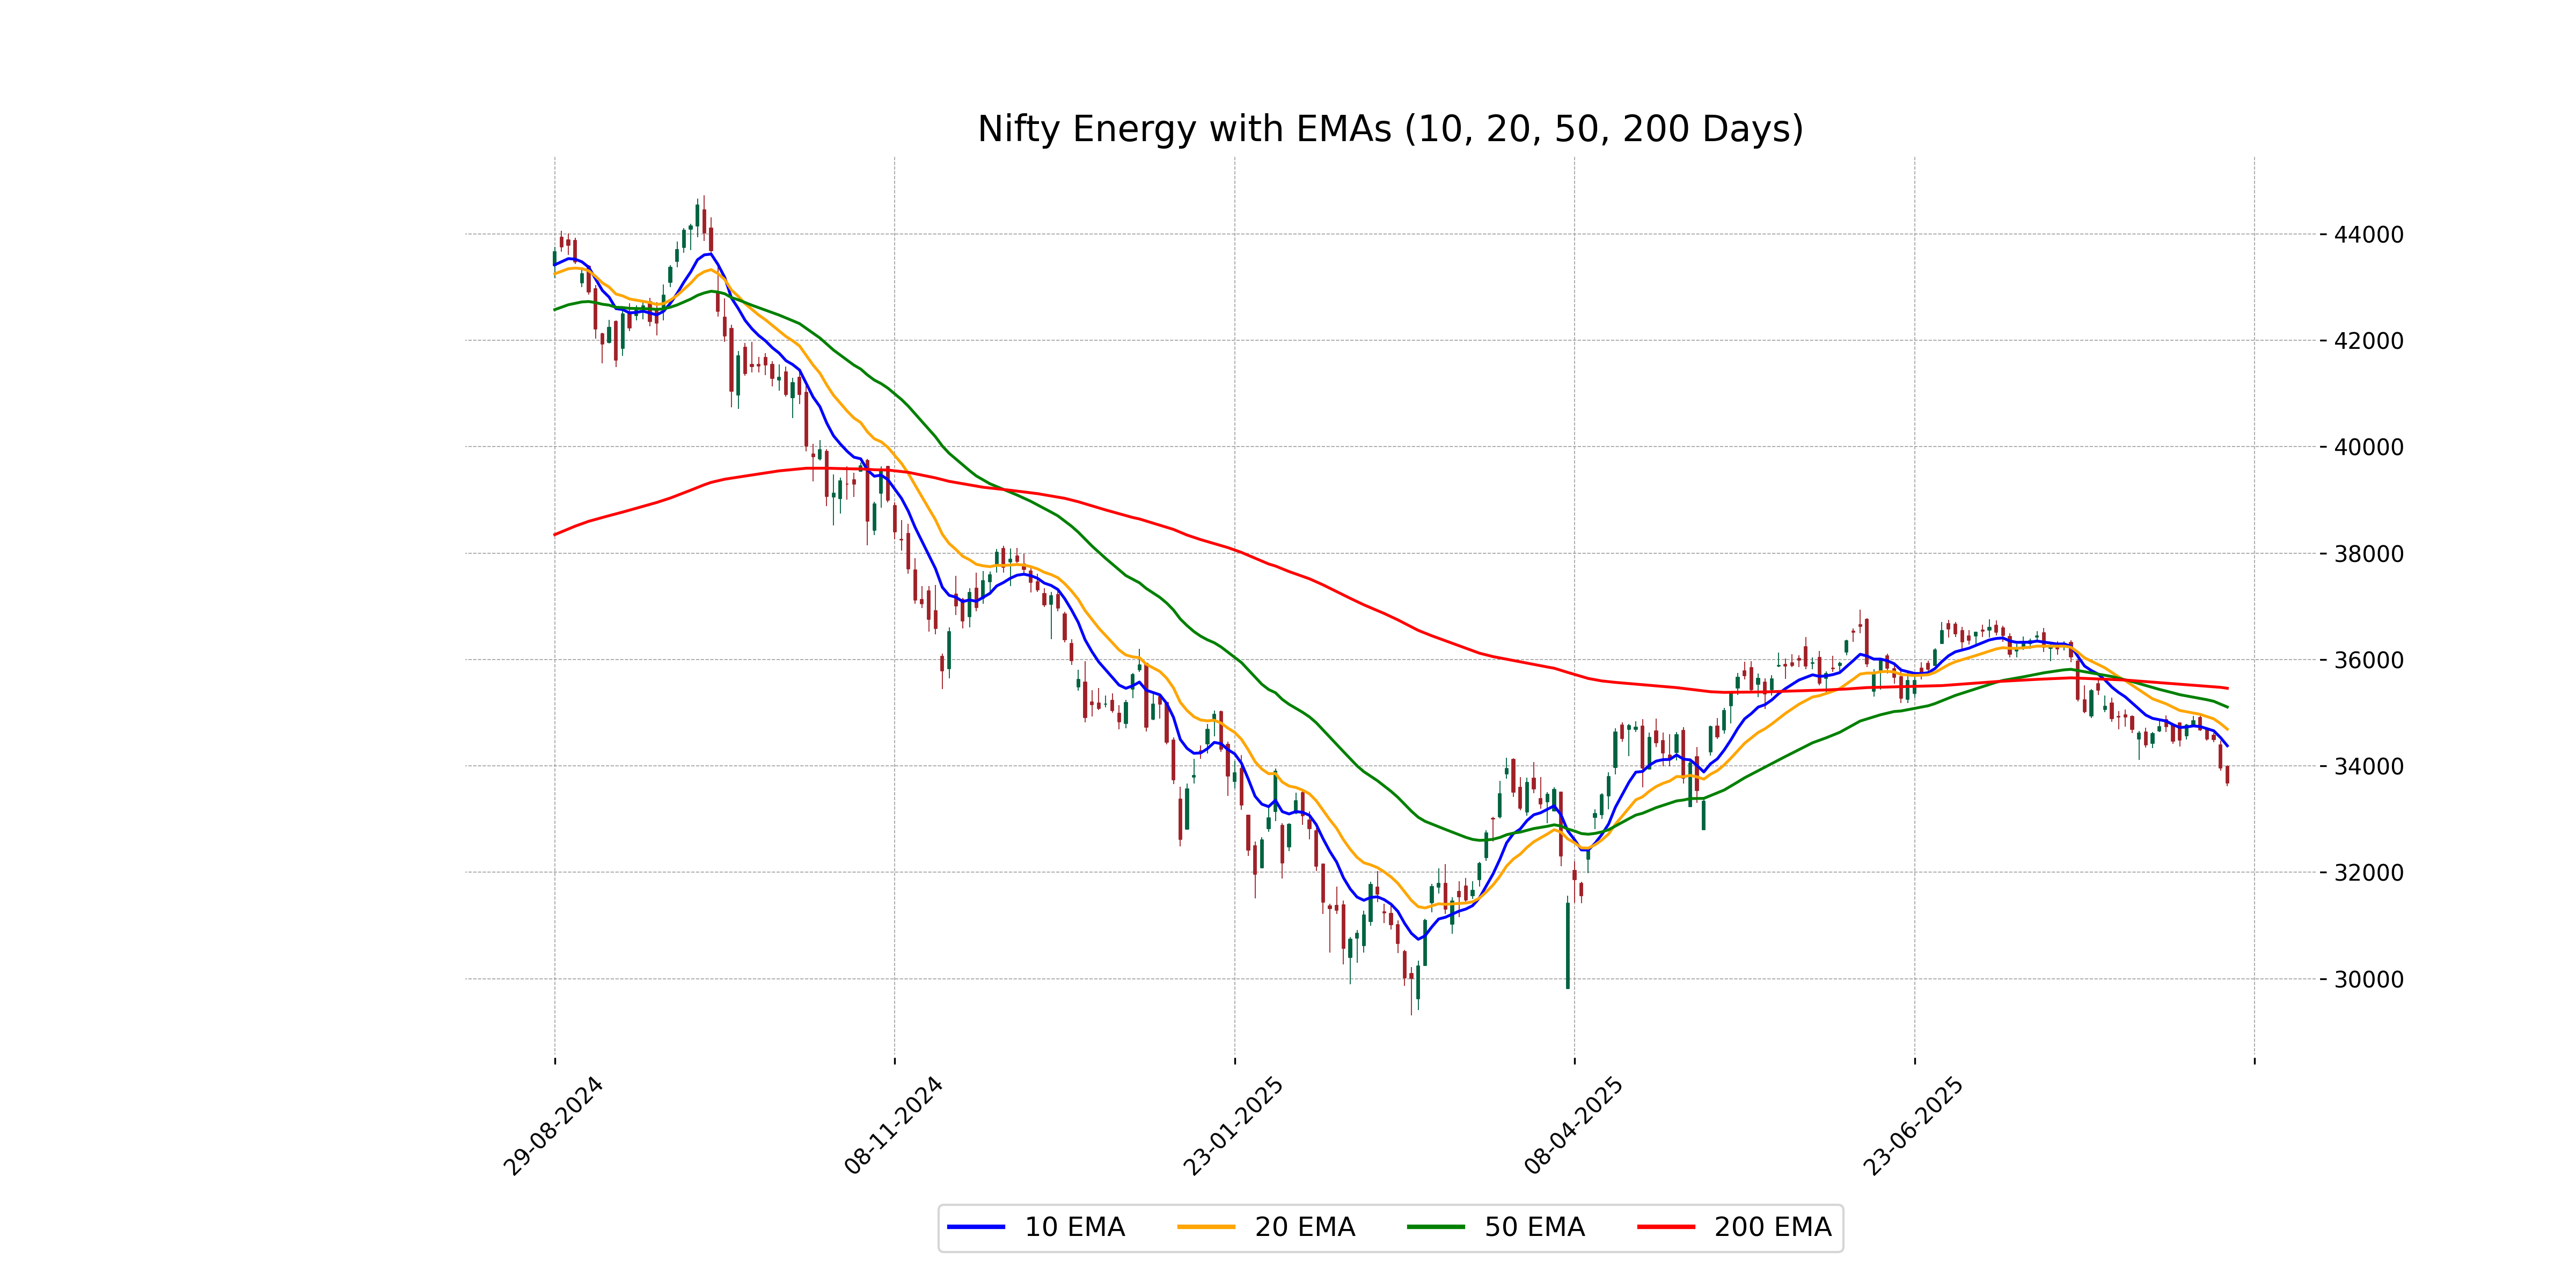
Relationship with Key Moving Averages
Nifty Energy closed at 33,682.85, which is below its 10-day EMA of 34,377.54, 20-day EMA of 34,689.66, 50-day EMA of 35,106.61, and 200-day EMA of 35,458.42. This suggests a bearish sentiment as the index is trading below key moving averages.
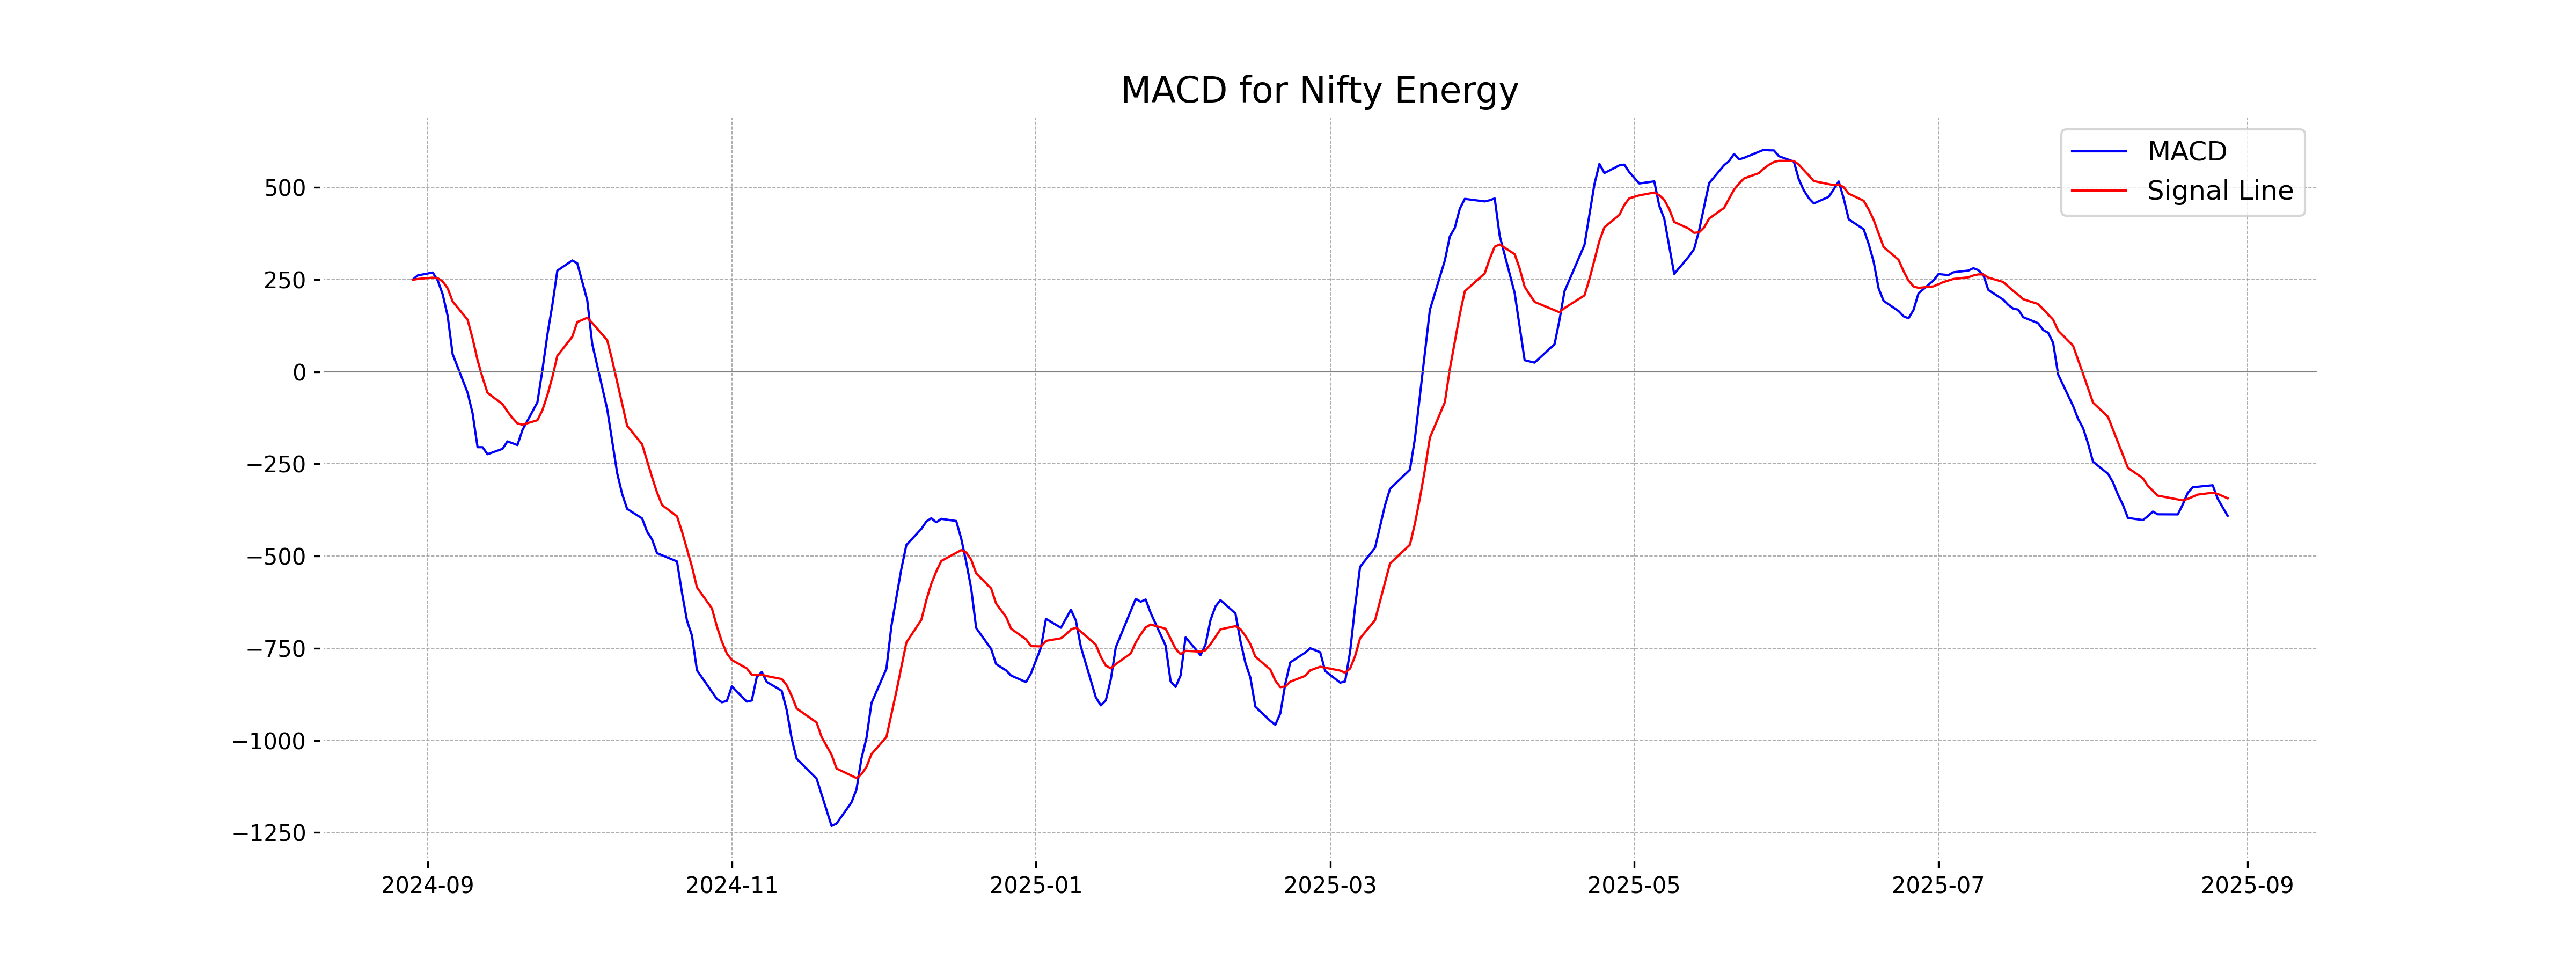
Moving Averages Trend (MACD)
MACD Analysis for Nifty Energy: The MACD value of -390.85 indicates a bearish momentum for Nifty Energy. With the MACD below the signal line (-343.27), it suggests a continued downward trend, potentially signaling a selling opportunity or the need for caution in new buy positions.
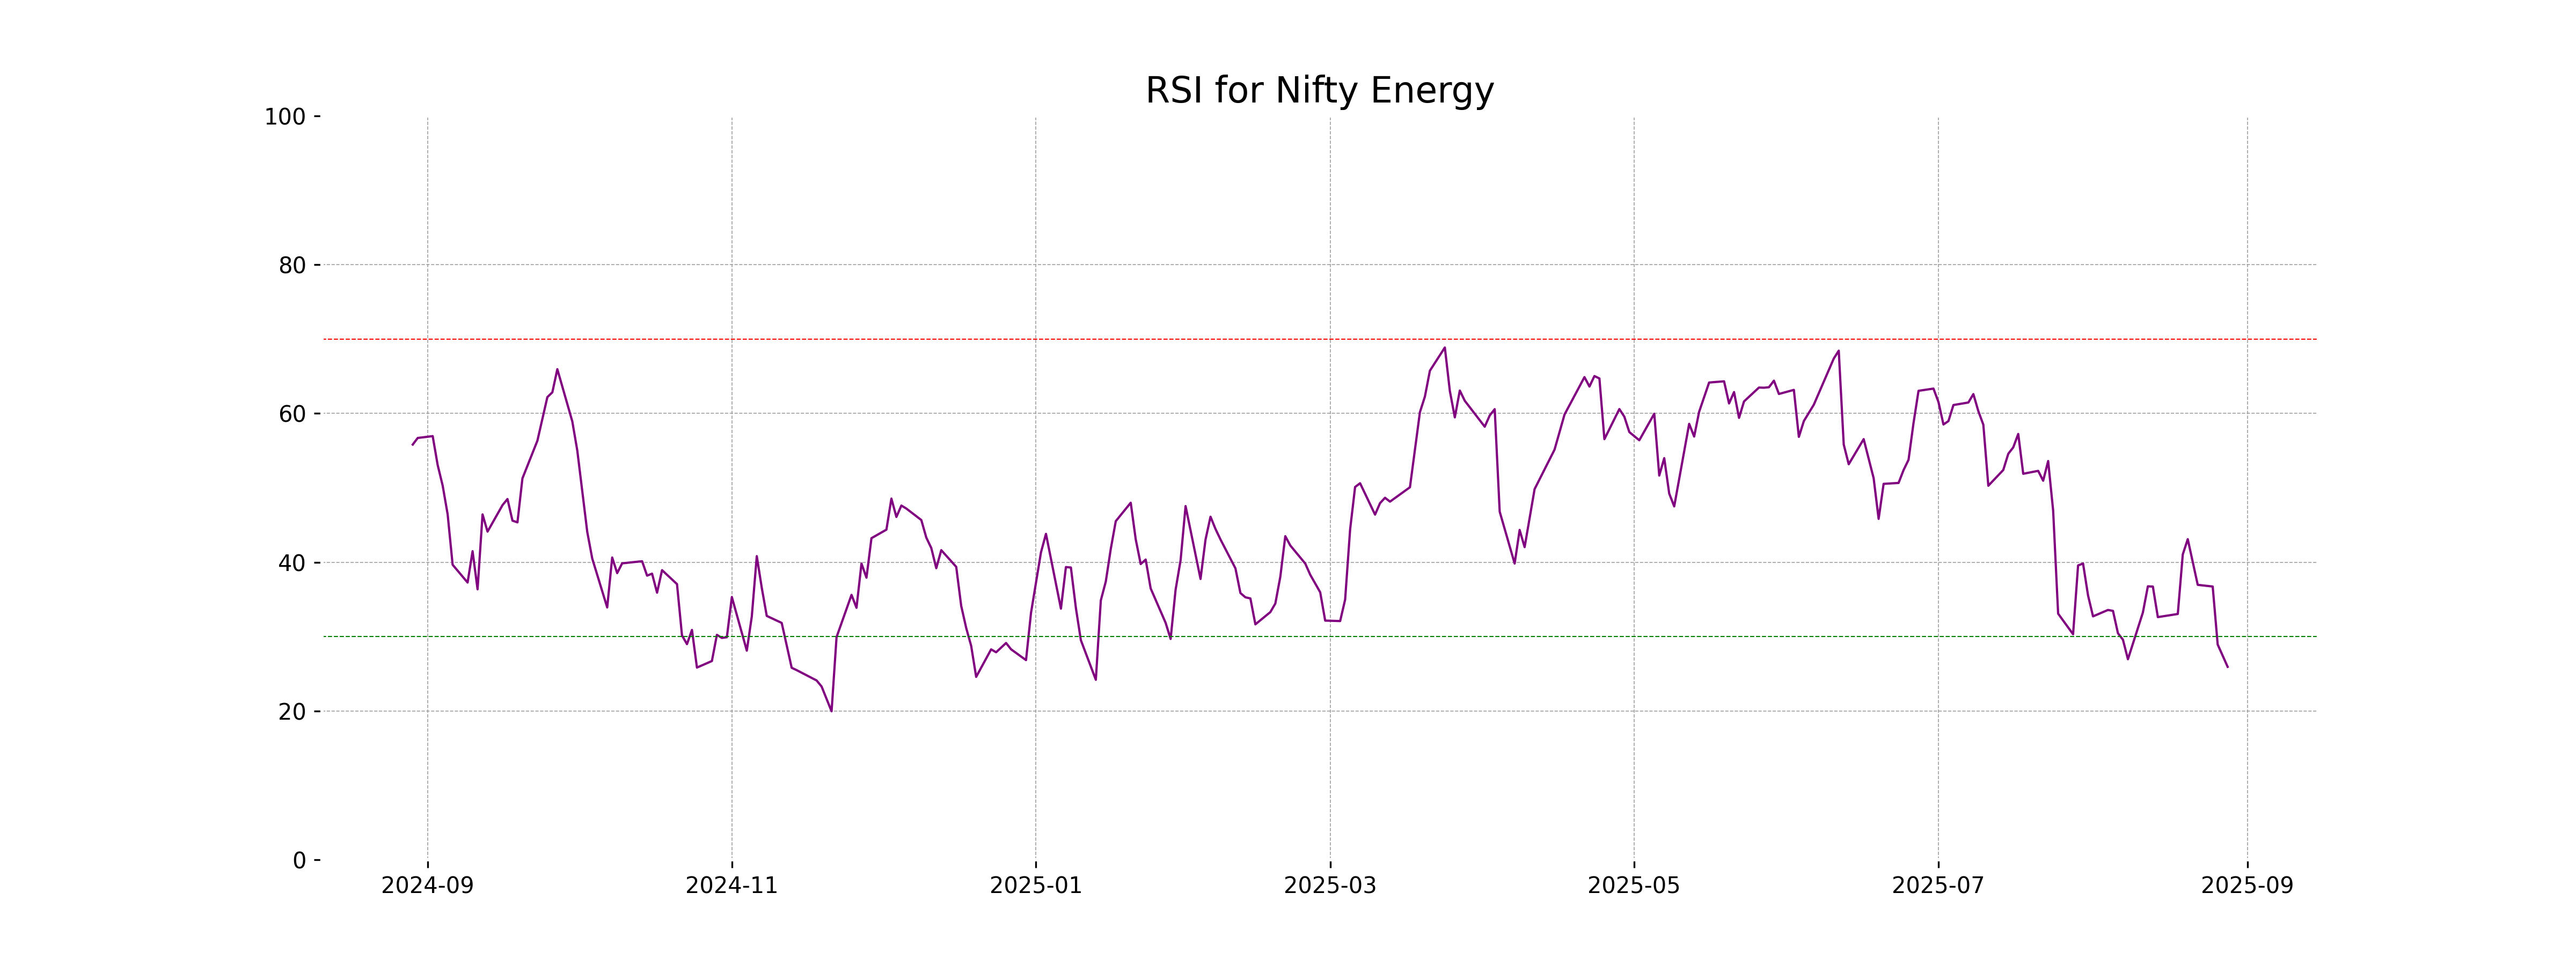
RSI Analysis
RSI Analysis for Nifty Energy: The RSI of 25.93 suggests that Nifty Energy is in the oversold territory. This indicates that the index may be experiencing a downtrend and could potentially be undervalued, possibly signaling a buying opportunity, provided other conditions support this view.
Analysis for Nifty FMCG - August 28, 2025
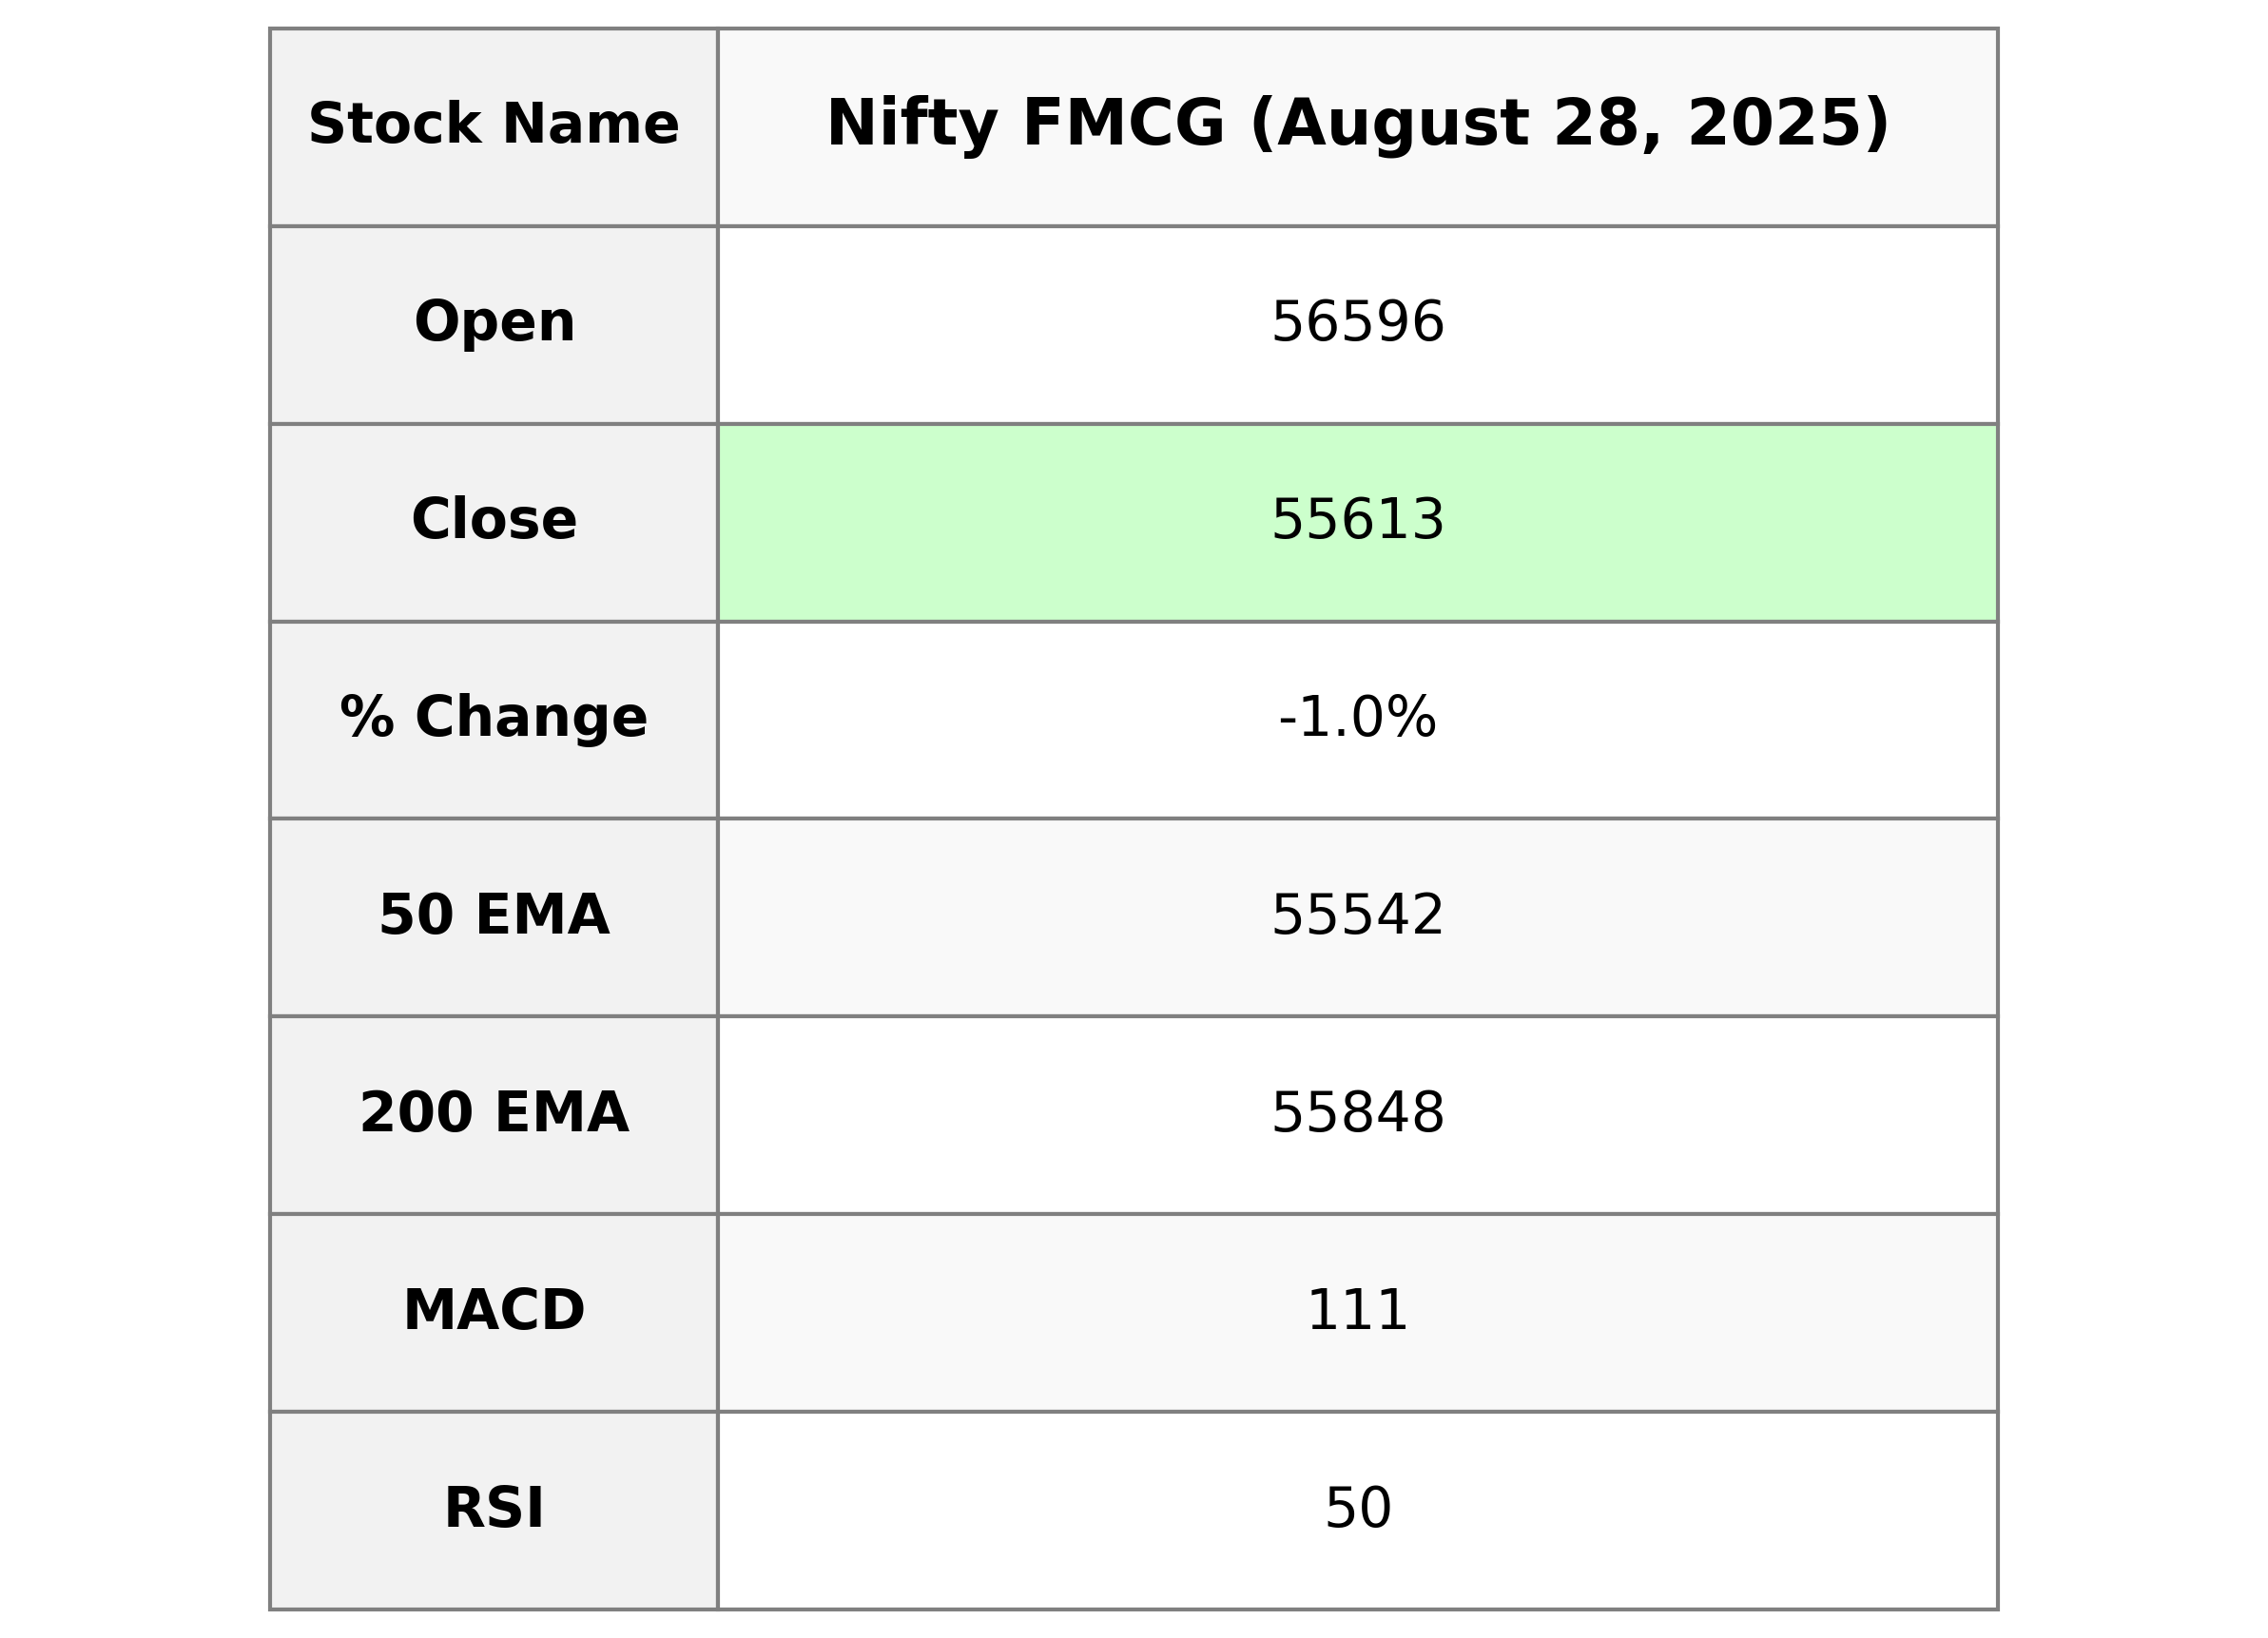
Nifty FMCG opened at 56,595.5 and closed at 55,612.95, showing a decline of approximately 1.02% from the previous close of 56,187.0. The stock experienced a drop of 574.05 points throughout the day, with a recorded low of 55,521.30 and a high equal to its opening. The RSI stands at 50.02, indicating a neutral momentum, while the MACD at 110.88 suggests a bullish signal above its signal line.
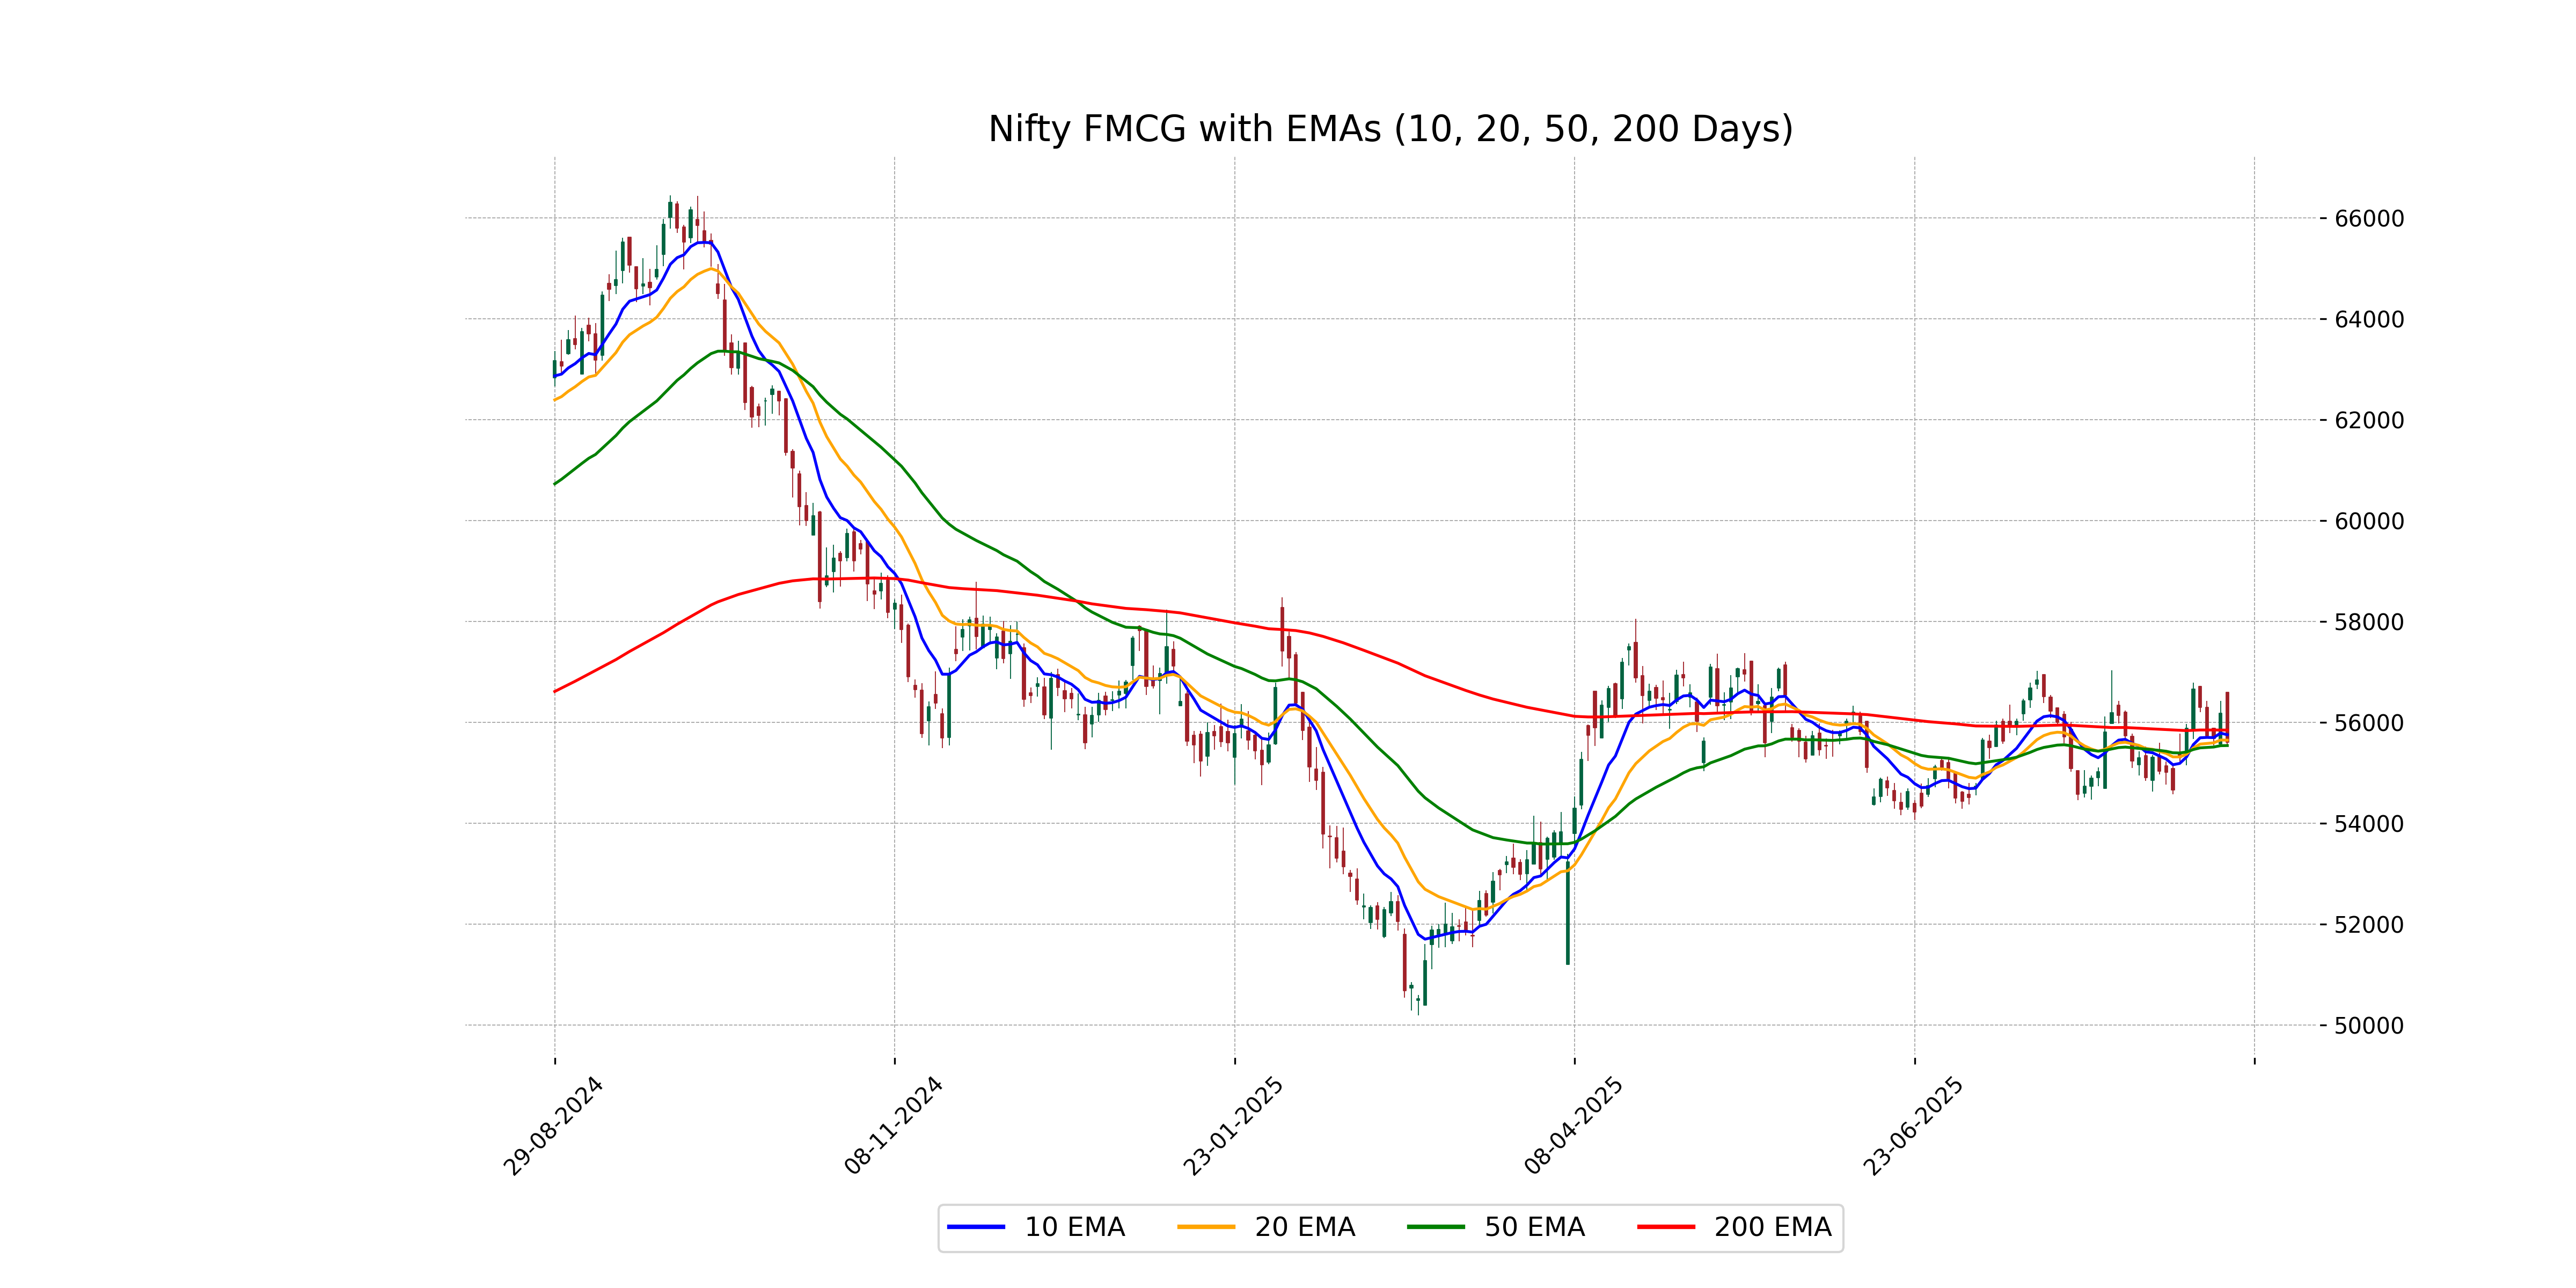
Relationship with Key Moving Averages
The Nifty FMCG index closed at 55,612.95, which is slightly above its 50-day EMA (55,541.60), but below the 200-day EMA (55,848.27) and 10-day EMA (55,755.90). This indicates that while there is short-term bearish sentiment, it is holding just above its 50-day average, suggesting some support at this level.
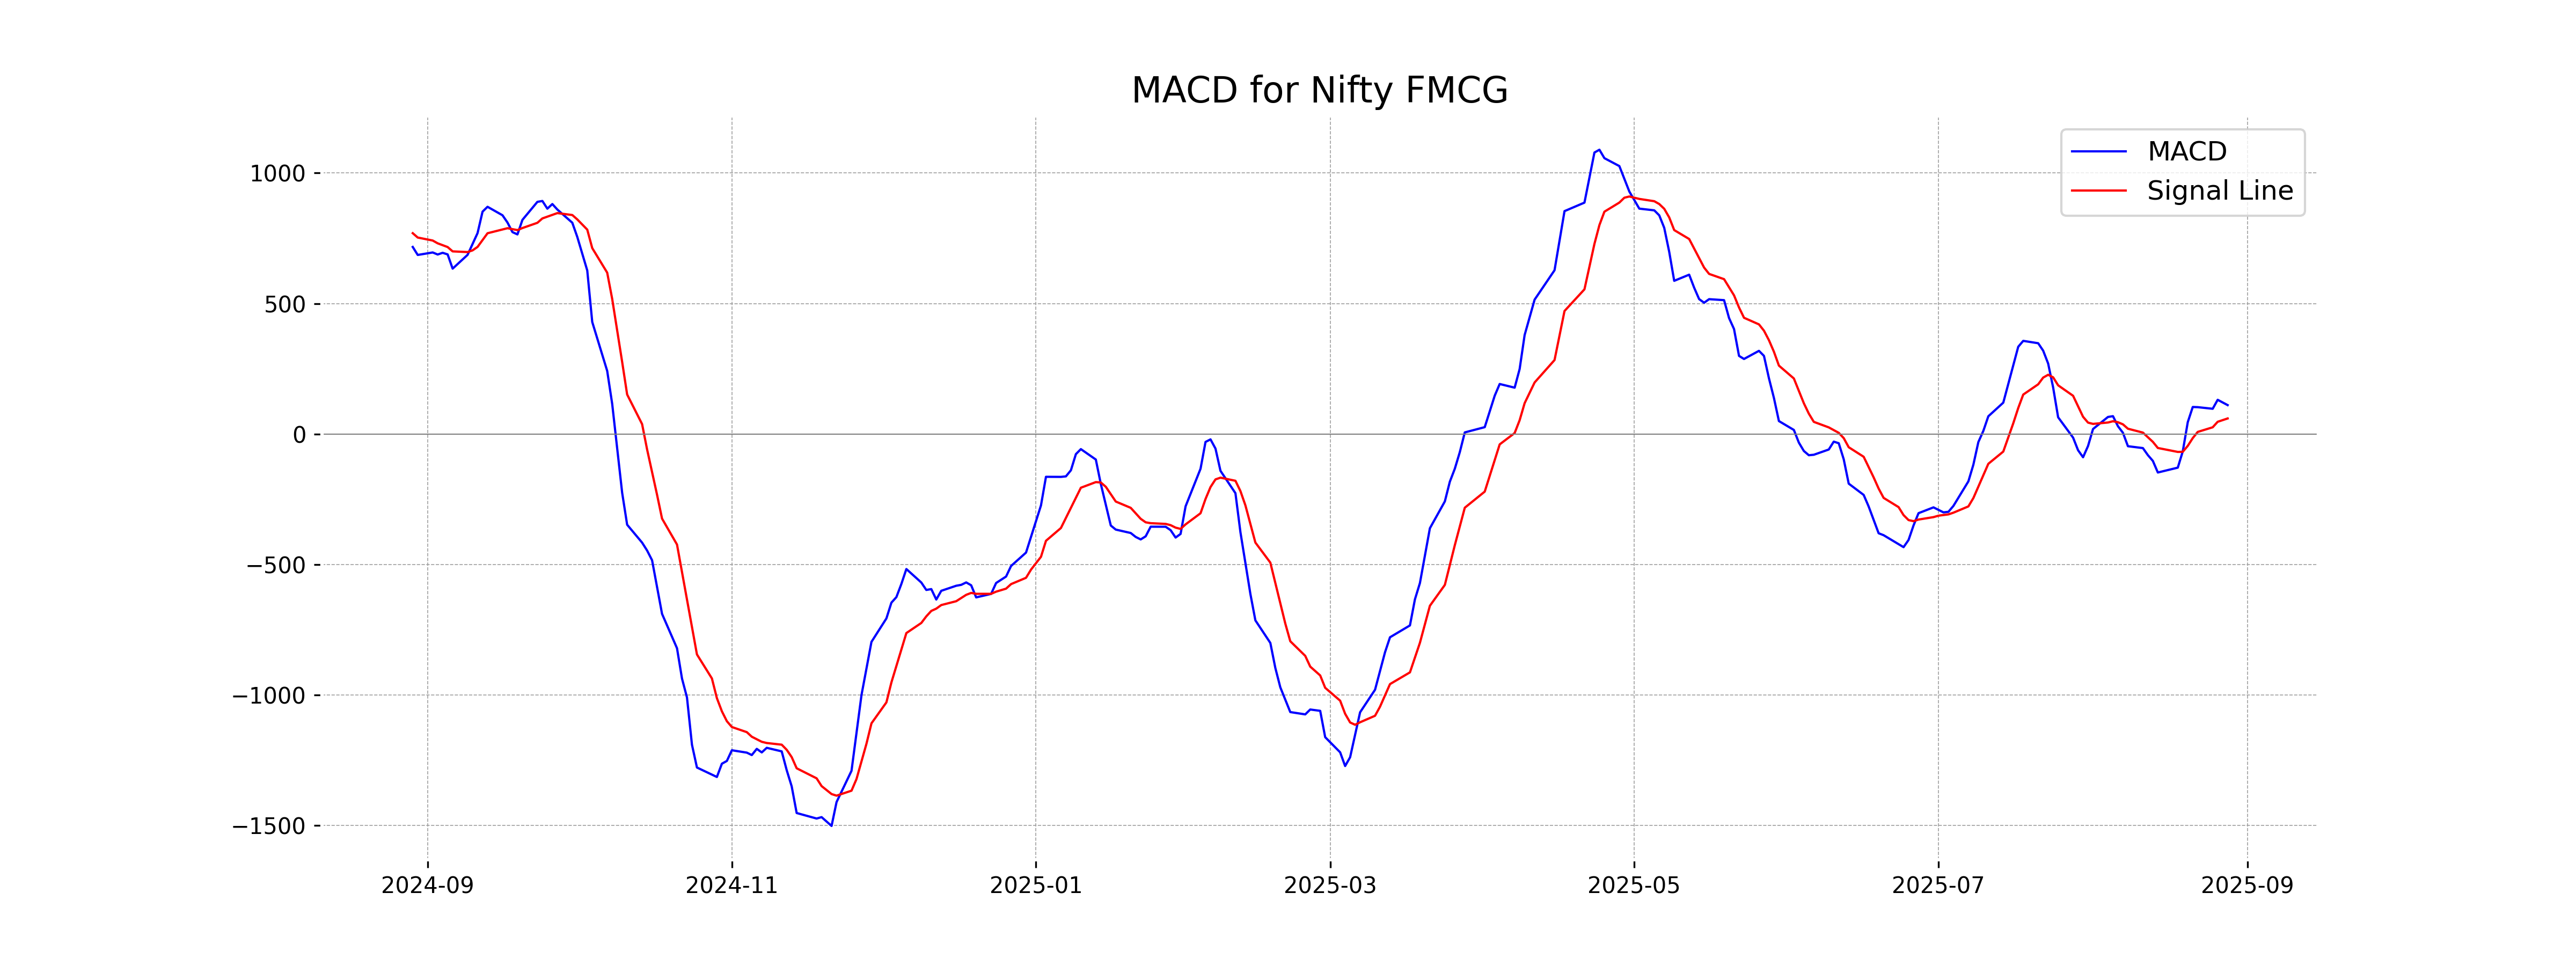
Moving Averages Trend (MACD)
The MACD value for Nifty FMCG is 110.88, while the MACD Signal is 59.78, indicating a bullish momentum as the MACD line is above the signal line. However, with the RSI near 50, the momentum may not be strong, suggesting consolidation or potential reversal.
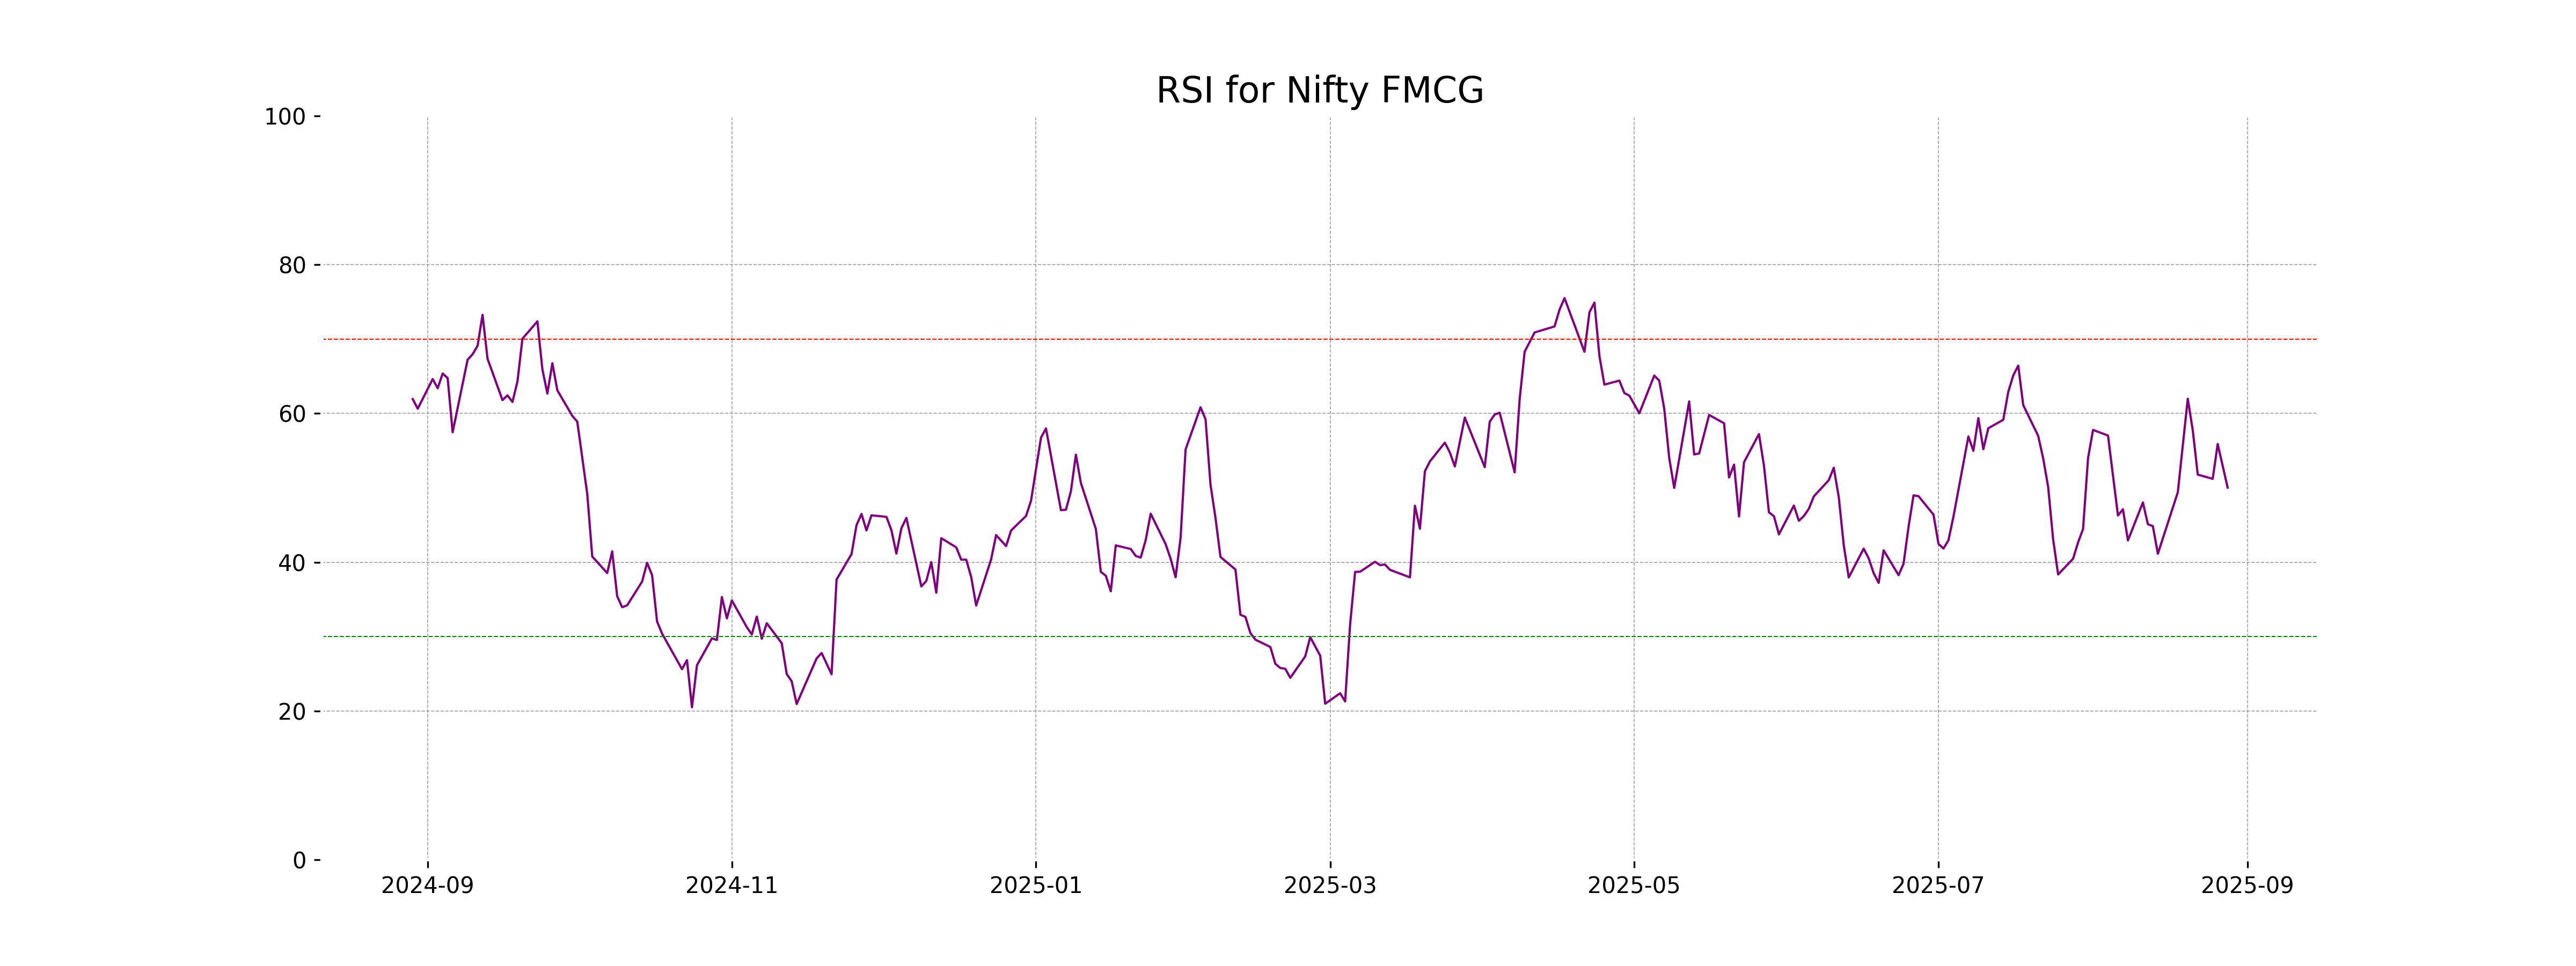
RSI Analysis
RSI Analysis for Nifty FMCG: The Relative Strength Index (RSI) for Nifty FMCG is at 50.02, indicating a neutral momentum. Values around 50 suggest a balanced condition, neither indicating overbought nor oversold levels. This suggests the market sentiment for Nifty FMCG is currently stable without significant bullish or bearish trends.
Analysis for Nifty Infra - August 28, 2025
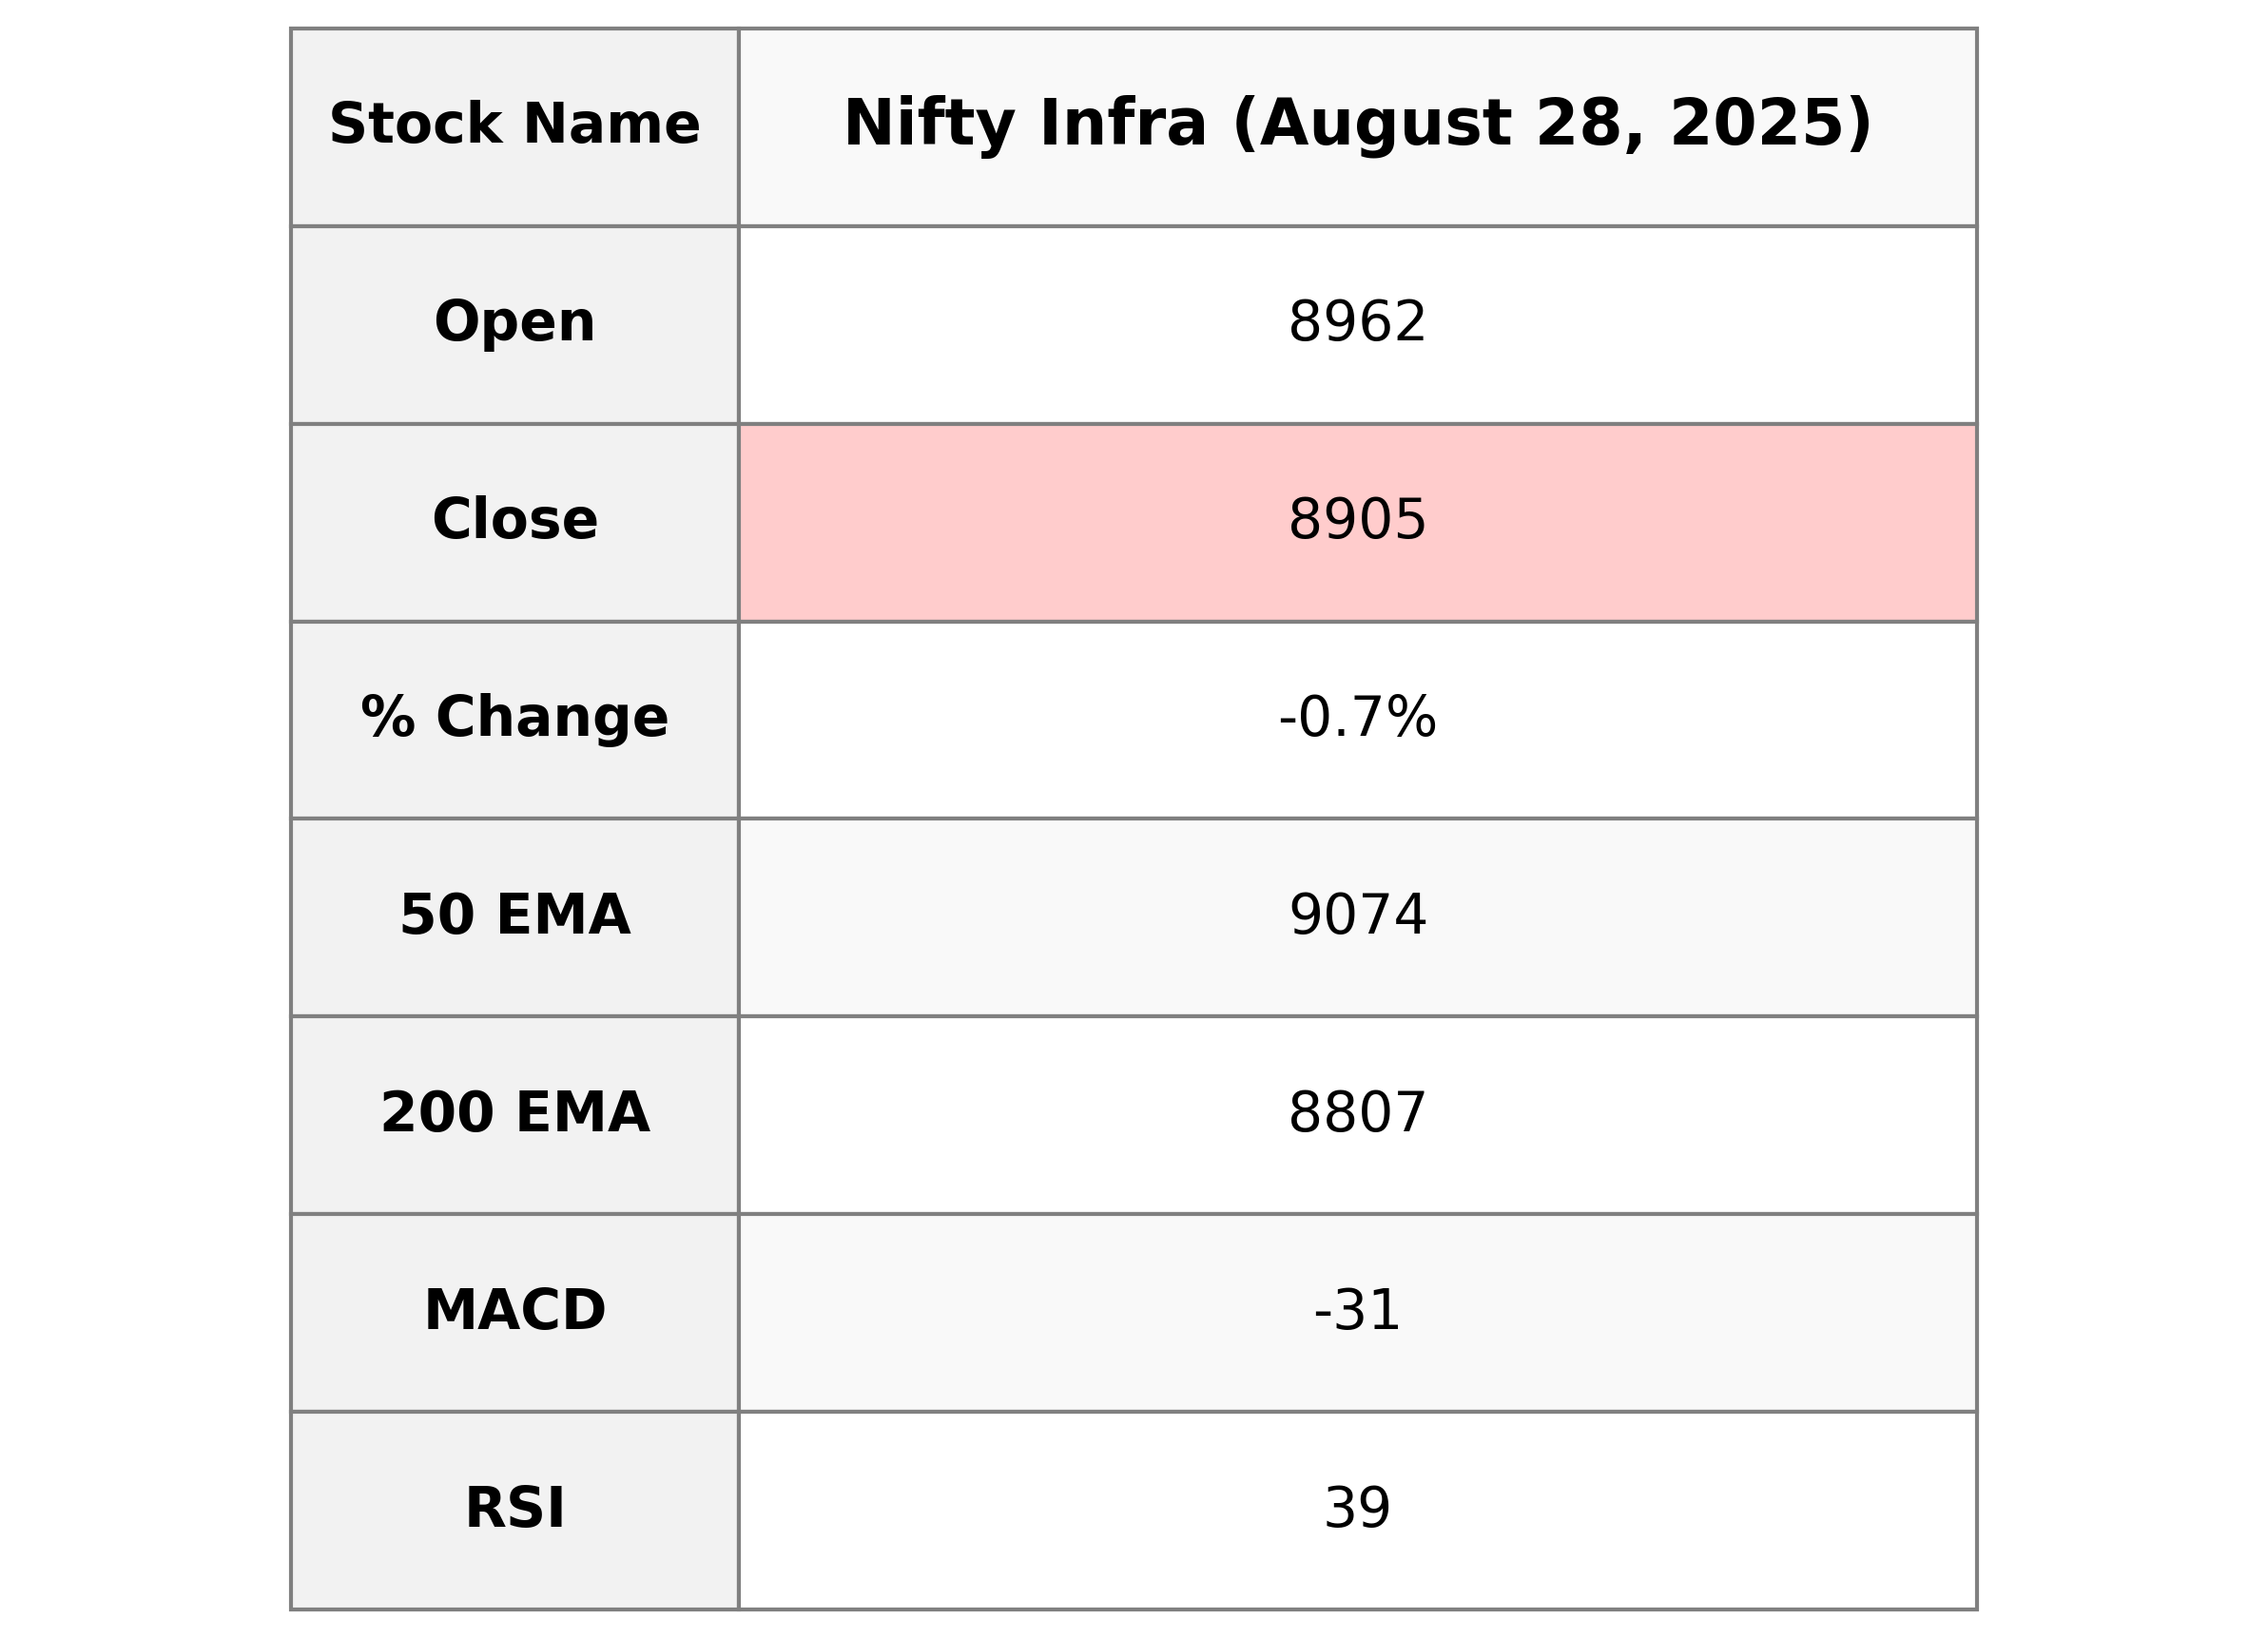
Nifty Infra opened at 8961.80, experienced a high of 8963.50, and closed at 8904.70 after reaching a low of 8883.40. The index saw a decrease of 64.75 points, resulting in a percentage change of -0.72%. Technical indicators show the index is trading below its 10, 20, and 50-day EMAs, with a current RSI of 38.57 suggesting mildly oversold conditions.
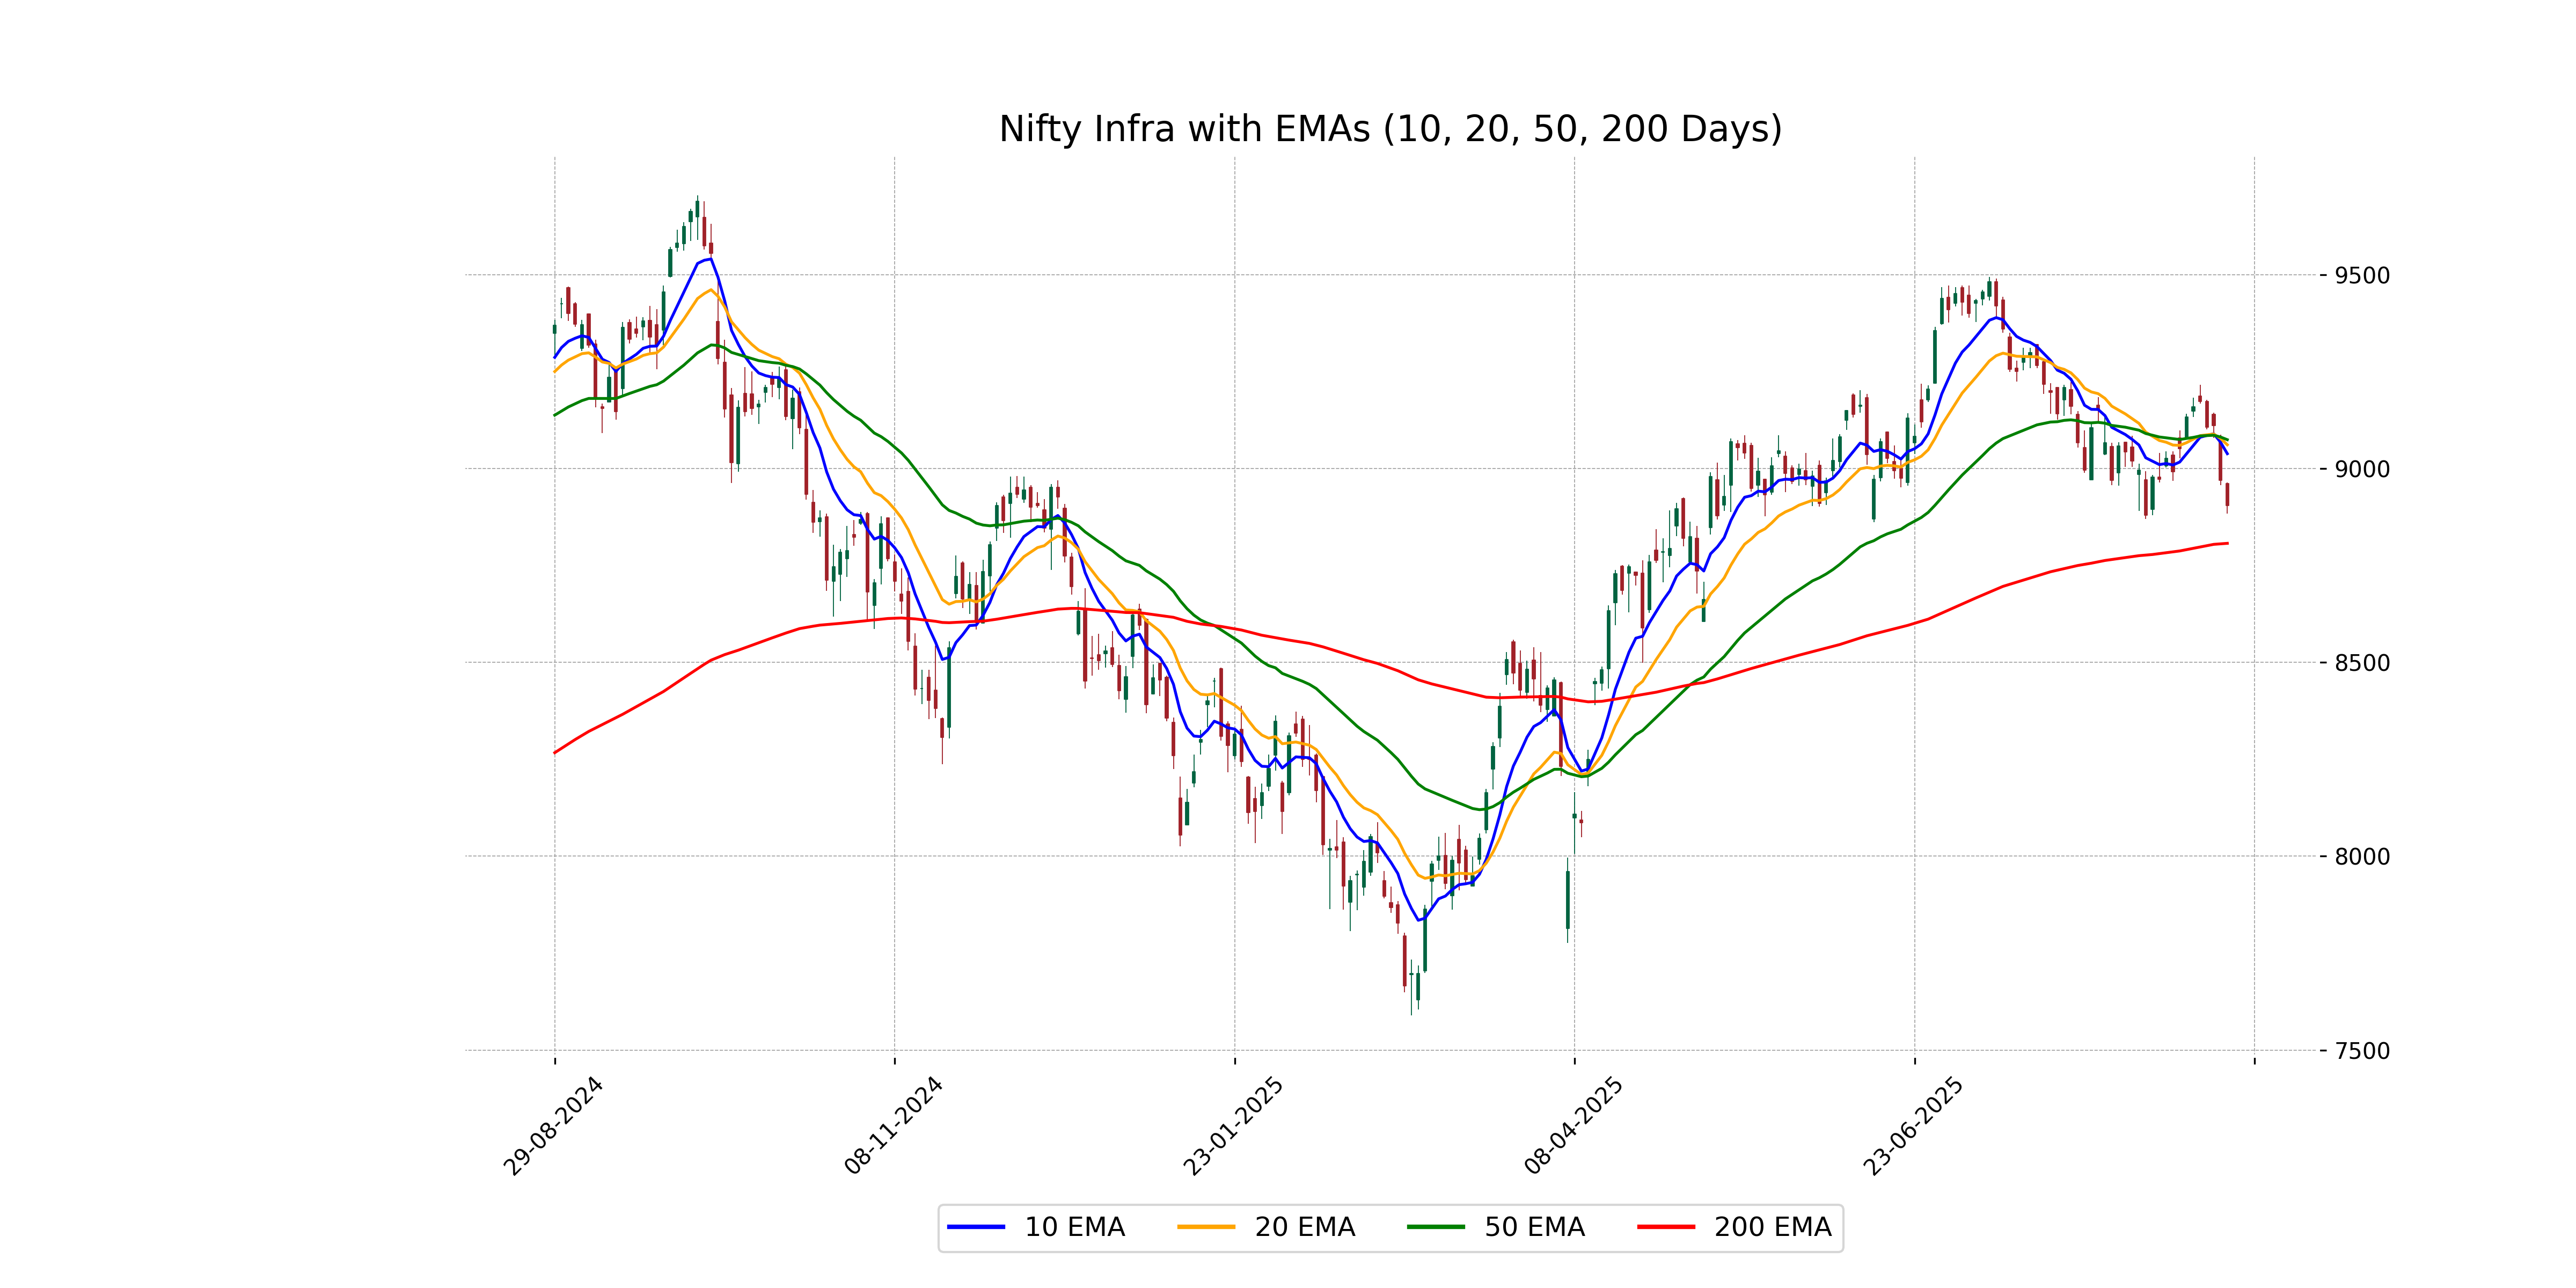
Relationship with Key Moving Averages
Nifty Infra closed at 8904.70, which is below its 10 EMA of 9038.30 and 50 EMA of 9074.41 but above its 200 EMA of 8807.07. This indicates a potential short-term weakness as the closing price is below the shorter-term moving averages.
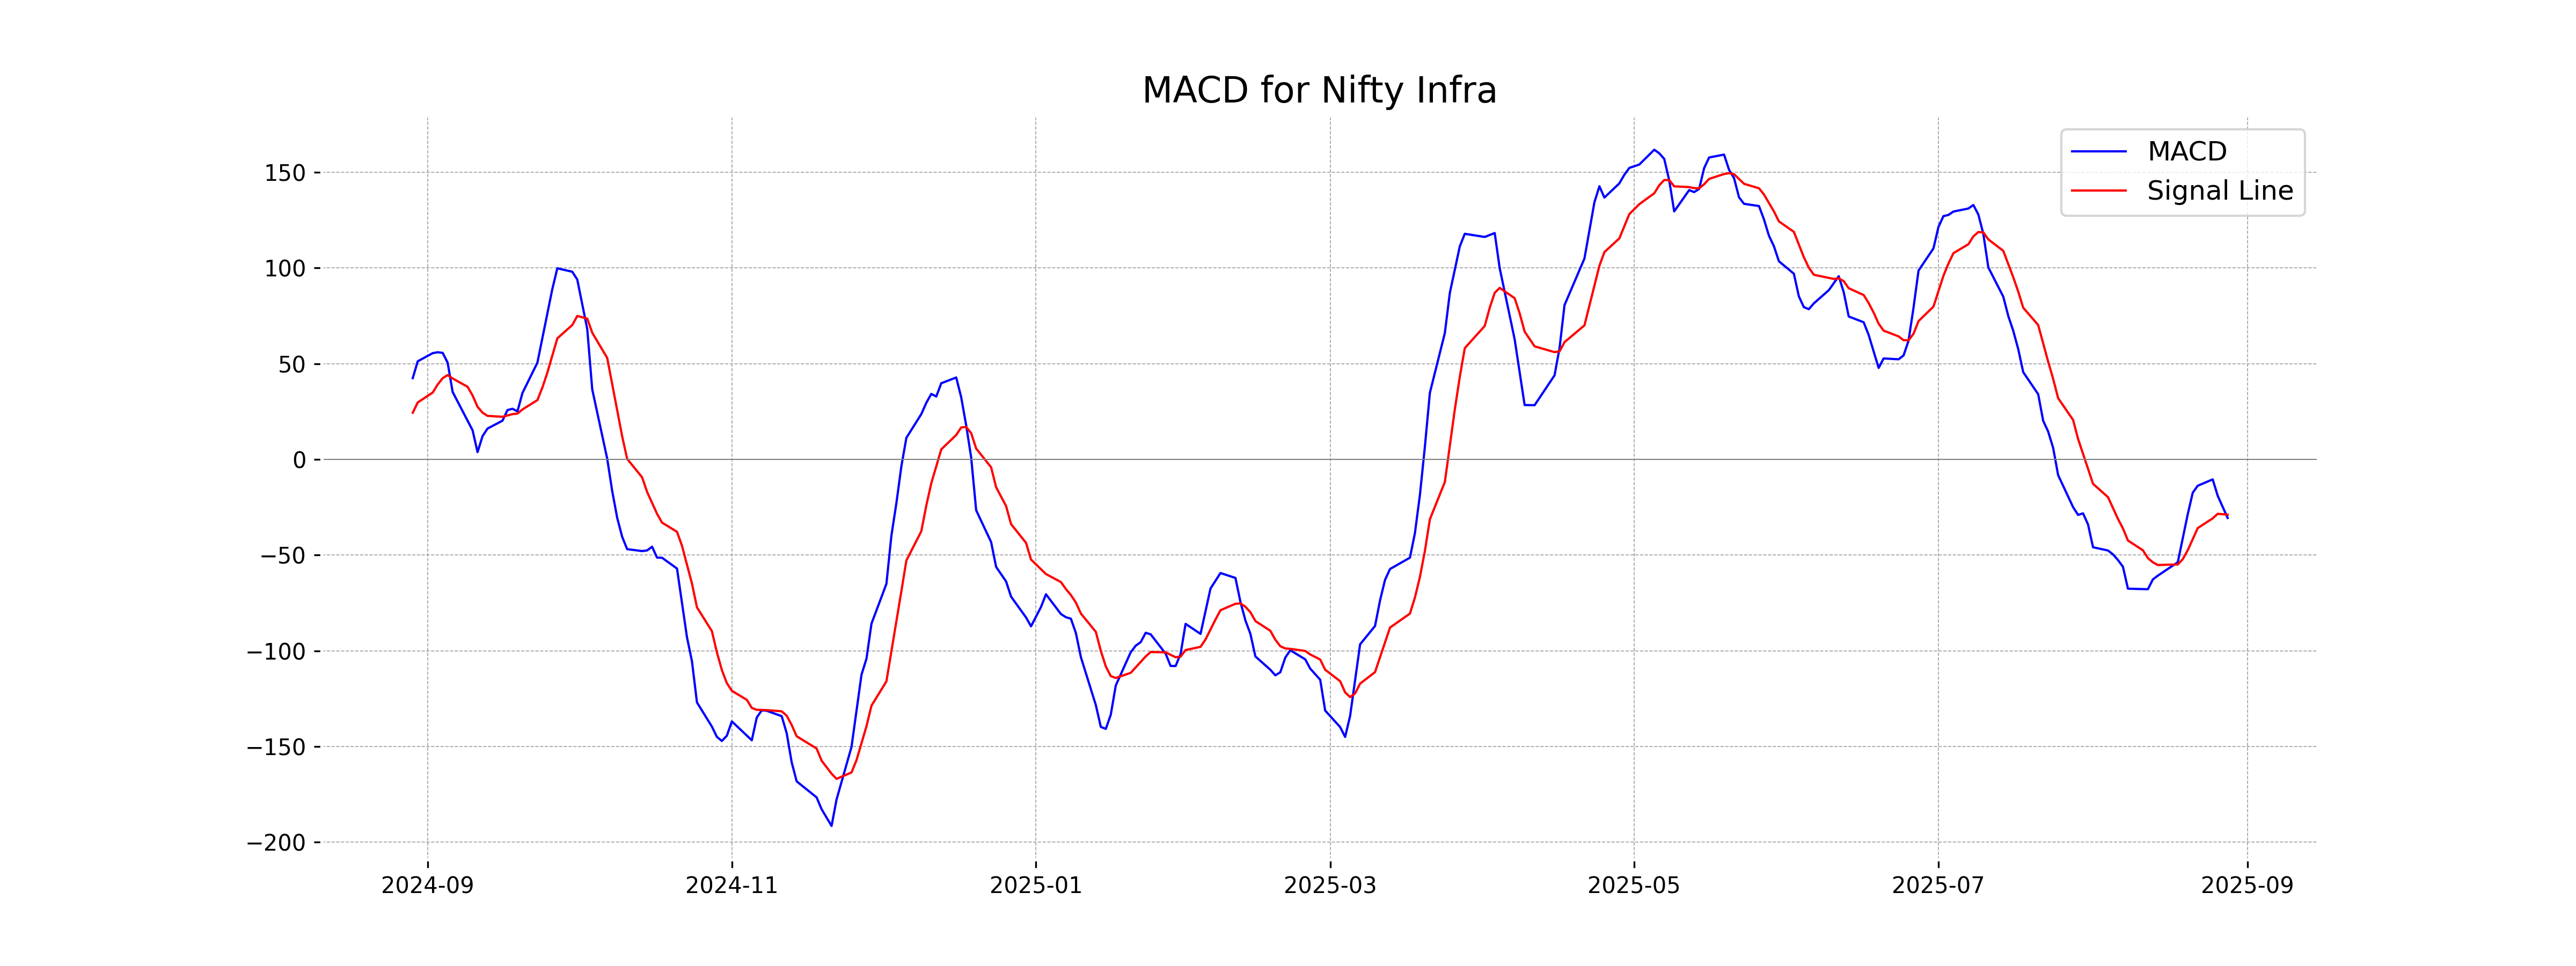
Moving Averages Trend (MACD)
The MACD for Nifty Infra is -30.61, which is below its signal line of -28.89, indicating a bearish momentum. The negative MACD value suggests that the stock could be in a downtrend. Additionally, the RSI of 38.57 further supports potential weakness in the current market conditions for Nifty Infra.
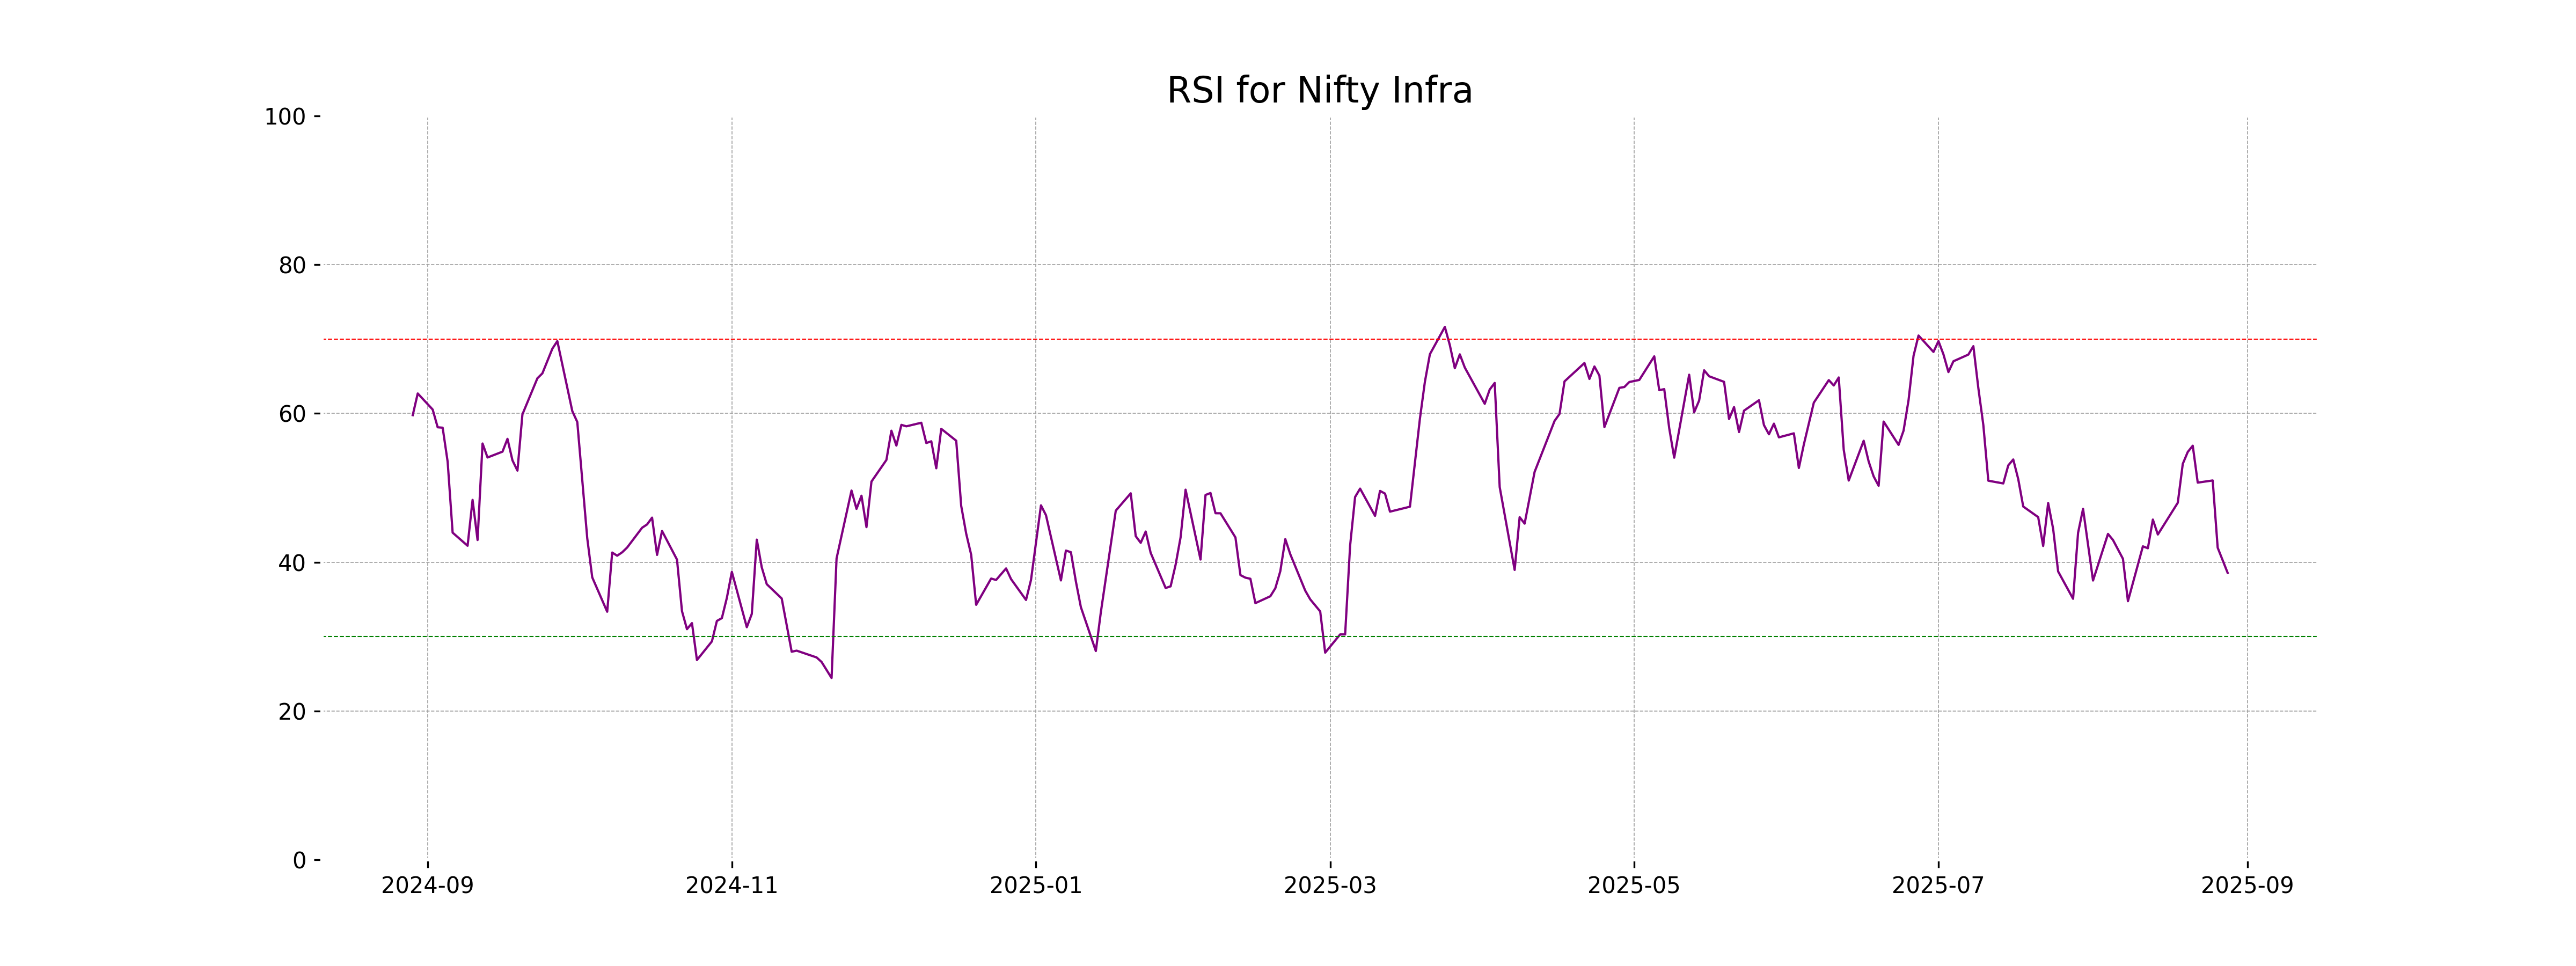
RSI Analysis
The RSI (Relative Strength Index) for Nifty Infra is at 38.57, which suggests that the index is nearing oversold territory. This may indicate potential undervaluation and could suggest a buying opportunity if other technical indicators align. However, investors should consider other factors before making decisions.
Analysis for Nifty IT - August 28, 2025
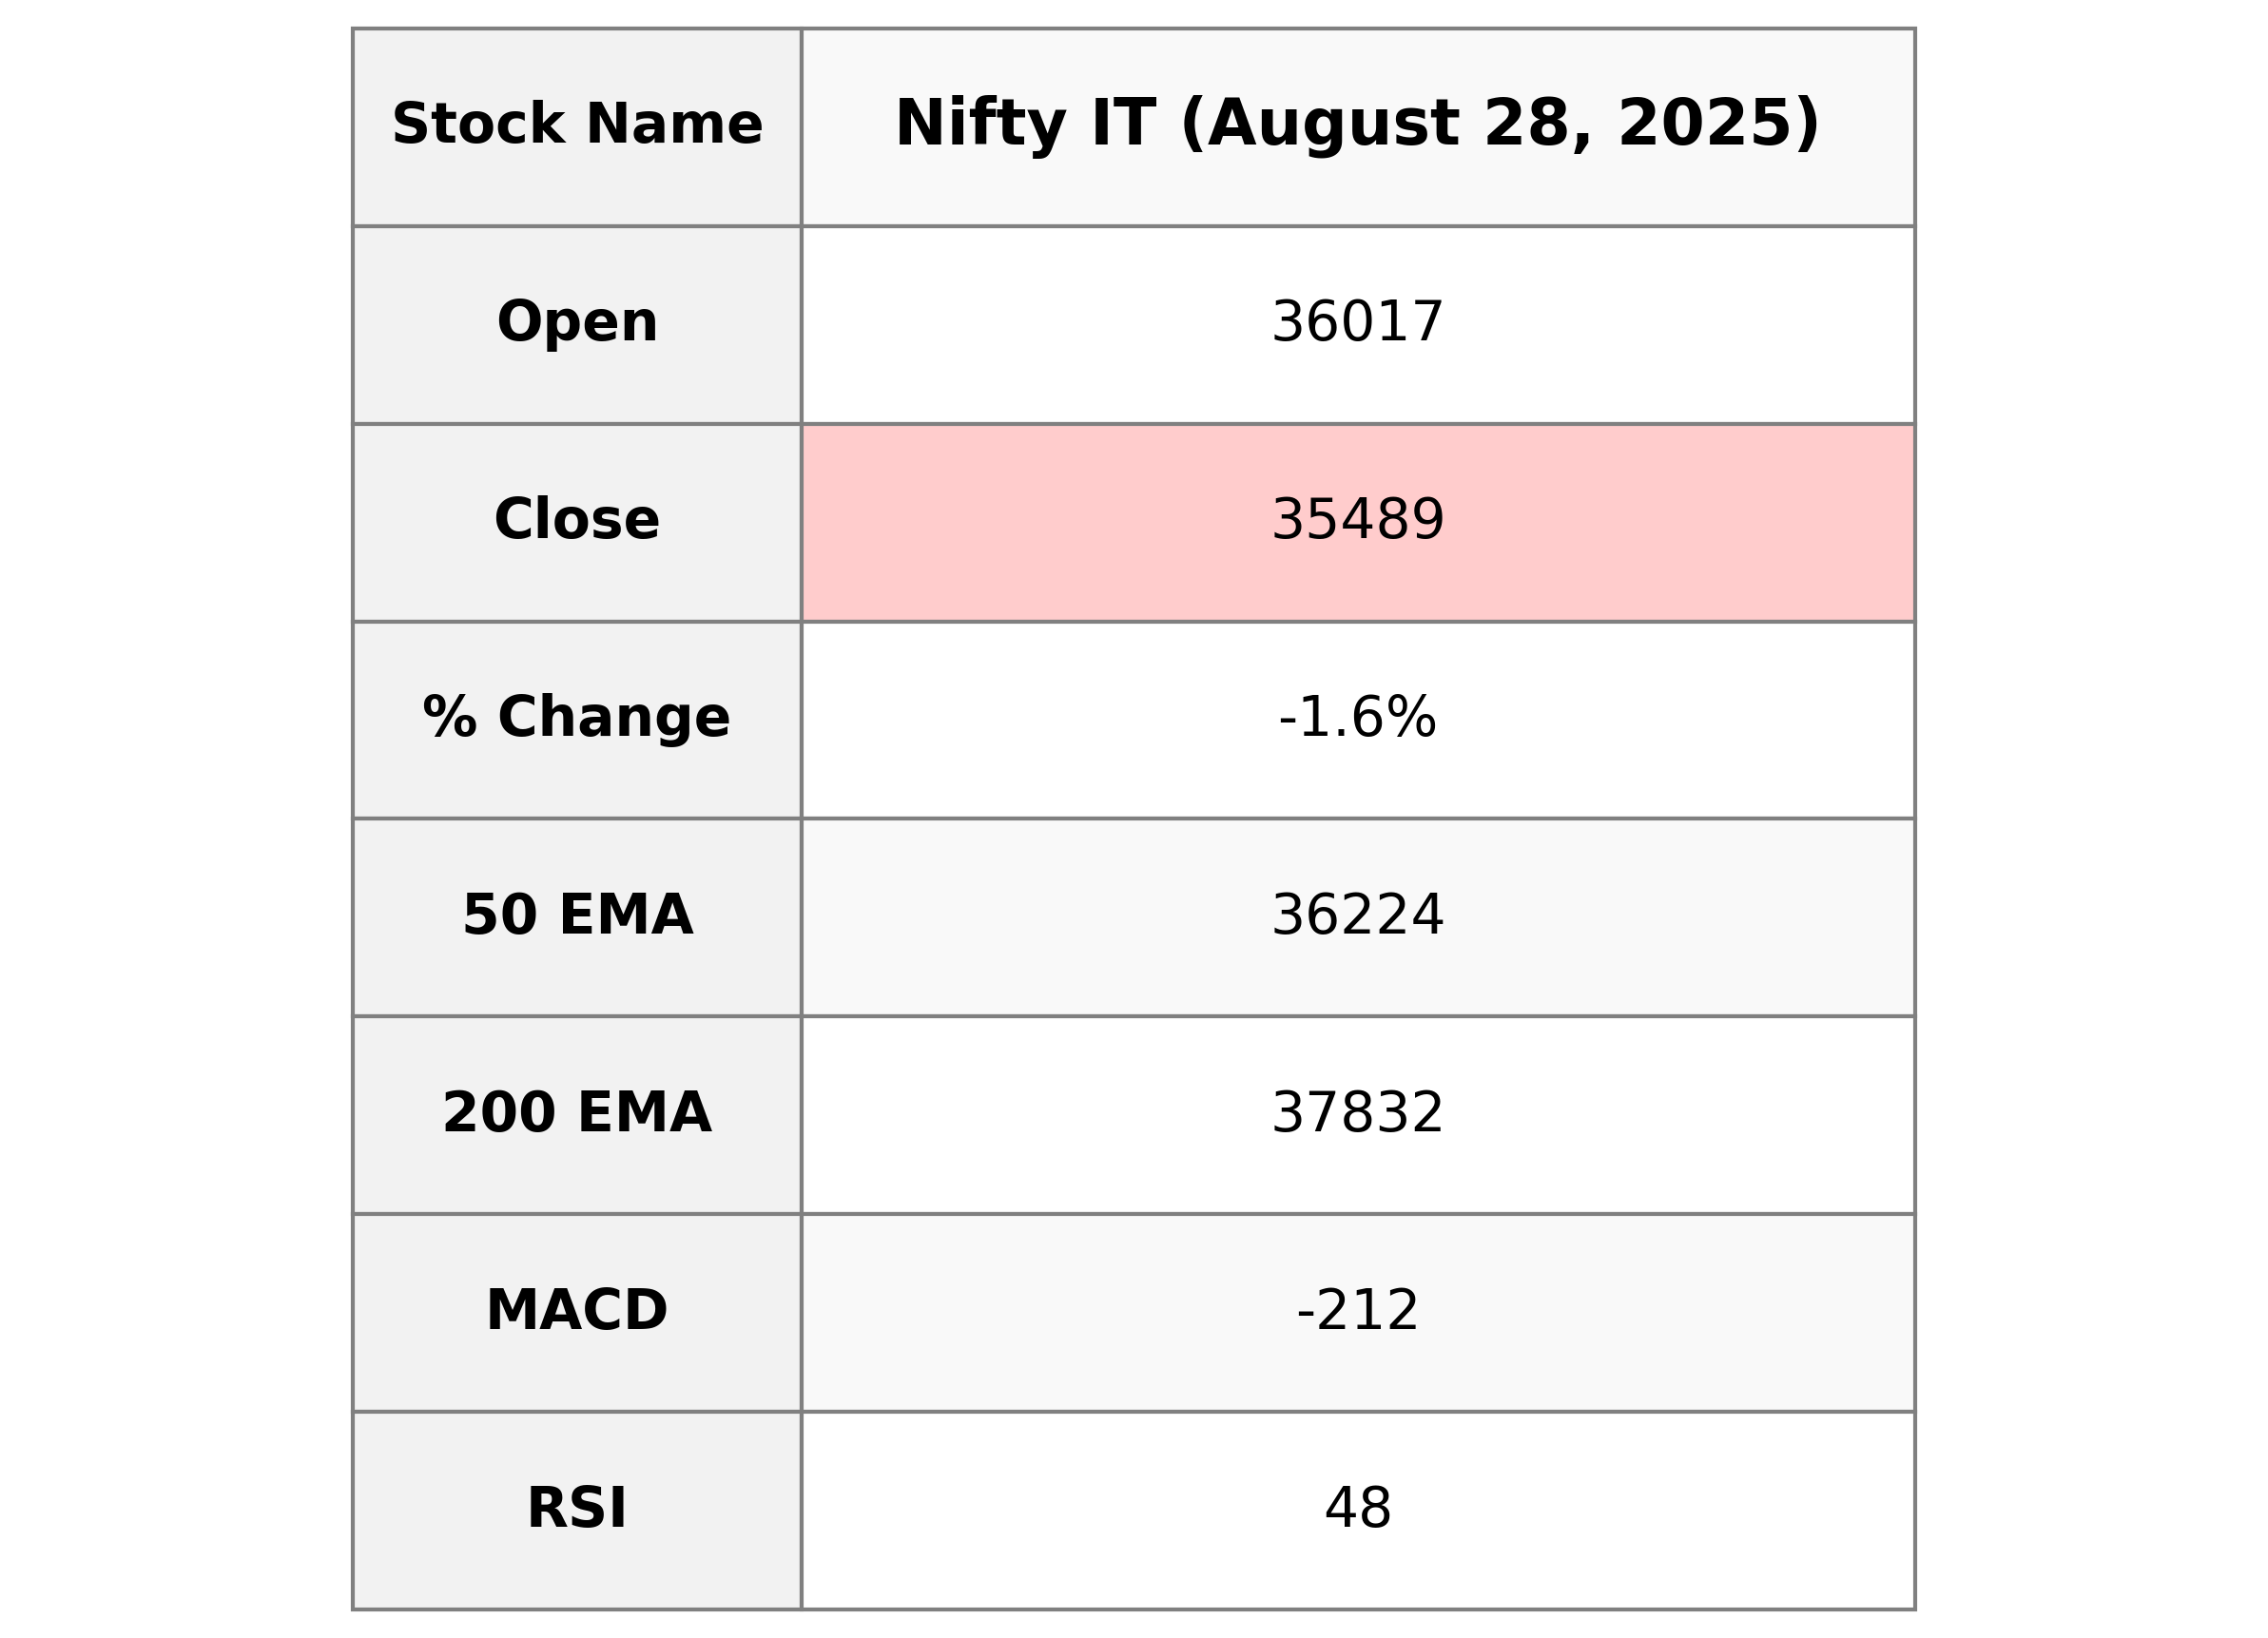
Nifty IT opened at 36,017.15 and closed lower at 35,488.75, marking a drop of approximately 1.59%. There was a points change of -574.45 with no recorded volume for the day. The 10 EMA is at 35,498.18, and the 20 EMA is 35,530.33, indicating short-term movements are below longer-term indicators. The RSI stands at 47.53, suggesting the index is nearing oversold territory.
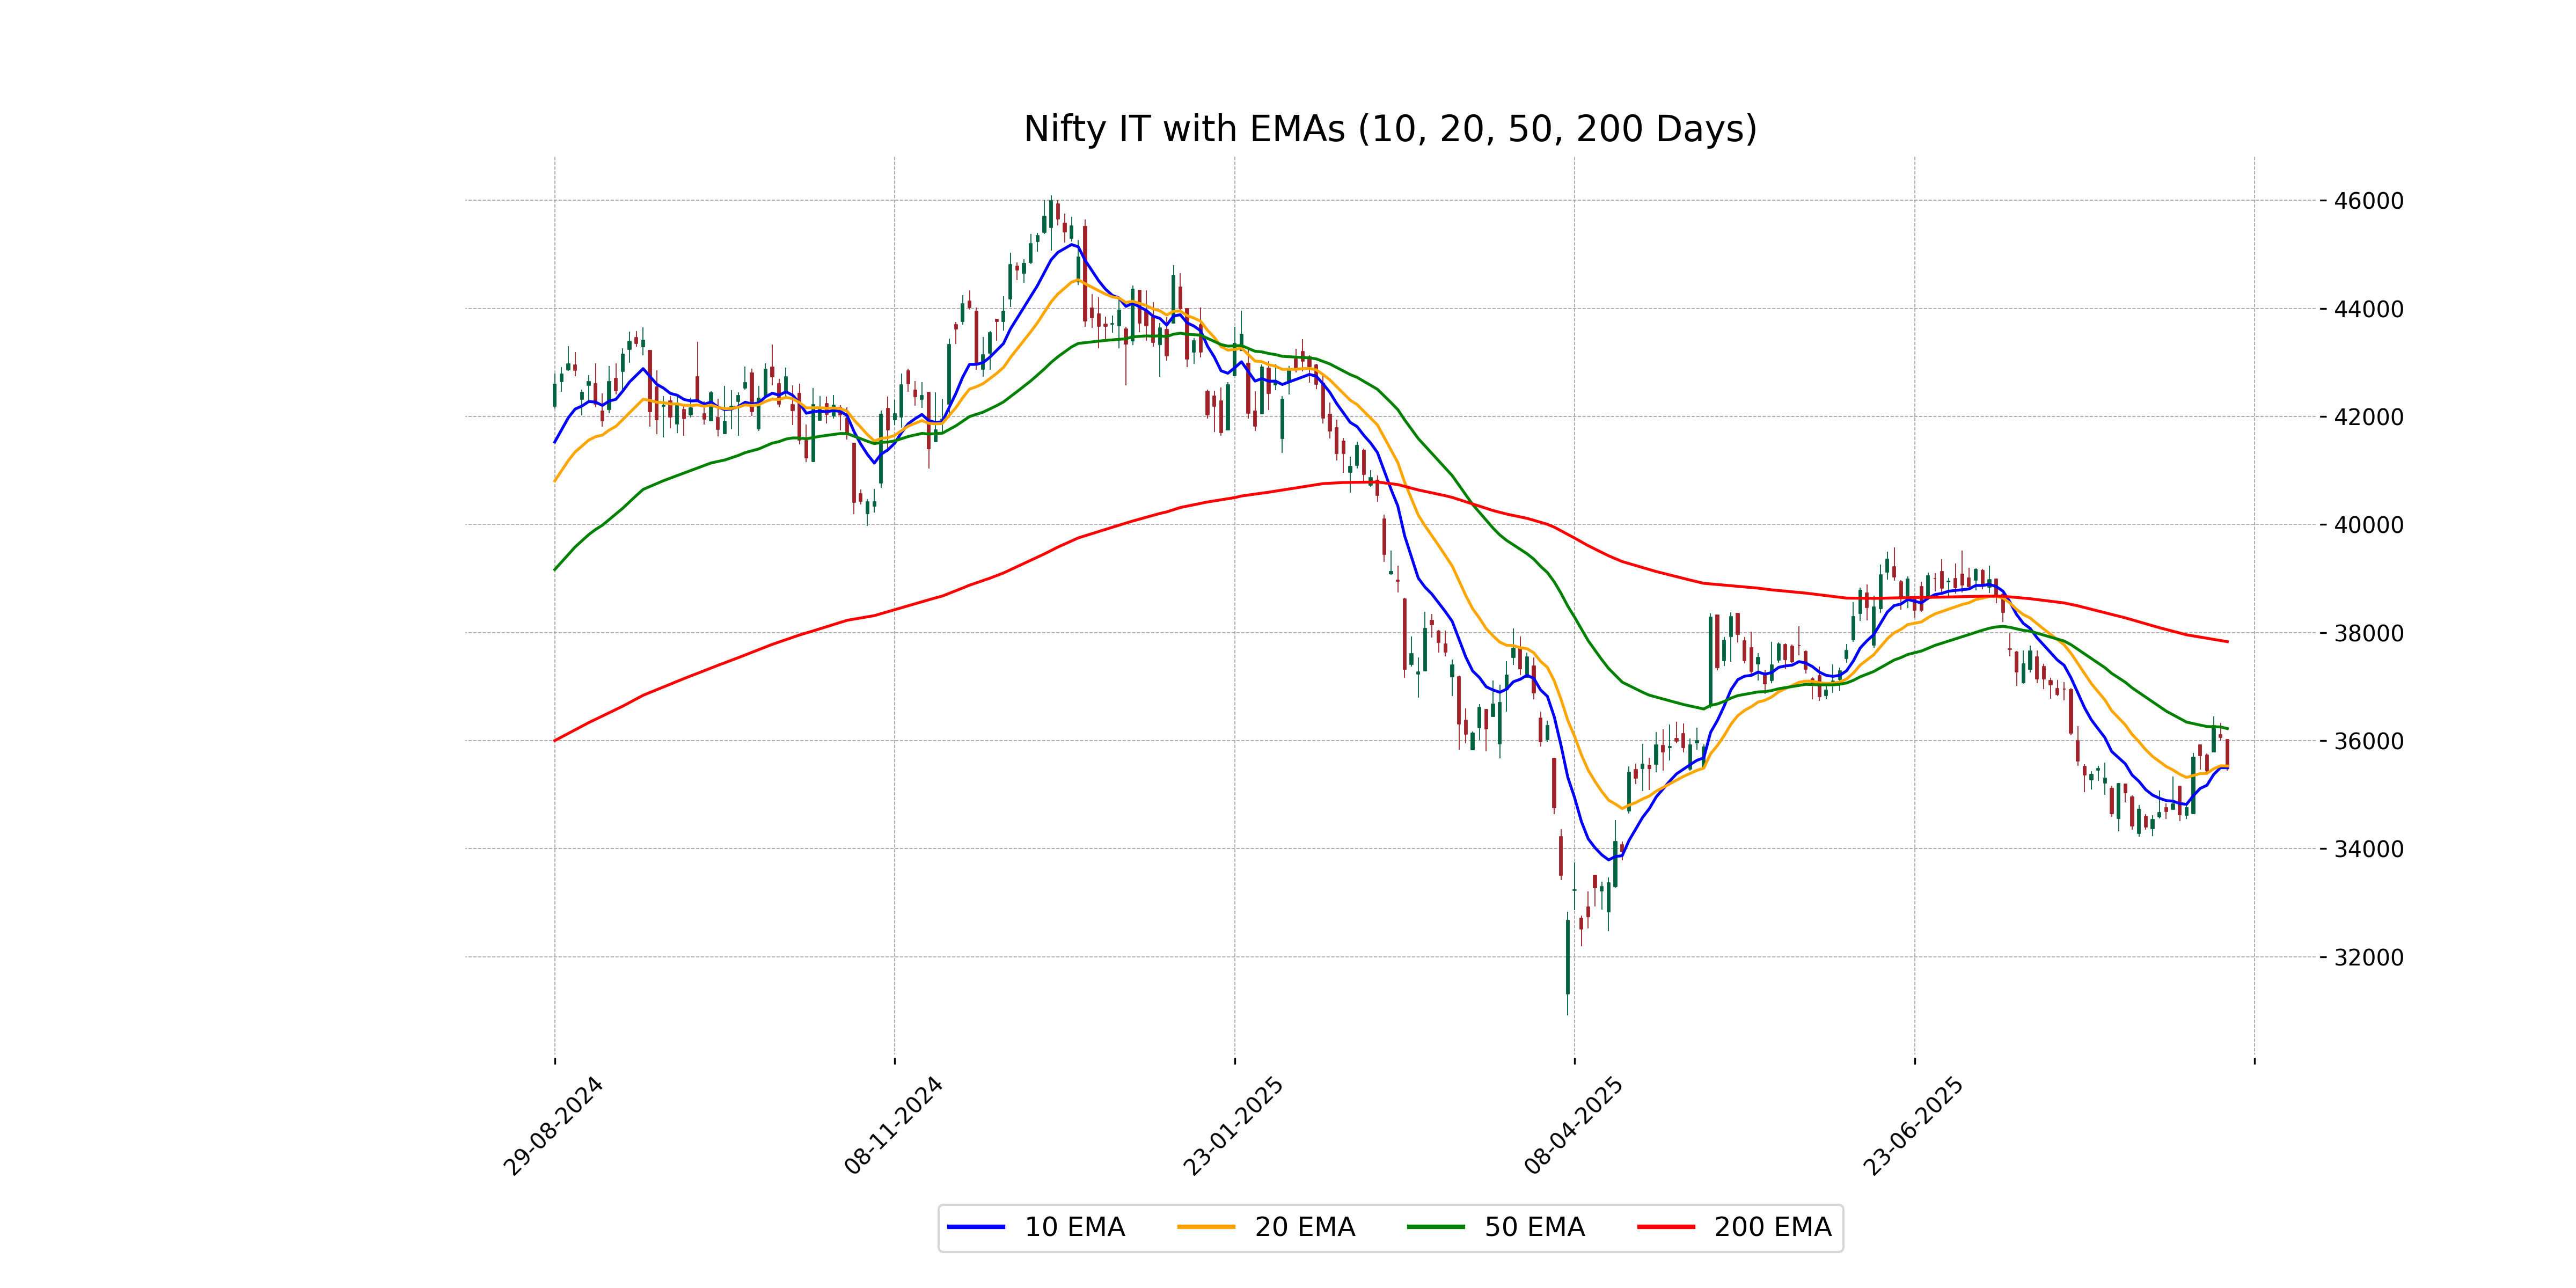
Relationship with Key Moving Averages
The Nifty IT index closed at 35488.75, which is below its 50 EMA of 36223.85 and significantly below the 200 EMA of 37831.99, indicating a bearish trend. However, it is quite close to its 10 EMA of 35498.18 and 20 EMA of 35530.33, suggesting a potential consolidation or short-term support level near the current closing price.
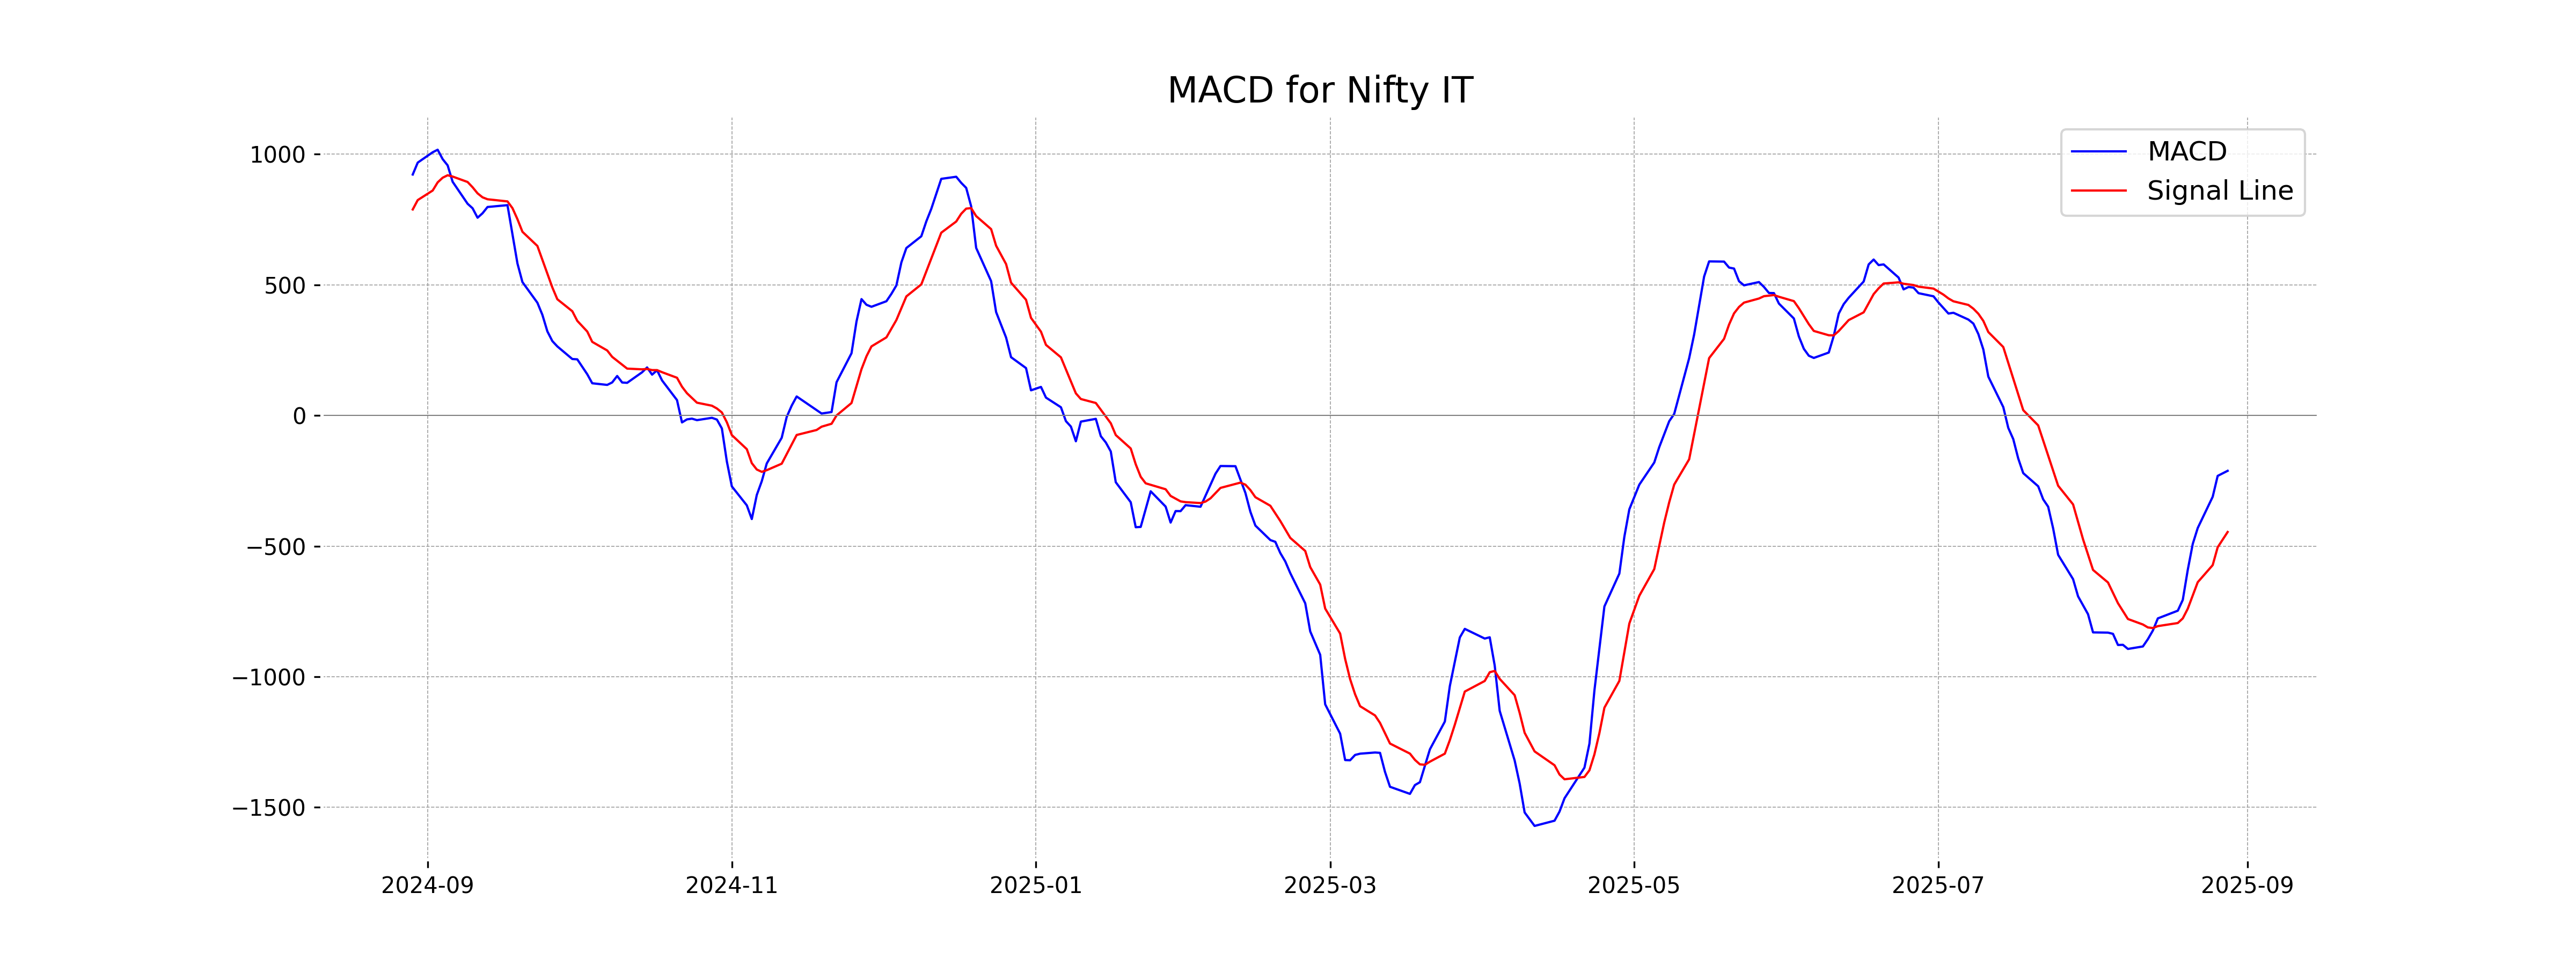
Moving Averages Trend (MACD)
The MACD for Nifty IT is -211.84, and its MACD signal line is -446.02, indicating a possible bullish crossover since the MACD line is above the signal line. However, both values are negative, which suggests that the stock might still be in a bearish phase.
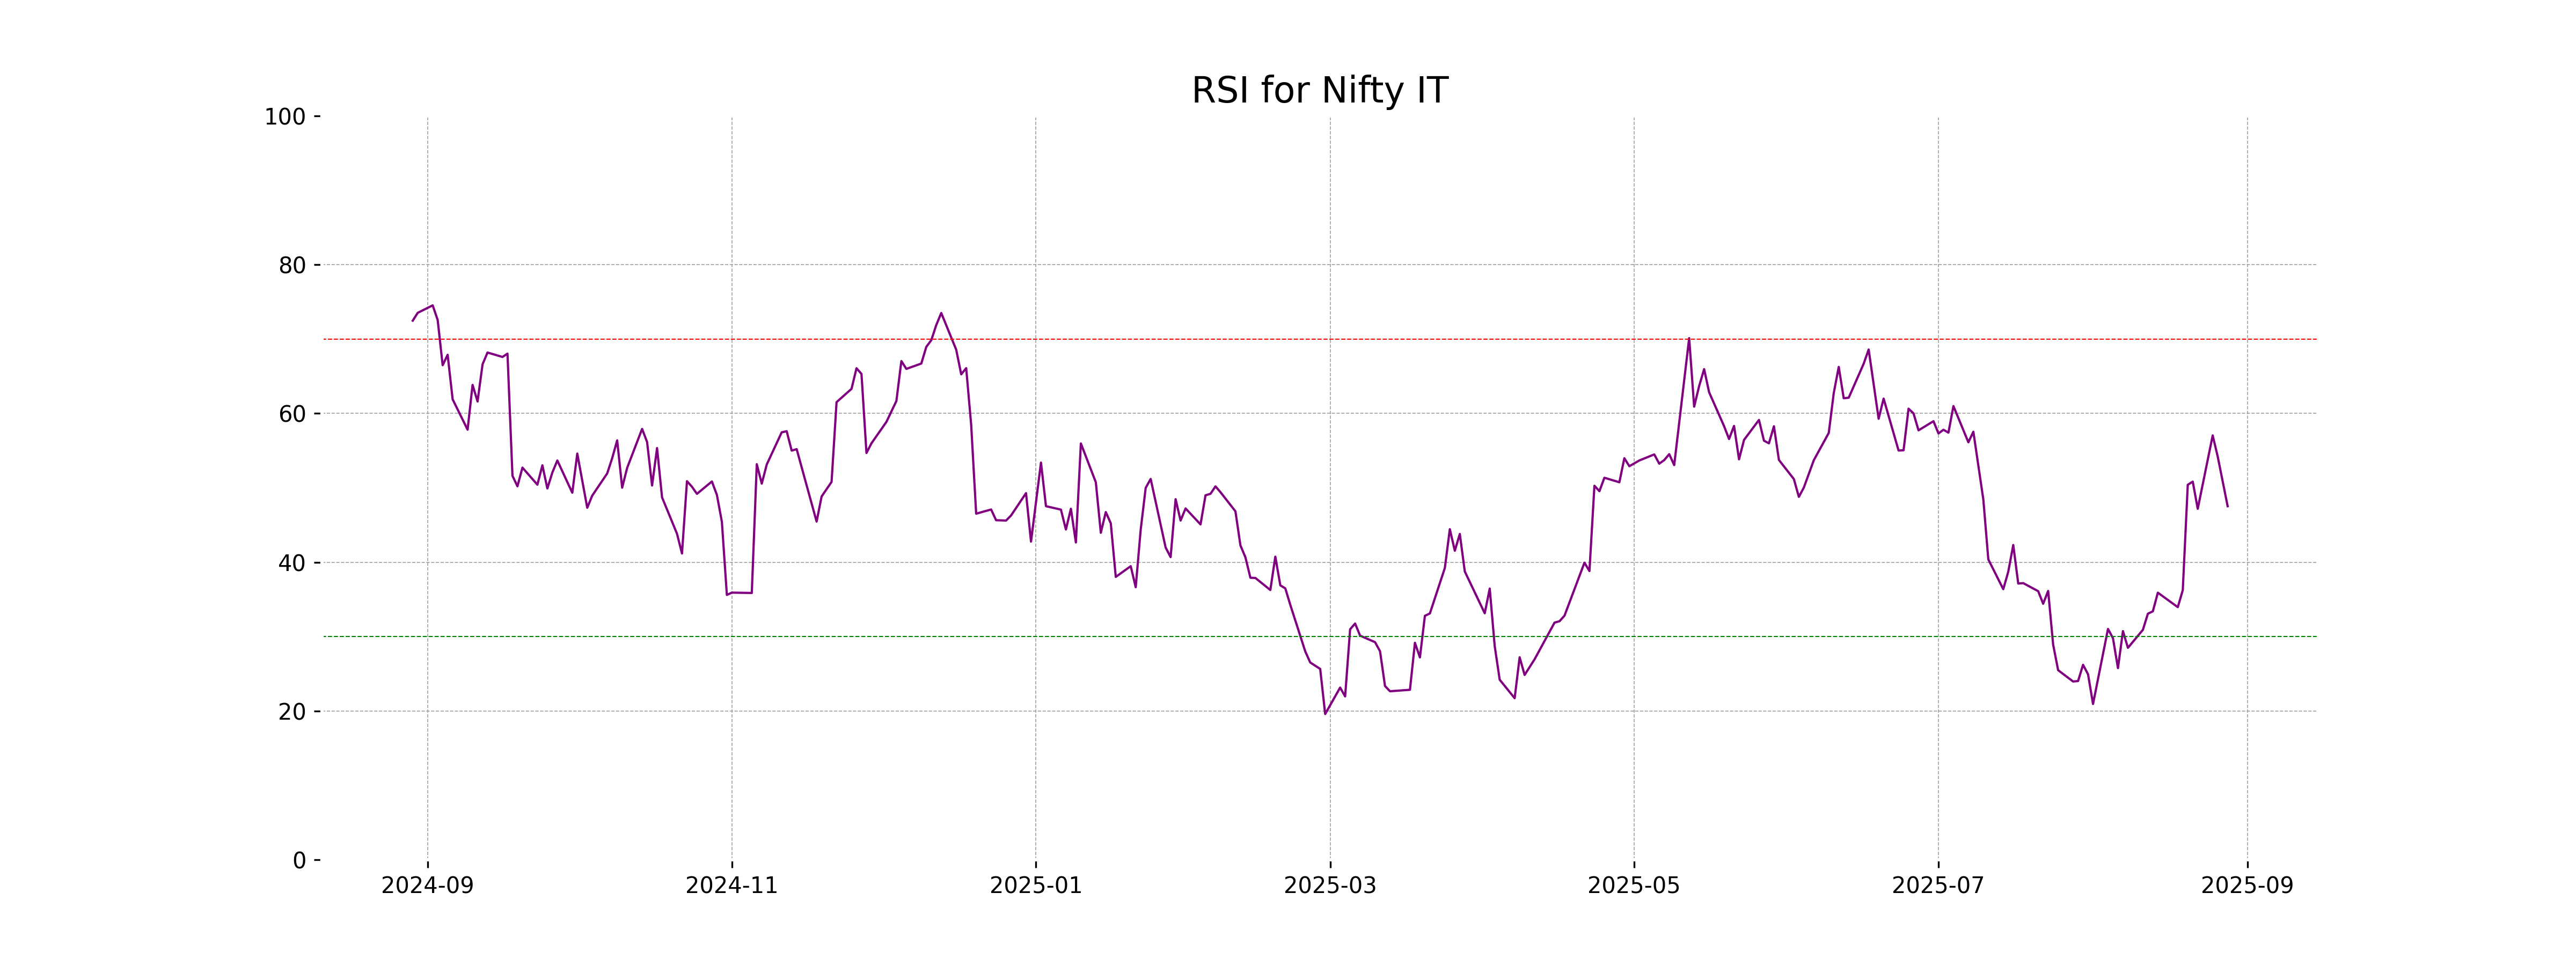
RSI Analysis
RSI analysis for Nifty IT indicates a neutral momentum, with a level of 47.53. This suggests that the index is neither in overbought nor oversold territory. Caution is advised as the RSI is close to the midpoint, indicating potential volatility.
Analysis for Nifty Metal - August 28, 2025
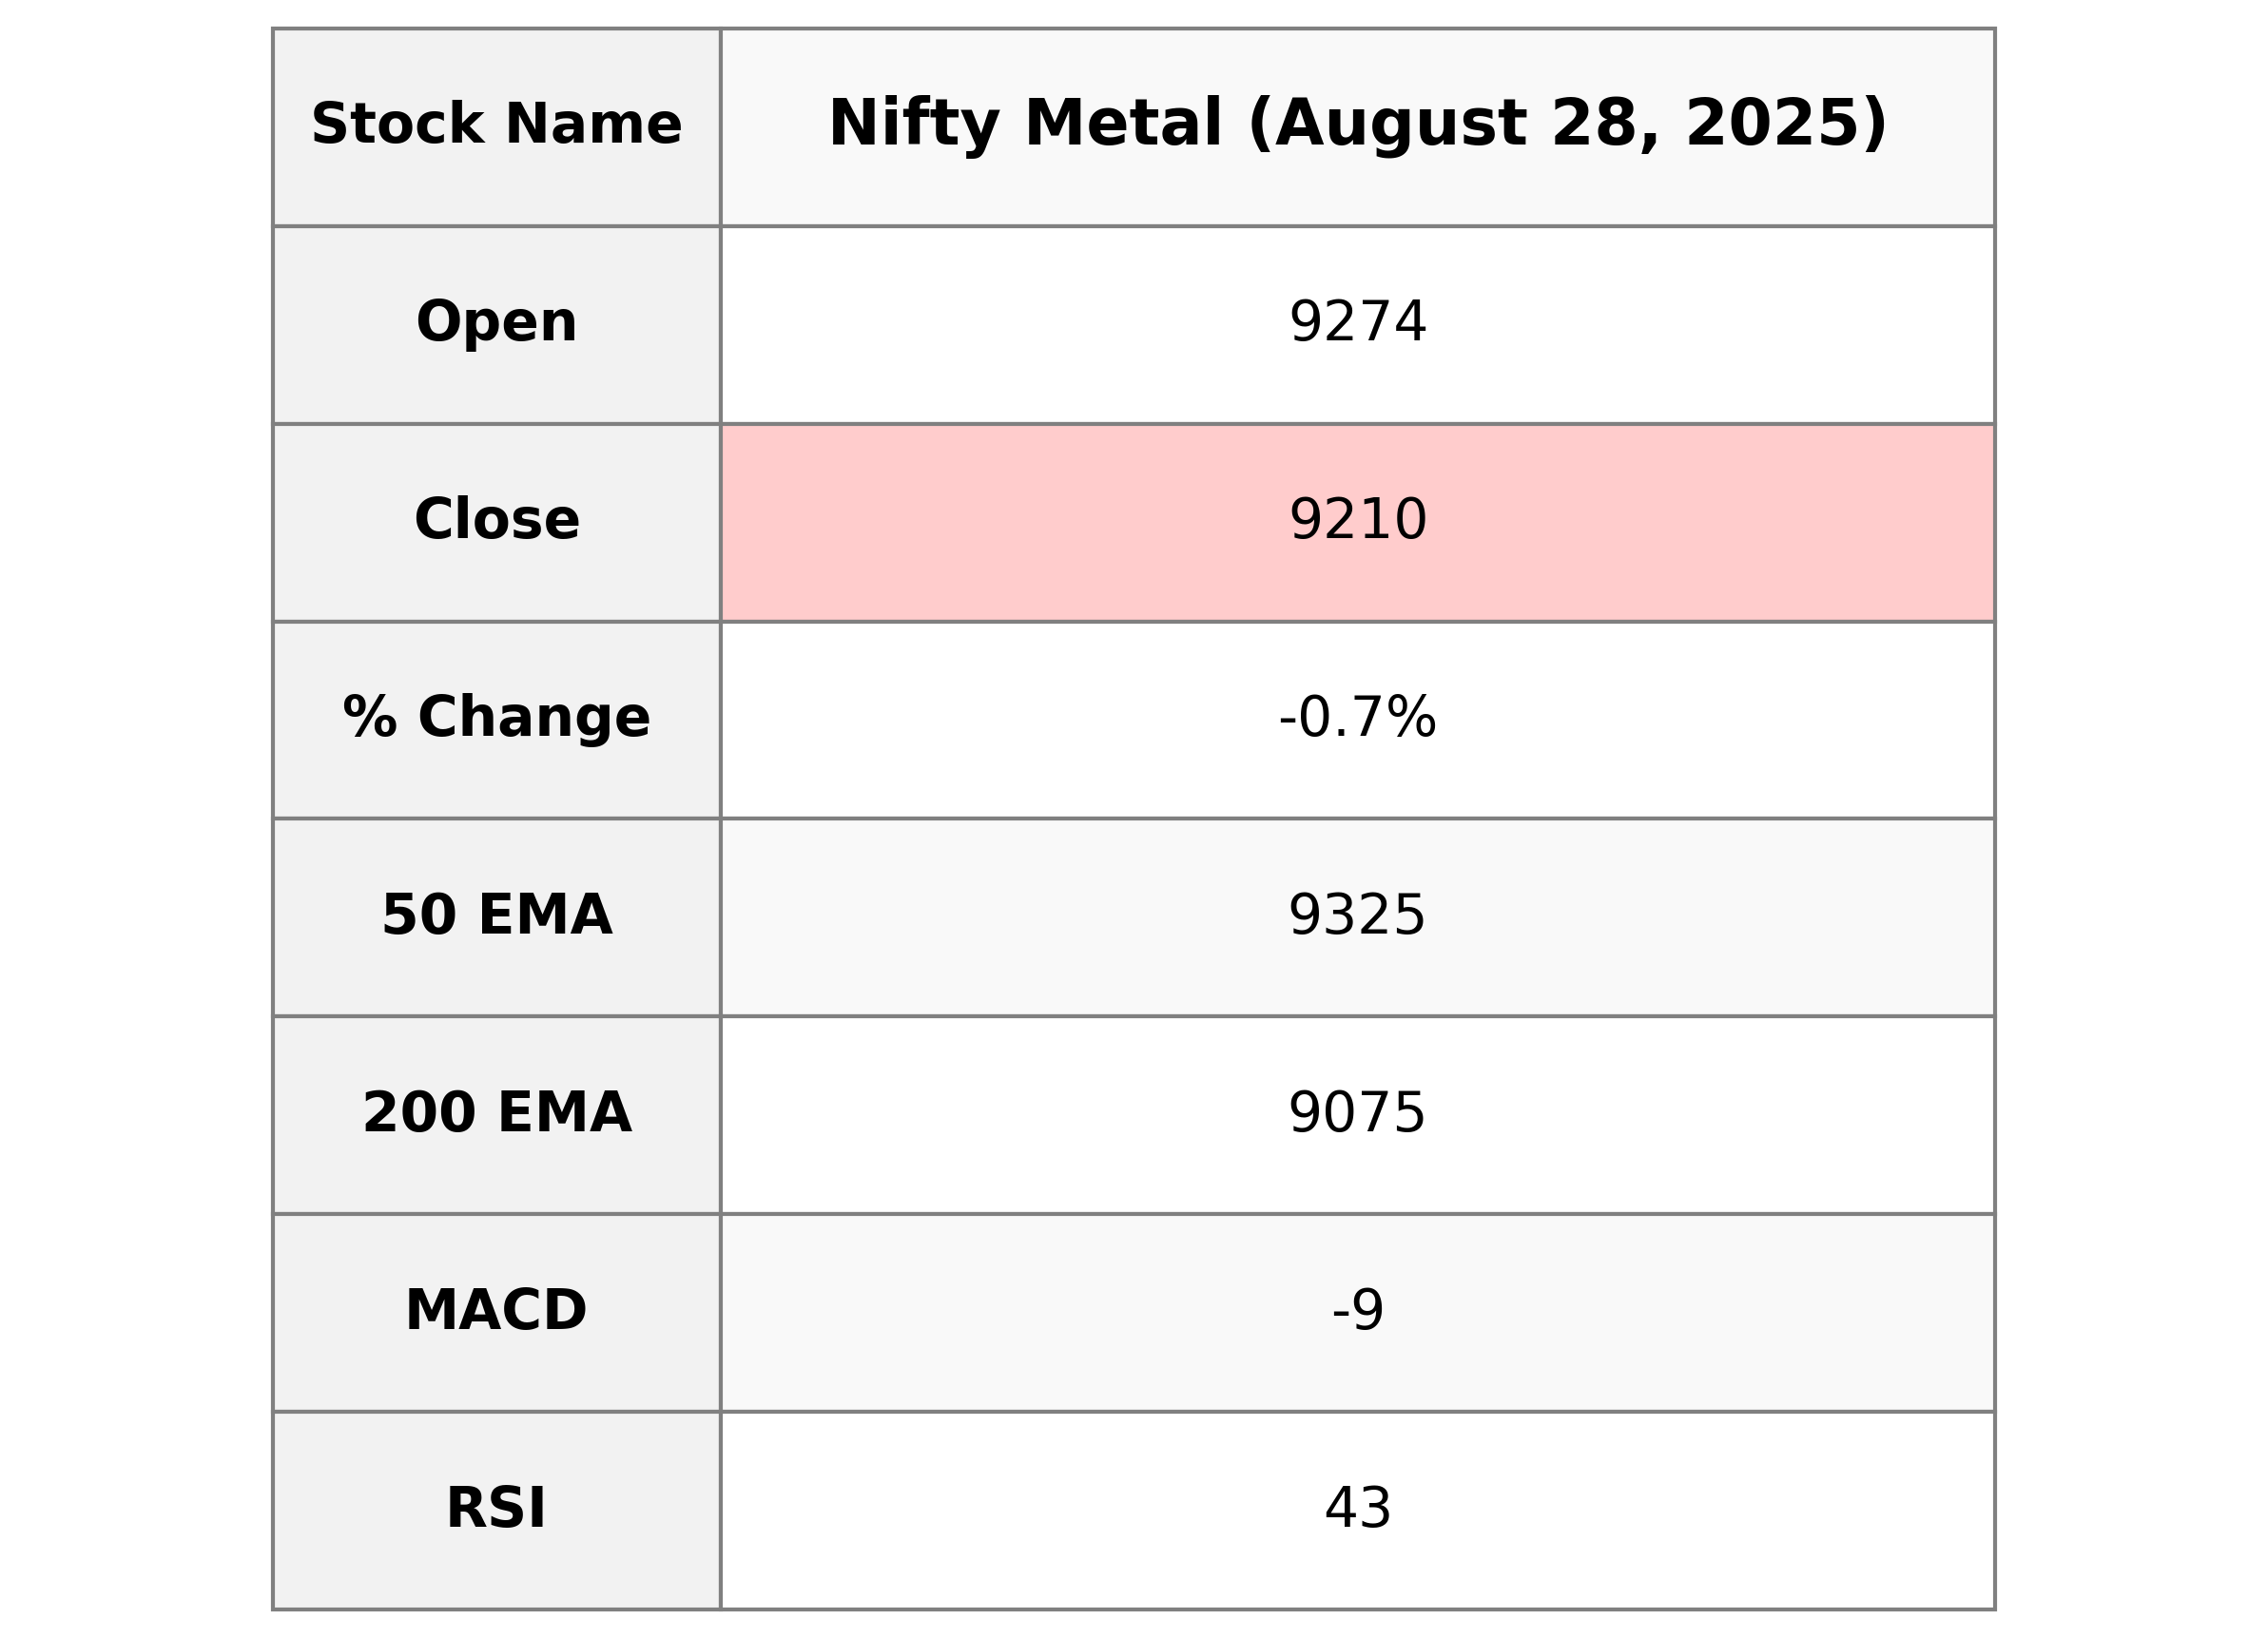
Nifty Metal opened at 9274.10 and closed at 9210.5, reflecting a drop of approximately 0.75% from the previous close of 9280.05. The index experienced a points change of -69.55 with notable resistance around the 50-day EMA of 9325.19. The RSI is at 43.49, indicating a moderate bearish momentum in the market.
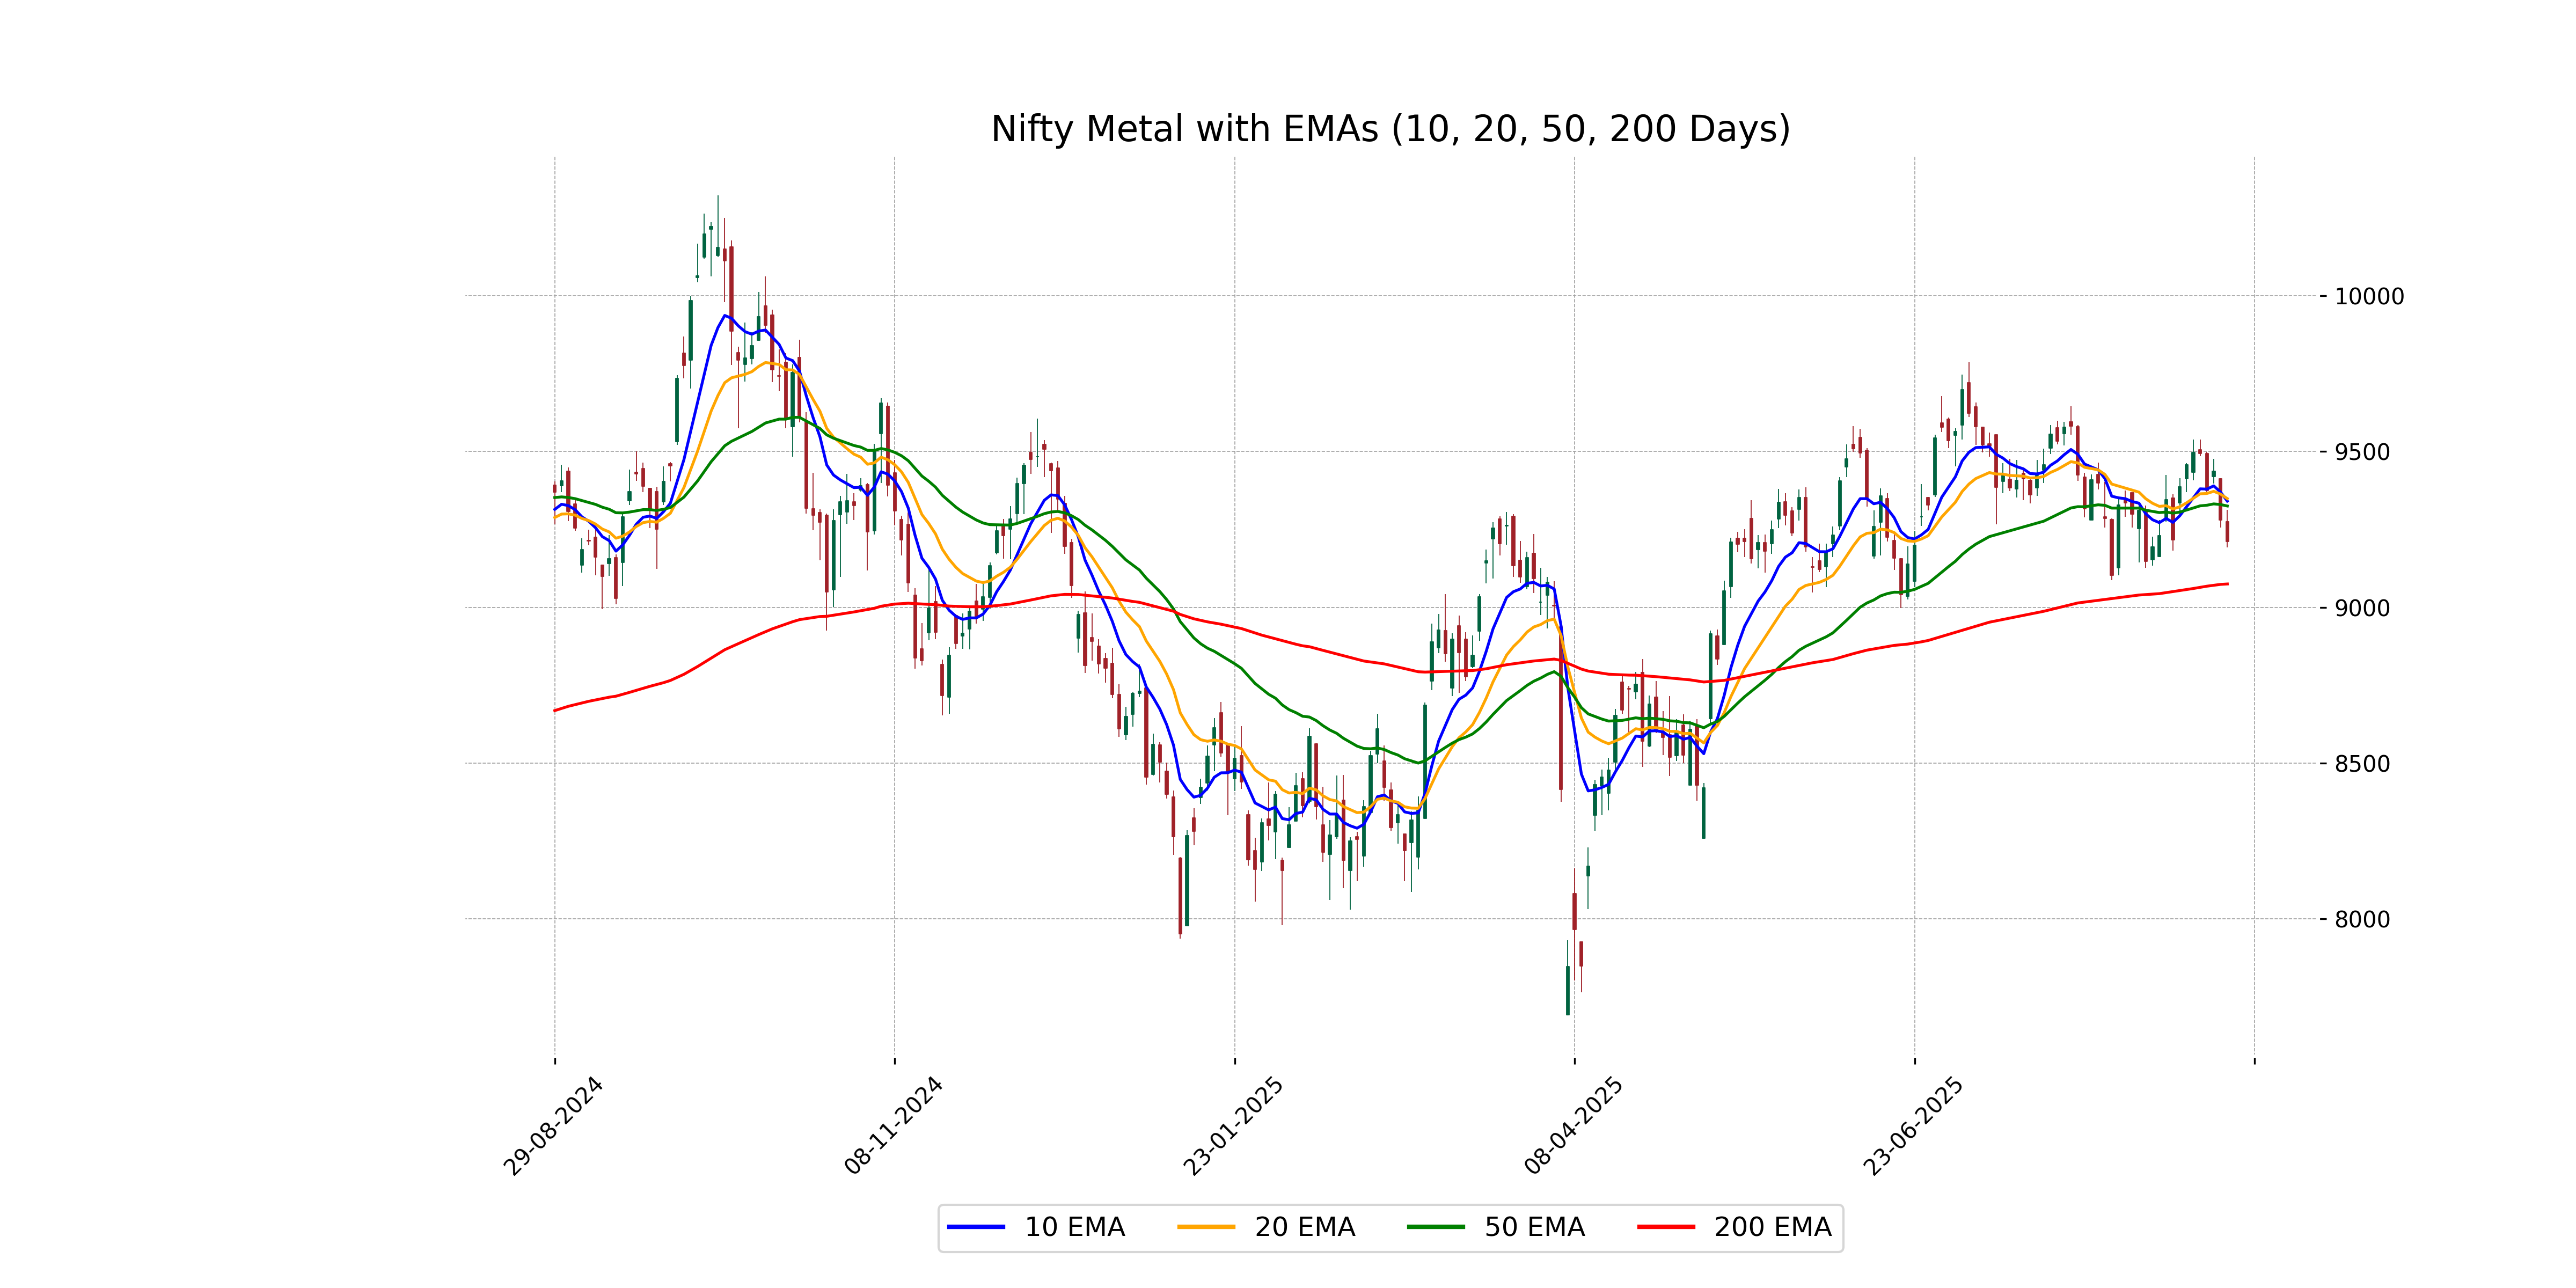
Relationship with Key Moving Averages
For Nifty Metal, the closing price of 9210.5 is below the 50 EMA of 9325.19 and the 10 EMA of 9340.89, indicating a bearish trend in the short to medium term. However, it remains above the 200 EMA of 9074.81, suggesting a longer-term bullish outlook.
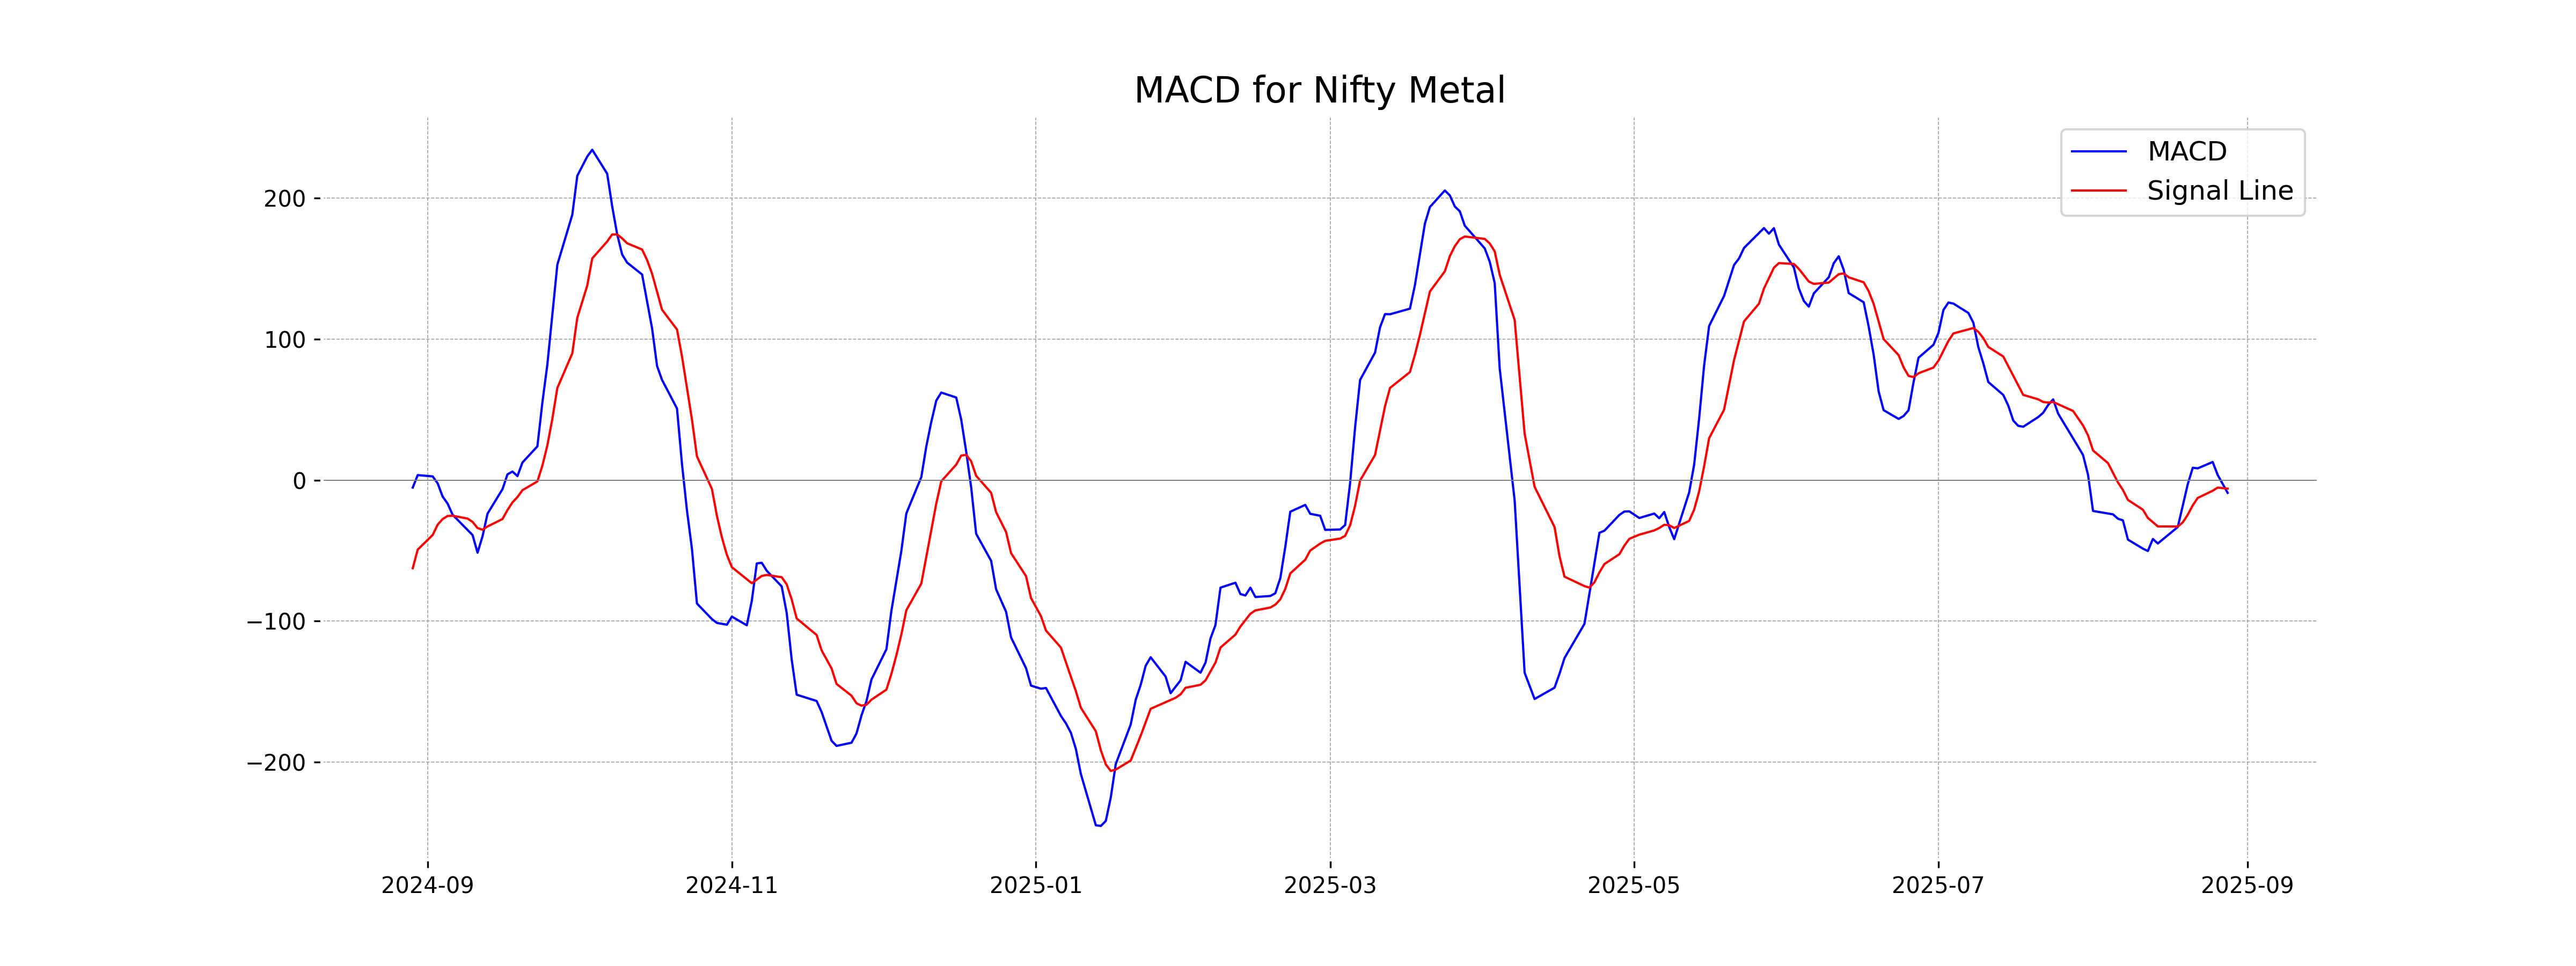
Moving Averages Trend (MACD)
The MACD for Nifty Metal is -8.99, with the MACD Signal at -5.99. The negative MACD and its positioning below the signal line suggest a bearish trend, indicating that the stock may be experiencing downward momentum.
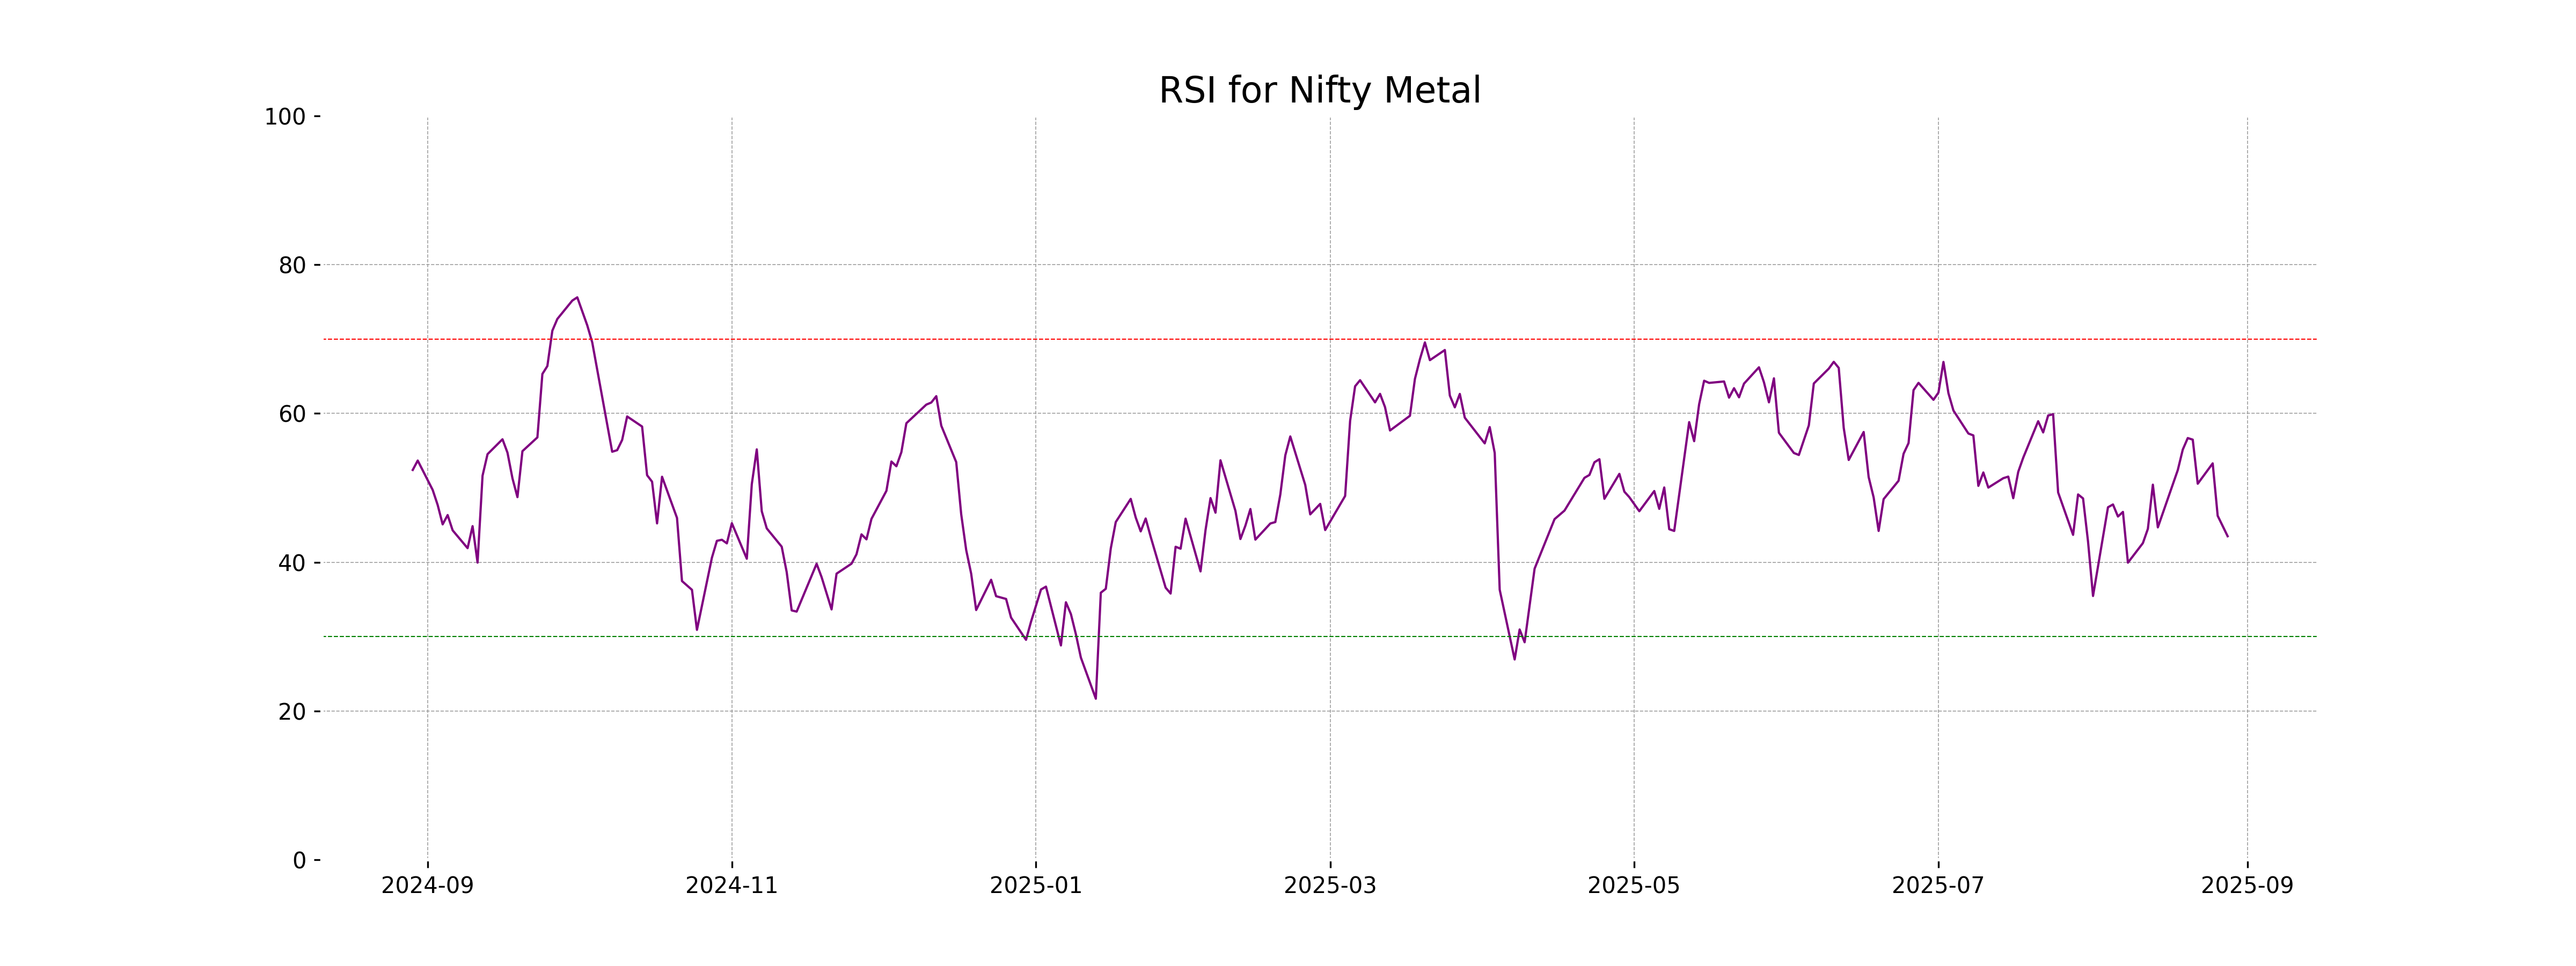
RSI Analysis
The RSI for Nifty Metal is 43.49, indicating a neutral position as it is below 50 but not in the oversold territory, which typically starts at 30. This suggests there might not be a strong trend currently, and traders might watch for further signals to determine market direction.
Analysis for Nifty Bank - August 28, 2025
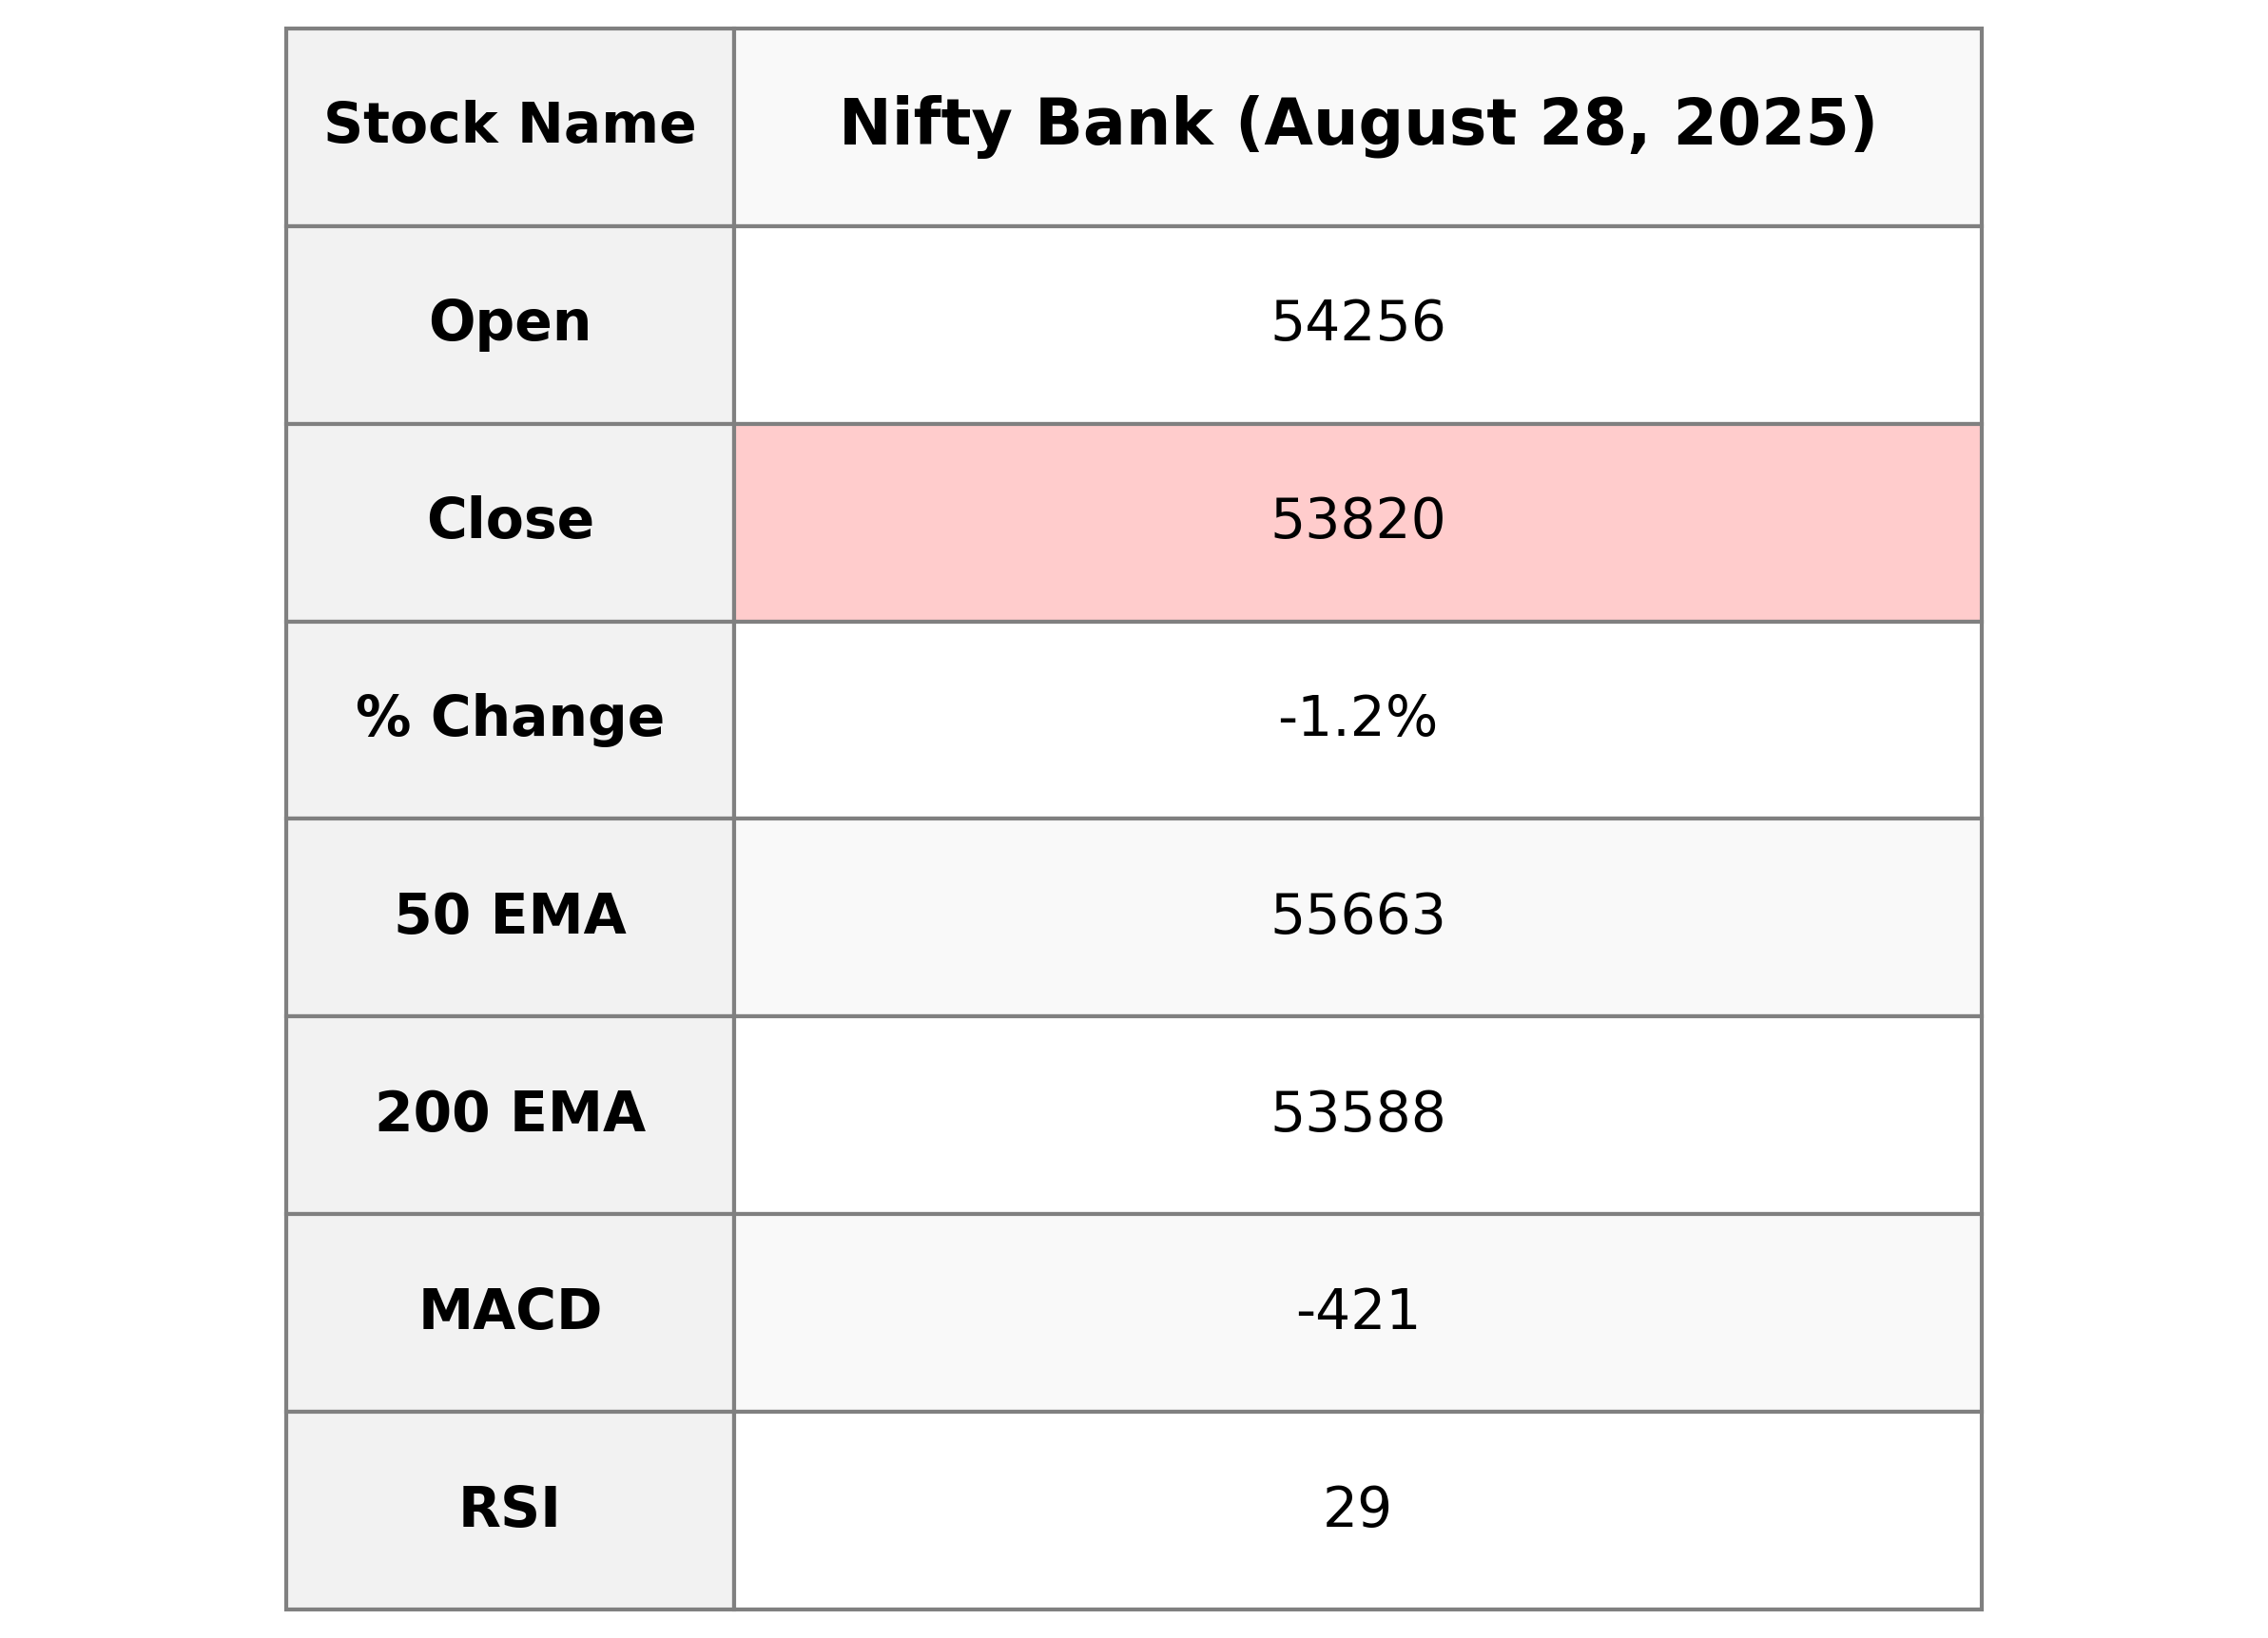
The Nifty Bank index opened at 54,256.00 and closed at 53,820.35, marking a decrease of 630.10 points or -1.16% from the previous close of 54,450.45. The RSI stands at 28.58, indicating oversold conditions, while the MACD is -421.15, suggesting strong bearish momentum.
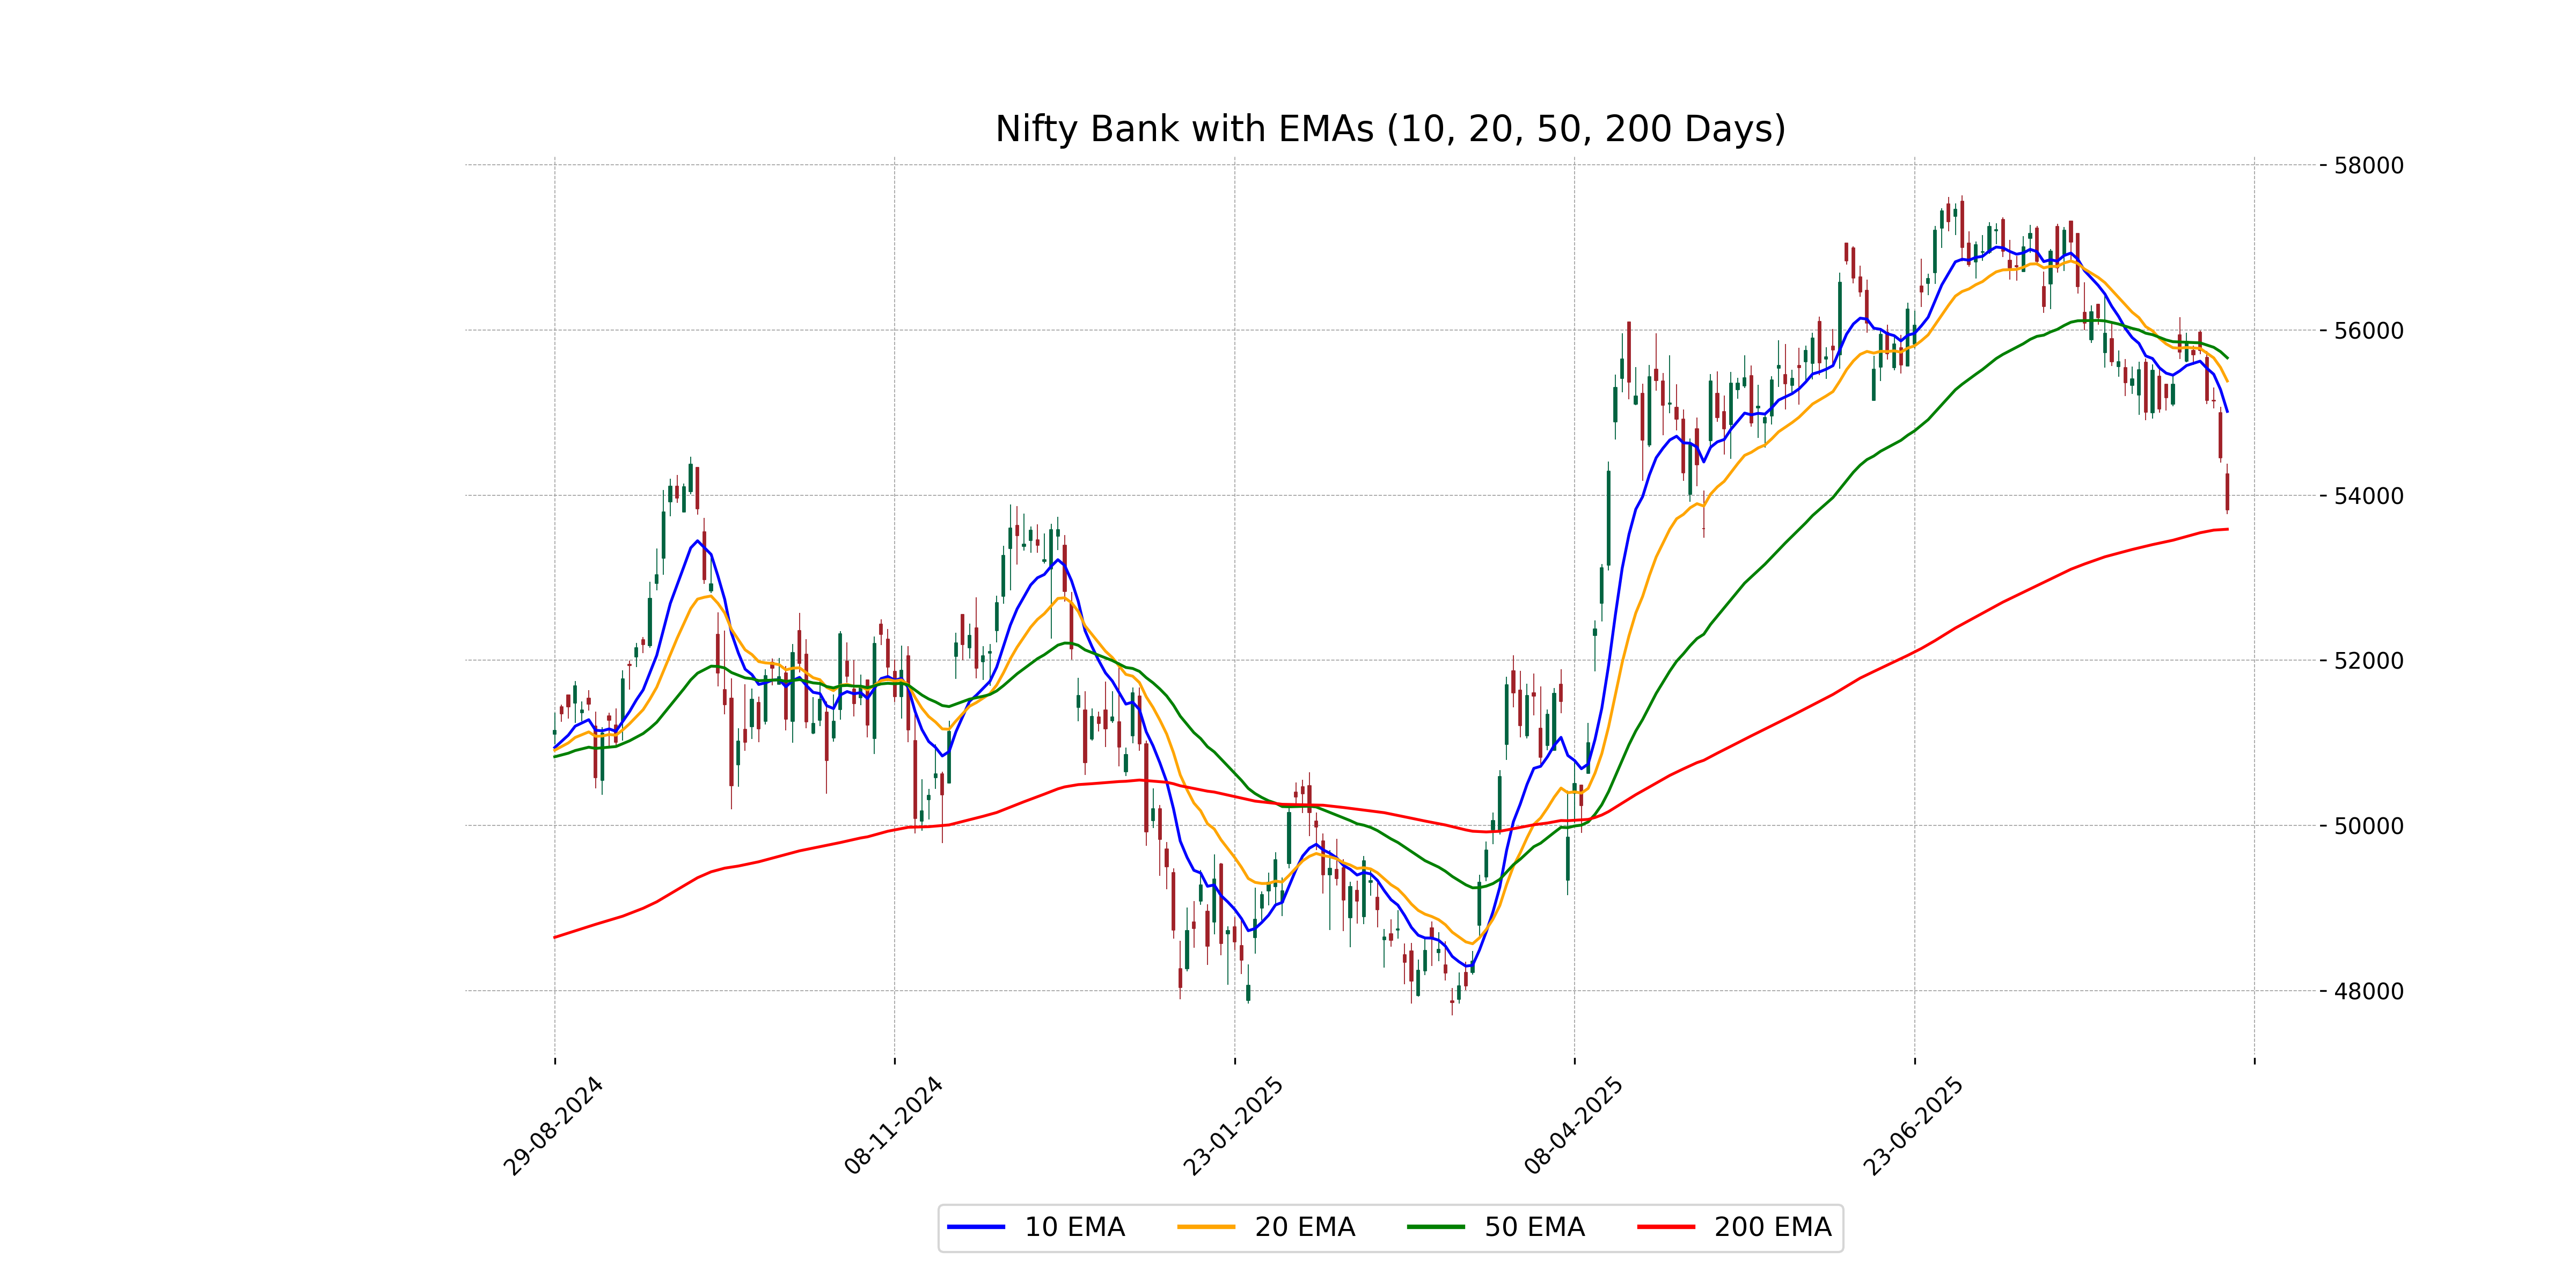
Relationship with Key Moving Averages
Nifty Bank closed below its 50-day EMA of 55662.91 and below the 10-day EMA of 55014.68, indicating short-term bearish sentiment. However, it remains slightly above the 200-day EMA of 53587.73, suggesting some longer-term support.
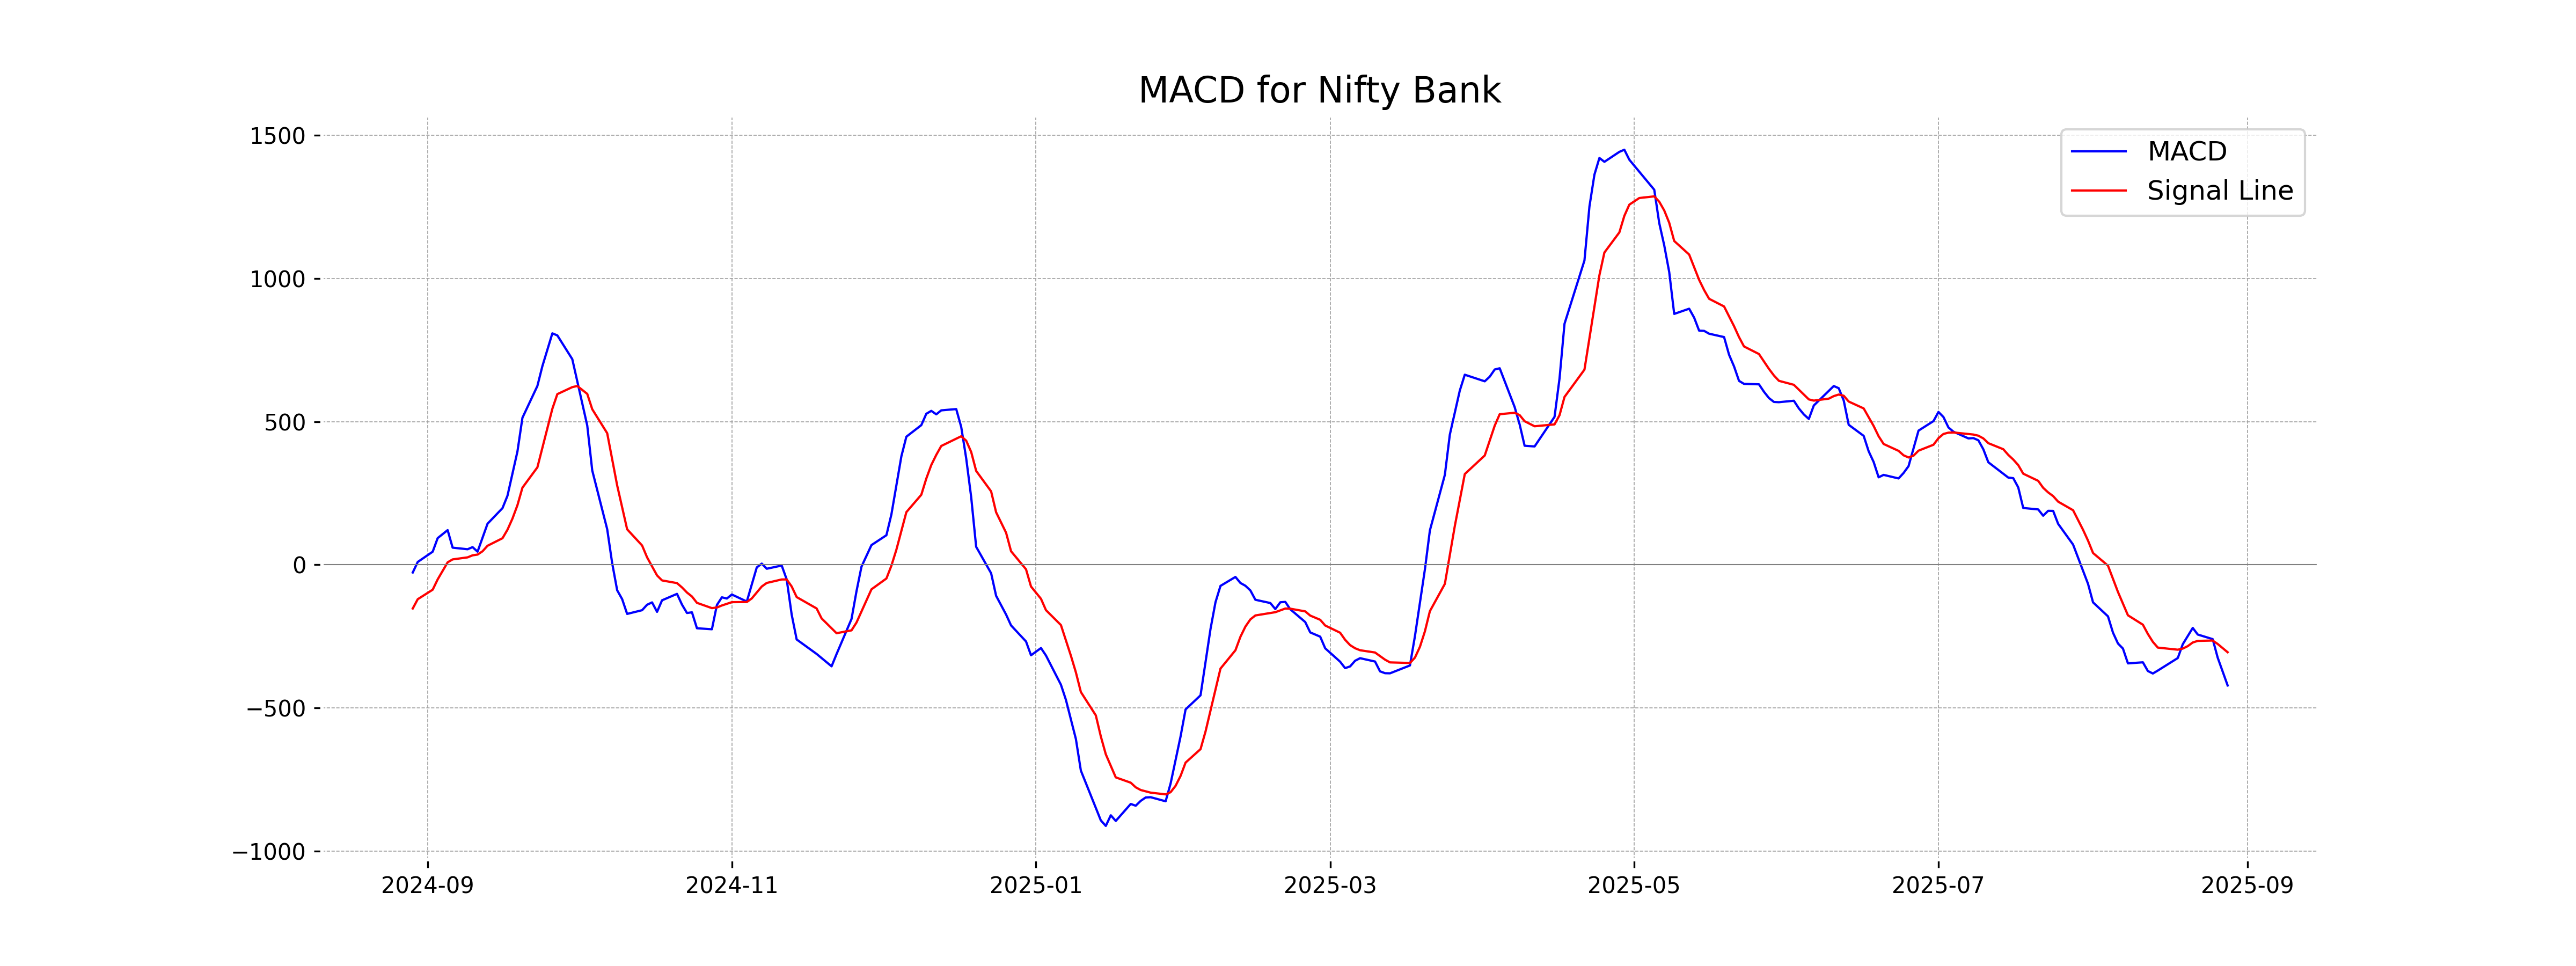
Moving Averages Trend (MACD)
The MACD for Nifty Bank is -421.15, which is below its signal line at -305.22, indicating a bearish trend. A negative MACD suggests that the momentum is favouring the downside, aligning with the RSI, which is also at a low value of 28.58.
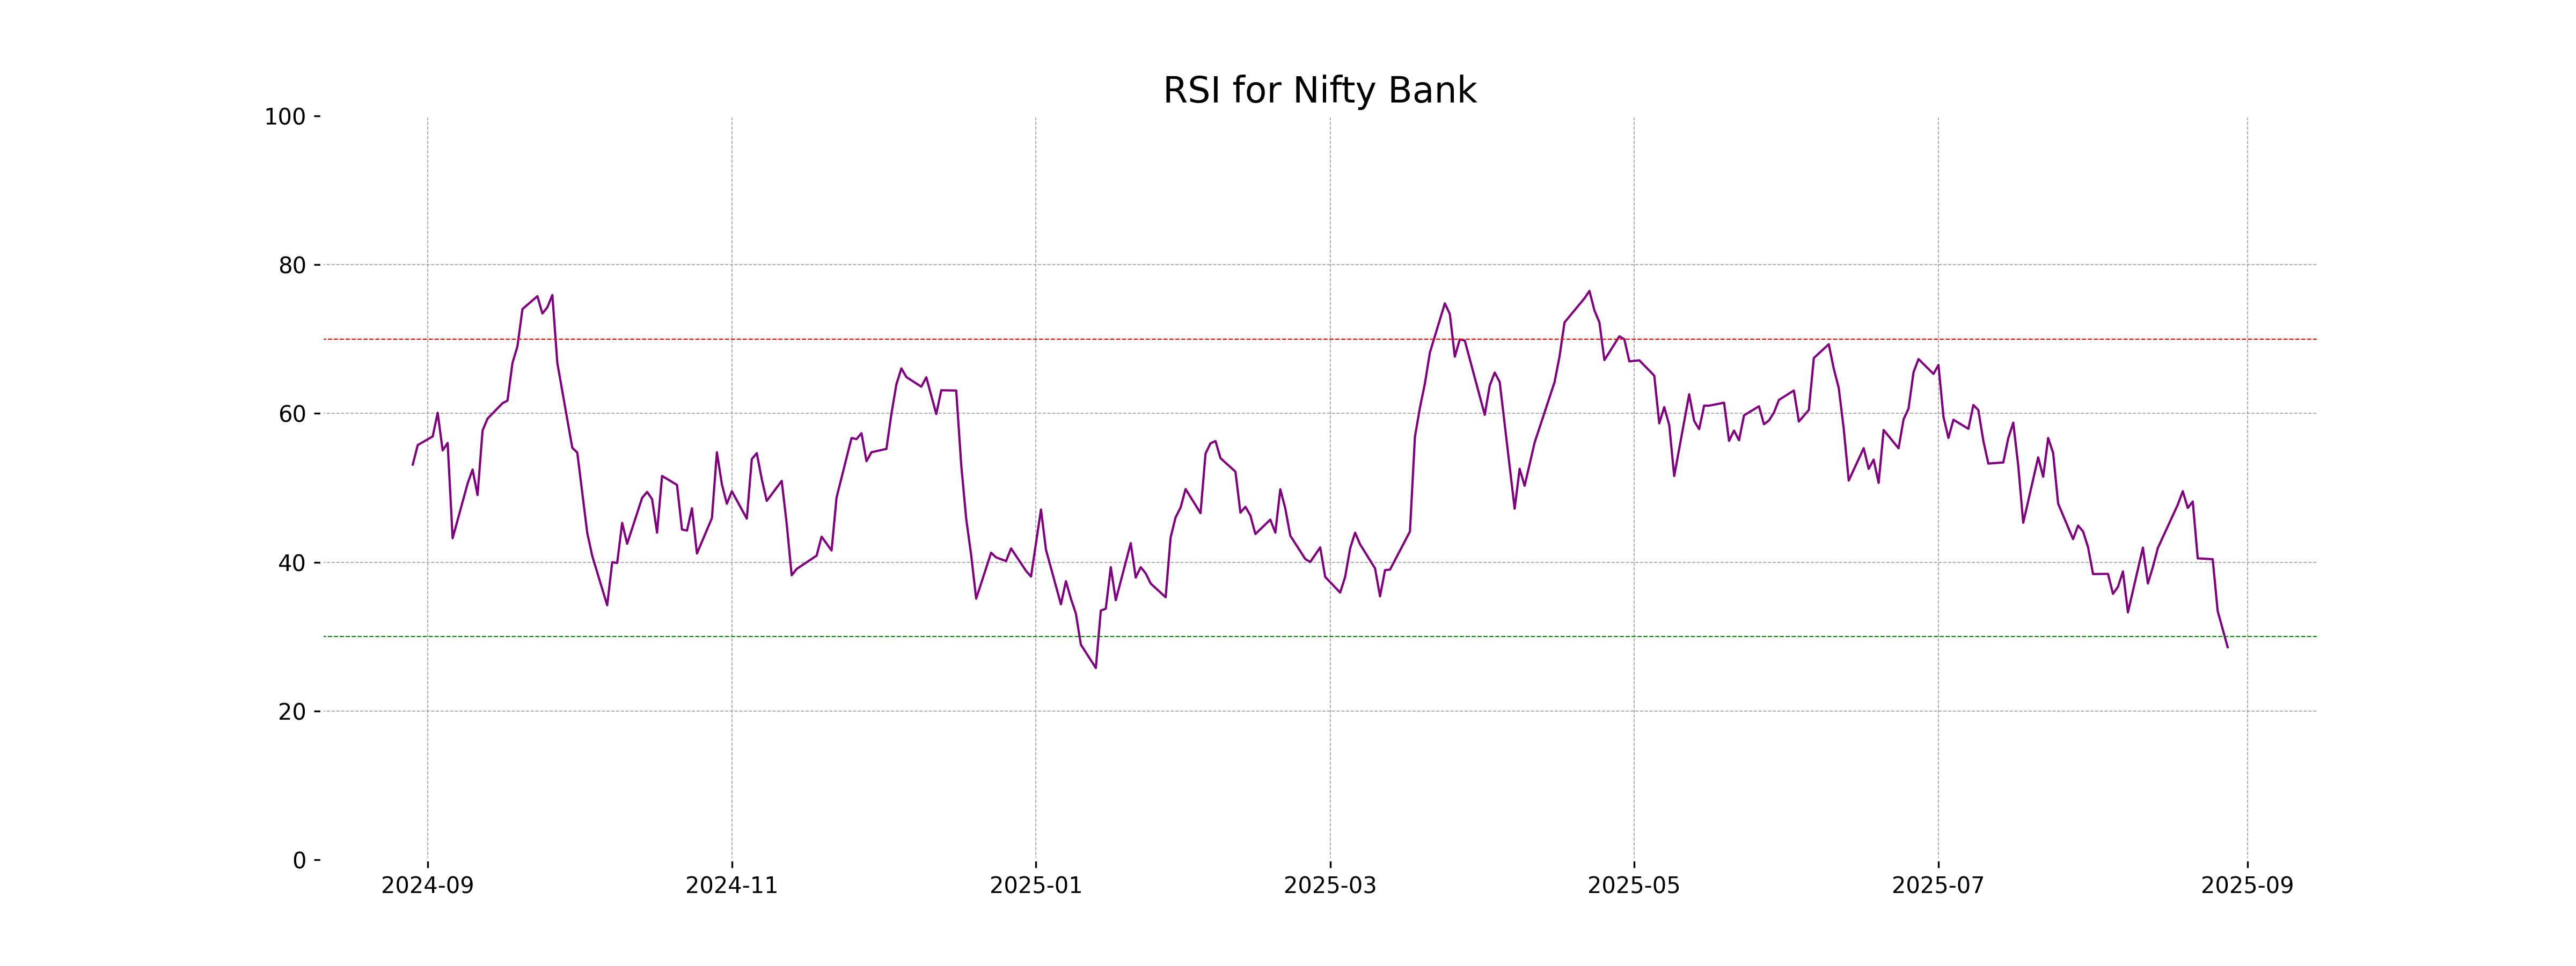
RSI Analysis
The current RSI of Nifty Bank is 28.58, which indicates that the index is in the oversold territory. Typically, an RSI below 30 suggests that the asset might be undervalued and could be due for a price correction or reversal upward.
Analysis for Nifty 50 - August 28, 2025
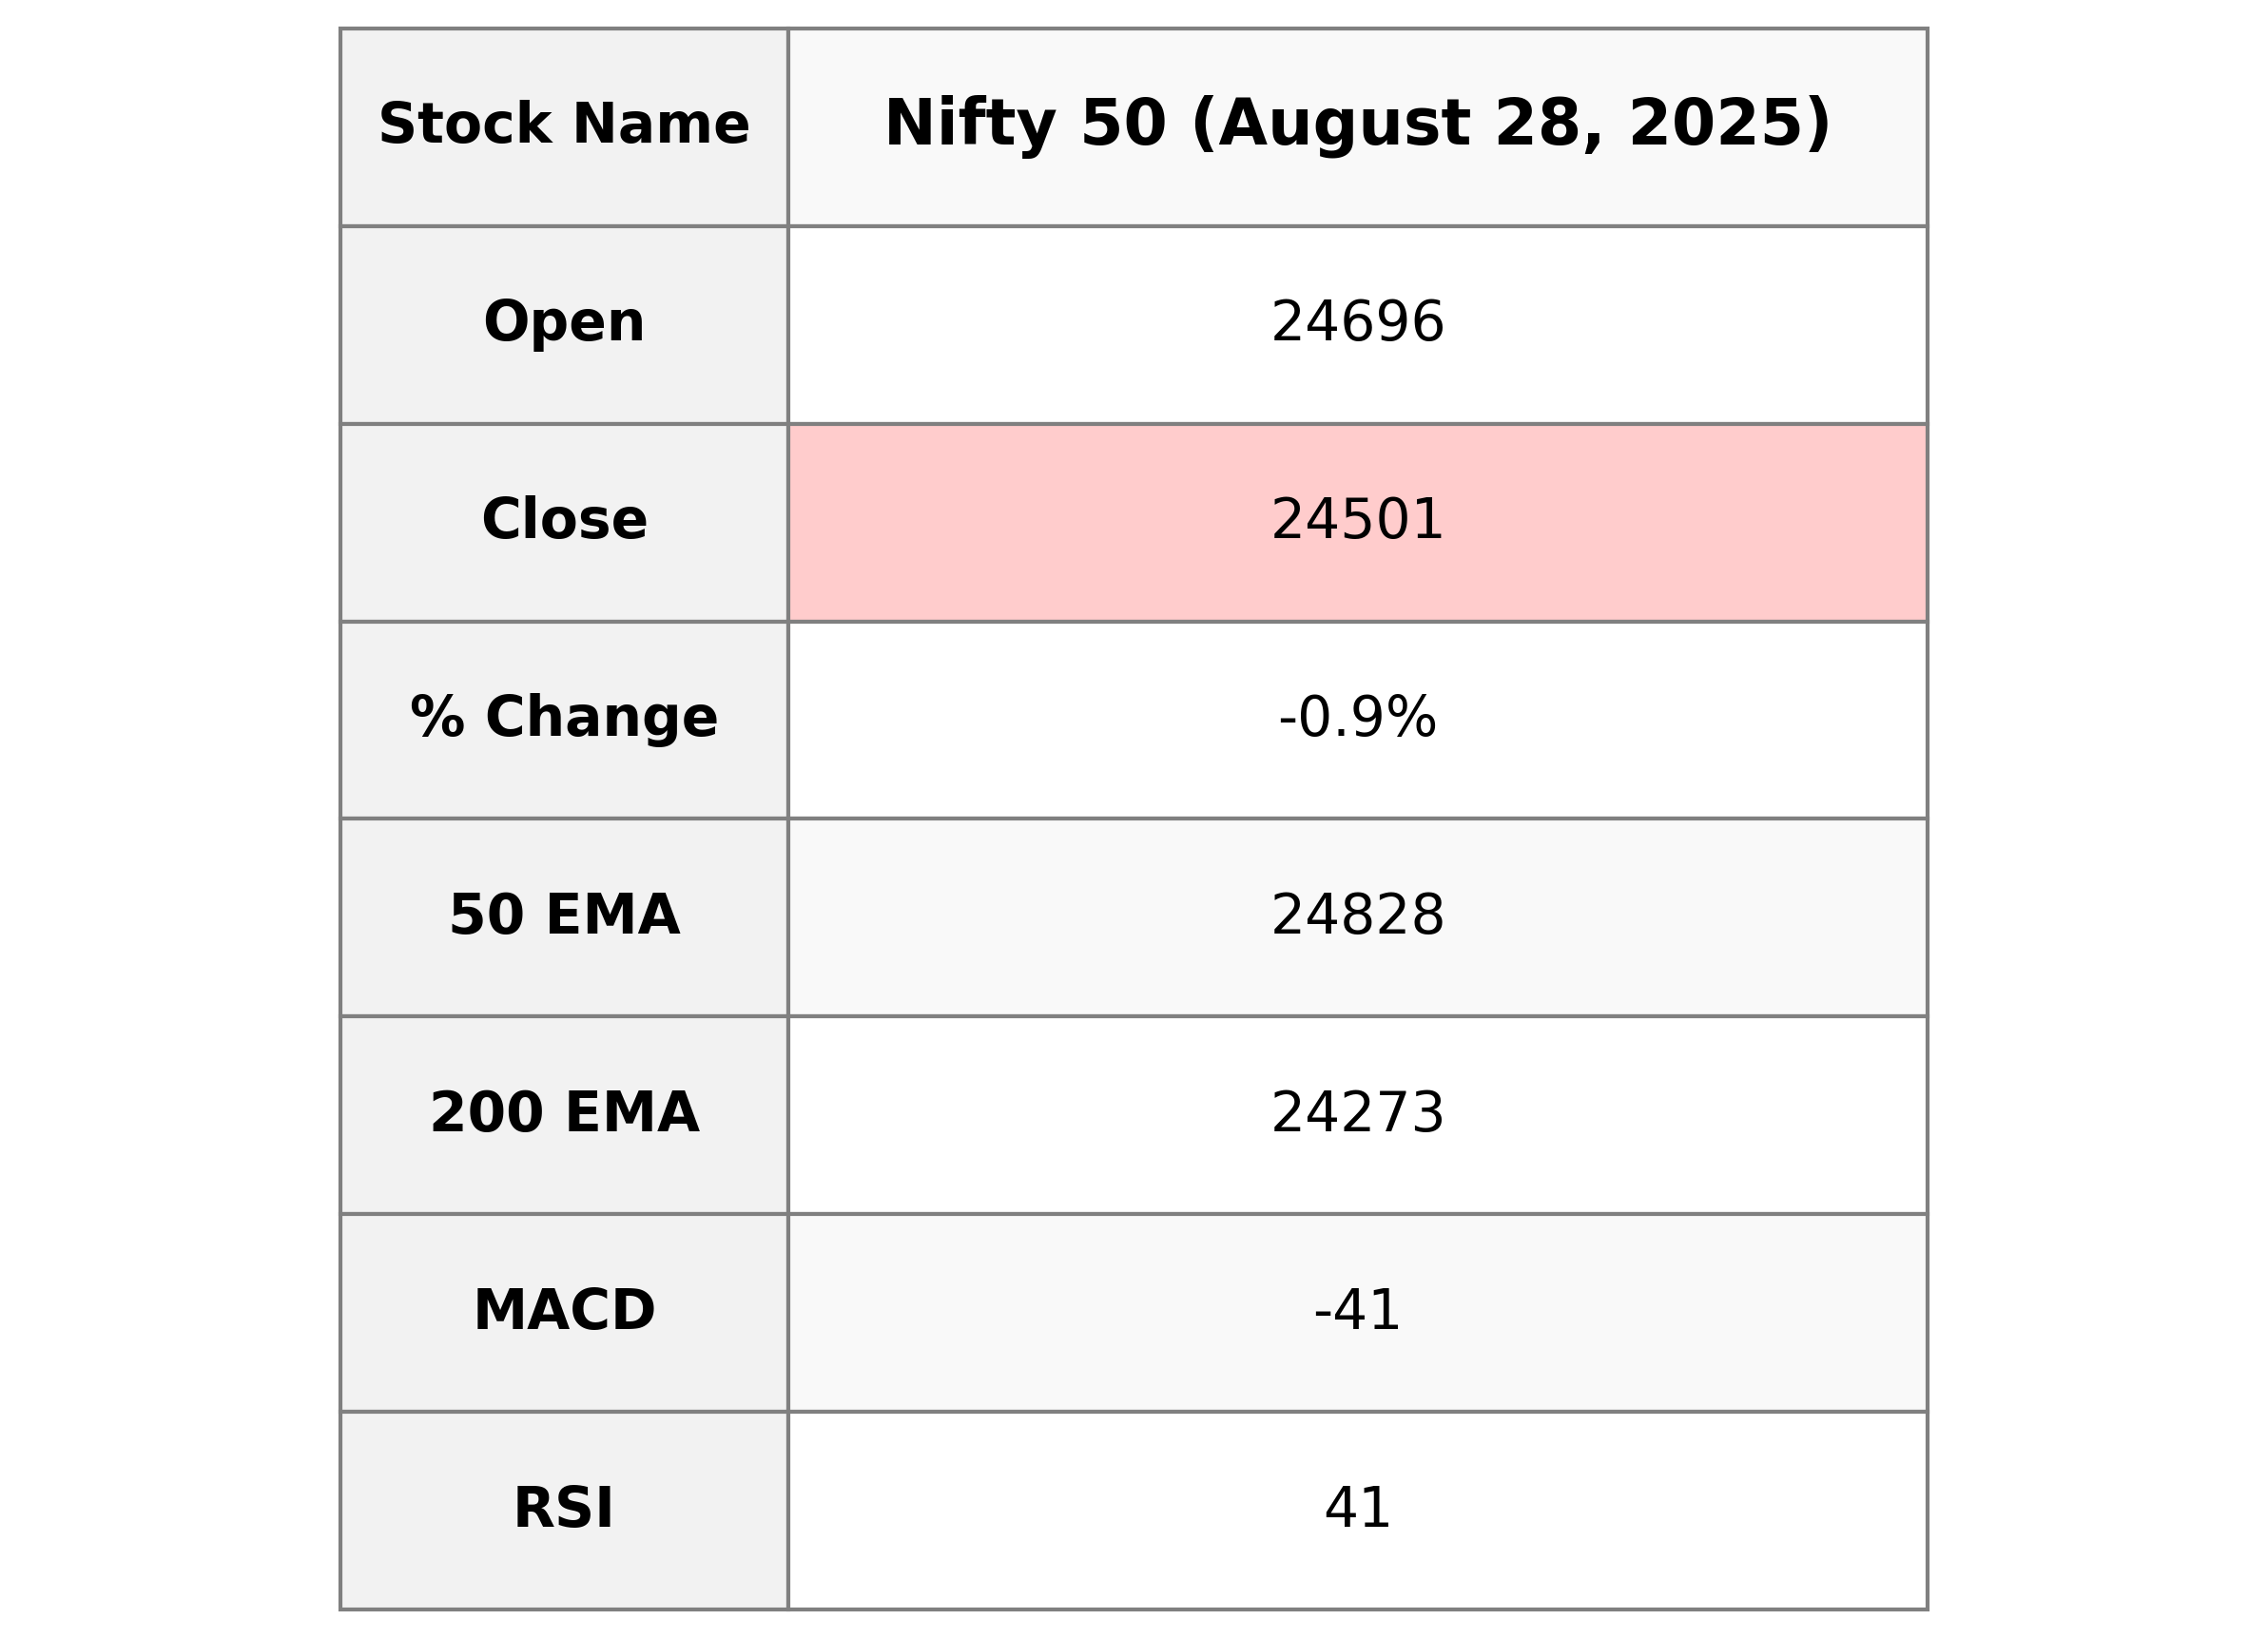
Nifty 50 Performance On the given trading day, Nifty 50 opened at 24,695.80, reaching a high of 24,702.65 and a low of 24,481.60, ultimately closing at 24,500.90. This reflected a decline of approximately 0.85% from the previous close, with a negative change of 211.15 points. The RSI suggests a weakened market sentiment, settling at 40.79.
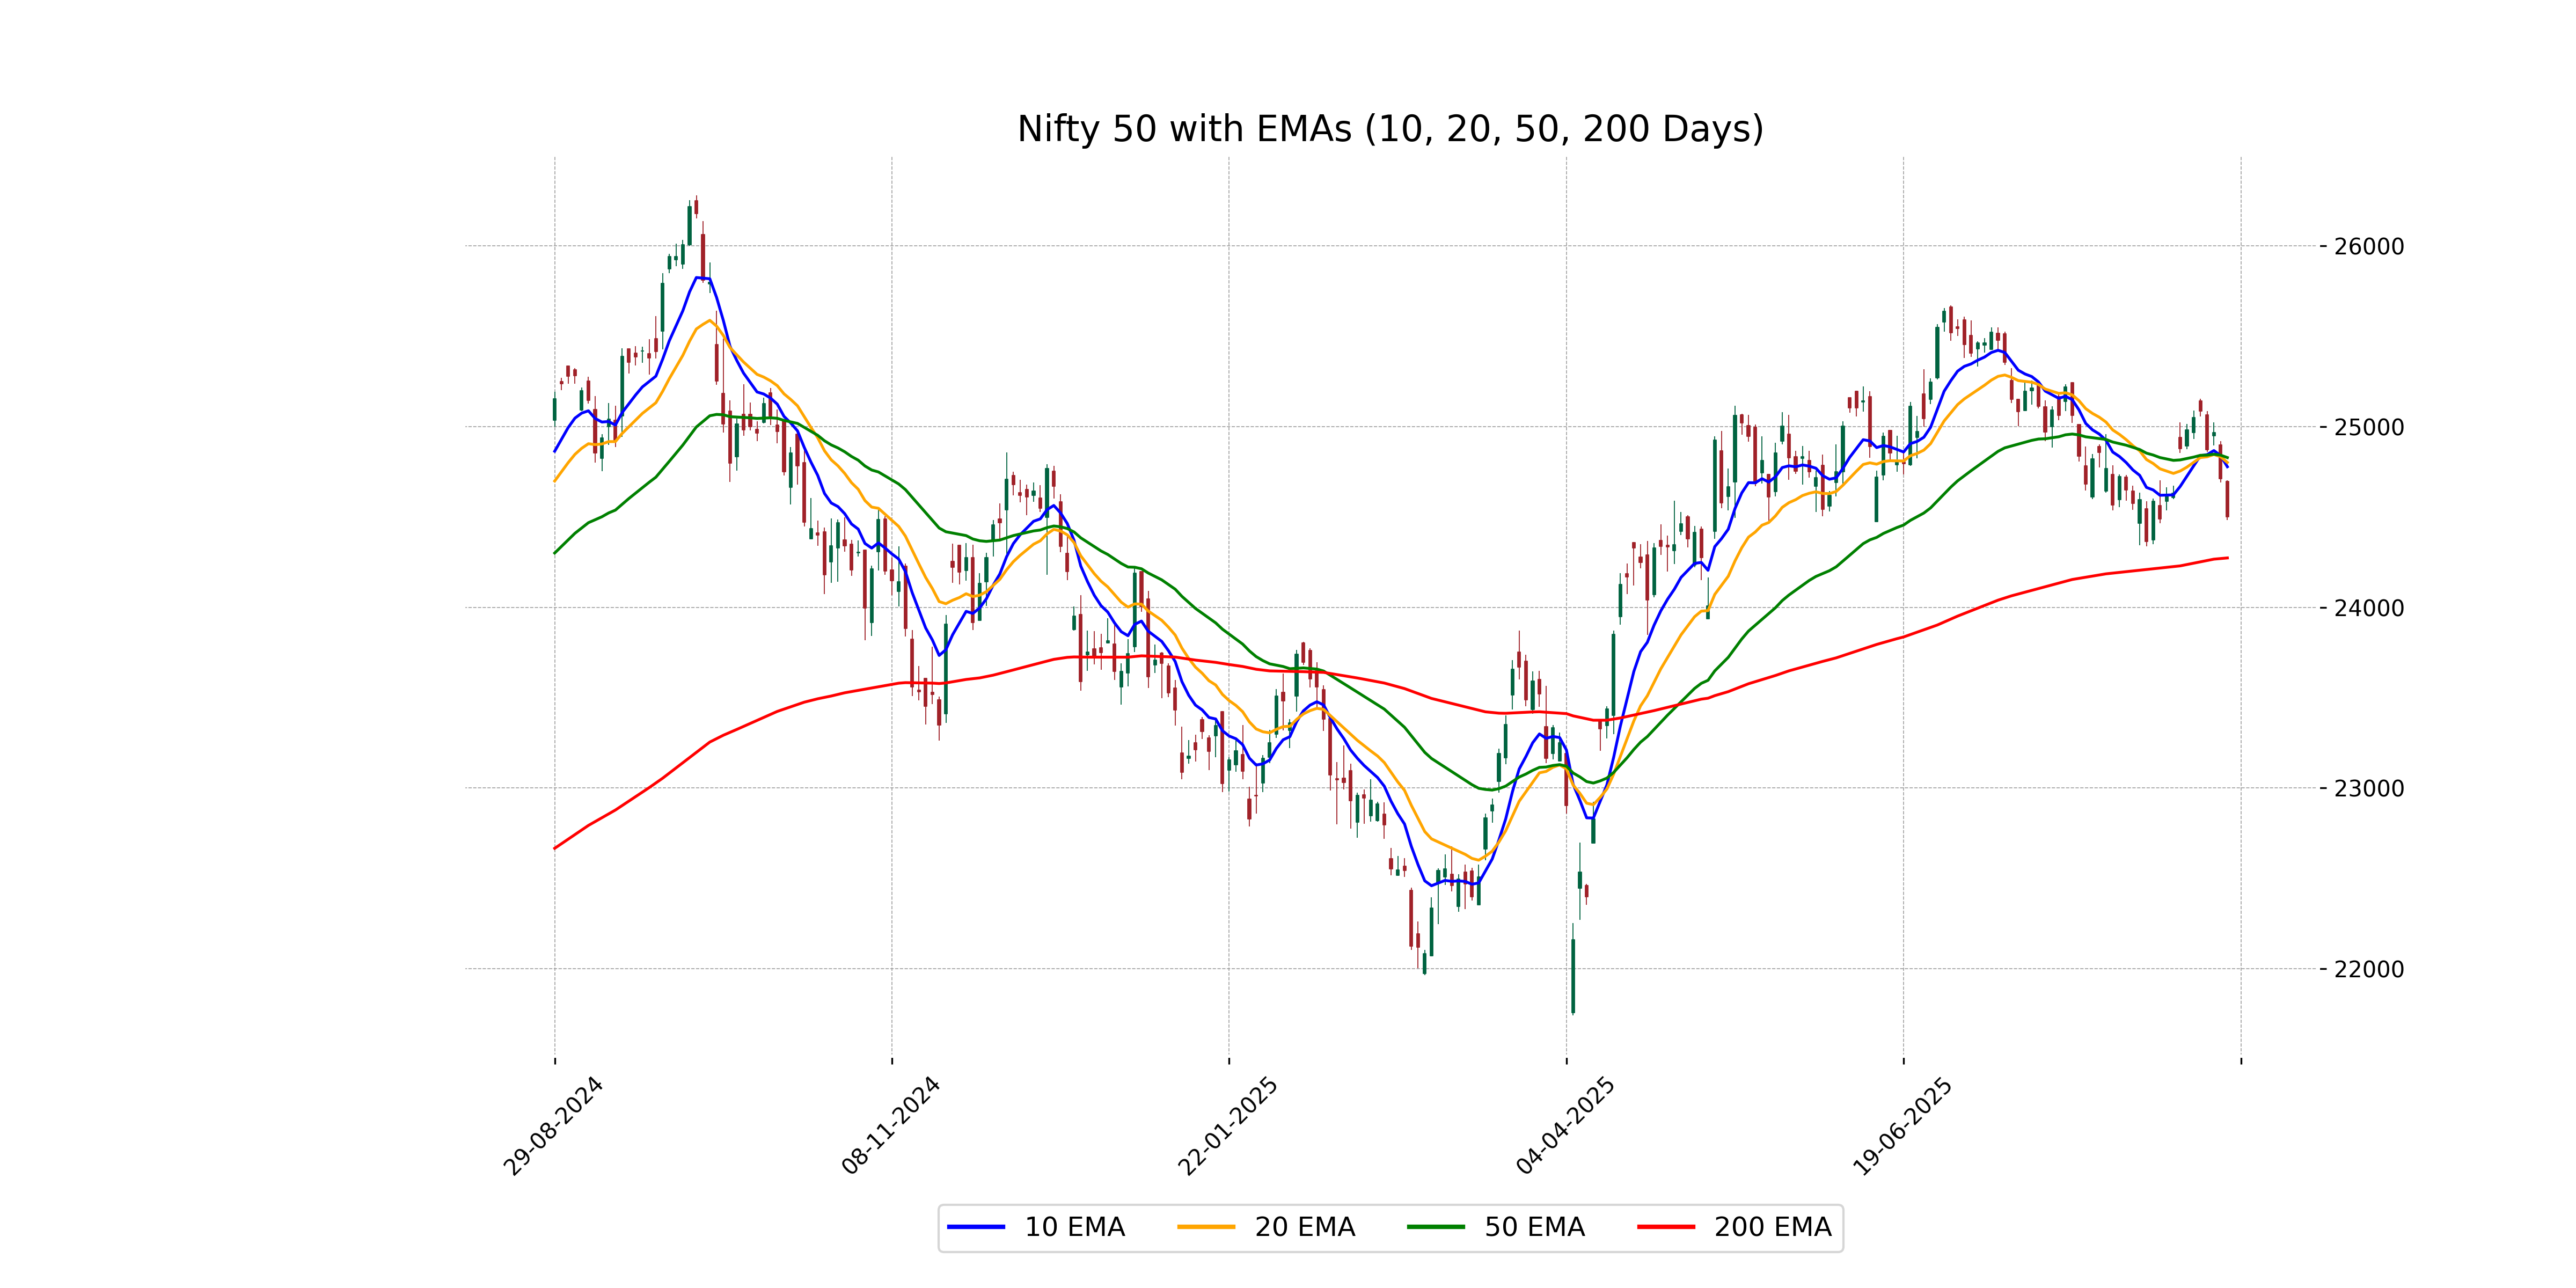
Relationship with Key Moving Averages
The Nifty 50 is trading below key moving averages, with its close at 24500.90, which is lower than the 50 EMA at 24827.94, the 200 EMA at 24272.80, the 10 EMA at 24777.22, and the 20 EMA at 24800.86. This suggests a bearish momentum in the short term due to prices staying below these thresholds.
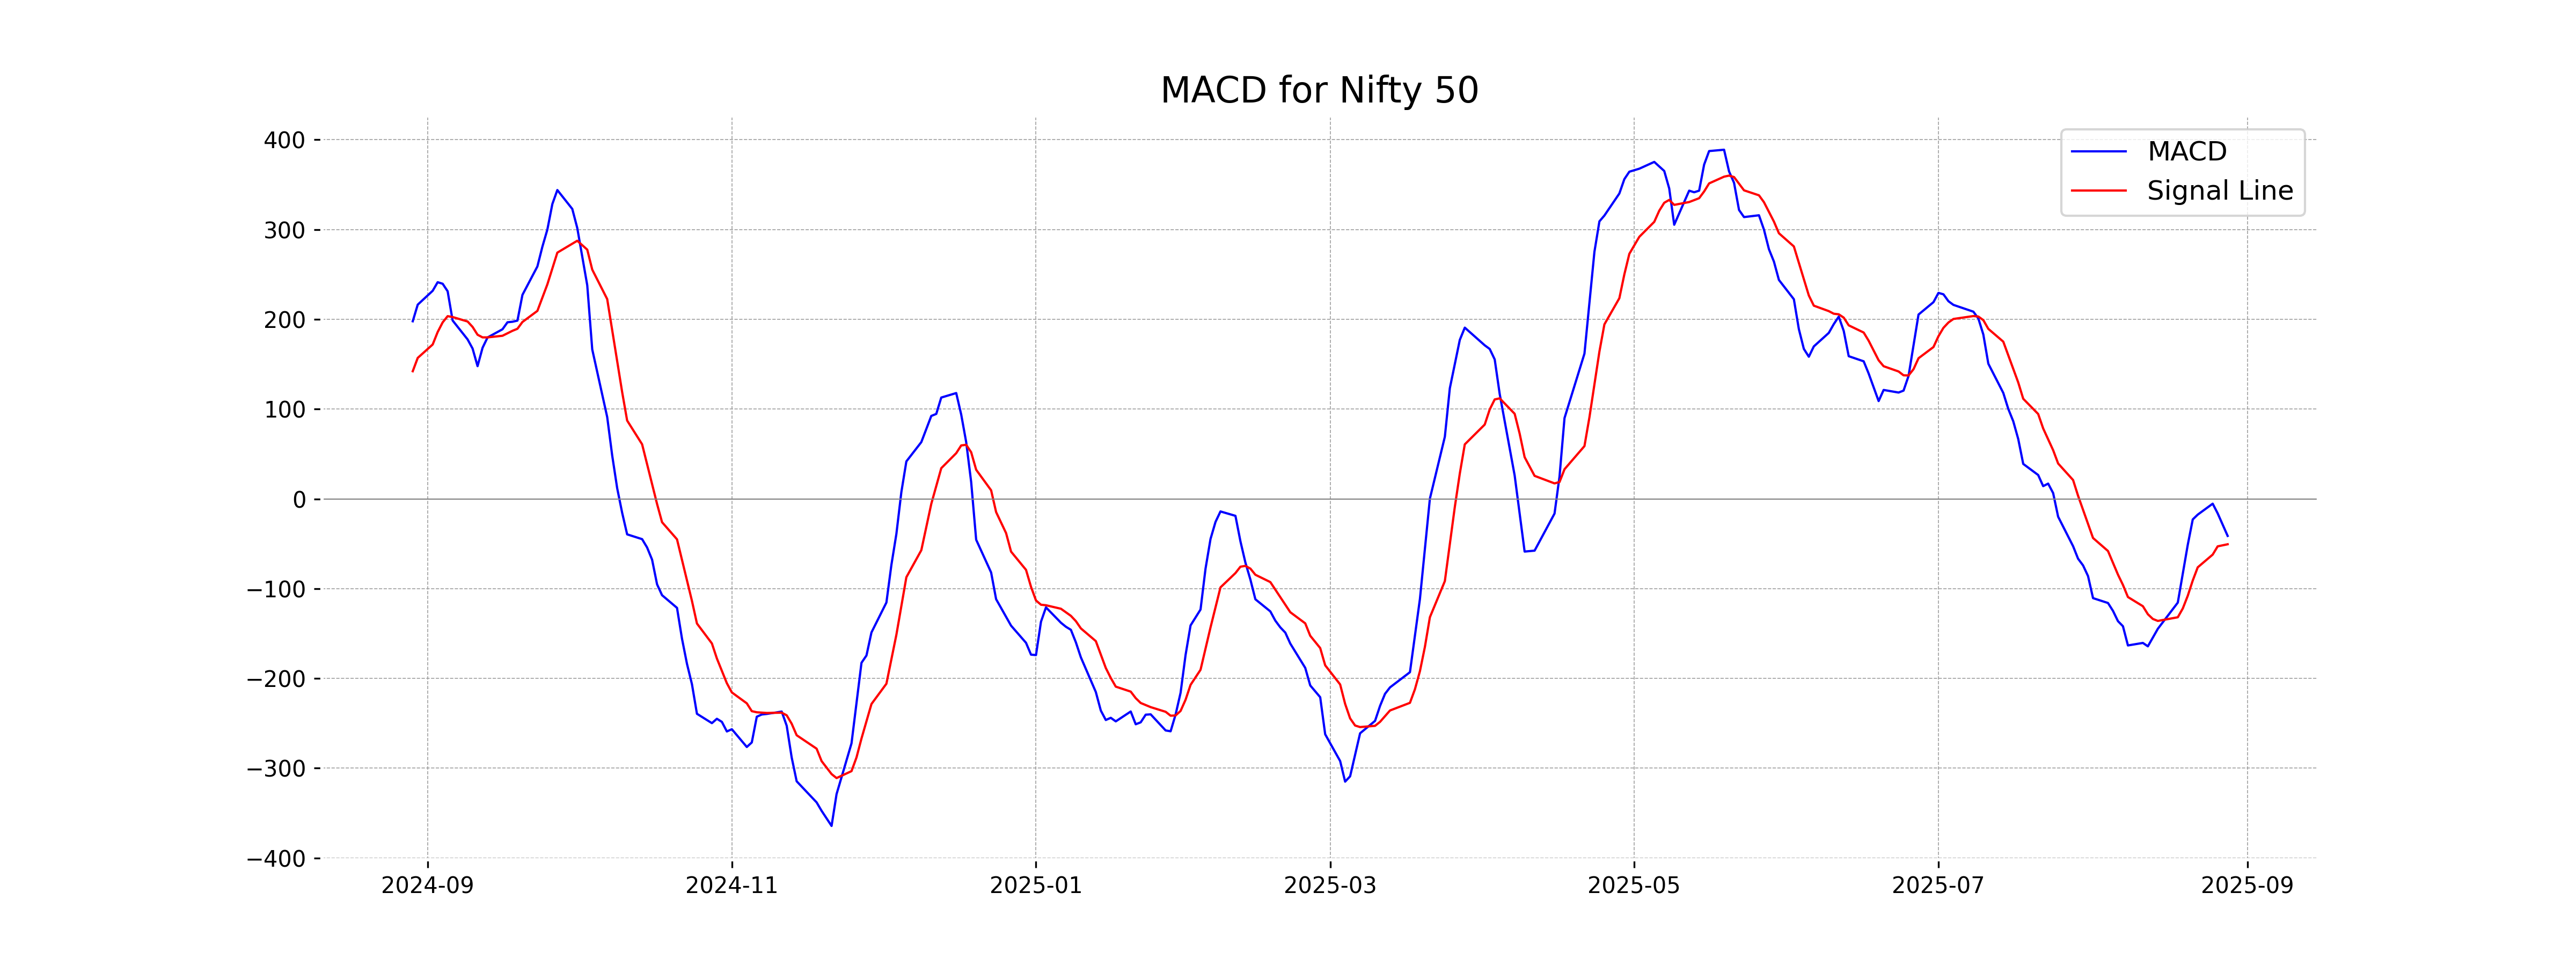
Moving Averages Trend (MACD)
MACD Analysis for Nifty 50: The MACD value of -41.29 being higher than the MACD Signal of -50.59 indicates a potential bullish crossover in the near term. However, both values being negative suggests the index is currently in a bearish phase, possibly signaling a trend reversal if the crossover occurs.
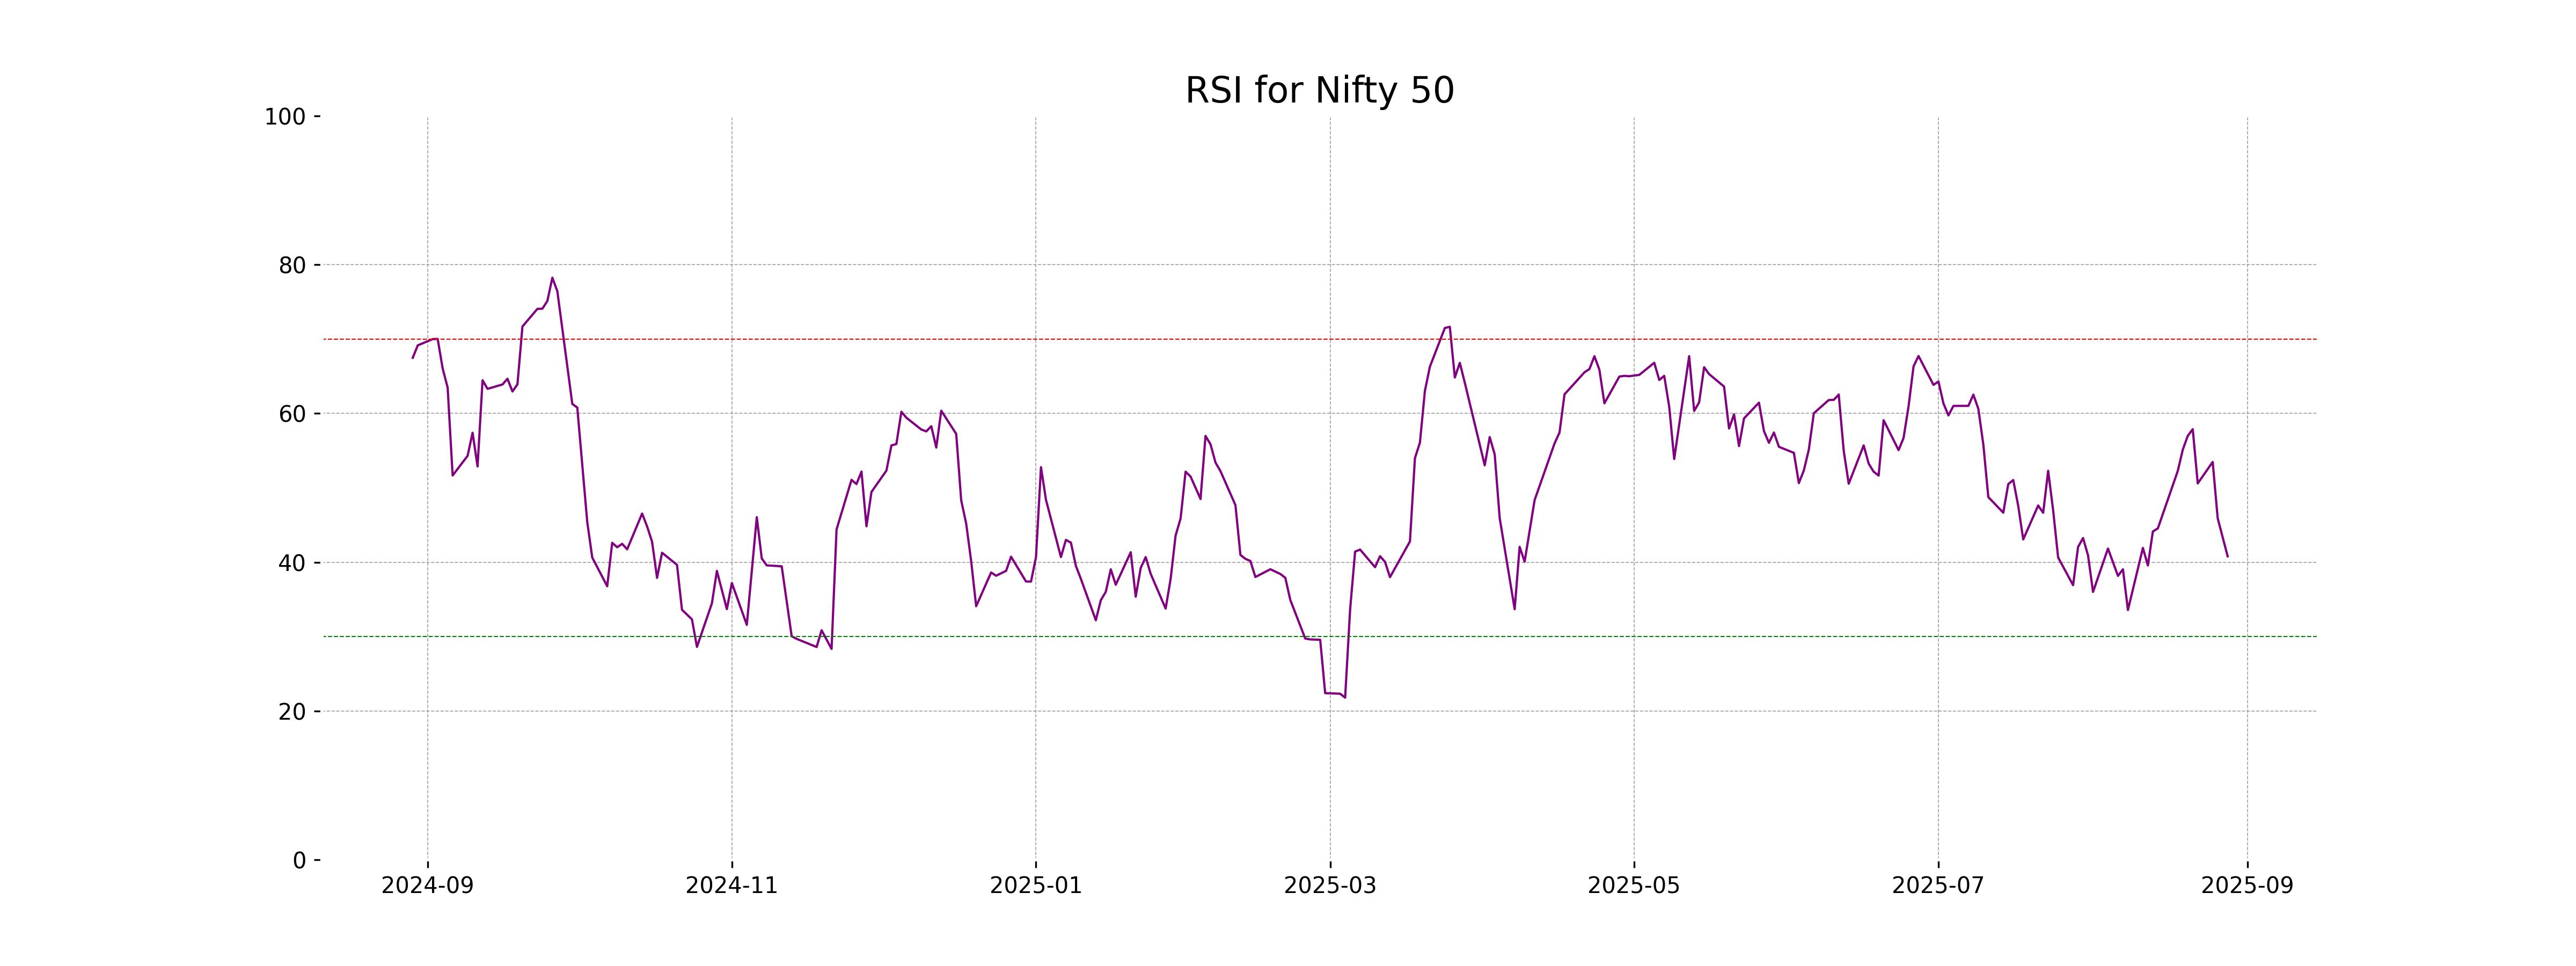
RSI Analysis
The Relative Strength Index (RSI) for Nifty 50 is 40.79, indicating that the index is approaching oversold conditions but not yet in the oversold territory, which is typically below 30. Although the RSI suggests potential bearish momentum, it leaves room for further declines before signaling a possible reversal.
Up Next

Indian stock market sector-wise performance today - August 28, 2025

Step-by-step guide to apply for a mortgage loan online with minimal documentation

Honda Activa 6G: Everything You Need to Know Before Buying

How much does a ULIP plan really cost? A break-down of all charges

Centre plans to borrow Rs 8.20 lakh cr from market in first half of FY27

Reliance denies buying Iranian oil amid US sanctions waiver

More videos

Premium petrol price up Rs 2, industrial diesel up Rs 22; no change in normal petrol, diesel rates

India's GDP expected to register over 8 pc growth in Sep-Dec: Report

Govt announces seven measures to help boost exports

RBI keeps interest rates on hold after US trade deal boosts outlook

RBI proposes to compensate customers up to Rs 25,000 loss due to fraud

RBI raises GDP growth projection of Q1, Q2 of FY27

RBI pauses rate cuts, retains interest rate at 5.25 pc

Rupee jumps 122 paise to close at 90.27 against US dollar on India-US trade deal

Stock markets cheer India-US trade deal: Sensex, Nifty surge 2.5 pc

UPI transactions hit record high of Rs 230 lakh crore in 2025-26 till Dec: Govt