


Highlights
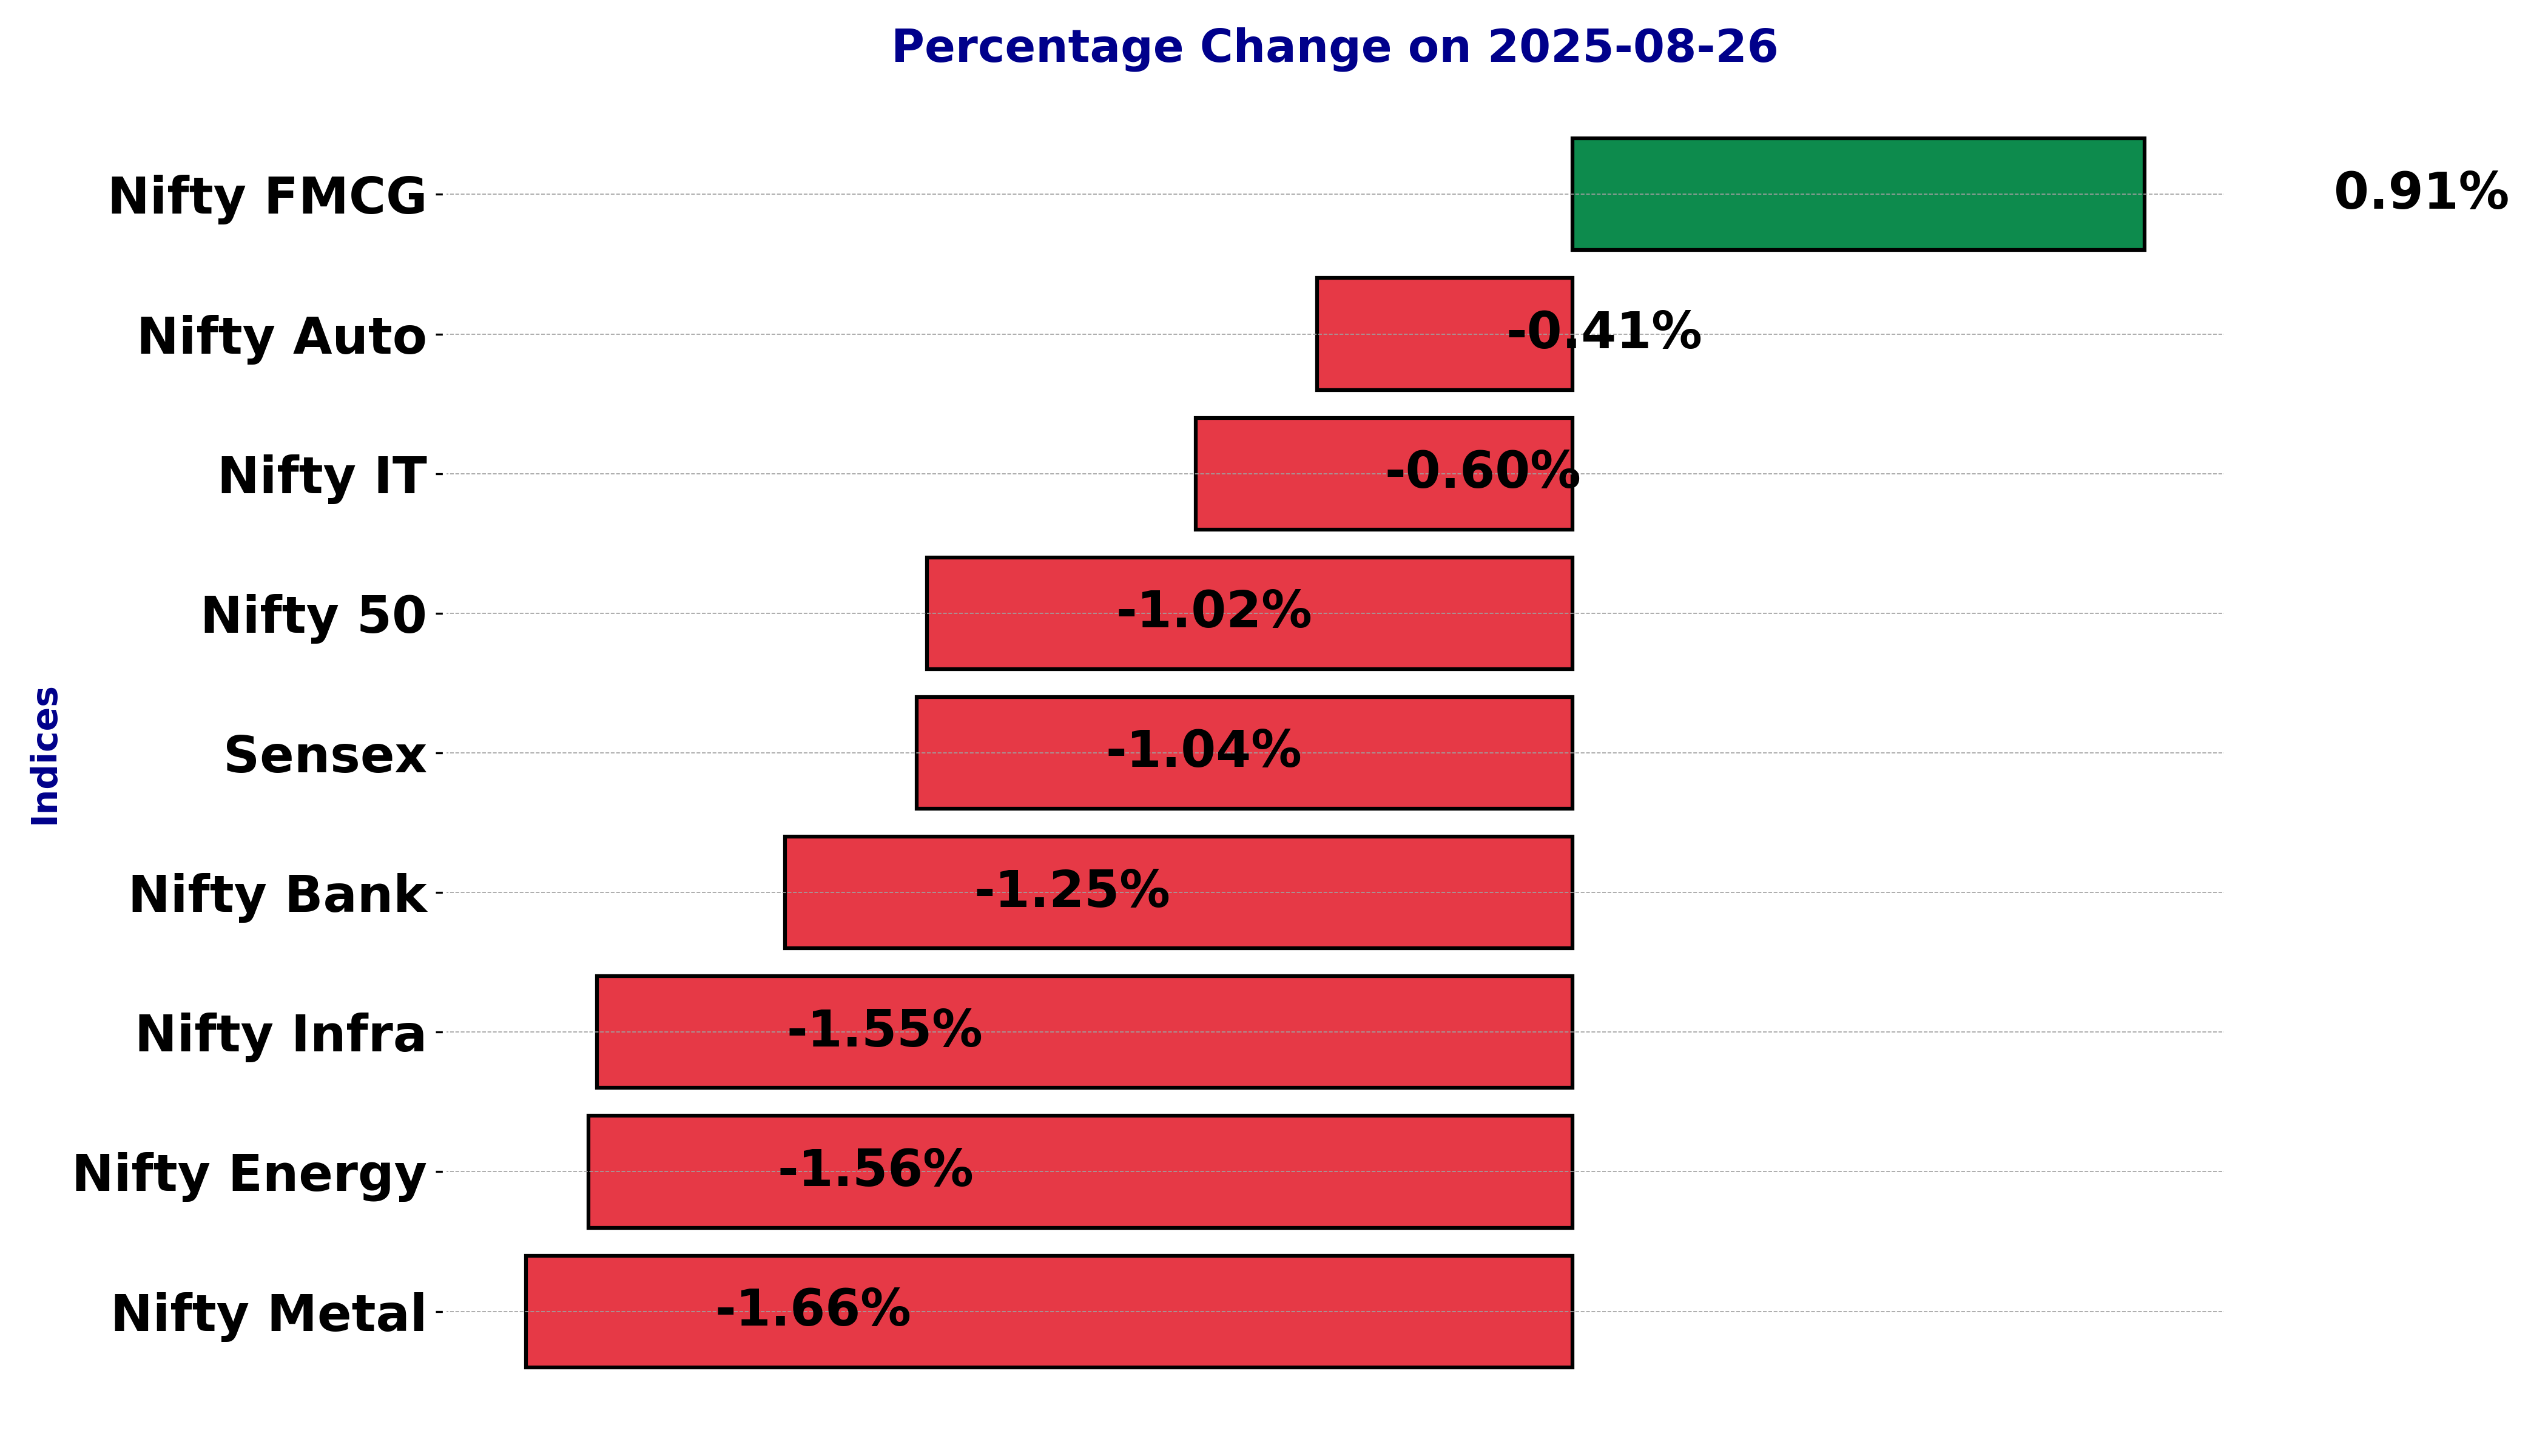
- Sensex and Nifty fell by 1.04% and 1.02% respectively
- Nifty FMCG grew by 0.91% despite a downturn
- Nifty Metal and Nifty Bank saw significant declines
Latest news

Dell Launches New Pro Precision AI Workstations In India, Introduces Deskside Agentic AI Platform

Oppo Enco Air5 Review: Incredible Value at ₹3,099

Samsung Galaxy A27 5G Goes On Sale In India With Cashback Offers, Zero Down Payment Schemes
 First Impressions: A Strong Debut For The New 'b' Series")
Nothing Phone (4b) First Impressions: A Strong Debut For The New 'b' Series

Samsung Galaxy A27 Review: A Dependable Mid-Ranger With Few Surprises

Union Finance Minister Nirmala Sitharaman Inaugurates Muzhiyan Kulam, Restored by Lumina Datamatics and Community Stakeholders in Puducherry

"Don't think anyone will be able to break his track record": Annu Kapoor hails Big B's unmatched legacy

Rewriting the Rules of Business Education: Stride School of Business Unveils Its AI-First Campus Infrastructure
Indian stock market sector-wise performance today - August 26, 2025


The stock market on Tuesday (August 26, 2025) witnessed varied performances across key sectors, with some indices experiencing notable changes.
The BSE Sensex closed with a decrease of 1.04%, highlighting a downward trend and losing 849.37 points from its previous close. This decline reflects the overall bearish sentiment prevalent in the market.
In the sectoral performance, the Nifty Auto index saw a slight dip of 0.41%, indicating a tepid market movement within the automotive sector.
Meanwhile, the Nifty Energy index experienced a significant decline of 1.56%, marking it as one of the most affected sectors for the day.
The fall in the energy sector might be attributed to fluctuating global oil prices and uncertainties around energy policies impacting investor sentiments.
Focusing on consumer goods, the Nifty FMCG index displayed resilience with a gain of 0.91%. The increase highlights potential optimism and consumer demand in the fast-moving consumer goods sector amidst the broader market pressures.
On the infrastructure front, the Nifty Infra index dropped by 1.55%, aligning closely with the energy sector's decline. This drop suggests perhaps underlying concerns about infrastructure spending or project delays that have likely influenced investor decisions.
The Nifty IT index recorded a reduction of 0.60%, reflecting some level of cautiousness among technology investors. Despite its decline, it wasn't as pronounced as other sectors, indicating relative stability.
The Nifty Metal index faced a significant downturn with a decrease of 1.66%, possibly due to global commodity price fluctuations affecting metal stocks.
Similarly, the Nifty Bank index also saw a substantial decline of 1.25%, affected by factors such as interest rate policies influencing bank stocks negatively.
Lastly, the Nifty 50 index itself posted a decline of 1.02%, shedding 255.70 points, influenced by the broad-based selling observed across multiple sectors.
Overall, the most affected sectors, such as energy and metals, point towards underlying issues related to commodity prices and global market pressures. In contrast, pockets of growth in consumer goods suggest differentiated sectoral strategies by investors seeking safe havens amidst market volatility.
Analysis for Sensex - August 26, 2025
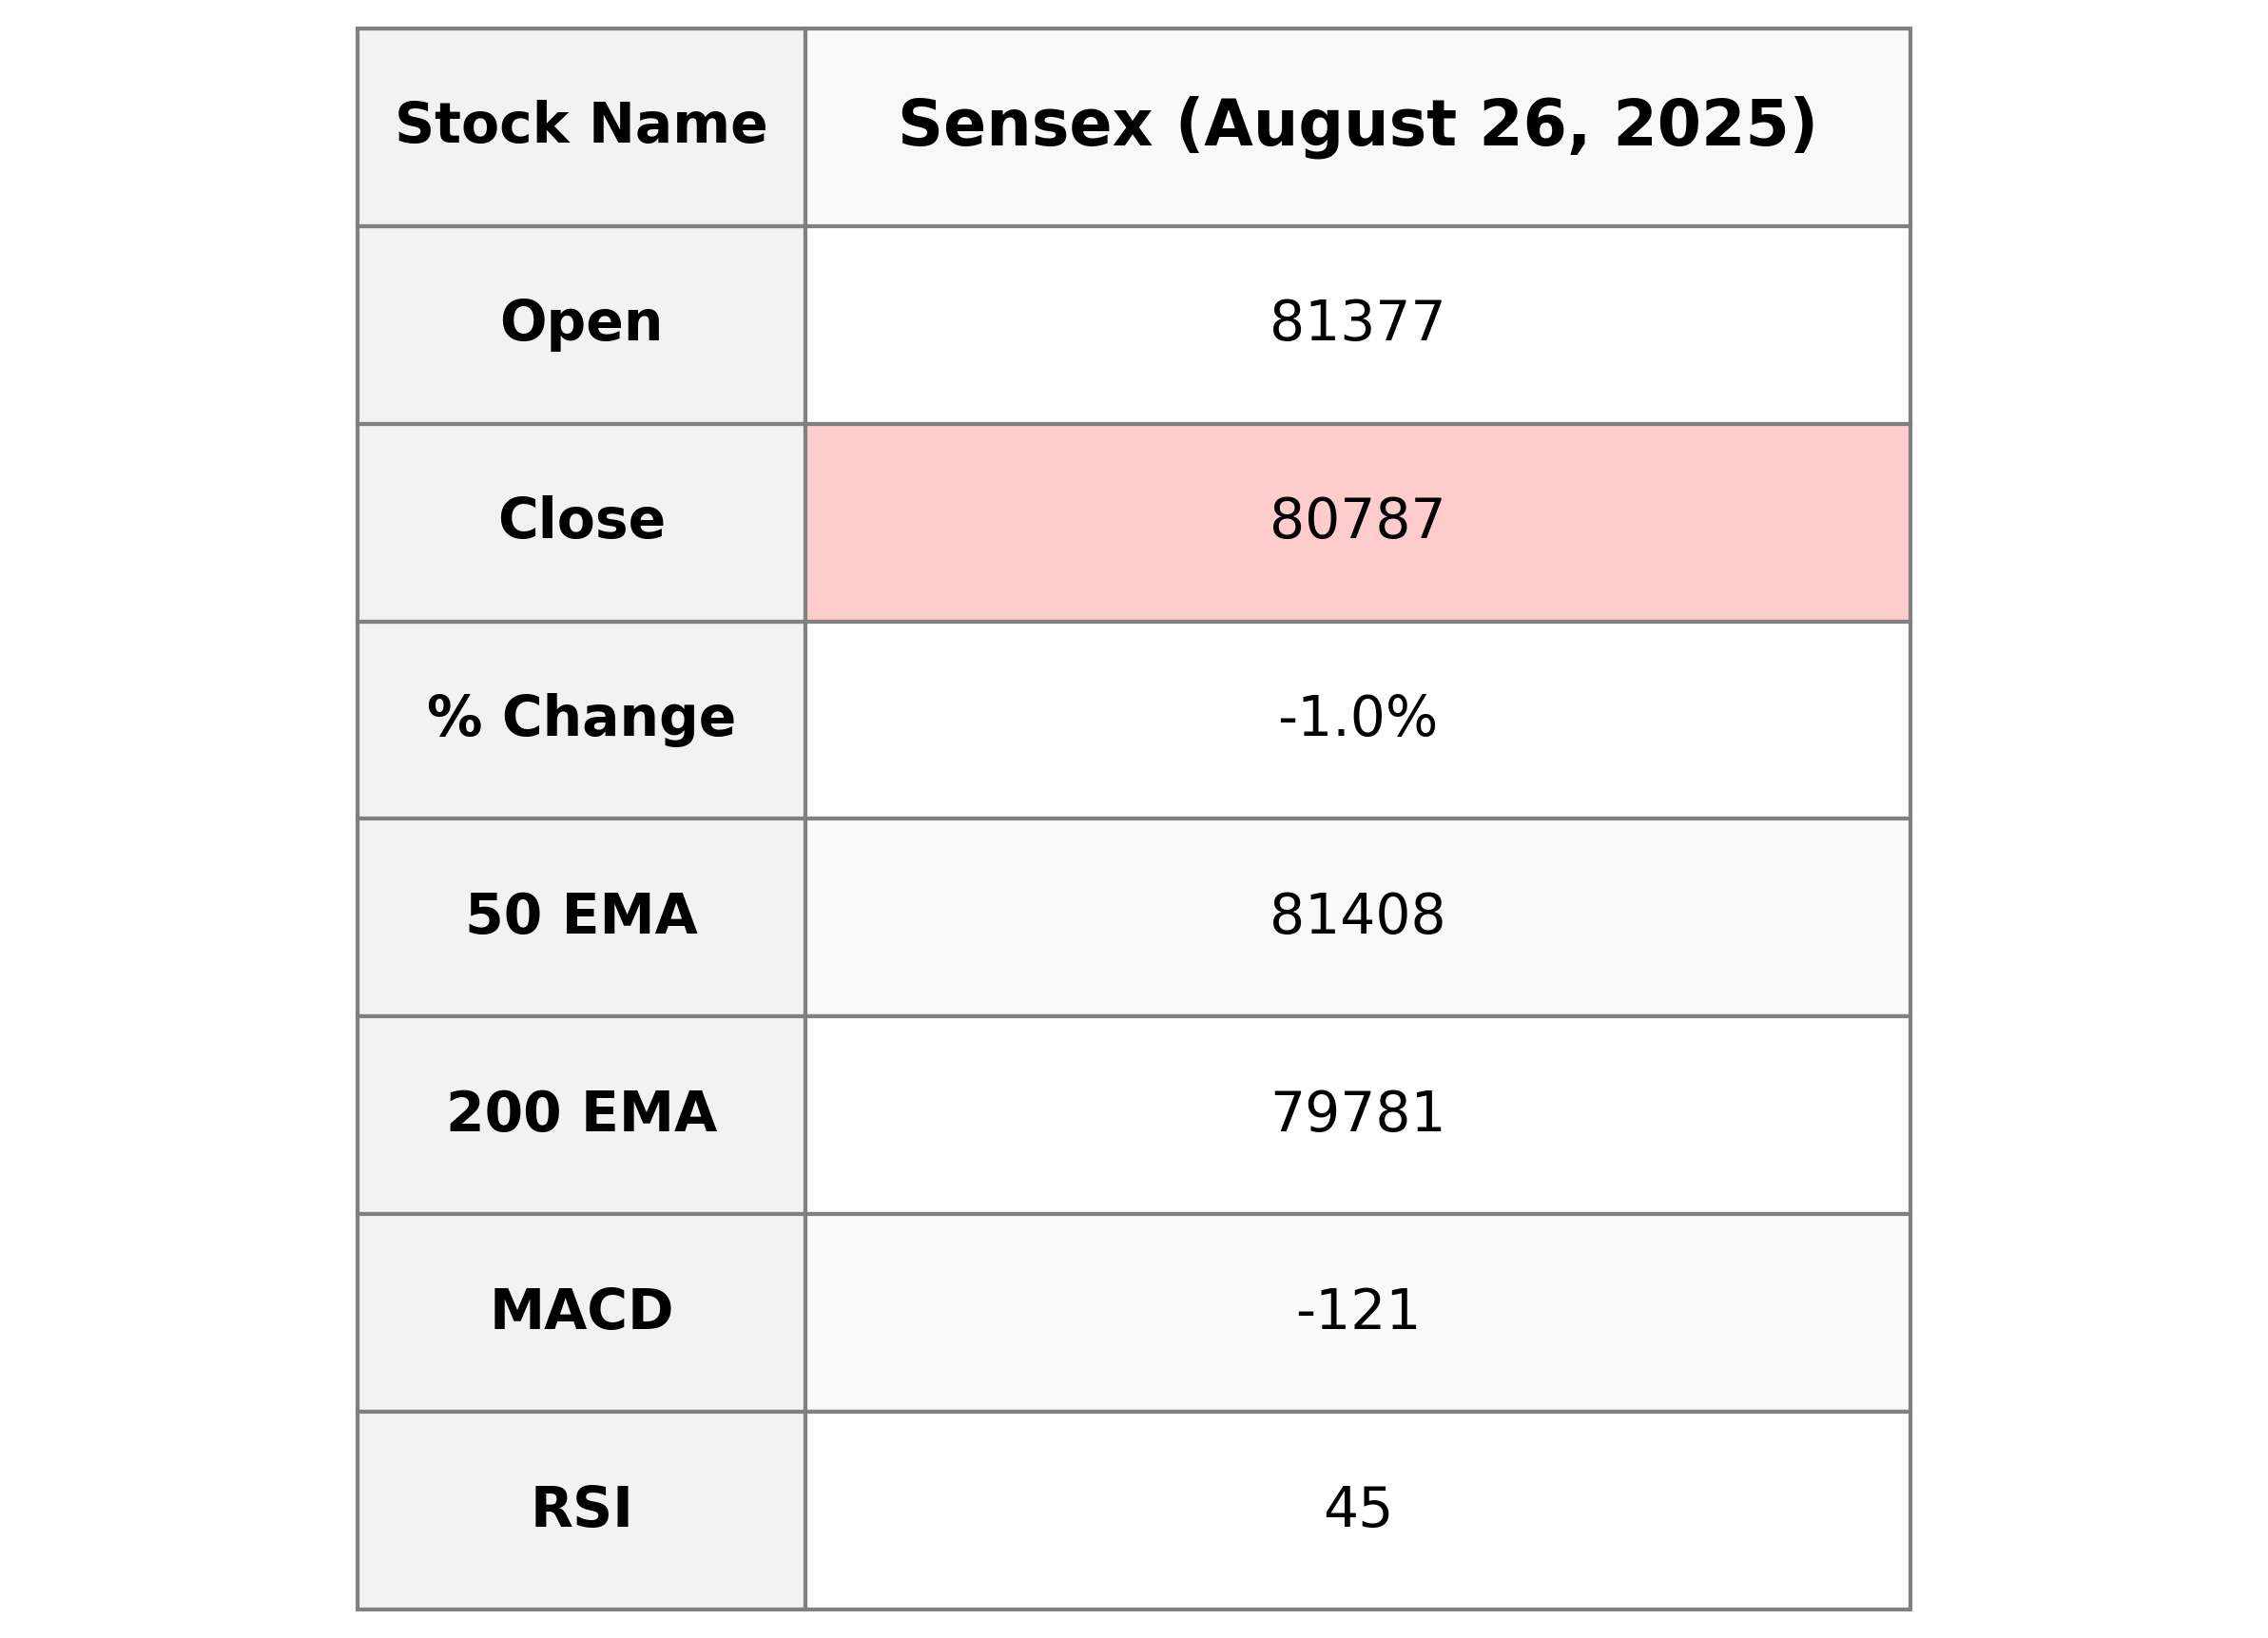
The Sensex opened at 81377.39 and closed lower at 80786.54, resulting in a negative points change of 849.37 and a percentage change of -1.04%. The day's high and low were 81450.28 and 80685.98 respectively. Technical indicators show a MACD of -120.55 and an RSI of 44.78, suggesting bearish momentum in the current market environment.
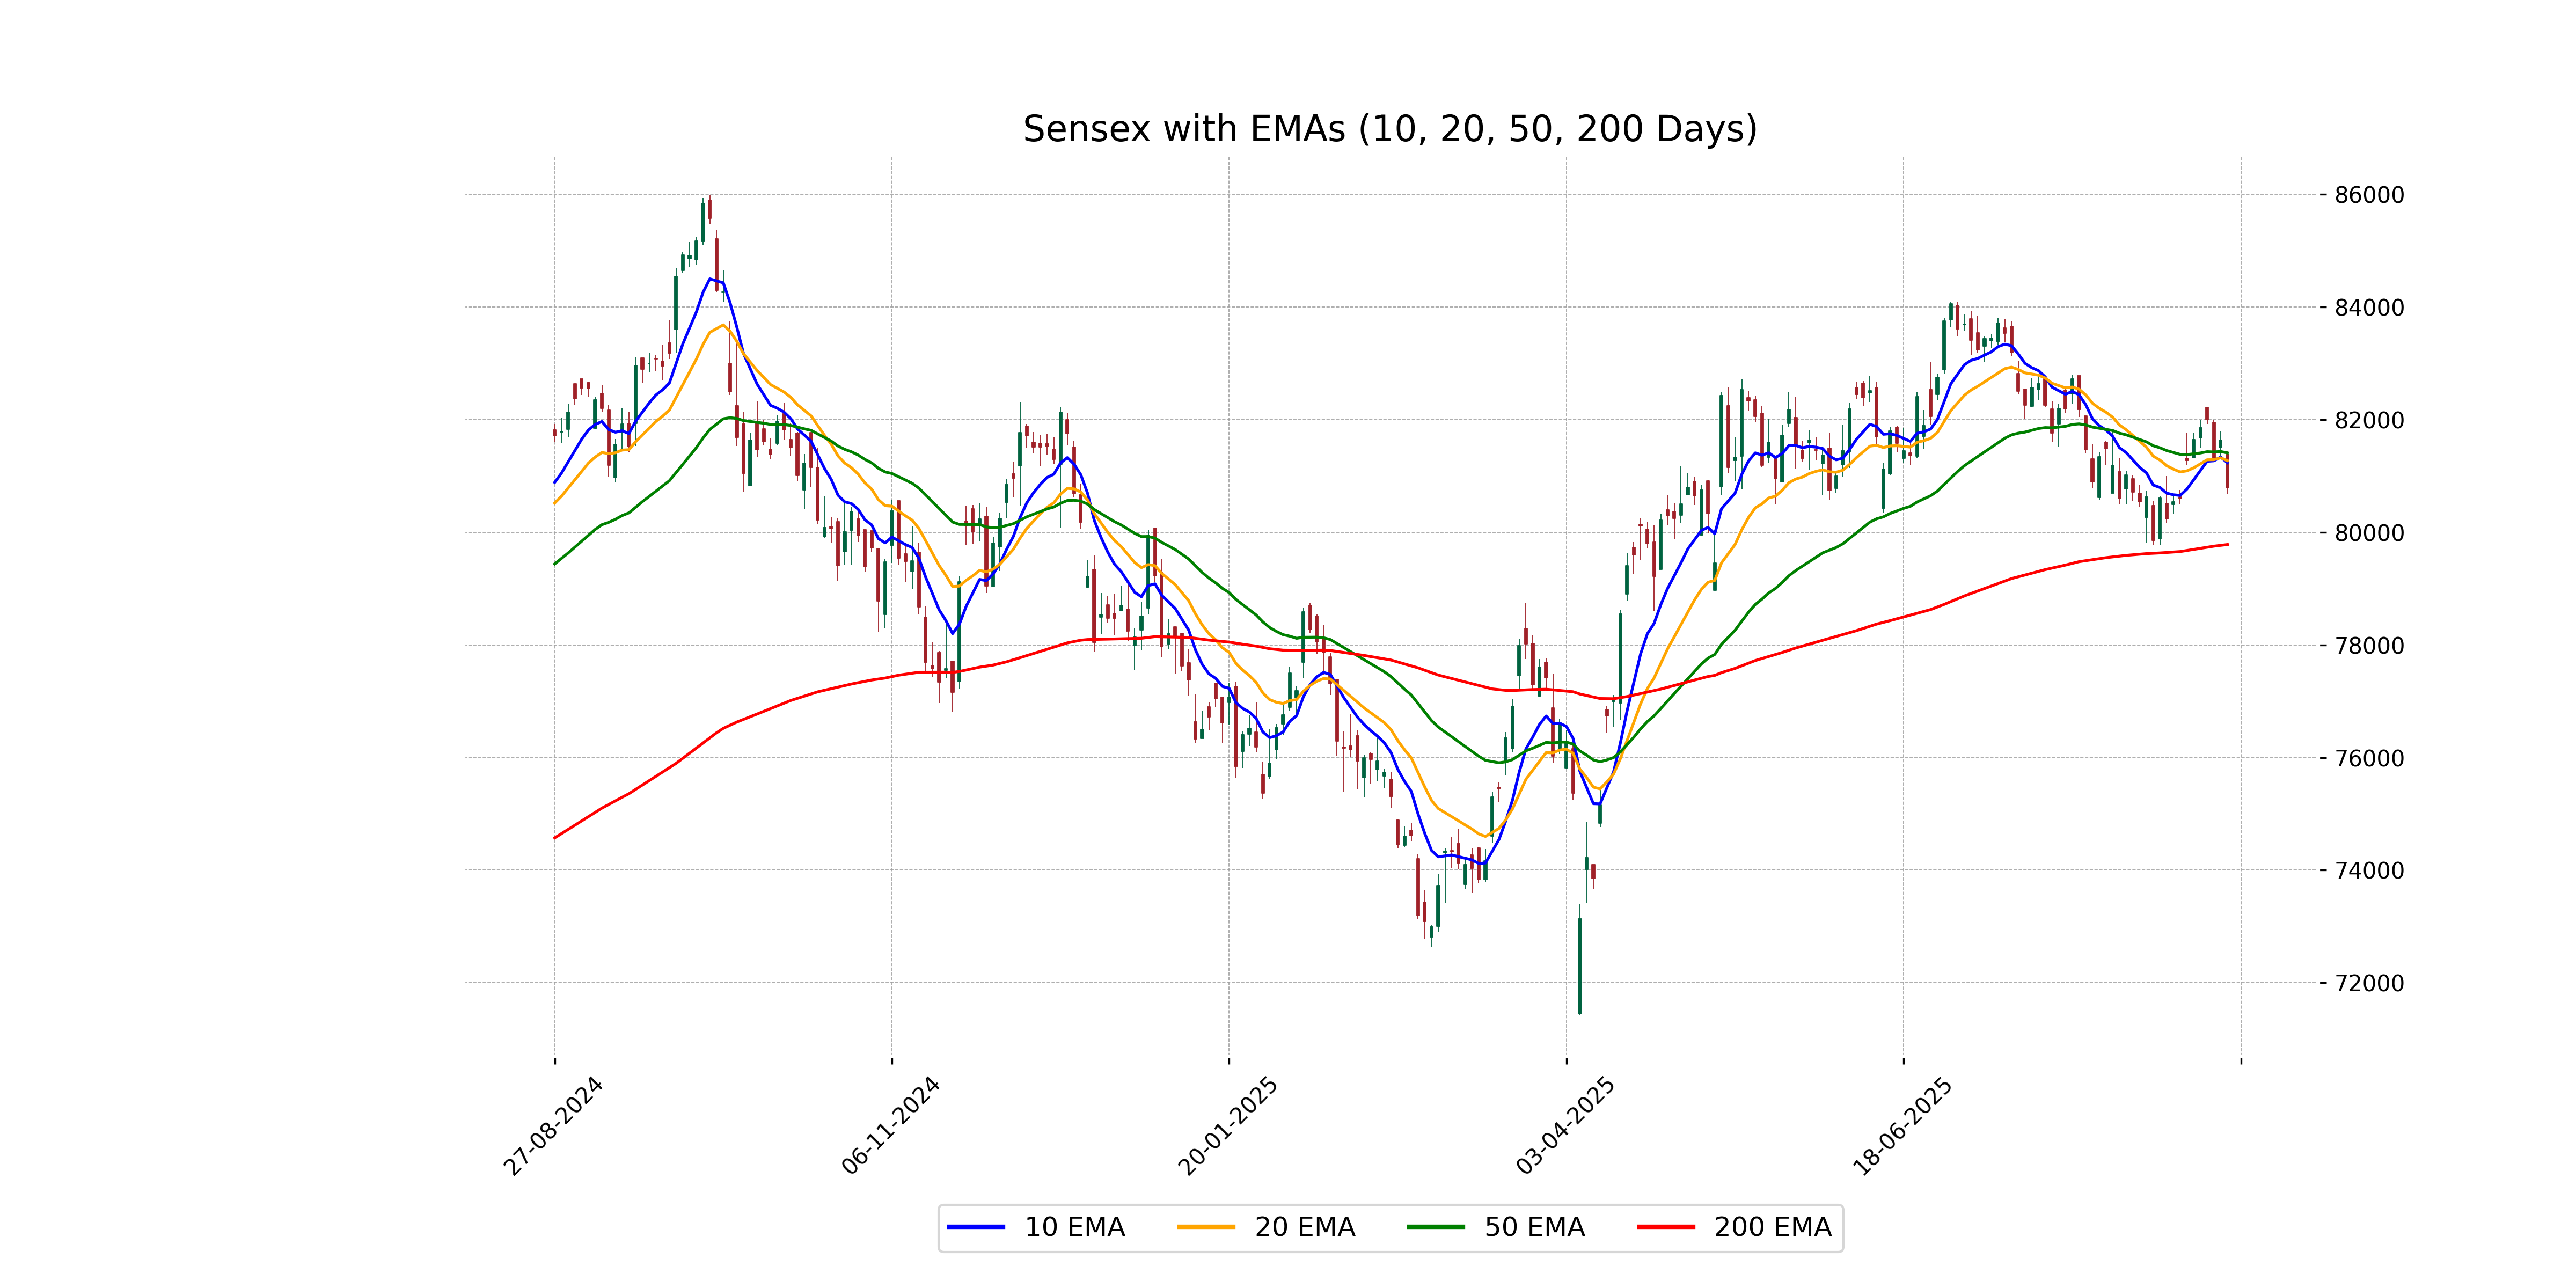
Relationship with Key Moving Averages
The closing value of Sensex, 80786.54, is below its 50-day EMA of 81408.26 and close to the 200-day EMA of 79781.42. This positioning suggests a short-term bearish trend, yet it is not far from its longer-term average, indicating a potential support level near the 200-day EMA.
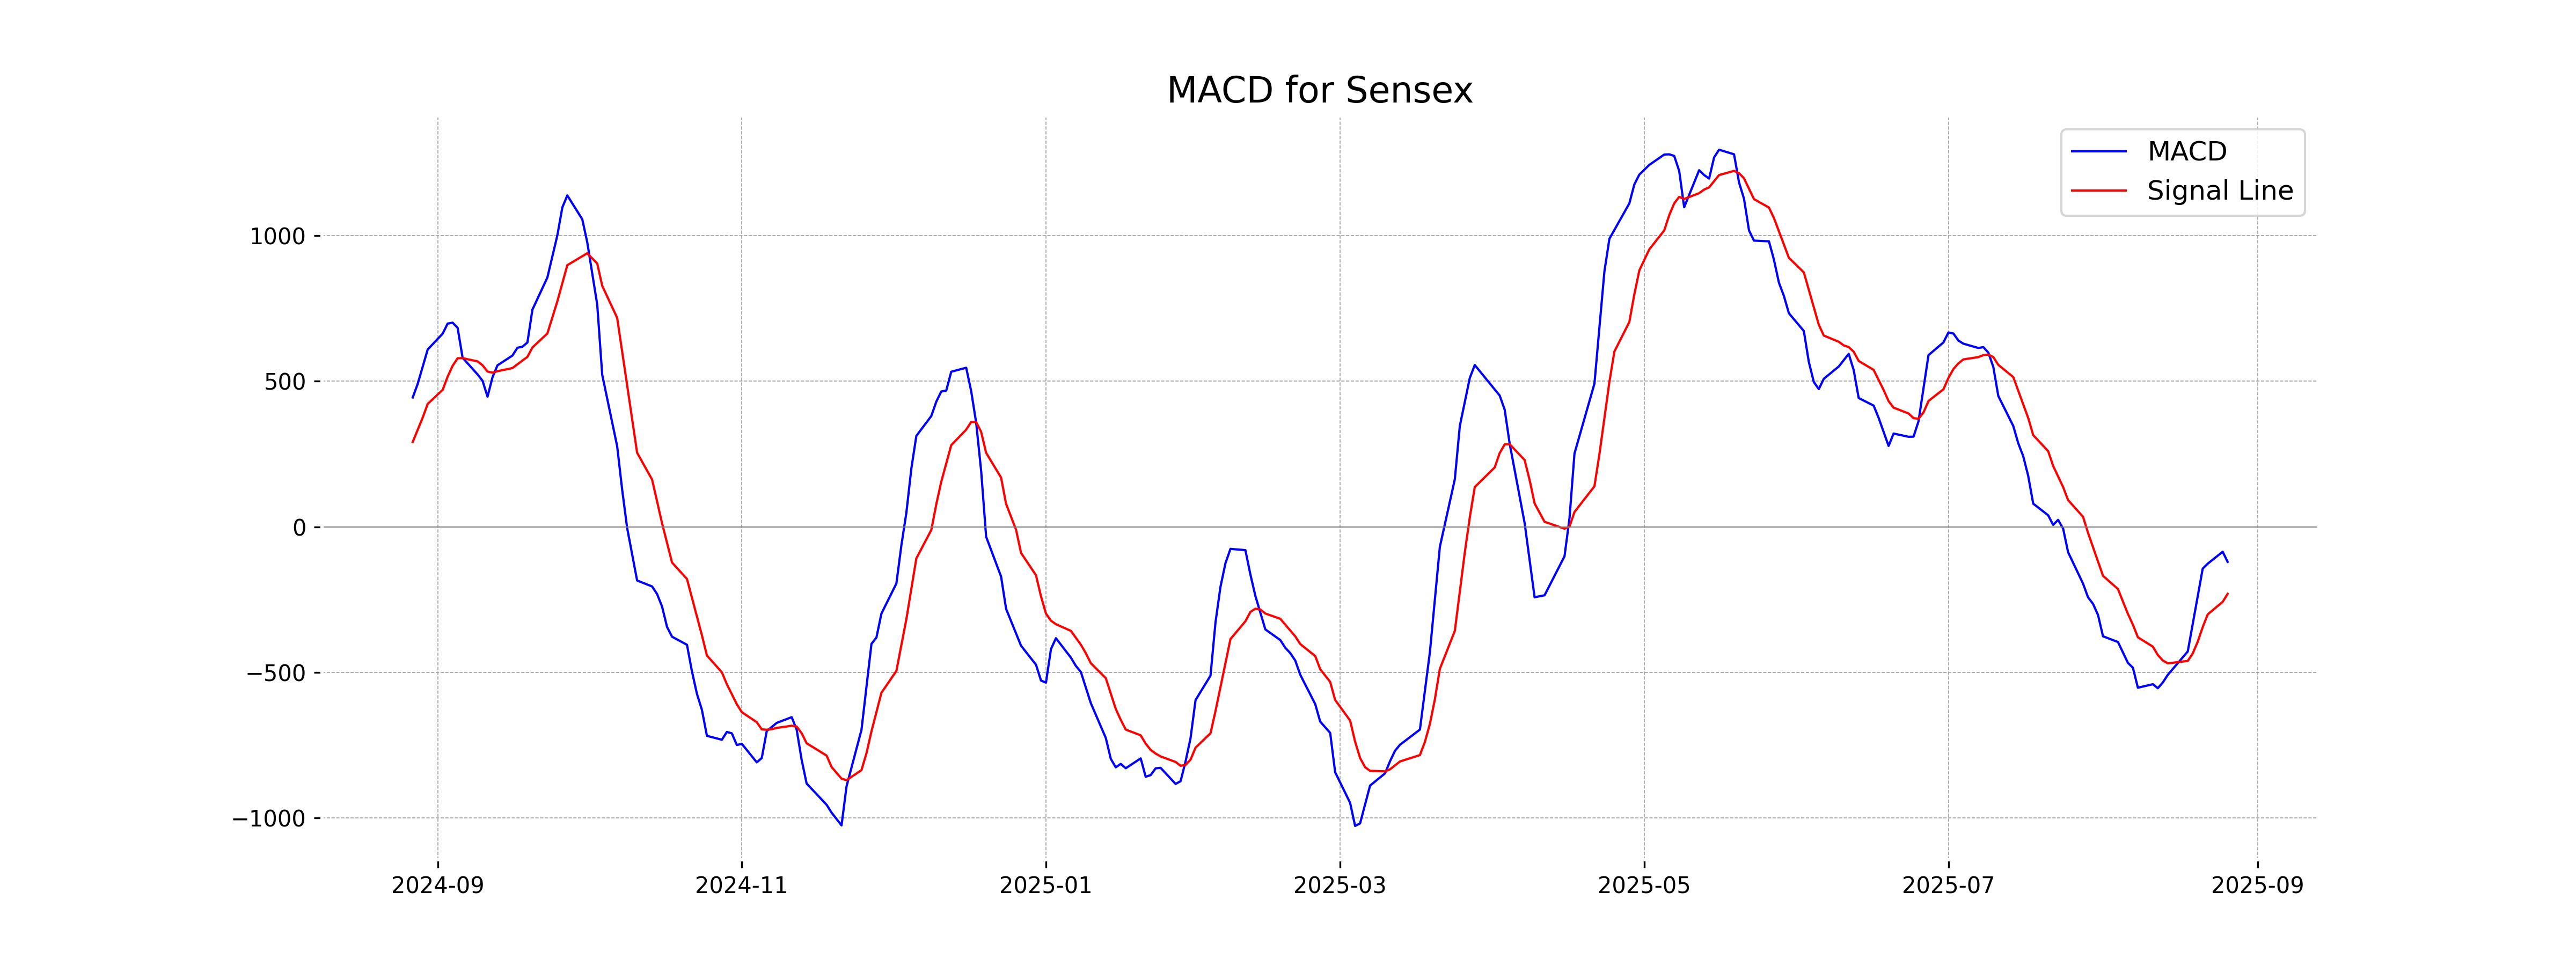
Moving Averages Trend (MACD)
Analysis for Sensex (MACD): The MACD value of -120.55, which is above the MACD Signal of -230.39, suggests a potential bullish crossover might be forming. However, given the negative MACD and Points Change of -849.37, caution is advisable as this can indicate continuing downward momentum.
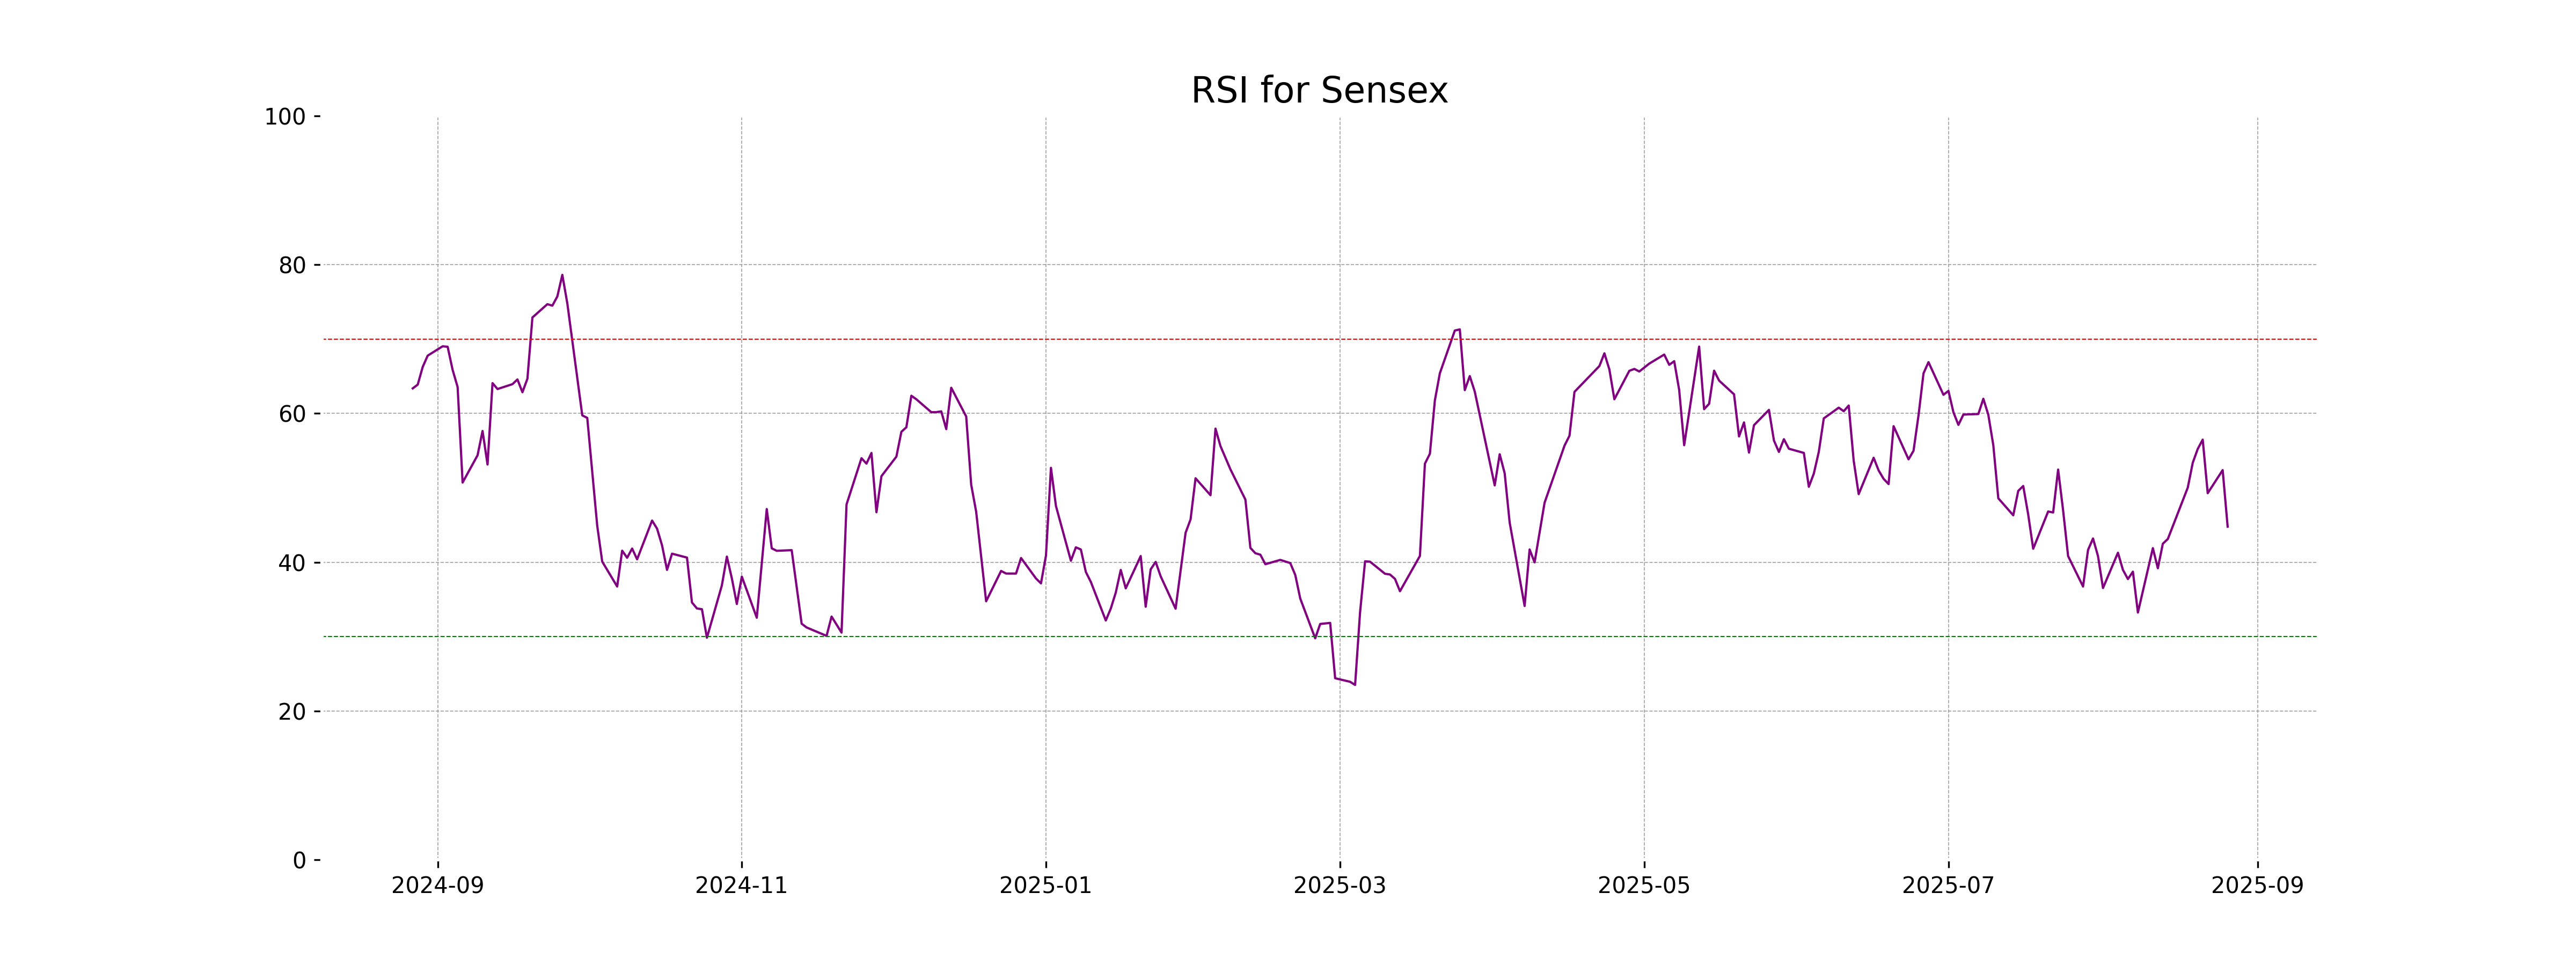
RSI Analysis
The Relative Strength Index (RSI) for Sensex is currently at 44.78. This suggests that the index is in a neutral zone, as a typical RSI reading between 30 and 70 indicates neither overbought nor oversold conditions. Further movements in the RSI would need to be observed to determine potential price action signals.
Analysis for Nifty Auto - August 26, 2025
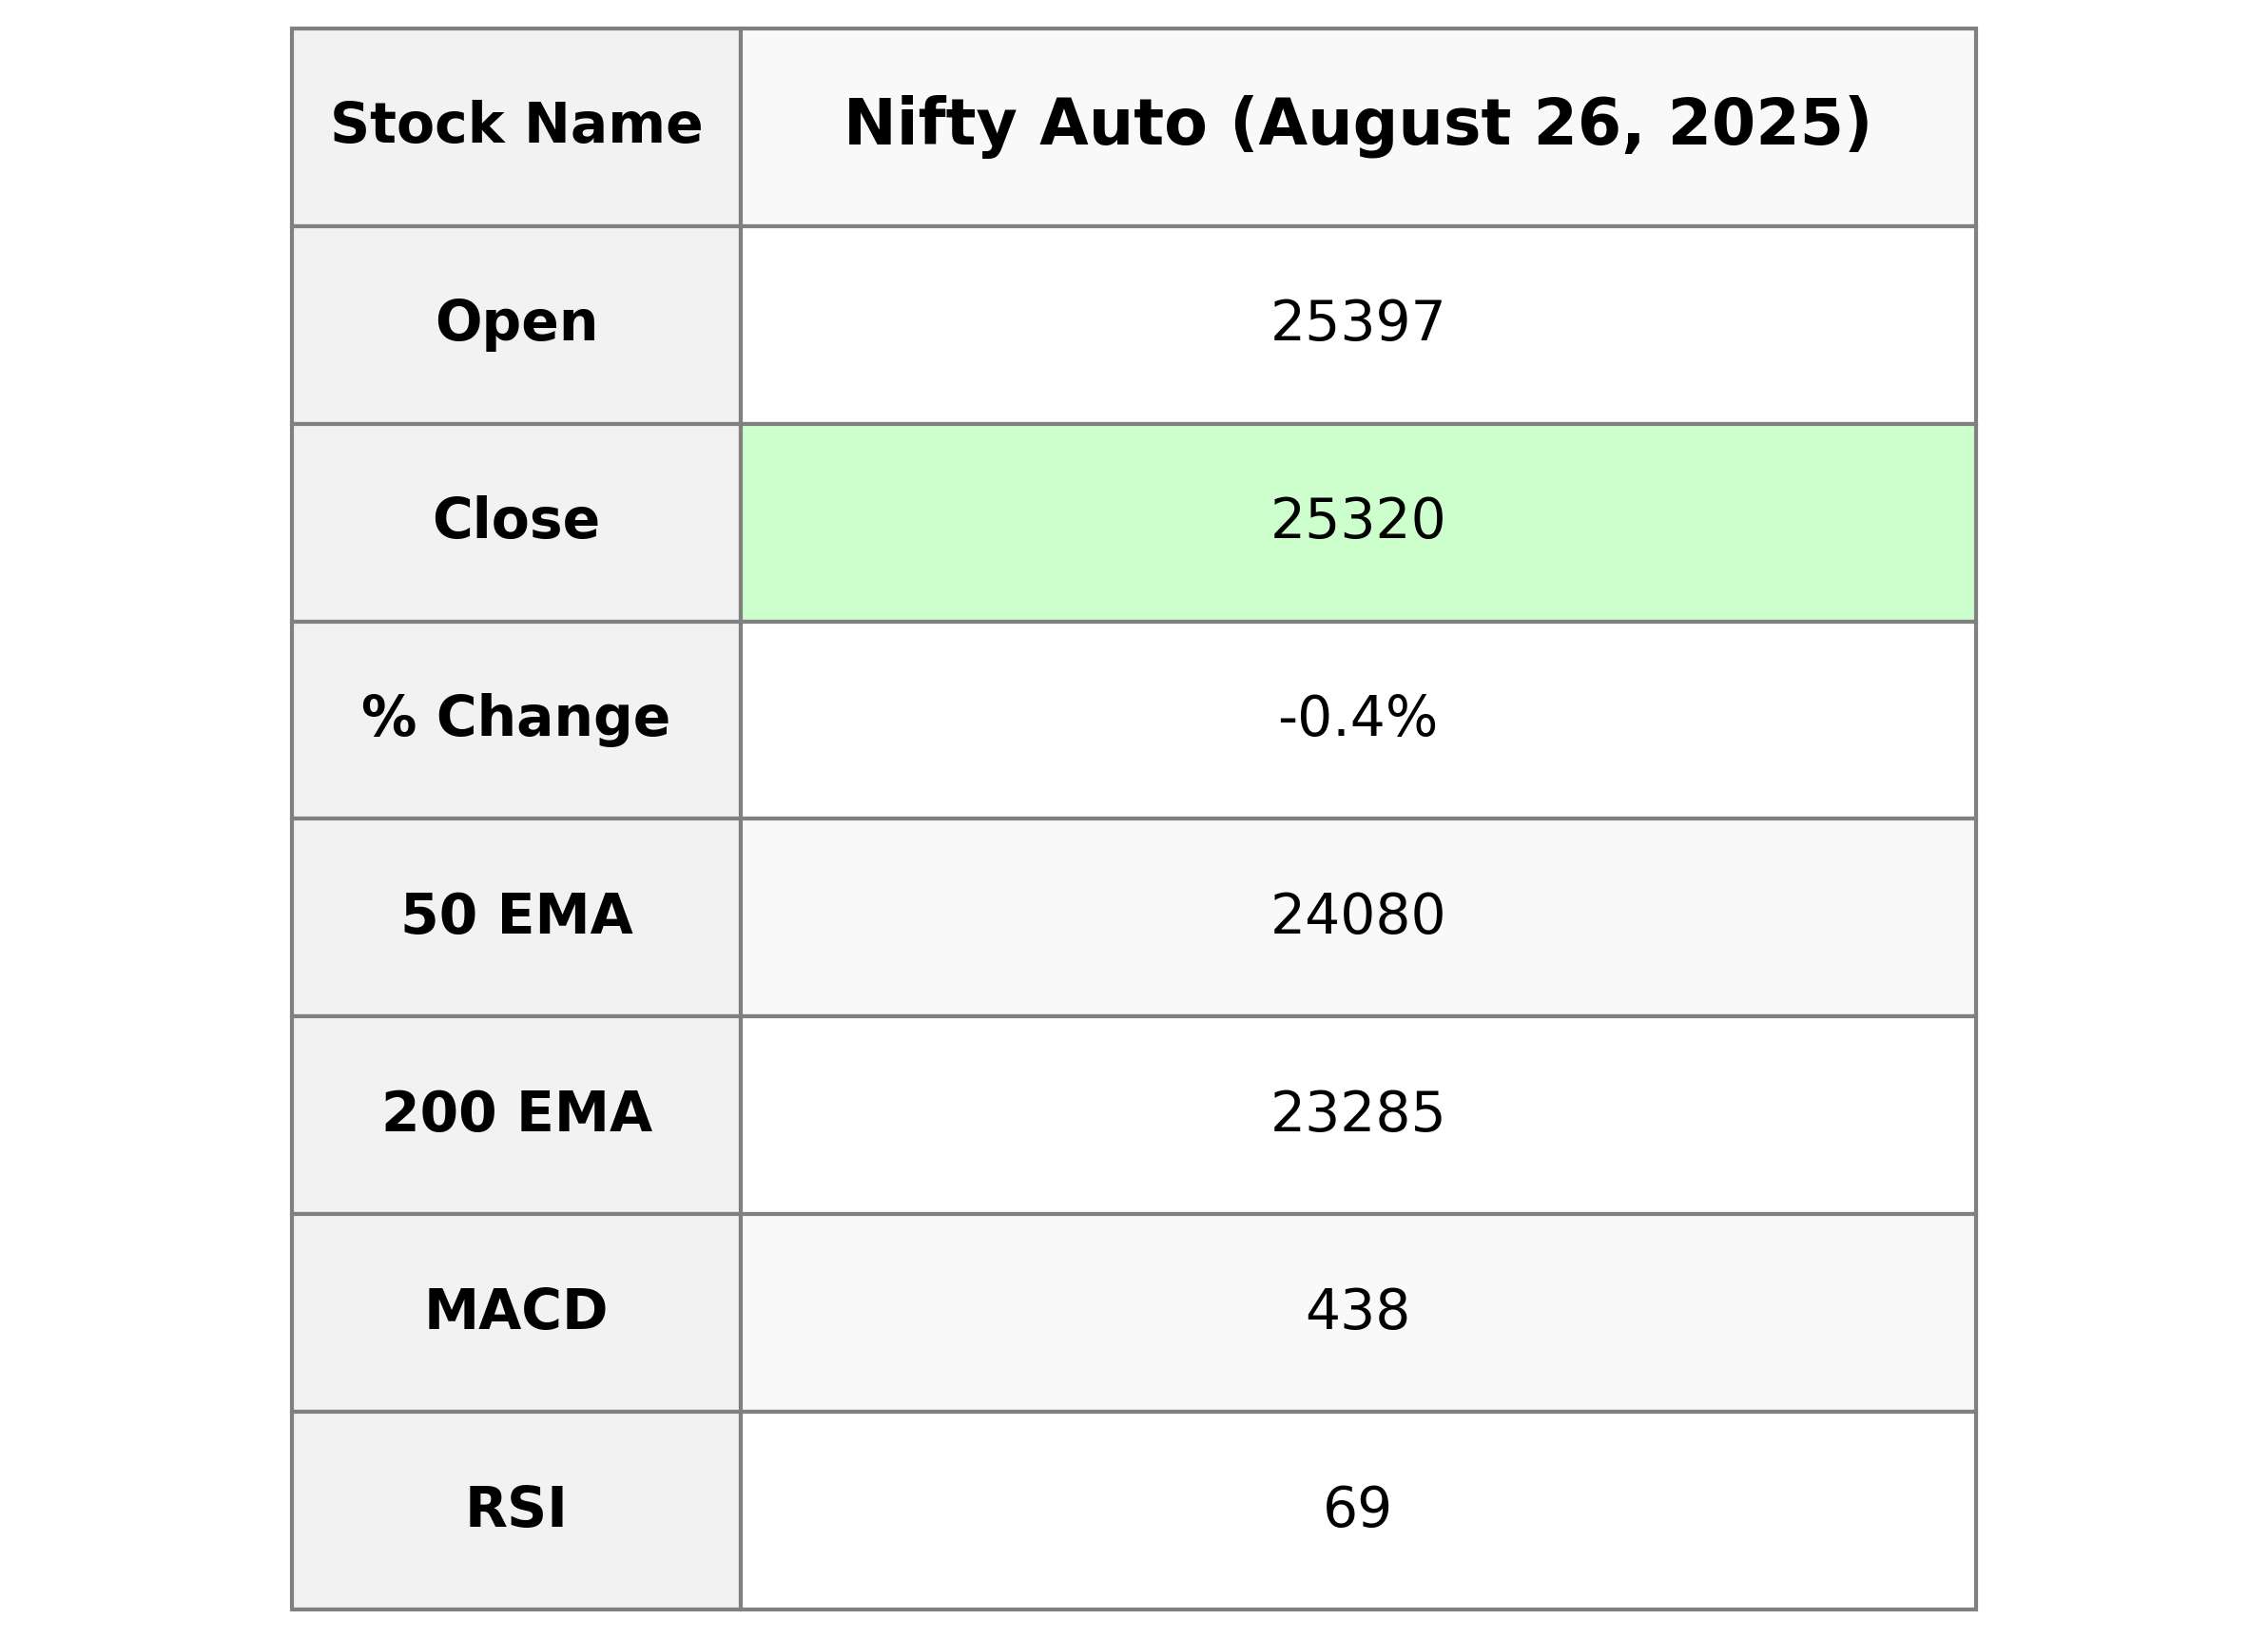
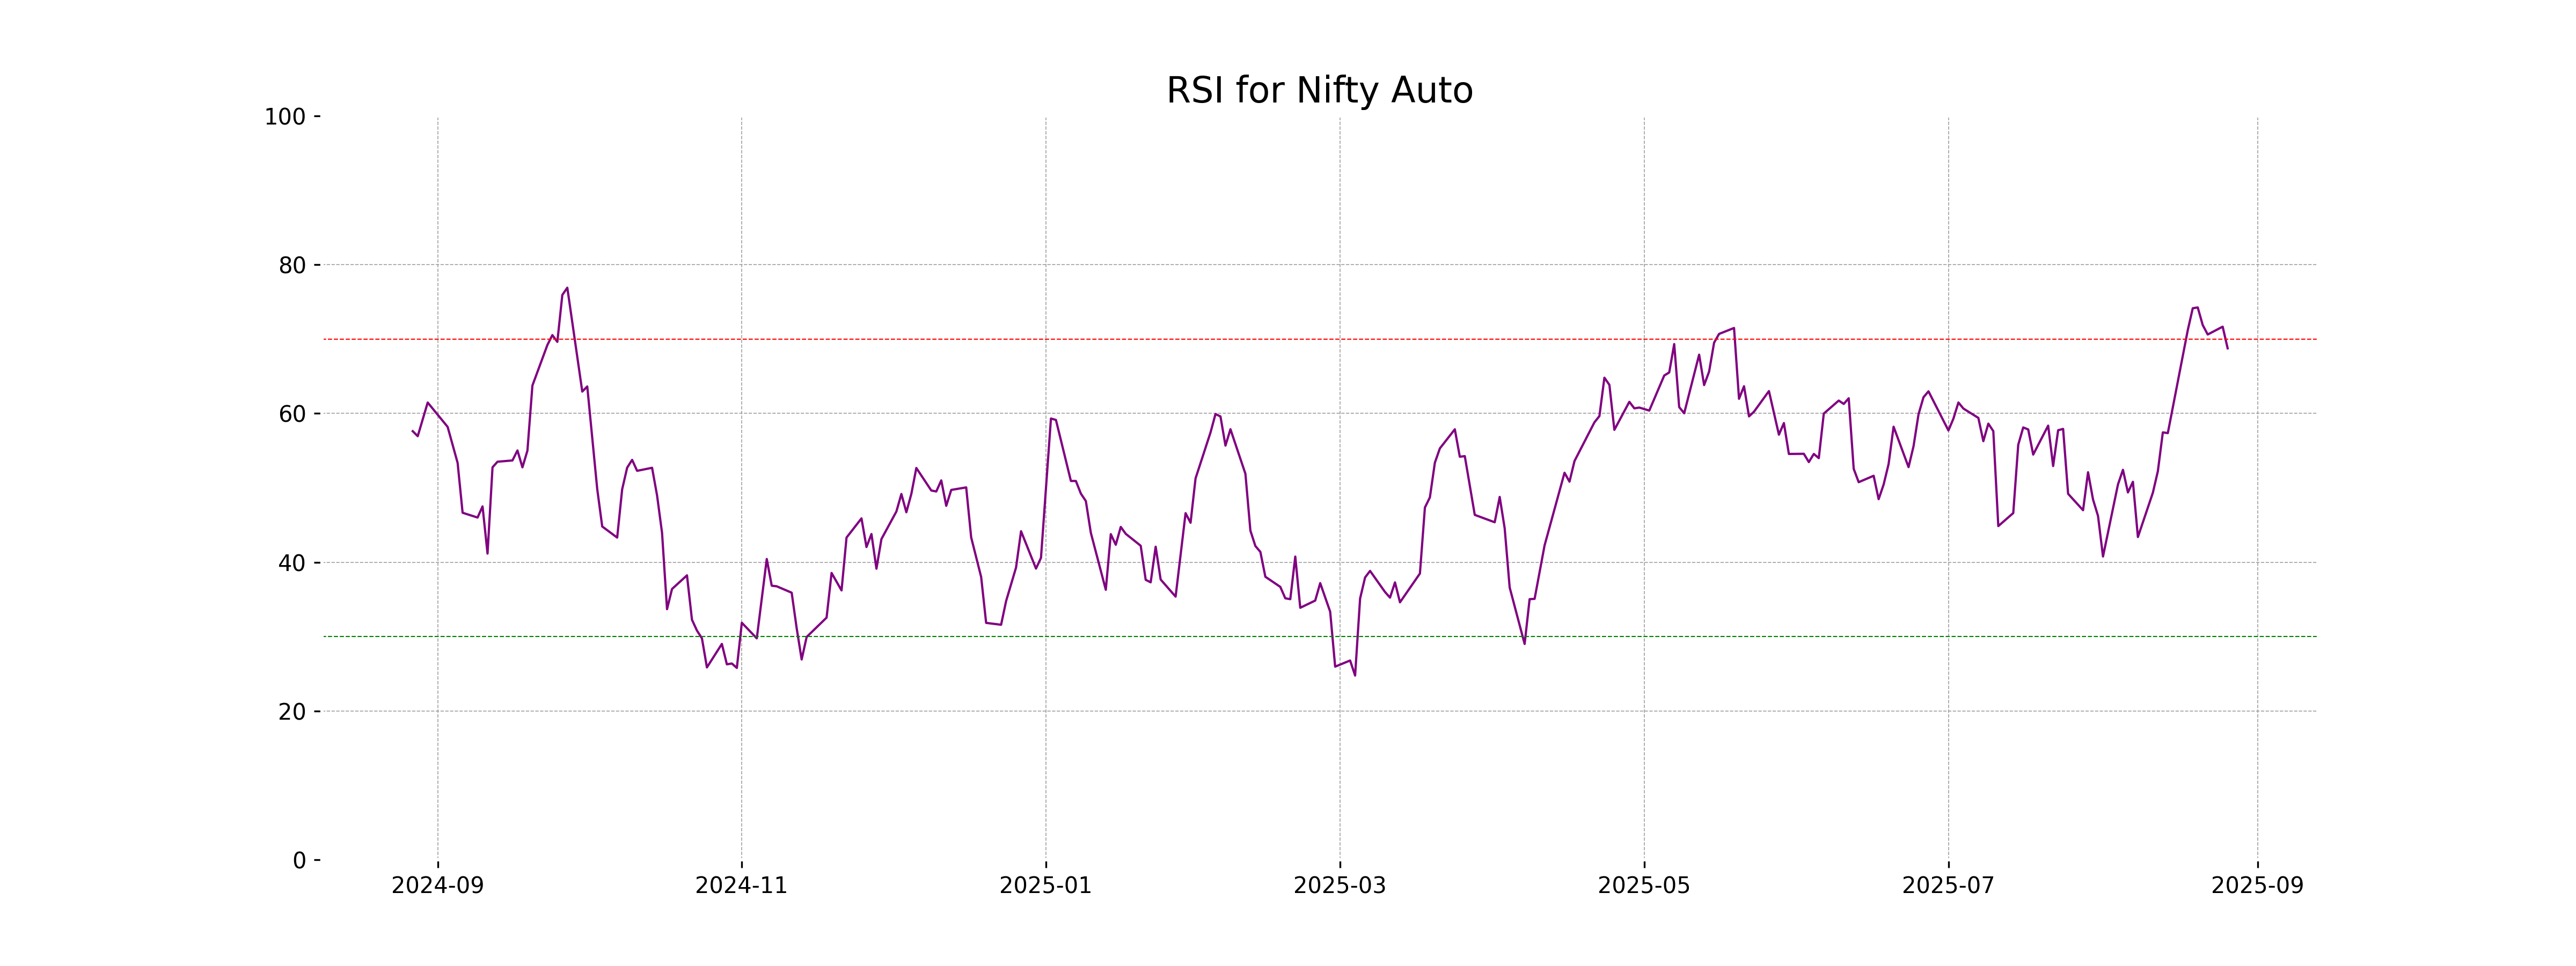
Nifty Auto opened at 25396.70 and closed at 25320.30, marking a decrease of 0.41% with a points change of -103.10 from the previous close of 25423.40. The index recorded a high of 25521.70 and a low of 25226.45. The relative strength index (RSI) is at 68.75, indicating a near overbought condition, whereas the moving average convergence divergence (MACD) is significantly above the signal line, suggesting bullish momentum.
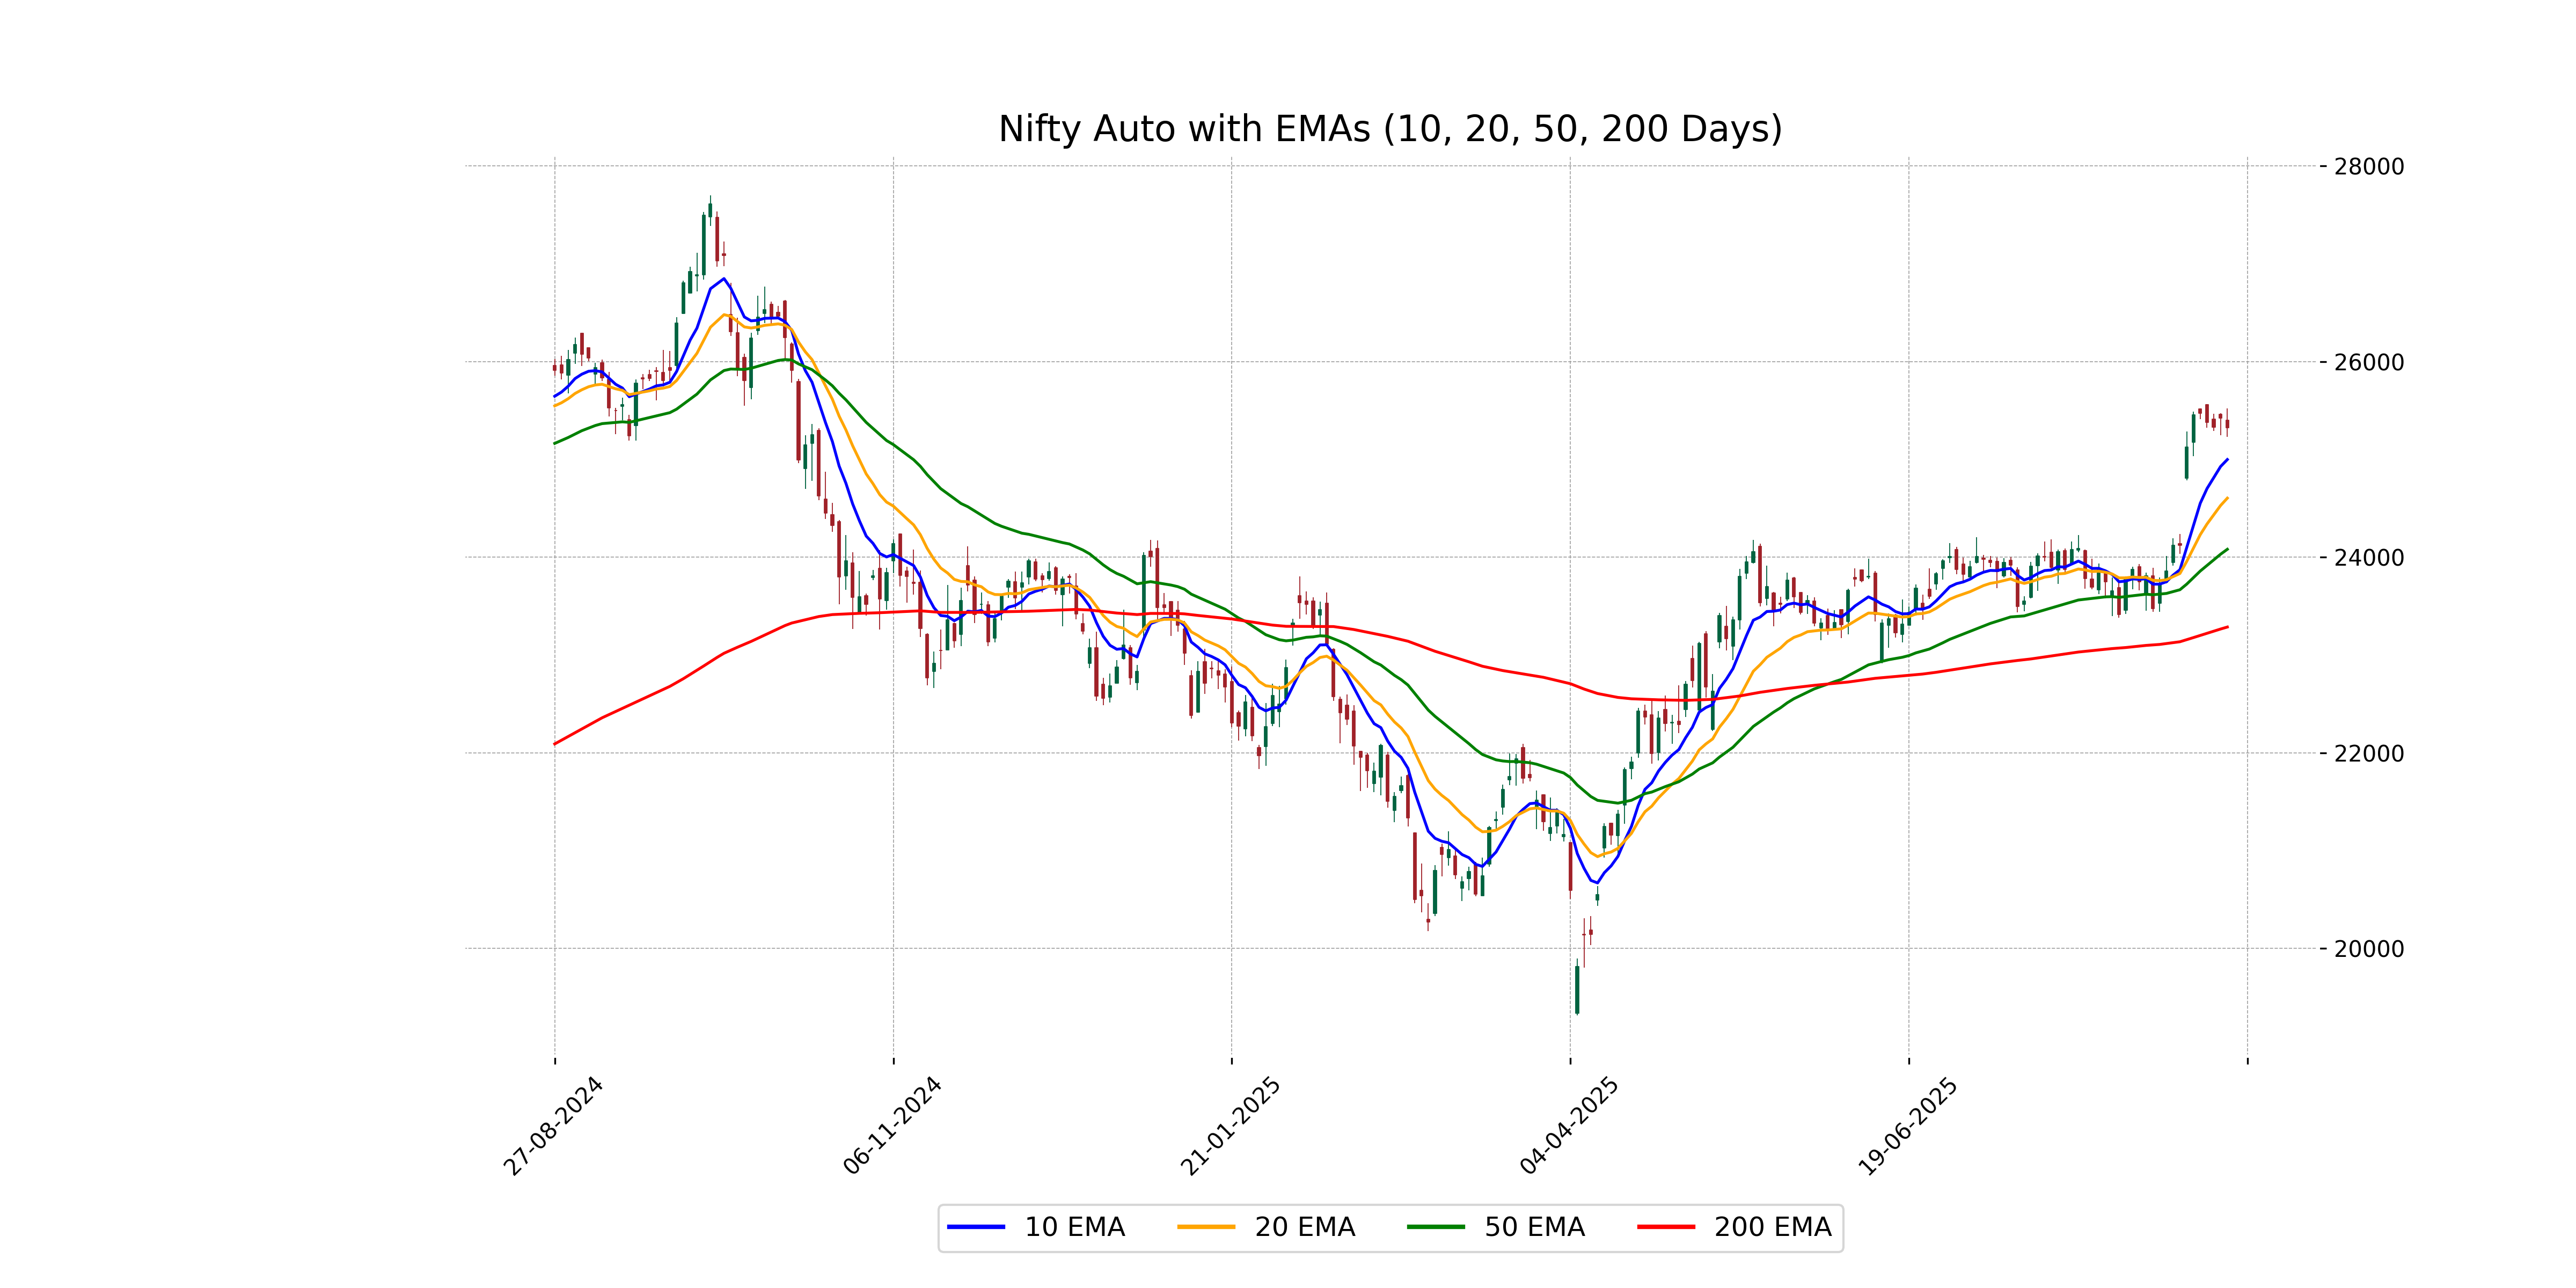
Relationship with Key Moving Averages
The Nifty Auto index closed at 25320.30, which is above its 50-day EMA of 24079.75 and 200-day EMA of 23284.87, indicating a bullish trend over the longer term. However, it is near its 10-day EMA of 24997.39 and slightly above the 20-day EMA of 24602.69, suggesting moderate short-term strength.
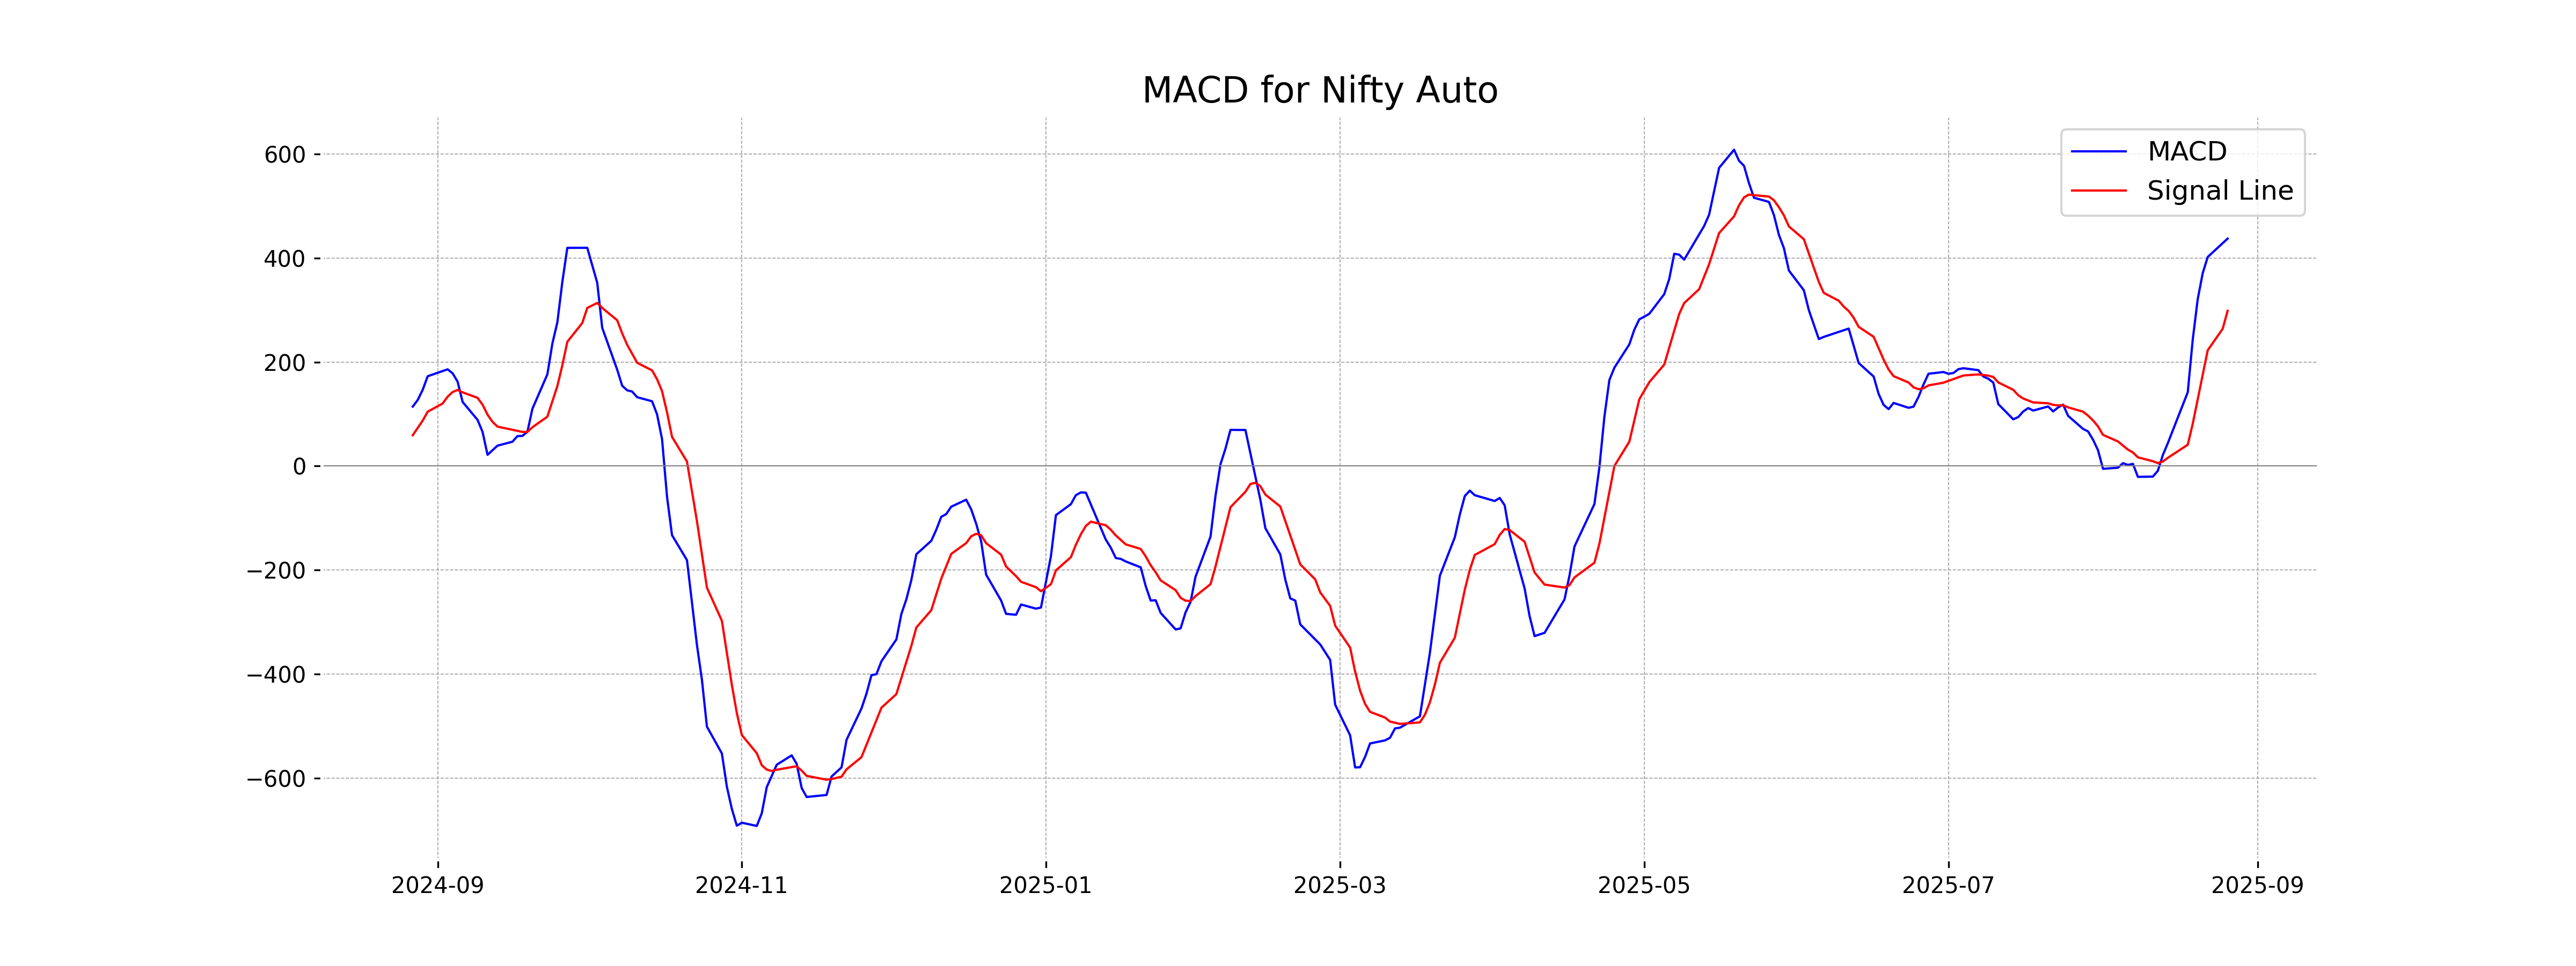
Moving Averages Trend (MACD)
Based on the data, the MACD for Nifty Auto is 437.6429 with the MACD Signal at 298.7937, indicating a bullish trend as the MACD line is above the Signal line. This suggests that the momentum in the stock price is positive.
RSI Analysis
The RSI for Nifty Auto is 68.75, indicating it is approaching overbought territory, as RSI values above 70 often suggest. While not yet in the overbought range, investors should monitor closely for any potential reversals or pullbacks.
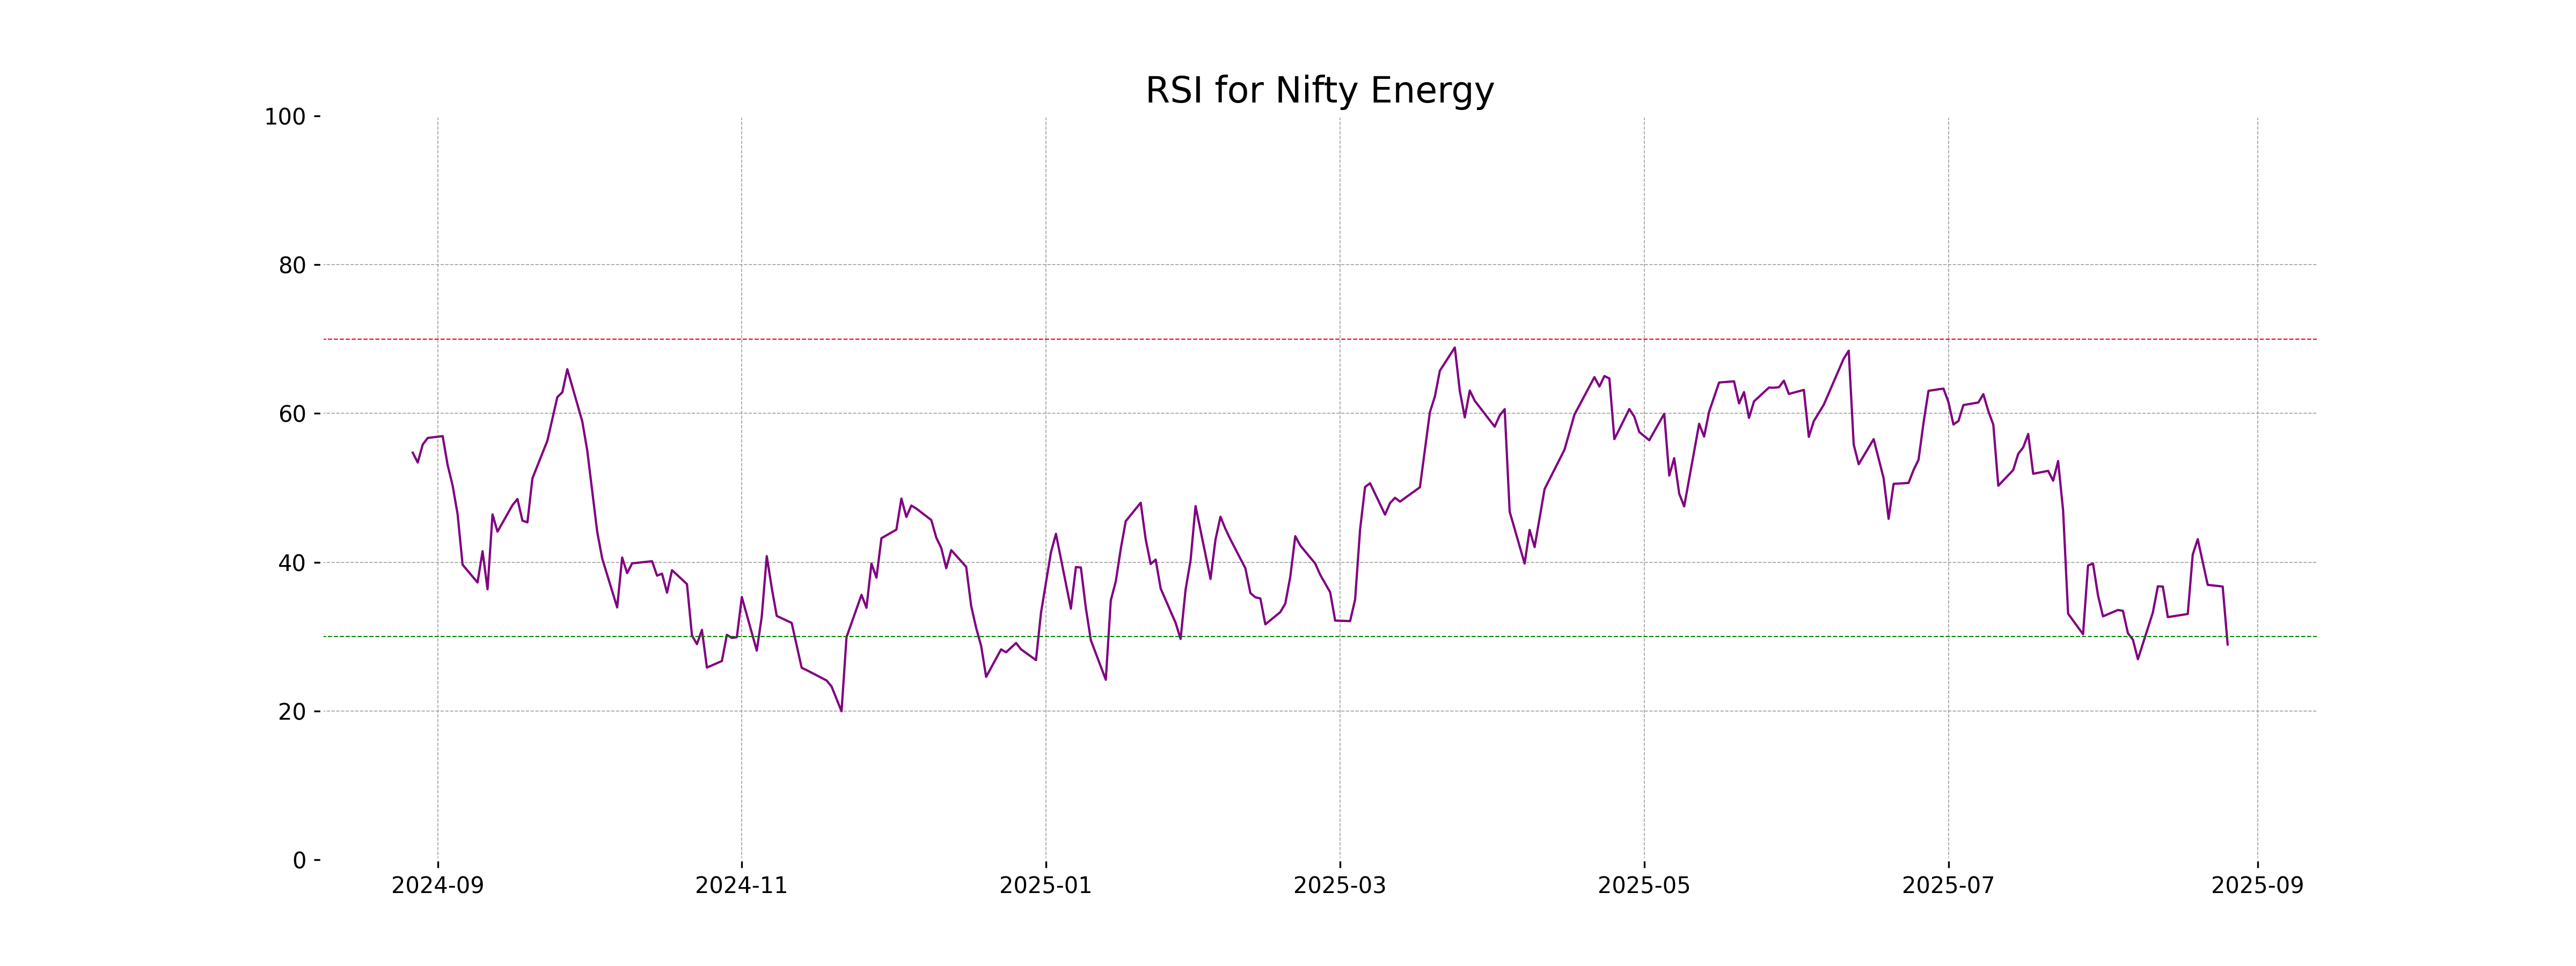
Analysis for Nifty Energy - August 26, 2025
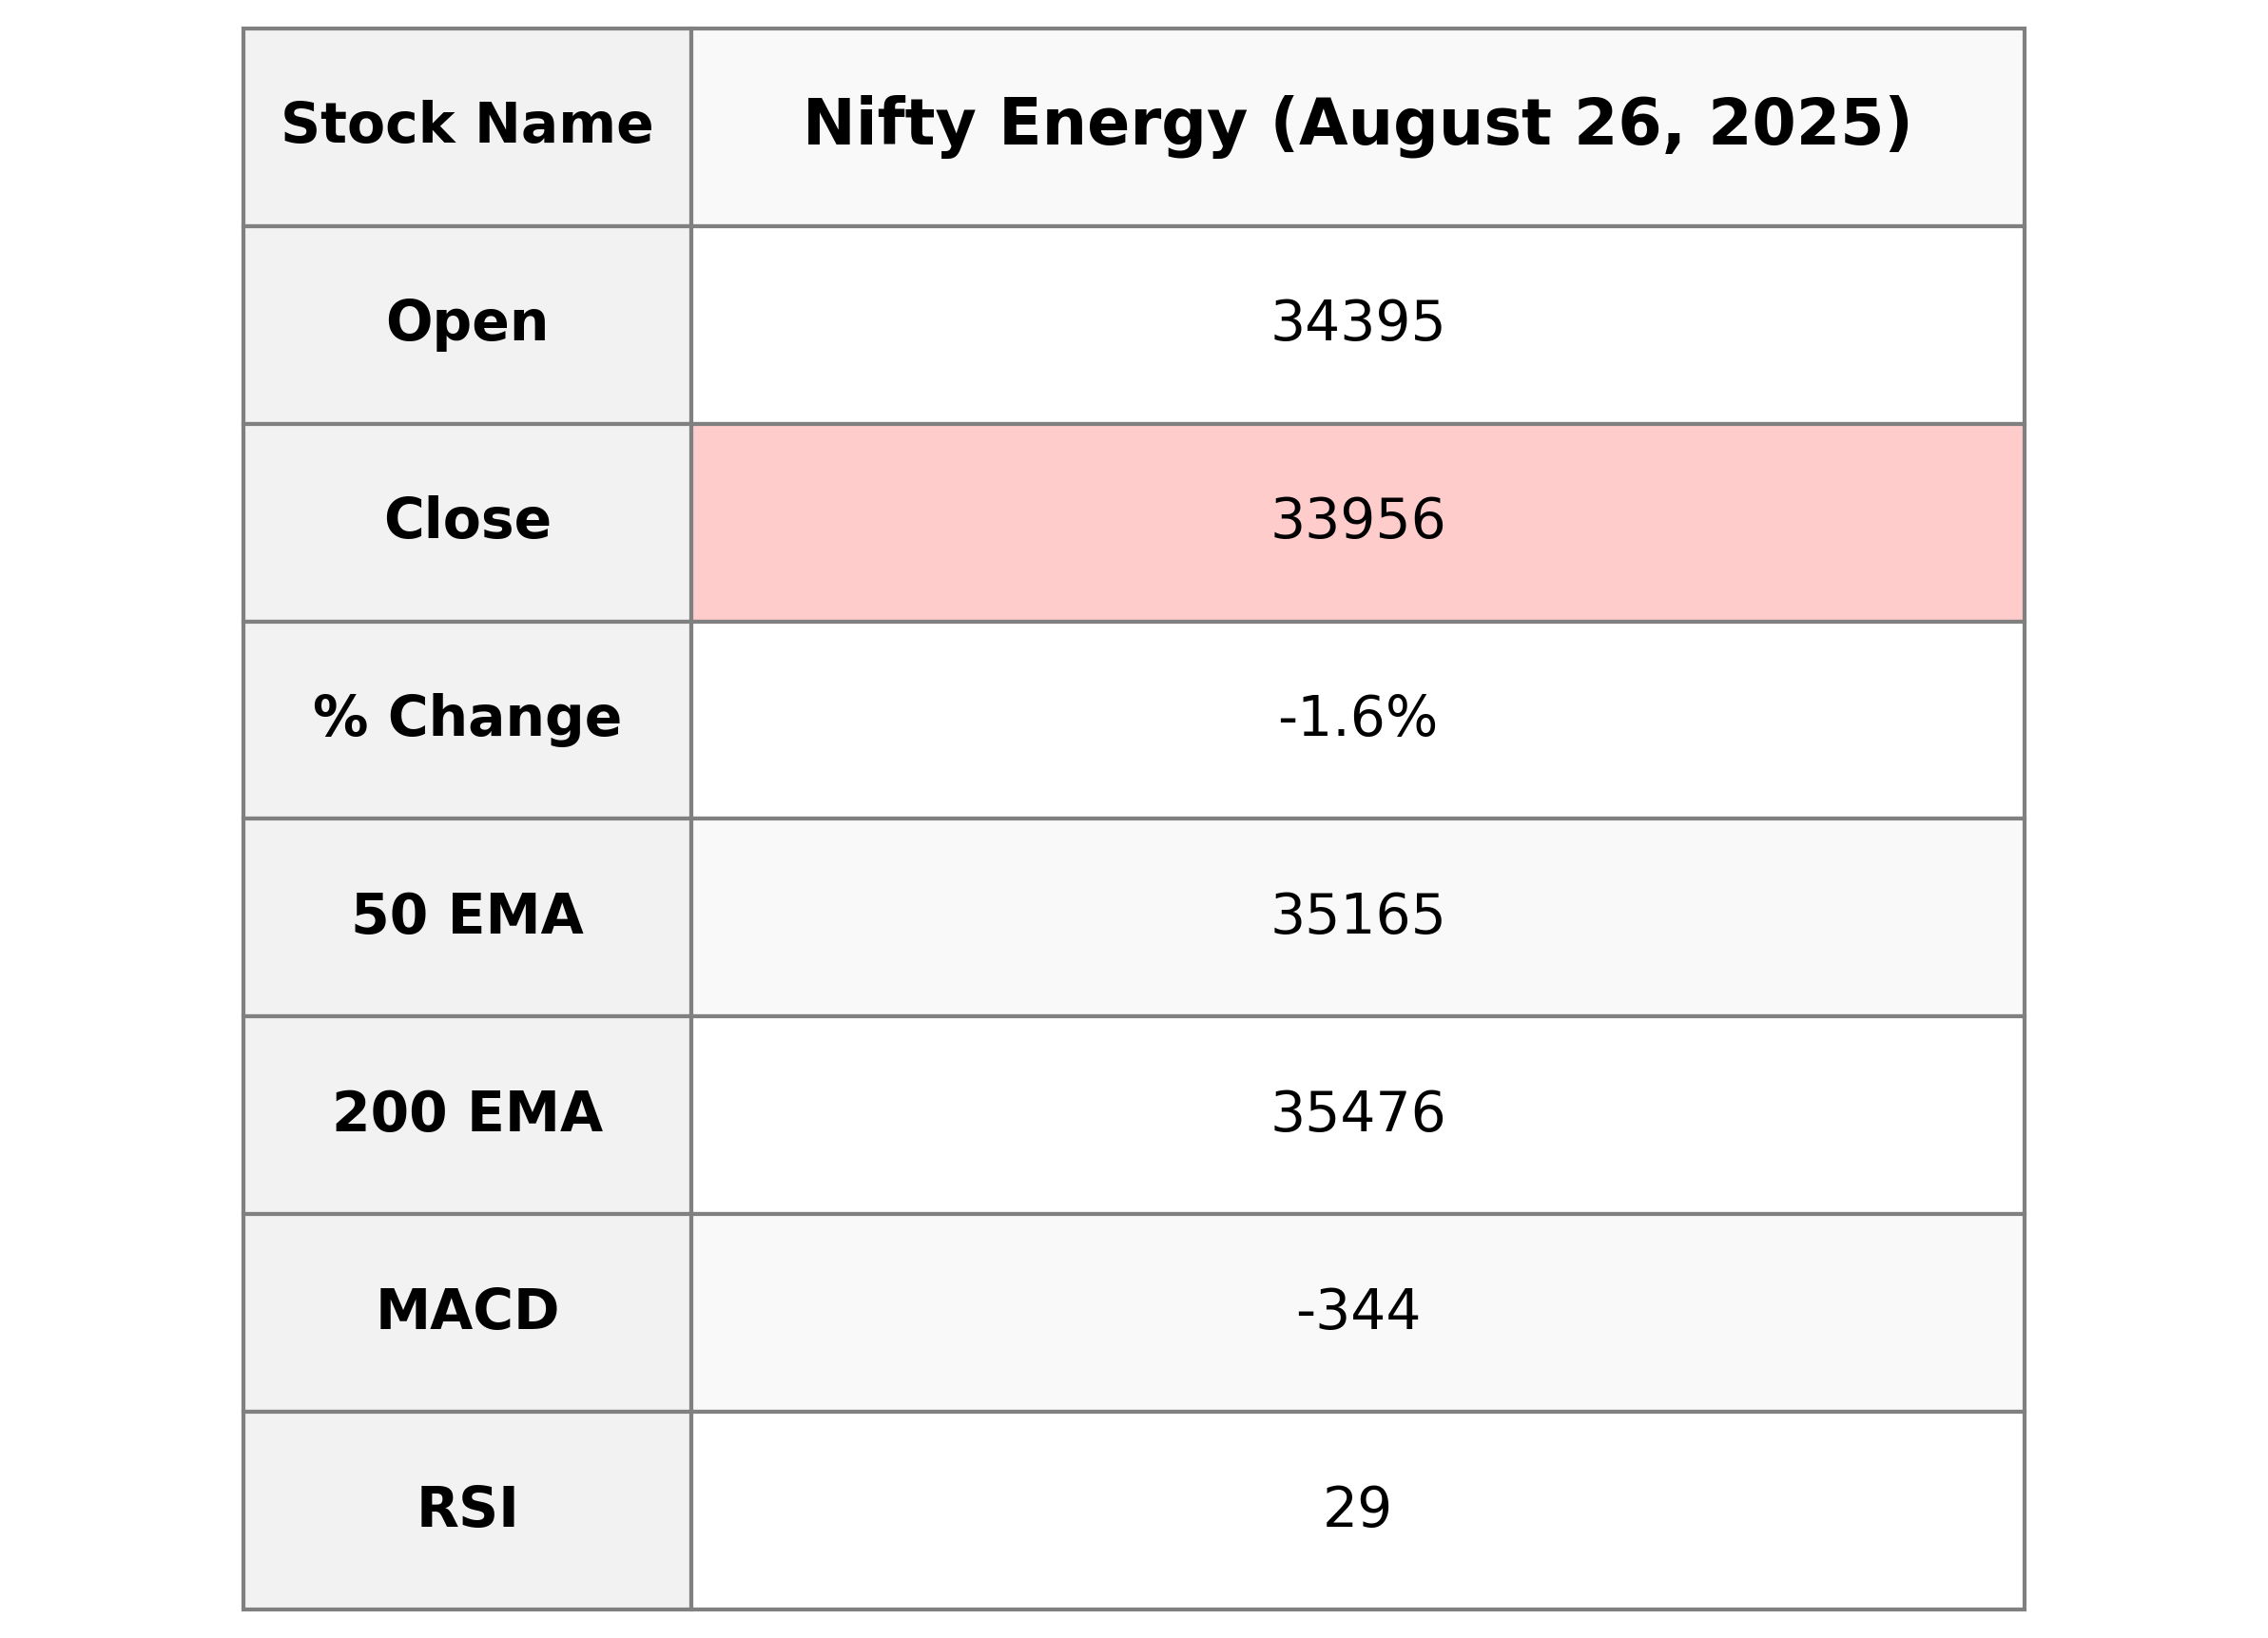
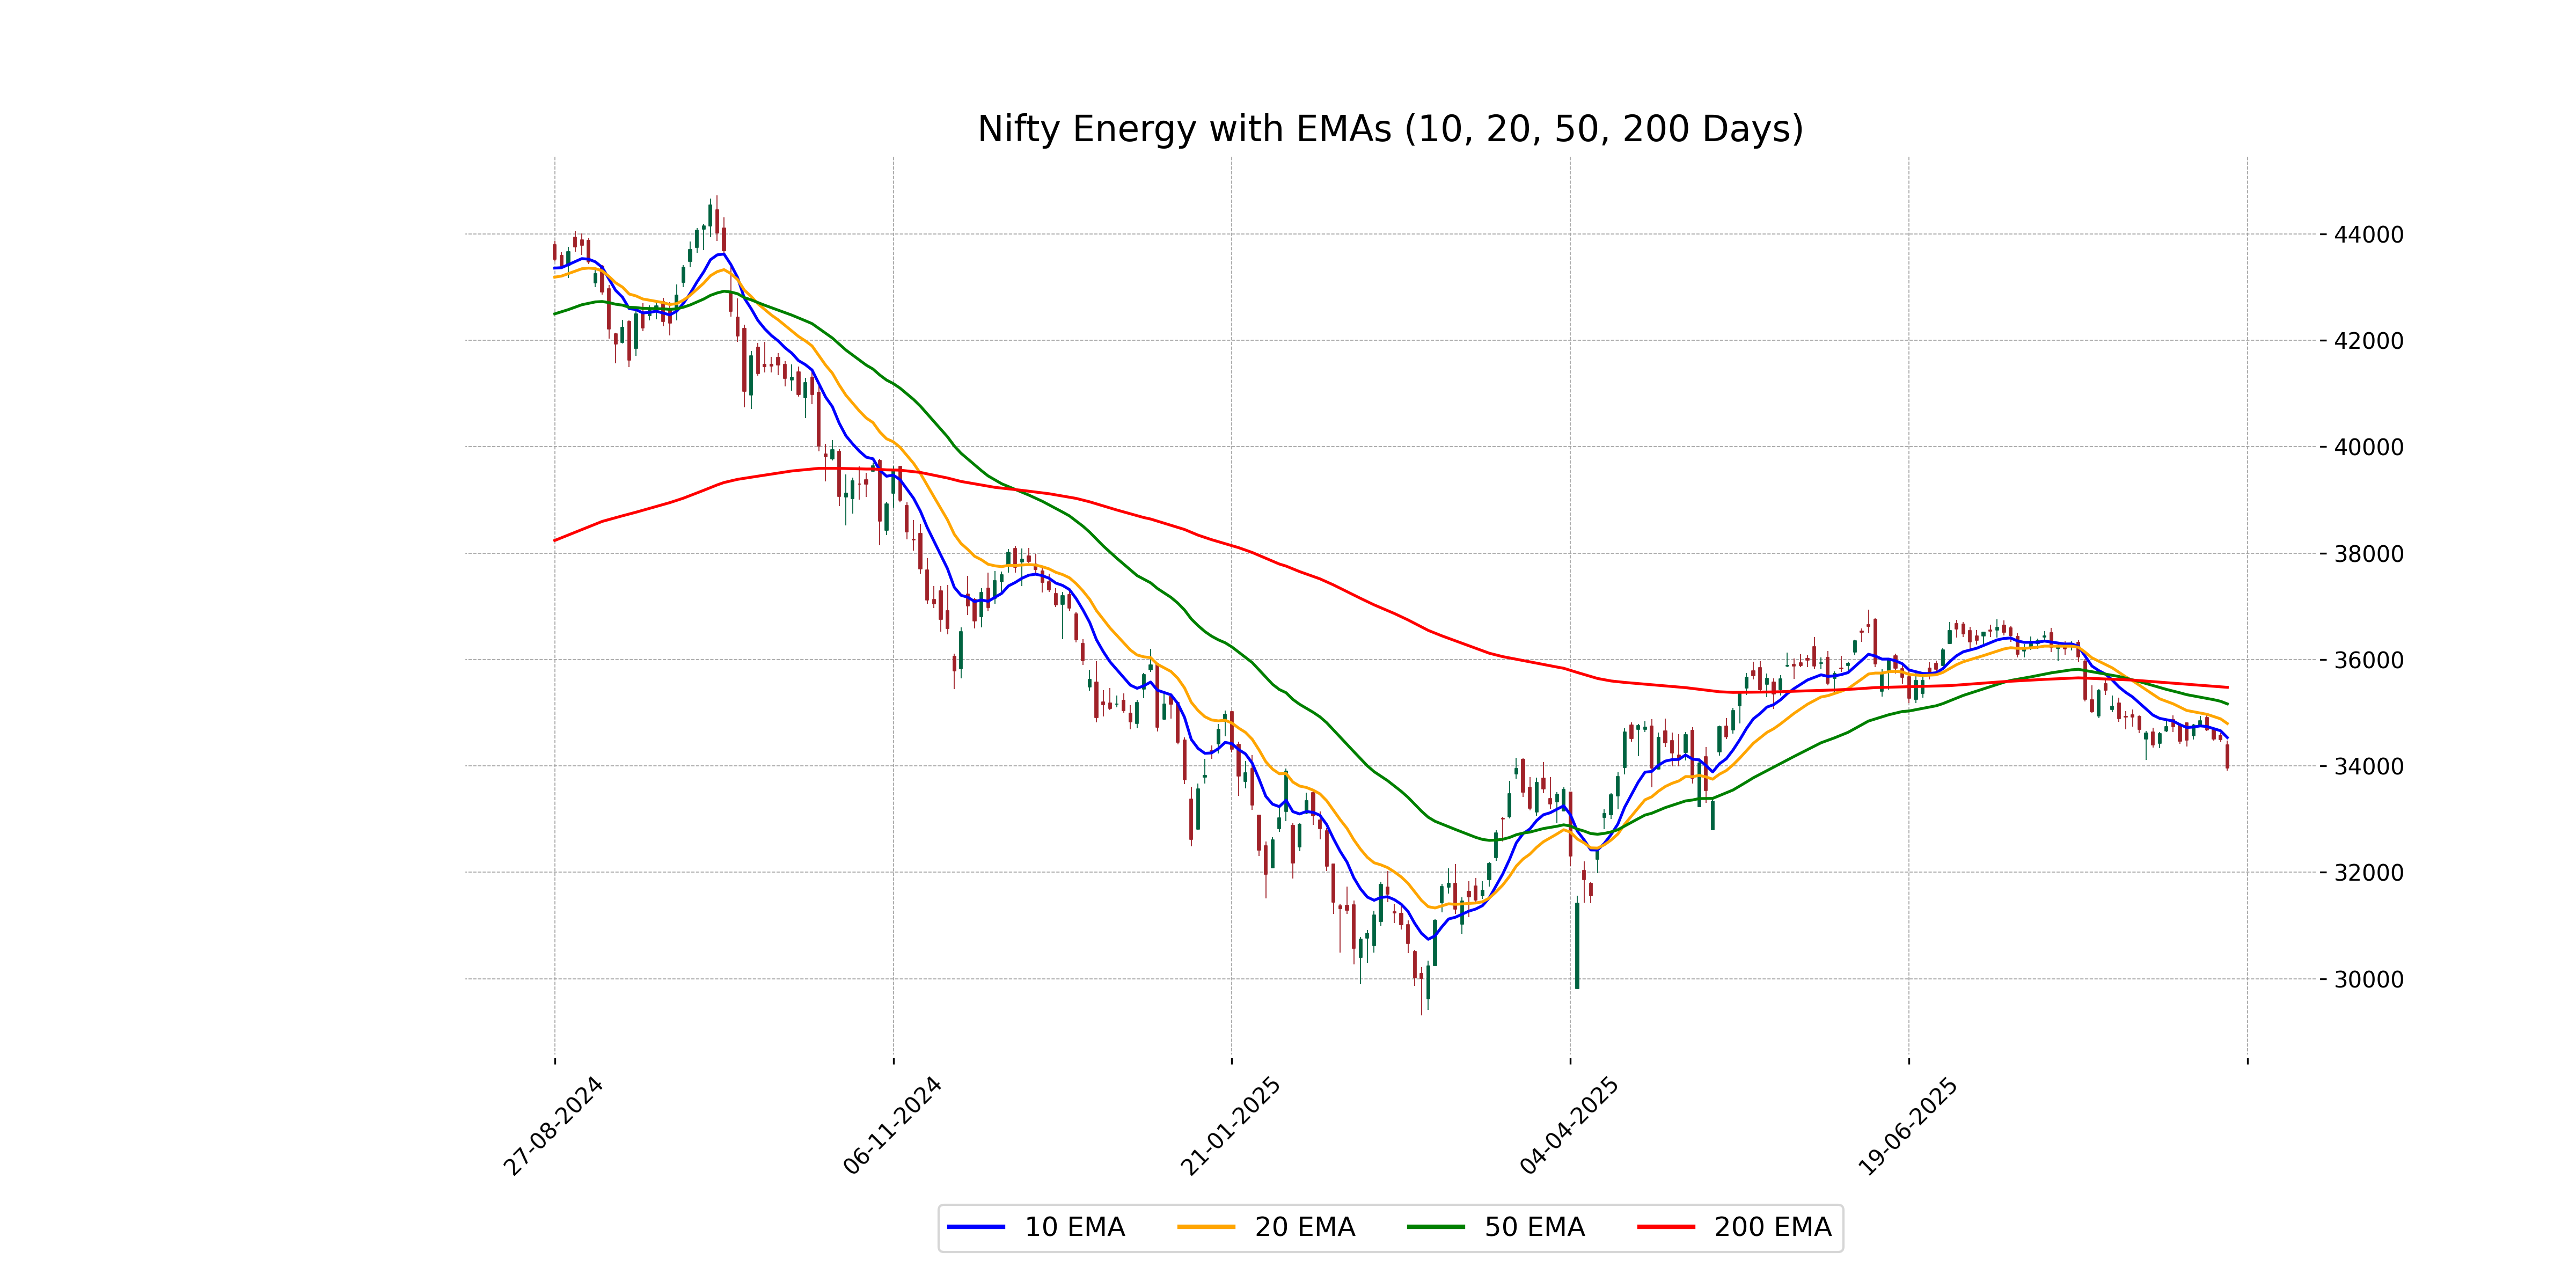
Nifty Energy Performance Description: Nifty Energy opened at 34395.25 and closed at 33955.95, experiencing a decline of approximately 1.56% with a points change of -538.40. The current RSI stands at 28.94, indicating it's in an oversold condition. Moving averages show the index is trading below its 10 EMA, 20 EMA, 50 EMA, and 200 EMA, reflecting a bearish trend.
Relationship with Key Moving Averages
The Nifty Energy index closed at 33,955.95, which is below its 10-day, 20-day, 50-day, and 200-day EMAs, indicating a bearish trend. The current close is notably below all the mentioned moving averages, with the RSI at 28.94 suggesting it is in the oversold territory.
Moving Averages Trend (MACD)
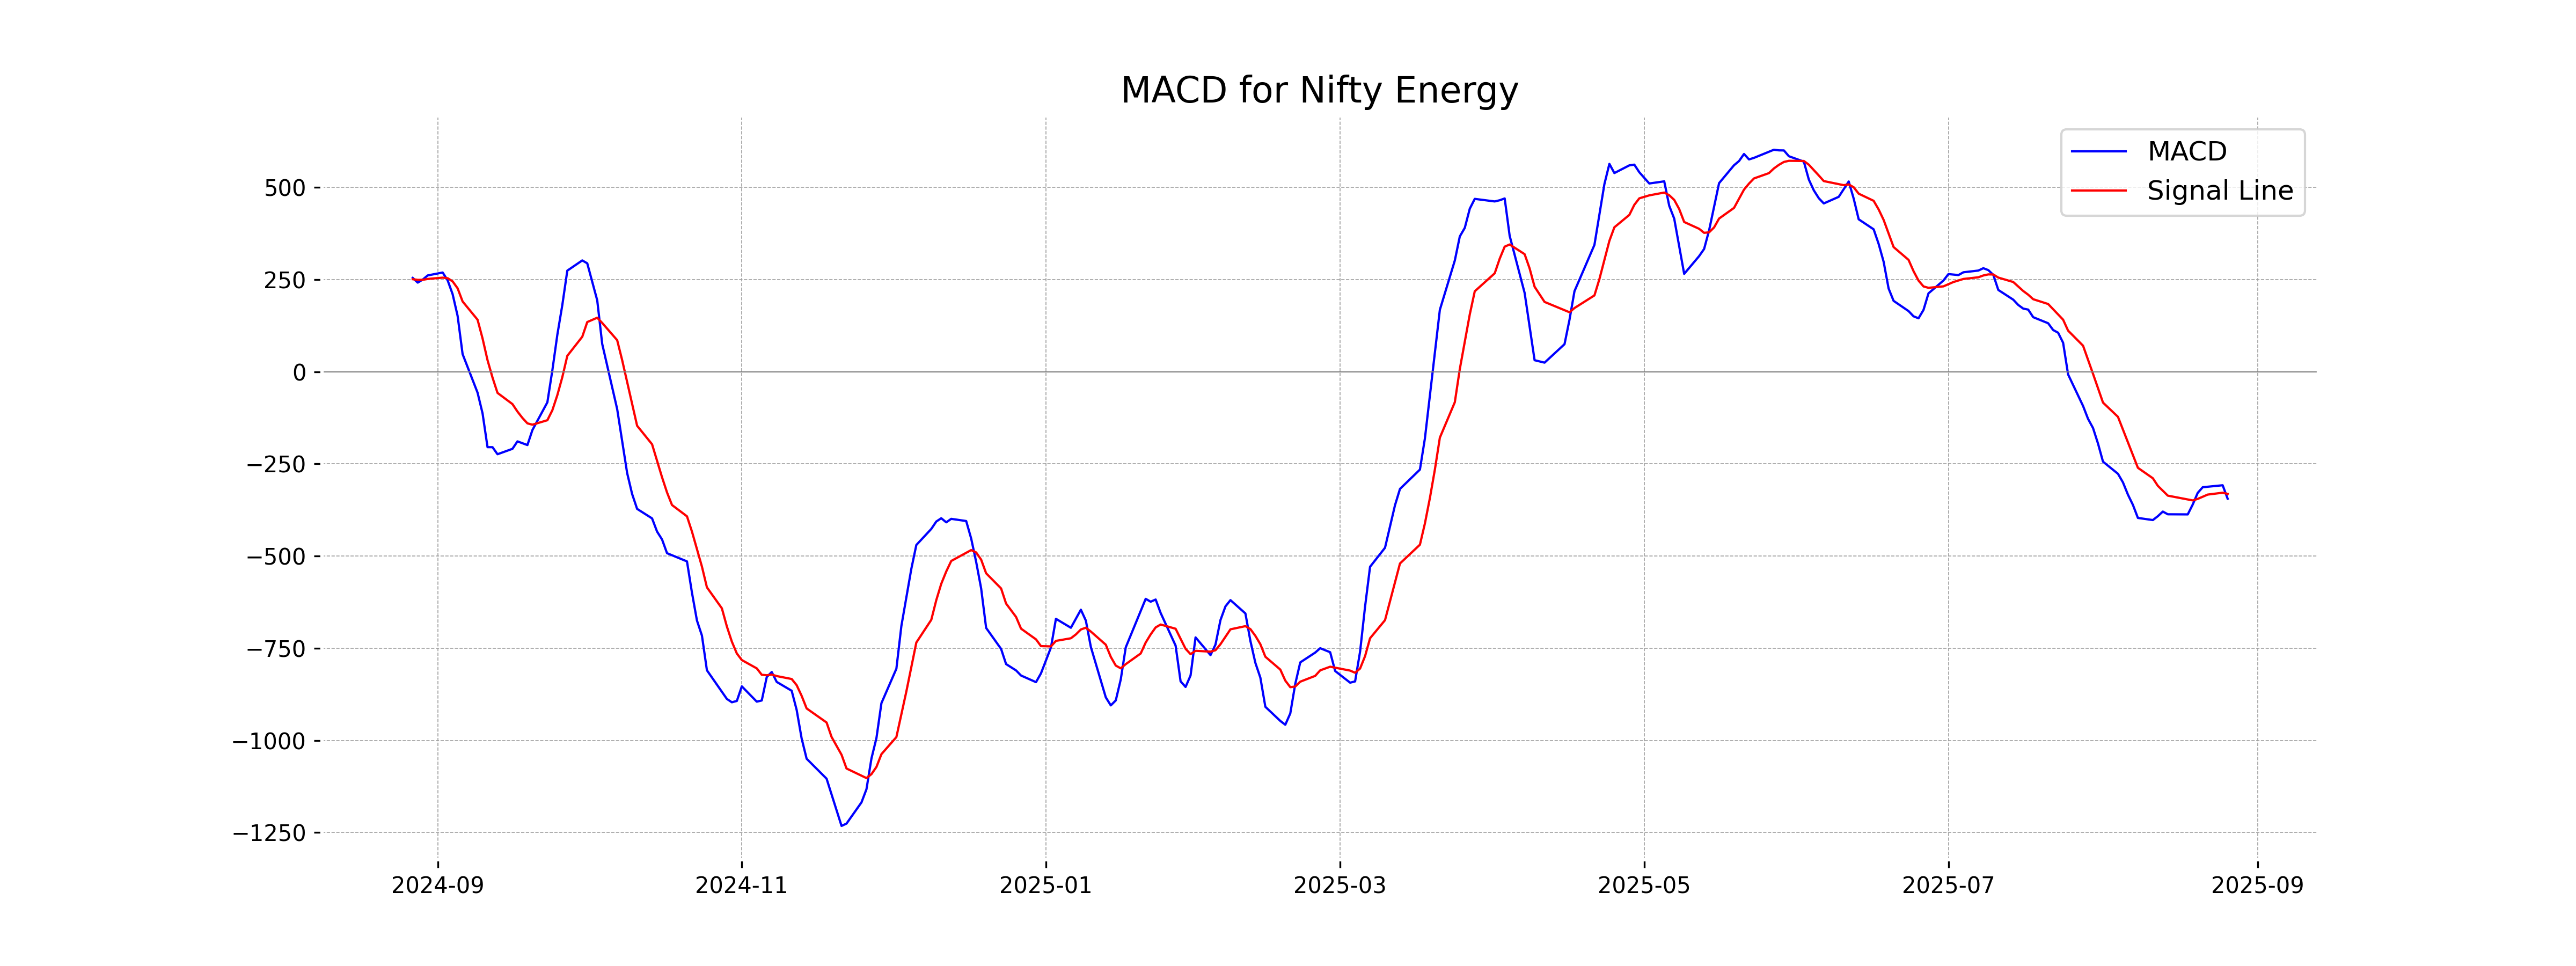
MACD Analysis for Nifty Energy: The negative MACD value of -344.39, alongside a signal line value of -331.37, indicates that Nifty Energy is experiencing bearish momentum. The downward crossover suggests a potential continuation of this bearish trend.
RSI Analysis
Based on the data provided, the Relative Strength Index (RSI) for Nifty Energy is at 28.94, indicating that the index is currently in the oversold territory. This suggests that there may be a potential for a rebound or trend reversal, as the RSI value is below 30.
Analysis for Nifty FMCG - August 26, 2025

Nifty FMCG opened at 55580.30 and closed at 56187.00, marking a gain from the previous close of 55681.648, resulting in a percentage change of 0.91%. The index experienced a high of 56425.15 and a low of 55578.10. The technical indicators suggest a bullish sentiment, with the MACD value of 131.24 being significantly above its signal line at 47.01 and an RSI of 55.89, indicating moderate bullish momentum.
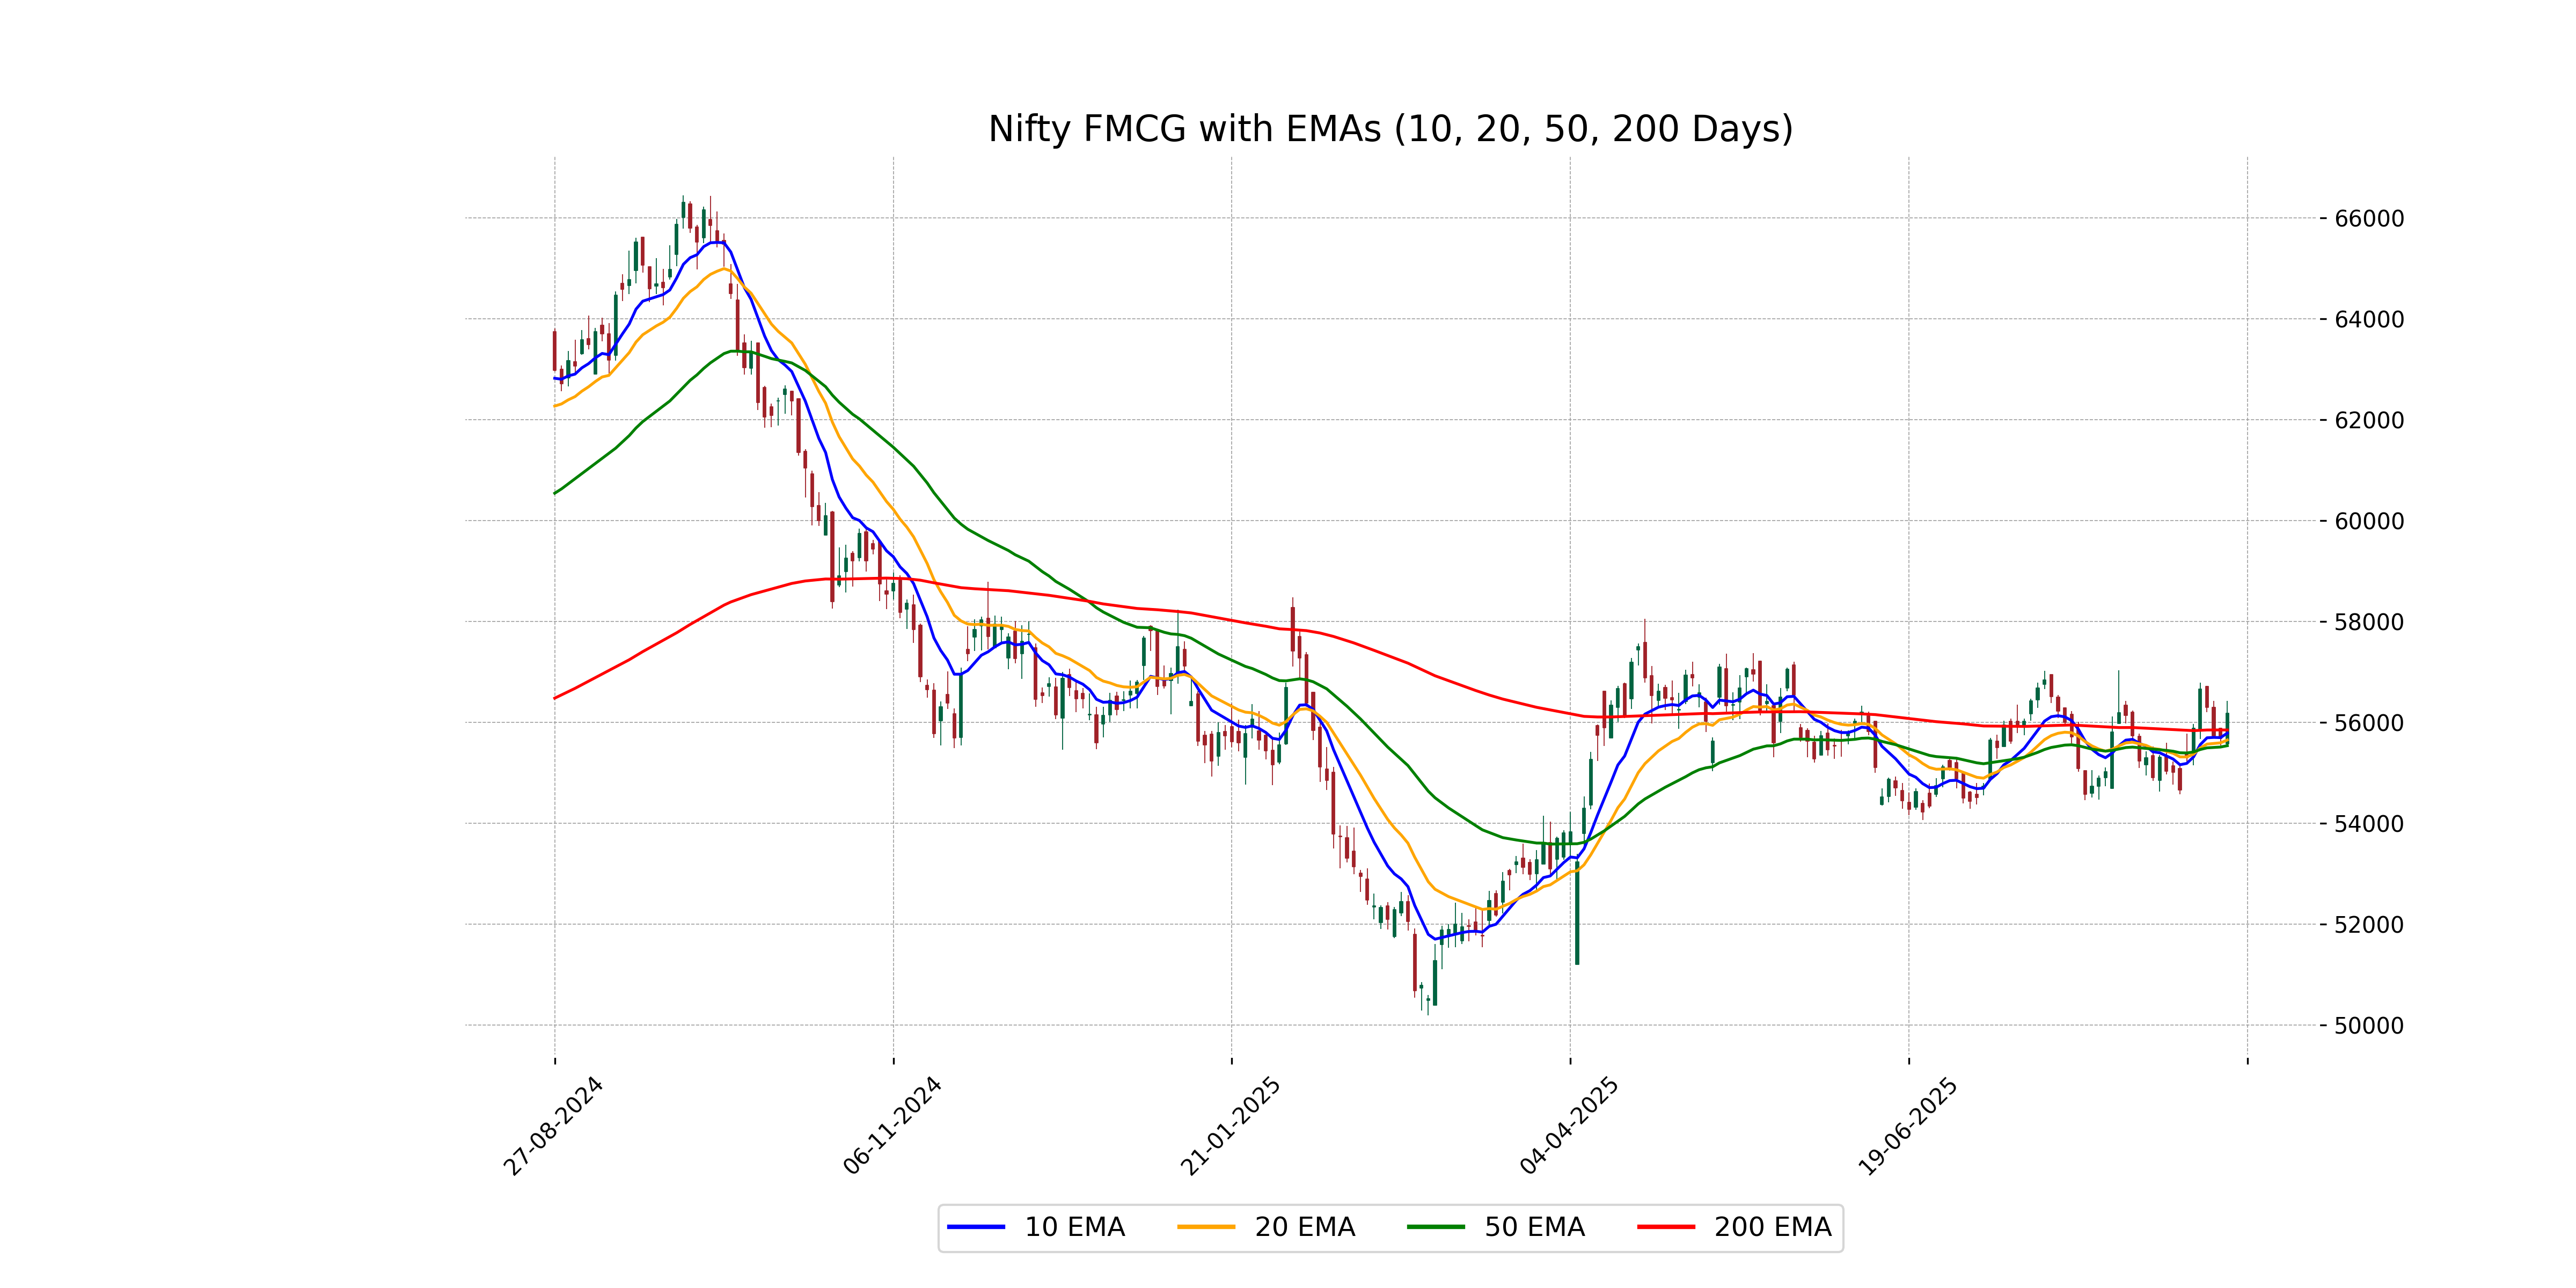
Relationship with Key Moving Averages
Nifty FMCG closed at 56187.0, which is above its 10 EMA of 55787.66, 20 EMA of 55651.79, and 50 EMA of 55538.69, indicating a positive momentum in the short to mid-term. However, it remains below the 200 EMA of 55850.39, suggesting a cautious long-term outlook.
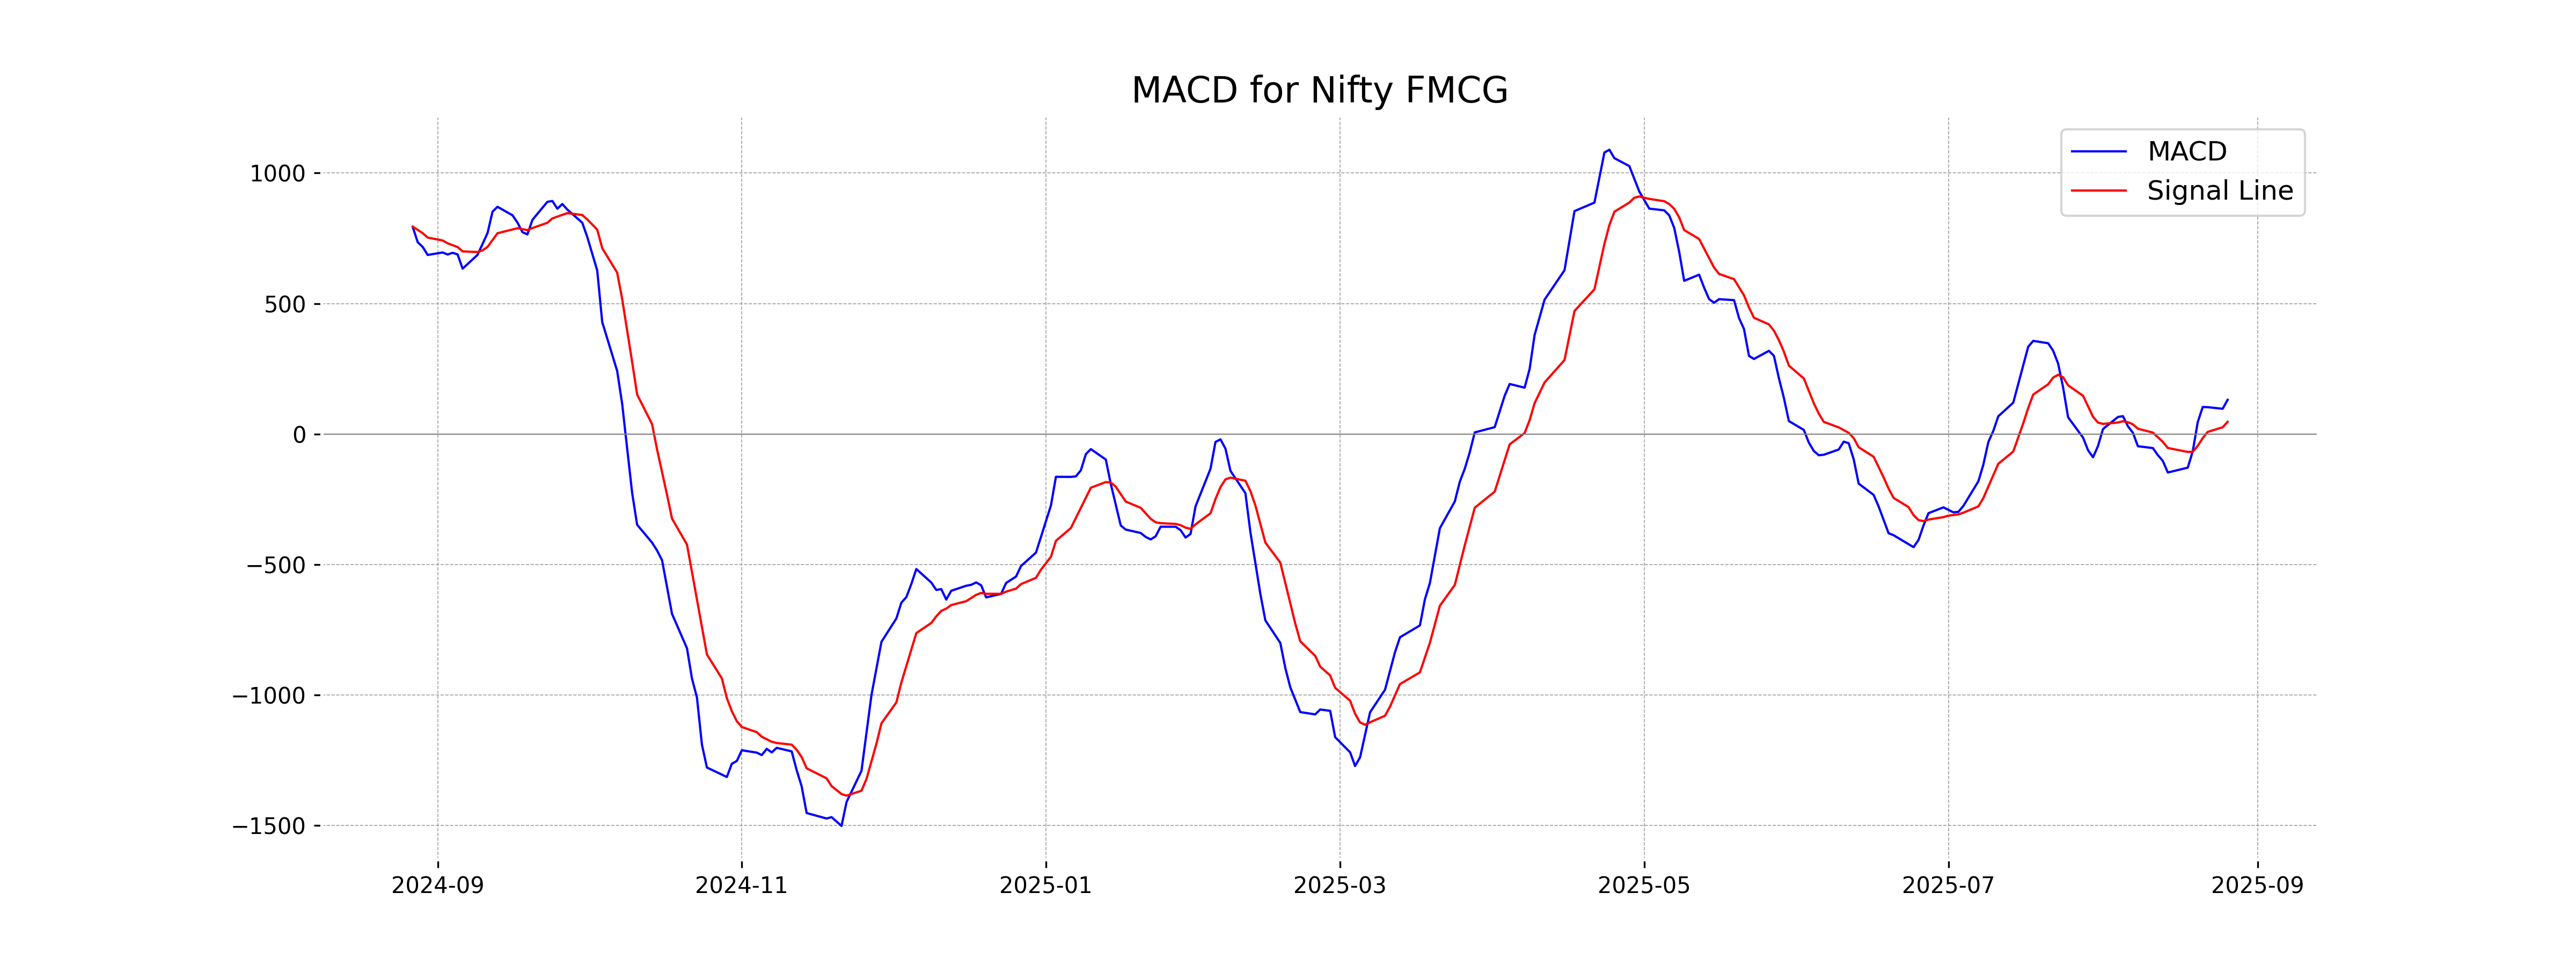
Moving Averages Trend (MACD)
Based on the provided data, the MACD for Nifty FMCG is significantly above its MACD Signal (131.24 vs. 47.01), indicating a bullish momentum. This suggests that the stock may be experiencing upward momentum, as the MACD is a popular tool to identify potential buy signals.
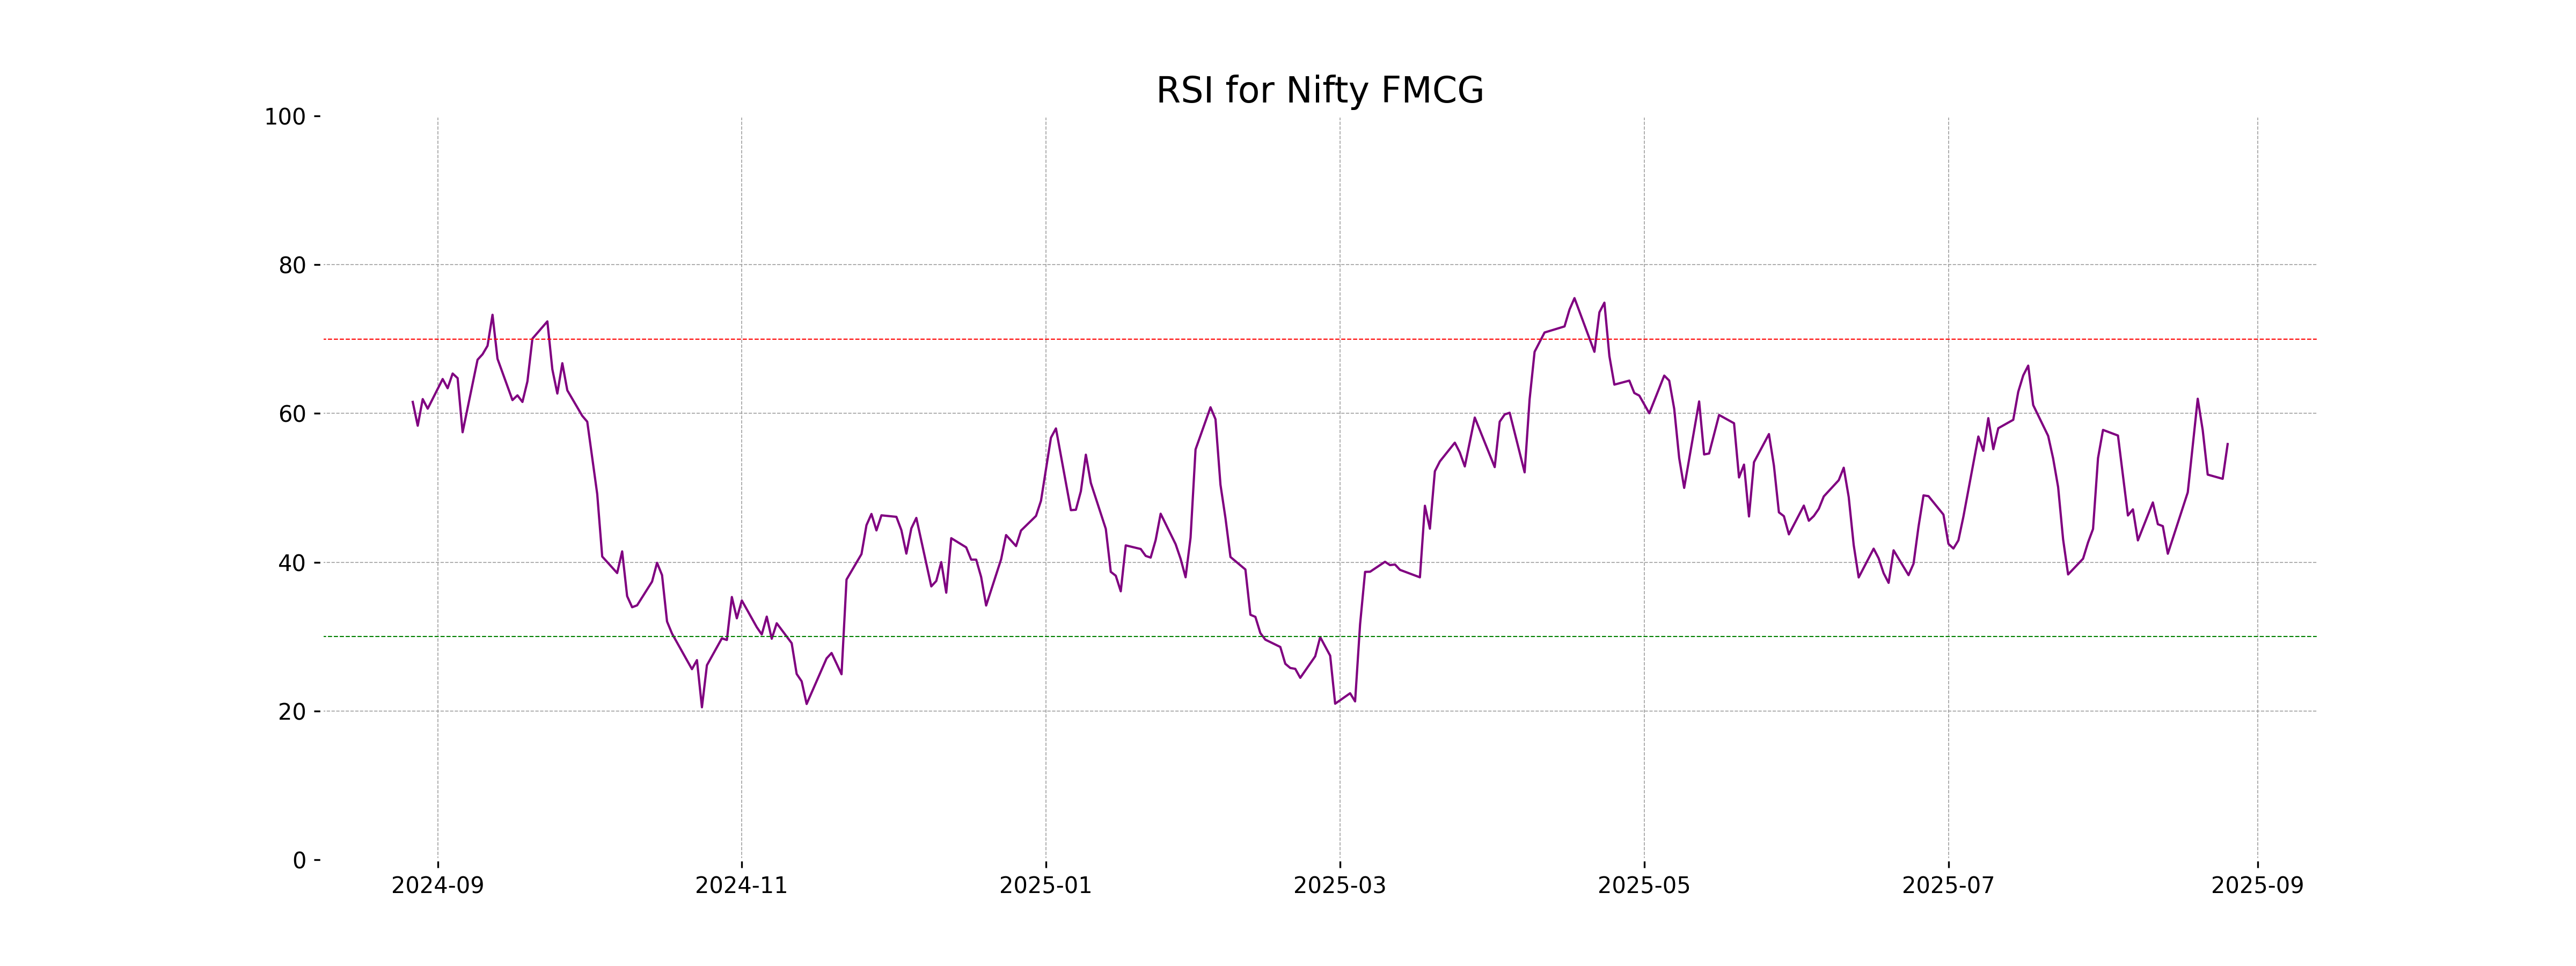
RSI Analysis
Nifty FMCG RSI Analysis: The RSI value for Nifty FMCG is 55.89, which is in the neutral range. This suggests that the stock is neither overbought nor oversold. Typically, RSI values between 30 and 70 indicate a stock is in a stable zone, implying potential for either upward or downward movement depending on market conditions.
Analysis for Nifty Infra - August 26, 2025
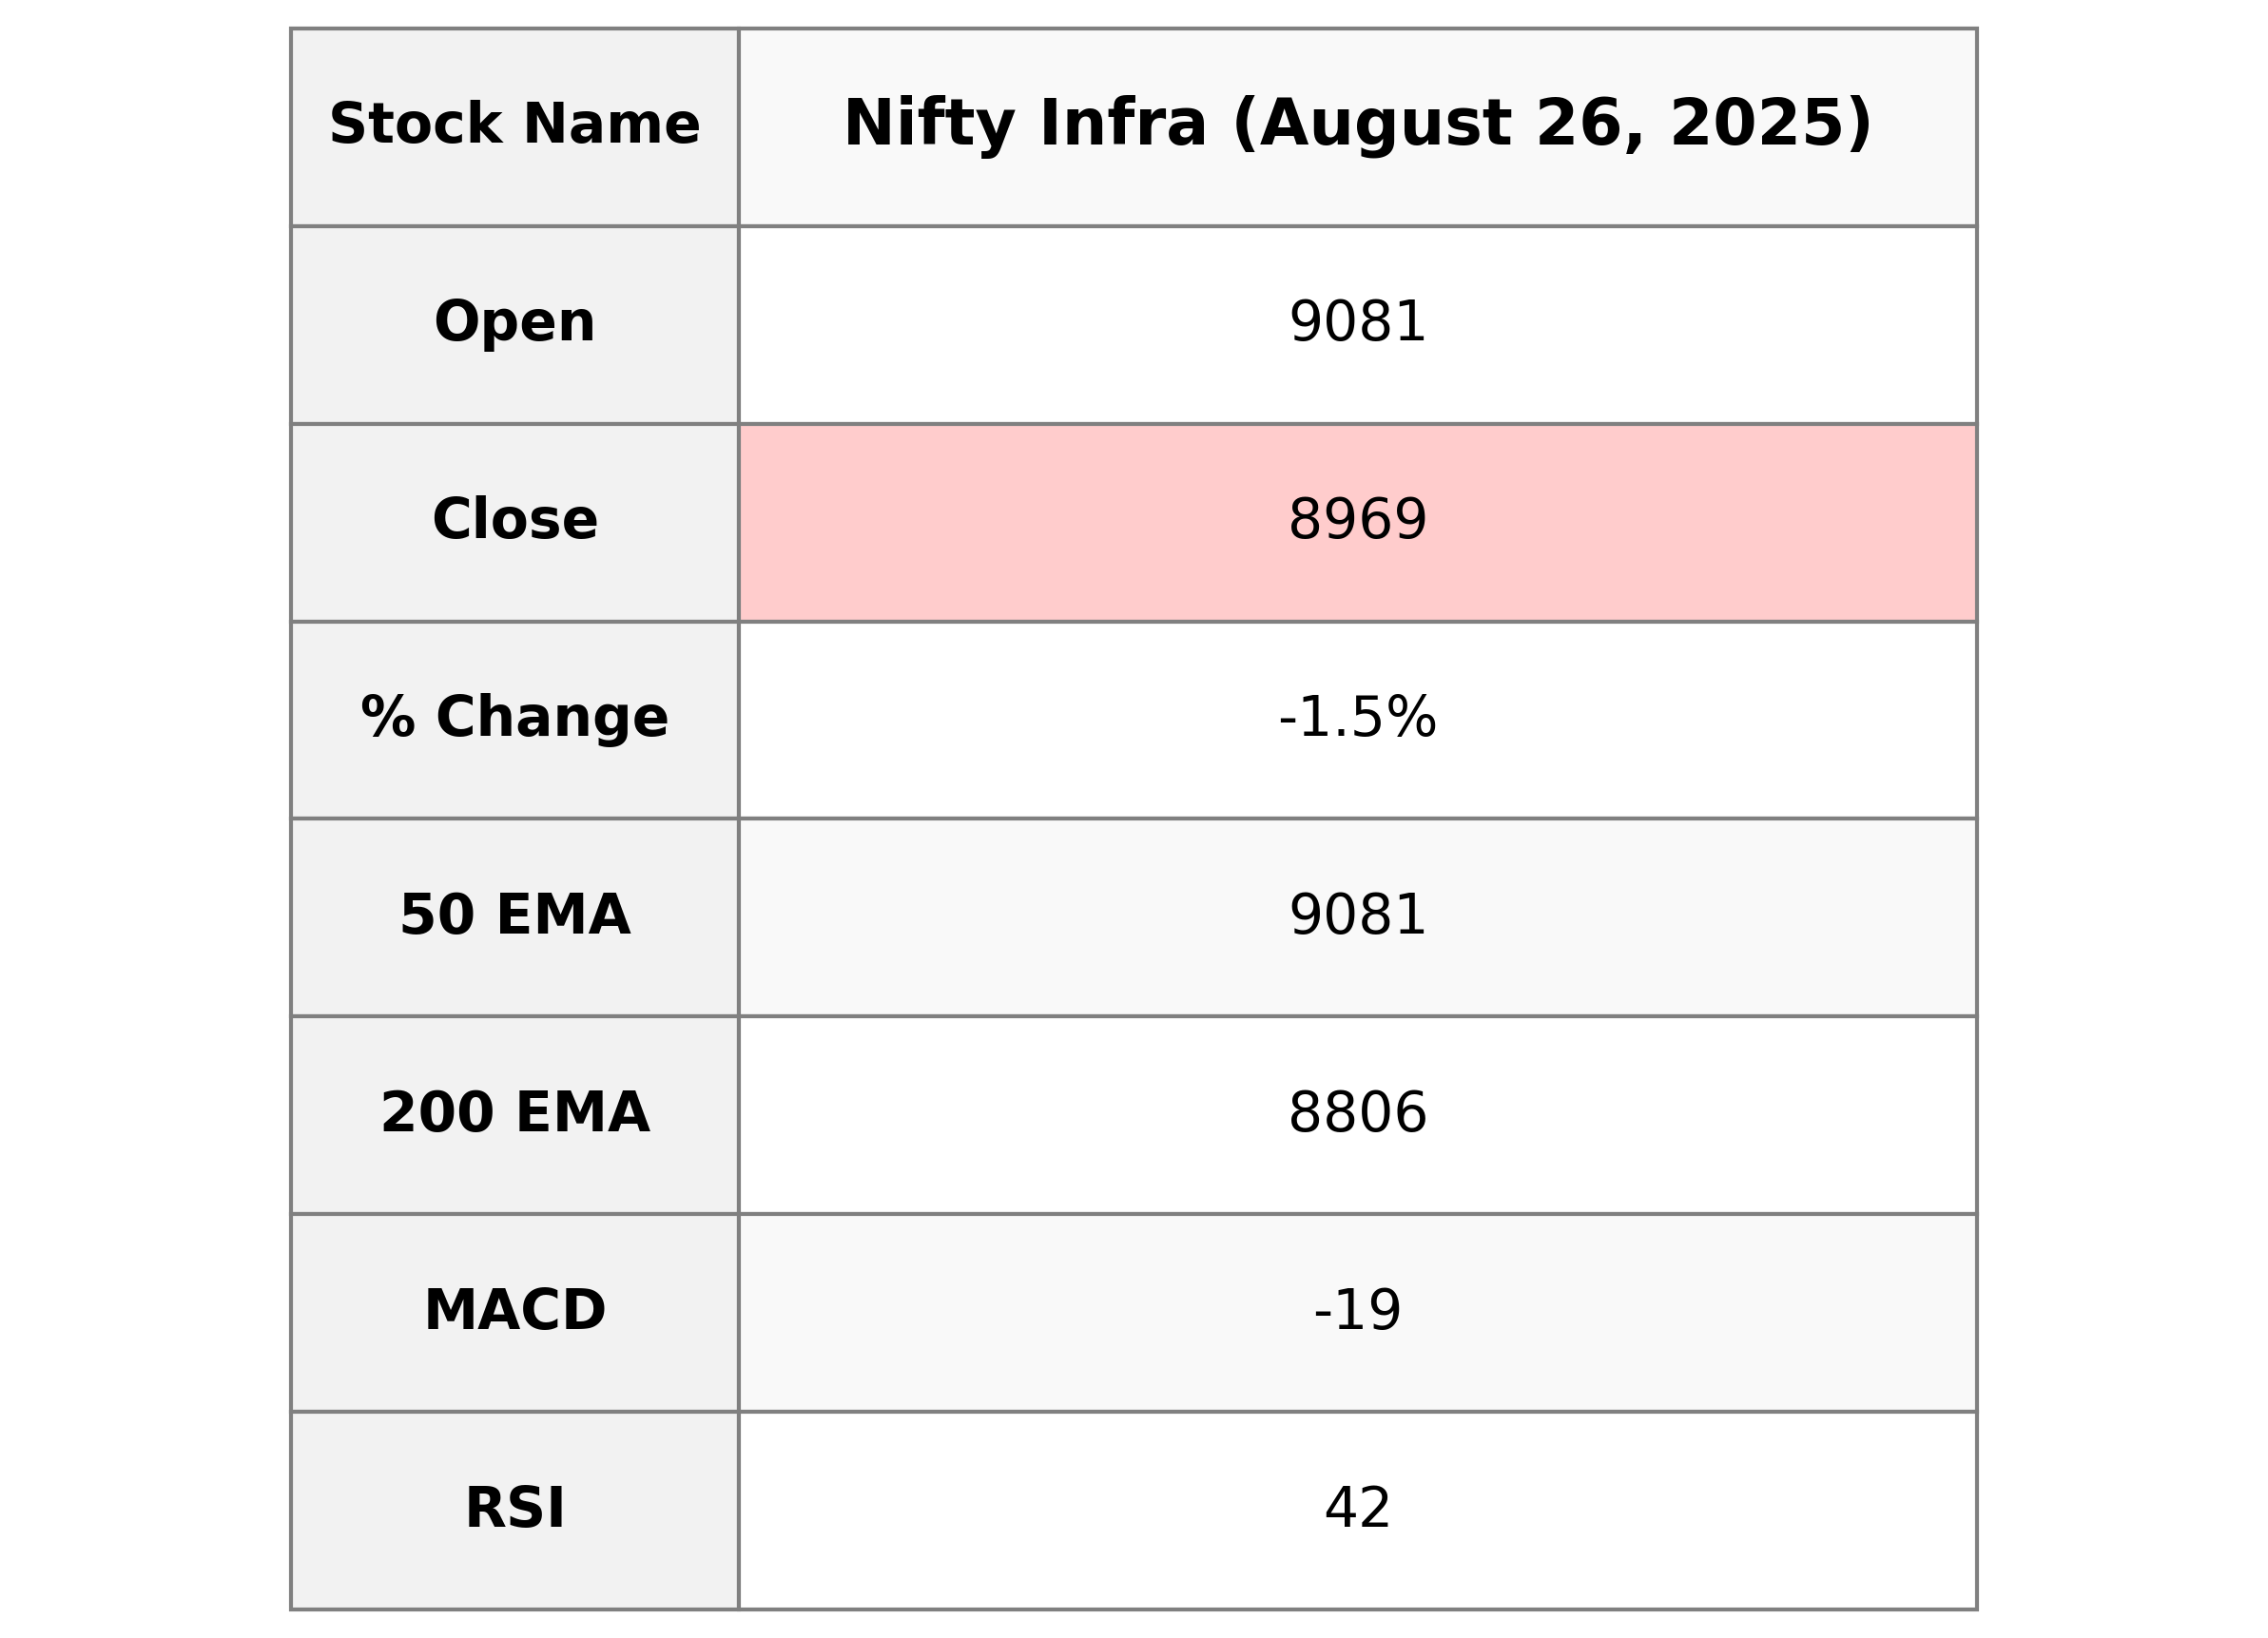
Nifty Infra opened at 9080.70 and closed at 8969.45, marking a percentage change of -1.55% from the previous close of 9110.40. The stock experienced a points change of -140.95 with a relative strength index (RSI) of 41.95, indicating weaker momentum. The MACD alignment suggests bearish sentiment as it stands at -18.99, below the MACD signal of -28.45.
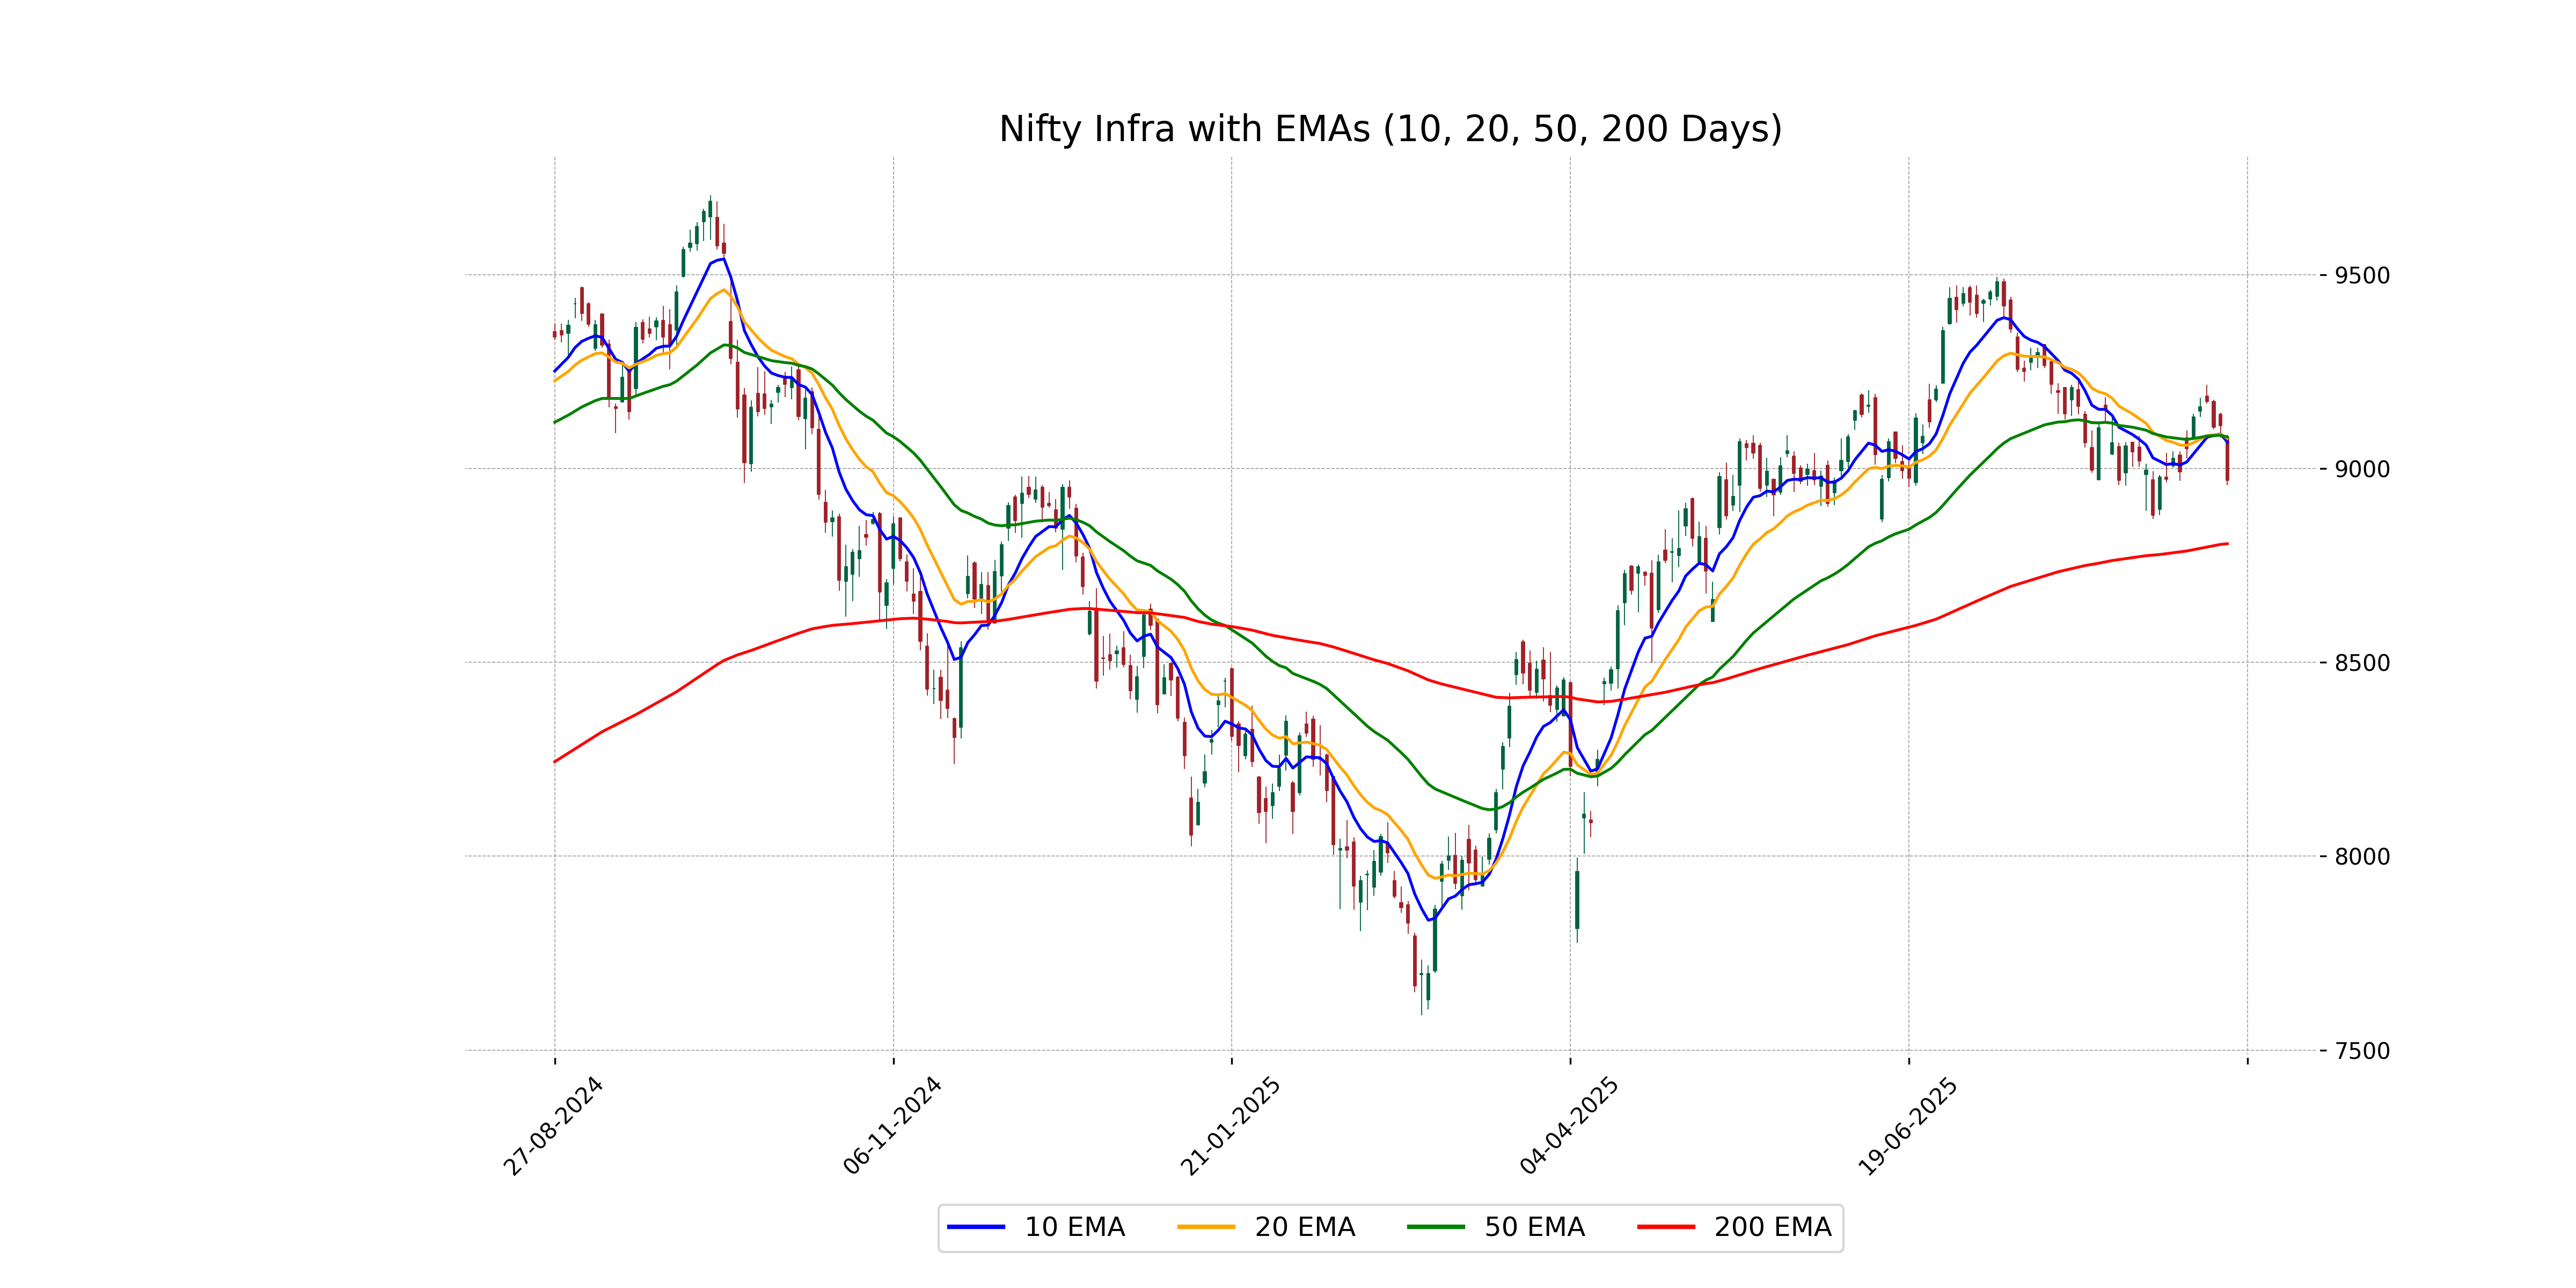
Relationship with Key Moving Averages
Nifty Infra closed below its 10-day, 20-day, and 50-day EMAs, indicating short-term bearish sentiment, given its close at 8969.45. The 50 EMA at 9081.34 and 10 EMA at 9067.98 highlight resistance levels. The MACD and RSI values reinforce overall bearish momentum.
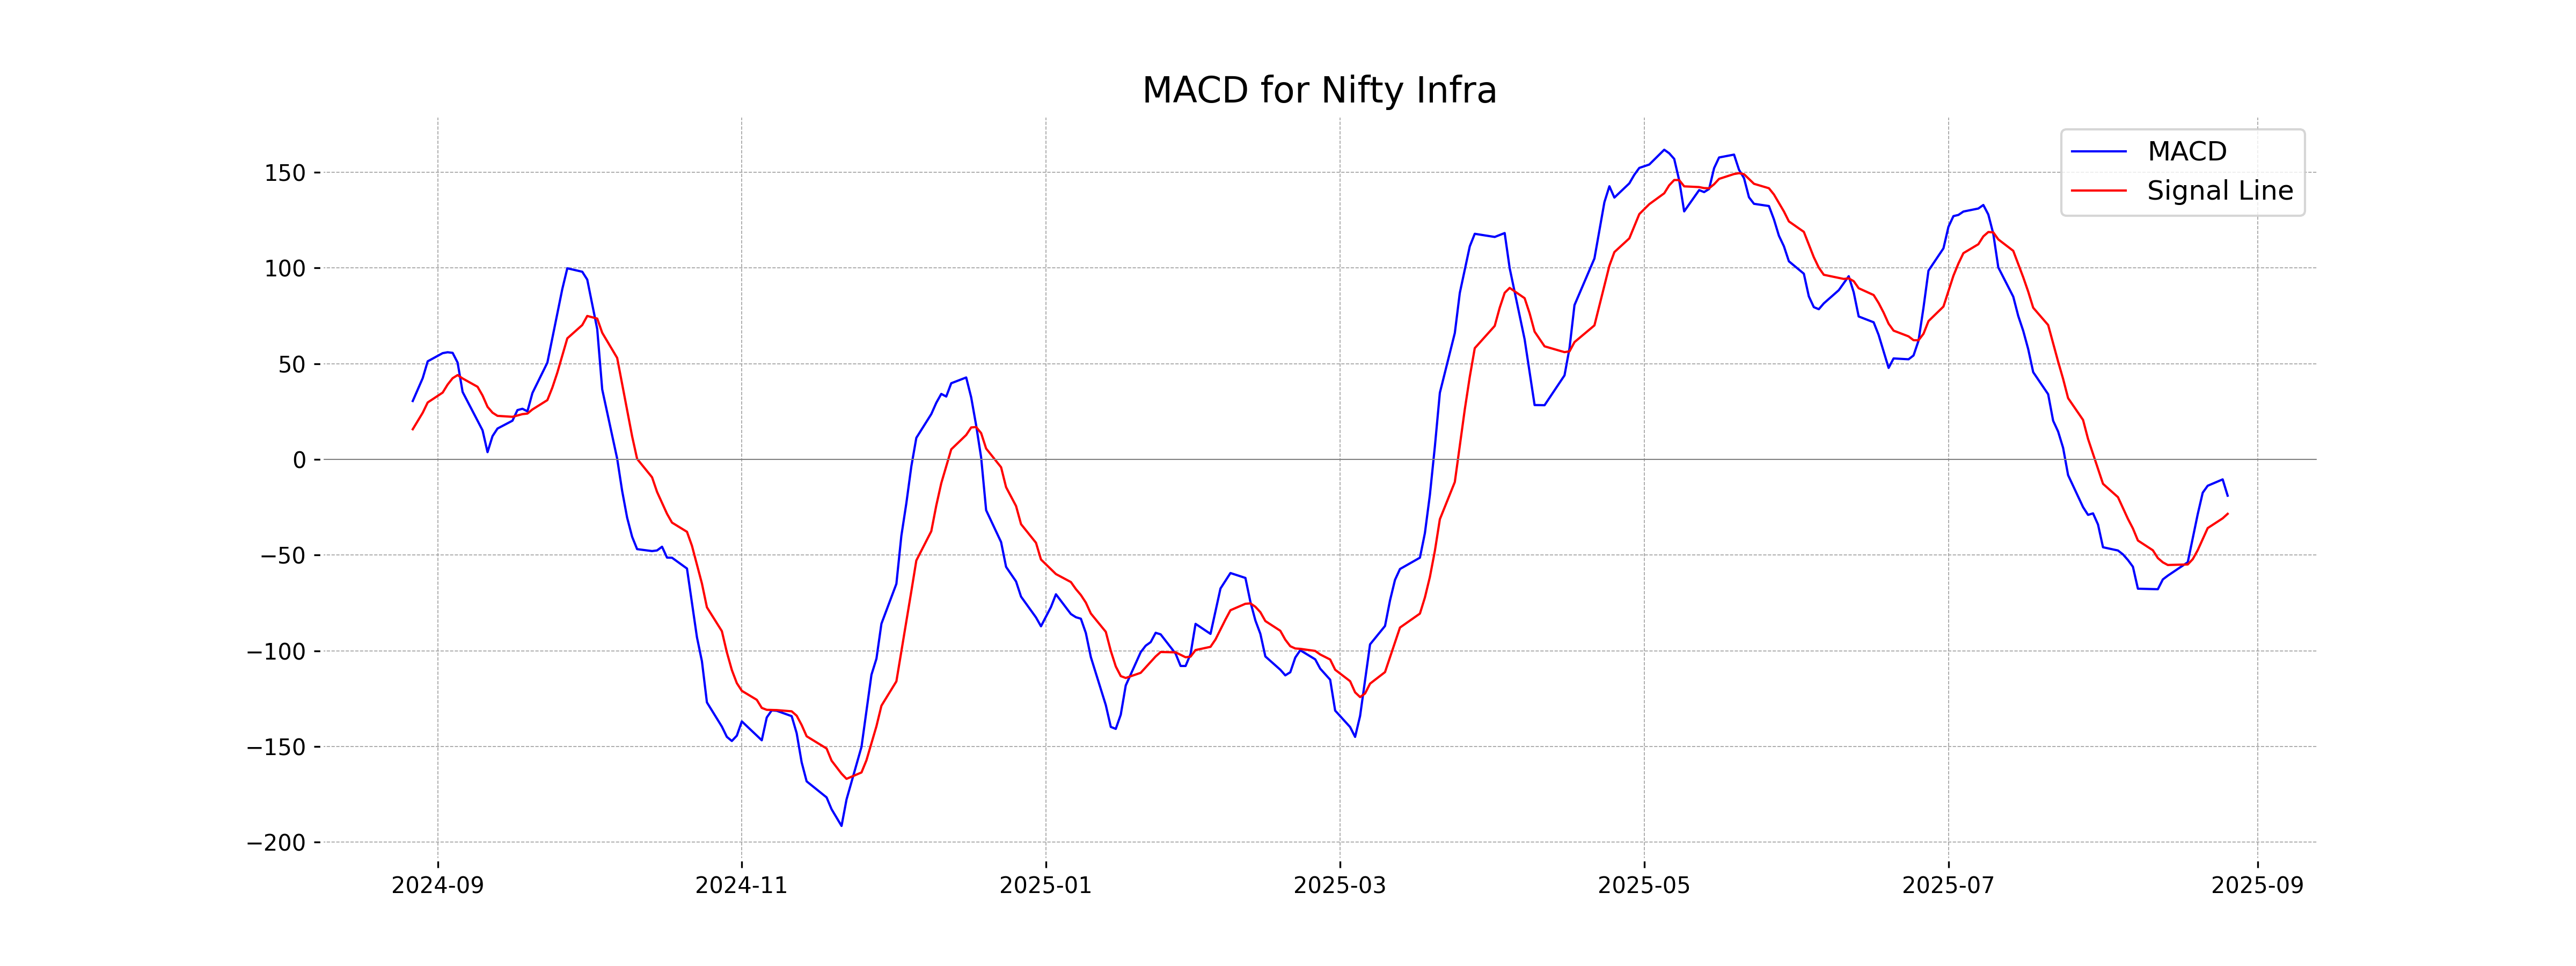
Moving Averages Trend (MACD)
Based on the provided data, the MACD for Nifty Infra is currently at -18.99, with a signal line of -28.45. This indicates that the MACD is above the signal line, suggesting a potential reduction in bearish momentum. However, the overall MACD being negative may still reflect a bearish trend.
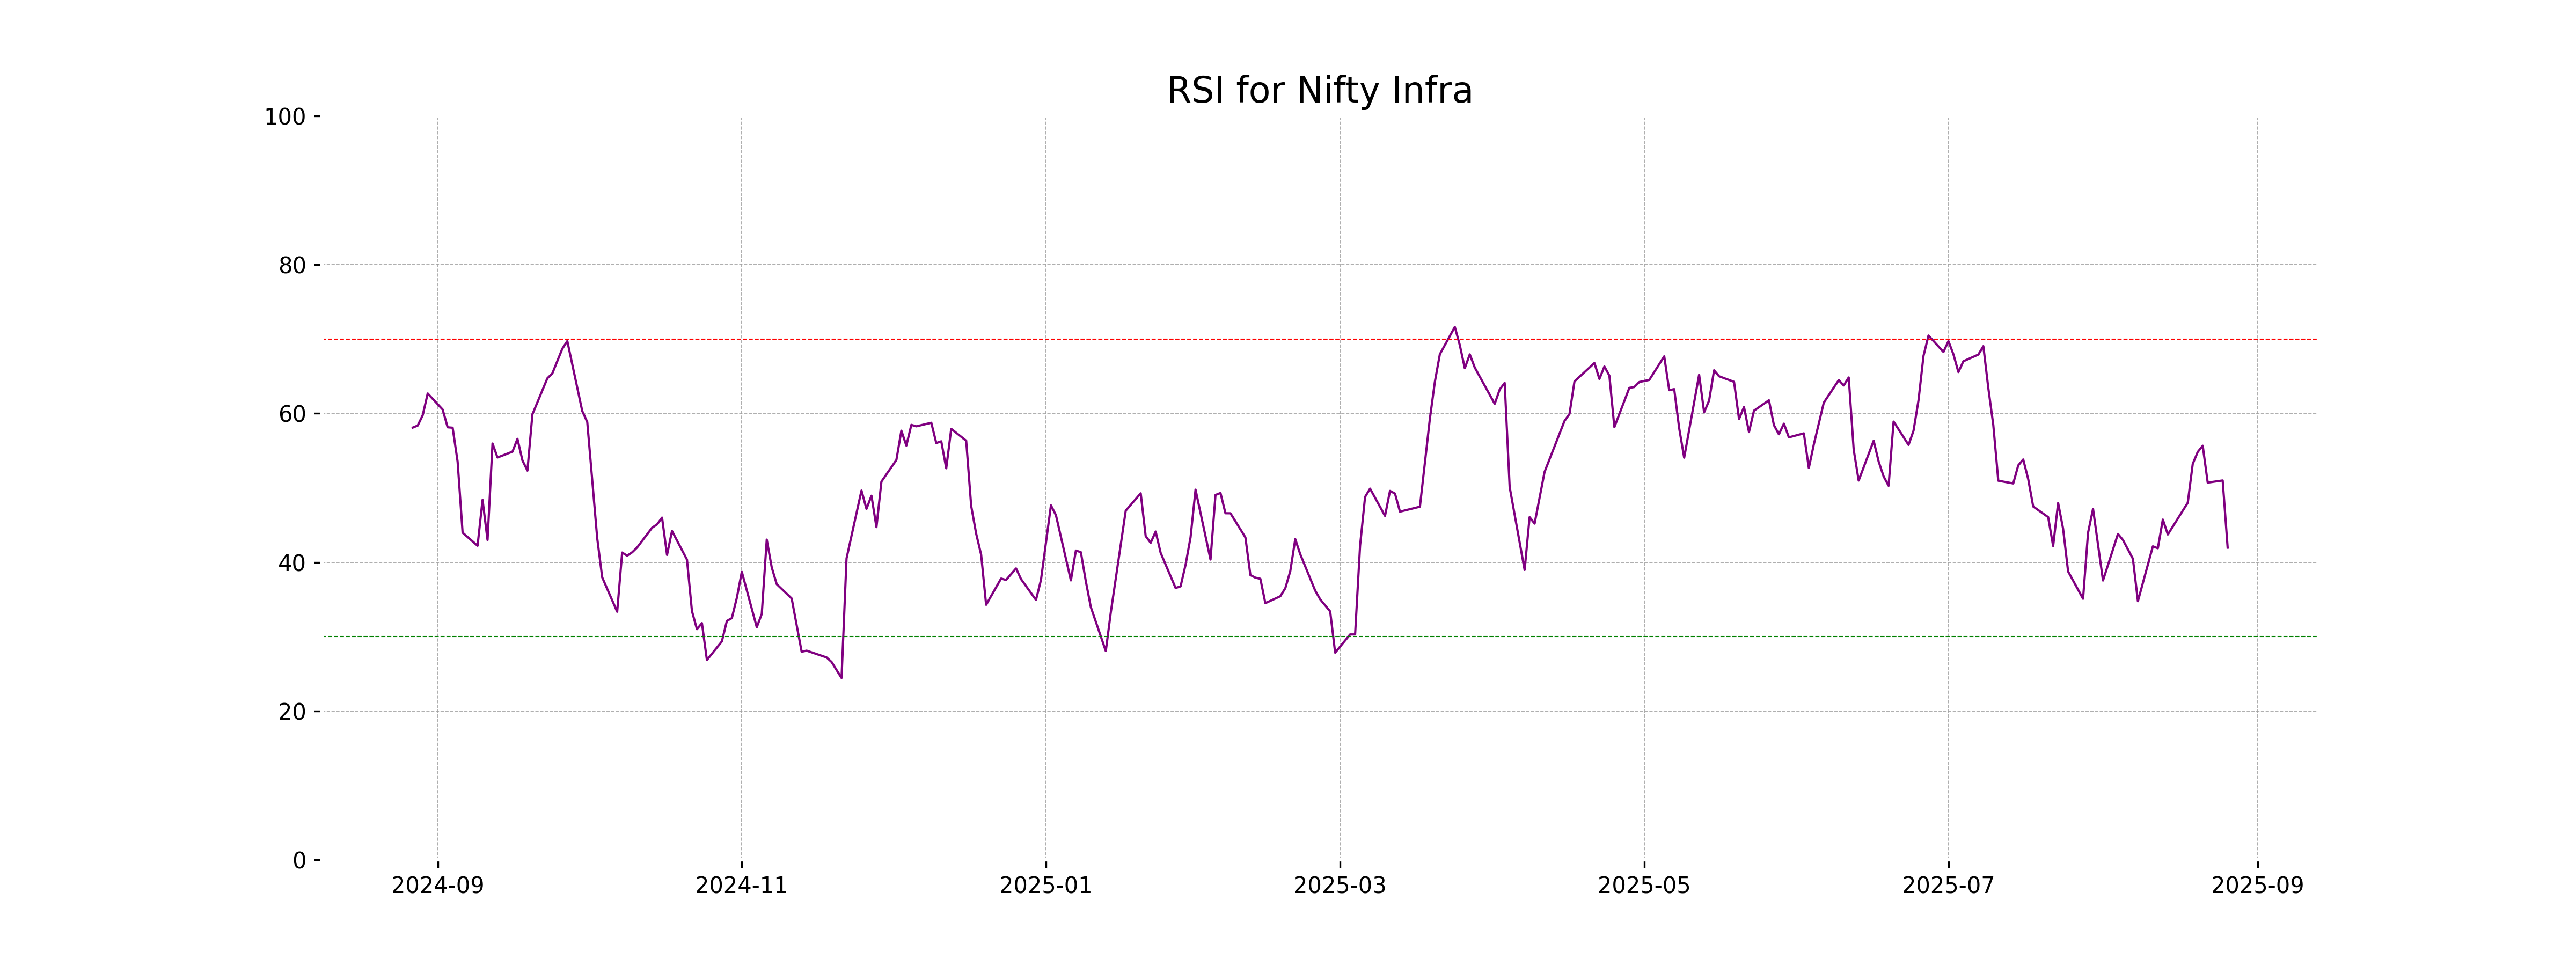
RSI Analysis
The RSI (Relative Strength Index) for Nifty Infra stands at approximately 41.95. This RSI value is below the neutral 50 mark, indicating bearish momentum and suggesting that the stock may be experiencing weaker performance. It is, however, not yet in the oversold zone, which is typically under 30.
Analysis for Nifty IT - August 26, 2025

The Nifty IT index opened at 36106.80, reaching a high of 36324.30 and a low of 35998.95, before closing at 36063.20. It saw a decline with a percentage change of -0.60% and a points change of -216.90 from its previous close of 36280.10. The index's Relative Strength Index (RSI) is at 54.22, indicating mild strength, while the MACD reflects a bearish trend with a value of -231.28.
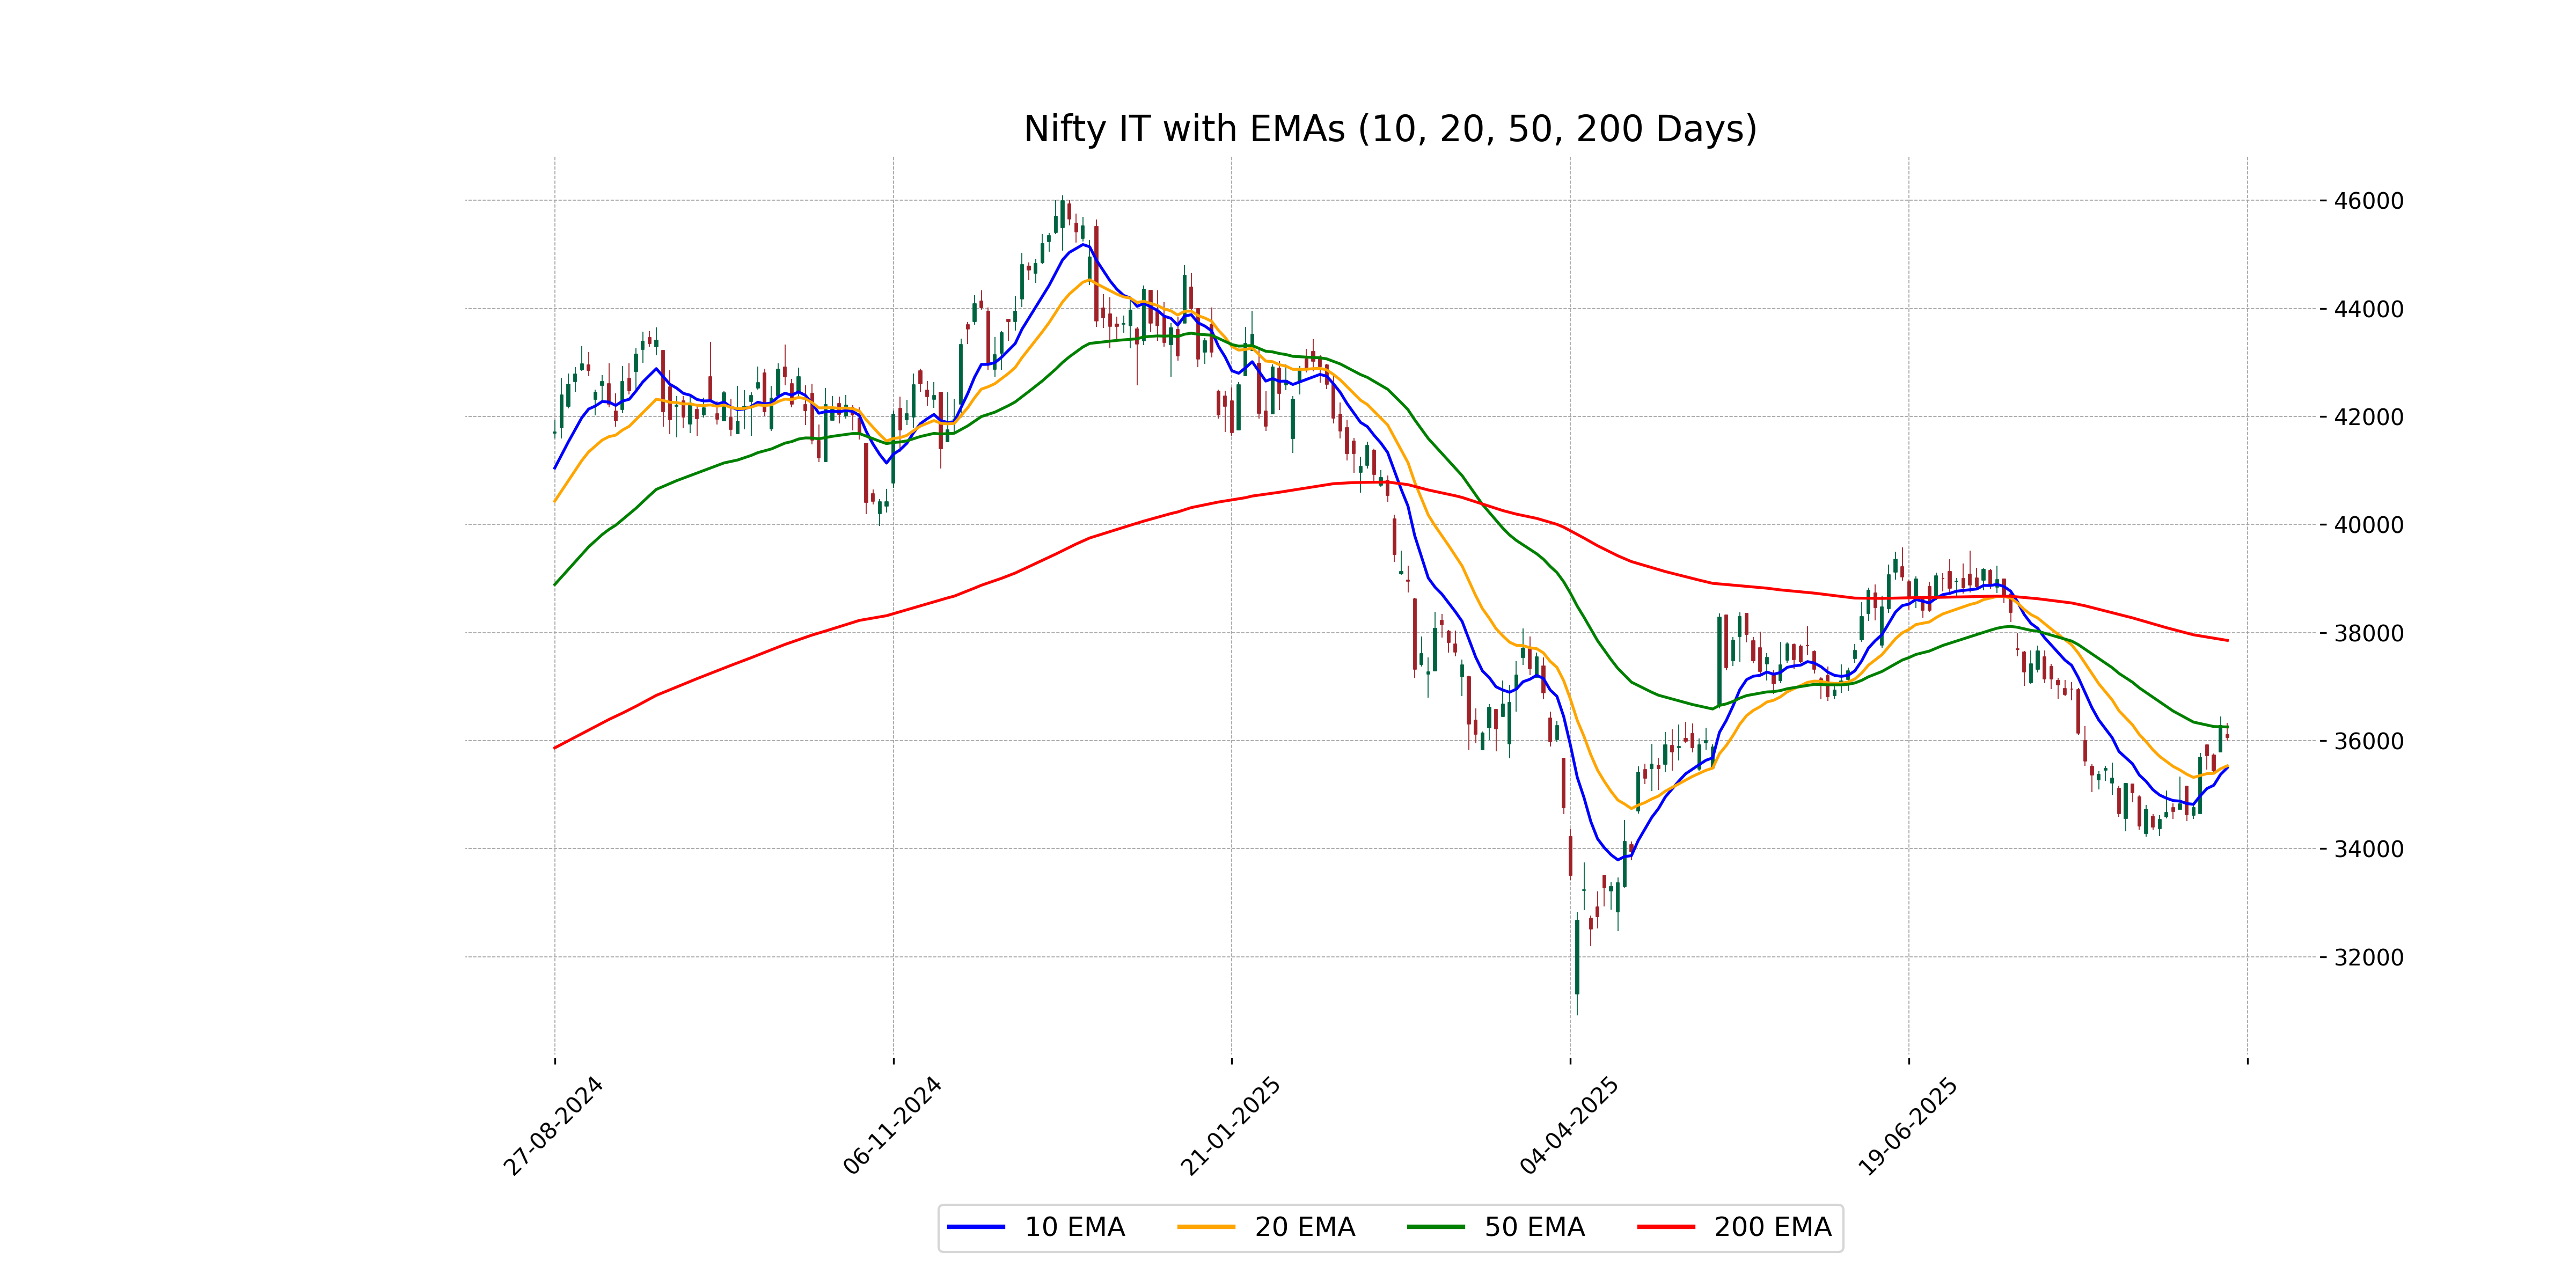
Relationship with Key Moving Averages
The Nifty IT index is currently trading slightly below its 50-day EMA of 36253.85, indicating a short-term bearish sentiment. It is trading significantly below its 200-day EMA of 37855.40, which suggests a more extended bearish trend. However, it remains slightly above the 10-day and 20-day EMAs, indicating some short-term strength.
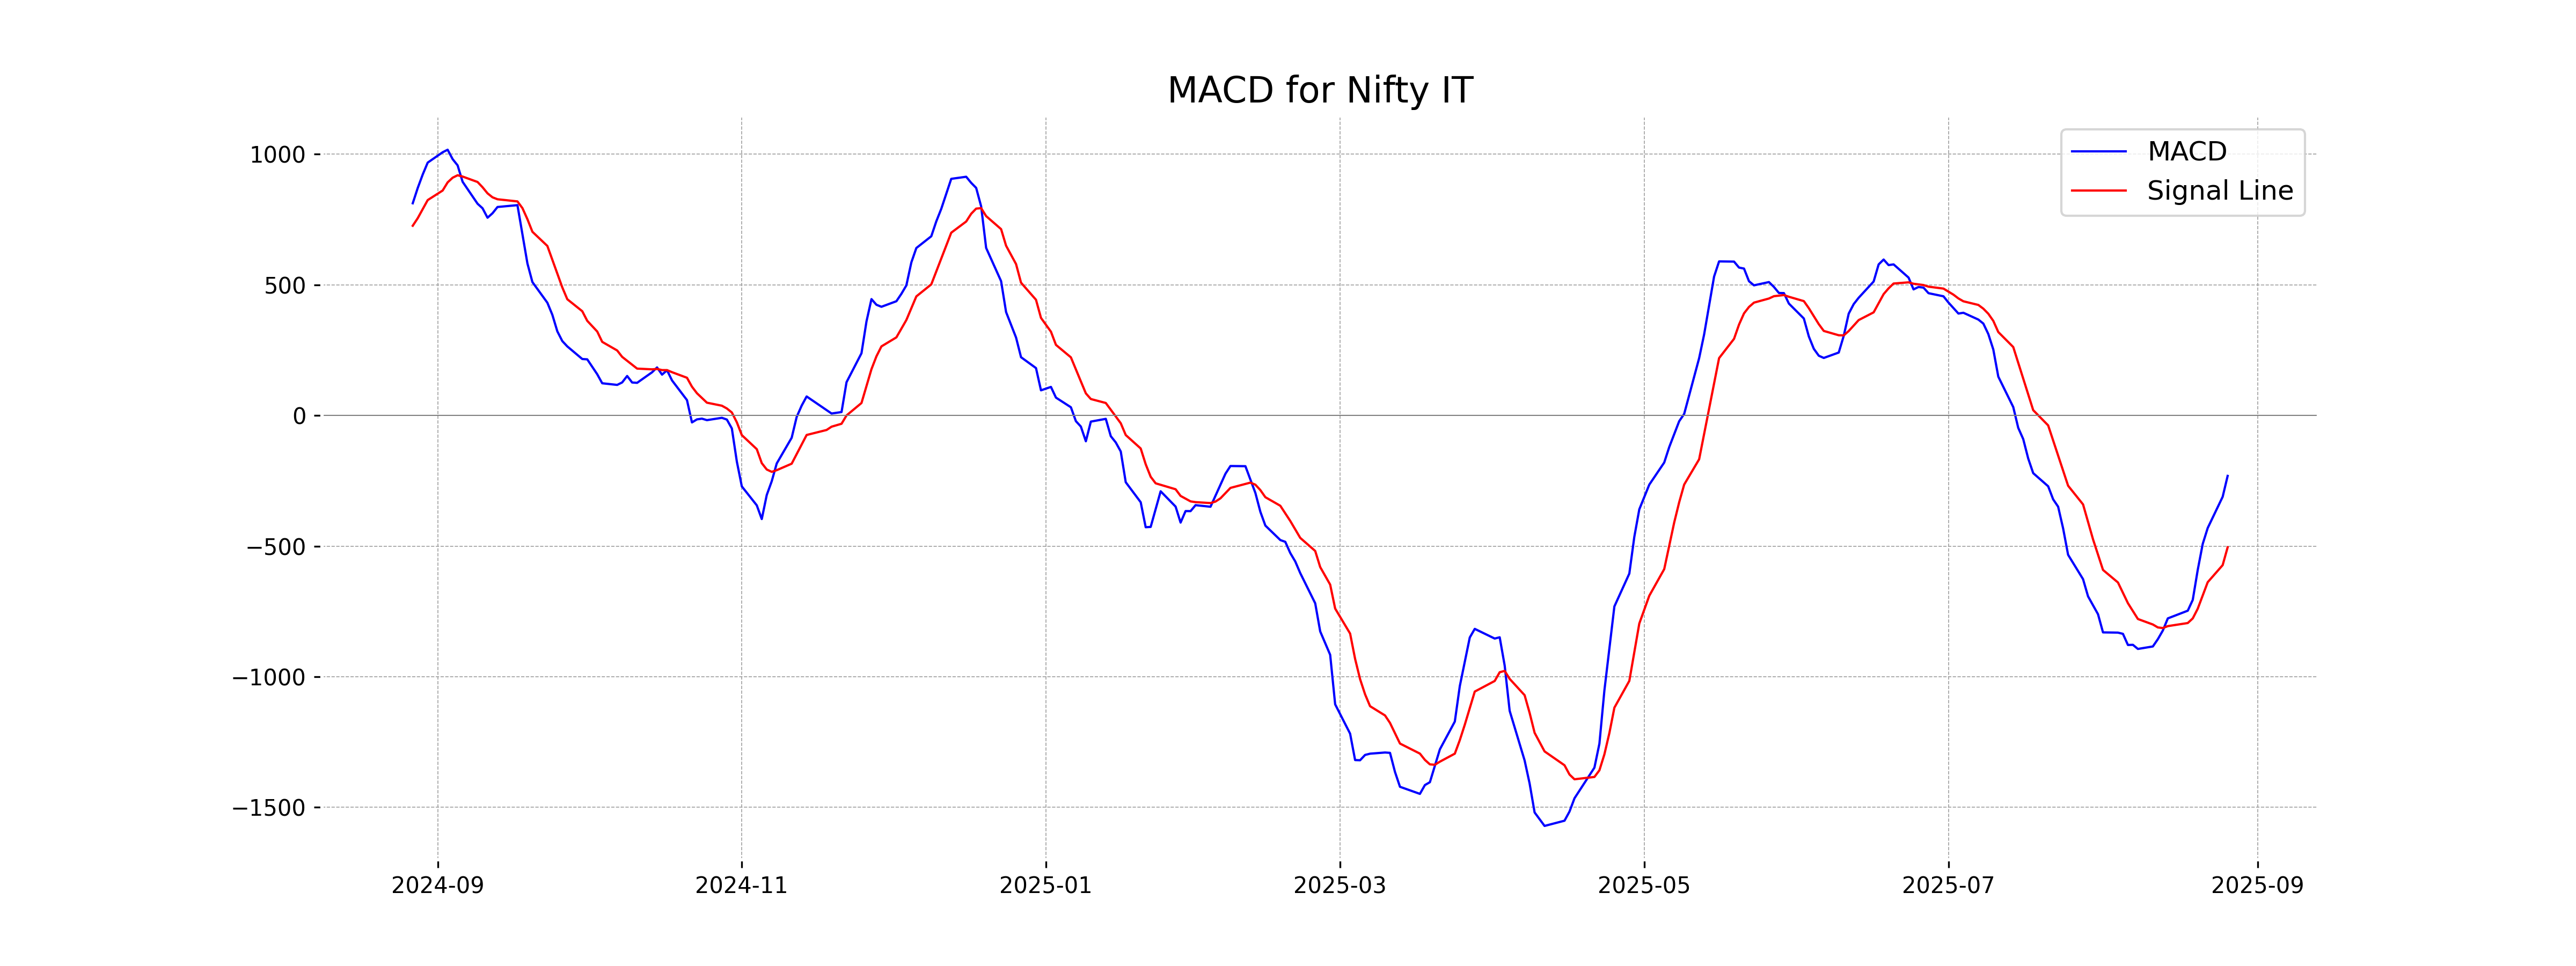
Moving Averages Trend (MACD)
Nifty IT's MACD of -231.28, compared to its MACD Signal of -504.56, indicates a positive divergence, suggesting potential upward momentum. This bullish signal is supported by the smaller magnitude of the MACD compared to the signal line, indicating a possible trend reversal or correction toward upward movement.
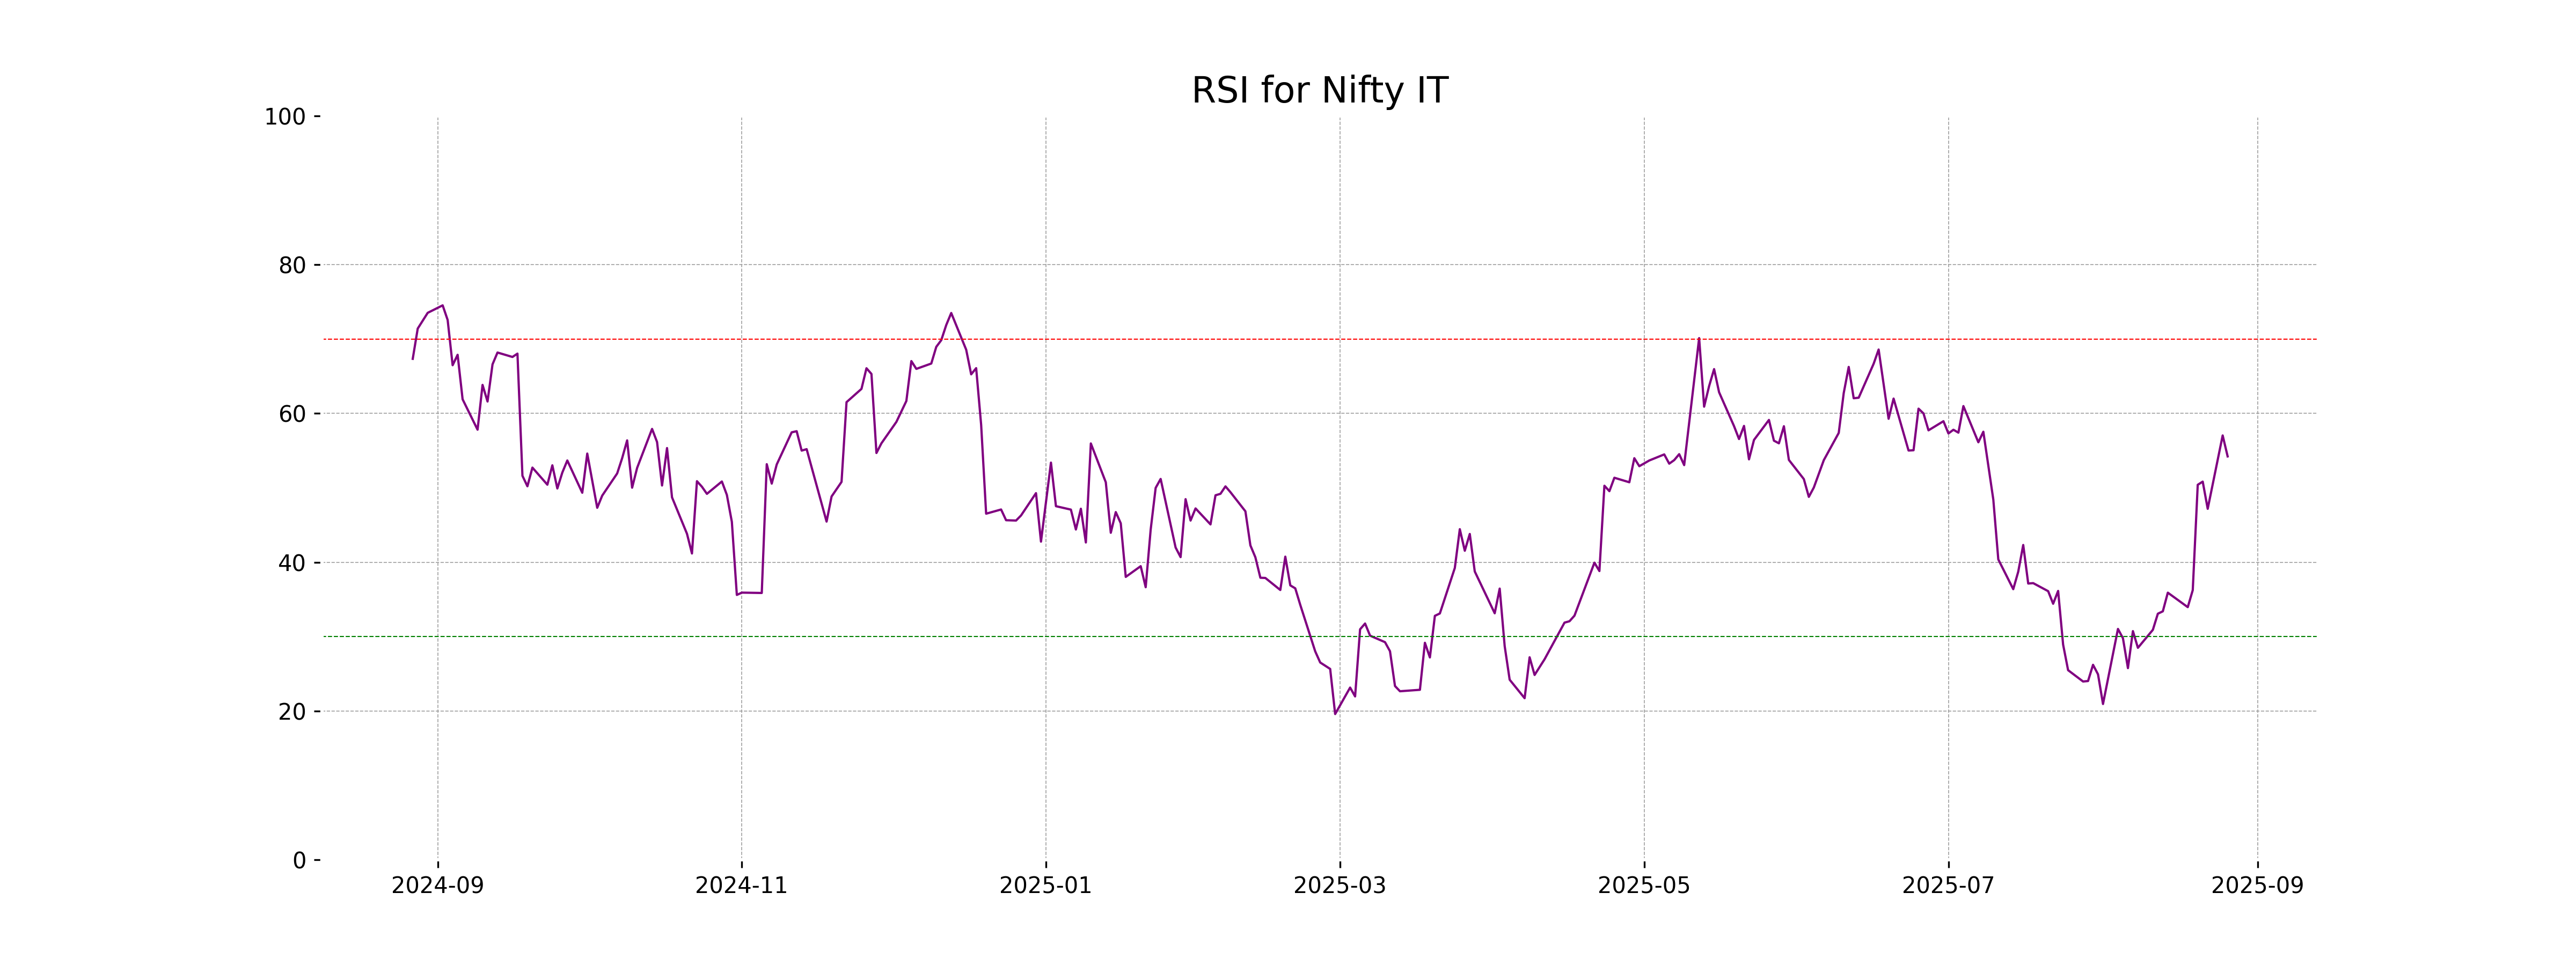
RSI Analysis
Based on the data provided, the RSI value for Nifty IT is 54.22, which is considered neutral. This suggests that the stock is neither overbought nor oversold, indicating a balance between bullish and bearish forces in the market.
Analysis for Nifty Metal - August 26, 2025
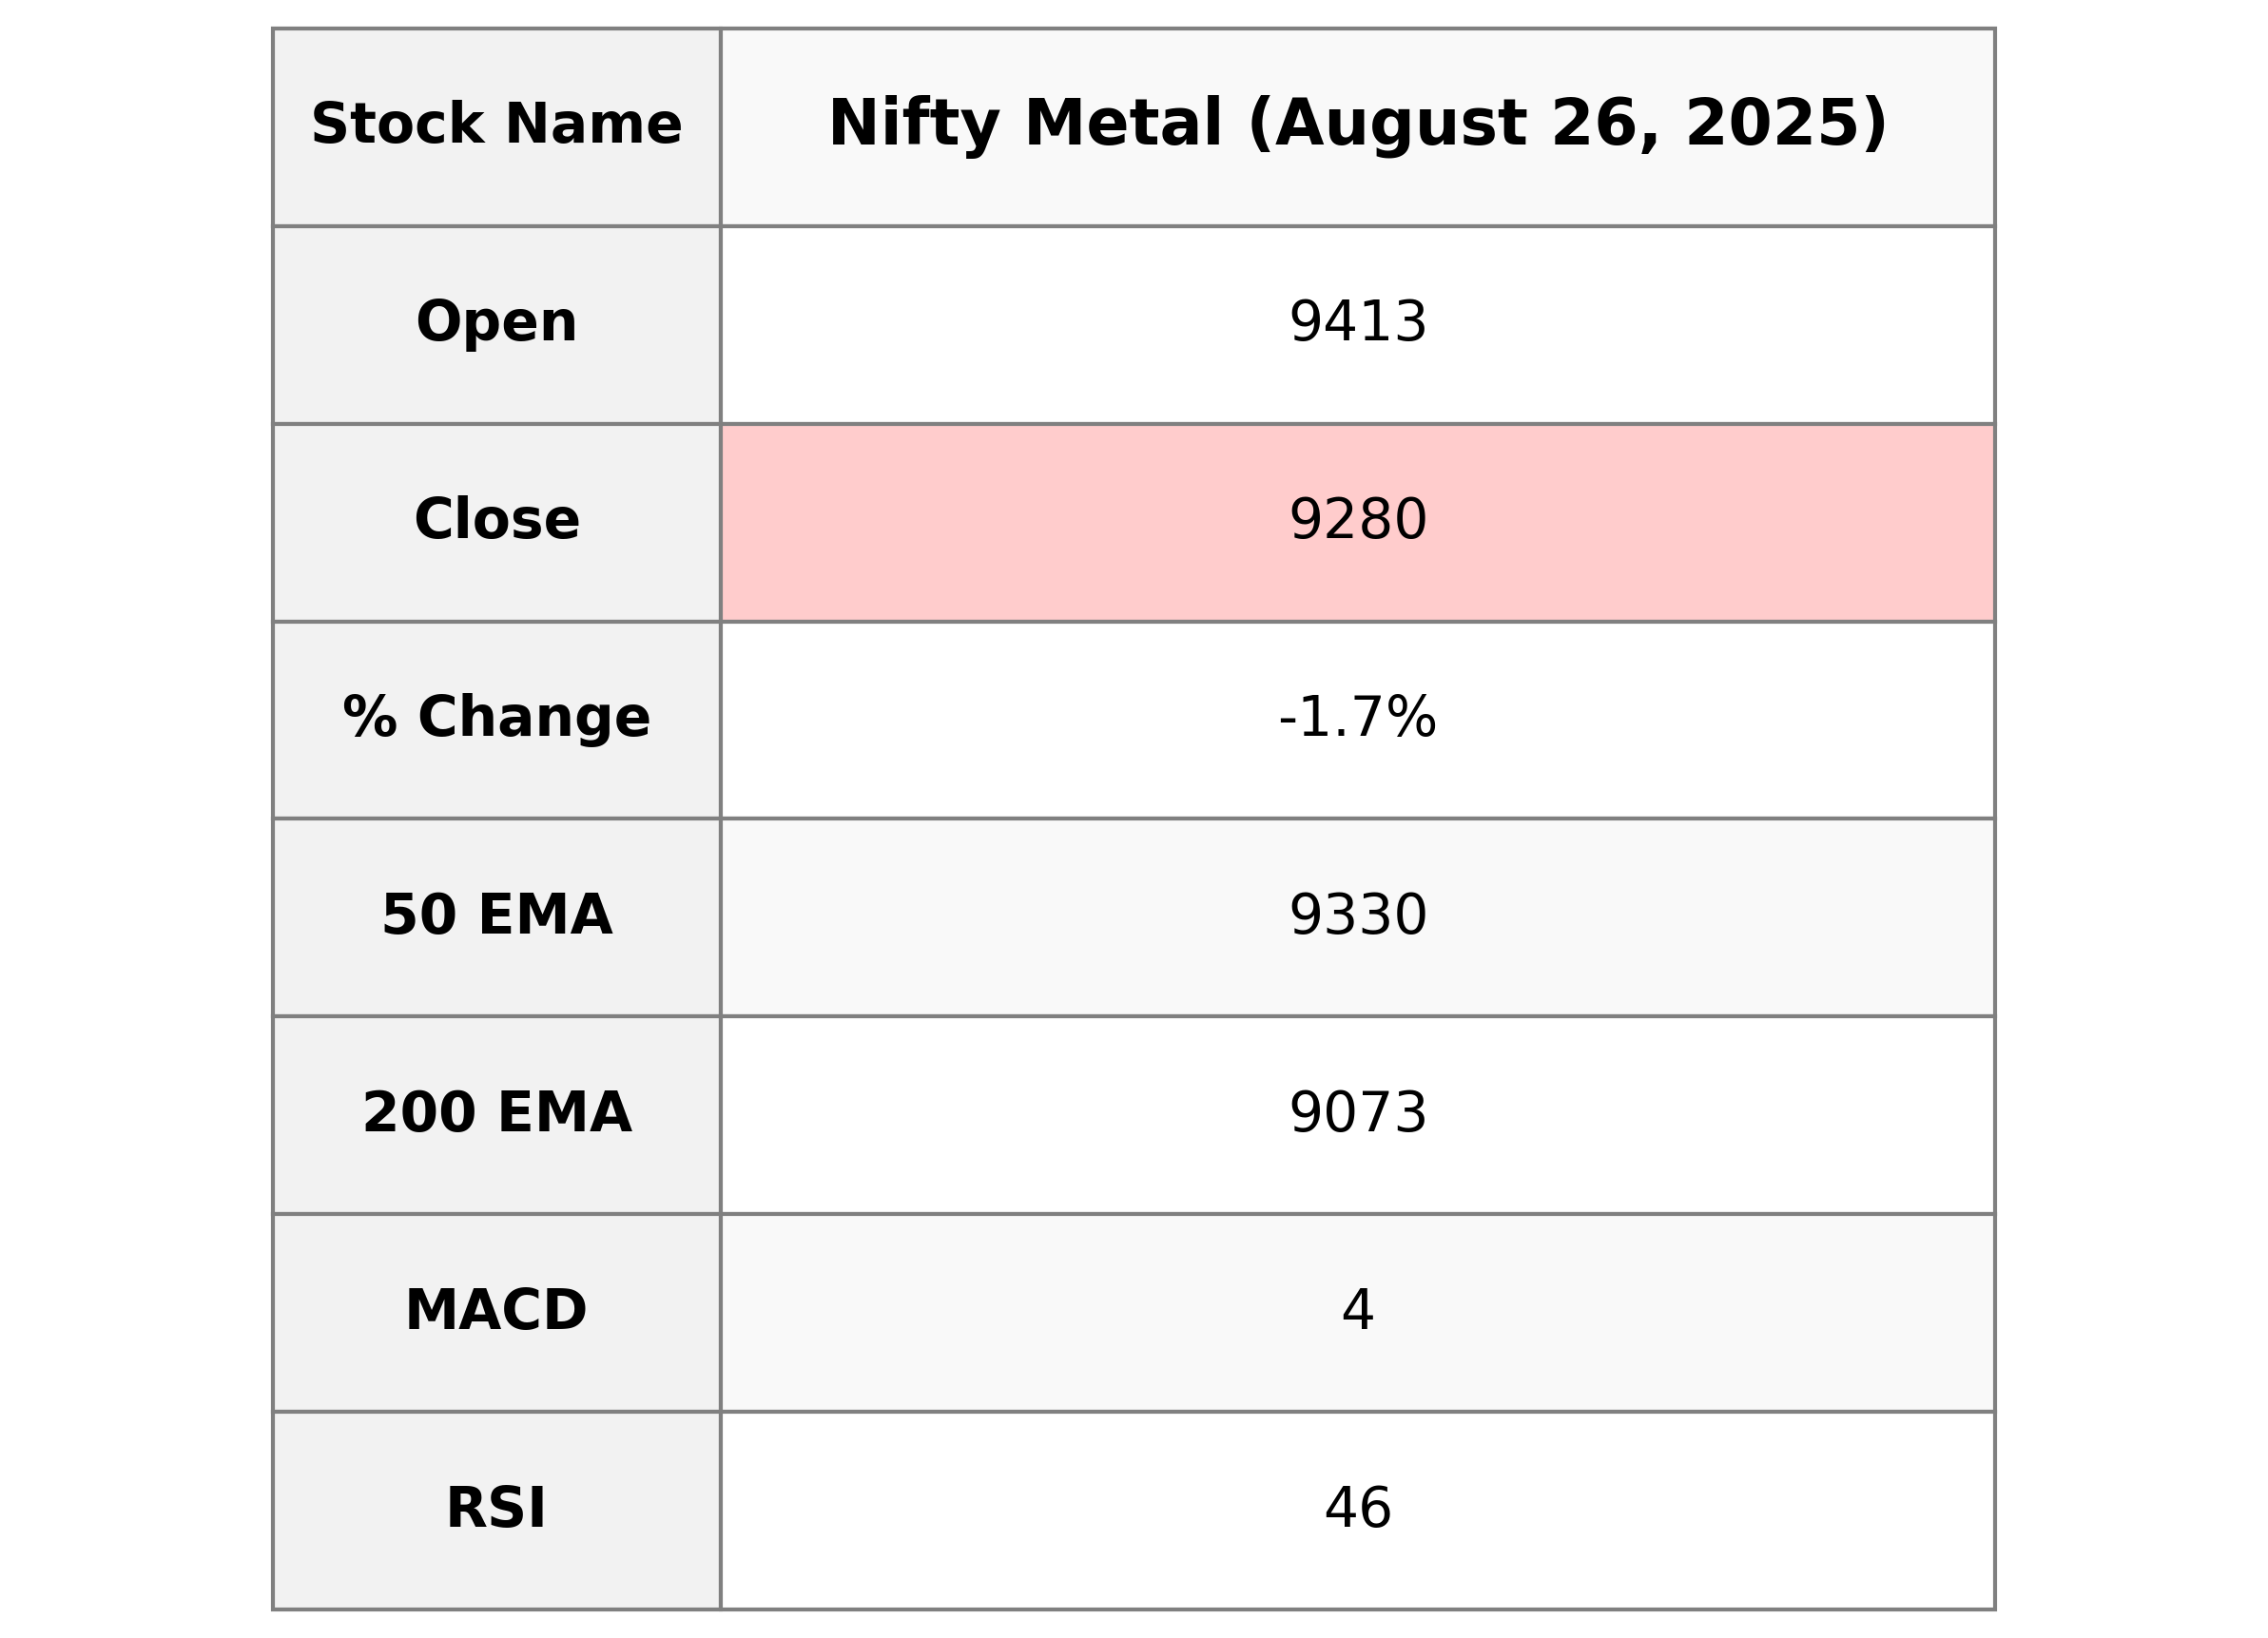
Nifty Metal opened at 9412.85 and closed lower at 9280.05, marking a percentage change of -1.66% with a points drop of 156.70 from its previous close of 9436.75. The Relative Strength Index stands at 46.24, indicating weakened momentum, while the MACD is slightly above the signal line at 3.76. The moving averages suggest that the index is currently below both the 10-day and 20-day EMAs.
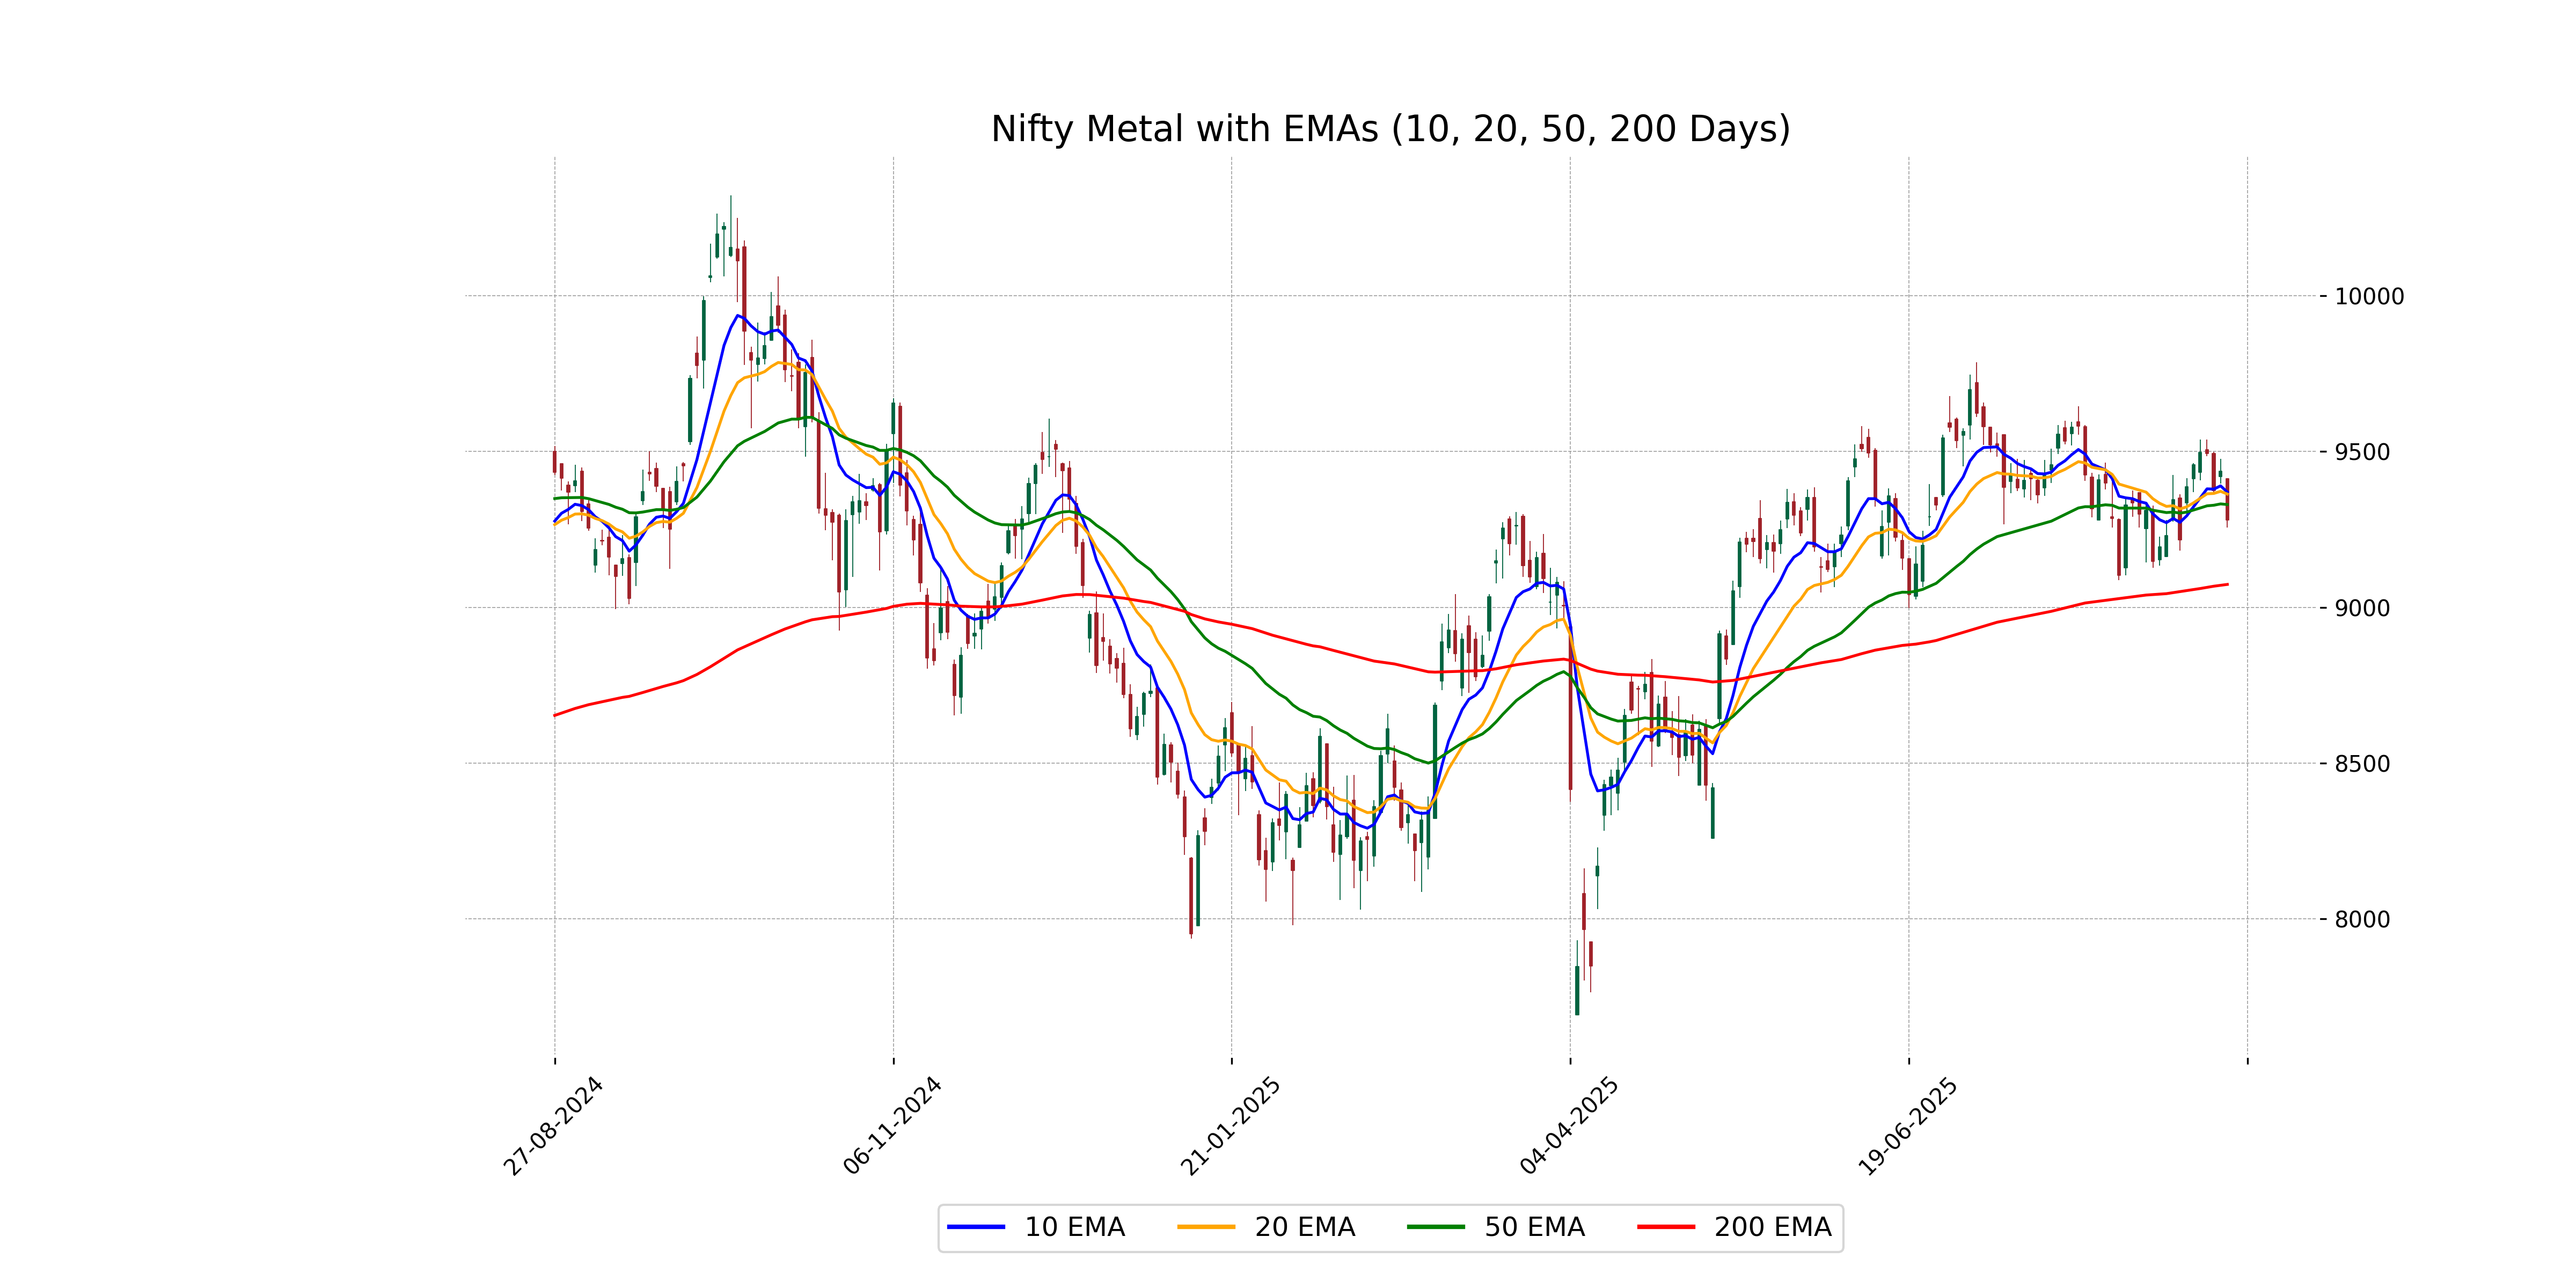
Relationship with Key Moving Averages
The close price of Nifty Metal at 9280.05 is below its 50-day EMA of 9329.87, indicating a potential bearish trend. The close is also below the 10-day EMA of 9369.86 and the 20-day EMA of 9363.46, suggesting short-term weakness as well.
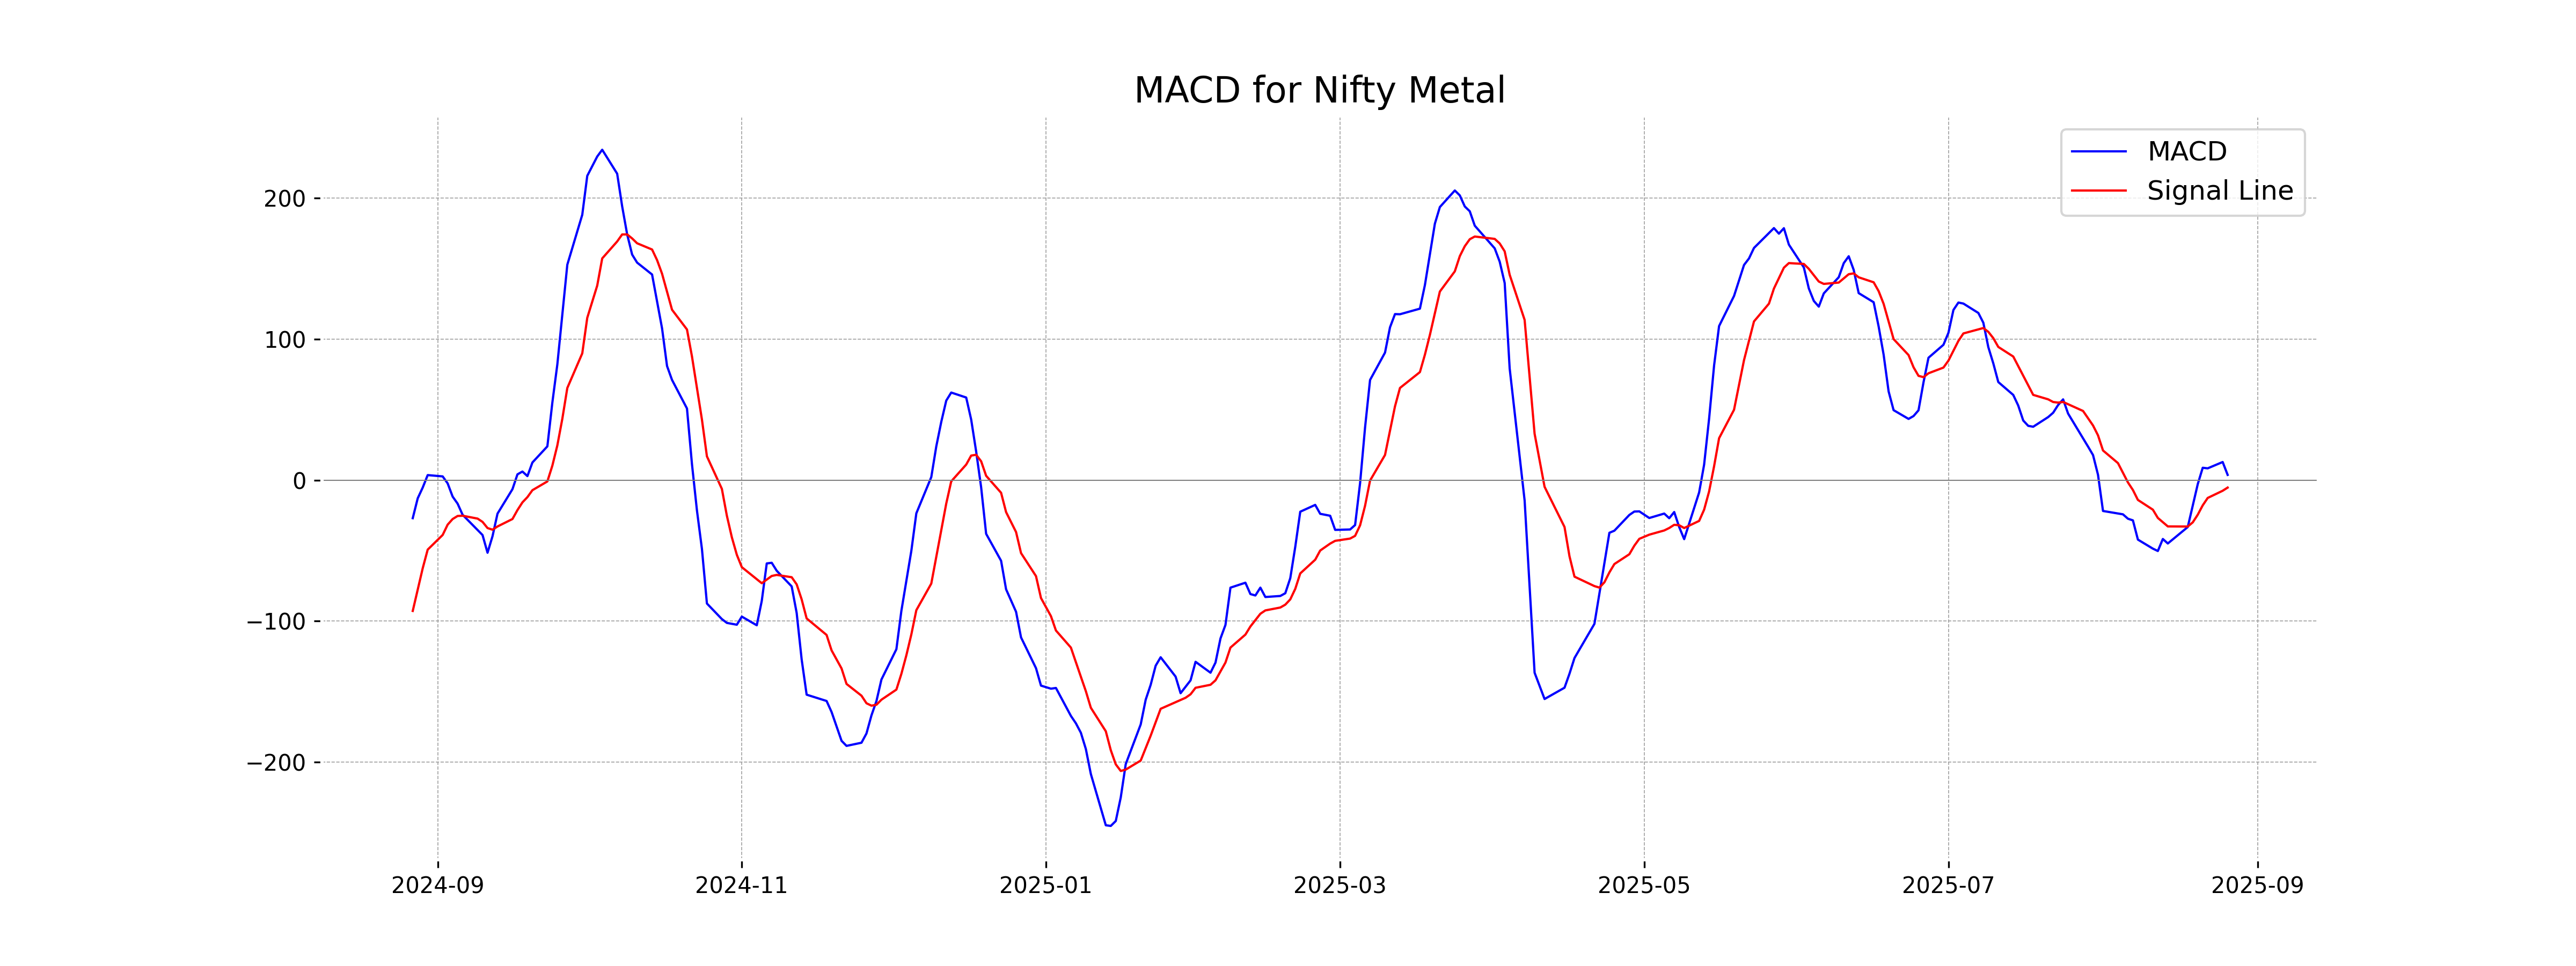
Moving Averages Trend (MACD)
MACD Analysis for Nifty Metal: The MACD value of 3.76 paired with a MACD Signal of -5.24 suggests a potential upward momentum as the MACD line is above the signal line. However, the negative MACD Signal indicates caution should be observed as the market sentiment might not fully support a strong upward move yet.
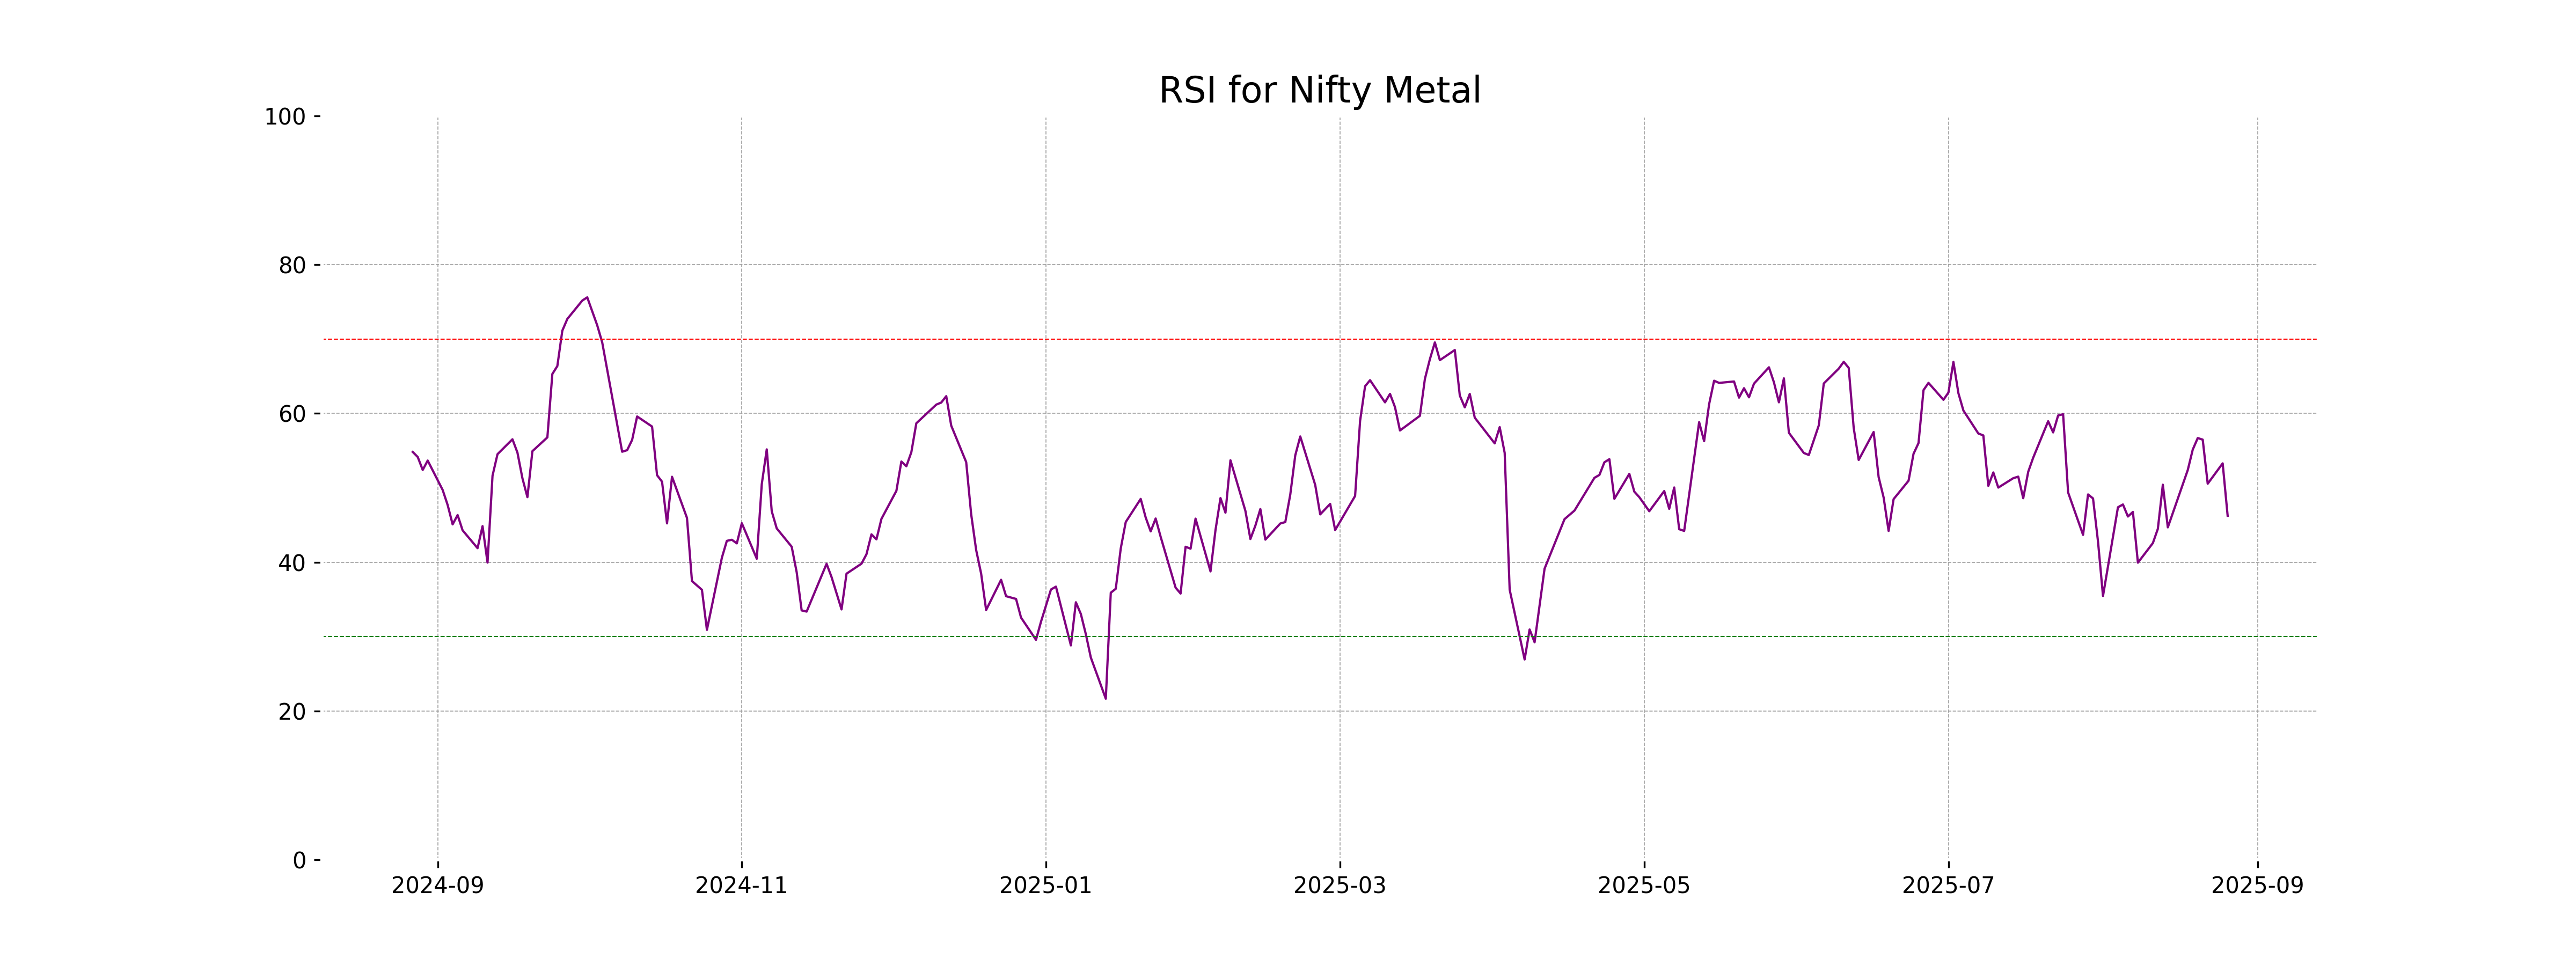
RSI Analysis
The RSI for Nifty Metal is 46.24, indicating a neutral stance as it is between the commonly referenced RSI thresholds of 30 (oversold) and 70 (overbought). This suggests that the index is neither in a strong buying nor selling zone and may be stabilizing.
Analysis for Nifty Bank - August 26, 2025
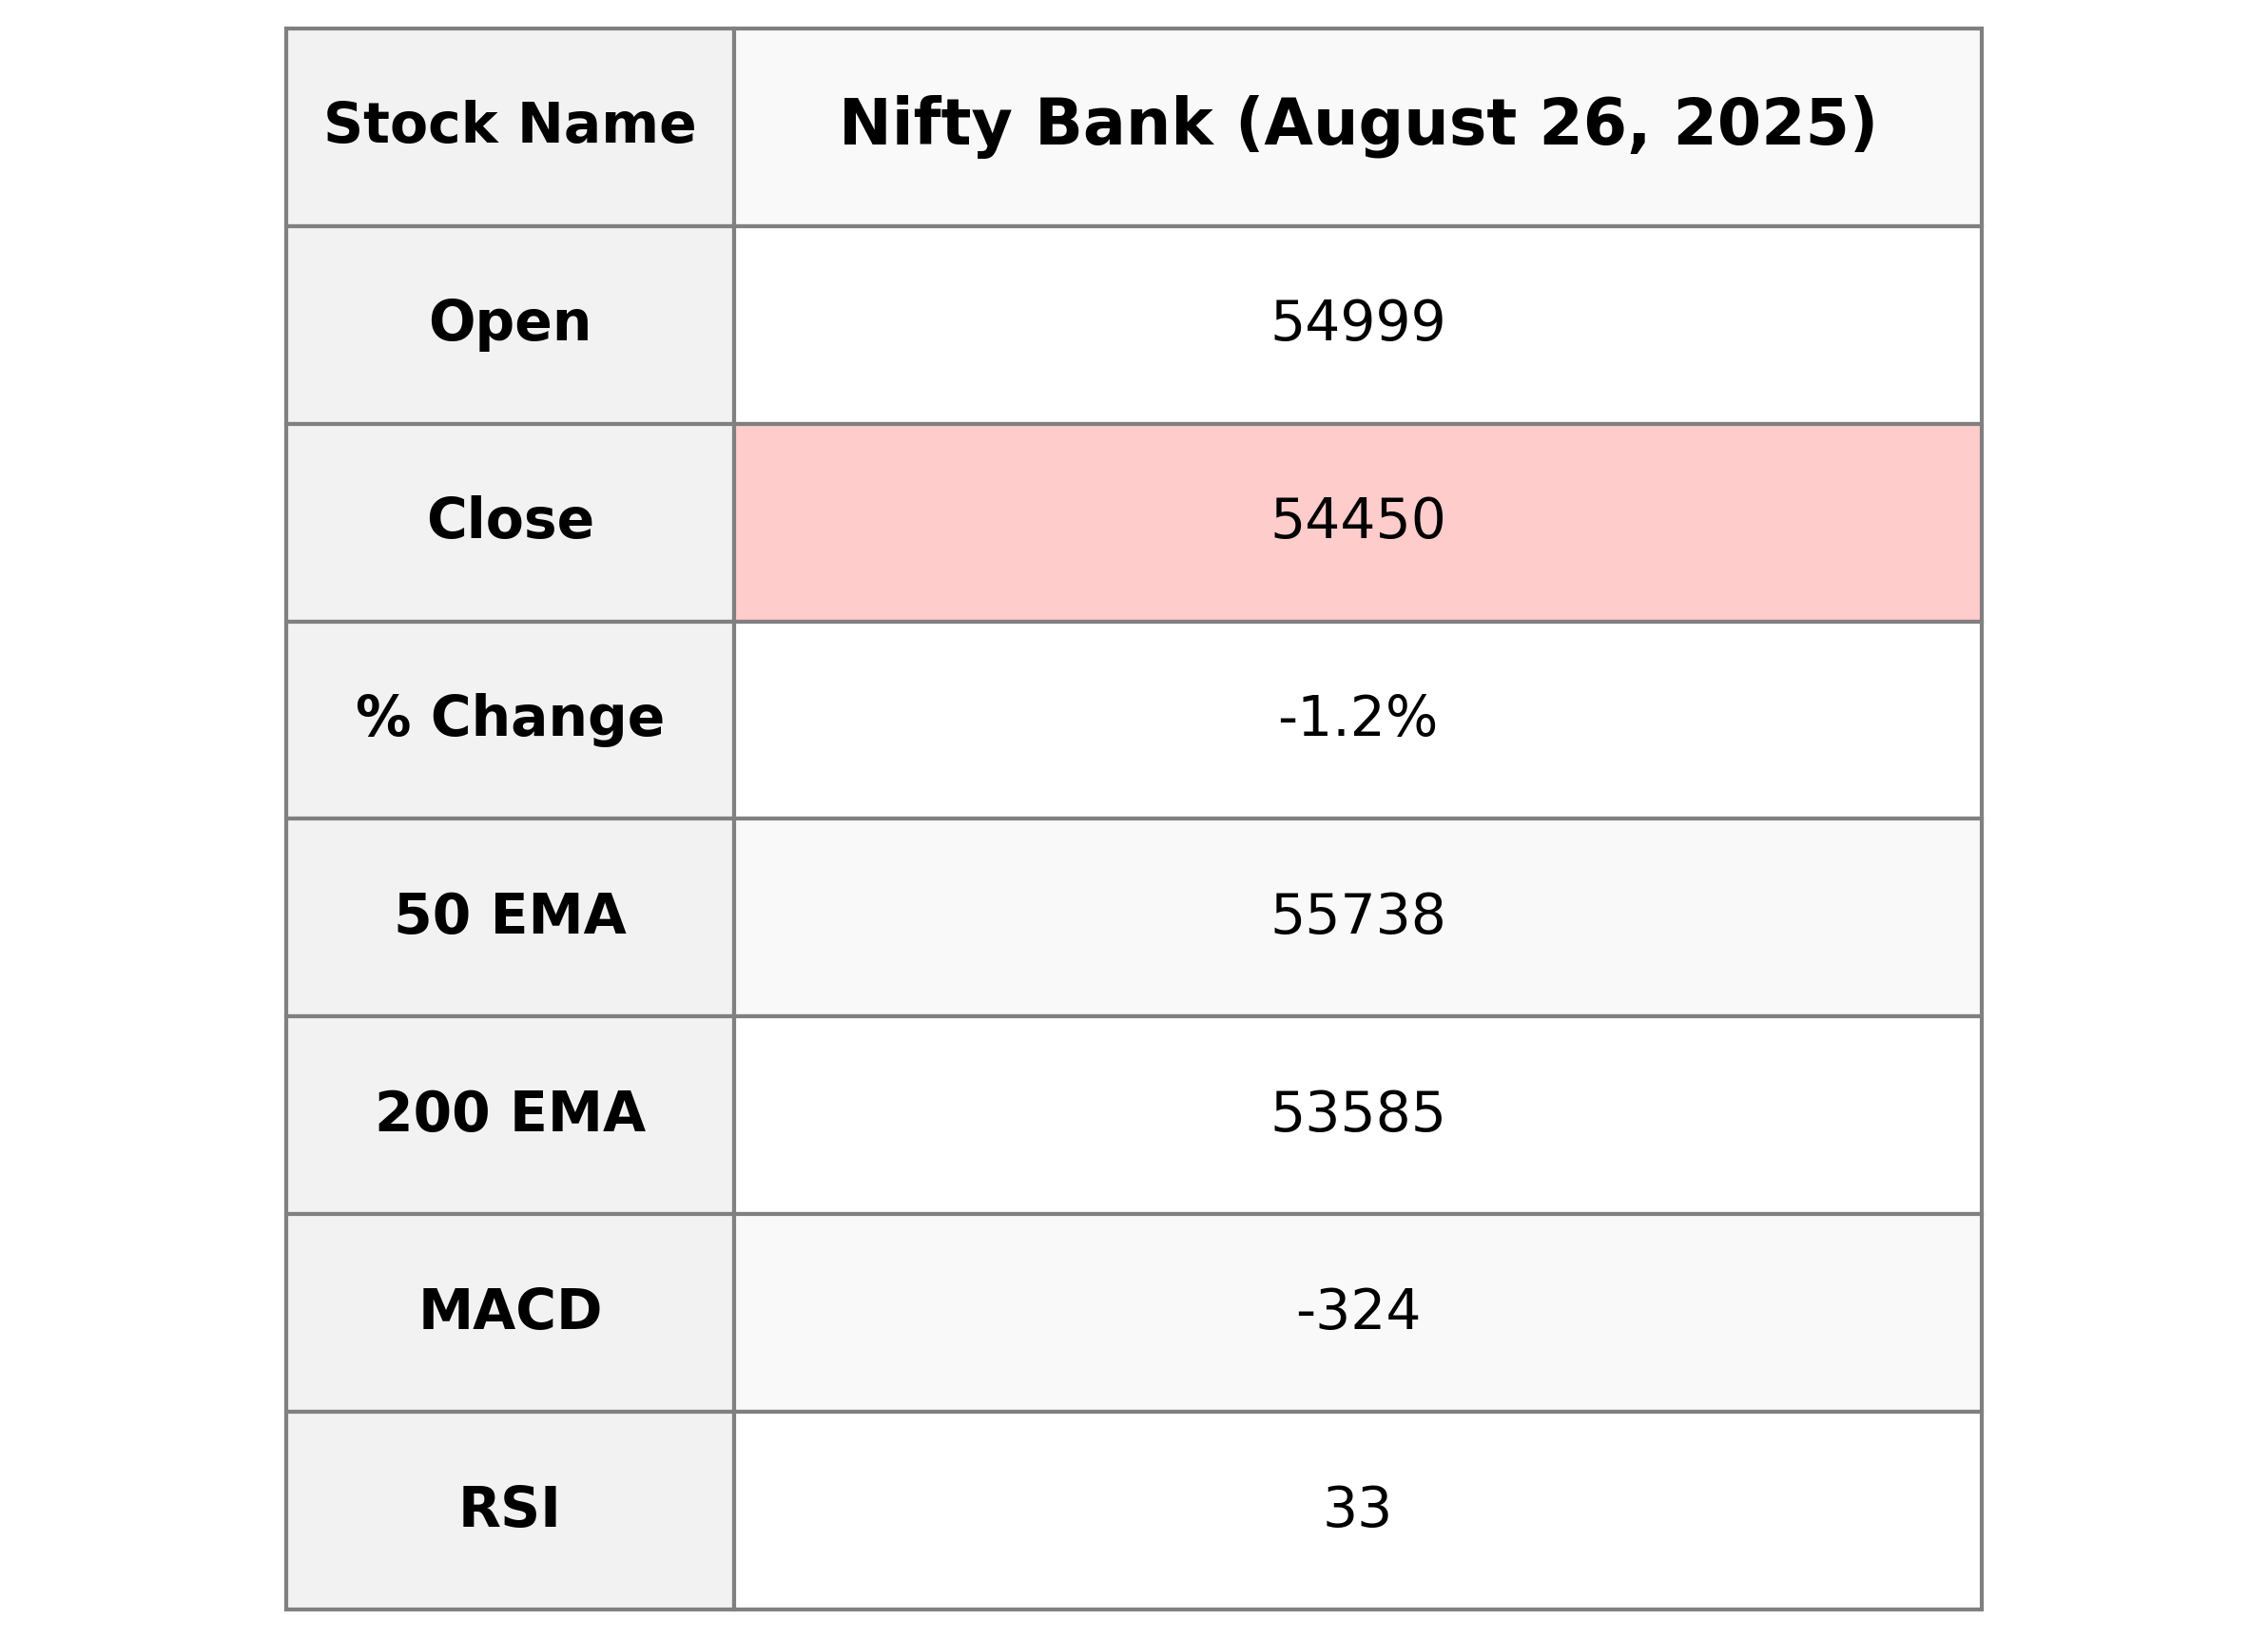
Nifty Bank Performance: Nifty Bank opened at 54,999.05 and closed at 54,450.45, experiencing a decline of approximately 1.25% or a points change of -688.85. The Relative Strength Index (RSI) is at 33.43, indicating a potential oversold condition. The Moving Average Convergence Divergence (MACD) is negative, suggesting bearish momentum.
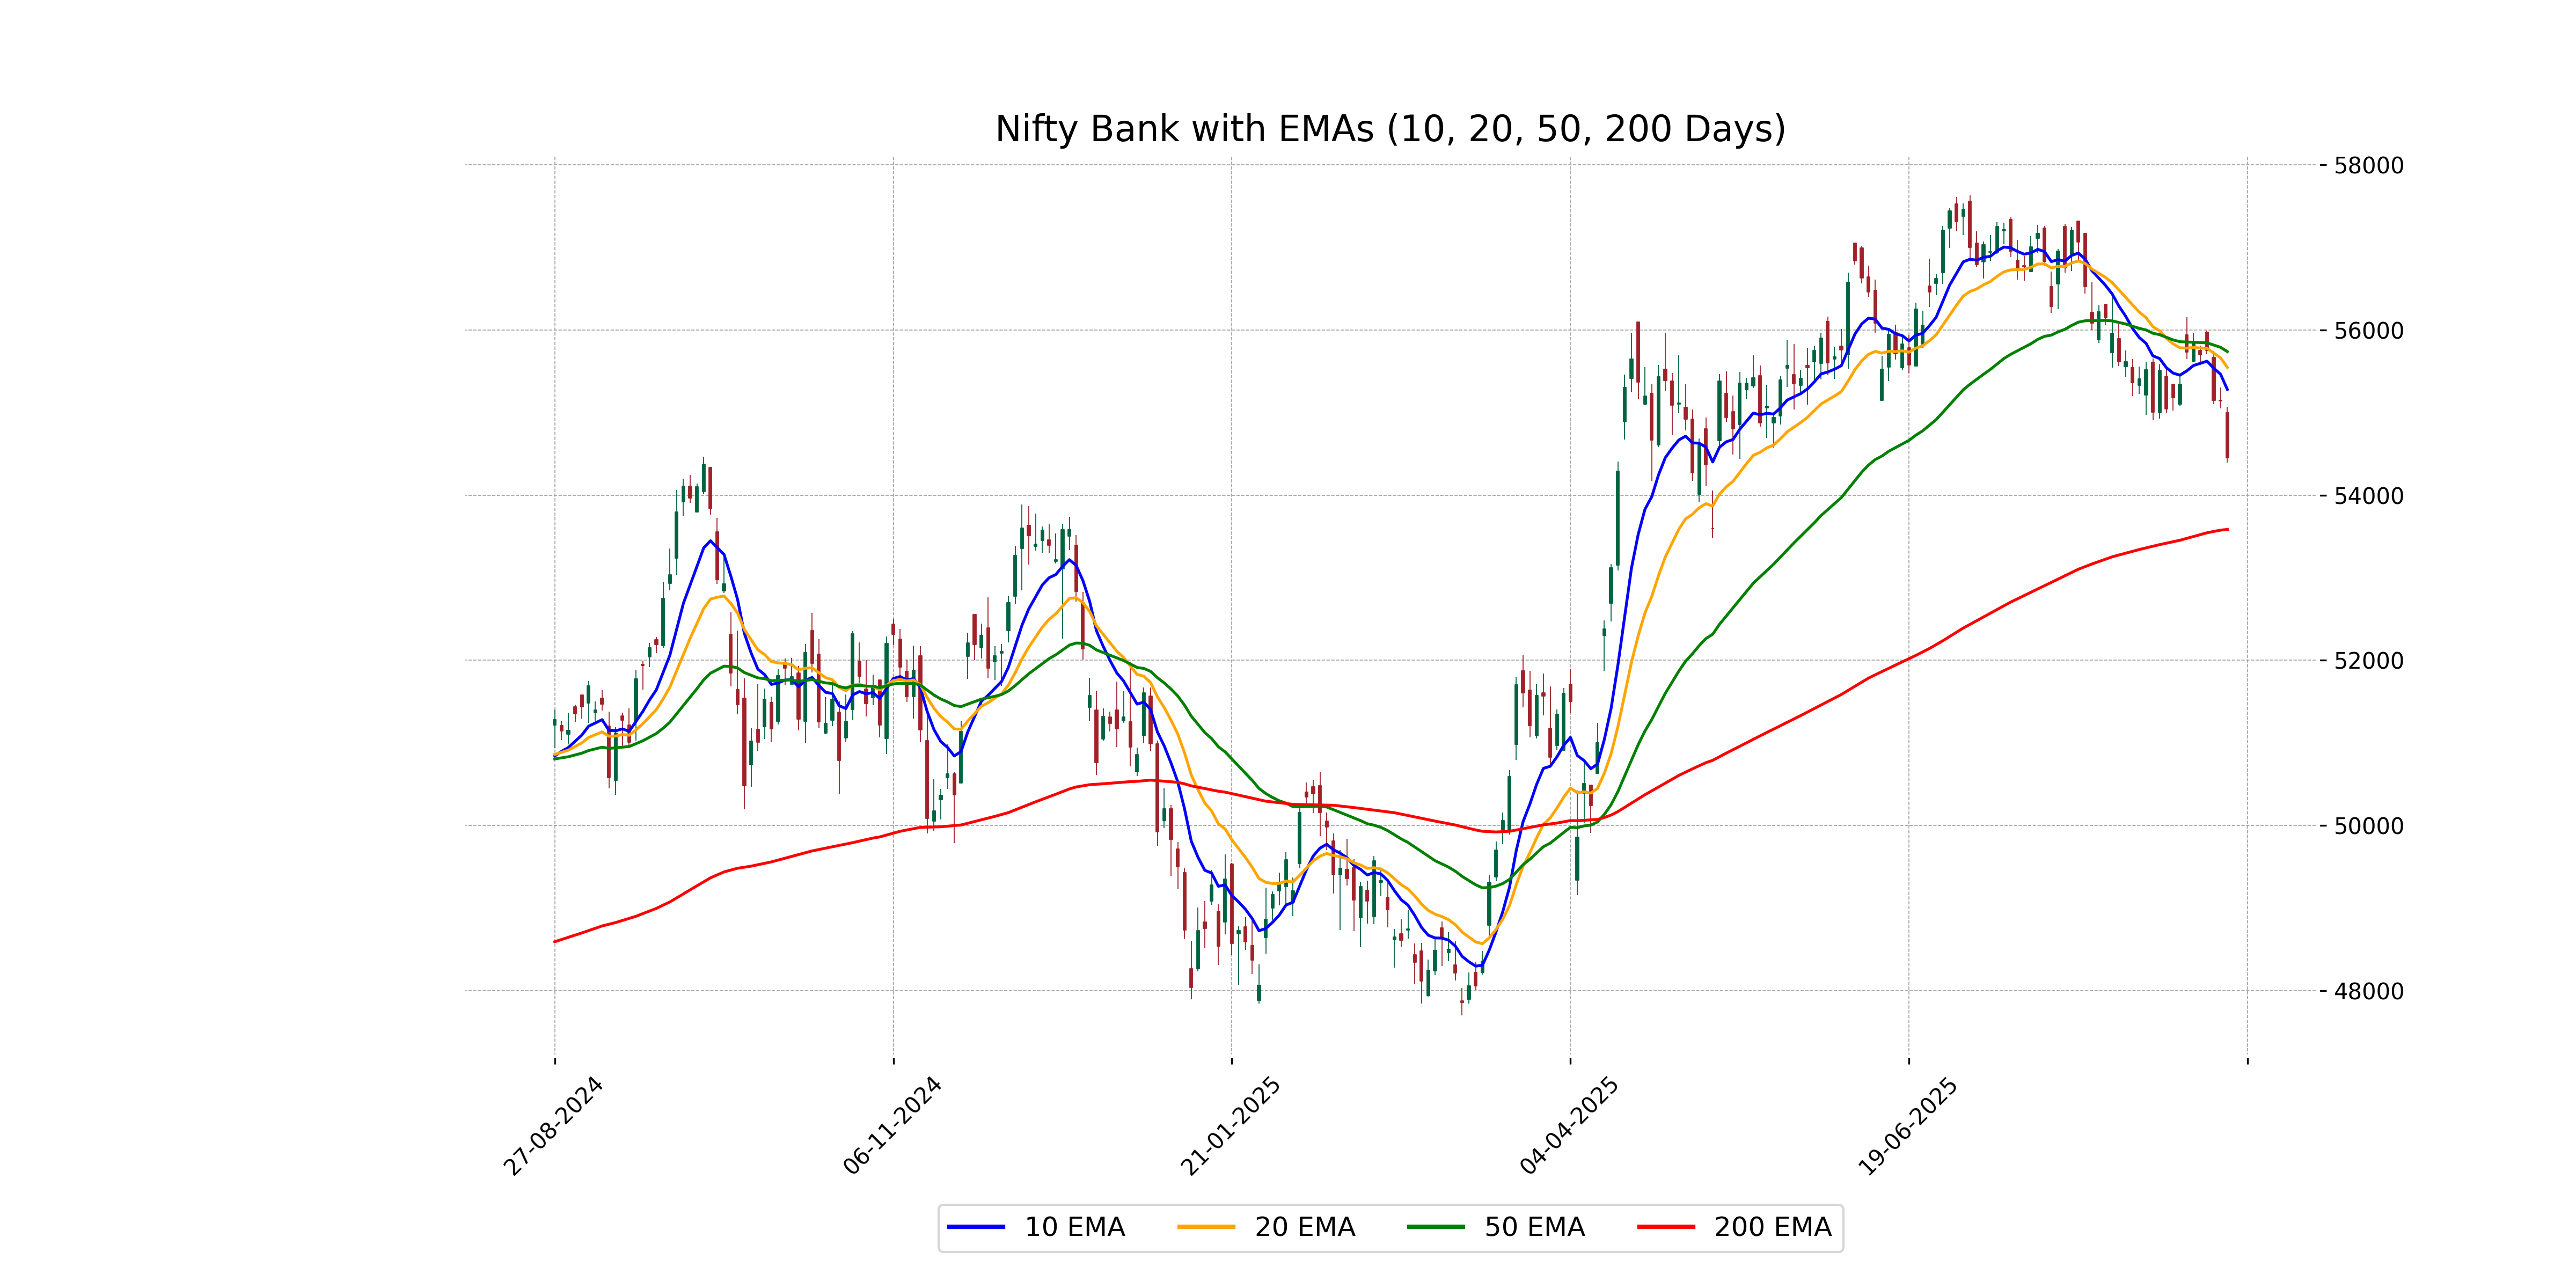
Relationship with Key Moving Averages
The Nifty Bank closed at 54450.45, which is below the 50 EMA (55738.12), the 20 EMA (55547.23), and the 10 EMA (55280.09), indicating a bearish trend as the stock price is trading below key moving averages. Additionally, the RSI at 33.43 suggests that the market is approaching an oversold condition.
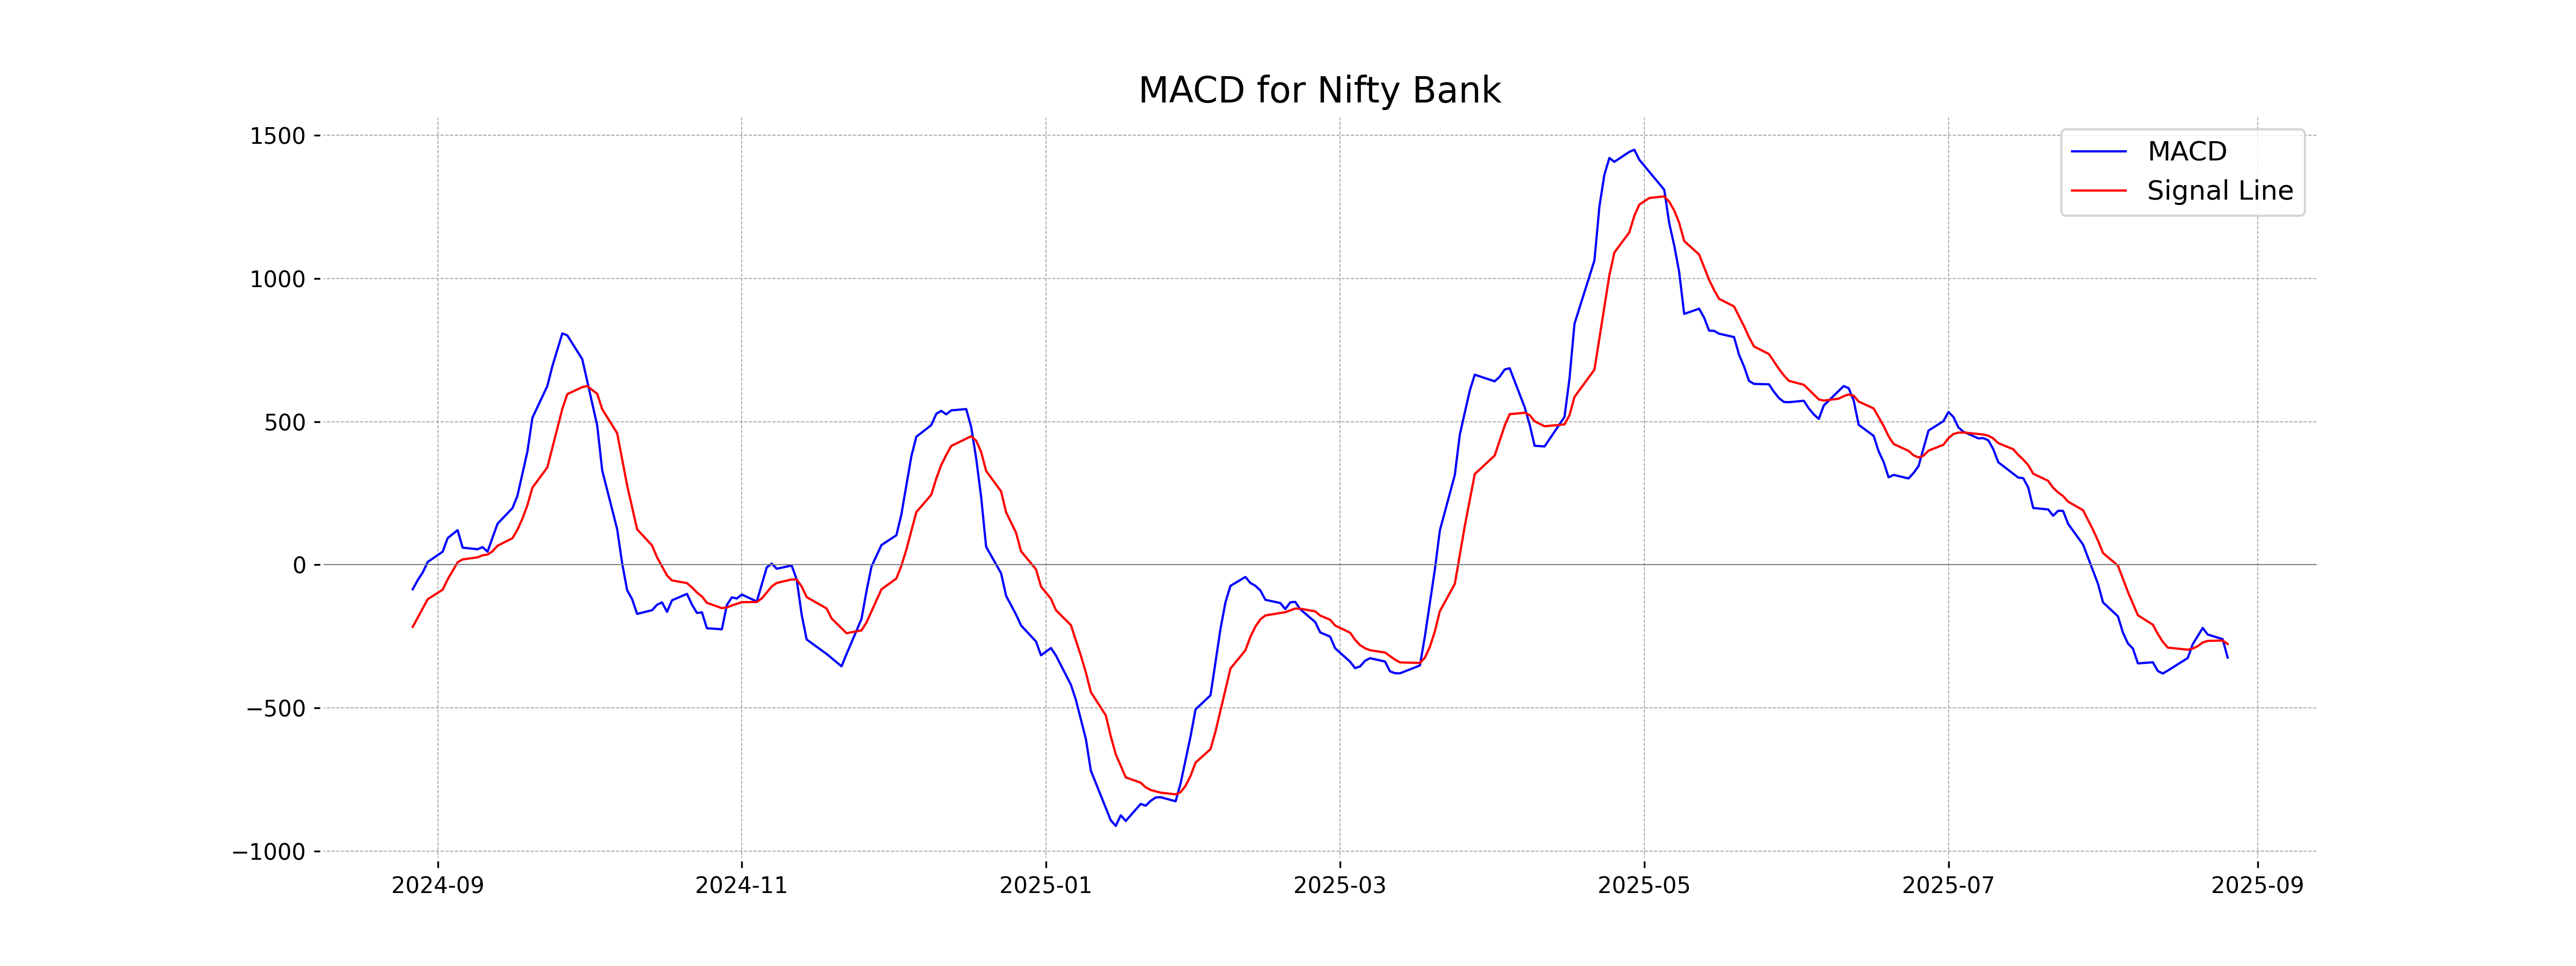
Moving Averages Trend (MACD)
The MACD for Nifty Bank is currently at -323.97, with the MACD Signal line at -276.23. The negative MACD value and the fact that it is below the Signal line suggest a bearish trend, indicating potential downward momentum in the stock price.
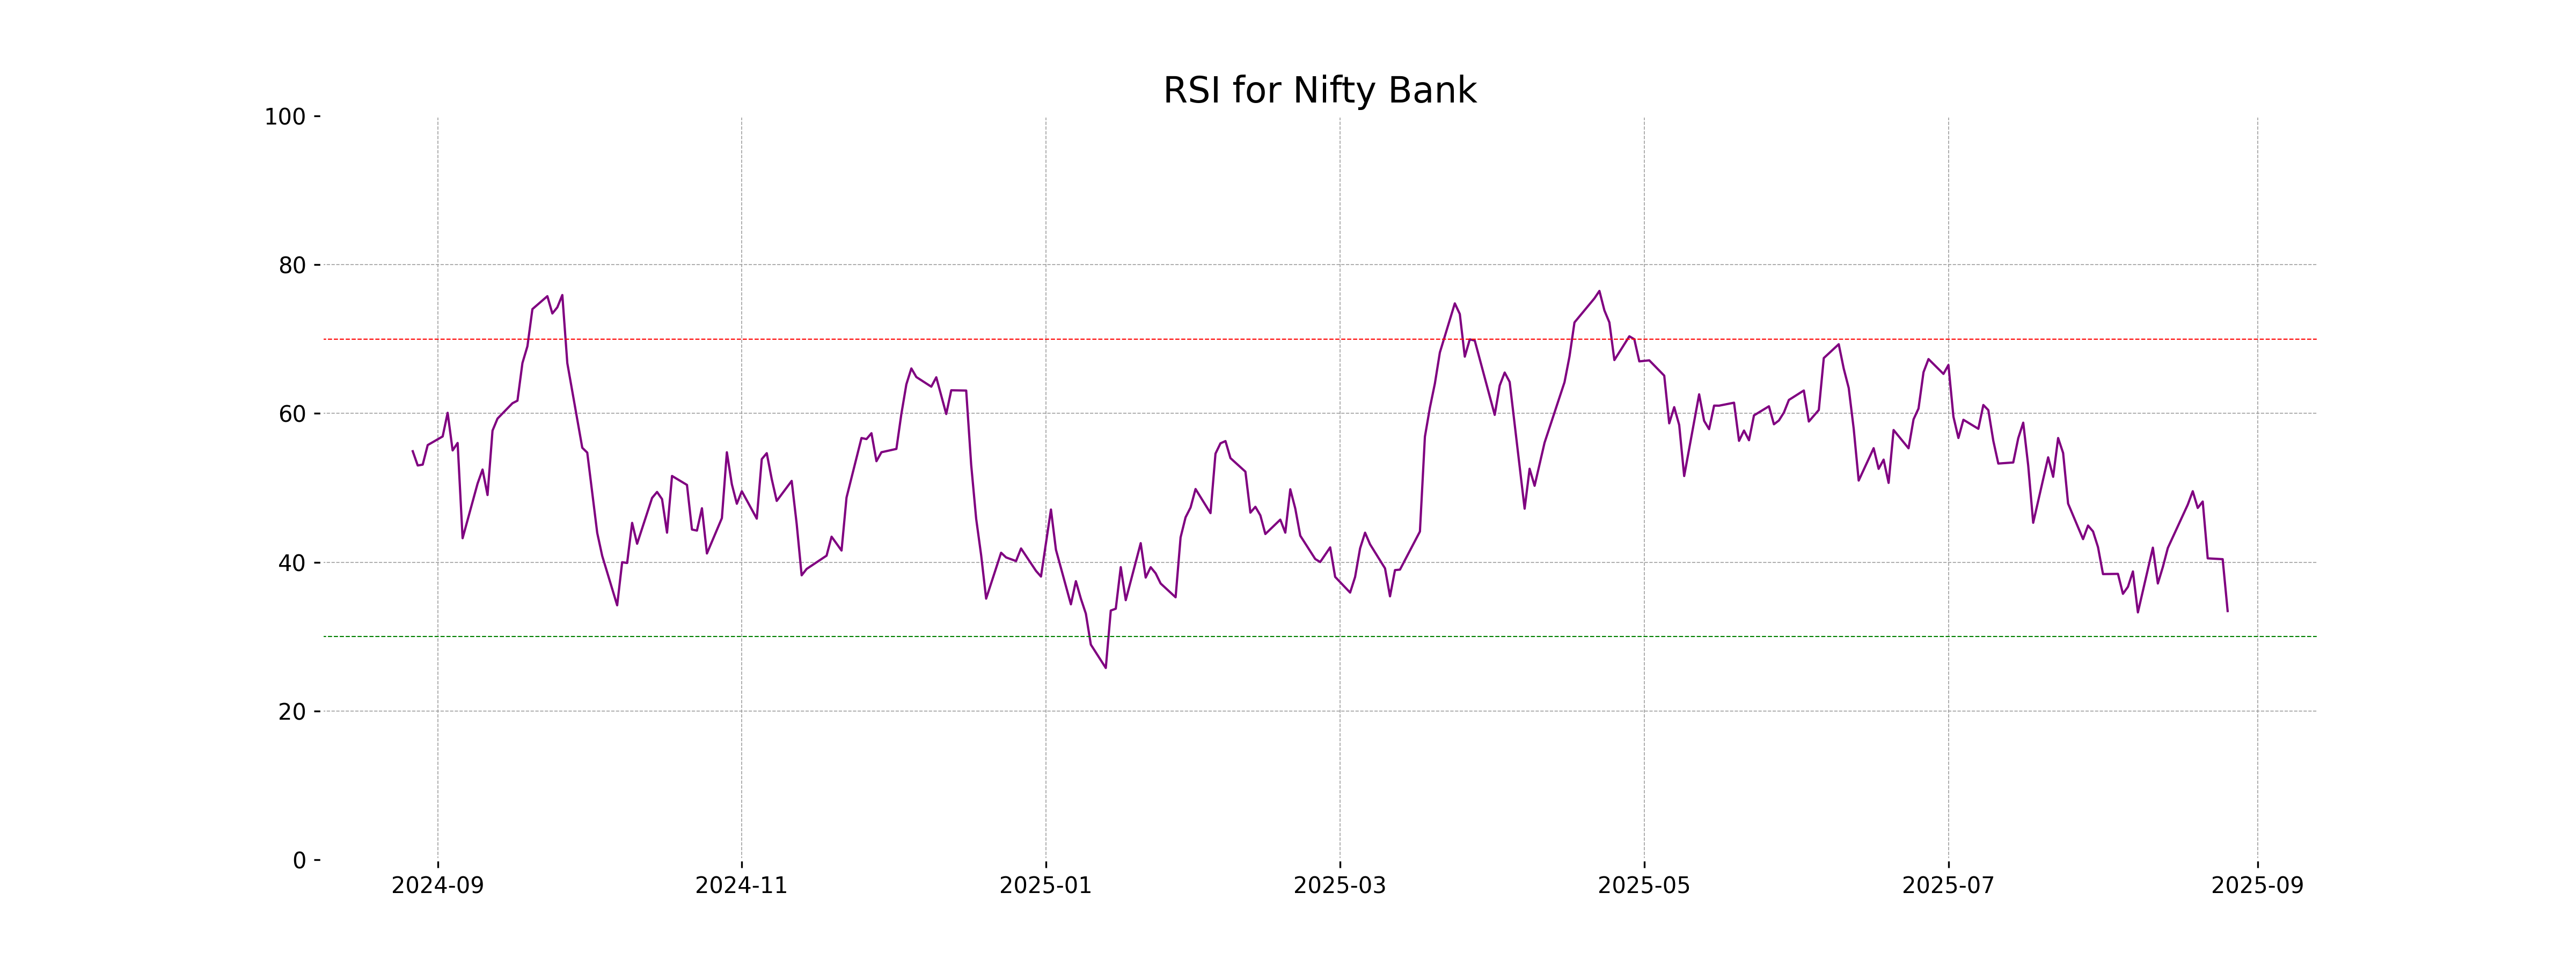
RSI Analysis
RSI is currently at 33.43, which indicates that Nifty Bank is approaching oversold conditions. Typically, an RSI below 30 is considered oversold, suggesting that the stock may be undervalued or experiencing a potential reversal point. However, it's essential to consider other factors and indicators before making any investment decisions.
Analysis for Nifty 50 - August 26, 2025
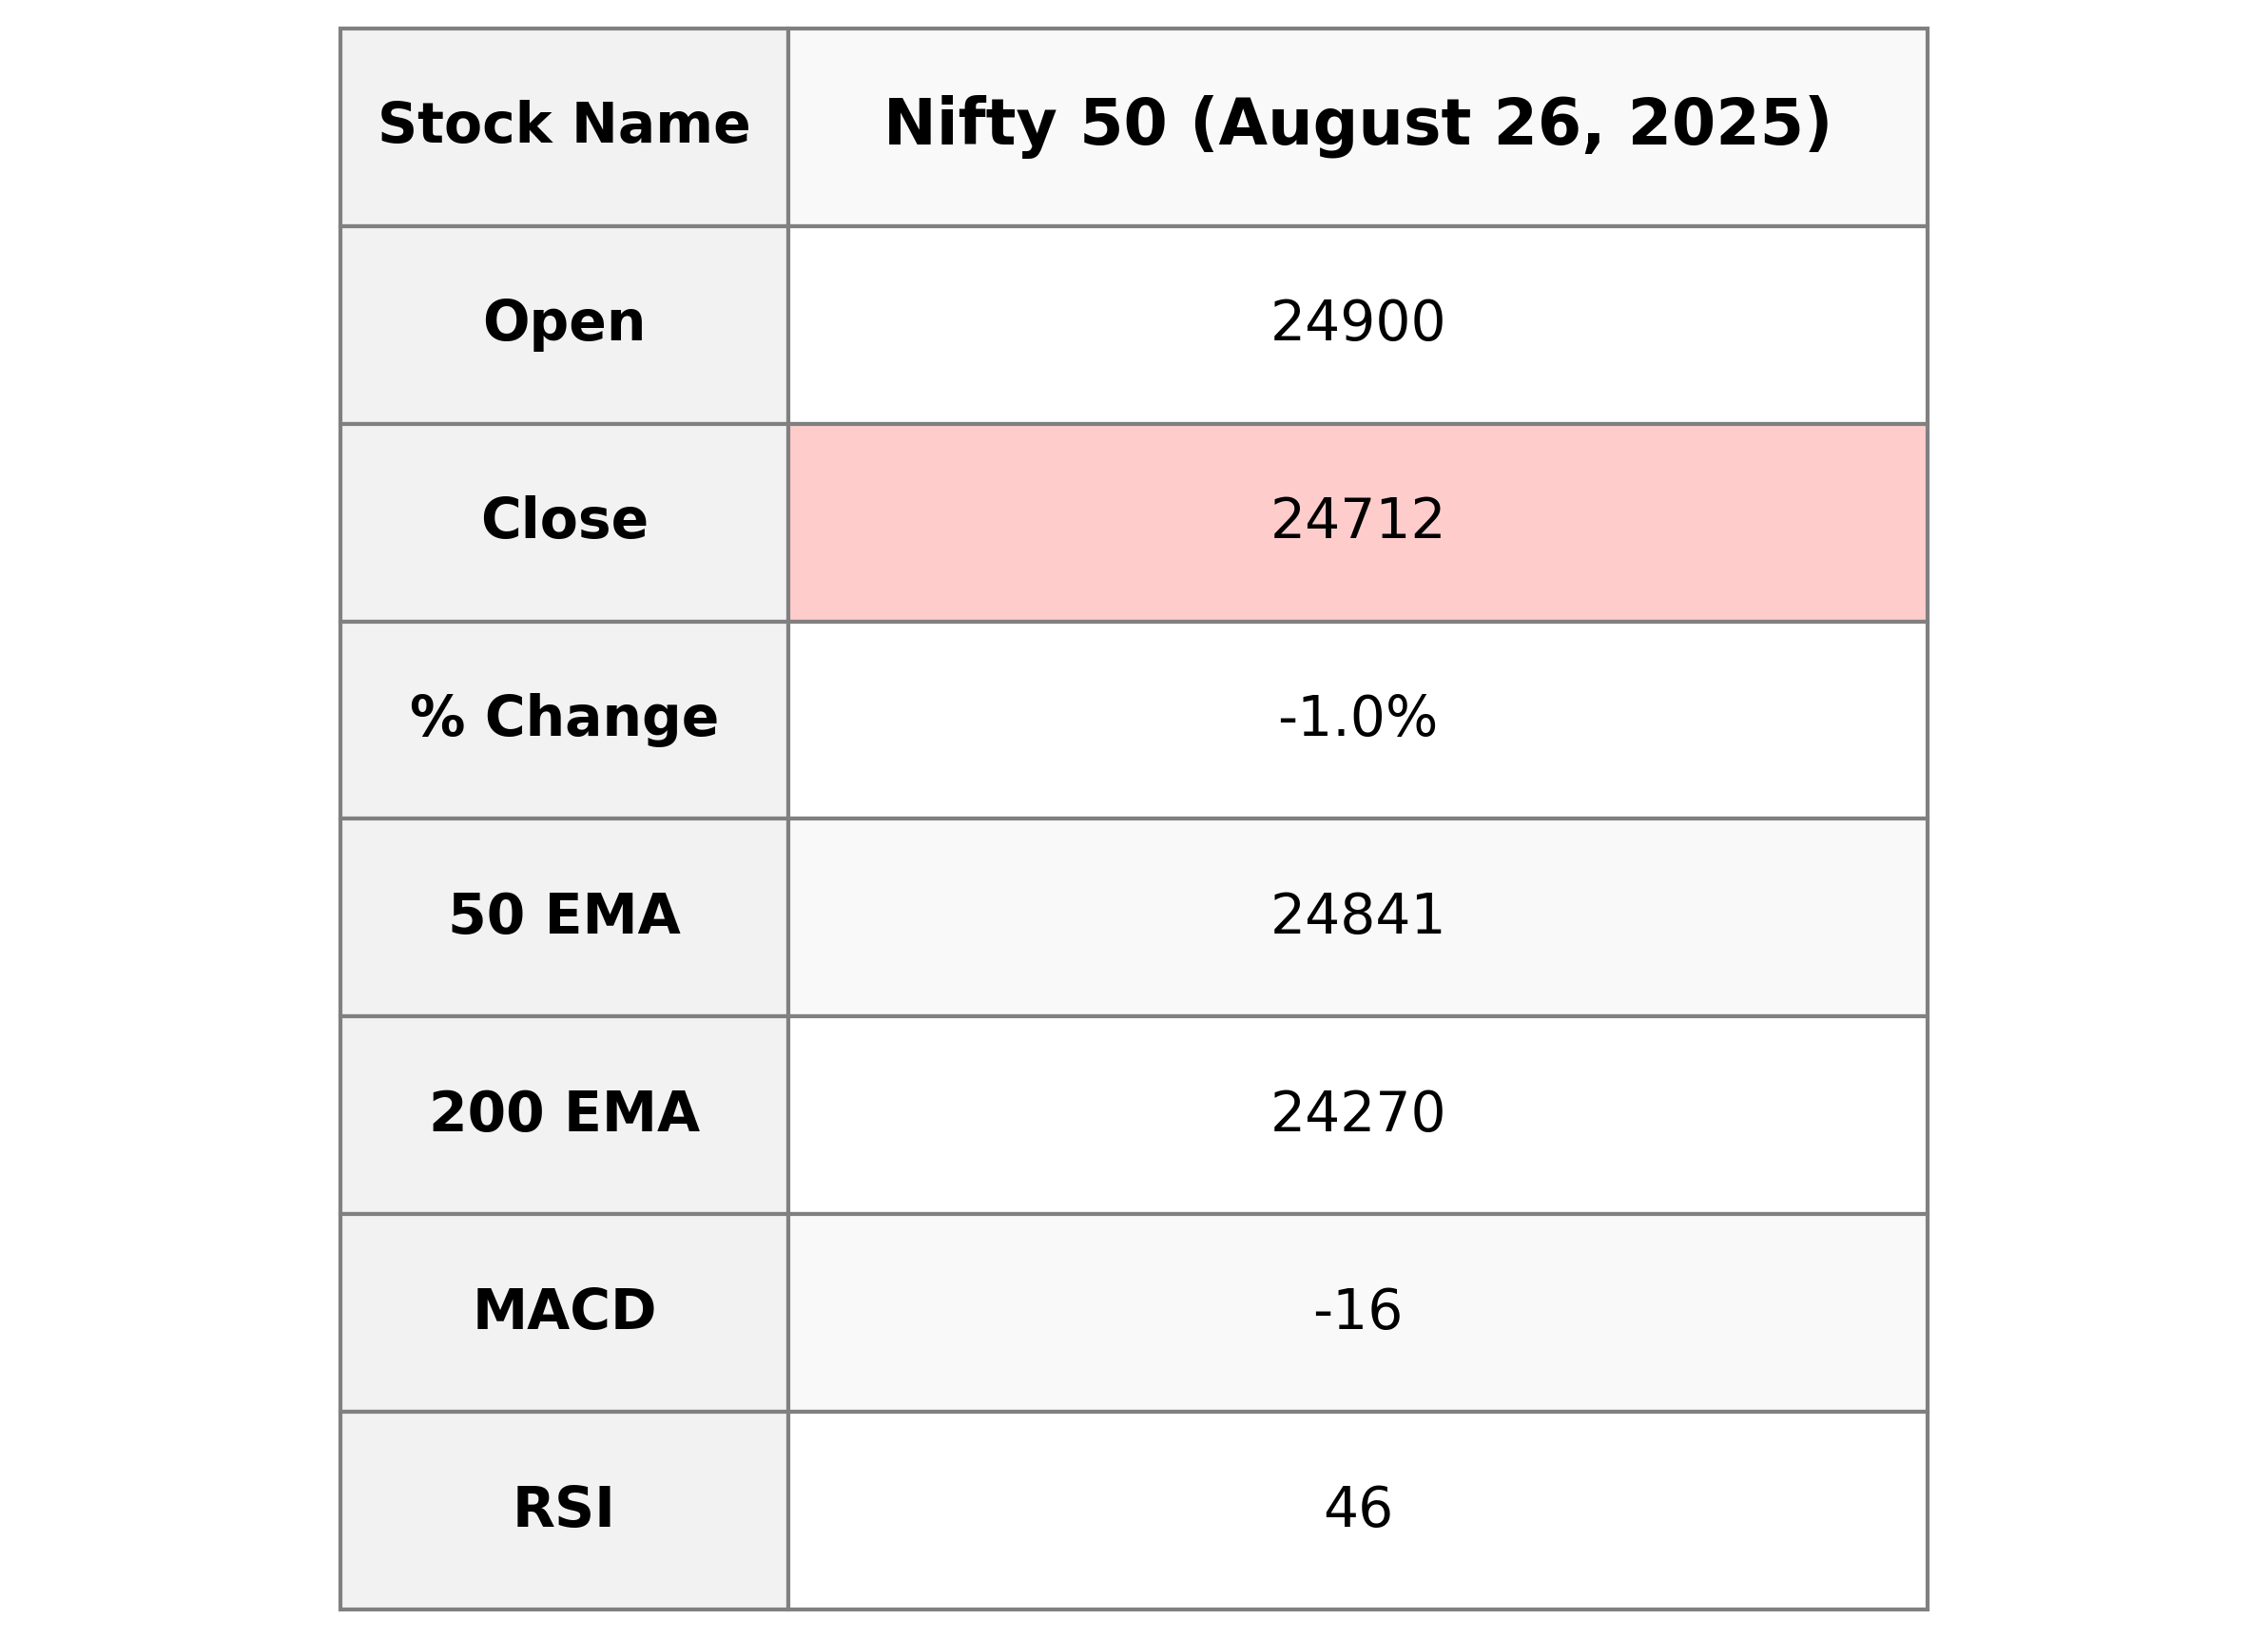
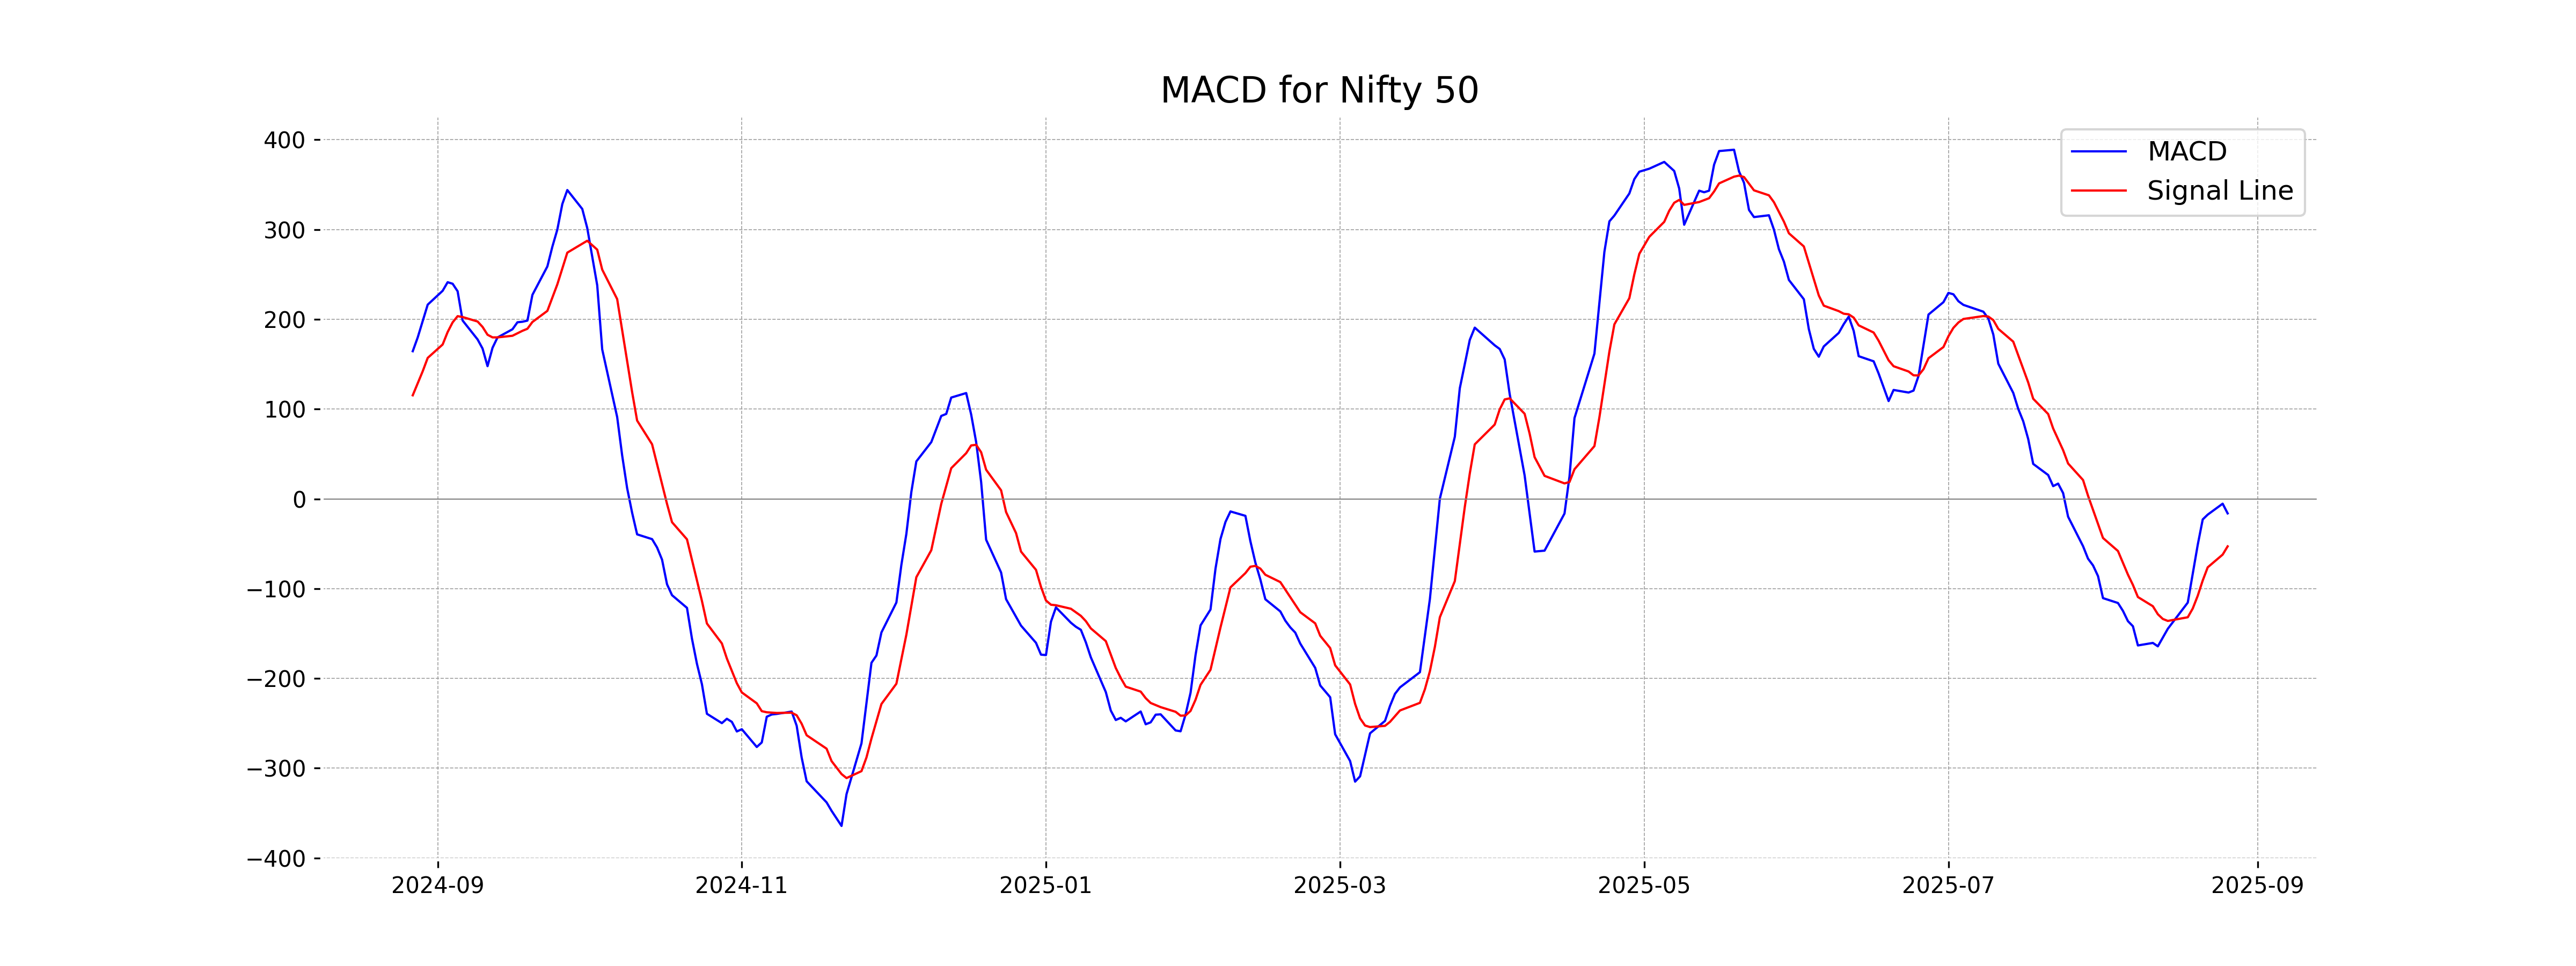
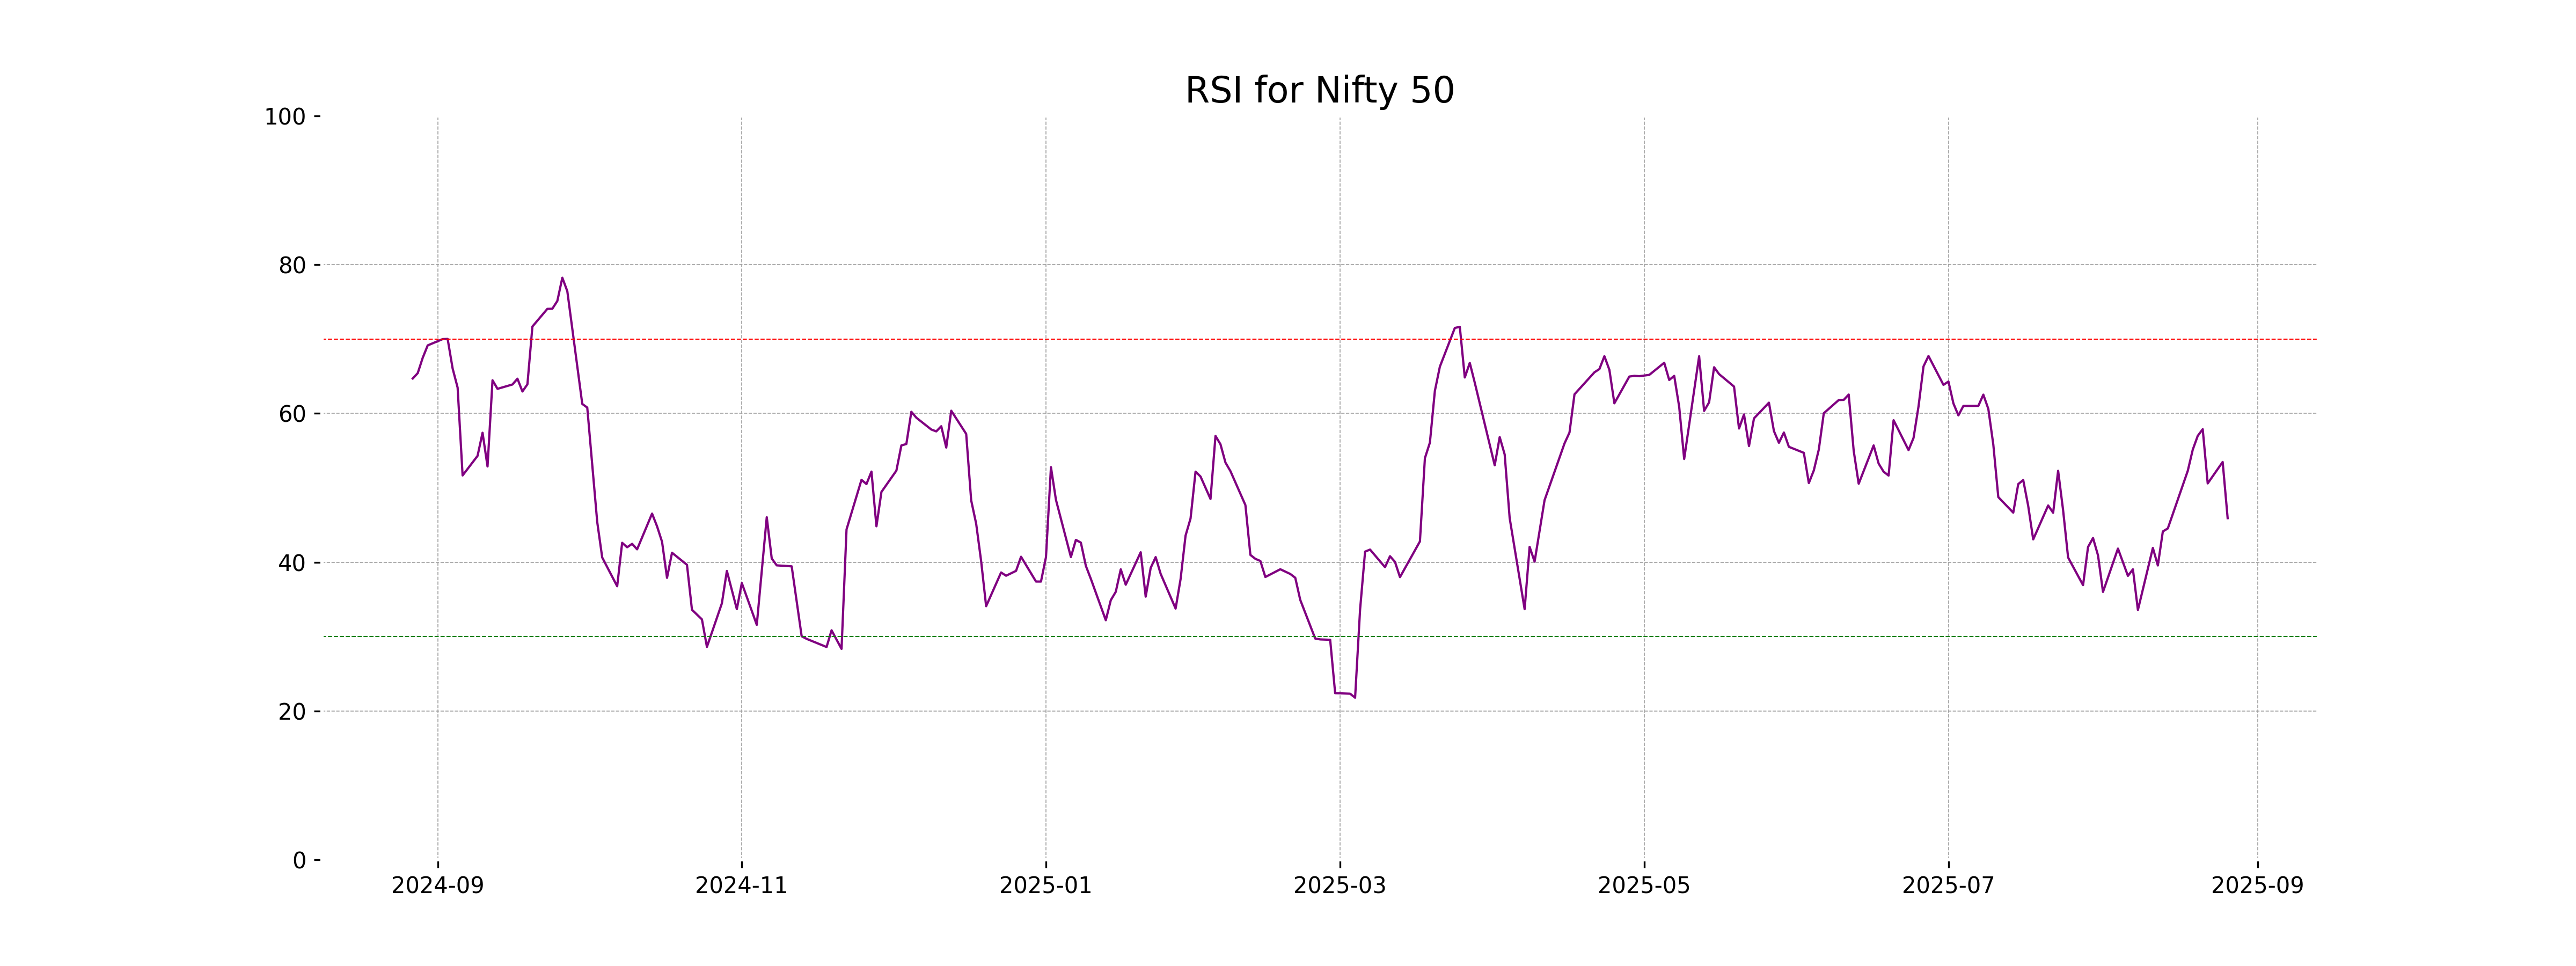
Nifty 50 closed at 24,712.05, experiencing a decrease of 1.02% from the previous close of 24,967.75, resulting in a points change of -255.70. The Relative Strength Index (RSI) at 45.92 suggests neutral market momentum. The Moving Average Convergence Divergence (MACD) value of -16.18, below the signal line, indicates a bearish trend.
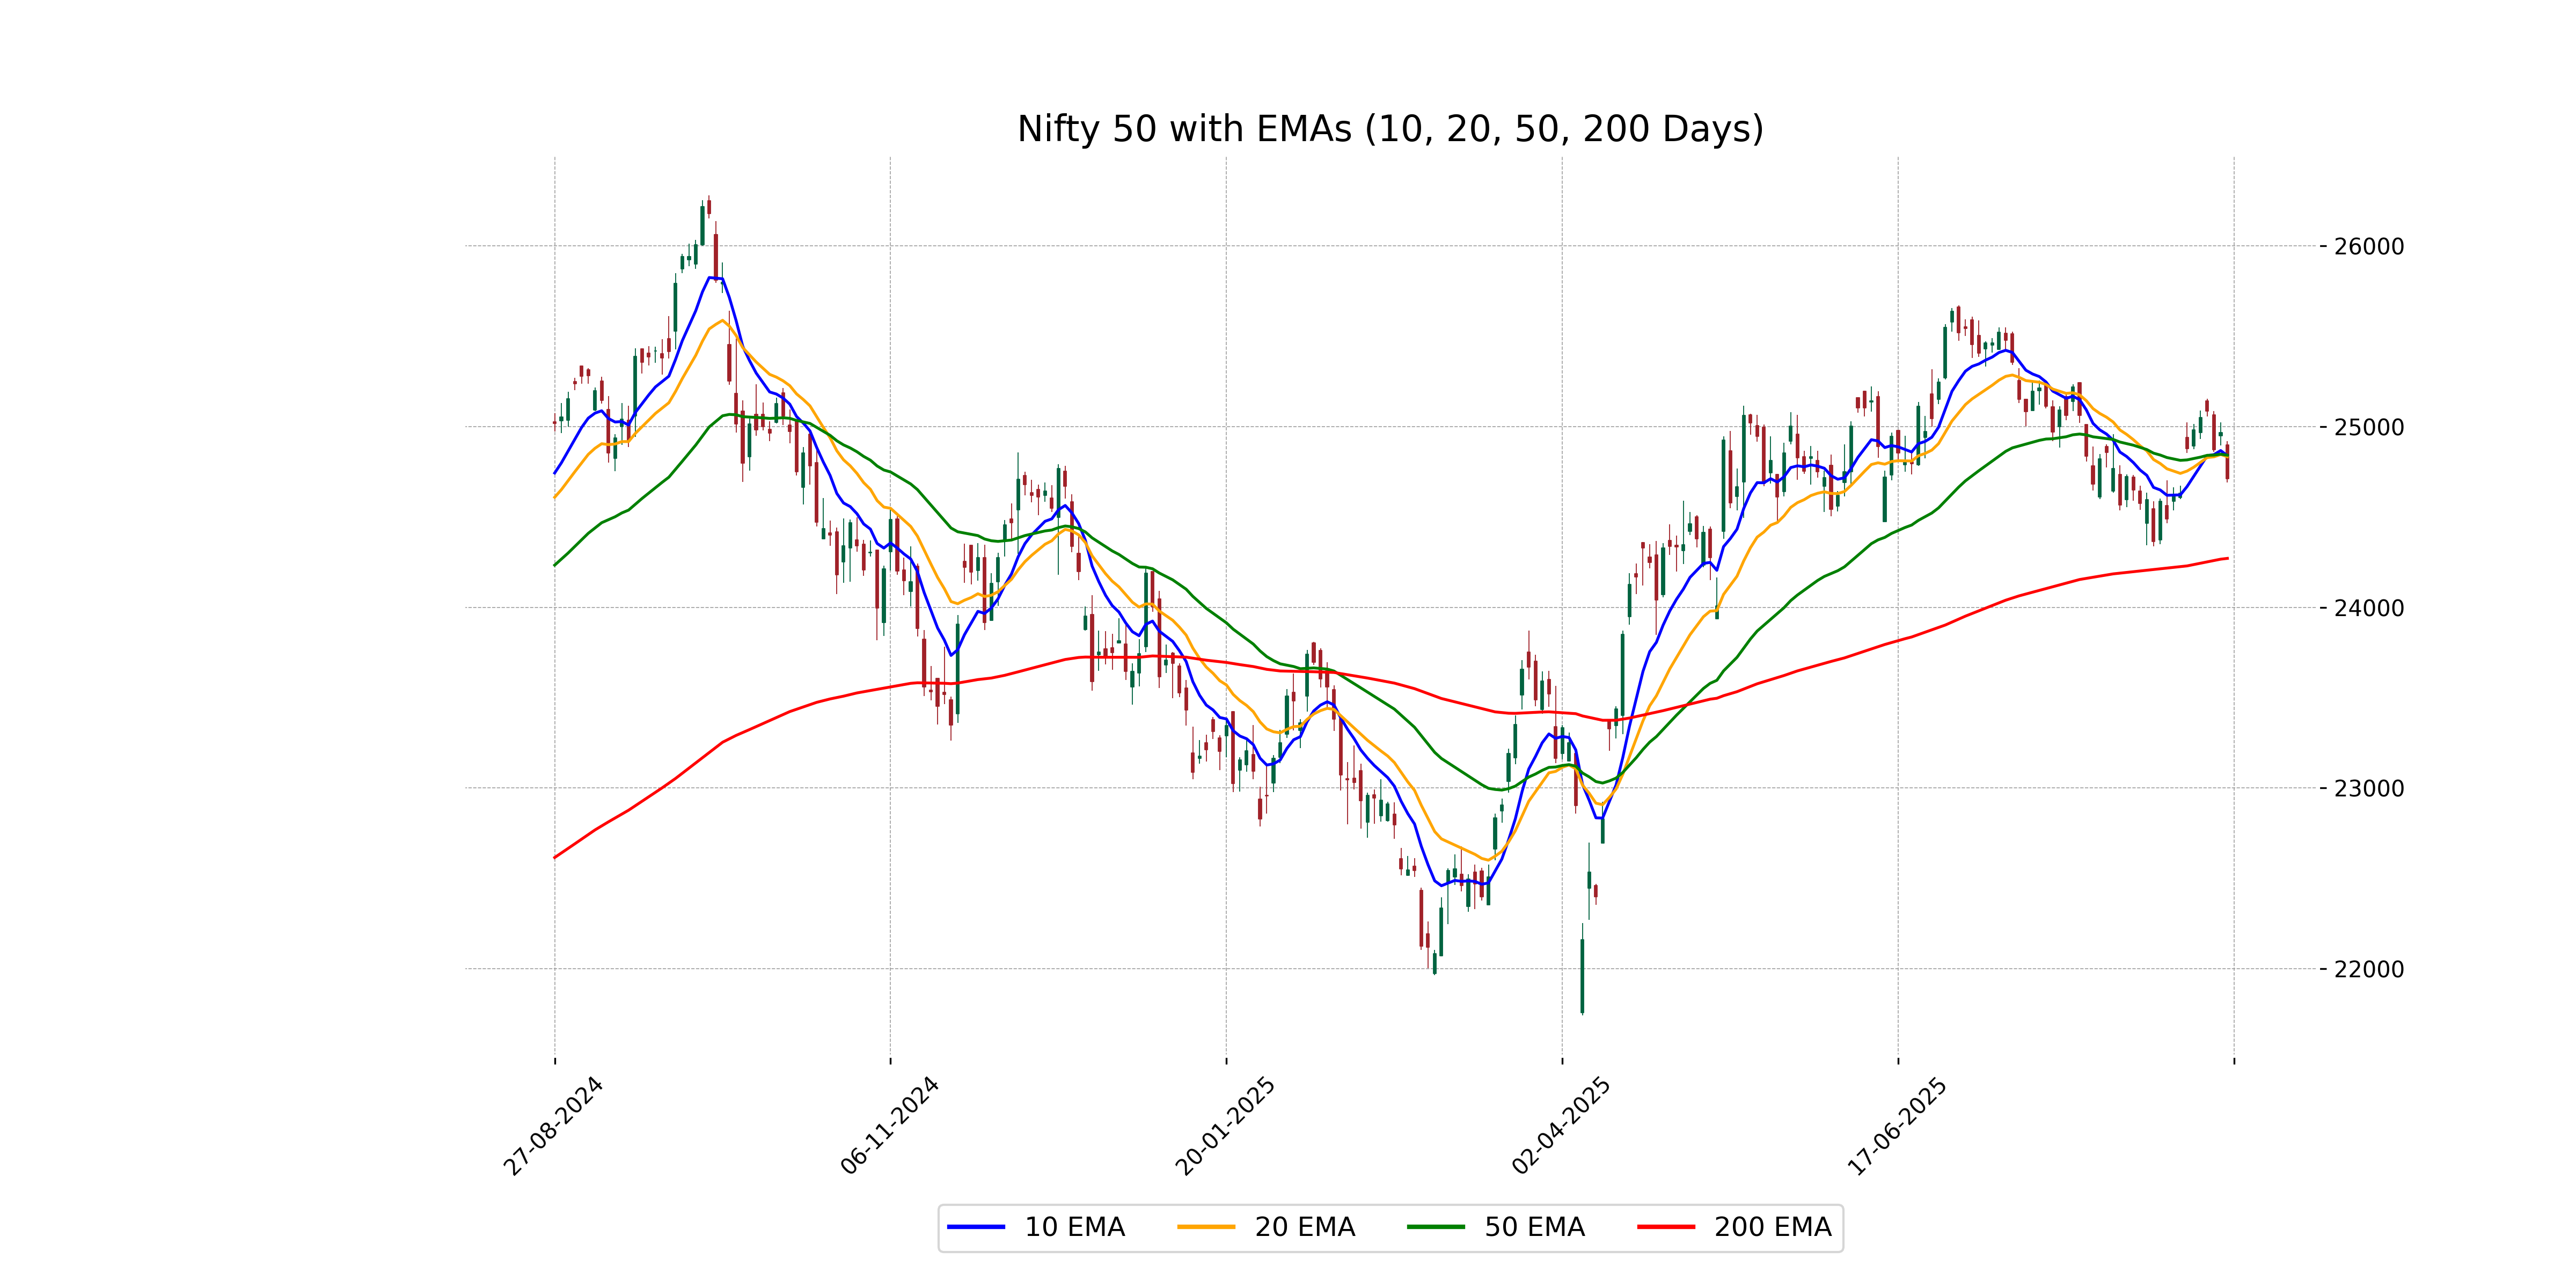
Relationship with Key Moving Averages
The Nifty 50 index, with a close of 24,712.05, is currently trading below its 50-day EMA of 24,841.29 and its 10-day EMA of 24,838.62, indicating a bearish trend. However, it remains above the 200-day EMA of 24,270.38, which may suggest long-term support.
Moving Averages Trend (MACD)
The MACD for Nifty 50 is currently negative at -16.18, which suggests that the index might be experiencing downward momentum. With the MACD signal being even more negative at -52.92, there could be a potential bearish trend continuation. This indicates a possible selling pressure in the near term.
RSI Analysis
Nifty 50 is currently showing an RSI of 45.92, which indicates that the index is neither overbought nor oversold. Typically, an RSI below 30 suggests oversold conditions, while an RSI above 70 indicates overbought levels. Therefore, the current RSI suggests a relatively neutral momentum for Nifty 50.
Up Next

Indian stock market sector-wise performance today - August 26, 2025

Step-by-step guide to apply for a mortgage loan online with minimal documentation

Honda Activa 6G: Everything You Need to Know Before Buying

How much does a ULIP plan really cost? A break-down of all charges

Centre plans to borrow Rs 8.20 lakh cr from market in first half of FY27

Reliance denies buying Iranian oil amid US sanctions waiver

More videos

Premium petrol price up Rs 2, industrial diesel up Rs 22; no change in normal petrol, diesel rates

India's GDP expected to register over 8 pc growth in Sep-Dec: Report

Govt announces seven measures to help boost exports

RBI keeps interest rates on hold after US trade deal boosts outlook

RBI proposes to compensate customers up to Rs 25,000 loss due to fraud

RBI raises GDP growth projection of Q1, Q2 of FY27

RBI pauses rate cuts, retains interest rate at 5.25 pc

Rupee jumps 122 paise to close at 90.27 against US dollar on India-US trade deal

Stock markets cheer India-US trade deal: Sensex, Nifty surge 2.5 pc

UPI transactions hit record high of Rs 230 lakh crore in 2025-26 till Dec: Govt