


Highlights
- SENSEX slightly down by 0.06%, closing at 80242
- Nifty Bank decreased by 0.55%, losing 304 points
- Nifty Auto gained 0.04%, closing at 22308
Latest news

Samsung Galaxy Z Fold 8, Fold 8 Ultra & Z Flip 8: A More Mature Foldable Family

Dell Launches New Alienware 16X Aurora, 16 Area-51 and 18 Area-51 Gaming Laptops in India

Samsung Takes on Premium Home Audio With New Music Studio Series

The End of OxygenOS: OnePlus Confirms Shift to Oppo's ColorOS

Fujifilm Instax Mini Evo Cinema Review: A Hybrid Camera That Prints Memories Differently

iQOO Teases Z11 Lite With AI Tools, Military-Grade Durability and a 6500mAh Battery

Editorji Launches Hook Global, Its International Digital News Brand

Samsung's Bespoke AI ACs Focus on Humidity, Hygiene and Smarter Cooling
Indian stock market sector-wise performance today - April 30, 2025


On the recent trading session, the Indian stock market on Wednesday (April 30, 2025) exhibited mixed performance across various indices, with varying degrees of change noted in key sectors.
The BSE Sensex saw a marginal decline, ending the session with a decrease of -0.06%. This negligible drop indicates a day of relatively stable movement with minimal fluctuation in the broader market index.
Similarly, the Nifty index also witnessed a minor decline, closing with a modest -0.01% change. In sector-specific developments, the Nifty Auto index demonstrated resilience, managing to finish the session up by +0.04%.
This slight increase reflects a positive sentiment in the auto sector amidst a largely stagnant market environment.
Meanwhile, the Nifty Infra index also showed a positive movement, rising by +0.25%, hinting at potential growth and investments in infrastructure-related activities.
Conversely, the Nifty Energy index experienced a notable downturn, falling by -0.57%. This significant decline marks it as one of the most affected sectors of the day.
The decline in energy stocks can be attributed to fluctuating crude oil prices and evolving policy announcements impacting investor confidence.
The Nifty IT sector recorded a decline of -0.35%. This drop might be associated with global tech stock trends and evolving challenges in the technology landscape, which often reflect on the IT index's performance.
The FMCG and Metal sectors, represented by Nifty FMCG and Nifty Metal, saw decreases of -0.05% and -0.29% respectively. The decline in FMCG could be linked to changes in consumer demand and pricing pressures, while the drop in Metal may be influenced by global commodity price changes and demand forecasts.
Among financial indices, the Bank Nifty index also showed a downward trend, closing with a -0.55% change. This movement may be reflective of investor apprehensions about interest rate adjustments and economic policy changes affecting the banking sector.
Overall, the trading day was marked by mixed movements with certain sectors showing resilience while others faced pressure. The distinct decline in the Nifty Energy sector stands out, potentially driven by external market dependencies and domestic economic factors.
This highlights an ongoing need for investors to stay informed about sector-specific dynamics and broader economic influences.

Analysis for Sensex - April 30, 2025

Sensex Performance: The stock opened at 80,370.80, reached a high of 80,525.61 and a low of 79,879.15, closing slightly lower at 80,242.24 compared to the previous close of 80,288.38, marking a slight decline of 0.06%. The RSI stands at 65.64, indicating a relatively strong market, while MACD shows a positive difference from its signal line, suggesting bullish momentum.
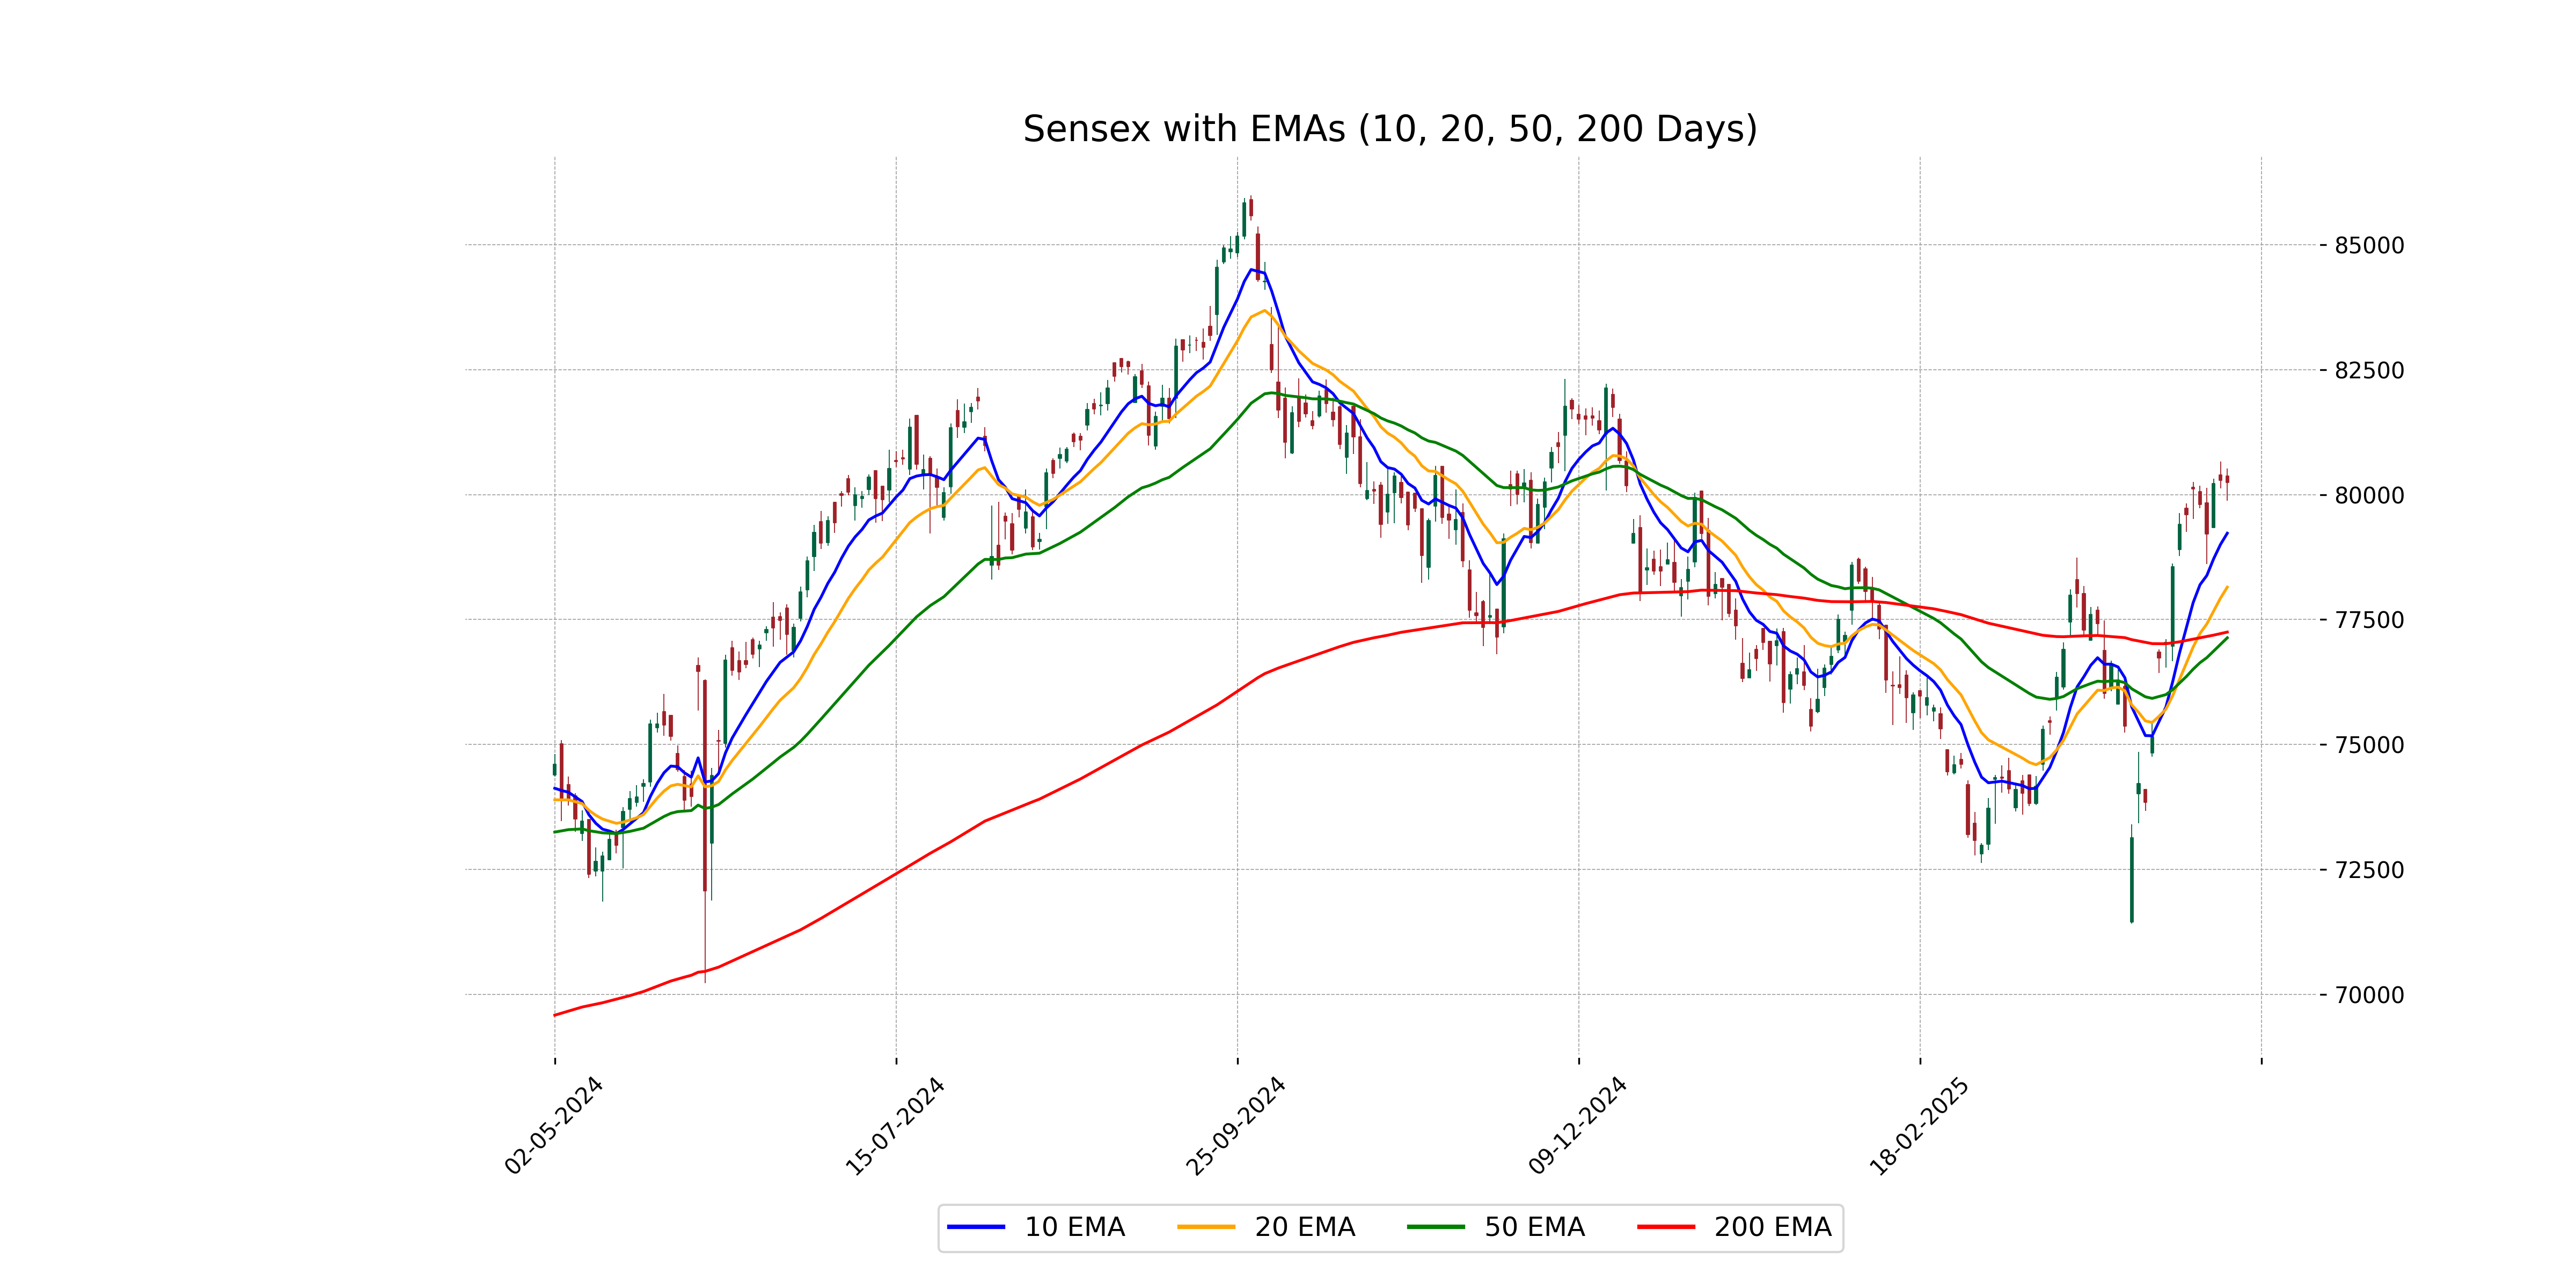
Relationship with Key Moving Averages
The close of Sensex at 80242.24 is above its 10 EMA (79226.77), 20 EMA (78148.50), 50 EMA (77135.70), and 200 EMA (77250.05), indicating a strong upward trend relative to these key moving averages. The current RSI of 65.64 suggests that the market is approaching overbought conditions.
Moving Averages Trend (MACD)
Based on the provided data, the MACD for Sensex is 1209.16, which is above its signal line of 880.01. This suggests a bullish momentum, indicating that the trend may continue upward. However, it's essential to consider other indicators and market conditions for a comprehensive analysis.

RSI Analysis
RSI Analysis for Sensex: The RSI value of 65.64 indicates that Sensex is approaching overbought territory, suggesting a potential for a price pullback or correction. However, it is still below the overbought threshold of 70, allowing room for continued upward momentum if buying pressure persists.

Analysis for Nifty Auto - April 30, 2025

Nifty Auto opened at 22,306.15, reached a high of 22,389.25, and closed slightly up at 22,308.40 with a minor percentage change of 0.0419% from the previous close of 22,299.05. The Relative Strength Index (RSI) is at 60.79, indicating a moderately strong performance. The MACD value of 282.28 suggests a positive trend, with the MACD Signal at 128.51.

Relationship with Key Moving Averages
The Nifty Auto index closed slightly above its previous close with a small positive change of approximately 0.042%. The closing price is higher than the 10 EMA (Exponential Moving Average) of 21,975.21 and the 50 EMA of 21,679.21, indicating a short-term bullish trend. However, it remains below the 200 EMA of 22,521.85, suggesting a potential long-term resistance.
Moving Averages Trend (MACD)
The MACD value for Nifty Auto is 282.28, which is significantly higher than the MACD Signal of 128.51. This indicates a bullish trend as the MACD line is above the signal line, suggesting potential upward momentum in the index.

RSI Analysis
The Relative Strength Index (RSI) for Nifty Auto is 60.79, indicating neither overbought nor oversold conditions, but leaning towards a slightly bullish momentum as it is above the midpoint of 50. As the RSI remains below 70, there is room for further upward movement before reaching overbought conditions.

Analysis for Nifty Energy - April 30, 2025

Nifty Energy Performance The Nifty Energy index opened at 34,476.80 and closed at 34,241.60, indicating a decline of 197.15 points or -0.57% compared to the previous close. The index's RSI of 57.50 suggests it's in a neutral zone, while the MACD of 541.05 indicates a positive trend, as it is above the signal line of 470.29.

Relationship with Key Moving Averages
Nifty Energy closed at 34,241.60, which is above its 10-day EMA of 34,117.31 and significantly higher than the 50-day EMA of 33,255.59, but below the 200-day EMA of 35,479.65. This indicates a short-term upward momentum but a potential longer-term bearish trend given the position relative to the 200-day EMA.
Moving Averages Trend (MACD)
MACD Analysis for Nifty Energy: The MACD value of 541.05 is above the MACD Signal value of 470.29, indicating a bullish trend in momentum for Nifty Energy. This suggests potential upward movement in the price, although other factors should be considered for a comprehensive analysis.

RSI Analysis
The RSI for Nifty Energy is 57.50, which is in the neutral zone. This suggests that the stock is neither overbought nor oversold, indicating a balanced momentum in recent trading sessions.

Analysis for Nifty FMCG - April 30, 2025

Nifty FMCG opened at 56,492 and closed slightly lower at 56,445.35, marking a small drop of 0.0516% as the index experienced a point change of -29.15. The 50 EMA and 200 EMA indicate a generally upward trend with values at 54,783.85 and 56,141.99, respectively, while the RSI stands at 62.40, suggesting the index is still not in overbought territory.

Relationship with Key Moving Averages
For Nifty FMCG, the current close of 56,445.35 is below the 50 EMA of 54,783.85 but above the 200 EMA of 56,141.99, indicating a mixed trend with a long-term bullish inclination. Additionally, it is above the 10 EMA of 56,353.96 and the 20 EMA of 55,622.02, suggesting short-term bullish momentum.
Moving Averages Trend (MACD)
The MACD for Nifty FMCG is currently at 929.10, which is above the MACD Signal line at 910.12, suggesting a bullish trend. This indicates that momentum is in favor of buyers, but the slight negative price change today should be monitored for any potential shifts in trend direction.

RSI Analysis
The Relative Strength Index (RSI) for Nifty FMCG is 62.40, indicating a moderately strong momentum for the stock. It is below the typical overbought threshold of 70, suggesting there might still be room for upward movement before reaching overbought conditions.

Analysis for Nifty Infra - April 30, 2025

Nifty Infra Performance: Nifty Infra opened at 8783.95 and closed at 8785.85, resulting in a slight gain with a percentage change of 0.25% from the previous close of 8763.85. The index showed a range-bound movement with a high of 8820.40 and a low of 8707.15. The Relative Strength Index (RSI) stands at 64.23, suggesting a bullish momentum. The index's MACD is above the signal line, indicating a positive trend continuation.

Relationship with Key Moving Averages
Nifty Infra closed at 8785.85, which is above its 50 EMA of 8374.78 and 200 EMA of 8421.65, indicating a potential bullish trend. It also remains above its 10 EMA of 8659.73 and 20 EMA of 8533.94, suggesting continued short-term upward momentum.
Moving Averages Trend (MACD)
The MACD value for Nifty Infra is 152.26 with a signal line of 128.13, indicating a bullish trend as the MACD is above the signal line. This suggests growing momentum in the stock's price movement.

RSI Analysis
Based on the given data, Nifty Infra has an RSI of 64.23, which suggests that the index is approaching the overbought territory but is still under the 70 threshold that typically indicates an overbought condition. This could imply potential continued upward momentum, but caution should be exercised for any signs of reversal.

Analysis for Nifty IT - April 30, 2025

Nifty IT opened at 35,913.70, reaching a high of 36,206.55 and a low of 35,440.80, before closing slightly down at 35,794.95. The index experienced a minor decline, with a percentage change of -0.35% and a points decrease of 125.45. Despite the drop, the RSI suggests a neutral momentum, while the MACD indicates a potential bearish trend.

Relationship with Key Moving Averages
Nifty IT closed at 35794.95, which is below both its 50-day EMA of 36764.84 and 200-day EMA of 39080.72, indicating a bearish trend in the short to medium term. However, it remains above its 10-day and 20-day EMAs, signaling potential short-term strength.
Moving Averages Trend (MACD)
MACD Analysis for Nifty IT: The MACD value is -359.28, which is above the MACD Signal line at -796.48, indicating a potential upward momentum or a bullish crossover. However, the negative MACD value suggests that the overall trend might still be bearish, and caution is advised.

RSI Analysis
Based on the data provided, the RSI for Nifty IT stands at 52.91. This indicates a neutral momentum as it is close to the midpoint of the RSI scale, suggesting there is no strong overbought or oversold condition in the current market trend for this index.

Analysis for Nifty Metal - April 30, 2025

Nifty Metal opened at 8600.84, experienced a high of 8666.15, and closed at 8581.80. The index saw a slight decrease of 0.29% compared to the previous close of 8607.15, indicating minor bearish sentiment. With an RSI of 48.75 and a MACD of -22.11, it suggests moderate selling pressure.

Relationship with Key Moving Averages
The Nifty Metal index closed at 8581.80, which is below its 50 EMA of 8640.13 and 200 EMA of 8771.01, indicating a short-term bearish trend. However, it is slightly below its 10 EMA of 8599.64 and 20 EMA of 8610.43, suggesting a potential reversal or consolidation in the near term.
Moving Averages Trend (MACD)
The MACD for Nifty Metal is -22.11, while the MACD Signal is -41.60. This indicates a bullish signal as the MACD line is above the Signal line; however, both values being negative suggests a bearish trend might still be in effect. The weak momentum indicates caution despite the potential bullish crossover.

RSI Analysis
Based on the RSI value of 48.75, Nifty Metal is currently in a neutral zone, suggesting a lack of strong momentum in either direction. The RSI is slightly below the midpoint, indicating that the stock is neither overbought nor oversold, but it might be slightly leaning towards a bearish sentiment. This could suggest monitoring for potential trend changes.

Analysis for Nifty Bank - April 30, 2025

Nifty Bank opened at 55382.40, reached a high of 55478.25, and a low of 54723.70, closing at 55087.15. It saw a decrease of 0.55% from the previous close of 55391.25, with a points change of -304.10. The RSI is at 67.00, indicating potential overbought conditions, while MACD suggests bullish momentum compared to its signal line.

Relationship with Key Moving Averages
Nifty Bank closed at 55087.15, slightly below its 10_EMA of 54568.99, and significantly above both its 50_EMA of 51737.06 and 200_EMA of 50545.77, indicating a relatively strong short-term upside momentum. The positive MACD against its signal line further supports this bullish sentiment.
Moving Averages Trend (MACD)
Based on the data provided for Nifty Bank, the MACD value of 1414.12 is above the MACD Signal value of 1257.36, which suggests a bullish momentum in the market. This indicates that the recent trend for Nifty Bank may continue upwards, although it is important to watch for any divergence that could indicate a potential reversal.

RSI Analysis
The RSI (Relative Strength Index) for Nifty Bank is 67.0, indicating a relatively strong position, close to the overbought threshold of 70. This suggests a potential slowdown or change in momentum, although it is still below the overbought level. Keep an eye on price movements for possible corrections if the RSI moves higher.

Analysis for Nifty 50 - April 30, 2025

### Nifty 50 Performance The Nifty 50 index experienced a minor decline, closing at 24334.20, down by 1.75 points from the previous close of 24335.95, marking a negligible percentage change. Despite the slight dip, the RSI suggests a moderately strong momentum at 64.99, indicating that the index is not currently in overbought or oversold territory.

Relationship with Key Moving Averages
Nifty 50 is currently trading at a closing price of 24334.20. This price is significantly above its 50-day EMA of 23404.03 and its 200-day EMA of 23438.90, indicating a bullish trend in the longer-term. The 10-day EMA of 24044.50 and 20-day EMA of 23723.71 also suggest short-term positive momentum.
Moving Averages Trend (MACD)
The MACD for Nifty 50 is 364.50, which is above the MACD Signal of 273.01, indicating a potential bullish trend. This positive divergence suggests momentum could be in favor of an upward price movement.

RSI Analysis
The RSI value for Nifty 50 is 64.9976, which is close to the typical overbought threshold of 70. This indicates that the stock index is nearing overbought conditions, suggesting potential resistance to further upward price movement or a possible trend reversal.

Up Next

Indian stock market sector-wise performance today - April 30, 2025

Step-by-step guide to apply for a mortgage loan online with minimal documentation

Honda Activa 6G: Everything You Need to Know Before Buying

How much does a ULIP plan really cost? A break-down of all charges

Centre plans to borrow Rs 8.20 lakh cr from market in first half of FY27

Reliance denies buying Iranian oil amid US sanctions waiver

More videos

Premium petrol price up Rs 2, industrial diesel up Rs 22; no change in normal petrol, diesel rates

India's GDP expected to register over 8 pc growth in Sep-Dec: Report

Govt announces seven measures to help boost exports

RBI keeps interest rates on hold after US trade deal boosts outlook

RBI proposes to compensate customers up to Rs 25,000 loss due to fraud

RBI raises GDP growth projection of Q1, Q2 of FY27

RBI pauses rate cuts, retains interest rate at 5.25 pc

Rupee jumps 122 paise to close at 90.27 against US dollar on India-US trade deal

Stock markets cheer India-US trade deal: Sensex, Nifty surge 2.5 pc

UPI transactions hit record high of Rs 230 lakh crore in 2025-26 till Dec: Govt