


Highlights
- Nifty IT showed a slight decline of 0.22%
- Nifty Infra led gains with an increase of 1.99%
- Nifty Bank surged by 1.41%, reflecting strong upward momentum
Latest news

Samsung Galaxy Z Fold 8, Fold 8 Ultra & Z Flip 8: A More Mature Foldable Family

Dell Launches New Alienware 16X Aurora, 16 Area-51 and 18 Area-51 Gaming Laptops in India

Samsung Takes on Premium Home Audio With New Music Studio Series

The End of OxygenOS: OnePlus Confirms Shift to Oppo's ColorOS

Fujifilm Instax Mini Evo Cinema Review: A Hybrid Camera That Prints Memories Differently

iQOO Teases Z11 Lite With AI Tools, Military-Grade Durability and a 6500mAh Battery

Editorji Launches Hook Global, Its International Digital News Brand

Samsung's Bespoke AI ACs Focus on Humidity, Hygiene and Smarter Cooling
Indian stock market sector-wise performance today - April 28, 2025


The stock market on Monday (April 28, 2025) experienced a notable upswing, with several key indices showing considerable shifts.
Among the various sectors, Nifty Infrastructure led the rally with a significant percentage increase of 1.99%. This was closely followed by Nifty Energy, which witnessed an impressive gain of 1.71%.
A detailed look at the individual performances further reveals the buoyancy in the market. The Sensex, one of the primary indices, climbed by 1.27%, reflecting a general positive sentiment.
Nifty Auto and Nifty Bank also made noteworthy strides, with improvements of 1.63% and 1.41% respectively, indicating robust performance in automotive and banking stocks.
On the downside, Nifty IT was the only index to post a decline, albeit a modest one at 0.22%, suggesting some specific challenges in the information technology sector that day. This rally was largely supported by Nifty Infrastructure's stellar performance, marking it as one of the best performers.
The sector's heightened activity and positive sentiment could potentially be ascribed to increased infrastructure investments and government initiatives aimed at boosting economic development.
Additionally, Nifty Energy's substantial gains were fueled by upward movements in energy prices, possibly linked to the global adjustments in crude oil prices and domestic policy changes related to energy tariffs.
Overall, the positive trends across most sectors indicate a buoyant market environment, bolstered by economic optimism and supportive fiscal measures.
While Nifty IT presents an outlier with a slight dip, the broader market momentum continues to remain strong, setting a positive tone for future trading sessions.

Analysis for Sensex - April 28, 2025

Stock Name: BSESN Performance Summary: The Sensex opened at 79,343.63, reached a high of 80,321.88, and closed at 80,218.37, marking a percentage change of 1.27% with a points increase of 1,005.84 from the previous close. The Relative Strength Index (RSI) indicates a value of 65.73, suggesting a moderately strong momentum. With a MACD of 1,110.43 versus a signal of 703.31, the trend seems bullish.

Relationship with Key Moving Averages
The Sensex closed at 80,218.37, which is above its 10-day EMA of 78,715.05, 20-day EMA of 77,679.66, 50-day EMA of 76,875.04, and 200-day EMA of 77,188.59. This indicates a positive trend, as the index is trading above all these key moving averages.
Moving Averages Trend (MACD)
The MACD for Sensex stands at 1110.43, which is significantly above the MACD Signal of 703.31, suggesting a bullish trend. This indicates positive momentum and the potential for continued upward movement in the stock market.

RSI Analysis
RSI Analysis for Sensex: The Relative Strength Index (RSI) for the Sensex is 65.73, which suggests that the market is approaching the overbought territory. While it indicates a strong upward momentum, investors should be cautious as a further increase could imply an overbought condition, possibly preceding a pullback.

Analysis for Nifty Auto - April 28, 2025

Nifty Auto opened at 22,003.45, reached a high of 22,427.15, and closed at 22,352.95, up 1.63% from the previous close of 21,994.50. It experienced a points change of 358.45, with a strong RSI of 61.56 indicating positive momentum. Despite a volume of 0.0, its position above the 10 and 50 EMA suggests a bullish trend, though it remains slightly below the 200 EMA.

Relationship with Key Moving Averages
Nifty Auto closed at 22352.95, which is above both its 10 EMA (21812.75) and 50 EMA (21627.19), indicating a bullish short to medium-term trend. However, it is still below the 200 EMA (22526.02), suggesting that the longer-term trend may still be bearish despite the recent upward momentum.
Moving Averages Trend (MACD)
Nifty Auto's MACD indicator is showing a value of 234.18, significantly above the MACD Signal line of 46.99. This suggests strong bullish momentum in the current trend. With the MACD line being much higher than the Signal line, it indicates a potential continuation of the upward movement.

RSI Analysis
The RSI for Nifty Auto is 61.56, which indicates that the stock is in a neutral zone and not overbought or oversold. This suggests a balanced market condition, with the possibility of further upward movement if momentum continues. Further analysis with other indicators can provide a clearer direction.

Analysis for Nifty Energy - April 28, 2025

Nifty Energy opened at 33,944.70 and closed at 34,538.85, resulting in a gain of 582.35 points, or a 1.71% increase from the previous close. The current RSI of 60.59 suggests a moderately strong performance, while the MACD indicates a bullish trend as it is above the signal line.

Relationship with Key Moving Averages
The Nifty Energy index closed above its 50 EMA and 20 EMA, indicating a short-term bullish trend as it has also surpassed the 10 EMA. However, it remains below the 200 EMA, suggesting a longer-term bearish sentiment still prevails. The current RSI of 60.59 supports a positive momentum without overbought conditions.
Moving Averages Trend (MACD)
The MACD for Nifty Energy is bullish as it is above the signal line, with a MACD value of 559.68 compared to the signal line value of 425.33. This indicates a potential upward momentum in the stock price. Additionally, the current RSI of 60.59 suggests moderate buying pressure.

RSI Analysis
The relative strength index (RSI) for Nifty Energy stands at 60.59, suggesting that the stock is currently in a neutral to moderately strong position. An RSI value between 50 and 70 generally indicates strength, signaling that the stock might be experiencing bullish momentum without reaching overbought conditions.

Analysis for Nifty FMCG - April 28, 2025

Nifty FMCG opened at 56432.95 and closed higher at 56620.30, reflecting a modest gain of 0.16%. The closing price represents an increase of 87.95 points from the previous close of 56532.35. The RSI is at 64.41, indicating a potentially strong momentum, while the MACD suggests a bullish trend with a value greater than the signal line.

Relationship with Key Moving Averages
For Nifty FMCG, the current closing price of 56,620.30 is above the 10 EMA (56,302.35) and the 200 EMA (56,135.22), indicating a strong upward trend. Additionally, it is also well above the 50 EMA (54,644.26), supporting a bullish momentum in the short to medium term.
Moving Averages Trend (MACD)
The MACD for Nifty FMCG is at 1026.60, which is above the MACD Signal line at 886.84, indicating a bullish momentum. The positive divergence suggests that the stock might continue to experience upward pressure.

RSI Analysis
Nifty FMCG RSI Analysis: The RSI value for Nifty FMCG is 64.41, which suggests a bullish trend as it is above the neutral 50 level. However, since it is below 70, it indicates the stock is not yet in the overbought territory, providing room for potential further upward movement.

Analysis for Nifty Infra - April 28, 2025
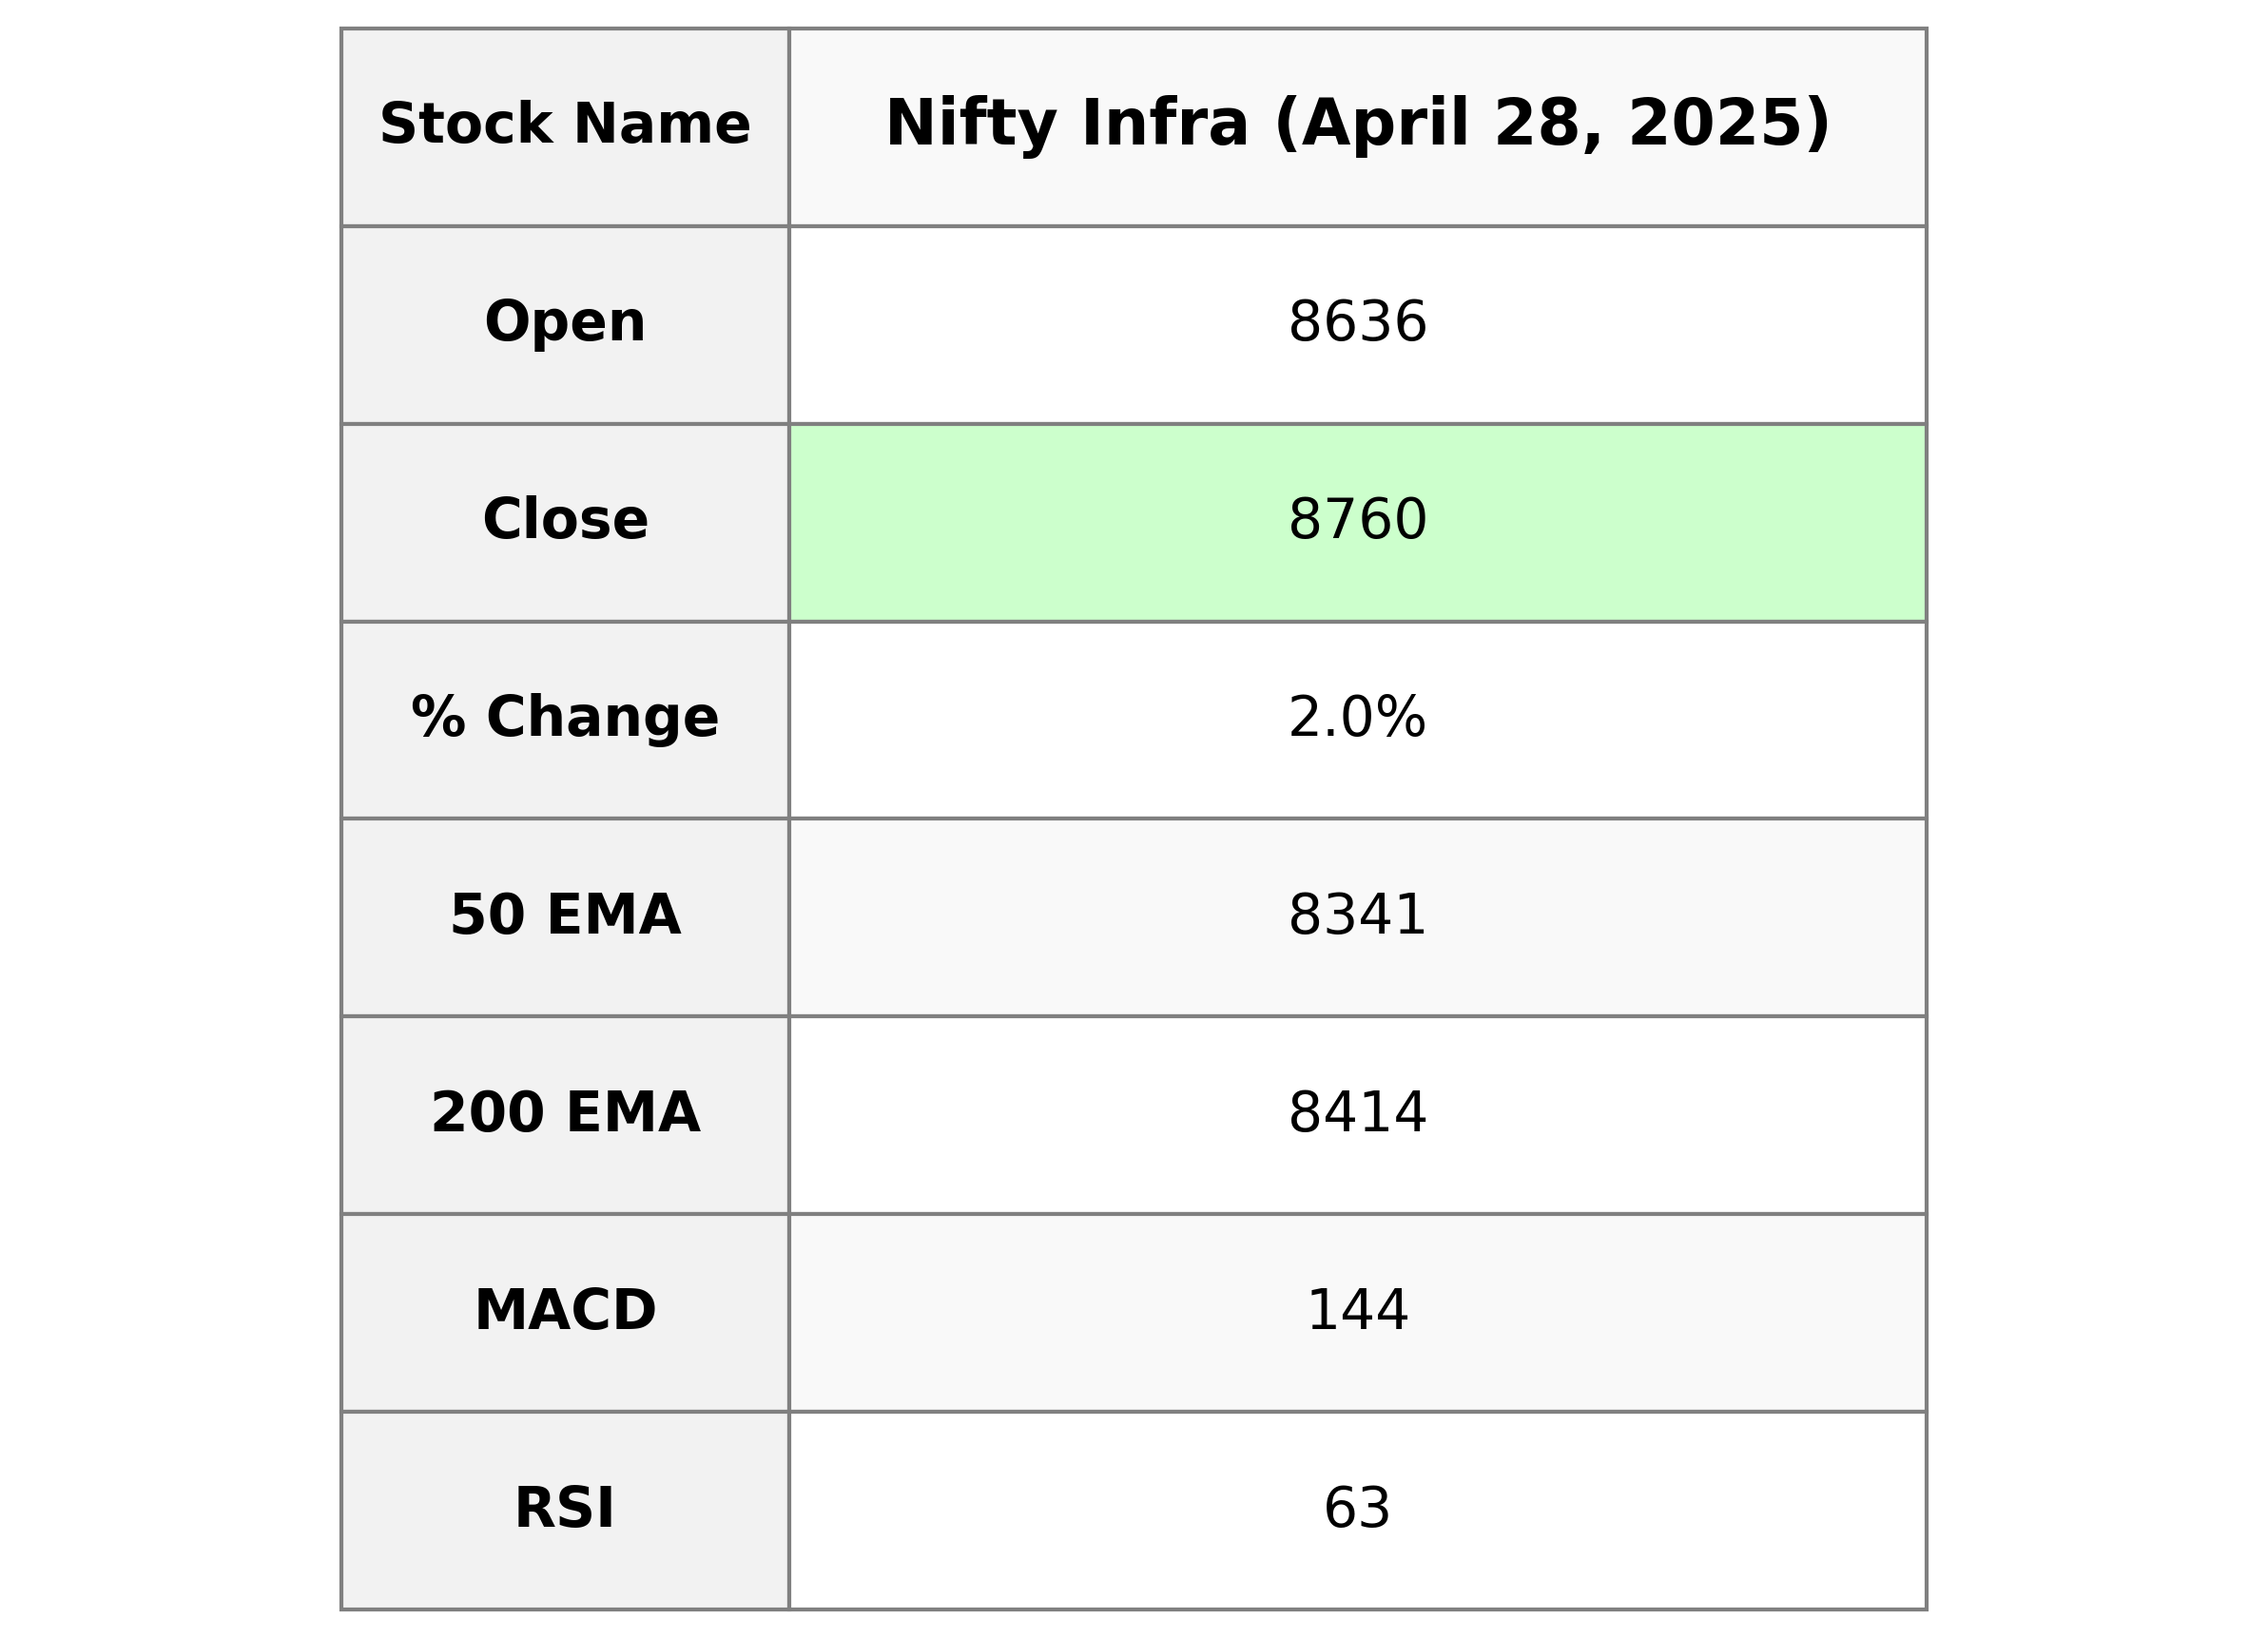
Nifty Infra opened at 8636.20, reached a high of 8777.5, and closed at 8759.85, showcasing a positive movement with a % change of 1.99% and a points change of 170.55. The RSI indicates a moderately strong position at 63.44, with the MACD above the signal line, suggesting a bullish momentum. Despite the absence of volume data, the EMAs indicate a stable upward trend.

Relationship with Key Moving Averages
The closing value of Nifty Infra at 8759.85 is above its 50 EMA of 8341.44, 200 EMA of 8414.42, 10 EMA of 8602.34, and 20 EMA of 8480.43, indicating a strong upward trend. The presence of an RSI of 63.44, above the neutral 50 level, suggests positive momentum, while the MACD value of 144.19 greater than the signal line of 115.45 further supports bullish sentiment.
Moving Averages Trend (MACD)
Based on the provided data, Nifty Infra's MACD value is 144.19, which is above the MACD Signal line at 115.45, indicating a bullish trend. The positive MACD crossover suggests potential upward momentum in the short term.

RSI Analysis
Based on the given data, Nifty Infra has an RSI of 63.44, indicating that the stock is in a strong position but approaching overbought levels. Typically, an RSI above 70 suggests overbought conditions, while below 30 suggests oversold. Thus, Nifty Infra is currently hovering in a moderately bullish zone.

Analysis for Nifty IT - April 28, 2025

Nifty IT opened at 35,541.55 and closed slightly lower at 35,482.95, marking a decrease of 0.22% or 79.3 points from the previous close. The index's RSI stands at 50.75, indicating a neutral stance, while MACD shows a mildly bearish sentiment with a value of -605.19. The EMAs suggest the index is currently trading below its 50-day and 200-day moving averages, hinting at potential resistance levels.

Relationship with Key Moving Averages
The Nifty IT index closed below its 50-day EMA of 36840.51 and 200-day EMA of 39145.66, indicating potential bearish sentiment in the short to long term. However, it remains above the 10-day EMA of 34744.04 and the 20-day EMA of 34974.68, suggesting a recent upward momentum possibly mitigating further downturn pressure.
Moving Averages Trend (MACD)
The MACD for Nifty IT is -605.19, which is above its signal line at -1016.06. This indicates a possible bullish momentum, suggesting a potential uptick in the short term despite the recent downtrend.

RSI Analysis
RSI Analysis for Nifty IT: The RSI for Nifty IT is 50.75, indicating a neutral position. This suggests the index is neither in overbought nor oversold territory, signaling a potential balance between bullish and bearish momentum.

Analysis for Nifty Metal - April 28, 2025

Nifty Metal opened at 8554.20 and closed at 8689.90, showing a gain with a percentage change of 1.40% and a points change of 120.15. The RSI value is 51.88, indicating a neutral position. The MACD is at -24.66, which suggests a potential bullish momentum as it is higher than the MACD Signal of -52.52.

Relationship with Key Moving Averages
The Nifty Metal index closed above its 50-day EMA of 8643.96, indicating bullish momentum in the short-term. However, it still remains below the 200-day EMA of 8774.50, suggesting potential long-term bearish sentiment until it crosses above this level. The proximity to the 10-day and 20-day EMAs indicates near-term price consolidation.
Moving Averages Trend (MACD)
Nifty Metal MACD Analysis: The MACD for Nifty Metal is currently -24.66, while the MACD Signal is -52.52. This indicates a bullish signal, as the MACD line is above the Signal line. The trend suggests potential for upward momentum, though it remains important to consider other indicators for a comprehensive market assessment.

RSI Analysis
The RSI value for Nifty Metal is 51.88, indicating a neutral market condition as it is close to the midpoint of 50. This suggests that the stock is neither overbought nor oversold at the moment.

Analysis for Nifty Bank - April 28, 2025
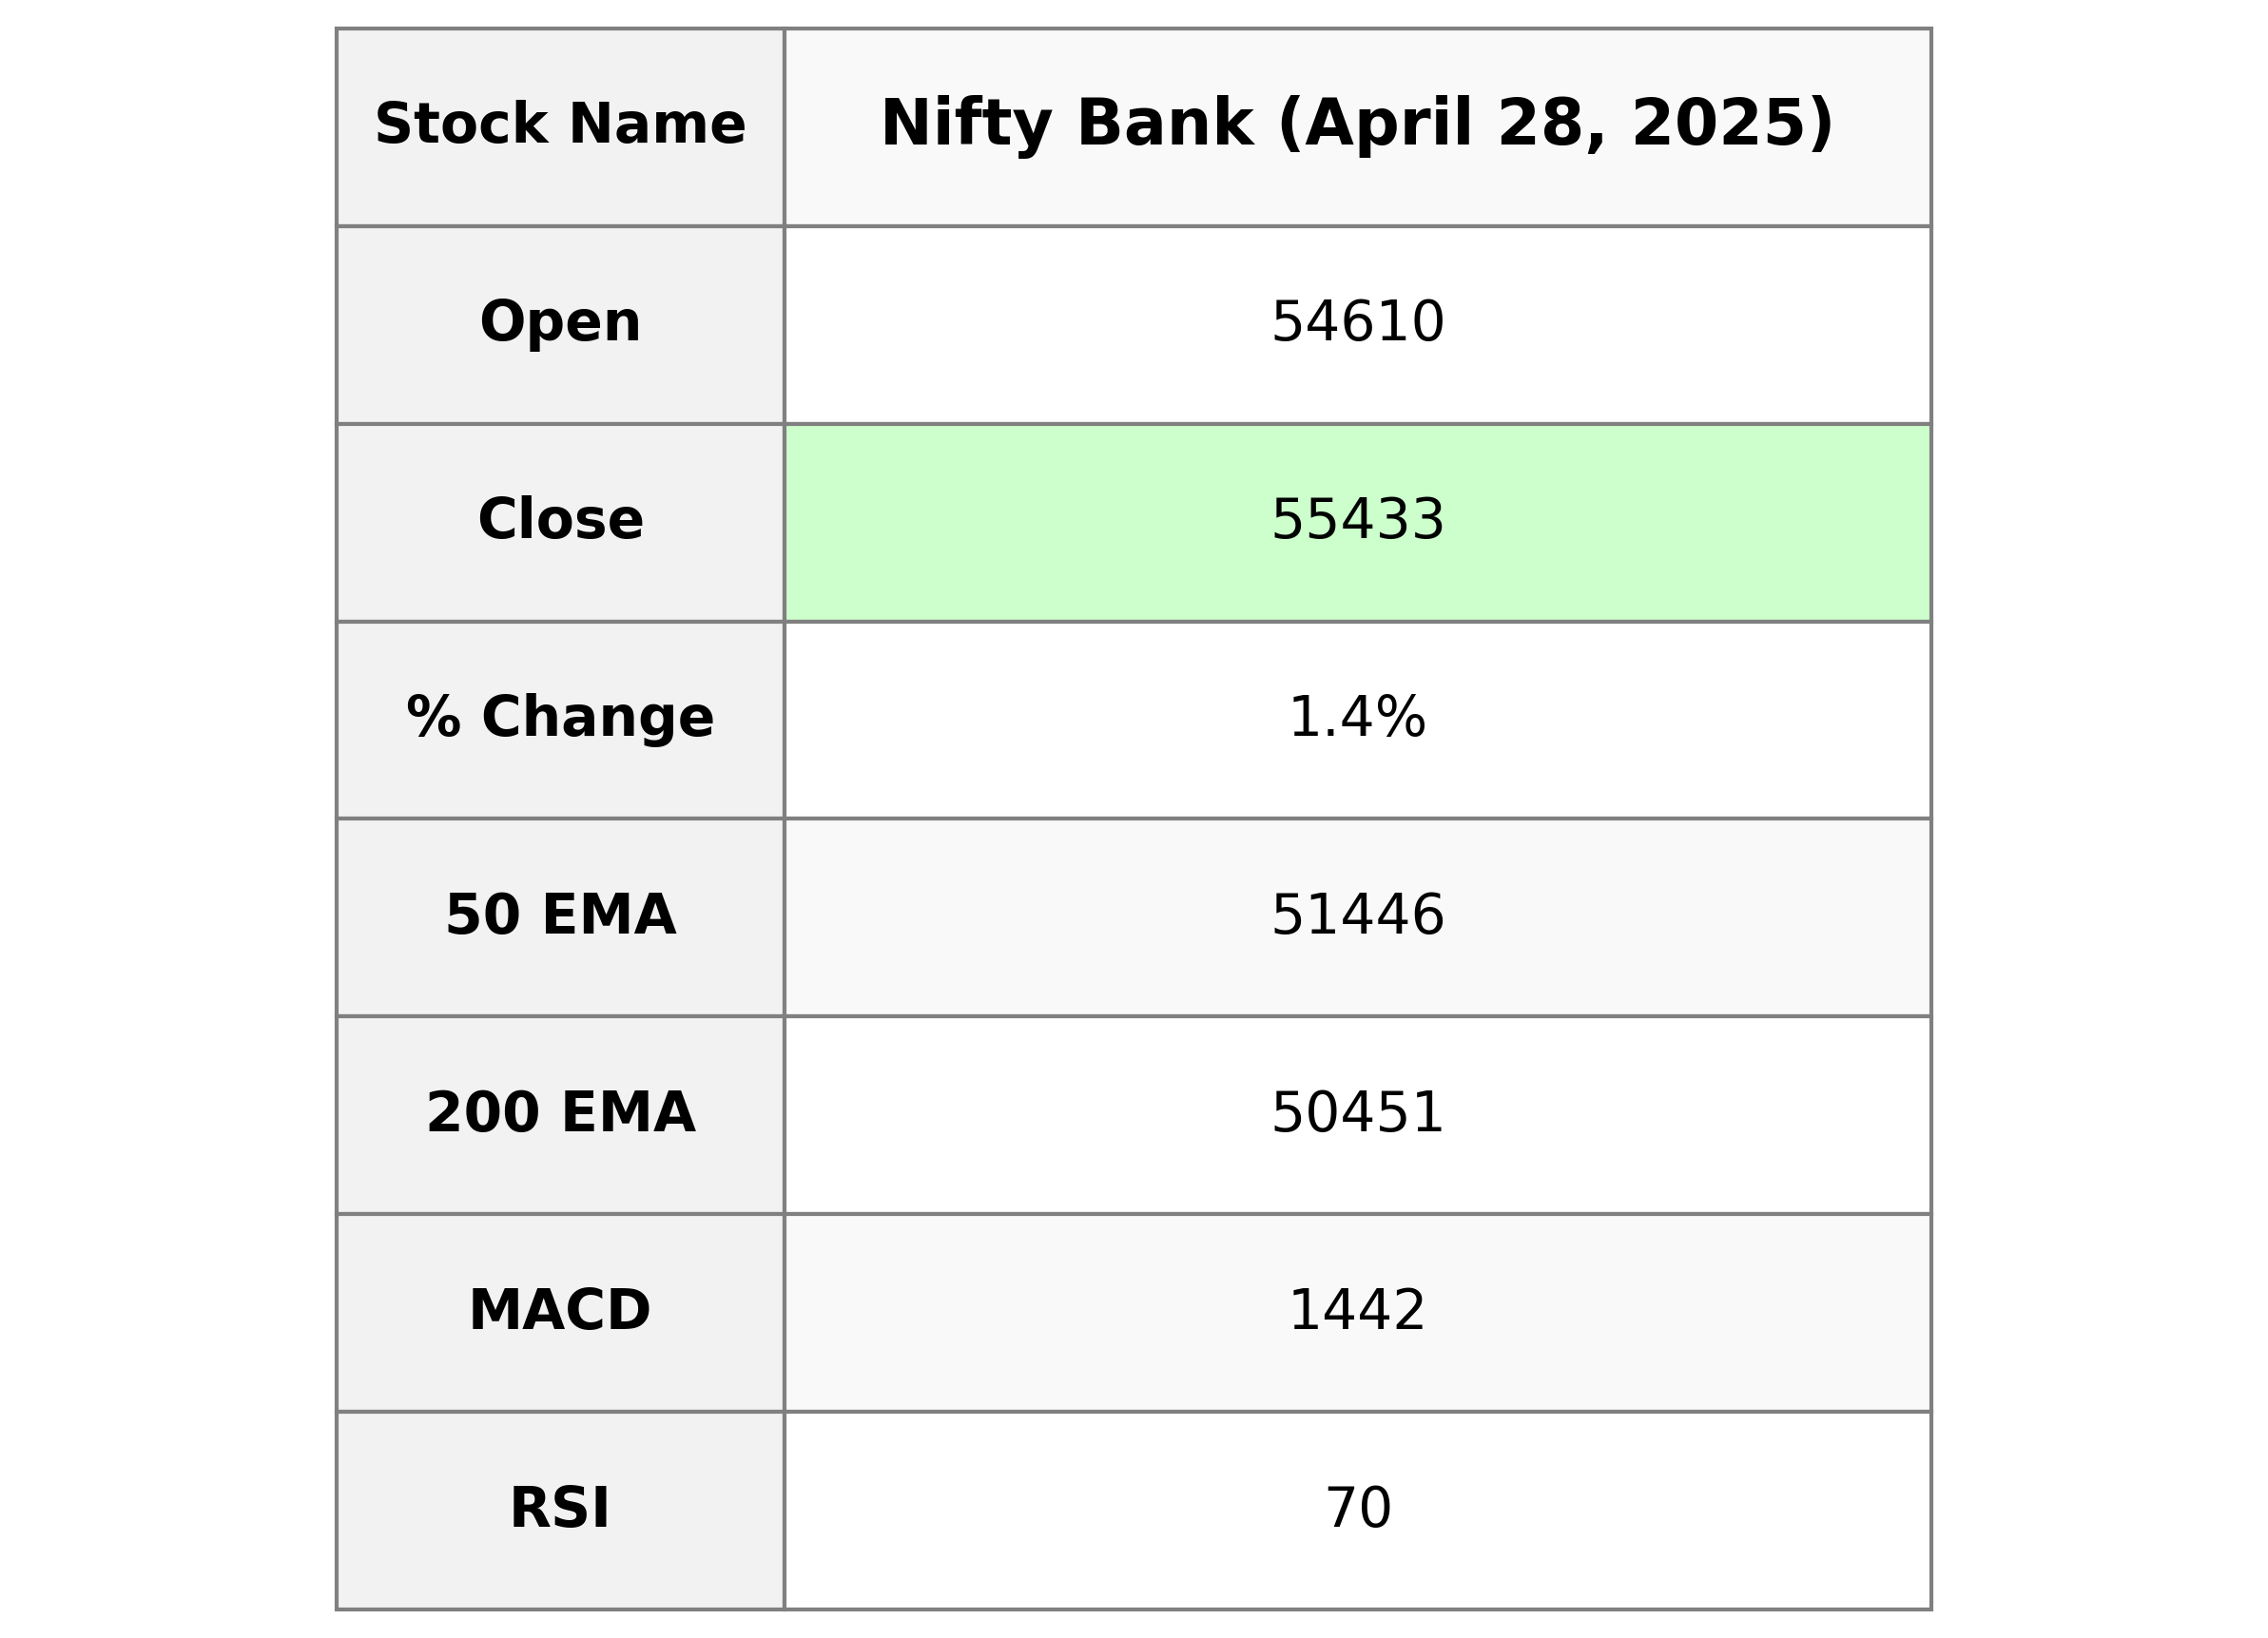
Nifty Bank opened at 54610.3, reaching a high of 55577.4 and a low of 54582.4, closing at 55432.8, reflecting a 1.41% increase with a points change of 768.75 from the previous close. Technical indicators like a Relative Strength Index (RSI) of 70.37 suggest overbought conditions, supported by a strong MACD value of 1441.57. The volume traded was negligible, and the EMA values show the price trading above both the 50-day and 200-day averages, indicating a strong bullish trend.

Relationship with Key Moving Averages
The Nifty Bank index is trading above its key moving averages, with the current close at 55432.80, which is higher than the 10 EMA of 54245.53, the 20 EMA of 53026.32, the 50 EMA of 51445.59, and the 200 EMA of 50450.53. This indicates a bullish trend as the index is above these averages, suggesting strong upward momentum.
Moving Averages Trend (MACD)
MACD Analysis for Nifty Bank: The MACD value for Nifty Bank is 1441.57, which is higher than the MACD Signal of 1160.46. This suggests a bullish momentum, indicating a potential continuation of the upward trend. However, investors should also consider other indicators for a comprehensive analysis.

RSI Analysis
Based on the provided data, the RSI for Nifty Bank is 70.37, which suggests that the stock is in the overbought territory. This indicates that the stock may be overvalued and a price correction could be imminent if the trend doesn't change. However, it's crucial to consider other indicators and market conditions before making any trading decisions.

Analysis for Nifty 50 - April 28, 2025

Nifty 50 opened at 24070.25 and closed at 24328.5, marking a gain of approximately 1.20% or a points change of 289.15. The index reached a high of 24355.10 and a low of 24054.05 during this trading session, with no trading volume reported. The RSI is at 64.95, indicating a relatively strong momentum, while the MACD value of 340.24 suggests bullish trends compared to its signal line at 223.63.

Relationship with Key Moving Averages
The Nifty 50 closed at 24328.5, which is above its 10 EMA (23901.06), 20 EMA (23588.24), 50 EMA (23326.48), and 200 EMA (23420.63). This indicates a bullish momentum as the current price surpasses these key moving averages.
Moving Averages Trend (MACD)
Nifty 50 MACD Analysis: The MACD of 340.24 is above the MACD Signal of 223.63, indicating a bullish momentum. This suggests a potential continuation of the upward trend.

RSI Analysis
The RSI for Nifty 50 is 64.95, indicating a bullish momentum as it is above the neutral 50 mark but below the overbought threshold of 70. This suggests that Nifty 50 is experiencing strong buying pressure, but it is not yet in the overbought territory.

Up Next

Indian stock market sector-wise performance today - April 28, 2025

Step-by-step guide to apply for a mortgage loan online with minimal documentation

Honda Activa 6G: Everything You Need to Know Before Buying

How much does a ULIP plan really cost? A break-down of all charges

Centre plans to borrow Rs 8.20 lakh cr from market in first half of FY27

Reliance denies buying Iranian oil amid US sanctions waiver

More videos

Premium petrol price up Rs 2, industrial diesel up Rs 22; no change in normal petrol, diesel rates

India's GDP expected to register over 8 pc growth in Sep-Dec: Report

Govt announces seven measures to help boost exports

RBI keeps interest rates on hold after US trade deal boosts outlook

RBI proposes to compensate customers up to Rs 25,000 loss due to fraud

RBI raises GDP growth projection of Q1, Q2 of FY27

RBI pauses rate cuts, retains interest rate at 5.25 pc

Rupee jumps 122 paise to close at 90.27 against US dollar on India-US trade deal

Stock markets cheer India-US trade deal: Sensex, Nifty surge 2.5 pc

UPI transactions hit record high of Rs 230 lakh crore in 2025-26 till Dec: Govt