


Highlights
- Sensex dips, losing -0.74%, notable below 50 EMA
- Nifty IT gains, up 0.72%, despite lower MACD
- Nifty Energy declines sharply, down -2.22%
Latest news

Samsung Galaxy Z Fold 8, Fold 8 Ultra & Z Flip 8: A More Mature Foldable Family

Dell Launches New Alienware 16X Aurora, 16 Area-51 and 18 Area-51 Gaming Laptops in India

Samsung Takes on Premium Home Audio With New Music Studio Series

The End of OxygenOS: OnePlus Confirms Shift to Oppo's ColorOS

Fujifilm Instax Mini Evo Cinema Review: A Hybrid Camera That Prints Memories Differently

iQOO Teases Z11 Lite With AI Tools, Military-Grade Durability and a 6500mAh Battery

Editorji Launches Hook Global, Its International Digital News Brand

Samsung's Bespoke AI ACs Focus on Humidity, Hygiene and Smarter Cooling
Indian stock market sector-wise performance today - April 25 2025


The stock market on Friday (April 25, 2025) experienced a day of mixed performance across various sectors and indices.
The BSE Sensex, observed a minor decline of 0.74%, closing at 79,212.53. This dip was echoed across several sectors, reflecting broad market sentiments on the trading day.
Among the notable changes, the Nifty Energy sector faced a significant downturn with a 2.22% drop, closing at 33,956.5. This sector was the most affected, contributing substantially to the overall market's bearish tone.
Several factors may have influenced this decline, including potential fluctuations in global oil prices or policy announcements impacting energy companies.
The Nifty Metal sector similarly experienced a noteworthy decrease, falling by 2.10% to close at 8,569.75. This drop can be attributed to various pressures in the commodities market, possibly due to changes in international trade policies or weakening demand expectations.
In contrast, the Nifty IT index emerged as a bright spot, advancing by 0.72% and closing at 35,562.25. This positive performance in the tech sector could be driven by robust earnings reports or optimism surrounding innovation and demand for IT services.
The Nifty Auto sector recorded a decrease of 1.67%, closing at 21,994.5, while the Nifty Infra sector faced a 1.55% decline, closing at 8,589.30.
These movements suggest varied investor sentiments across different industries, possibly influenced by economic data releases or company-specific news.
Despite these fluctuations, the Nifty FMCG index showed resilience with a relatively modest decline of 0.62%, closing at 56,532.35, indicating stability and continued consumer demand in the fast-moving consumer goods sector.
Overall, the trading day reflected a mix of positive and negative trends among different sectors. Market participants should stay attentive to broader economic indicators and sector-specific developments, which could further influence indices and sector performances in the near term.

Analysis for Sensex - April 25, 2025

Sensex Performance: The Sensex opened at 79,830.15 and closed at 79,212.53, witnessing a decline of 588.90 points, which translates to a percentage change of -0.74%. The index experienced a high of 80,130.66 and a low of 78,605.81 during the trading session. The Relative Strength Index (RSI) stands at 61.91, indicating a moderately strong market.

Relationship with Key Moving Averages
The Sensex closed at 79,212.53, which is above its 50-day EMA of 76,738.58 and 10-day EMA of 78,380.98, indicating a short-term uptrend. However, it is slightly below its 200-day EMA of 77,157.87, suggesting potential longer-term resistance or consolidation in its movement.
Moving Averages Trend (MACD)
The MACD value for Sensex is 1018.53, indicating a bullish sentiment as it is greater than the MACD Signal at 601.53. This suggests a positive upward momentum. However, traders typically look for more context and additional indicators to make comprehensive investment decisions.

RSI Analysis
The RSI value for Sensex is approximately 61.91, suggesting a neutral to slightly overbought position. Generally, RSI values above 70 indicate overbought conditions, whereas values below 30 indicate oversold conditions. Current RSI suggests that the Sensex is not in extreme conditions, allowing room for either upward or downward movement.

Analysis for Nifty Auto - April 25, 2025
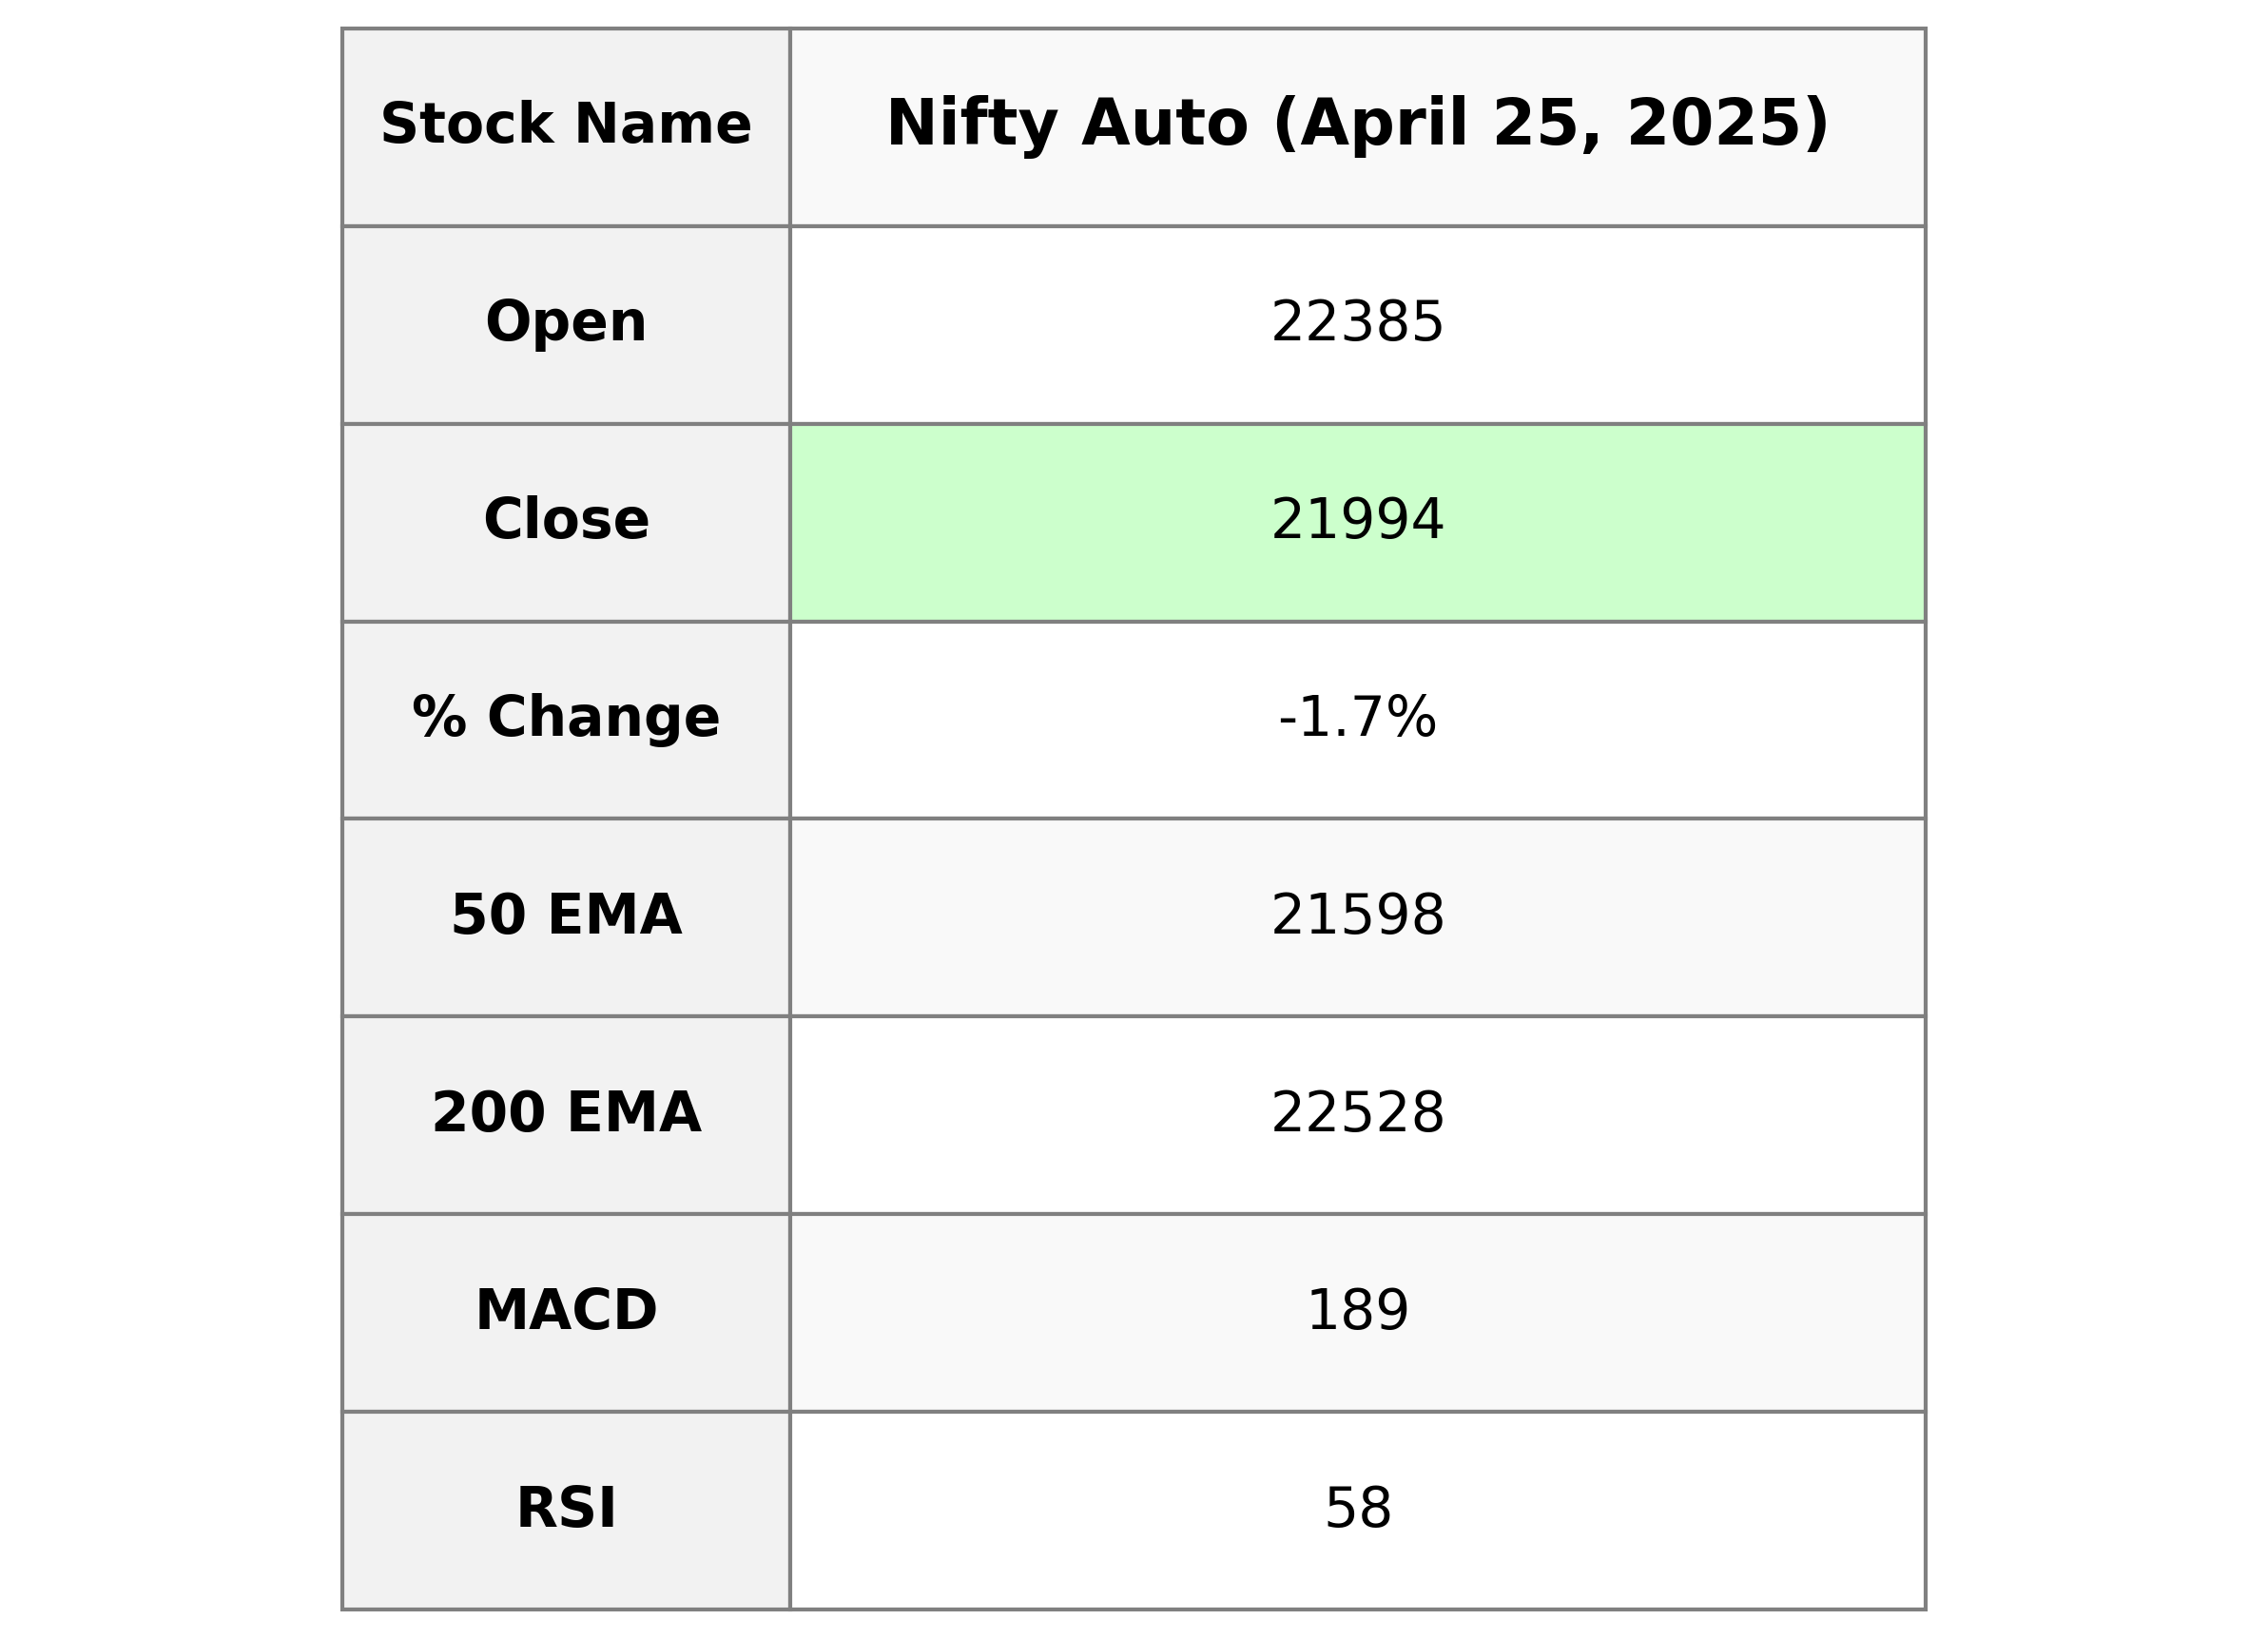
Nifty Auto opened at 22,385.30 and closed at 21,994.50, experiencing a decrease of approximately 1.67% compared to the previous close of 22,367.55. The index saw a high of 22,541.90 and a low of 21,885.20. Trading volume was reported as zero, indicating an anomaly or missing data. The 50-day EMA is below the 200-day EMA, possibly suggesting a bearish pattern. The RSI is at 57.79, indicating a neutral to slightly bullish momentum.

Relationship with Key Moving Averages
Nifty Auto closed at 21,994.5, which is above its 50-day EMA of 21,597.56 and its 10-day EMA of 21,692.70, indicating a recent bullish trend. However, it remains below the 200-day EMA of 22,527.64, which suggests a longer-term bearish outlook.
Moving Averages Trend (MACD)
Nifty Auto's MACD stands at approximately 189.26, significantly higher than the Signal line at 0.19. This indicates a bullish momentum in the recent price movements.

RSI Analysis
The RSI (Relative Strength Index) for Nifty Auto is 57.79. This indicates a neutral position, as it is above 50, suggesting a potential continuation of an uptrend but not yet reaching the overbought condition of 70. Investors might see this as an opportunity for further analysis before making buy or sell decisions.

Analysis for Nifty Energy - April 25, 2025

Nifty Energy opened at 34,751.15 and closed at 33,956.5, representing a decline of -2.22%. It experienced a high of 34,874.05 and a low of 33,599.6. The MACD line is above the signal line, indicating potential bullish momentum, but the closing is lower than the previous close of 34,726.75.

Relationship with Key Moving Averages
Nifty Energy closed at 33,956.5, which is slightly above its 10-day EMA of 33,895.06 and significantly above its 50-day EMA of 33,109.35, indicating short-term bullish momentum. However, its current price remains below the 200-day EMA of 35,512.08, suggesting possible long-term bearish sentiment.
Moving Averages Trend (MACD)
The MACD for Nifty Energy is currently at 538.84, which is above the MACD Signal line of 391.74. This suggests a bullish trend, indicating that the stock might continue to see positive momentum in the near term.

RSI Analysis
RSI Analysis for Nifty Energy: The RSI (Relative Strength Index) for Nifty Energy is at 56.54, indicating a neutral strength in the current market trend. This level suggests that the stock is neither overbought nor oversold, providing neither a strong buy nor sell signal at this moment.

Analysis for Nifty FMCG - April 25, 2025

Nifty FMCG opened at 56926.90 and closed at 56532.35, reflecting a decrease of 0.62% with a points change of -355.20. The RSI stands at 63.88, indicating a moderately bullish sentiment. The MACD is above its signal line, showing positive momentum, even as the close remains below both the 50 EMA and the 10 EMA.

Relationship with Key Moving Averages
The Nifty FMCG index closed at 56,532.35, which is above the 10_EMA of 56,231.70 and the 20_EMA of 55,311.89, but below the 50_EMA of 54,563.60 and the 200_EMA of 56,130.17. This indicates short-term bullish momentum as the close is above shorter moving averages, while longer-term trends suggest potential resistance or consolidation.
Moving Averages Trend (MACD)
Nifty FMCG's MACD value is 1056.95 with a signal line of 851.90, indicating a positive MACD line crossover. This suggests a bullish trend is currently present, as the MACD line is above the signal line.

RSI Analysis
The RSI value for Nifty FMCG is 63.88, indicating that the stock is in the neutral territory but approaching the overbought zone, which starts at 70. This suggests a potential slowdown of upward momentum, although no clear overbought condition is present yet.

Analysis for Nifty Infra - April 25, 2025

Nifty Infra opened at 8729.80 and closed at 8589.30, showing a percentage change of -1.55% from the previous close of 8724.65. The index experienced a high of 8763.45 and a low of 8499.15 during the trading session. With the RSI at 58.16 and a positive MACD of 136.76, the trend indicates moderate bullish momentum despite the day's loss.

Relationship with Key Moving Averages
The Nifty Infra closed at 8589.30, which is above its 10-day EMA of 8567.34, implying short-term strength. However, it is below the 50-day EMA of 8324.36 and the 200-day EMA of 8410.90, indicating potential medium to long-term weakness.
Moving Averages Trend (MACD)
MACD Analysis for Nifty Infra: The MACD value of 136.76 is above the MACD Signal of 108.27, suggesting a bullish momentum. However, the negative points change and % change indicate that caution might be warranted, as there may be short-term volatility.

RSI Analysis
The Relative Strength Index (RSI) for Nifty Infra is 58.16, which suggests that the stock is currently in a neutral zone and not overbought or oversold. An RSI value typically above 70 indicates overbought conditions, while below 30 suggests oversold conditions; hence, the current RSI suggests moderate strength with no immediate market extremes.

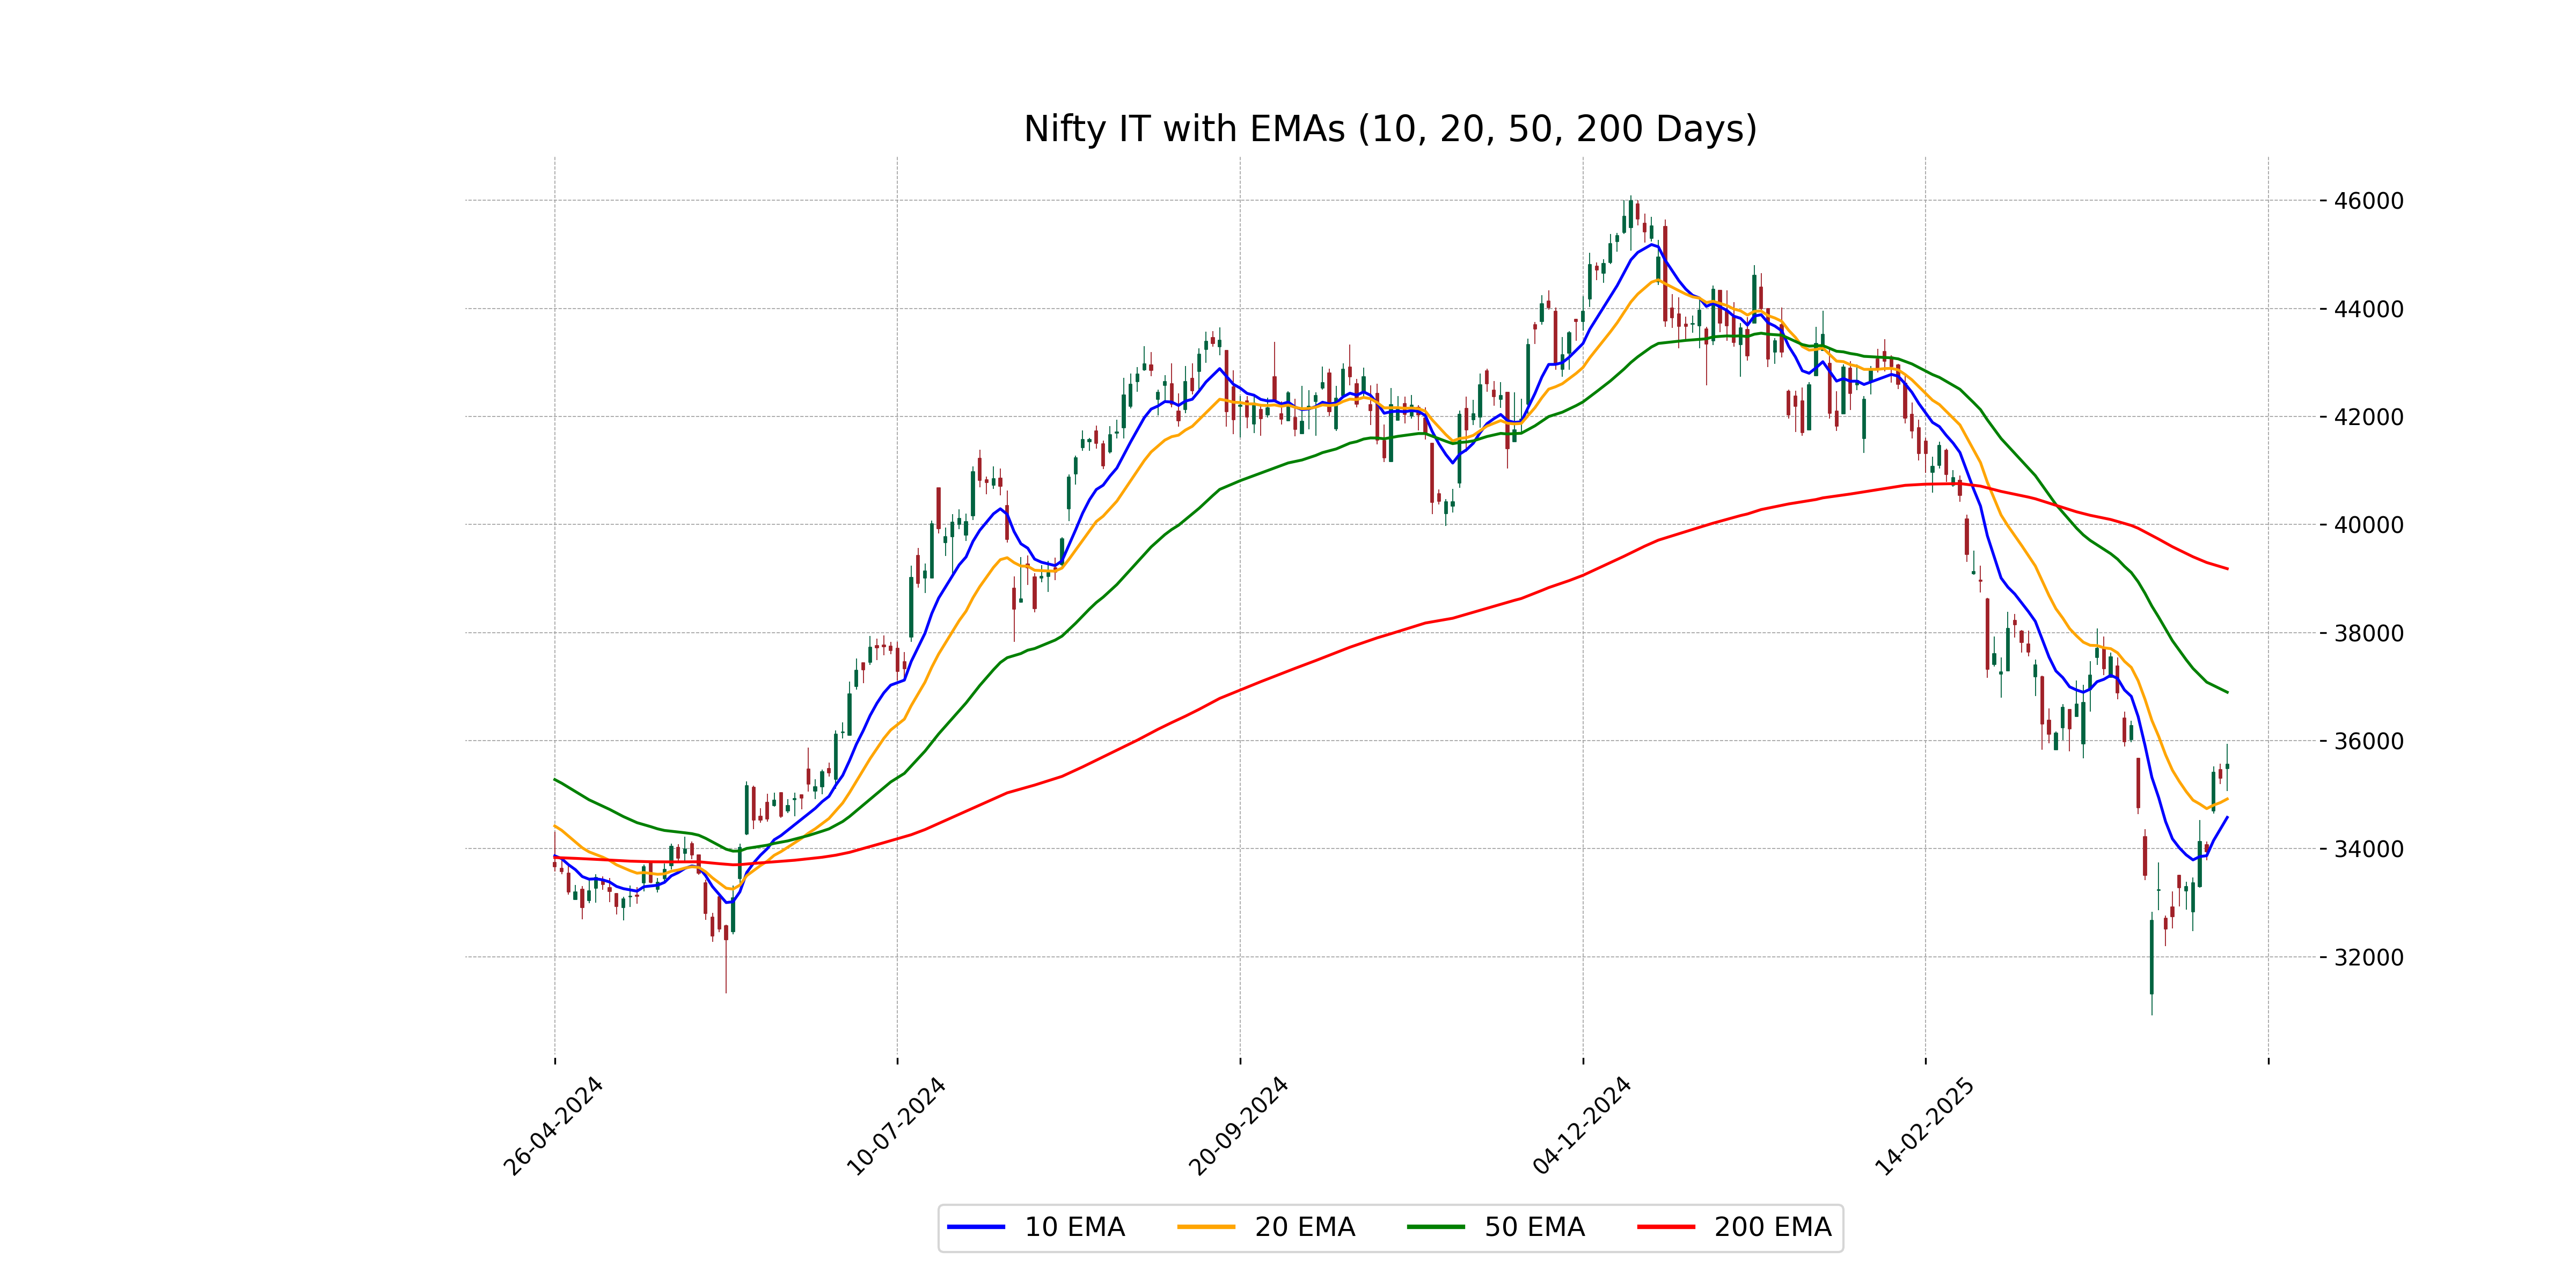
Analysis for Nifty IT - April 25, 2025

Nifty IT opened at 35,487.30 and closed at 35,562.25, registering a 0.72% increase from its previous close. The index saw a high of 35,941.45 and a low of 35,068.15, indicating some volatility during the trading session. The MACD value of -731.20 suggests a bearish trend, although the RSI is at a neutral 51.36.
Relationship with Key Moving Averages
Nifty IT is trading below its key moving averages, with the current close of 35562.25 being lower than the 50 EMA of 36895.92 and the 200 EMA of 39182.40, indicating a potential bearish trend. However, it is trading above the 10 EMA of 34579.84 and slightly above the 20 EMA of 34921.18, suggesting some short-term momentum.
Moving Averages Trend (MACD)
Nifty IT's MACD indicator is currently below the signal line with a value of -731.20, indicating potential bullish momentum as the MACD is approaching the signal line from below. This suggests a possible trend reversal if the MACD crosses above the signal line.

RSI Analysis
The RSI for Nifty IT is 51.36, indicating a neutral market sentiment. An RSI value close to 50 suggests that the stock is neither overbought nor oversold at the moment. This typically implies balanced buying and selling pressures.

Analysis for Nifty Metal - April 25, 2025

Nifty Metal opened at 8790.15 and closed at 8569.75, experiencing a decline of approximately 2.10% with a points change of -183.55. The 50-day EMA stands at 8642.08, while the 200-day EMA is at 8775.31, indicating a potential bearish trend. The RSI is at 48.52, suggesting that the index is nearing oversold conditions.

Relationship with Key Moving Averages
Nifty Metal closed at 8569.75, below its 50 EMA of 8642.08 and 200 EMA of 8775.31, indicating a potential bearish trend or weakness in the current price movement. Additionally, the 10 EMA and 20 EMA are calculated at 8583.46 and 8606.13, respectively, also higher than the closing price, reinforcing the short-term bearish sentiment.
Moving Averages Trend (MACD)
MACD Analysis for Nifty Metal: The MACD for Nifty Metal is currently at -35.82, which is above its signal line of -59.49. This suggests a potential bullish convergence, indicating that bearish momentum may be weakening. However, traders should watch for further confirmation before making decisions.

RSI Analysis
In the provided data, the RSI (Relative Strength Index) for Nifty Metal stands at 48.52, indicating that it is in the neutral range. An RSI value around 50 suggests neither overbought nor oversold conditions, implying a balance between bullish and bearish sentiment.

Analysis for Nifty Bank - April 25, 2025

Nifty Bank opened at 55233.55 and closed at 54664.05, marking a decline of approximately 0.97% with a points change of -537.35. The RSI stands at 67.18, indicating a relatively strong position, while the MACD suggests a continuation of a positive trend, as it is above its signal line. The observed market activity shows negligible volume, pointing towards limited trading during this period.

Relationship with Key Moving Averages
### Relationship with Key Moving Averages for Nifty Bank Nifty Bank closed at 54664.05, which is above its 10 EMA of 53981.69 and 20 EMA of 52773.01, indicating a short-term uptrend. However, it is significantly above its 50 EMA of 51282.84 and 200 EMA of 50400.24, suggesting an extended rally.
Moving Averages Trend (MACD)
Based on the provided data, the MACD for Nifty Bank is 1406.84, with a signal line of 1090.18, indicating that the MACD line is above the signal line. This suggests a bullish momentum, as the separation between the MACD and its signal line implies a strengthening upward trend.

RSI Analysis
The Nifty Bank RSI value is 67.18, which indicates that it is nearing the overbought territory, as RSI levels above 70 typically suggest overbought conditions. However, it's not quite there yet, suggesting potential for further gains unless other indicators signal caution.

Analysis for Nifty 50 - April 25, 2025

Nifty 50 opened at 24,289.0 and closed slightly lower at 24,039.35, marking a decrease of 207.35 points or approximately -0.86% from the previous close of 24,246.70. The market showed mixed signals with the RSI indicating a moderately strong trend at 61.35 and the MACD standing positive at 315.69, suggesting potential bullish momentum.

Relationship with Key Moving Averages
Nifty 50 is trading at 24039.35, which is above its 50-day EMA of 23285.58 and its 200-day EMA of 23411.42, indicating a bullish trend in the longer term. However, it is close to its 10-day EMA of 23806.07 and above the 20-day EMA of 23510.32, suggesting short-term momentum may be maintaining but with the potential for some consolidation.
Moving Averages Trend (MACD)
The MACD for Nifty 50 is 315.69, indicating a bullish outlook as it is above the MACD Signal line, which is 194.47. This suggests a positive momentum in the short term.

RSI Analysis
Nifty 50's RSI stands at approximately 61.35, indicating a relatively strong position in the market. Generally, an RSI above 70 suggests overbought conditions, and below 30 indicates oversold; thus, Nifty 50 is currently in a neutral to slightly strong territory, suggesting no immediate extreme conditions in either direction.

Up Next

Indian stock market sector-wise performance today - April 25 2025

Step-by-step guide to apply for a mortgage loan online with minimal documentation

Honda Activa 6G: Everything You Need to Know Before Buying

How much does a ULIP plan really cost? A break-down of all charges

Centre plans to borrow Rs 8.20 lakh cr from market in first half of FY27

Reliance denies buying Iranian oil amid US sanctions waiver

More videos

Premium petrol price up Rs 2, industrial diesel up Rs 22; no change in normal petrol, diesel rates

India's GDP expected to register over 8 pc growth in Sep-Dec: Report

Govt announces seven measures to help boost exports

RBI keeps interest rates on hold after US trade deal boosts outlook

RBI proposes to compensate customers up to Rs 25,000 loss due to fraud

RBI raises GDP growth projection of Q1, Q2 of FY27

RBI pauses rate cuts, retains interest rate at 5.25 pc

Rupee jumps 122 paise to close at 90.27 against US dollar on India-US trade deal

Stock markets cheer India-US trade deal: Sensex, Nifty surge 2.5 pc

UPI transactions hit record high of Rs 230 lakh crore in 2025-26 till Dec: Govt