


Highlights
- Nifty Metal only gainer with a modest 0.18% rise
- Nifty FMCG led declines falling over 1%
- Nifty 50 dipped 0.34%, shedding 82.25 points
Latest news

Samsung Galaxy Z Fold 8, Fold 8 Ultra & Z Flip 8: A More Mature Foldable Family

Dell Launches New Alienware 16X Aurora, 16 Area-51 and 18 Area-51 Gaming Laptops in India

Samsung Takes on Premium Home Audio With New Music Studio Series

The End of OxygenOS: OnePlus Confirms Shift to Oppo's ColorOS

Fujifilm Instax Mini Evo Cinema Review: A Hybrid Camera That Prints Memories Differently

iQOO Teases Z11 Lite With AI Tools, Military-Grade Durability and a 6500mAh Battery

Editorji Launches Hook Global, Its International Digital News Brand

Samsung's Bespoke AI ACs Focus on Humidity, Hygiene and Smarter Cooling
Indian stock market sector-wise performance today - April 24 2025


On the given market day, April 24, 2025, the overall sentiment was largely bearish across various sectors and indices.
The Bombay Stock Exchange Sensex, a significant benchmark for Indian markets, closed with a decline of 0.39%. This drop translated to a loss of 315.06 points, indicating a lack of positive momentum across the market.
The Nifty Auto index witnessed a fall of 0.25%, marking a decrease of 56.9 points. This suggests a mild contraction in the automotive sector, likely influenced by broader market conditions rather than sector-specific issues.
Similarly, the Nifty Energy index experienced a minor decrease of 0.08%, losing 28.3 points. Despite being a crucial sector that usually remains resilient, the energy sector saw limited movements reflecting subdued investor interest.
Among the most notable declines, the Nifty FMCG index dropped by 1.06%, translating to a significant decrease of 610.35 points. The consumer goods sector faced considerable selling pressure, possibly due to profit-taking by investors or cautionary stances amidst macroeconomic signals.
On the infrastructure front, the Nifty Infrastructure index decreased by 0.26%, reporting a drop of 22.75 points, further indicating a cautious outlook on infrastructure projects and investments.
In technology, the Nifty IT index reported a decrease of 0.30%, representing a fall of 107.54 points. Despite being in an era driven by technological advancements, the sector grappled with fluctuating investor sentiments, possibly influenced by global tech trends.
Conversely, the Nifty Metal index registered a positive change, closing 0.18% higher with a gain of 16 points. This gain suggests a potential recovery in the metal sector, which might be due to rising commodity prices or increased demand forecasts.
Finally, the Nifty Bank index fell by 0.30%, losing 168.65 points. Financial institutions might be reacting to regulatory announcements or adjusting their positions ahead of fiscal results updates.
The broader Nifty Index itself closed 0.34% lower, losing 82.25 points. Overall, the market performance reflected cautious trading with underlying concerns such as economic policy impacts, global economic conditions, and investor outlook.
The most affected sector, the Nifty FMCG, faced a decline surpassing 1%, highlighting some market skepticism or temporary headwinds within consumer preferences or price pressures.
Investors might be reacting to inflationary pressures affecting consumer purchasing power or upcoming regulatory changes affecting how these goods are taxed or marketed.
Overall, the trading day represented a mixed to negative sentiment across the board, with specific sectors such as metals bucking the trend with localized gains.
This suggests potential sector rotations and reassessments by investors based on prevailing market conditions and future economic indicators.

Analysis for Sensex - April 24, 2025

The Bombay Stock Exchange Sensex opened at 80058.43 and closed at 79801.43, reflecting a daily decrease of 315.06 points, or -0.39% compared to the previous close of 80116.49. The 50-day EMA stands at 76637.60, suggesting a bullish trend, while the RSI of 65.90 indicates the index is approaching overbought levels.

Relationship with Key Moving Averages
The Sensex closed at 79,801.43, which is above its 50-day EMA of 76,637.60 and 200-day EMA of 77,136.96, indicating a positive short-term and long-term trend. However, it remains below the 10-day EMA of 78,196.19 and 20-day EMA of 77,222.94.
Moving Averages Trend (MACD)
The MACD for Sensex is at 988.83 with a MACD Signal of 497.28, indicating a bullish trend as the MACD line is well above the signal line. This positive divergence suggests upward momentum in the market despite the closing points change being negative.

RSI Analysis
The RSI for Sensex stands at 65.90, indicating a moderately strong upward momentum. Typically, an RSI above 70 may suggest overbought conditions, while below 30 could indicate oversold conditions. Currently, the RSI suggests that Sensex is approaching the higher end of the neutral zone but is not yet in overbought territory.

Analysis for Nifty Auto - April 24, 2025

Nifty Auto Performance: The Nifty Auto index opened at 22,426.90 and closed slightly lower at 22,367.55, resulting in a percentage change of -0.25% from the previous close. The index's MACD indicates a bullish signal with the current value above the MACD Signal. The RSI of 63.85 suggests a somewhat overbought condition, indicating potential caution for investors.

Relationship with Key Moving Averages
Nifty Auto closed at 22367.55, which is below the 200-day EMA of 22532.88, indicating a bearish sentiment. However, it is trading above the 50-day EMA of 21581.36 and the 10-day EMA of 21625.63, suggesting short to medium-term support.
Moving Averages Trend (MACD)
The MACD for Nifty Auto is 165.66, with a MACD Signal of -47.08, indicating a bullish sentiment as the MACD line is significantly above the signal line. This suggests a positive trend momentum.

RSI Analysis
The Relative Strength Index (RSI) for Nifty Auto is 63.85, suggesting that the stock is in a stable momentum zone. An RSI above 70 typically indicates that the stock may be overbought, while a value below 30 suggests it may be oversold. Since the current RSI is below 70, Nifty Auto does not appear overbought, indicating potential for further upward movement or consolidation.

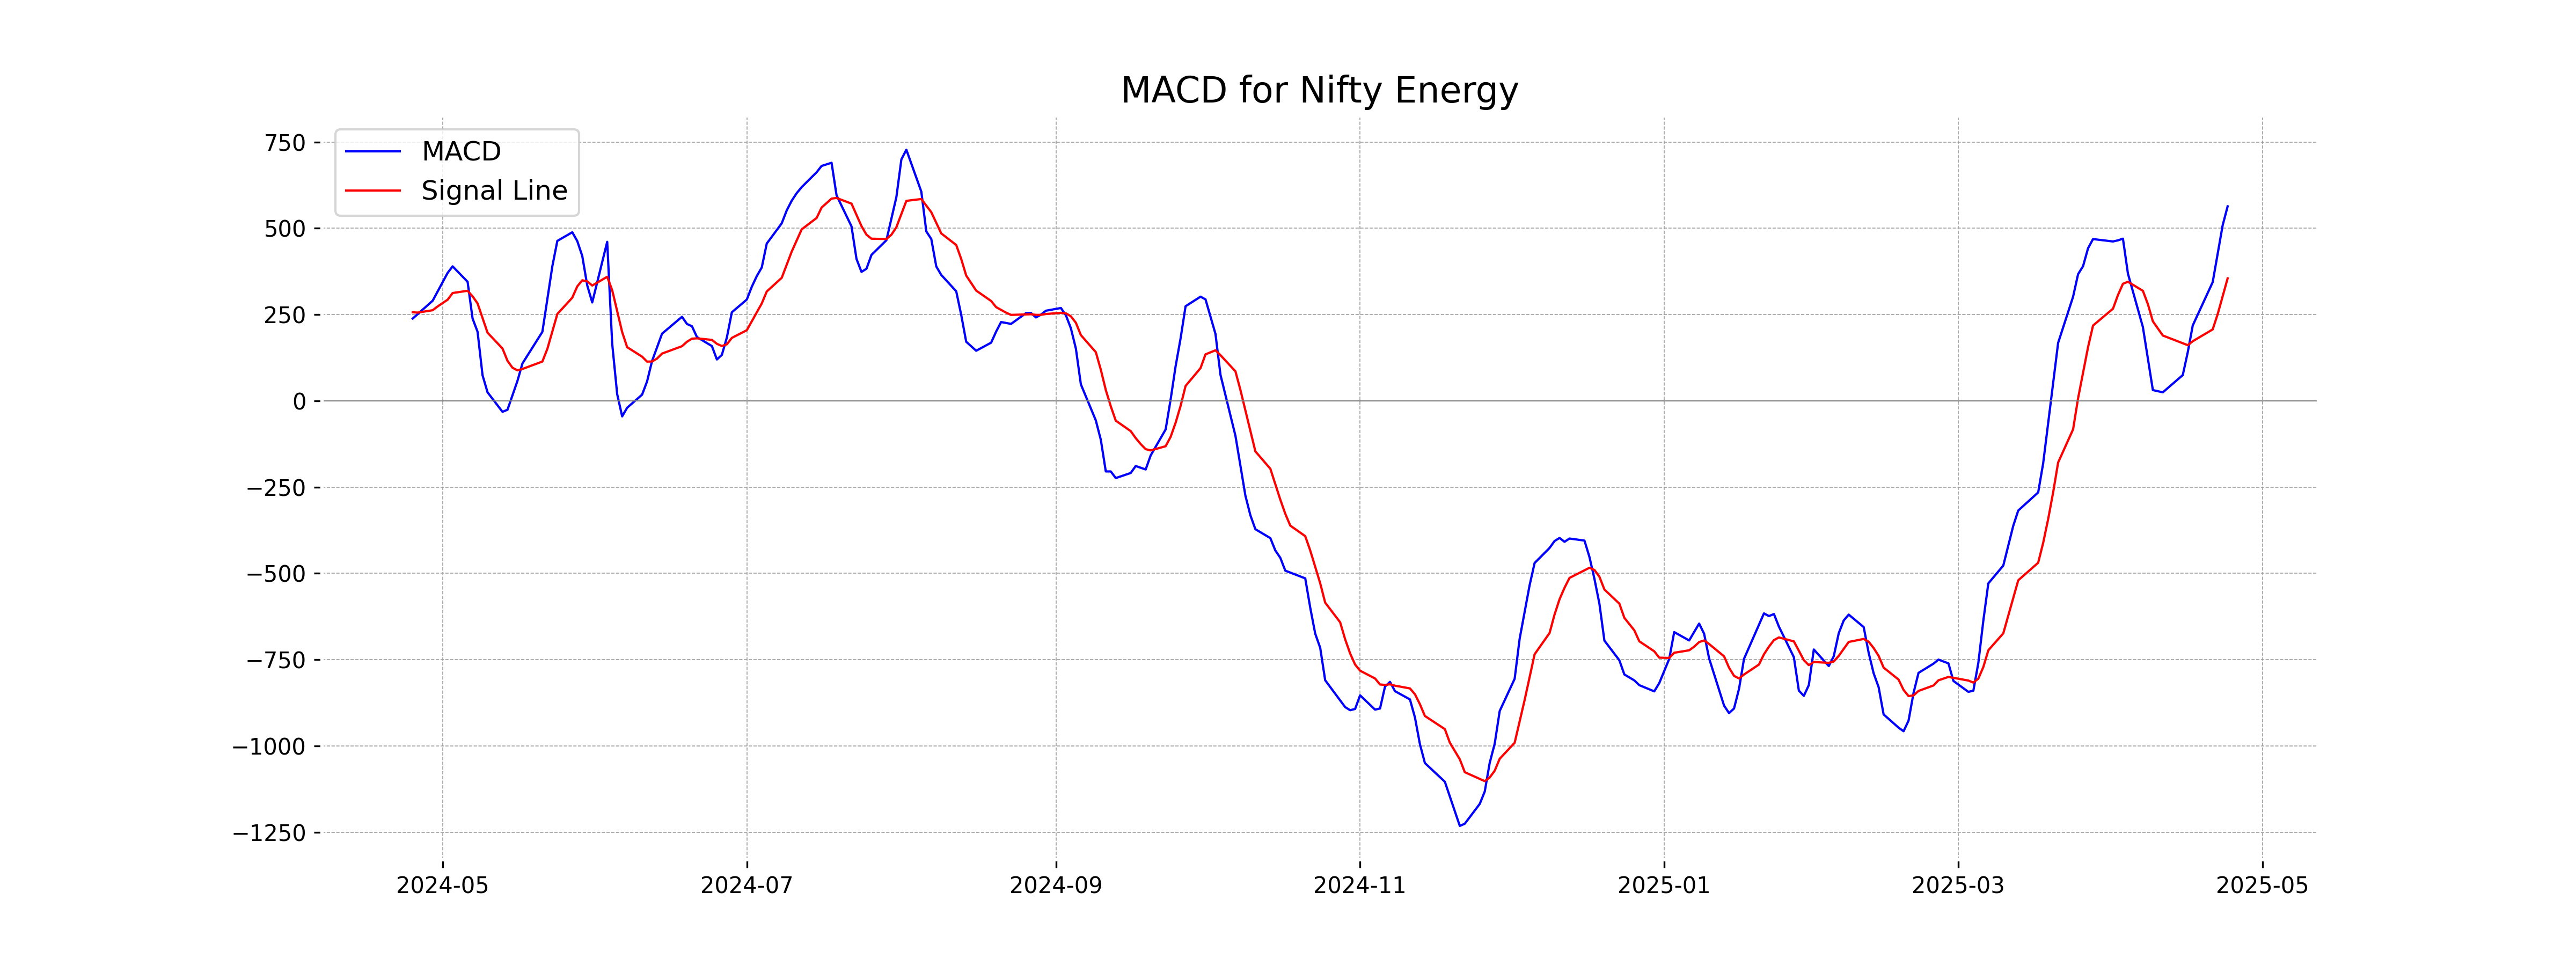
Analysis for Nifty Energy - April 24, 2025

Nifty Energy Performance Overview: On the specified day, Nifty Energy opened at 34,684.05 and closed slightly lower at 34,726.75, marking a minor decline of 0.08% from the previous close of 34,755.05. Although the index experienced a drop of 28.30 points, it remains well above its 50-day EMA of 33,074.78 but is still below the 200-day EMA of 35,527.62, with an RSI of 64.71 indicating moderate strength.

Relationship with Key Moving Averages
Nifty Energy closed at 34,726.75, below its 50 EMA of 33,074.78, indicating it is trading above this short-term average. However, it is significantly below the 200 EMA of 35,527.62, suggesting a bearish longer-term trend despite short-term bullish momentum.
Moving Averages Trend (MACD)
Analysis for Nifty Energy MACD: The MACD value for Nifty Energy is 563.70, which is above its signal line at 354.97. This indicates a bullish momentum as the gap between the MACD and its signal line suggests increasing strength in the upward trend. However, investors should monitor for any potential changes in momentum.
RSI Analysis
The RSI value for Nifty Energy is 64.71, which suggests that the stock is nearing the overbought territory but still within a neutral range. Investors might watch for further increases approaching or surpassing 70, which typically signals overbought conditions.

Analysis for Nifty FMCG - April 24, 2025

Nifty FMCG opened at 57582.65, reached a high of 58048.20, but closed lower at 56887.55, showing a decrease from its previous close of 57497.90. The index experienced a point change of -610.35, resulting in a percentage change of -1.06%. The relative strength index (RSI) stood at 67.71, indicating relatively strong momentum, while the moving average convergence divergence (MACD) was above the signal, reflecting potential bullish trends.

Relationship with Key Moving Averages
Based on the data, Nifty FMCG closed at 56887.55, which is below its 50 EMA (54483.25) and slightly above its 200 EMA (56125.95). The closing price is also just above the 10 EMA (56164.89) and 20 EMA (55183.42), indicating short-term bullish momentum while still maintaining a long-term upward trend.
Moving Averages Trend (MACD)
The MACD for Nifty FMCG is 1089.26, with a Signal Line at 800.63, indicating a bullish trend as the MACD line is above the Signal Line. However, this should be interpreted in conjunction with other indicators, as market conditions can change rapidly.

RSI Analysis
Based on the data provided, the RSI for Nifty FMCG is 67.71, which suggests that the stock is approaching overbought territory but is still within a neutral range. Traders might want to watch for a potential reversal if the RSI moves above 70, which typically indicates overbought conditions.

Analysis for Nifty Infra - April 24, 2025

The Nifty Infra index opened at 8732.5 and closed slightly lower at 8724.65, marking a percentage change of -0.26% from its previous close of 8747.40. The technical indicators show a relatively strong RSI of 65.08, and the MACD is above its signal line, indicating a potential bullish trend despite the slight dip in price. The index is trading above its short-term EMAs (10, 20, 50 days) indicating a positive momentum in the given period.

Relationship with Key Moving Averages
The Nifty Infra index closed at 8724.65, which is above its 50 EMA of 8313.55 and 200 EMA of 8409.06, indicating a bullish trend in the longer term. However, it is below the 10 EMA of 8562.46 and 20 EMA of 8436.47, suggesting possible short-term weakness or consolidation.
Moving Averages Trend (MACD)
The MACD for Nifty Infra is 142.66, which is higher than the MACD Signal of 101.15, indicating a bullish momentum. With an RSI of 65.08, Nifty Infra may still have room to rise but is approaching overbought territory. Overall, the short-term indicators suggest continued upward movement, although caution is advised as it approaches resistance levels.

RSI Analysis
The RSI for Nifty Infra is 65.08. This value indicates a moderately strong momentum, suggesting that the stock is approaching overbought conditions but is not yet at an extreme level. Investors may want to monitor for potential reversals or continuation of the current trend.

Analysis for Nifty IT - April 24, 2025

The Nifty IT index experienced a minor decline with a close at 35,307.10, down from the previous close of 35,414.65, marking a percentage drop of 0.30%. The index traded between a high of 35,572.0 and a low of 35,197.30, showing slight volatility. Notably, technical indicators like the 50-EMA and 200-EMA exhibit higher values compared to the current levels, indicating potential downward pressure, while the RSI is neutral at 49.55.

Relationship with Key Moving Averages
The closing price of Nifty IT is below its 50-day and 200-day EMAs, indicating a potential bearish trend. However, it is above the 10-day and 20-day EMAs, which may suggest short-term bullish movement amidst longer-term weakness.
Moving Averages Trend (MACD)
Nifty IT's MACD of -889.48, which is above the signal line of -1215.68, suggests a potential for a bullish reversal, as the MACD line is rising towards the signal line. However, the negative MACD indicates the current bearish trend may still persist.

RSI Analysis
The RSI for Nifty IT is currently at 49.55, which is near the midpoint of the scale, indicating neither overbought nor oversold conditions. This suggests a neutral momentum, and it may require additional indicators to ascertain the next movement direction.

Analysis for Nifty Metal - April 24, 2025

Nifty Metal Performance The Nifty Metal index opened at 8729.5 and closed at 8753.3, marking a slight increase of 0.18% or 16 points from the previous close. The index appears to be trading above its 50-day Exponential Moving Average (EMA) but below the 200-day EMA, indicating mixed momentum. The relative strength index (RSI) is at 53.85, suggesting neither overbought nor oversold conditions, while the MACD indicates a bearish trend.

Relationship with Key Moving Averages
The Nifty Metal index closed at 8753.30, which is above its 50-day EMA of 8645.03, indicating near-term bullish sentiment. However, it is below the 200-day EMA of 8777.34, suggesting a longer-term bearish trend. Furthermore, the 10-day and 20-day EMAs are below the 50-day EMA, which might indicate short-term weakness.
Moving Averages Trend (MACD)
The MACD for Nifty Metal is observed at -37.31, which is below the MACD Signal line at -65.40, indicating a bullish crossover. This suggests a potential trend reversal to the upside, as the MACD line has crossed above the signal line, despite remaining in negative territory.

RSI Analysis
The RSI for Nifty Metal is 53.85, which suggests a neutral momentum as it lies between the commonly used thresholds of 30 and 70. This indicates that the index is neither overbought nor oversold, reflecting a balance between buying and selling pressures at this time.

Analysis for Nifty Bank - April 24, 2025

Nifty Bank opened at 55103.90 and closed at 55201.40, experiencing a slight decrease of 0.30% with a points change of -168.65. The Relative Strength Index (RSI) is at a high level of 72.24, indicating potential overbought conditions. The MACD and MACD Signal values suggest bullish momentum, supported by the current price being above the 50 EMA and 200 EMA levels.

Relationship with Key Moving Averages
The Nifty Bank index closed at 55,201.40, which is above its 50-EMA of 51,144.83 and 200-EMA of 50,357.17, indicating a bullish trend relative to the key longer-term moving averages. It also remains above the 10-EMA and 20-EMA, suggesting continued short-term strength.
Moving Averages Trend (MACD)
Nifty Bank - MACD Analysis: The MACD value of 1420.32 indicates a strong bullish momentum, as it is significantly higher than the MACD Signal line at 1011.01. This suggests potential upward movement in the Nifty Bank index, but caution is advised given the recent decrease in the stock price.

RSI Analysis
RSI Analysis for Nifty Bank: The relative strength index (RSI) for Nifty Bank is at 72.24, suggesting that the stock is in an overbought condition. Generally, an RSI above 70 indicates that the stock might be overvalued, which could lead to a price correction. However, it is important to consider other factors and indicators before making trading decisions.

Analysis for Nifty 50 - April 24, 2025

Nifty 50 opened at 24,277.90 and closed at 24,246.70, with a high of 24,347.85 and a low of 24,216.15. The index experienced a decrease of 82.25 points, marking a percentage change of -0.34% from the previous close of 24,328.95. Technical indicators show an RSI of 65.85, suggesting the market is in a strong position, and MACD stands at 309.20, indicating positive momentum over the signal line at 164.17.

Relationship with Key Moving Averages
The closing price of Nifty 50 at 24,246.70 is above its 50-day EMA of 23,254.81 and its 200-day EMA of 23,405.03, suggesting an upward trend in the long term. However, it is below its 10-day EMA of 23,754.23 and its 20-day EMA of 23,454.63, indicating possible short-term downward pressure.
Moving Averages Trend (MACD)
The MACD value for Nifty 50 is 309.20, which is above the MACD Signal value of 164.17. This indicates a bullish momentum in the market. The positive difference suggests that upward movement may continue if the current trend persists.

RSI Analysis
The Nifty 50 has an RSI of approximately 65.85, indicating that the index is close to the overbought territory. This suggests that the market might be due for a correction or consolidation if buying pressure diminishes.

Up Next

Indian stock market sector-wise performance today - April 24 2025

Step-by-step guide to apply for a mortgage loan online with minimal documentation

Honda Activa 6G: Everything You Need to Know Before Buying

How much does a ULIP plan really cost? A break-down of all charges

Centre plans to borrow Rs 8.20 lakh cr from market in first half of FY27

Reliance denies buying Iranian oil amid US sanctions waiver

More videos

Premium petrol price up Rs 2, industrial diesel up Rs 22; no change in normal petrol, diesel rates

India's GDP expected to register over 8 pc growth in Sep-Dec: Report

Govt announces seven measures to help boost exports

RBI keeps interest rates on hold after US trade deal boosts outlook

RBI proposes to compensate customers up to Rs 25,000 loss due to fraud

RBI raises GDP growth projection of Q1, Q2 of FY27

RBI pauses rate cuts, retains interest rate at 5.25 pc

Rupee jumps 122 paise to close at 90.27 against US dollar on India-US trade deal

Stock markets cheer India-US trade deal: Sensex, Nifty surge 2.5 pc

UPI transactions hit record high of Rs 230 lakh crore in 2025-26 till Dec: Govt