


Highlights
- Nifty IT surged by 4.34%, gaining over 1473 points
- Nifty Auto increased by 2.38%, climbing 520.75 points
- Sensex rose by 0.65%, adding 520.9 points
Latest news

Samsung Galaxy Z Fold 8, Fold 8 Ultra & Z Flip 8: A More Mature Foldable Family

Dell Launches New Alienware 16X Aurora, 16 Area-51 and 18 Area-51 Gaming Laptops in India

Samsung Takes on Premium Home Audio With New Music Studio Series

The End of OxygenOS: OnePlus Confirms Shift to Oppo's ColorOS

Fujifilm Instax Mini Evo Cinema Review: A Hybrid Camera That Prints Memories Differently

iQOO Teases Z11 Lite With AI Tools, Military-Grade Durability and a 6500mAh Battery

Editorji Launches Hook Global, Its International Digital News Brand

Samsung's Bespoke AI ACs Focus on Humidity, Hygiene and Smarter Cooling
Indian stock market sector-wise performance today - April 23, 2025


On a recent trading day, the stock market observed a varied performance across key indices, with technology stocks particularly stealing the spotlight. The Nifty IT index surged with a remarkable percentage change of 4.34%, marking it as the highest gainer among all sectors. This uptick reflects growing investor confidence in the technology sector, potentially driven by strong earnings reports and positive industry trends favoring digital transformation across the globe. The consistent demand for technology services and products amid evolving business environments might have fueled this notable rise, making it a significant point of interest for market analysts and investors. Elsewhere, the Nifty Auto index also experienced significant growth with a remarkable rise of 2.38%. This upward momentum can be attributed to factors such as increasing automotive sales and anticipations of favorable policy announcements benefitting the automobile industry. Additionally, the Nifty Energy index reported a modest yet positive change of 0.69%. Factors such as stable crude oil prices and potential policy support for renewable energy projects likely contributed to this outcome. The Nifty Metal index recorded a subtle increase of 0.78%, reflecting steady demand in the industrial metals market. Base metal prices and ongoing infrastructure projects might have aided in maintaining this upward trajectory despite varying economic conditions. On a slightly different note, the Nifty FMCG index experienced a moderate gain of 0.53%, reflecting consistent consumer demand for fast-moving consumer goods, supported possibly by strong quarterly results from major players within this space. Meanwhile, the Nifty 50 index itself showcased a gain of 0.67%, indicating overall market optimism. This broad-based performance is underpinned by gains in major sectors contributing to the index. Conversely, the Nifty Bank index saw a slight decline of 0.50%. This could be a result of profit-booking activities following recent highs, as well as mixed sentiments surrounding banking and financial services due to ongoing global economic concerns. To summarize, the session was dominated by the robust revaluation of technology-related shares, while other sectors also showed encouraging trends. While each sector has its unique set of driving forces, the tech sector's standout performance remains the focal point, accentuating its critical role in steering market sentiment and investor enthusiasm forward.

Analysis for Sensex - April 23, 2025

The BSE Sensex opened at 80142.09 and closed at 80116.49, showing a positive change with a gain of 520.90 points or 0.65% from the previous close of 79595.59. The current trend is supported by technical indicators like a high RSI of 68.09 and a positive MACD of 876.57, indicating bullish momentum. The indices' movement is above its 50 and 10-day EMAs, suggesting a continuation of the upward trend.

Relationship with Key Moving Averages
The Sensex closed at 80116.49, which is above its 50-day EMA of 76508.47 and 200-day EMA of 77109.90, indicating a positive trend. Additionally, it's above the 10-day EMA of 77839.47 and 20-day EMA of 76951.52, suggesting short-term bullish momentum.
Moving Averages Trend (MACD)
The MACD for Sensex shows a strong bullish signal with a value of 876.57, significantly above the MACD Signal line at 374.40. This indicates positive momentum and potential for upward price movement.

RSI Analysis
The Relative Strength Index (RSI) for Sensex is 68.09, which indicates that the stock is approaching overbought conditions, as RSI values above 70 typically signify overbought levels. This suggests potential caution for investors regarding a possible reversal or pullback in price.

Analysis for Nifty Auto - April 23, 2025

Nifty Auto opened at 21,999.95 and closed at 22,424.45, marking a positive change of 2.38% from its previous close of 21,903.70, with a points change of 520.75. The index reached a high of 22,456.90 and a low of 21,947.05 during the trading session. The RSI is at 64.81, indicating potentially strong momentum, while the MACD suggests a bullish trend with a value of 95.15.

Relationship with Key Moving Averages
Nifty Auto is trading above its 50-day EMA of 21549.27 and 10-day EMA of 21460.76, indicating a short to medium-term upward momentum, as the current close is 22424.45. However, it is still below the 200-day EMA of 22534.42, suggesting a long-term resistance level might be nearby.
Moving Averages Trend (MACD)
Based on the given data, the Nifty Auto index shows a MACD value of 95.15 with a MACD Signal of -100.27. This positive MACD value and negative signal indicate bullish momentum, suggesting a potential upward trend continuation.

RSI Analysis
The current RSI for Nifty Auto is 64.81, which is approaching the overbought threshold of 70. This suggests that the index may be experiencing strong momentum, but caution is advisable, as further upward movement might result in overbought conditions.

Analysis for Nifty Energy - April 23, 2025

Nifty Energy Performance: The Nifty Energy index opened at 34,685.45, reached a high of 34,785.10, and closed at 34,755.05, marking an increase of approximately 0.69% from the previous close of 34,516.35. The relative strength index (RSI) is at 65.03, indicating a strong momentum in the current trend, while the MACD suggests bullish momentum with a value considerably above its signal line.

Relationship with Key Moving Averages
Nifty Energy's current close at 34755.05 is above its 50 EMA of 33007.35 and significantly surpasses the 10 EMA of 33693.55 and 20 EMA of 33217.79, indicating a bullish trend in the short and intermediate term. However, it remains below the 200 EMA of 35535.55, suggesting that the longer-term trend might still be bearish.
Moving Averages Trend (MACD)
The MACD for Nifty Energy is 508.81, which is higher than the MACD Signal of 302.78, indicating a bullish trend. The positive MACD value suggests strong upward momentum, supported by the higher RSI of 65.03.

RSI Analysis
The RSI for Nifty Energy is 65.03, indicating it is approaching the overbought territory (typically considered overbought above 70). This suggests that the stock may experience a pullback or consolidation in the near term if upward momentum continues.

Analysis for Nifty FMCG - April 23, 2025

Nifty FMCG opened at 57436.35 and closed at 57497.90, marking a percentage change of 0.53% with a point increase of 304.10. The Relative Strength Index (RSI) is 74.90, indicating overbought conditions, while the MACD is at 1078.49, suggesting a bullish momentum. The stock's 50-day EMA is significantly below its current price, reflecting an upward trend.

Relationship with Key Moving Averages
Nifty FMCG closed above all key moving averages, indicating a bullish trend. With a close of 57497.90, it is above the 10 EMA (56004.29), 20 EMA (55004.04), 50 EMA (54385.11), and 200 EMA (56118.11). The RSI is at a high 74.90, suggesting strong momentum.
Moving Averages Trend (MACD)
The MACD for Nifty FMCG is 1078.49, significantly higher than the Signal line at 728.48, indicating a bullish trend. The difference suggests strong upward momentum in the current market conditions.

RSI Analysis
The RSI value for Nifty FMCG is 74.90, which indicates that the index is in the overbought territory. This suggests that the stock may be overvalued, and there could be a potential for a price pullback or correction soon. Investors should be cautious and consider re-evaluating their positions.

Analysis for Nifty Infra - April 23, 2025

Nifty Infra opened at 8729.70 and closed at 8747.40, achieving a high of 8752.60 and a low of 8628.40 during the session. It recorded a 0.71% increase from the previous close of 8686. The RSI stands at 66.32, indicating strong relatively upward momentum, while the MACD is at 134.34, suggesting continued bullish trends in the sector.

Relationship with Key Moving Averages
The current close of Nifty Infra is 8747.40, which is above the 50-day EMA of 8296.77, indicating a bullish trend over the medium term. It is also above the 10-day EMA of 8526.42 and the 20-day EMA of 8406.13, suggesting continued short-term strength. The close is slightly above the 200-day EMA of 8405.84, reaffirming an overall positive sentiment.
Moving Averages Trend (MACD)
The MACD value of 134.34 for Nifty Infra is above the MACD Signal line of 90.77, indicating a bullish crossover. This suggests that the momentum for Nifty Infra is potentially strengthening, with a positive trend likely to continue.

RSI Analysis
Based on the provided data, the Nifty Infra index has an RSI of 66.31, indicating a moderately strong momentum. This value suggests that the index might be approaching overbought conditions, which could signal a potential for a price correction or consolidation in the near future.

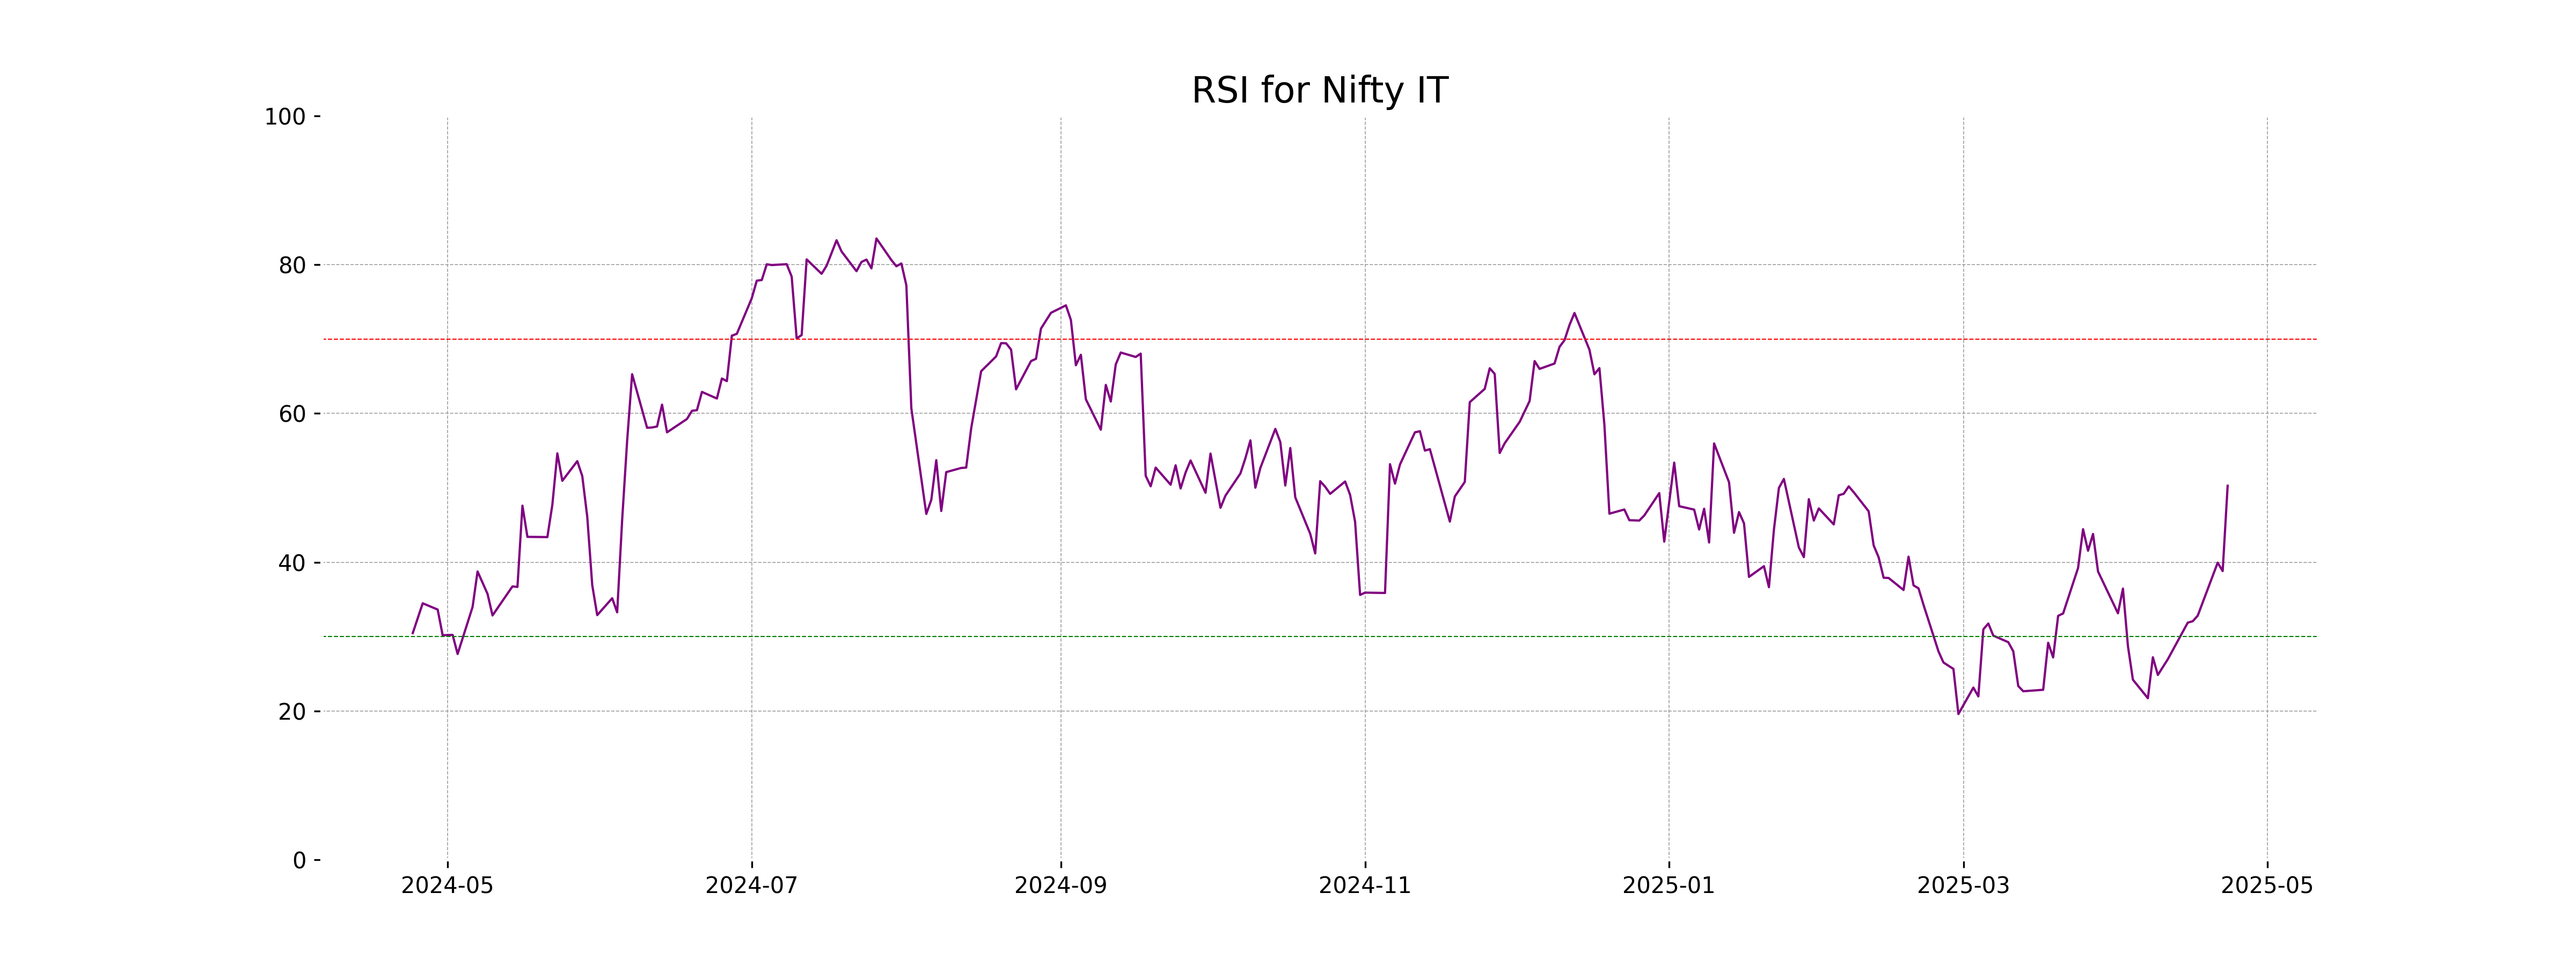
Analysis for Nifty IT - April 23, 2025

Nifty IT opened at 34,700.10 and closed at 35,414.65, marking a positive change of 4.34% from the previous close of 33,941.05, with a points change of 1,473.60. The index's RSI indicates a relatively neutral momentum at 50.28, while its MACD reading of -1052.58 suggests a bearish trend but is showing signs of convergence as it is moving closer to its signal line.

Relationship with Key Moving Averages
The Nifty IT index closed at 35,414.65, which is below both the 50-day EMA (37,017.43) and the 200-day EMA (39,257.93), indicating a potential bearish trend in the longer term. However, it is trading above the 10-day EMA (34,151.40) and 20-day EMA (34,805.97), suggesting short-term bullish momentum.
Moving Averages Trend (MACD)
MACD Analysis for Nifty IT: The MACD value for Nifty IT is -1052.58, which is above the MACD Signal of -1297.23. This suggests a potential bullish crossover, indicating that the index might experience positive momentum in the short term.

RSI Analysis
The current RSI value for Nifty IT is 50.28, indicating a neutral position, as it is relatively close to 50. This suggests that the index is neither overbought nor oversold. Investors may want to wait for further signals or trends to emerge before making any significant trading decisions.
Analysis for Nifty Metal - April 23, 2025

Nifty Metal saw a modest gain with its closing price at 8737.30, reflecting a 0.78% increase from its previous close of 8669.50, marking a points change of 67.80. The price movement for the day showed a high of 8747.65 and a low of 8589.30. Current technical indicators such as RSI are at 53.43, suggesting a relatively neutral stance, while the MACD of -57.35 indicates a bearish momentum, though better compared to its signal line at -72.43.

Relationship with Key Moving Averages
The Nifty Metal index closed slightly below its 200 EMA but above its 50, 10, and 20 EMAs, indicating a mixed short-term trend with potential bullish momentum. The MACD is negative, but the signal line is more negative, suggesting a possible increase in bullish momentum if the gap continues decreasing.
Moving Averages Trend (MACD)
The MACD (-57.35) for Nifty Metal is above the MACD Signal (-72.43), indicating a potential uptrend or bullish momentum. This suggests buying interest may be increasing, as the MACD is recovering from a prior lower level.

RSI Analysis
Based on the provided data for Nifty Metal, the RSI (Relative Strength Index) is 53.43. This value indicates that the stock is in a neutral zone, suggesting neither overbought nor oversold conditions at the moment. Traders may consider monitoring for any movements toward the 70 or 30 thresholds for potential buying or selling signals.

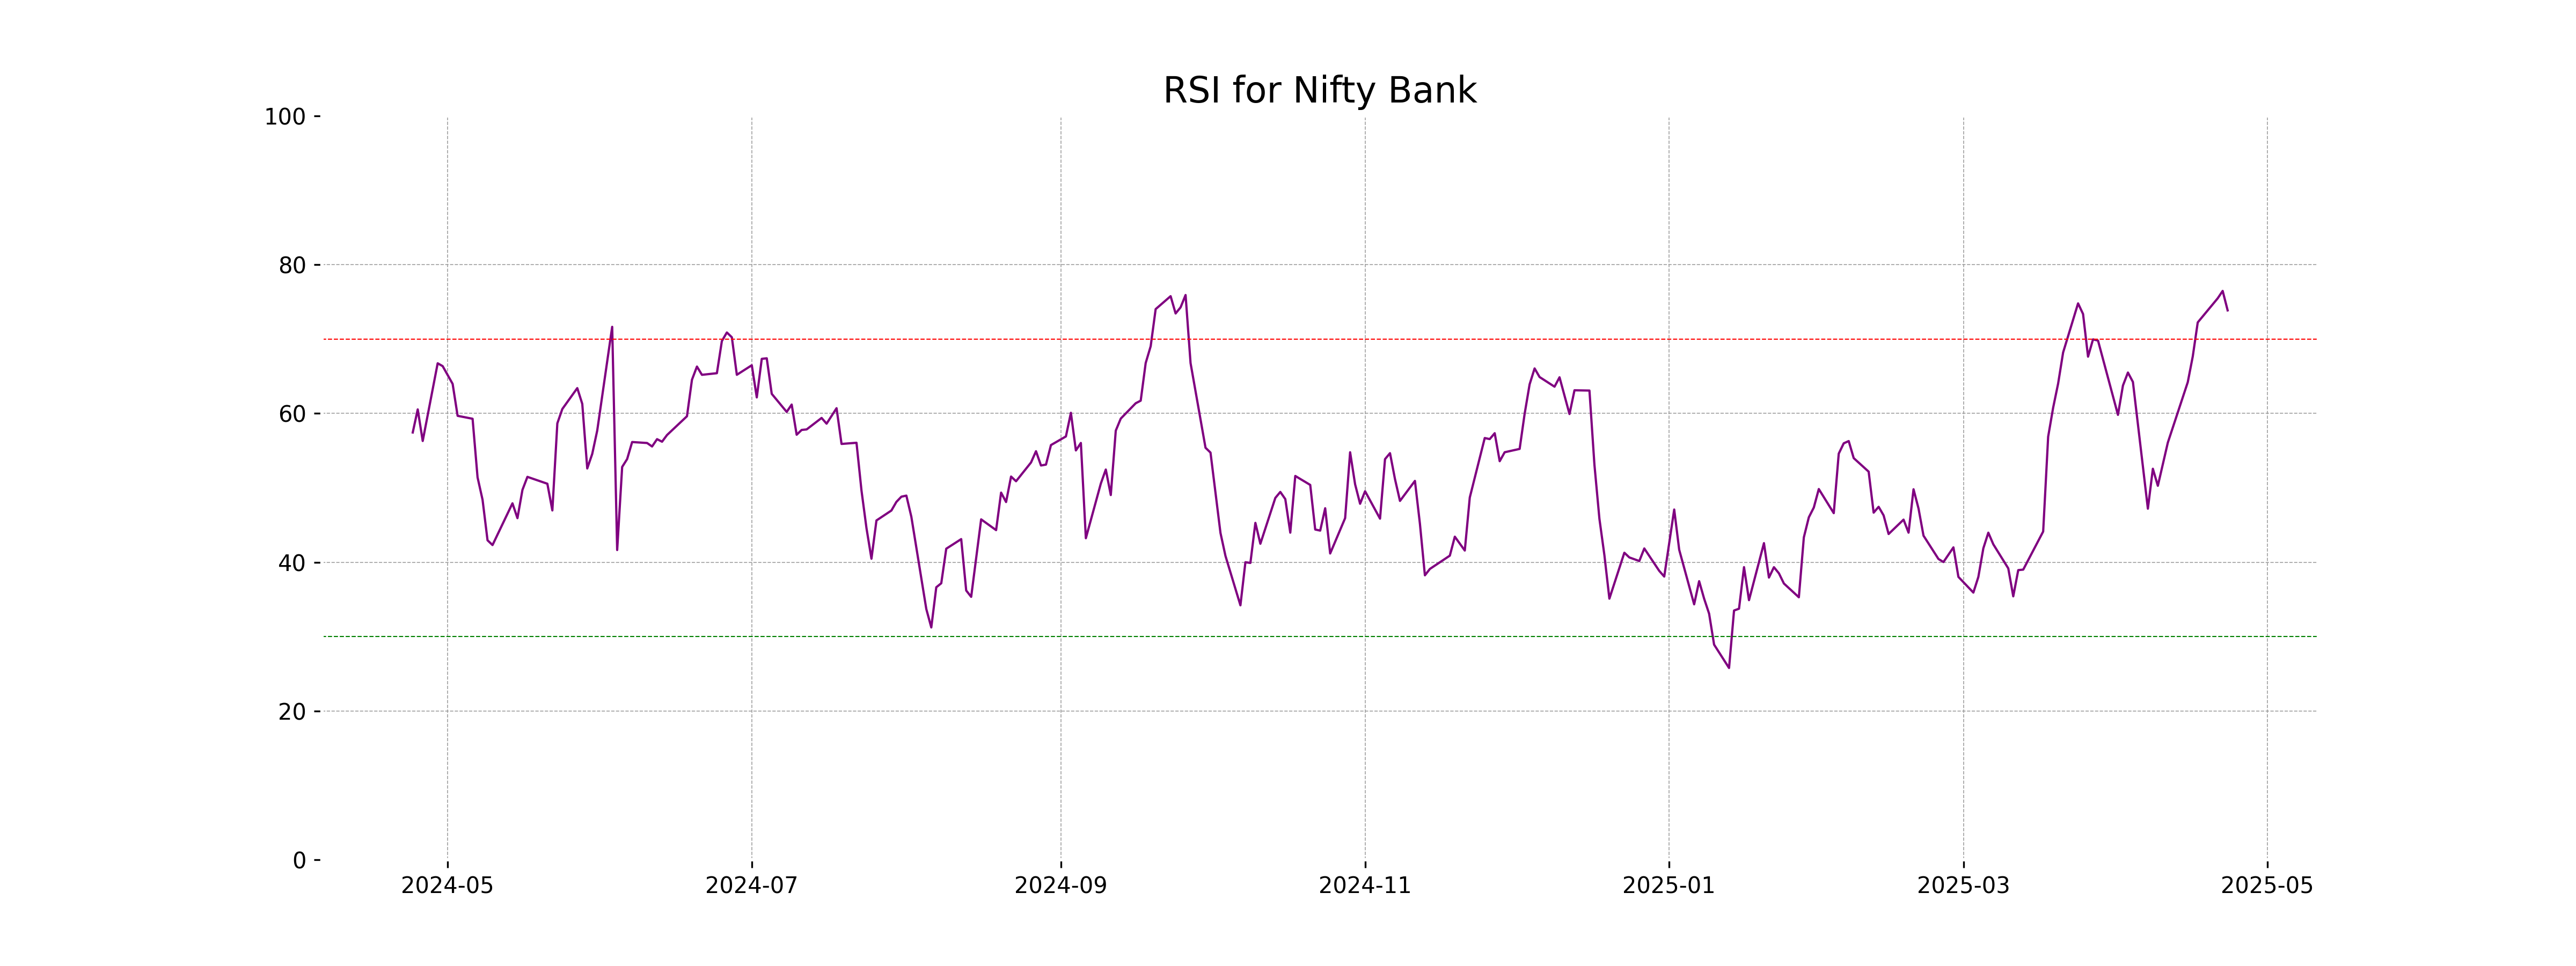
Analysis for Nifty Bank - April 23, 2025

The Nifty Bank index opened at 56097.10, reached a high of 56098.70, and closed at 55370.05, indicating a decrease of 0.50% from the previous close of 55647.20, with a points change of -277.15. The index shows strength with a high RSI of 73.86 and positive MACD of 1362.15, reflecting a bullish trend despite the day's decline.

Relationship with Key Moving Averages
The Nifty Bank is trading above its 50-day EMA of 50979.26 and 200-day EMA of 50308.26, indicating a strong upward trend. However, it's closer to its 10-day EMA of 53525.31 and 20-day EMA of 52297.38, which suggests recent short-term volatility.
Moving Averages Trend (MACD)
The MACD for Nifty Bank is 1362.15, which is significantly above the MACD Signal of 908.69. This indicates a bullish momentum in the stock's price movement. The positive MACD suggests a strong upward trend.

RSI Analysis
The Nifty Bank RSI is currently at 73.86, which is above the typical overbought threshold of 70. This suggests that the index may be experiencing overbought conditions and could be due for a potential pullback or consolidation. Traders might exercise caution when entering new long positions.
Analysis for Nifty 50 - April 23, 2025

Nifty 50 opened at 24,357.60 and closed at 24,328.95, marking a percentage increase of 0.67% or a points change of 161.70 from the previous close of 24,167.25. The technical indicators show that the index's RSI stands at 67.68, suggesting a slightly overbought condition, while the MACD at 275.31 is significantly above its signal line, indicating a strong upward trend.

Relationship with Key Moving Averages
The open, high, and close prices of Nifty 50 are all above the 50-day and 200-day exponential moving averages, suggesting a bullish trend. The 10-day and 20-day EMAs are also above the 50-day and 200-day EMAs, further indicating short-term upward momentum.
Moving Averages Trend (MACD)
Based on the provided data, the MACD value for Nifty 50 is significantly higher than the MACD Signal line, suggesting a bullish momentum. The MACD line at 275.31 indicates strong upward momentum compared to the Signal line at 127.91.

RSI Analysis
The RSI (Relative Strength Index) for Nifty 50 is at 67.68, which suggests the market is nearing the overbought territory, indicating potential for a price pullback or consolidation. However, it hasn't breached the 70 level, so the market might still have some room for upside movement before a potential reversal.

Up Next

Indian stock market sector-wise performance today - April 23, 2025

Step-by-step guide to apply for a mortgage loan online with minimal documentation

Honda Activa 6G: Everything You Need to Know Before Buying

How much does a ULIP plan really cost? A break-down of all charges

Centre plans to borrow Rs 8.20 lakh cr from market in first half of FY27

Reliance denies buying Iranian oil amid US sanctions waiver

More videos

Premium petrol price up Rs 2, industrial diesel up Rs 22; no change in normal petrol, diesel rates

India's GDP expected to register over 8 pc growth in Sep-Dec: Report

Govt announces seven measures to help boost exports

RBI keeps interest rates on hold after US trade deal boosts outlook

RBI proposes to compensate customers up to Rs 25,000 loss due to fraud

RBI raises GDP growth projection of Q1, Q2 of FY27

RBI pauses rate cuts, retains interest rate at 5.25 pc

Rupee jumps 122 paise to close at 90.27 against US dollar on India-US trade deal

Stock markets cheer India-US trade deal: Sensex, Nifty surge 2.5 pc

UPI transactions hit record high of Rs 230 lakh crore in 2025-26 till Dec: Govt