


Highlights
- Nifty Energy and Nifty IT led with % gains of 2.50% and 2.29%
- Nifty FMCG was the sole decliner, falling by 0.96%
- Bank Nifty rose sharply by 1.87%, adding 1014 points
Latest news

Samsung Galaxy Z Fold 8, Fold 8 Ultra & Z Flip 8: A More Mature Foldable Family

Dell Launches New Alienware 16X Aurora, 16 Area-51 and 18 Area-51 Gaming Laptops in India

Samsung Takes on Premium Home Audio With New Music Studio Series

The End of OxygenOS: OnePlus Confirms Shift to Oppo's ColorOS

Fujifilm Instax Mini Evo Cinema Review: A Hybrid Camera That Prints Memories Differently

iQOO Teases Z11 Lite With AI Tools, Military-Grade Durability and a 6500mAh Battery

Editorji Launches Hook Global, Its International Digital News Brand

Samsung's Bespoke AI ACs Focus on Humidity, Hygiene and Smarter Cooling
Indian stock market sector-wise performance today - April 21, 2025


The stock market on Monday (April 21, 2025) witnessed various movements across several indices, reflecting distinct trends in different sectors.
One of the highlights was the Nifty Auto index, which surged by 2.12%. This rise marked a significant upswing, positioning the Auto sector as one of the day's top performers.
The indices' positive trajectory was influenced by optimistic prospects in the automotive industry, possibly fueled by recent trends or announcements that bolstered investor confidence.
Similarly, the Nifty Energy index experienced a rise of 2.50%, indicating robust investor interest and a favorable performance.
Such a sharp increase could be attributed to various factors such as changes in energy policies, fluctuations in global energy prices, or strategic sector advancements.
The Nifty IT index followed suit with a commendable rise of 2.29%. Despite its previous volatility, the IT sector displayed resilience and potential for recovery, which likely attracted investor attention and contributed to the positive percentage change.
On the other hand, the Nifty FMCG index registered a decline of 0.96%, making it an outlier in terms of performance. The downturn could be attributed to altered consumer behavior, fluctuations in raw material prices, or other external factors affecting this traditionally stable sector.
Overall, the stock market's performance was multifaceted, with significant gains primarily led by the Auto and Energy sectors, and noteworthy investor interest in the IT sector.
However, the contrasted performance of the FMCG sector highlighted the day’s mixed sentiment among investors, showcasing the dynamic nature of market activities.

Analysis for Sensex - April 21, 2025

The Sensex opened at 78,903.09 and closed at 79,408.5, indicating a positive performance with a points change of 855.30 and a percentage increase of 1.09%. The day's trading saw a high of 79,635.05 and a low of 78,776.06. The Relative Strength Index (RSI) is at 65.77, suggesting relatively strong momentum.

Relationship with Key Moving Averages
The Sensex closed at 79,408.5, which is above its 50-day EMA of 76,229.18, 200-day EMA of 77,053.79, 10-day EMA of 76,830.78, and 20-day EMA of 76,304.98. This suggests a bullish sentiment as the closing price is higher than all key moving averages.
Moving Averages Trend (MACD)
Based on the data provided, Sensex is exhibiting a strong bullish momentum with the MACD line (491.40) significantly above the MACD Signal line (138.95), indicating a potential upward trend. The current RSI of 65.77 suggests that while the index is approaching overbought territory, it still has room for growth.

RSI Analysis
The RSI value for Sensex is 65.77, which indicates that the index is approaching the overbought zone, as RSI values above 70 typically signify overbought conditions. This suggests potential caution for investors as it could imply a possible price correction in the near term.

Analysis for Nifty Auto - April 21, 2025
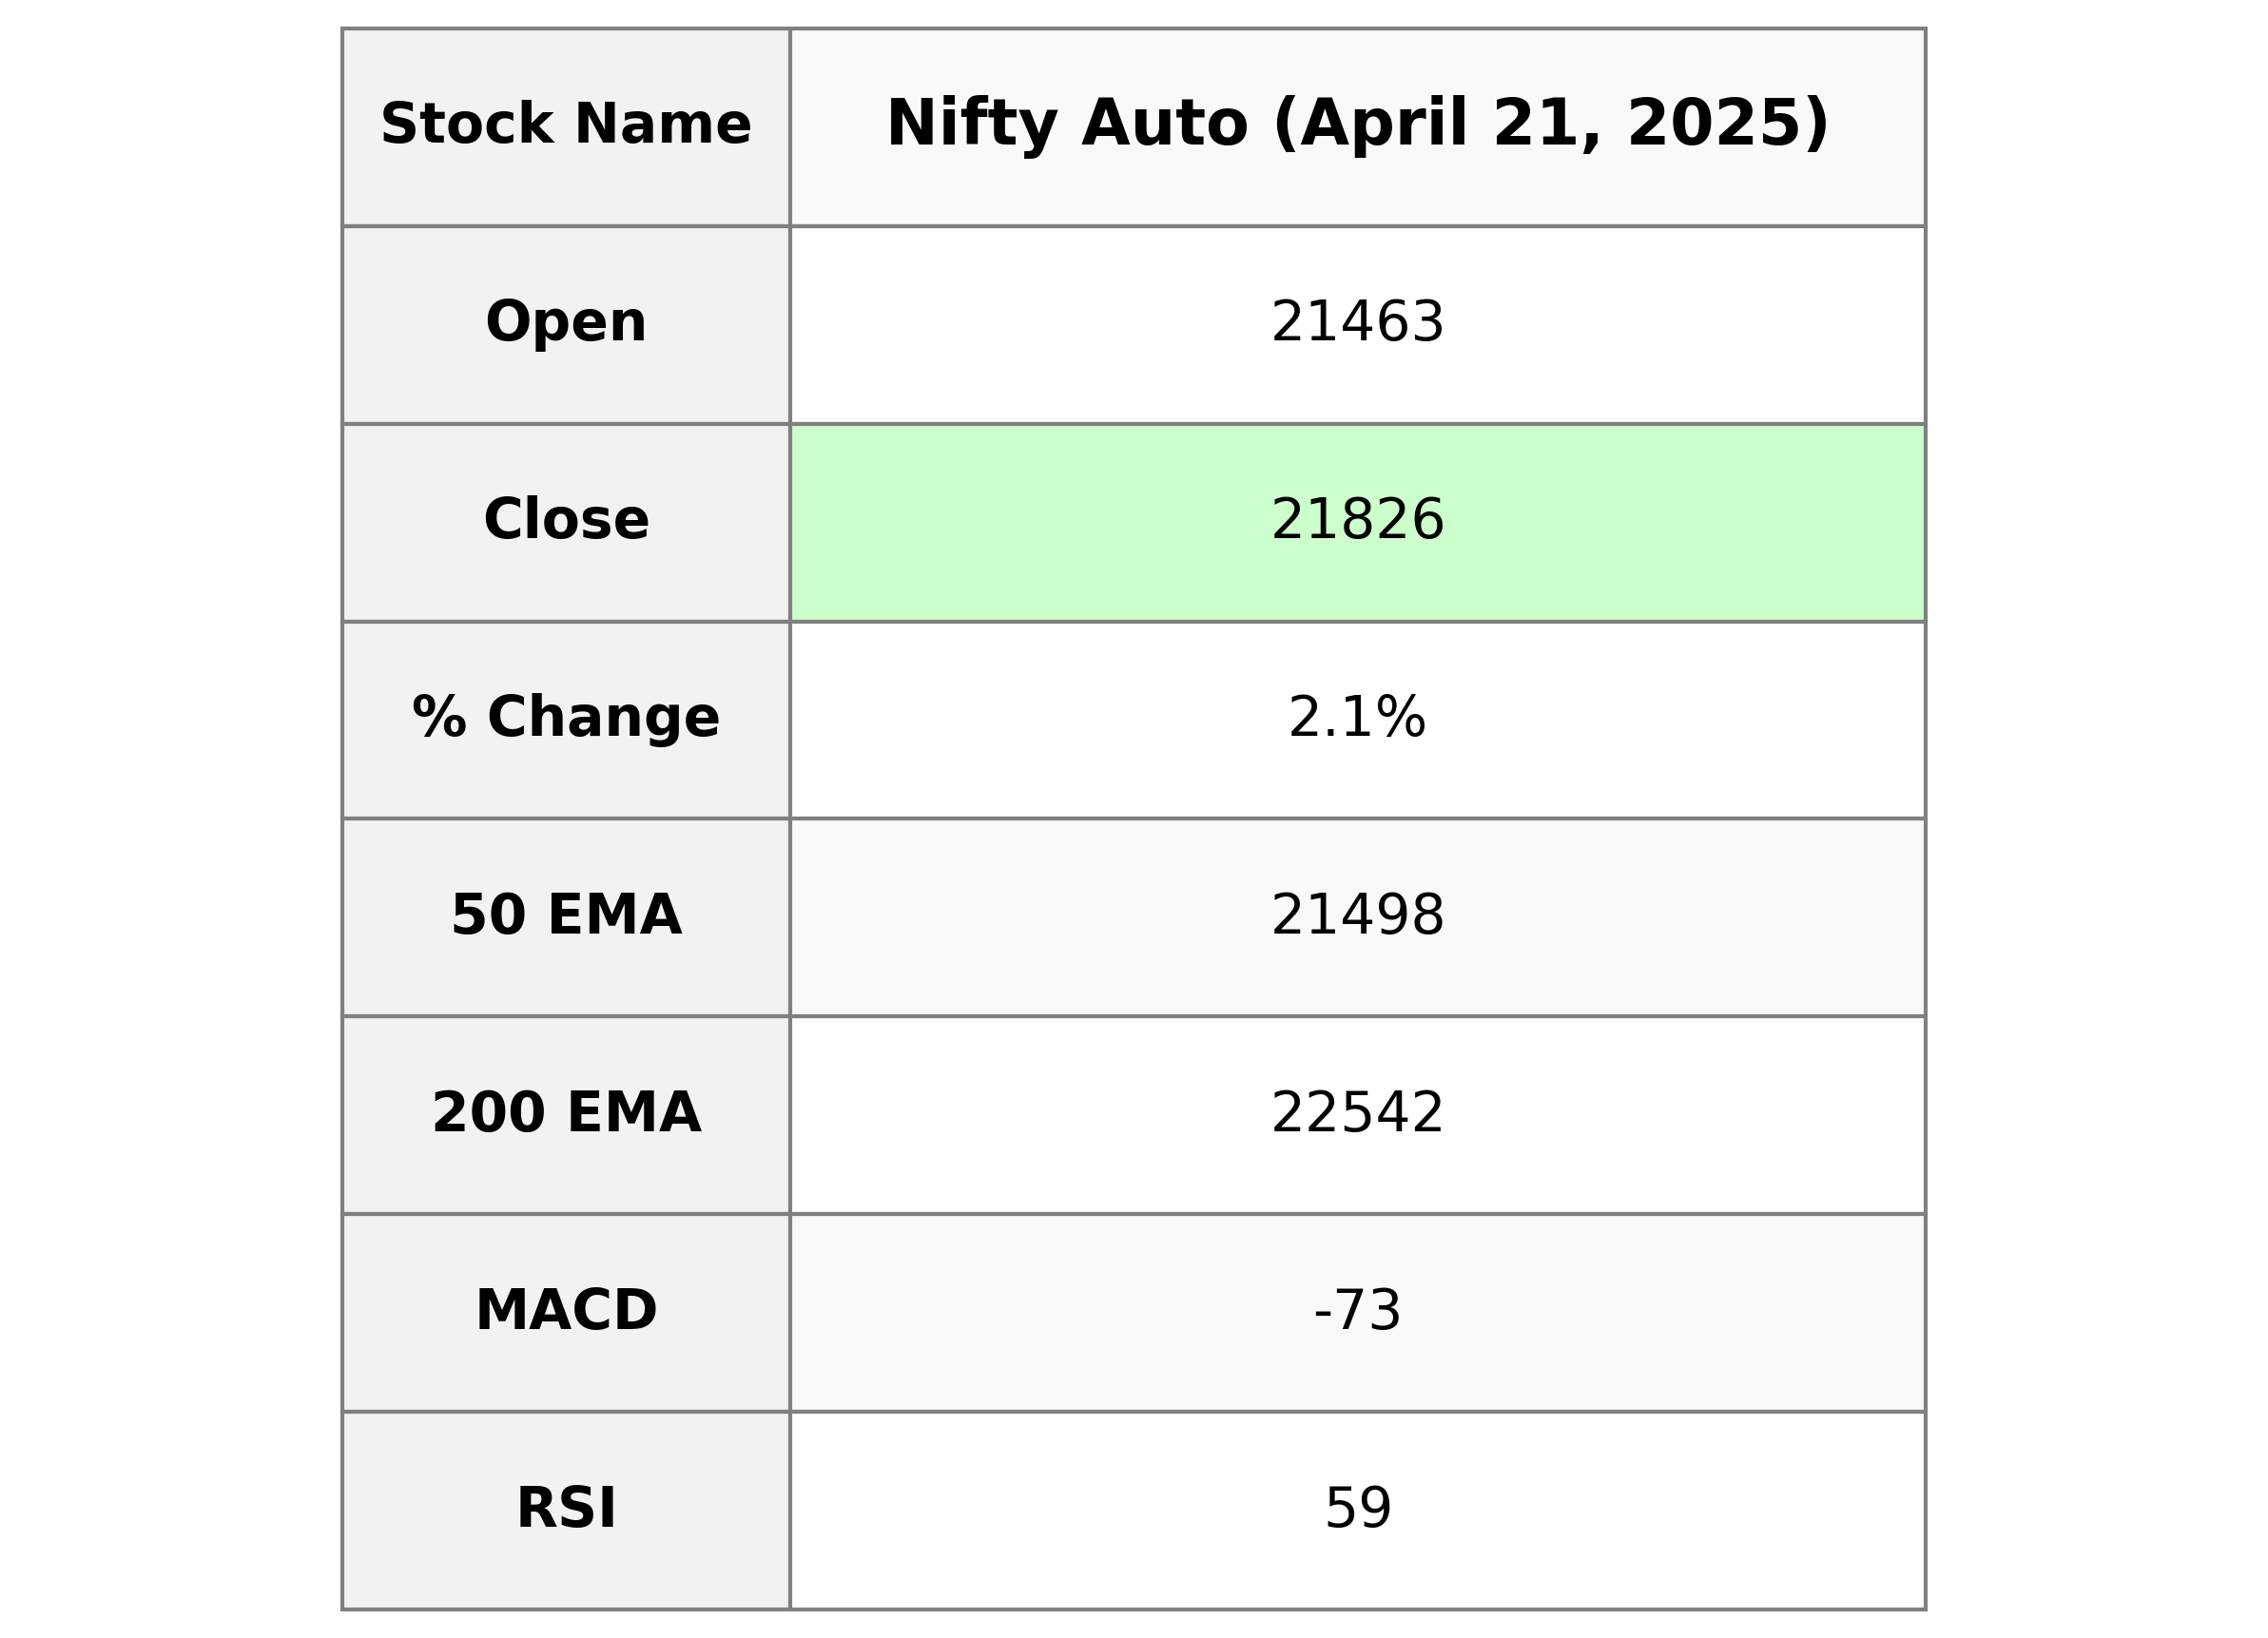
Nifty Auto opened at 21,463.45 and closed higher at 21,826.00, marking a change of 2.12% with a gain of 452.90 points from its previous close of 21,373.10. The RSI indicates a moderately strong momentum at 58.81, and the MACD suggests a bullish crossover as it moves towards the signal line. However, the 50 EMA is slightly below the current close, while the 200 EMA remains higher, indicating mixed medium to long-term trends.

Relationship with Key Moving Averages
Nifty Auto closed at 21826.0, which is above the 50-day EMA of 21497.63, indicating a positive short-term trend. It is also well above the 10-day EMA of 21100.59 and the 20-day EMA of 21098.49, suggesting bullish momentum. However, the current price is below the 200-day EMA of 22541.62, indicating that the longer-term trend may still be bearish.
Moving Averages Trend (MACD)
The MACD for Nifty Auto is -72.99, which is above the MACD Signal line of -185.90. This suggests a potential bullish momentum as the MACD line is indicating a move towards convergence with the signal line. It's important to monitor if this trend continues for a confirmed bullish signal.

RSI Analysis
The RSI for Nifty Auto is 58.81, indicating a neutral to slightly bullish momentum. Since it's below 70, the index is not overbought, suggesting there might still be some room for upward movement without immediate risk of a reversal.

Analysis for Nifty Energy - April 21, 2025

The Nifty Energy index opened at 33,968.5 and closed at 34,640.75, marking a significant rise with a 2.50% change from the previous close of 33,797.5. The index showed strong momentum with a high of 34,711.35 during the session and a MACD value of 343.98, indicating a bullish trend. The RSI stands at 64.88, suggesting that the index is approaching overbought conditions.

Relationship with Key Moving Averages
Nifty Energy closed at 34,640.75, which is above its 50 EMA of 32,871.51 and also above the 20 EMA of 32,902.25, indicating a short to medium-term bullish trend. However, it is still below the 200 EMA of 35,553.48, suggesting caution for long-term trends.
Moving Averages Trend (MACD)
The MACD value of 343.98 for Nifty Energy is notably above its signal line of 206.98, suggesting a bullish momentum in the stock. This indicates a positive trend, as the MACD is in positive territory above the zero line.

RSI Analysis
The latest RSI for Nifty Energy is 64.88, indicating a strong momentum nearing the overbought zone, typically defined as 70 and above. This suggests that while the index currently shows bullish momentum, it may be approaching resistance levels.

Analysis for Nifty FMCG - April 21, 2025

Nifty FMCG started the day at 56768.35 and experienced fluctuations, reaching a high of 56789.75 and a low of 56084.80, ultimately closing at 56130.20. The index witnessed a decline of 0.96% from the previous close, resulting in a point change of -544.00. The Relative Strength Index (RSI) of 68.29 indicates the index is close to overbought territory, while the Moving Average Convergence Divergence (MACD) is above the signal line, suggesting potential bullish momentum.

Relationship with Key Moving Averages
Nifty FMCG closed below its 10 EMA and 20 EMA, indicating short-term bearish sentiment. However, it remains slightly above its 200 EMA, suggesting possible long-term support. With the 50 EMA considerably lower than the closing price, the index maintains a robust overall trend.
Moving Averages Trend (MACD)
Based on the data provided for Nifty FMCG, the MACD is 886.65, which is above the MACD Signal line at 554.49. This indicates a bullish trend as the MACD line is above the Signal line, suggesting potential upward momentum in the stock's price.

RSI Analysis
Nifty FMCG RSI Analysis The RSI value for Nifty FMCG is 68.29, indicating that the index is approaching overbought territory as RSI values above 70 suggest overbought conditions. This may imply a correction or consolidation phase can be expected if buying momentum decreases.

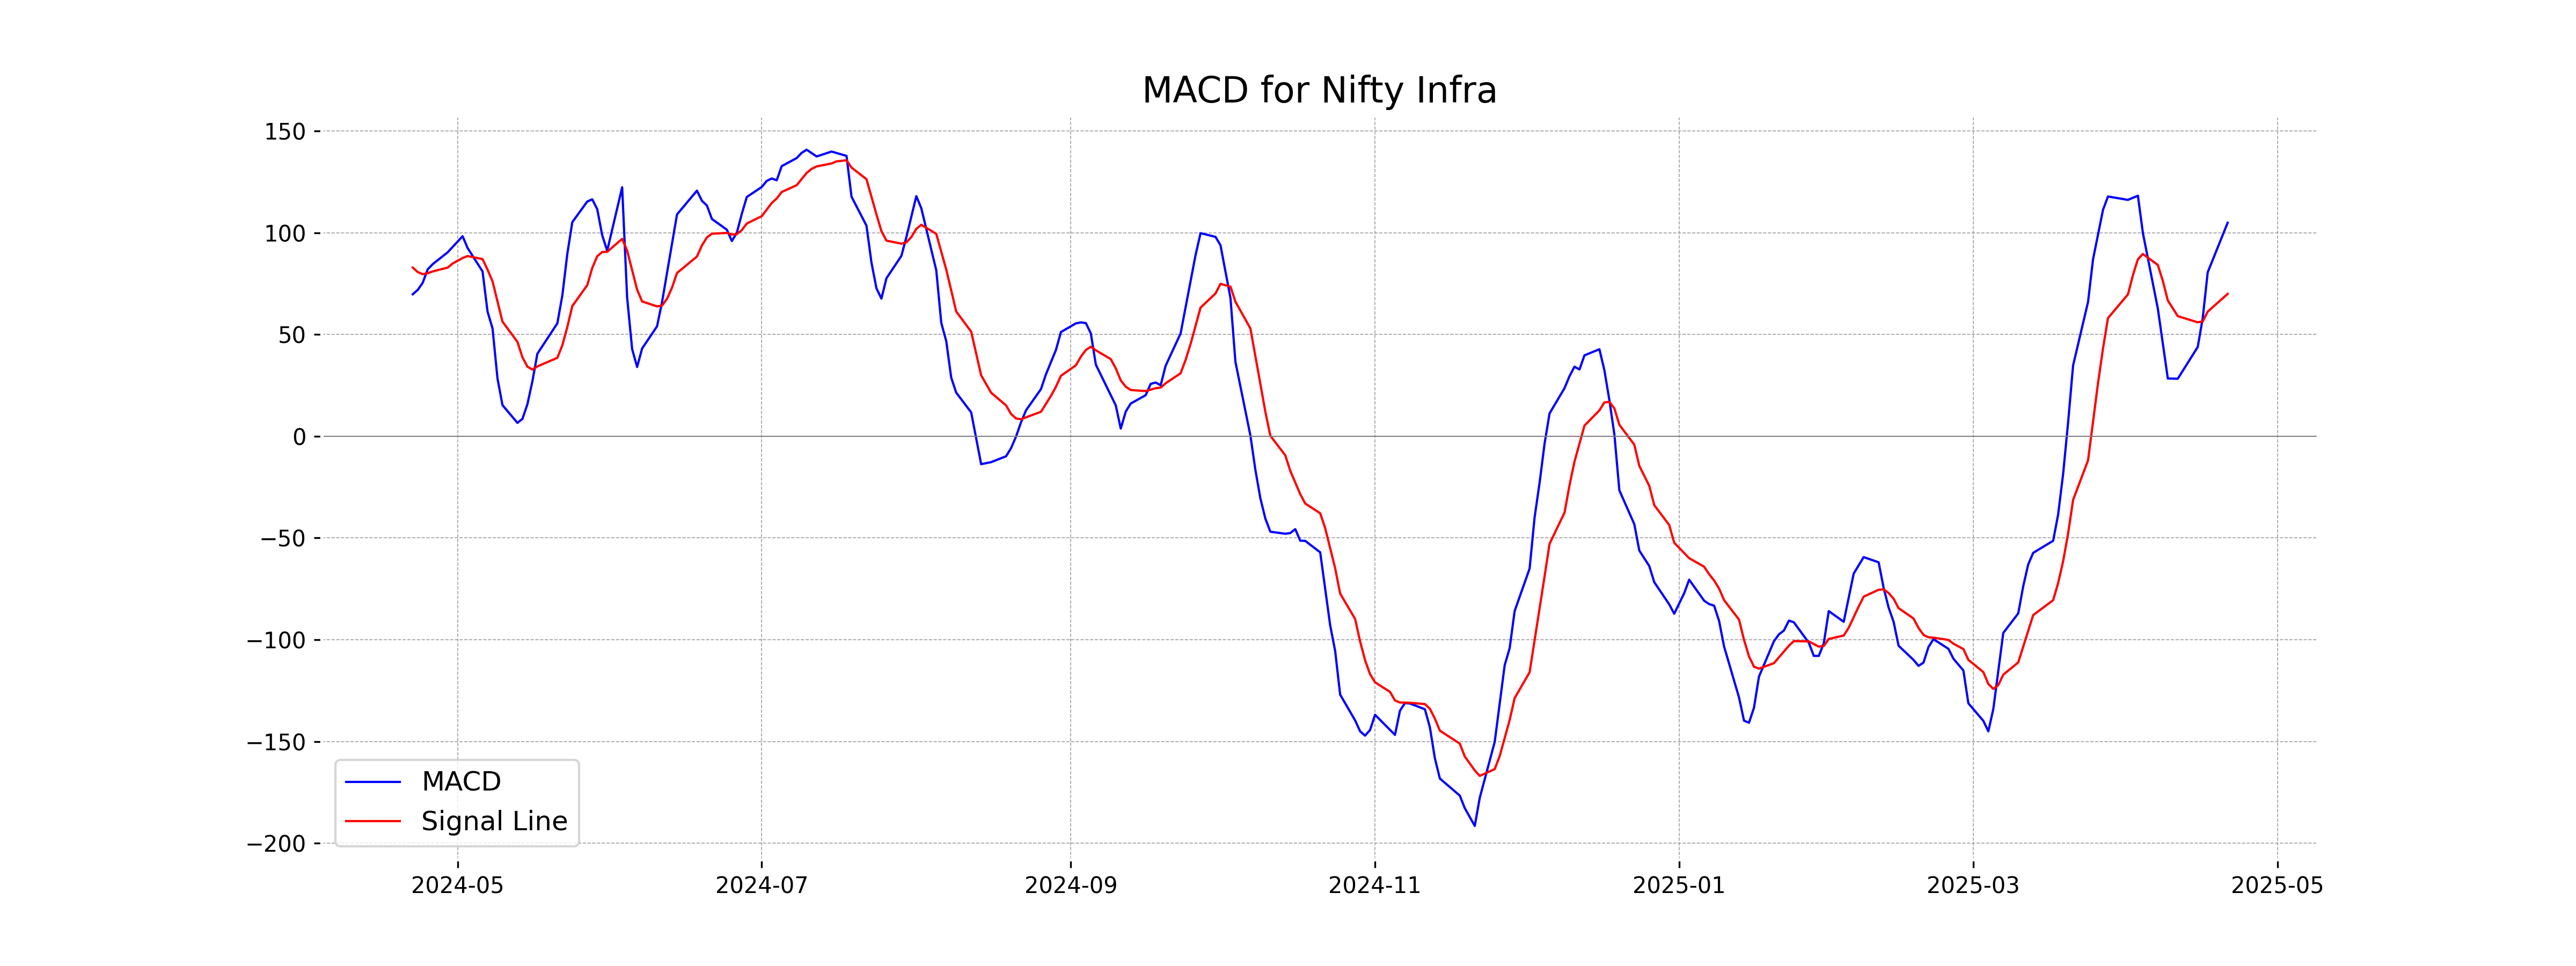
Analysis for Nifty Infra - April 21, 2025

Nifty Infra opened at 8653.90 and closed at 8728.60, showing a positive change with a percentage increase of 1.11% and a points change of 95.80 compared to the previous close. The index demonstrated a bullish momentum as indicated by the RSI of 66.78 and a positive MACD divergence.

Relationship with Key Moving Averages
Nifty Infra closed above its 50 EMA and 200 EMA, indicating a bullish momentum compared to these longer-term averages. It also closed well above its 10 EMA and 20 EMA, suggesting short-term strength in the index.
Moving Averages Trend (MACD)
Nifty Infra's MACD value is 104.94, notably higher than the MACD Signal line at 69.99, indicating a bullish trend. This crossover suggests potential upward momentum in the market.
RSI Analysis
The Nifty Infra index has an RSI of 66.78, indicating that it is nearing the overbought territory but still within the neutral range. This suggests a strong bullish momentum, but traders should be cautious of potential overbought conditions approaching the 70 mark.

Analysis for Nifty IT - April 21, 2025

Nifty IT Performance Description: Nifty IT saw a gain in its performance, closing at 34,135.05, which is 2.29% higher than its previous close. Despite the rally, its 50-day and 200-day EMA remain higher than the current level, indicating potential resistance ahead. The RSI is at 39.94, suggesting it is nearing the oversold territory, and the MACD shows a negative divergence. The trading volume remained minimal.

Relationship with Key Moving Averages
Nifty IT closed at 34135.05, which is above its 10-day EMA of 33855.04 but below both its 50-day EMA of 37211.08 and 200-day EMA of 39350.20. This indicates short-term bullishness, while long-term trends remain bearish.
Moving Averages Trend (MACD)
Nifty IT's MACD value is -1348.24, and the MACD Signal is -1383.89. As the MACD is higher than the signal line, it indicates a positive momentum shift, suggesting potential upward movement. However, both values being negative indicates bearish market conditions overall.

RSI Analysis
RSI Analysis for Nifty IT: The RSI (Relative Strength Index) is at 39.94, indicating that the stock is approaching oversold territory, as values below 30 typically suggest stronger oversold conditions. This suggests potential buying interest if the trend continues downward, but also warrants caution as it may signal underlying weakness.

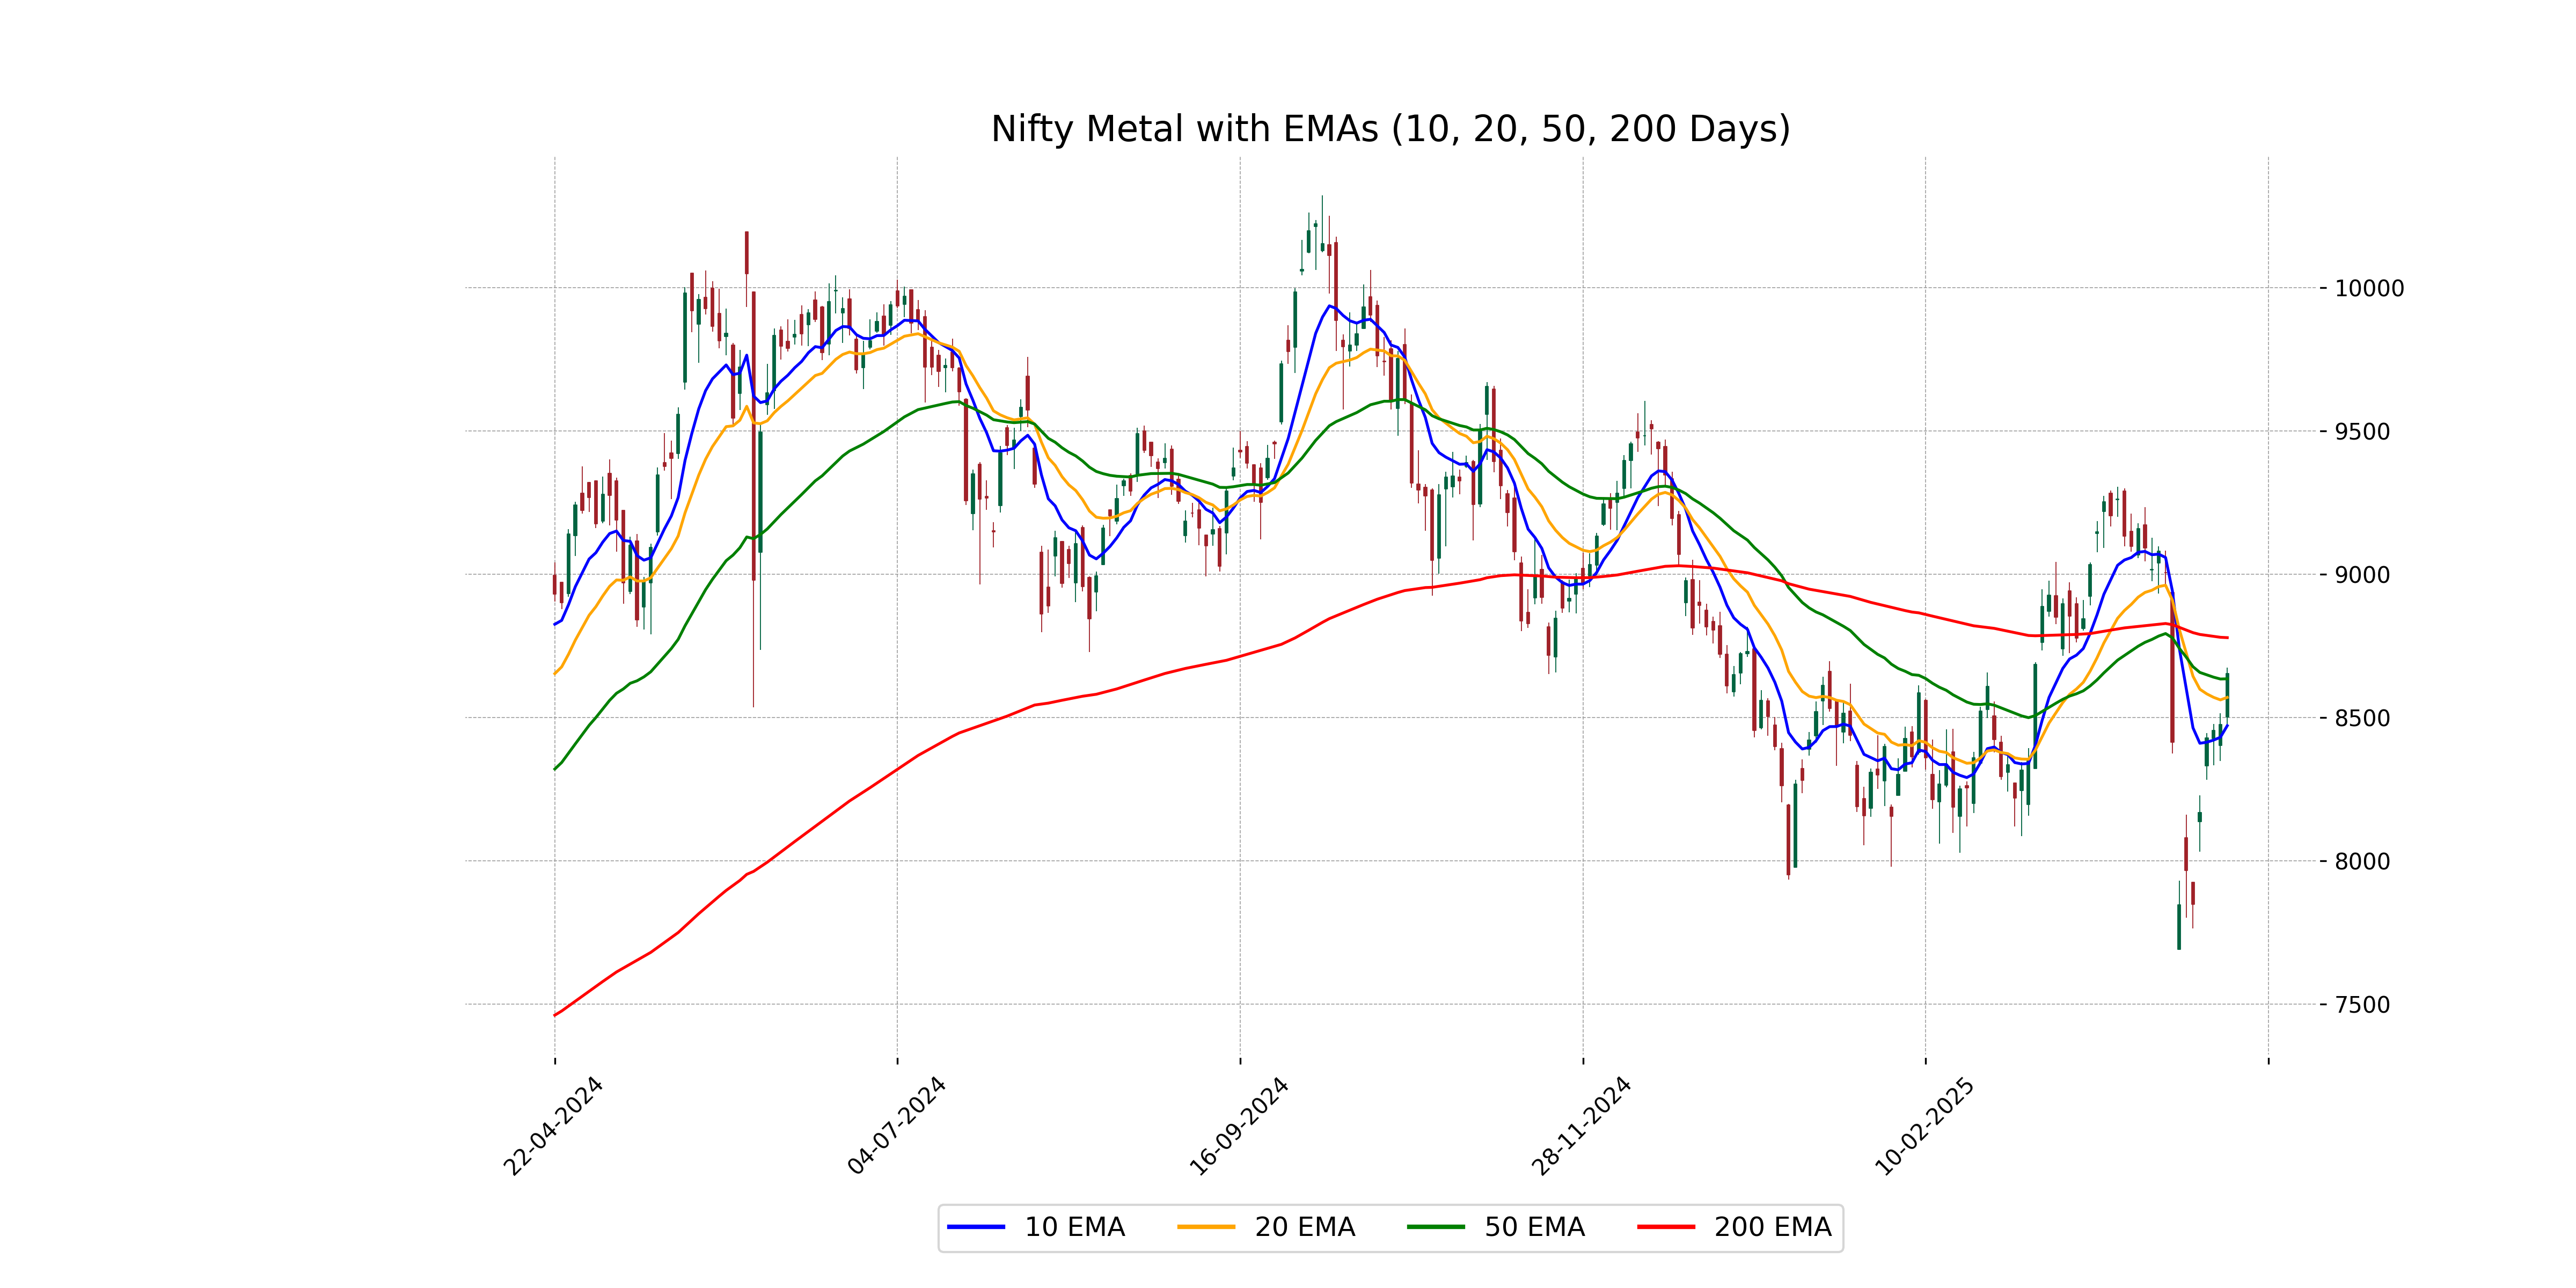
Analysis for Nifty Metal - April 21, 2025

Nifty Metal opened at 8502.75 and closed positively at 8653.5, with a notable percentage change of 2.09%. The index demonstrated a strong upward momentum with a points change of 177.0, surpassing its 10-day and 20-day EMAs but remaining below the 200-day EMA, indicating a potential bullish trend amidst medium-term resistance. The RSI value of 51.34 suggests a neutral market sentiment, while the MACD value indicates bearish momentum is slowly weakening.
Relationship with Key Moving Averages
The closing price of Nifty Metal is 8653.5, which is above its 50 EMA of 8635.33, suggesting short-term bullish momentum. However, it remains below the 200 EMA of 8778.94, indicating a possible long-term bearish trend. The 10 EMA at 8471.75 and 20 EMA at 8570.44 show that recent movements have been in the upward direction, aligning with the current closing price.
Moving Averages Trend (MACD)
The MACD value of -101.91, which is below the MACD Signal value of -75.13, indicates a bearish sentiment in the Nifty Metal. This suggests that the downward momentum might continue unless there is a positive crossover.

RSI Analysis
The RSI for Nifty Metal stands at 51.34, indicating that it is in a neutral zone, neither overbought nor oversold. This suggests that there may not be strong immediate pressure for a reversal or continuation of the current trend based on RSI alone.

Analysis for Nifty Bank - April 21, 2025

The Nifty Bank index opened at 54,891.25 and closed at 55,304.5, marking a positive change of 1.87% for the session. It experienced a high of 55,461.65 and a low of 54,674.95, with a notable points change of 1,014.30. The RSI is elevated at 75.48, indicating strong momentum, and the MACD is above the signal line, suggesting a bullish trend continuation.

Relationship with Key Moving Averages
Nifty Bank closed at 55304.5, which is above its 10 EMA (52552.73), 20 EMA (51587.28), 50 EMA (50602.20), and 200 EMA (50202.73), indicating a strong positive momentum. The RSI value of 75.48 suggests overbought conditions, and the MACD is well above the signal line, reinforcing bullish sentiment.
Moving Averages Trend (MACD)
The MACD value for Nifty Bank is 1062.54, which is above the MACD Signal of 681.42, indicating a bullish momentum. This suggests strong upward momentum in the stock.

RSI Analysis
The RSI for Nifty Bank is at 75.48, which suggests that it is in the overbought territory. This indicates a potential for a price correction or pullback in the near future if trading activity follows typical overbought conditions.

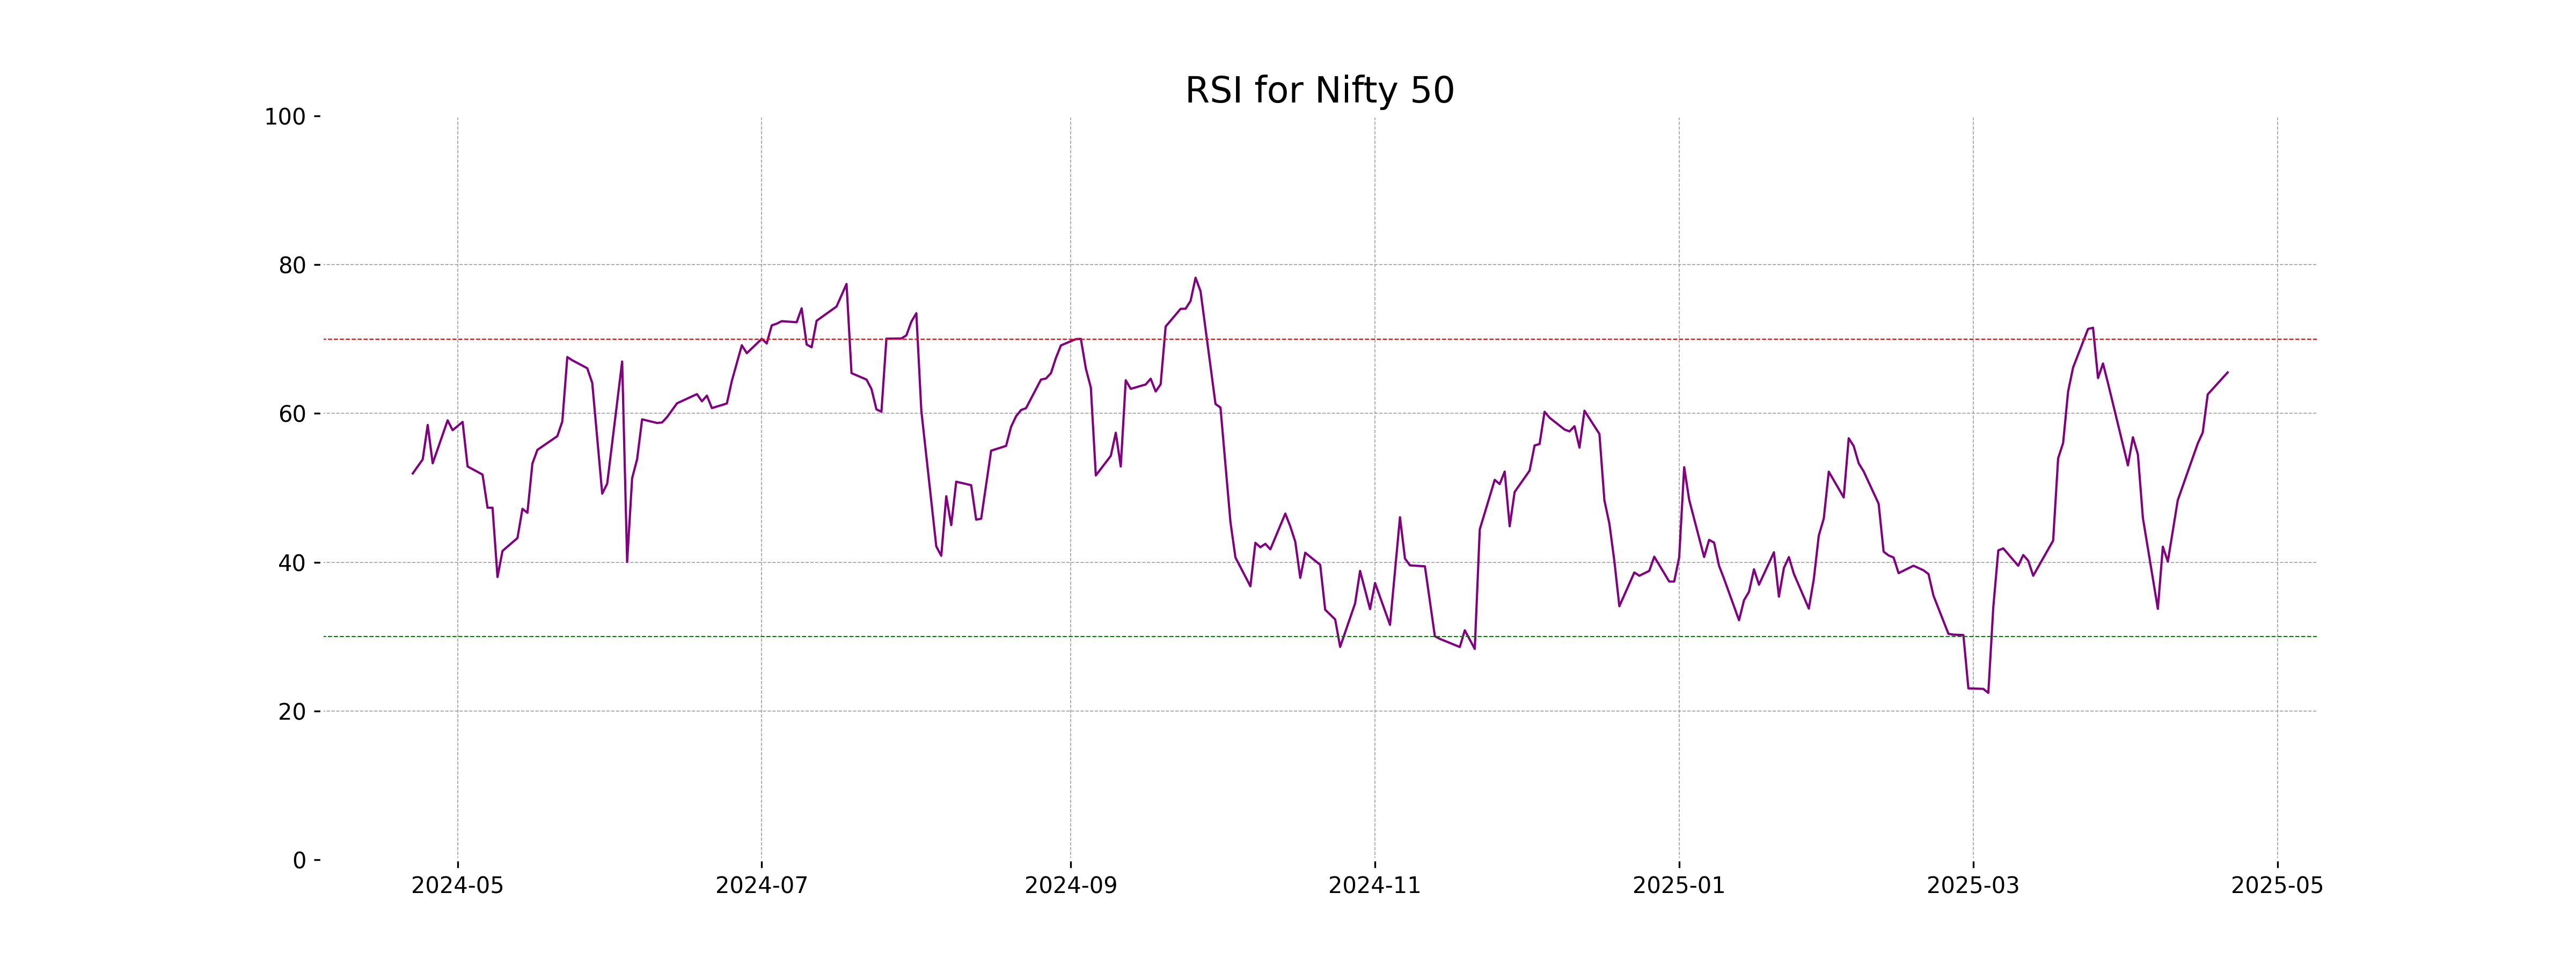
Analysis for Nifty 50 - April 21, 2025

Nifty 50 Performance Description: The Nifty 50 index opened at 23,949.15 and closed at 24,125.55, marking a gain of 273.90 points or a 1.15% increase compared to the previous close. The day's trading saw a high of 24,189.55 and a low of 23,903.65. With a Relative Strength Index (RSI) of 65.51, the market shows a bullish sentiment, as indicated by the positive divergence between the MACD and its signal line.

Relationship with Key Moving Averages
The Nifty 50 closed at 24,125.55, above its 10-day EMA of 23,342.87, 20-day EMA of 23,176.05, 50-day EMA of 23,128.08, and 200-day EMA of 23,379.08, indicating a bullish trend. The Relative Strength Index (RSI) is at 65.51, indicating potential further upward momentum.
Moving Averages Trend (MACD)
The MACD value for Nifty 50 is 161.92, which is above its signal line of 58.91, indicating a bullish trend. This suggests potential upward momentum in the stock price. The RSI value of 65.51 supports this positive sentiment but also indicates that the stock is approaching overbought levels.

RSI Analysis
Nifty 50 has an RSI value of 65.51, indicating it is in the neutral to slightly overbought territory. Typically, an RSI above 70 suggests overbought conditions, while below 30 indicates oversold conditions. The current RSI suggests moderate bullish sentiment in the market.
Up Next
Indian stock market sector-wise performance today - April 21, 2025

Step-by-step guide to apply for a mortgage loan online with minimal documentation

Honda Activa 6G: Everything You Need to Know Before Buying

How much does a ULIP plan really cost? A break-down of all charges

Centre plans to borrow Rs 8.20 lakh cr from market in first half of FY27

Reliance denies buying Iranian oil amid US sanctions waiver

More videos

Premium petrol price up Rs 2, industrial diesel up Rs 22; no change in normal petrol, diesel rates

India's GDP expected to register over 8 pc growth in Sep-Dec: Report

Govt announces seven measures to help boost exports

RBI keeps interest rates on hold after US trade deal boosts outlook

RBI proposes to compensate customers up to Rs 25,000 loss due to fraud

RBI raises GDP growth projection of Q1, Q2 of FY27

RBI pauses rate cuts, retains interest rate at 5.25 pc

Rupee jumps 122 paise to close at 90.27 against US dollar on India-US trade deal

Stock markets cheer India-US trade deal: Sensex, Nifty surge 2.5 pc

UPI transactions hit record high of Rs 230 lakh crore in 2025-26 till Dec: Govt