


Highlights
- Global indices reflect mixed investor sentiment worldwide
- Major markets trade near or above EMAs
- MACD trends hint at bullish momentum building
Latest news

Haier Launches HQLED P7 Pro Series TVs With Google Gemini, 50W Audio And AI Picture Enhancements

Nothing's Latest Pokémon Teasers Hint At New Hardware, RCB Collaboration May Also Be In The Works

OnePlus N6 Set To Debut With Massive 8,000mAh Battery And Long-Term Performance Focus

Roblox Introduces Age-Based Accounts for Younger Users, Expands Parental Controls Globally

IIFL Capital Launches Algo Marketplace with Over 100 Ready-Made Strategies

LUMIQ Raises INR 50 Crore Pre-Series B to Become the AI Decision Layer for Financial Services

Tay Keith, producer behind Travis Scott's 'Sicko Mode' dies at 29

GenAI could lift realty sales velocity by up to 50%, speed up launches by 30%: Report
Global stock market indices: How the world markets performed today - 01 May 2025


The international stock market indices showed varied performances on May 01, 2025, reflecting the economic sentiment across different regions.
In this article, we analyze the performance of key global indices including the S&P 500, Dow Jones Industrial Average, NASDAQ Composite, FTSE 100, DAX, CAC 40, IBEX 35, Nikkei 225, Hang Seng, Nifty 50, and BSE Sensex.

Analysis for Sensex - May 01, 2025

The Sensex opened at 80,370.80 and closed slightly lower at 80,242.24, marking a points decrease of 46.14 from the previous close. The Relative Strength Index (RSI) suggests that the stock is relatively strong with a value of 65.64. The MACD indicator, at 1209.16, is above the signal line, indicating recent bullish momentum.

Relationship with Key Moving Averages
The Sensex opened above its 50 EMA and 200 EMA, indicating a potential bullish trend, as the open value is significantly higher than these averages. The 10 EMA and 20 EMA are also lower than the open, suggesting recent upward momentum. The close is slightly below the open but still above the EMAs, pointing to an ongoing positive trend despite a minor daily loss.
Moving Averages Trend (MACD)
The MACD for Sensex is currently at 1209.16, with a MACD Signal of 880.01, showing a bullish divergence. This suggests upward momentum as the MACD line remains above the signal line, indicating potential buy signals.

RSI Analysis
The Sensex RSI of 65.64 suggests the market is approaching overbought territory but is still below the typical 70 threshold. This indicates increasing buying interest, but investors should watch for potential reversals.

Analysis for Dow Jones Industrial Average (US) - May 01, 2025

The Dow Jones Industrial Average (US) opened at 40,290.41 and closed at 40,669.36, marking a gain of 141.74 points or a 0.35% increase from the previous close of 40,527.62. The index experienced a trading range with a high of 40,777.16 and a low of 39,745.63. The Relative Strength Index (RSI) is at 51.73, indicating a neutral momentum, while the MACD suggests a bearish trend with a value of -334.65 compared to the MACD Signal of -571.11.

Relationship with Key Moving Averages
The Dow Jones Industrial Average opened below its 10-day and 20-day EMAs and remained beneath both throughout the trading session, closing at 40669.359, which is still below its 50-day EMA of 41150.466 and 200-day EMA of 41610.787. This positioning indicates short-term weakness when compared to key moving averages.
Moving Averages Trend (MACD)
The Dow Jones Industrial Average shows a MACD of -334.65, which is above the MACD Signal of -571.11, indicating a potential bullish momentum. However, since both values are negative, overall market conditions may still be weak.

RSI Analysis
The current RSI for Dow Jones Industrial Average is 51.73, indicating a neutral market condition as it is close to the mid-point of 50. This suggests a balanced momentum without clear overbought or oversold signals.

Analysis for CAC 40 (France) - May 01, 2025

CAC 40 (France) opened at 7586.65 and closed at 7593.87, marking a modest gain with a percentage change of 0.50%. The index experienced a fluctuation between a high of 7609.32 and a low of 7512.23, with a trading volume of 111,554,900. The 14-day Relative Strength Index (RSI) suggests a moderately strong market at 52.31.

Relationship with Key Moving Averages
The CAC 40 index, with a closing price of 7593.87, is trading below both its 50 EMA at 7642.63 and its 200 EMA at 7648.78, indicating a potential bearish trend. However, it is above its 10 EMA of 7480.23 and 20 EMA of 7497.76, suggesting some short-term bullish momentum.
Moving Averages Trend (MACD)
The MACD for the CAC 40 (France) is -63.47, which is above the MACD Signal of -125.80. This crossover suggests a potential bullish trend, indicating that momentum may be shifting to the upside.

RSI Analysis
The RSI for CAC 40 (France) stands at 52.31, indicating a neutral market sentiment, as it neither leans towards overbought nor oversold conditions. This suggests that the current price level might continue in the same trend unless significant market changes occur.

Analysis for FTSE 100 (UK) - May 01, 2025

FTSE 100 (UK) saw a slight decline with a close at 8493.5 compared to the previous close of 8494.9, marking a percentage change of -0.016%. The index showed a minor points decrease of 1.4 points, with an RSI of 56.55 indicating a balanced market. Key moving averages, such as the 50-day EMA at 8422.26 and 200-day EMA at 8337.58, suggest the index is trading above these averages.

Relationship with Key Moving Averages
The FTSE 100's close at 8493.5 positions it above the 50-day EMA of 8422.26 and significantly above the 200-day EMA of 8337.58, indicating a bullish trend relative to these key averages. However, it's also positioned above the 10-day EMA of 8394.59 and the 20-day EMA of 8364.43, reinforcing the near-term upward momentum.
Moving Averages Trend (MACD)
The MACD for FTSE 100 indicates a bullish crossover, as the MACD line (4.2324) is above the MACD Signal line (-48.6753). This suggests potential upward momentum in the market. However, traders should also consider other indicators and market conditions.

RSI Analysis
The RSI for the FTSE 100 stands at 56.55, indicating that the index is neither overbought nor oversold; it's in a neutral zone. This suggests a balance between buying and selling pressures, with potential for price movement in either direction.

Analysis for DAX (Germany) - May 01, 2025

The DAX index of Germany opened at 22,520.49, reaching a high of 22,607.32 and a low of 22,235.74, before closing at 22,496.98. This reflects a 0.32% increase from its previous close of 22,425.83, with a points change of 71.15. The RSI is at 59.05, indicating modest momentum, while the MACD value at 65.49 is well above its signal line, suggesting a bullish trend.

Relationship with Key Moving Averages
For the DAX (Germany), the current closing price of 22,496.98 is above the 50-day EMA of 21,819.03 and the 20-day EMA of 21,795.07, indicating a potential upward trend. The current price is also above the 10-day EMA of 21,945.93, reinforcing the bullish sentiment. Additionally, the price is well above the 200-day EMA of 20,488.47, suggesting a strong positive momentum overall.
Moving Averages Trend (MACD)
The MACD for DAX stands at 65.49, which is above the MACD Signal value of -156.13. This indicates a bullish trend suggesting that the stock might be experiencing upward momentum. Traders may view this as a potential buy signal, but it's important to consider other indicators for a comprehensive analysis.

RSI Analysis
The Relative Strength Index (RSI) for DAX (Germany) is 59.05, which suggests that the index is in neutral territory, neither overbought nor oversold. Generally, an RSI above 70 indicates an overbought condition, while below 30 suggests oversold conditions. Thus, DAX is currently displaying moderate momentum without extreme price pressures.

Analysis for S&P 500 (US) - May 01, 2025

The S&P 500 (US) opened at 5499.44, experienced a high of 5581.84, and closed at 5569.06, marking a slight increase of 0.15% or 8.23 points from the previous close. The index shows a moderate relative strength with an RSI of 54.77, indicating a balanced trading condition, and is slightly below its 50-day and 200-day exponential moving averages.

Relationship with Key Moving Averages
The S&P 500 opened below its 50 EMA of 5570.25, slightly closing above it at 5569.06. It remains below the 200 EMA of 5640.79, suggesting potential bearish pressure. Additionally, with the MACD below the signal line, there may be a lack of strong upward momentum.
Moving Averages Trend (MACD)
The MACD for the S&P 500 is -18.59, which is above its MACD Signal of -68.24, suggesting a bullish momentum is starting to build as the MACD is converging towards the signal line. This implies potential upward momentum in the short term.

RSI Analysis
The S&P 500 has an RSI of approximately 54.77, indicating that it is in the neutral zone, not indicating overbought or oversold conditions. This suggests a balanced momentum currently, with no strong directional bias in the market.

Analysis for Hang Seng Index (Hong Kong) - May 01, 2025

Hang Seng Index (Hong Kong) Performance: The Hang Seng Index opened at 22,038.73, reaching a high of 22,129.31 and a low of 21,848.33, before closing at 22,119.41, showing a % change of 0.51% from the previous close of 22,008.11. The trading volume was about 4.68 billion, with the 50-day EMA at 22,102.22 and the 200-day EMA at 20,580.85. The RSI stood at 50.74, indicating a neutral market trend.

Relationship with Key Moving Averages
The Hang Seng Index's close price of 22,119.41 is slightly above its 50-day EMA of 22,102.22, indicating a potential bullish signal in the short term. However, it remains well above its longer-term 200-day EMA of 20,580.85, suggesting a general uptrend. Additionally, the close is above the 10-day and 20-day EMAs, reinforcing the short-term positive momentum.
Moving Averages Trend (MACD)
The MACD for Hang Seng Index (Hong Kong) is currently -207.63, while the MACD Signal is -342.61, indicating a possible bullish divergence as the MACD is above the signal line. This could suggest a potential for upward momentum if the trend continues.

RSI Analysis
The RSI for Hang Seng Index (Hong Kong) is currently at 50.74, which indicates a neutral position — neither overbought nor oversold. It suggests that the market is relatively balanced at this point, without strong momentum in either direction.

Analysis for IBEX 35 (Spain) - May 01, 2025

The IBEX 35 index opened at 13,368.40 and closed at 13,287.80, experiencing a decline of 0.59%, equivalent to a points change of -79.10. The daily trading volume was 200,803,500, and the index shows a moderate RSI of 56.98, indicating a neutral momentum. The Moving Average Convergence Divergence (MACD) is at 108.34 with a signal line of 18.87, suggesting a positive momentum trend compared to the signal.

Relationship with Key Moving Averages
The IBEX 35 index closed at 13287.80, which is above its 50-day EMA of 12896.40, indicating a short-term uptrend. However, it is also above the 200-day EMA of 12113.13, suggesting a long-term bullish trend. The close is slightly above the 10-day EMA of 13150.22 and 20-day EMA of 13028.74, supporting short-term momentum.
Moving Averages Trend (MACD)
The MACD for IBEX 35 is 108.34, with a MACD Signal of 18.87. Since the MACD is significantly above the signal line, this may indicate a bullish trend, suggesting potential upward momentum in the short term.

RSI Analysis
The IBEX 35 in Spain has an RSI value of 56.98, which indicates a neutral market sentiment at the moment. The RSI suggests neither overbought nor oversold conditions, but the index is closer to being overbought if it continues trending upwards.

Analysis for NASDAQ Composite (US) - May 01, 2025

NASDAQ Composite (US) Performance: The NASDAQ Composite opened at 17,099.98, reaching a high of 17,483.82 and closing at 17,446.34. It showed a slight decline with a percentage change of -0.086% from the previous close, alongside a modest volume of 8,595,330,000. Key technical indicators such as MACD and RSI suggest mild bearish sentiment around the current market level.

Relationship with Key Moving Averages
NASDAQ Composite (US) Relationship with Key Moving Averages: The current close of 17,446.34 for NASDAQ Composite is below the 50-EMA of 17,505.69 and the 200-EMA of 17,940.55, suggesting a bearish trend relative to these averages. However, it remains slightly above the 10-EMA of 17,050.19 and the 20-EMA of 16,987.72, indicating potential short-term strength.
Moving Averages Trend (MACD)
NASDAQ Composite (US) demonstrates a MACD value of -60.77, indicating a bearish momentum as it is below the MACD Signal line of -259.08. This suggests that the stock may continue its downward trend unless there is a significant positive change in momentum.

RSI Analysis
The RSI (Relative Strength Index) for NASDAQ Composite is 54.60, which indicates a neutral market condition. This suggests that the index is neither overbought nor oversold, implying balanced price momentum at this time.

Analysis for Nikkei 225 (Japan) - May 01, 2025

The Nikkei 225 (Japan) opened at 36,197.04 and closed higher at 36,452.30, marking a daily gain of 1.13% or 406.92 points increase from the previous close of 36,045.38. Despite being below the long-term 200-day EMA of 37,412.05, the short-term indicators show improvement, with an RSI of 57.81 indicating moderate buying pressure.

Relationship with Key Moving Averages
Nikkei 225 is trading above its 50-day EMA of 36025.81 and its 10-day EMA of 35359.10, suggesting short-term bullish momentum. However, it remains below its 200-day EMA of 37412.05, indicating potential long-term bearishness.
Moving Averages Trend (MACD)
The MACD for Nikkei 225 is at -49.37, which is above its MACD signal line of -449.52, indicating a potential bullish signal as the MACD line is moving towards crossing above the signal line. This could suggest a reversal or strengthening in momentum to the upside, but confirmation in subsequent sessions is advisable.

RSI Analysis
The RSI value for Nikkei 225 is 57.81, indicating a moderately strong level, suggesting that the index is neither overbought nor oversold. Since the RSI is slightly above the midpoint of 50, it suggests a potential for continued upward momentum in the index.

Analysis for Nifty Bank - May 01, 2025
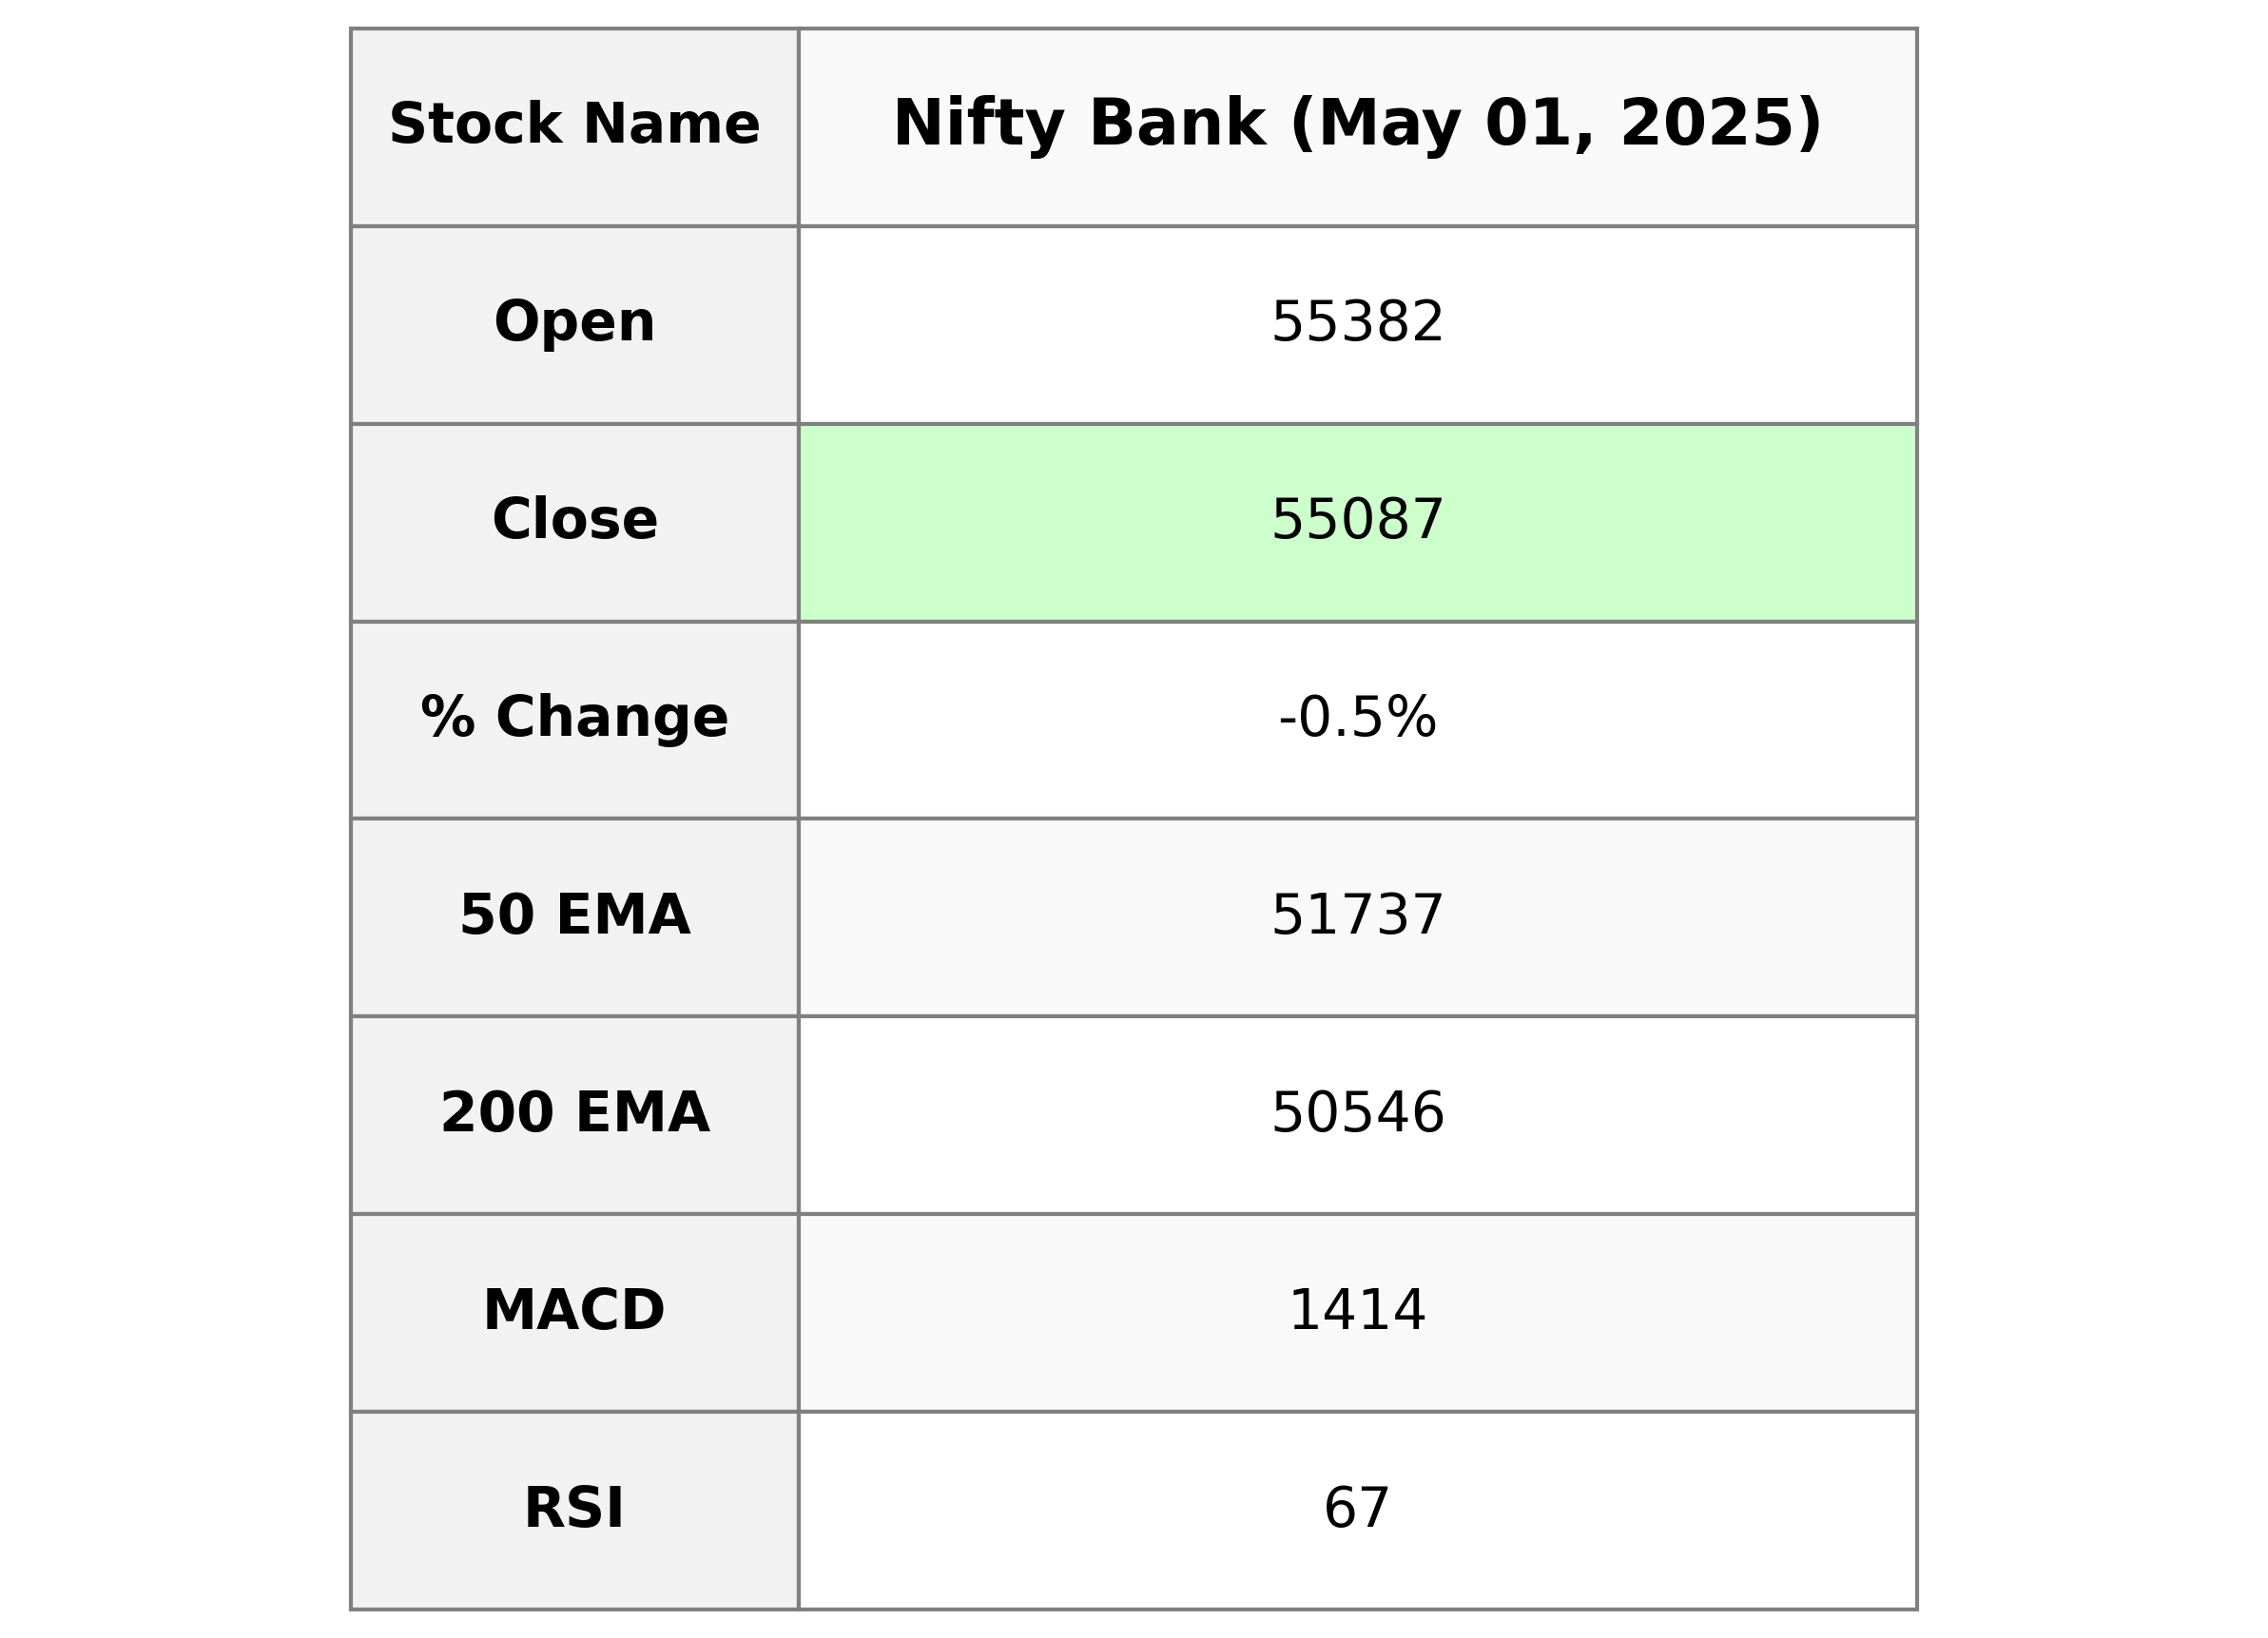
Nifty Bank opened at 55,382.40 and closed at 55,087.15, marking a decline of approximately 0.55%, with a points change of -304.10. The day's high and low were 55,478.25 and 54,723.70 respectively, with a traded volume of 193,500. The Relative Strength Index (RSI) is at 67.00, indicating neutral momentum, and the Moving Average Convergence Divergence (MACD) suggests a positive trend with a MACD of 1414.12.

Relationship with Key Moving Averages
Nifty Bank closed at 55087.15, which is above its 50-day EMA of 51737.06 and 200-day EMA of 50545.93, indicating a strong bullish trend. The close is also slightly above the 10-day EMA of 54568.99, and the percentage change of -0.55% shows a minor pullback from the previous close but still maintains an overall uptrend.
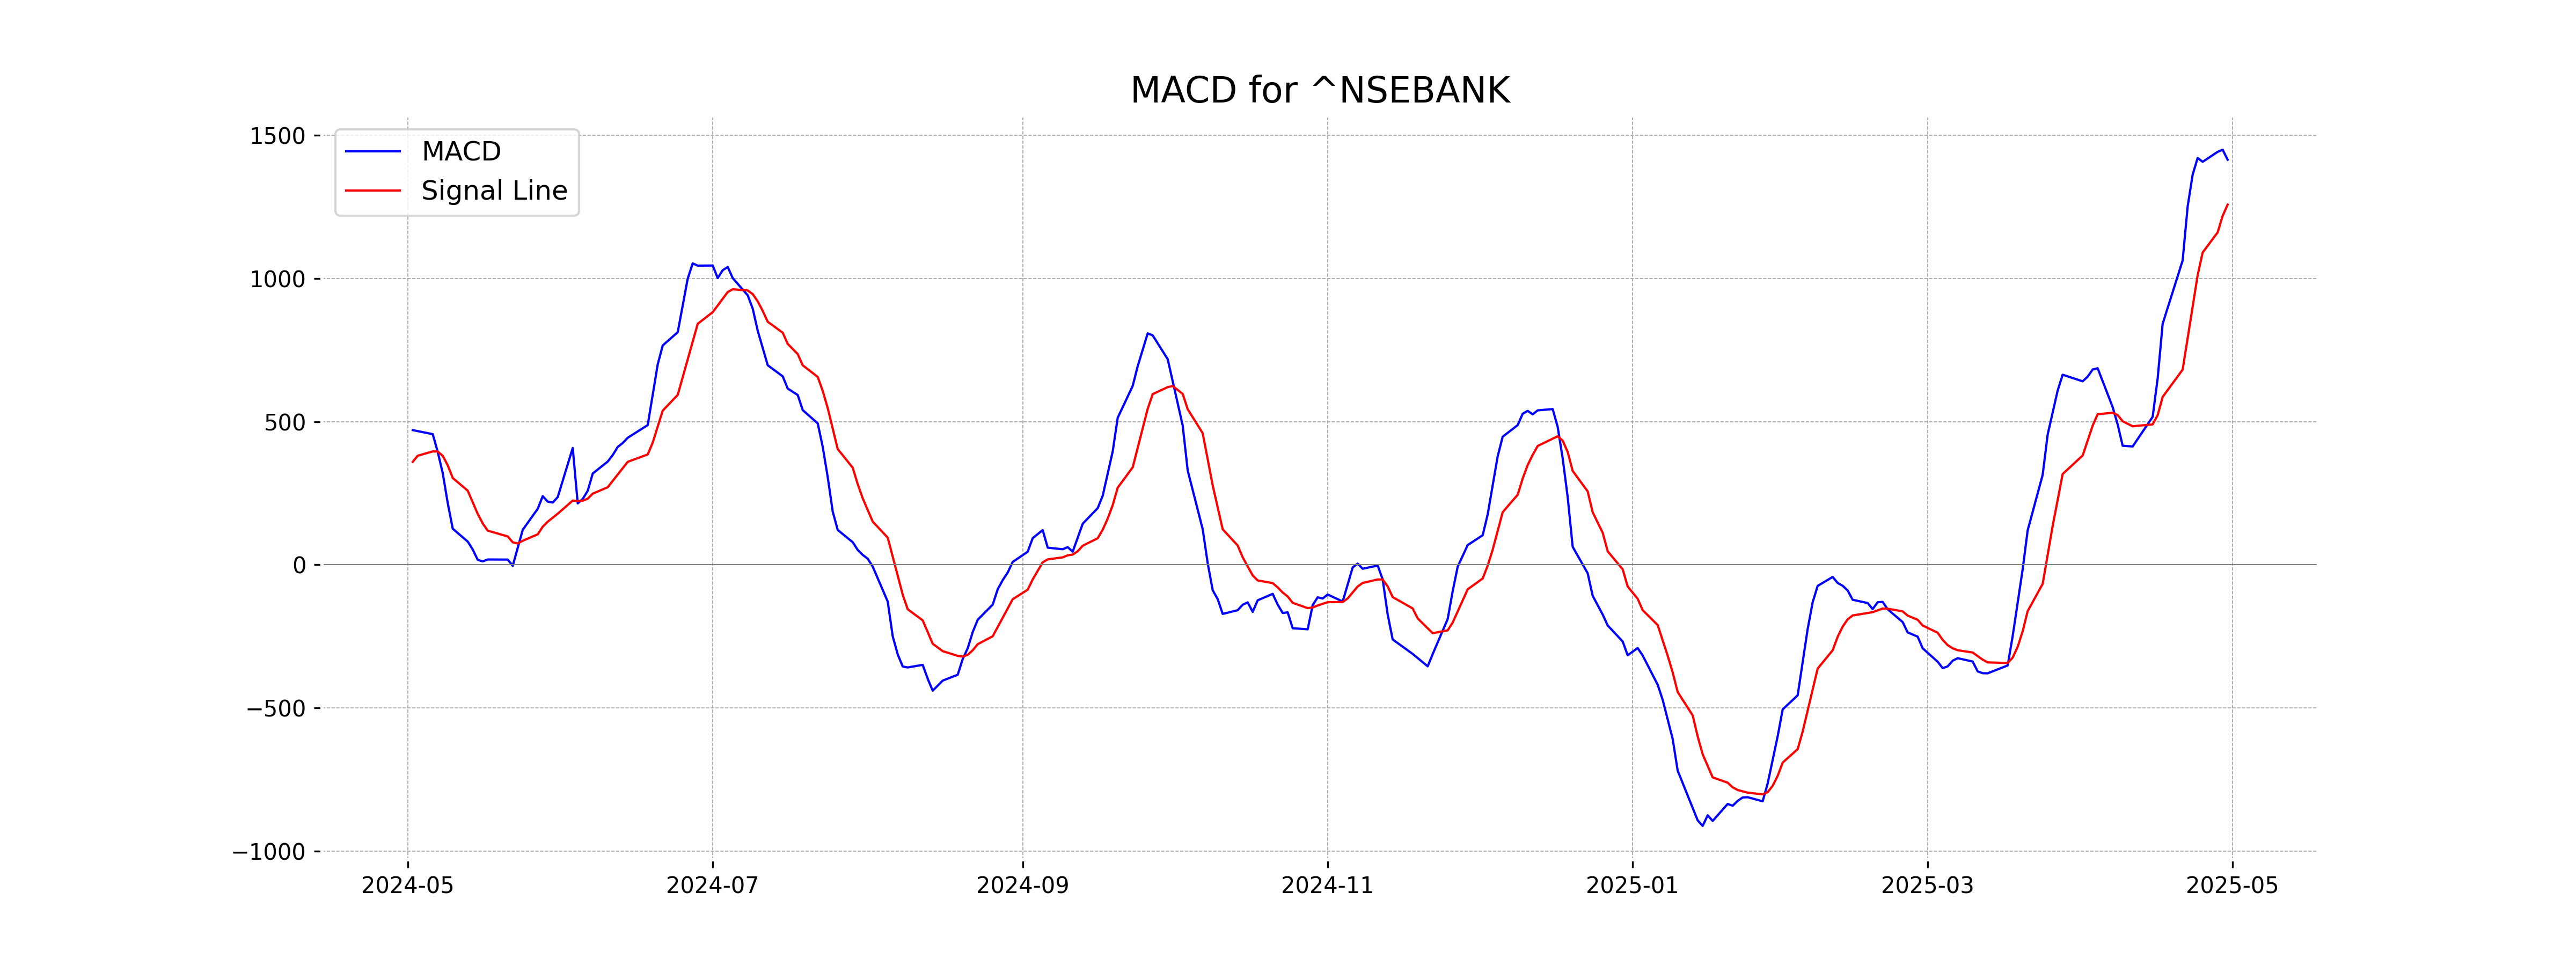
Moving Averages Trend (MACD)
The MACD value for Nifty Bank is 1414.12, which is above the MACD Signal of 1257.36, suggesting a bullish momentum. However, it's important to consider other indicators and market conditions for a comprehensive analysis.
RSI Analysis
The RSI (Relative Strength Index) for Nifty Bank is 67.00. This value suggests that Nifty Bank is nearing the overbought territory, as RSI values above 70 are generally considered overbought. Traders might want to be cautious or look for signs of potential price reversals.

Analysis for Nifty 50 - May 01, 2025

Nifty 50 opened at 24,342.05 and closed slightly lower at 24,334.20, reflecting a minor decrease of 0.0072% from its previous close, with a point change of -1.75. The index saw a trading range between a high of 24,396.15 and a low of 24,198.75, alongside a trading volume of 424,500. Indicators such as the 10, 20, 50, and 200-day EMAs, along with an RSI of 65, suggest a relatively strong momentum, with the MACD showing a positive divergence above its signal line.

Relationship with Key Moving Averages
The Nifty 50 index, with a closing of 24,334.20, is above the 50 EMA of 23,404.03 and the 200 EMA of 23,438.98, indicating a strong uptrend. Additionally, it is also above the 10 EMA of 24,044.50 and the 20 EMA of 23,723.71, suggesting short-term bullish momentum.
Moving Averages Trend (MACD)
Nifty 50's MACD value is 364.50, which is higher than its MACD Signal of 273.01, indicating a bullish momentum. This suggests increased buying interest, as the MACD line is above the signal line, reinforcing the positive trend.

RSI Analysis
RSI Analysis for Nifty 50: The RSI (Relative Strength Index) for Nifty 50 is 65, indicating that the stock is approaching the overbought zone. Typically, RSI values above 70 suggest overbought conditions, while values below 30 indicate oversold conditions. Currently, investors may be cautious as the RSI nearing 70 can signal potential price corrections.

Up Next

Global stock market indices: How the world markets performed today - 01 May 2025

Honda Activa 6G: Everything You Need to Know Before Buying

How much does a ULIP plan really cost? A break-down of all charges

Centre plans to borrow Rs 8.20 lakh cr from market in first half of FY27

Reliance denies buying Iranian oil amid US sanctions waiver

Premium petrol price up Rs 2, industrial diesel up Rs 22; no change in normal petrol, diesel rates

More videos

India's GDP expected to register over 8 pc growth in Sep-Dec: Report

Govt announces seven measures to help boost exports

RBI keeps interest rates on hold after US trade deal boosts outlook

RBI proposes to compensate customers up to Rs 25,000 loss due to fraud

RBI raises GDP growth projection of Q1, Q2 of FY27

RBI pauses rate cuts, retains interest rate at 5.25 pc

Rupee jumps 122 paise to close at 90.27 against US dollar on India-US trade deal

Stock markets cheer India-US trade deal: Sensex, Nifty surge 2.5 pc

UPI transactions hit record high of Rs 230 lakh crore in 2025-26 till Dec: Govt

Explained: India-US trade deal, tariffs and trade benefits