


Highlights
- S&P 500 and Nasdaq enter overbought zone
- Dow Jones remains bullish above key EMA
- FTSE 100 shows weak momentum and pressure
Latest news

Aditya Birla Capital deploys conversational AI in 7 business verticals with Blue Machines AI

India auto sales rise sharply in April; EV adoption gains pace: Report

A$AP Rocky calls Rihanna "diamond" at 2026 Met Gala

Tax benefit removal under new tax regime hits life insurance sales: Deepak Parekh

World Book of Records Hosts International Summit and Awards in Nepal

IPMAT Indore 2026 Concludes Successfully; Supergrads Releases First-Cut Analysis

Glam Brand Licensing & Consulting: Enabling Meaningful Global Partnerships

LTM and Uniphore Partner to Scale Domain-Specific AI Across Core Business Processes
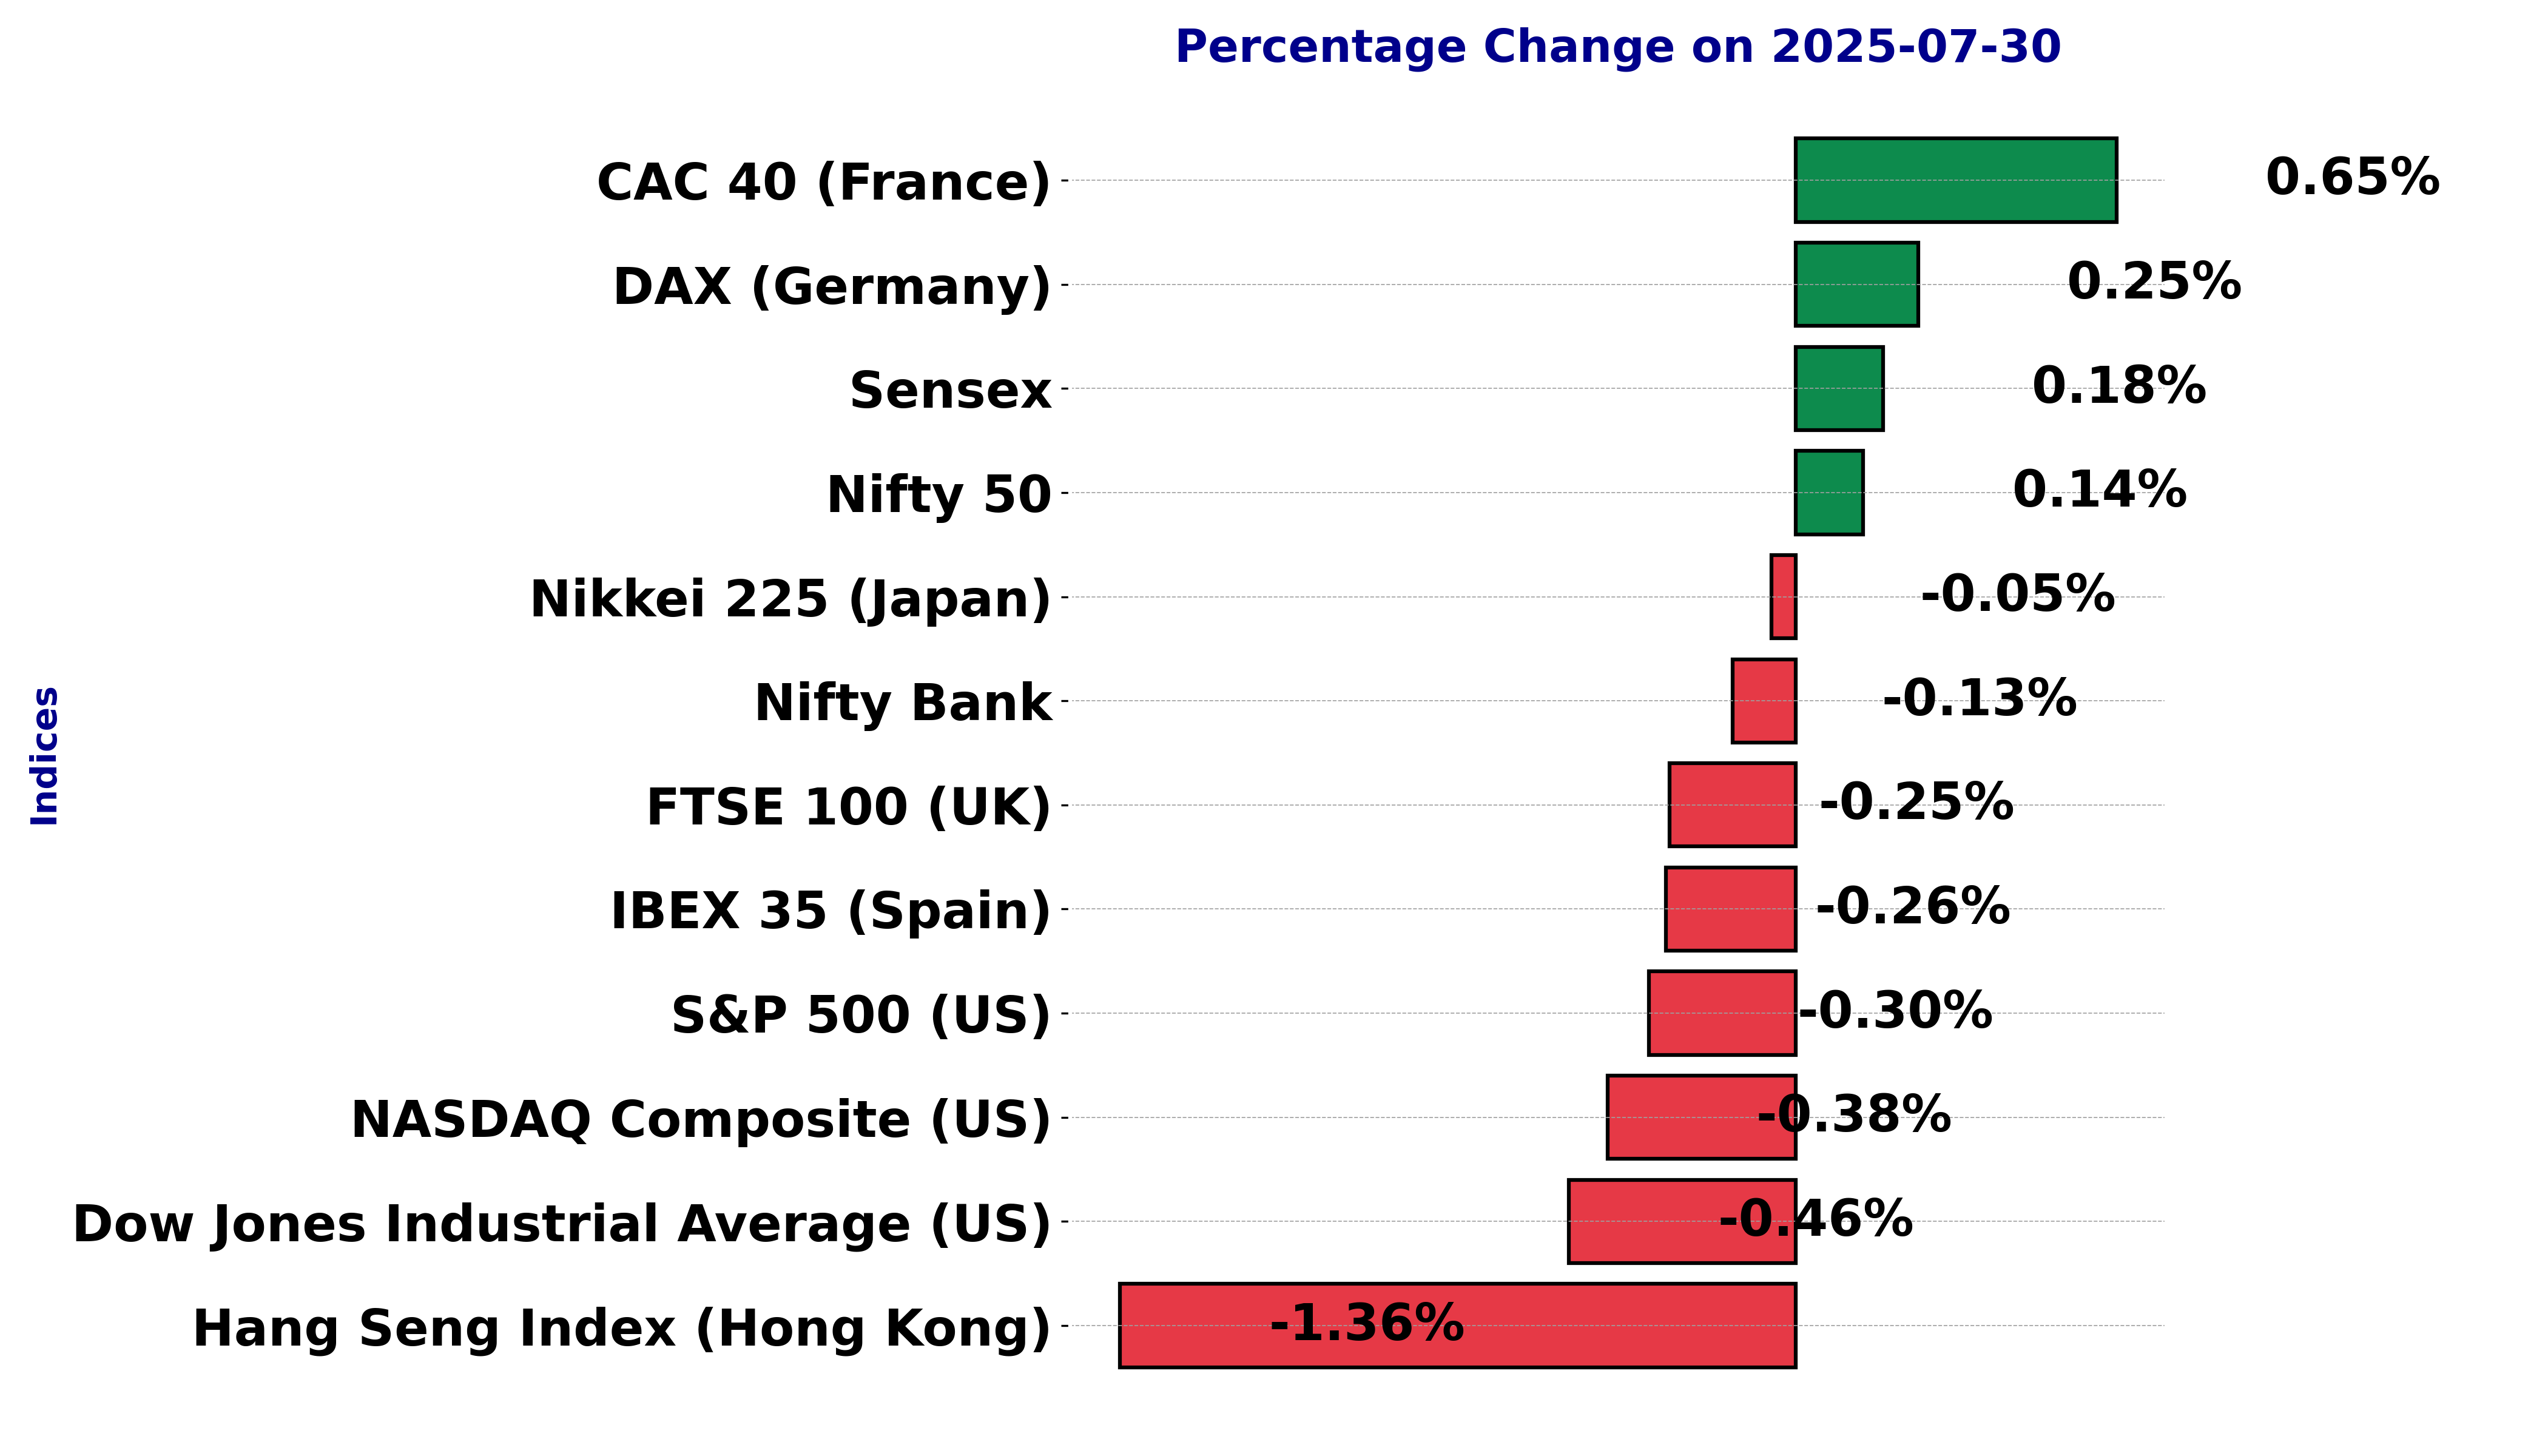
Global stock market indices: How the world markets performed today - 30 July 2025


The international stock market indices showed varied performances on July 30, 2025, reflecting the economic sentiment across different regions.
In this article, we analyze the performance of key global indices including the S&P 500, Dow Jones Industrial Average, NASDAQ Composite, FTSE 100, DAX, CAC 40, IBEX 35, Nikkei 225, Hang Seng, Nifty 50, and BSE Sensex.
Analysis for Sensex - July 30, 2025
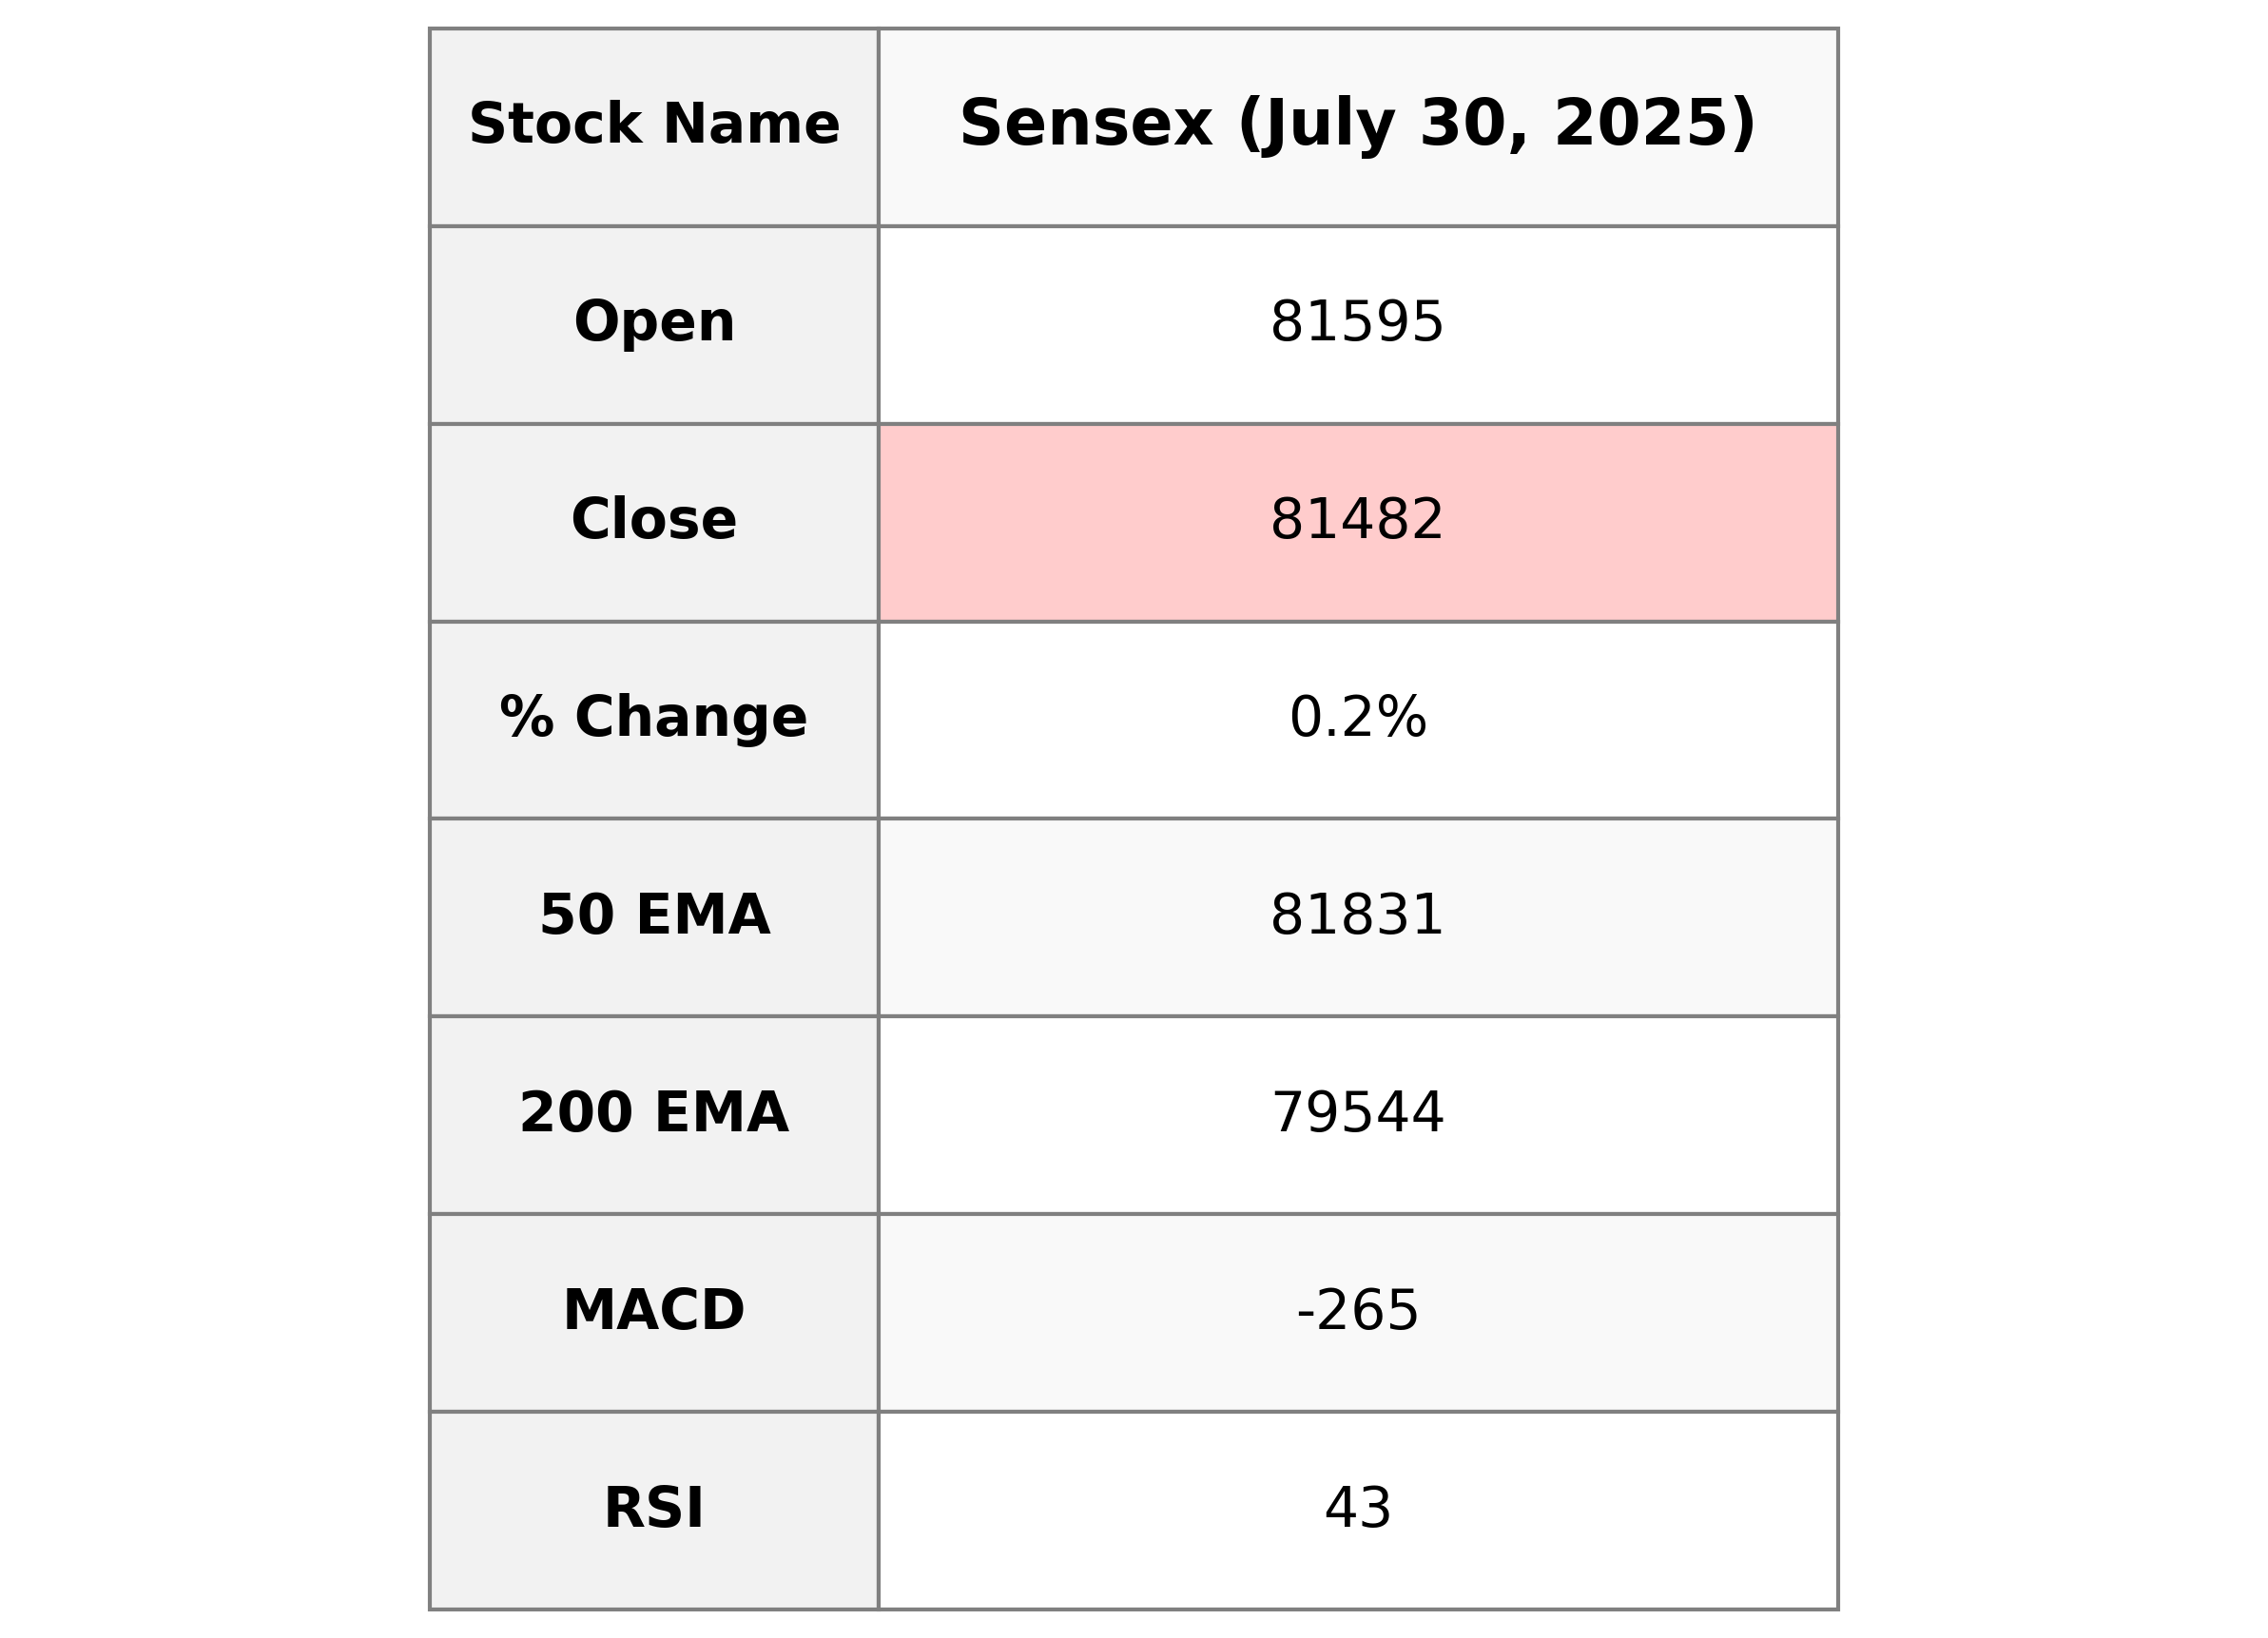
The Sensex opened at 81,594.52, reaching a high of 81,618.96 and a low of 81,187.06, before closing at 81,481.86. The index showed a slight increase with a 0.18% gain represented by a 143.91 points change. Technical indicators suggest a below-average momentum, with the RSI at 43.19 and a negative MACD value of -264.66, indicating potential bearish conditions.
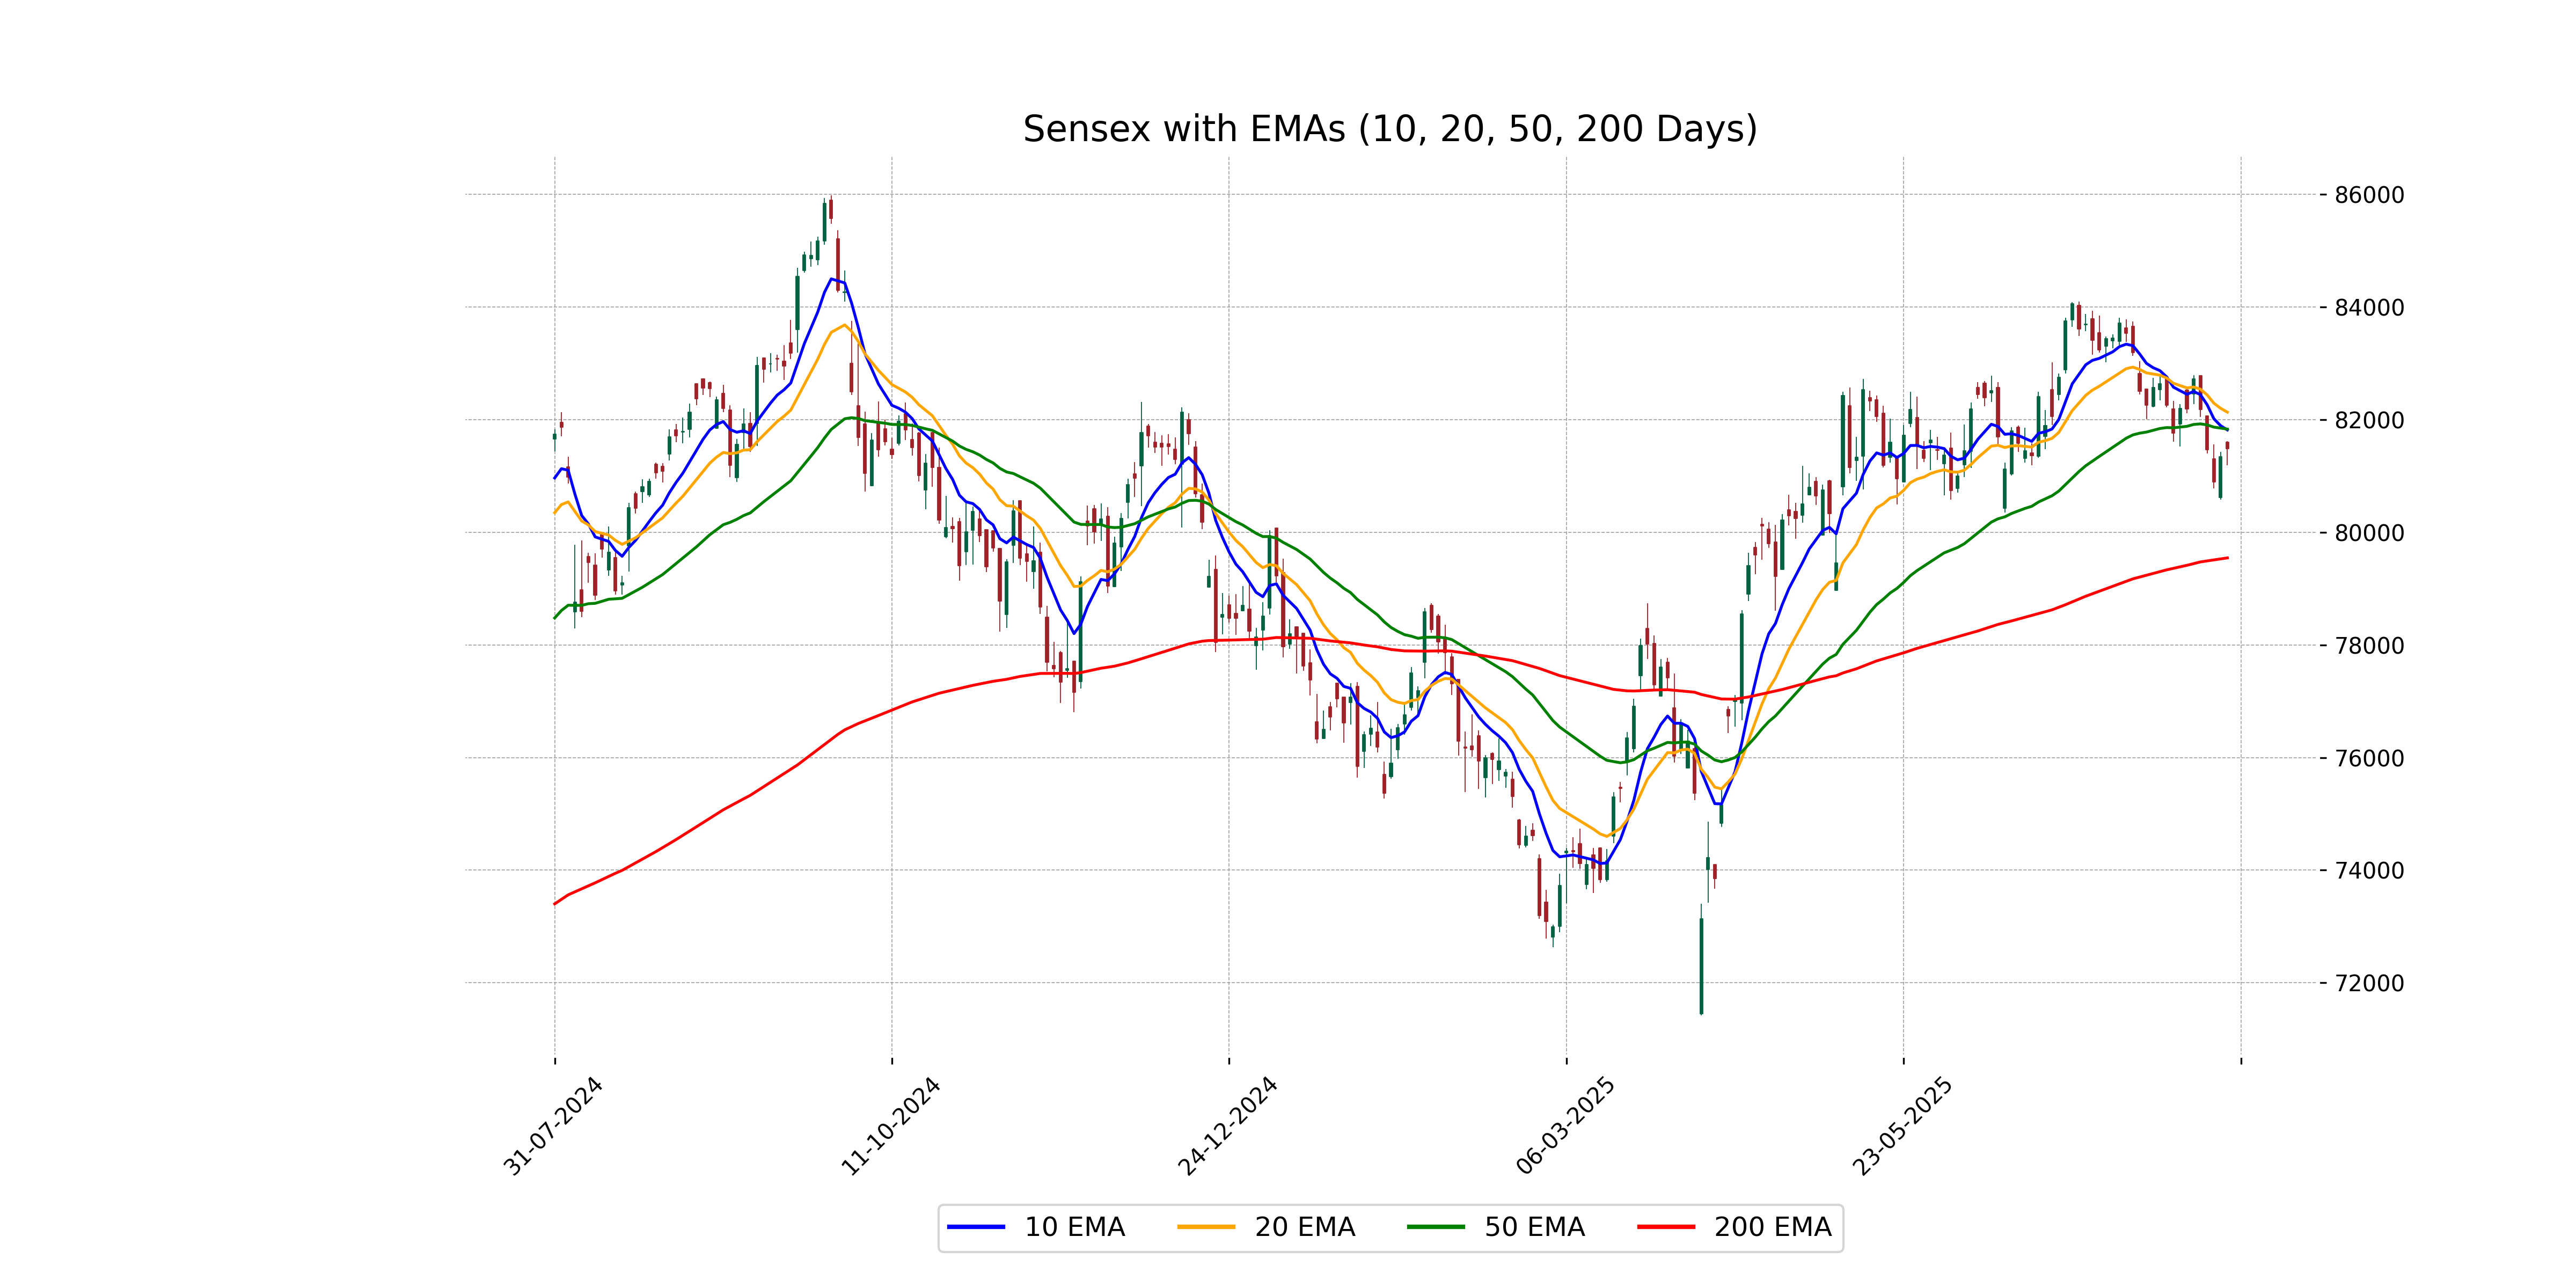
Relationship with Key Moving Averages
The Sensex closed below its 50-day EMA (81,831.29) and 10-day EMA (81,817.15), indicating a potential short-term bearish trend. Additionally, the index is also below its 20-day EMA (82,131.82), reinforcing a bearish outlook.
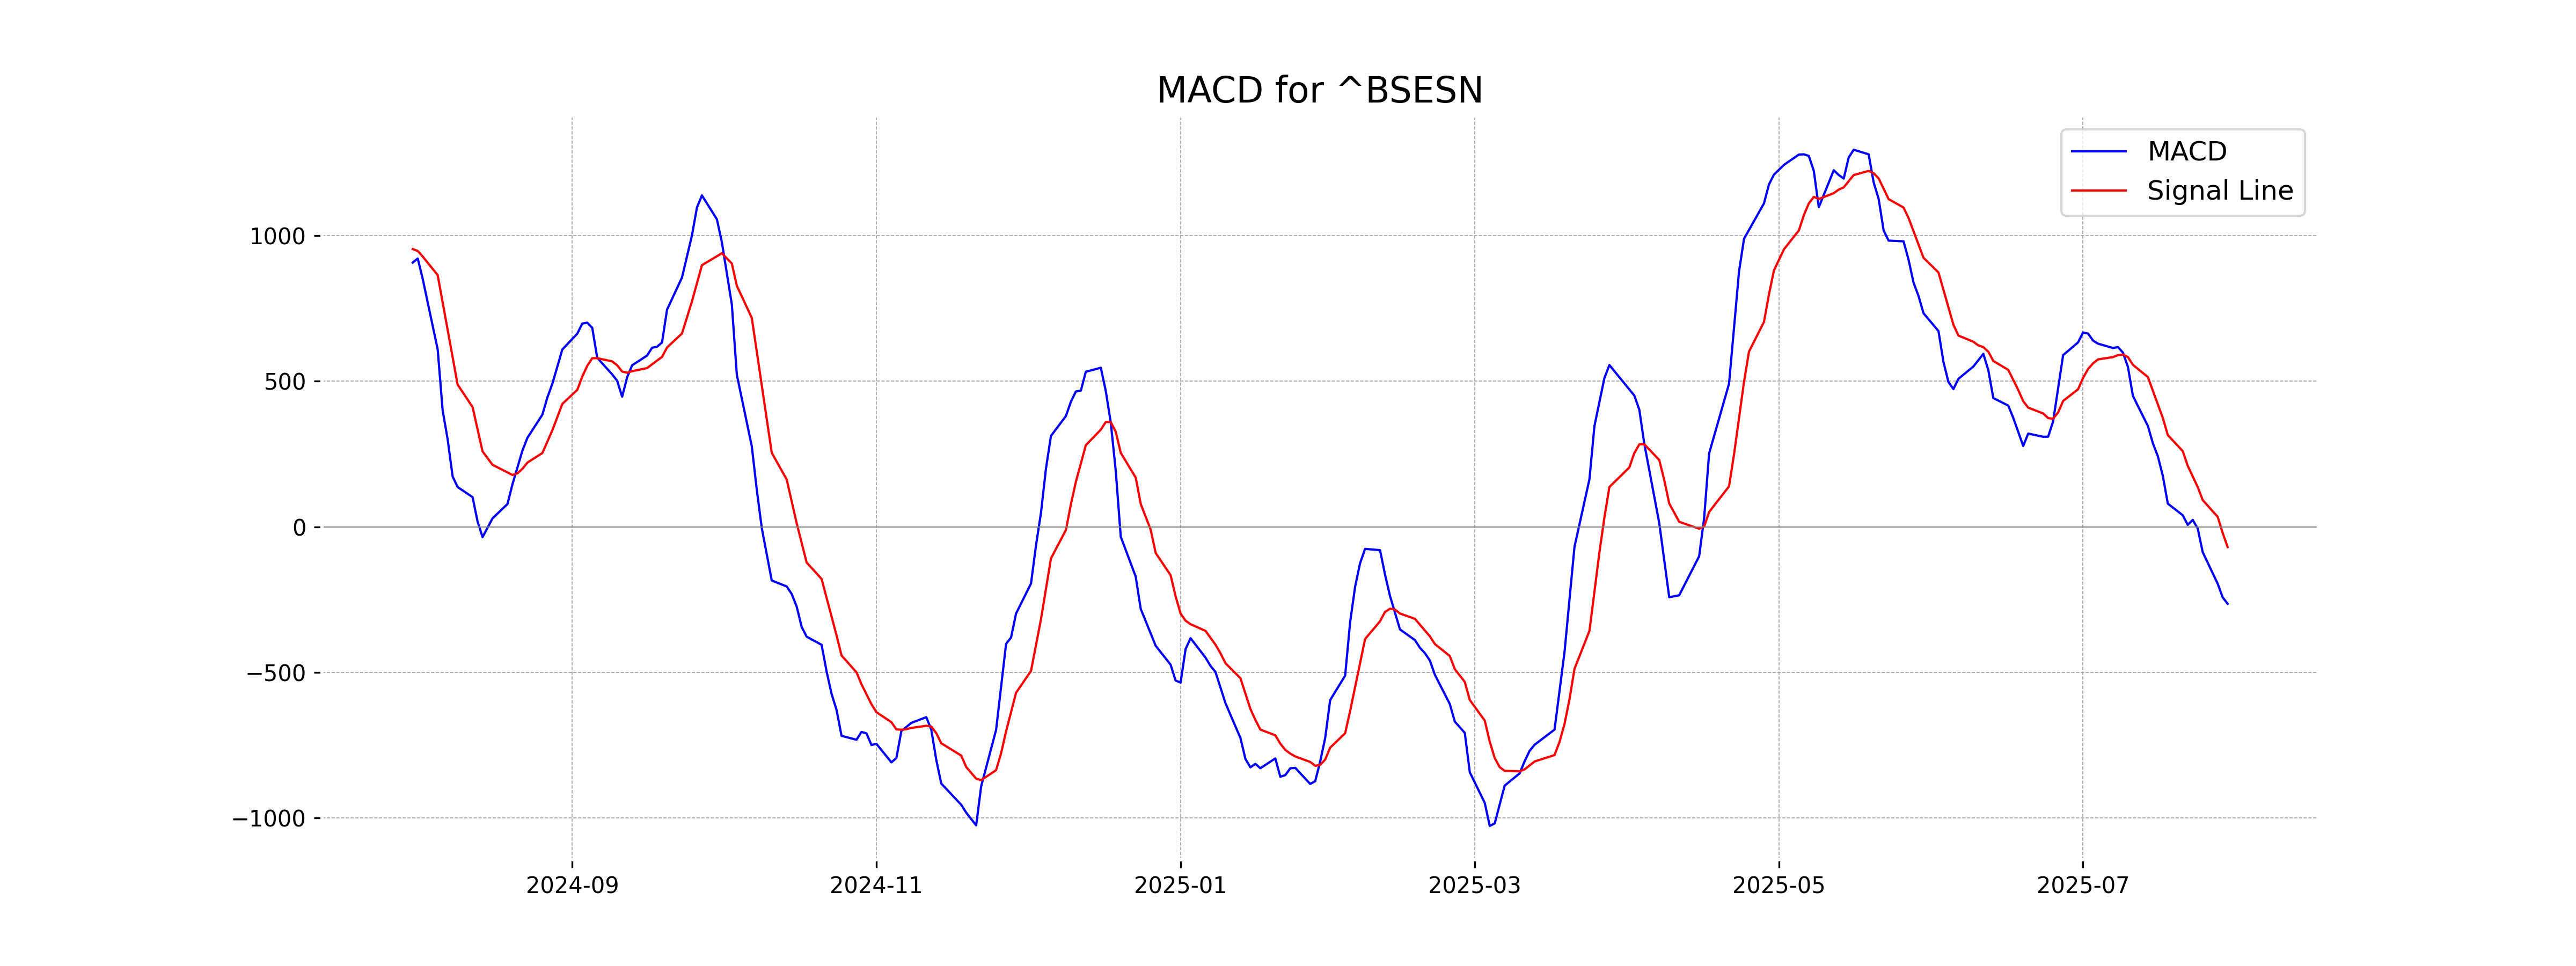
Moving Averages Trend (MACD)
Sensex MACD Analysis: The MACD indicator for Sensex is currently -264.66, which is lower than the MACD signal line at -69.78. This suggests a bearish signal, indicating potential downward momentum in the market.
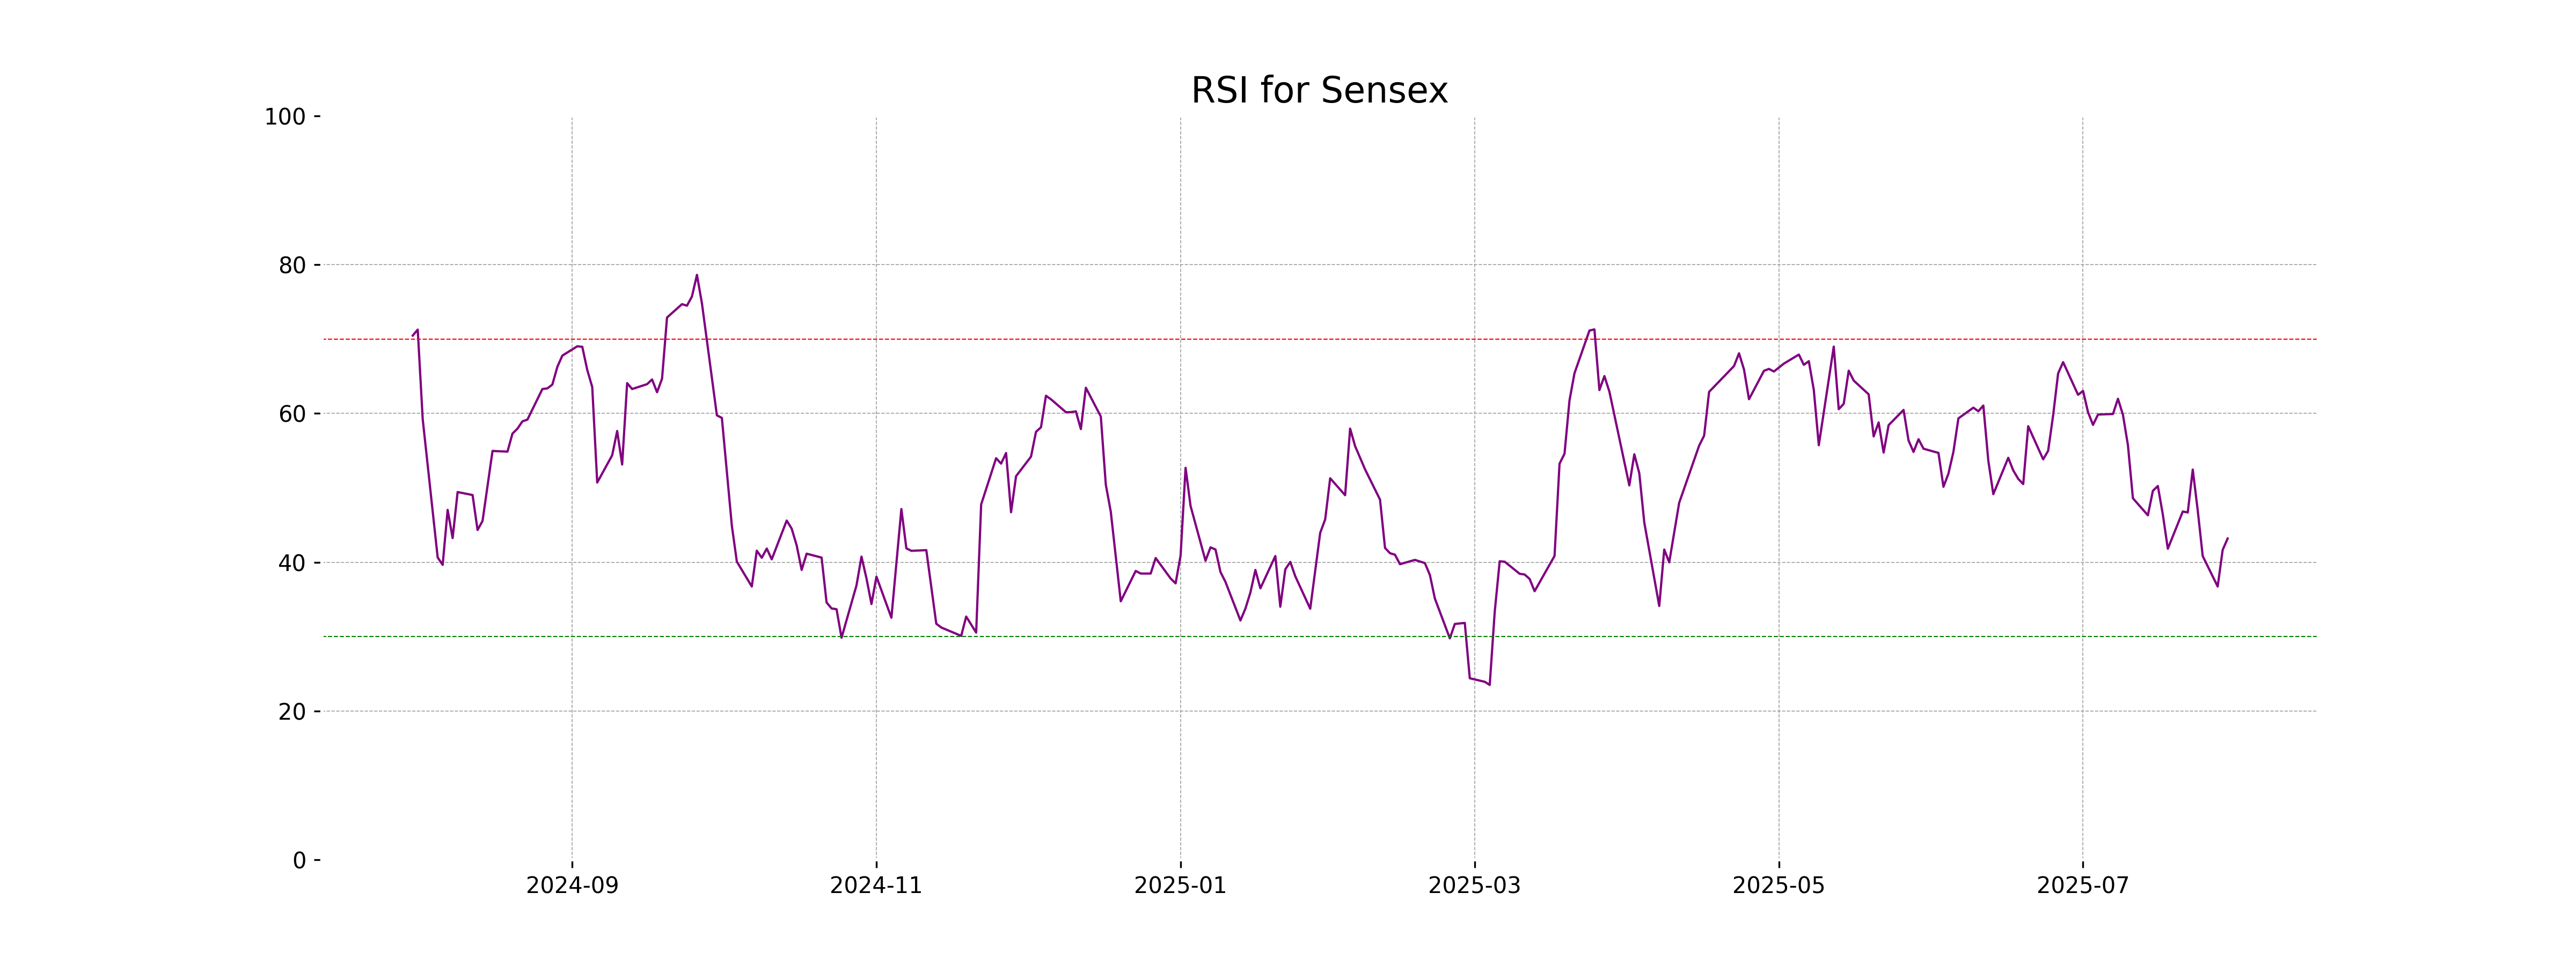
RSI Analysis
RSI Analysis for Sensex: The Relative Strength Index (RSI) for Sensex is currently 43.19, which is below the typical neutral level of 50. This indicates mild bearish momentum, suggesting that the market may not be strong presently and is closer to being oversold rather than overbought.
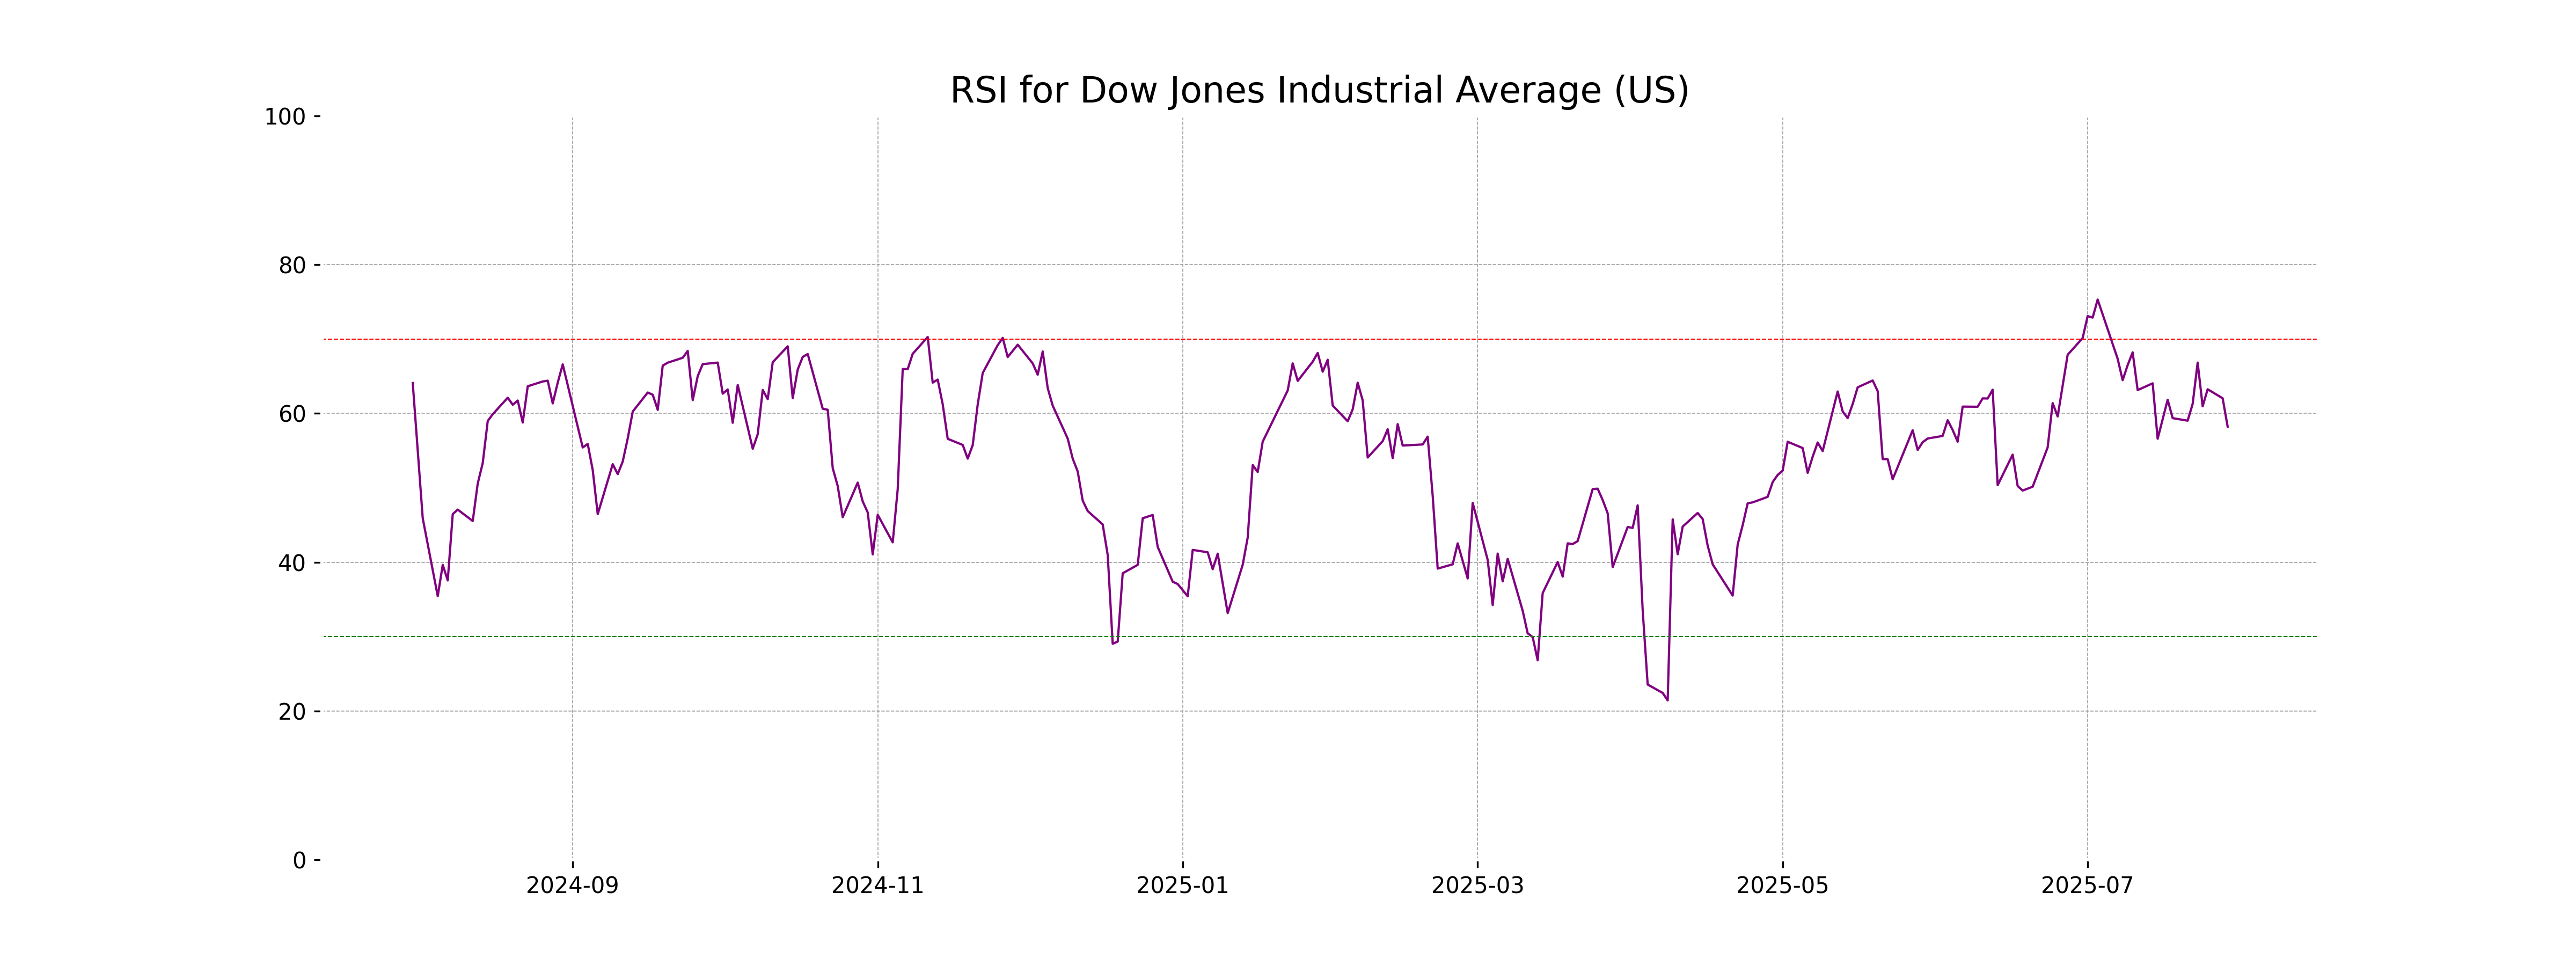
Analysis for Dow Jones Industrial Average (US) - July 30, 2025
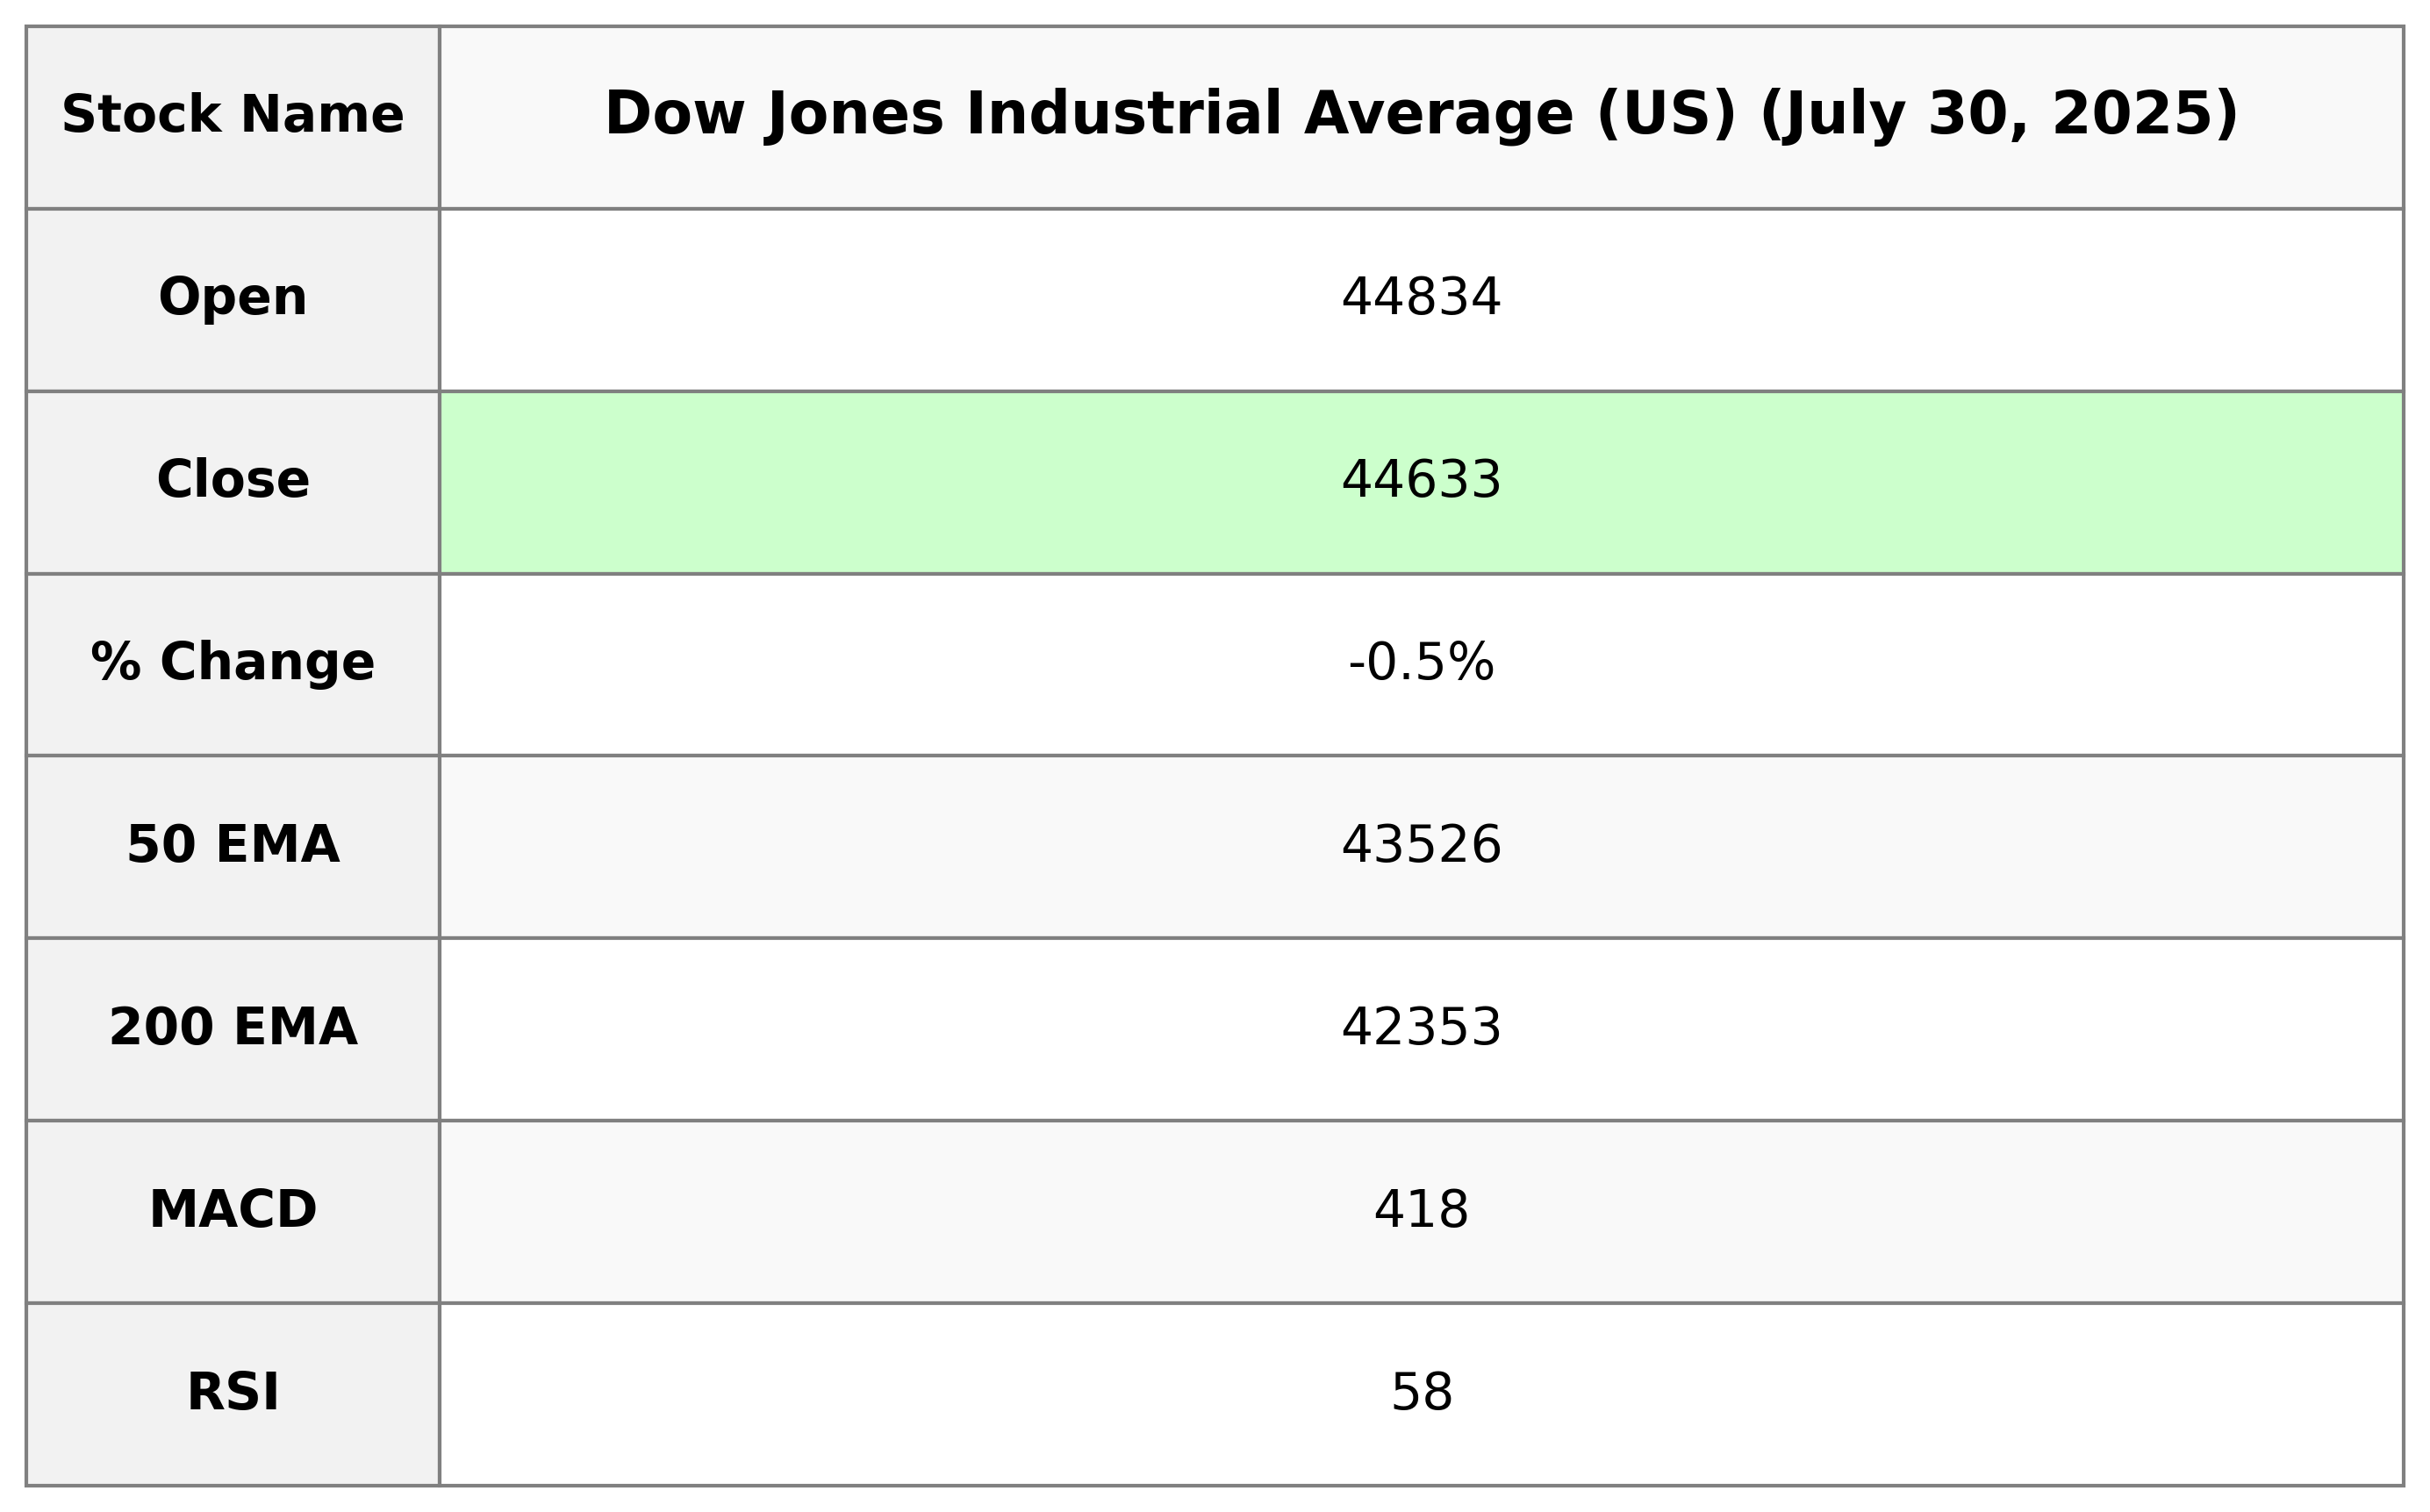
The Dow Jones Industrial Average (US) opened at 44,833.74, reached a high of 44,883.66, and closed at 44,632.99. The index experienced a decline with a percentage change of -0.46%, which equates to a drop of 204.57 points from its previous close. The Relative Strength Index (RSI) is at 58.23, indicating a neutral market momentum.
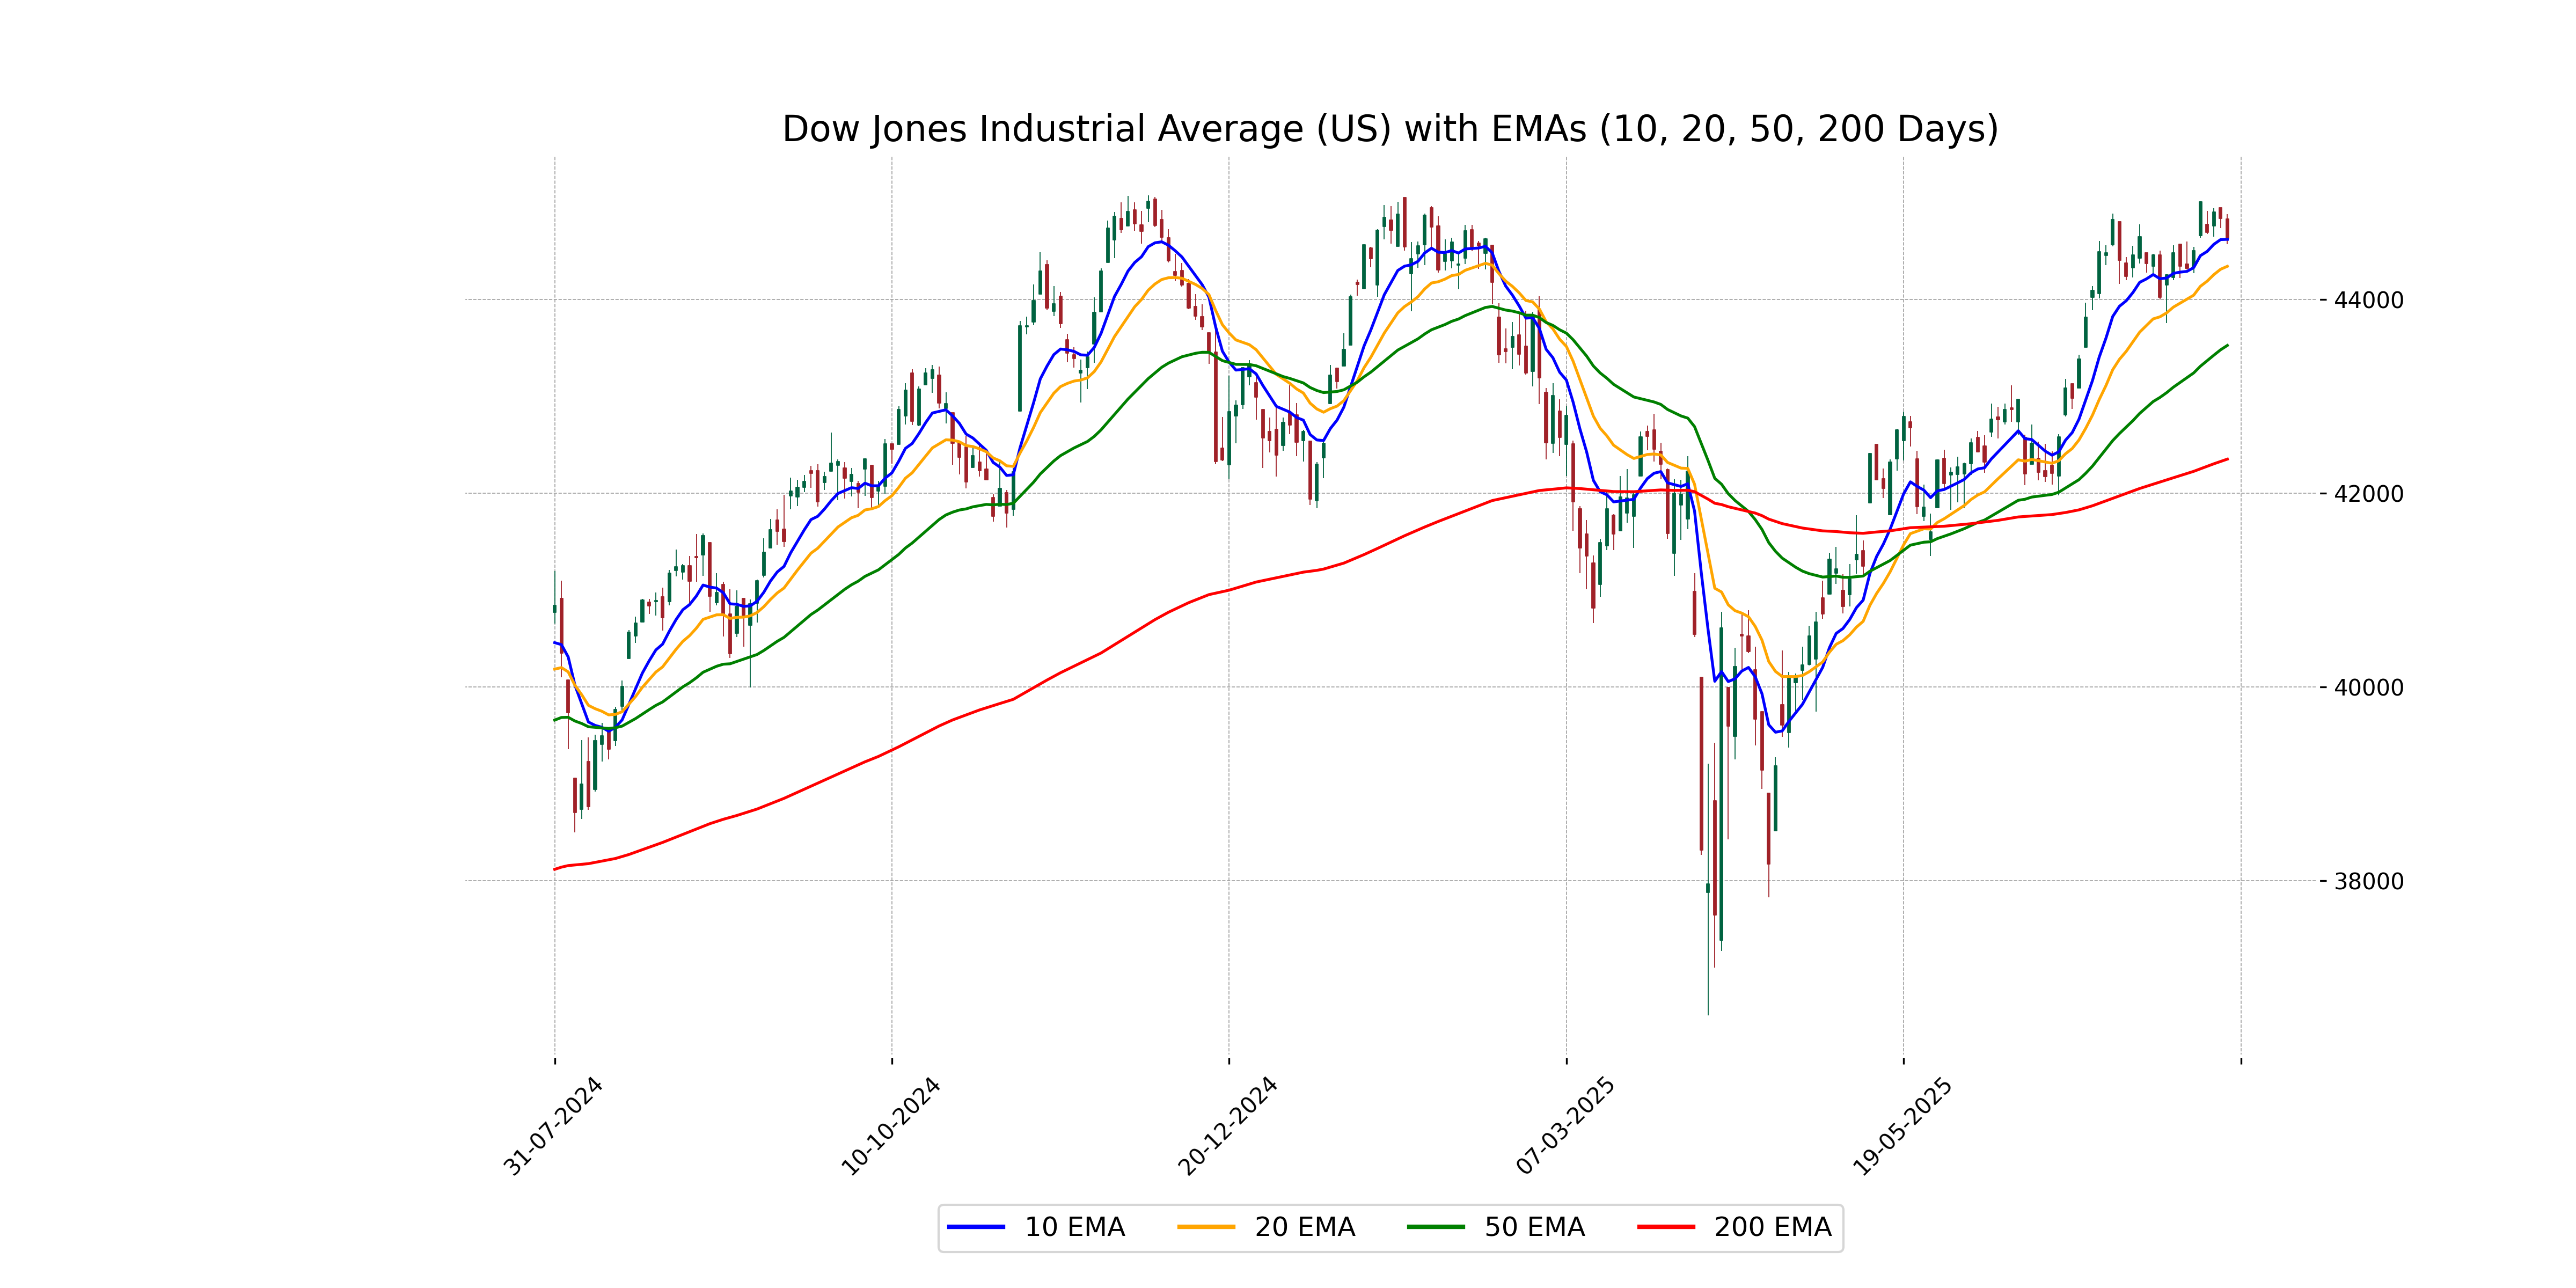
Relationship with Key Moving Averages
The Dow Jones Industrial Average closed just above its 10-day EMA of 44,621.49 and well above its 50-day EMA of 43,526.37 and 200-day EMA of 42,352.50, indicating a strong medium to long-term bullish trend despite a minor recent decline. The index is also showing a weaker momentum with the MACD line below the MACD Signal line.
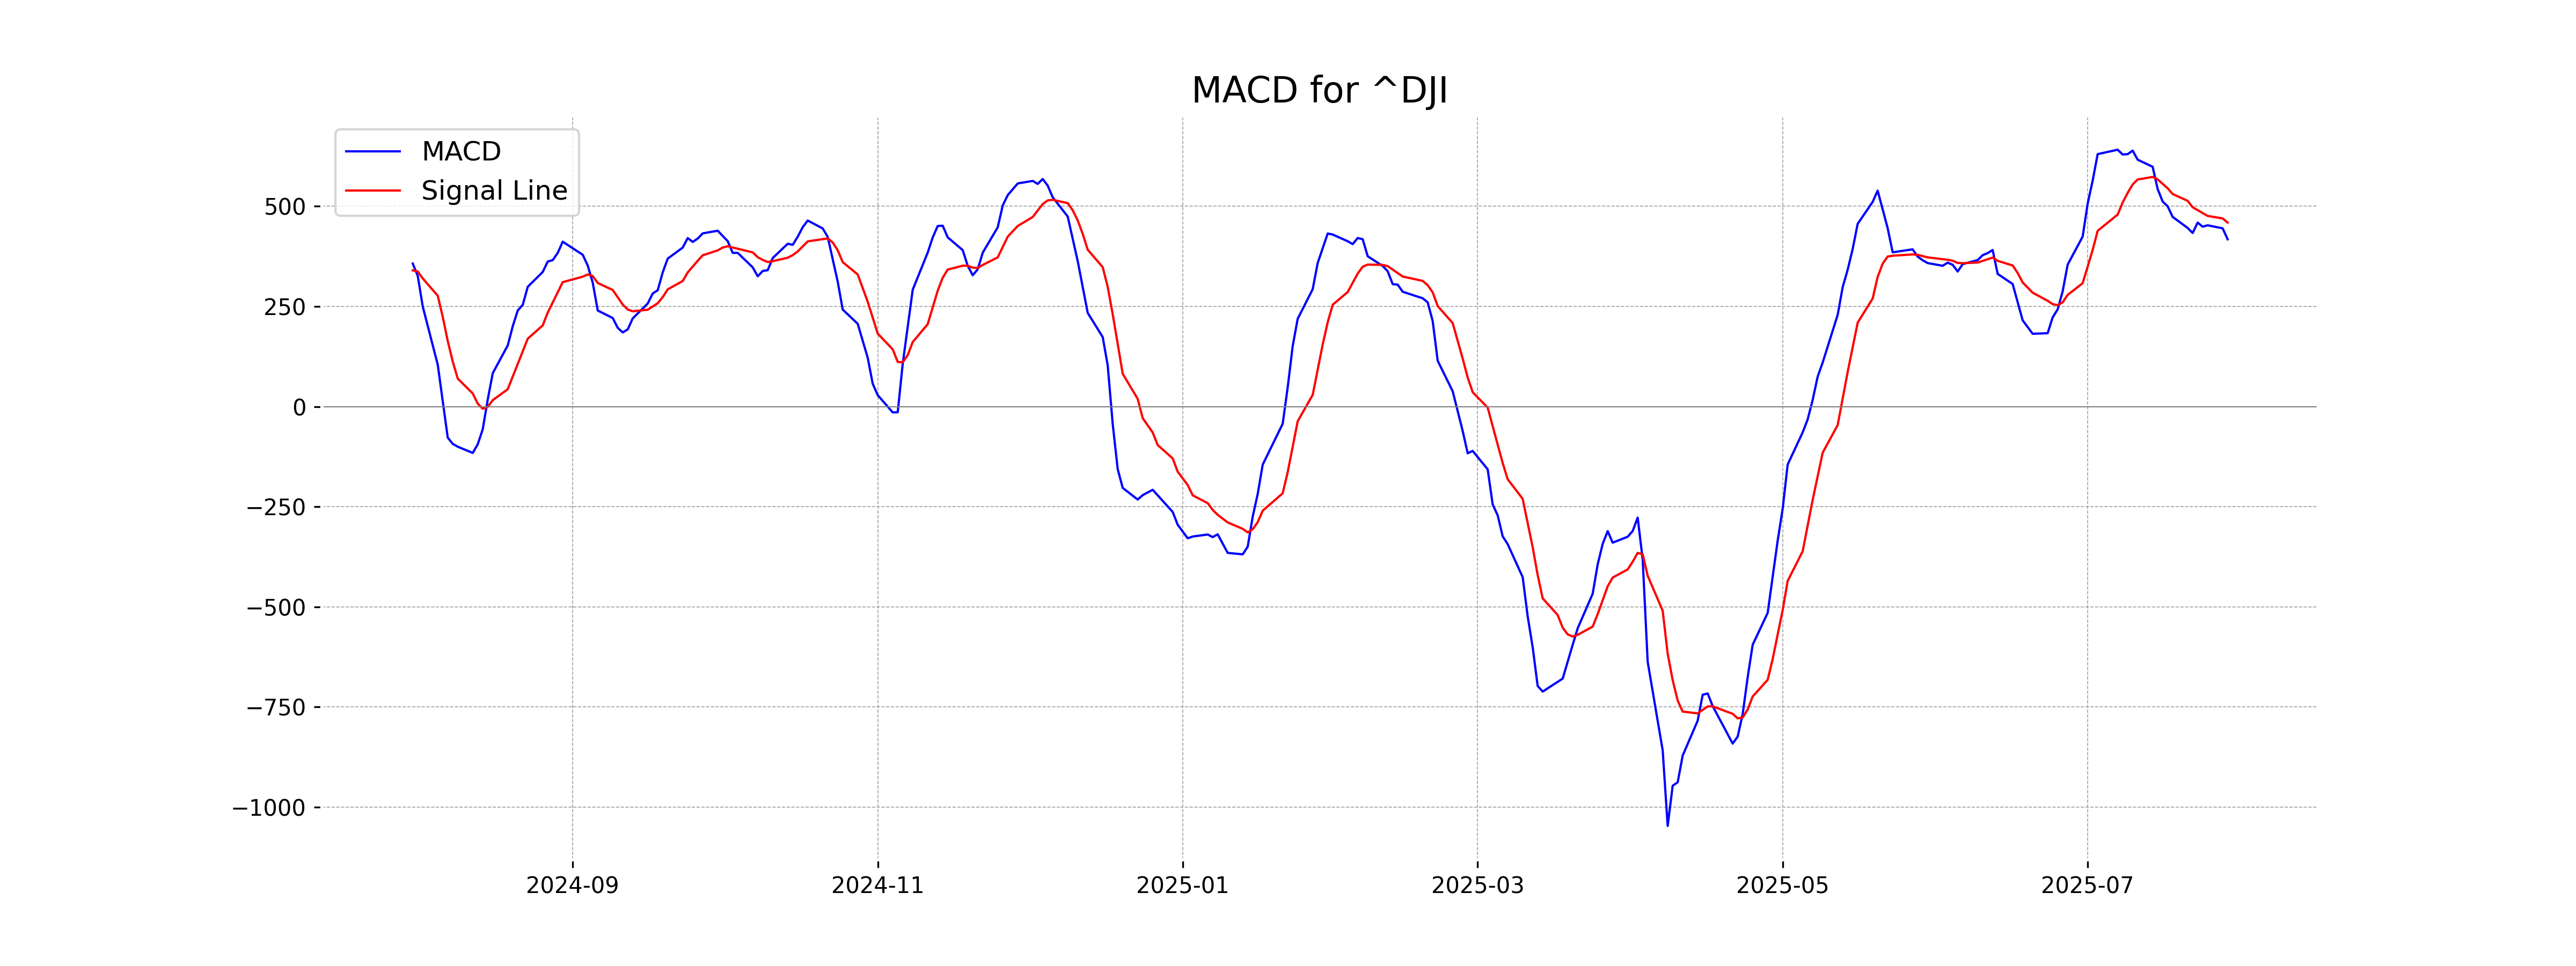
Moving Averages Trend (MACD)
The MACD value for the Dow Jones Industrial Average is 417.62, which is below the MACD Signal value of 459.30, indicating a bearish trend. This suggests that the index might be experiencing downward momentum.
RSI Analysis
The RSI for the Dow Jones Industrial Average is 58.23, suggesting that the index is in a neutral zone, exhibiting neither overbought nor oversold conditions. Typically, an RSI below 30 indicates oversold conditions, while an RSI above 70 signals overbought conditions.
Analysis for CAC 40 (France) - July 30, 2025
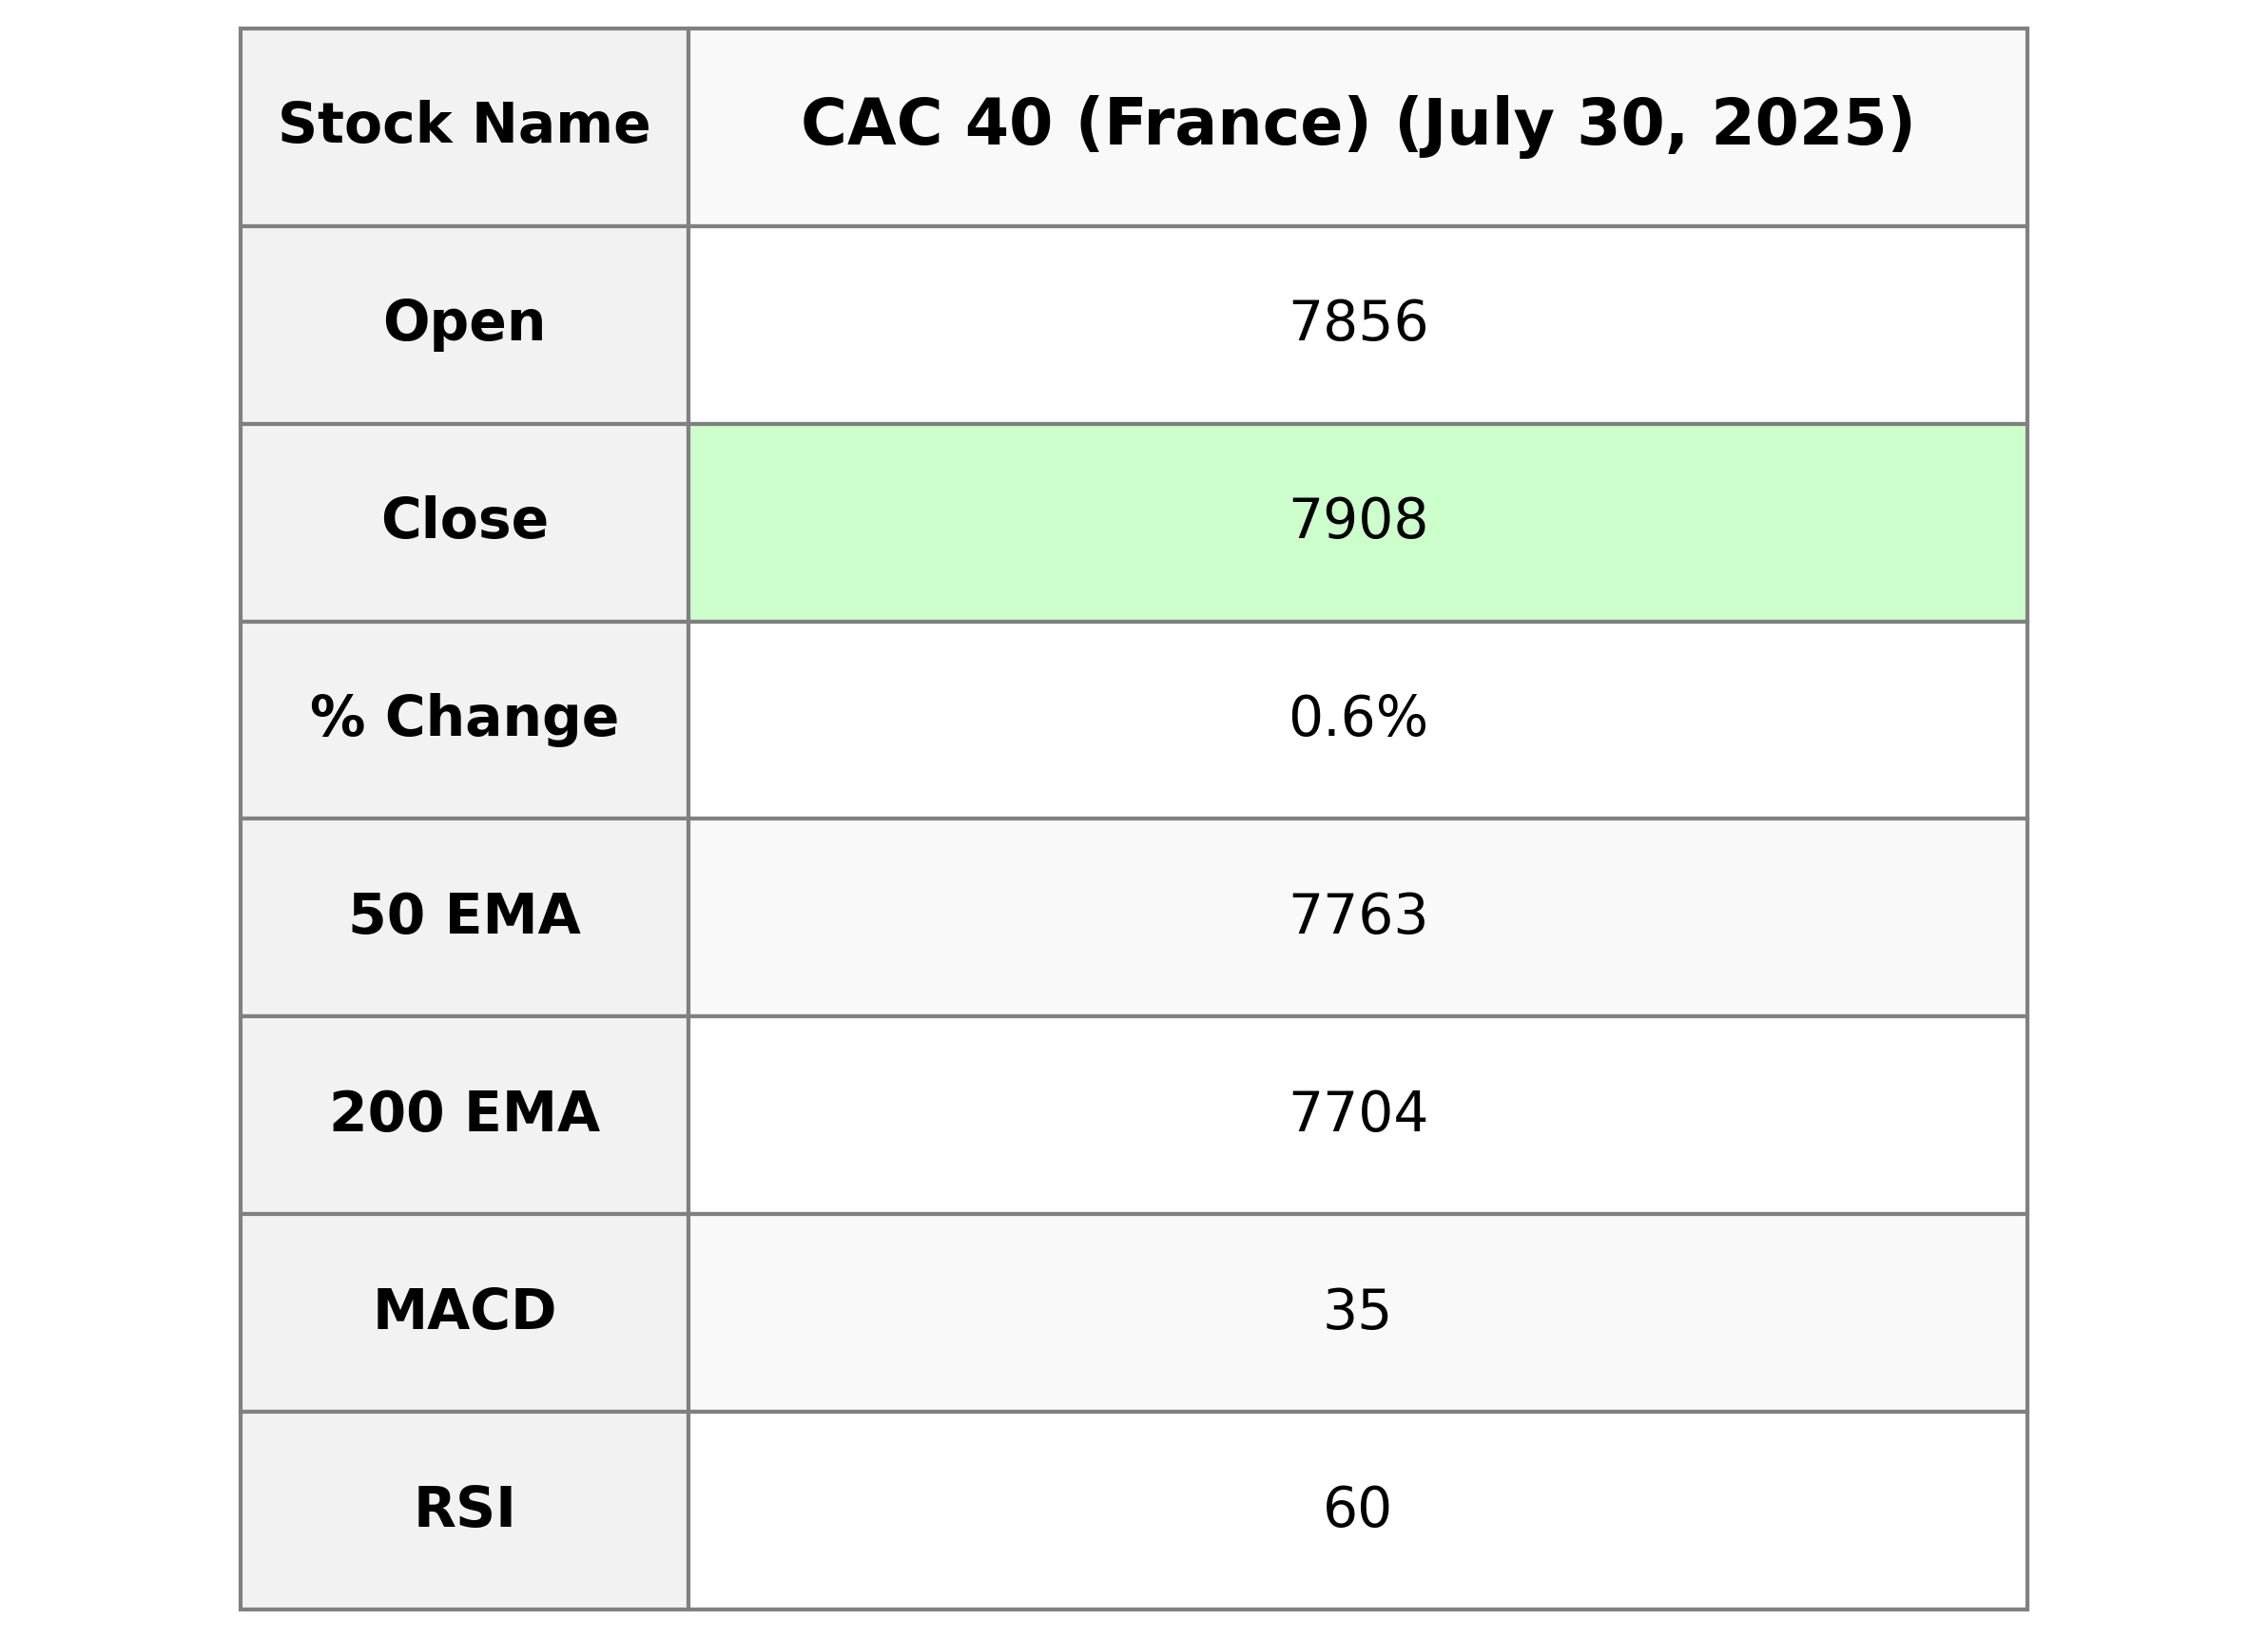
CAC 40 (France) opened at 7856.00, reached a high of 7921.61, and closed at 7908.25, marking a 0.65% increase with a points change of 50.89 from the previous close of 7857.36. The RSI is at 59.91, indicating a slightly bullish momentum, with a MACD of 35.17 and a signal line of 27.85, suggesting positive momentum.
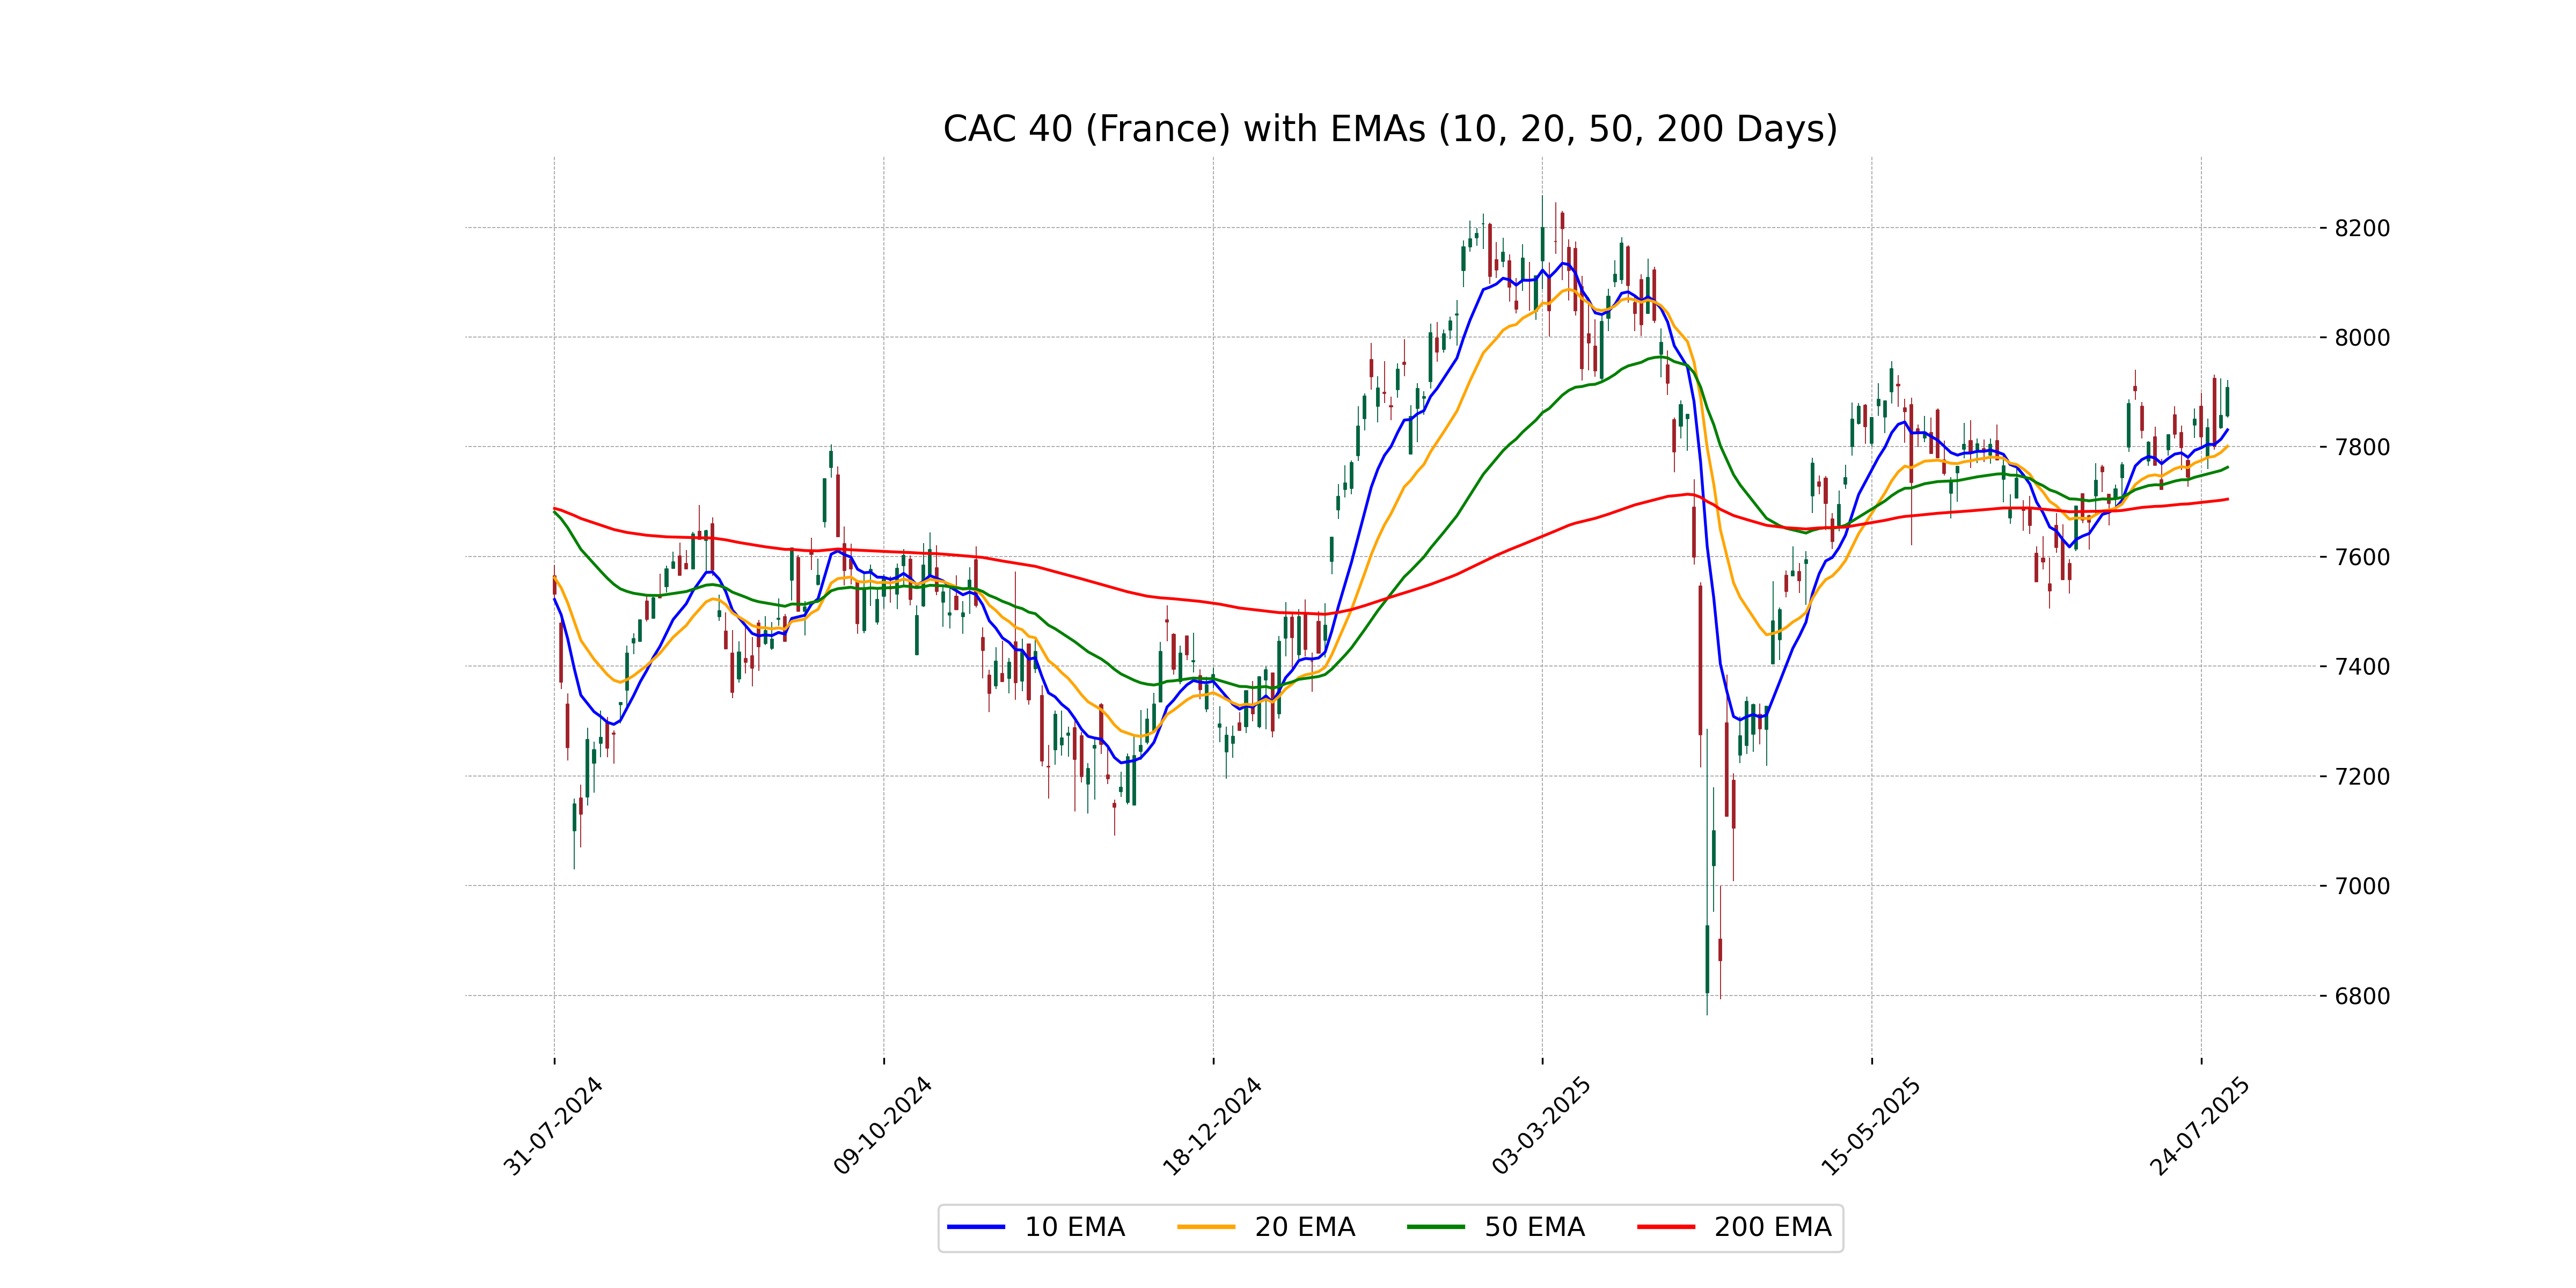
Relationship with Key Moving Averages
The CAC 40 index is trading above its 50-day and 200-day exponential moving averages (EMAs), indicating a potential positive trend or bullish sentiment. The current close at 7908.25 is also above shorter-term EMAs like the 10-day and 20-day EMAs, suggesting continued upward momentum.
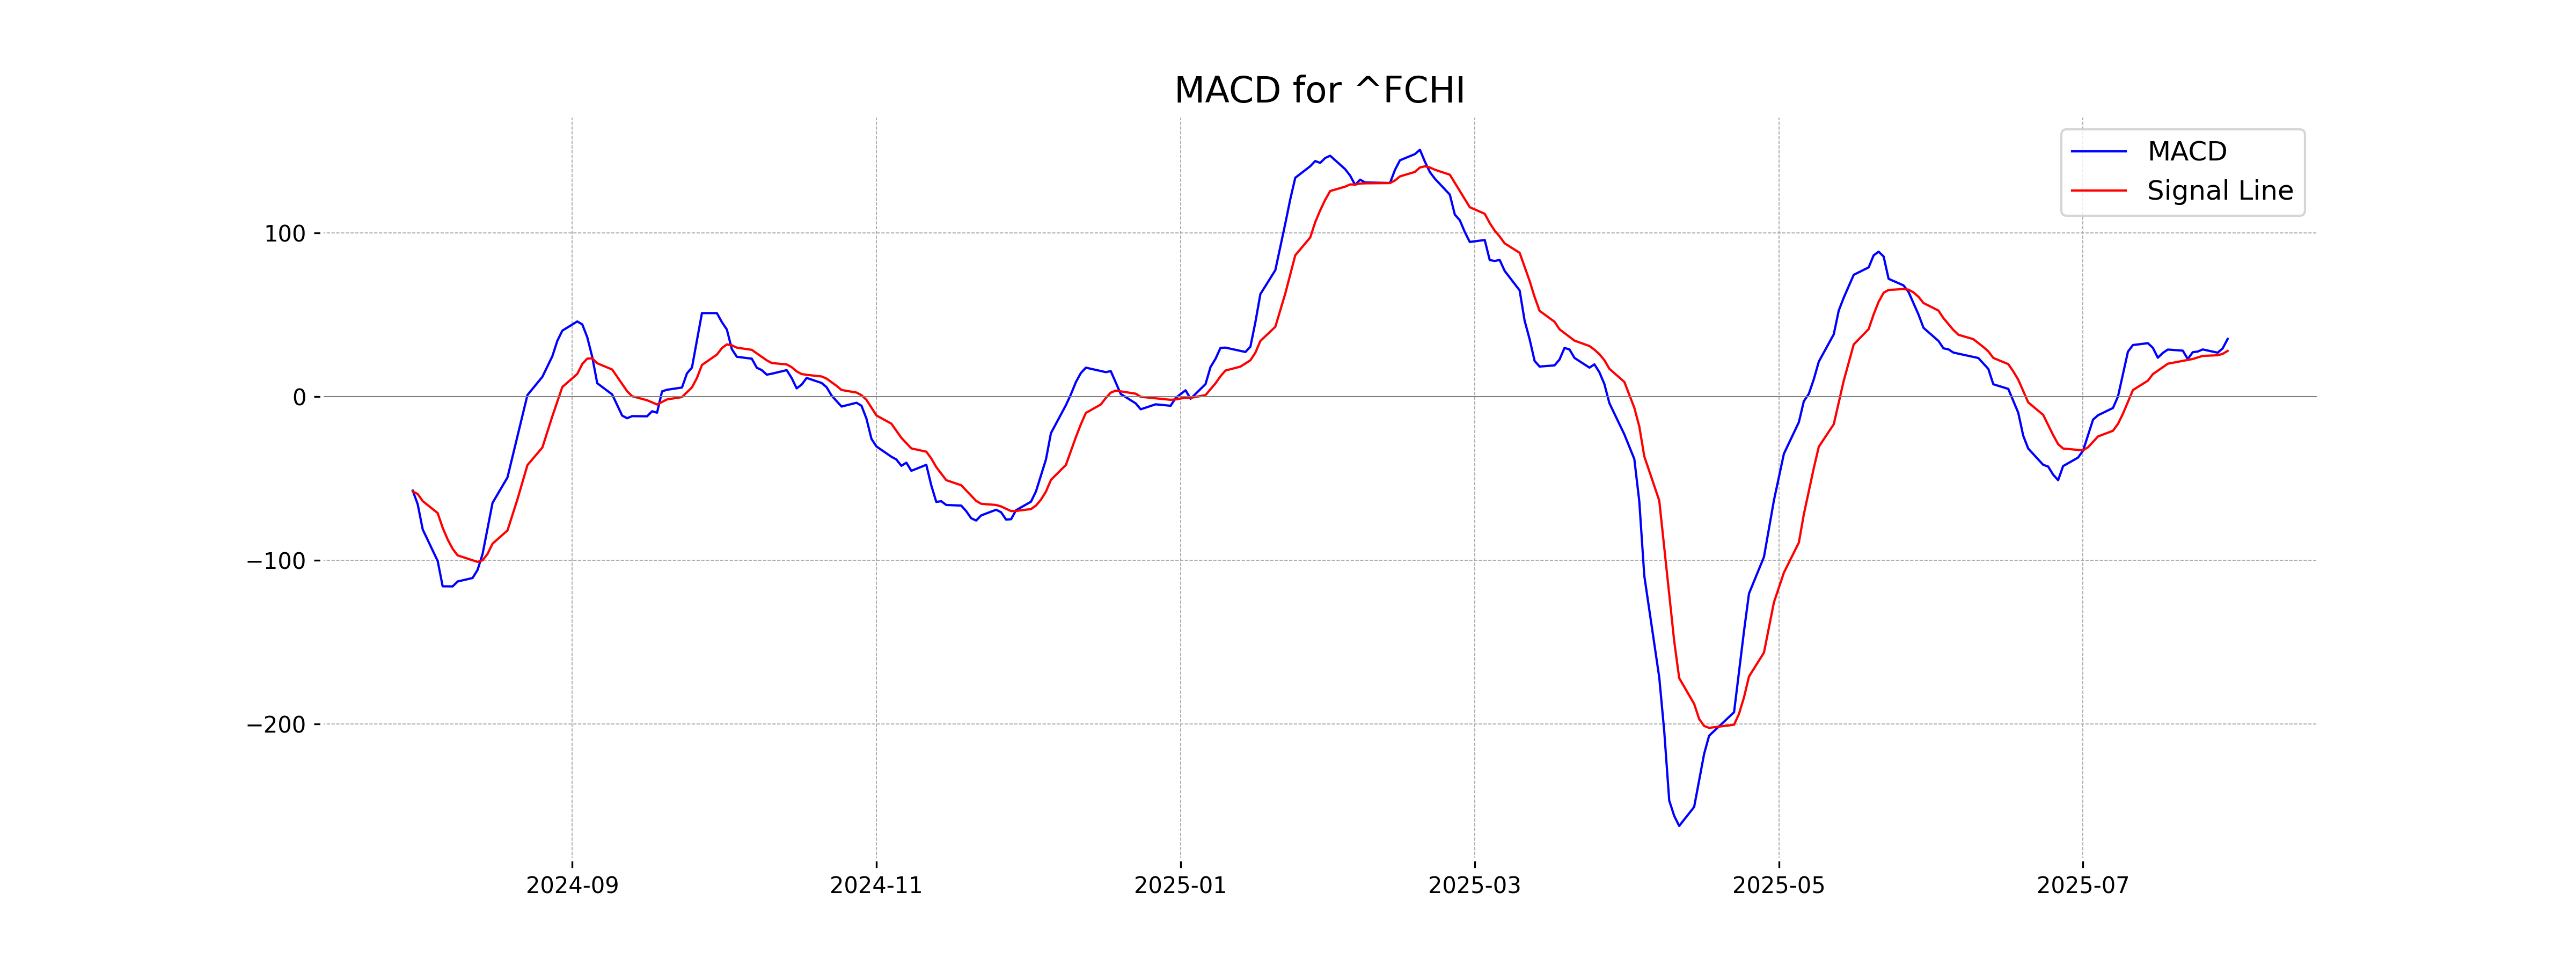
Moving Averages Trend (MACD)
The CAC 40 (France) is currently showing a bullish signal as the MACD indicator (35.17) is above the MACD Signal line (27.85). This suggests that there may be upward momentum in the market. The RSI of 59.91 indicates a neither overbought nor oversold condition, further supporting the positive outlook.
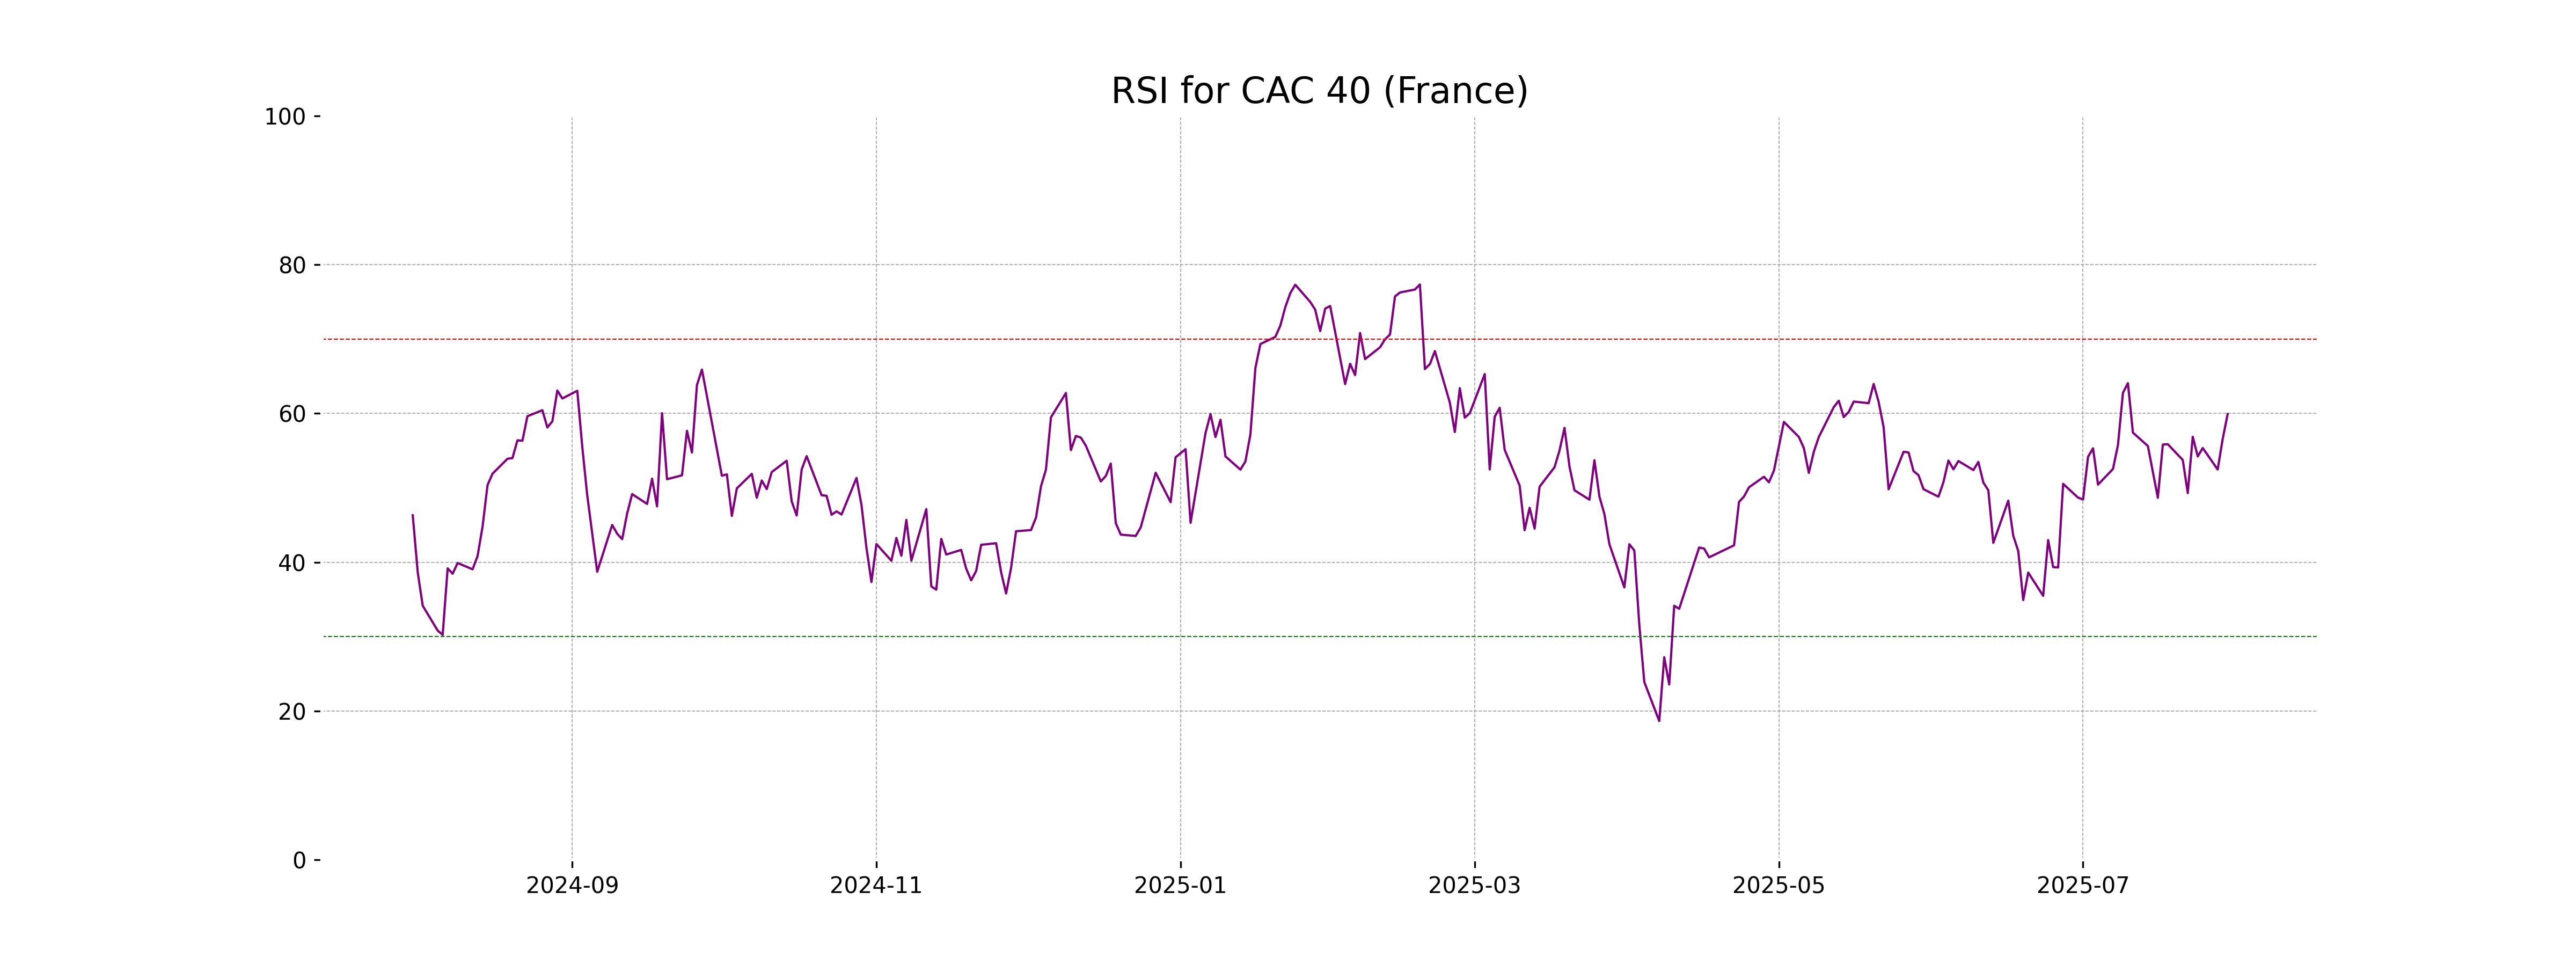
RSI Analysis
The RSI for CAC 40 (France) is 59.91, indicating a neutral to slightly bullish momentum. Being below 70 suggests that the index is not yet in overbought territory, with potential room for an upward trend continuation.
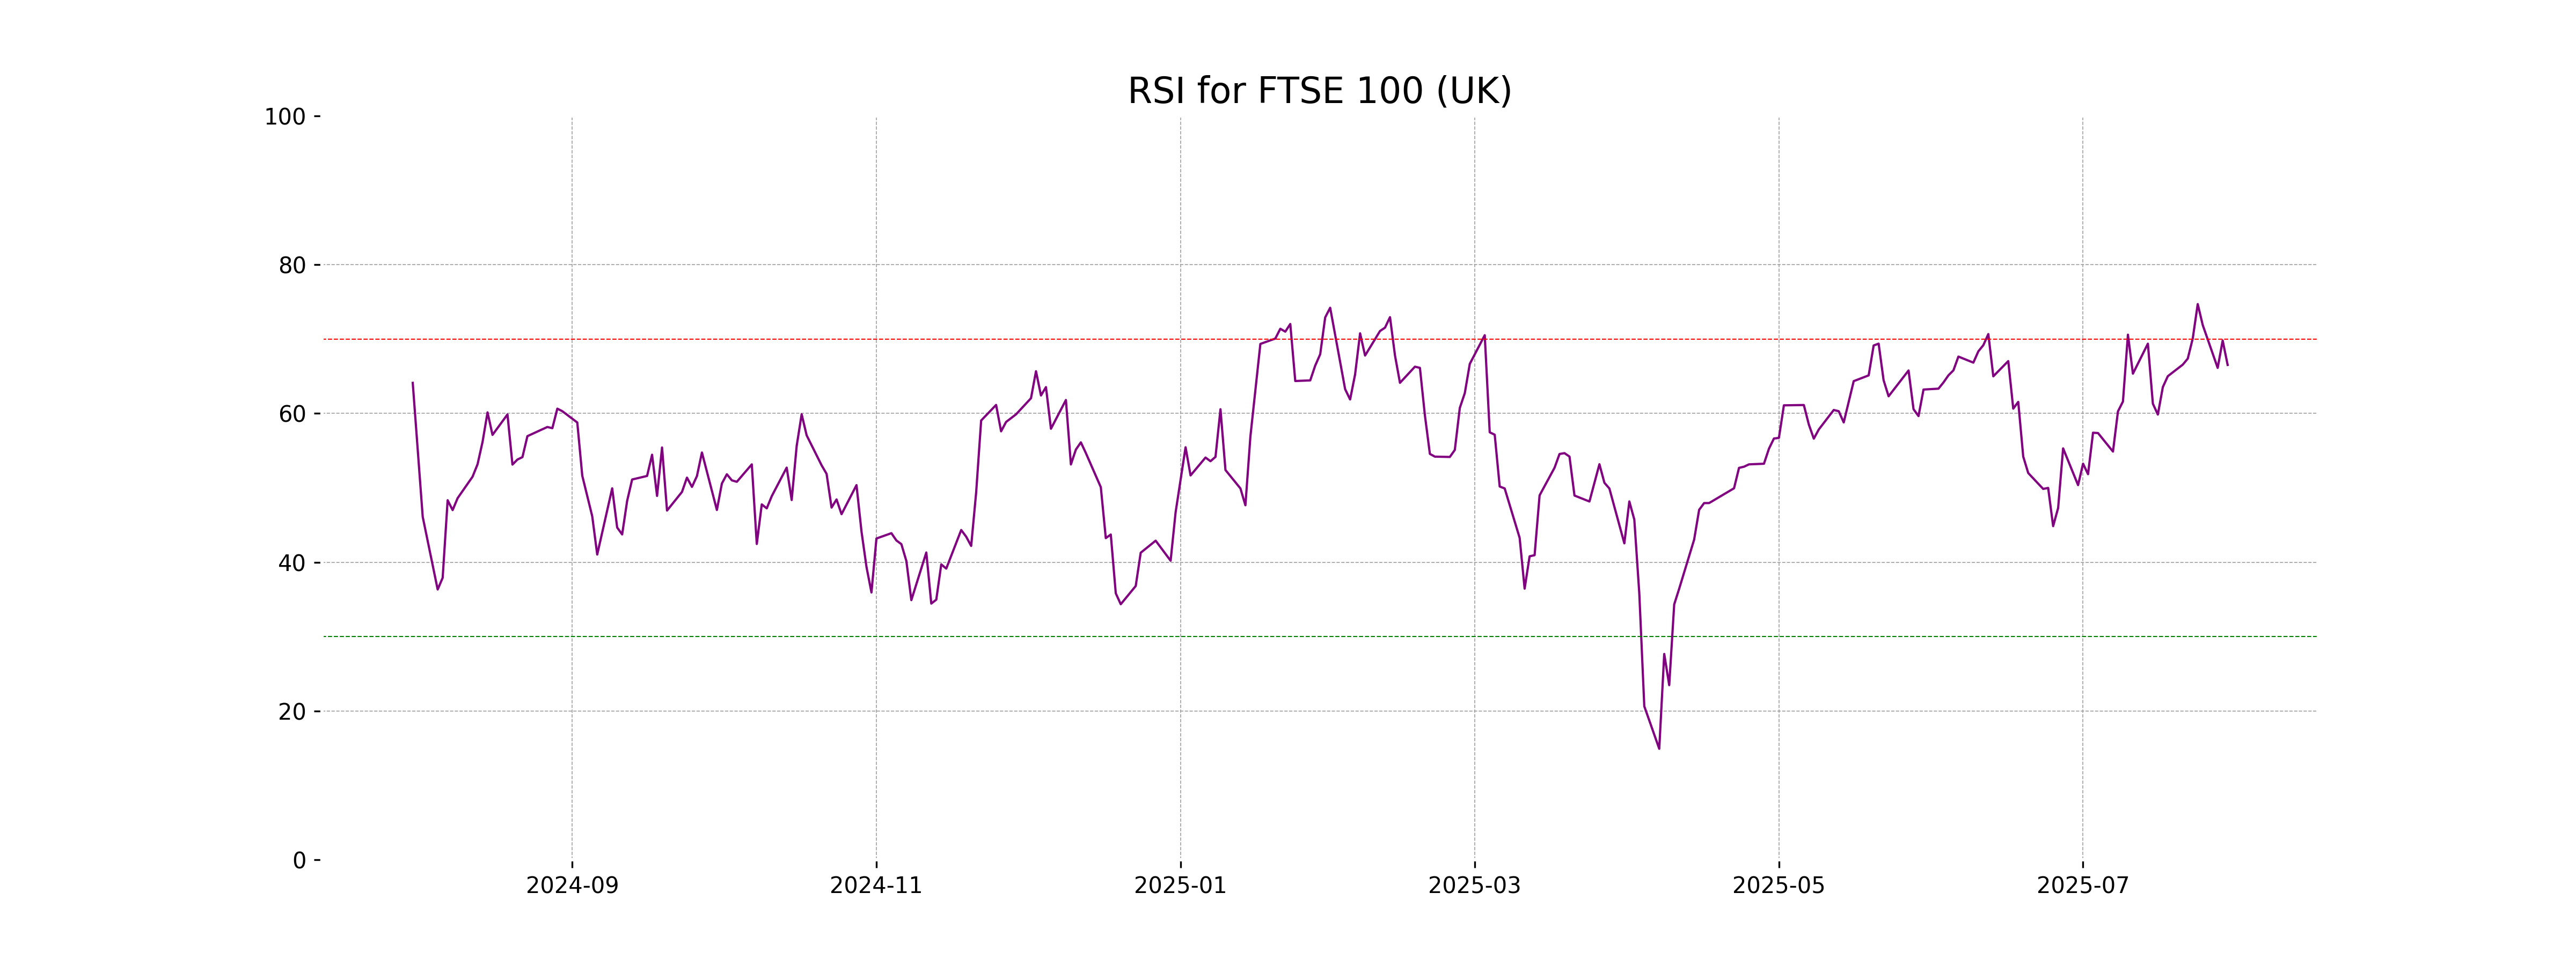
Analysis for FTSE 100 (UK) - July 30, 2025
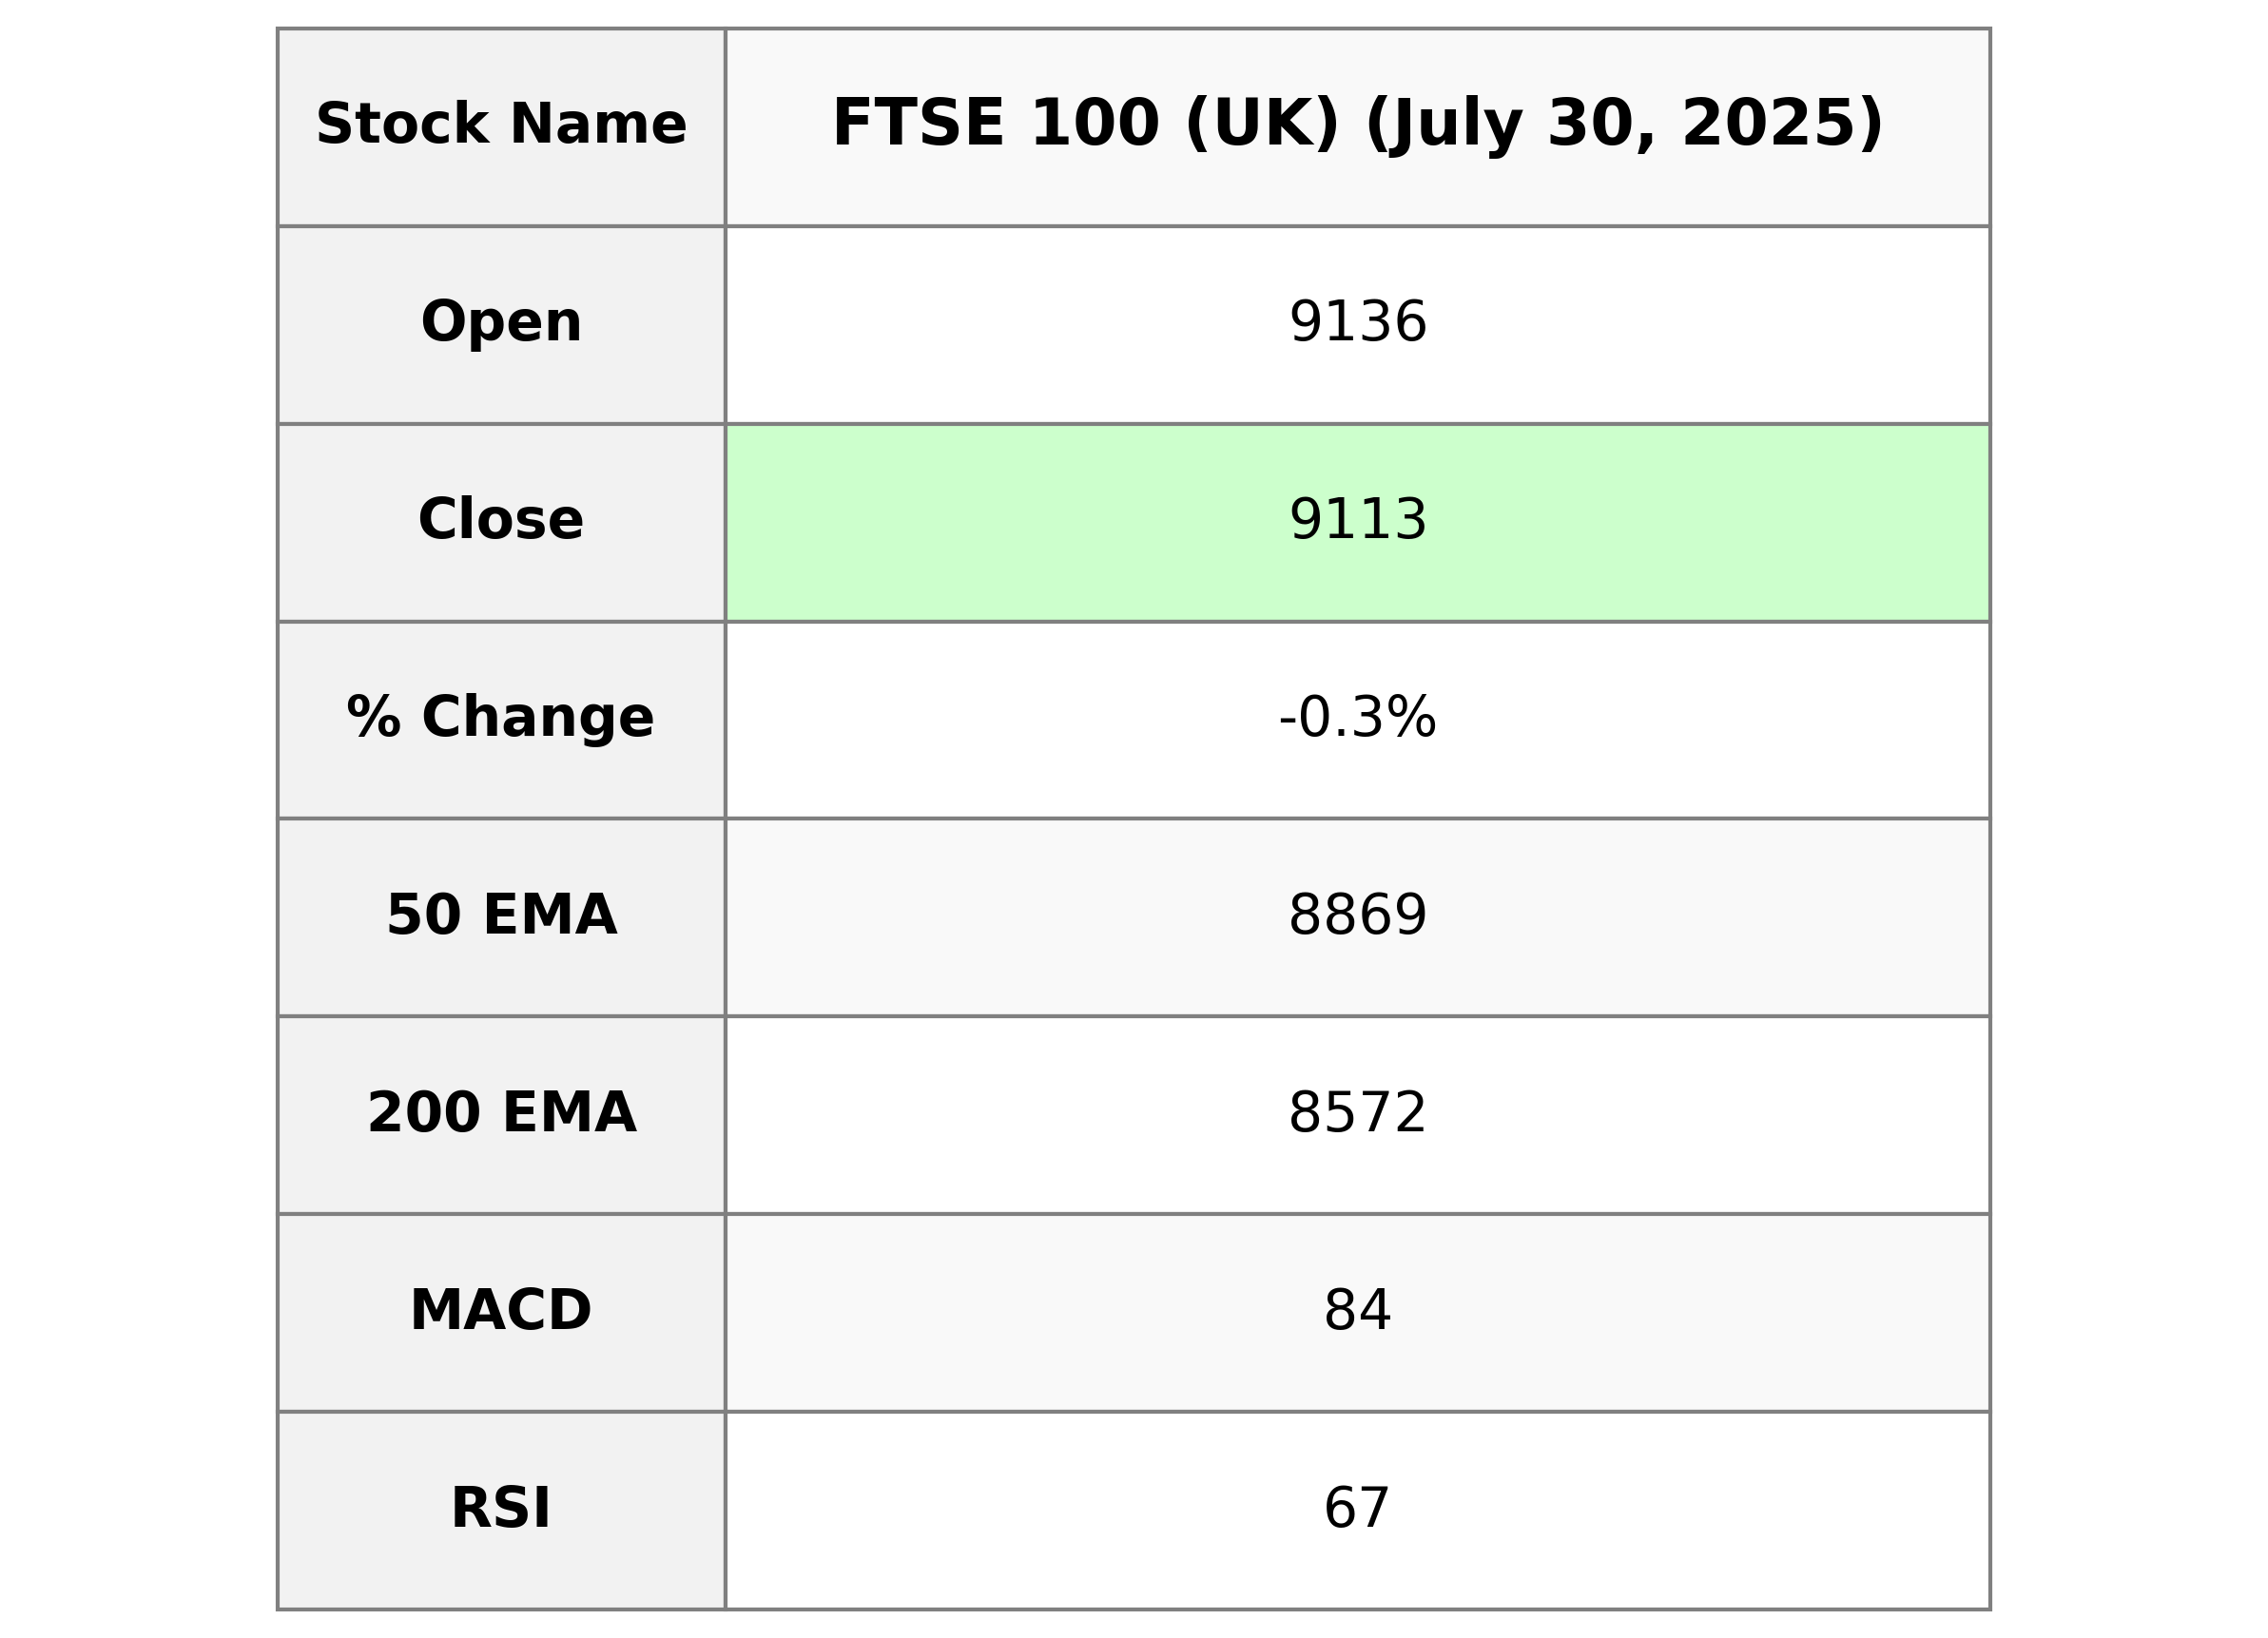
FTSE 100 (UK) opened at 9136.32, reached a high of 9146.79 and closed at 9113.13, indicating a slight decline with a percentage change of -0.25%. The index's RSI is at 66.52, suggesting near overbought conditions, while its MACD value of 83.72 indicates potential upward momentum above the signal line of 73.22.
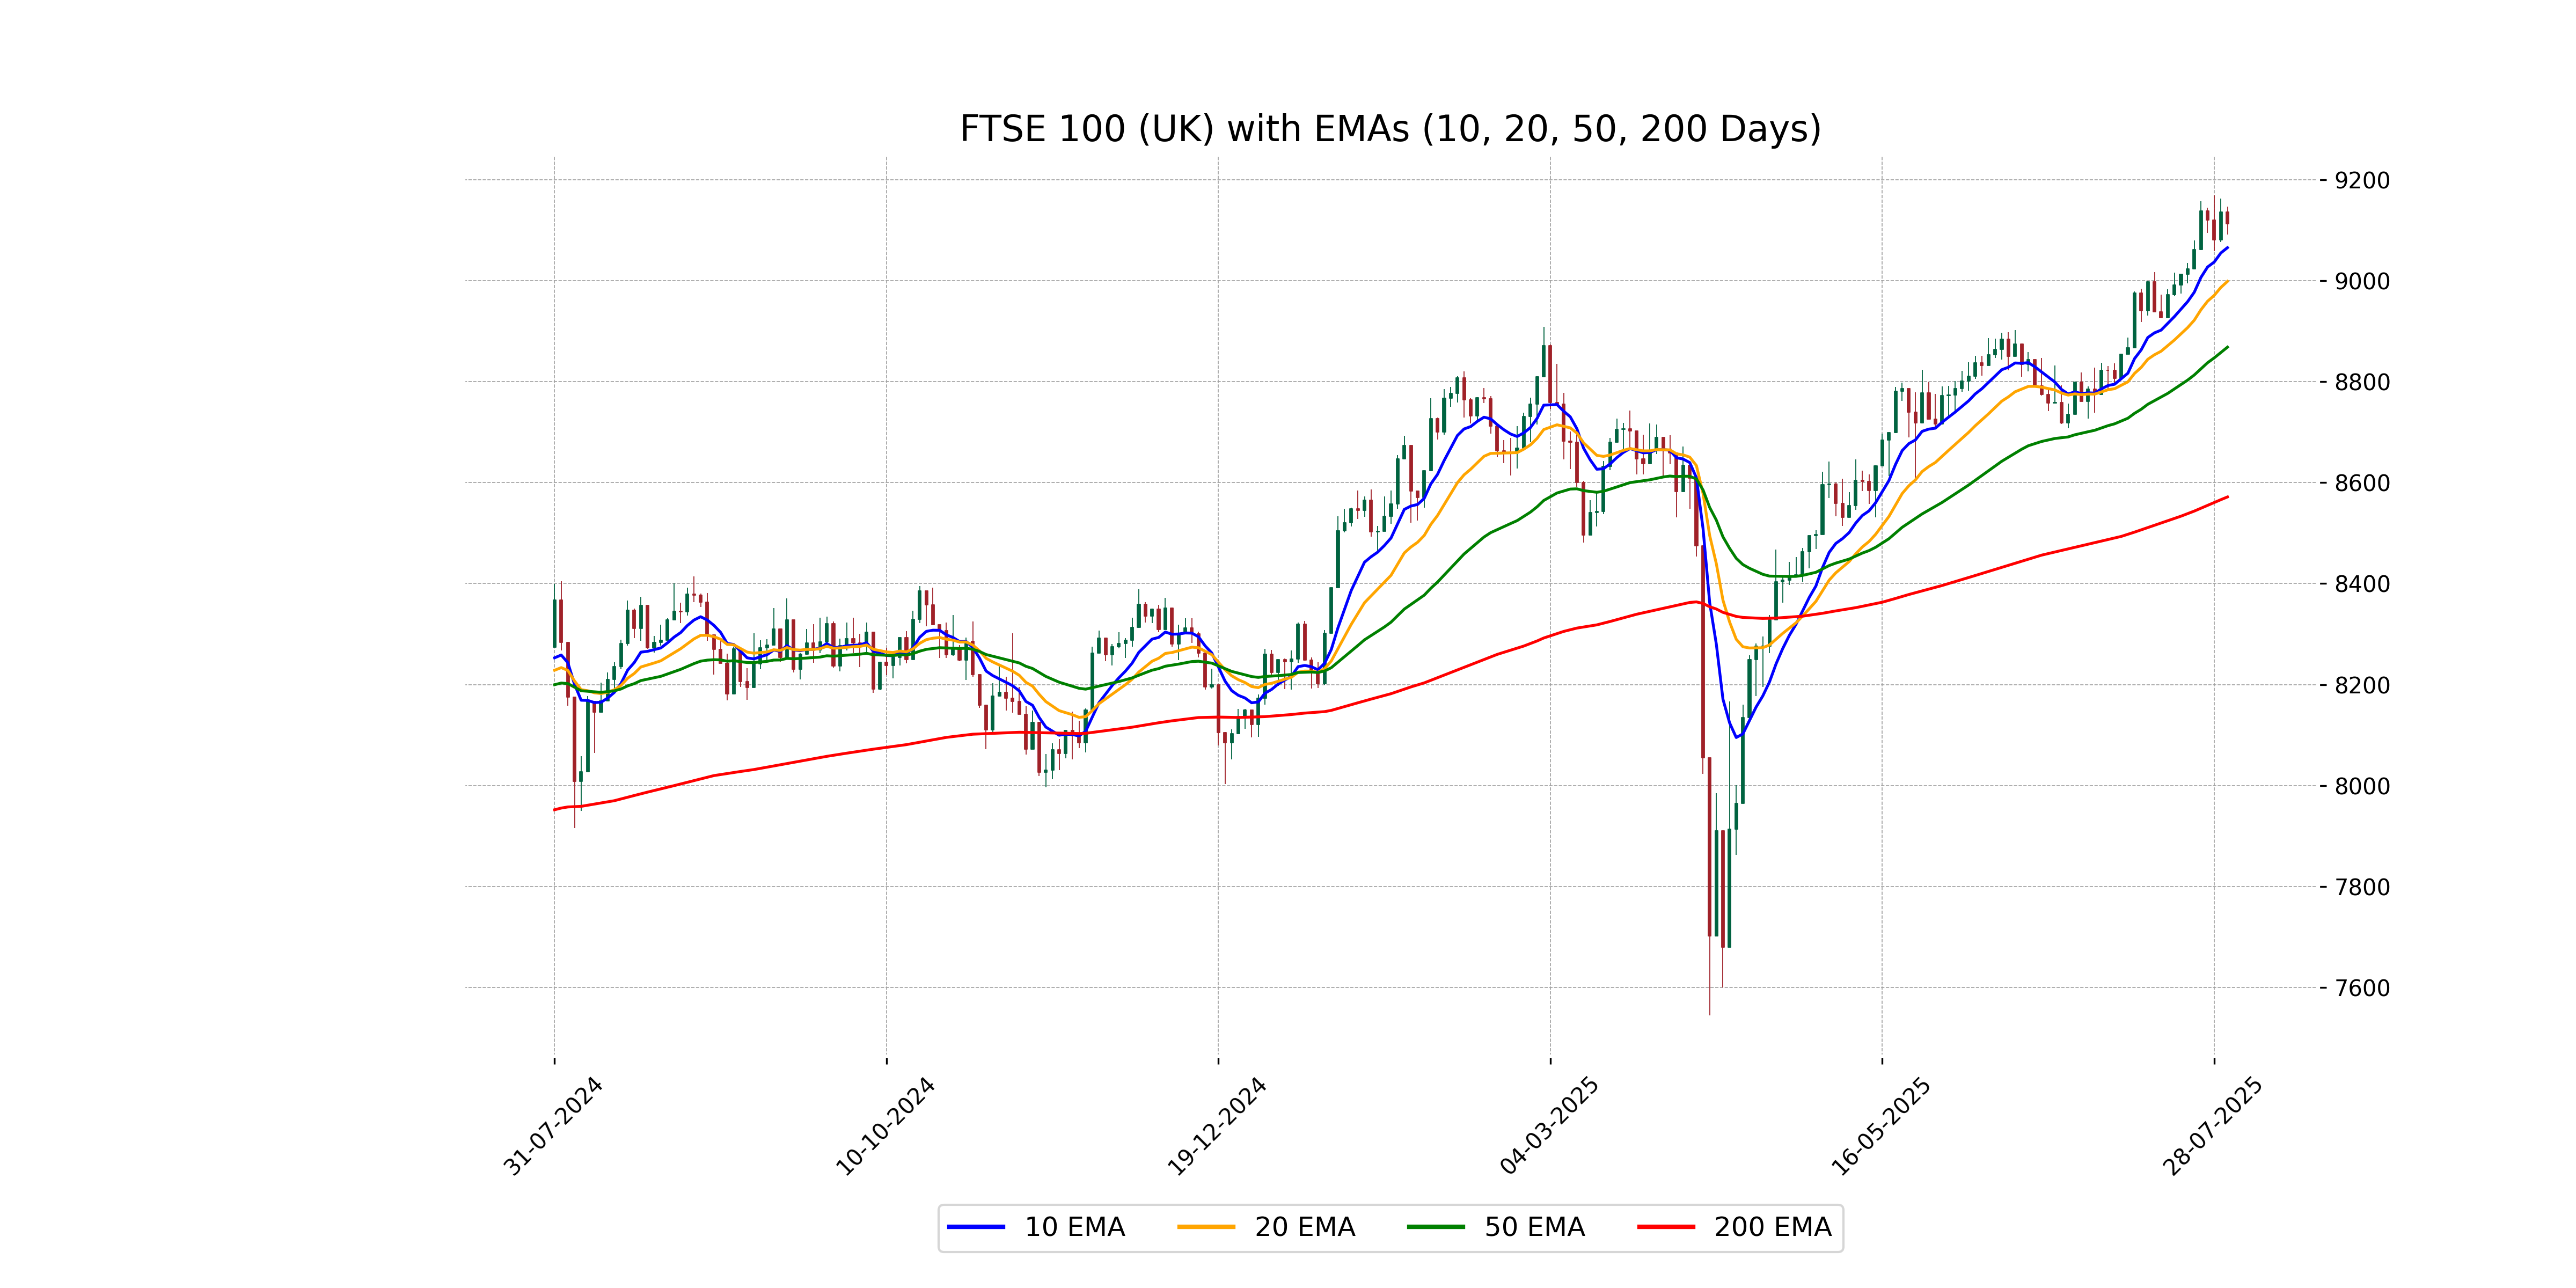
Relationship with Key Moving Averages
The FTSE 100 is trading slightly above its 10 EMA (9065.74) and significantly above both the 50 EMA (8868.58) and the 200 EMA (8571.75), indicating a short-term bullish trend. However, given the recent slight decline of 0.25%, traders should watch for potential reversal signs.
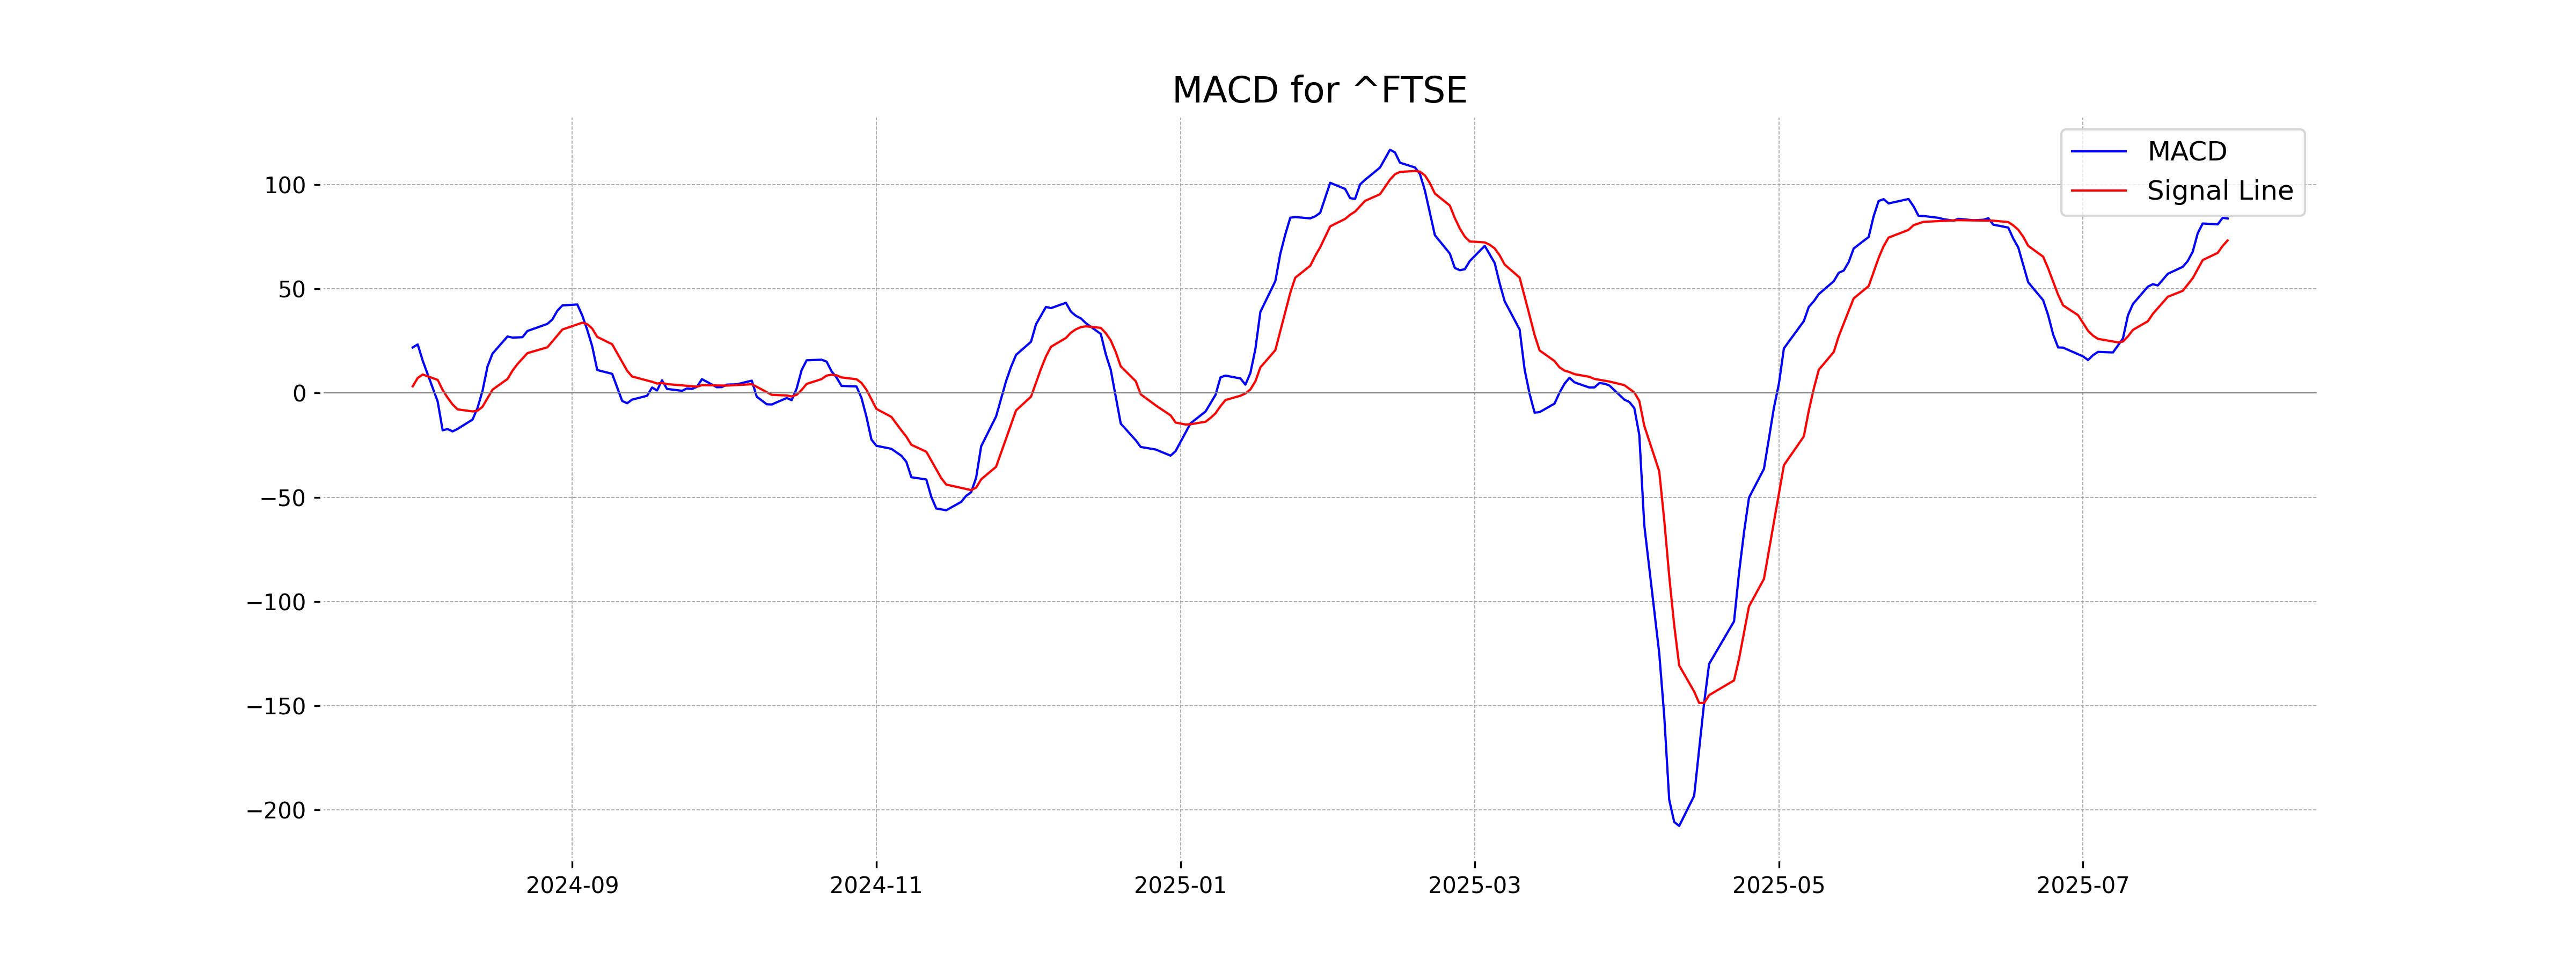
Moving Averages Trend (MACD)
The FTSE 100 shows a positive trend with an MACD of 83.72, which is above the MACD Signal of 73.22, suggesting bullish momentum. This indicates a favorable buying trend in the market.
RSI Analysis
The FTSE 100 index currently has an RSI value of 66.52. This suggests that the index is approaching overbought territory, indicating potential upward momentum but also caution for any possible price corrections if the index continues to rise in value.
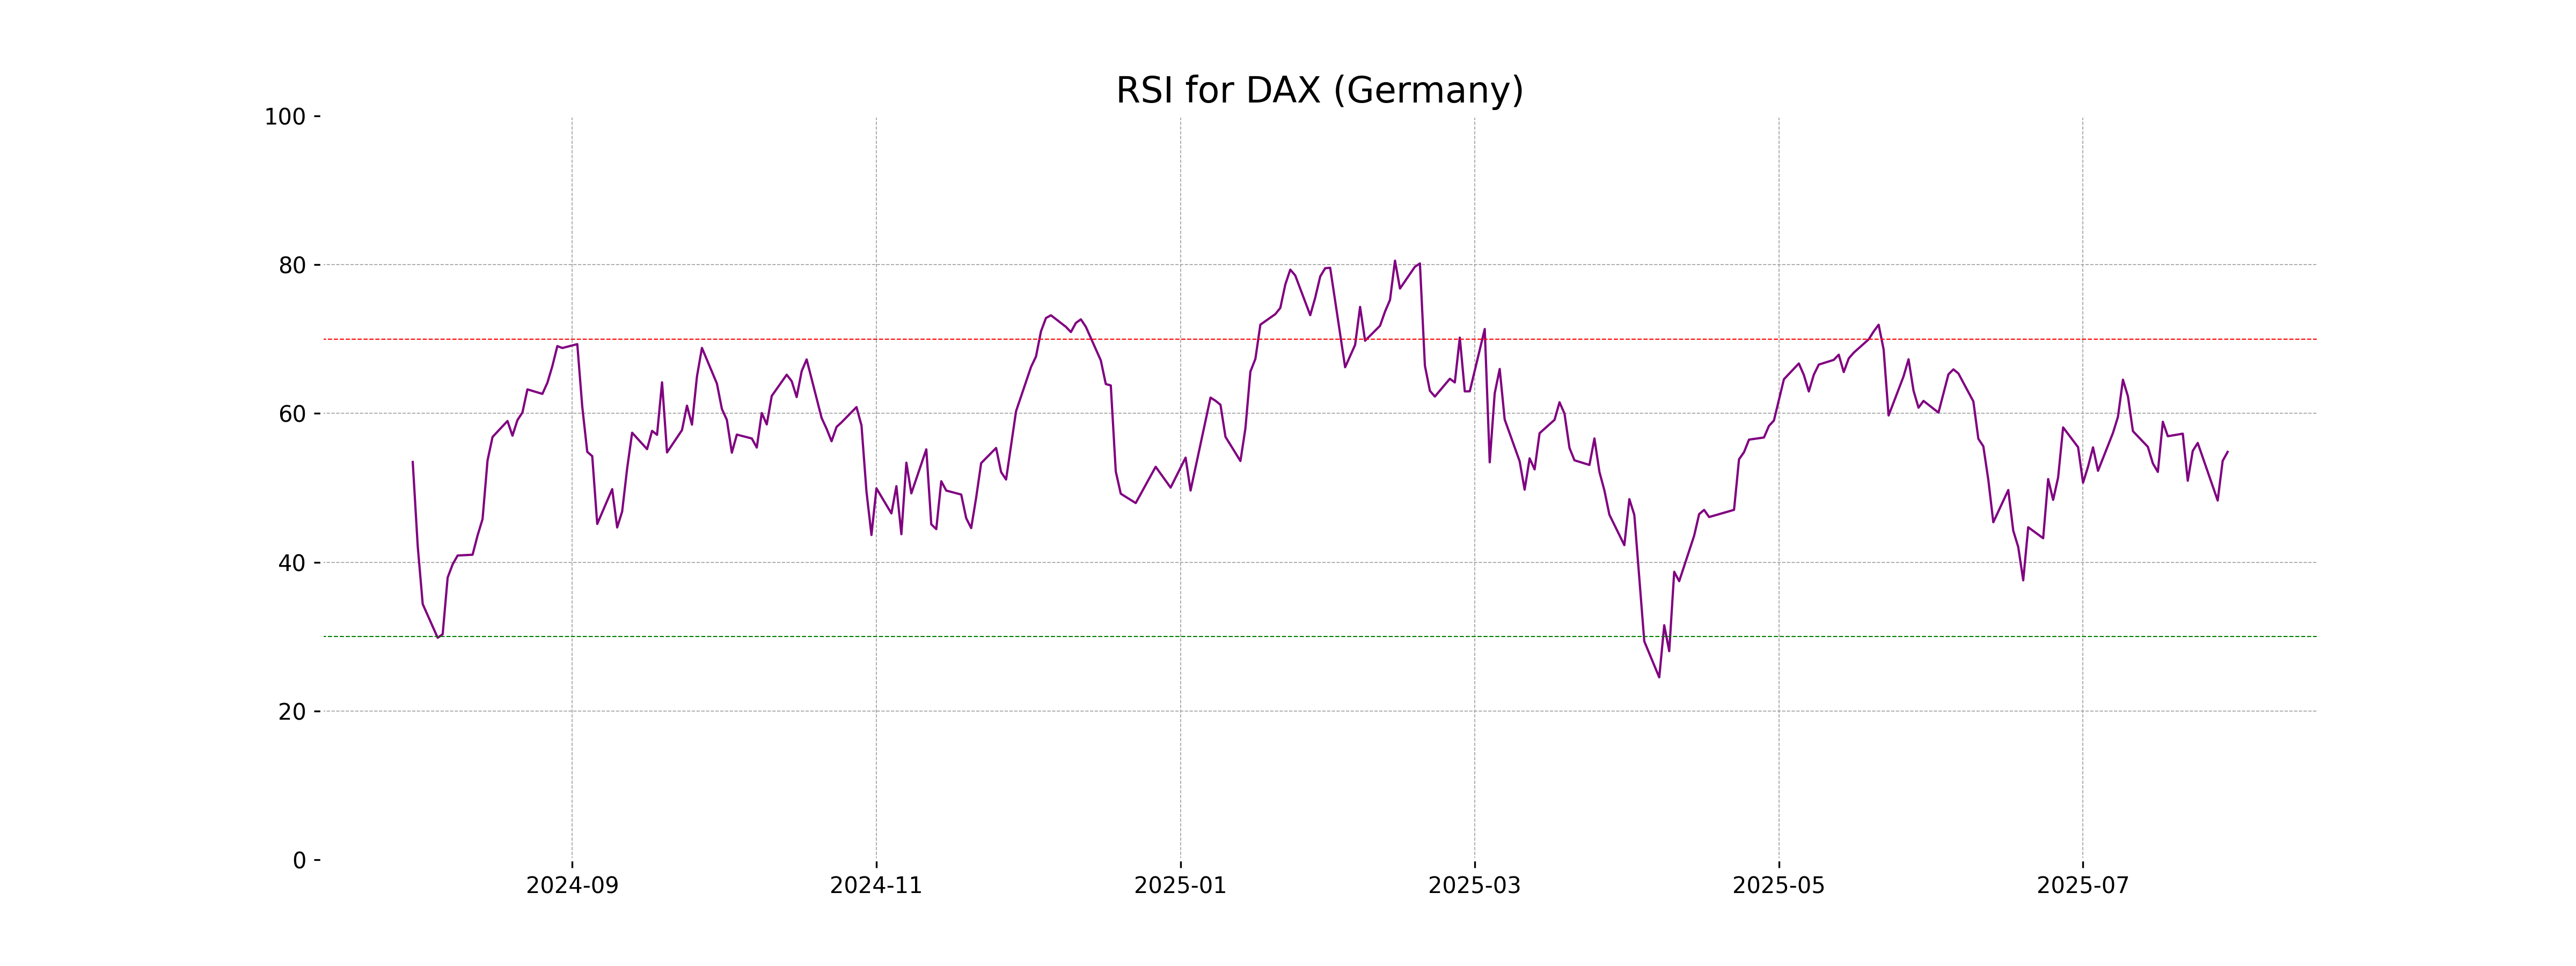
Analysis for DAX (Germany) - July 30, 2025
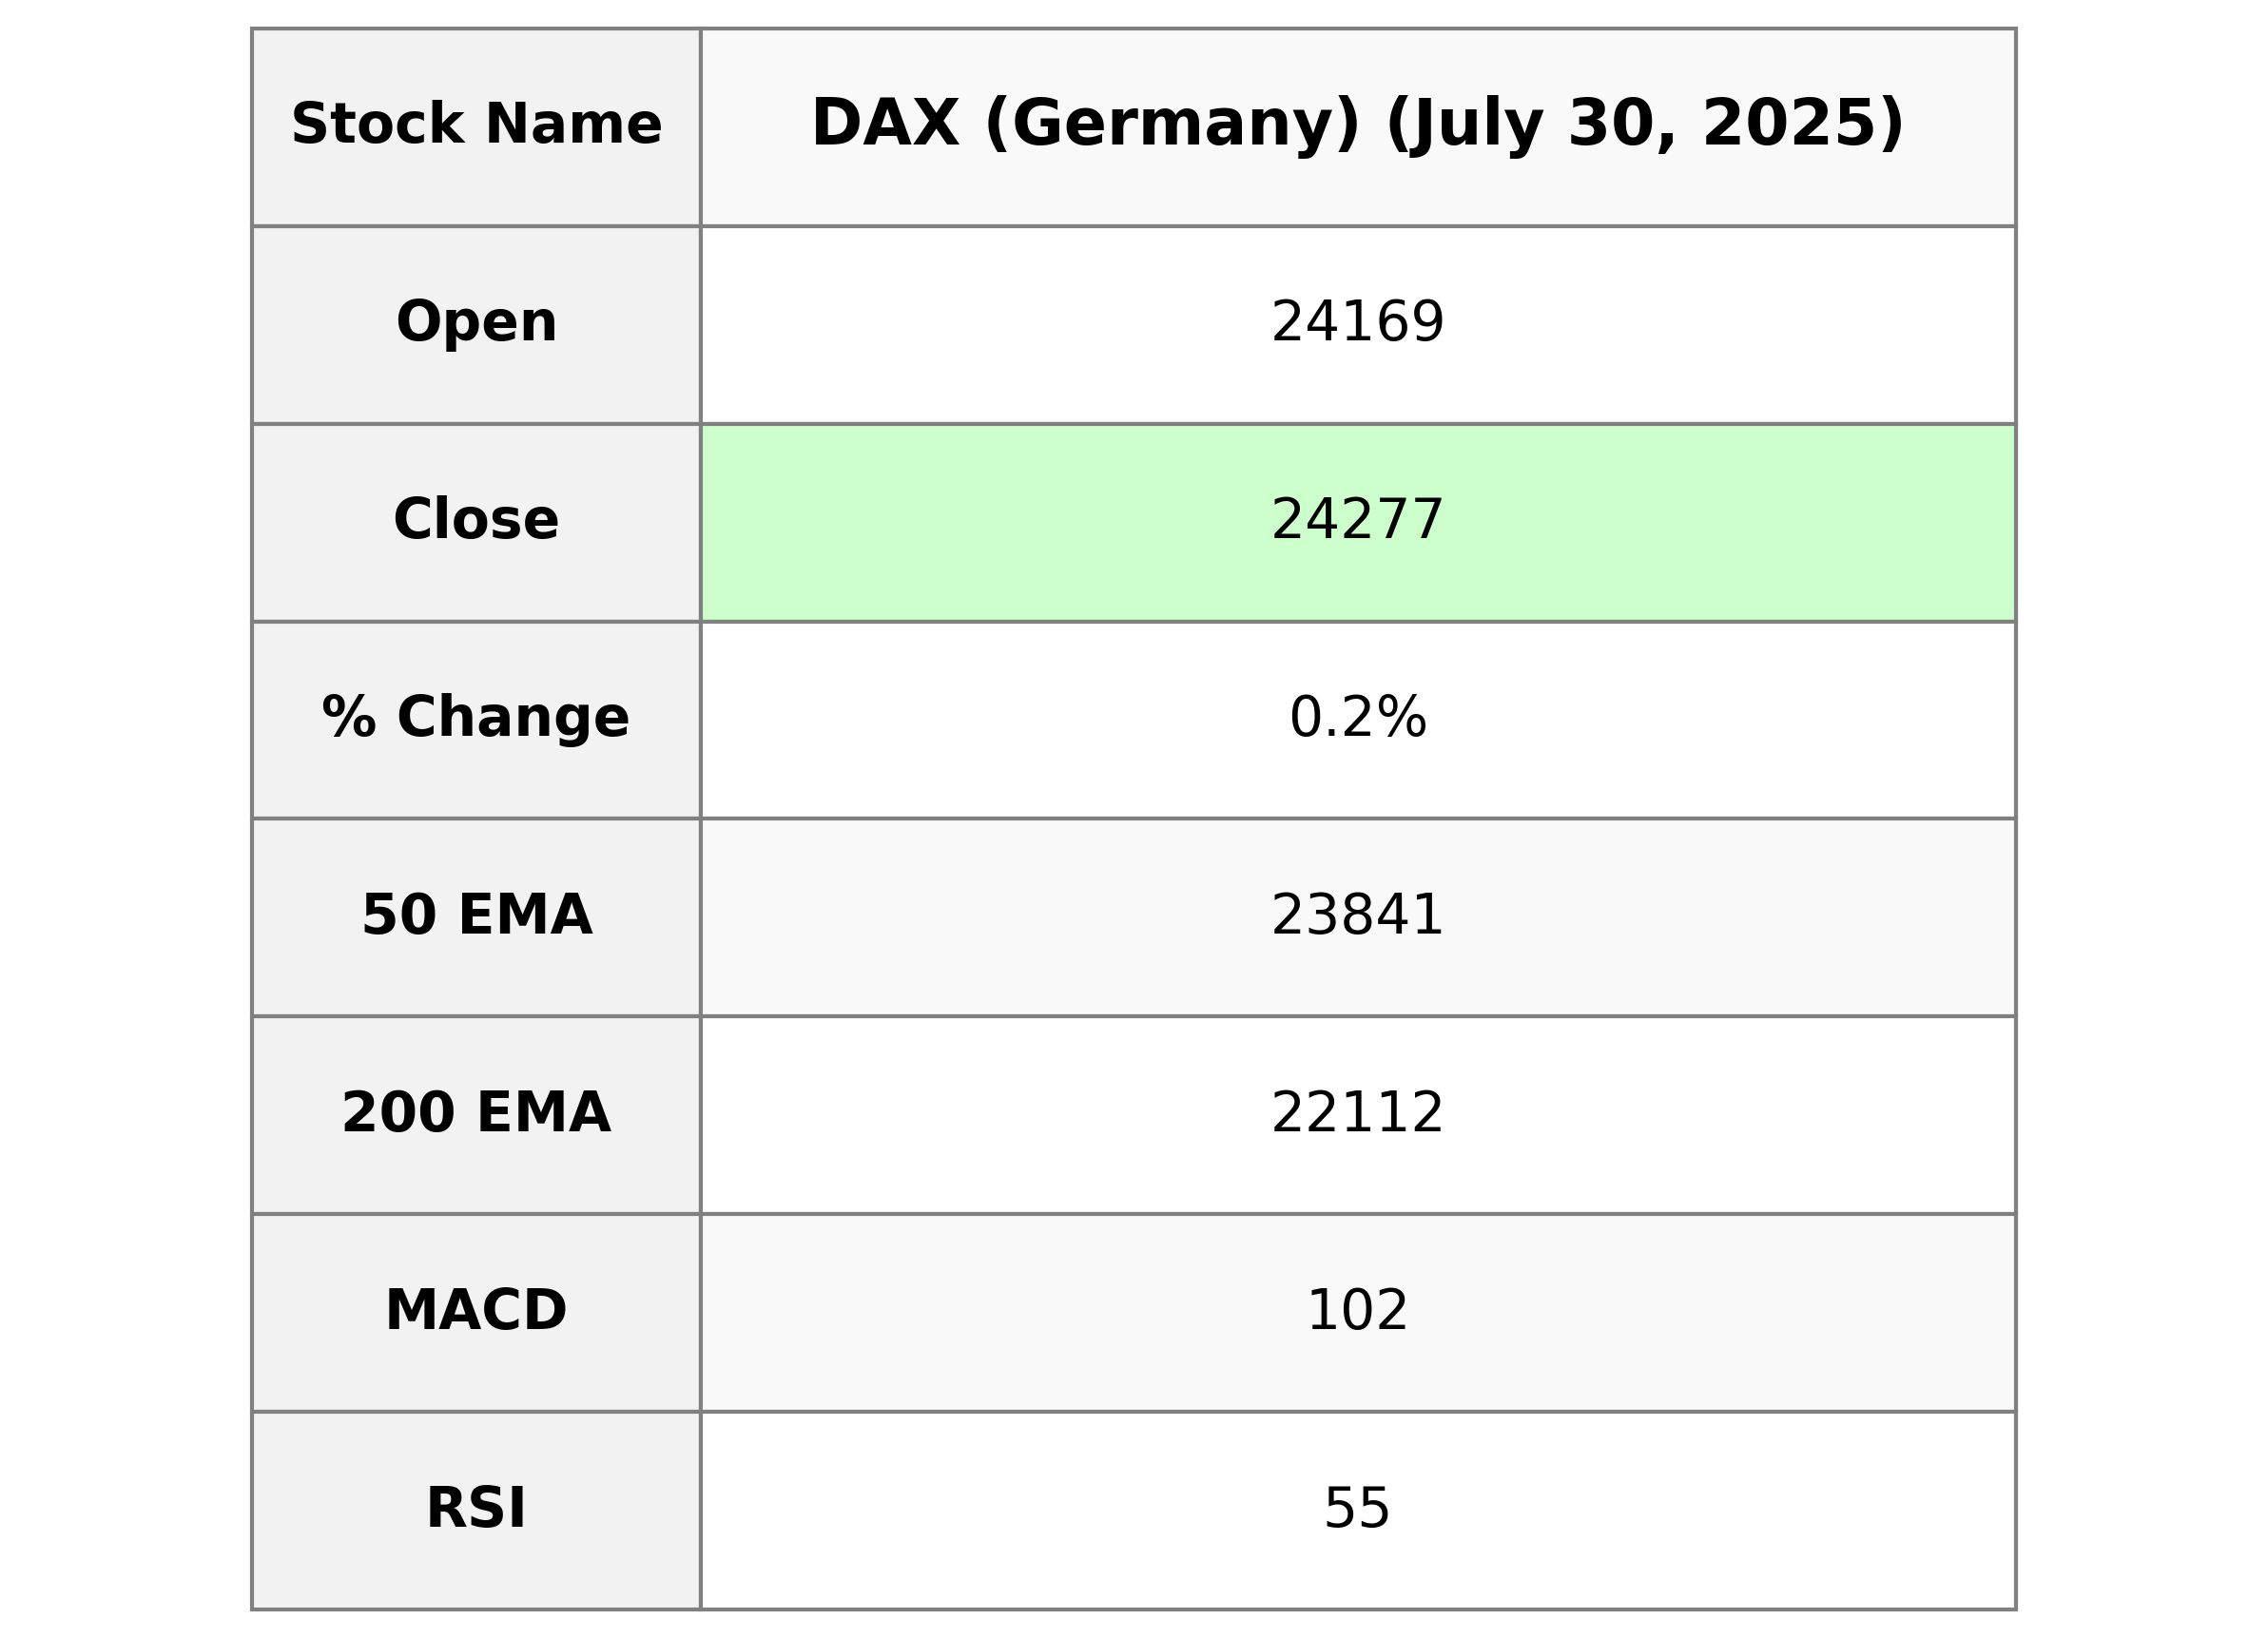
DAX Performance Overview: The DAX index opened at 24,169.26 and closed at 24,277.34, marking a slight rise with a percentage change of 0.25%, translating to a points change of approximately 59.97. The RSI is at 54.84, indicating a neutral position, while the MACD is below the signal line, suggesting a potential downward trend. The absence of market cap, PE ratio, and other specifics indicates limited contextual financial data.
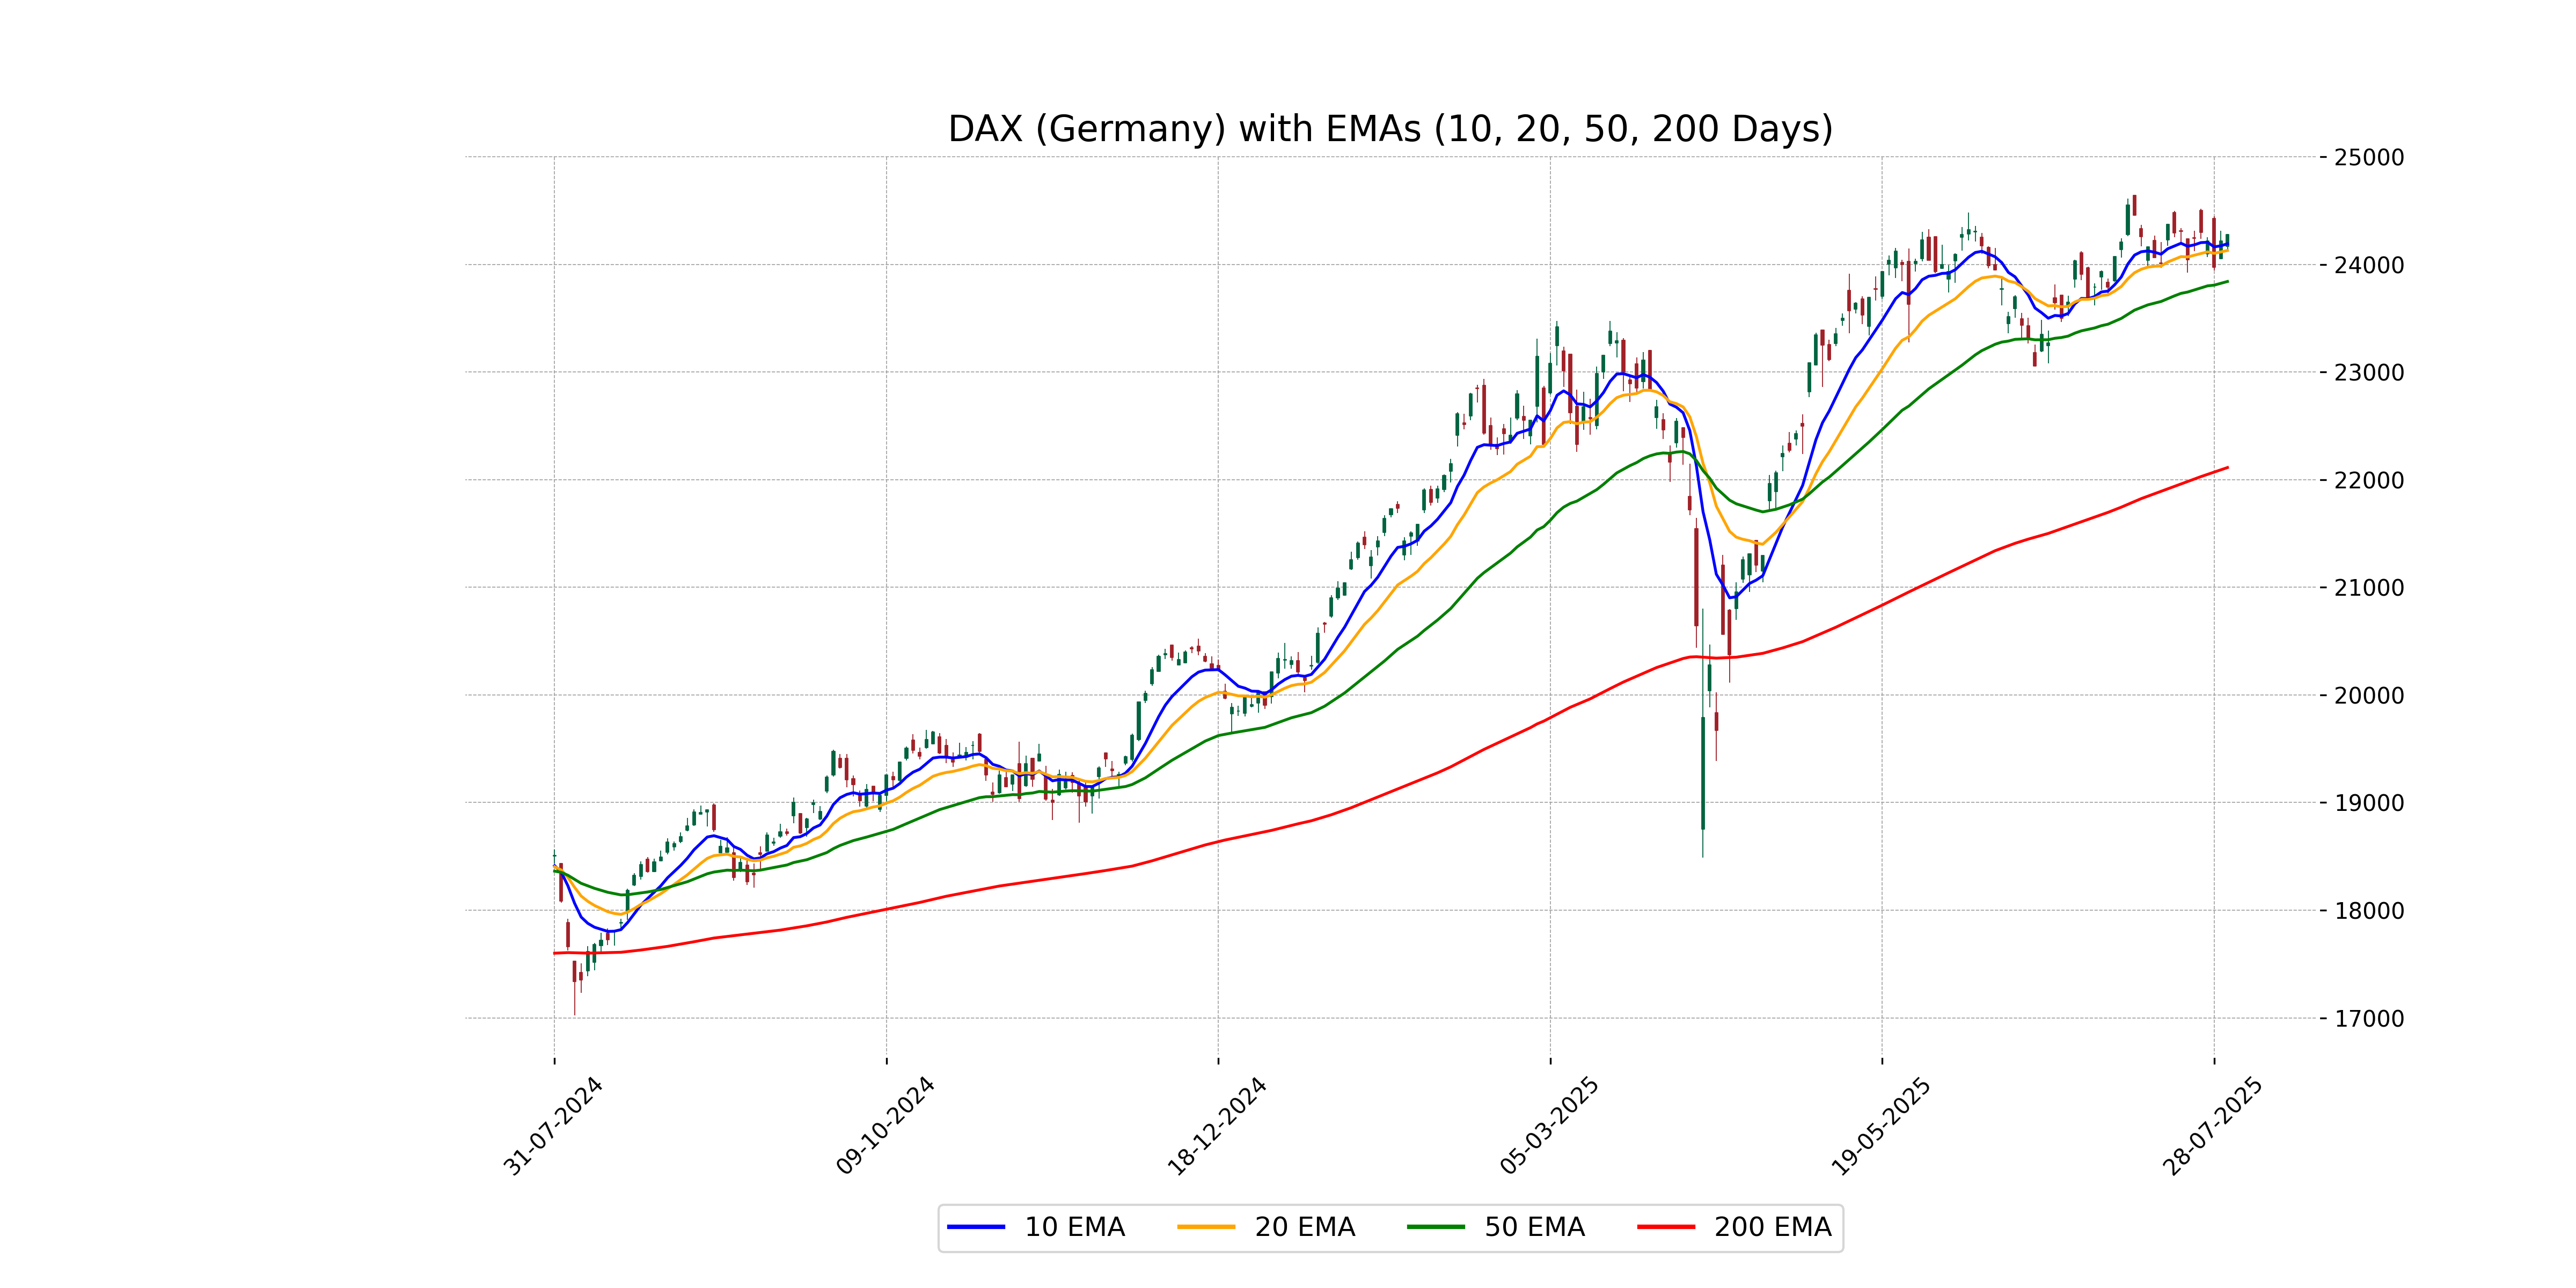
Relationship with Key Moving Averages
The close price of DAX at 24,277.34 is above both the 50-day EMA at 23,840.70 and the 10-day EMA at 24,191.31, indicating a short-term bullish trend. However, it remains significantly above the 200-day EMA of 22,112.11, suggesting overall strong market momentum.
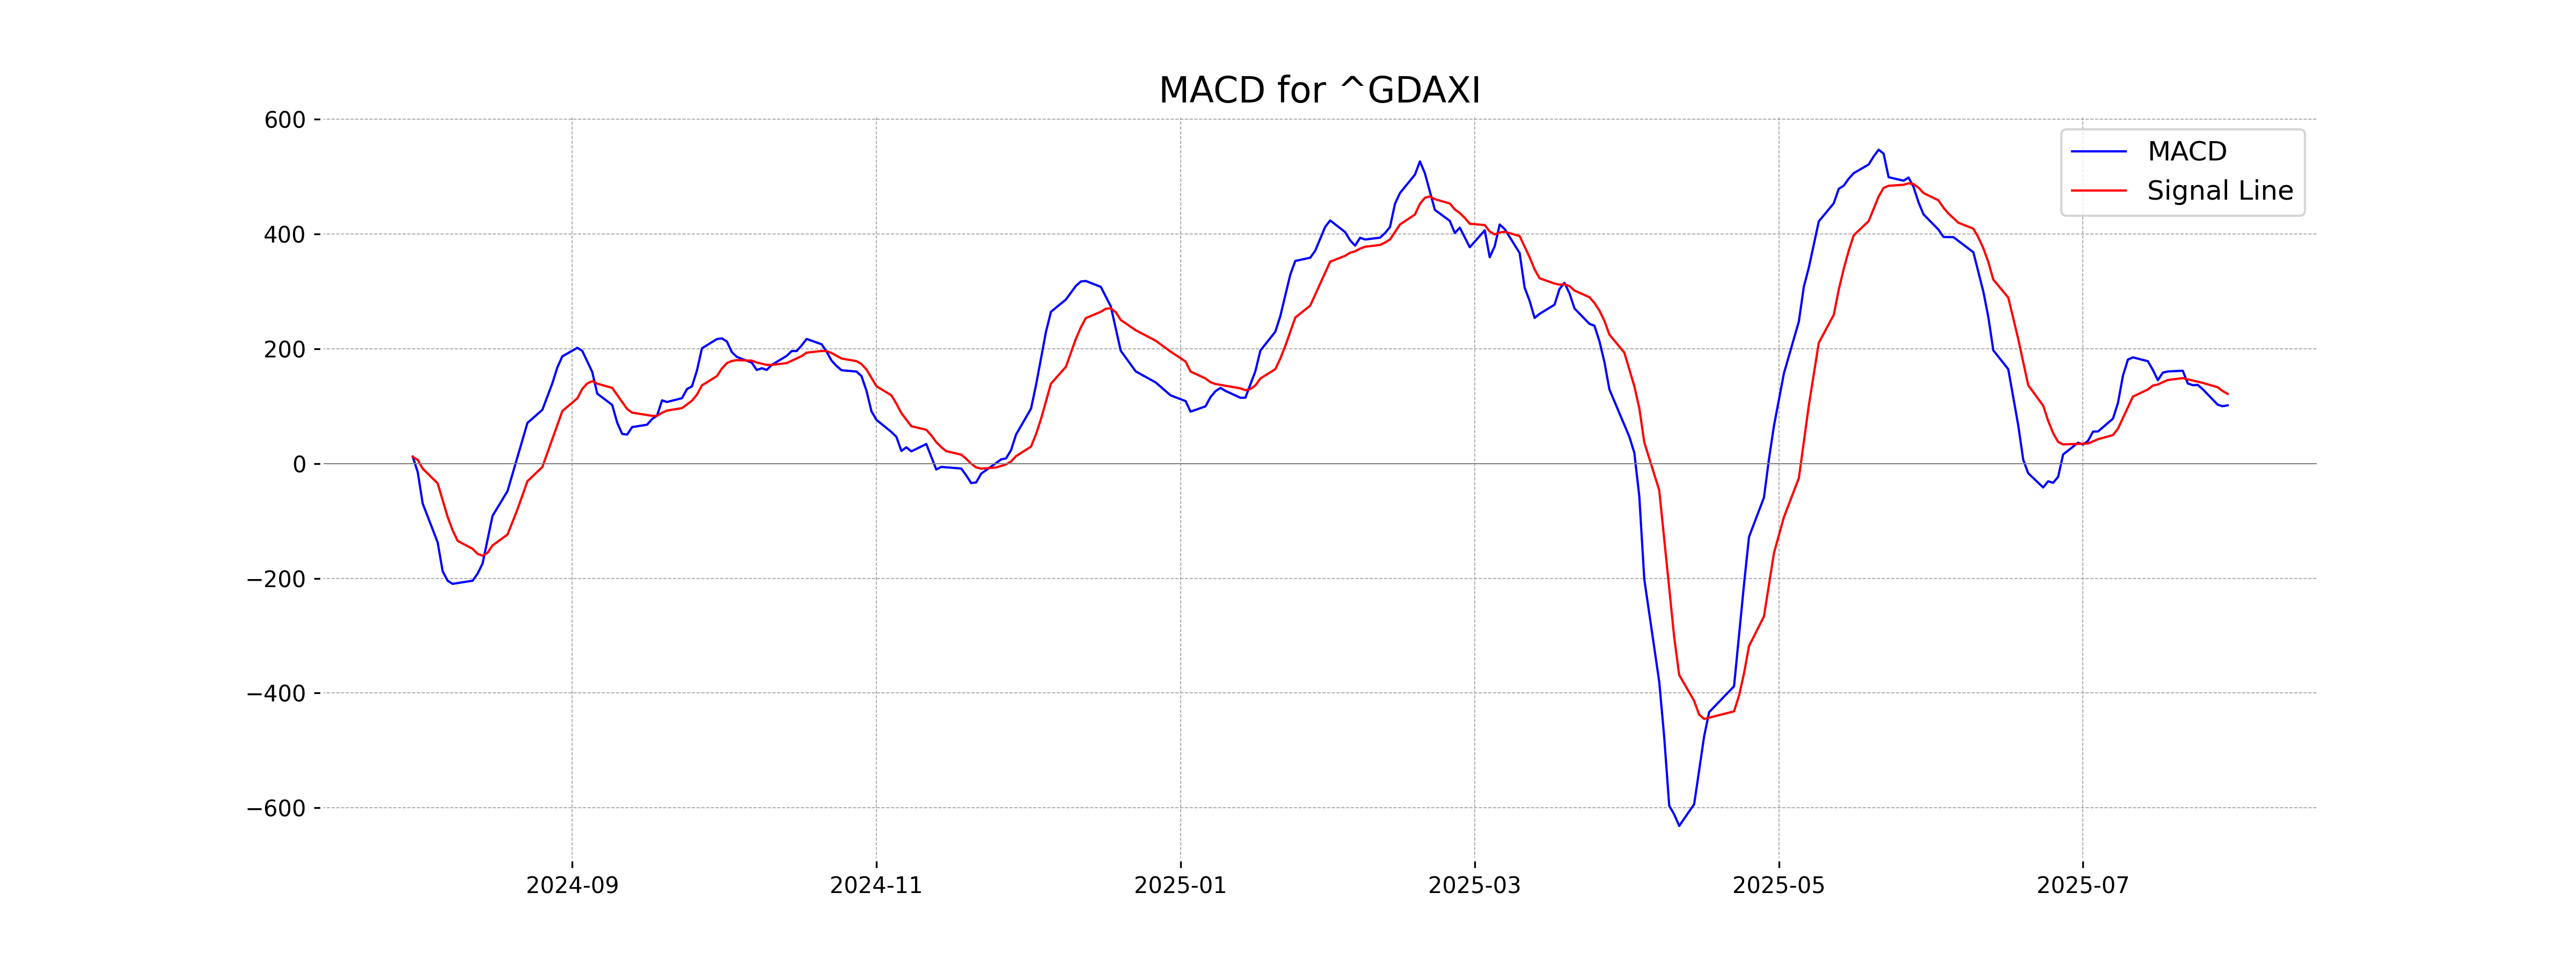
Moving Averages Trend (MACD)
The MACD for DAX shows a value of 101.57, while the MACD Signal is at 121.48. The MACD line is slightly below the signal line, suggesting a potential selling pressure or bearish sentiment, but the situation is quite close to the signal line, indicating potential limited change.
RSI Analysis
The RSI (Relative Strength Index) of DAX (Germany) is 54.84, indicating a neutral momentum as it is neither overbought nor oversold, being close to the midpoint of 50. This suggests a balanced market sentiment where buying and selling pressures are relatively equal.
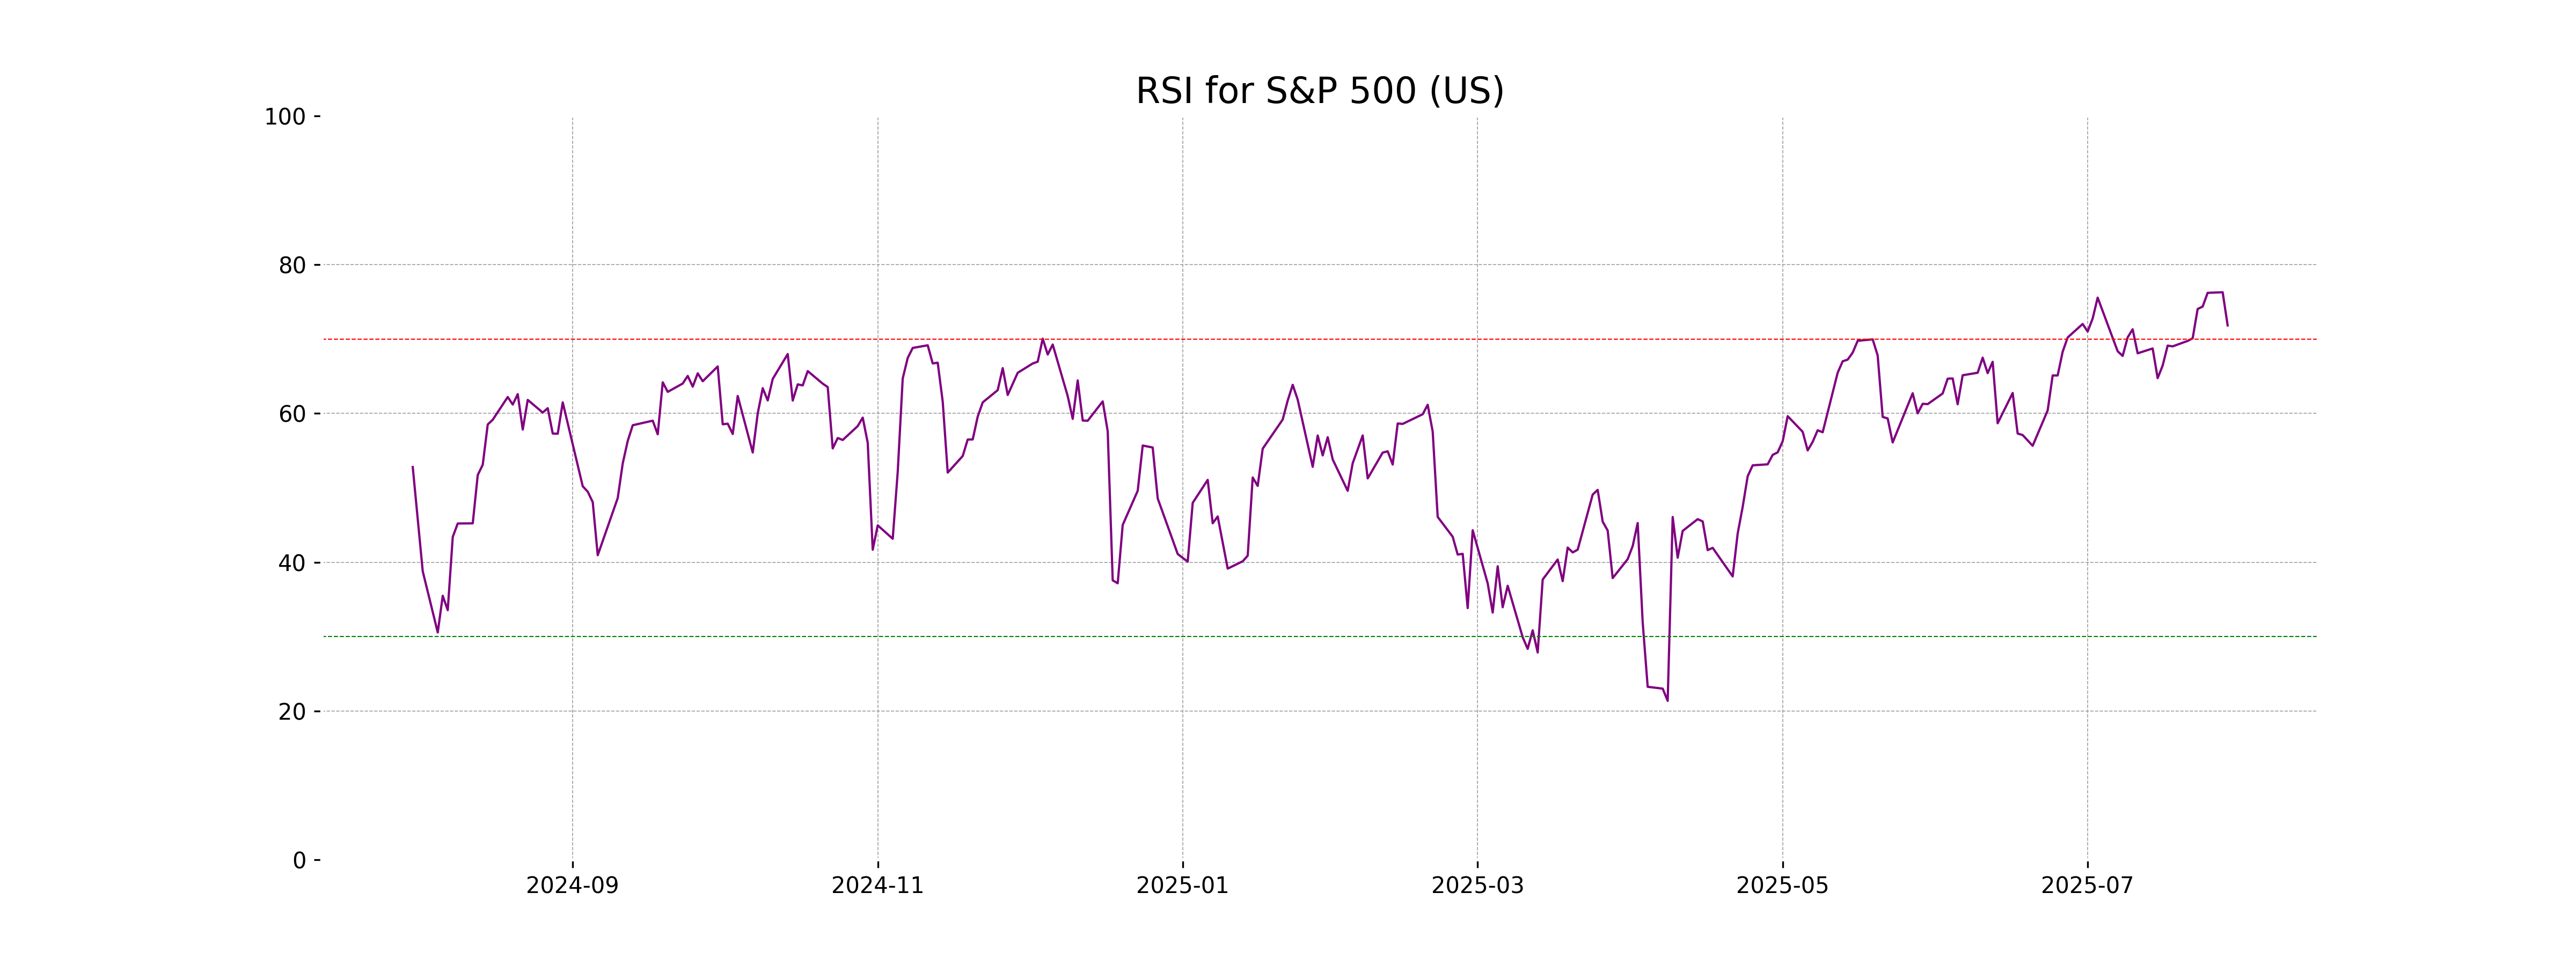
Analysis for S&P 500 (US) - July 30, 2025
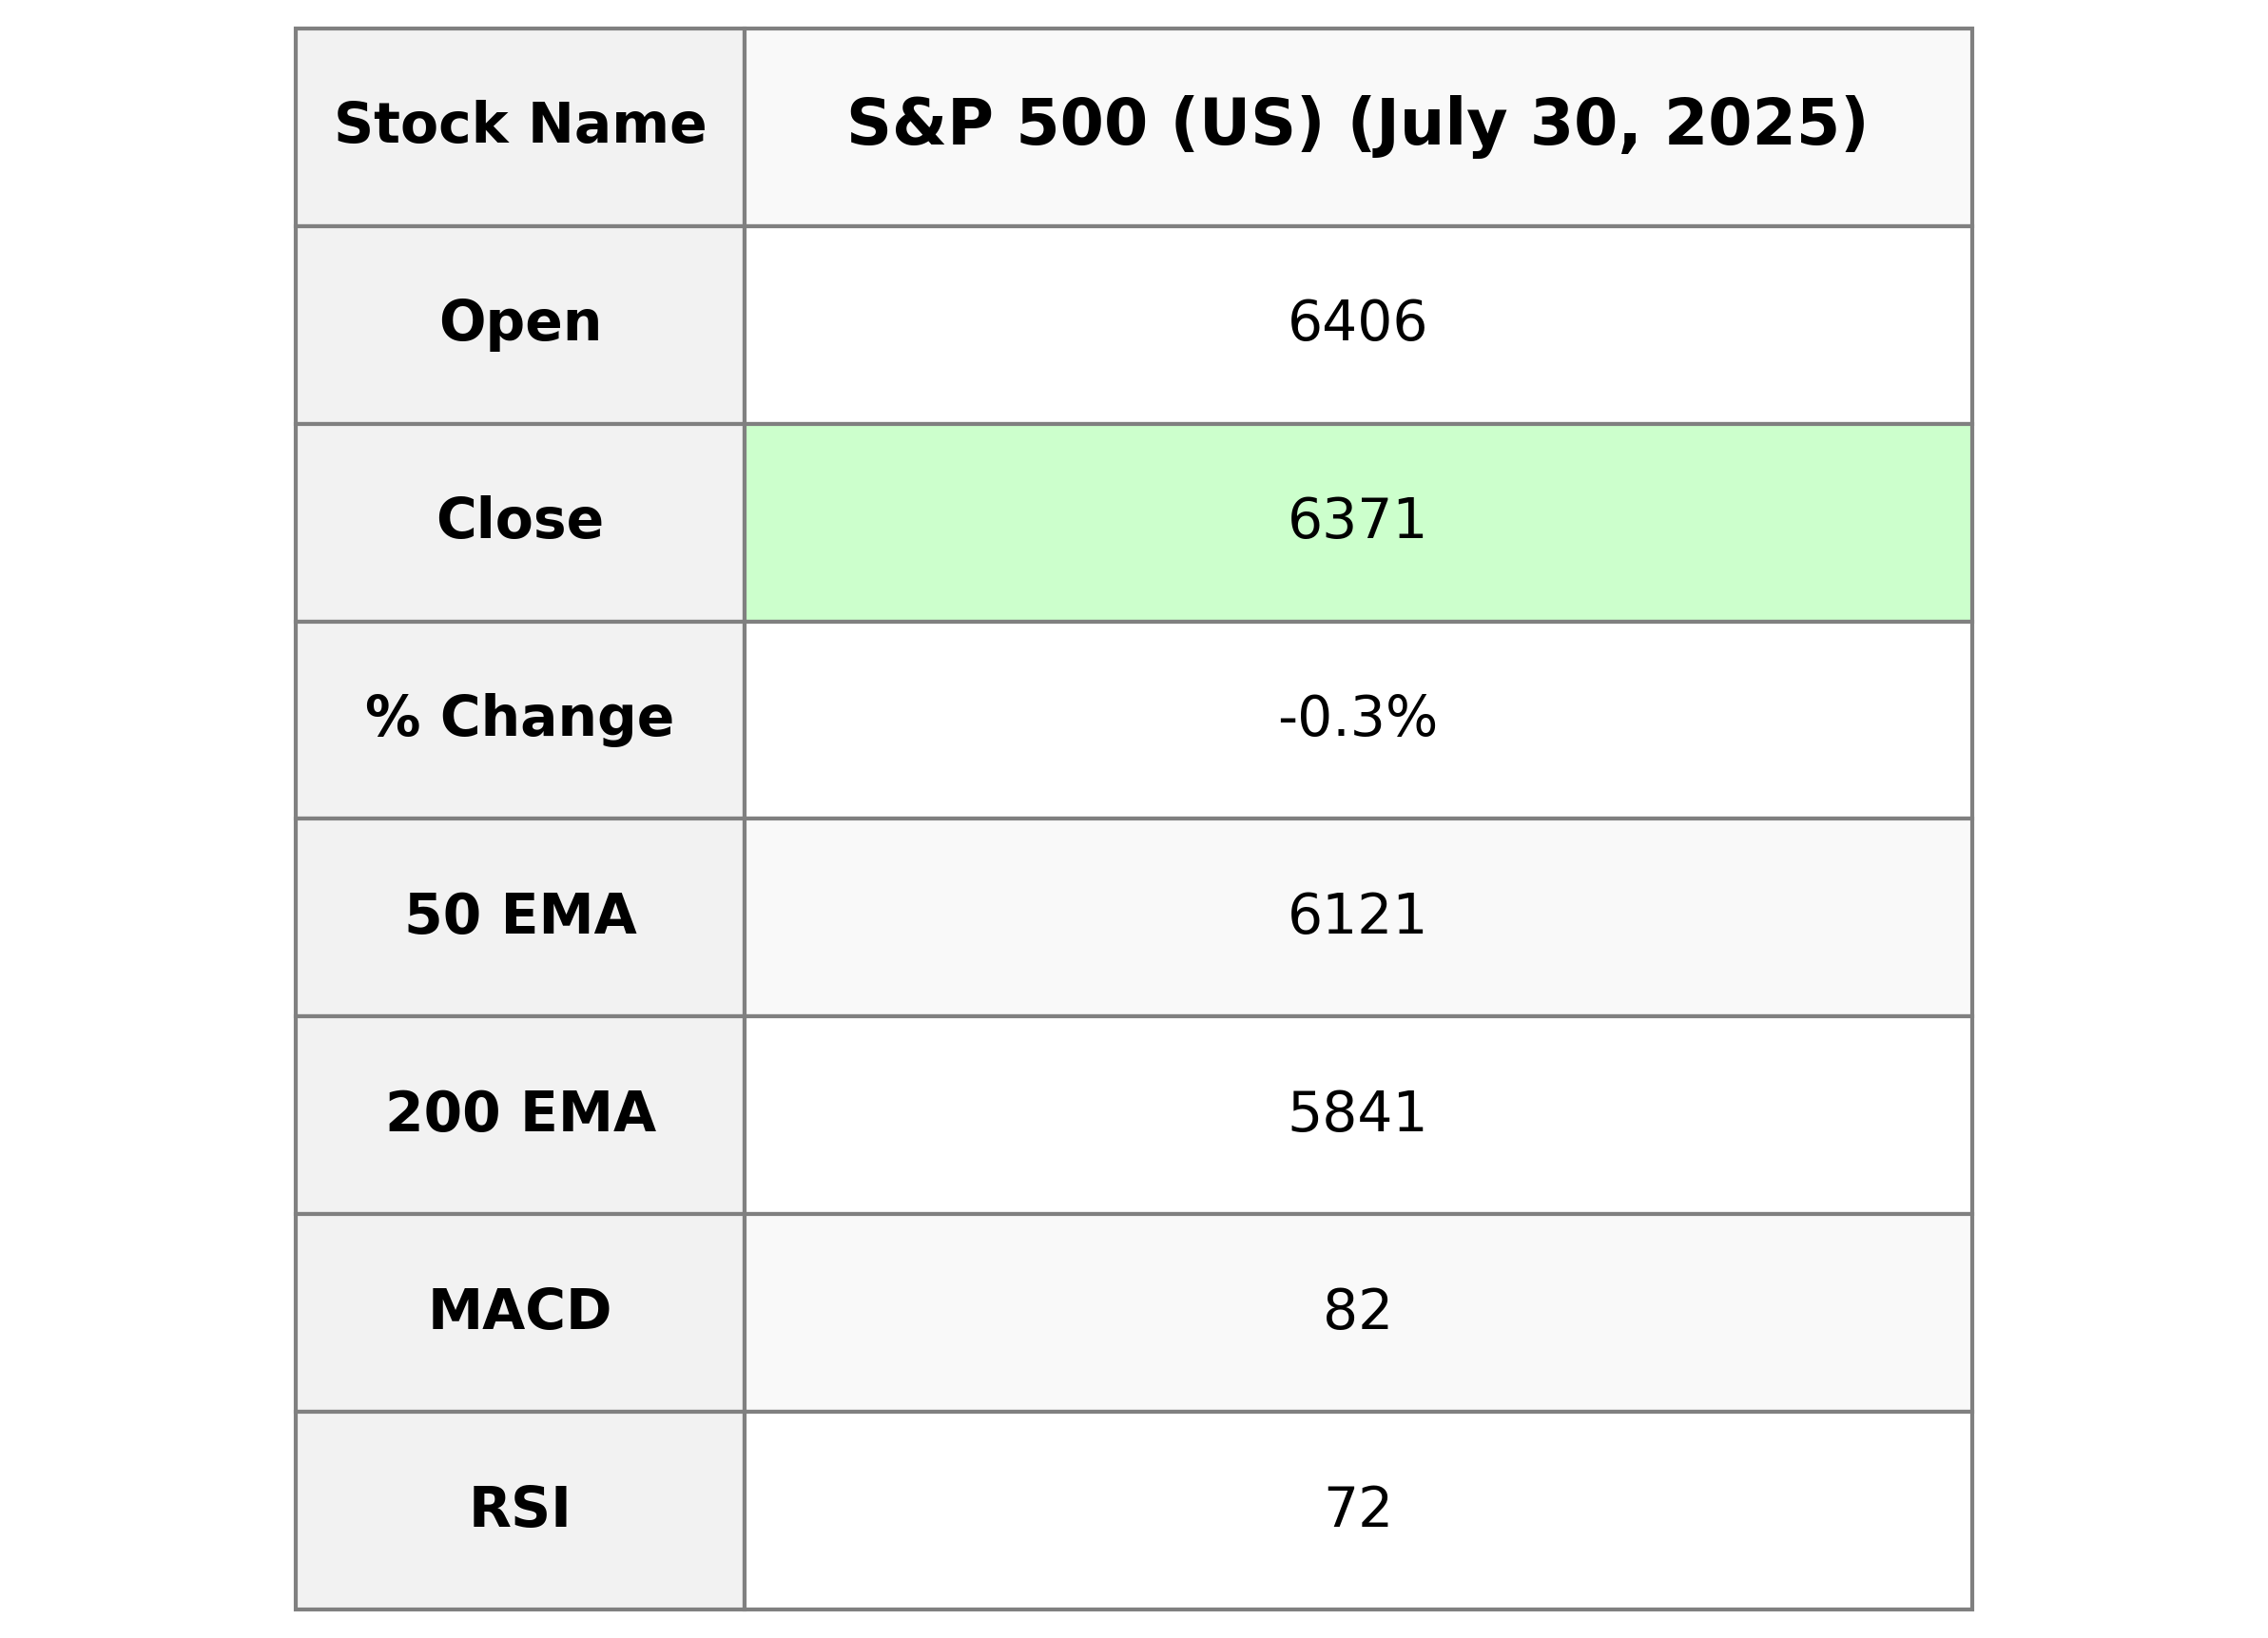
S&P 500 (US) Performance Description: The S&P 500 index opened at 6405.62 and closed lower at 6370.86, reflecting a decrease of approximately -0.30% with a points change of -18.91. Despite closing lower, the index's RSI stood at a high 71.83, indicating overbought conditions, while the MACD was slightly below the signal line, suggesting potential bearish momentum.
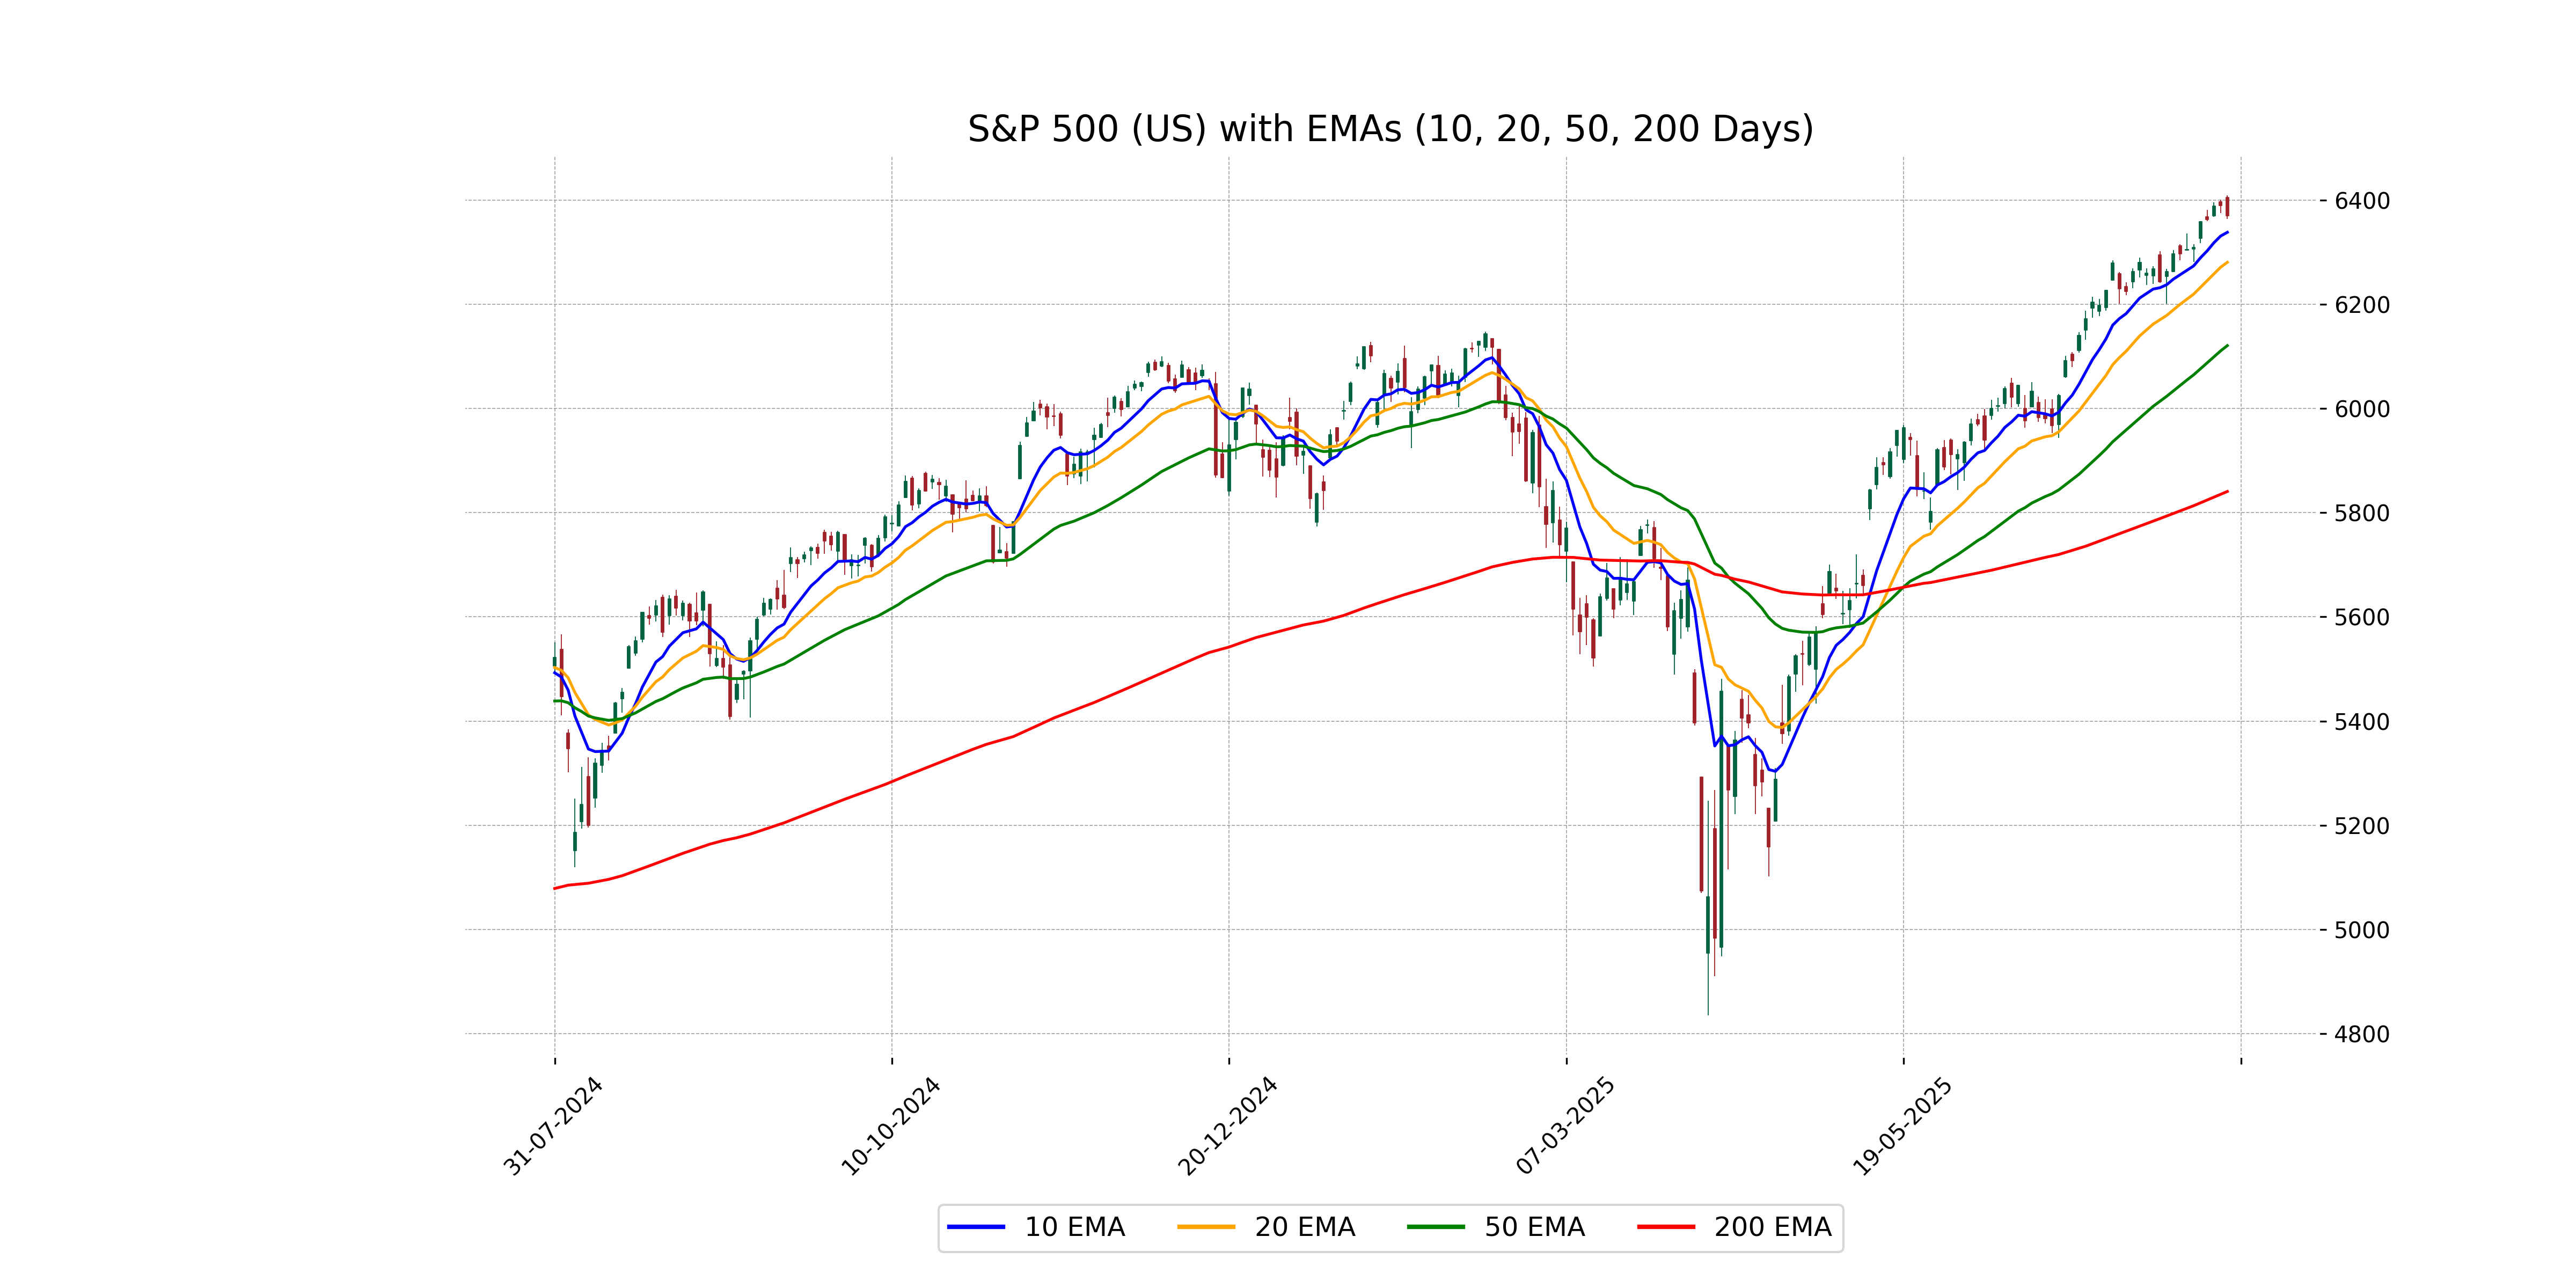
Relationship with Key Moving Averages
The S&P 500 is trading above its 50-day EMA of 6121.09 and 200-day EMA of 5840.89, indicating a strong upward trend. However, the price is slightly above the 10-day EMA of 6338.64 and 20-day EMA of 6281.06, suggesting a potential short-term consolidation or pullback.
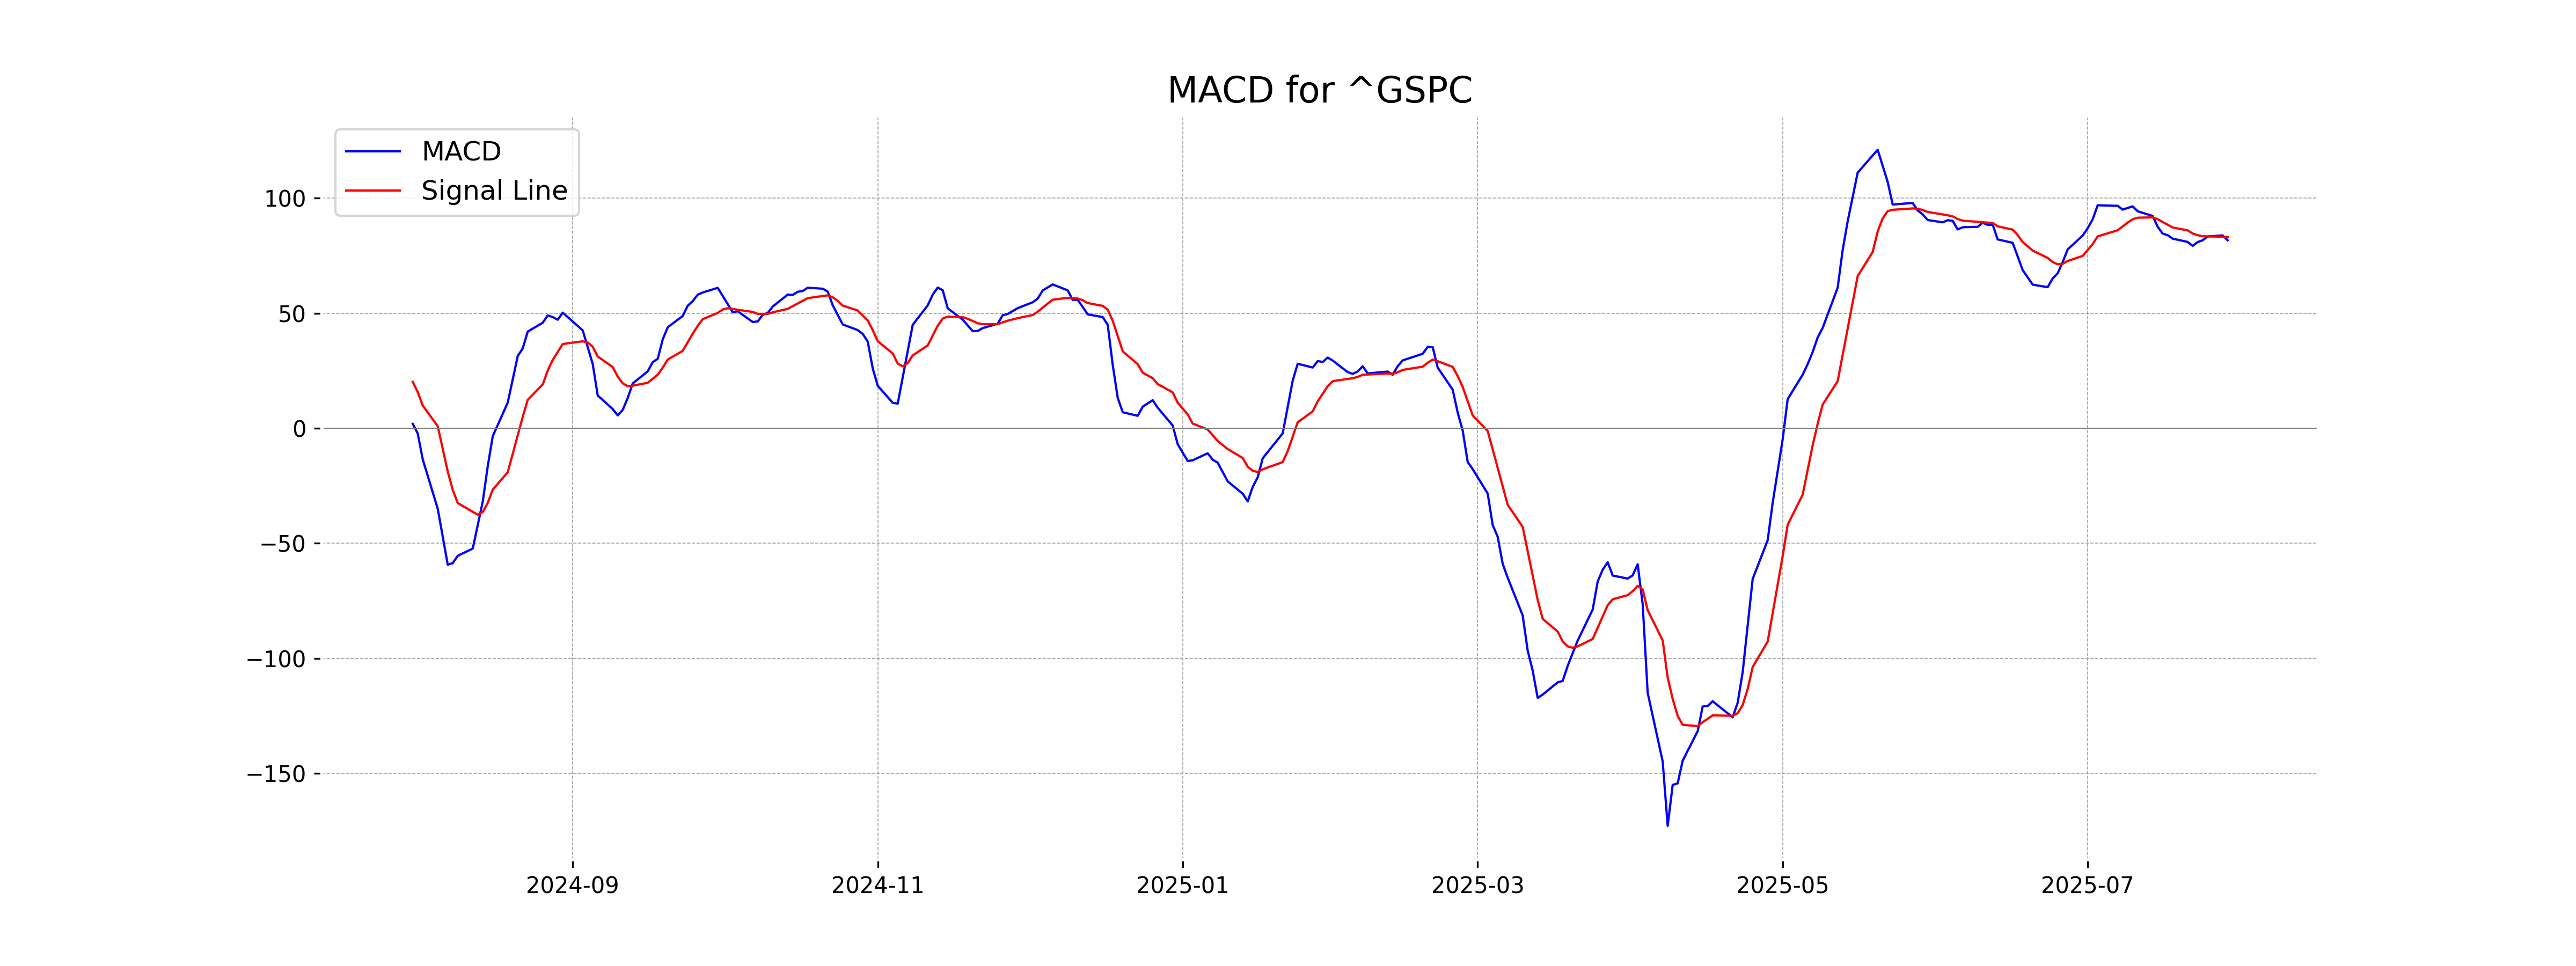
Moving Averages Trend (MACD)
The MACD for S&P 500 (US) is at 81.73, with a MACD Signal of 83.18. This suggests a bearish trend since the MACD is below the signal line, indicating potential downward momentum.
RSI Analysis
S&P 500 (US) RSI Analysis: The RSI for S&P 500 is at 71.83, indicating that the index is in the overbought territory. This suggests potential for a price pullback or correction, as it has surpassed typical overbought levels.
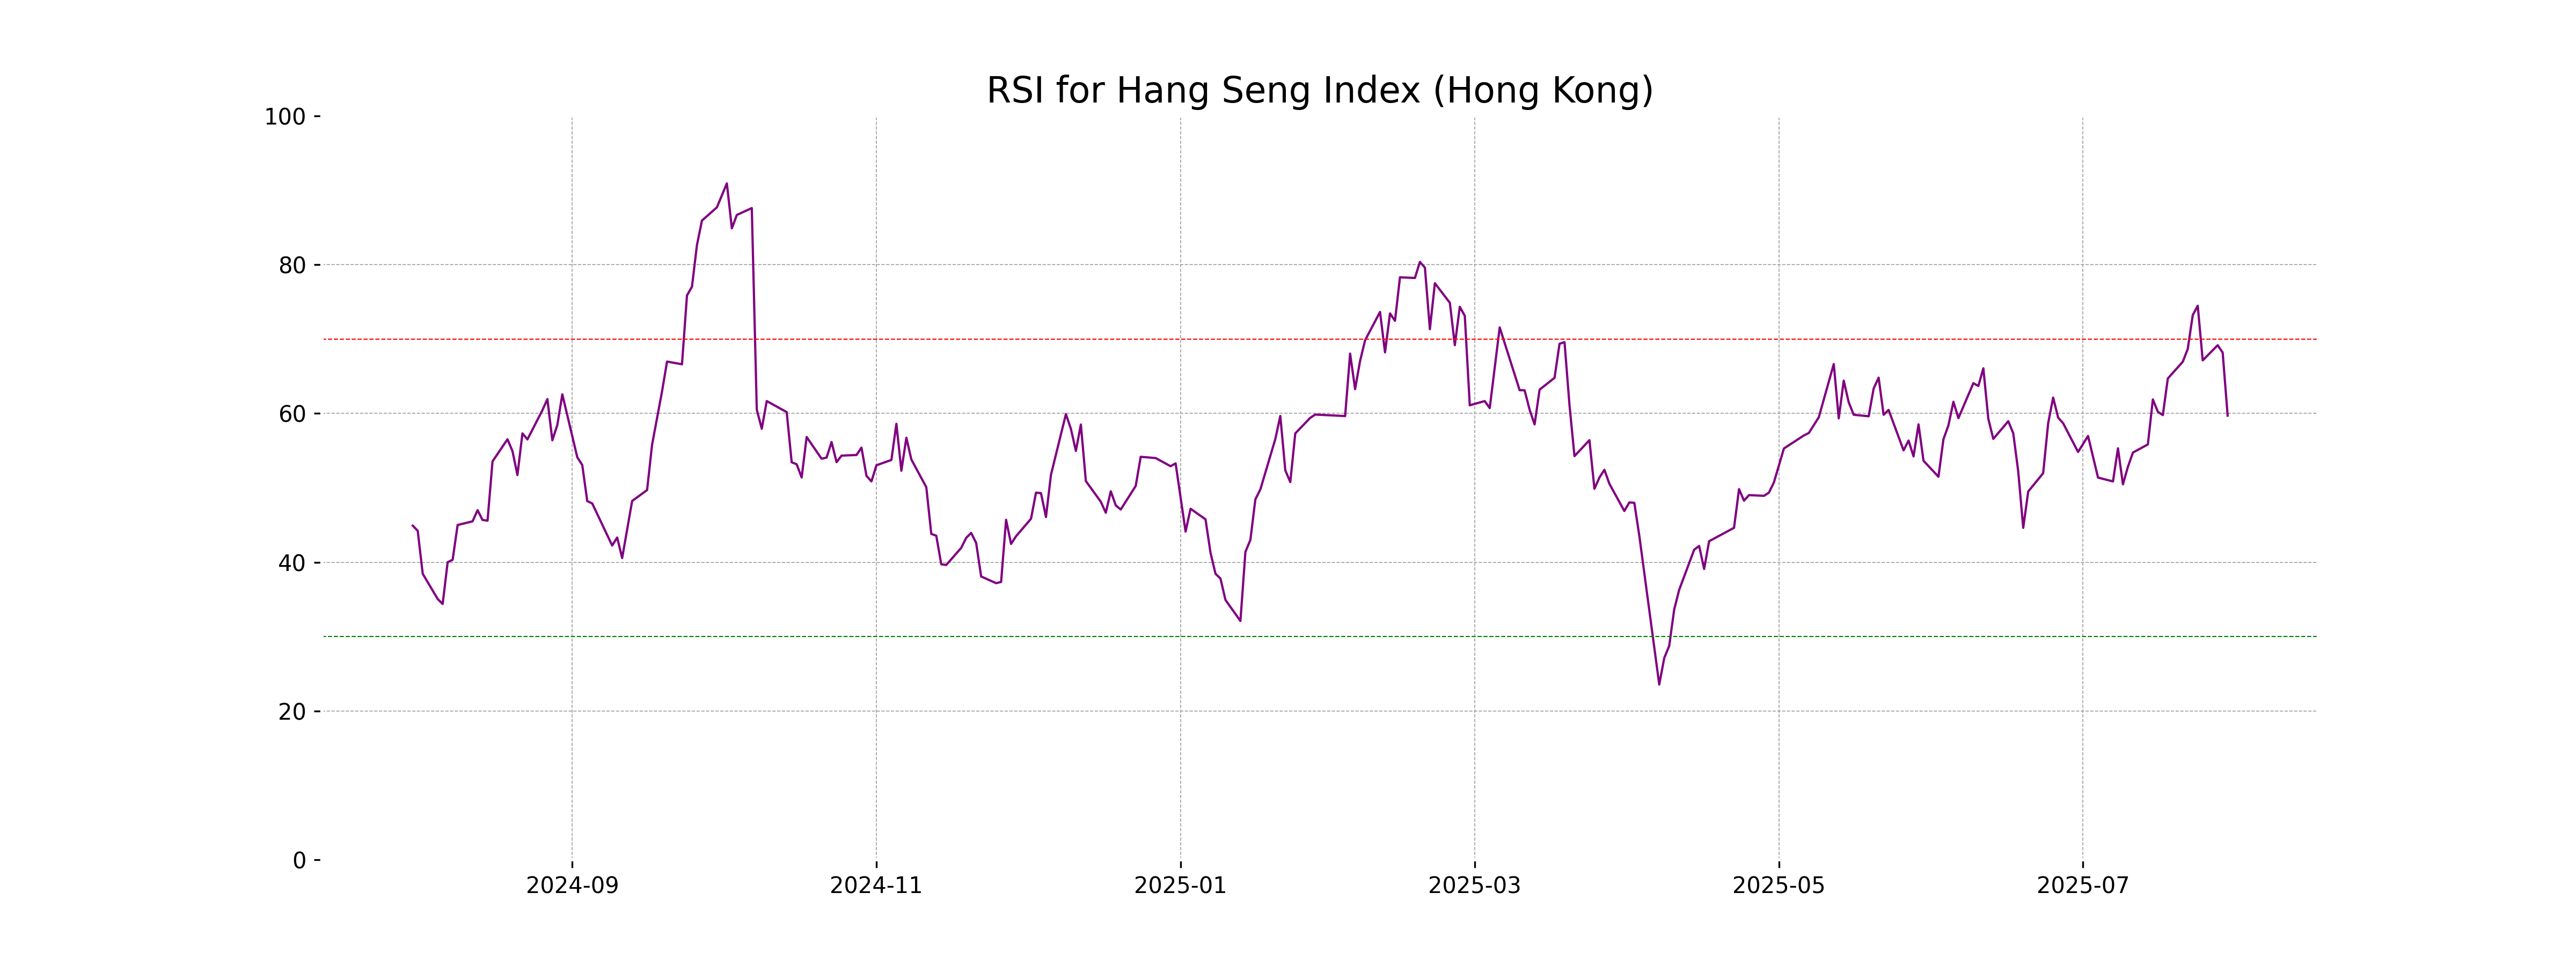
Analysis for Hang Seng Index (Hong Kong) - July 30, 2025
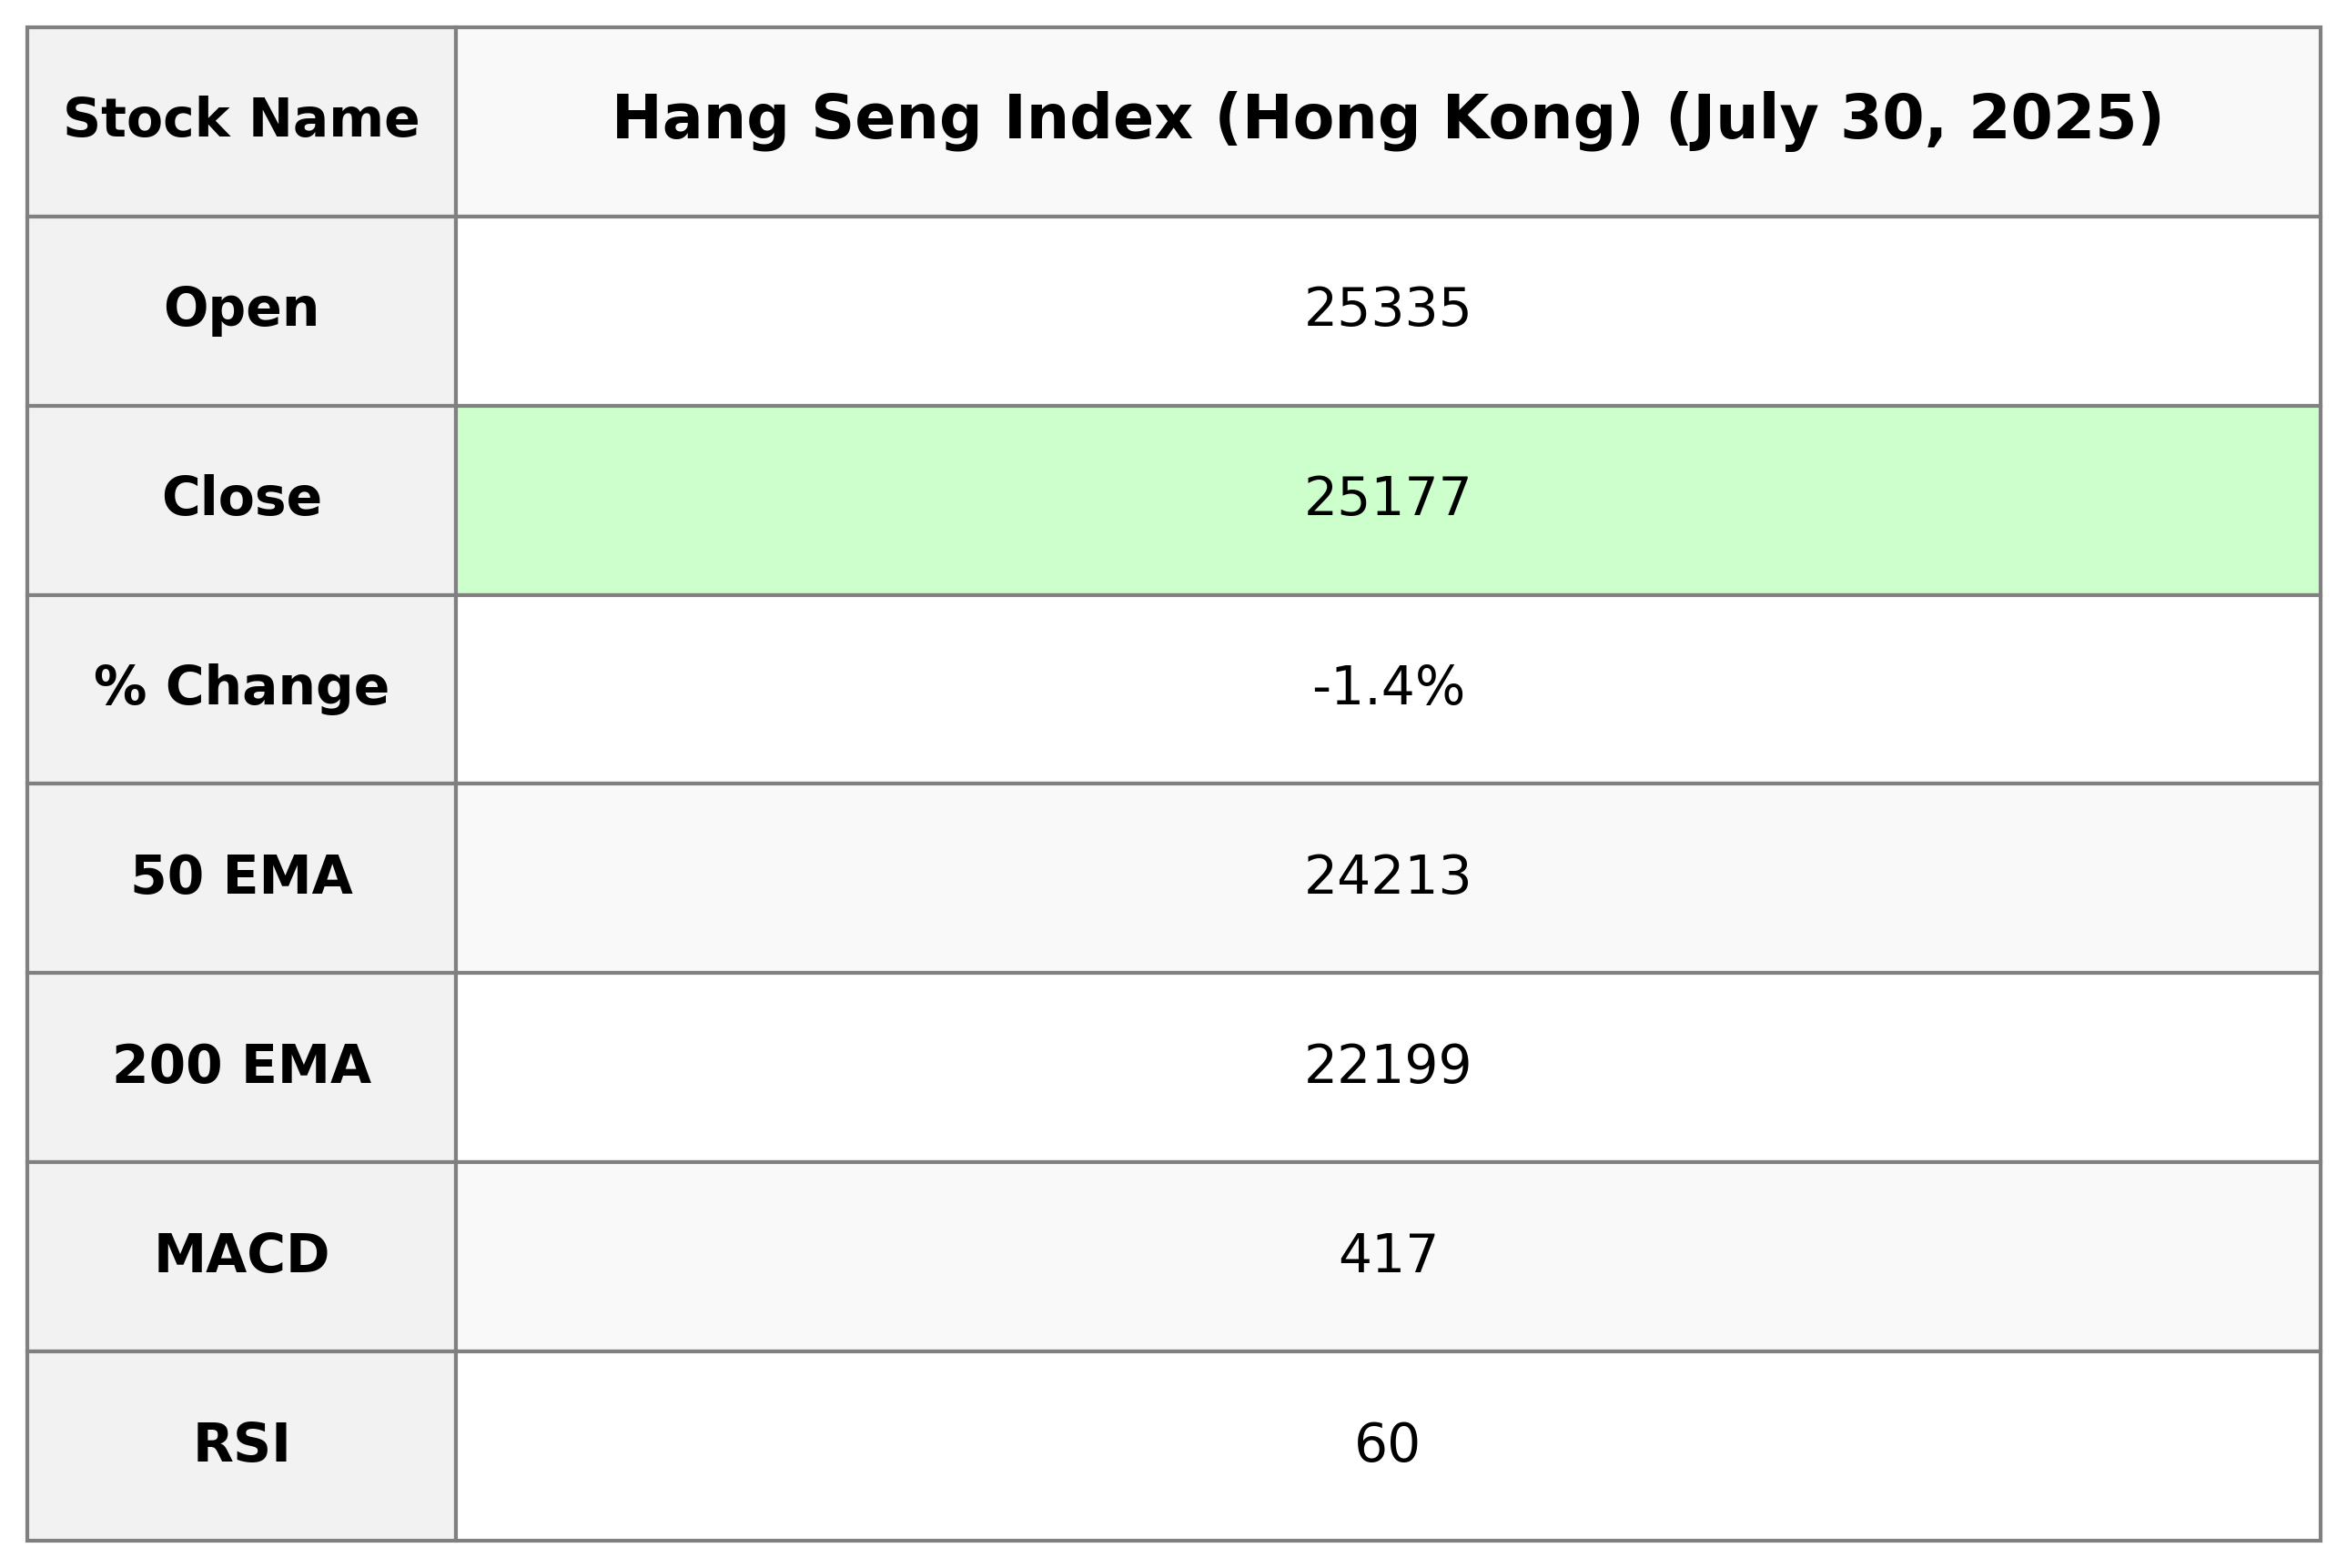
The Hang Seng Index opened at 25,335.21, reached a high of 25,499.57, and closed at 25,176.93, reflecting a decrease of 1.36% from the previous close, with a points change of -347.52. Technical indicators show it is above its 50-day, 20-day, and 10-day EMAs but traded lower than its previous close with an RSI of 59.71, suggesting steady momentum. The MACD value of 417.29 is greater than the signal line at 365.54, indicating a potential bullish trend.
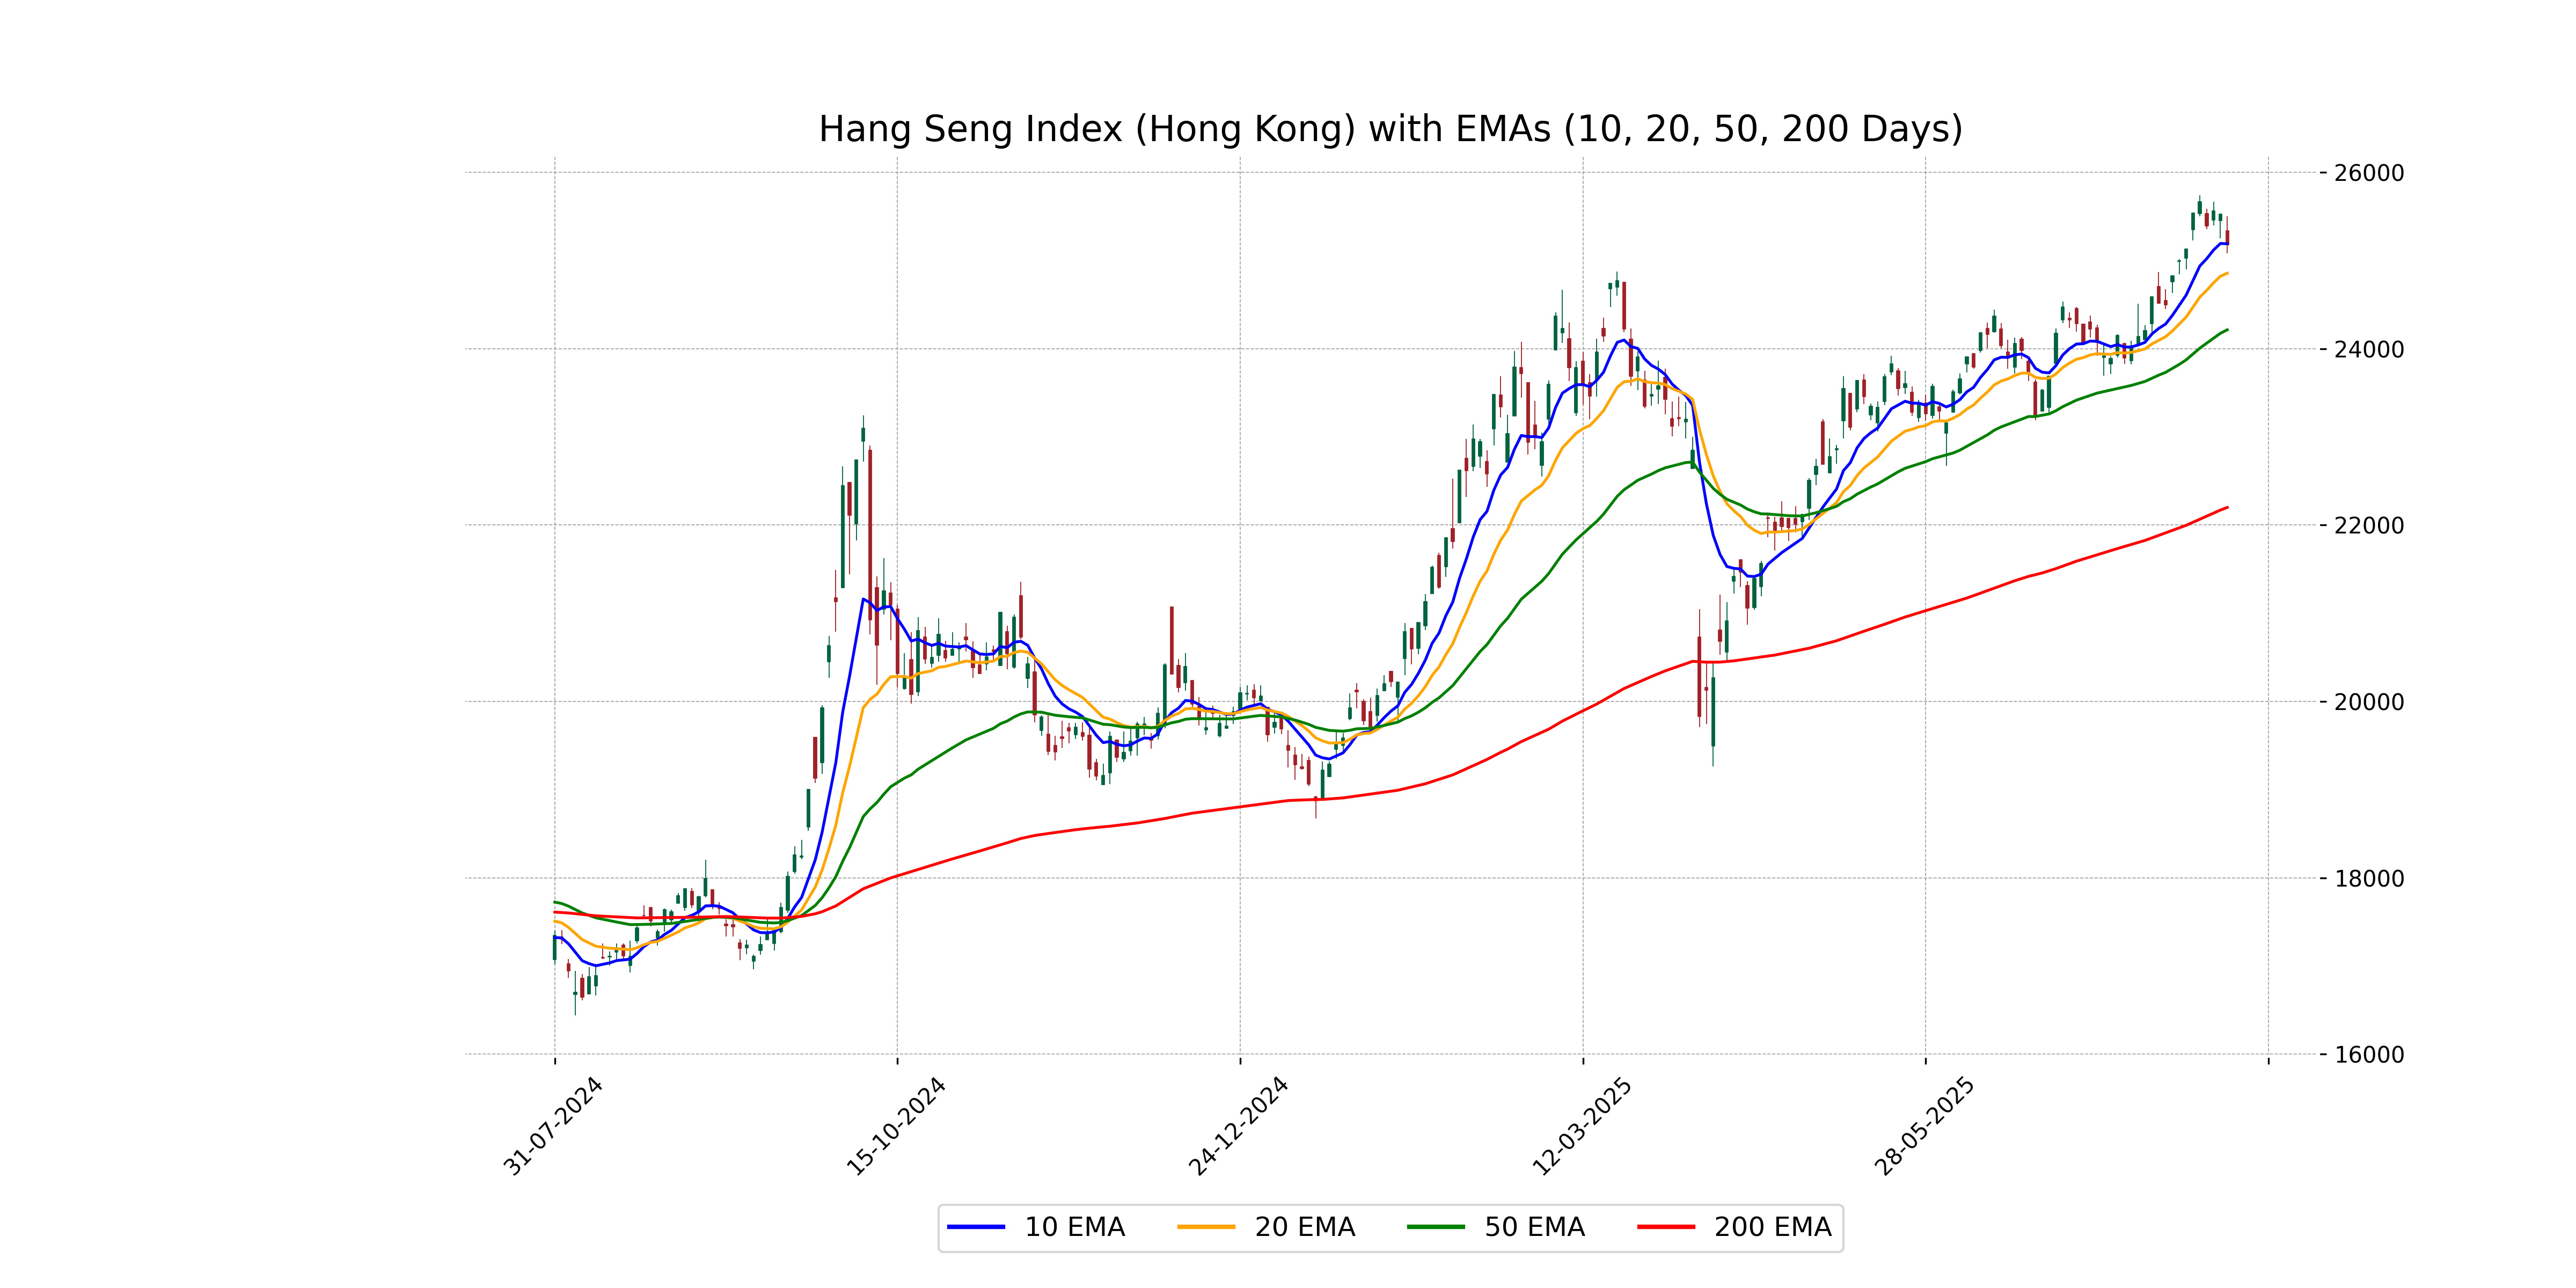
Relationship with Key Moving Averages
The Hang Seng Index closed at 25176.93, which is above its 50 EMA (24213.32) and significantly above its 200 EMA (22199.06), indicating a strong upward momentum. However, it is slightly below its 10 EMA (25189.40), suggesting some short-term consolidation.
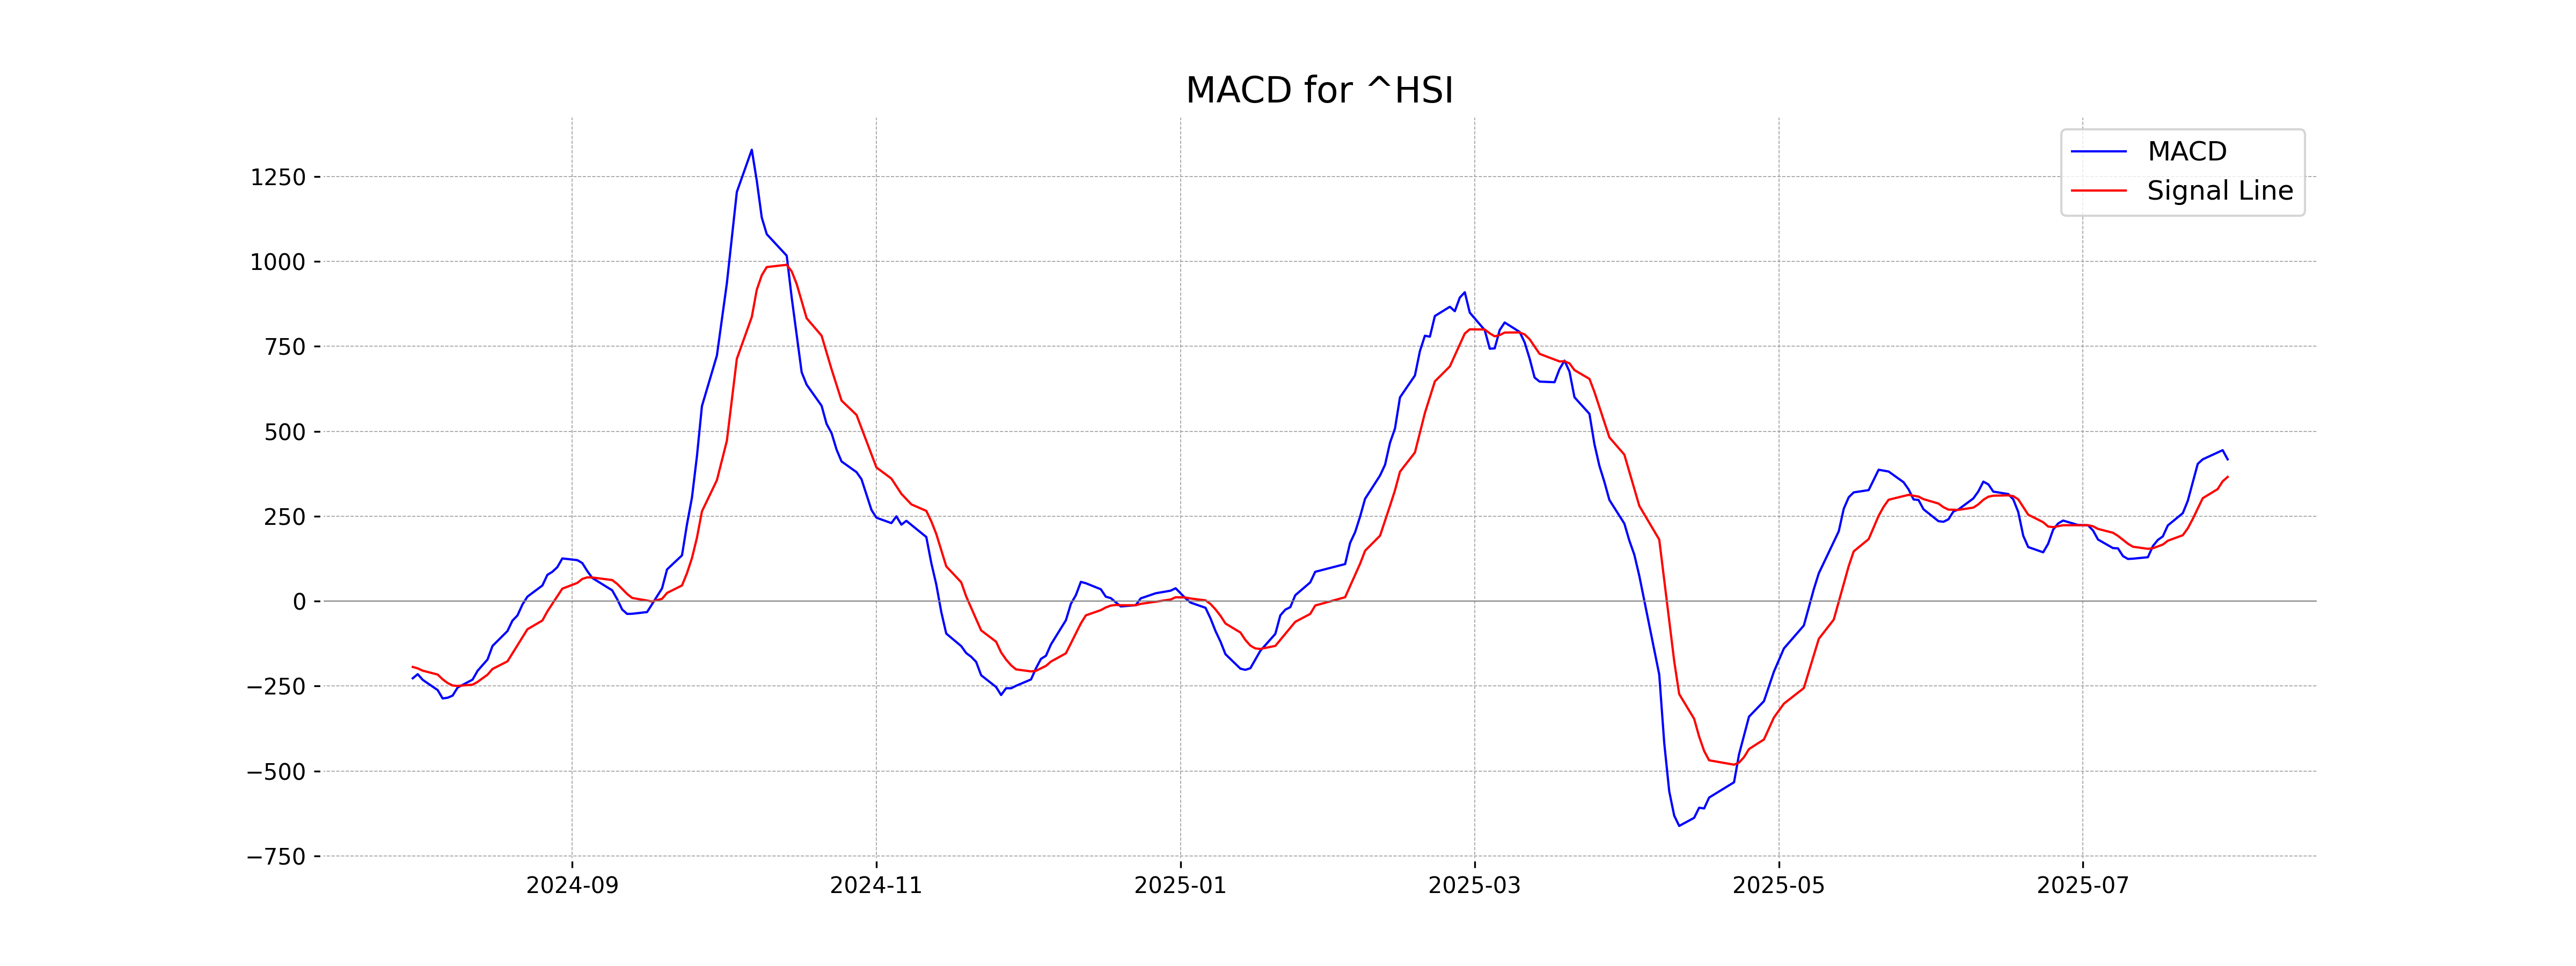
Moving Averages Trend (MACD)
The MACD for Hang Seng Index indicates a bullish trend as the MACD value (417.29) is above the MACD Signal (365.54). This suggests potential upward momentum in the market despite the recent decline in price.
RSI Analysis
RSI Analysis for Hang Seng Index (Hong Kong): The RSI value of 59.71 suggests that Hang Seng Index is in a neutral to slightly overbought condition, indicating potential for continued bullish momentum unless other factors change. RSI values typically range from 30 to 70, with levels above 70 indicating overbought conditions and below 30 indicating oversold conditions.
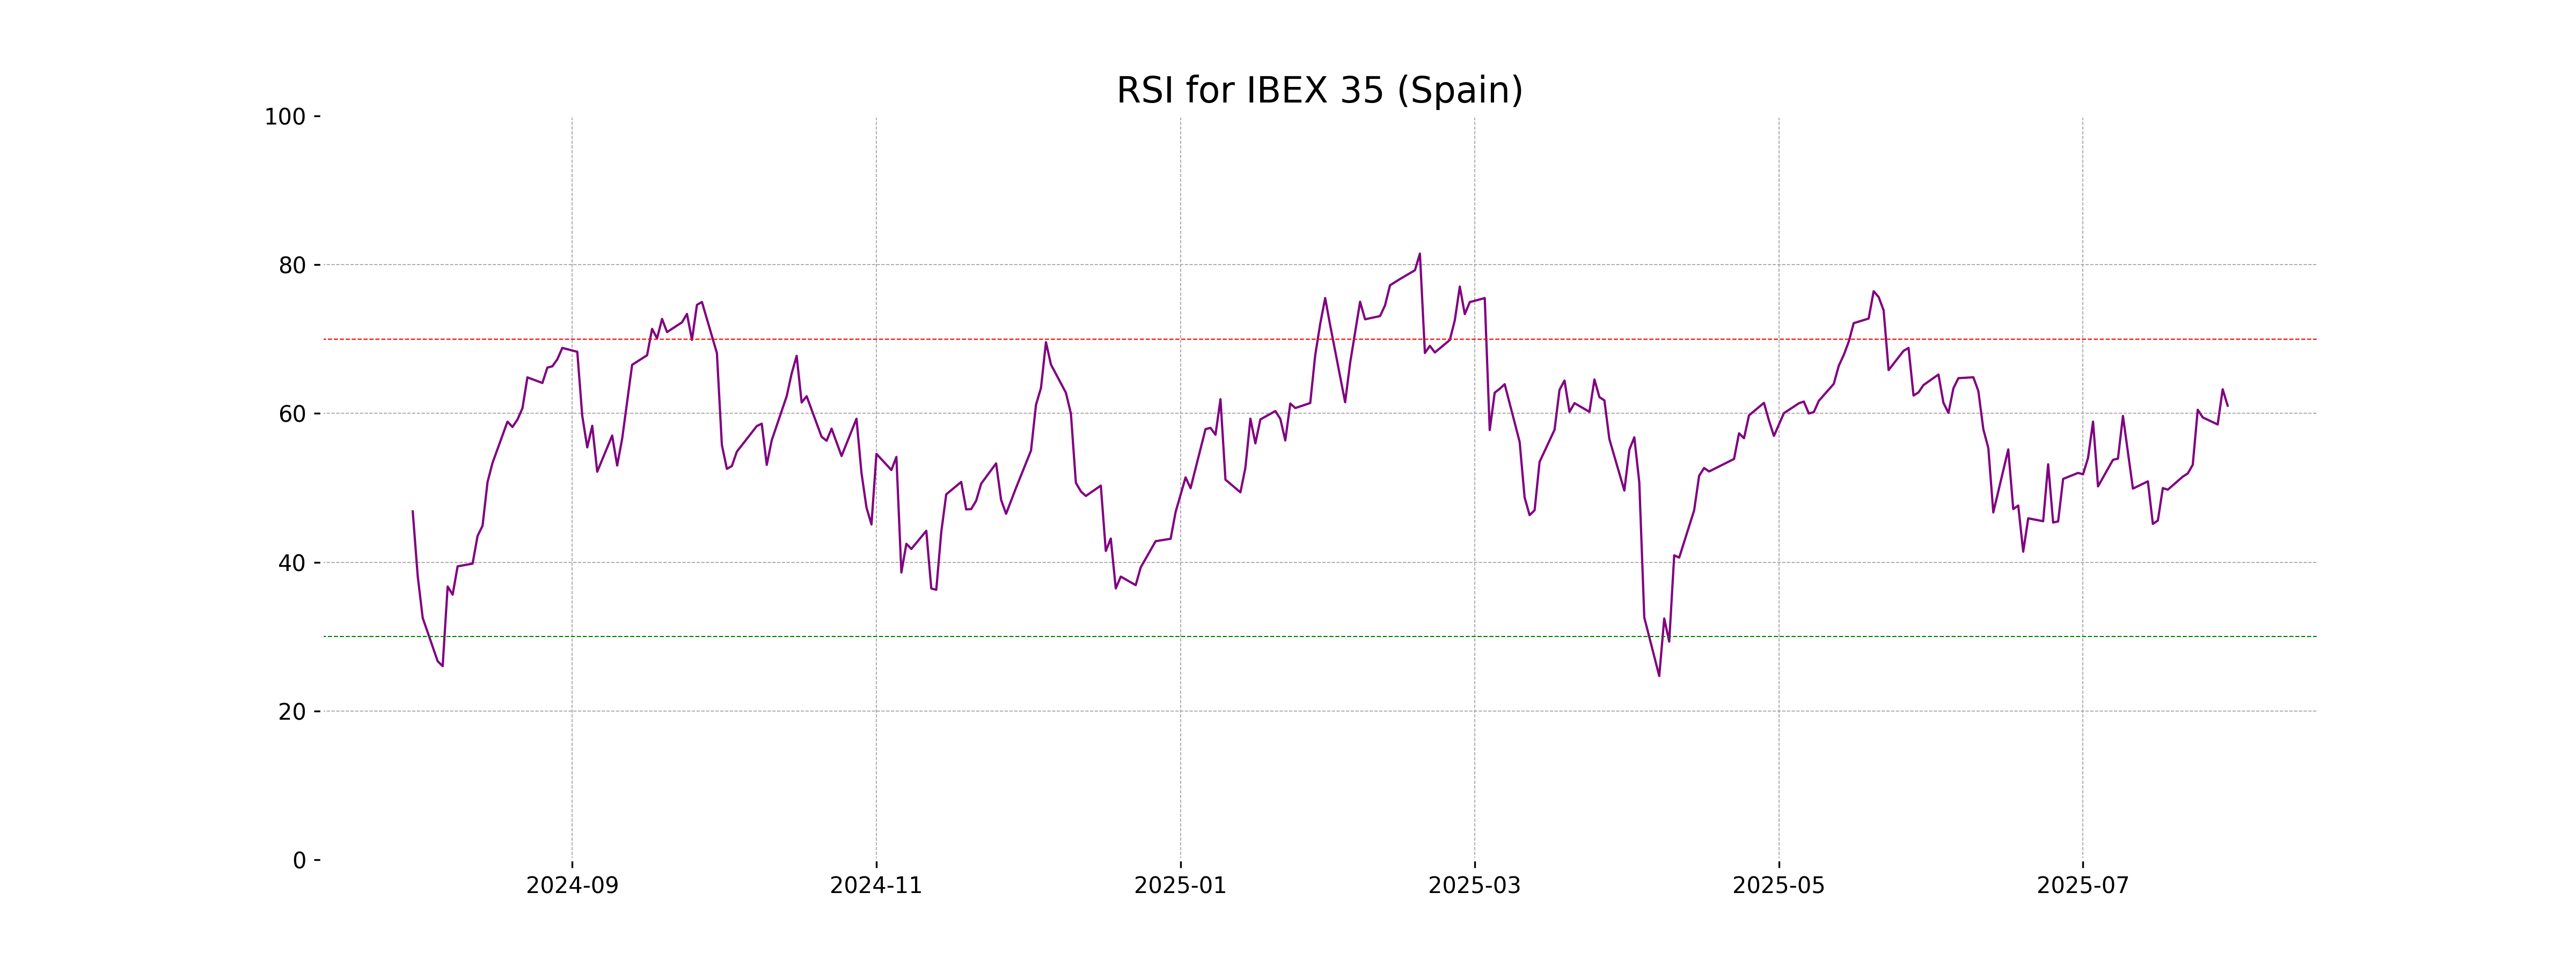
Analysis for IBEX 35 (Spain) - July 30, 2025
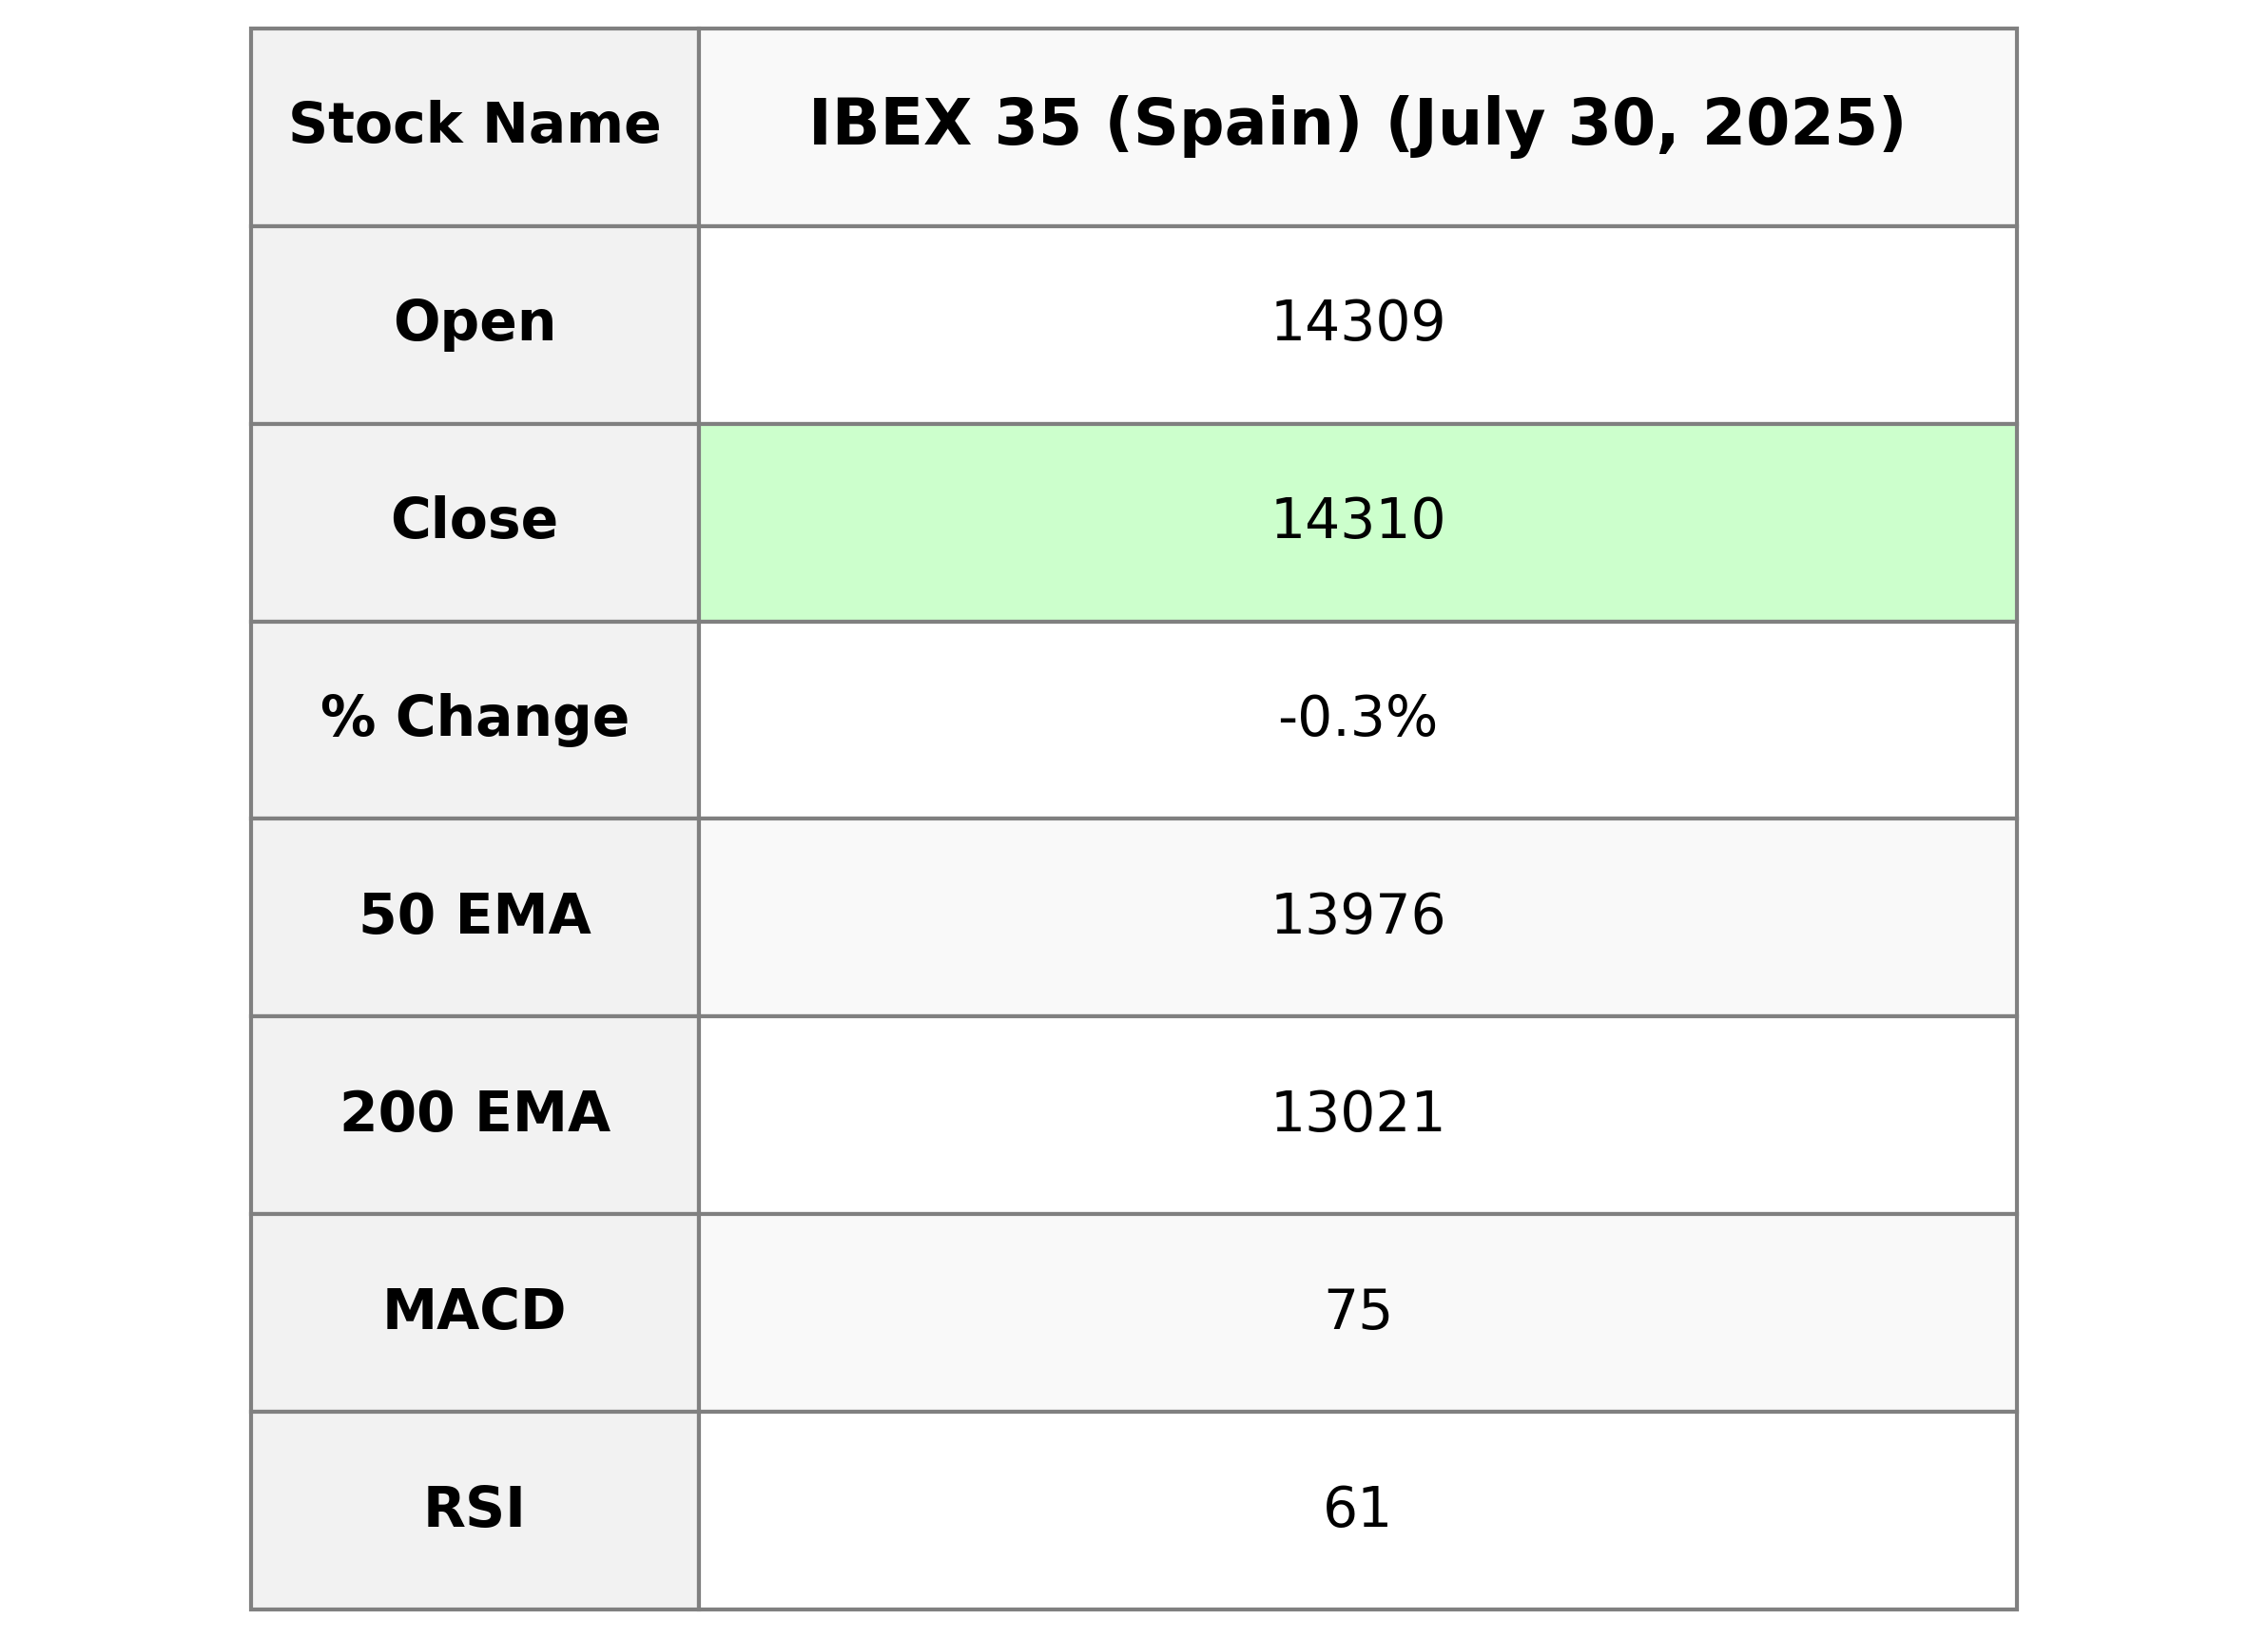
IBEX 35 (Spain) Performance: The IBEX 35 opened at 14,308.60 and closed slightly lower at 14,310.30, marking a decrease of 0.26% with a points change of -37.40. The index fluctuated between a high of 14,312.10 and a low of 14,197.90. Despite the slight dip, the RSI indicates a generally strong position at 61.05, and the current MACD of 74.52 suggests bullish momentum compared to the signal line at 43.67.
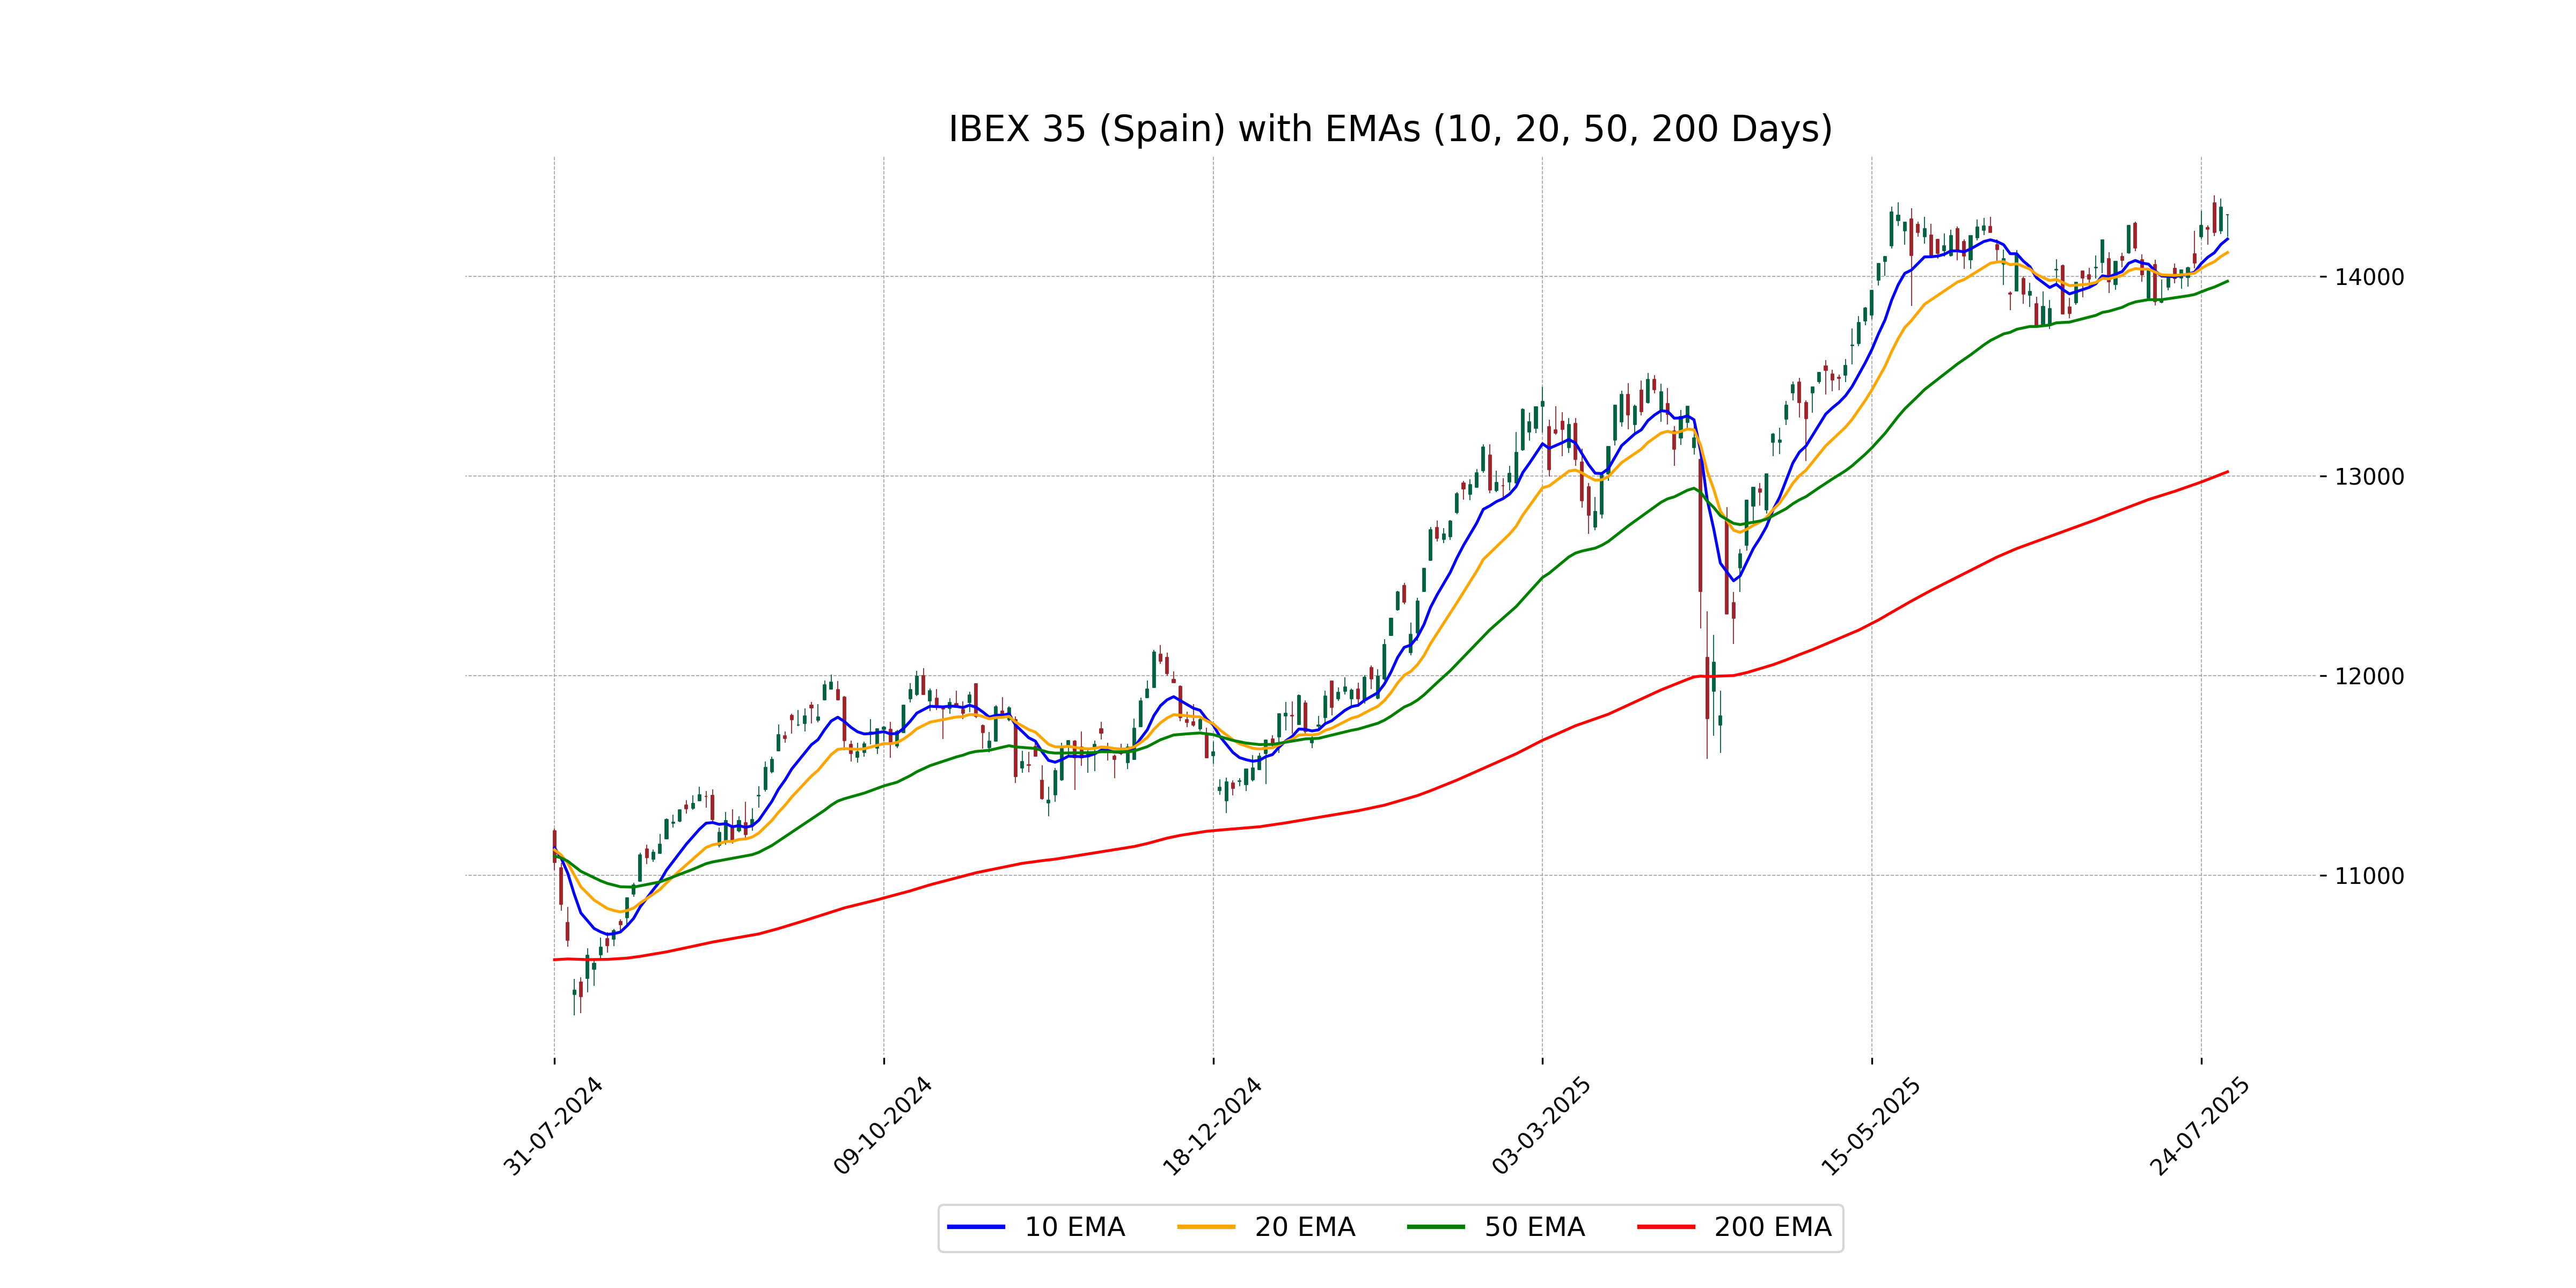
Relationship with Key Moving Averages
The IBEX 35 closed at 14310.30, which is above its 50-day EMA of 13975.68 and significantly above its 200-day EMA of 13020.89, indicating a potentially strong upward trend. It is also above both the 10-day EMA of 14187.31 and the 20-day EMA of 14119.54, reinforcing short-term bullish momentum.
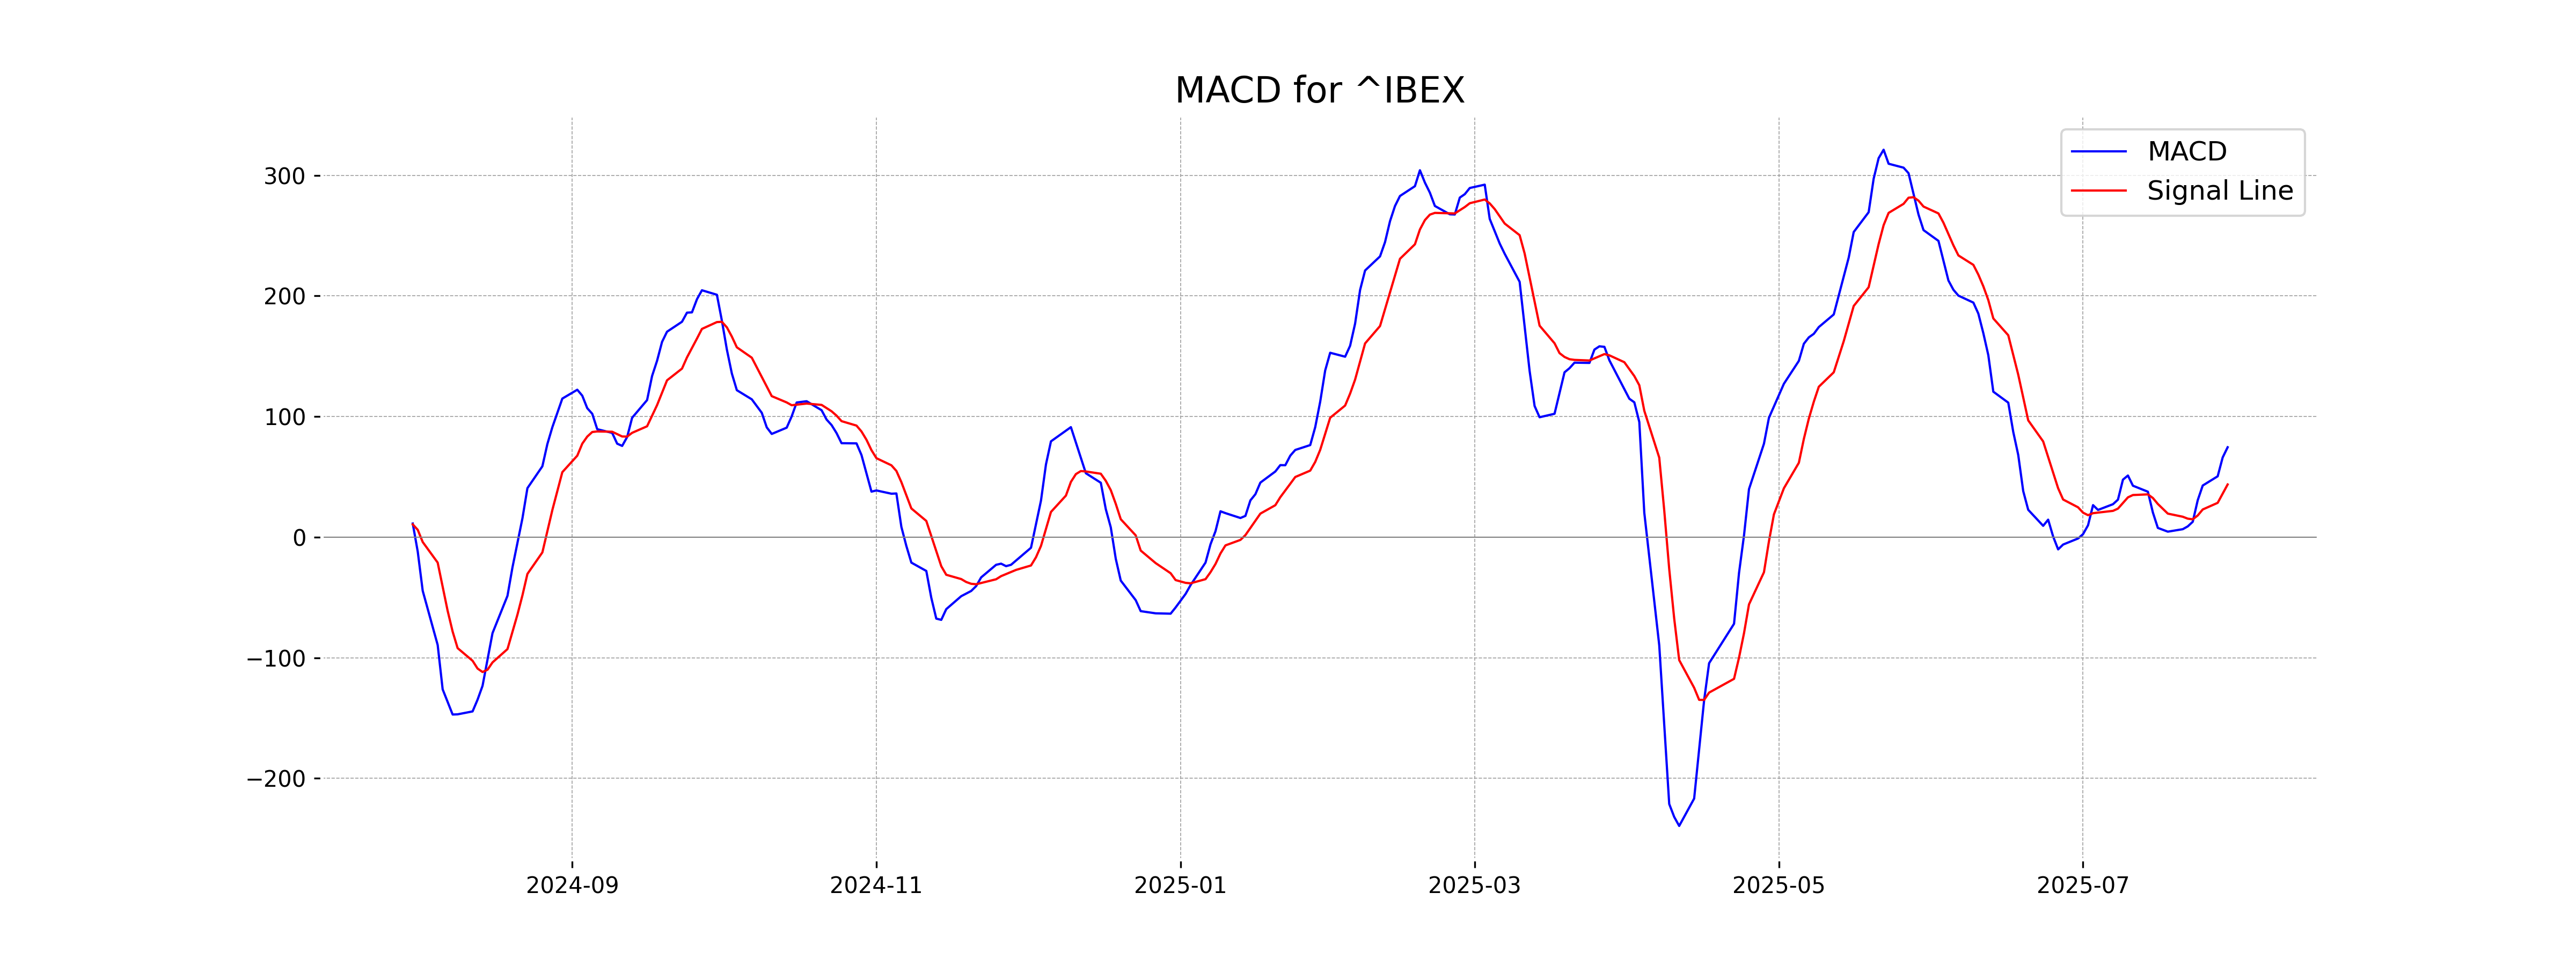
Moving Averages Trend (MACD)
The IBEX 35's MACD of 74.52 is above the MACD Signal of 43.67, indicating a bullish momentum in the market. The positive difference suggests potential upward price movement for the index, but further confirmation from other indicators would be beneficial.
RSI Analysis
The current RSI for the IBEX 35 is approximately 61.05, which suggests that the index is in neutral to slightly overbought territory. Typically, an RSI above 70 indicates overbought conditions, while below 30 indicates oversold. With an RSI of 61.05, the IBEX 35 is not in either extreme condition, signaling relatively balanced momentum at present.
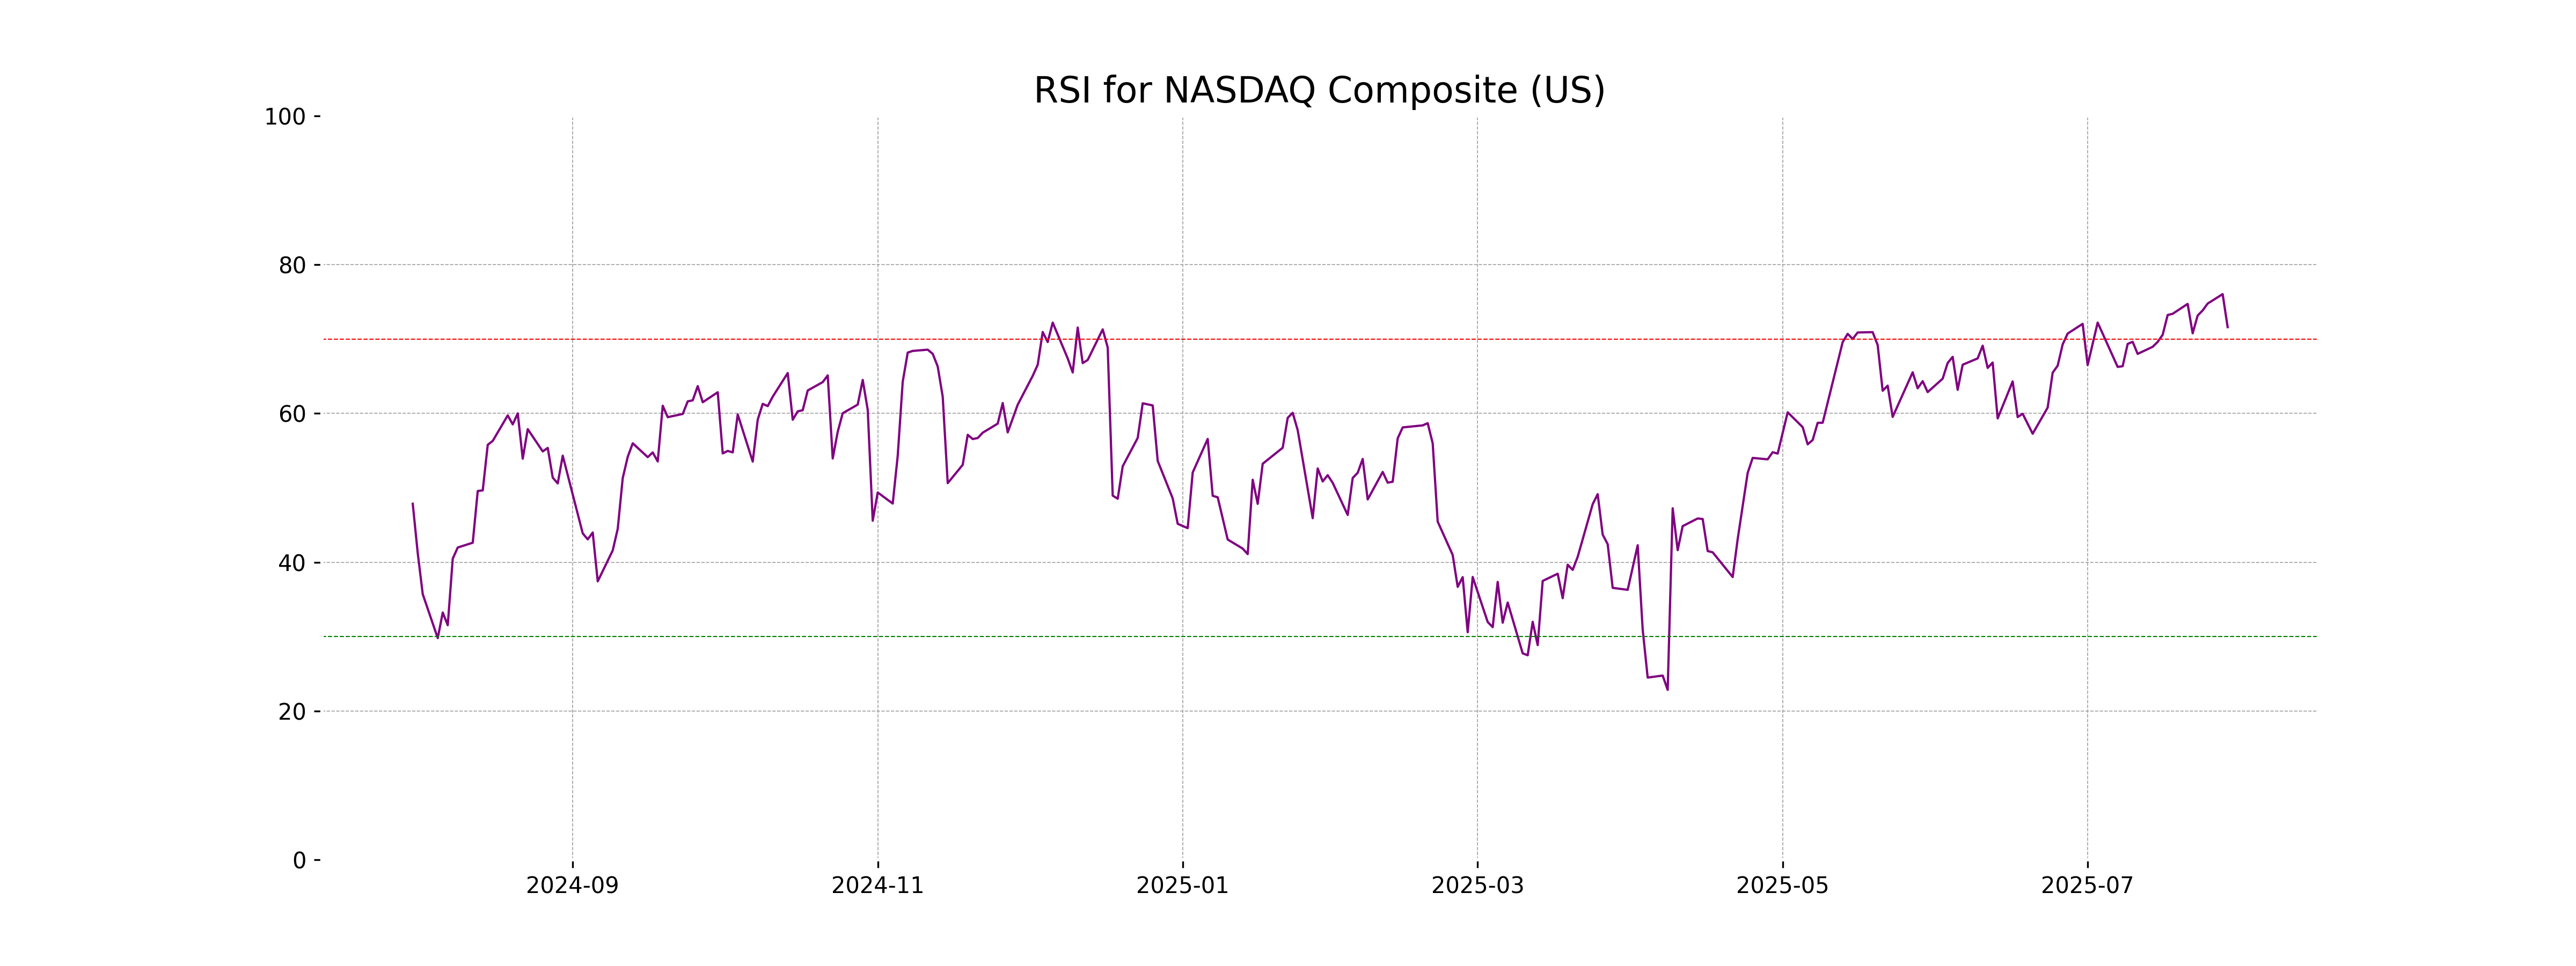
Analysis for NASDAQ Composite (US) - July 30, 2025
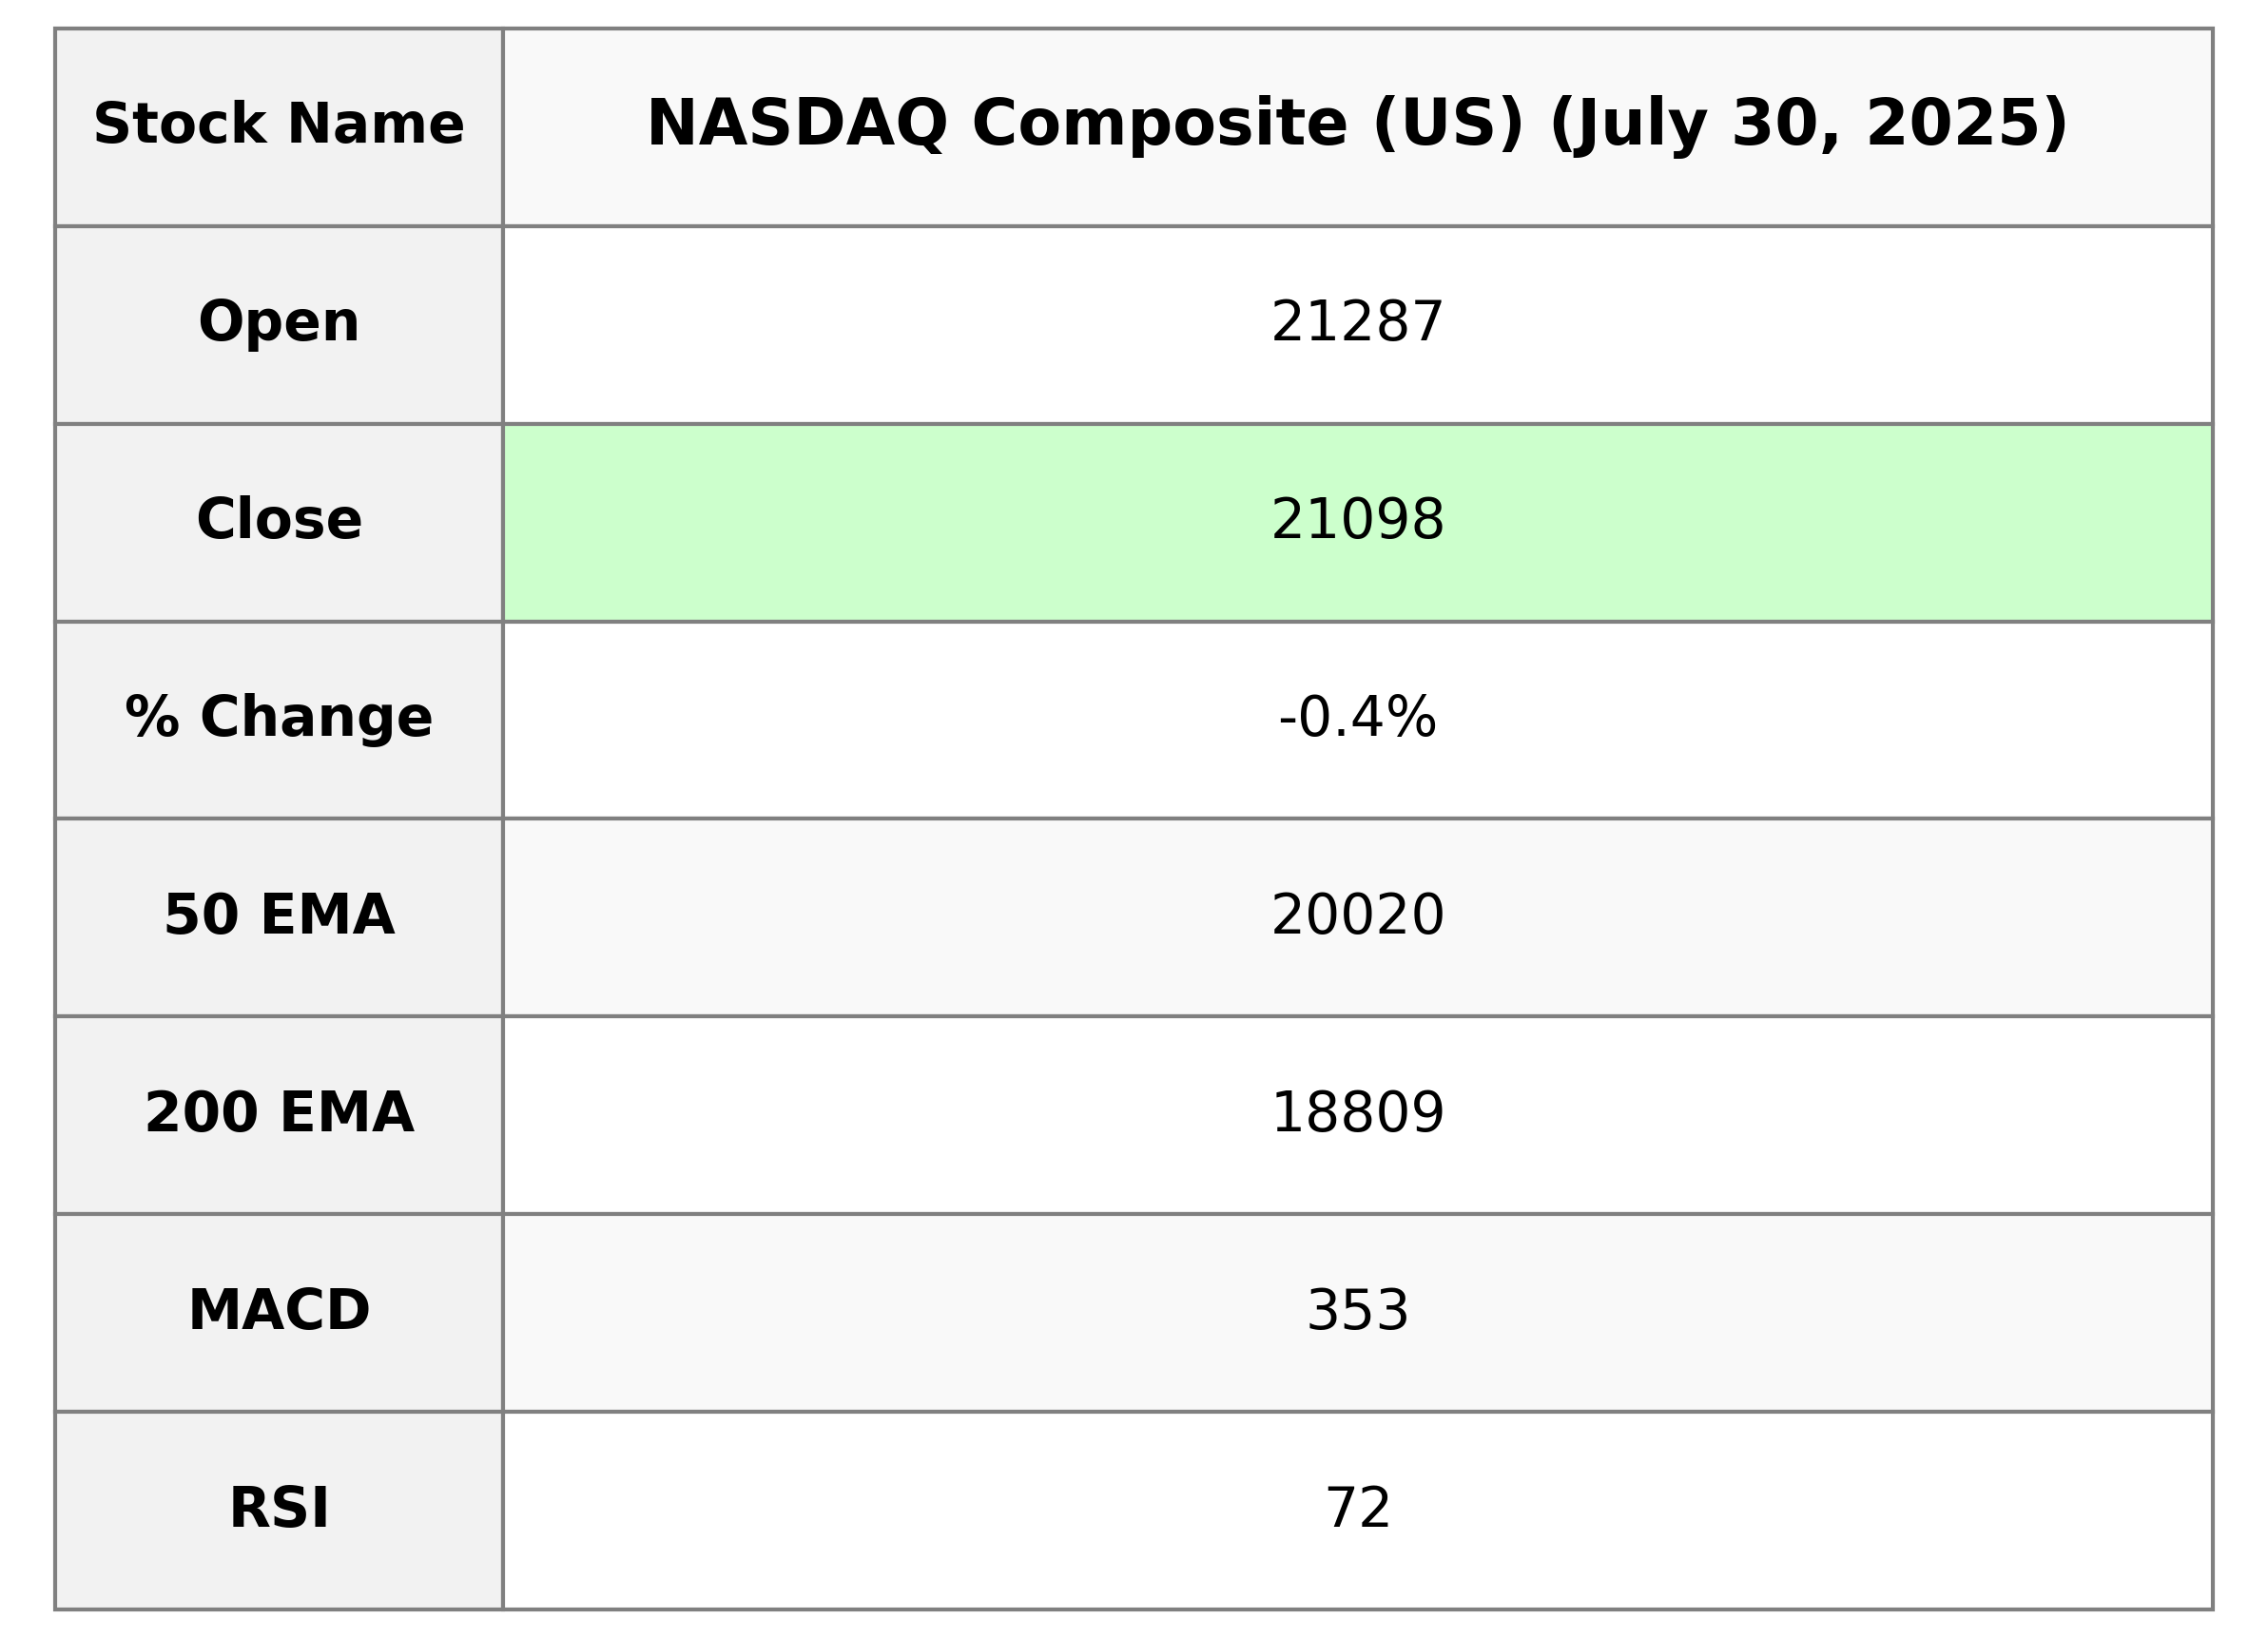
The NASDAQ Composite (US) opened at 21286.72 and closed at 21098.29, reflecting a decrease of 0.38% or 80.29 points from the previous close of 21178.58. The current 50-day EMA is 20019.87, indicating a short-term uptrend compared to the 200-day EMA of 18809.03. Trading volume was significant at 10.04 billion, with an RSI of 71.60, suggesting the index is in an overbought condition.
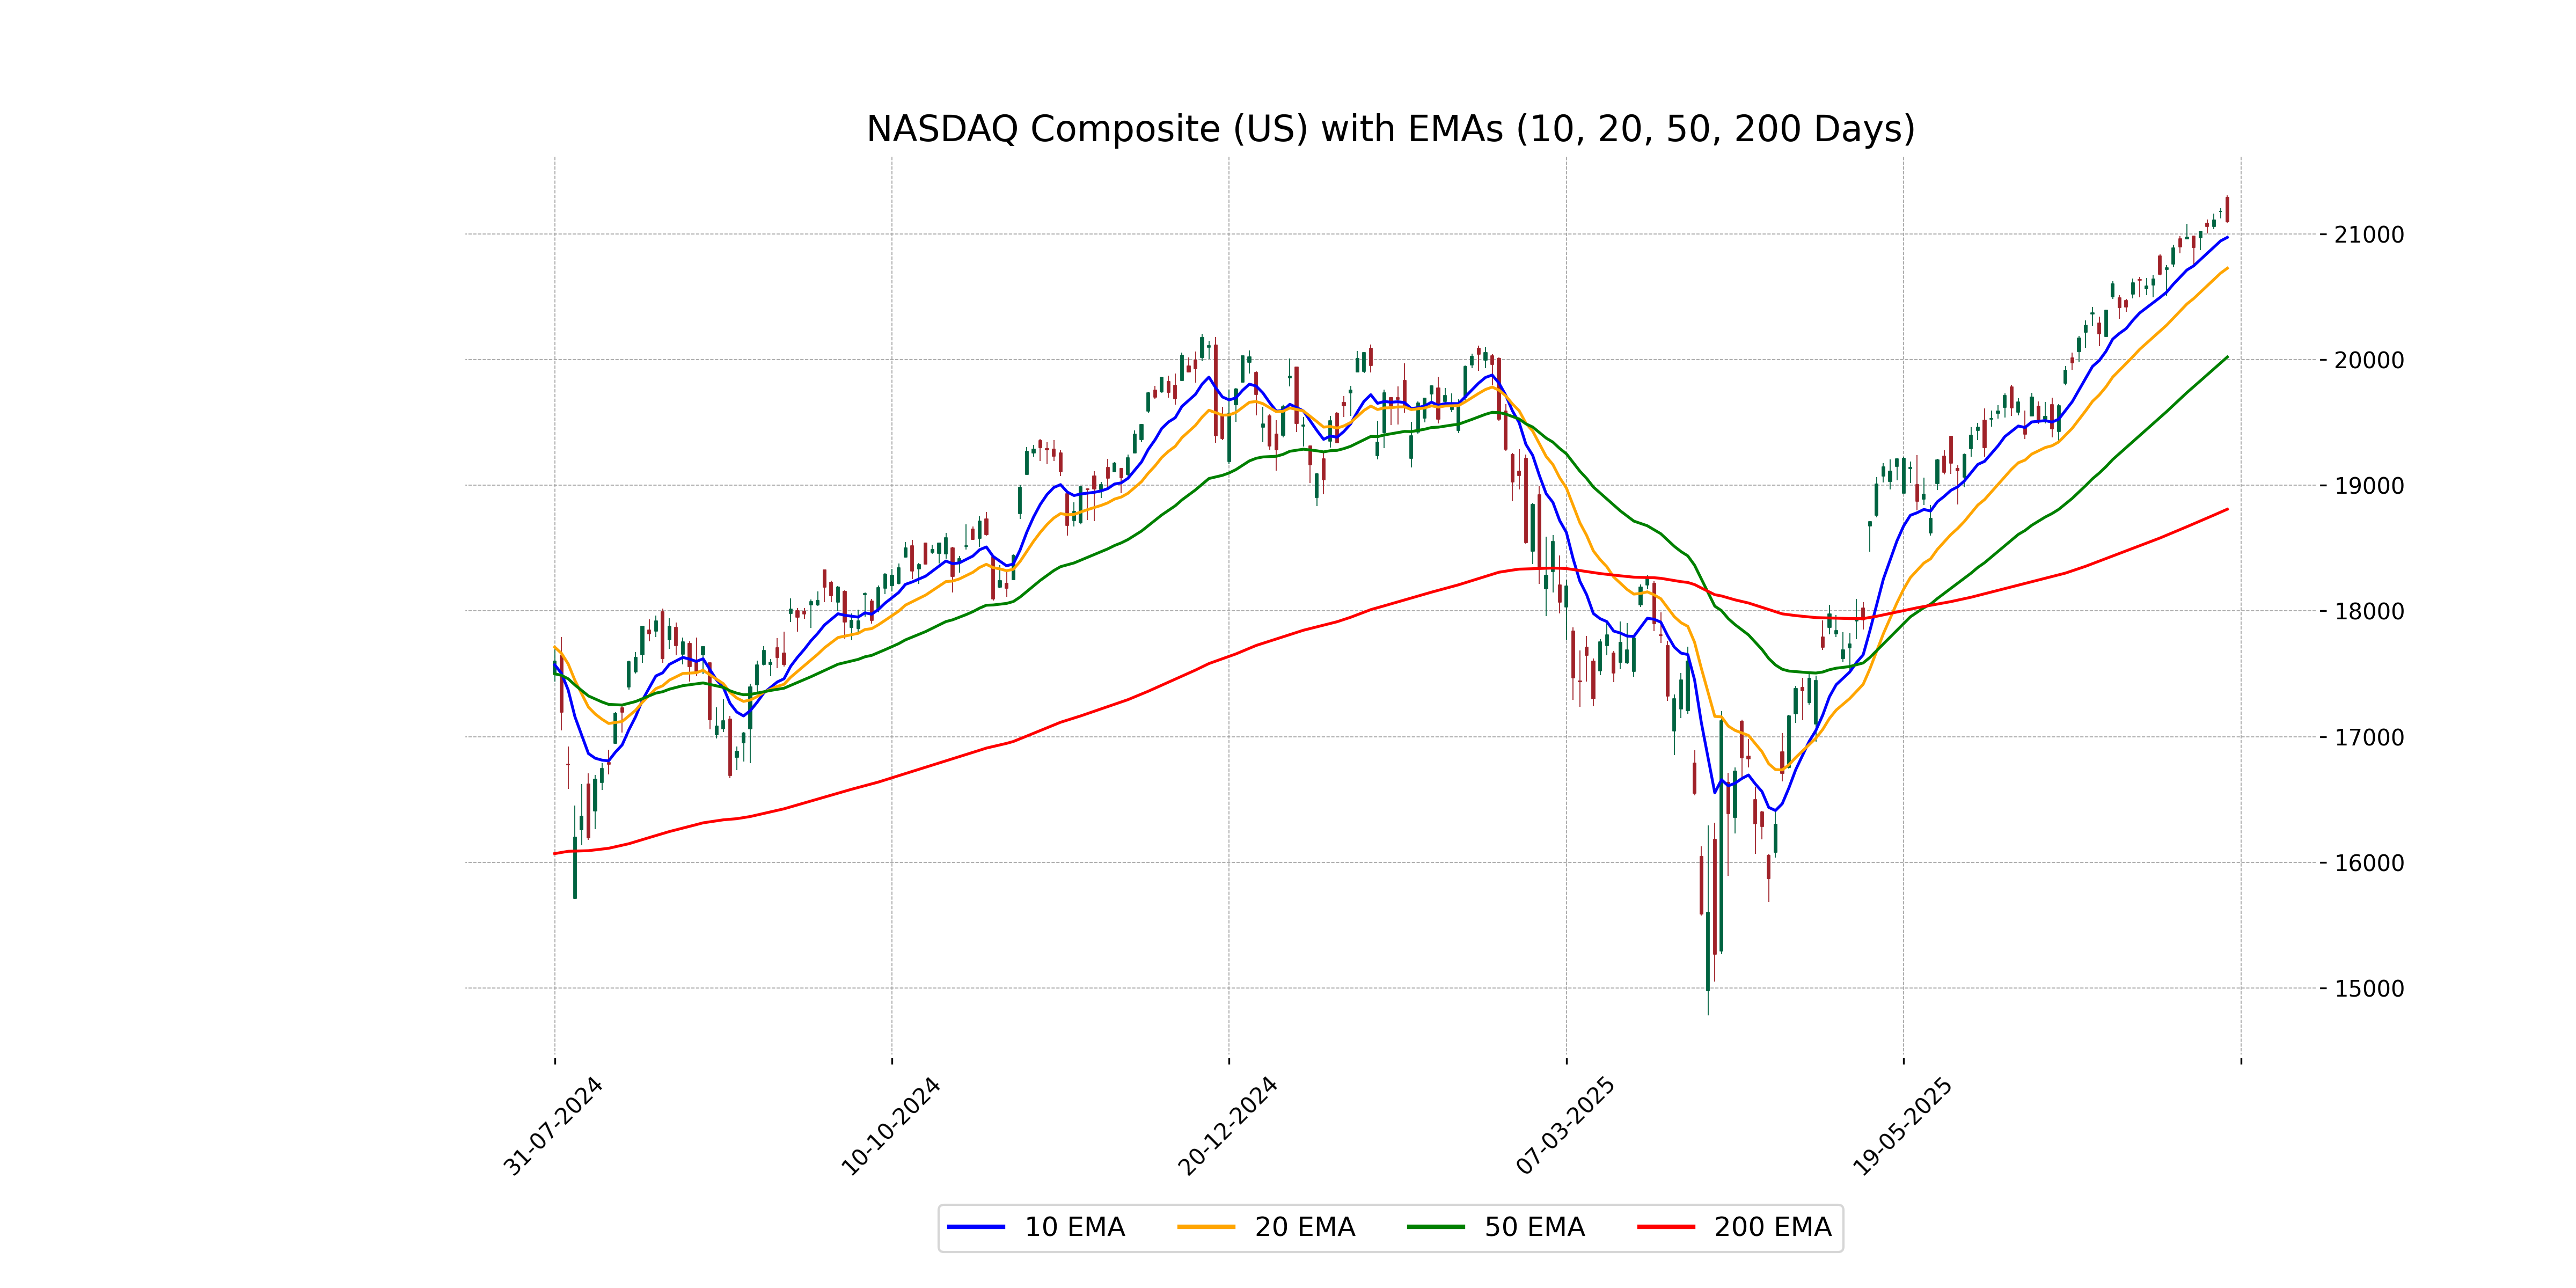
Relationship with Key Moving Averages
The NASDAQ Composite (US) closed at 21,098.29, which is above the 50-day EMA of 20,019.87, and significantly higher than the 200-day EMA of 18,809.03, indicating a strong uptrend. However, it is very close to the 10-day EMA of 20,971.36 and the 20-day EMA of 20,725.94, suggesting recent volatility and a potential consolidation phase.
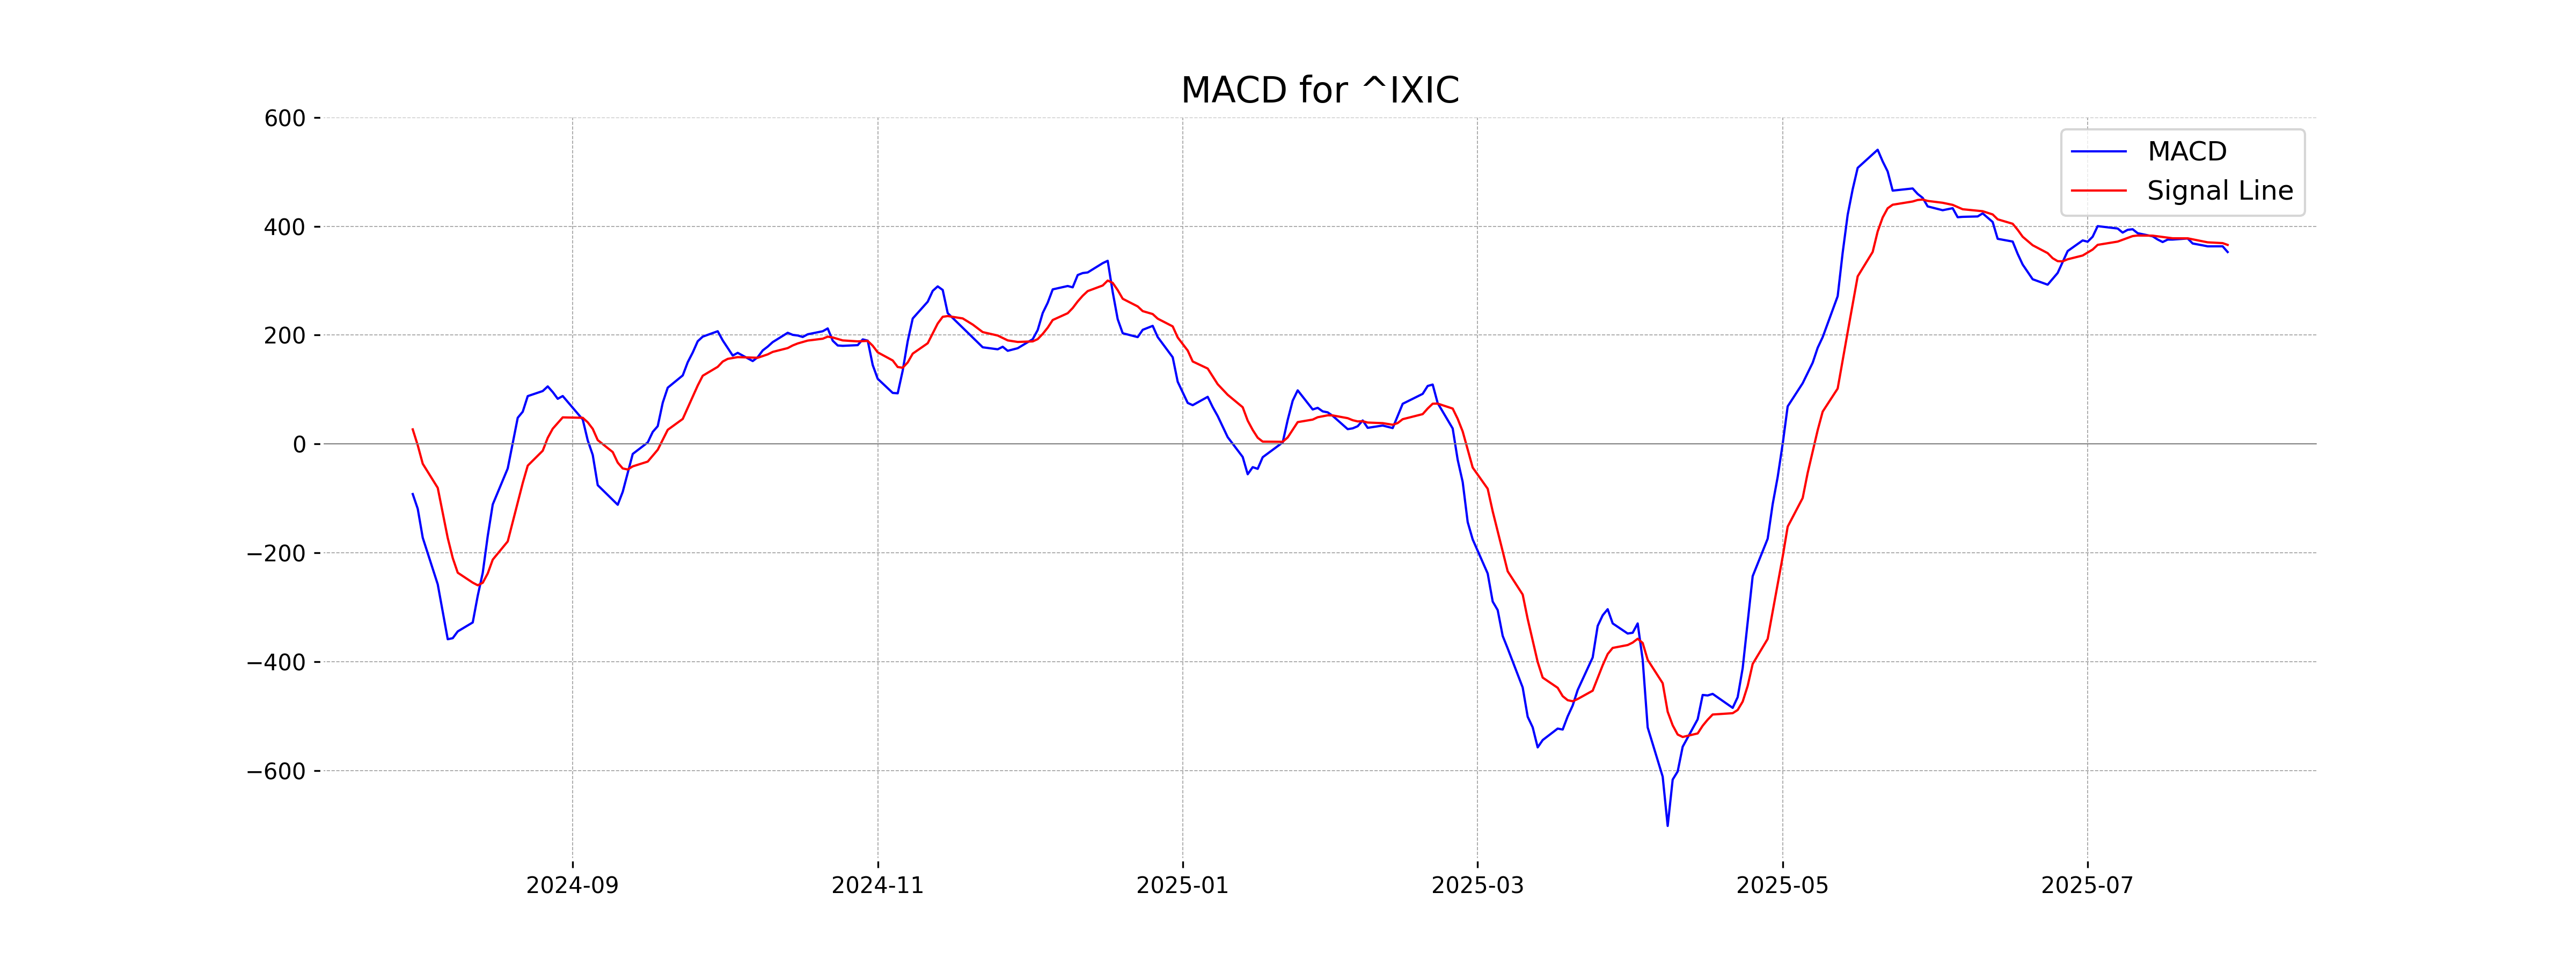
Moving Averages Trend (MACD)
NASDAQ Composite (US) is showing a potential bearish signal as the MACD (352.59) is below the MACD Signal line (365.69). This indicates a weakening upward momentum and could suggest a potential trend reversal.
RSI Analysis
The NASDAQ Composite index has an RSI of 71.60, indicating it is in the overbought territory. This suggests that the index may be overextended and could be prone to a pullback or reversal in the near term.
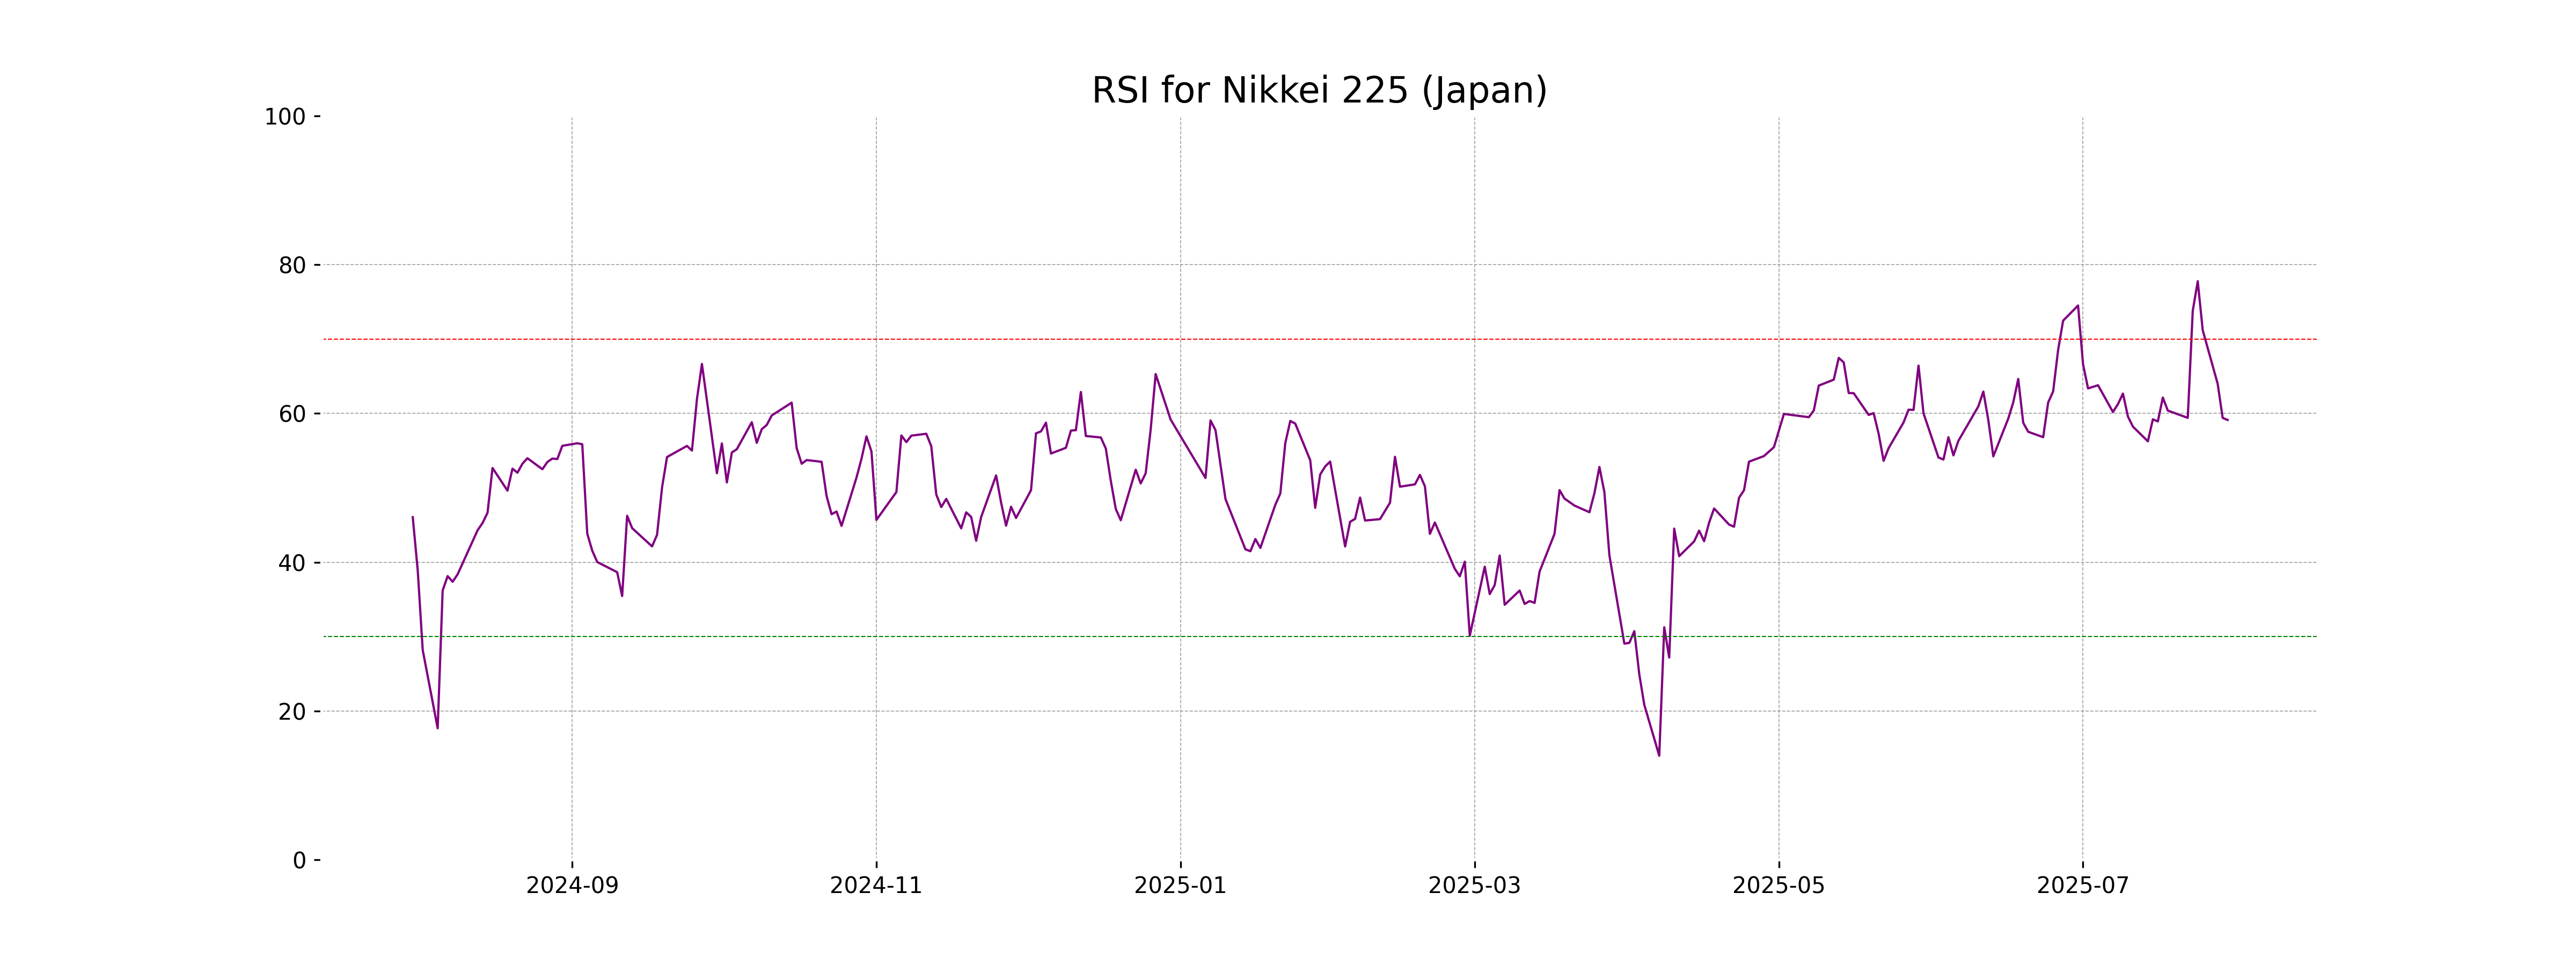
Analysis for Nikkei 225 (Japan) - July 30, 2025
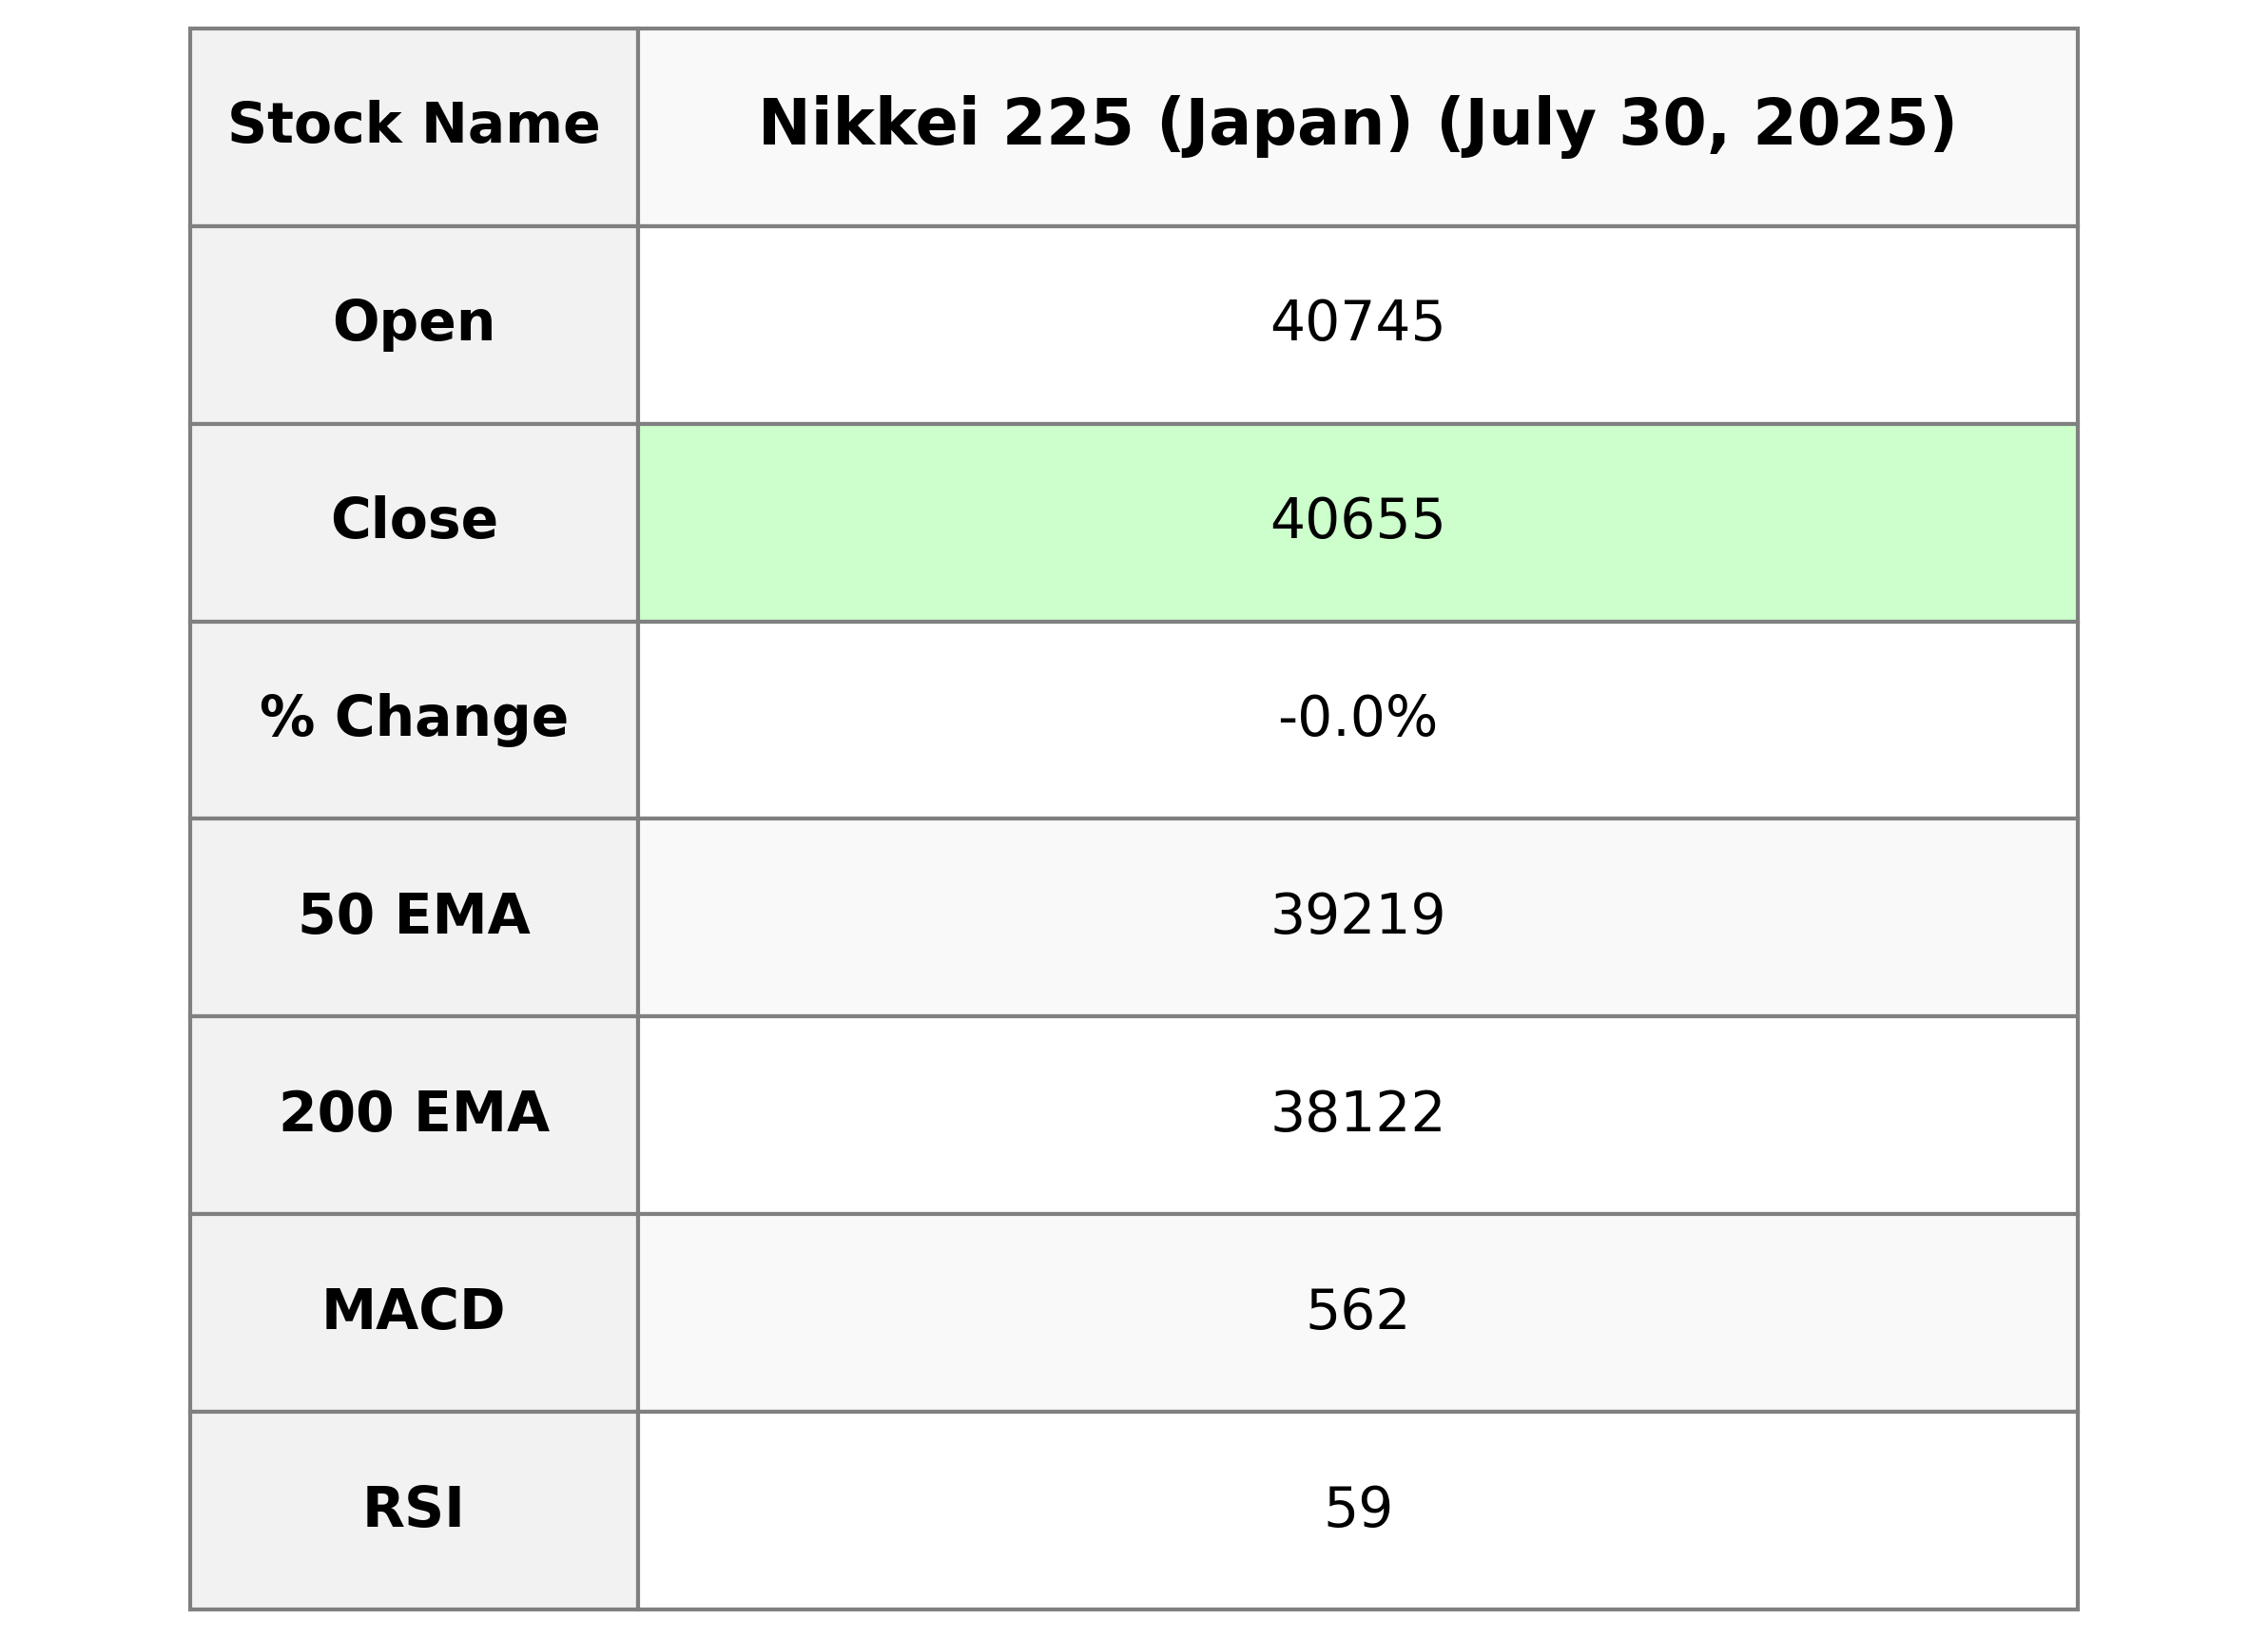
Nikkei 225 (Japan) opened at 40,744.53 and closed at 40,654.70, registering a slight decrease of 0.05% or 19.85 points from the previous close. Despite a high RSI of 59.12, indicating a moderately overbought position, the MACD of 561.79 suggests continued positive momentum with its value above the signal line.
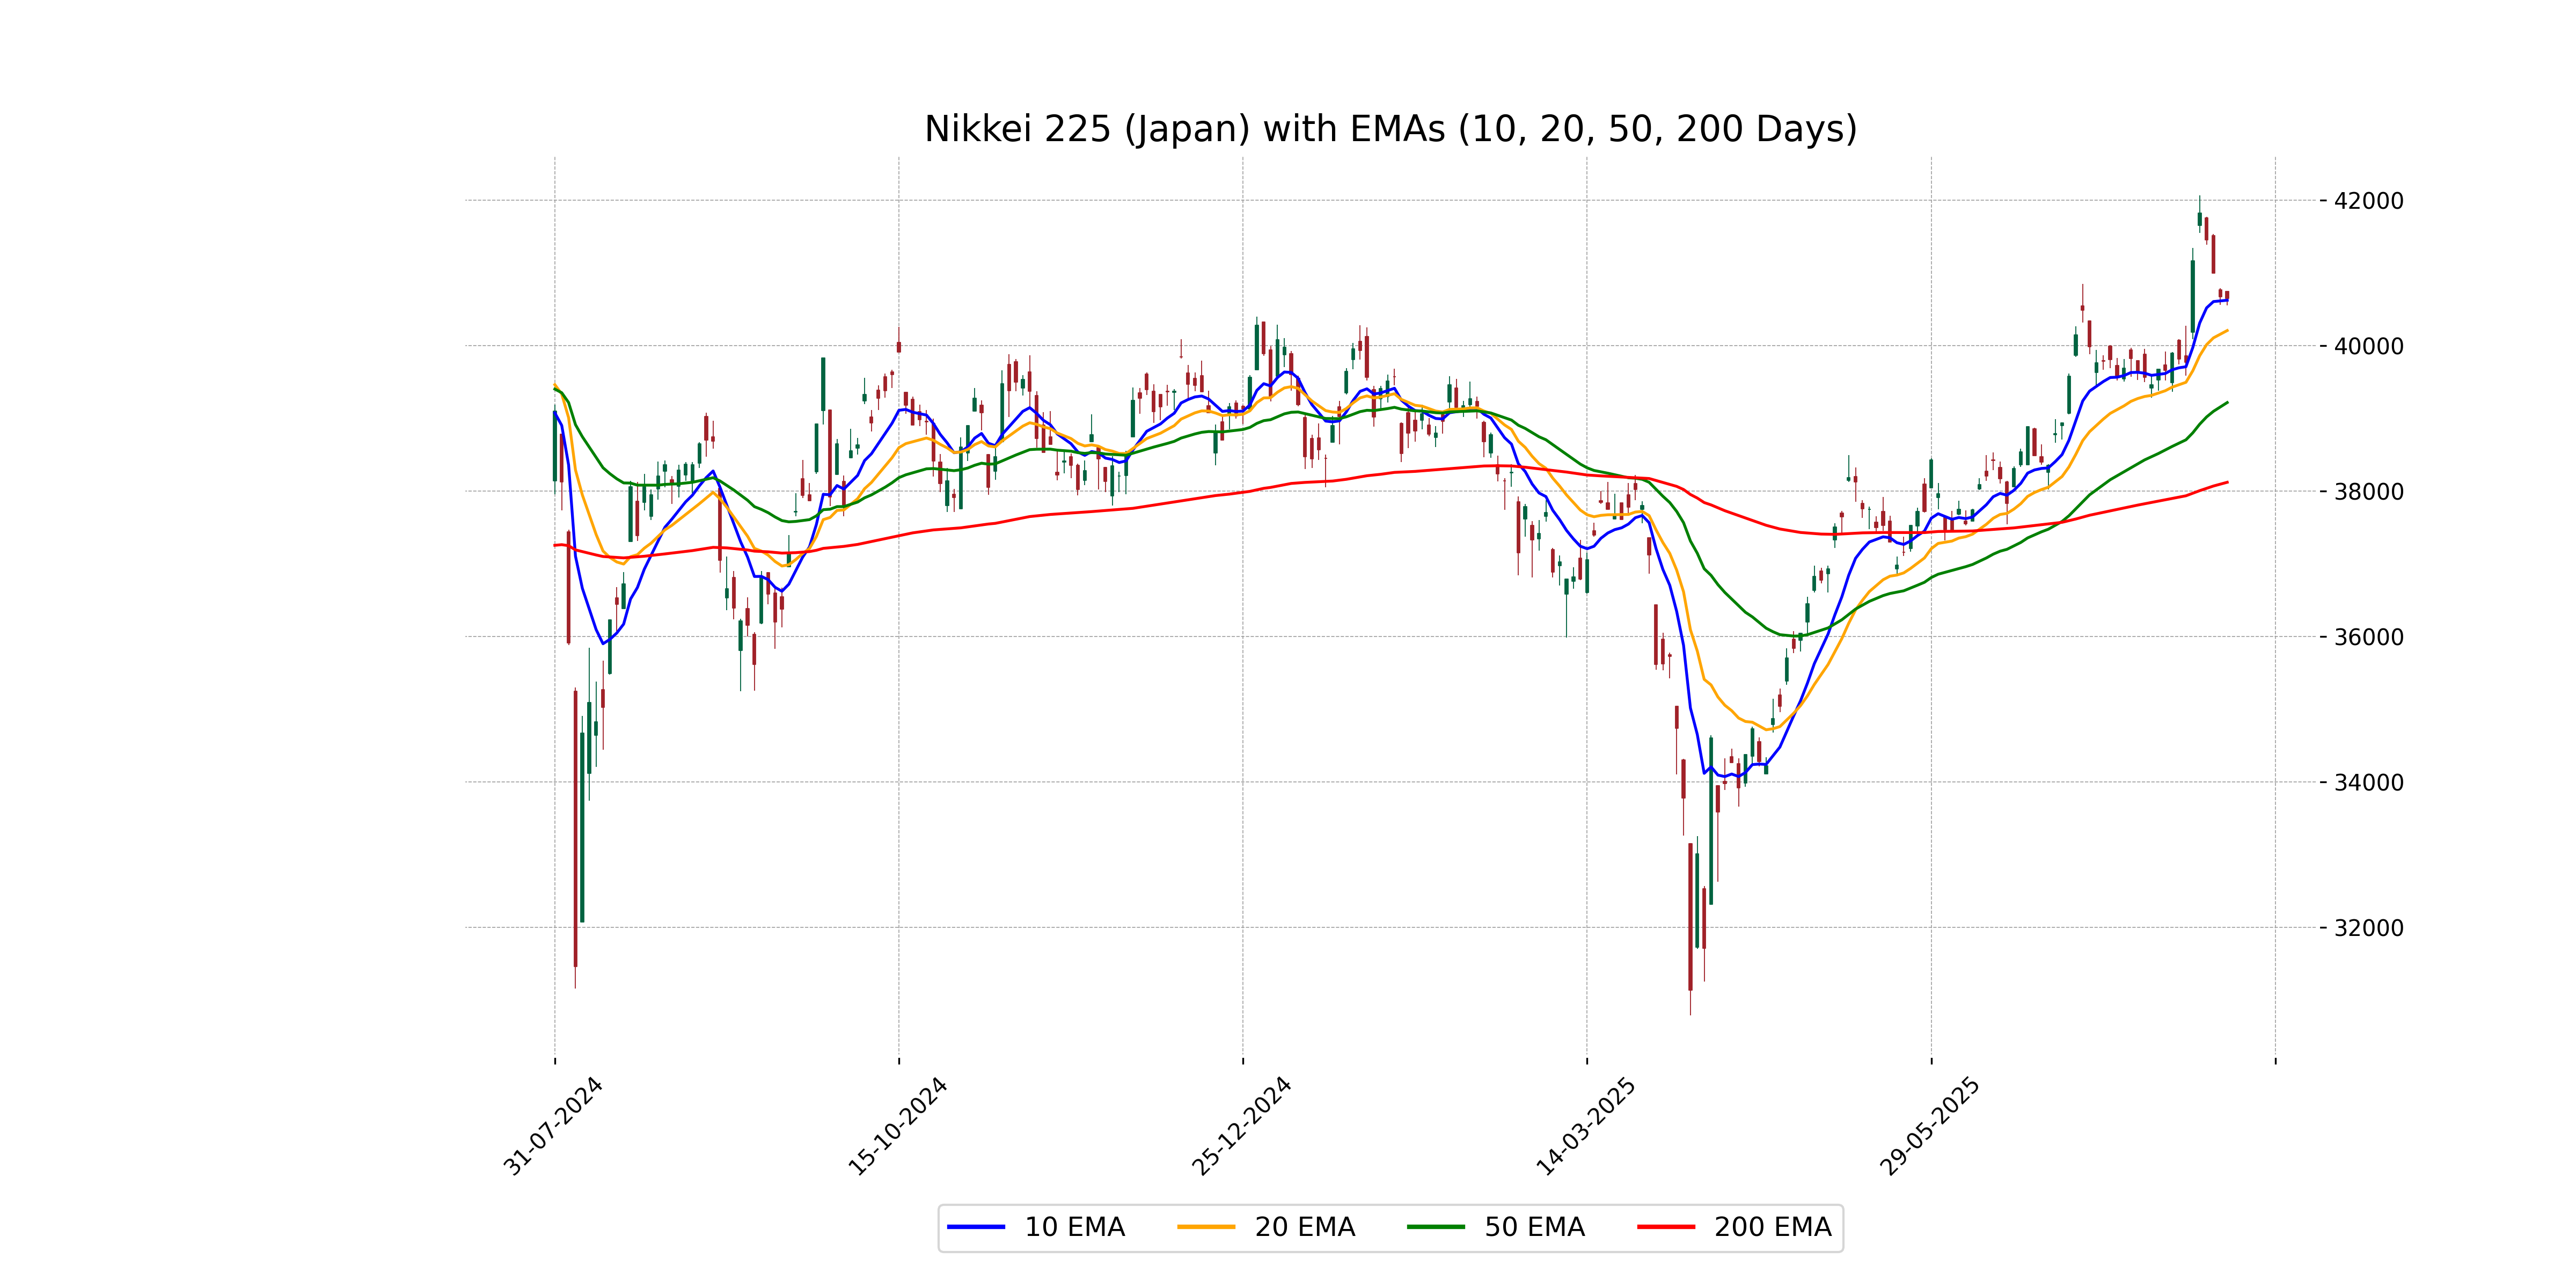
Relationship with Key Moving Averages
The Nikkei 225 closed below its opening price, with a minor decline of 0.05%. It remains above its 50 EMA, 200 EMA, 10 EMA, and 20 EMA, suggesting a strong short-term and long-term bullish trend. The RSI of 59.12 indicates neutral momentum, while the MACD above the signal line signals continuing positive momentum.
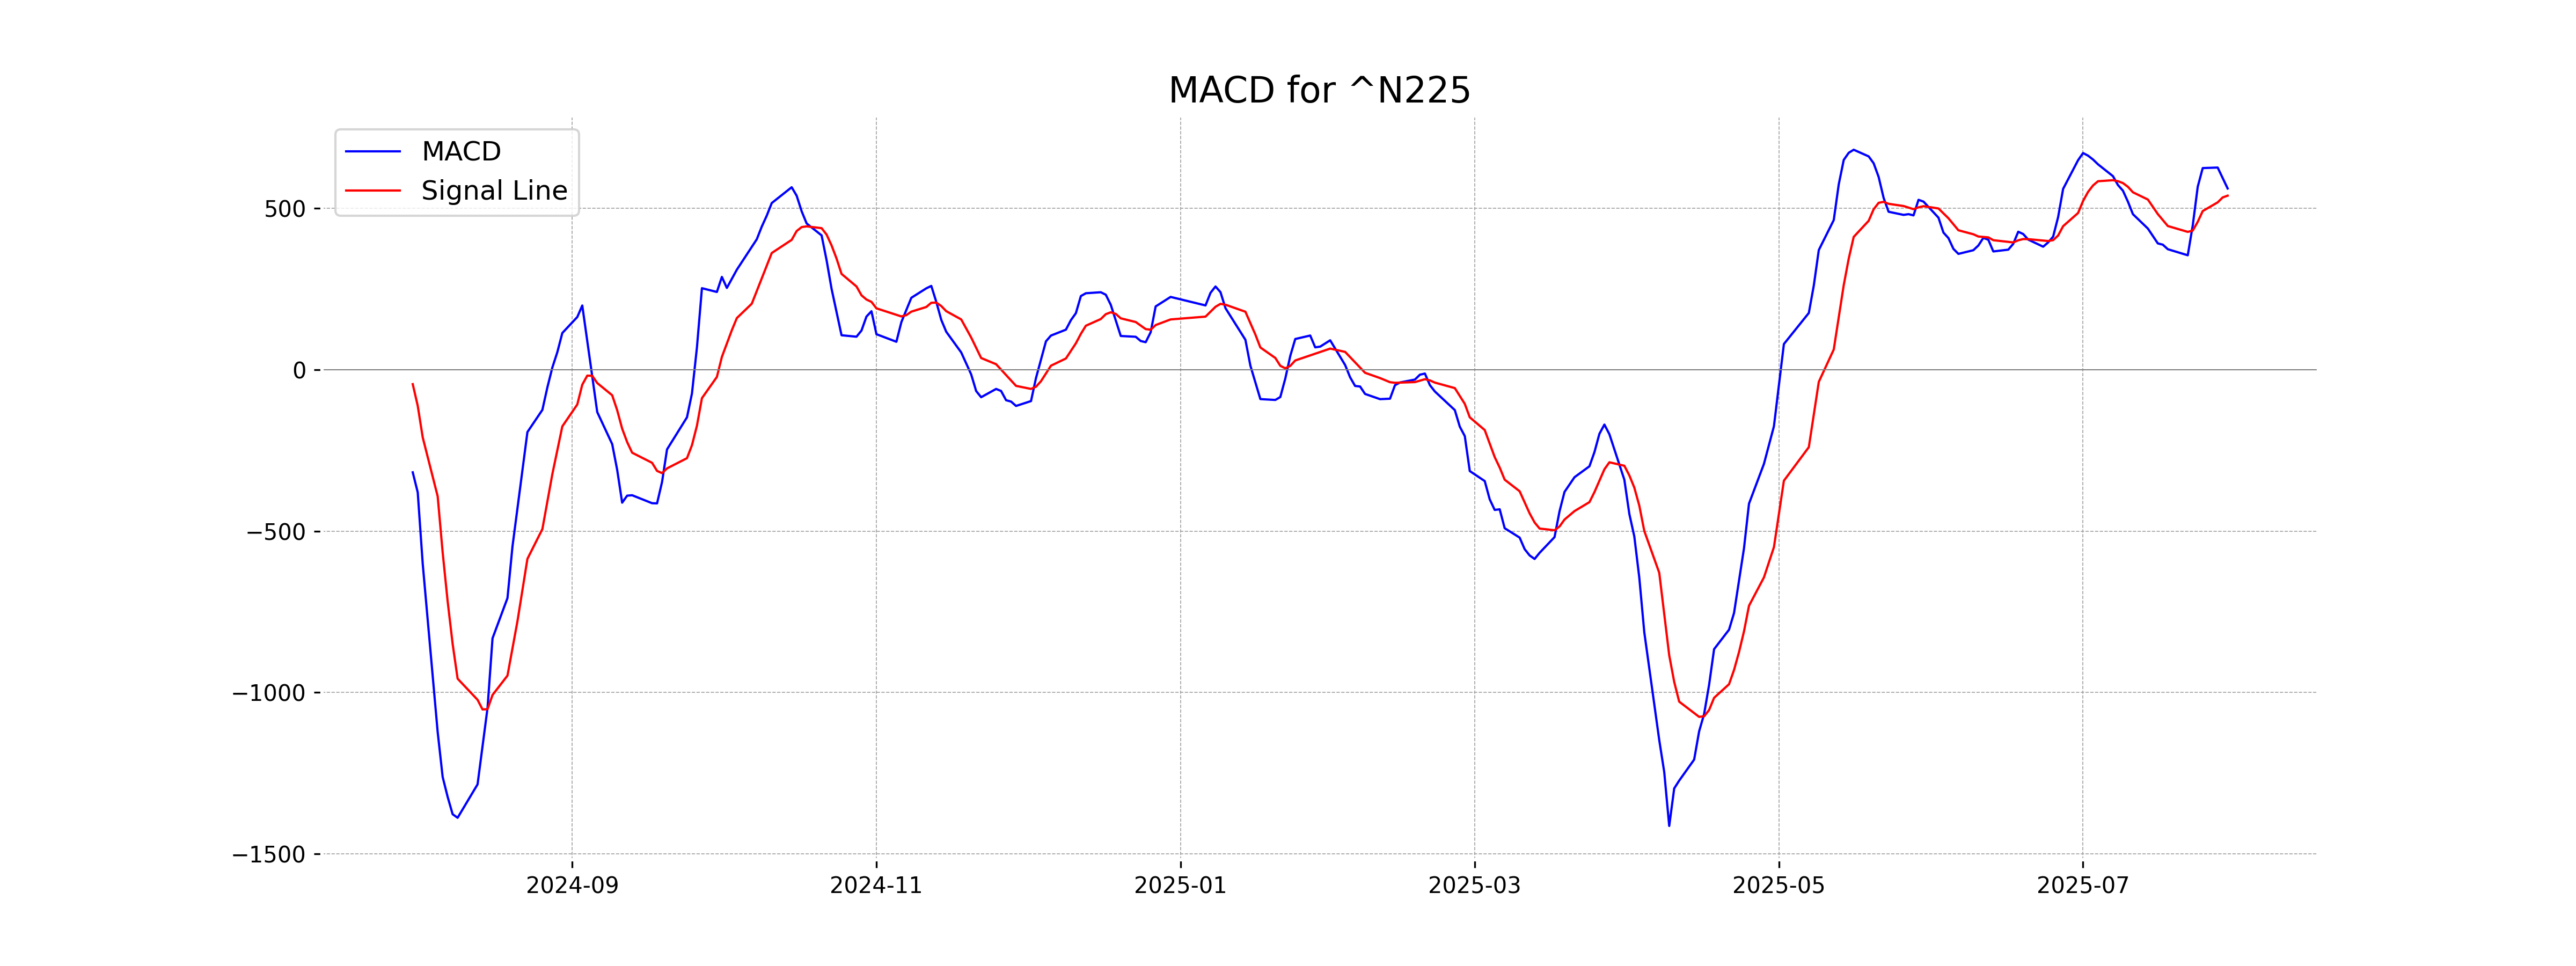
Moving Averages Trend (MACD)
MACD Analysis for Nikkei 225 (Japan): The MACD value of 561.79 is above the MACD Signal of 539.58, suggesting a potential bullish trend. This crossover indicates that the momentum may be shifting positively for the Nikkei 225 index.
RSI Analysis
The Relative Strength Index (RSI) for Nikkei 225 is 59.12, suggesting that the index is in a neutral zone. This indicates that it is neither overbought nor oversold, reflecting a balanced market condition.
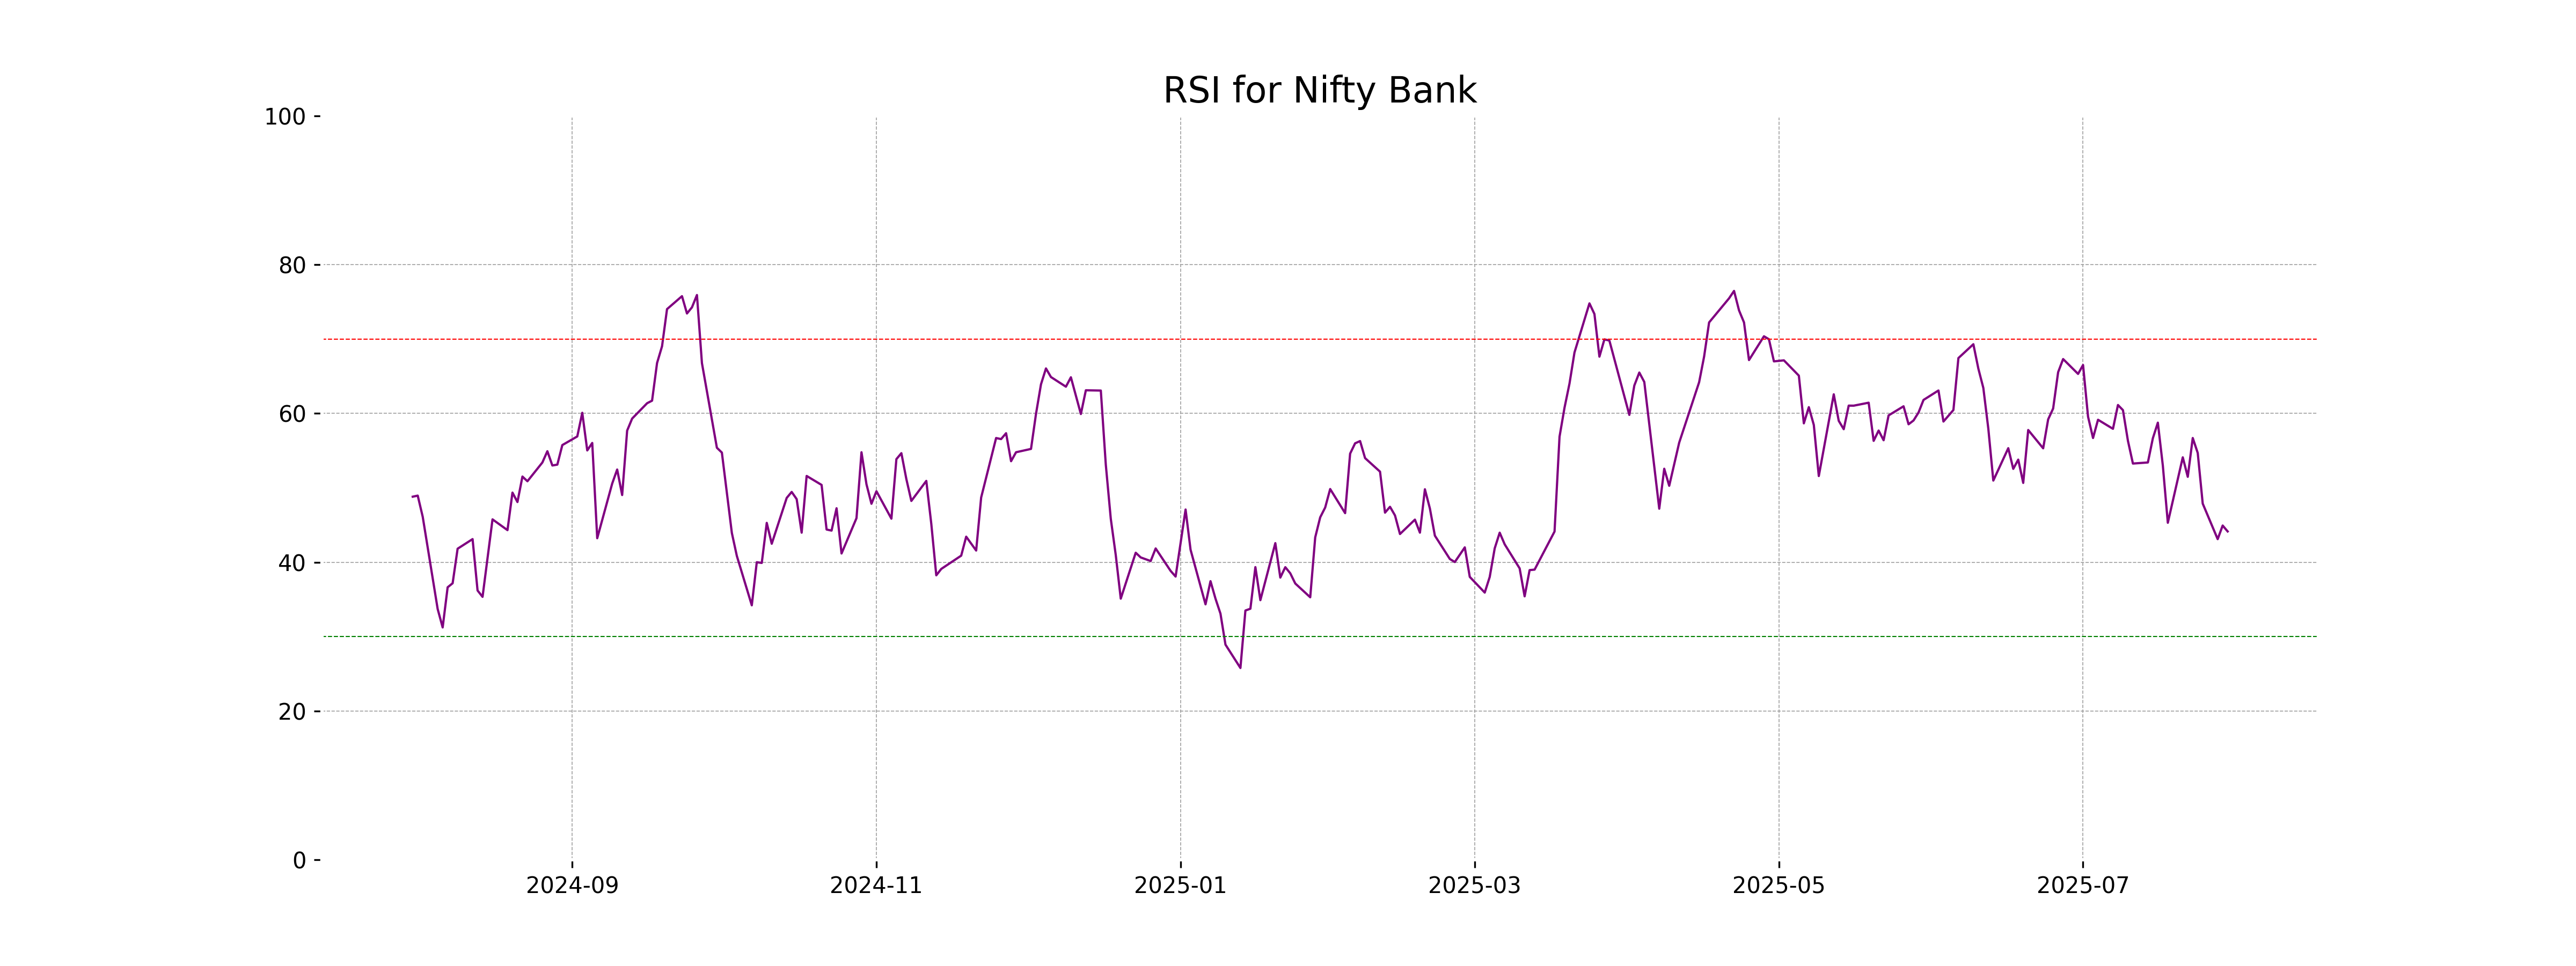
Analysis for Nifty Bank - July 30, 2025
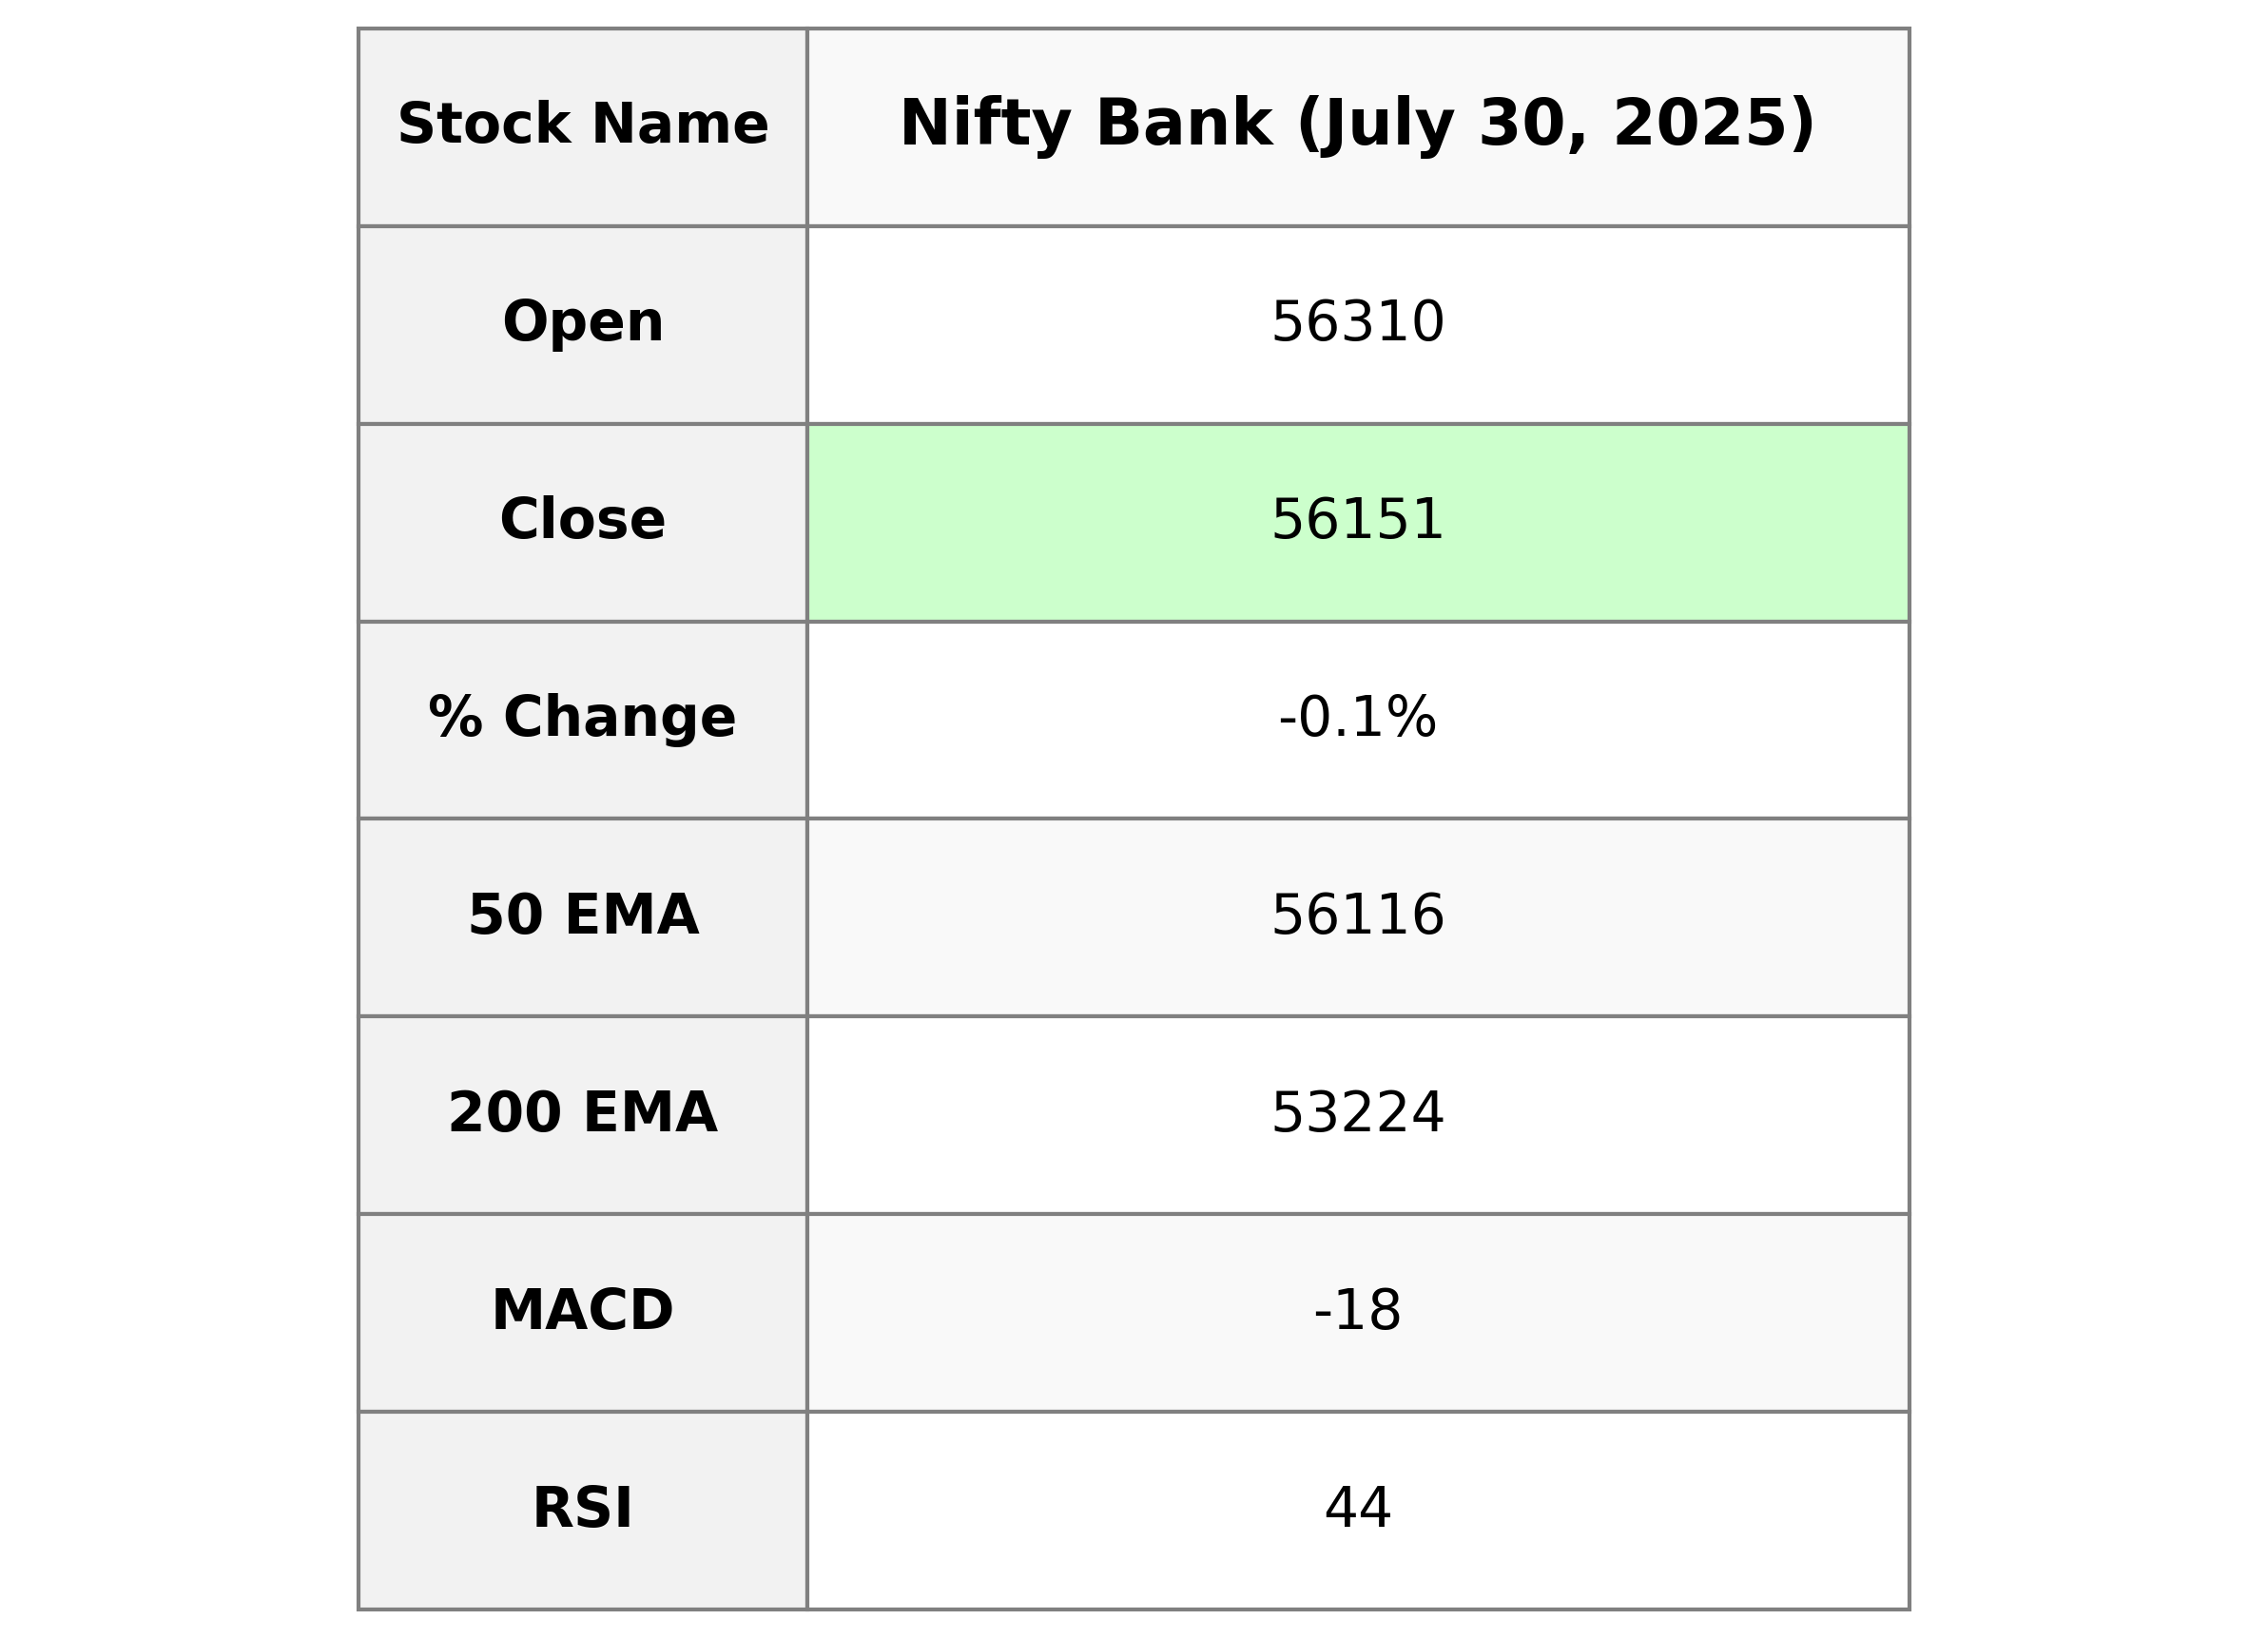
The Nifty Bank observed a slight decrease in its performance, with a closing price of 56150.70, down by 71.30 points compared to the previous close of 56222.00. The relative strength index (RSI) at 44.14 indicates a moderately weak market sentiment. The negative MACD value suggests a bearish trend, with the price also below the 50-day EMA of 56116.48.
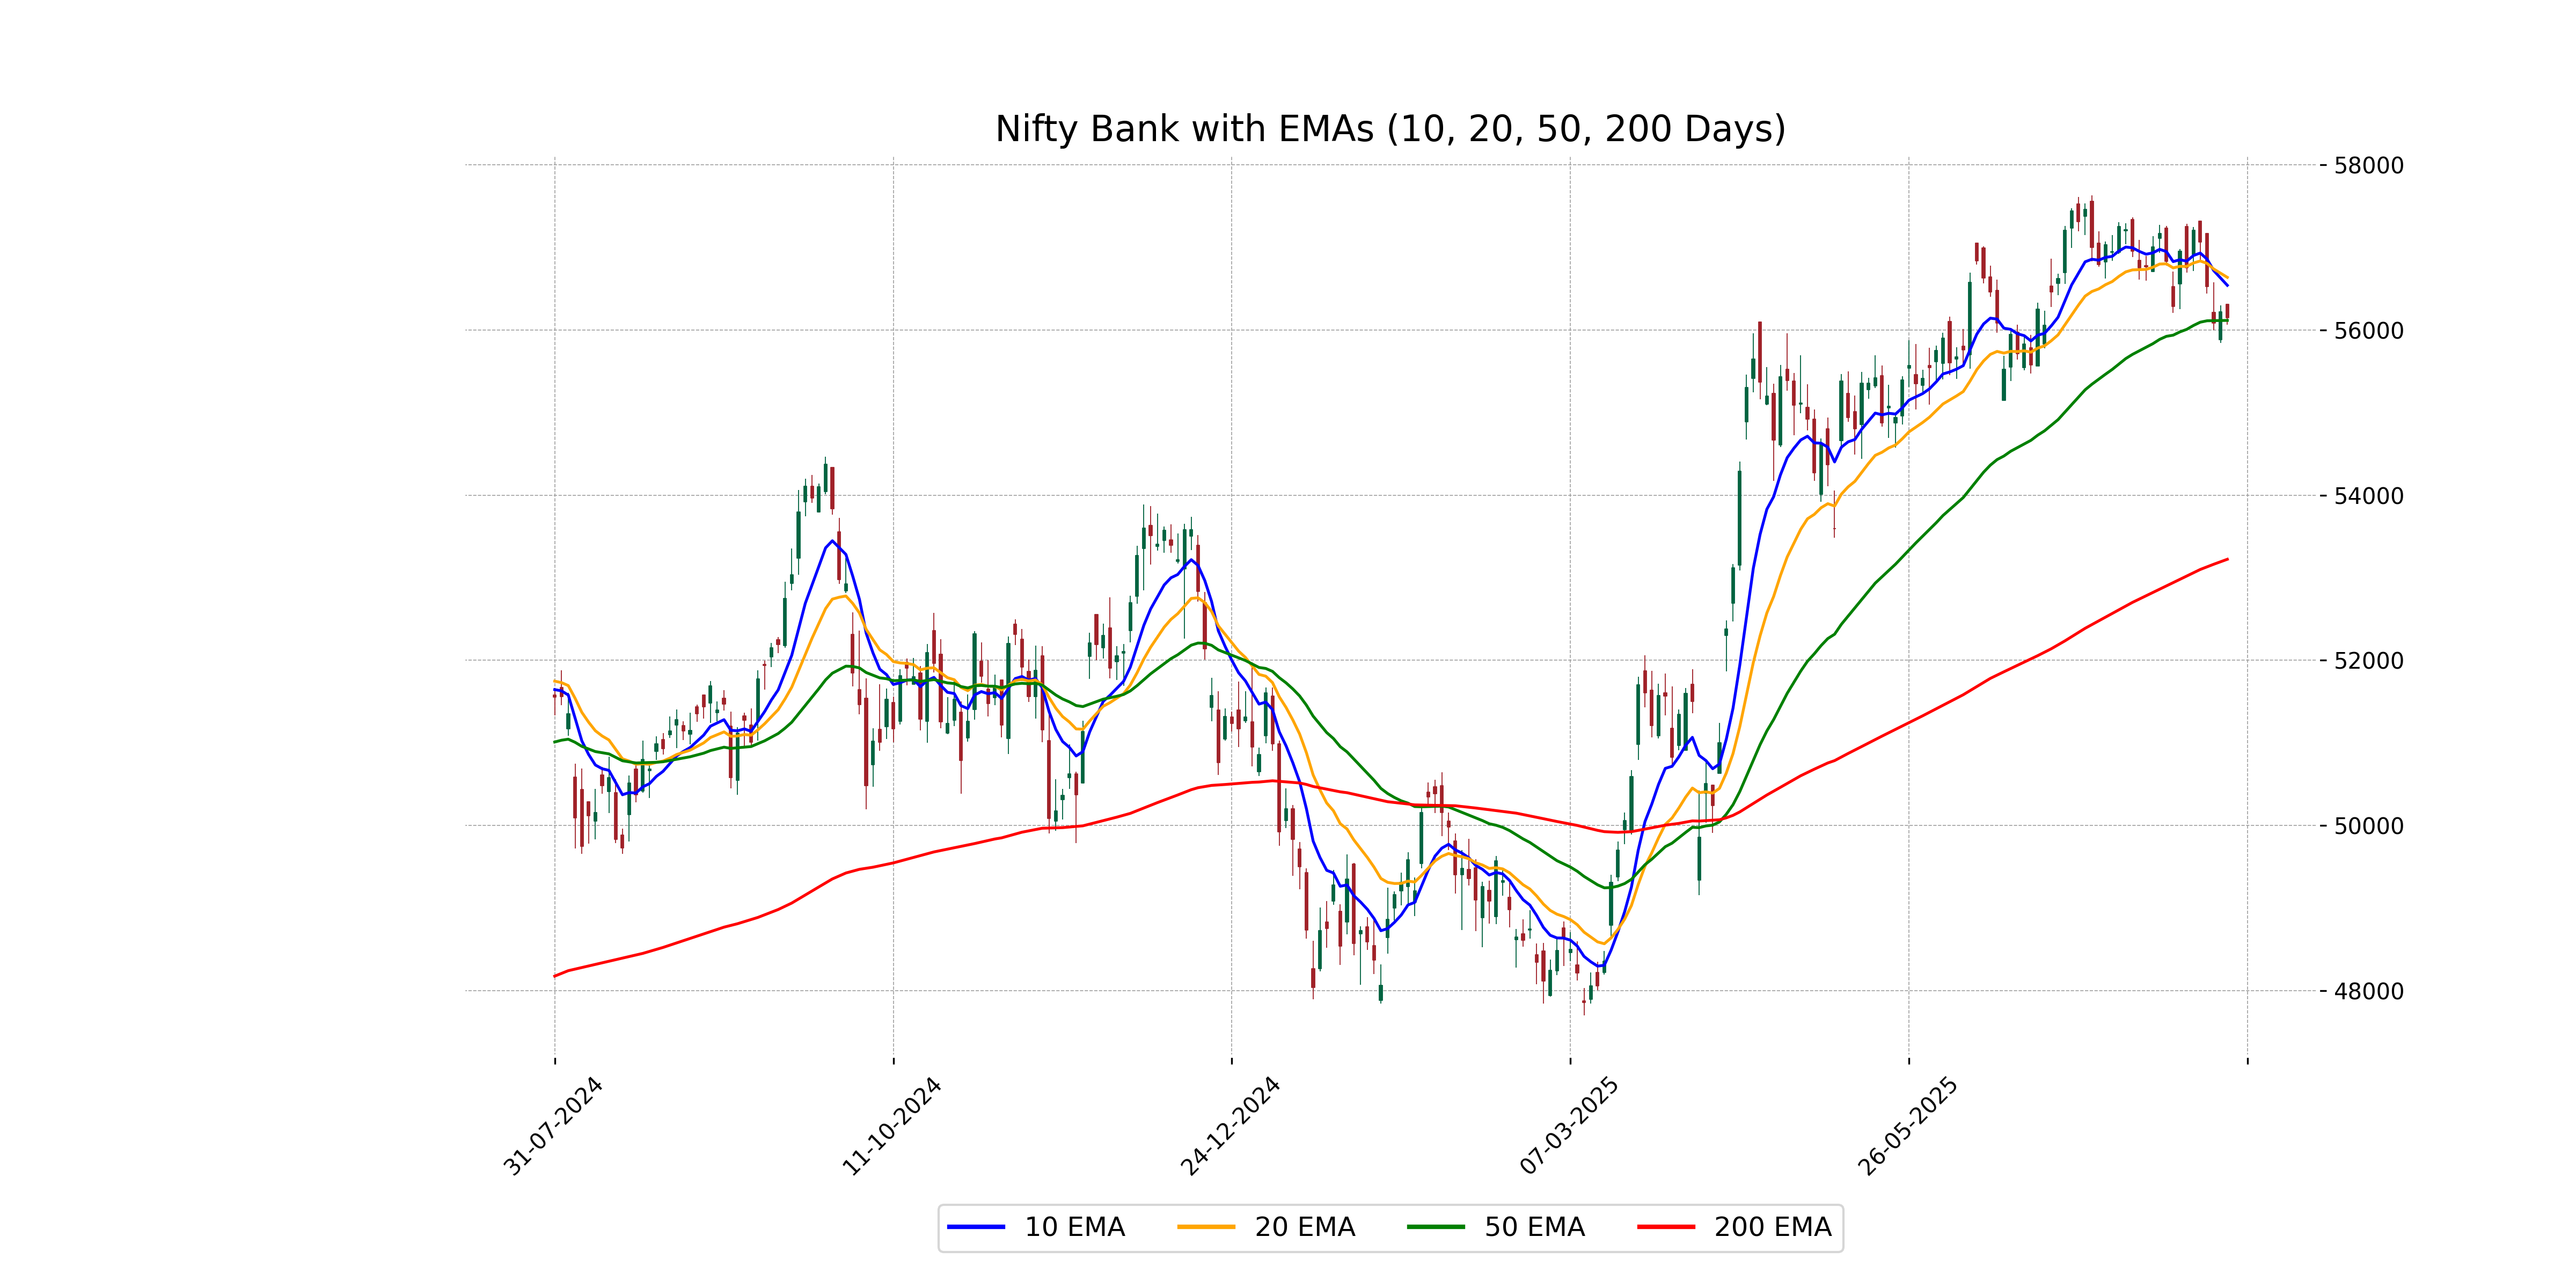
Relationship with Key Moving Averages
The Nifty Bank index closed at 56,150.70, which is above its 50-day EMA of 56,116.48 but below its 10-day EMA of 56,541.14 and 20-day EMA of 56,637.67. This positioning suggests a short-term downward pressure while staying relatively stable against the medium-term average.
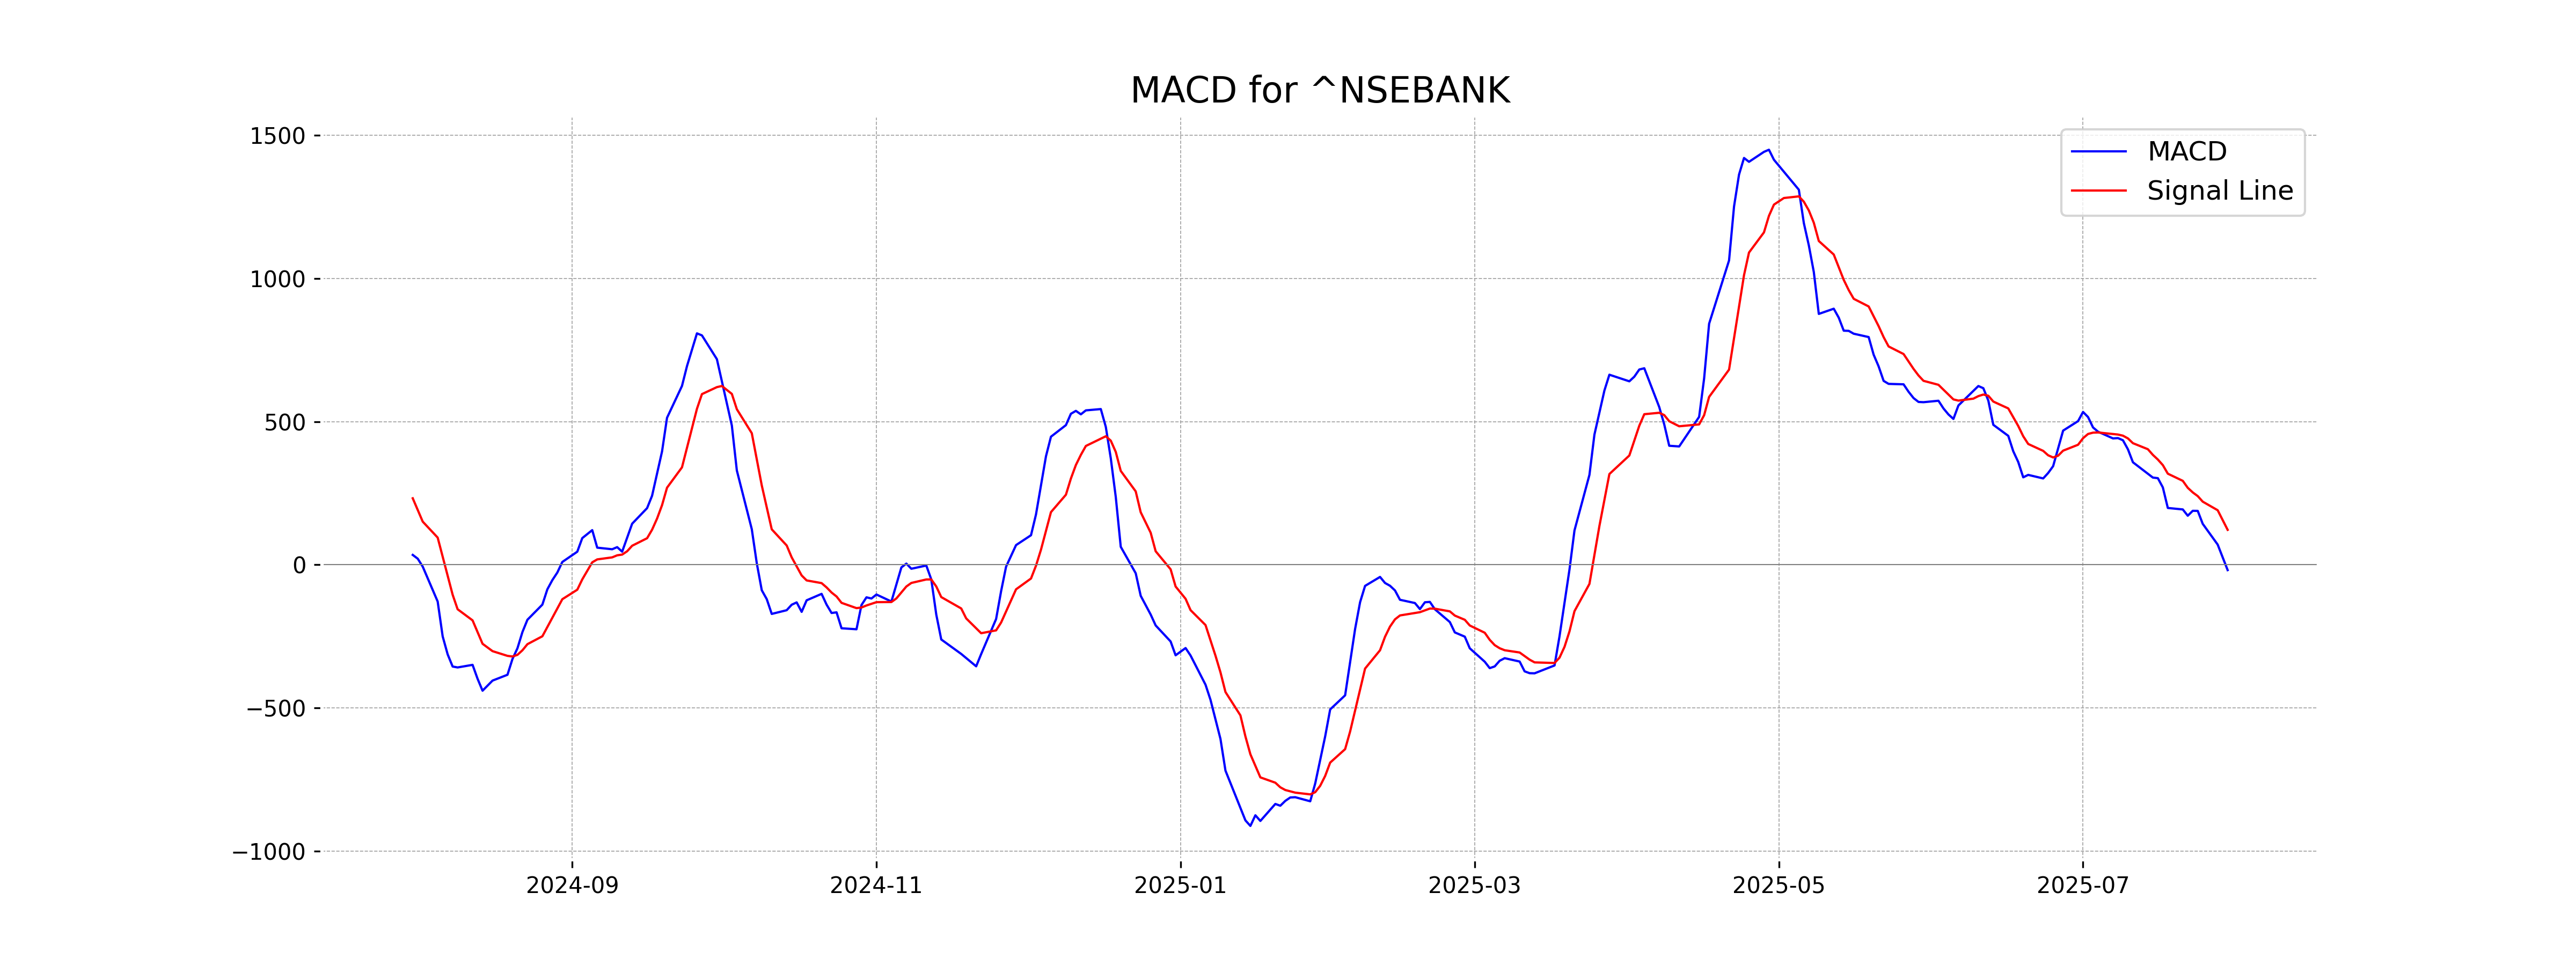
Moving Averages Trend (MACD)
Based on the stock data for Nifty Bank, the MACD value is currently -18.46, which is below the MACD signal line of 122.12. This suggests a bearish trend, indicating that the recent price momentum has been negative. Traders might view this as a signal that the stock could continue to face downward pressure in the short term.
RSI Analysis
Based on the given stock data for Nifty Bank, the RSI (Relative Strength Index) is 44.14. This indicates a neutral momentum, as the RSI is neither in the overbought territory (above 70) nor in the oversold region (below 30). Investors might consider this level to assess potential buying or selling points, depending on other technical factors.
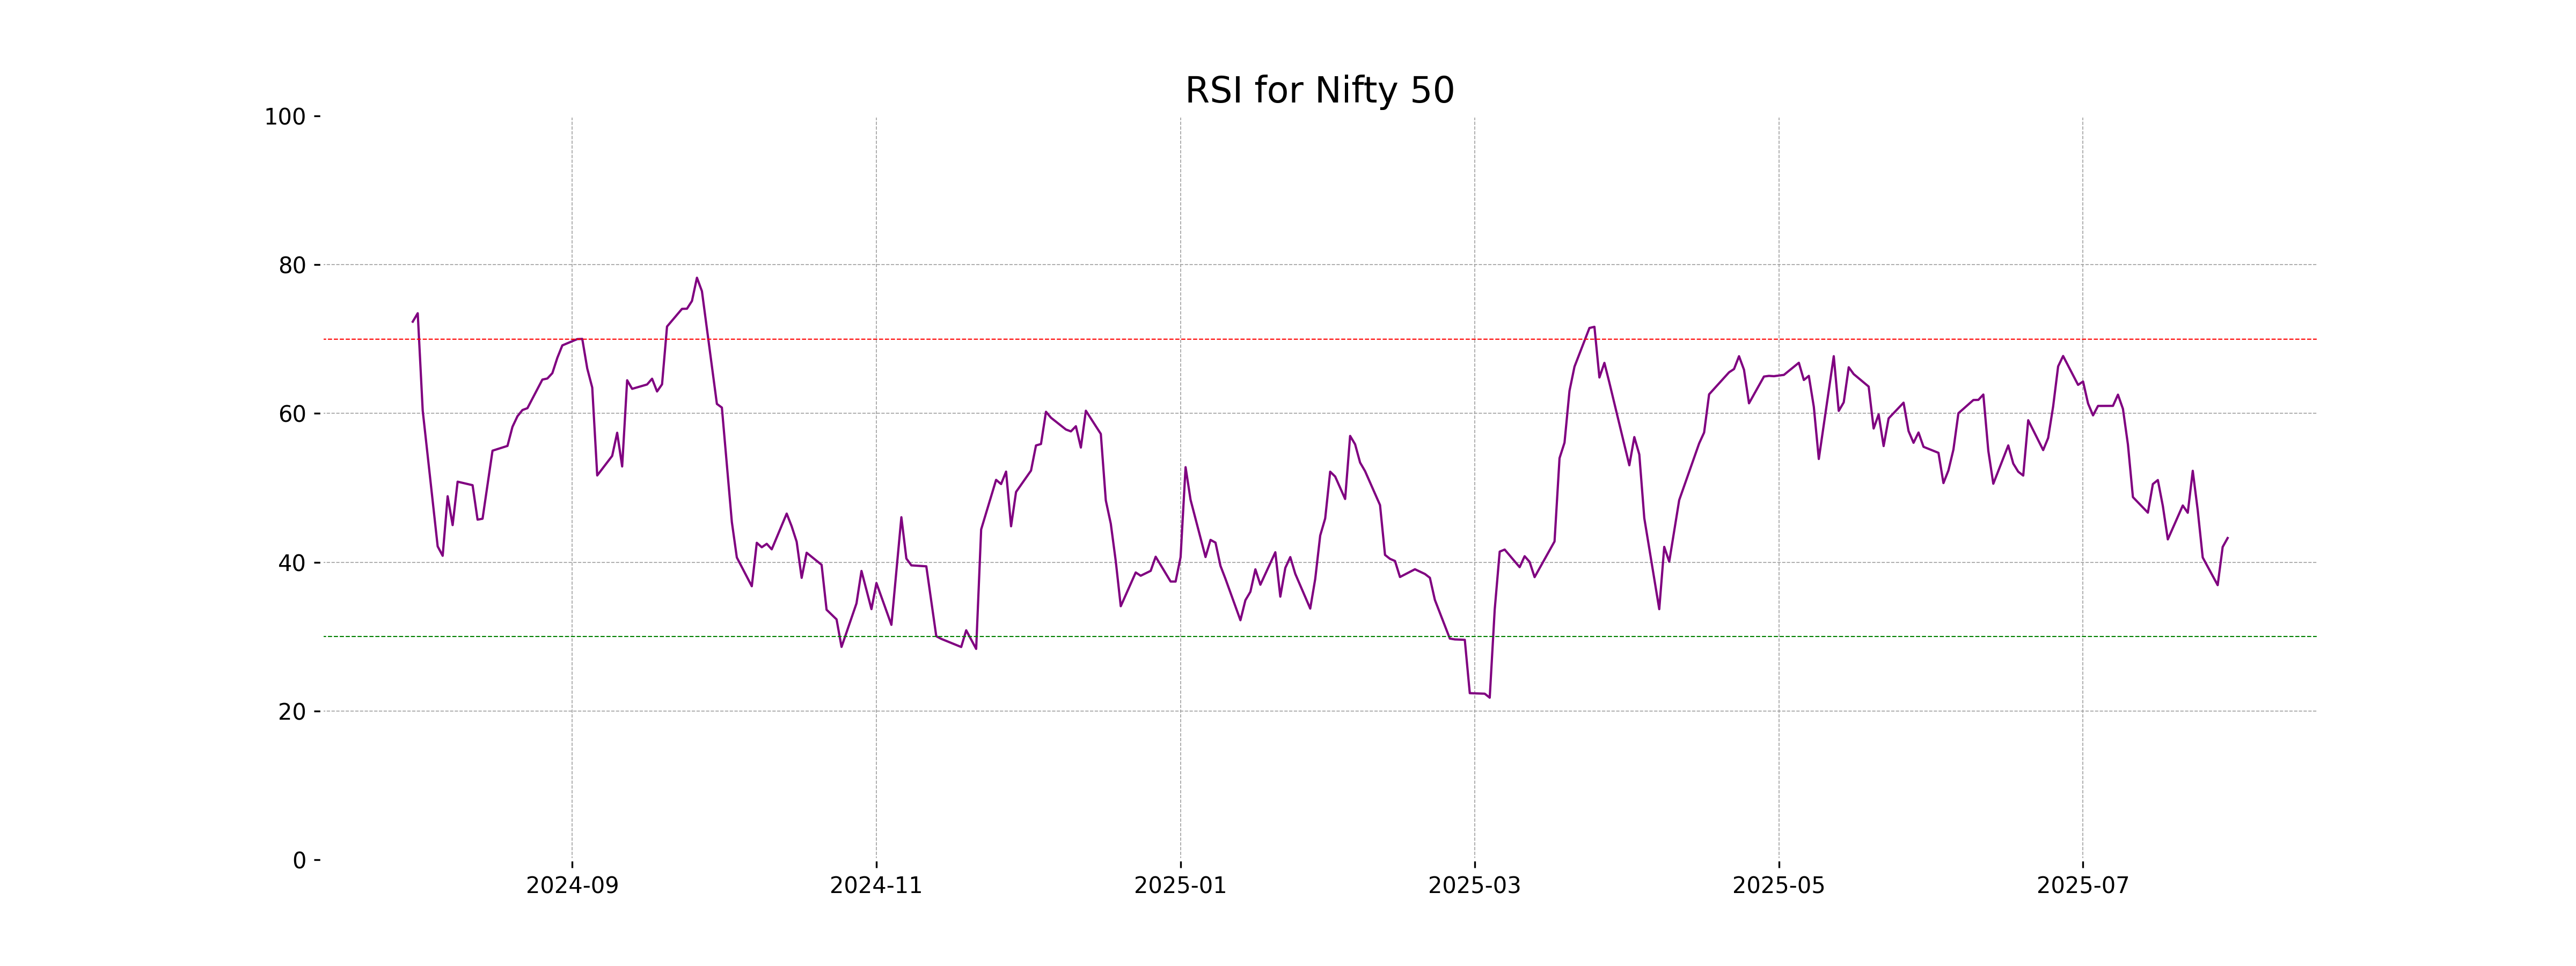
Analysis for Nifty 50 - July 30, 2025
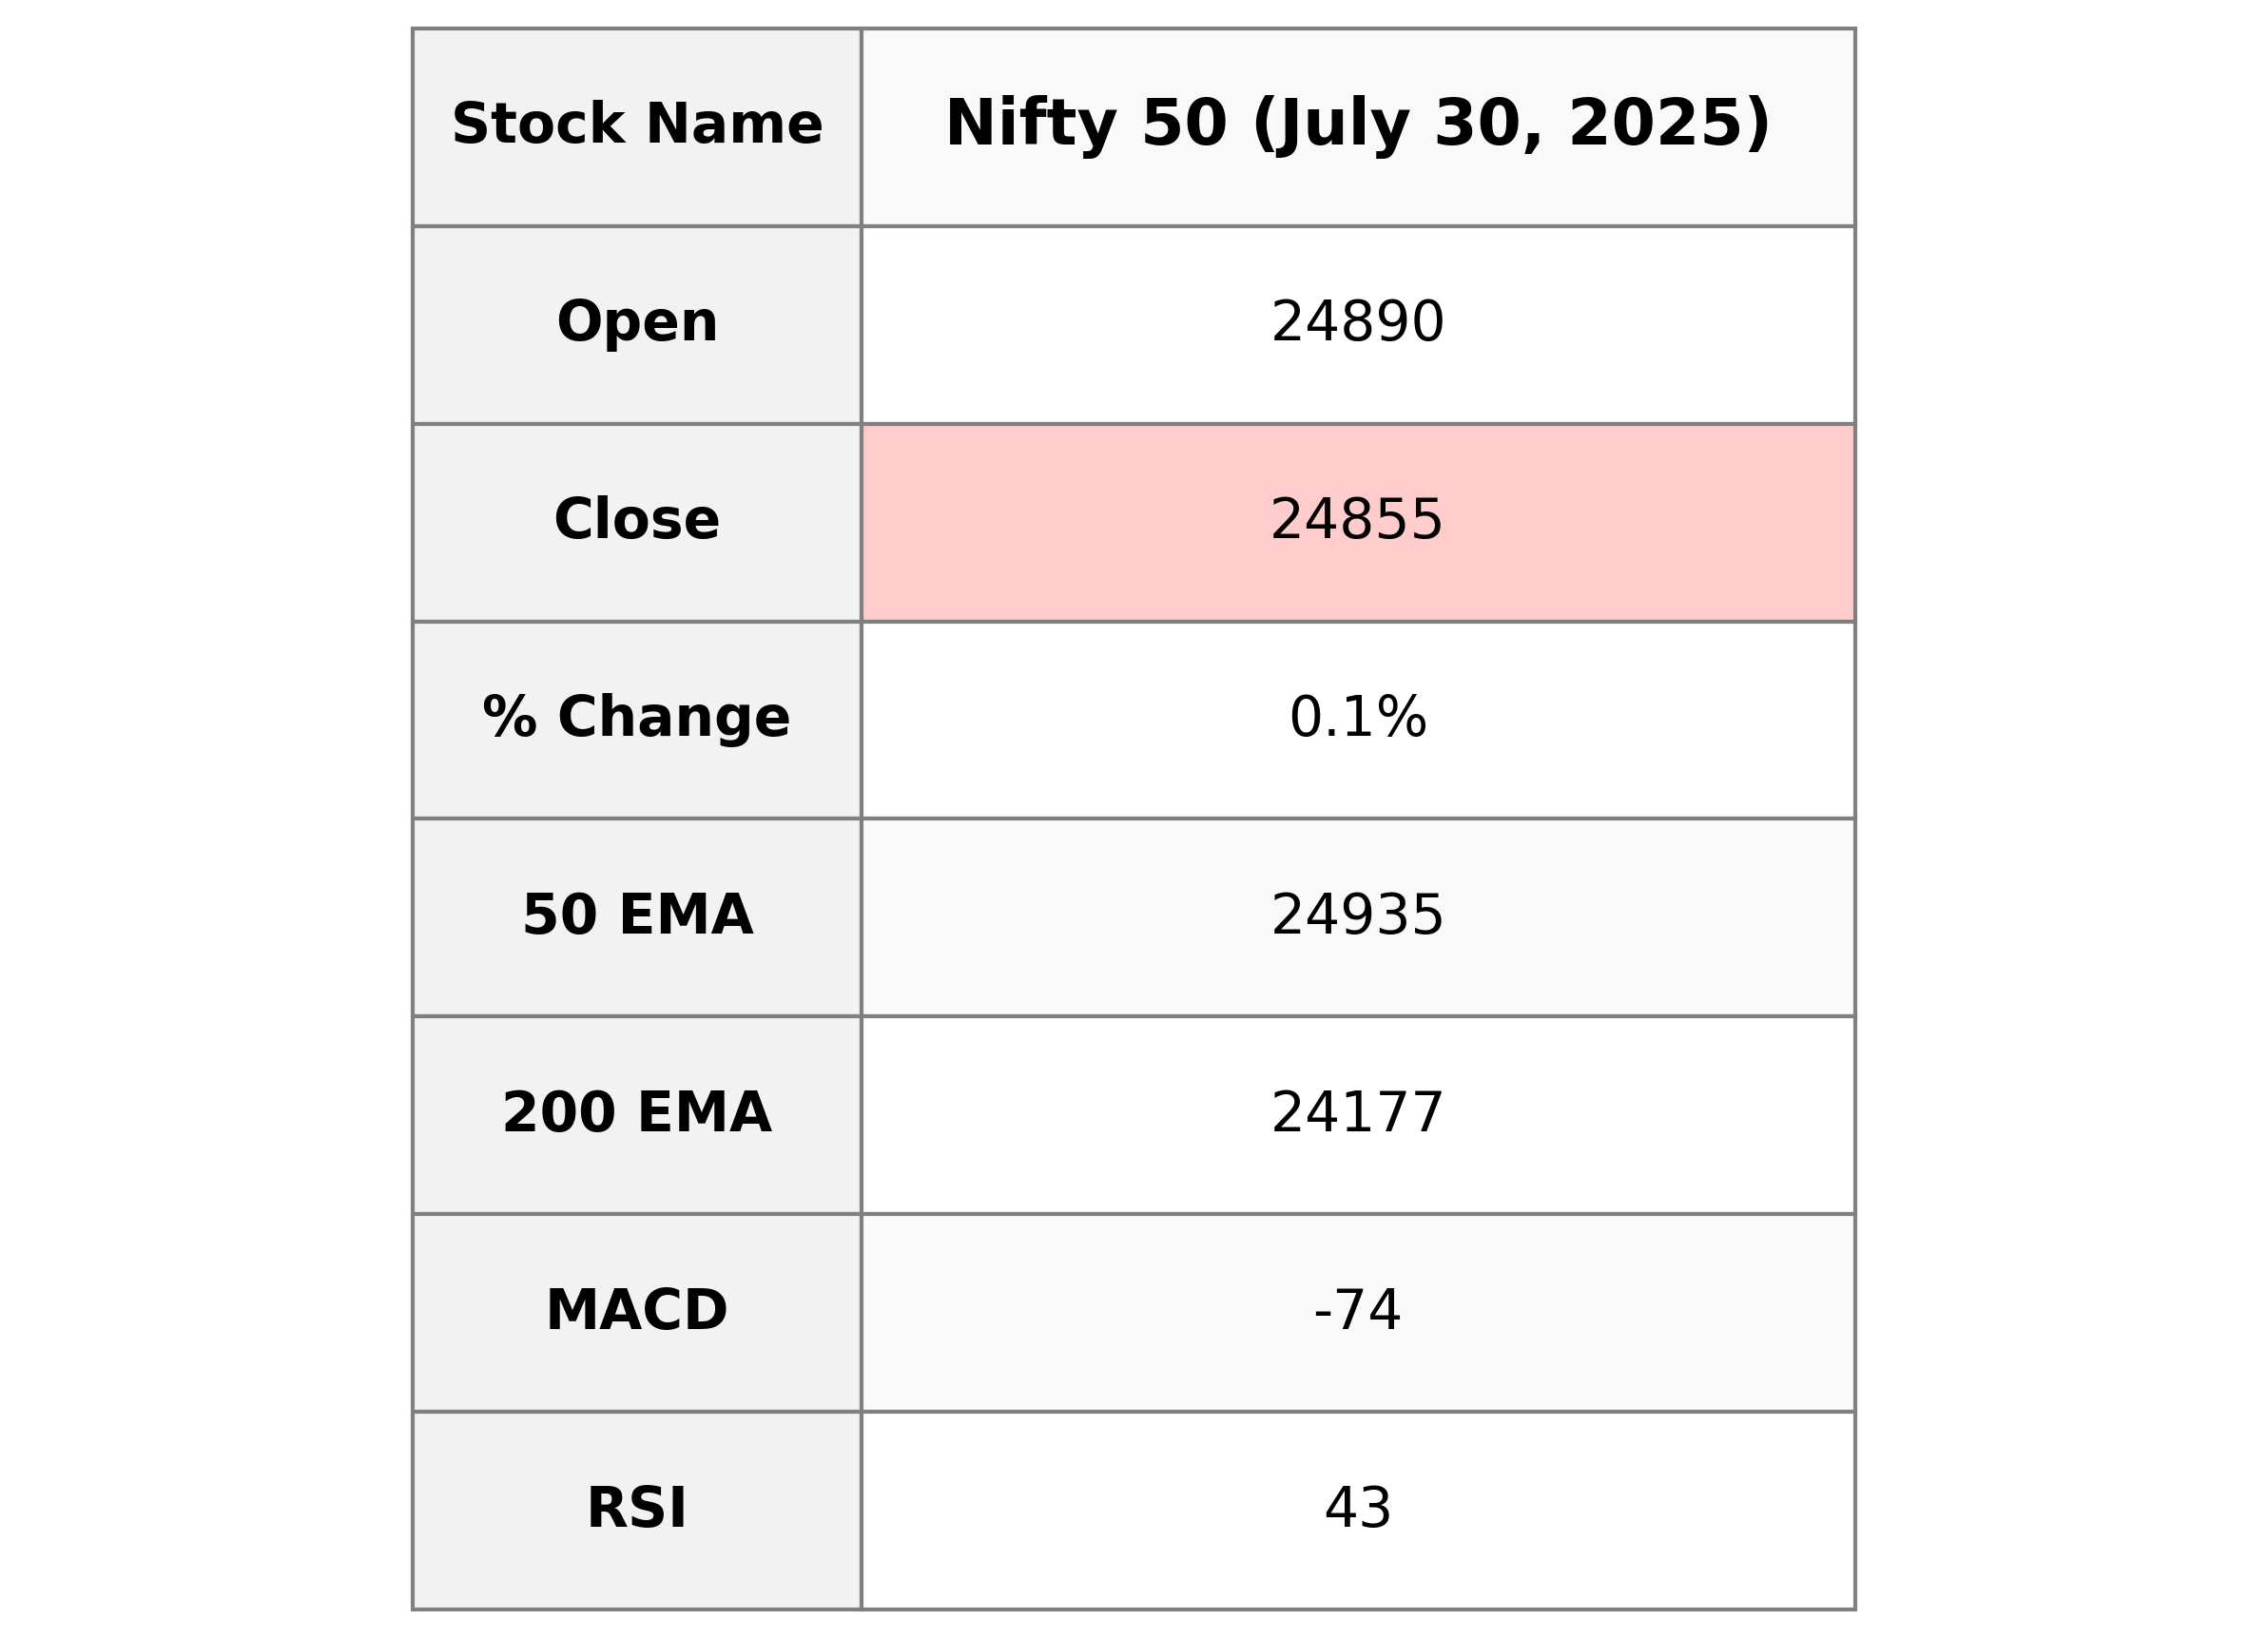
The Nifty 50 opened at 24,890.40 and closed at 24,855.05, with a slight increase of 0.14% compared to the previous close of 24,821.10. The day's trading showed a high of 24,902.30 and a low of 24,771.95. The Relative Strength Index (RSI) suggests a neutral momentum at 43.25, whereas the MACD indicates a bearish trend with a value of -74.14.
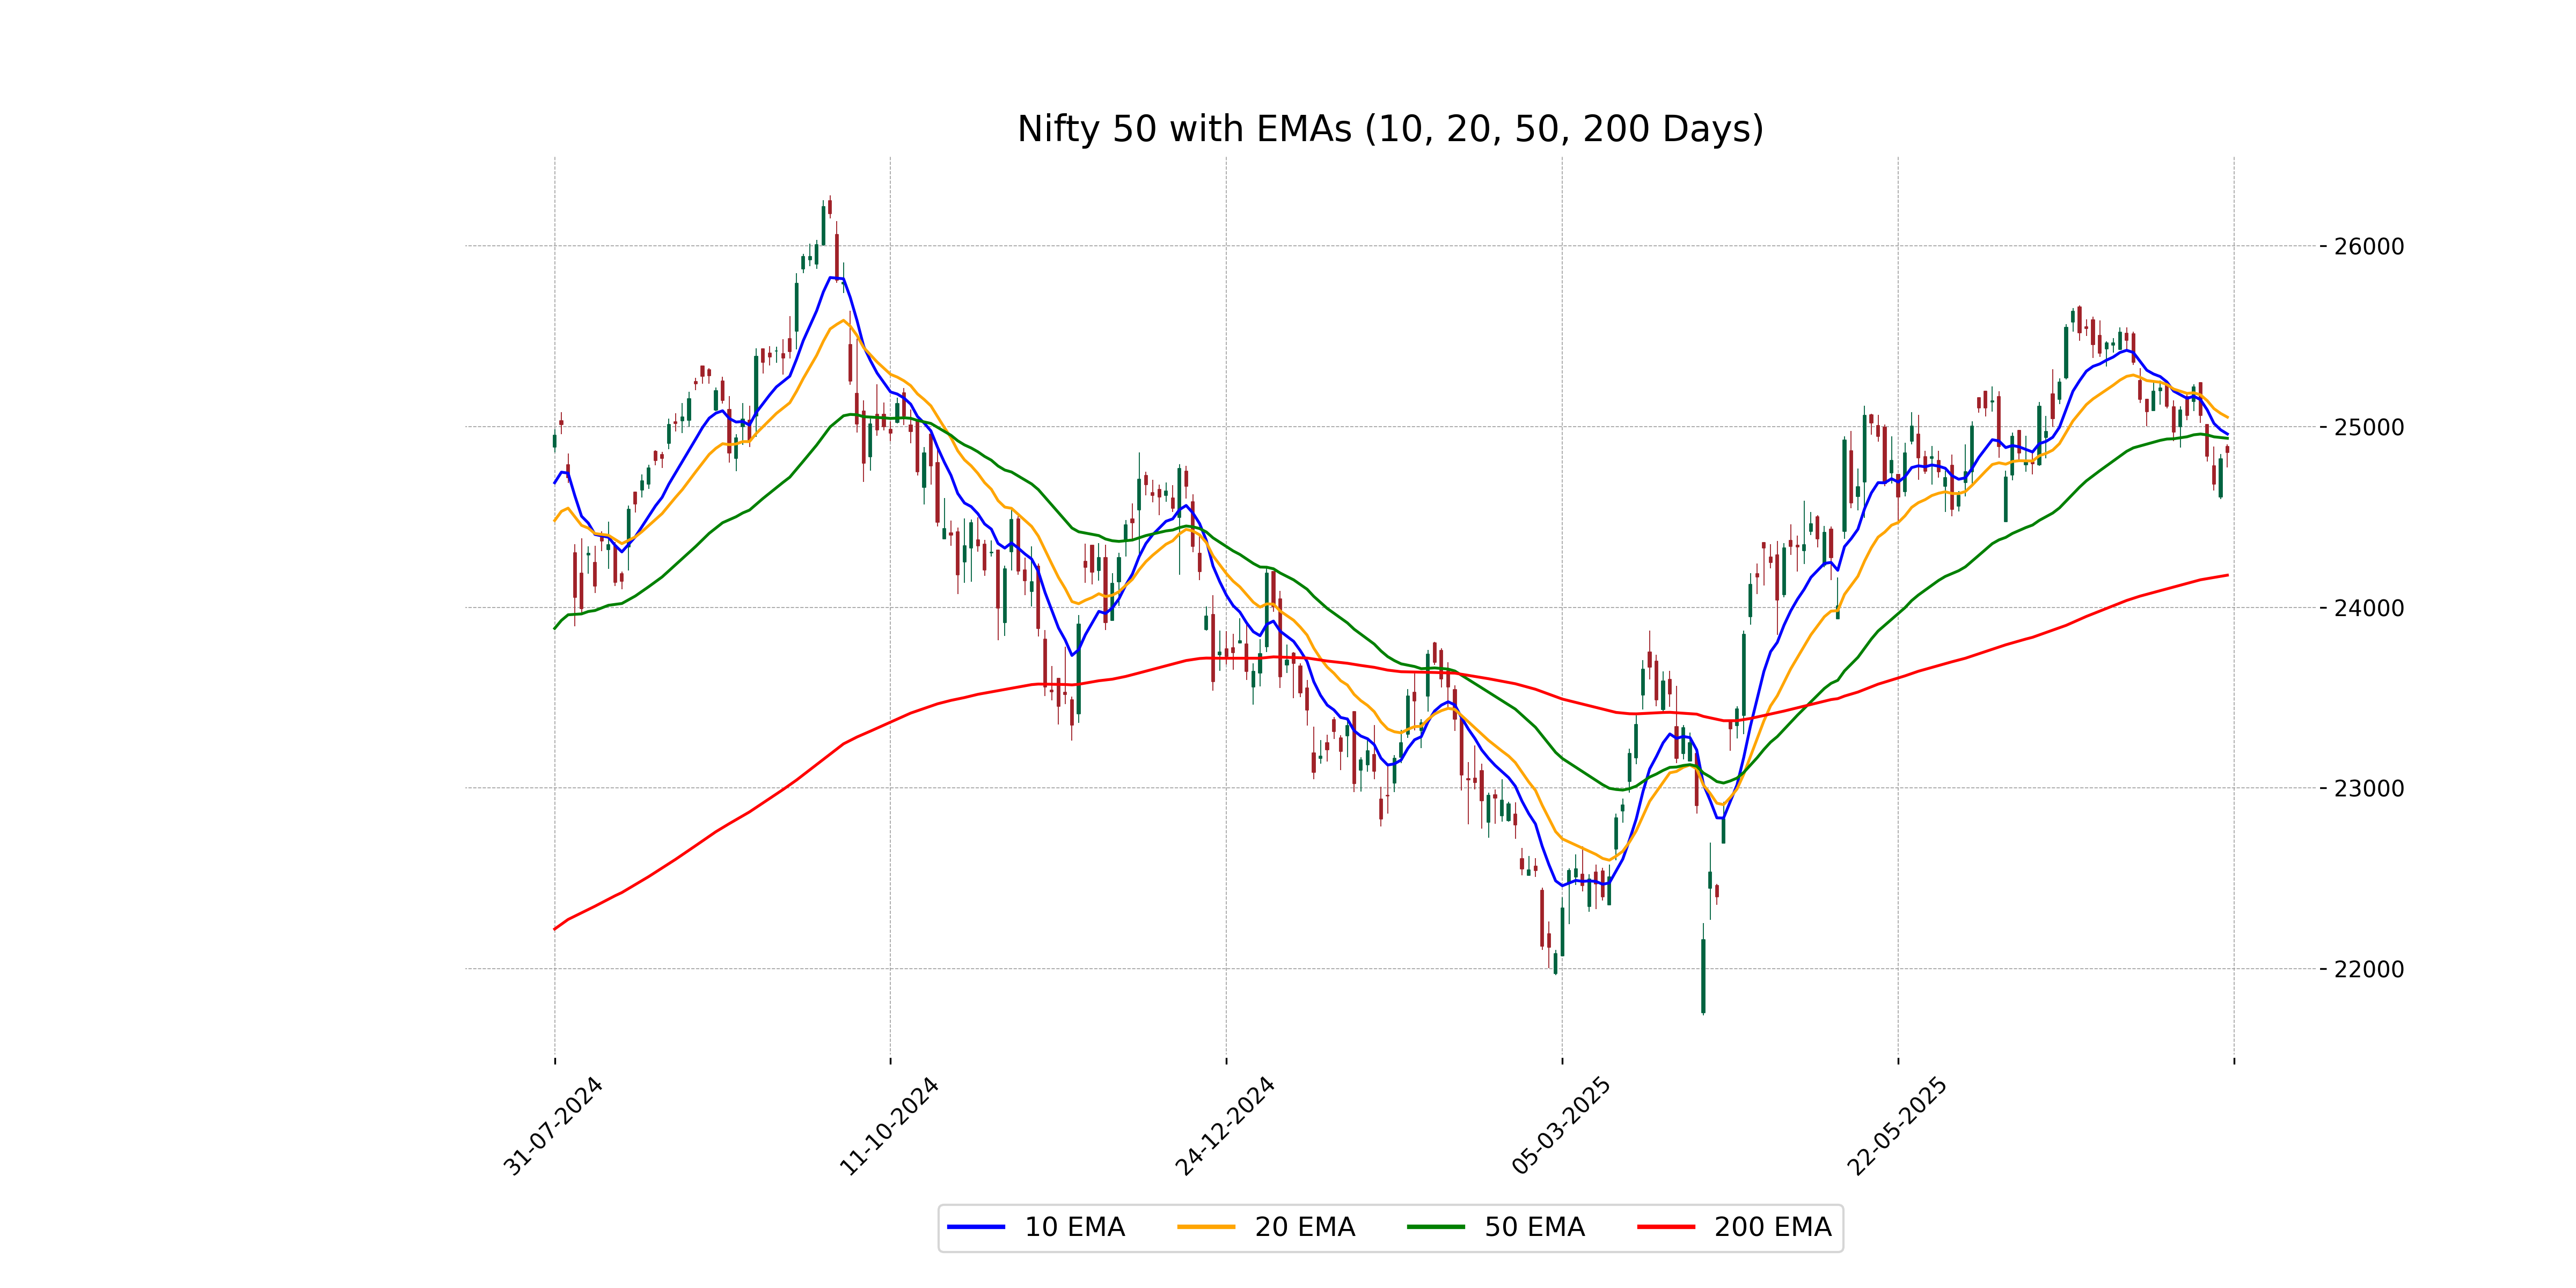
Relationship with Key Moving Averages
The Nifty 50's closing price of 24,855.05 is currently below its key moving averages, including the 50-day EMA of 24,934.71, the 10-day EMA of 24,958.33, and the 20-day EMA of 25,051.48. This suggests a bearish short-term trend as the RSI is also relatively low at 43.25.
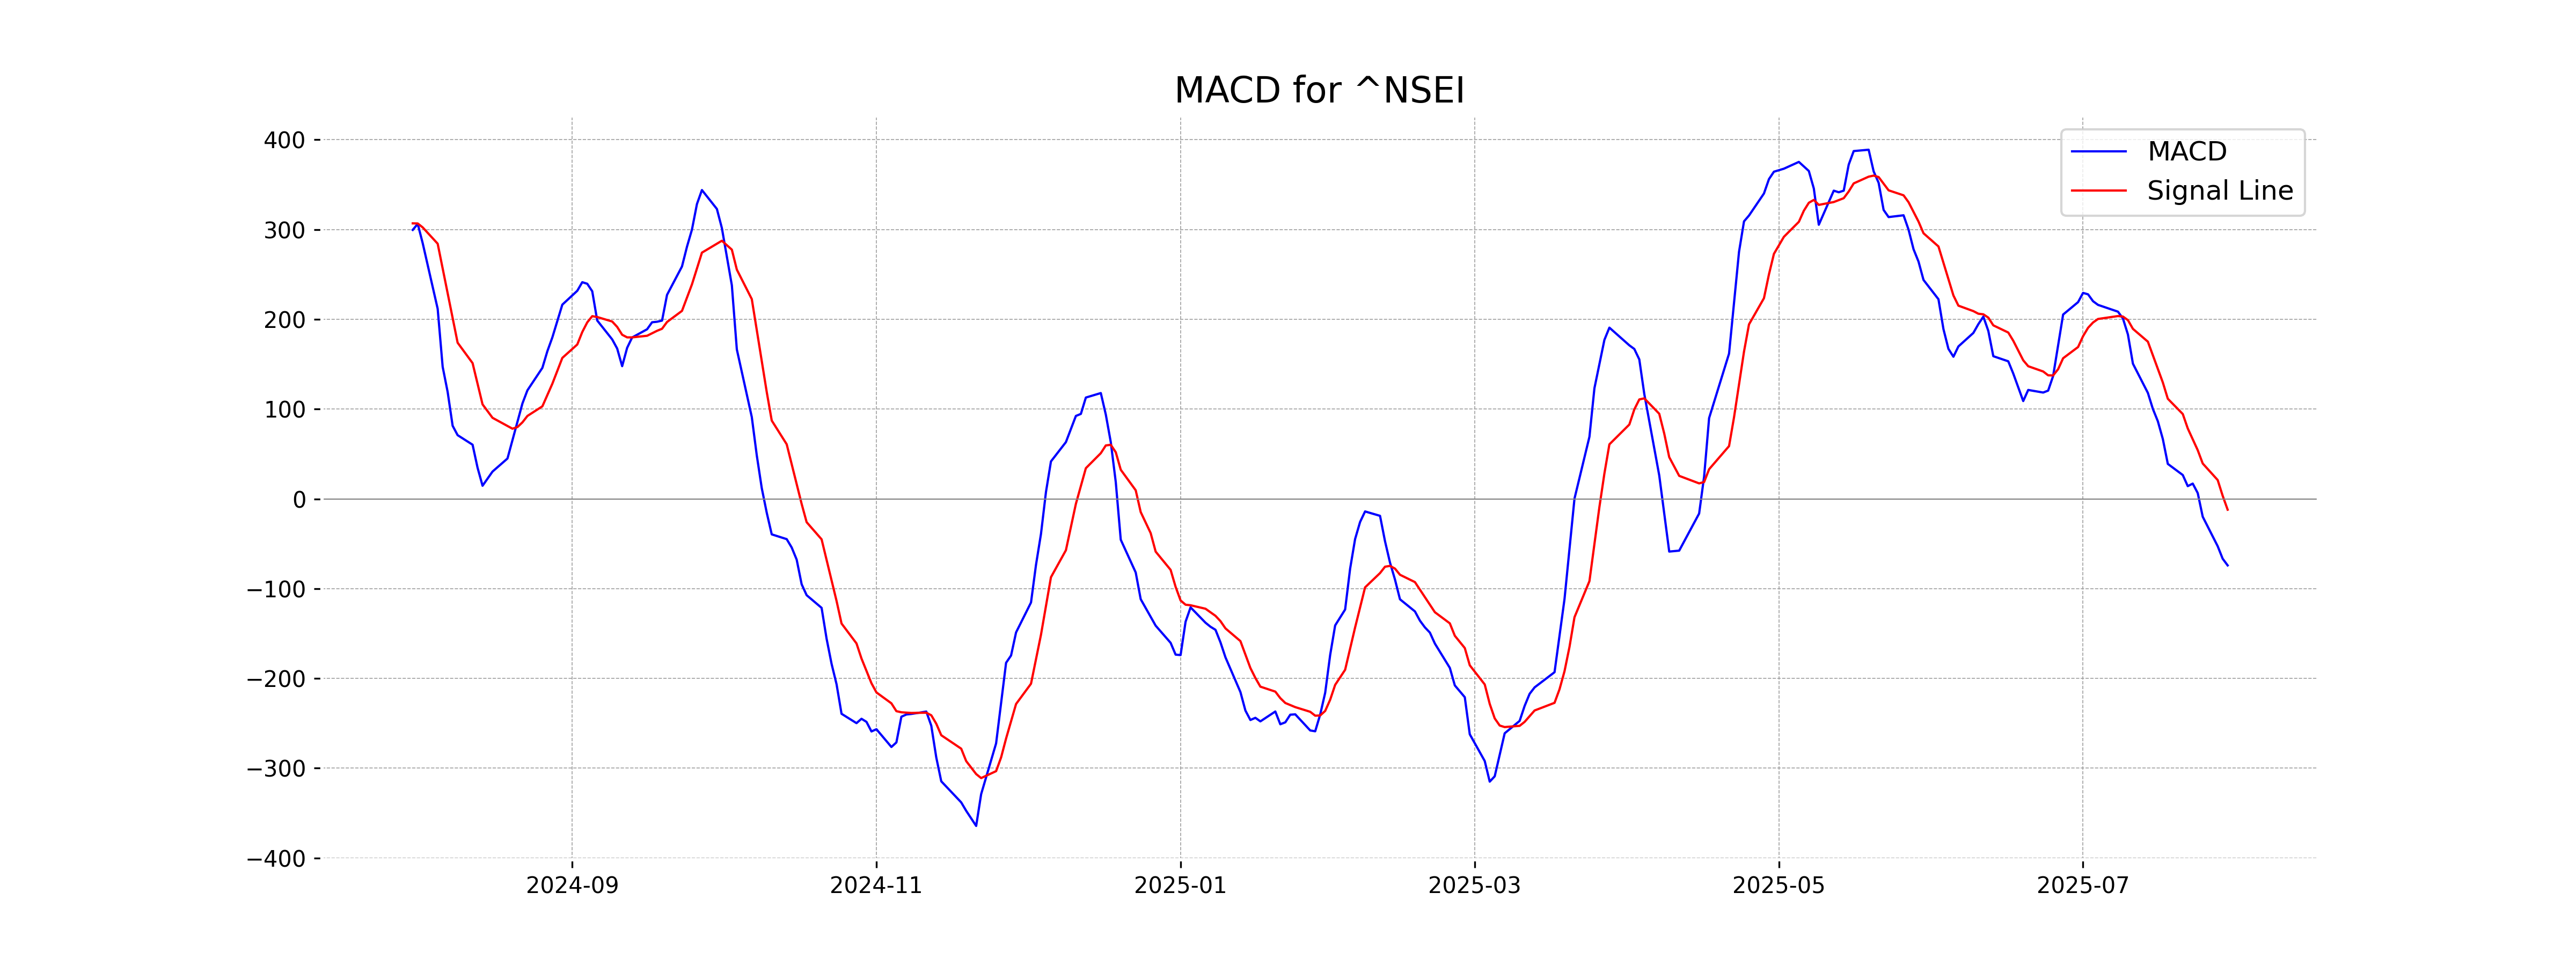
Moving Averages Trend (MACD)
The MACD for Nifty 50 is at -74.14, which is below the MACD Signal line at -12.09, indicating a bearish trend. This suggests that momentum is currently favoring the downside, as the MACD is diverging negatively from the Signal line.
RSI Analysis
The Relative Strength Index (RSI) for Nifty 50 is currently at 43.25, which suggests it is in the neutral zone. An RSI below 50 indicates that the stock has experienced more selling pressure than buying pressure, but it is not yet in oversold territory. This level implies potential consolidation or a possible downturn if selling continues.
Up Next

Global stock market indices: How the world markets performed today - 30 July 2025

Centre plans to borrow Rs 8.20 lakh cr from market in first half of FY27

Reliance denies buying Iranian oil amid US sanctions waiver

Premium petrol price up Rs 2, industrial diesel up Rs 22; no change in normal petrol, diesel rates

India's GDP expected to register over 8 pc growth in Sep-Dec: Report

Govt announces seven measures to help boost exports

More videos

RBI keeps interest rates on hold after US trade deal boosts outlook

RBI proposes to compensate customers up to Rs 25,000 loss due to fraud

RBI raises GDP growth projection of Q1, Q2 of FY27

RBI pauses rate cuts, retains interest rate at 5.25 pc

Rupee jumps 122 paise to close at 90.27 against US dollar on India-US trade deal

Stock markets cheer India-US trade deal: Sensex, Nifty surge 2.5 pc

UPI transactions hit record high of Rs 230 lakh crore in 2025-26 till Dec: Govt

Explained: India-US trade deal, tariffs and trade benefits

Trade deal with US adds momentum to India's growth ambition: Industry leaders

Rupee jumps 119 paise to 90.30 against the US dollar on India-US trade deal