


Highlights
- Dow and S&P 500 show mild weakness
- FTSE and DAX indicate short-term bullish trends
- NASDAQ RSI nears overbought; MACD softens
Latest news

Haier Launches HQLED P7 Pro Series TVs With Google Gemini, 50W Audio And AI Picture Enhancements

Nothing's Latest Pokémon Teasers Hint At New Hardware, RCB Collaboration May Also Be In The Works

OnePlus N6 Set To Debut With Massive 8,000mAh Battery And Long-Term Performance Focus

Roblox Introduces Age-Based Accounts for Younger Users, Expands Parental Controls Globally

IIFL Capital Launches Algo Marketplace with Over 100 Ready-Made Strategies

LUMIQ Raises INR 50 Crore Pre-Series B to Become the AI Decision Layer for Financial Services

Tay Keith, producer behind Travis Scott's 'Sicko Mode' dies at 29

GenAI could lift realty sales velocity by up to 50%, speed up launches by 30%: Report
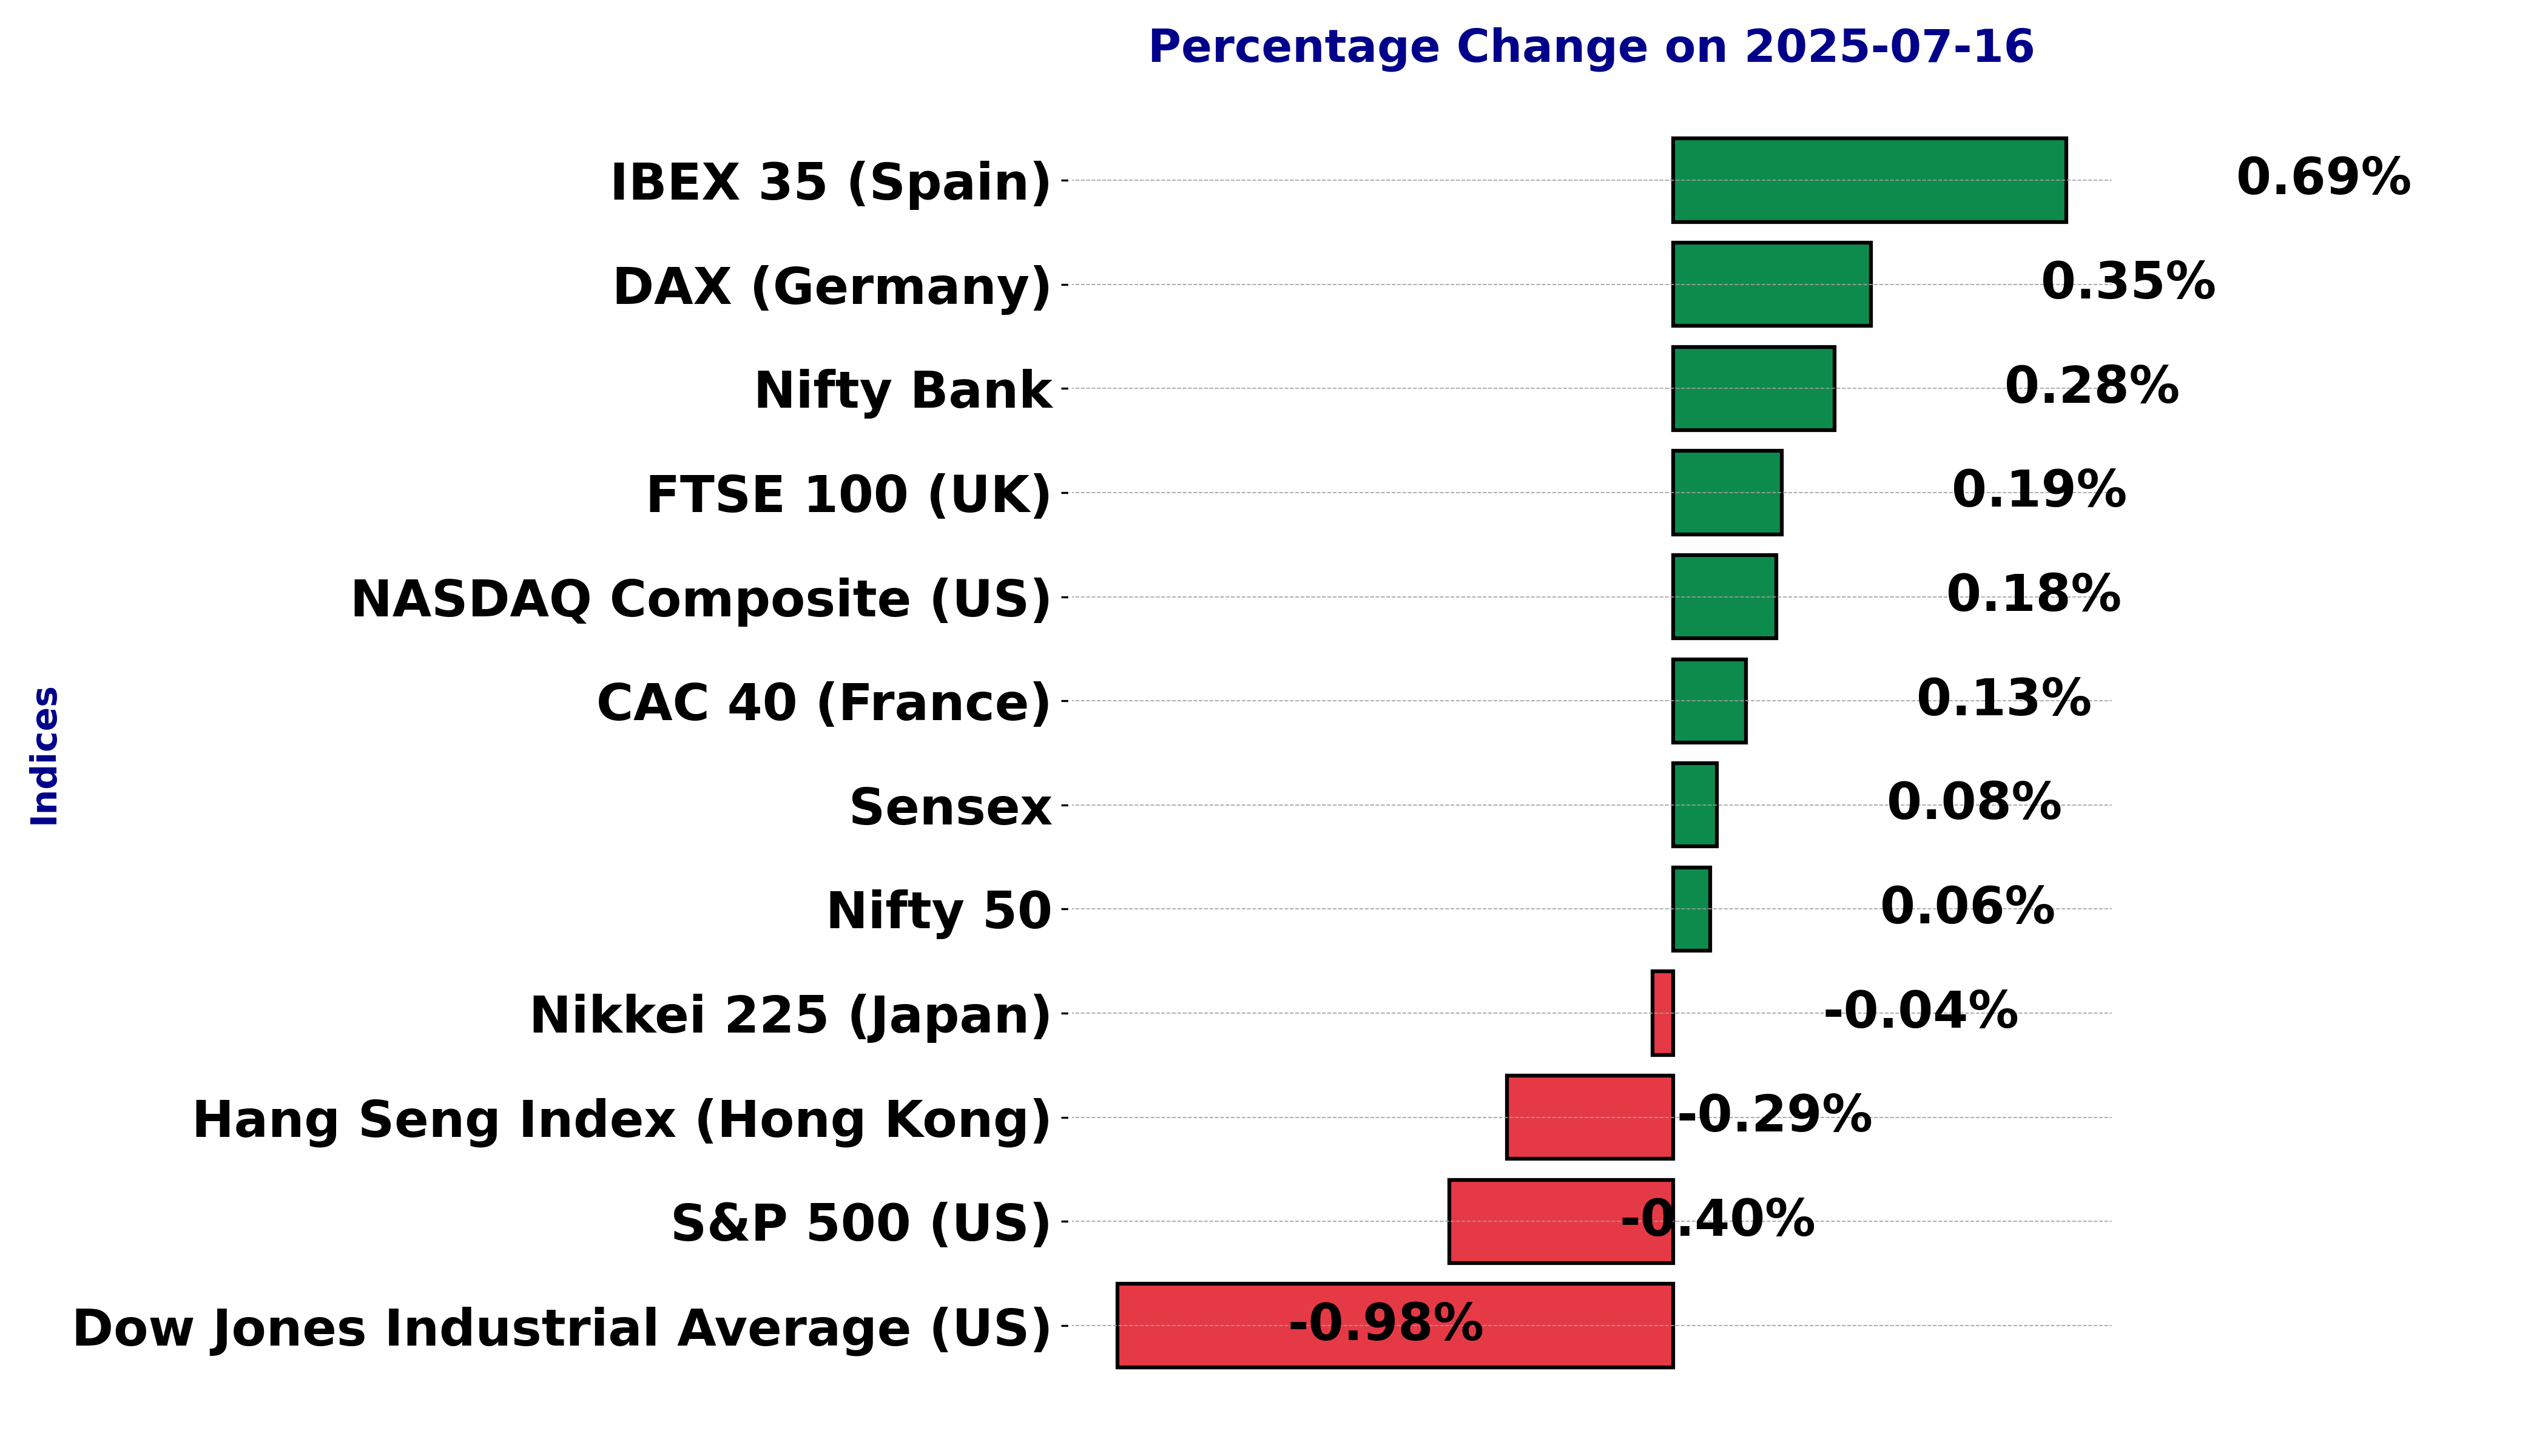
Global stock market indices: How the world markets performed today - 16 July 2025


The international stock market indices showed varied performances on July 16, 2025, reflecting the economic sentiment across different regions.
In this article, we analyze the performance of key global indices including the S&P 500, Dow Jones Industrial Average, NASDAQ Composite, FTSE 100, DAX, CAC 40, IBEX 35, Nikkei 225, Hang Seng, Nifty 50, and BSE Sensex.
Analysis for Sensex - July 16, 2025
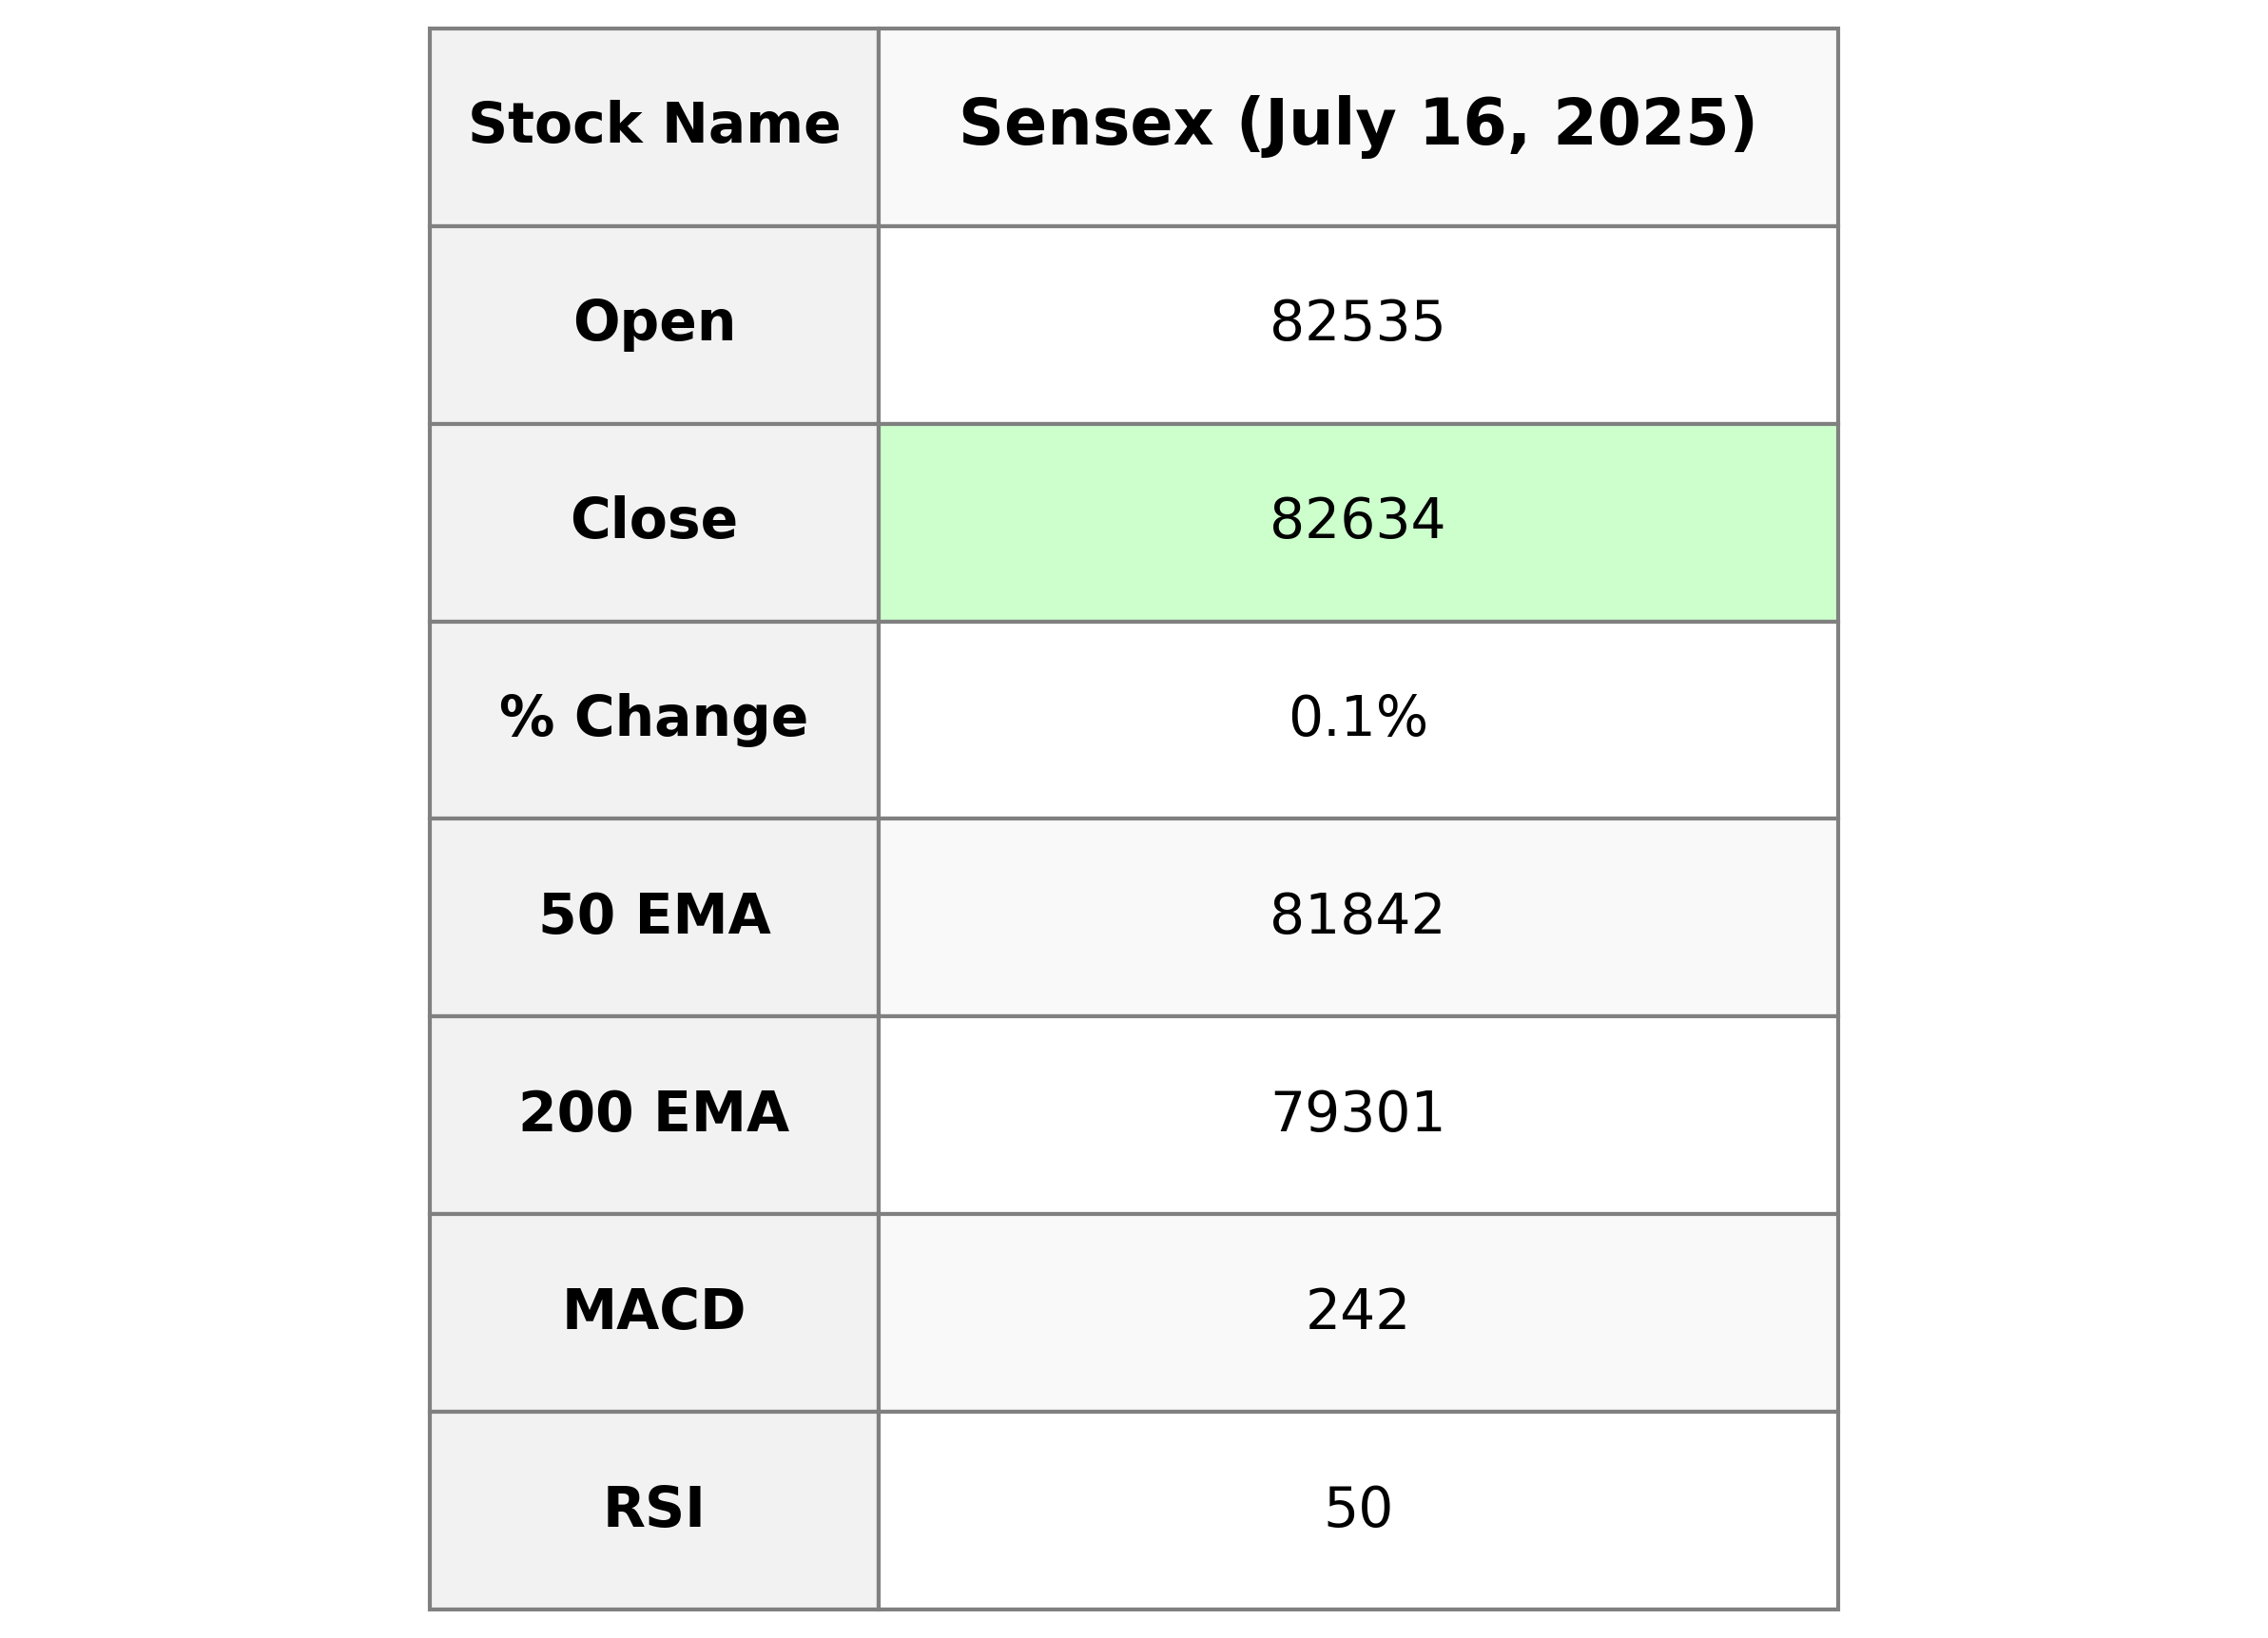
The Sensex opened at 82,534.66, reaching a high of 82,784.75 and a low of 82,342.94, before closing at 82,634.48. The index experienced a slight increase, with a percentage change of 0.08% and a points change of 63.57. The RSI indicates neutral market momentum at 50.25, while the MACD suggests a bearish divergence.
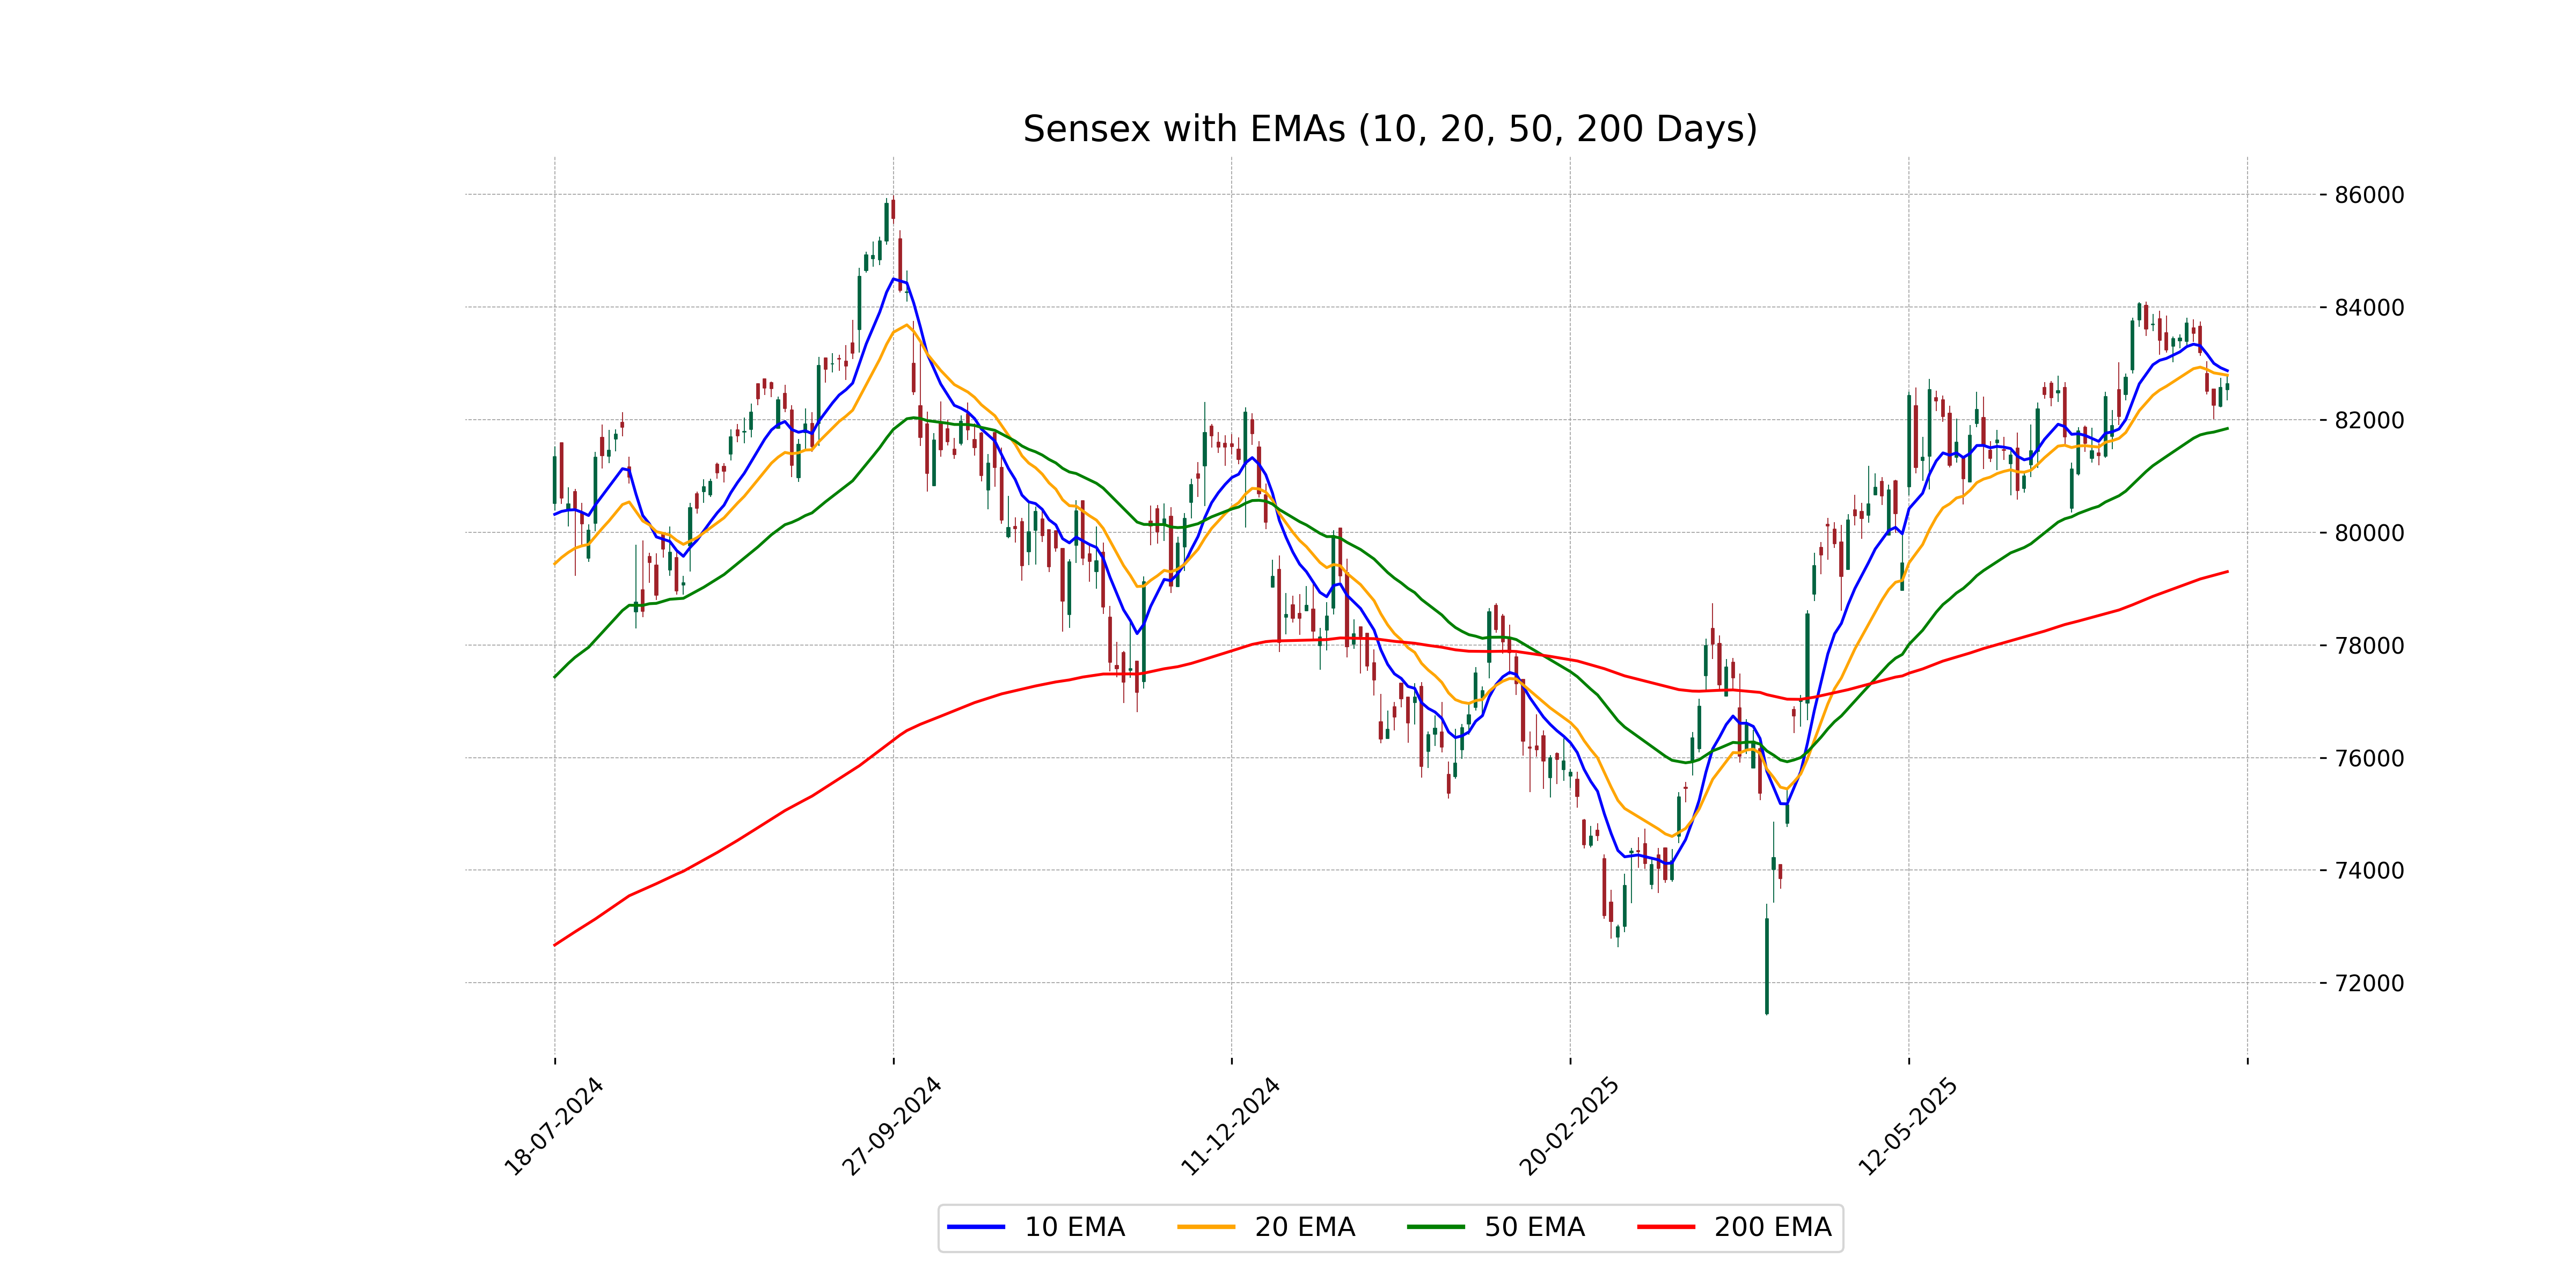
Relationship with Key Moving Averages
The closing price of Sensex at 82,634.48 is above the 50 EMA at 81,841.85 and the 200 EMA at 79,300.58, indicating a potential longer-term uptrend. However, it is slightly below the 10 EMA at 82,868.97 and near the 20 EMA at 82,788.79, suggesting some short-term resistance or consolidation.
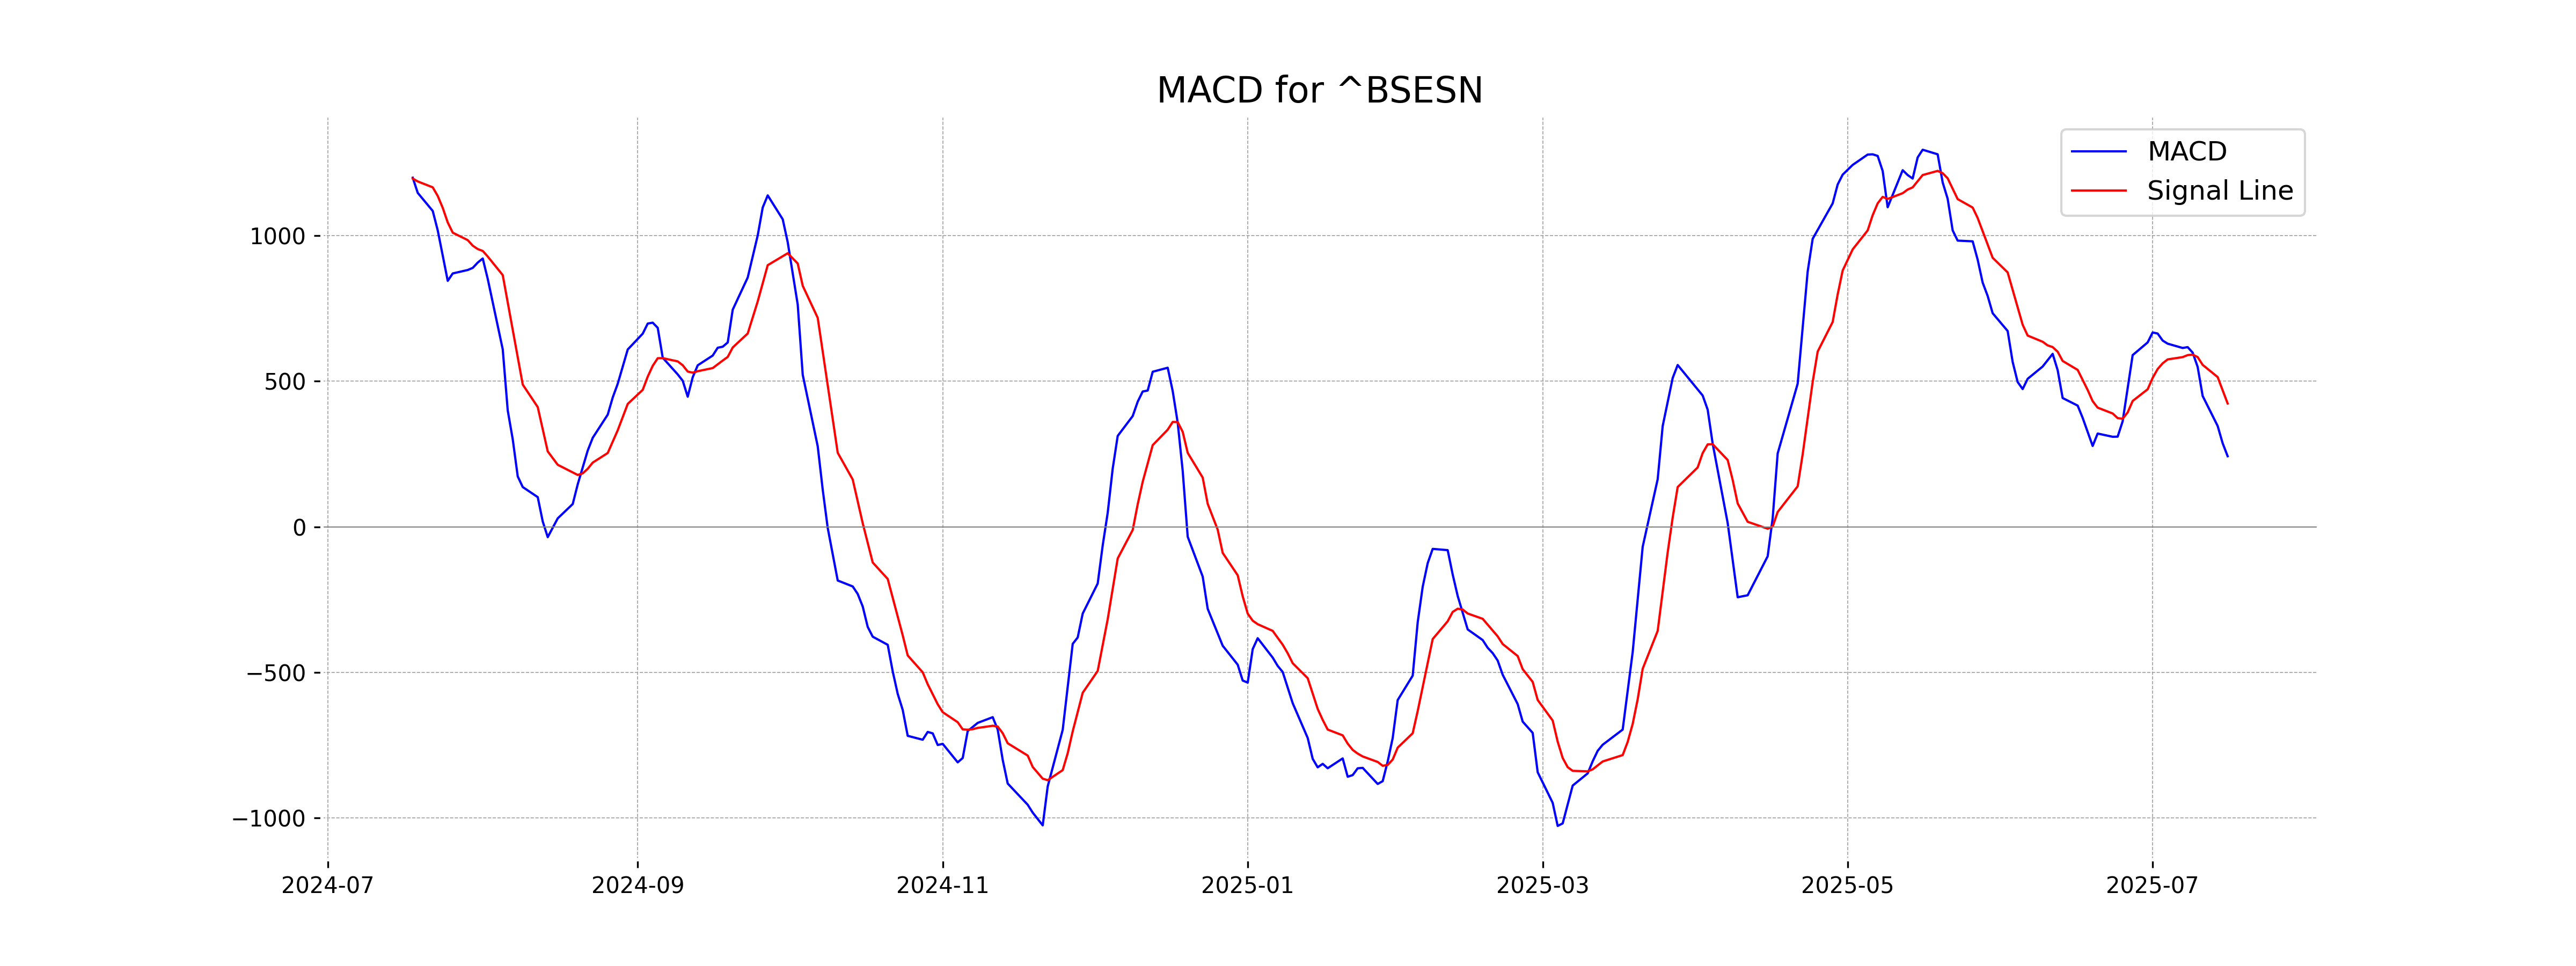
Moving Averages Trend (MACD)
Based on the provided stock data for Sensex, the MACD value is 242.258, which is below the MACD Signal of 423.377. This indicates a bearish signal, suggesting potential downward momentum in the market.
RSI Analysis
Based on the stock data for Sensex, the Relative Strength Index (RSI) is 50.25, indicating a neutral market condition. This value suggests that there is no significant momentum or trend, as it is near the midpoint of the typical RSI range of 30 to 70.
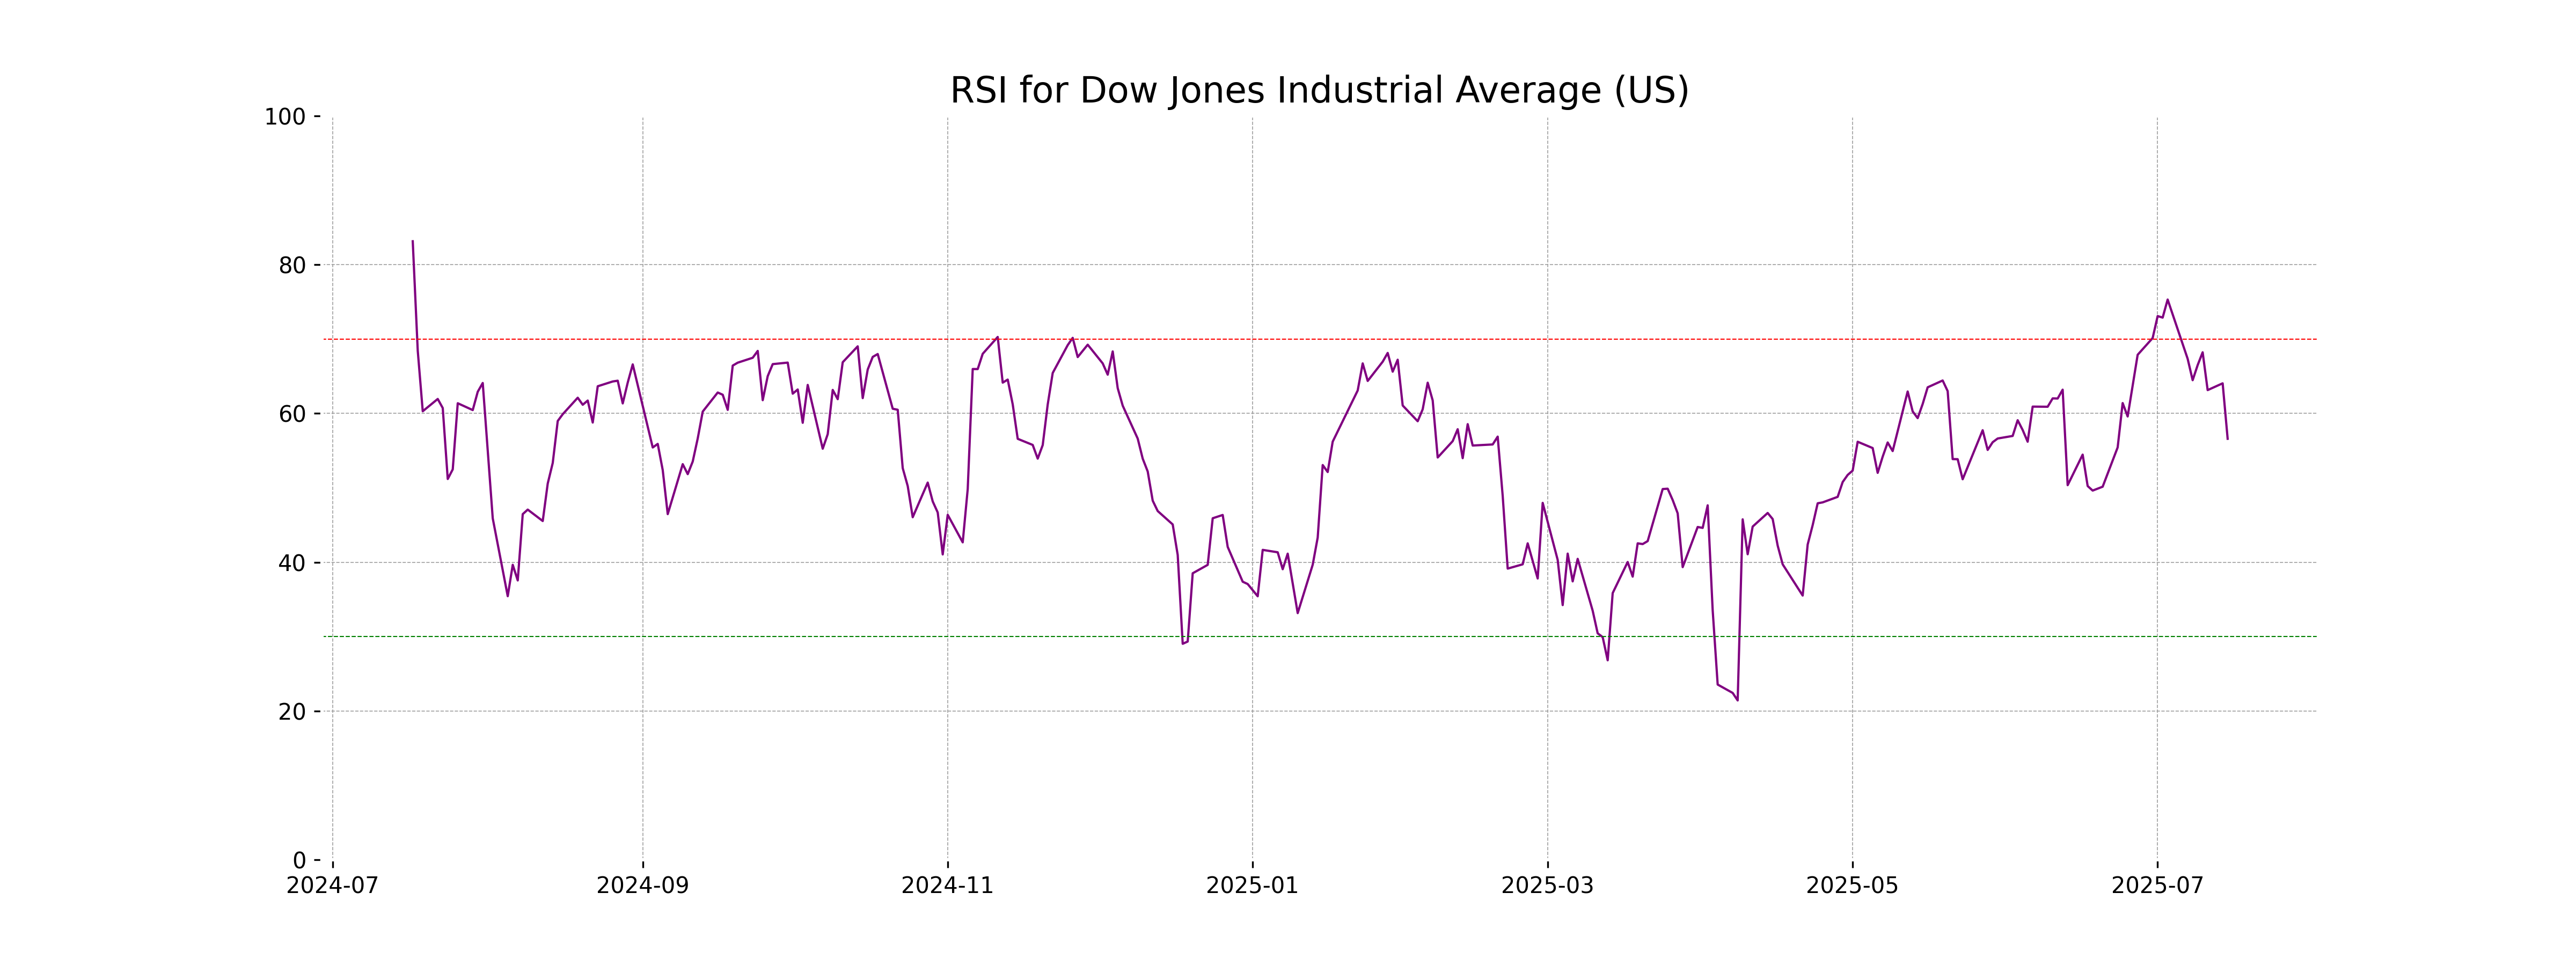
Analysis for Dow Jones Industrial Average (US) - July 16, 2025
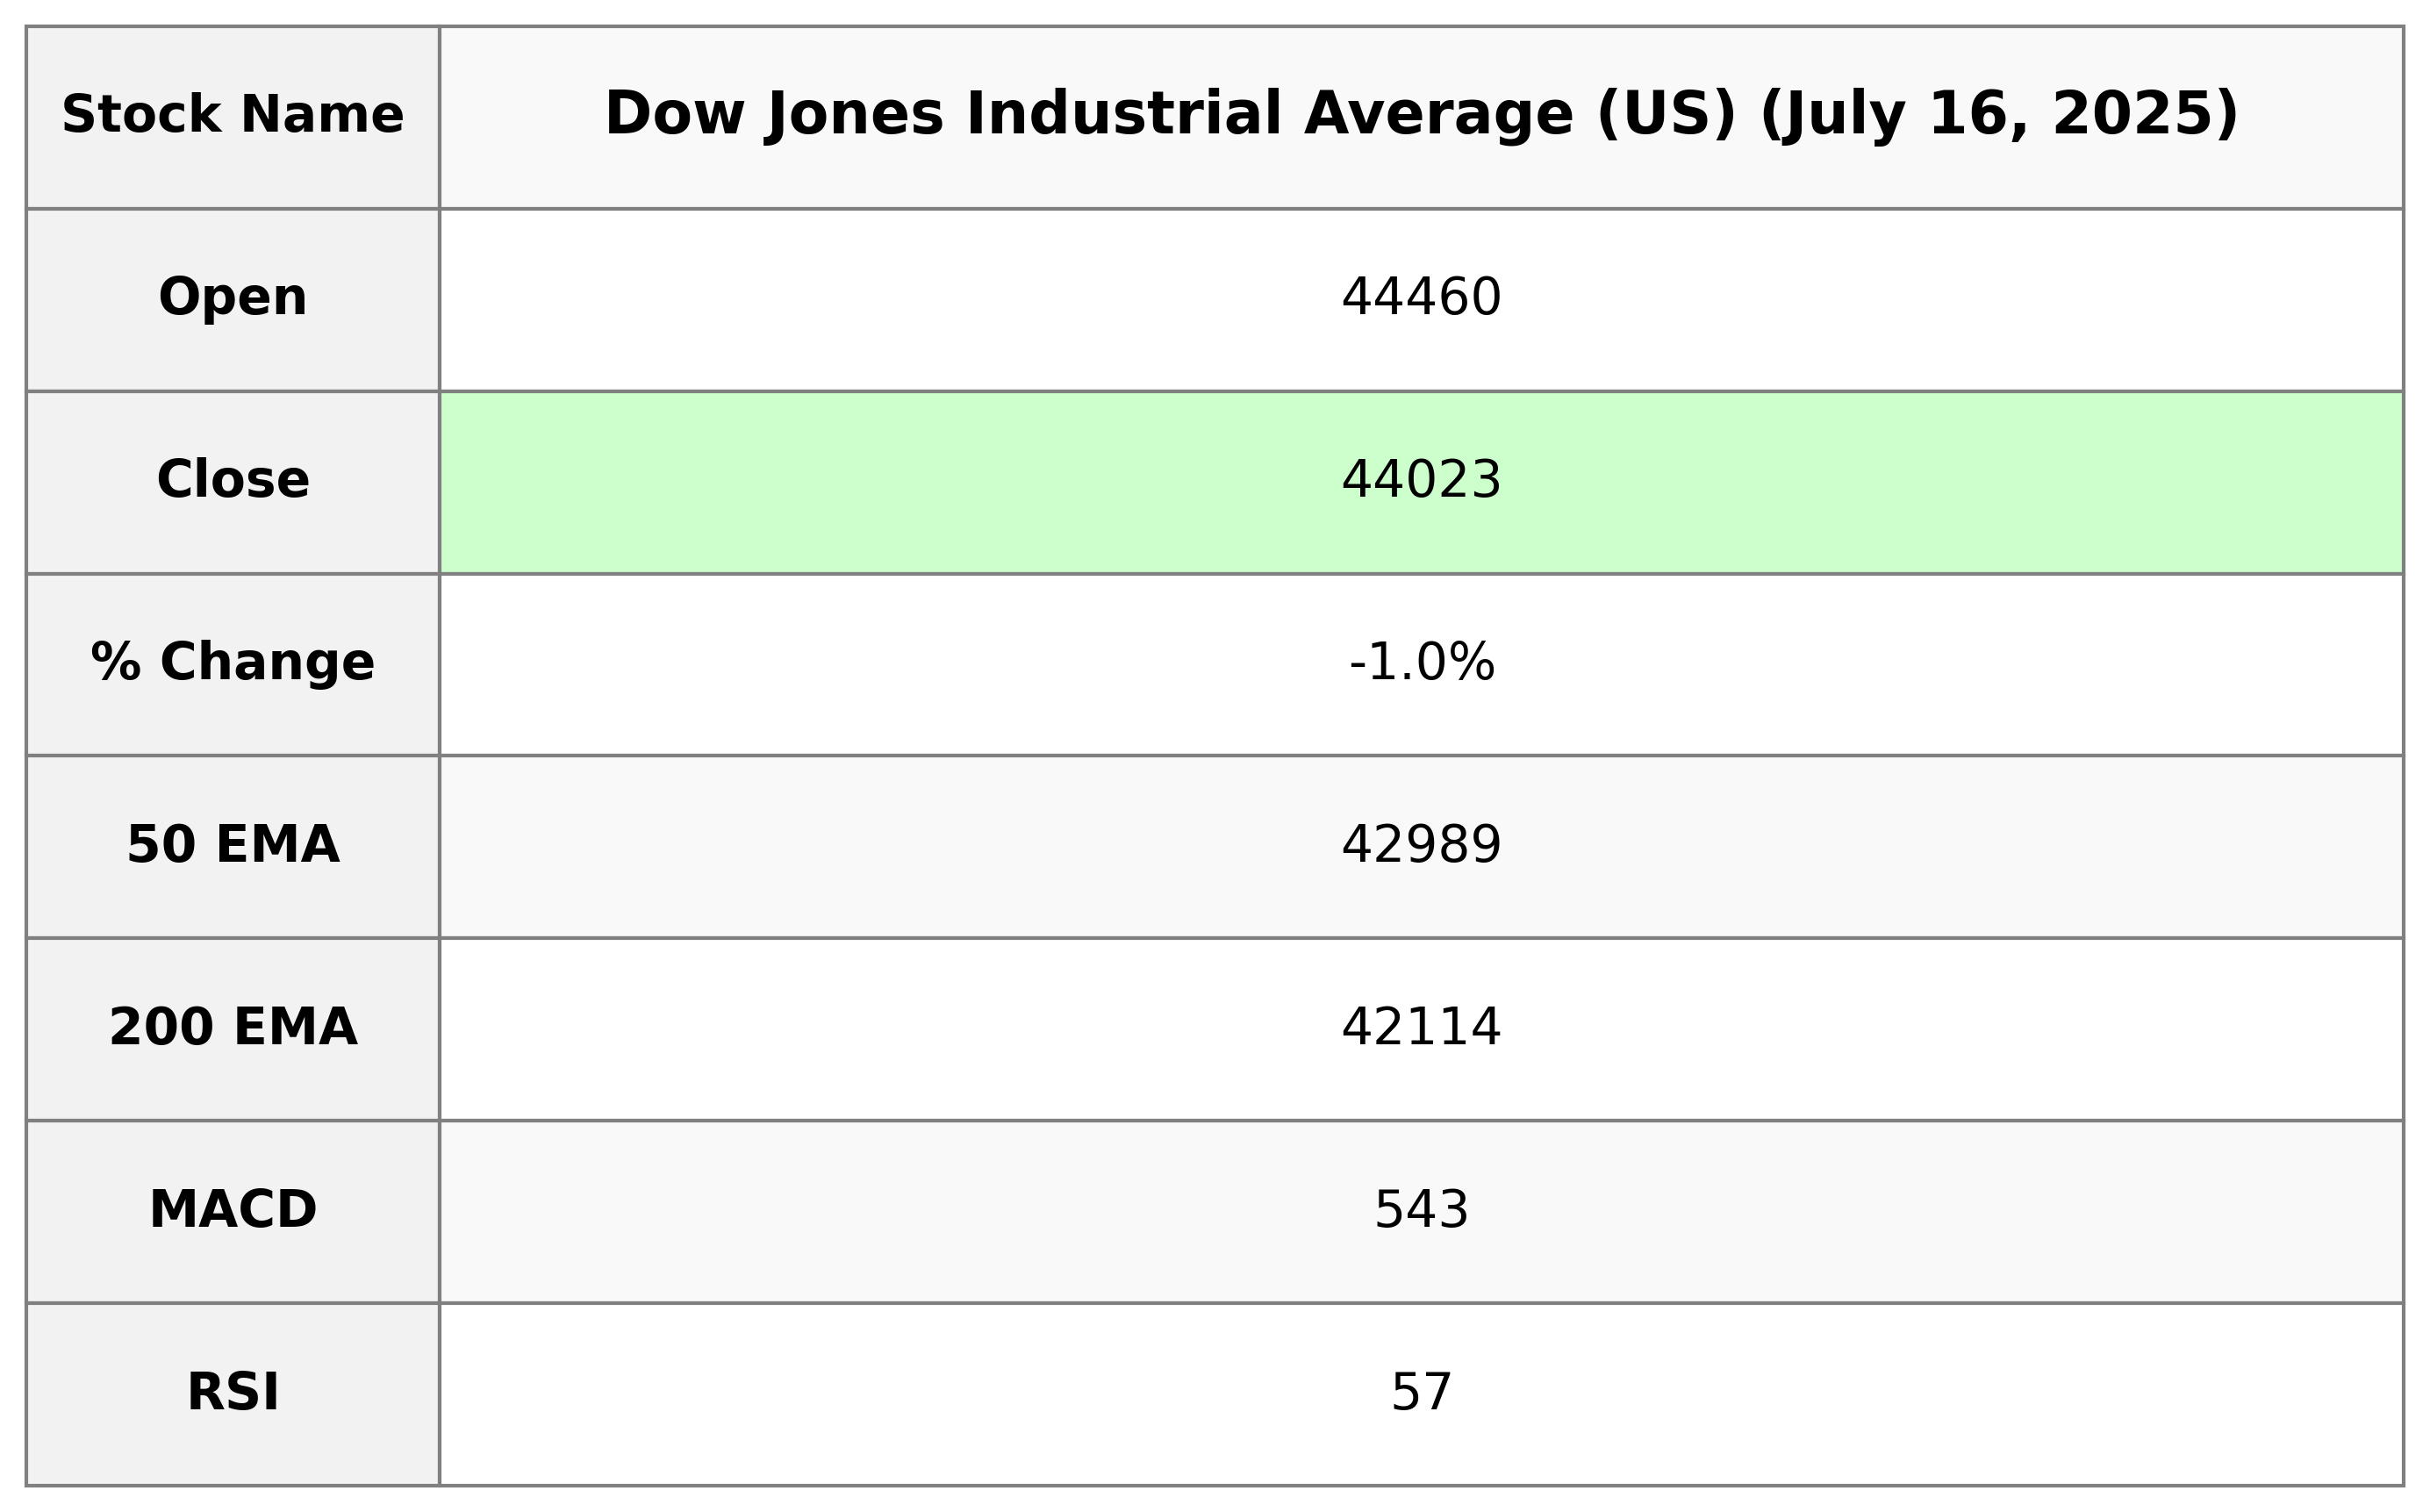
The Dow Jones Industrial Average opened at 44,459.84 and closed lower at 44,023.29, marking a decrease of 0.98% with a loss of 436.36 points. The RSI stands at 56.59, suggesting moderately strong momentum, while the MACD is slightly below its signal line, indicating a potential bearish trend.
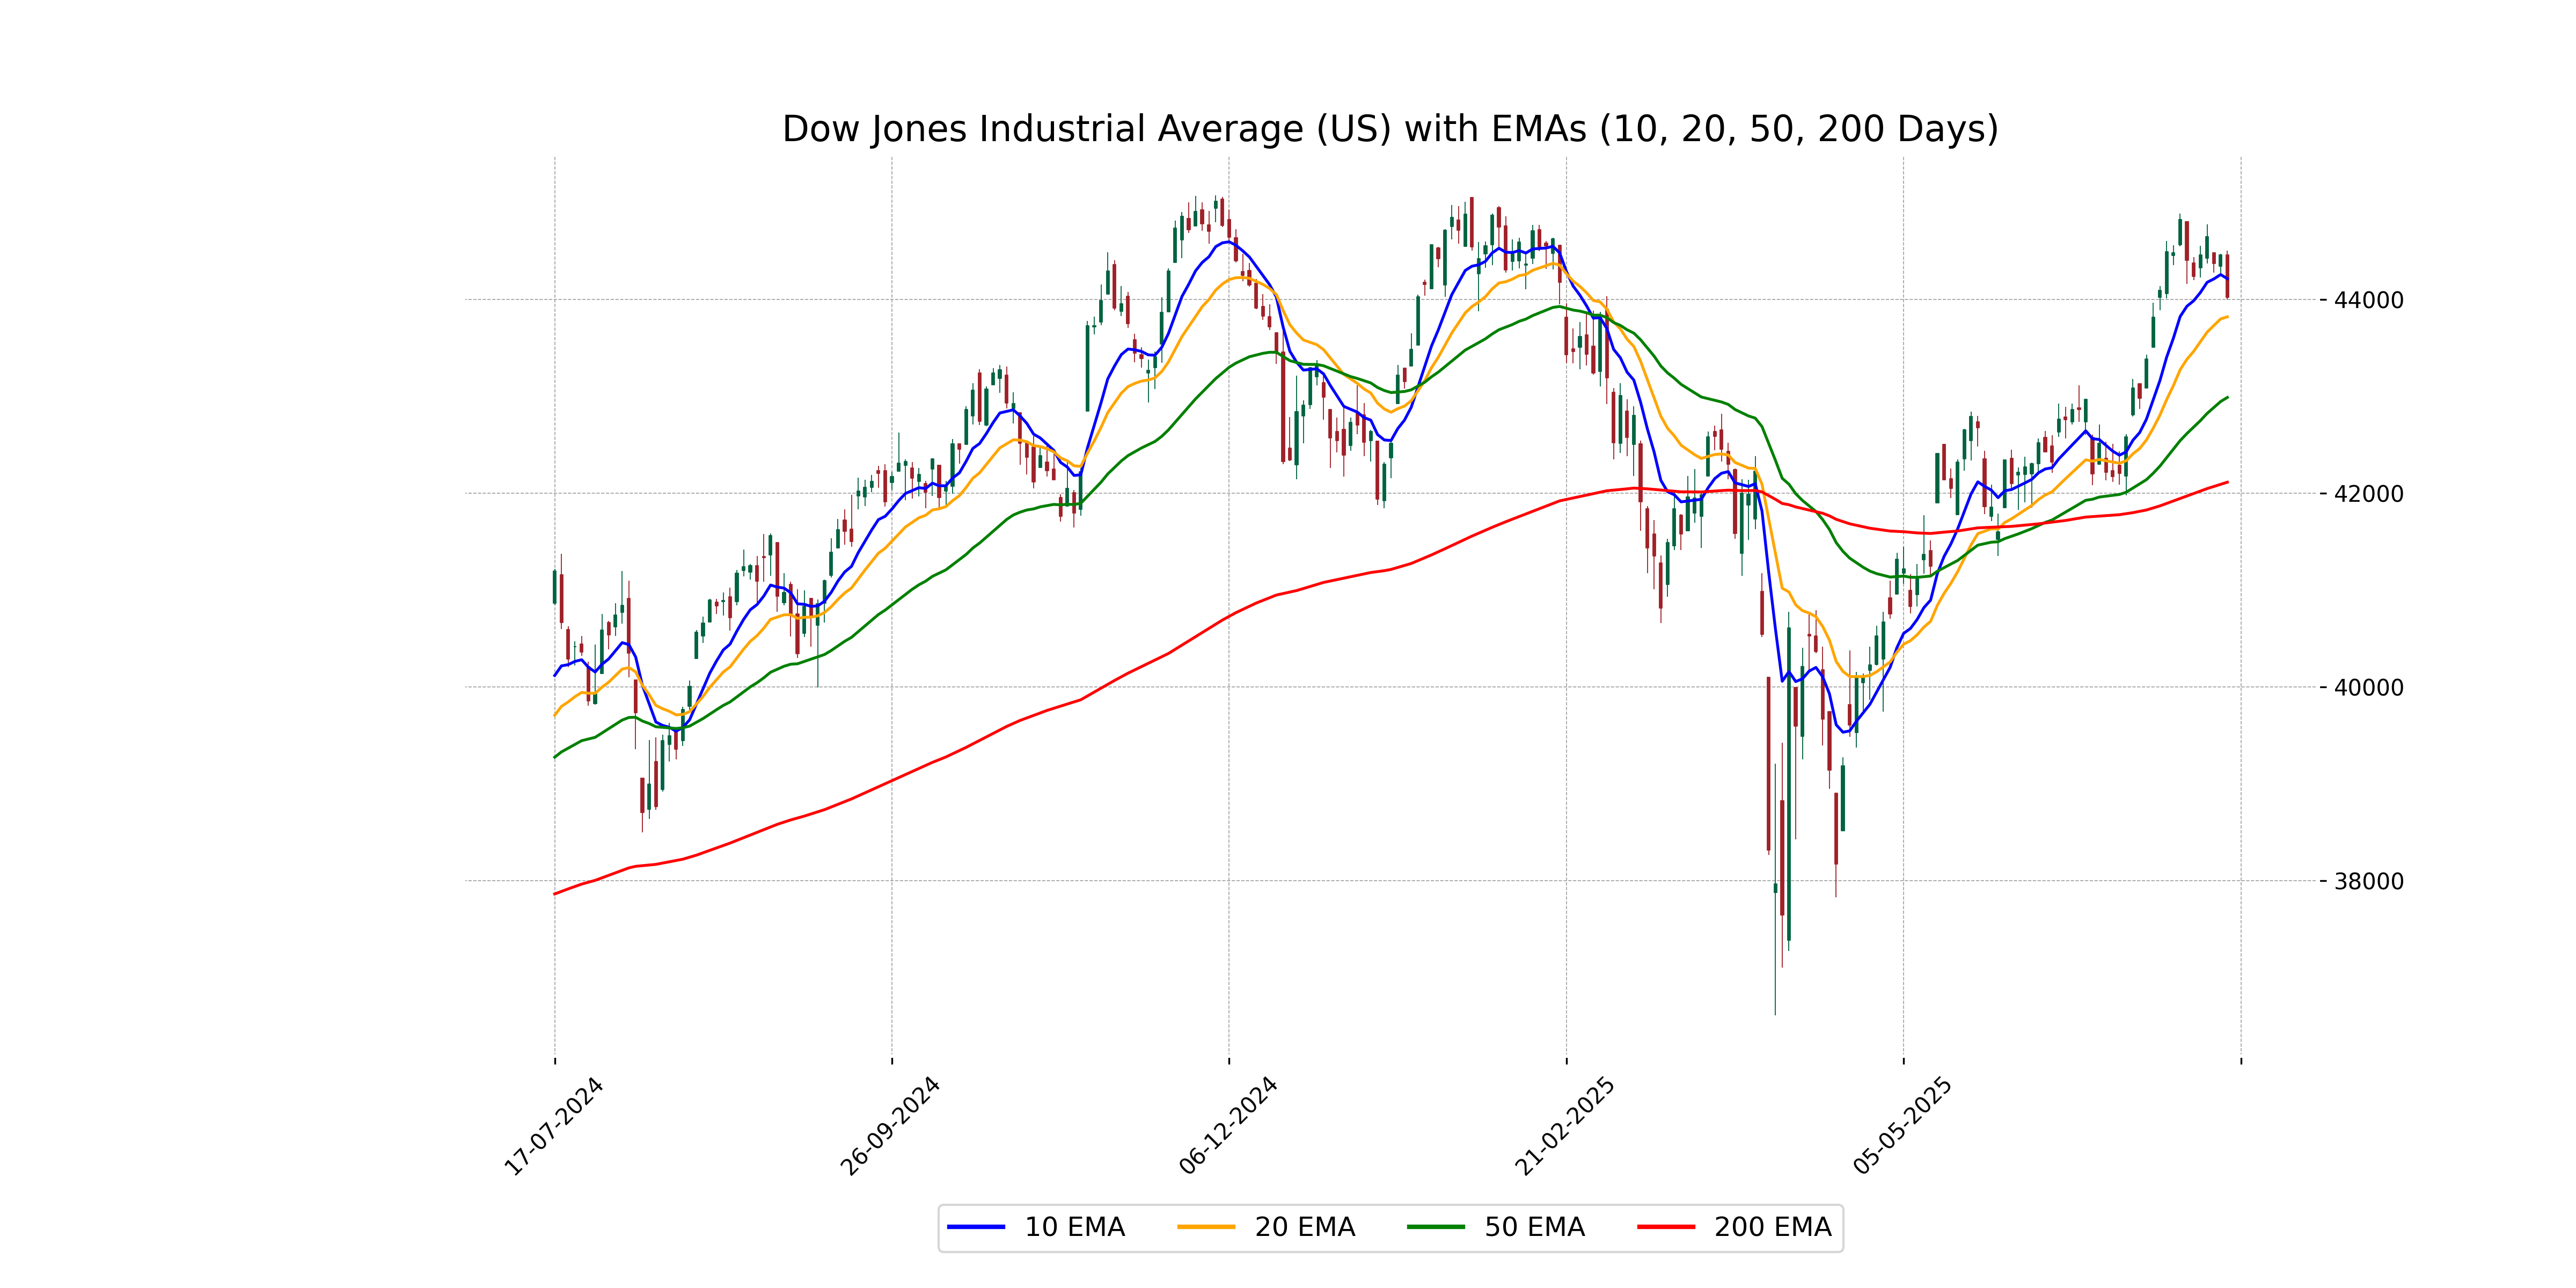
Relationship with Key Moving Averages
The Dow Jones Industrial Average closed below its 10 EMA at 44,023.29, indicating recent downward momentum. However, it remains well above its 50 EMA and 200 EMA, showing overall longer-term positive trends.
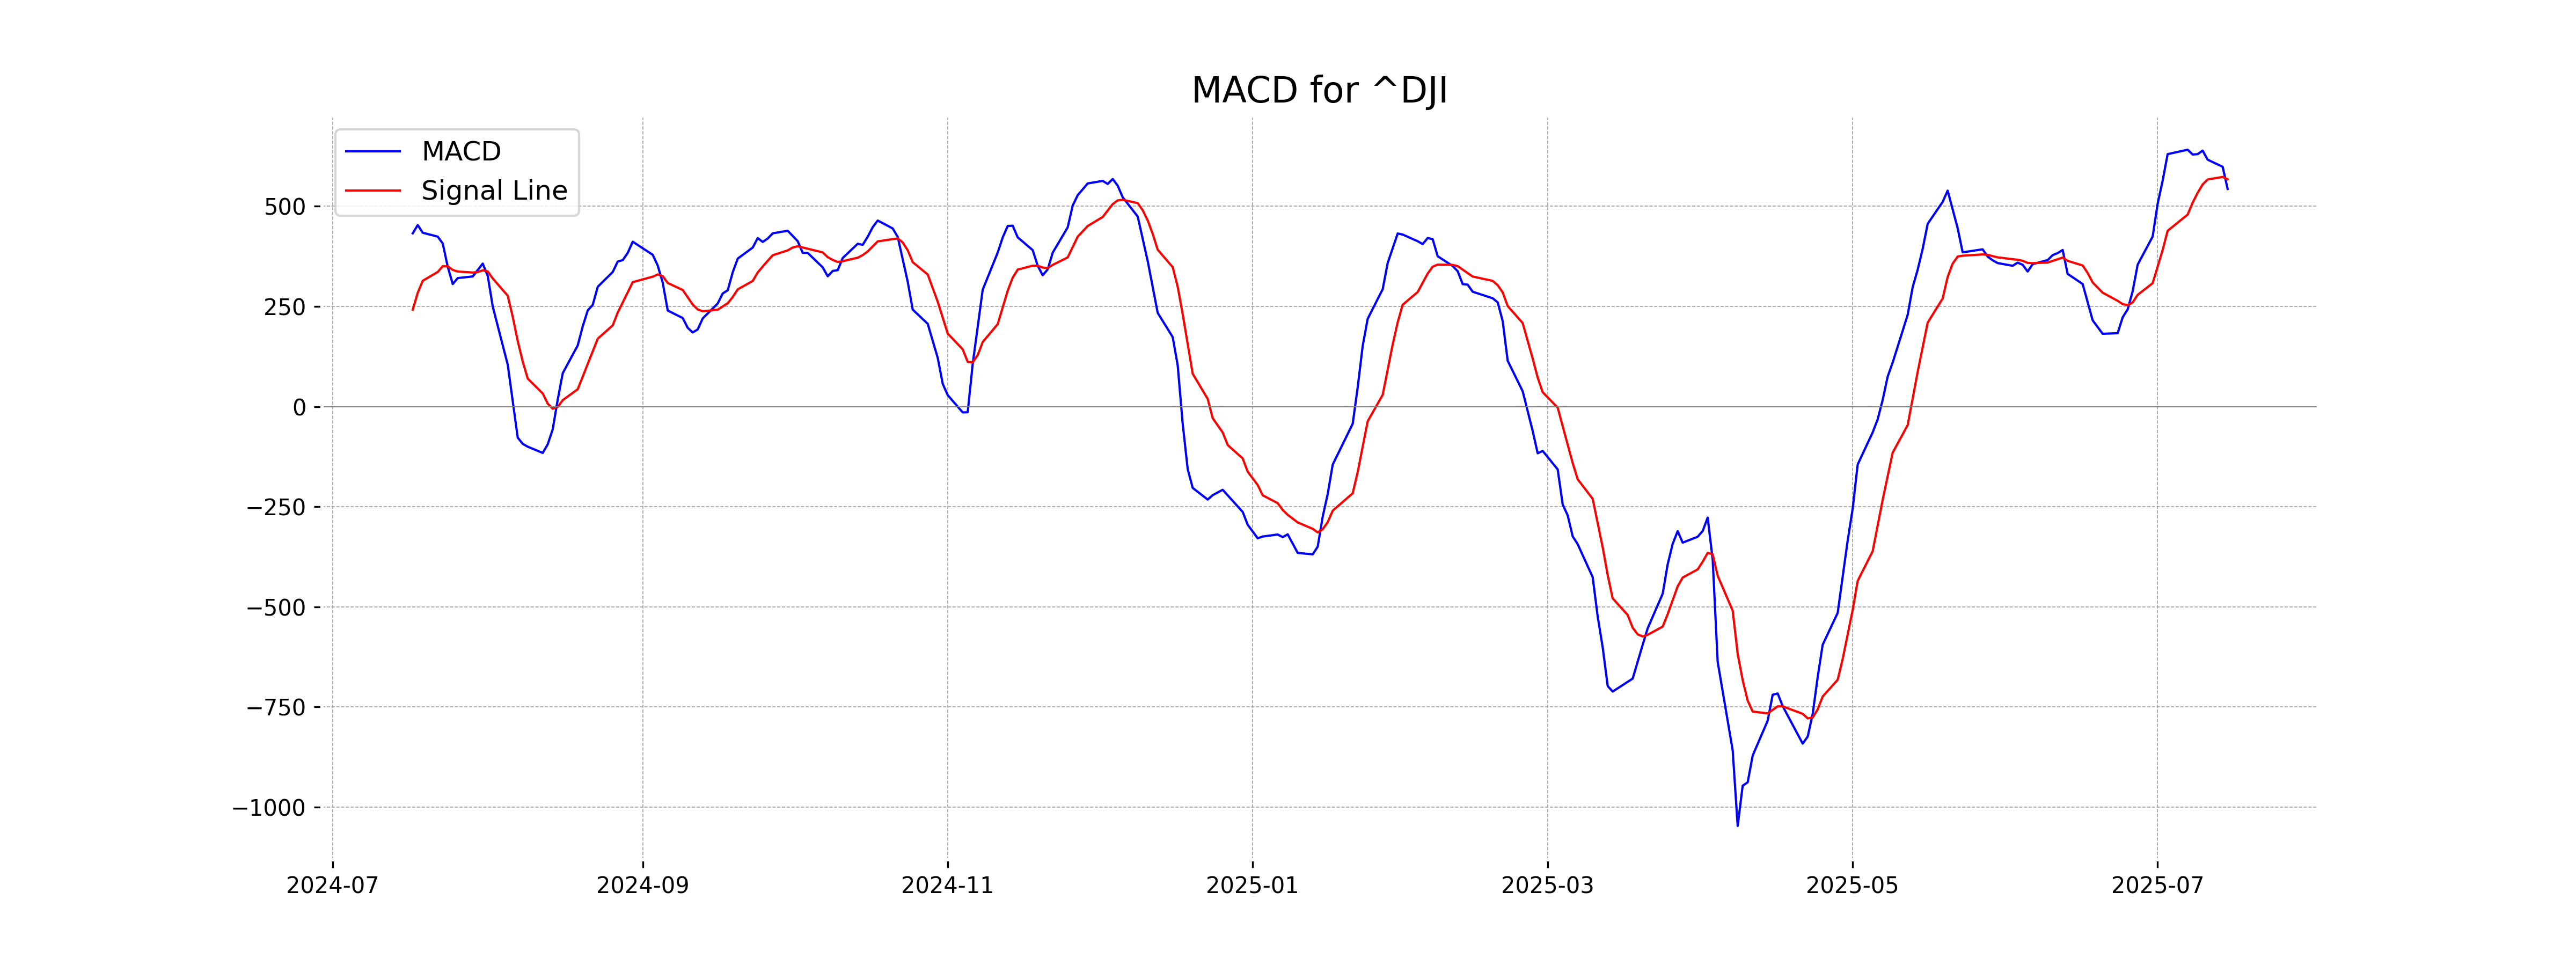
Moving Averages Trend (MACD)
The Dow Jones Industrial Average (US) shows a bearish signal in the MACD analysis. The MACD line at 543.07 is below the MACD signal line at 567.19, indicating a potential downtrend. Traders might consider this as a signal to be cautious in the short term.
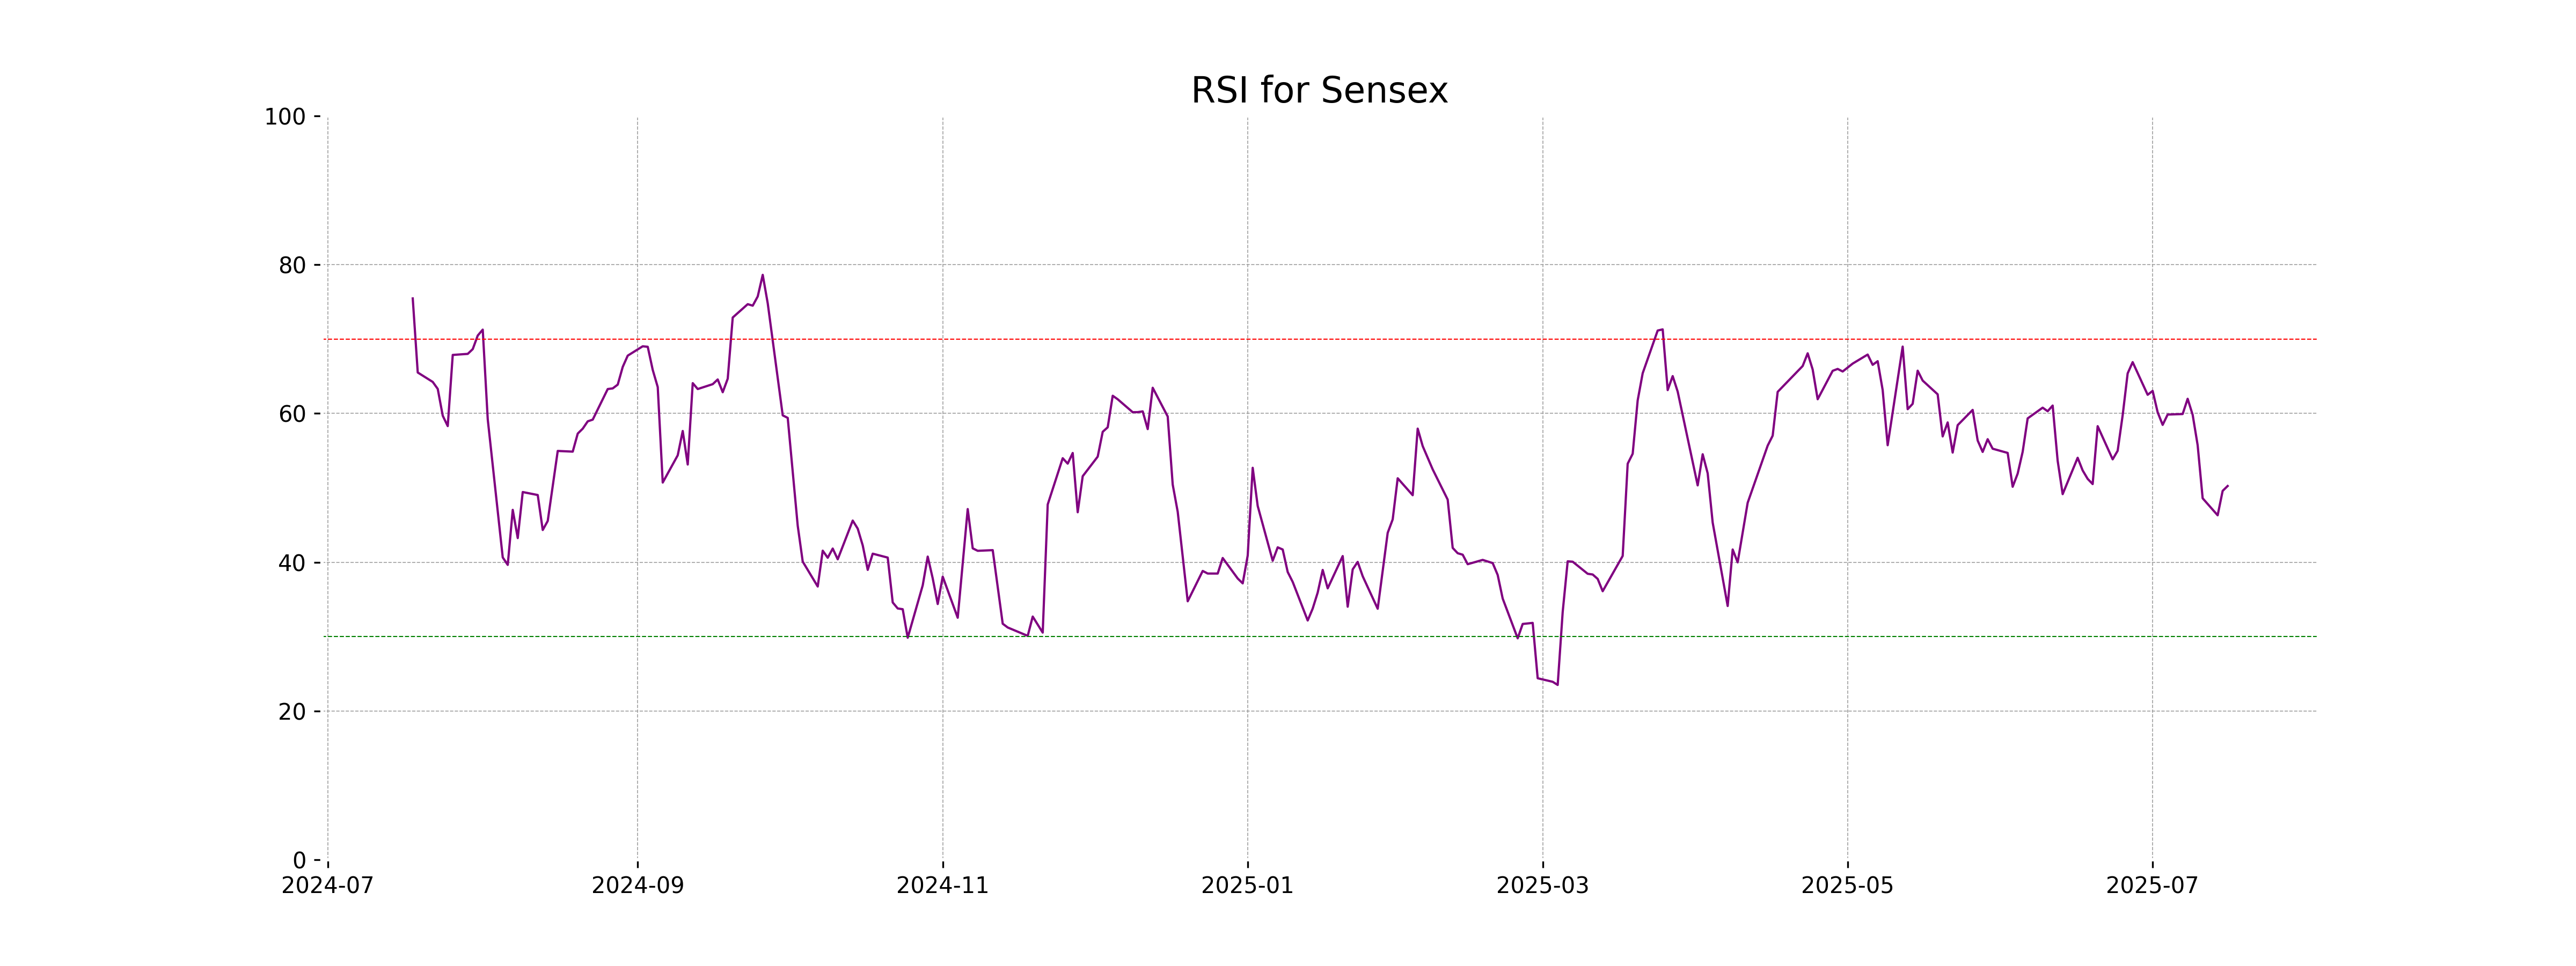
RSI Analysis
The RSI for the Dow Jones Industrial Average is 56.59, indicating a neutral momentum. Generally, an RSI between 30 and 70 suggests neither overbought nor oversold conditions, and currently, the index is comfortably within this range.
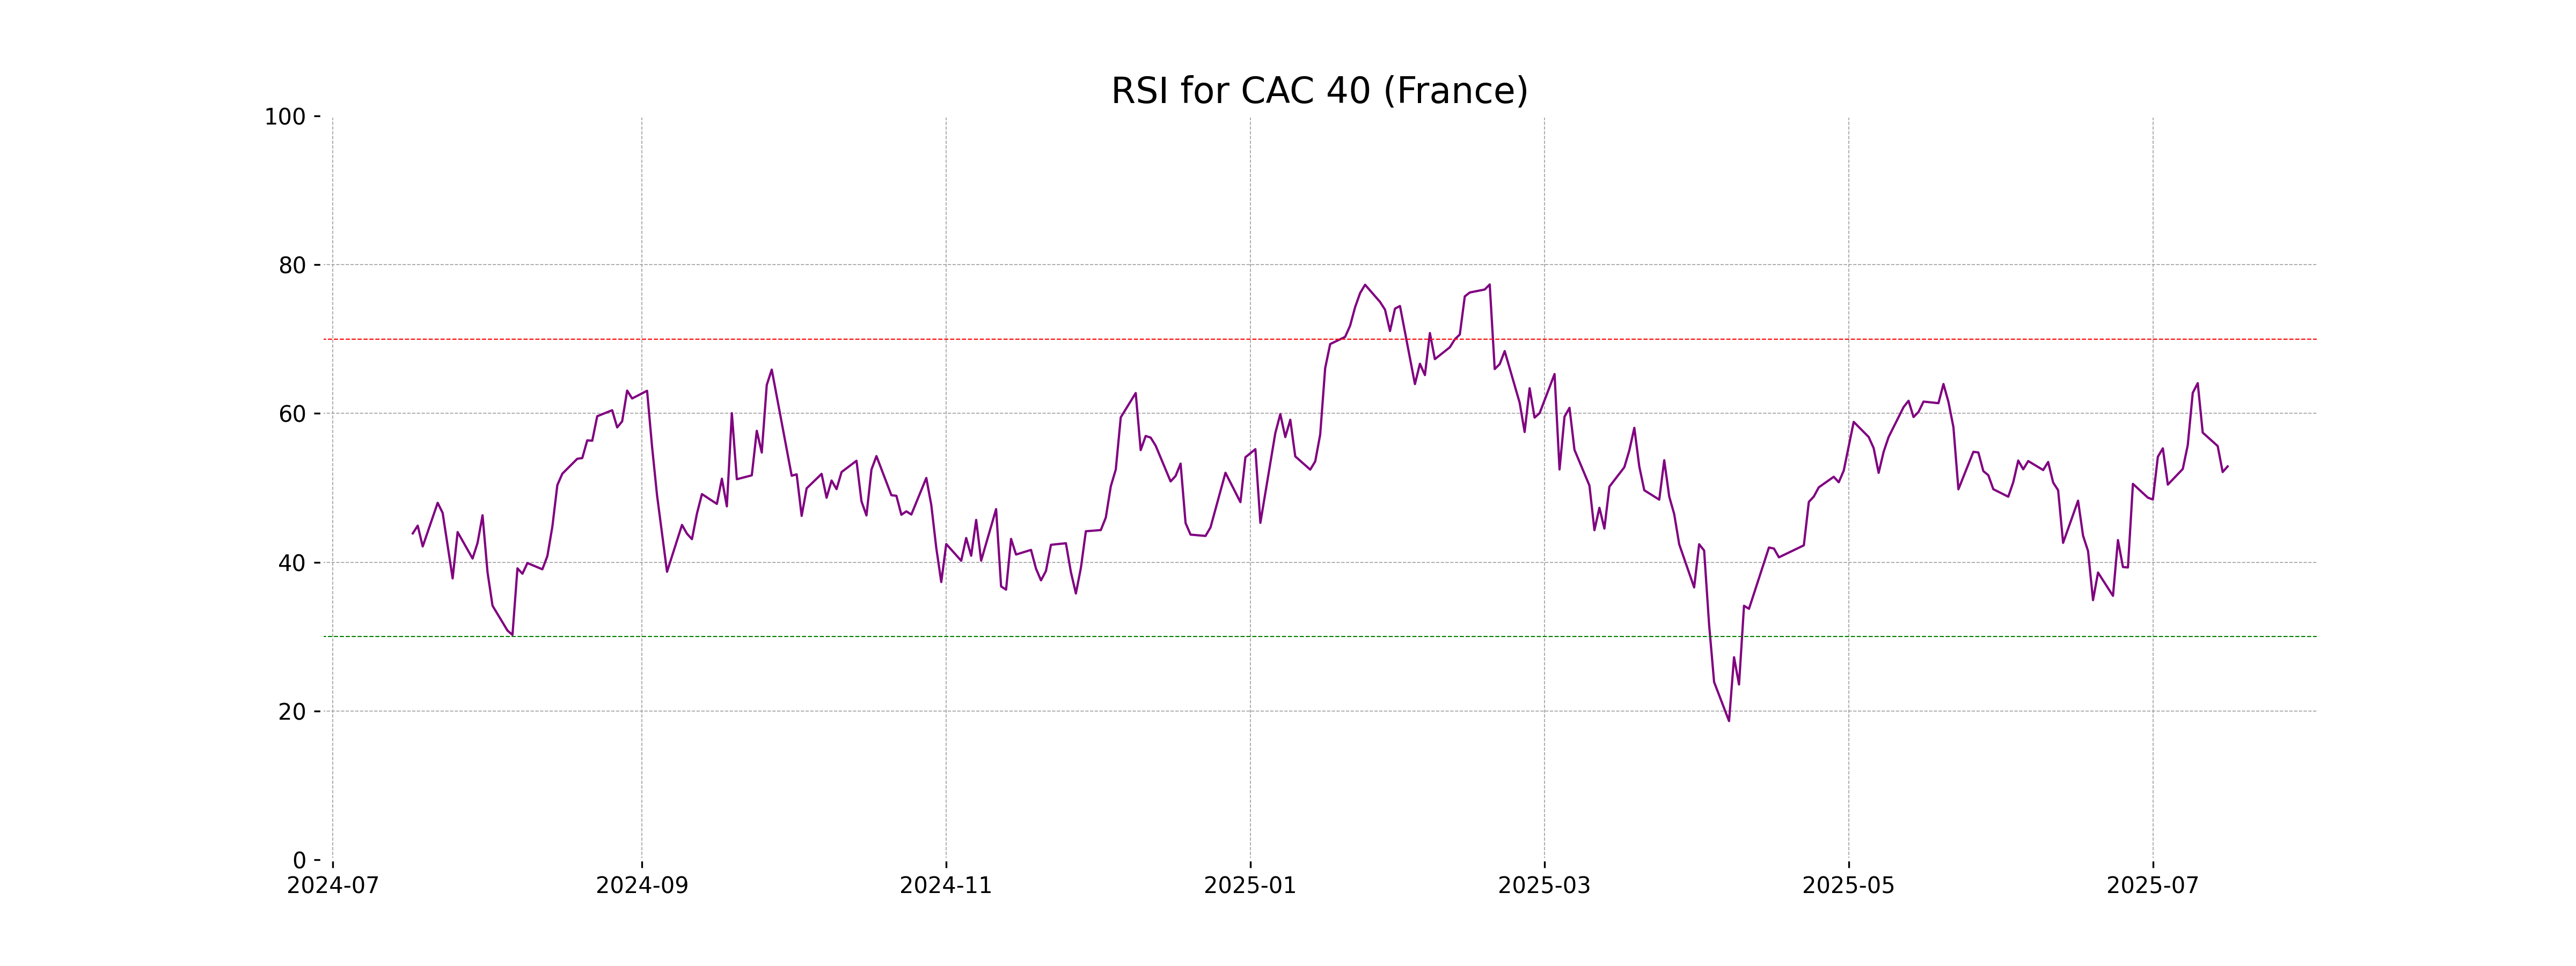
Analysis for CAC 40 (France) - July 16, 2025
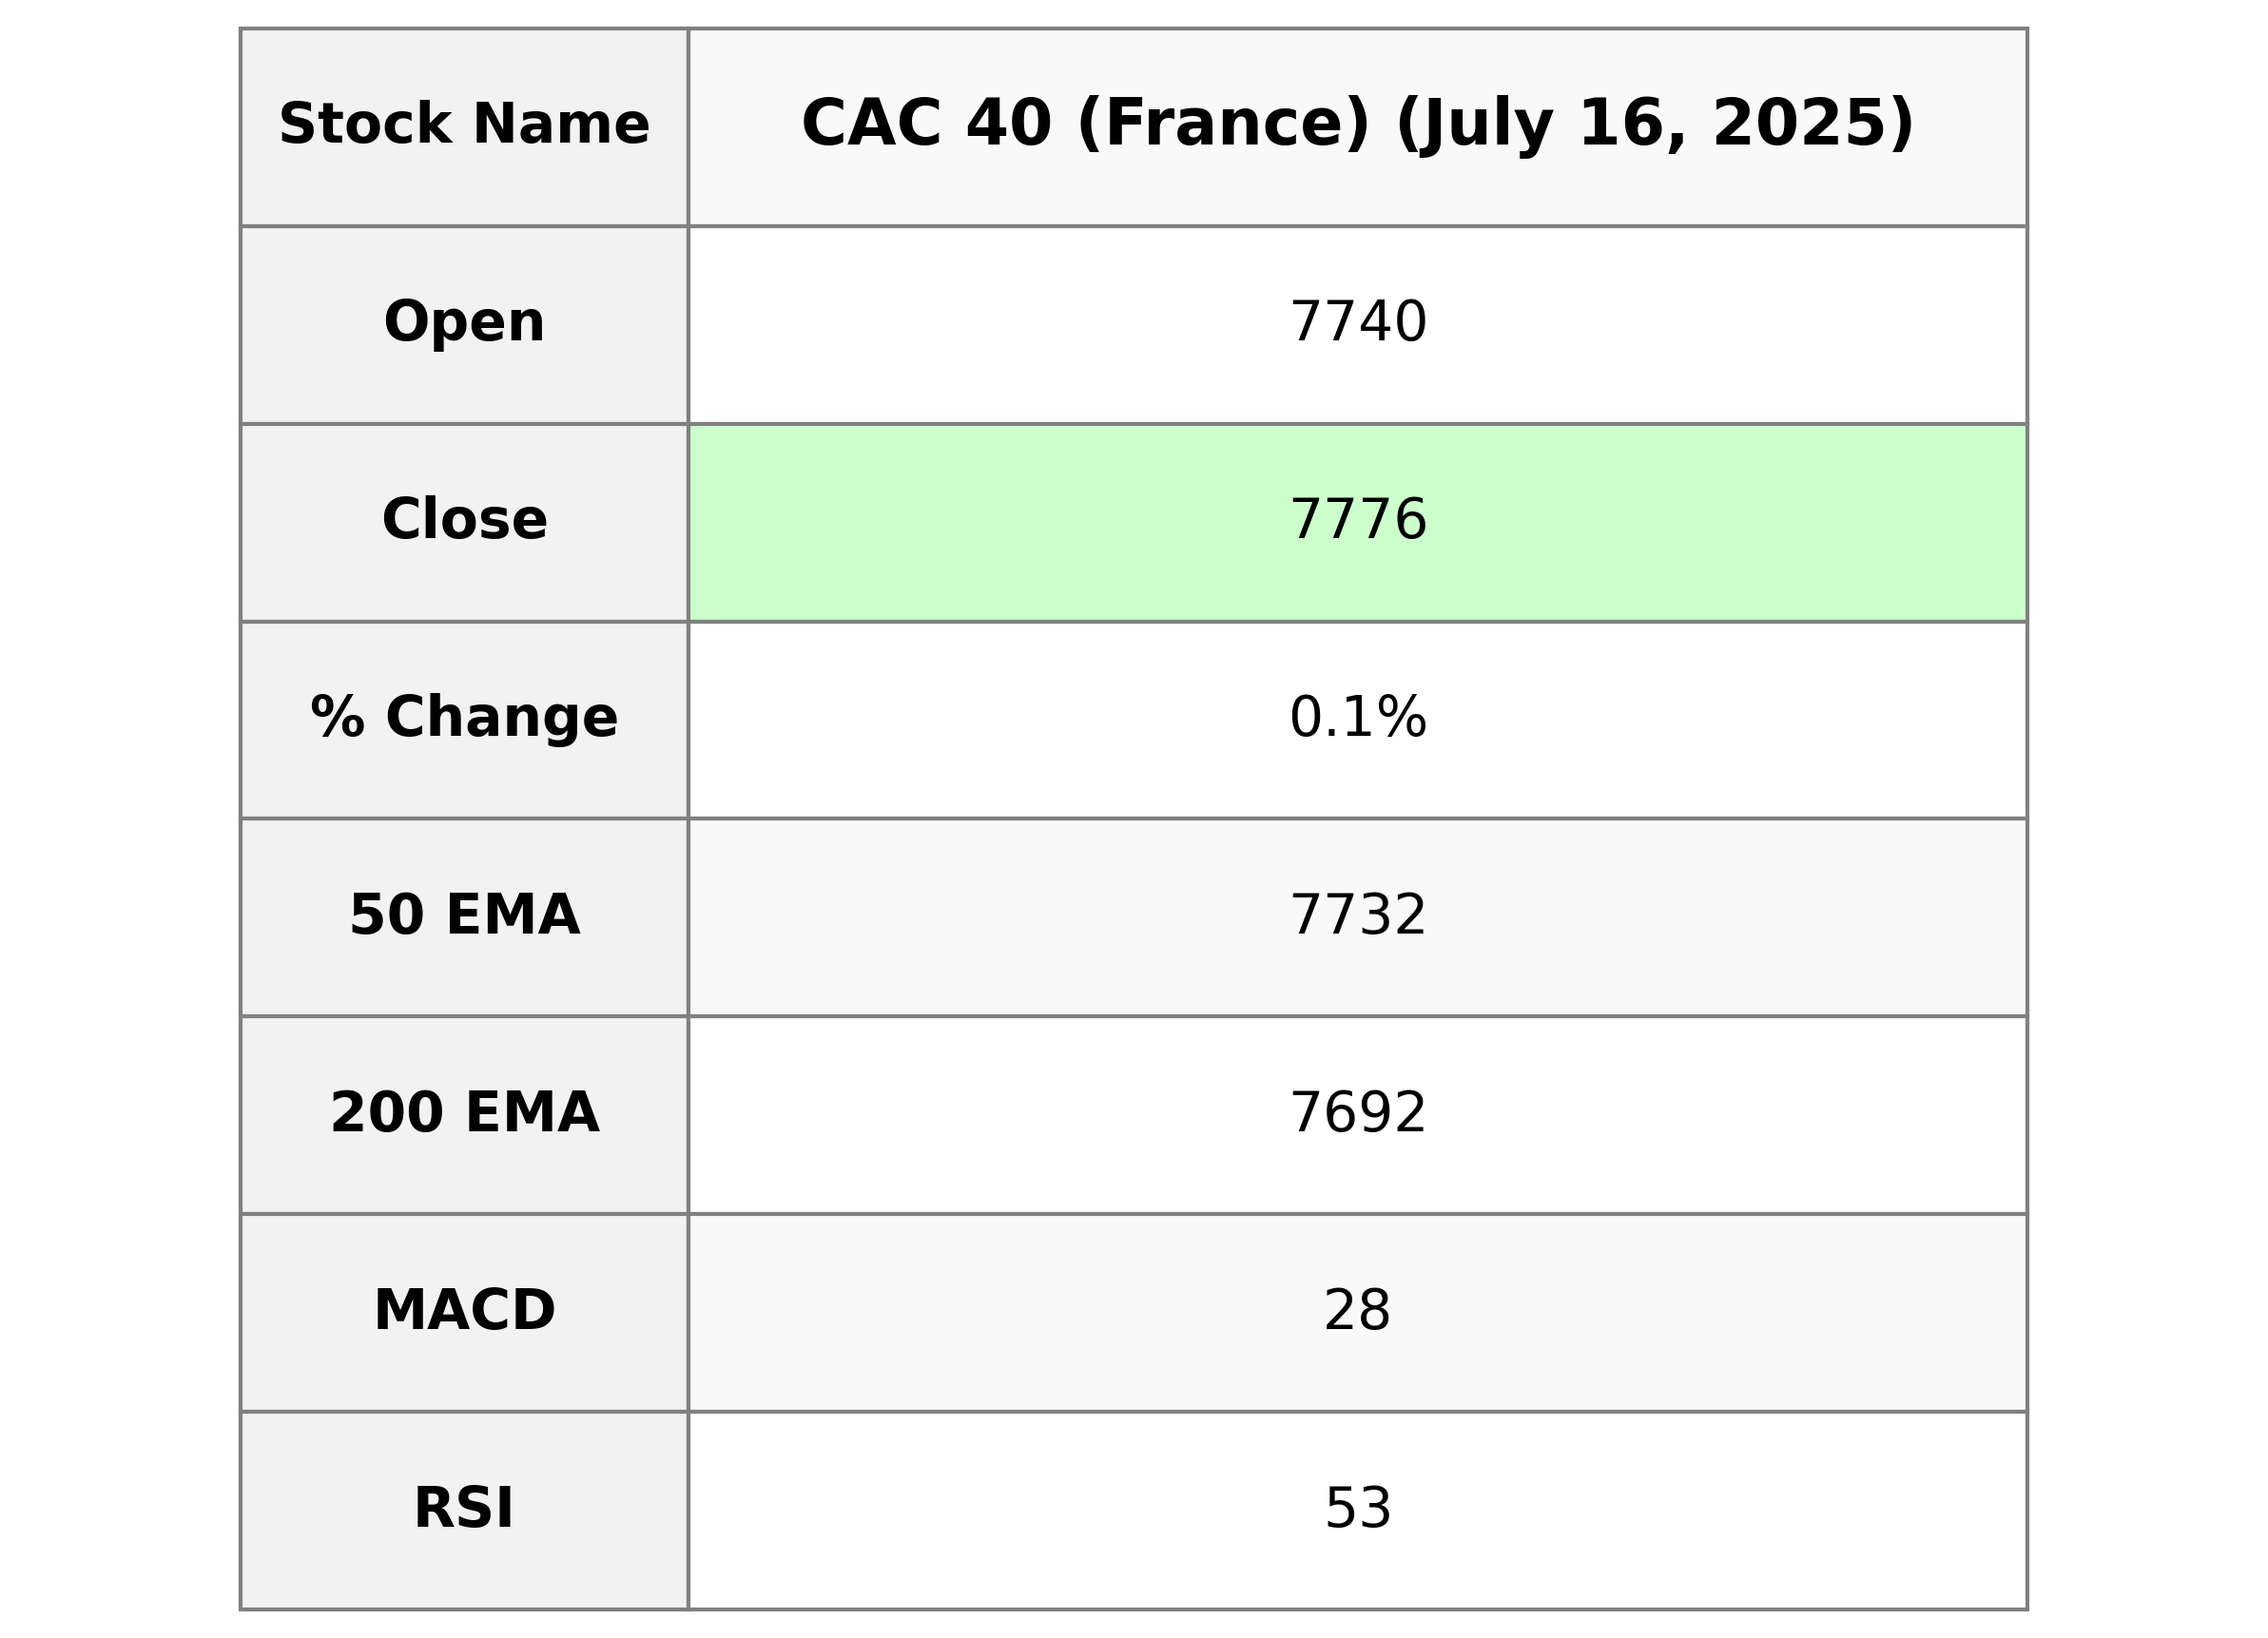
CAC 40's performance shows a closing value of 7776.20, marking a slight increase of 0.13% from the previous close. The index experienced a high of 7776.20 and a low of 7736.17, with no reported trading volume. The RSI stands at 52.88, suggesting neither overbought nor oversold conditions, while the MACD value of 27.98 indicates a positive trend above its signal line.
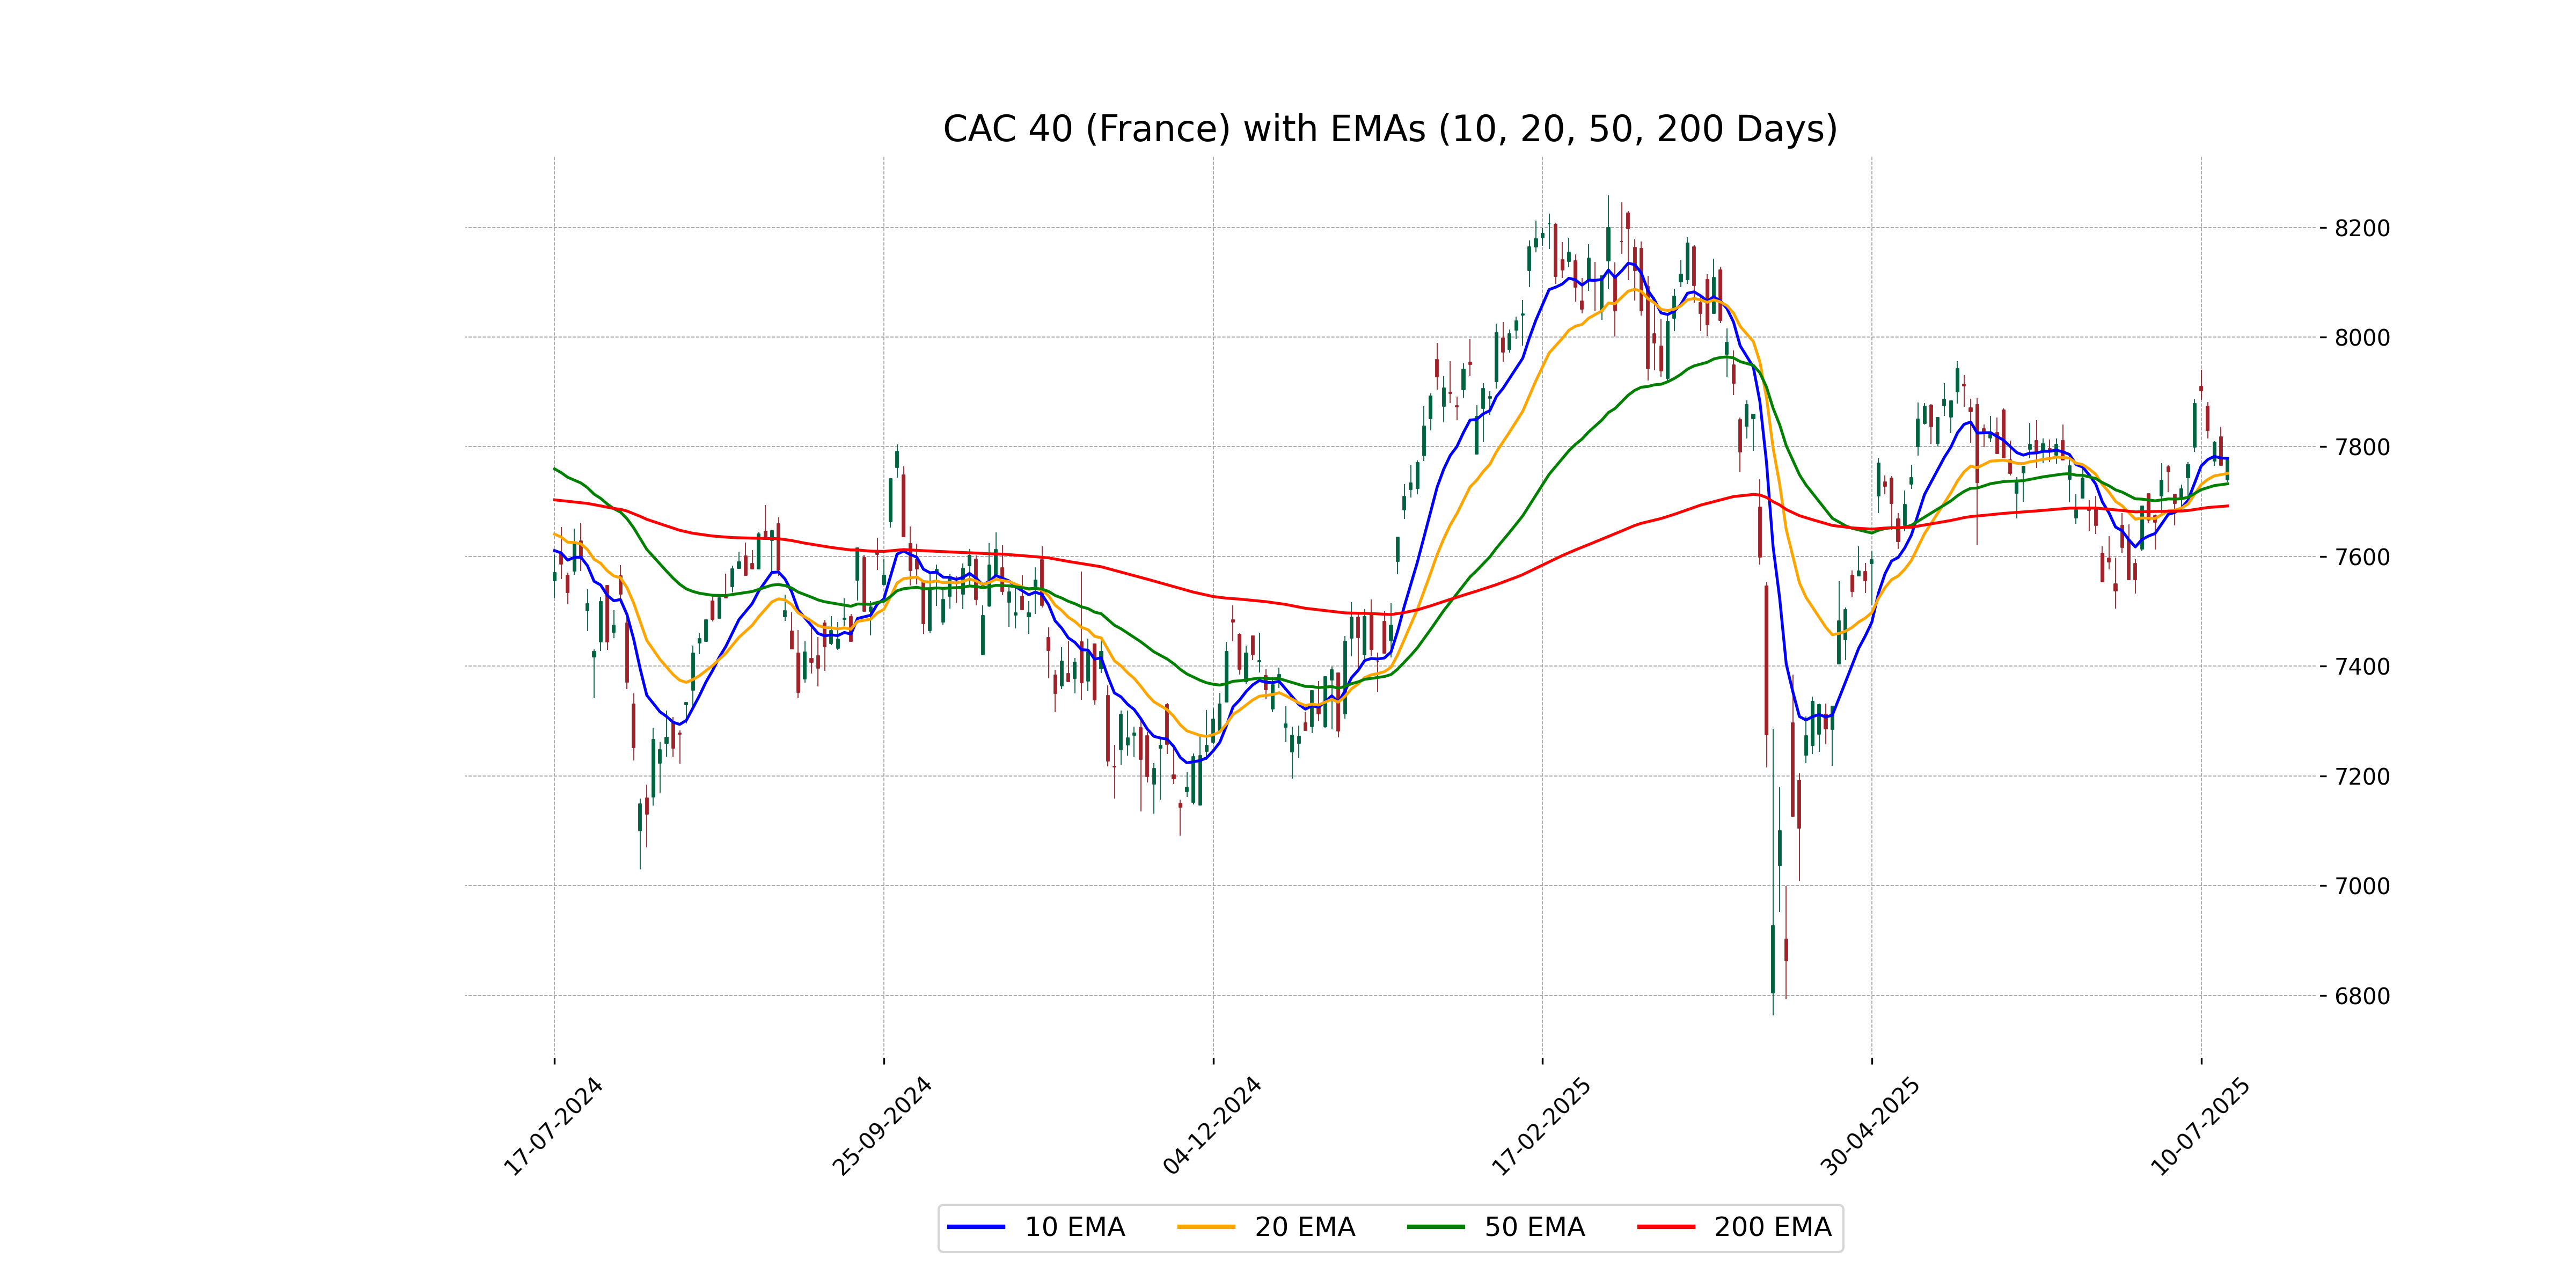
Relationship with Key Moving Averages
CAC 40 (France) closed above its 50 EMA and 200 EMA but below its 10 EMA, indicating a predominantly bullish position relative to these moving averages. The current RSI of 52.88 suggests a moderately neutral momentum.
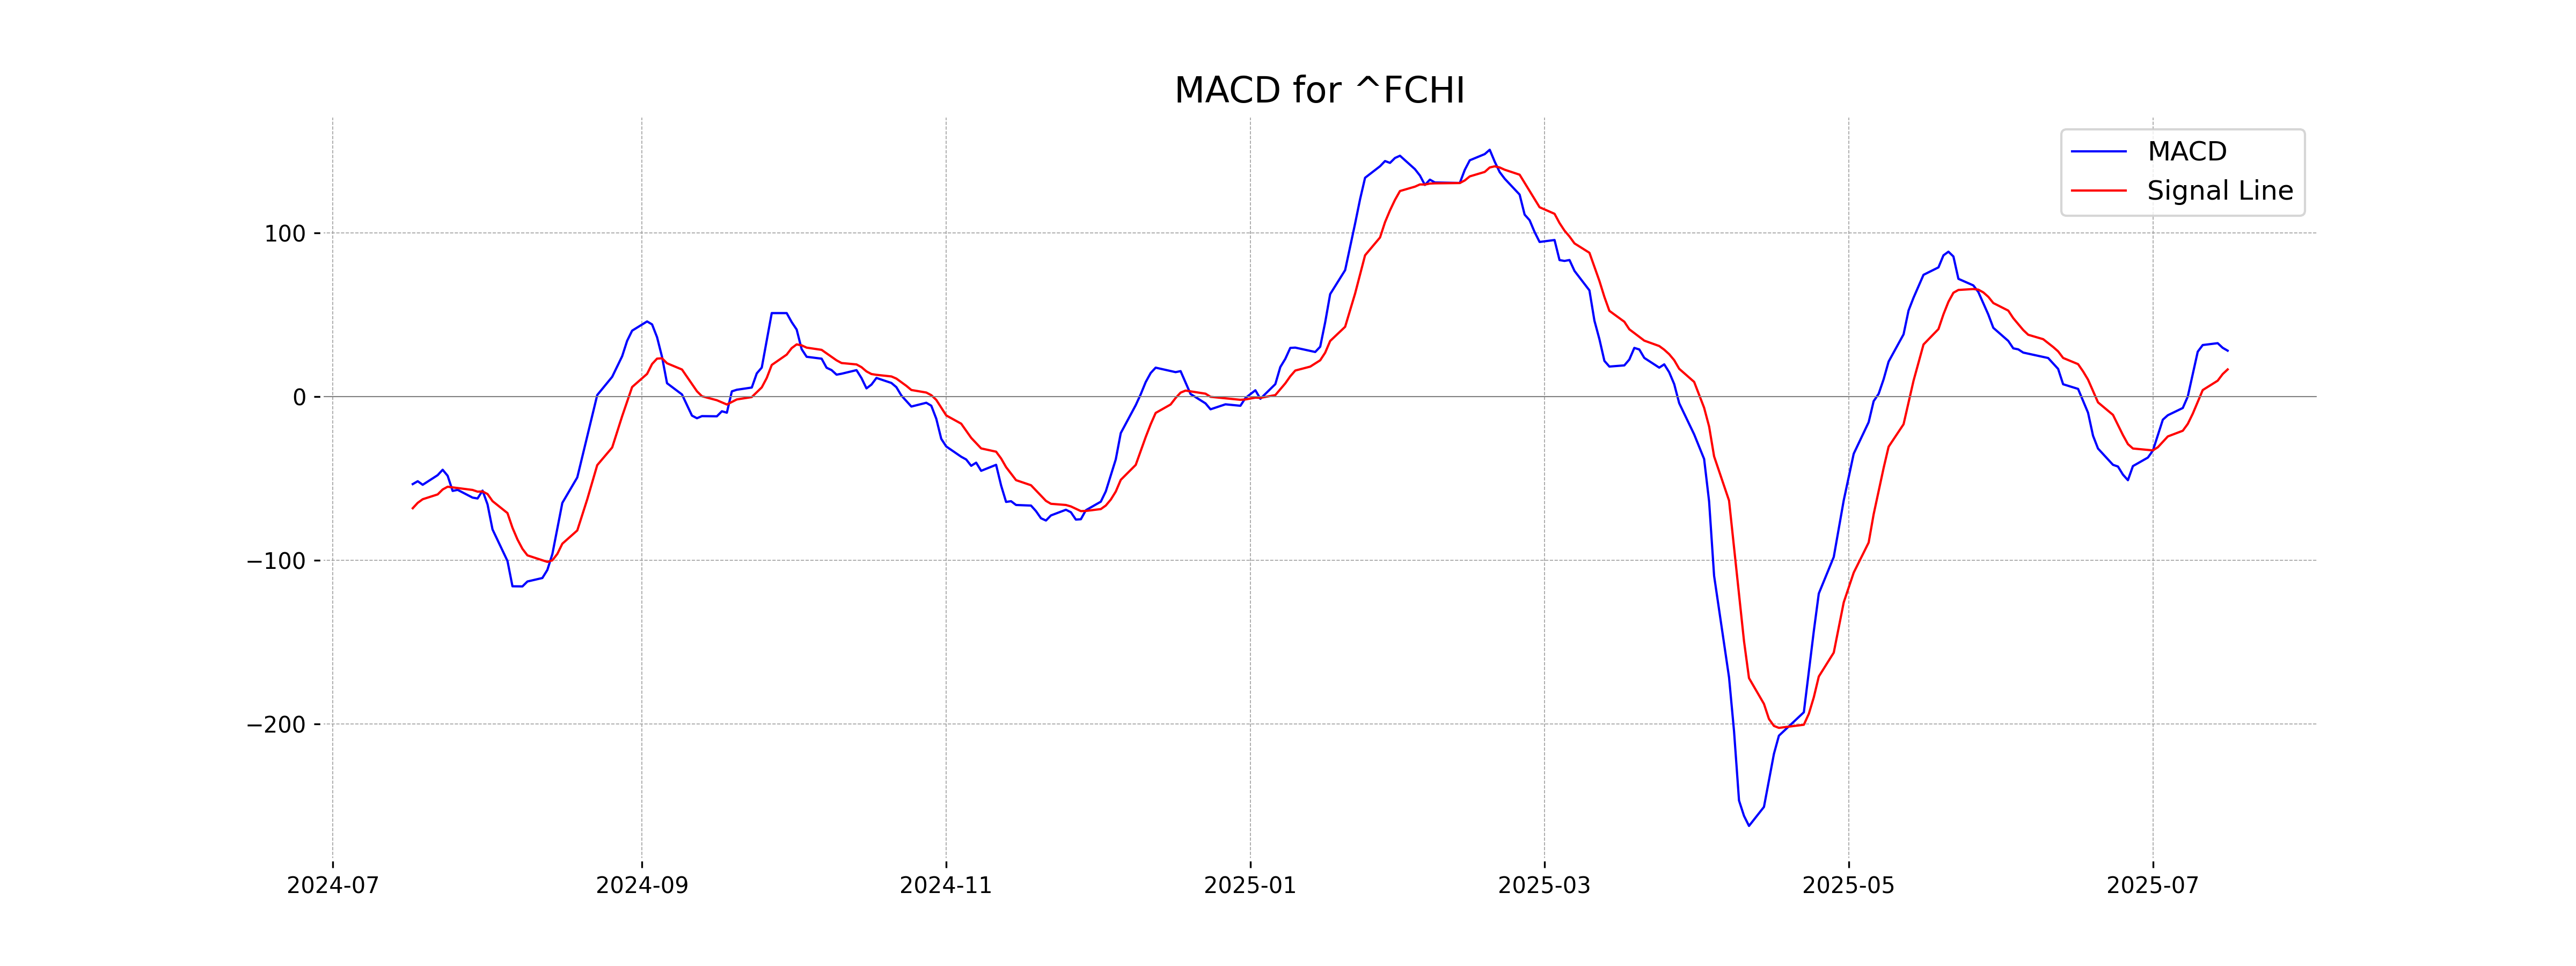
Moving Averages Trend (MACD)
For the CAC 40 (France), the MACD value is 27.98, which is higher than the MACD Signal of 16.52. This indicates a bullish trend, suggesting that the price may continue to rise if the current momentum persists.
RSI Analysis
CAC 40 RSI Analysis: The RSI of CAC 40 currently stands at 52.88, indicating a neutral market condition. This suggests that the index is not in overbought or oversold territory, and price momentum is balanced.
Analysis for FTSE 100 (UK) - July 16, 2025

FTSE 100 (UK) opened at 8938.32 and closed at 8955.40, experiencing a slight increase with a percentage change of 0.19%. The RSI value stands at 62.65, indicating a moderately strong momentum, while the MACD is above the signal line, suggesting a potential bullish trend.
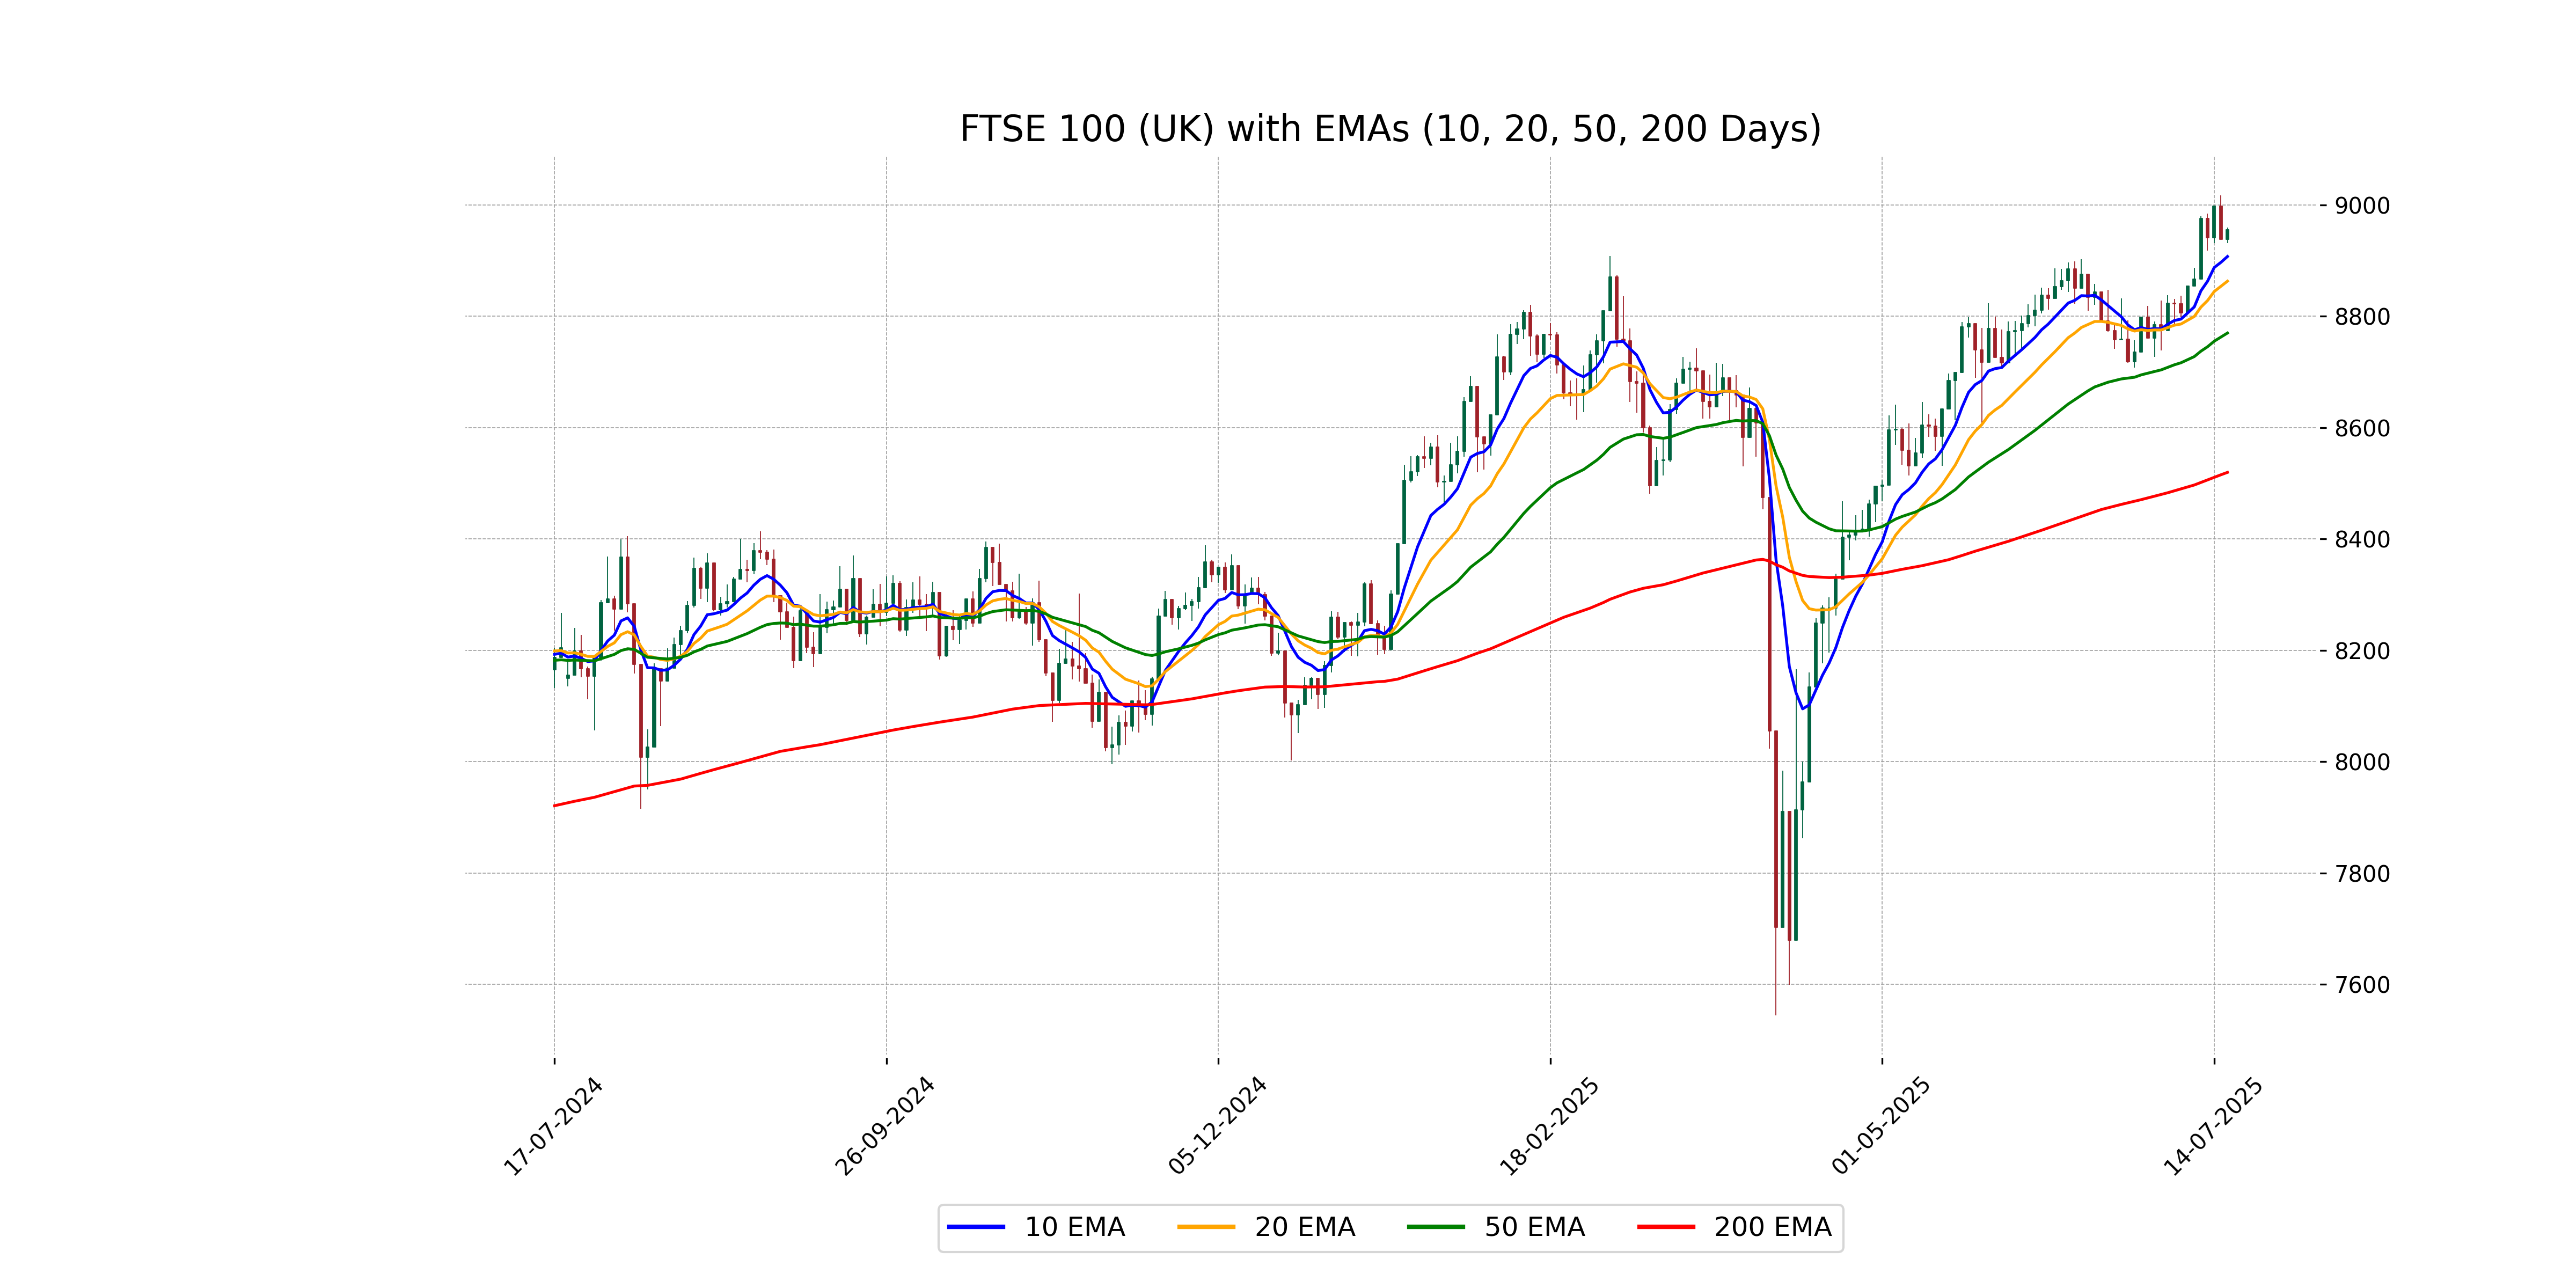
Relationship with Key Moving Averages
The FTSE 100 (UK) is trading above its 10-day EMA of 8907.52 and 20-day EMA of 8863.20, indicating short-term bullish momentum. Additionally, it is trading higher than both its 50-day EMA of 8770.08 and 200-day EMA of 8519.77, which suggests a longer-term uptrend is present.
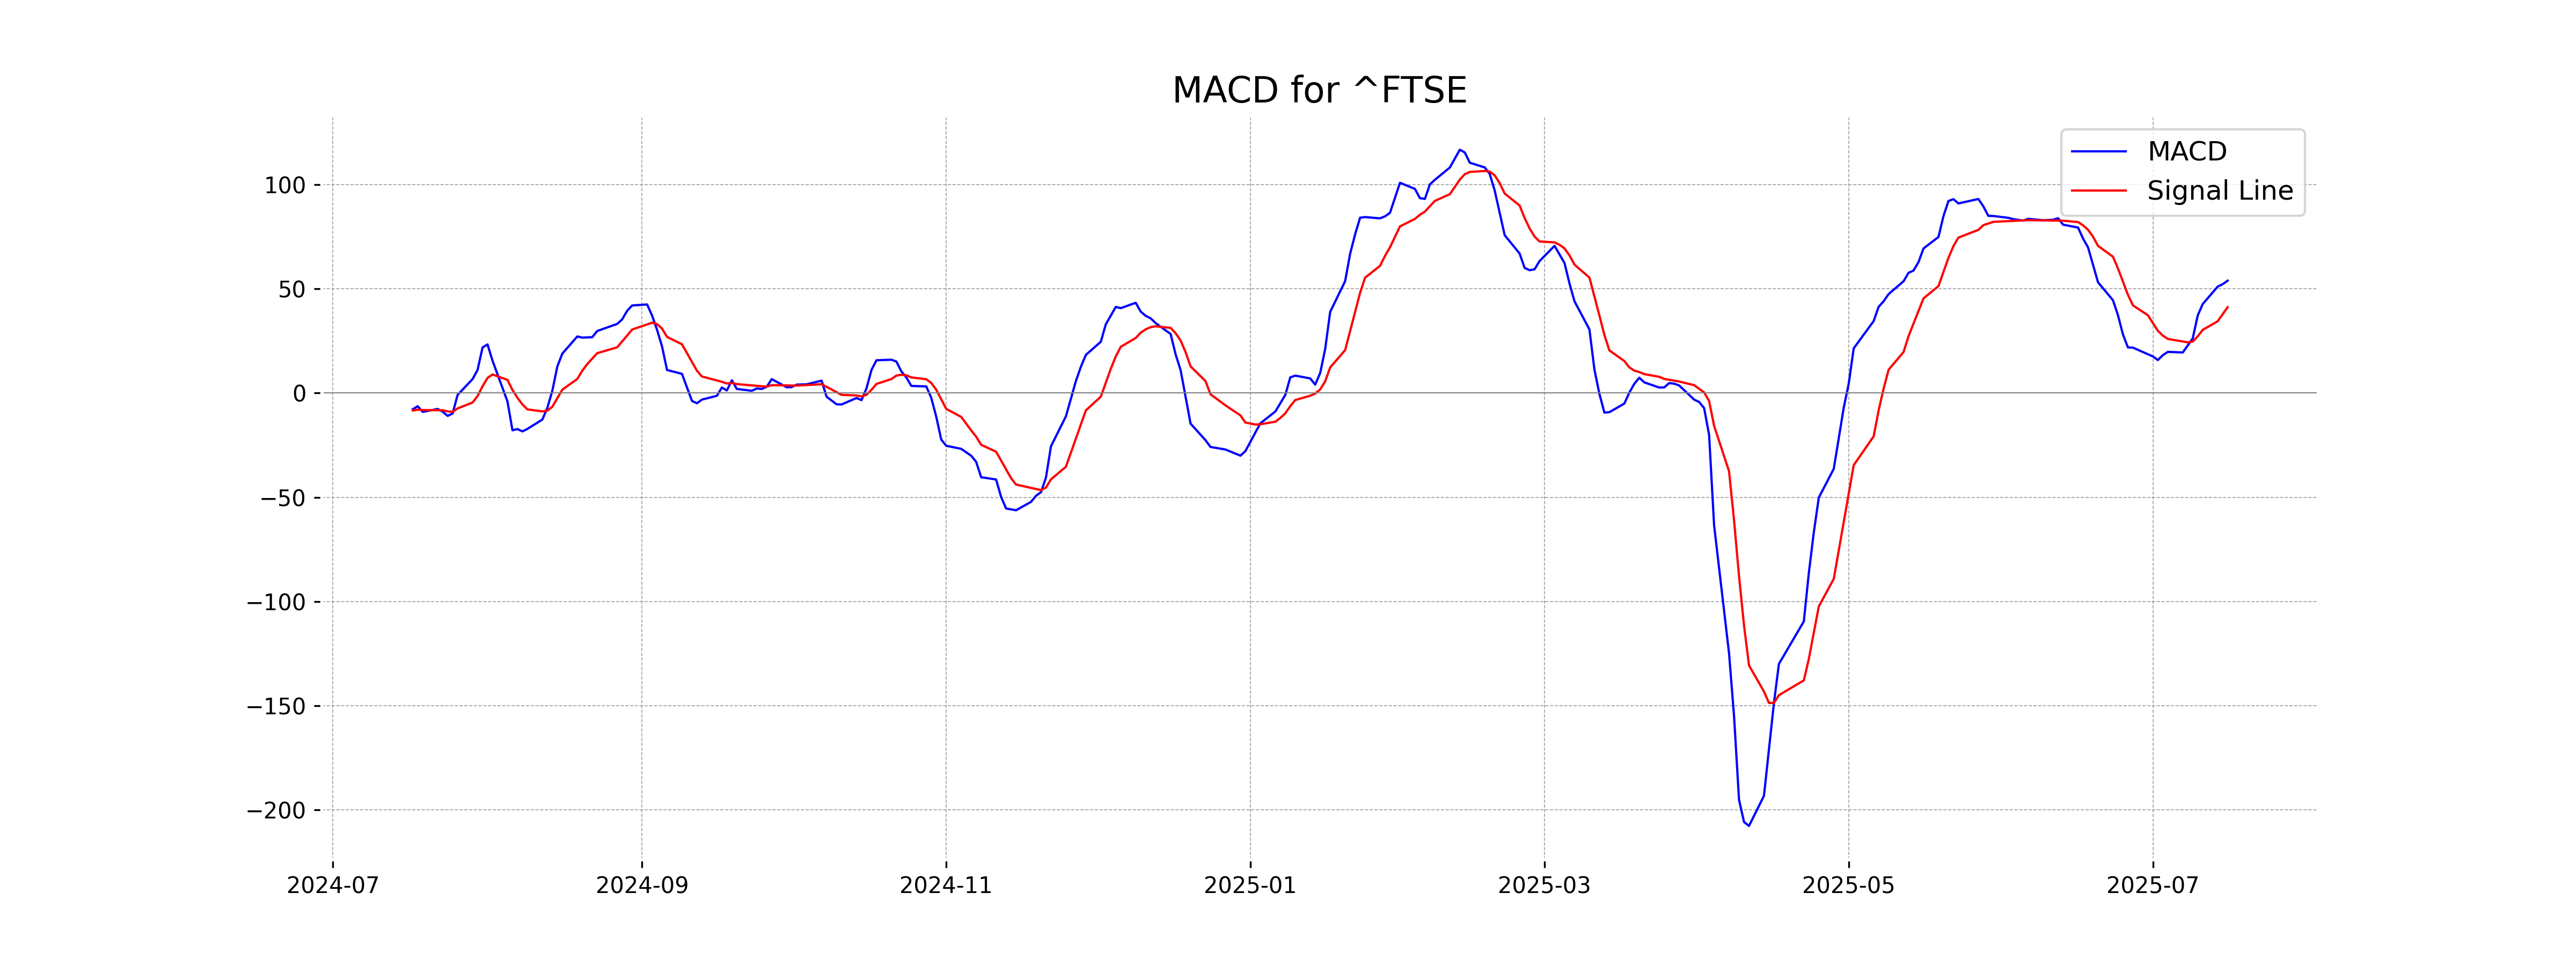
Moving Averages Trend (MACD)
FTSE 100 (UK): The MACD value of 53.91, which is above the MACD Signal line at 41.19, indicates a bullish momentum in the market. This suggests that upward price movement is gaining strength.
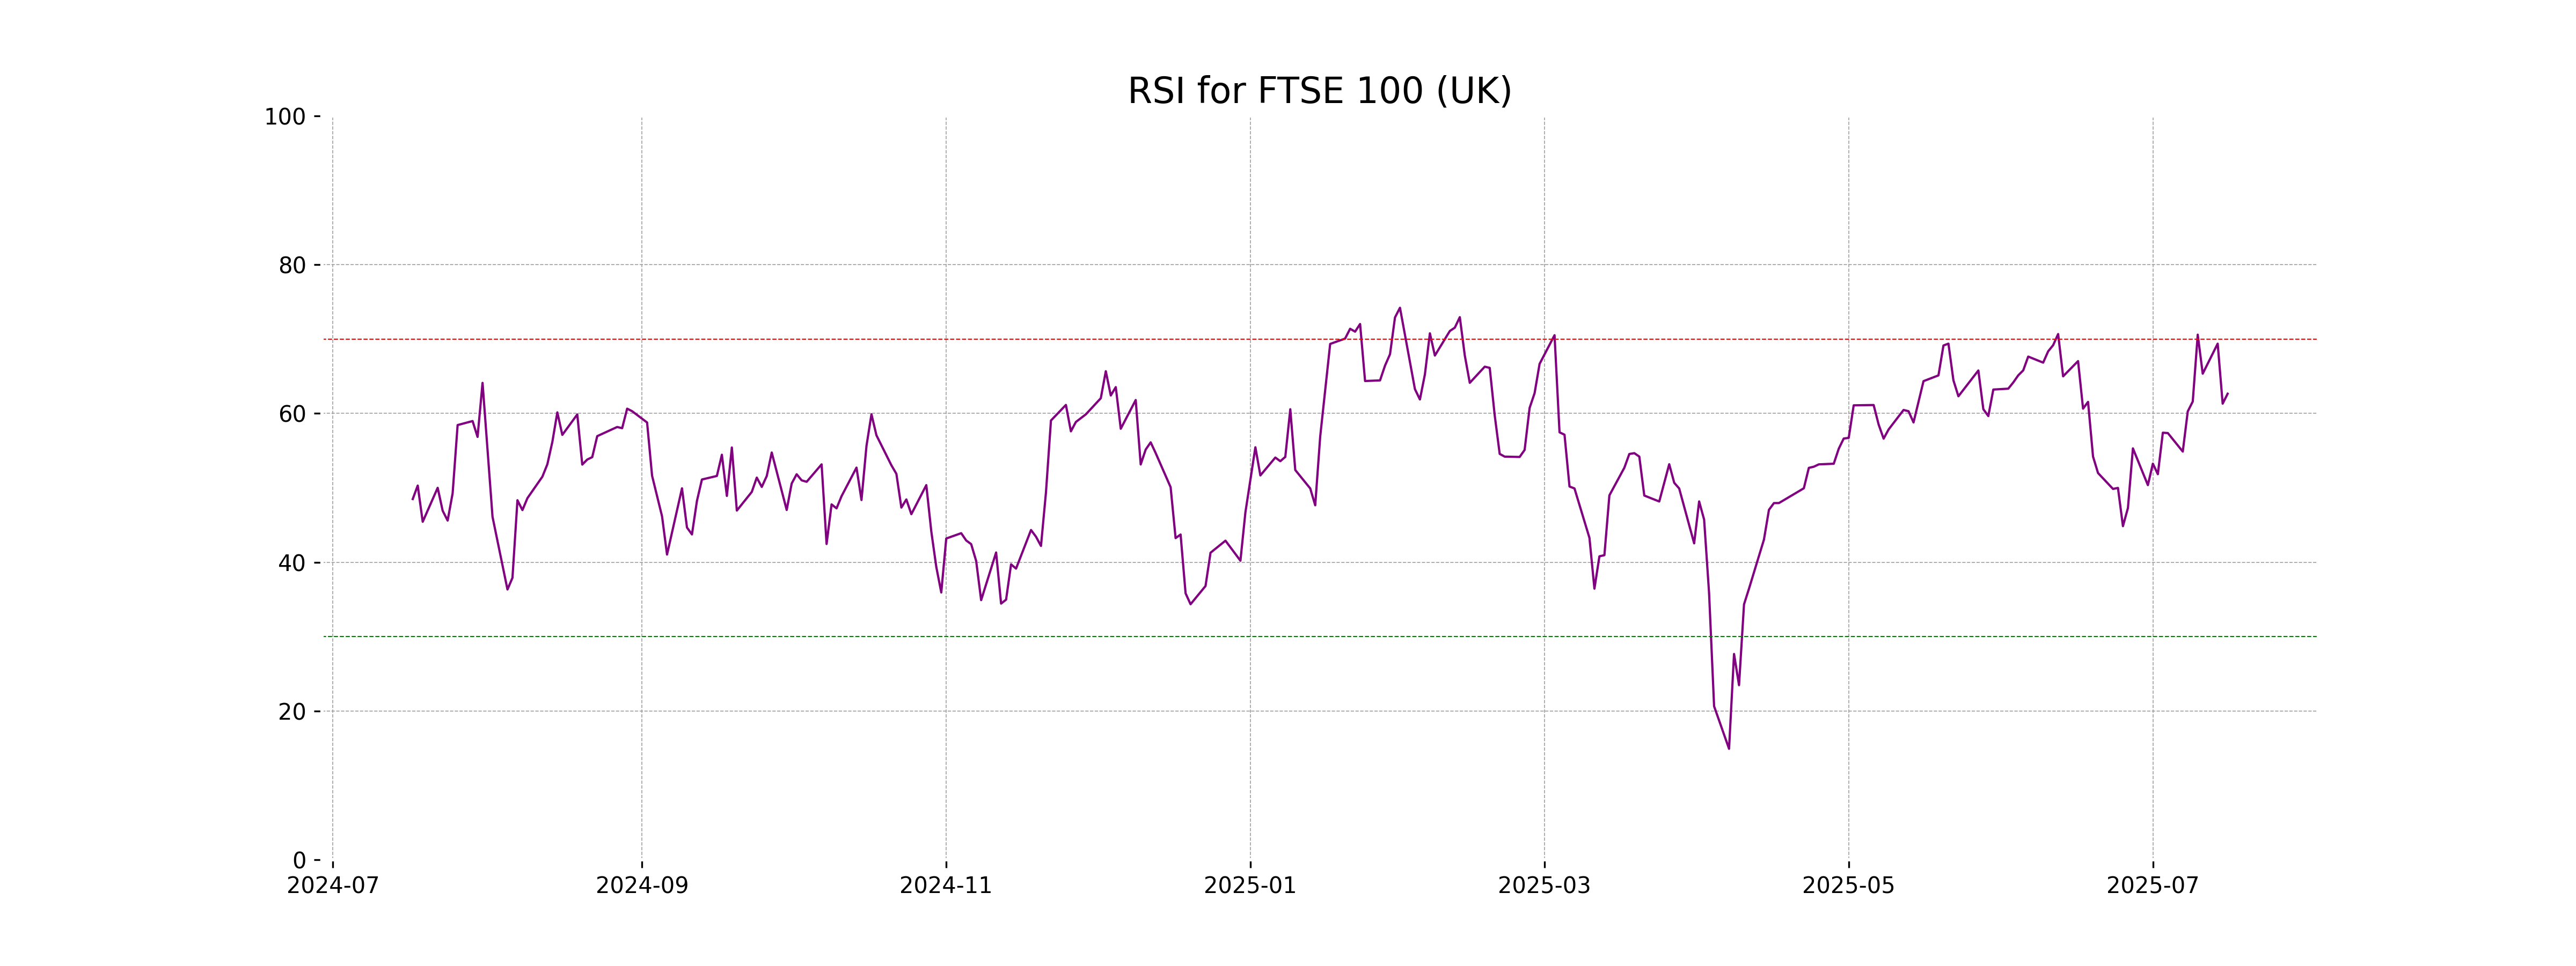
RSI Analysis
RSI Analysis for FTSE 100 (UK): The RSI for FTSE 100 is currently at 62.65, which indicates that the index is in a moderately strong position. An RSI value above 70 may suggest the index is overbought, while below 30 may suggest it is oversold.
Analysis for DAX (Germany) - July 16, 2025

The DAX (Germany) opened at 24,011.99 and closed higher at 24,144.16, marking a gain of 0.35% or an increase of 83.87 points from the previous close of 24,060.29. Technical indicators show the index is trading above its 10 EMA and 50 EMA, with an RSI of 54.91, suggesting moderate momentum.
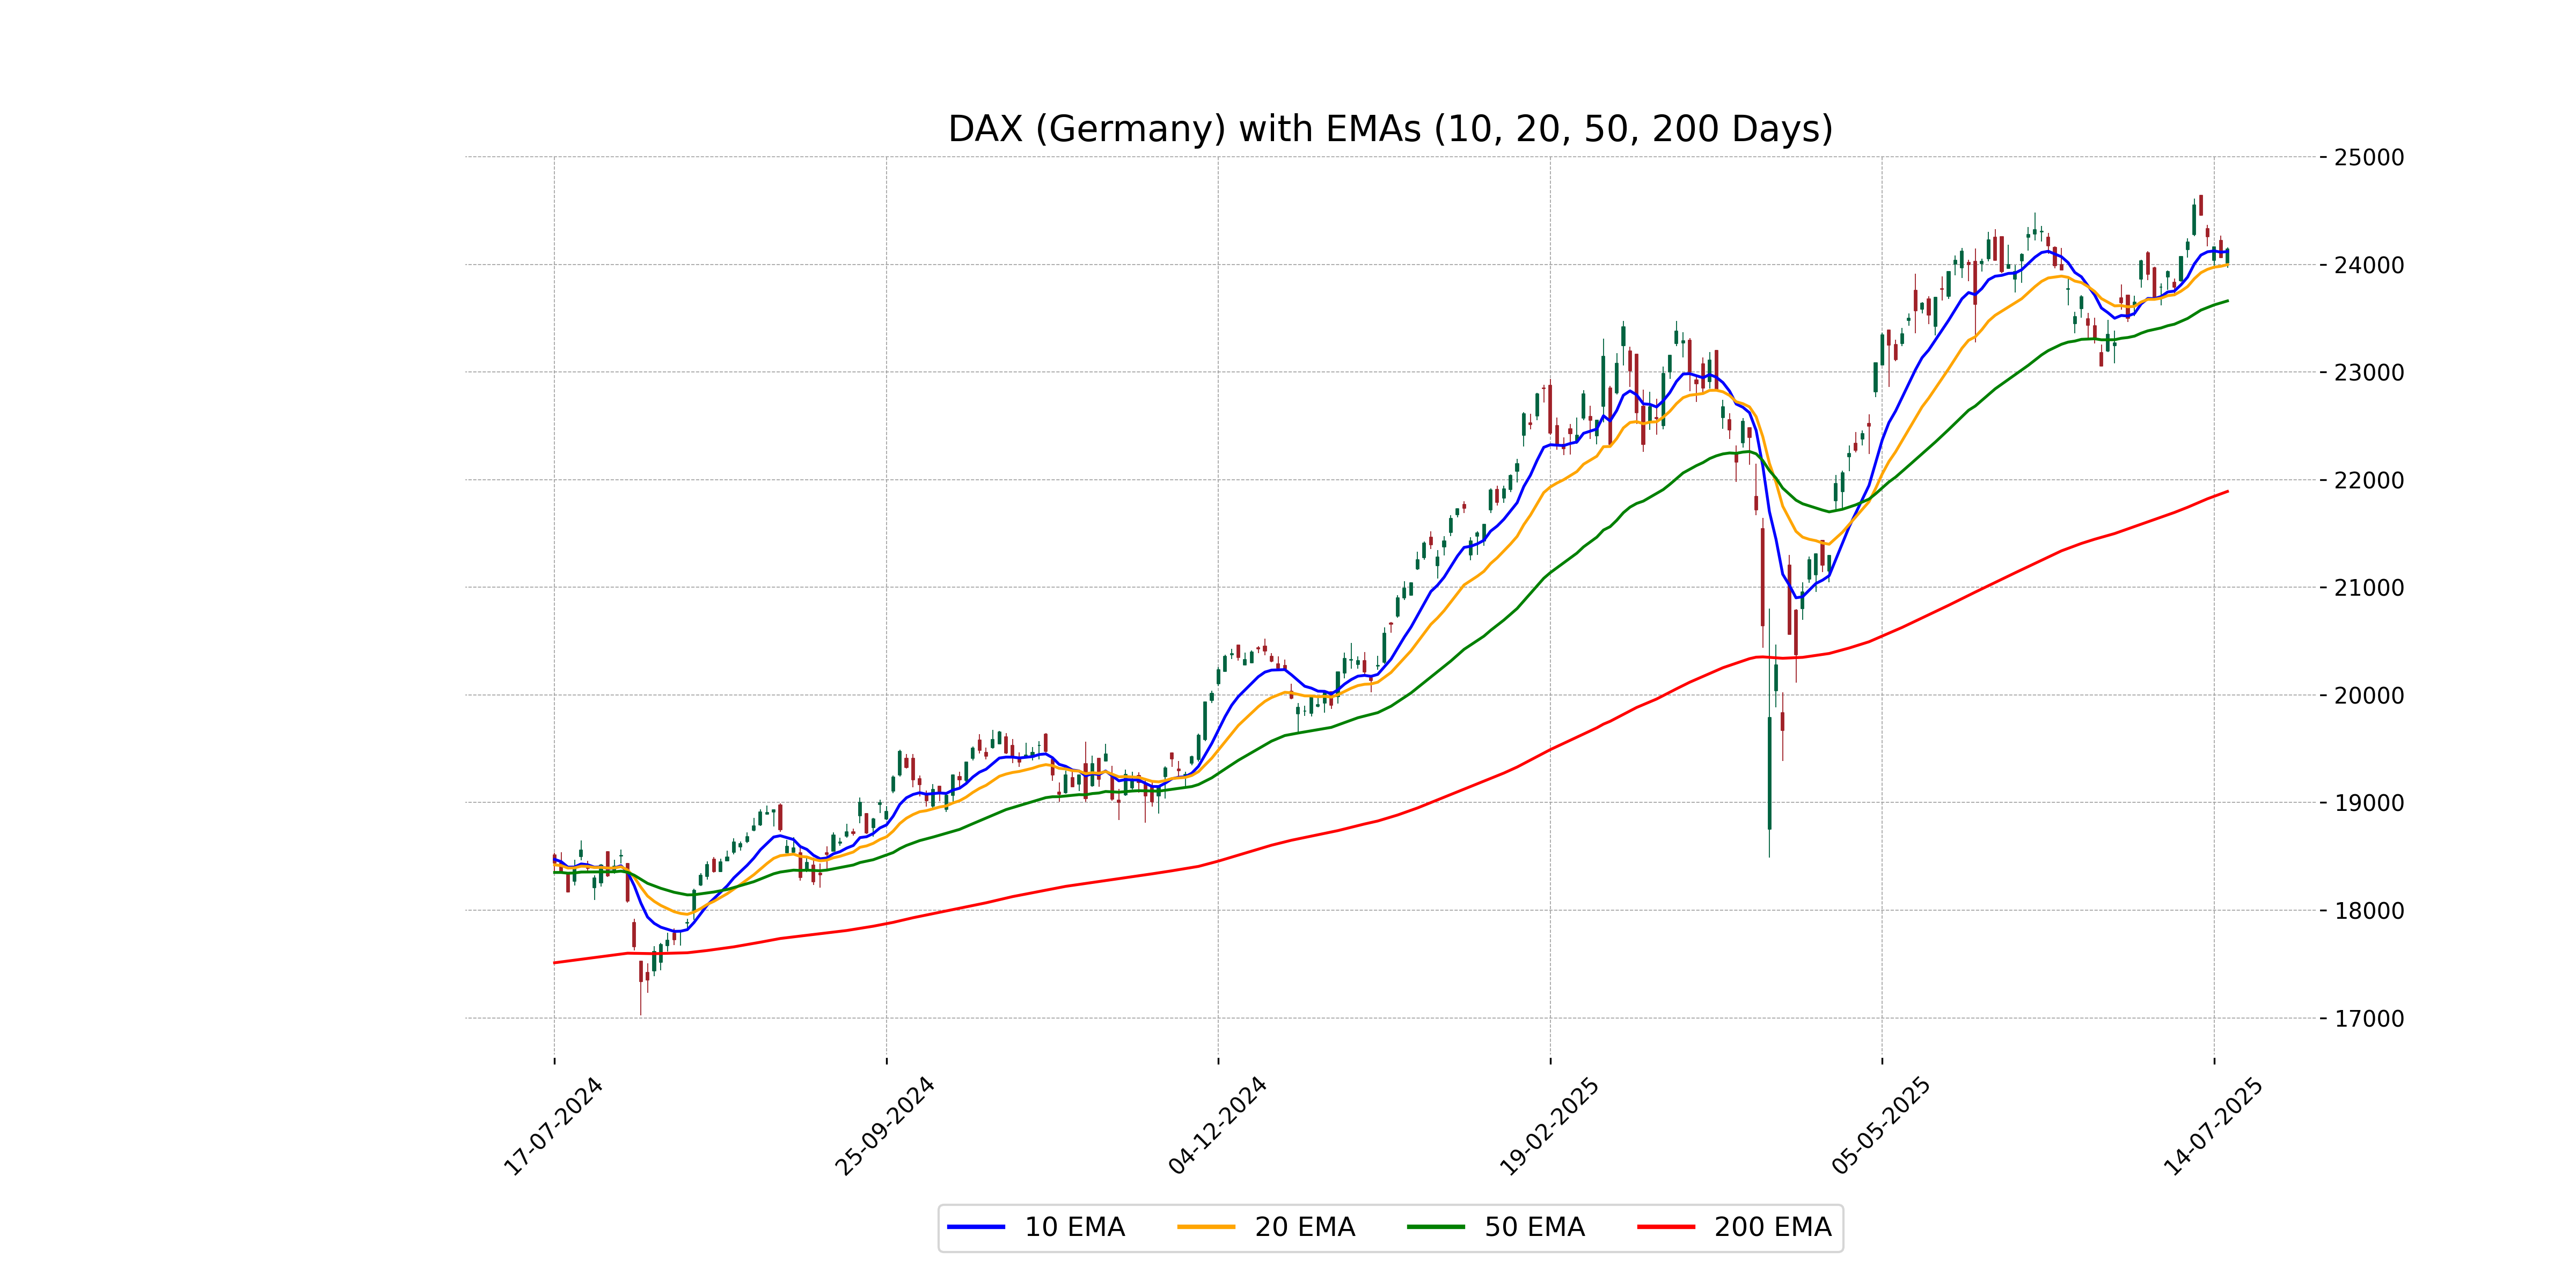
Relationship with Key Moving Averages
The DAX (Germany) closed above its 50 EMA (23,660.23) and 200 EMA (21,890.48), suggesting a bullish short-term trend. It also closed above its 10 EMA (24,118.67) and 20 EMA (23,997.42), indicating continued upward momentum.
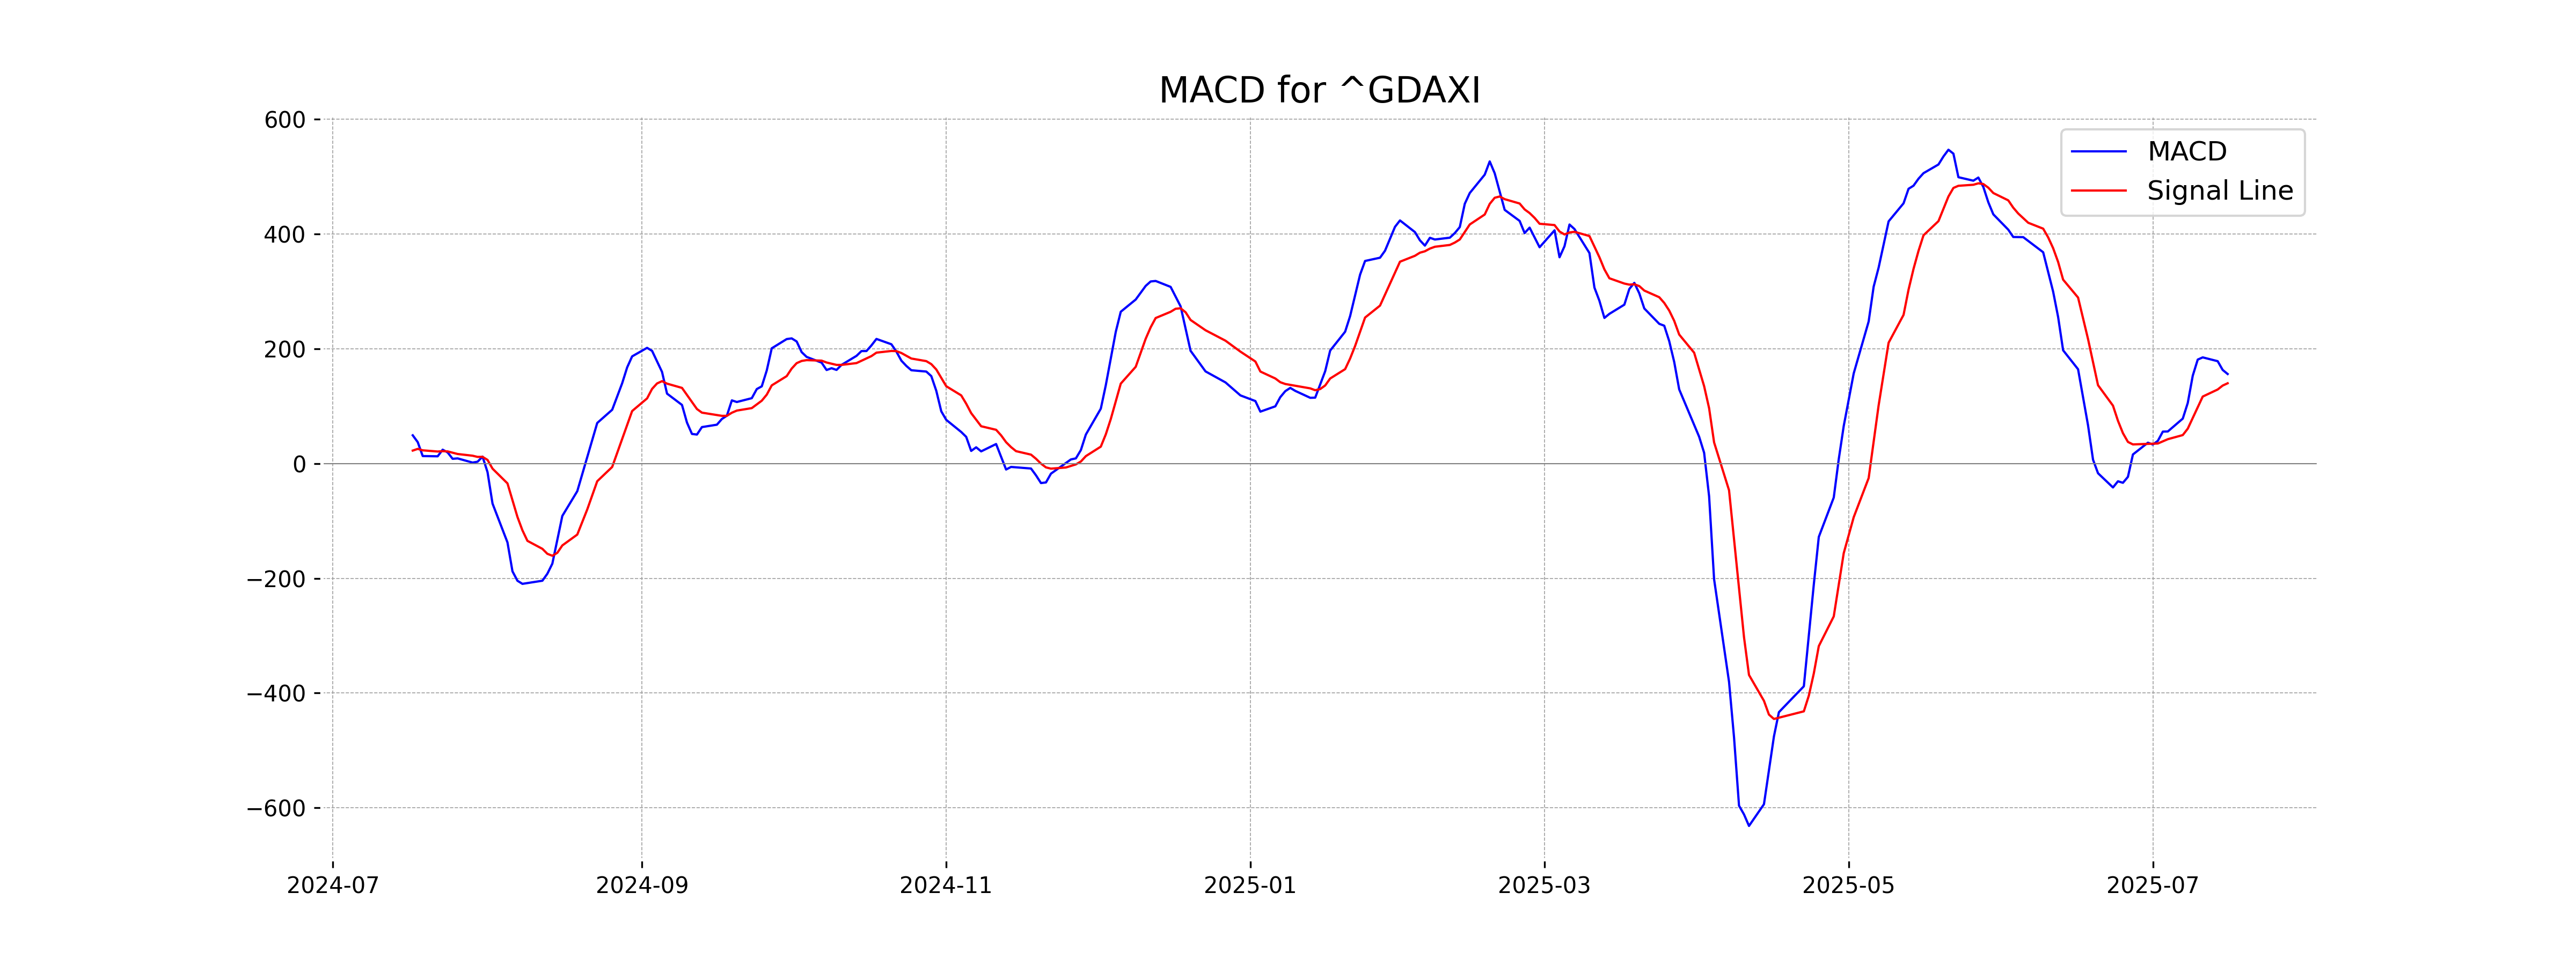
Moving Averages Trend (MACD)
The MACD value for DAX (Germany) is 156.13, which is above the MACD Signal value of 140.00, suggesting a bullish trend. This indicates potential positive momentum, as the MACD line is above the signal line.
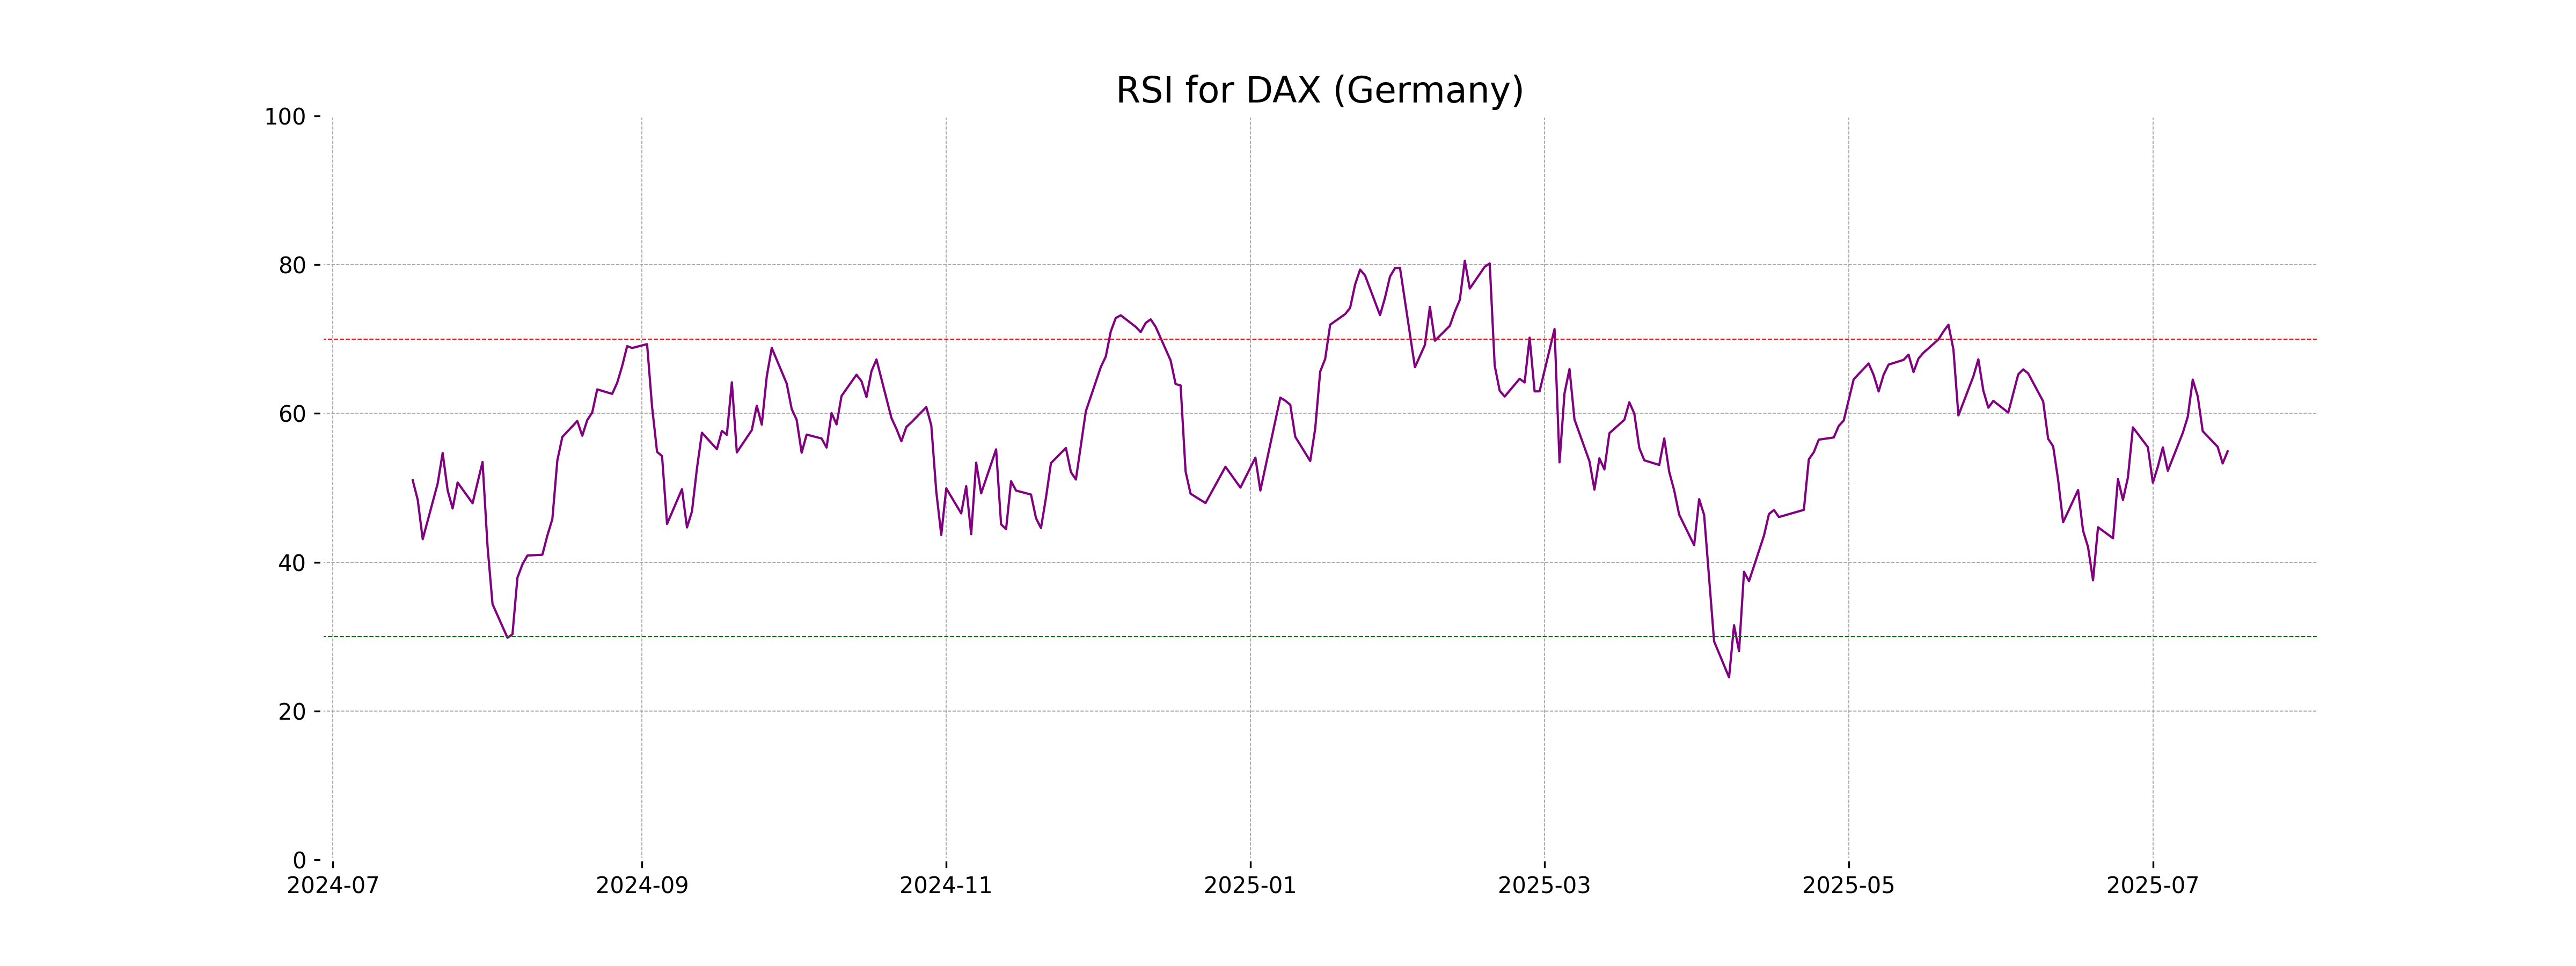
RSI Analysis
The RSI value for DAX (Germany) is 54.91, indicating it is in the neutral range. This suggests that the market is neither overbought nor oversold, implying potential stability in the short term. Investors may consider additional factors for a comprehensive decision.
Analysis for S&P 500 (US) - July 16, 2025
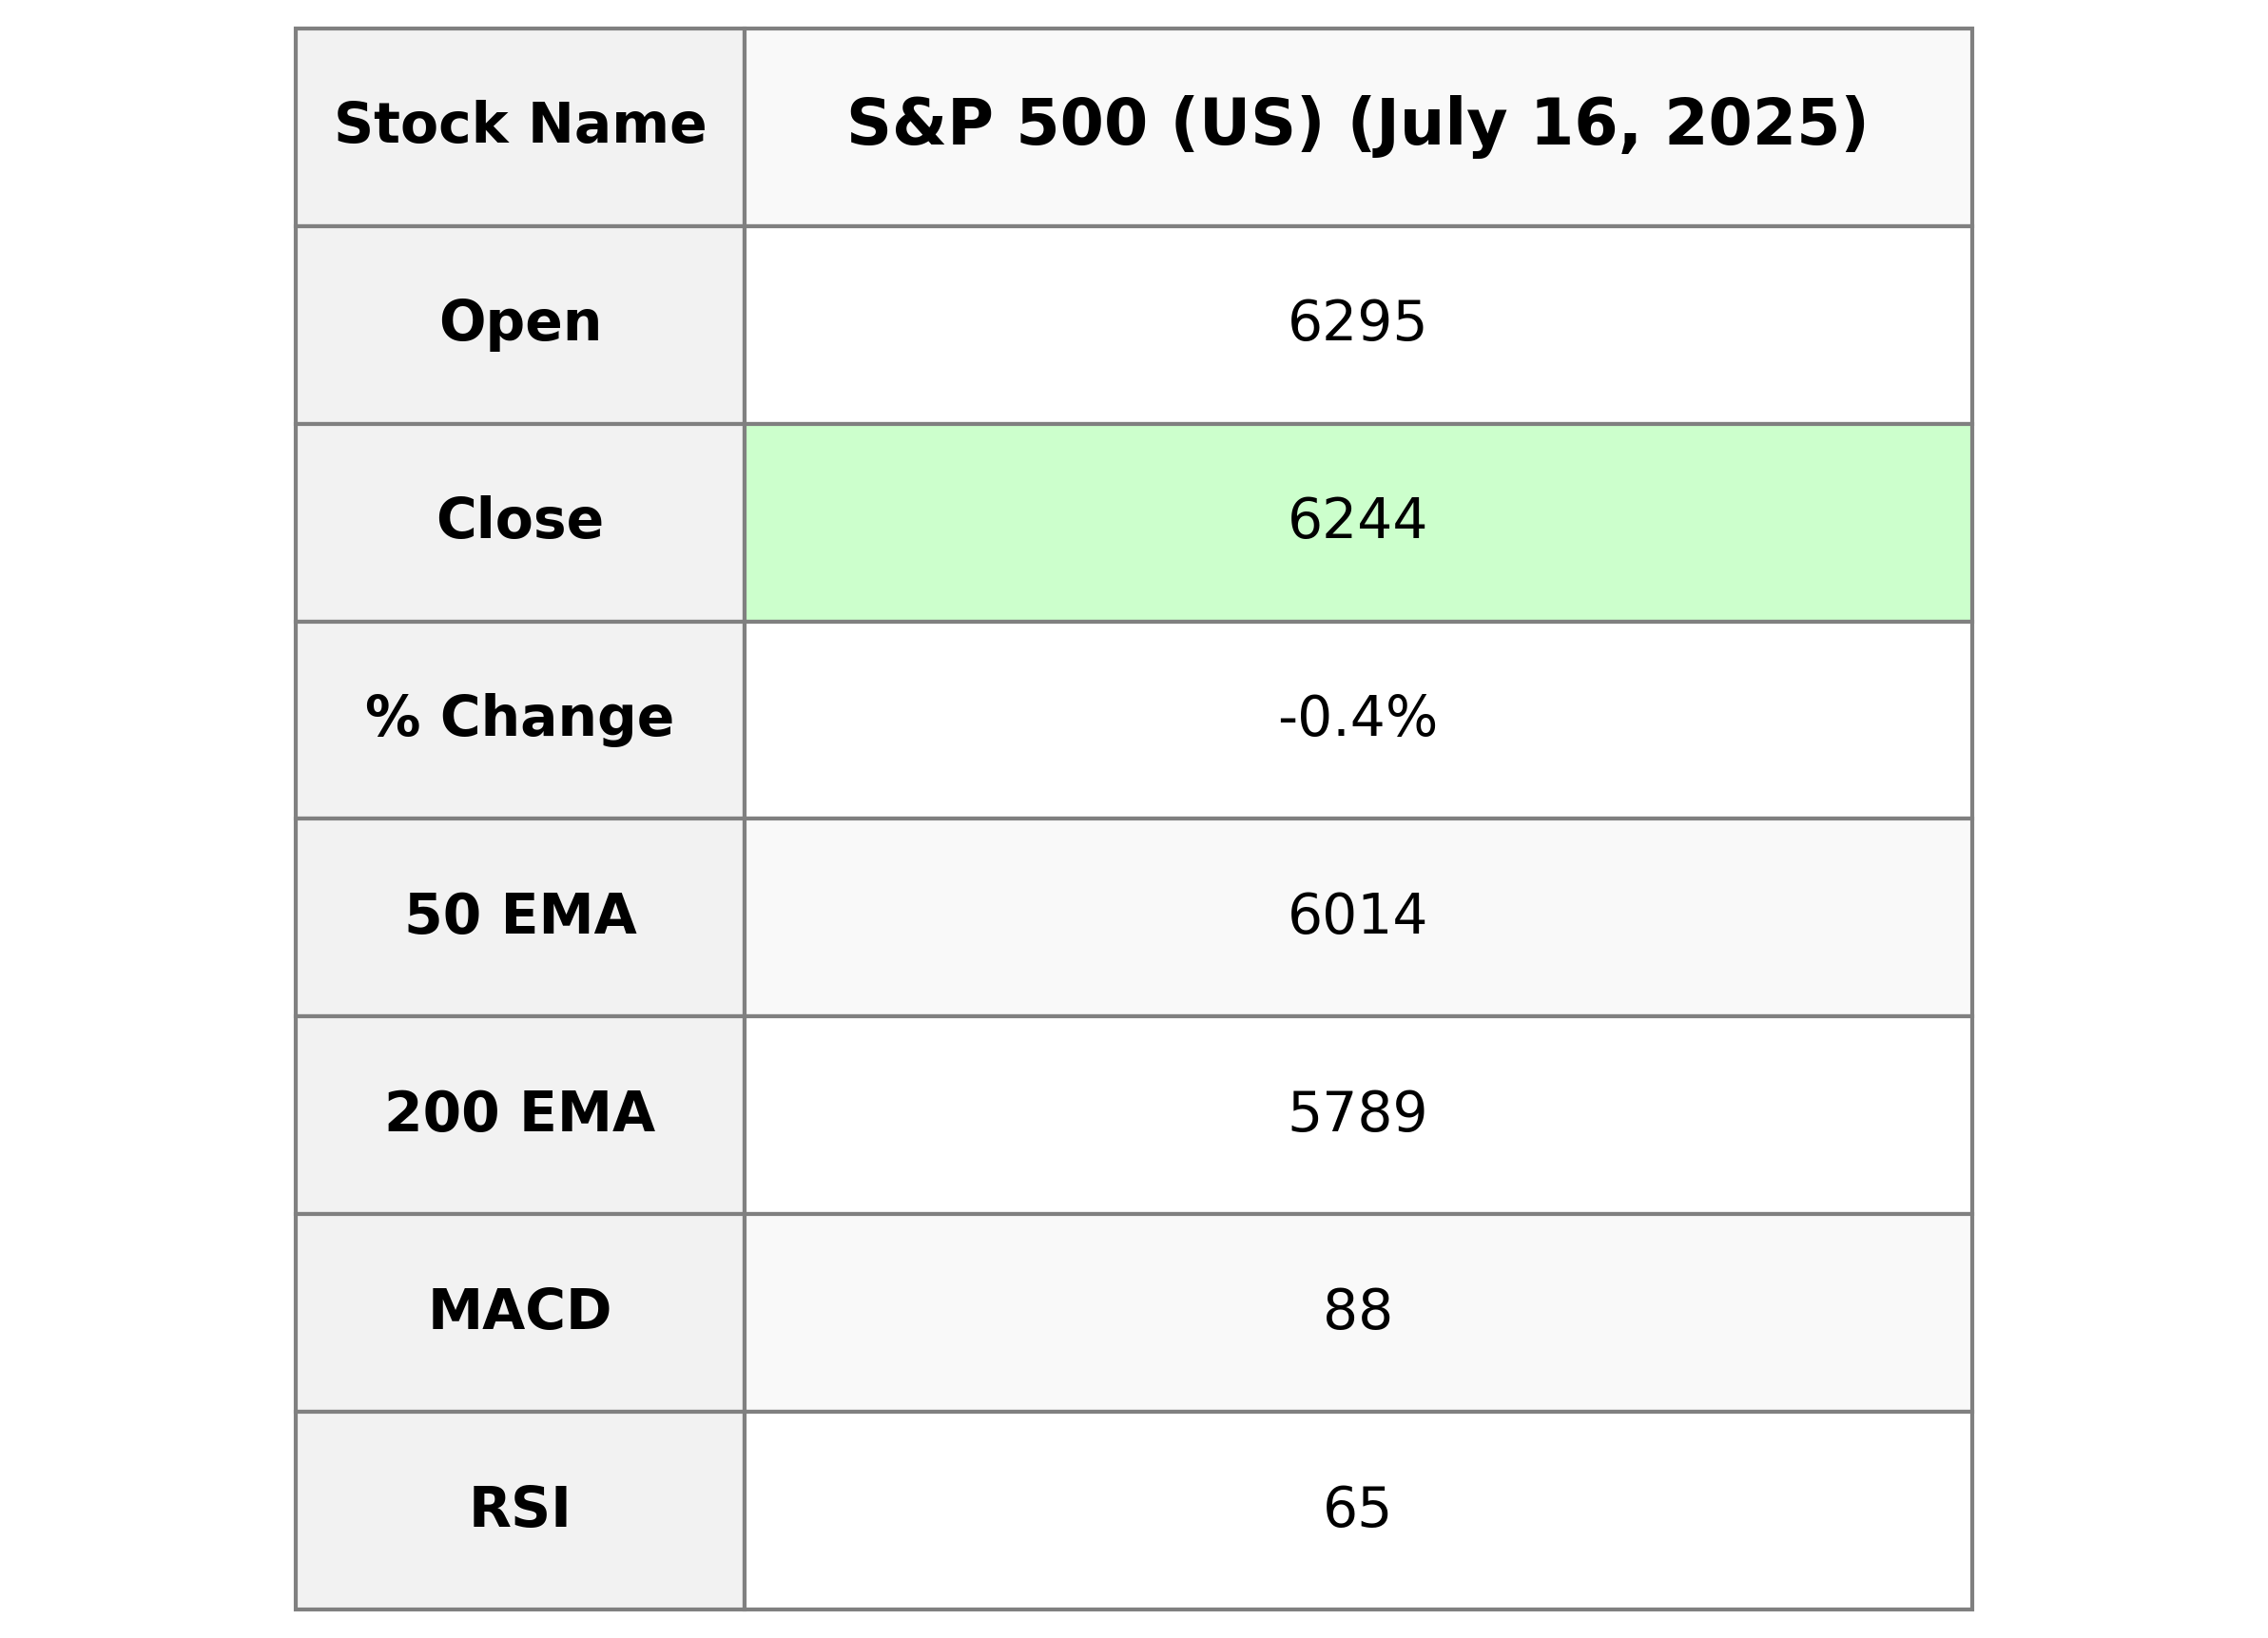
The S&P 500 opened at 6295.29, reaching a high of 6302.04 and a low of 6241.68, ultimately closing at 6243.76. There was a decrease of 0.40% or 24.80 points compared to the previous close of 6268.56. The volume traded was 5.13 billion. The 50-day EMA was 6013.89, while the 200-day EMA was 5788.58. The RSI was moderately high at 64.75, and the MACD indicates a minor downtrend compared to its signal line.
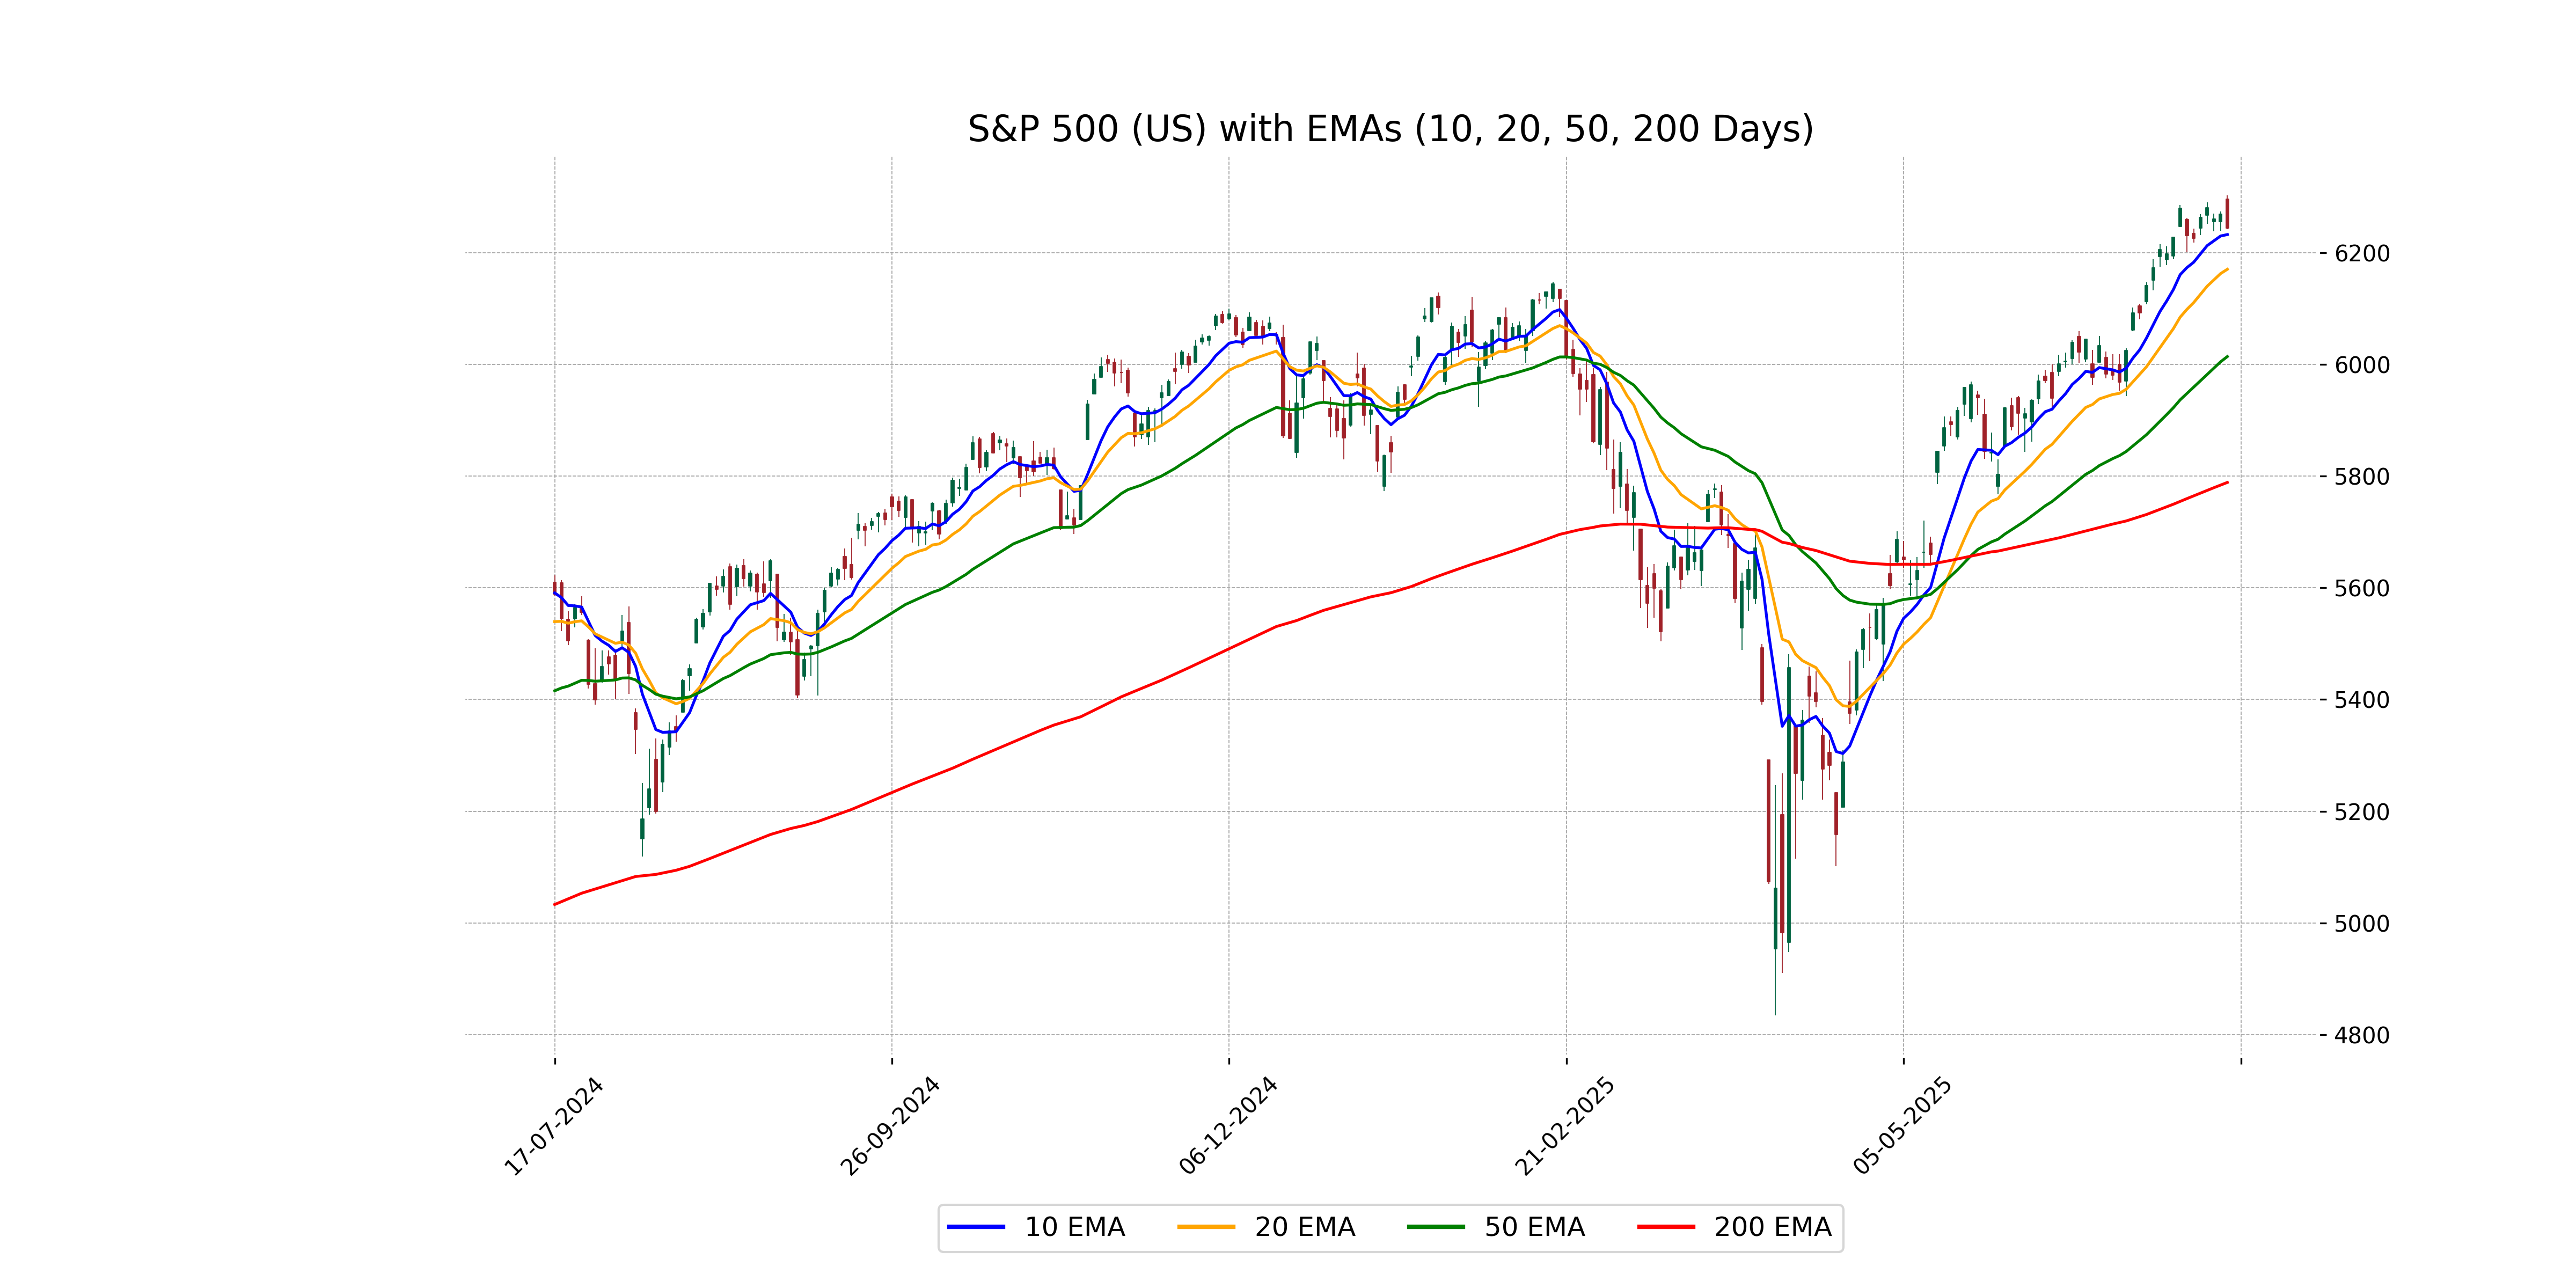
Relationship with Key Moving Averages
The S&P 500 opened at 6295.29 and closed slightly lower at 6243.76, below its 10-day EMA (6232.21), indicating recent downward movement. The closing price is above both the 50-day EMA (6013.89) and the 200-day EMA (5788.58), reflecting a longer-term uptrend despite the short-term pullback.
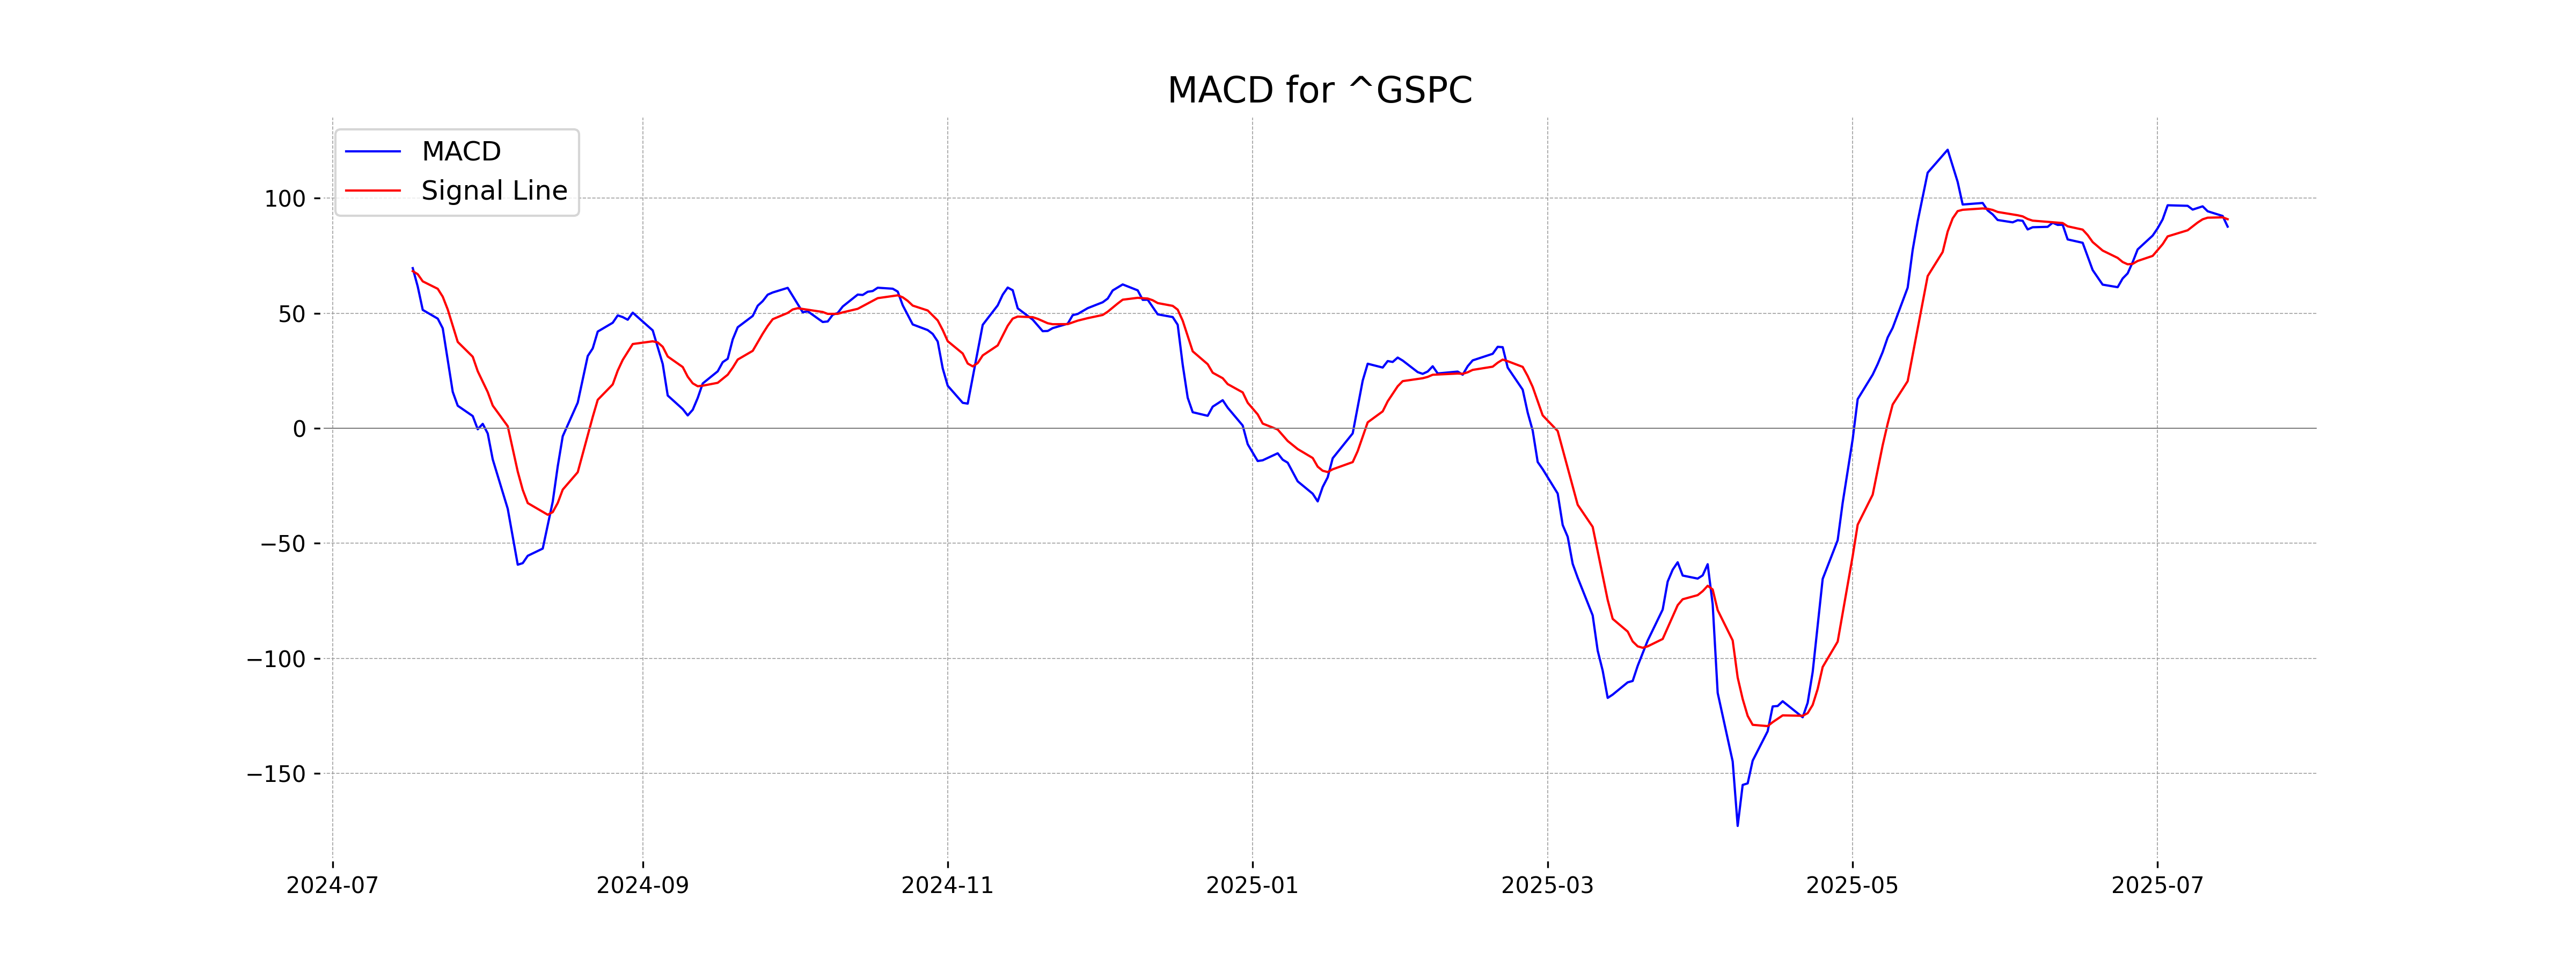
Moving Averages Trend (MACD)
S&P 500 (US) shows a MACD of 87.66 which is below its MACD Signal of 90.89, indicating a bearish trend. This suggests potential downward momentum in the market.
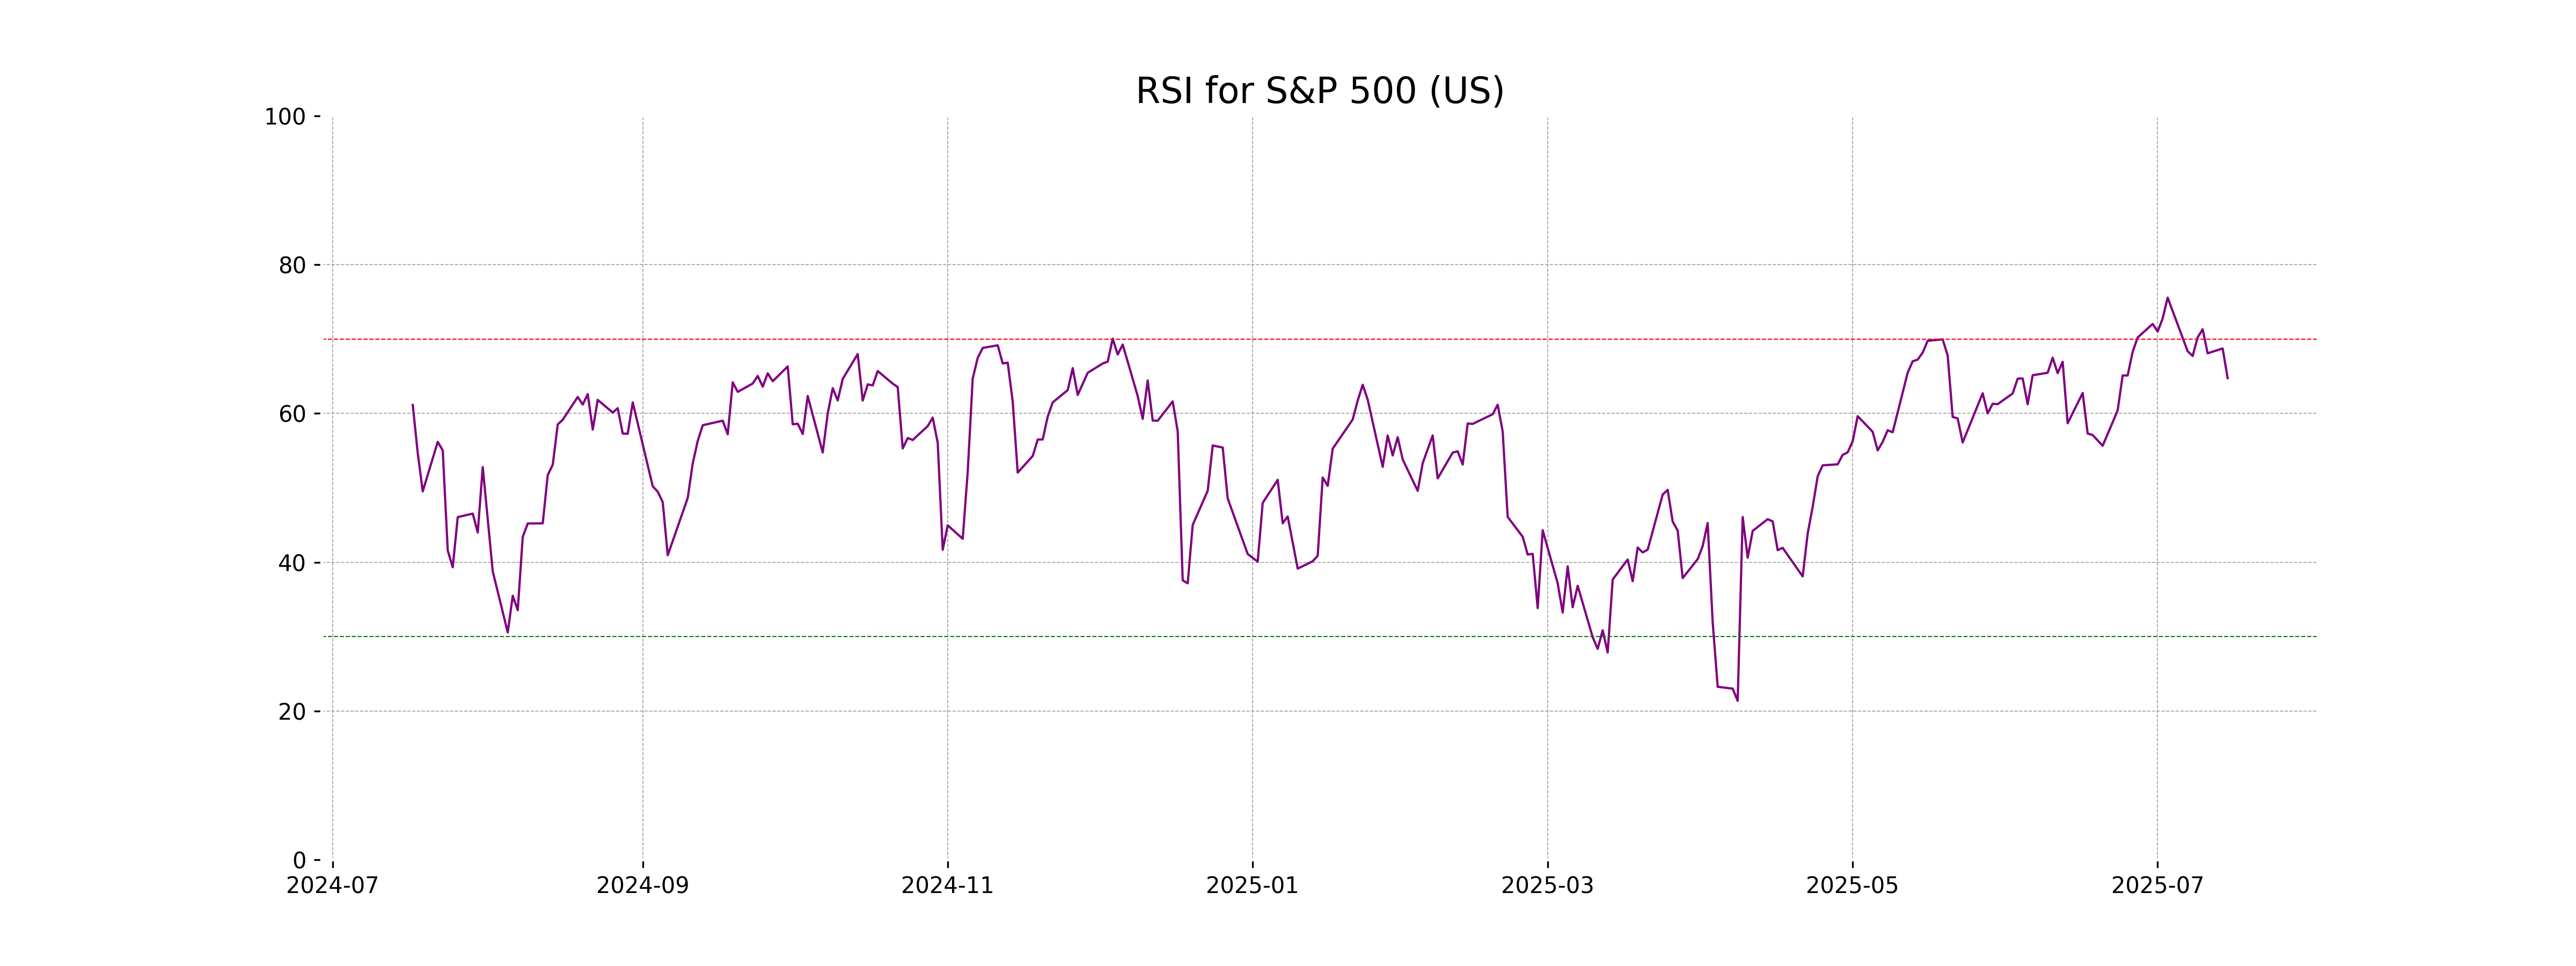
RSI Analysis
The RSI for S&P 500 is 64.75, indicating a moderately strong momentum. Since RSI values above 70 might suggest overbought conditions and below 30 might suggest oversold conditions, the index is currently not in overbought territory and suggests a neutral to slightly bullish trend.
Analysis for Hang Seng Index (Hong Kong) - July 16, 2025
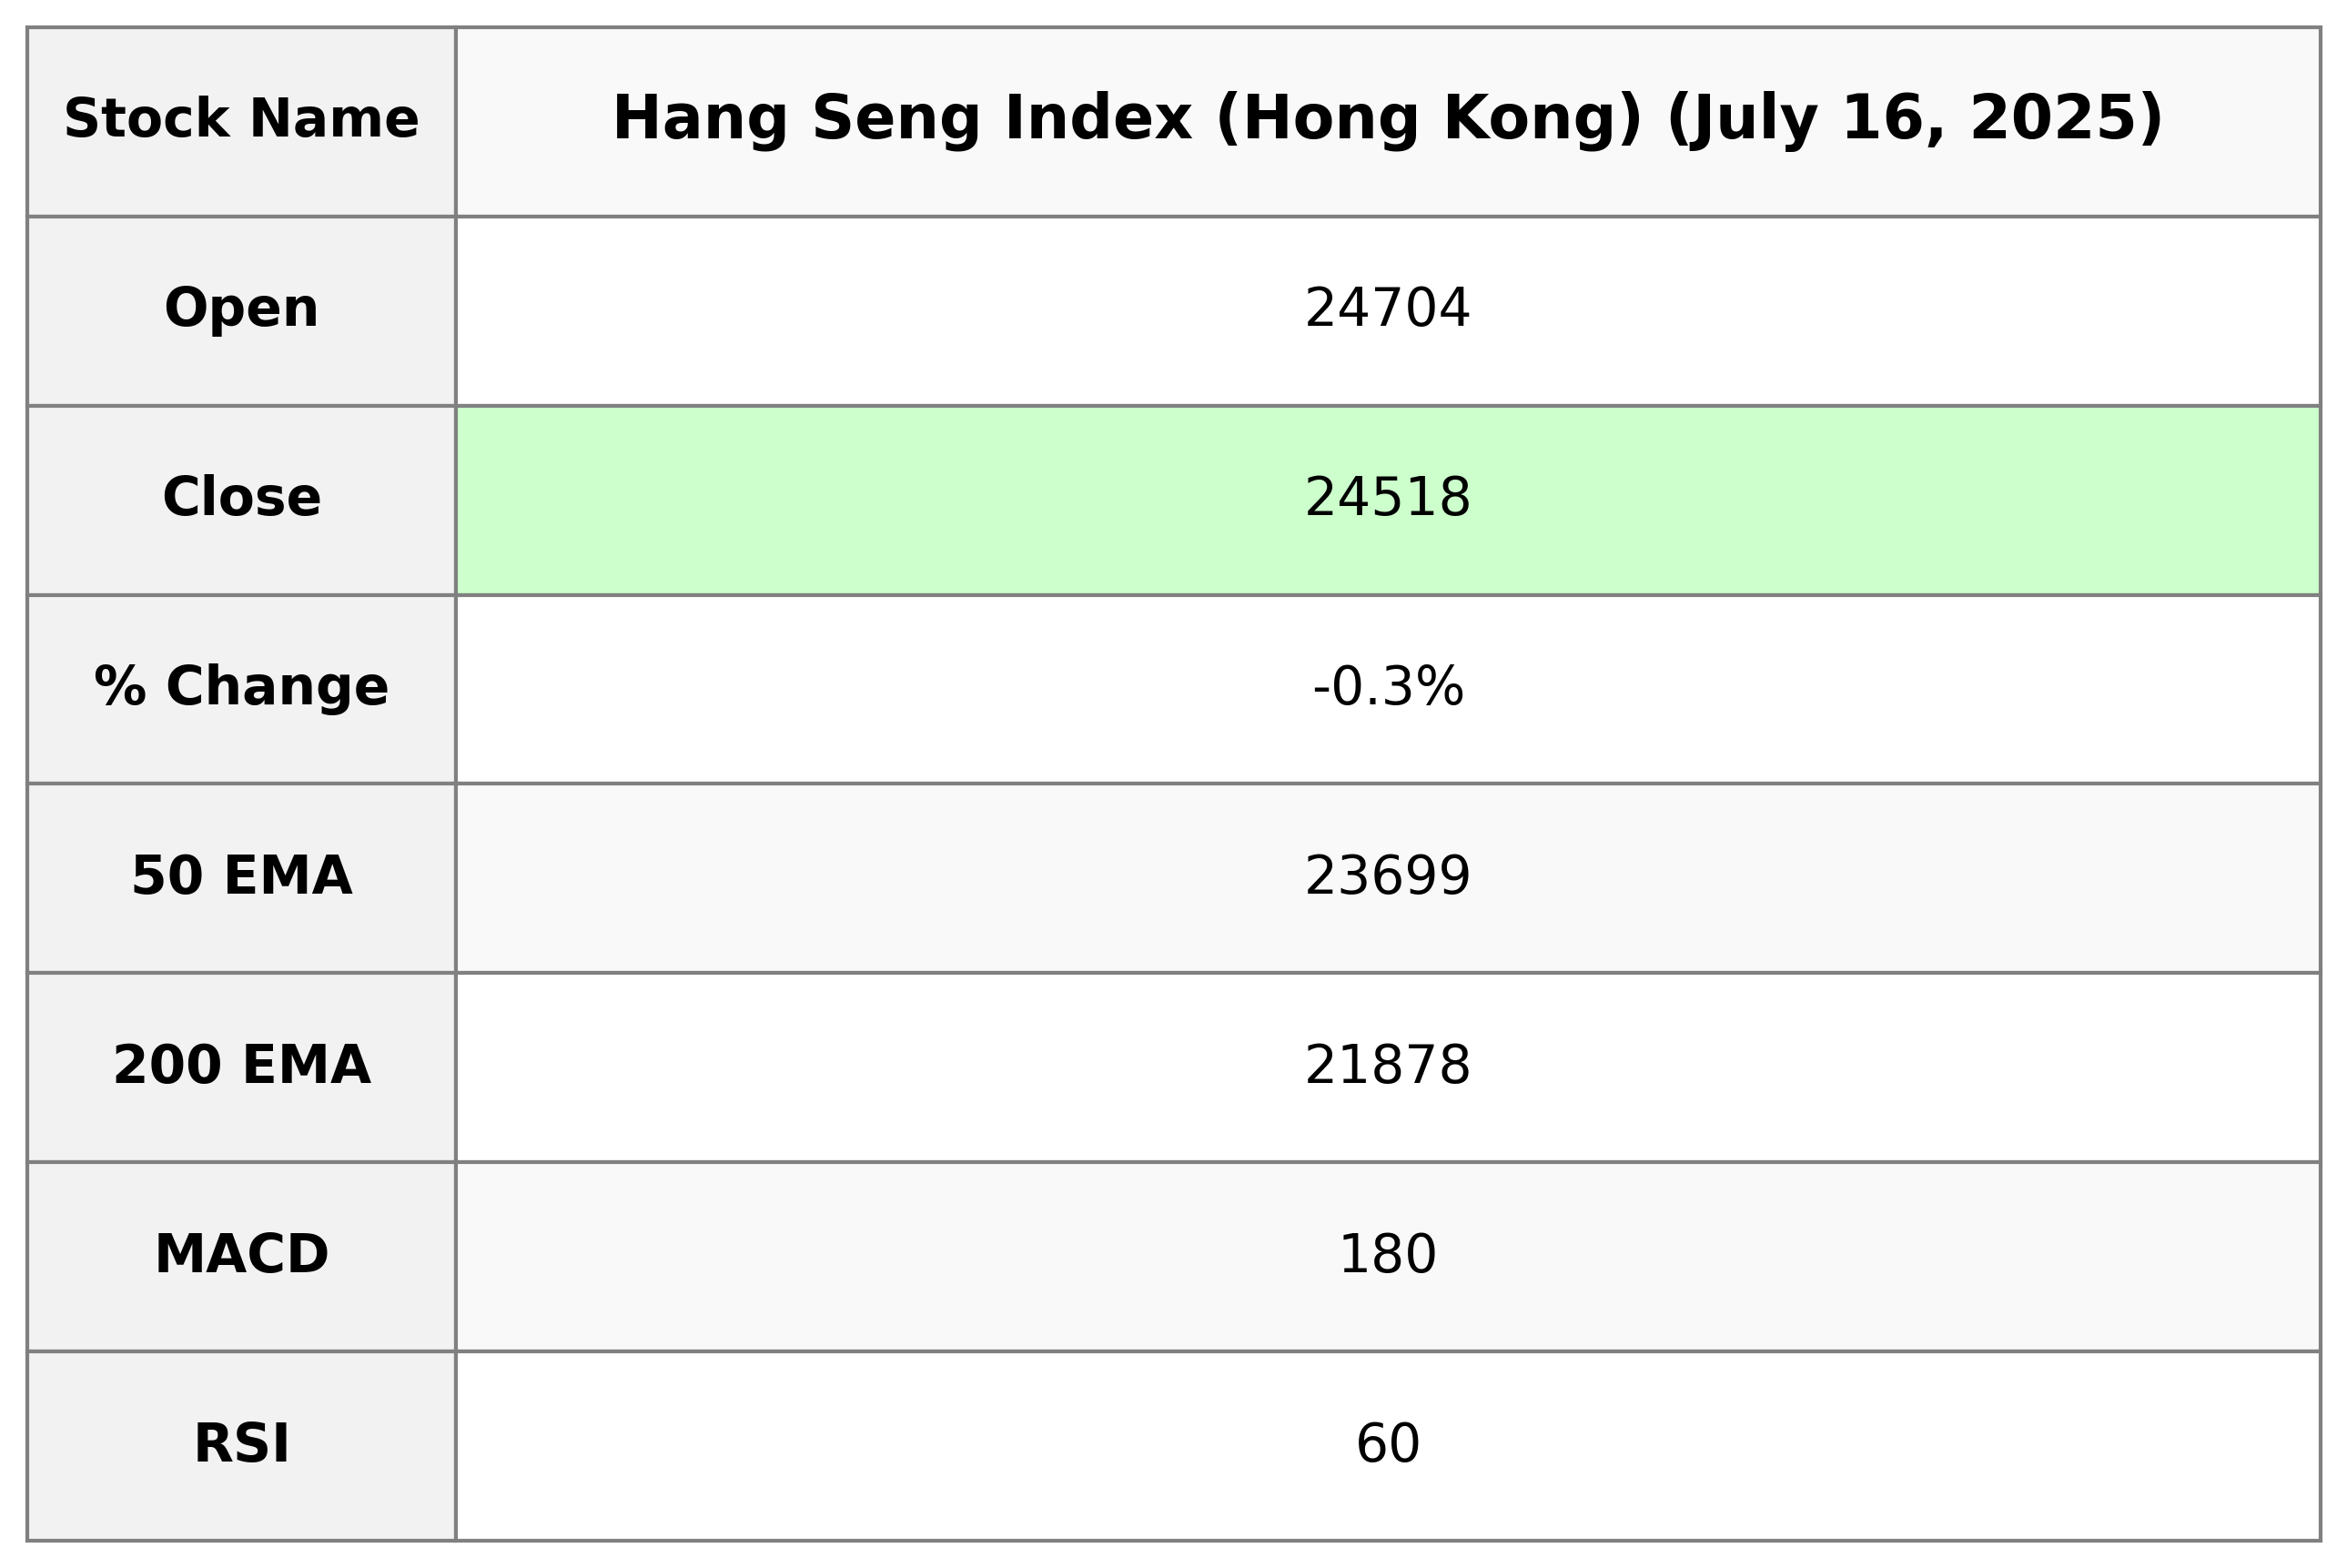
The Hang Seng Index opened at 24,704.05 and closed at 24,517.76, marking a decrease of 72.36 points or a -0.29% change from the previous close of 24,590.12. The index saw a high of 24,867.81 and a low of 24,517.75, with a significant RSI of 60.22 indicating moderate momentum and a positive MACD reflecting bullish market conditions.
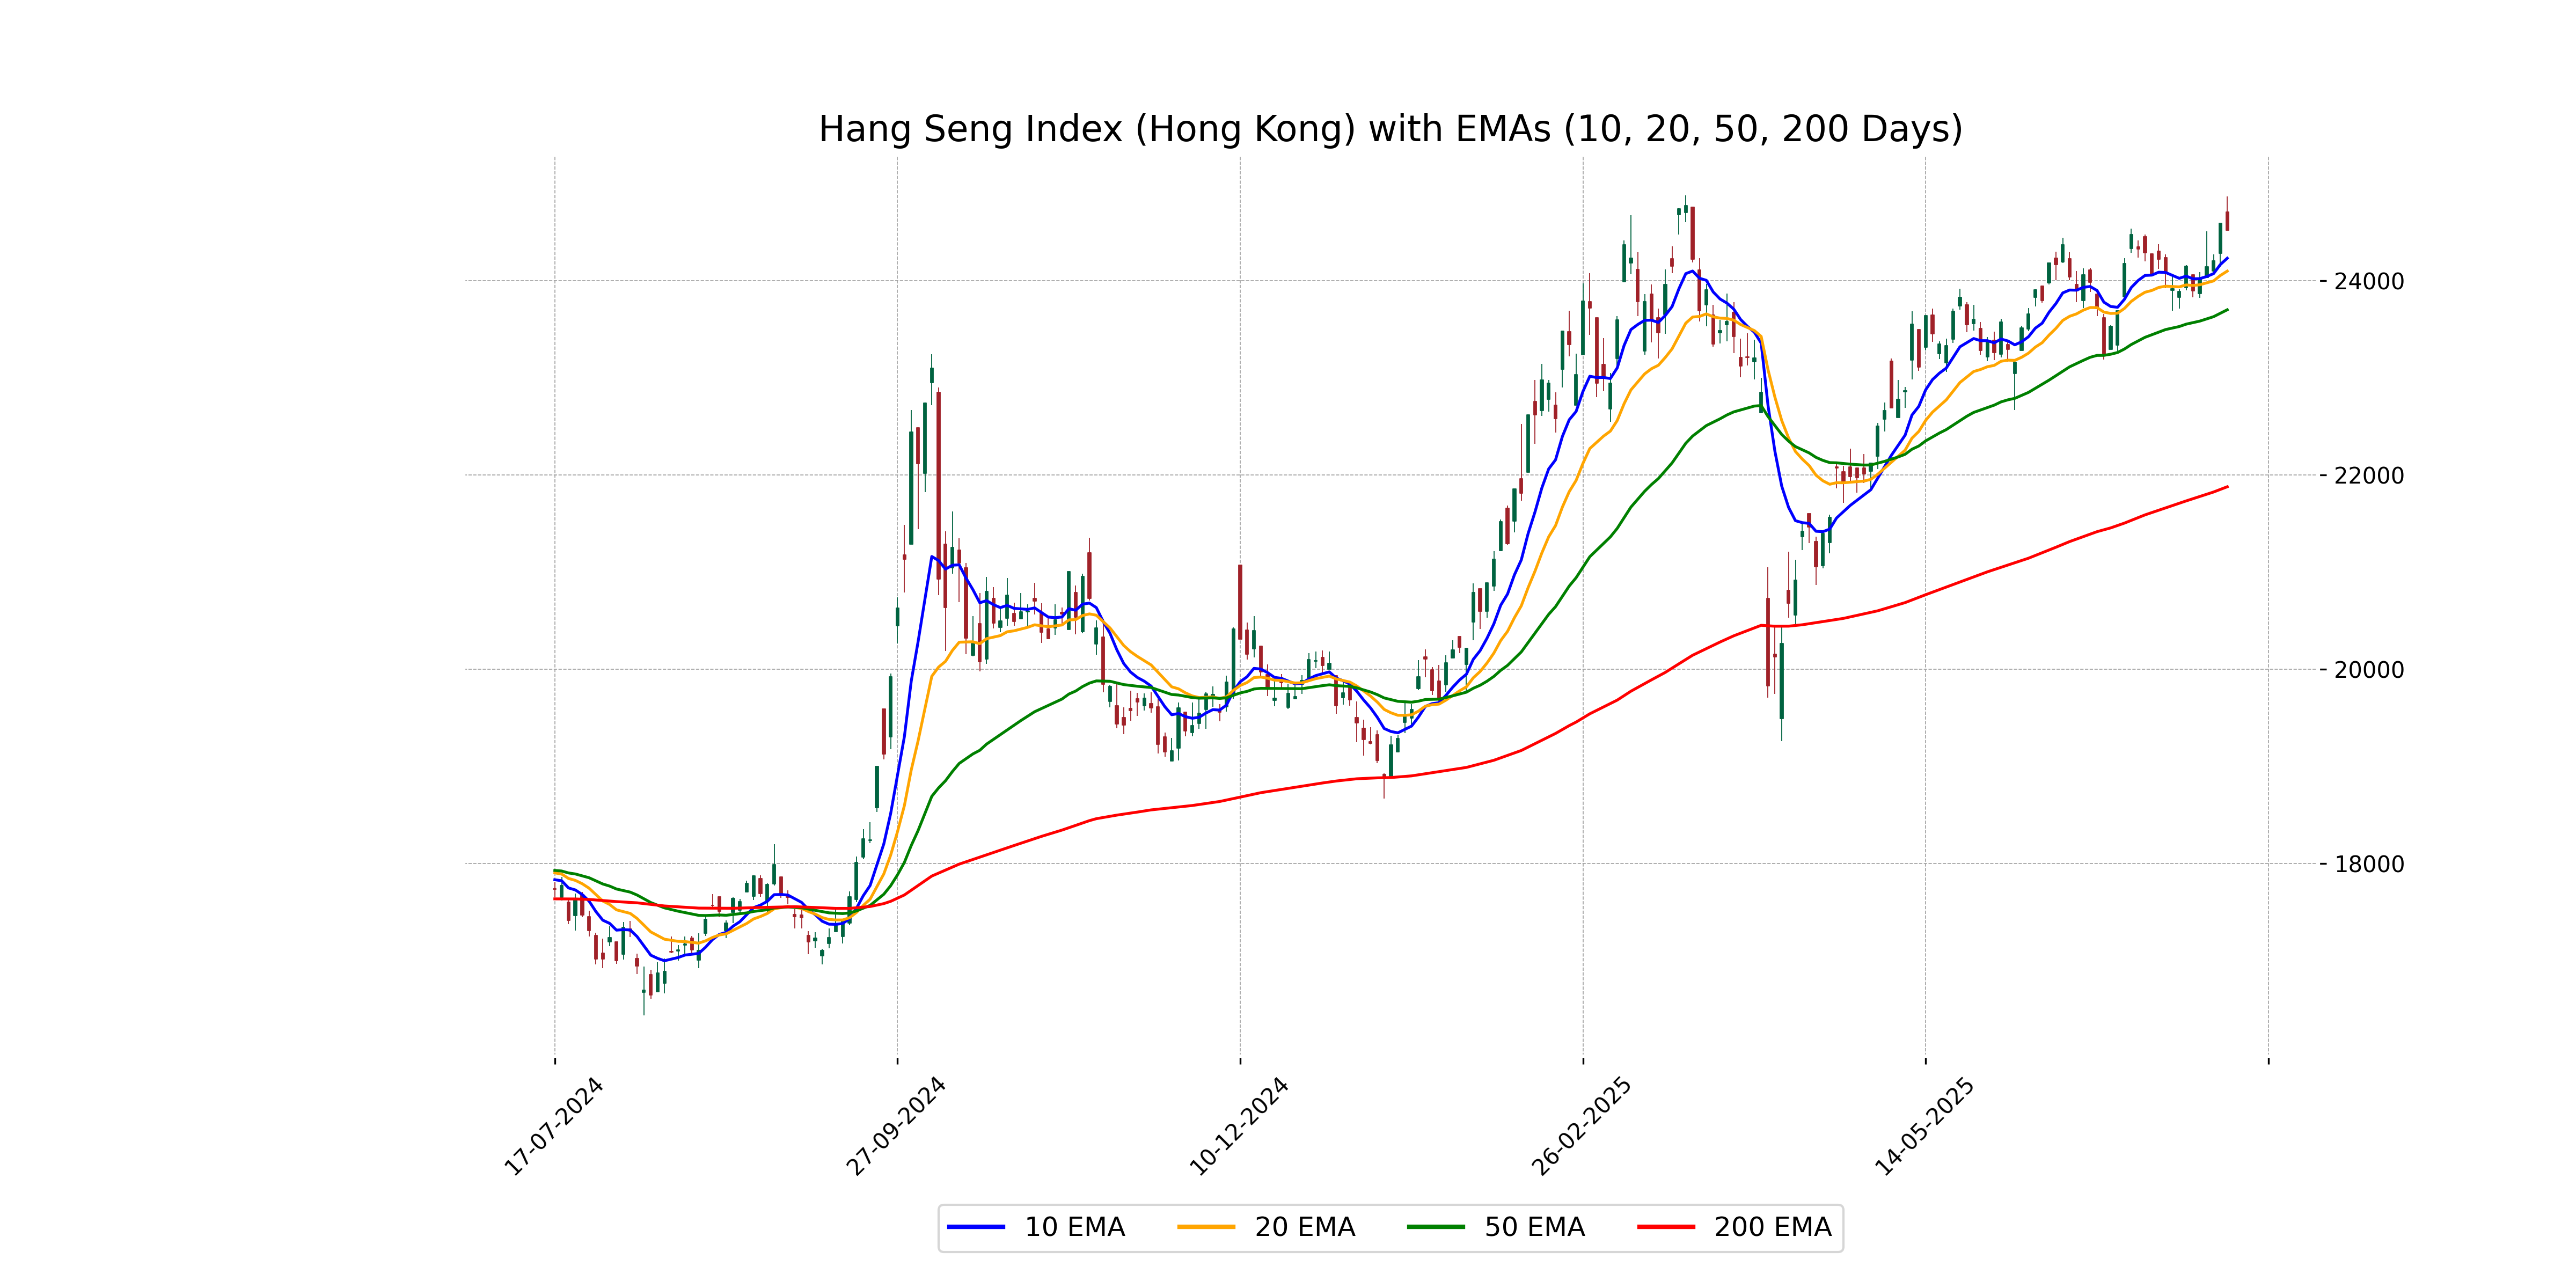
Relationship with Key Moving Averages
The closing value of Hang Seng Index is 24,517.76, which is above the 50 EMA (23,699.11) and the 200 EMA (21,878.19), indicating a bullish trend in the short to medium term. However, it is below the 10 EMA (24,229.34) and 20 EMA (24,096.78), suggesting recent short-term bearish pressure.
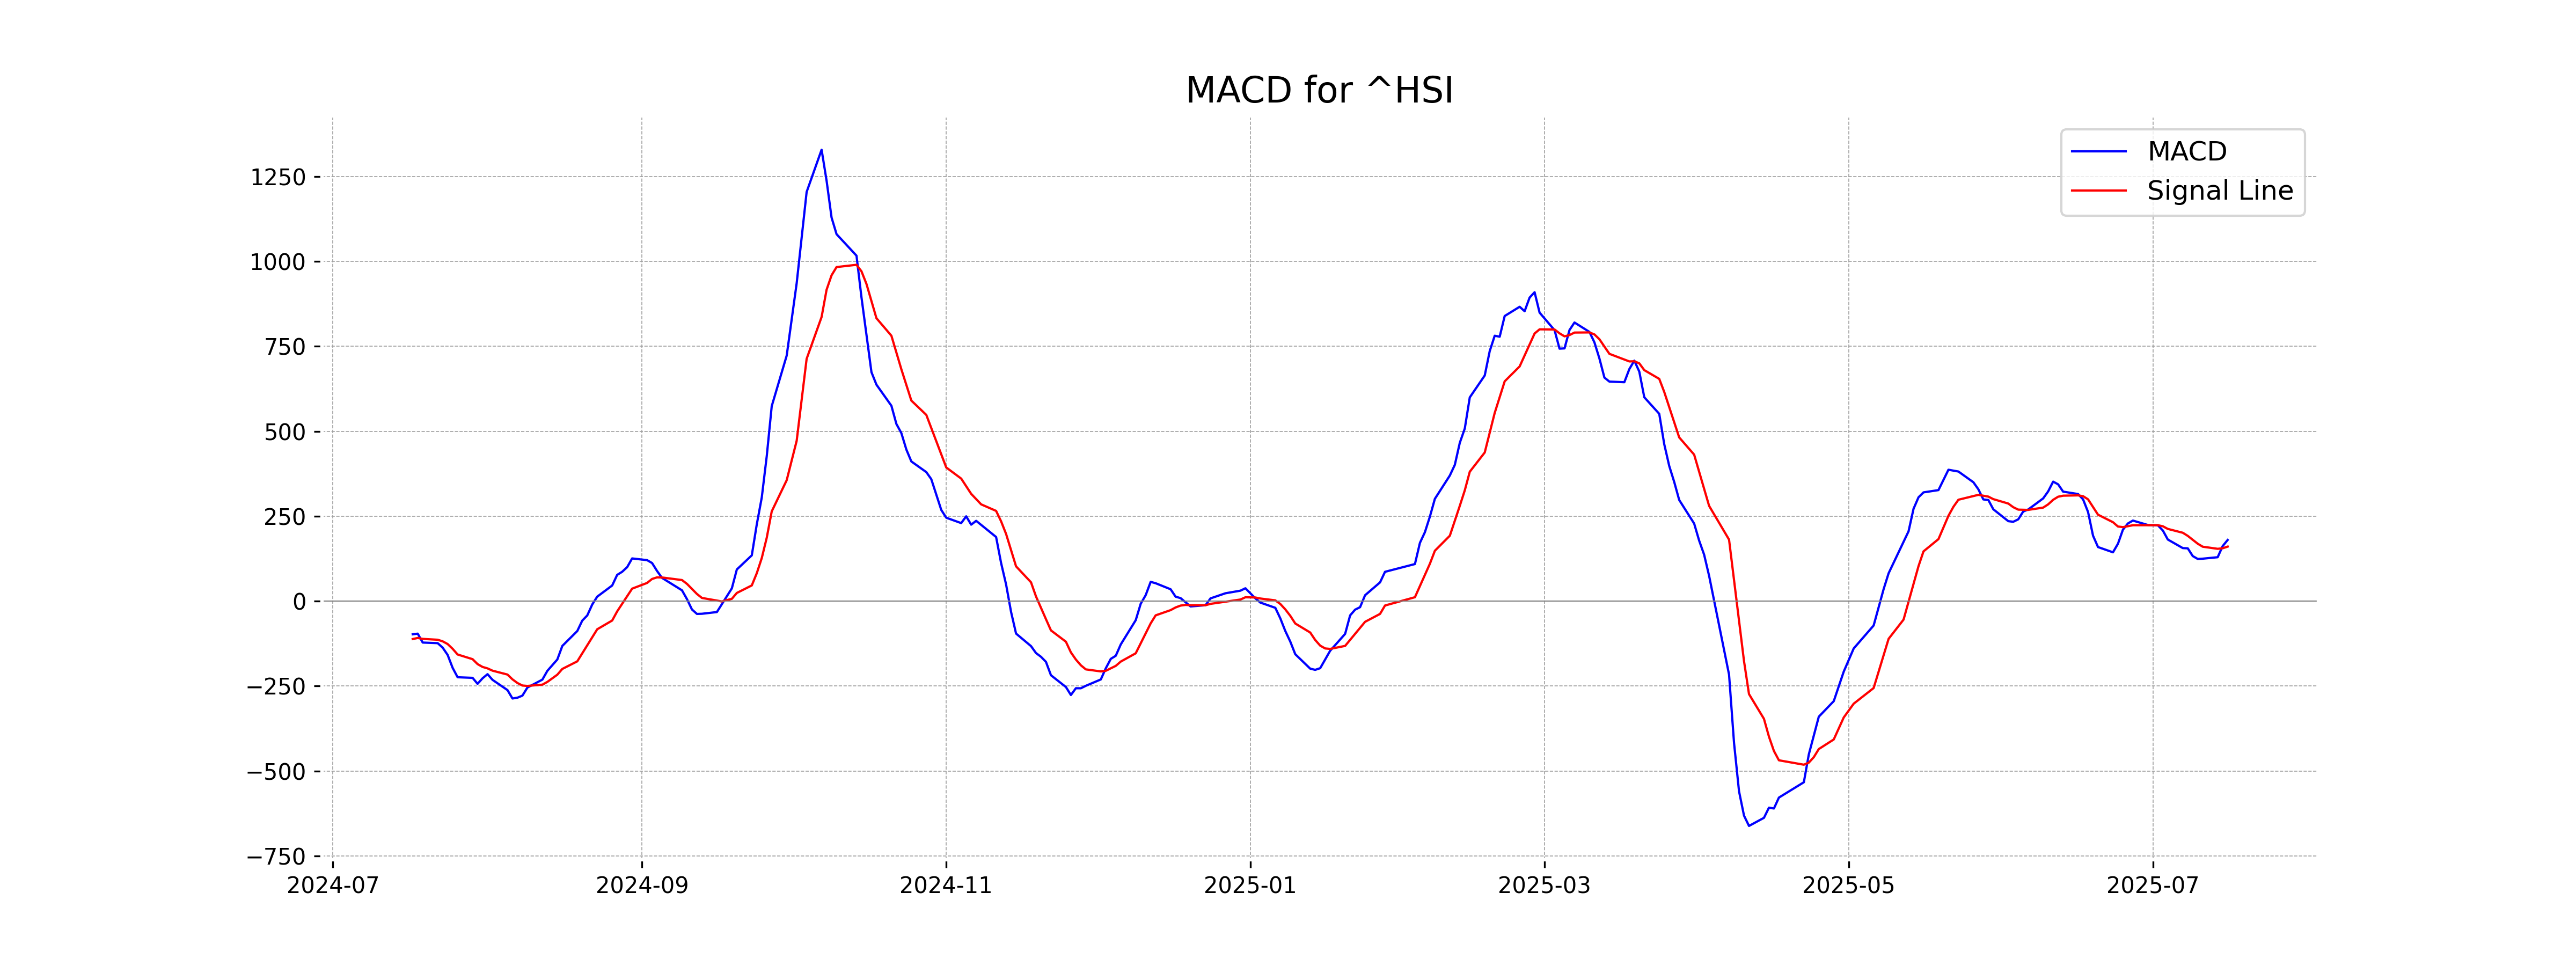
Moving Averages Trend (MACD)
MACD Analysis for Hang Seng Index (Hong Kong): The MACD value is 179.96, which is higher than the MACD Signal line at 160.41. This suggests a bullish sentiment, indicating potential upward momentum in the Hang Seng Index.
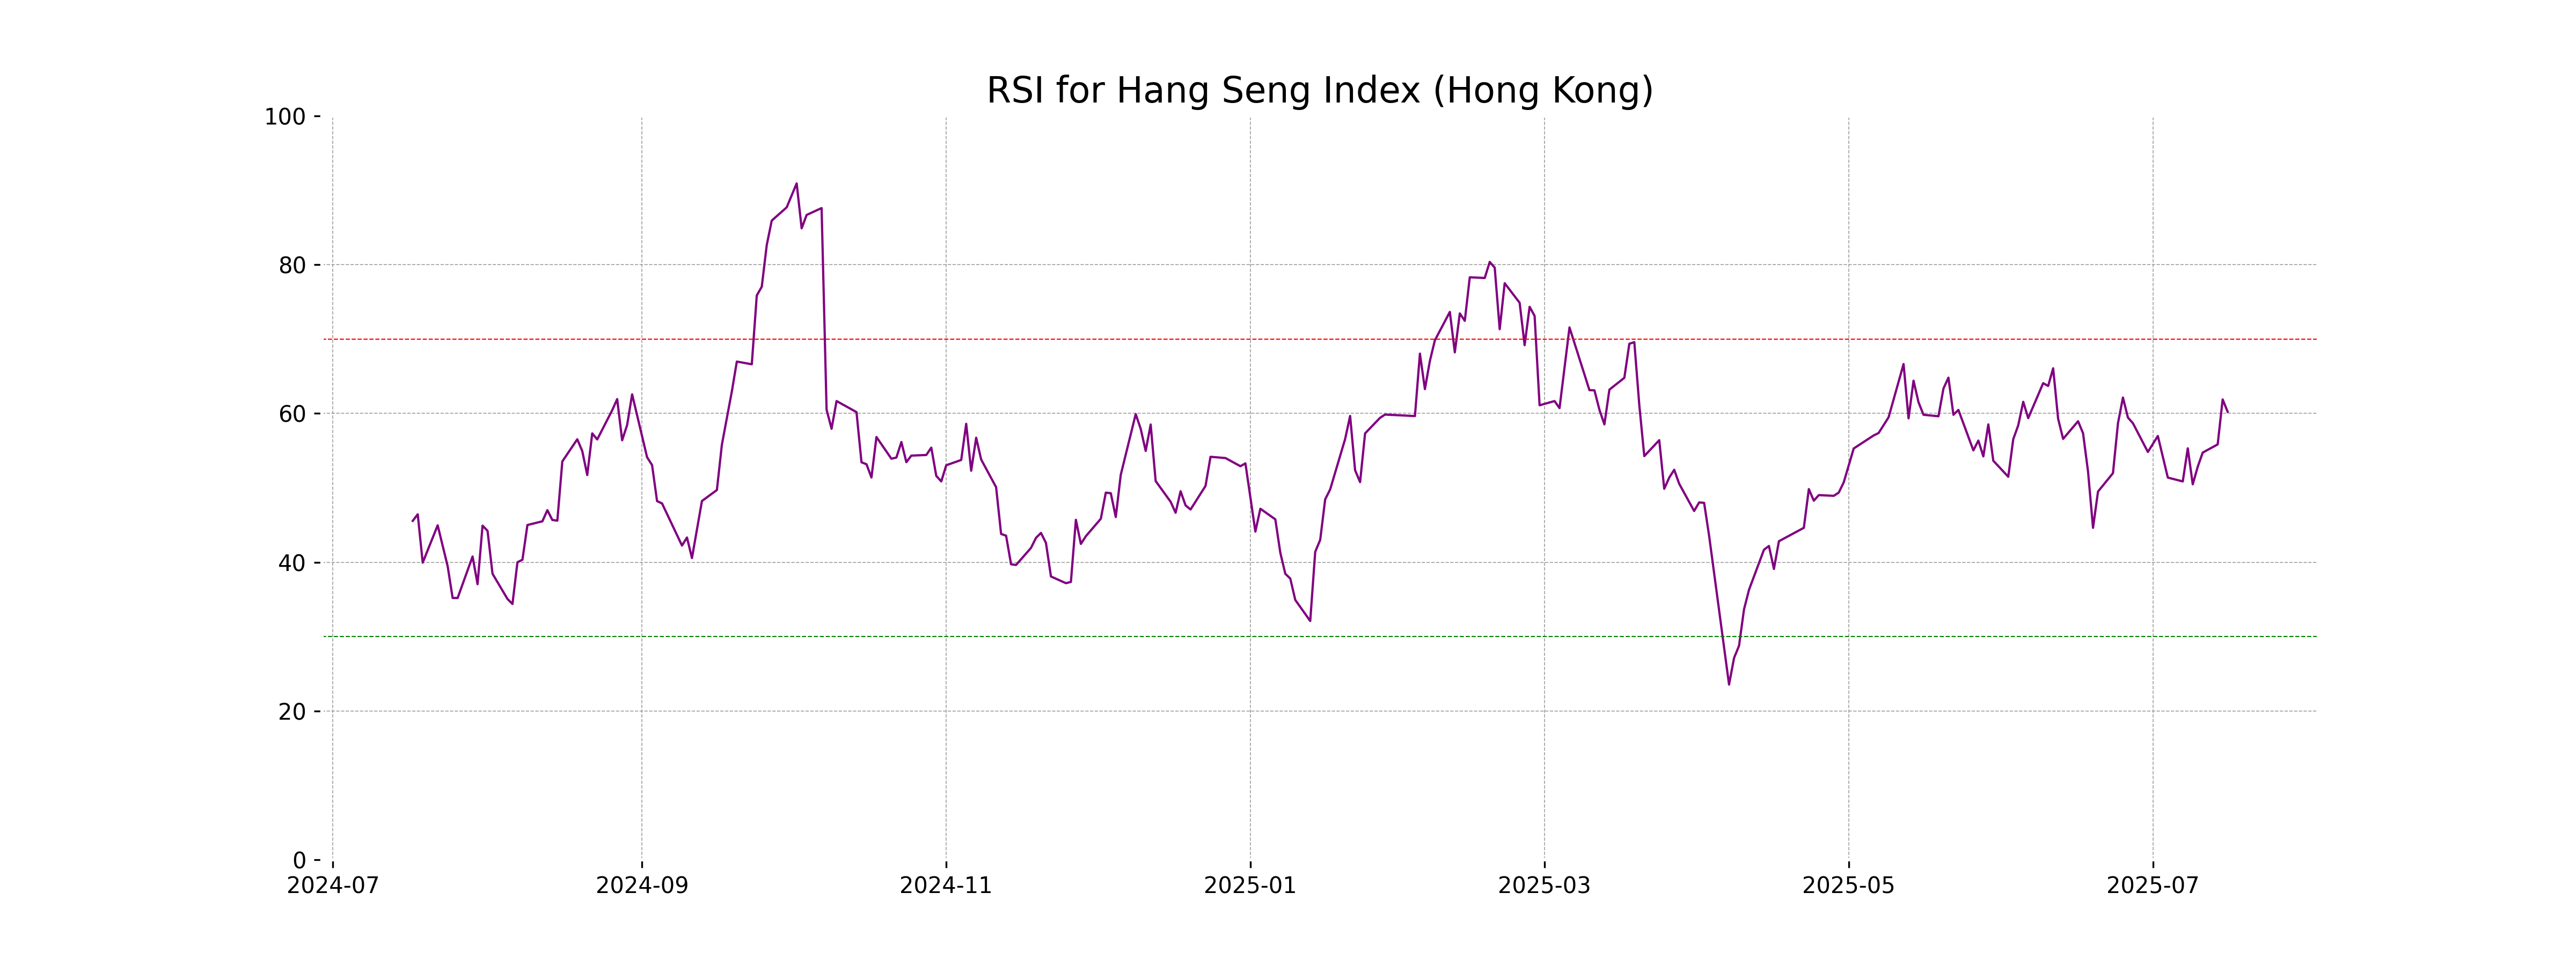
RSI Analysis
RSI Analysis for Hang Seng Index (Hong Kong): The RSI value for the Hang Seng Index is 60.22, which indicates a neutral to slightly bullish momentum. Generally, an RSI value above 50 suggests more buying pressure than selling pressure, but it is not yet in the overbought territory that typically begins at an RSI above 70.
Analysis for IBEX 35 (Spain) - July 16, 2025
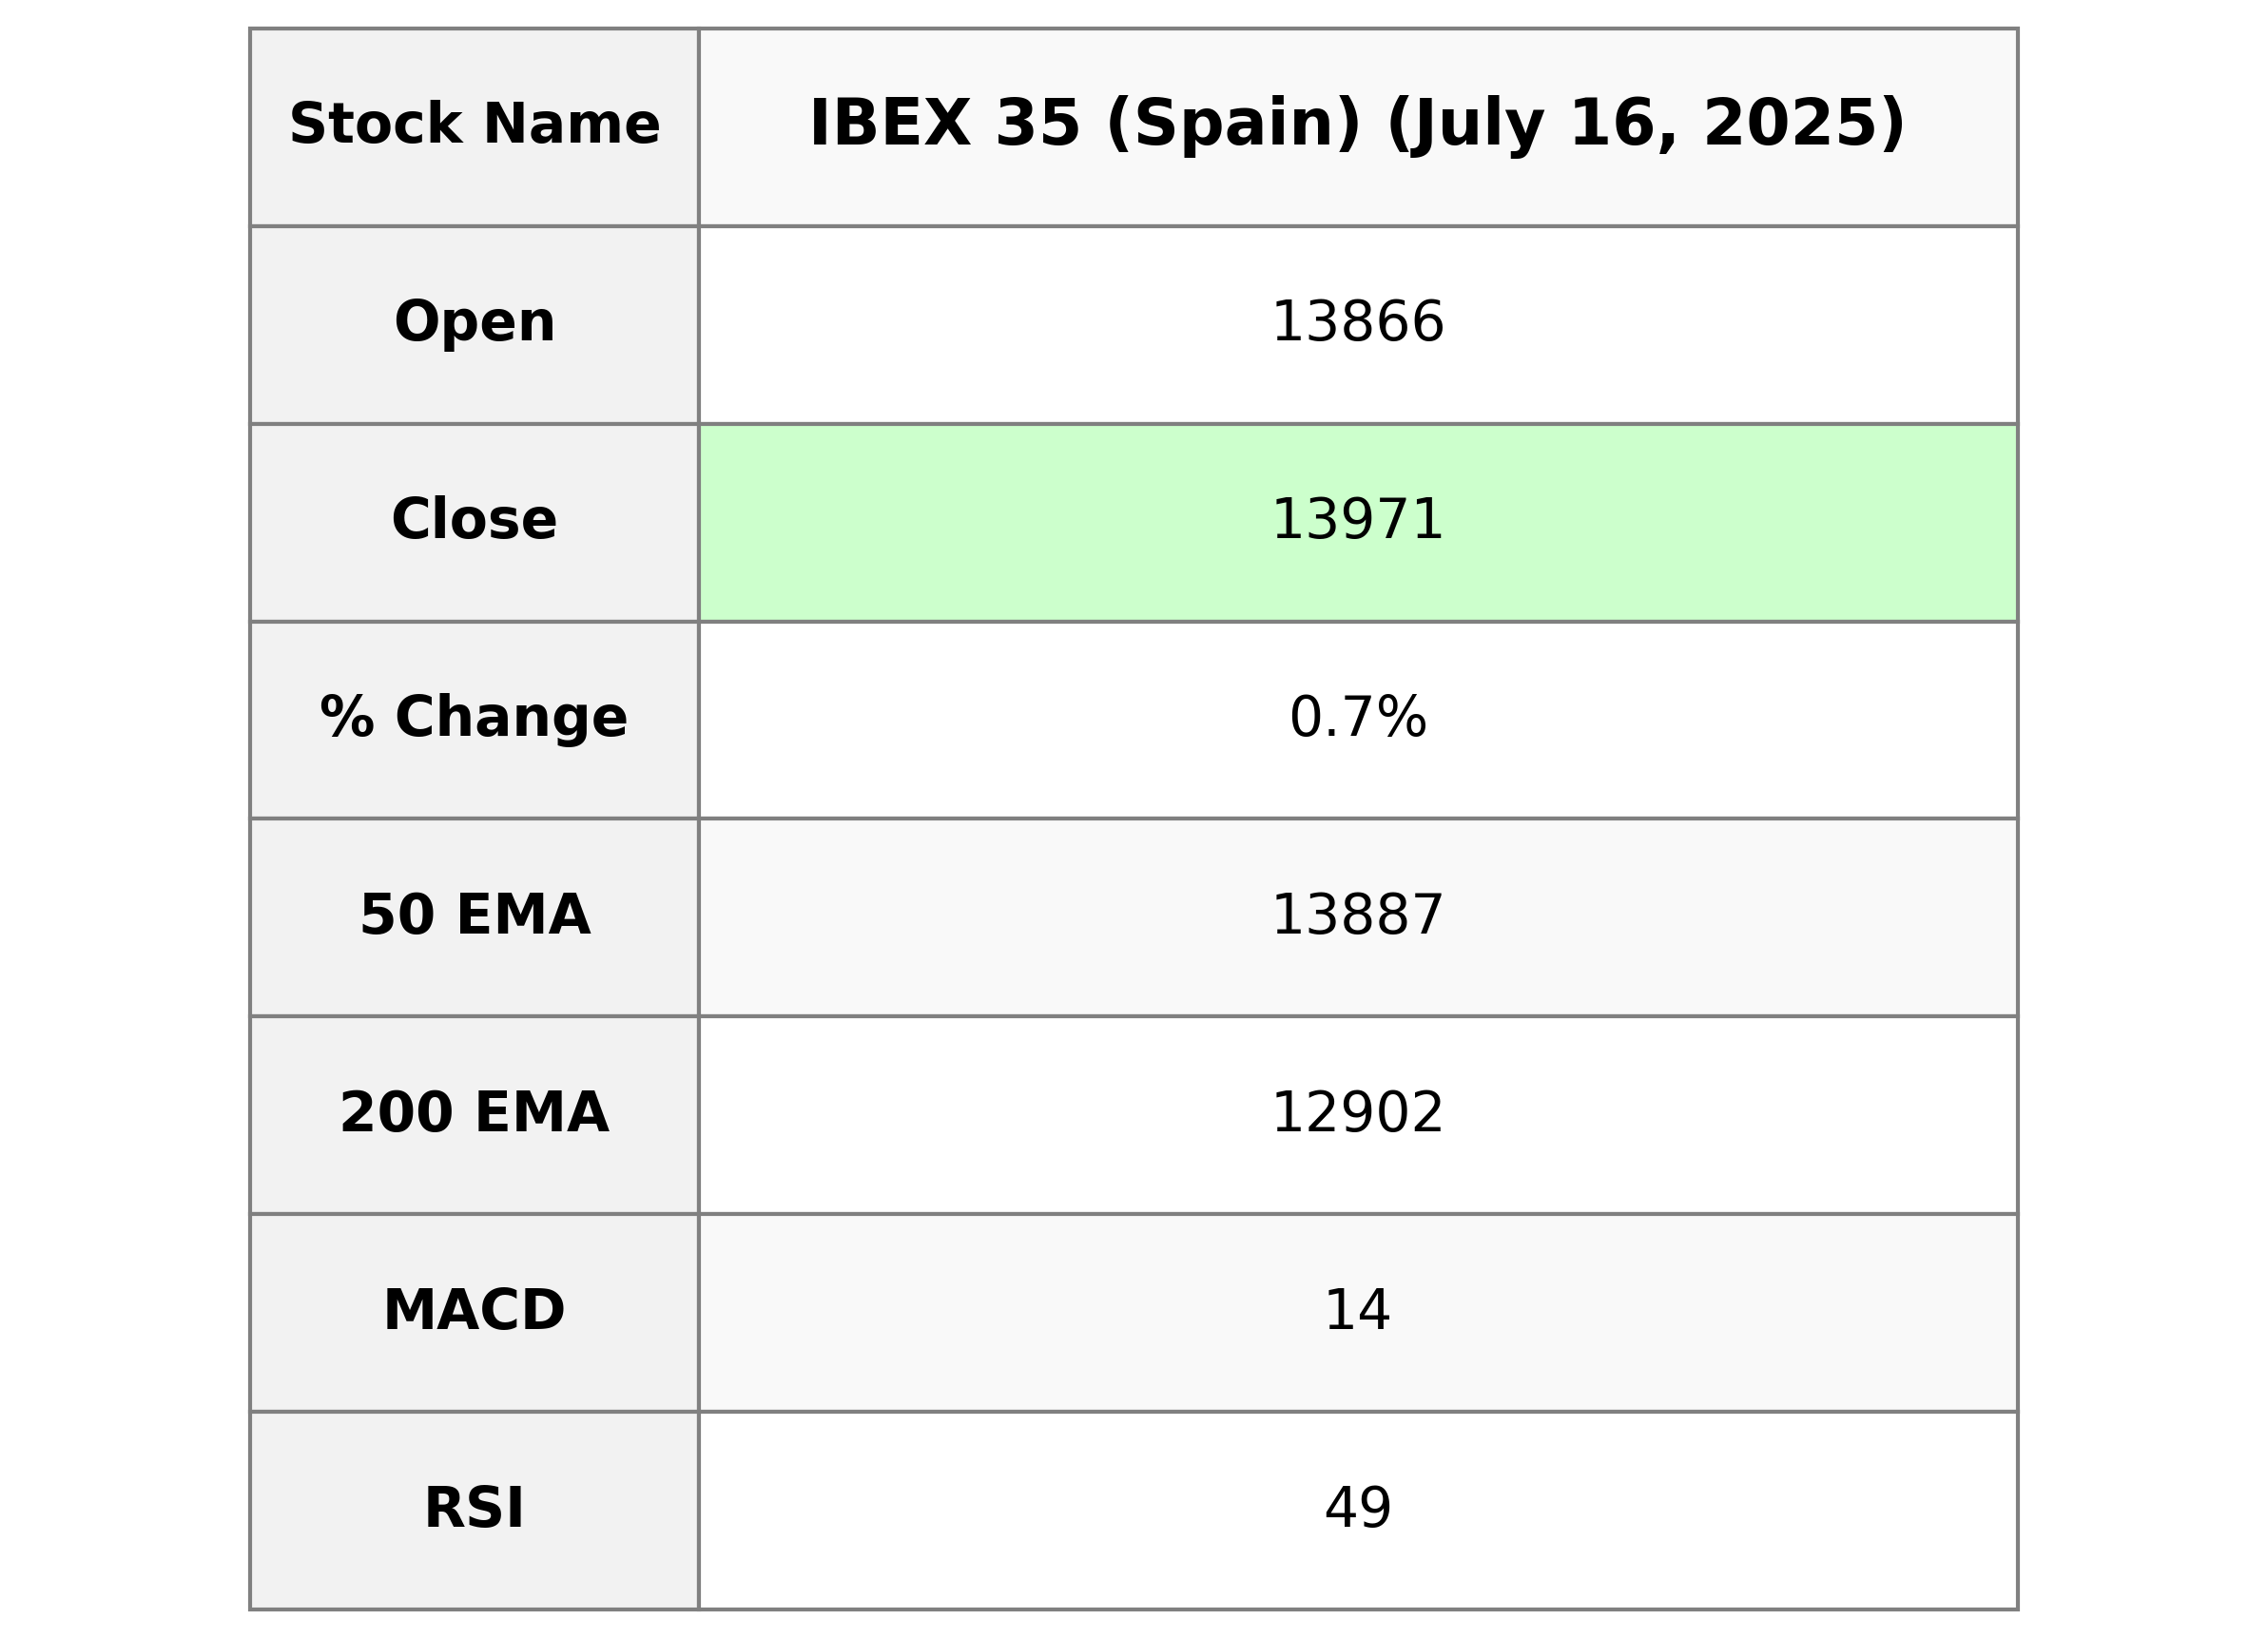
The IBEX 35 (Spain) opened at 13,866.10 and closed higher at 13,970.90, marking a 0.69% increase from the previous close of 13,874.70, with a points change of 96.20. The Relative Strength Index (RSI) is at 48.85, suggesting a neutral market sentiment, while the Moving Average Convergence Divergence (MACD) is below the signal line, indicating a bearish trend.
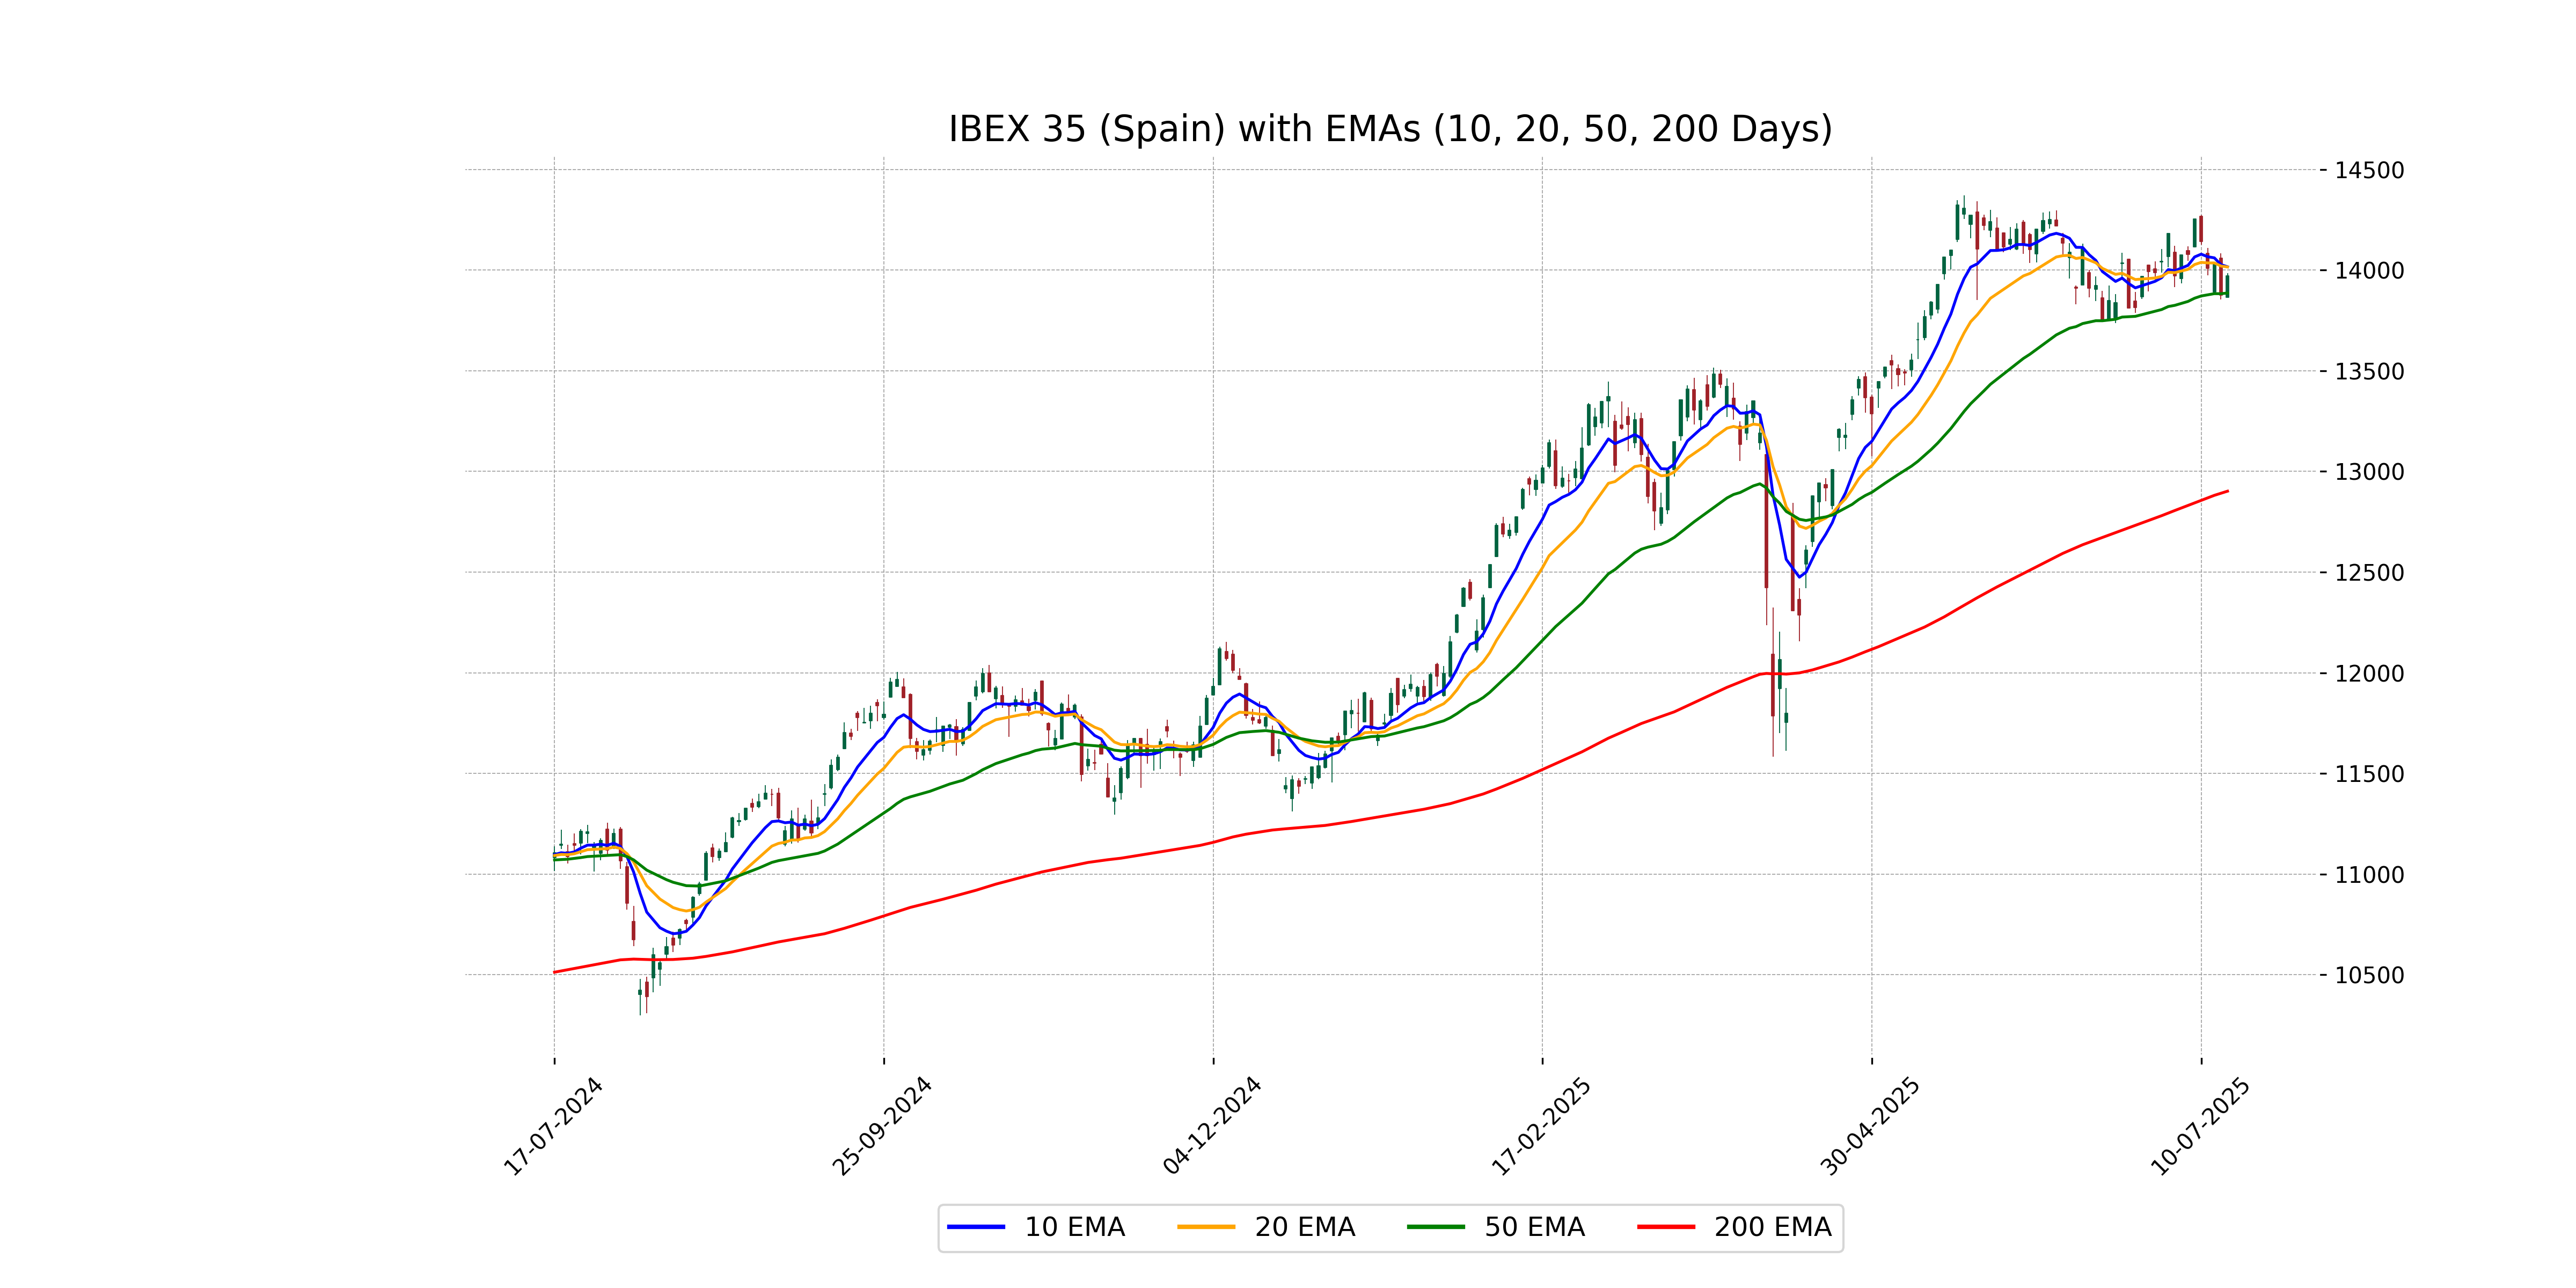
Relationship with Key Moving Averages
The IBEX 35 closed above its 50 EMA but below its 10 EMA and 20 EMA, indicating mixed momentum in the short term. The RSI near 48.85 suggests a neutral trend, while the MACD being below its signal line may imply potential bearish movement.
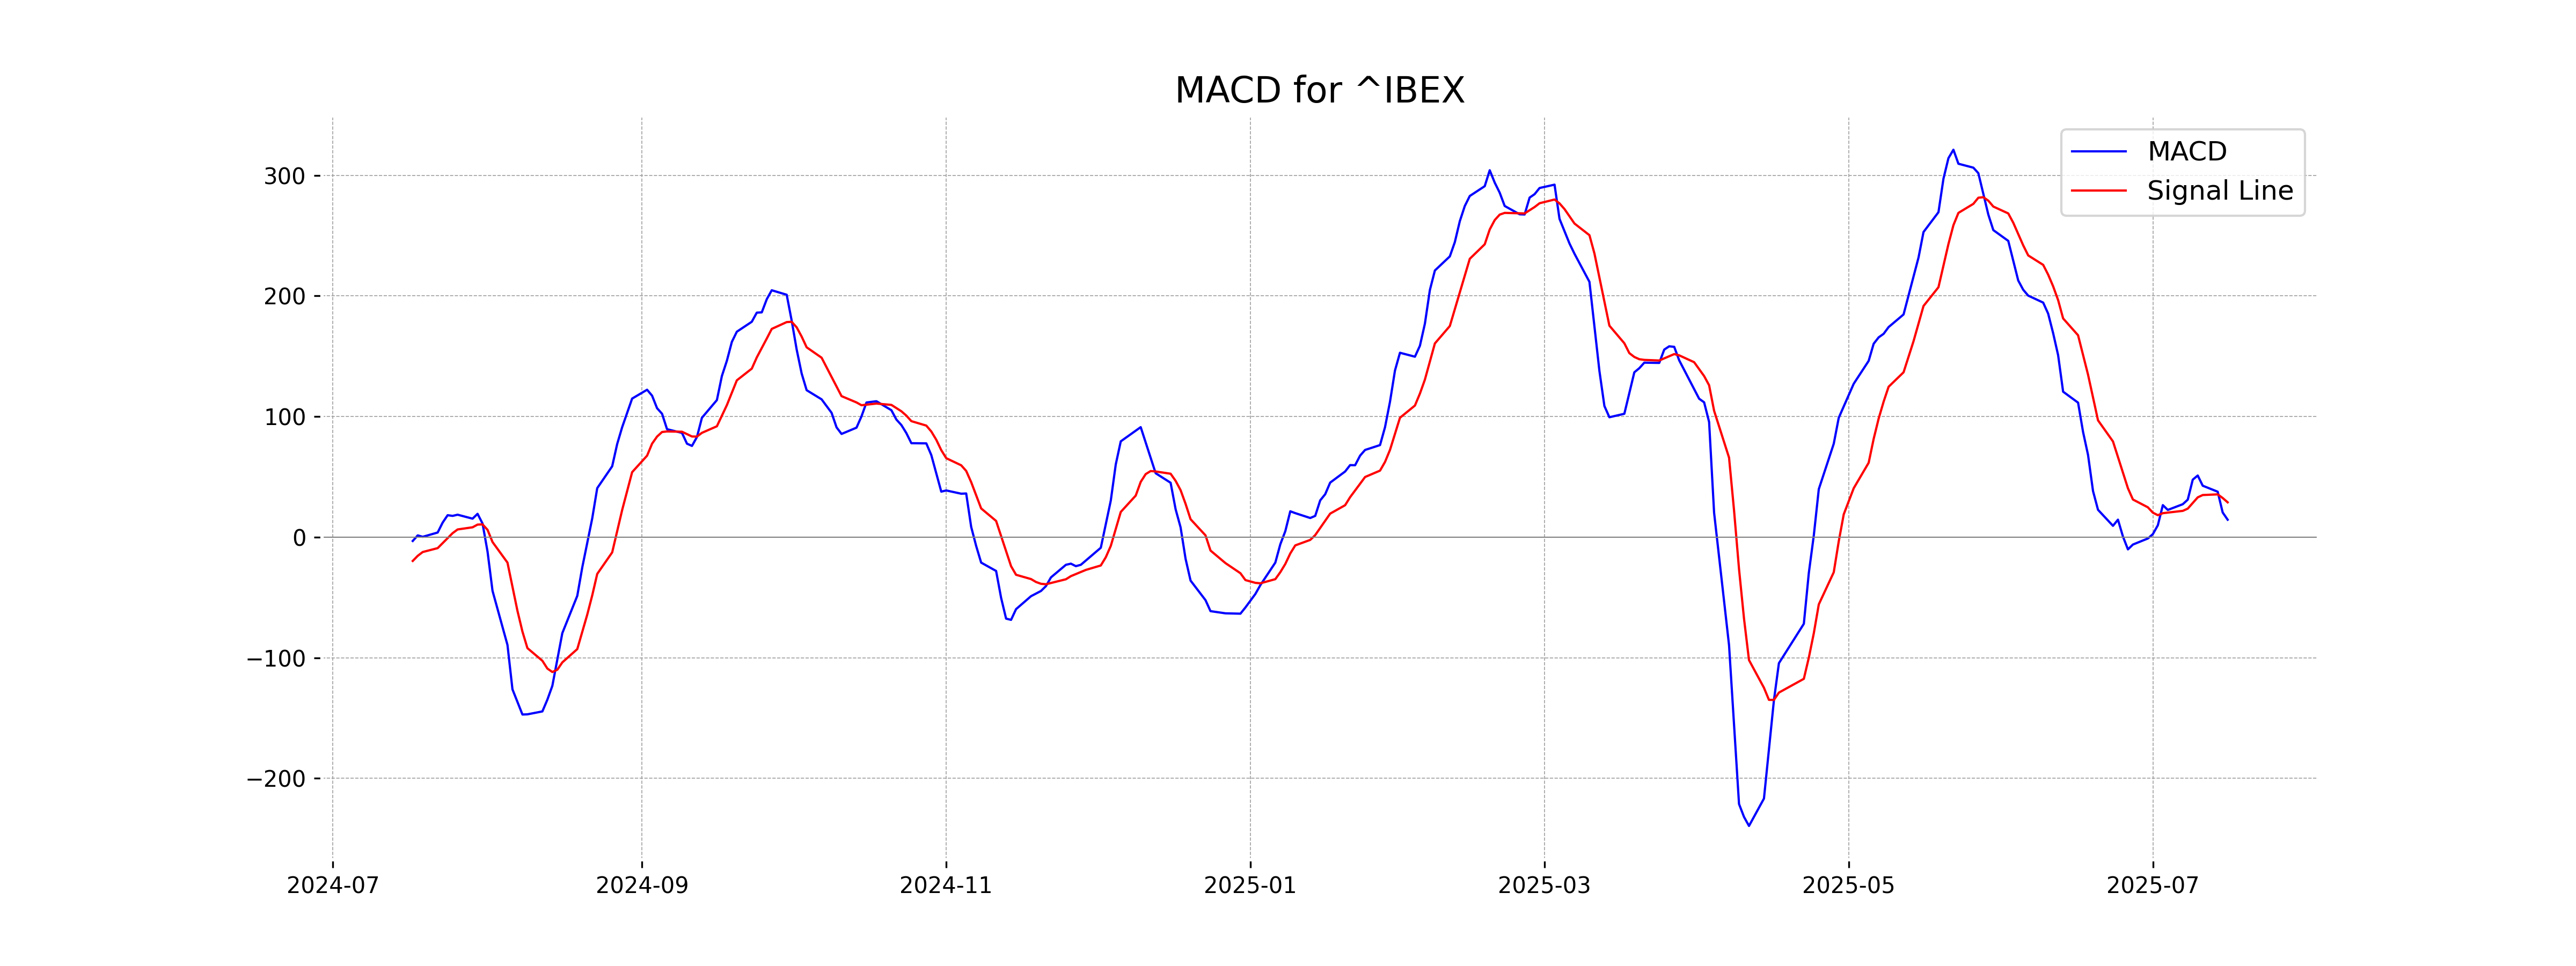
Moving Averages Trend (MACD)
For IBEX 35 (Spain), the MACD value is lower than the MACD Signal line, which may indicate bearish momentum. This divergence suggests that the index may experience some downward pressure in the short term.
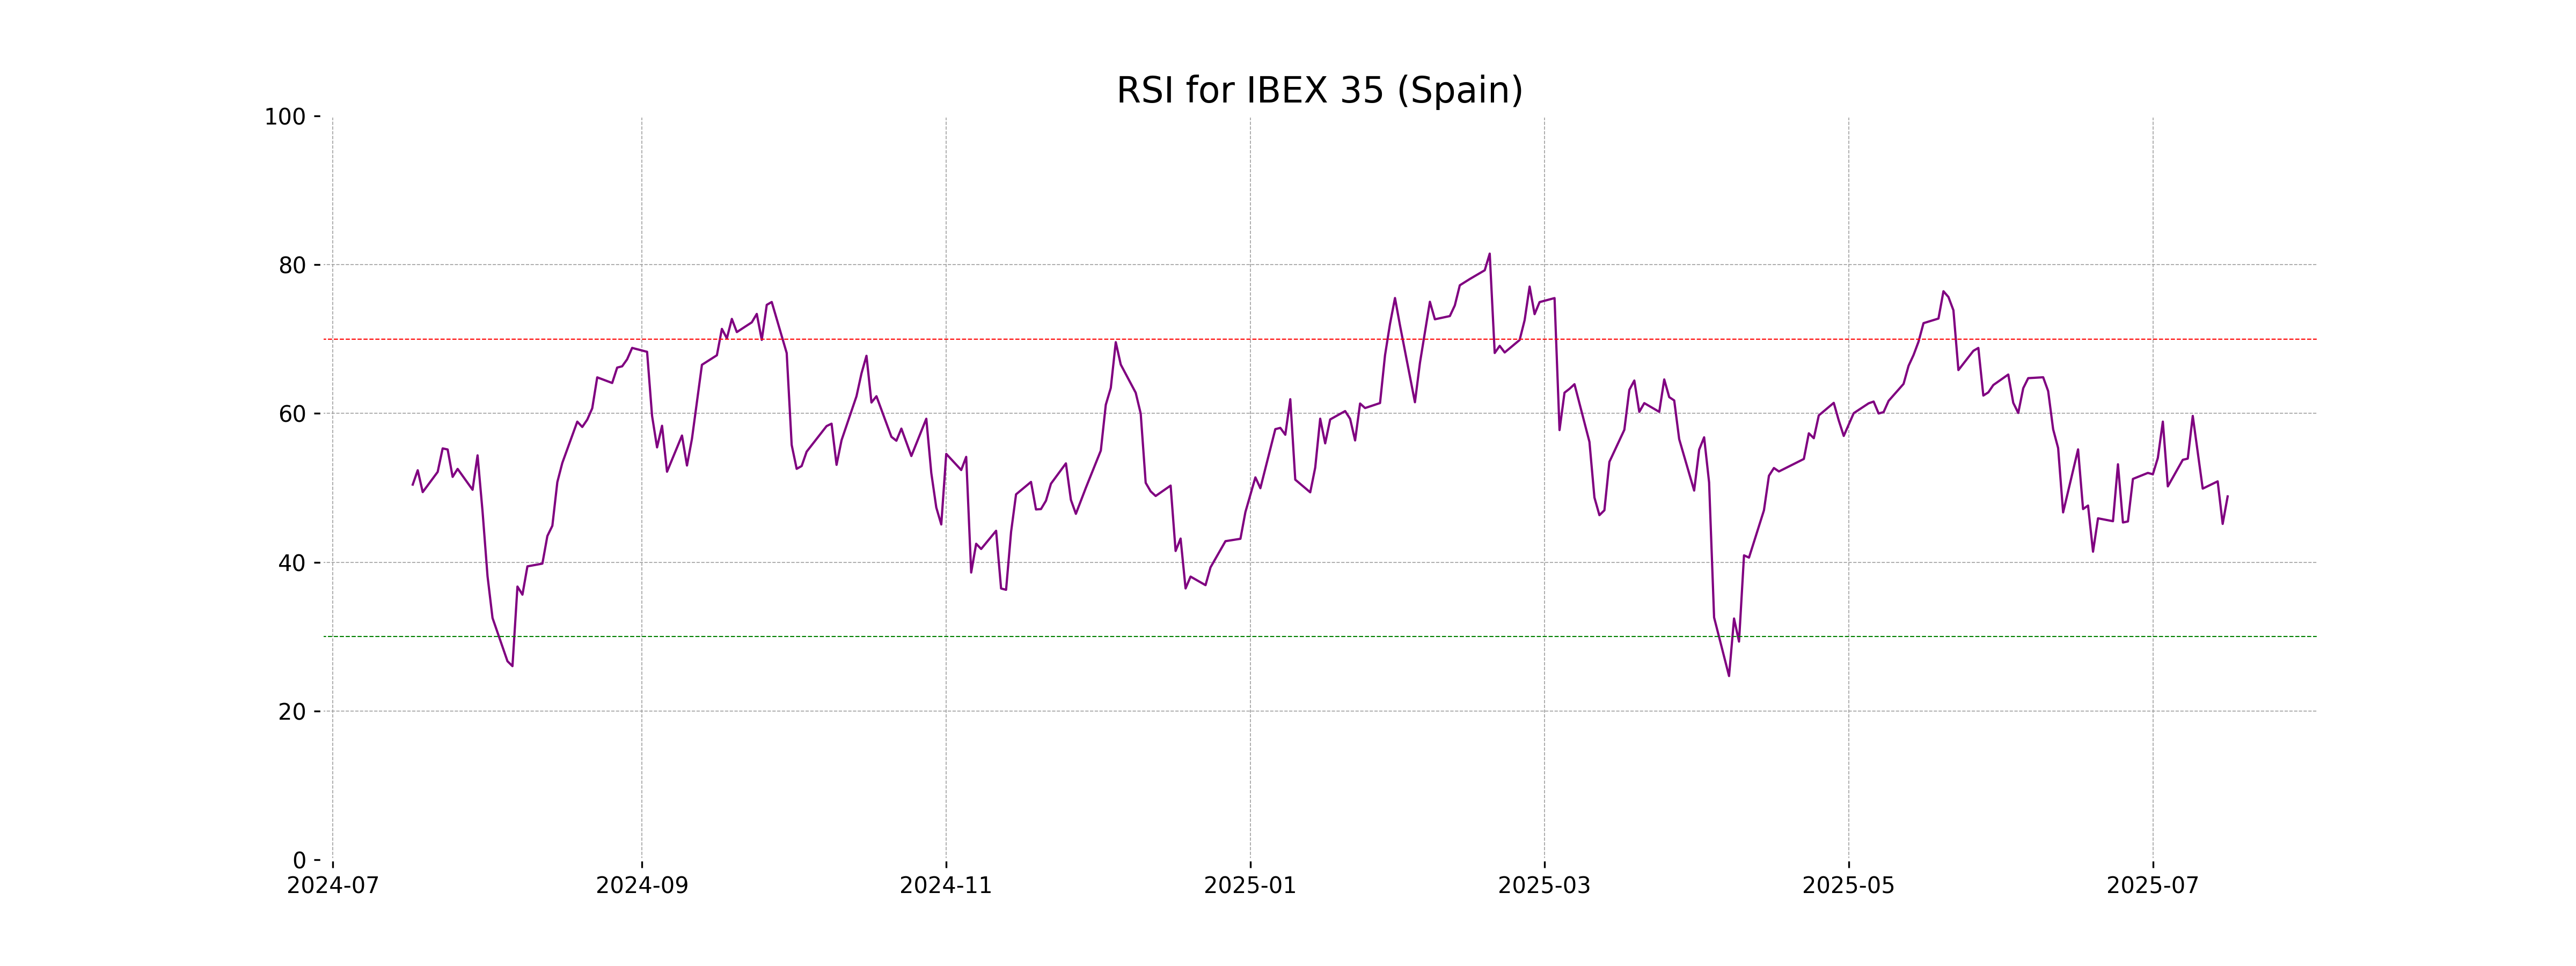
RSI Analysis
The RSI for IBEX 35 (Spain) is 48.85, which indicates that the index is in a neutral zone and not currently overbought or oversold. This suggests a balanced momentum with no immediate reversal signals based on RSI alone.
Analysis for NASDAQ Composite (US) - July 16, 2025

The NASDAQ Composite opened at 20,822.76 and closed slightly lower at 20,677.80. It experienced a minor gain of 0.18% from the previous close, with a points increase of 37.47. The trading volume was substantial at over 8.3 billion, and the Relative Strength Index (RSI) was relatively high at 69.62, indicating a possible overbought condition.
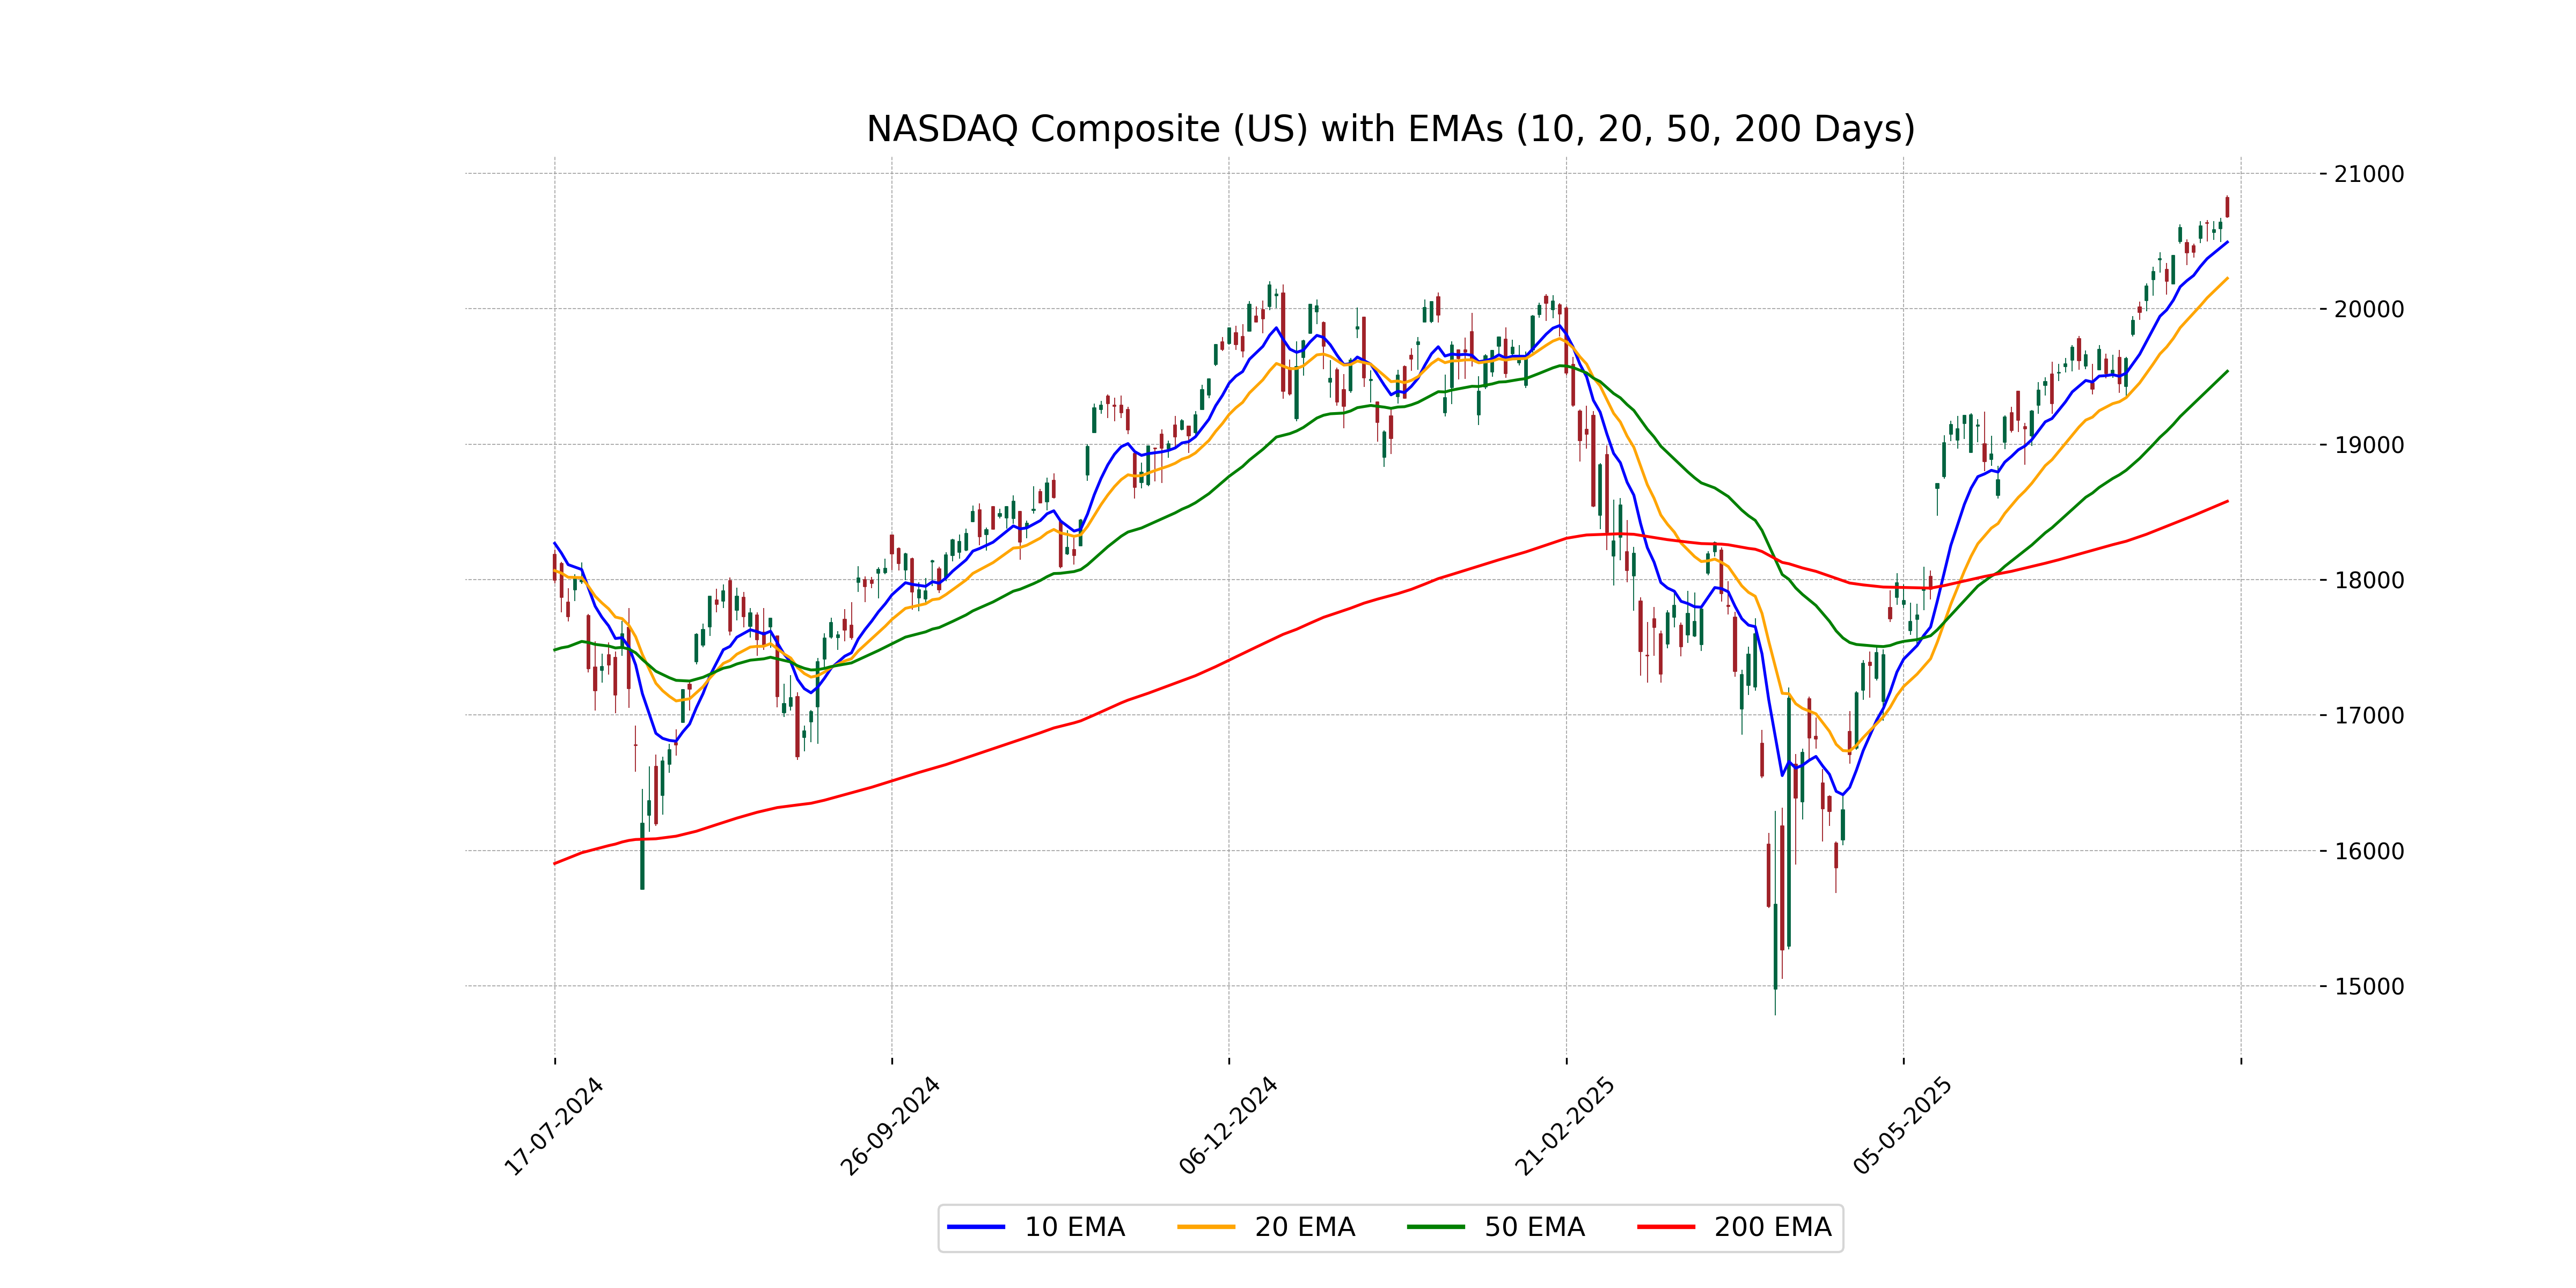
Relationship with Key Moving Averages
The NASDAQ Composite is trading above its 10-day EMA (20,492.54), 20-day EMA (20,225.12), 50-day EMA (19,538.90), and 200-day EMA (18,578.77). This indicates a strong bullish trend as it maintains levels above these key moving averages.
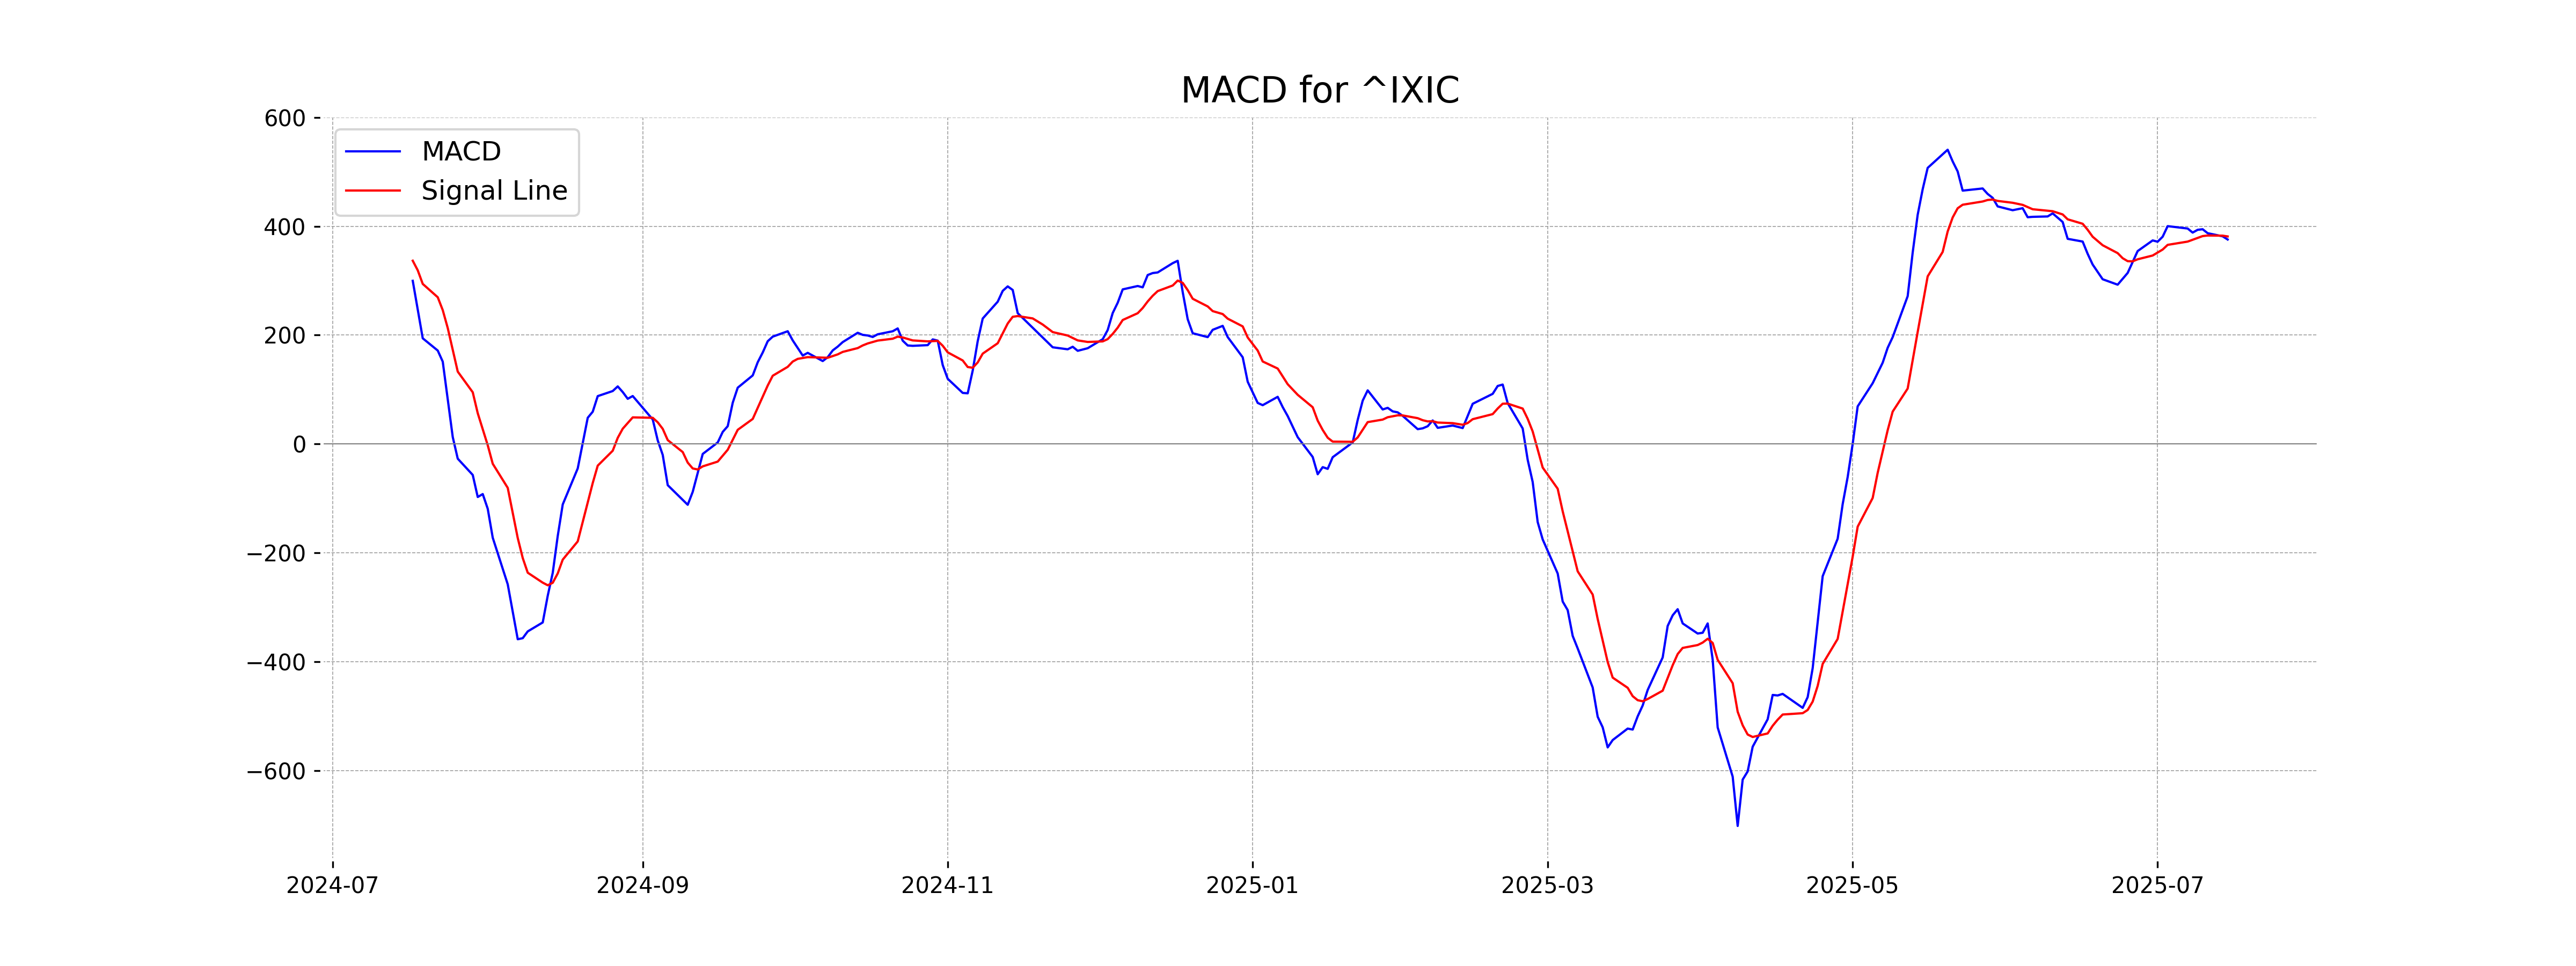
Moving Averages Trend (MACD)
MACD Analysis for NASDAQ Composite (US): The MACD value is 375.62, slightly below the MACD Signal of 381.25, indicating a potential bearish crossover. This may suggest the beginning of a bearish trend, but the close proximity of the values warrants cautious observation.
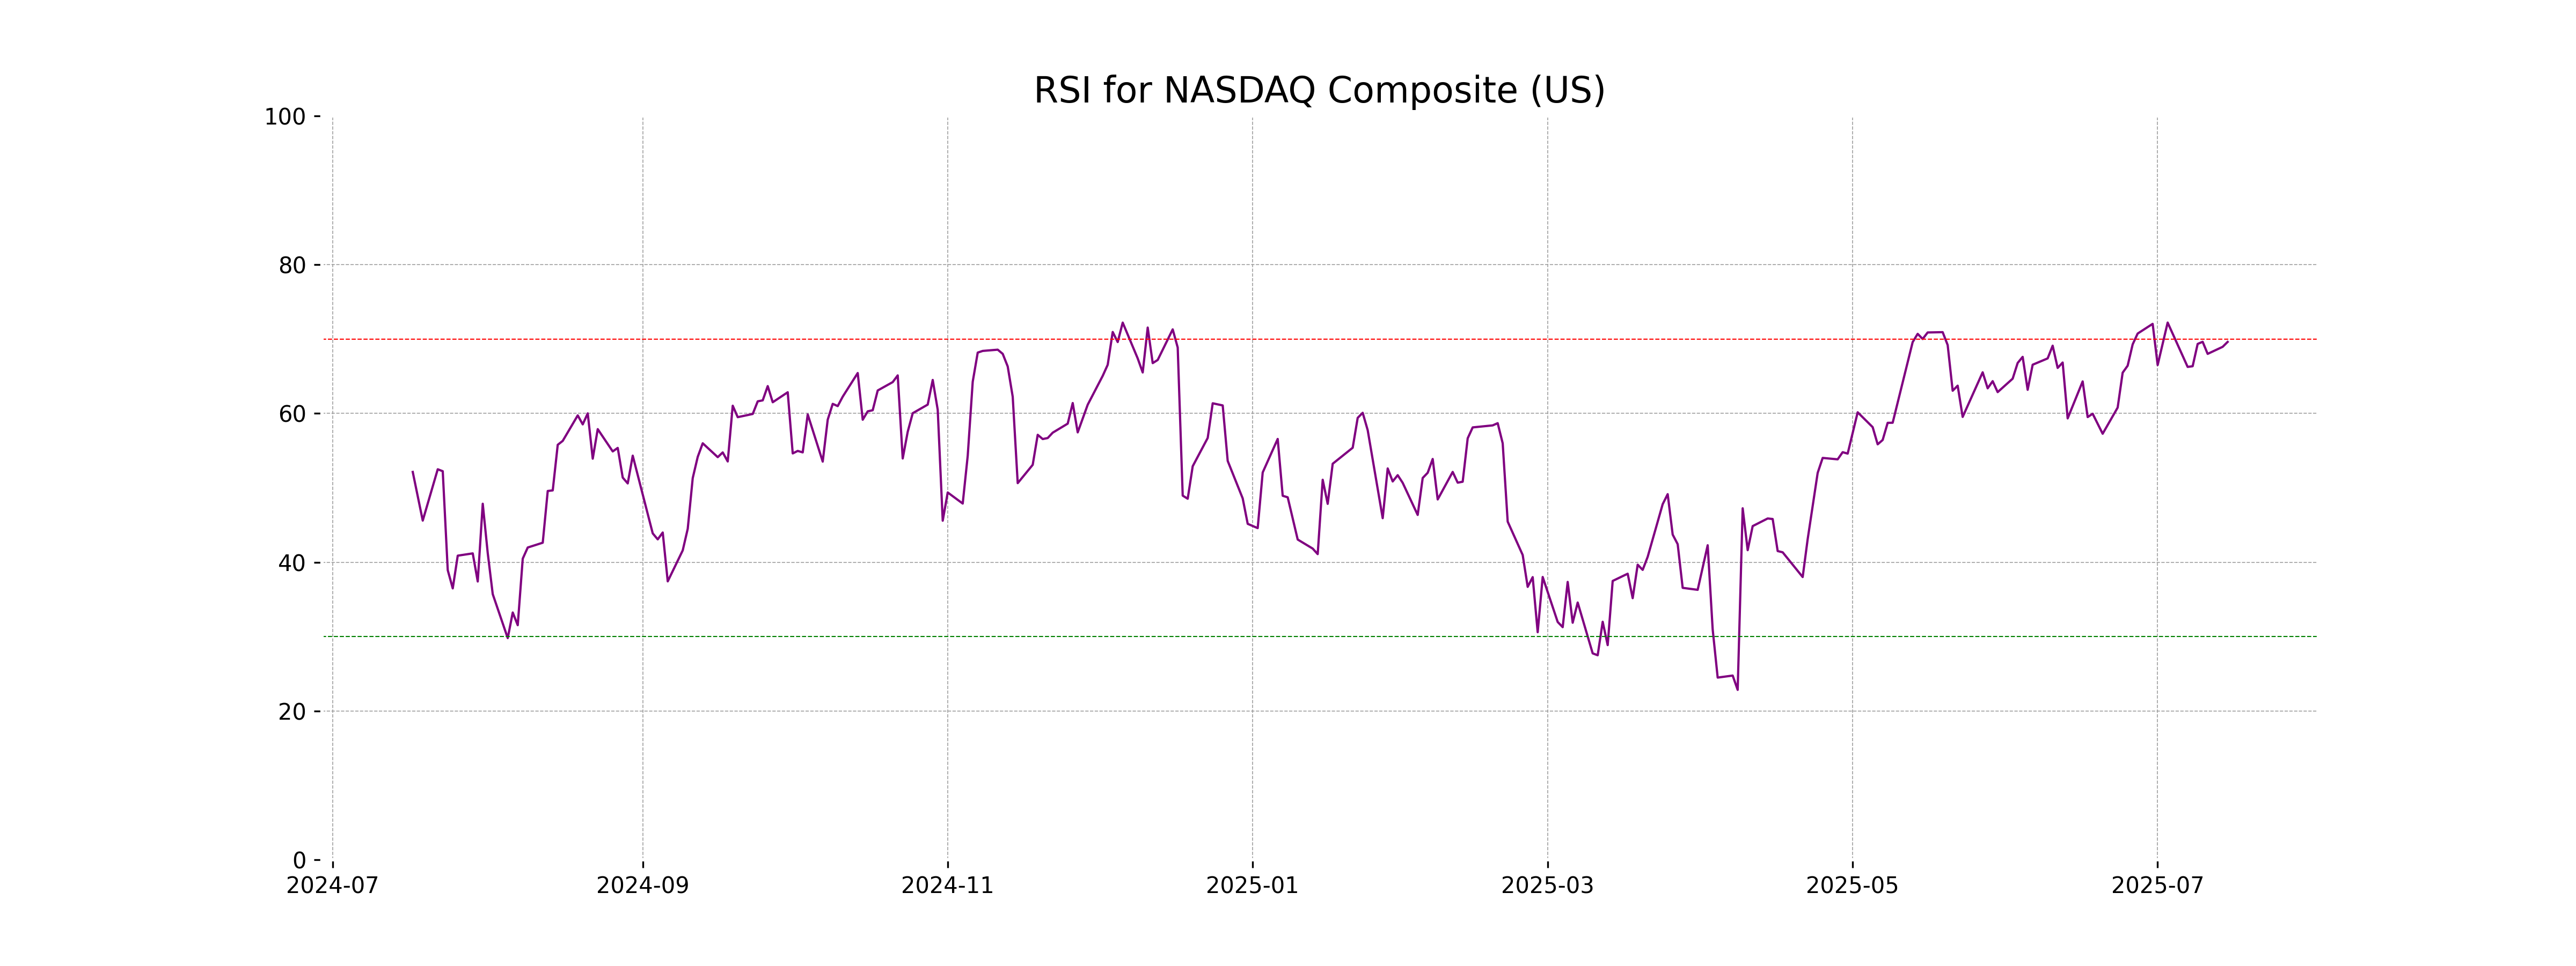
RSI Analysis
NASDAQ Composite (US) RSI Analysis: The current RSI of 69.62 suggests that the index is approaching the overbought territory, indicating a potential for a slowdown or pullback in the near future. Typically, an RSI above 70 is considered overbought, so investors may want to exercise caution or reevaluate positions.
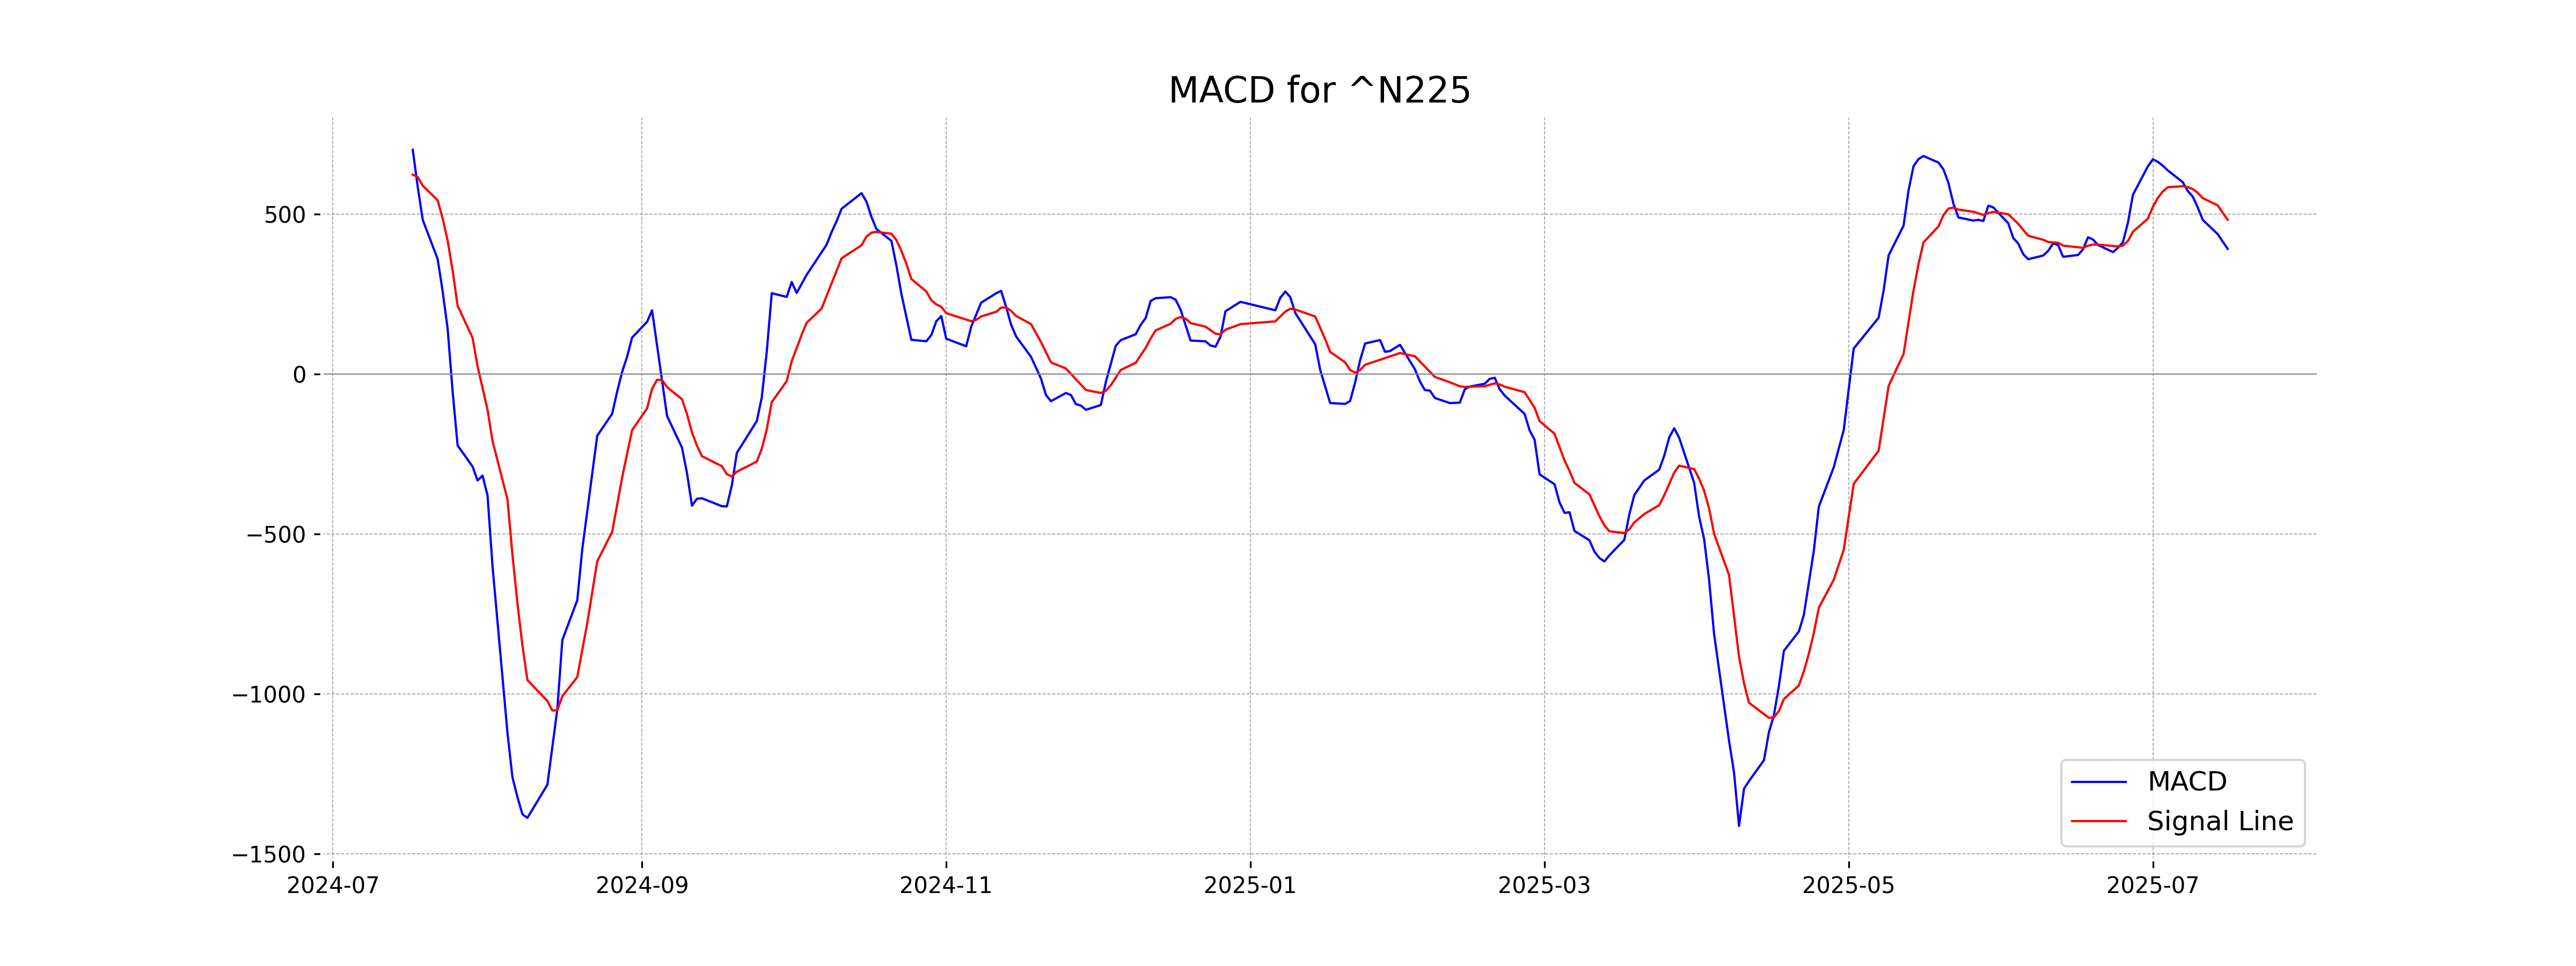
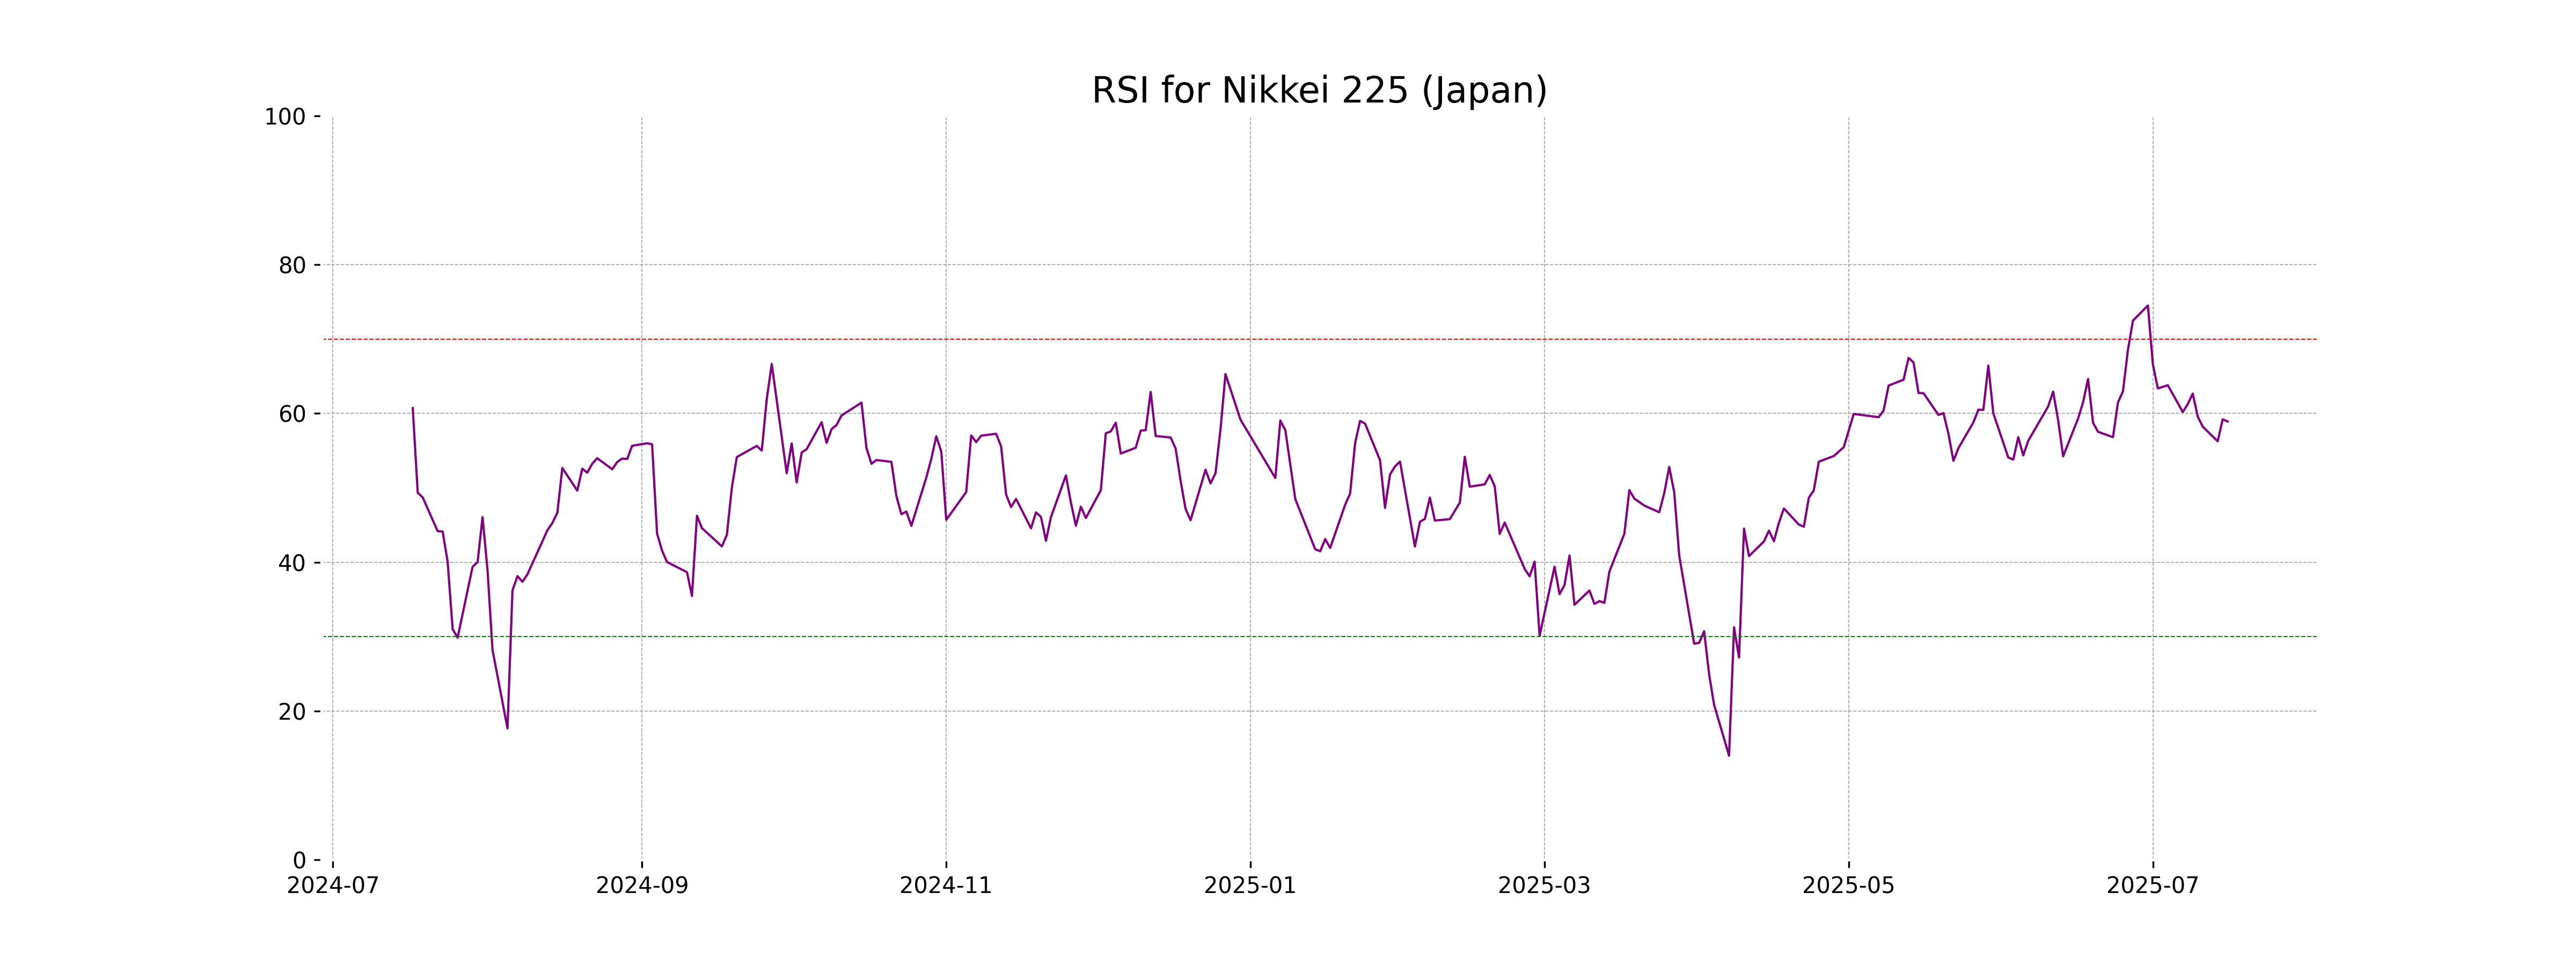
Analysis for Nikkei 225 (Japan) - July 16, 2025
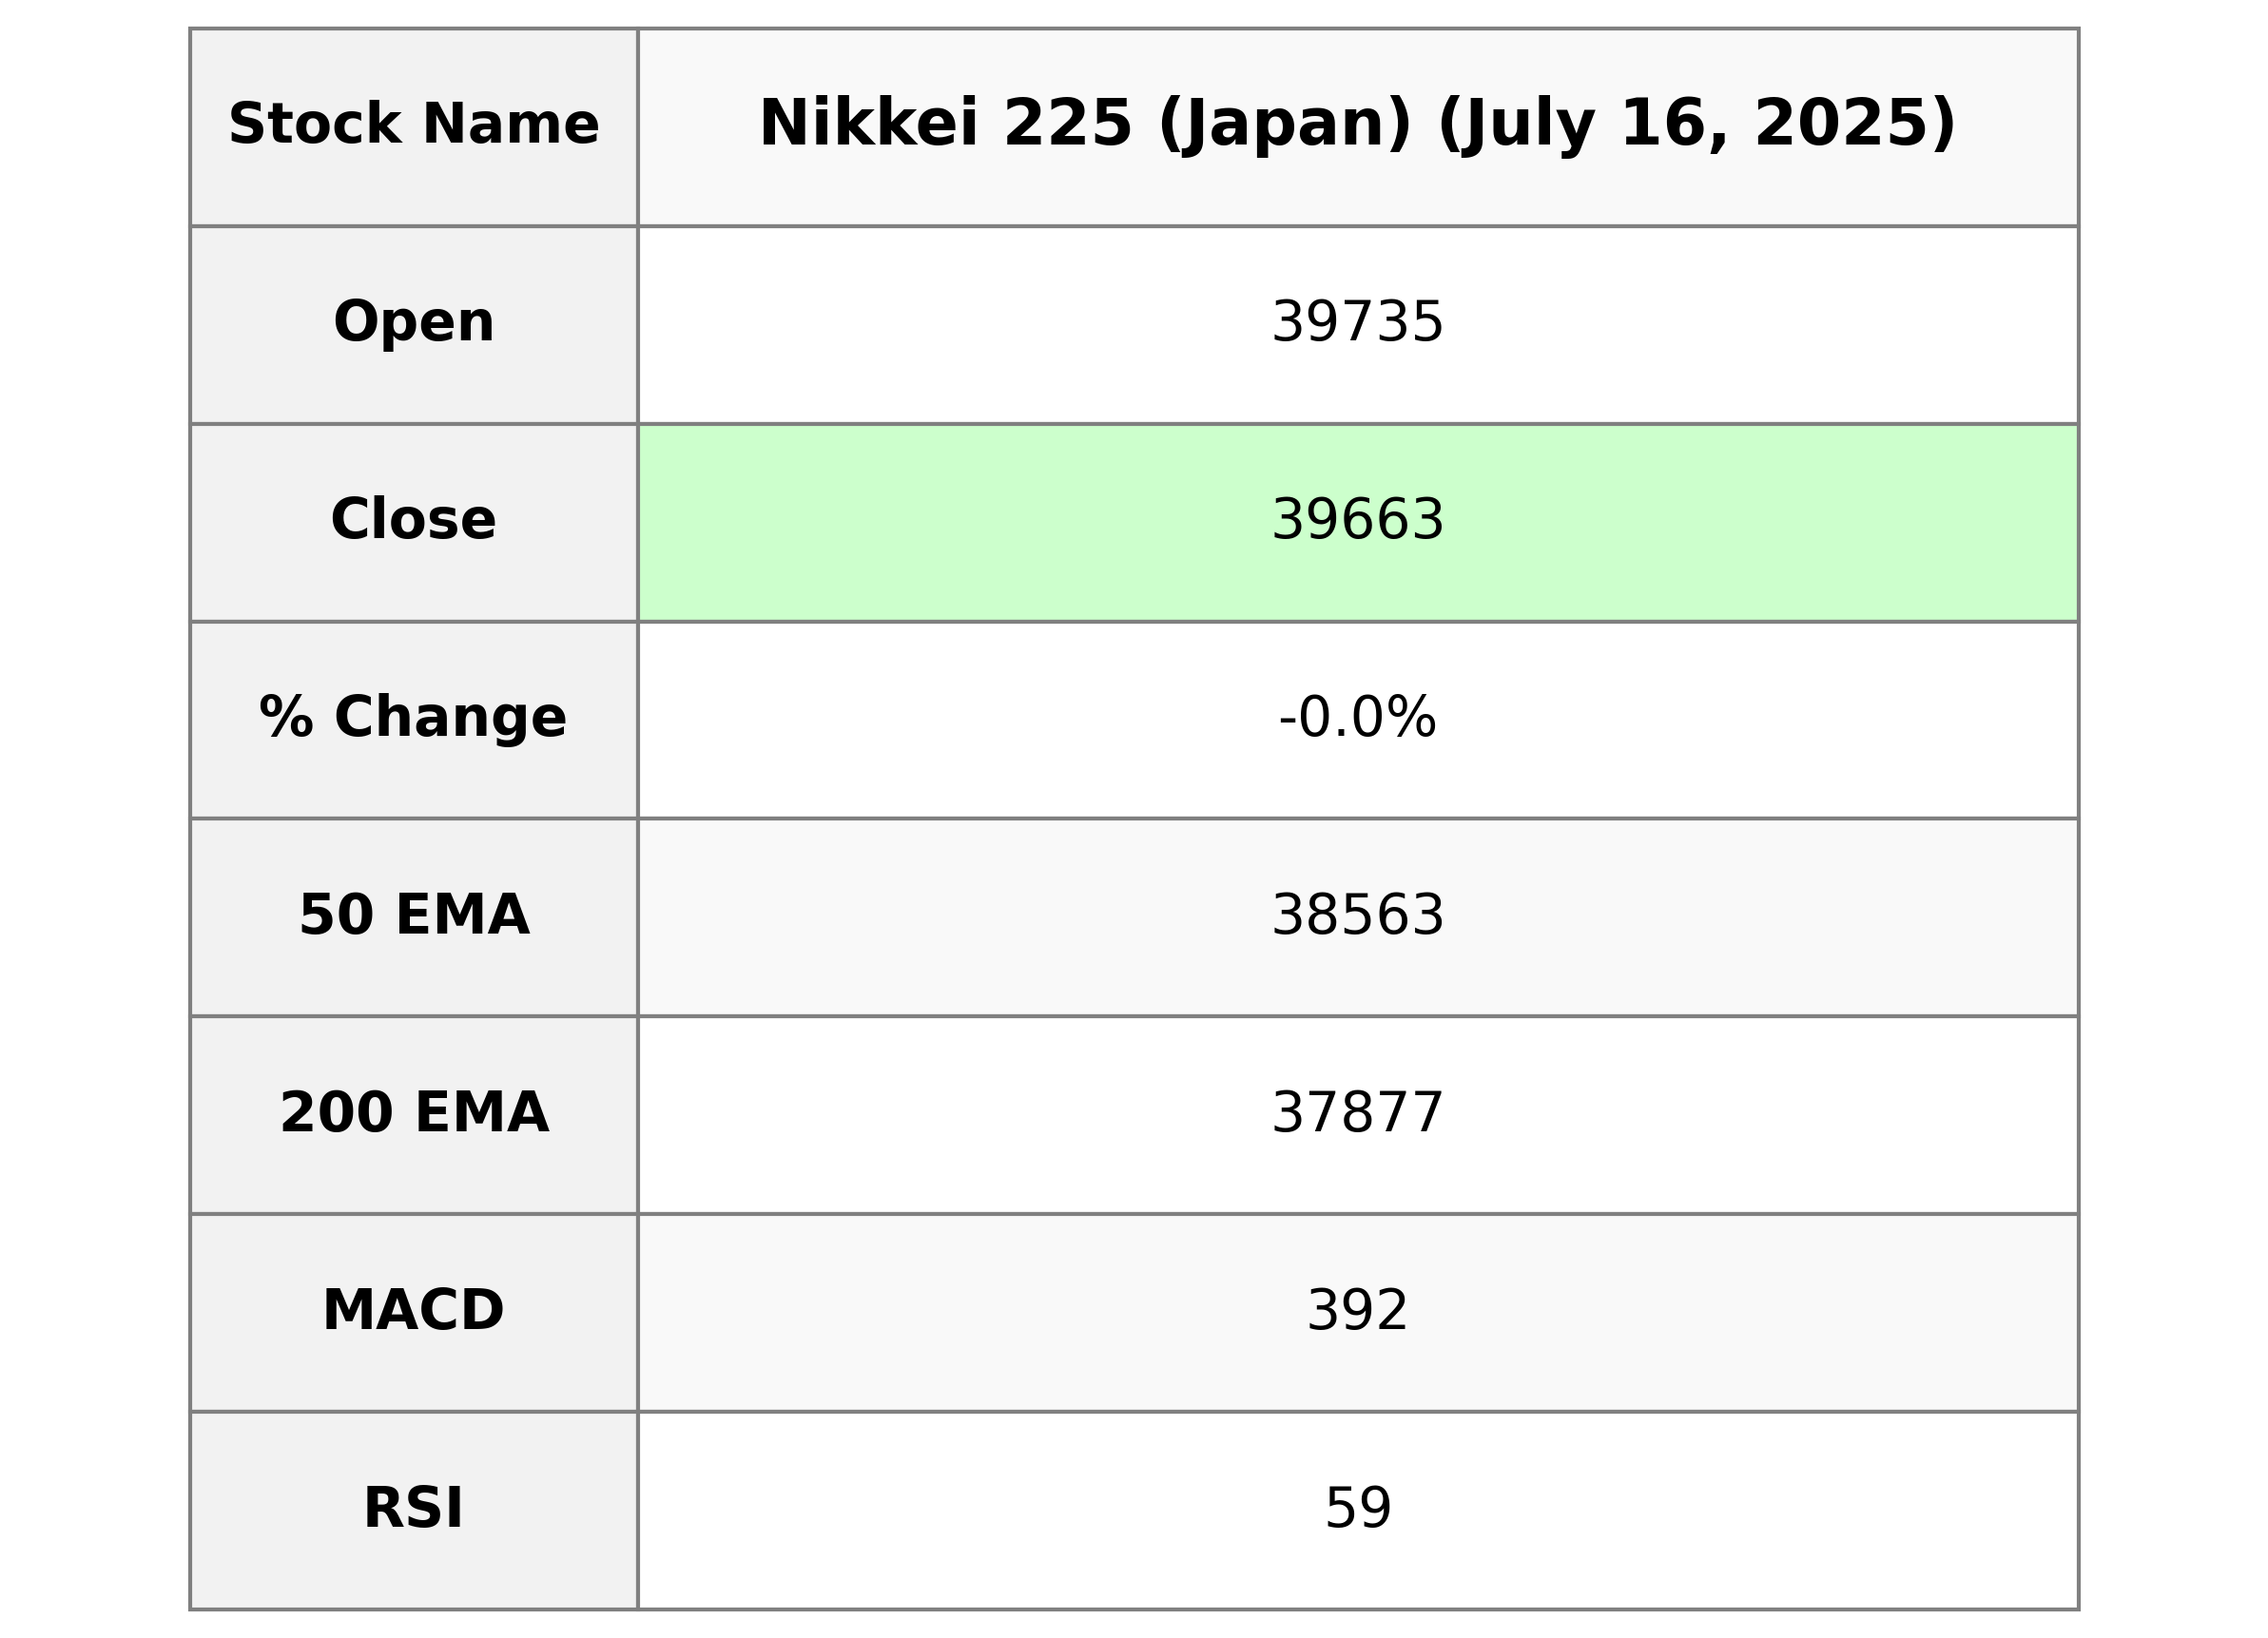
The Nikkei 225 index opened at 39,734.74 and closed slightly lower at 39,663.40, marking a modest decrease of 0.0368% compared to the previous close. Despite this minor decline, the index remains above its 50-day EMA of 38,562.78, indicating a generally positive longer-term trend, supported by a moderate RSI of 58.92.
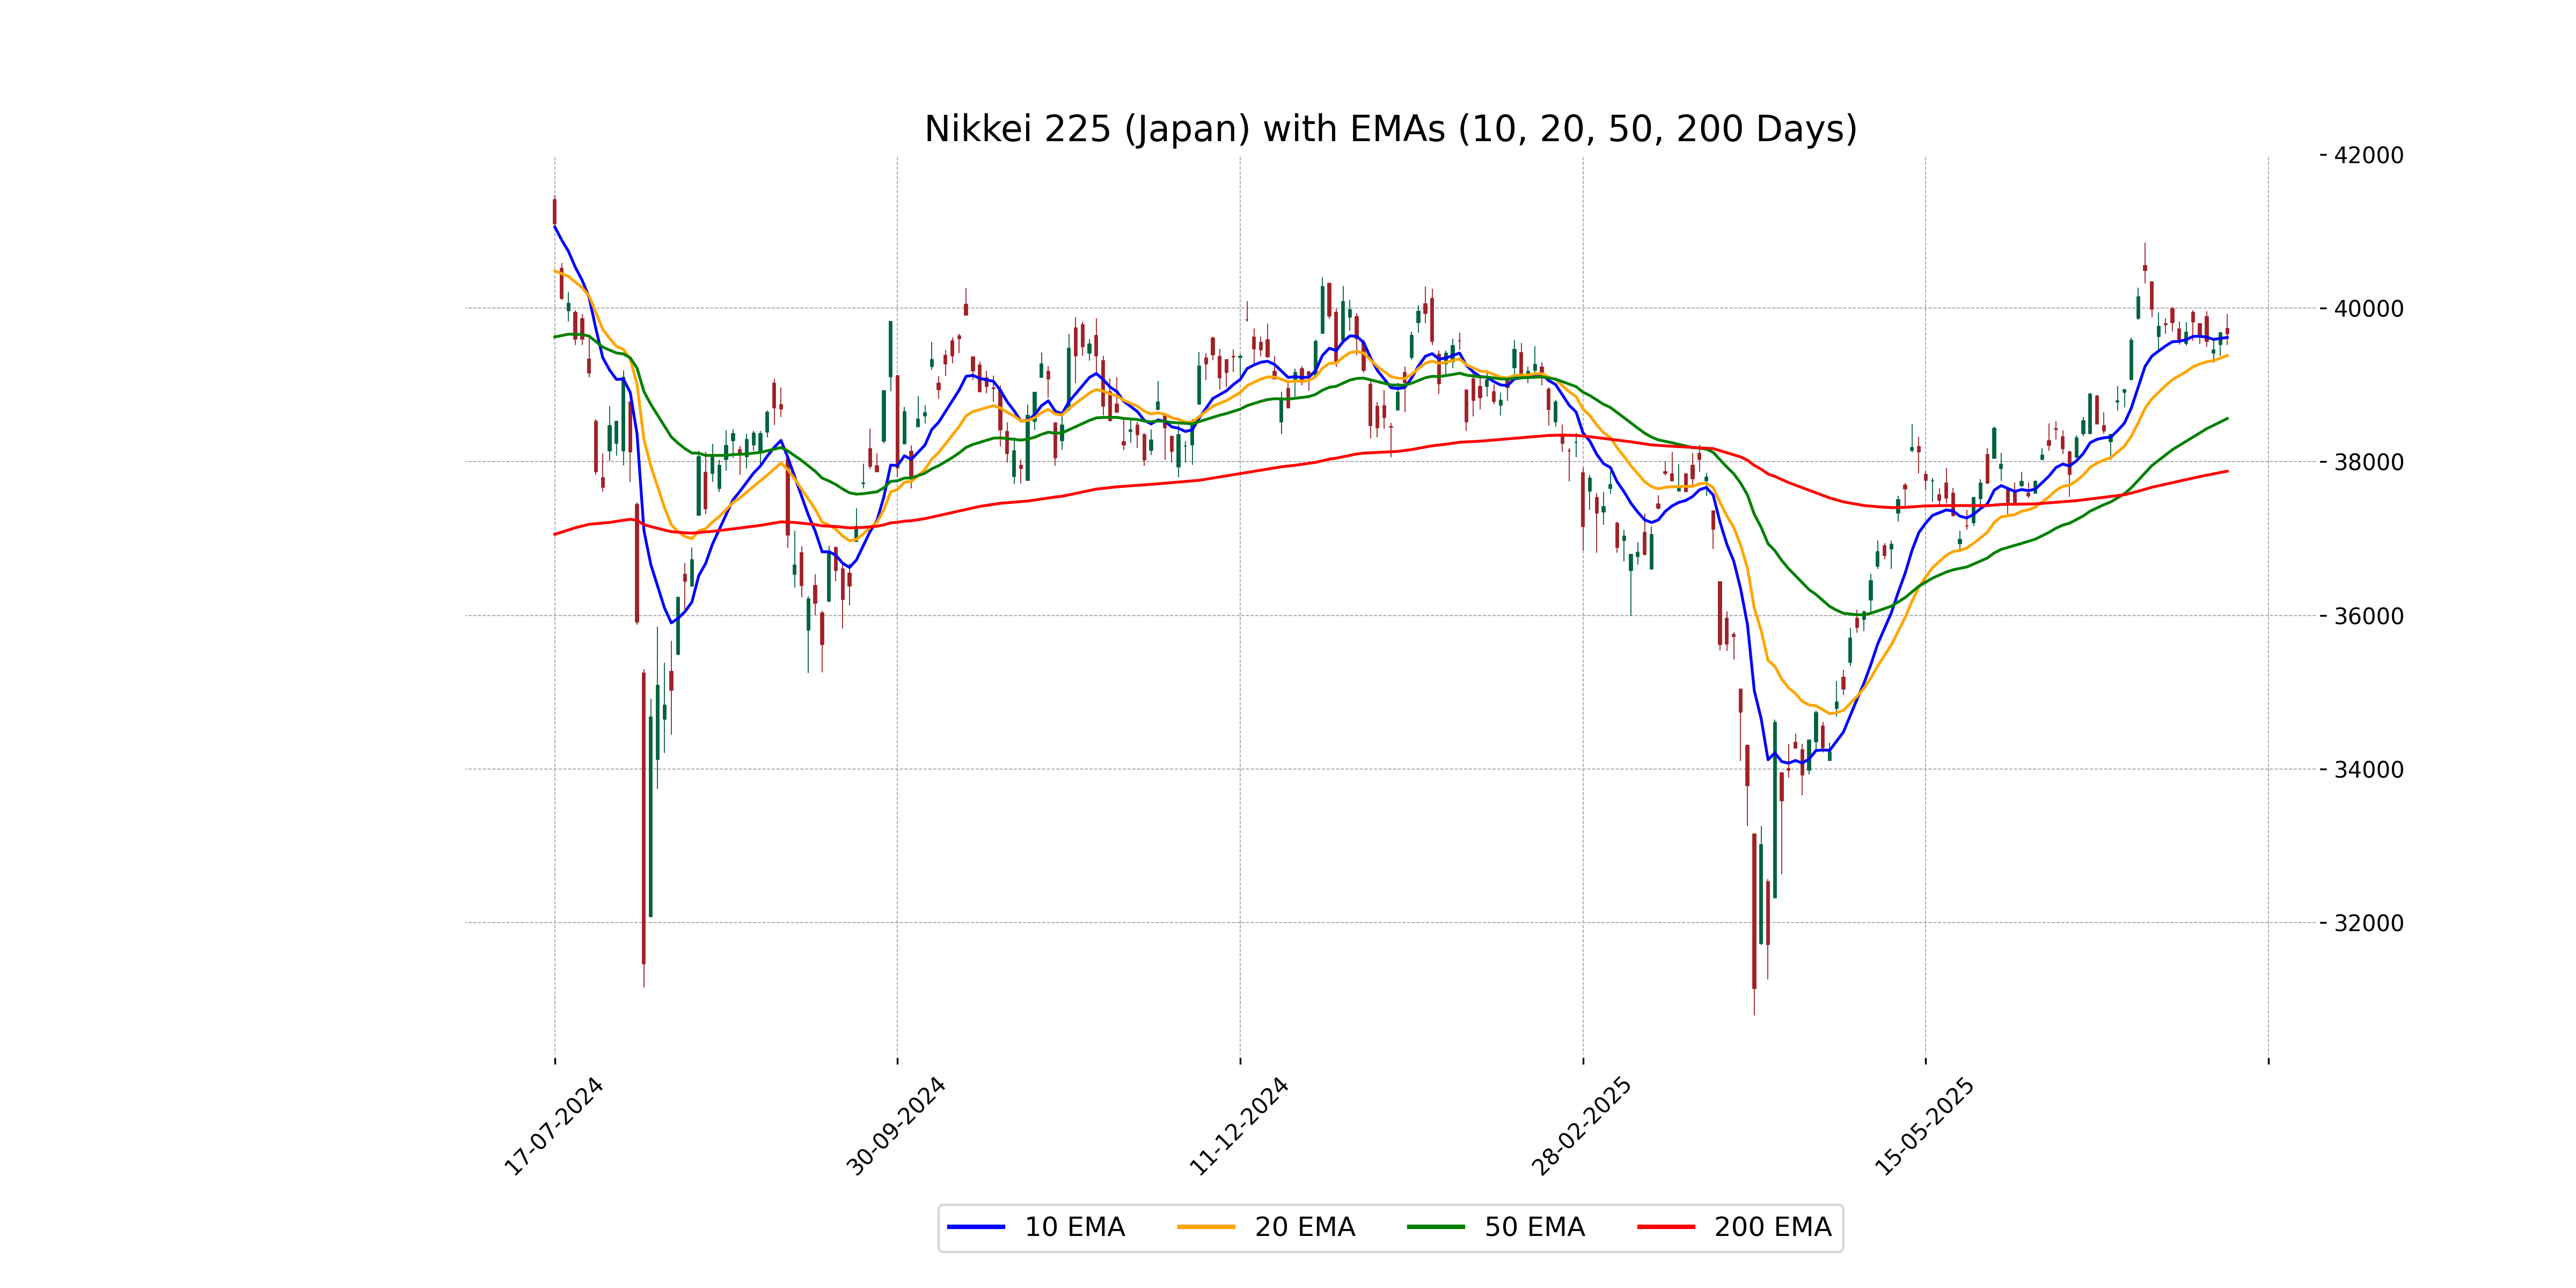
Relationship with Key Moving Averages
The closing price of Nikkei 225 is 39,663.40, which is above the 50-day EMA of 38,562.78 and the 200-day EMA of 37,877.14, indicating a bullish trend. It is also slightly above the 10-day EMA of 39,618.45 and the 20-day EMA of 39,381.31, suggesting a continued upward momentum in the short term.
Moving Averages Trend (MACD)
The MACD value for Nikkei 225 is lower than the MACD Signal line, indicating a potential bearish signal. This suggests momentum could be shifting towards a downward trend. Traders might interpret this as a cautious time to review positions.
RSI Analysis
The current RSI for Nikkei 225 is approximately 58.92, suggesting that the stock is in the neutral zone. This indicates a balanced momentum without being overbought or oversold, hinting at a stable market condition.
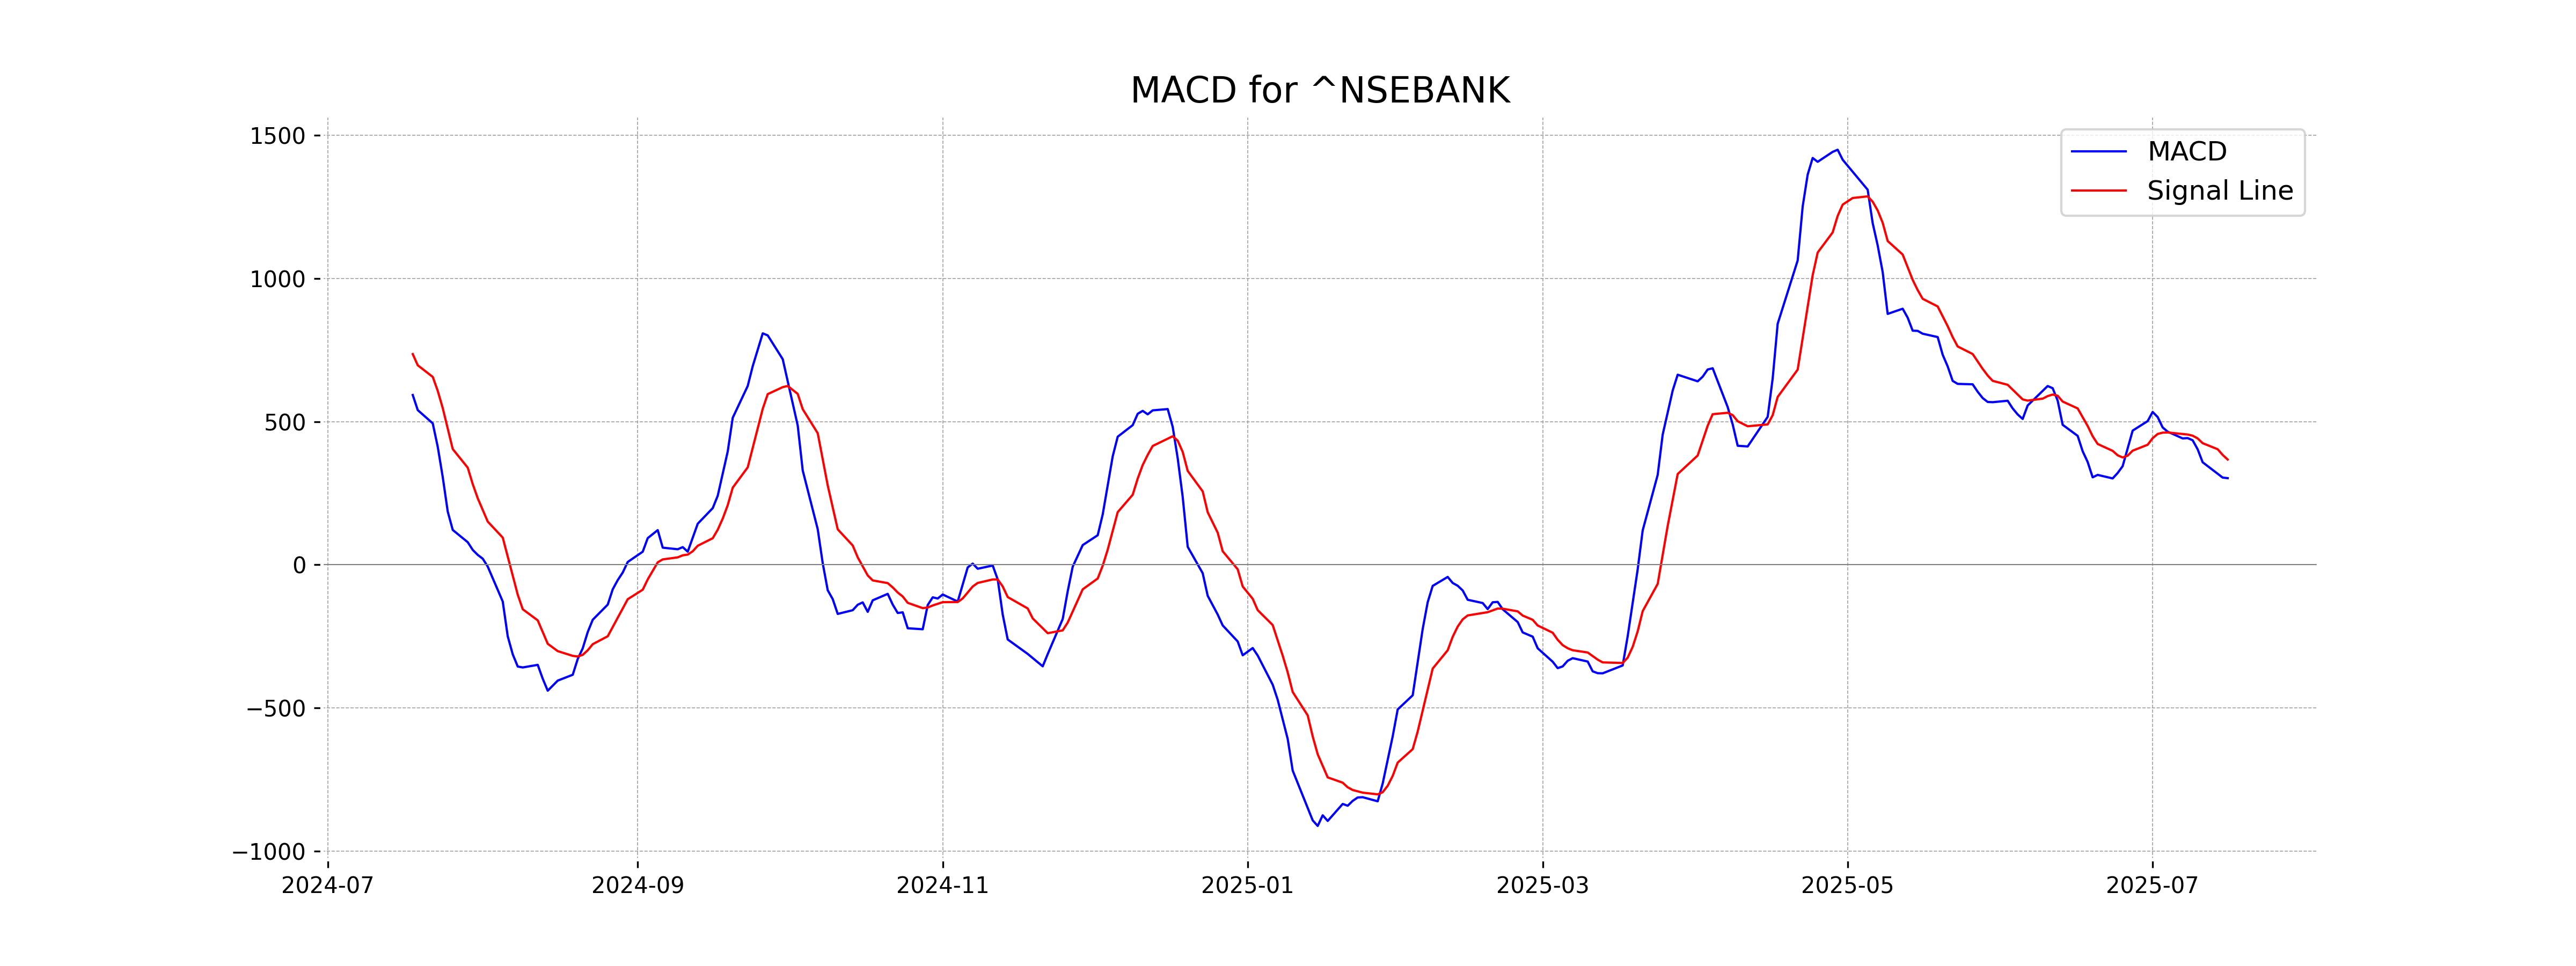
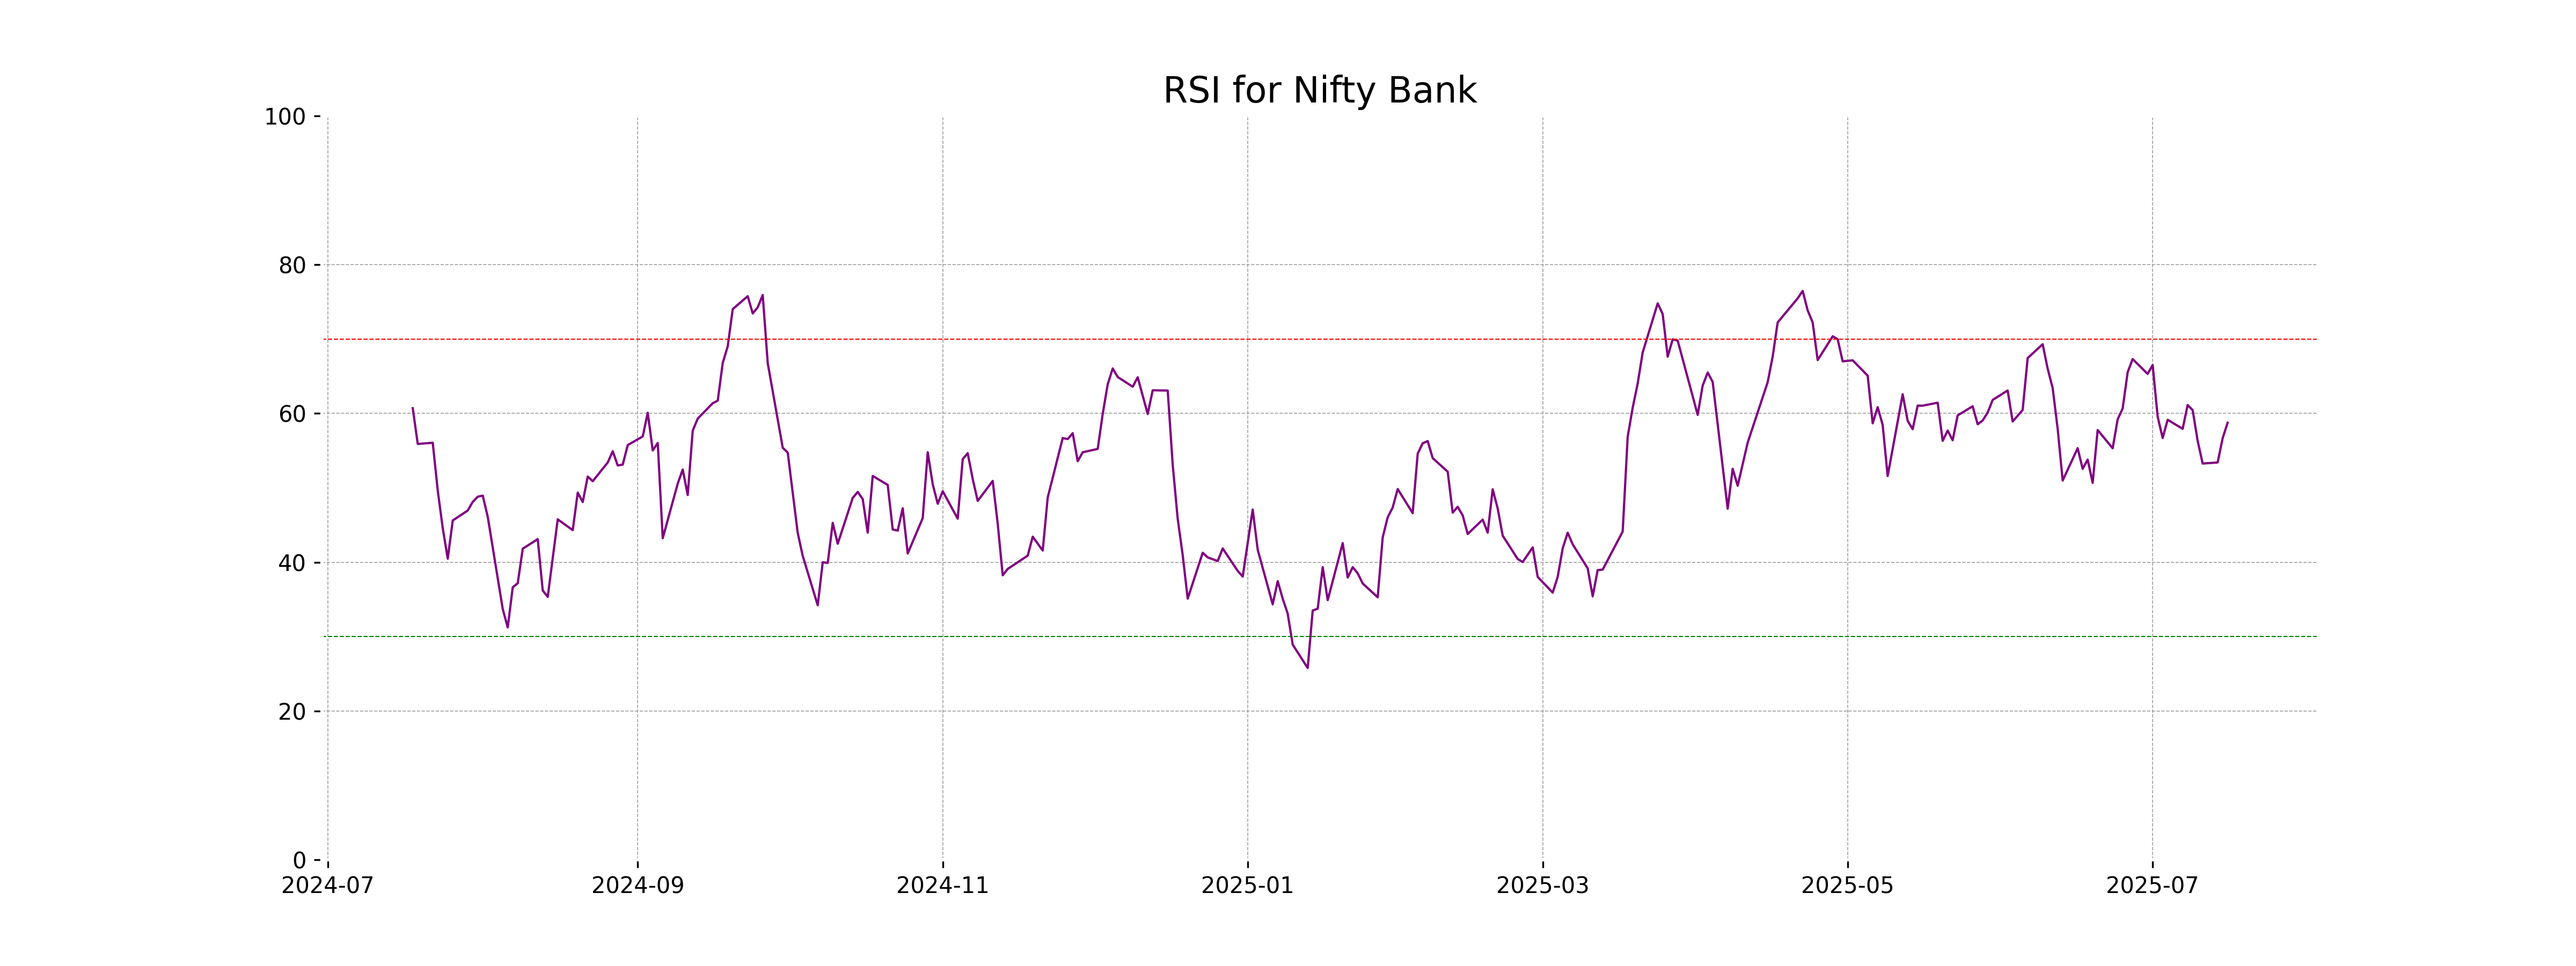
Analysis for Nifty Bank - July 16, 2025

Nifty Bank opened at 57111.25 and closed at 57168.95, marking a slight increase with a 0.28% gain from the previous close. The MACD indicates a bearish trend as it is below the signal line, while the RSI suggests moderate strength in the current rally. The index is trading above its 10, 20, and 50-day EMAs, indicating a short-term uptrend.
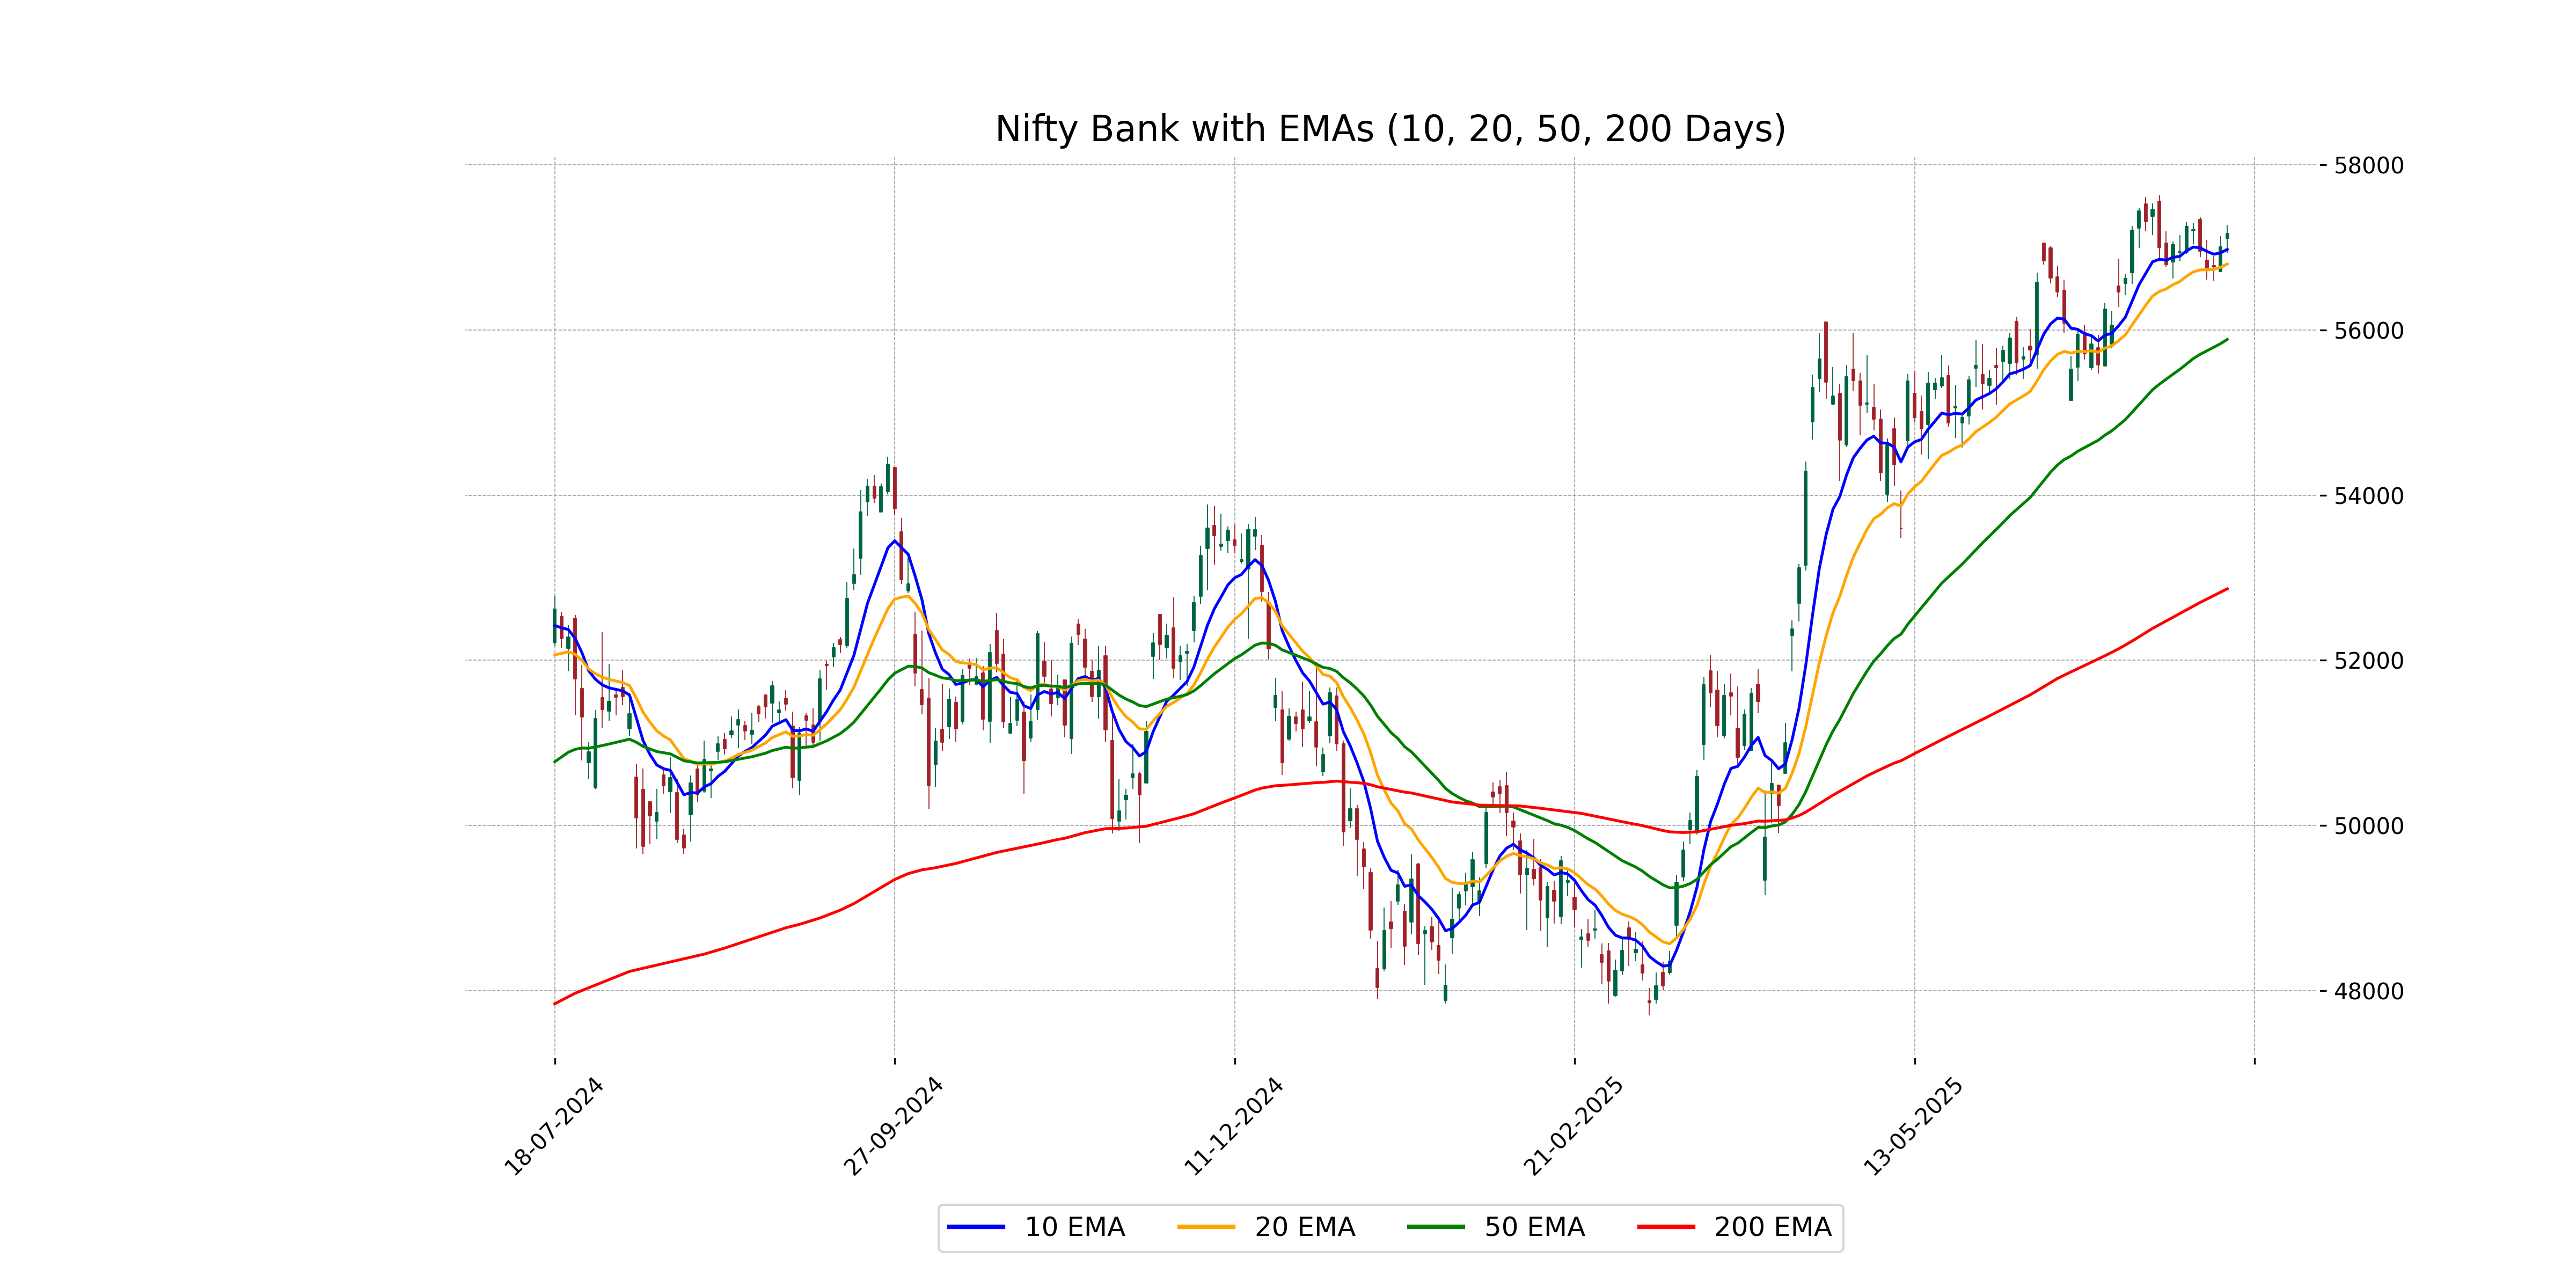
Relationship with Key Moving Averages
The Nifty Bank index closed at 57,168.95, which is above its 10-day EMA of 56,976.86, 20-day EMA of 56,798.85, and 50-day EMA of 55,886.56, indicating a short to medium-term bullish trend. The index is also trading well above its 200-day EMA of 52,866.54, suggesting a strong long-term uptrend.
Moving Averages Trend (MACD)
The MACD for Nifty Bank is currently at 302.53, while the MACD Signal is at 367.55. This indicates a bearish momentum as the MACD is below the signal line. Investors may want to watch for any future crossovers or confirmation of trends.
RSI Analysis
Based on the given data, the Relative Strength Index (RSI) for Nifty Bank is 58.76. This suggests that the index is in the neutral range, indicating neither overbought nor oversold conditions. A reading between 30 and 70 typically signifies neutrality and suggests the potential for a continuation of the current trend.
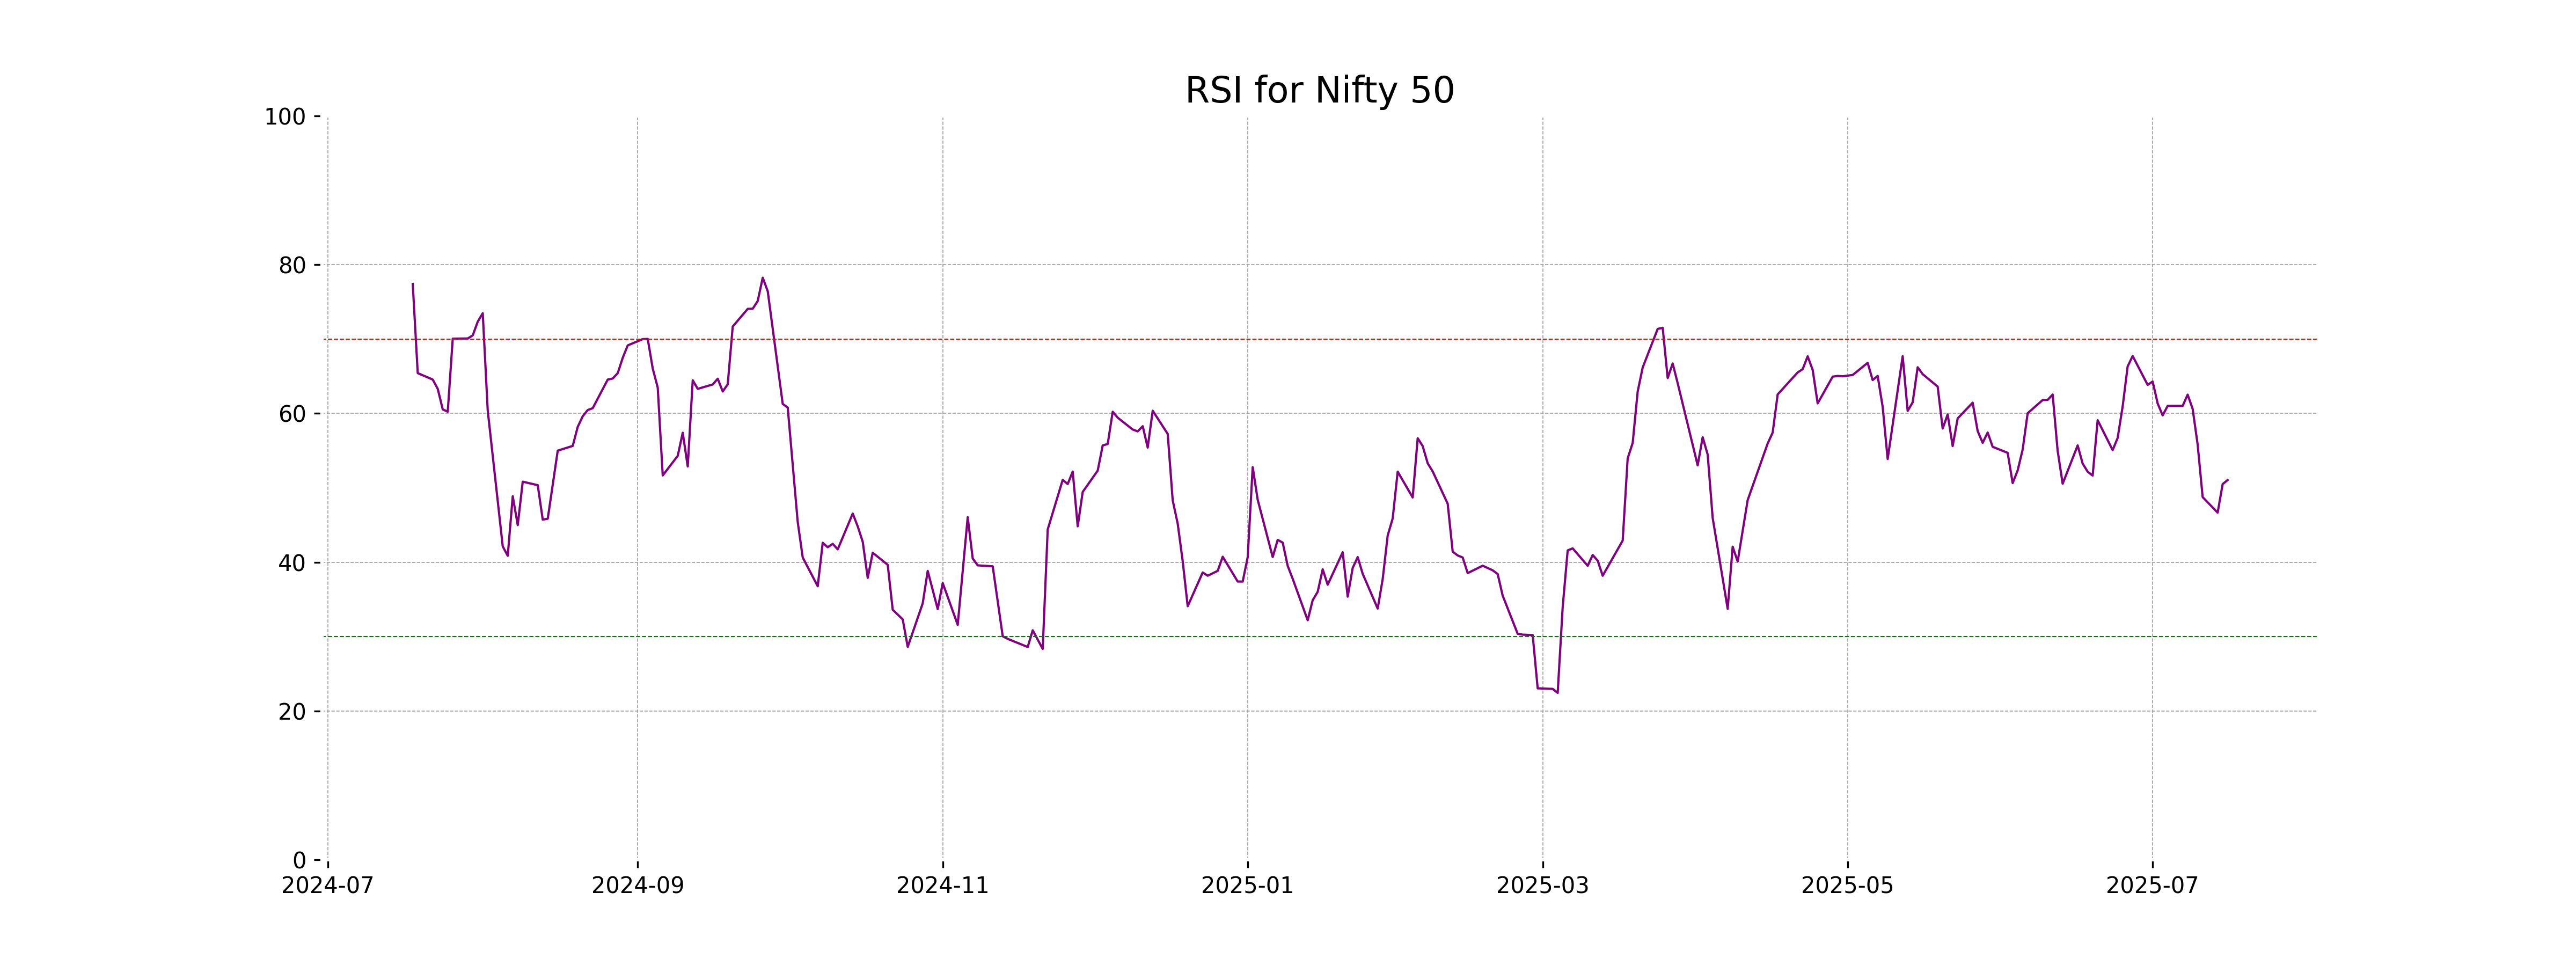
Analysis for Nifty 50 - July 16, 2025
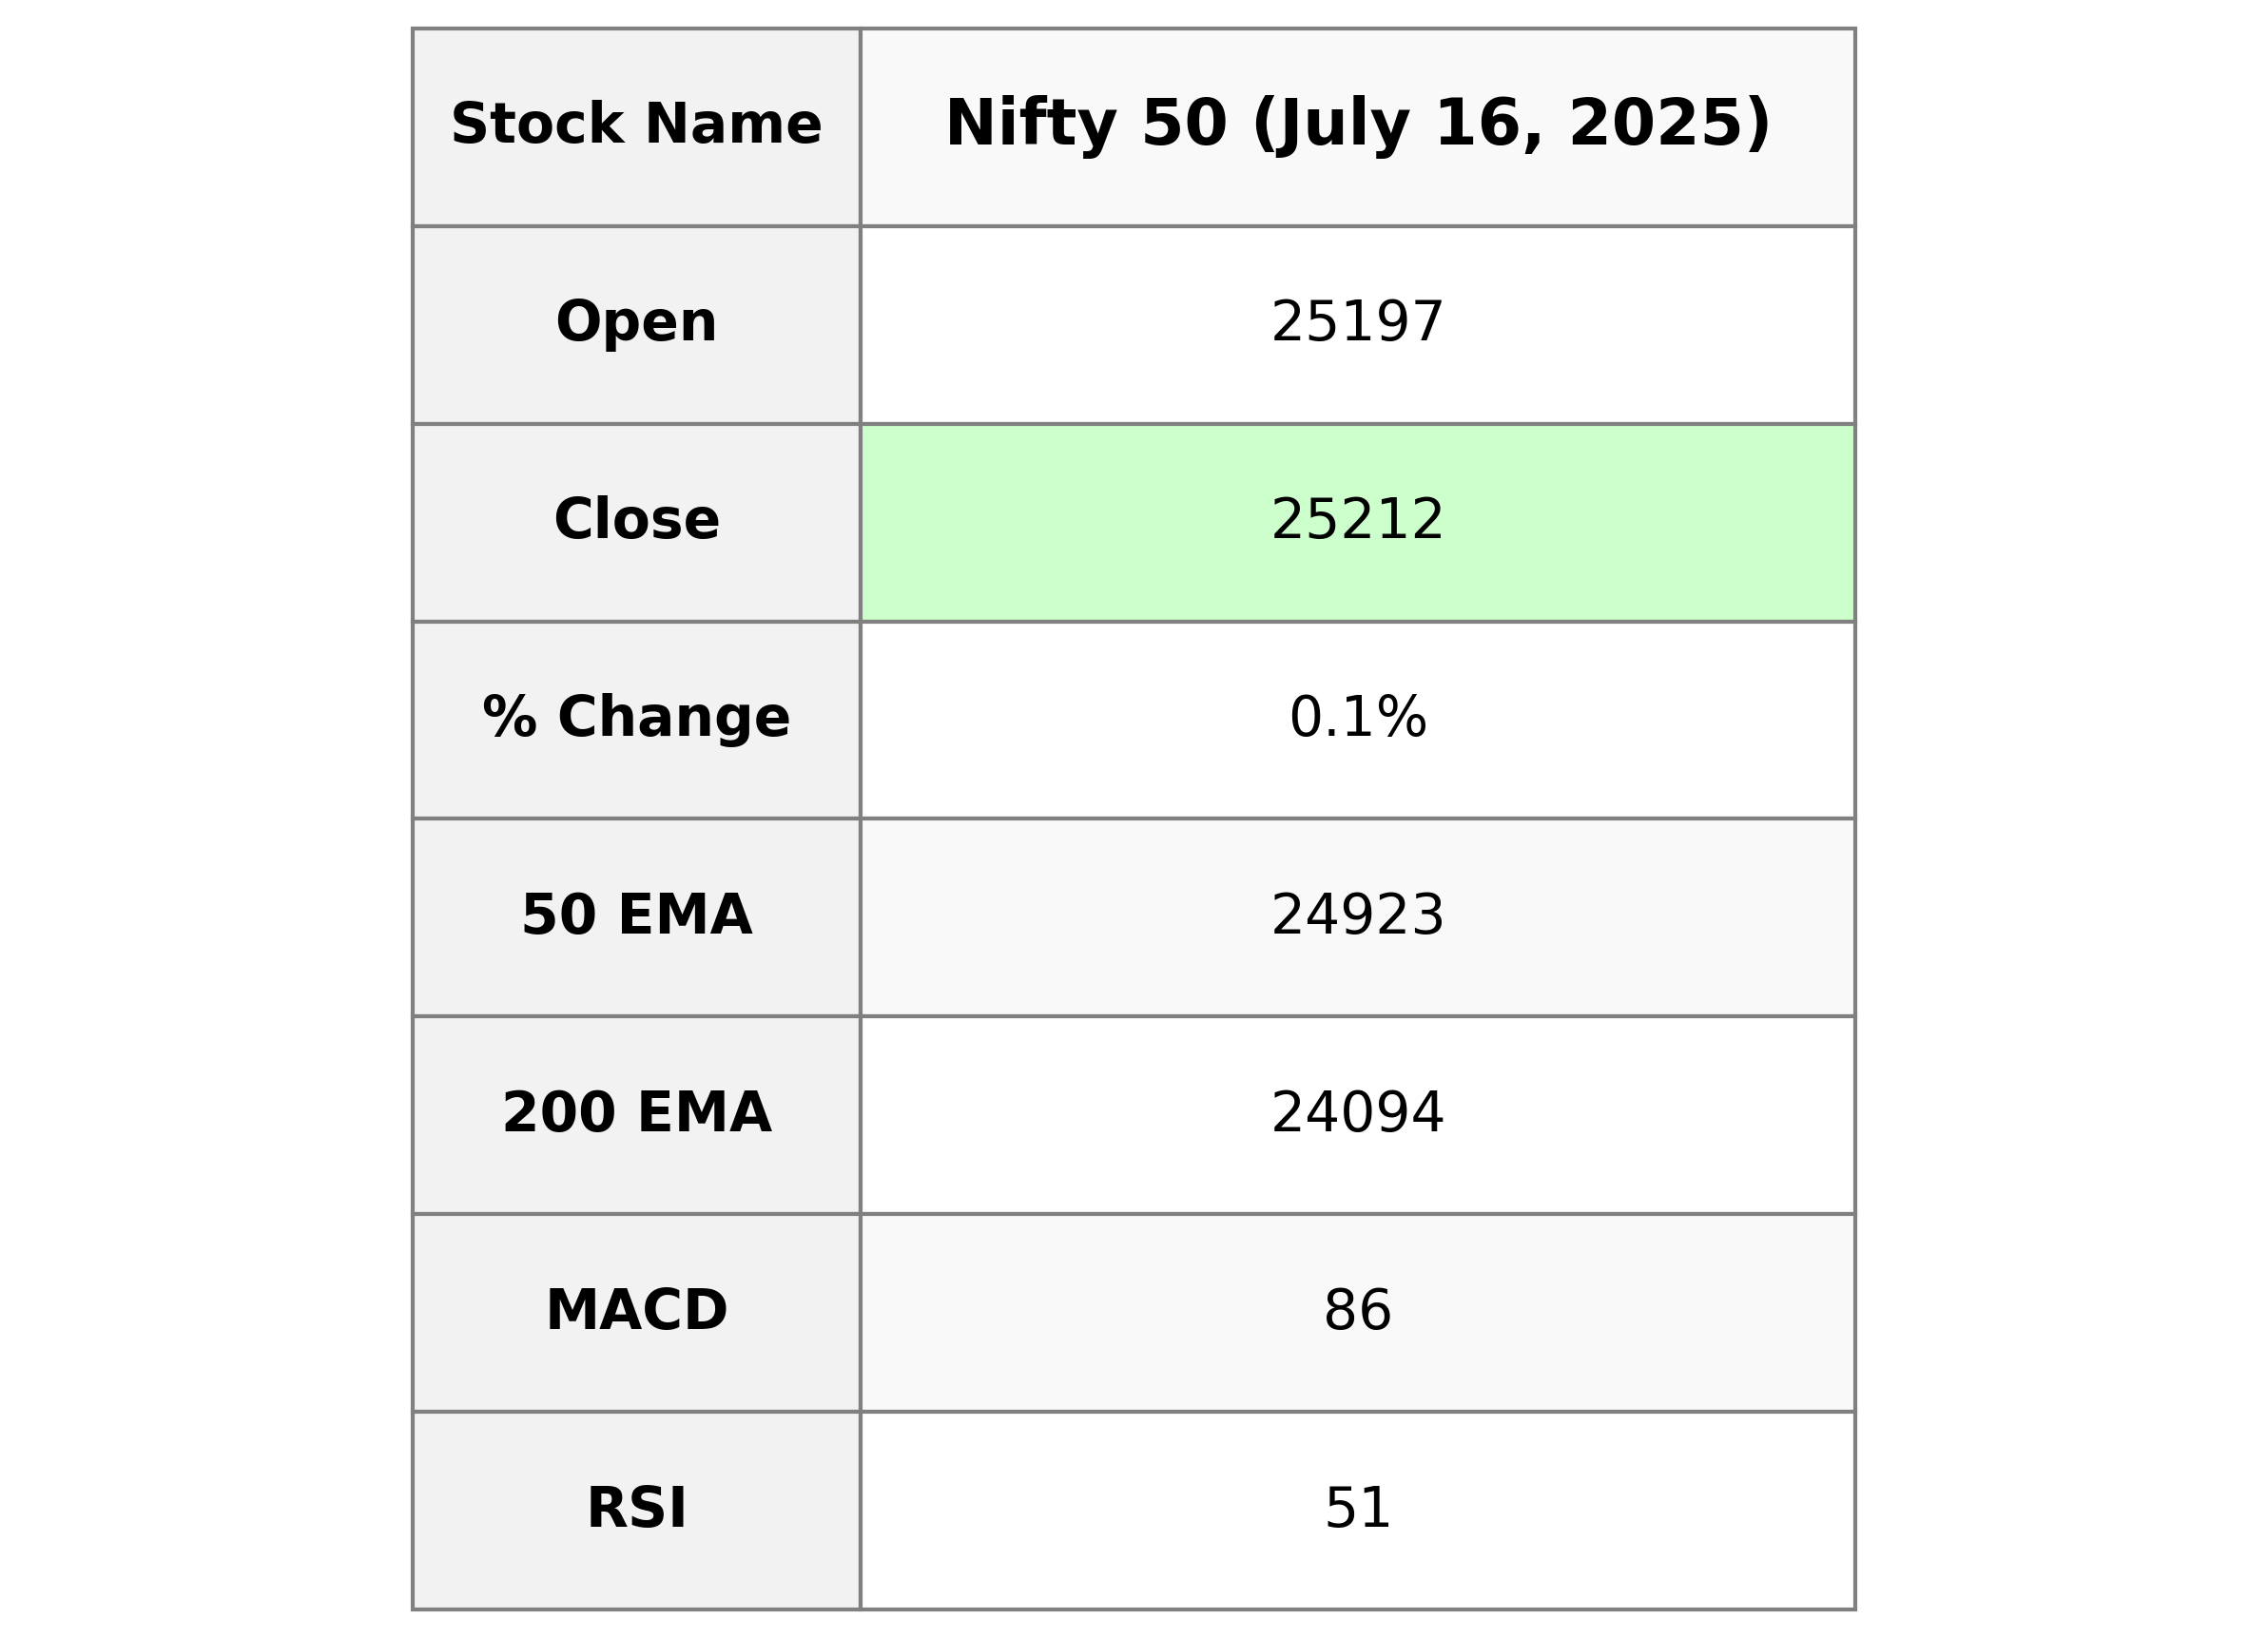
Nifty 50 opened at 25,196.60 and closed slightly higher at 25,212.05 with a percentage change of 0.0645%, reflecting a modest gain of 16.25 points. The RSI indicates a neutral trend at 51.05, while the MACD suggests a bearish outlook as it is below the MACD signal. The 50-day EMA is at 24,923.26, showing the index is slightly above its short-term average, while the 10-day and 20-day EMAs are above the current close, indicating recent downward pressure.
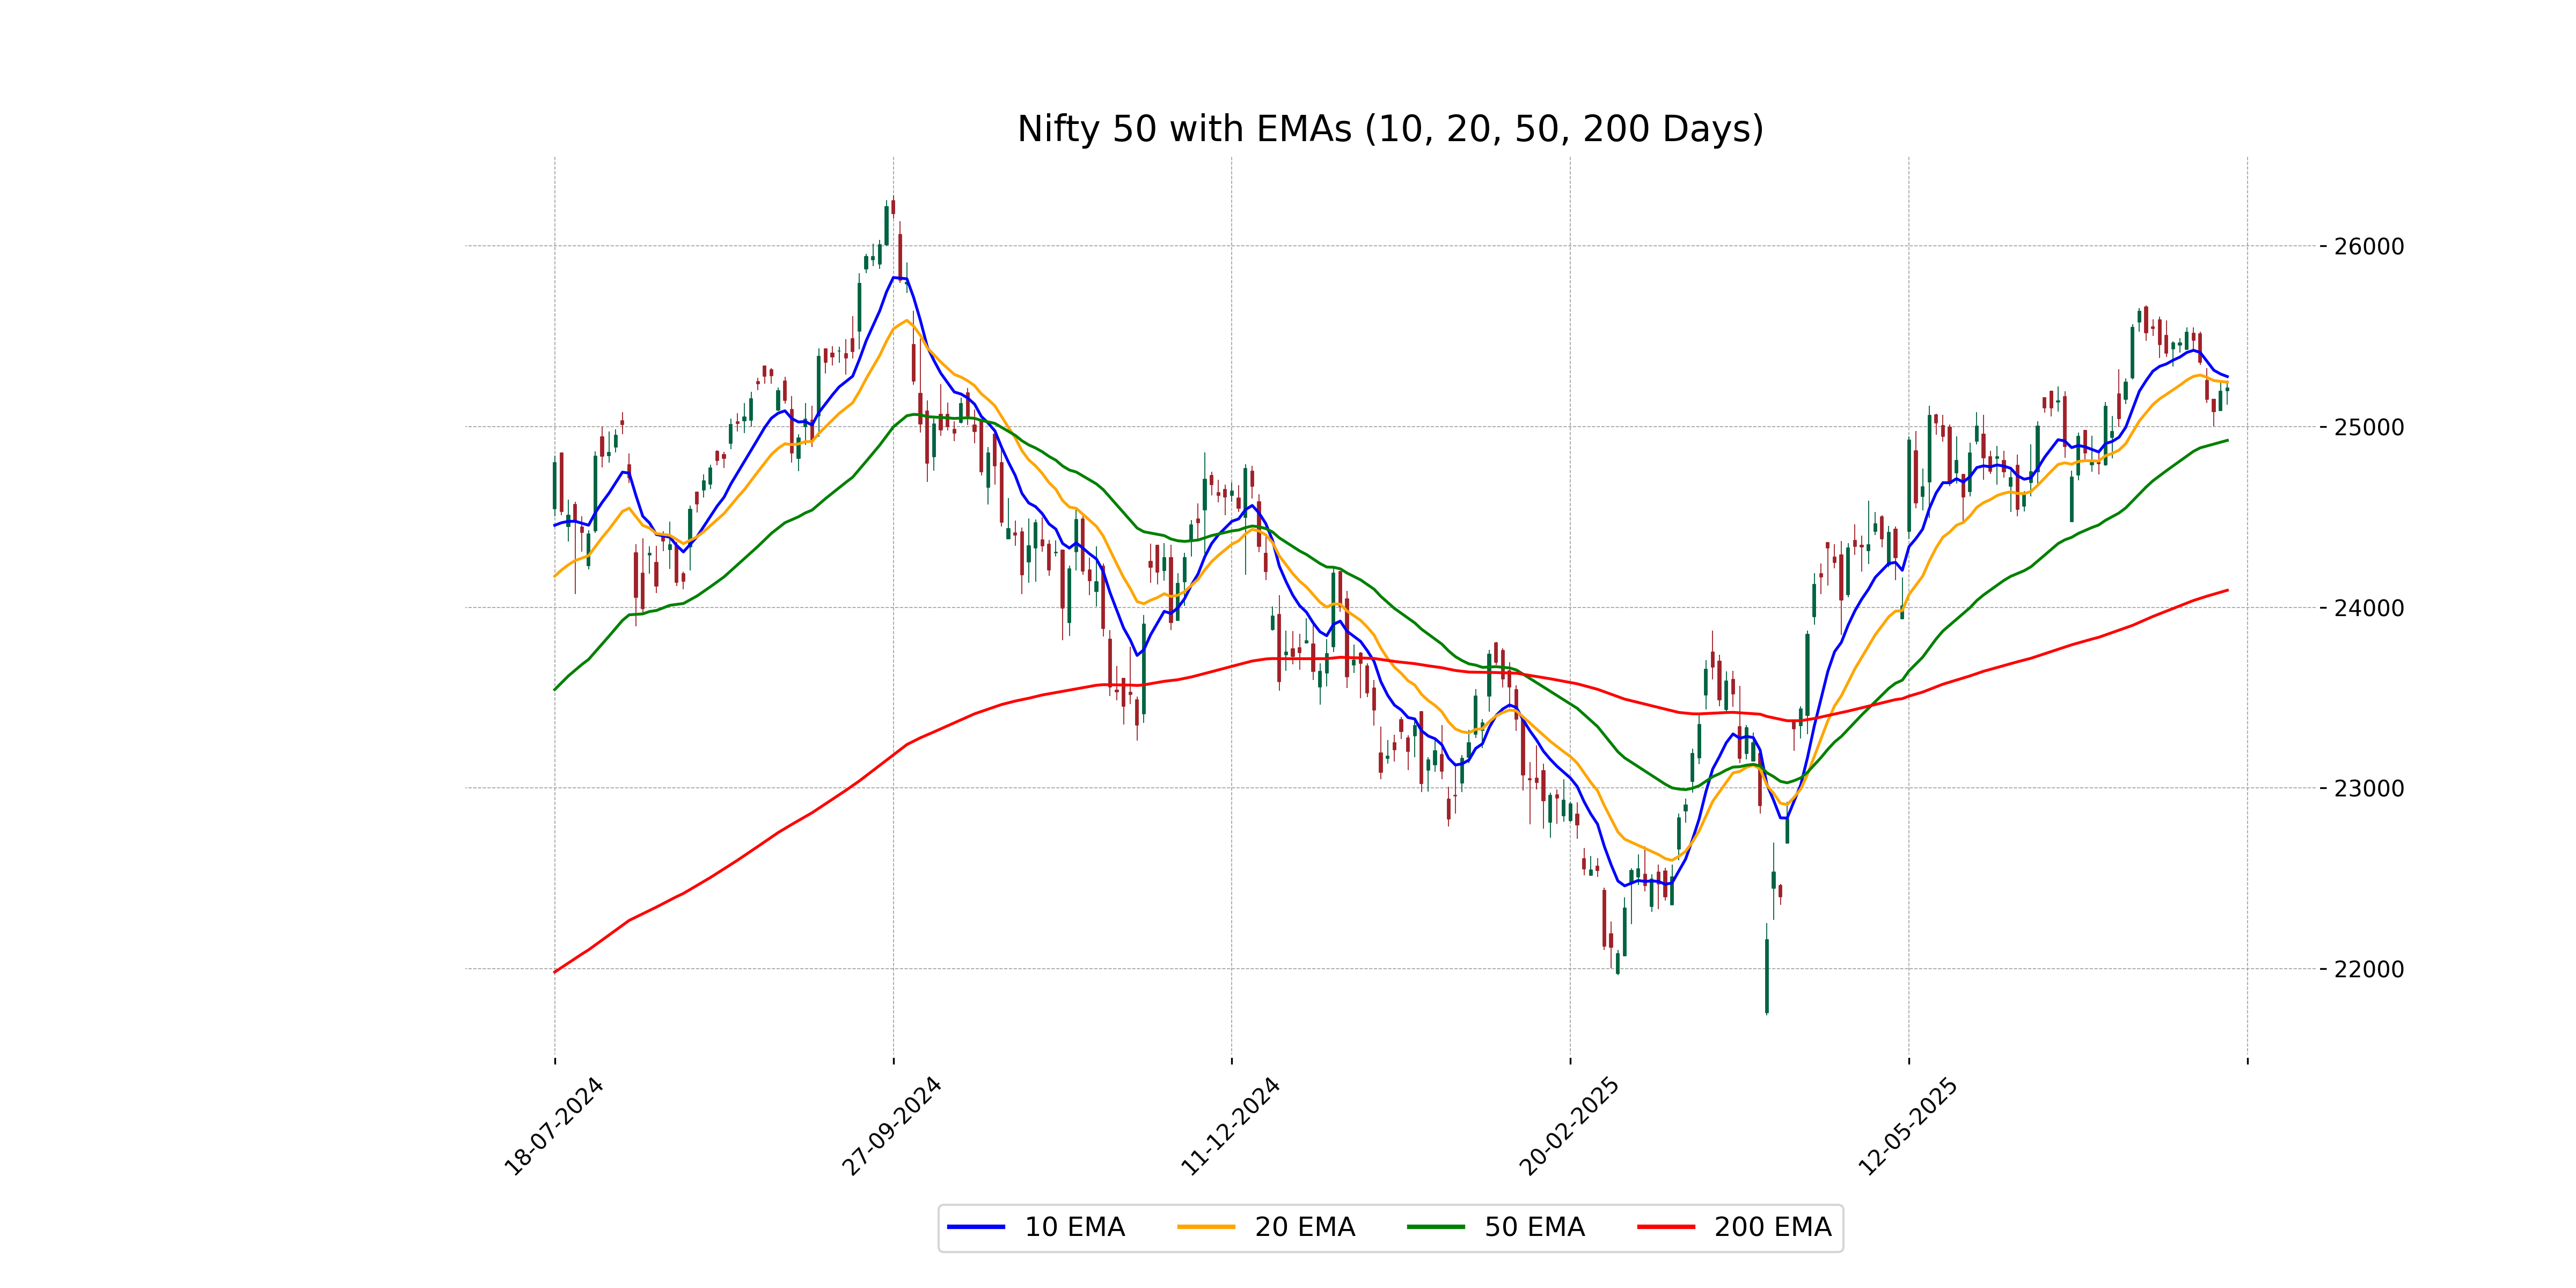
Relationship with Key Moving Averages
The close price of Nifty 50 is 25,212.05, which is above its 50-day EMA of 24,923.26 and significantly above its 200-day EMA of 24,094.10, suggesting a bullish trend in the longer term. However, it is below the 10-day EMA of 25,276.04 and the 20-day EMA of 25,244.80, indicating a potential short-term consolidation or weakening.
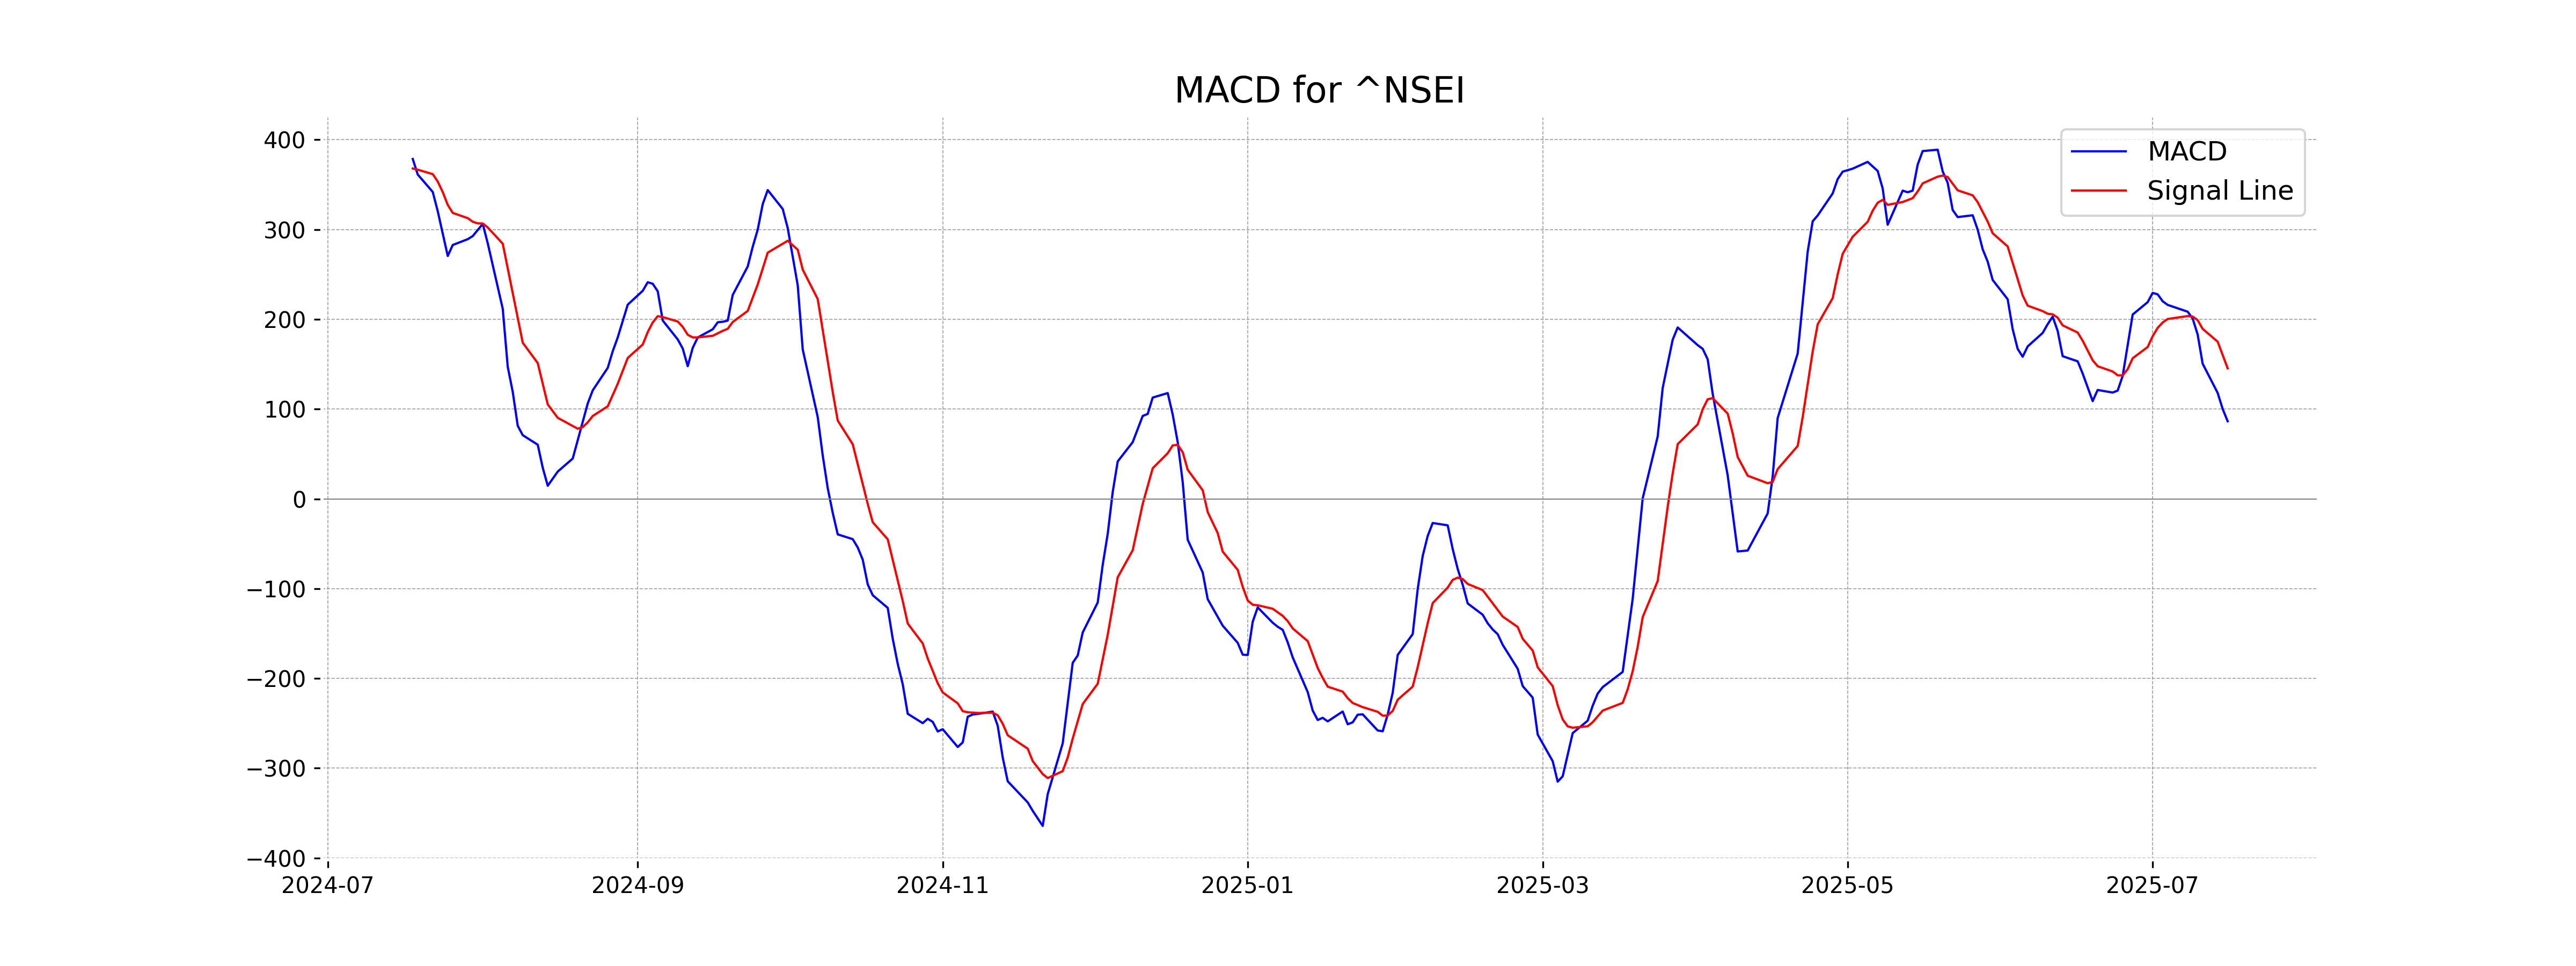
Moving Averages Trend (MACD)
Nifty 50's MACD value is 86.43, while the MACD Signal line is higher at 145.38, indicating a bearish momentum as the MACD line is below the signal line. This suggests that the index may experience downward pressure unless there is a reversal.
RSI Analysis
The RSI value for Nifty 50 is 51.05, which indicates a neutral position in terms of overbought or oversold conditions. An RSI value above 70 typically suggests overbought conditions, while below 30 indicates oversold conditions. Therefore, Nifty 50 is neither in an overbought nor an oversold state at this time.
Up Next

Global stock market indices: How the world markets performed today - 16 July 2025

Honda Activa 6G: Everything You Need to Know Before Buying

How much does a ULIP plan really cost? A break-down of all charges

Centre plans to borrow Rs 8.20 lakh cr from market in first half of FY27

Reliance denies buying Iranian oil amid US sanctions waiver

Premium petrol price up Rs 2, industrial diesel up Rs 22; no change in normal petrol, diesel rates

More videos

India's GDP expected to register over 8 pc growth in Sep-Dec: Report

Govt announces seven measures to help boost exports

RBI keeps interest rates on hold after US trade deal boosts outlook

RBI proposes to compensate customers up to Rs 25,000 loss due to fraud

RBI raises GDP growth projection of Q1, Q2 of FY27

RBI pauses rate cuts, retains interest rate at 5.25 pc

Rupee jumps 122 paise to close at 90.27 against US dollar on India-US trade deal

Stock markets cheer India-US trade deal: Sensex, Nifty surge 2.5 pc

UPI transactions hit record high of Rs 230 lakh crore in 2025-26 till Dec: Govt

Explained: India-US trade deal, tariffs and trade benefits