


Highlights
- Global indices show mixed performances on January 14, 2025
- BSE Sensex records significant upsurge amid technical caution
- Overbought conditions signal caution across key global indices
Latest news

GIPMC Strengthens Certification Credibility Through Industry-Aligned Learning Frameworks

Sahara Star: Mumbai's Most Iconic Address for MICE and Wedding Celebrations

Paytm Foundation launches second 'Wisdom on Wheels' mobile learning bus to expand digital and computer education across Odisha

Mount Litera Zee School, Kalaburagi Achieves 100 Percent Result in First CBSE Class X Batch

Vedanta's claim of being highest bidder 'false narrative', RP tells NCLAT in Jaypee Associates insolvency case

"Finest actor of our generation": Namit Malhotra lauds Ranbir Kapoor's performance in 'Ramayana'

Priyadarshani Group of Schools announce 100% success in class 10th CBSE board results across its Pune campuses

Intertek Strengthens Solar Assurance Leadership with Purchase of Mitsui Chemicals Solar Laboratory Assets in India
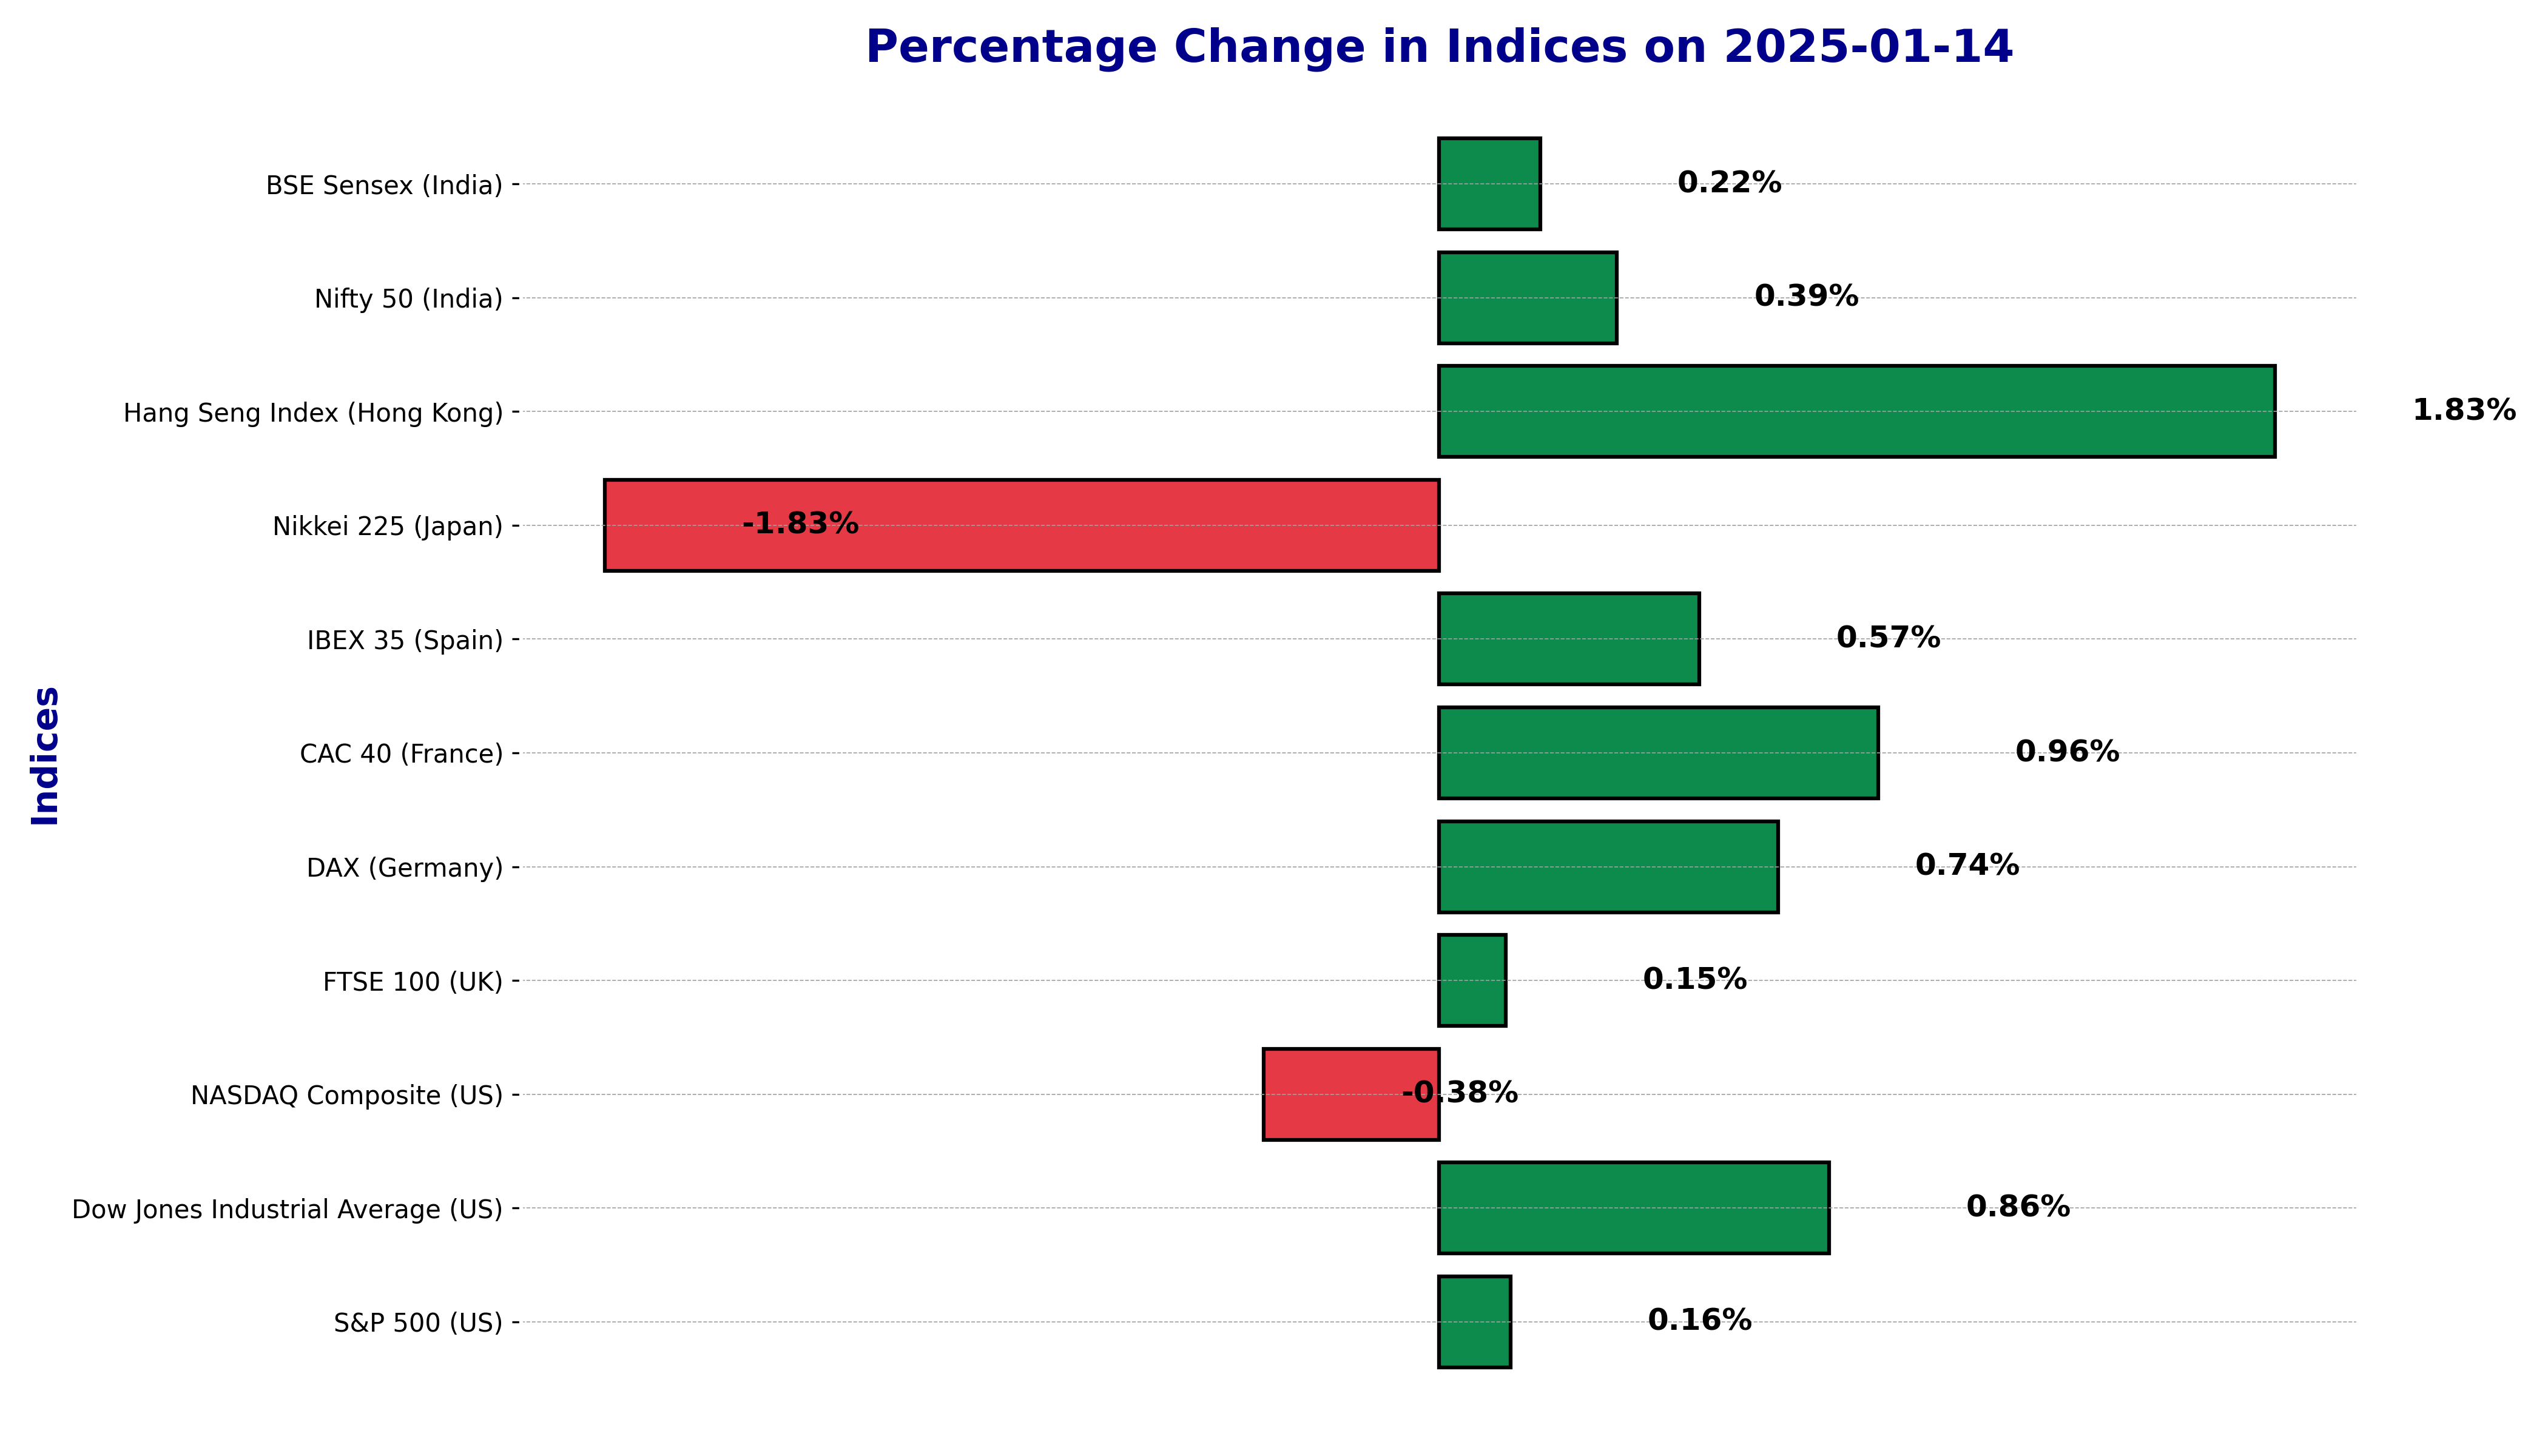
Global Stock Market Indices Performance Today - January 14, 2025: Mixed Trading Day


The international stock market indices showed varied performances on January 14, 2025, reflecting the economic sentiment across different regions.
In this article, we analyze the performance of key global indices including the S&P 500, Dow Jones Industrial Average, NASDAQ Composite, FTSE 100, DAX, CAC 40, IBEX 35, Nikkei 225, Hang Seng, Nifty 50, and BSE Sensex.
Global Stock Market Indices Today - January 14, 2025
BSE Sensex (India) on January 14, 2025
_candlestick_with_ema_1_year.png)
The BSE Sensex (India) witnessed a modest advancement as it closed at 76,499.63, marking a percentage change of 0.22% with a points change of 169.63 from its previous close of 76,330.01.
Technical Indicators
On the technical front, the 50-day Exponential Moving Average (EMA) is positioned at 79,000.62, while the 200-day EMA is at 79,348.52. The fact that both EMAs are higher than the current closing price indicates a potential downtrend, suggesting that the market is generally performing below its recent averages.
The Relative Strength Index (RSI) stands at 33.96, which is below the neutral level of 50. RSI levels below 30 are generally considered oversold, and the current RSI indicates that the BSE Sensex is nearing oversold conditions. This could imply potential consolidation or a reversal if market conditions shift favorably.
The Moving Average Convergence Divergence (MACD) is calculated at -743.17 with a MACD Signal of -548.24. The negative values for both MACD and its signal line suggest bearish momentum. Furthermore, since the MACD is more negative than the signal, it underlines the current negative sentiment gripping the market, emphasizing a downtrend.
Market Sentiment
The technical indicators for the BSE Sensex point towards a cautious market environment. Both RSI and MACD are critical in identifying the current market trend. A RSI near the oversold region indicates that the market might soon see a reversal if other conditions improve.
However, the consistent negative MACD readings confirm the prevailing downside momentum, signaling a downtrend. Investors might remain wary and await more bullish confirmation before considering long positions. As the market sentiment leans towards bearishness, traders should closely monitor these indicators for signs of trend shifts in the coming sessions.
Technical Analysis for CAC 40 (France) on January 14, 2025
_candlestick_with_ema_1_year.png)
The CAC 40 (France) has shown a noticeable change in the market on January 14, 2025, with a percentage change of 0.96% and a points change amounting to 71.33. This movement suggests a positive sentiment for the trading day.
Technical Indicators
Let's delve into the technical indicators to understand the current market trends for the CAC 40:
- 50 EMA: The 50-day Exponential Moving Average (EMA) for CAC 40 stands at 7365.27, indicating the average price over the last 50 days. As the current closing price of 7479.97 is above this value, it signifies a recent bullish trend.
- 200 EMA: The 200-day EMA is recorded at 7345.28. With the closing price also above this longer-term moving average, it further reinforces the bullish outlook.
- RSI (Relative Strength Index): The RSI for CAC 40 is noted at 58.88. RSI values above 50 generally indicate a buying strength, suggesting that the market was predominantly in an uptrend.
- MACD (Moving Average Convergence Divergence): The MACD value is 32.01, with a signal line of 24.14. Since the MACD line is above the signal line, it shows bullish momentum.
Market Sentiment
Based on the technical indicators observed, the CAC 40 (France) appears to be in an uptrend. The fact that both the 50 EMA and 200 EMA are trending below the current price supports the bullish momentum, indicating the market was performing optimistically on this particular day.
The RSI and MACD are crucial in identifying these trends. An RSI of 58.88 suggests that the asset isn't overbought yet, leaving room for potential upward movement. Meanwhile, the MACD's position above its signal indicates continued upward momentum. Together, these indicators present a positive outlook for CAC 40, pointing towards the market's strength on January 14, 2025.
DAX (Germany) Analysis - January 14, 2025
_candlestick_with_ema_1_year.png)
The DAX (Germany) has shown a notable performance on January 14, 2025. The index exhibited a percentage change of 0.74% with a points change of 149.63. This indicates a positive sentiment among investors, pushing the index to a closing value of 20,282.48.
Technical Indicators:
Analyzing the Exponential Moving Averages (EMAs), the 50 EMA is currently at 20,073.64 and the 200 EMA is at 20,010.59. As the current price is above both these EMAs, it suggests a bullish trend in the short to mid-term horizon.
The Relative Strength Index (RSI) is at 59.89, which is below the overbought threshold of 70 but indicates a stronger momentum, portraying a slightly bullish sentiment.
The Moving Average Convergence Divergence (MACD) is at 56.99 with a MACD Signal of 52.23. The MACD being above the signal line suggests positive momentum and further supports the bullish stance of the market.
Market Sentiment:
The overall market sentiment for the DAX (Germany) appears to be in an uptrend based on the presented technical indicators. The position of the price relative to the 50 EMA and 200 EMA signifies a continuation of the upward movement.
The RSI, being under the overbought zone, provides a cushion for further upward movements without the immediate threat of a reversal caused by overbuying. Coupled with a positive MACD reading, these indicators together align to emphasize the presence of an ongoing uptrend.
In summary, the analysis of DAX (Germany) on January 14, 2025, reveals a promising position, hinting towards sustained bullish momentum aided by supportive technical indicators.
Stock Analysis for Dow Jones Industrial Average (US) on January 14, 2025
_candlestick_with_ema_1_year.png)
The Dow Jones Industrial Average (US) experienced a positive change on January 14, 2025. The index recorded a % change of 0.8552%, translating to a points change of 358.67 points.
Technical Indicators for Dow Jones Industrial Average (US):
- 50 EMA and 200 EMA: The 50 Exponential Moving Average (EMA) is currently at 43,244.48, while the 200 EMA stands at 43,484.39. The 50 EMA being below the 200 EMA generally indicates a bearish trend, as shorter-term prices are below their longer-term average, suggesting a possible continuation or formation of a downtrend.
- RSI: The Relative Strength Index (RSI) is at 38.31. An RSI below 40 typically signals bearish market momentum and could indicate that the market is currently oversold, suggesting potential for a price reversal if conditions change.
- MACD: The Moving Average Convergence Divergence (MACD) value is -368.52, with a MACD Signal line of -340.87. A negative MACD value indicates bearish sentiment as the MACD line is below the signal line. This further supports the potential downtrend identified by the moving averages.
Market Sentiment:
Based on the technical indicators, the Dow Jones Industrial Average (US) is currently in a downtrend. The RSI's reading below 40 confirms the market's recent negative momentum, while the MACD's negative crossover adds evidence of prevailing bearish conditions.
Despite the day's positive change in points, the overall market sentiment reflects a cautious environment, suggesting traders maintain a vigilant stance as they await signs of a potential reversal.
Technical Analysis of FTSE 100 (UK) - January 14, 2025
_candlestick_with_ema_1_year.png)
On January 14, 2025, the FTSE 100 (UK) showed a modest increase, with a percentage change of 0.146% and a points change of 12.0. This rise suggests a positive market movement for the day.
Technical Indicators:
The 50-day Exponential Moving Average (EMA) for FTSE 100 stands at 8233.57, while the 200-day EMA is at 8238.49. The proximity of the 50 EMA to the current closing price suggests that the market may have been oscillating around this level, indicating a balanced state of momentum over the mid-term.
The 200 EMA being slightly above the trading price implies a longer-term upward trajectory, yet the market remains close to this benchmark.
The Relative Strength Index (RSI), which is a momentum oscillator, is calculated at 51.81. This value is close to the neutral mark of 50, indicating that there is an almost equal balance of buyers and sellers, suggesting no clear trend in either direction for the time being.
The Moving Average Convergence Divergence (MACD) is recorded at 2.91 with a MACD Signal of -4.87. The positive MACD and a MACD line being above the signal line generally signify bullish momentum, albeit the divergence value showing a potential lack of strong conviction.
Market Sentiment:
Based on the technical indicators analyzed, the FTSE 100 appears to be in a cautiously optimistic state. The overall sentiment, influenced by the slight positive points and percentage change alongside the technical indicators, hints at a tentative uptrend.
The closing price being above the 50 EMA suggests a recent leaning towards positive performance. However, the RSI being near neutral and minimal spread between MACD and its signal line suggests limited immediate volatility and no pronounced bullish or bearish sentiment.
The RSI and MACD play crucial roles in identifying market trends. In this scenario, the RSI's neutral position indicates a lack of overly bought or sold conditions, while the MACD's positive but limited gap to its signal line showcases mild bullishness, encouraging cautious optimism among traders.
Technical Analysis of Hang Seng Index (Hong Kong) on January 14, 2025
_candlestick_with_ema_1_year.png)
The Hang Seng Index (Hong Kong) experienced a notable movement on January 14, 2025, closing at 19,219.78 points. This reflected a percentage change of 1.83% and a points change of 345.64 points from the previous close of 18,874.14 points.
Technical Indicators Discussion:
The 50-day Exponential Moving Average (EMA) is at 19,645.27, which provides insight into the intermediate-term trend of the index. The 200-day EMA, which stands at 19,675.39, offers a view of the longer-term trend. Currently, the index is trading below both the 50-day and 200-day EMAs, indicating a bearish trend in the longer term.
The Relative Strength Index (RSI) is at a level of 41.12. Typically, an RSI below 30 is considered oversold, and above 70 is considered overbought. Thus, an RSI of 41.12 suggests bearish momentum but not in the oversold territory.
The Moving Average Convergence Divergence (MACD) indicator is at -171.41, with the MACD Signal line at -82.43. The negative MACD value indicates a bearish sentiment, given that the MACD is below the Signal line, highlighting downward momentum.
Market Sentiment Evaluation:
Based on the technical indicators for the Hang Seng Index, the market appears to be in a downtrend, as evidenced by the closing below the 50-day and 200-day EMAs and the negative MACD reading. The RSI at 41.12, although not in oversold territory, still indicates bearish pressure.
Such readings suggest that the market sentiment is predominantly negative. The MACD's position below its signal further corroborates this bearish outlook, hinting at the sustained downward momentum in the index's recent trading sessions.
Technical Analysis for IBEX 35 (Spain) on January 14, 2025
_candlestick_with_ema_1_year.png)
The IBEX 35, Spain's benchmark stock index, exhibited a performance characteristic of cautious optimism on January 14, 2025. With a slight increase in value, the index reported a percentage change of 0.57%, translating to a points change of 66.60 points, closing at 11,754.80.
Technical Indicators
The IBEX 35's technical indicators provide insightful cues into the market's current state and potential trajectory:
- 50 EMA vs. 200 EMA: The 50-day Exponential Moving Average (EMA) is recorded at 11,706.96, while the 200-day EMA is slightly higher at 11,709.88. A minor spread between these averages suggests a phase of consolidation in the market, without any significant bearish or bullish signal.
- RSI: The Relative Strength Index (RSI) stands at 53.33. This neutral figure indicates that the index is neither overbought nor oversold, maintaining its price action within a stable range.
- MACD: The Moving Average Convergence Divergence (MACD) is 14.87, with a signal line of -1.38. The positive MACD, relative to its signal line, suggests that upward momentum is gaining traction.
Market Sentiment
Considering the technical indicators, the market sentiment for the IBEX 35 tends towards a cautious uptrend. This is primarily ascertained from the positive MACD value along with the RSI hovering above 50, which collectively hint at a recovering buying interest.
However, the lack of significant divergence between the short-term and long-term EMAs suggests the need for confirmation before forecasting a robust trend.
Overall, while the market remains in a tentative upward trend, continued observation of these indicators in coming trading sessions would be essential to ascertain the strength and sustainability of this trend.
Technical Analysis: NASDAQ Composite (US) - January 14, 2025
_candlestick_with_ema_1_year.png)
The NASDAQ Composite (US) experienced a modest decline on January 14, 2025. The index reported a percentage change of -0.38%, translating to a points change of -73.53 points. This movement sets the NASDAQ Composite's closing at 19,088.10 points, down from the previous close of 19,161.63 points.
Technical Indicators
The 50-Day Exponential Moving Average (EMA) for NASDAQ Composite stands at 19,557.97. This figure, when compared to the current closing price, indicates that the index is trading below the 50-day EMA, suggesting a bearish short-term trend.
Similarly, the 200-Day EMA is recorded at 19,547.33. The current closing being below this level highlights persistent bearish momentum over the longer term as well.
The Relative Strength Index (RSI) is at 40.79, which places it below the neutral 50-mark. An RSI closer to 30 is generally interpreted as indicating oversold conditions, whereas values nearer to 70 suggest overbought scenarios. At 40.79, the NASDAQ Composite is closer to the oversold side, albeit not quite there, nonetheless hinting at weakened buying power.
The Moving Average Convergence Divergence (MACD) sits at -79.45 with the MACD Signal line at -16.40. A negative MACD indicates a downward trend, and the significant difference between the MACD and its Signal line further supports the bearish sentiment.
Market Sentiment
Analyzing the current performance of the NASDAQ Composite (US) through its technical indicators suggests that the market is trending downward. Both the 50 and 200 EMAs exhibit bearish positions, which imply persistent negative sentiment in both short and long-term trends. The RSI corroborates this sentiment by being below 50, indicating a lack of strong buying interest.
The MACD also supplies additional confirmation of a downtrend with its negative value and gap with the Signal line. These signals work collectively to map a bearish market outlook, suggesting that the NASDAQ Composite is experiencing downward pressure.
In summary, the market appears to be in a bearish trend as evidenced by its key technical measures. Investors and traders might exercise caution considering these indications until new patterns or catalysts emerge to potentially alter the current trajectory.
Nifty 50 (India) Technical Analysis - January 14, 2025
_candlestick_with_ema_1_year.png)
The Nifty 50 (India) stock market index has shown a % change of 0.39% from its previous closing value, with a points change of 90.10. This brings the closing value for January 14, 2025, to 23,176.05.
Technical Indicators Overview
Examining the technical indicators provides insights into the current market trends:
- 50 EMA: The 50-day Exponential Moving Average is at 23,897.41. As the current closing value of 23,176.05 is below this level, it indicates a bearish sentiment in the short to medium term.
- 200 EMA: The long-term 200-day Exponential Moving Average stands at 23,996.72. Being below this baseline suggests a persistent downtrend in the long-term overview.
- RSI: The Relative Strength Index is calculated to be 35.30, a clear indication that the market is approaching oversold conditions. It breaches below the neutral level of 50, highlighting continued downward pressure.
- MACD: The Moving Average Convergence Divergence stands at -211.92, with the MACD signal line at -153.90. A negative MACD further signifies bearish momentum as the MACD line is below the signal line.
Market Sentiment Analysis
The current technical indicators paint a picture of a market leaning towards a downward trend. The closing price's positioning below both the 50 EMA and 200 EMA underscores prolonged bearishness, outlining how the Nifty 50 is struggling to find upward momentum. The RSI's indication of nearing oversold territory suggests potential for a reversal if buyers step in, but at present, there's a prevailing negative sentiment.
The MACD, being in negative territory, reinforces the downward trend. As it remains below the signal line, it mirrors the bearish sentiment echoed by the EMAs and RSI. Collectively, these indicators highlight a general bearish market sentiment for Nifty 50, suggesting caution for traders looking for upward opportunities.
Nikkei 225 (Japan) Technical Analysis - January 14, 2025
_candlestick_with_ema_1_year.png)
On January 14, 2025, the Nikkei 225 (Japan) demonstrated a significant downward movement. The index experienced a % change of -1.83% with a total points change of -716.10, closing at 38,474.30. This decline marks a noticeable movement in the Japanese stock market for the day.
Technical Indicators:
- 50 EMA: The 50-day Exponential Moving Average (EMA) for the Nikkei 225 is at 39,230.49. Since the current closing price of 38,474.30 is below the 50 EMA, it suggests potential bearish momentum in the short to medium term.
- 200 EMA: Meanwhile, the 200-day EMA is positioned at 39,135.27. The index falling below this level is often interpreted as a longer-term bearish signal, indicating a possible continuation of the downward trend if the price does not reverse.
- RSI: The Relative Strength Index stands at 41.39. This suggests that the index is close to being oversold; however, it is not yet in the textbook oversold territory of below 30. Caution is advised as further declines could push the RSI into a more oversold condition, hinting at potential reversal or continuation of the trend.
- MACD: The Moving Average Convergence Divergence (MACD) indicator reads at 55.32, whereas the MACD Signal is at 134.53. With MACD being lower than the signal line, this divergence supports a bearish sentiment, indicating further downside risk might be possible for the index.
Market Sentiment:
Currently, the Nikkei 225 appears to be in a downtrend. The crossover of the 50-day EMA below the 200-day EMA furthers this bearish outlook, often referred to as a "death cross", signaling potential further downward movement if the trend persists. The RSI and MACD values are critical indicators that reflect the current market sentiment as well.
While the RSI is hovering above the oversold category, it suggests potential selling pressure. The MACD brings further confirmation of bearish sentiment, with its position below the signal line validating the downtrend signal. If these indicators do not exhibit marked changes, investors should be cautious of continued bearish sentiment in the short to mid-term period.
Technical Analysis for S&P 500 (US) on January 14, 2025
_candlestick_with_ema_1_year.png)
The S&P 500 (US) came to a close at 5,836.22 points on January 14, 2025. This represents a percentage change of 0.16% from its previous close of 5,827.04, indicating a slight upward momentum with a points change of 9.18.
Technical Indicators:
Examining the key technical indicators, the 50-day Exponential Moving Average (EMA) stands at 5,963.59, while the 200-day EMA is at 5,978.00. These figures suggest that the current closing price is trailing below both the 50-day and 200-day EMAs, indicating a potential bearish sentiment in the market.
The Relative Strength Index (RSI) is calculated at 39.01, which is below the neutral 50 level and closer to the oversold threshold, potentially suggesting that the index might be undervalued but may still face selling pressure.
The Moving Average Convergence Divergence (MACD) at -34.04, along with the MACD signal at -23.89, both being negative, reinforce the bearish outlook as the MACD line is below the signal line.
Market Sentiment:
The overall market sentiment for the S&P 500 hints at a bearish trend, based on the technical indicators assessed. The distance of the current price from both the 50 EMA and 200 EMA points towards a downtrend. Furthermore, the RSI value supports this bearish sentiment by indicating potential overselling activity without yet reaching a point of reversal.
The MACD further confirms this market downtrend with its position below the signal line, implying continued bearish momentum.
In conclusion, the analysis of technical indicators such as the EMAs, RSI, and MACD provides insight into the prevailing sentiment of the S&P 500 (US). The indicators suggest that the index is currently experiencing a bearish phase, with potential opportunities for reversal if the RSI moves towards the oversold region and triggers renewed buying interest.
Up Next
Global Stock Market Indices Performance Today - January 14, 2025: Mixed Trading Day

Centre plans to borrow Rs 8.20 lakh cr from market in first half of FY27

Reliance denies buying Iranian oil amid US sanctions waiver

Premium petrol price up Rs 2, industrial diesel up Rs 22; no change in normal petrol, diesel rates

India's GDP expected to register over 8 pc growth in Sep-Dec: Report

Govt announces seven measures to help boost exports

More videos

RBI keeps interest rates on hold after US trade deal boosts outlook

RBI proposes to compensate customers up to Rs 25,000 loss due to fraud

RBI raises GDP growth projection of Q1, Q2 of FY27

RBI pauses rate cuts, retains interest rate at 5.25 pc

Rupee jumps 122 paise to close at 90.27 against US dollar on India-US trade deal

Stock markets cheer India-US trade deal: Sensex, Nifty surge 2.5 pc

UPI transactions hit record high of Rs 230 lakh crore in 2025-26 till Dec: Govt

Explained: India-US trade deal, tariffs and trade benefits

Trade deal with US adds momentum to India's growth ambition: Industry leaders

Rupee jumps 119 paise to 90.30 against the US dollar on India-US trade deal