


Highlights
- Sensex and IBEX show strength in price momentum
- MACD provide mixed signals across indices
- Bullish RSIs noticeable in markets like the Nifty and Nasdaq
Latest news

Dell Launches New Pro Precision AI Workstations In India, Introduces Deskside Agentic AI Platform

Oppo Enco Air5 Review: Incredible Value at ₹3,099

Samsung Galaxy A27 5G Goes On Sale In India With Cashback Offers, Zero Down Payment Schemes
 First Impressions: A Strong Debut For The New 'b' Series")
Nothing Phone (4b) First Impressions: A Strong Debut For The New 'b' Series

Samsung Galaxy A27 Review: A Dependable Mid-Ranger With Few Surprises

Union Finance Minister Nirmala Sitharaman Inaugurates Muzhiyan Kulam, Restored by Lumina Datamatics and Community Stakeholders in Puducherry

"Don't think anyone will be able to break his track record": Annu Kapoor hails Big B's unmatched legacy

Rewriting the Rules of Business Education: Stride School of Business Unveils Its AI-First Campus Infrastructure
Global stock market indices: How the world markets performed today - 5 February 2025


The international stock market indices showed varied performances on February 05, 2025, reflecting the economic sentiment across different regions.
In this article, we analyze the performance of key global indices including the S&P 500, Dow Jones Industrial Average, NASDAQ Composite, FTSE 100, DAX, CAC 40, IBEX 35, Nikkei 225, Hang Seng, Nifty 50, and BSE Sensex.

Analysis for Sensex - February 05, 2025

The Sensex opened at 78,704.60 and closed at 78,271.28, showing a % change of 1.41% with a points change of 1084.54. The Relative Strength Index (RSI) is at 56.24, indicating moderately strong momentum. The stock is trading above both its 50-day and 200-day Exponential Moving Averages (EMAs).

Relationship with Key Moving Averages
Sensex is currently trading slightly above its 50-day and 200-day EMAs, indicating a short-term bullish momentum. However, it is trading below its 10-day and 20-day EMAs, which might suggest some recent downward pressure. The positive change from the previous close reflects recent upward movement.
Moving Averages Trend (MACD)
The Moving Average Convergence Divergence (MACD) for Sensex is -353.17, with a MACD Signal of -637.85. The MACD is above the signal line, indicating a potential bullish momentum. However, it is important to consider other indicators and market conditions for comprehensive analysis.

RSI Analysis
The RSI for Sensex is 56.24, which indicates a neutral to slightly bullish momentum as it is above the 50-mark. This suggests that the index is neither overbought nor oversold, but it is closer to a bullish territory.

Analysis for Dow Jones Industrial Average (US) - February 05, 2025

The Dow Jones Industrial Average (US) showed a positive performance, with a close at 44,556.04, marking a 0.30% increase from the previous close of 44,421.91, adding 134.13 points. The index's RSI is at 60.56, indicating a moderate upward momentum, while the MACD is above the signal line, suggesting continued bullish sentiment.

Relationship with Key Moving Averages
The Dow Jones Industrial Average is trading above its key moving averages, with its close at 44556.0391 surpassing the 50-day EMA of 43594.6162, the 10-day EMA of 44394.4126, and the 20-day EMA of 44029.8591. This indicates a bullish trend as the price is positioned above these short- and medium-term averages.
Moving Averages Trend (MACD)
The Dow Jones Industrial Average shows a positive MACD value of 405.62, indicating a bullish momentum, as it is above the MACD Signal line at 309.86. This suggests potential continued upward movement in the index.

RSI Analysis
The RSI for the Dow Jones Industrial Average is 60.56, indicating a moderately strong trend. An RSI above 50 suggests a general upward momentum, although it remains below the overbought threshold of 70, implying there's still room for growth without immediate overbought concerns.

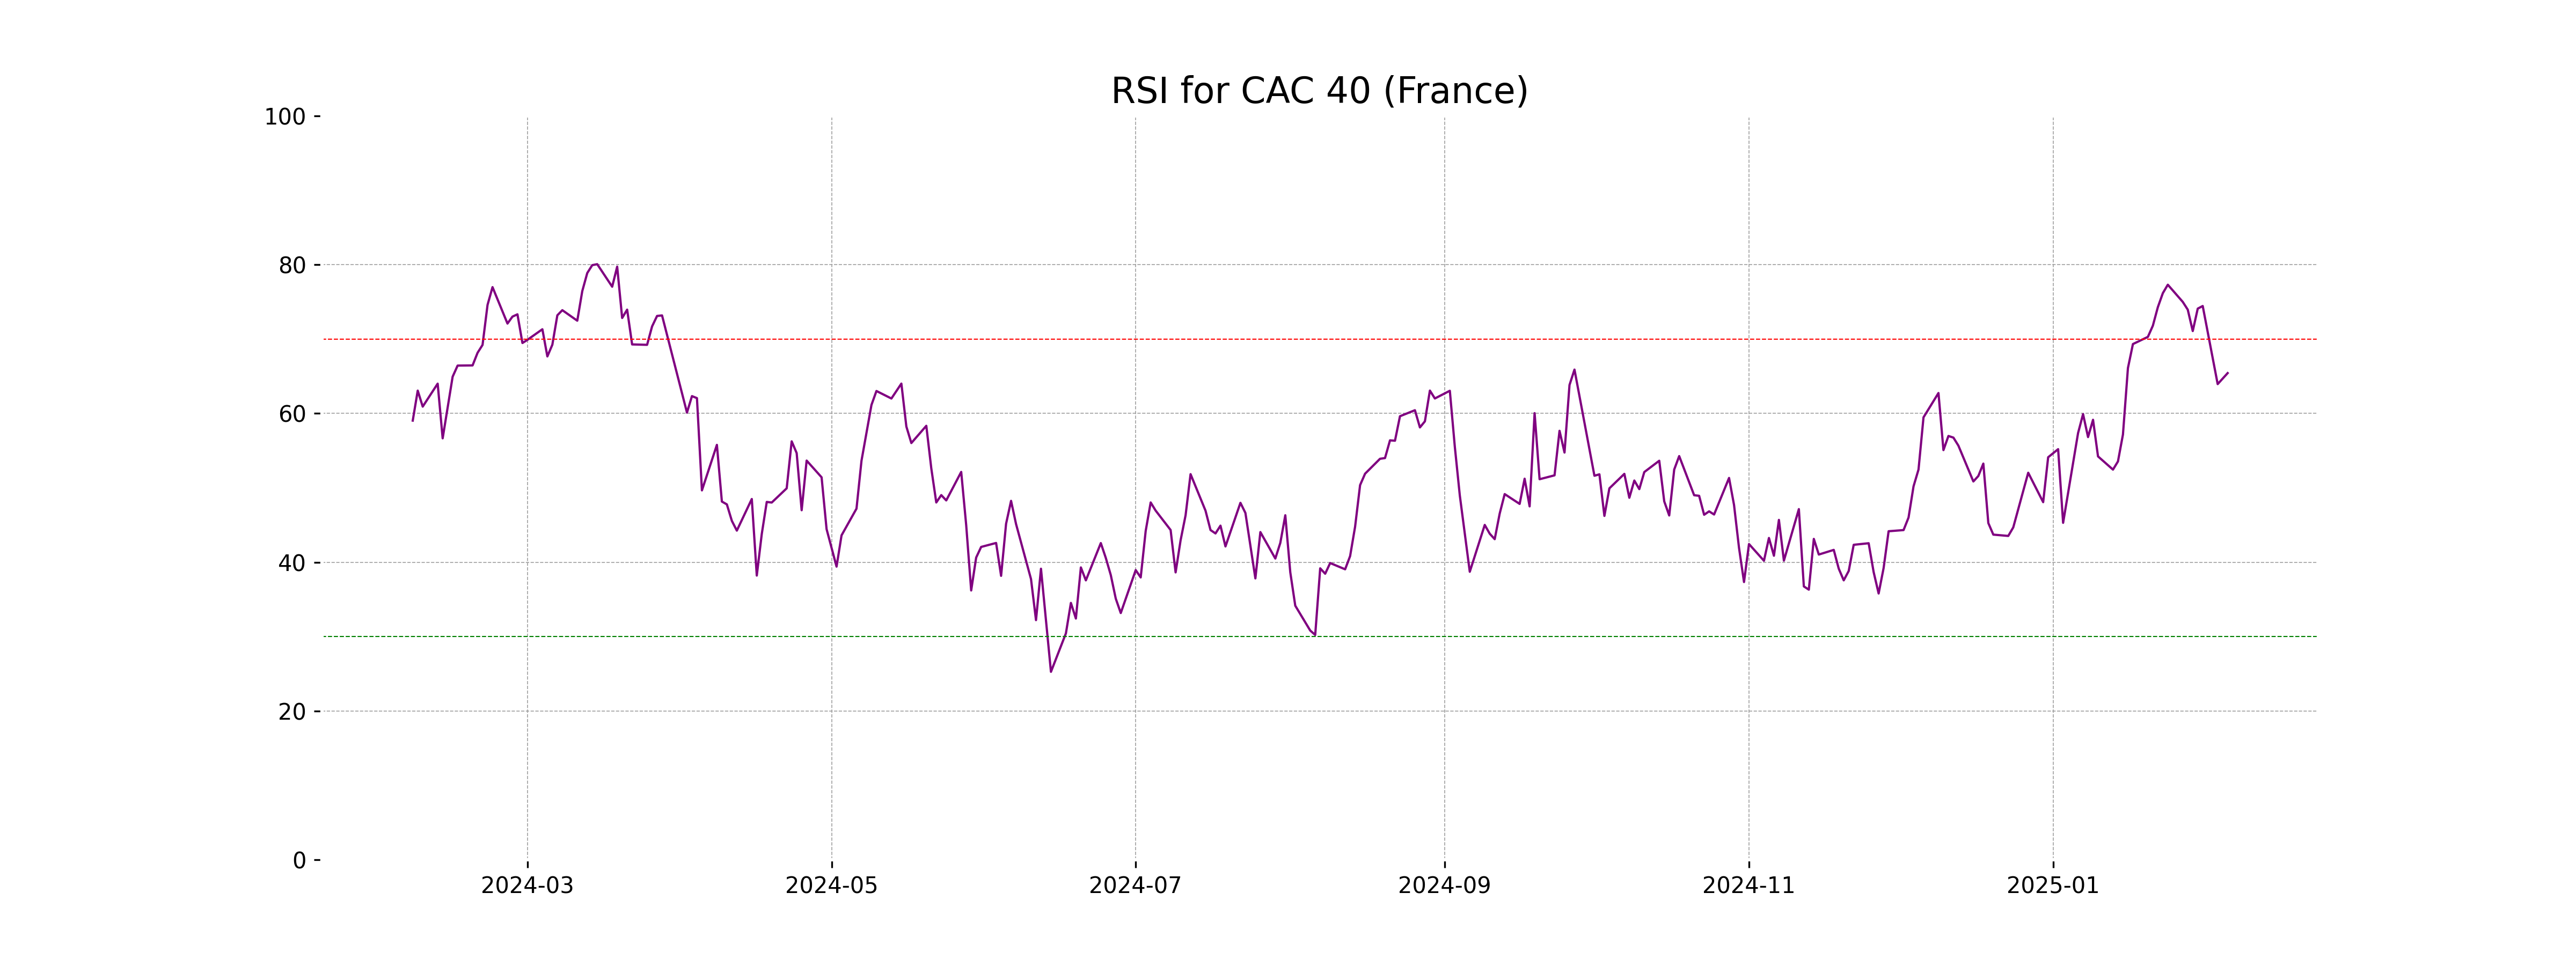
Analysis for CAC 40 (France) - February 05, 2025

The CAC 40 (France) showed a positive performance with a closing value of 7881.77, up by approximately 0.34% or 26.85 points from the previous close of 7854.92. Notably, the Relative Strength Index (RSI) stands at 65.43, indicating the index is in the upper range of the neutral zone. The MACD value also suggests a positive momentum in the market.

Relationship with Key Moving Averages
The CAC 40 index is trading above its key moving averages, with the current close of 7881.77 higher than the 50 EMA (7586.26), 200 EMA (7537.55), 10 EMA (7855.55), and 20 EMA (7752.49). This positioning suggests a bullish trend in the short to long term, bolstered by a positive MACD of 133.03 above its signal line of 129.17.
Moving Averages Trend (MACD)
The MACD value for CAC 40 (France) is 133.03, which is above the MACD Signal line value of 129.17. This suggests a bullish indicator, indicating a potential upward momentum in the market.

RSI Analysis
The Relative Strength Index (RSI) for CAC 40 is 65.43, which suggests that the index is approaching overbought conditions. An RSI above 70 typically indicates that a security may be overvalued or due for a pullback, while a reading below 30 suggests it may be undervalued.
Analysis for FTSE 100 (UK) - February 05, 2025

FTSE 100 (UK) opened at 8570.77 and closed slightly lower at 8563.47, marking a decrease of 0.23% and a points change of -20.13. The 50-day EMA is observed at 8366.75, with a 200-day EMA of 8196.61, indicating a bullish trend. The RSI of 61.11 suggests neither overbought nor oversold conditions.

Relationship with Key Moving Averages
FTSE 100 is trading above its 50-day EMA of 8366.75 and 200-day EMA of 8196.61, indicating a positive momentum. However, it is slightly above its 10-day EMA of 8555.49, which suggests a near-term mixed sentiment.
Moving Averages Trend (MACD)
The FTSE 100's MACD value is 92.91, which is above its MACD Signal line at 85.42, indicating a bullish momentum. This suggests that the index may be experiencing upward price movement and positive market sentiment.

RSI Analysis
The RSI for FTSE 100 (UK) is 61.11, indicating a relatively neutral position. RSI values typically between 30 and 70 suggest that the index is neither overbought nor oversold, which may point to a steady market without significant momentum in either direction.

Analysis for DAX (Germany) - February 05, 2025

DAX (Germany) Performance: The DAX opened at 21,429.83, with a high of 21,468.35 and a low of 21,387.72, closing at 21,460.85. The index increased by 32.61 points or 0.15% from the previous close of 21,428.24. The RSI is at 66.86, indicating a strong momentum, while the MACD shows a bullish signal above the signal line.

Relationship with Key Moving Averages
The DAX (Germany) closed at 21460.85, which is above its 10 EMA of 21395.39, indicating a short-term bullish trend. It is also well above its 50 EMA of 20501.98 and its 200 EMA of 19158.28, suggesting a strong longer-term uptrend.
Moving Averages Trend (MACD)
The MACD value of 385.58 indicates a bullish trend for DAX, as it is higher than the MACD Signal line value of 366.86. This suggests that the momentum for DAX is currently positive, potentially signaling further upward movement.

RSI Analysis
The RSI for DAX (Germany) is 66.86, which indicates that the market is approaching overbought conditions. Typically, an RSI above 70 suggests an overbought market, so investors should monitor any further upward movement closely for potential selling pressure.

Analysis for S&P 500 (US) - February 05, 2025

The S&P 500 (US) opened at 5998.14 and closed at 6037.88, marking a rise of 43.31 points or a 0.72% increase on the previous close of 5994.57. The relative strength index (RSI) is at 53.31, indicating a neutral market sentiment, while the MACD suggests a positive momentum as it is above the signal line.

Relationship with Key Moving Averages
The S&P 500 closed at 6037.88, which is above its 50-day EMA of 5969.24 and significantly above the 200-day EMA of 5645.82, indicating a potential bullish trend. It is also slightly above the 10-day EMA of 6030.85, suggesting short-term strength in the market.
Moving Averages Trend (MACD)
The S&P 500's MACD value of 23.67, which is above the MACD signal line of 21.77, suggests a potential bullish momentum. This indicates that the recent upward trend might continue if the positive momentum persists.

RSI Analysis
The RSI value for S&P 500 is 53.31, which indicates a neutral position, suggesting neither overbought nor oversold conditions. Traders may see minimal price pressure as the market hovers near equilibrium.

Analysis for Hang Seng Index (Hong Kong) - February 05, 2025

The Hang Seng Index opened at 20,827.77 and closed at 20,597.09, showing a percentage change of 1.88% with a points rise of 379.83 from the previous close of 20,217.26. The RSI of 65.64 suggests that the index is nearing an overbought condition, and the MACD indicates a bullish trend with a value of 155.97 compared to its signal line.

Relationship with Key Moving Averages
The Hang Seng Index (Hong Kong) is trading above its 10 EMA, 20 EMA, and 50 EMA, indicating a strong upward momentum. The current close of 20597.0898 suggests a bullish sentiment as it surpasses these key moving averages, which are at 20067.4152, 19894.2036, and 19797.4135 respectively.
Moving Averages Trend (MACD)
MACD Analysis for Hang Seng Index (Hong Kong): The MACD of 155.97 is significantly higher than the Signal line at 40.34, indicating a strong bullish momentum. This suggests potential upward movement in the index.

RSI Analysis
The RSI (Relative Strength Index) of the Hang Seng Index is at 65.64, indicating a moderately strong momentum. It suggests the index is nearing overbought conditions, which typically start at an RSI above 70. This implies potential caution for traders as it might signal a slowing of the current upward trend.

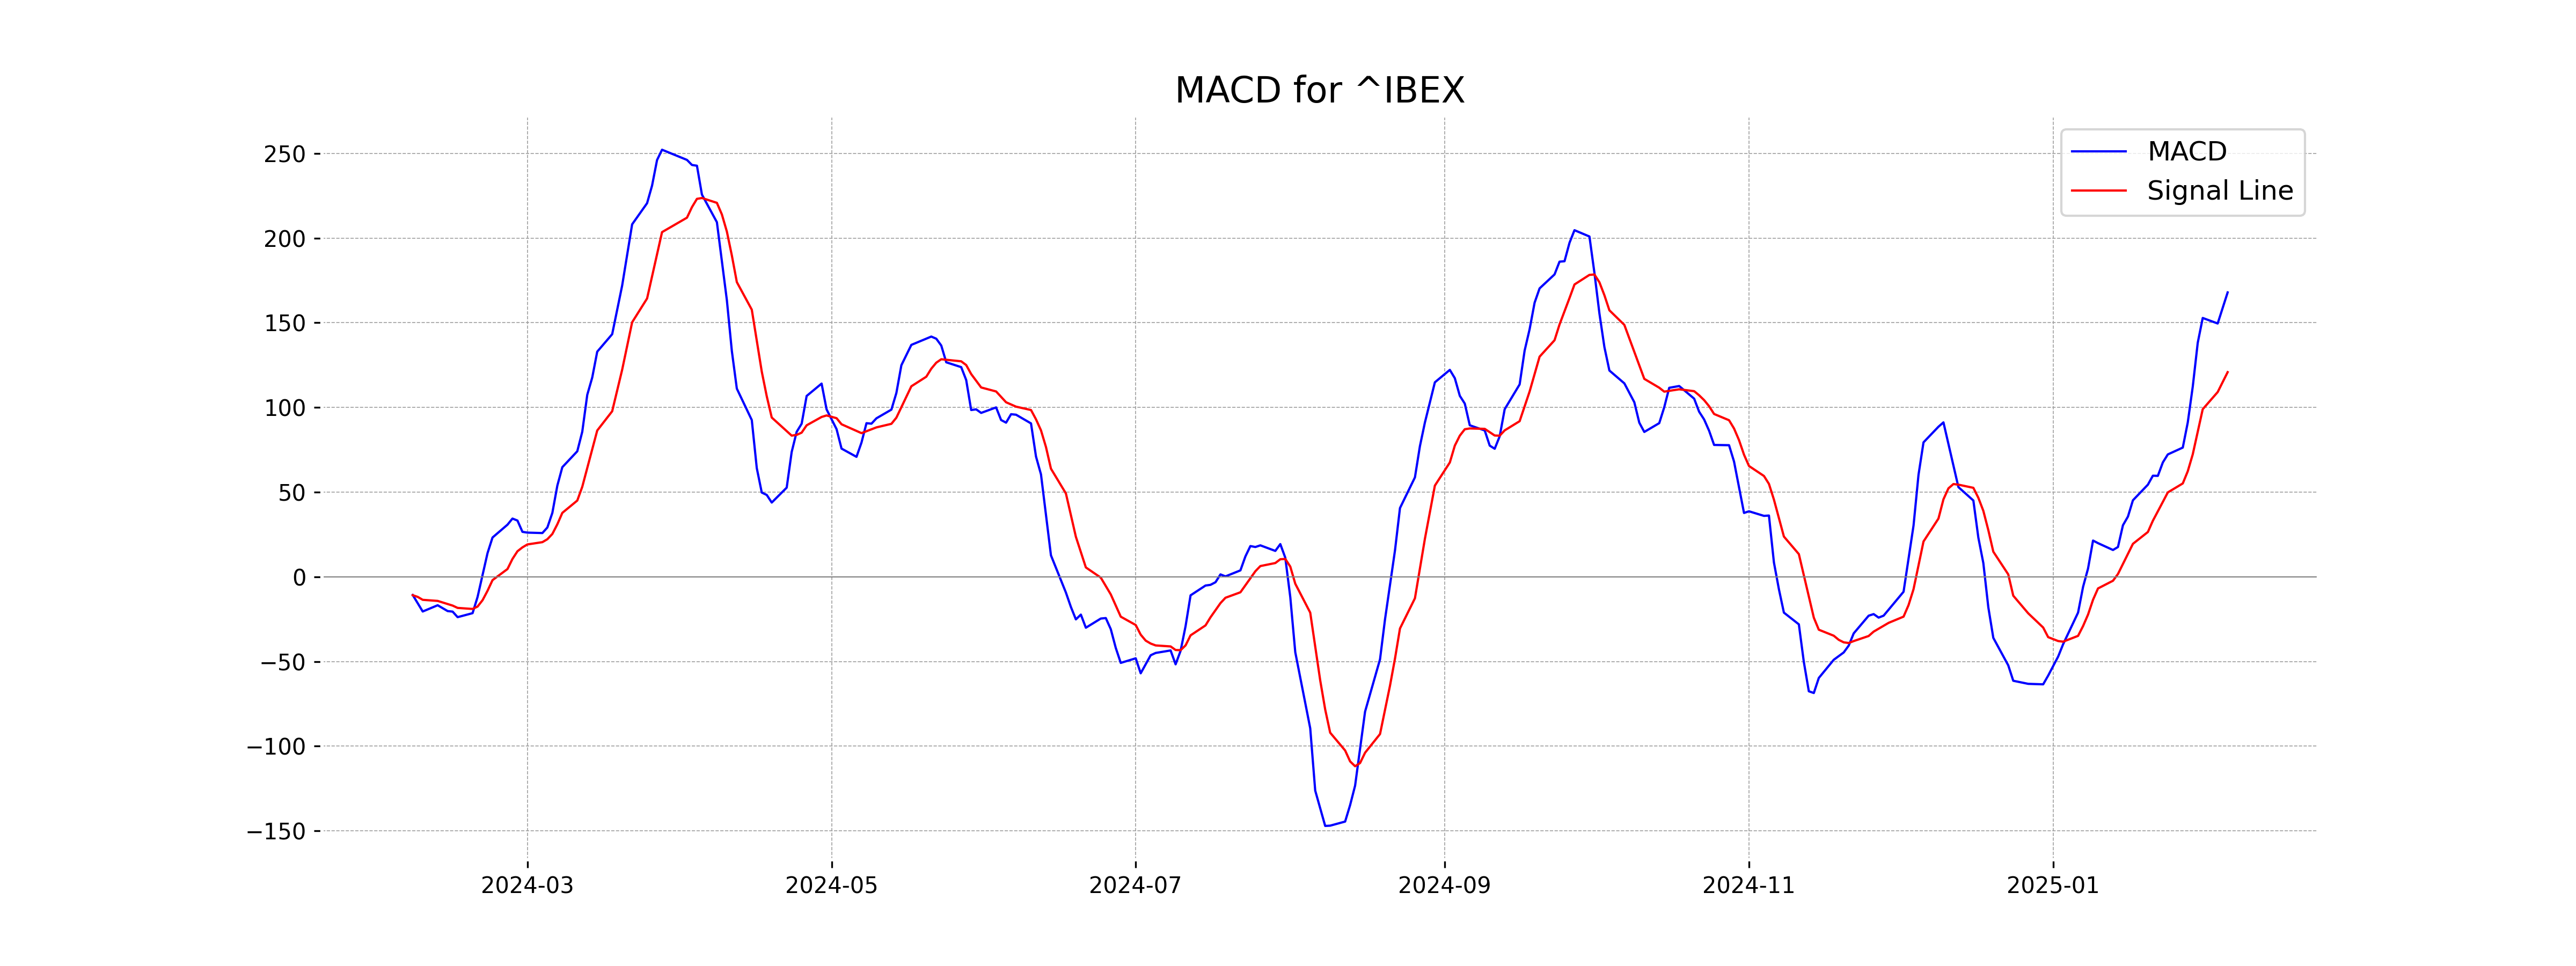
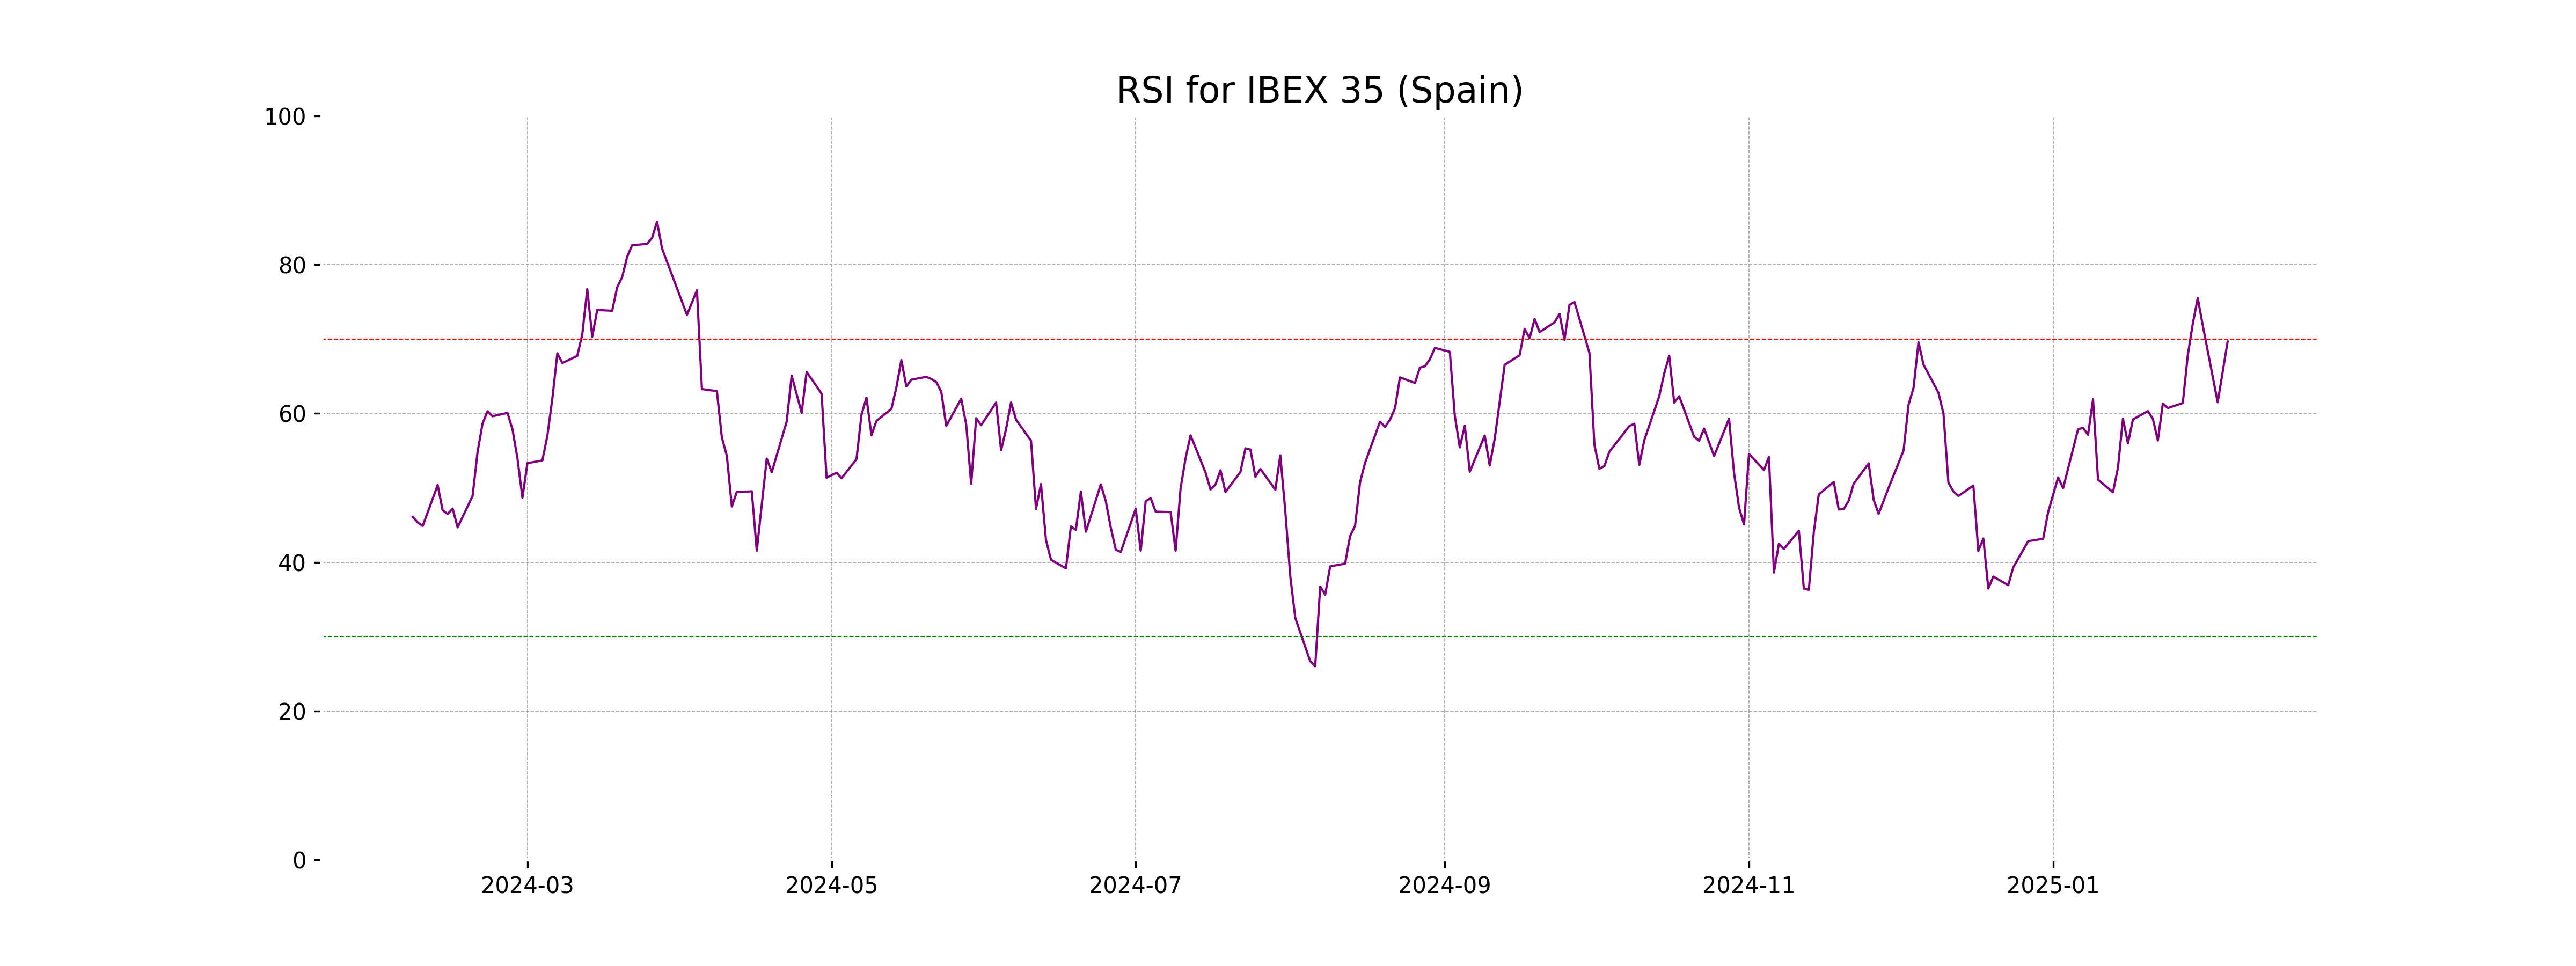
Analysis for IBEX 35 (Spain) - February 05, 2025

The IBEX 35 index opened at 12,421.5 and closed at 12,489.2, marking a gain of 2.32% with a points change of 283.4. The index showed strong momentum, indicated by its position above the 50-day and 200-day EMAs, and an RSI of 69.68 suggests it is nearing overbought territory.

Relationship with Key Moving Averages
The IBEX 35 is currently trading above its key moving averages, with a close of 12489.20 compared to the 50 EMA at 11881.53 and the 200 EMA at 11392.22, indicating a bullish trend. Its 10 EMA and 20 EMA are at 12214.19 and 12065.49, respectively, supporting the recent upward momentum.
Moving Averages Trend (MACD)
The IBEX 35 (Spain) current MACD of 167.93 indicates a strong upward momentum as it is well above the MACD Signal of 120.86. This suggests bullish conditions with potential for continued price increases given the rising trend in momentum.
RSI Analysis
The RSI for IBEX 35 is 69.68, indicating that the index is approaching overbought territory. This suggests potential caution for investors, as the index's price momentum might lead to a pullback or correction.
Analysis for NASDAQ Composite (US) - February 05, 2025

The NASDAQ Composite (US) opened at 19,422.20 and closed at 19,654.02, reflecting a positive change of 1.35% or 262.05 points from the previous close. The index has a relative strength index (RSI) of 51.32, indicating a neutral momentum, while the MACD value of 28.68 suggests a bullish trend compared to its signal line. Trading volume stood at 6.04 billion, with short-term moving averages above the 50-day EMA, supporting recent upward movements.

Relationship with Key Moving Averages
The NASDAQ Composite is currently trading above its 10 EMA (19,617.19) and 20 EMA (19,606.02), indicating a short-term bullish trend. However, it is significantly above the 200 EMA (18,100.08), suggesting a strong long-term upward momentum.
Moving Averages Trend (MACD)
The NASDAQ Composite shows a MACD of 28.68, which is below its MACD Signal of 43.62, suggesting a bearish trend. This indicates potential downward momentum, as the MACD line is below the signal line.

RSI Analysis
The RSI for the NASDAQ Composite is at 51.32, which indicates that the index is in the neutral zone. This suggests that the market might not be experiencing significant overbought or oversold conditions currently.

Analysis for Nikkei 225 (Japan) - February 05, 2025

The Nikkei 225 (Japan) closed at 38,831.48, marking a 0.81% increase from its previous close with a points change of 311.39. The RSI of 45.80 suggests neutral momentum, while the MACD indicates potential bearish pressure as it is below the signal line. Despite trading higher on the day, the index remains below its 50 and 10-day EMAs, indicating possible resistance ahead.

Relationship with Key Moving Averages
Nikkei 225 closed at 38,831.48, which is below the 50 EMA at 39,116.44 and the 10 EMA at 39,176.03, as well as the 20 EMA at 39,220.90, indicating a possible bearish trend. The index is, however, above the 200 EMA at 38,235.86, suggesting it is still in a long-term uptrend despite the short-term decline.
Moving Averages Trend (MACD)
The Nikkei 225 shows a bearish signal with a MACD of -20.58, which is below the MACD Signal of 40.27. This indicates that the recent downward trend might continue as the MACD line is moving away from the signal line.

RSI Analysis
The RSI for Nikkei 225 is at 45.80, indicating that the index is in a neutral range. This suggests neither overbought nor oversold conditions, potentially signaling a period of consolidation or a balanced demand-supply scenario.

Analysis for Nifty Bank - February 05, 2025

Nifty Bank opened at 50402.30 and closed at 50343.05, registering a 2.30% increase from the previous close of 49210.55, with a significant point change of 1132.5. The 50 EMA and 200 EMA values indicate a short-term trend moving above the long-term average, as the 10 EMA and 20 EMA reinforce this upward momentum. The relative strength index (RSI) at 55.89 suggests moderate strength, while the MACD values indicate cautious optimism in momentum.

Relationship with Key Moving Averages
Nifty Bank closed at 50,343.05, which is above its 50 EMA (50,233.83) and 200 EMA (50,216.69), indicating a positive short-term trend. The index's current level is also above the 10 and 20 EMAs, suggesting bullish momentum.
Moving Averages Trend (MACD)
Based on the stock data for Nifty Bank, the MACD value of -321.35 suggests bearish momentum, as it is below the MACD Signal line of -579.00. However, the MACD has moved closer to the signal line, indicating a potential easing of the bearish trend.

RSI Analysis
The RSI (Relative Strength Index) for Nifty Bank stands at 55.89, indicating a neutral position with neither overbought nor oversold conditions. This level suggests a balance between buying and selling pressures, potentially signaling stable trading activity.

Analysis for Nifty 50 - February 05, 2025

The Nifty 50 opened at 23801.75 and closed at 23696.30, marking a positive change of 1.44% with a points increase of 335.25 from its previous close. The 50-day and 200-day EMAs suggest a technical support level around 23668.67 and 23622.36 respectively, with RSI at 55.89 indicating a moderately strong position. The MACD value of -104.00, although negative, is moving closer to its signal line, suggesting a potential change in momentum.

Relationship with Key Moving Averages
The closing price of Nifty 50 at 23,696.30 is above its 50-day EMA of 23,668.67 and 200-day EMA of 23,622.36, suggesting a positive short to mid-term trend. However, the closing is below the 10-day EMA of 23,327.04, indicating potential short-term weakness.
Moving Averages Trend (MACD)
The MACD value for Nifty 50 is -104.00, while the MACD Signal is -188.12, indicating a bullish crossover as the MACD is above the signal line. This suggests potential upward momentum in the short term.

RSI Analysis
The RSI (Relative Strength Index) for Nifty 50 is 55.89, indicating a neutral momentum. Since it is not close to the overbought level (typically above 70) or the oversold level (typically below 30), the market might not have a strong bullish or bearish trend currently.

Up Next
Global stock market indices: How the world markets performed today - 5 February 2025

Step-by-step guide to apply for a mortgage loan online with minimal documentation

Honda Activa 6G: Everything You Need to Know Before Buying

How much does a ULIP plan really cost? A break-down of all charges

Centre plans to borrow Rs 8.20 lakh cr from market in first half of FY27

Reliance denies buying Iranian oil amid US sanctions waiver

More videos

Premium petrol price up Rs 2, industrial diesel up Rs 22; no change in normal petrol, diesel rates

India's GDP expected to register over 8 pc growth in Sep-Dec: Report

Govt announces seven measures to help boost exports

RBI keeps interest rates on hold after US trade deal boosts outlook

RBI proposes to compensate customers up to Rs 25,000 loss due to fraud

RBI raises GDP growth projection of Q1, Q2 of FY27

RBI pauses rate cuts, retains interest rate at 5.25 pc

Rupee jumps 122 paise to close at 90.27 against US dollar on India-US trade deal

Stock markets cheer India-US trade deal: Sensex, Nifty surge 2.5 pc

UPI transactions hit record high of Rs 230 lakh crore in 2025-26 till Dec: Govt