


Highlights
- Global indices show mixed performance with bullish signals
- US stocks trend upward, MACD indicates potential bullish reversal
- European markets experience modest gains, indicating stable momentum
Latest news

Haier Launches HQLED P7 Pro Series TVs With Google Gemini, 50W Audio And AI Picture Enhancements

Nothing's Latest Pokémon Teasers Hint At New Hardware, RCB Collaboration May Also Be In The Works

OnePlus N6 Set To Debut With Massive 8,000mAh Battery And Long-Term Performance Focus

Roblox Introduces Age-Based Accounts for Younger Users, Expands Parental Controls Globally

IIFL Capital Launches Algo Marketplace with Over 100 Ready-Made Strategies

LUMIQ Raises INR 50 Crore Pre-Series B to Become the AI Decision Layer for Financial Services

Tay Keith, producer behind Travis Scott's 'Sicko Mode' dies at 29

GenAI could lift realty sales velocity by up to 50%, speed up launches by 30%: Report
Global stock market indices: How the world markets performed today - 30 April 2025


The international stock market indices showed varied performances on April 30, 2025, reflecting the economic sentiment across different regions.
In this article, we analyze the performance of key global indices including the S&P 500, Dow Jones Industrial Average, NASDAQ Composite, FTSE 100, DAX, CAC 40, IBEX 35, Nikkei 225, Hang Seng, Nifty 50, and BSE Sensex.

Analysis for Sensex - April 30, 2025

The Sensex opened at 80,370.80, reached a high of 80,525.61, and closed slightly lower at 80,242.24 compared to the previous close of 80,288.38, marking a minimal change of -0.06%. Despite a slight decrease, the RSI remained strong at 65.64, indicating a bullish trend, and the MACD value of 1209.16 suggests potential further upward momentum. Although the volume data is unavailable, the stock's EMA values indicate a significant upward trend over various periods.

Relationship with Key Moving Averages
The Sensex closed at 80,242.24, which remains considerably above the 50-day EMA of 77,135.70 and the 200-day EMA of 77,250.05. This suggests a strong bullish trend as it is trading at higher levels compared to both critical moving averages.
Moving Averages Trend (MACD)
Sensex MACD Analysis The MACD value for Sensex is 1209.16, which is above the MACD Signal value of 880.01. This suggests a bullish momentum in the market as the MACD line is above the signal line, indicating potential upward movement.

RSI Analysis
The RSI (Relative Strength Index) for Sensex is 65.64, indicating that the index is in the neutral range, though approaching overbought territory. An RSI above 70 typically signals that an asset may be overbought, while an RSI below 30 indicates it might be oversold.

Analysis for Dow Jones Industrial Average (US) - April 30, 2025

The Dow Jones Industrial Average (US) opened at 40,233.98 and closed higher at 40,527.62, marking a positive points change of 300.03 or a percentage change of 0.75%. The trading day saw a high of 40,630.49 and a low of 40,222.18, with a trading volume of 434,830,000. The Relative Strength Index (RSI) is at 50.78, suggesting a neutral market position, while the MACD indicates a potentially bullish trend with a value of -422.94.

Relationship with Key Moving Averages
The Dow Jones Industrial Average opened at 40,233.98 and closed at 40,527.62, trading below its 50-day (41,170.10) and 200-day (41,620.17) exponential moving averages, suggesting a bearish trend. However, it closed above the 10-day (39,949.66) and 20-day (40,157.63) EMAs, potentially indicating a short-term bullish reversal.
Moving Averages Trend (MACD)
The Dow Jones Industrial Average (US) has a MACD of -422.94, which is higher than its MACD Signal of -630.22. This suggests a bullish momentum could be developing as the MACD line is climbing towards the signal line. Keep monitoring to see if it crosses the signal line for a possible buy signal.

RSI Analysis
RSI Analysis for Dow Jones Industrial Average (US): The RSI (Relative Strength Index) of the Dow Jones Industrial Average stands at 50.78, indicating a neutral market position. This suggests that the index is neither overbought nor oversold, warranting cautious monitoring for potential trends.

Analysis for CAC 40 (France) - April 30, 2025

CAC 40 (France) showed a positive performance with a closing point of 7598.26, reflecting a 0.56% increase from the previous close of 7555.87. The index reached a high of 7602.00 and a low of 7568.64 during the trading session. The RSI is at 52.49, suggesting a relatively neutral momentum, while the MACD indicates a bearish sentiment as it is below the signal line.

Relationship with Key Moving Averages
The CAC 40 index closed at 7598.26, which is below its 50-day EMA of 7642.80 and the 200-day EMA of 7648.81, indicating potential bearish sentiment in the short to long term. However, it is above the 10-day EMA (7481.03) and 20-day EMA (7498.17), suggesting some recent positive momentum.
Moving Averages Trend (MACD)
The CAC 40 (France) stock's MACD value of -63.12, which is above the MACD Signal of -125.73, suggests a potential bullish momentum building in the market. However, since both values are negative, it indicates the stock is currently in a bearish phase, and a close watch on subsequent trends is necessary for confirmation of any bullish reversal.

RSI Analysis
The Relative Strength Index (RSI) for the CAC 40 (France) is 52.49, indicating a neutral market condition, as it is neither overbought (above 70) nor oversold (below 30). This suggests a balanced momentum without a clear buying or selling pressure.

Analysis for FTSE 100 (UK) - April 30, 2025

FTSE 100 opened at 8463.46 and closed at 8475.54, marking a slight gain with a percentage change of 0.14%. The index experienced an intra-day high of 8486.47 and a low of 8454.90, showing a positive points change of 12.04. The Relative Strength Index (RSI) indicates mild strength at 55.79, while the Moving Average Convergence Divergence (MACD) remains negative.

Relationship with Key Moving Averages
The FTSE 100's closing price of 8475.54 is above its 50-day EMA (8418.59), indicating short-term bullish momentum. It also remains significantly above both the 10-day EMA (8369.09) and the 20-day EMA (8349.00), reinforcing the positive trend. However, it is slightly lower than the 200-day EMA (8335.81), pointing towards a need for further upward momentum to confirm long-term bullishness.
Moving Averages Trend (MACD)
MACD Analysis for FTSE 100 (UK): The MACD value of -8.58 suggests a bearish trend as it is below the signal line at -62.21, indicating a weak momentum in the current market conditions. This divergence may imply potential for a future reversal if momentum shifts.

RSI Analysis
The RSI for FTSE 100 is 55.79, indicating a neutral position as it falls neither in the overbought (above 70) nor oversold (below 30) range. This suggests that there is no strong momentum in either buying or selling activities for the FTSE 100 at the moment.

Analysis for DAX (Germany) - April 30, 2025

The DAX (Germany) opened at 22,520.49 and closed at 22,562.54, reflecting a positive change of approximately 0.61% from the previous close of 22,425.83. With a daily high of 22,607.32 and a low of 22,495.97, the performance shows a modest upward movement, as indicated by the Points Change of +136.71. The Relative Strength Index (RSI) of 59.70 suggests modest market strength, and the MACD indicator of 70.72 confirms positive momentum.

Relationship with Key Moving Averages
The DAX index is trading above its 50-day EMA at 22,562.54, indicating a short-term bullish momentum as it surpasses the 50-day moving average of 21,821.60. Furthermore, it remains significantly above the 200-day EMA of 20,489.06, reflecting longer-term strength. The index also trades above the 10-day EMA of 21,957.85 and the 20-day EMA of 21,801.31, confirming a positive short to intermediate-term trend.
Moving Averages Trend (MACD)
The MACD for DAX (Germany) is 70.72, while the MACD Signal is -155.08. A positive MACD compared to the MACD Signal indicates potential bullish momentum. However, the significant difference suggests volatility, warranting cautious optimism.

RSI Analysis
RSI Analysis for DAX (Germany): The RSI (Relative Strength Index) for DAX is 59.70, indicating a neutral stance, oscillating between the usual overbought threshold of 70 and the oversold mark of 30. This suggests neither strong upward nor downward momentum in its current state.

Analysis for S&P 500 (US) - April 30, 2025

The S&P 500 (US) opened at 5508.87 and closed higher at 5560.83, marking a gain with a 0.58% increase, which equates to a 32.08 points change. The day's trading saw a high of 5571.95 and a low of 5505.70, with a significant trading volume of 4,747,150,000. The RSI stands at 54.43, indicating moderate momentum, while the MACD at -32.37 suggests potential bearish momentum, though it is less negative than the MACD signal.
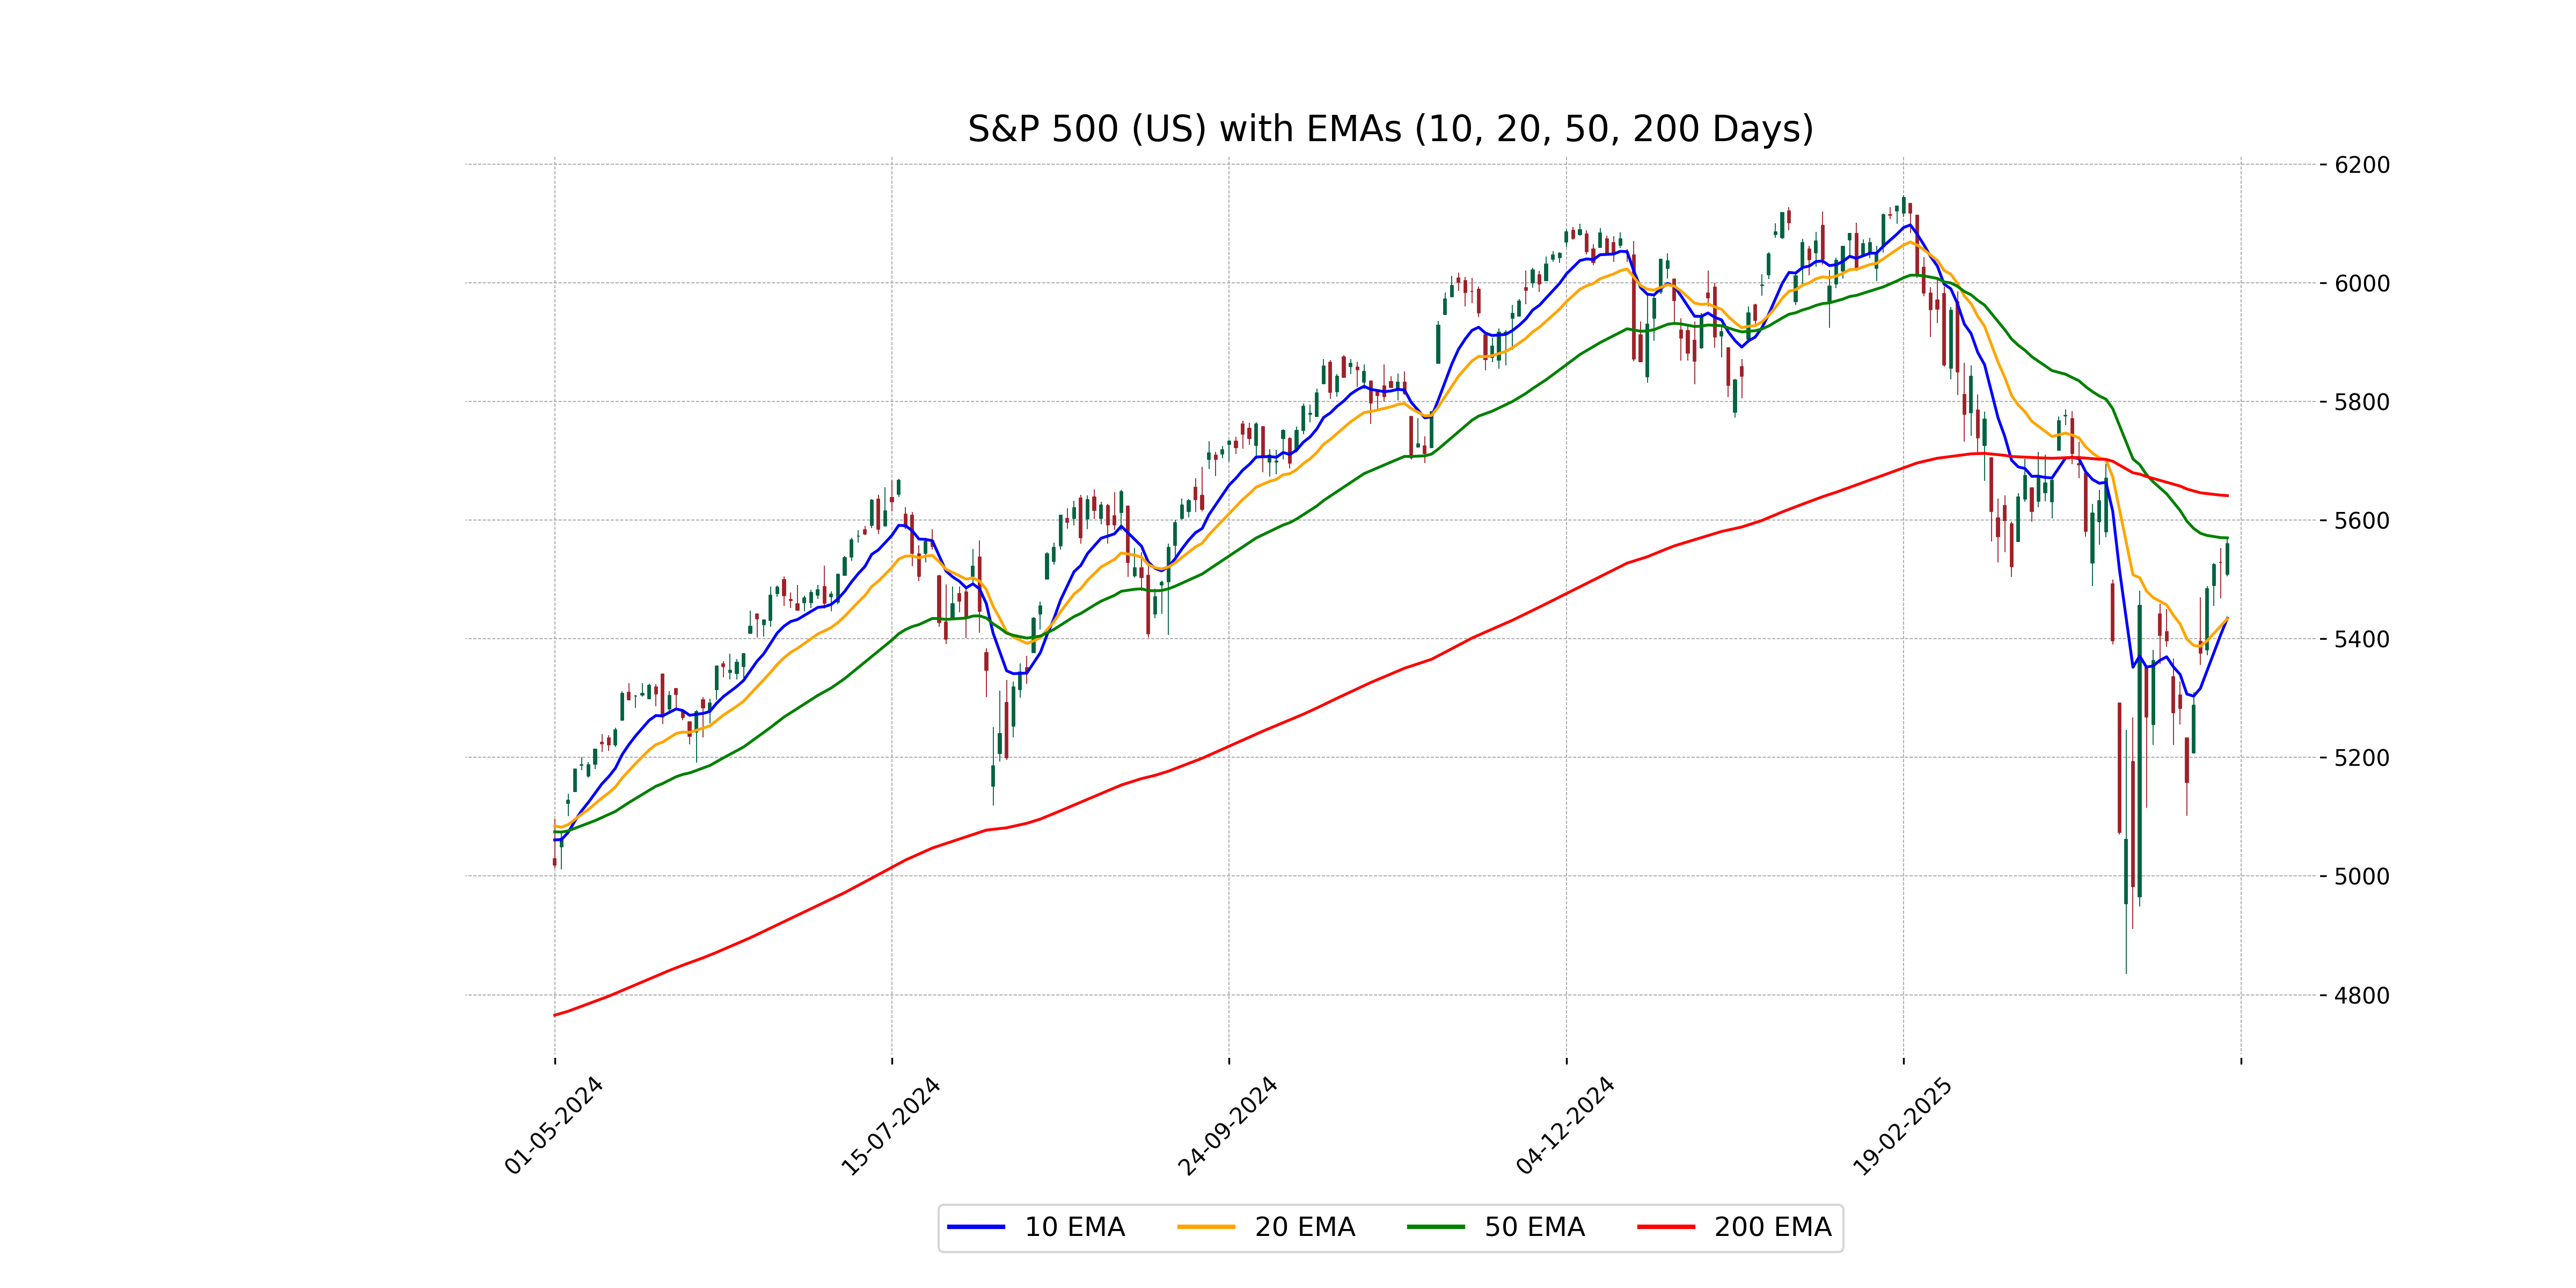
Relationship with Key Moving Averages
The S&P 500 closed below its 50-day EMA (5560.83 vs. 5570.30) and significantly below its 200-day EMA (5560.83 vs. 5641.50), indicating potential bearish momentum. However, it remains above its 10-day and 20-day EMAs, suggesting short-term support.
Moving Averages Trend (MACD)
The MACD for S&P 500 (US) is -32.368, while the MACD Signal is -80.649. Since the MACD is above the MACD Signal, this indicates a potential bullish crossover, suggesting a possible uptrend reversal. However, it's important to consider other indicators and perform further analysis for a comprehensive view.

RSI Analysis
The RSI for S&P 500 is 54.43, indicating a neutral stance as it is close to the midpoint of the RSI scale (0-100). This suggests that the stock is neither overbought nor oversold, and there is no significant momentum in either direction.

Analysis for Hang Seng Index (Hong Kong) - April 30, 2025

The Hang Seng Index (Hong Kong) opened at 22,038.73 and closed higher at 22,119.41, marking a gain of 0.51% from the previous close of 22,008.11. The index showed positive movement with a points change of 111.30, although the trading volume was notably low. Its 50-day EMA is slightly above its closing price at 22,102.22, indicating short-term price strength, while the MACD suggests a bearish trend in the broader context.

Relationship with Key Moving Averages
Hang Seng Index opened and closed above its 50-day EMA, suggesting a short-term bullish trend. The index also traded well above its 10-day and 20-day EMAs, indicating recent upward momentum. However, the MACD remains negative, which may signal a potential for a bearish shift or consolidation.
Moving Averages Trend (MACD)
The Hang Seng Index is showing a bullish signal indicated by the MACD analysis, where the MACD line at -207.63 is consistently above the MACD Signal line at -342.61. This suggests potential momentum for upward movement in the index price.

RSI Analysis
The RSI (Relative Strength Index) for Hang Seng Index (Hong Kong) is 50.74, which indicates a neutral position. This suggests that the market is neither overbought nor oversold, implying stability in investor sentiment at the current level.

Analysis for IBEX 35 (Spain) - April 30, 2025

The IBEX 35 index opened at 13,376.30, reached a high of 13,378.90, and closed at 13,180.20, representing a 1.40% decrease with a points change of -186.70. The volume of shares traded was 55,892,040. The current 50-day and 200-day EMA values are 12,892.18 and 12,112.02, respectively, with an RSI of 54.36 indicating a neutral position.

Relationship with Key Moving Averages
The current close of IBEX 35 at 13180.20 is above the 20-day EMA (13018.49) and 10-day EMA (13130.66), suggesting short-term bullish momentum. However, it remains far above the 50-day EMA (12892.18) and 200-day EMA (12112.02), indicating a generally upward longer-term trend.
Moving Averages Trend (MACD)
The MACD for IBEX 35 in Spain is 99.75, with a MACD Signal of 17.15, indicating a bullish momentum as the MACD line is above the signal line. This suggests potential upward movement, but investors should monitor other indicators and market conditions for confirmation.

RSI Analysis
For the IBEX 35, the RSI value of 54.36 suggests that the index is in a neutral zone. This indicates that the market is neither overbought nor oversold at the moment, reflecting a balanced trading environment without any extreme conditions.

Analysis for NASDAQ Composite (US) - April 30, 2025

The NASDAQ Composite (US) opened at 17,270.76 and closed at 17,461.32, with a 0.55% daily gain reflected by a 95.19 point increase from the previous close. The index's RSI is 54.79, indicating a neutral stance, while the MACD shows a slight bearish trend at -110.59, below the signal line of -308.66. Despite this, the index remains above both the 10 EMA and 20 EMA, yet below the 50 EMA and 200 EMA.

Relationship with Key Moving Averages
The NASDAQ Composite opened at 17,270.76, and its closing price of 17,461.32 is slightly below the 50 EMA of 17,508.11, indicating a recent downward trend relative to its 50-day average. It remains significantly lower than the 200 EMA of 17,945.47, suggesting a potential bearish momentum over a longer timeframe compared to the 10 EMA of 16,962.16 and the 20 EMA of 16,939.45.
Moving Averages Trend (MACD)
The NASDAQ Composite shows a MACD of -110.59, indicating a bearish sentiment as it is below the MACD Signal line of -308.66. This suggests a potential downward momentum in the market.

RSI Analysis
The RSI of the NASDAQ Composite is currently at 54.79, suggesting it is in a neutral zone. This indicates that there is no particular overbought or oversold condition at the moment, pointing to a balanced momentum.

Analysis for Nikkei 225 (Japan) - April 30, 2025

Nikkei 225 (Japan) opened at 35,946.88 and closed at 36,045.38, marking a percentage change of 0.57% with a points increase of 205.39 from the previous close of 35,839.99. The index reached a high of 36,056.52 and a low of 35,793.33 during the trading session. The RSI indicates a moderately strong market position with a value of 55.46.

Relationship with Key Moving Averages
The Nikkei 225's closing price of 36,045.38 is above its 50-day EMA of 36,008.40, indicating a short-term bullish trend. However, it remains below the 200-day EMA of 37,421.59, suggesting a possible longer-term bearish outlook. The close is also above both the 10-day EMA (35,116.17) and 20-day EMA (35,050.42), reinforcing the short-term positive momentum.
Moving Averages Trend (MACD)
The MACD value for the Nikkei 225 index is -175.03, while the MACD Signal is -549.56. Since the MACD is above the Signal line, this indicates potential upward momentum. However, since both values are negative, this also suggests that the index still exhibits some bearish characteristics.

RSI Analysis
Nikkei 225 RSI Analysis: The Relative Strength Index (RSI) for Nikkei 225 is 55.46, indicating that the index is in the neutral zone. This suggests neither overbought nor oversold conditions, potentially signaling continued stability in the market without significant directional bias.

Analysis for Nifty Bank - April 30, 2025

Nifty Bank opened at 55,382.40 and closed at 55,087.15, registering a decline of approximately 0.55% with a points change of -304.10. The 50-day EMA stands at 51,737.06, while the RSI is at 67.00, indicating strong performance momentum.

Relationship with Key Moving Averages
The Nifty Bank closed at 55087.15, which is above its 50-day EMA of 51737.06 and 200-day EMA of 50545.77, indicating a potential bullish trend. However, it's slightly above its 10-day EMA of 54568.99 and significantly above its 20-day EMA of 53426.37, suggesting some short-term strength.
Moving Averages Trend (MACD)
The MACD analysis for Nifty Bank indicates a positive trend, as the MACD line (1414.12) is above the signal line (1257.36). This suggests bullish momentum, but investors should monitor other technical indicators to confirm the trend.

RSI Analysis
Based on the data provided, the Relative Strength Index (RSI) for Nifty Bank is 67.00. This suggests that the Nifty Bank index is nearing the overbought territory, as it is close to the typical threshold of 70. Investors might see this as a potential signal that the index could experience a short-term pullback or consolidation.

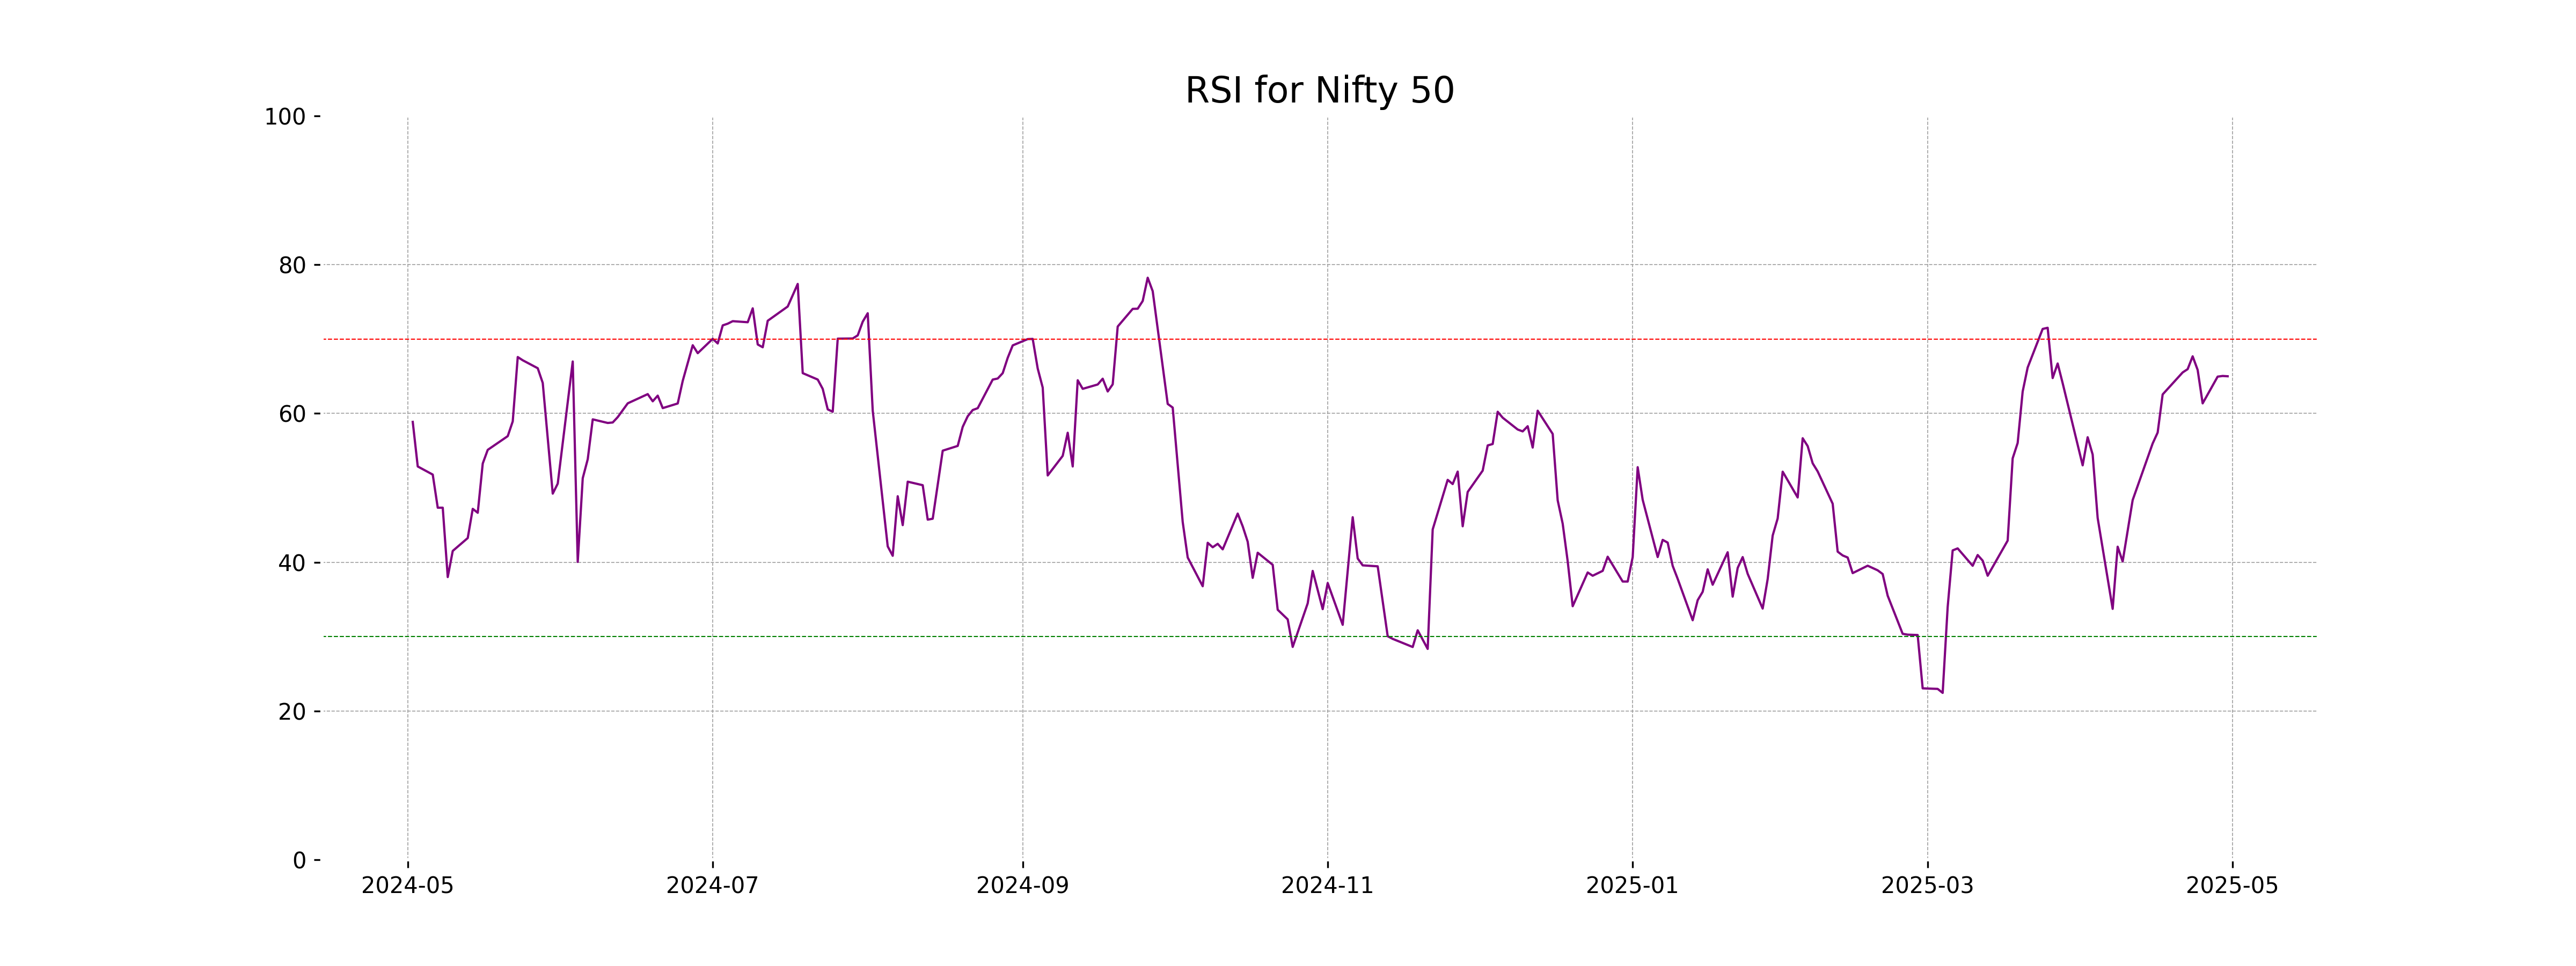
Analysis for Nifty 50 - April 30, 2025

Nifty 50 opened at 24,342.05, with a high of 24,396.15 and a low of 24,198.75, closing slightly down at 24,334.20 from the previous close of 24,335.95. The percentage change is minimal at -0.0072%, equivalent to a points change of -1.75. The index has a notably high RSI at 65, indicating potential overbought conditions, and its MACD is positive at 364.50, above the MACD Signal of 273.01, suggesting bullish momentum.

Relationship with Key Moving Averages
The Nifty 50 index closed at 24334.20, slightly below the 50 EMA of 23404.03 and 200 EMA of 23438.90, indicating a trend above both long-term averages. It is also trading above the 10 EMA of 24044.50 and the 20 EMA of 23723.71, suggesting a short-term upward momentum as confirmed by its RSI of 64.99 and positive MACD of 364.50.
Moving Averages Trend (MACD)
The MACD for Nifty 50 is 364.50 with a signal line at 273.01, indicating a bullish trend as the MACD line is above the signal line. This suggests potential upward momentum in the short to medium term. Additionally, the RSI at 65 suggests that the index is nearing overbought territory.

RSI Analysis
Nifty 50 RSI Analysis: The RSI for Nifty 50 is 64.998, which suggests a relatively strong momentum, approaching overbought levels but still within the neutral range. Investors might watch for potential overbought signals if the RSI continues to rise above 70, which could indicate a price reversal in the near future.
Up Next

Global stock market indices: How the world markets performed today - 30 April 2025

Honda Activa 6G: Everything You Need to Know Before Buying

How much does a ULIP plan really cost? A break-down of all charges

Centre plans to borrow Rs 8.20 lakh cr from market in first half of FY27

Reliance denies buying Iranian oil amid US sanctions waiver

Premium petrol price up Rs 2, industrial diesel up Rs 22; no change in normal petrol, diesel rates

More videos

India's GDP expected to register over 8 pc growth in Sep-Dec: Report

Govt announces seven measures to help boost exports

RBI keeps interest rates on hold after US trade deal boosts outlook

RBI proposes to compensate customers up to Rs 25,000 loss due to fraud

RBI raises GDP growth projection of Q1, Q2 of FY27

RBI pauses rate cuts, retains interest rate at 5.25 pc

Rupee jumps 122 paise to close at 90.27 against US dollar on India-US trade deal

Stock markets cheer India-US trade deal: Sensex, Nifty surge 2.5 pc

UPI transactions hit record high of Rs 230 lakh crore in 2025-26 till Dec: Govt

Explained: India-US trade deal, tariffs and trade benefits