


Global stock market performance on April 29, 2025, with analysis of key indices like Dow Jones and S&P 500. Key trends in moving averages, RSI, and MACD provide insights into economic sentiment and market movements.
Highlights
- Bullish momentum observed with rising moving averages
- Dow Jones shows bearish signals with MACD divergence
- RSI nearing overbought, indicating potential slowdown
Latest news
Haier Launches HQLED P7 Pro Series TVs With Google Gemini, 50W Audio And AI Picture Enhancements
Nothing's Latest Pokémon Teasers Hint At New Hardware, RCB Collaboration May Also Be In The Works
OnePlus N6 Set To Debut With Massive 8,000mAh Battery And Long-Term Performance Focus
Roblox Introduces Age-Based Accounts for Younger Users, Expands Parental Controls Globally
IIFL Capital Launches Algo Marketplace with Over 100 Ready-Made Strategies
LUMIQ Raises INR 50 Crore Pre-Series B to Become the AI Decision Layer for Financial Services
Tay Keith, producer behind Travis Scott's 'Sicko Mode' dies at 29
GenAI could lift realty sales velocity by up to 50%, speed up launches by 30%: Report
Global stock market indices: How the world markets performed today - 29 April 2025


The international stock market indices showed varied performances on April 29, 2025, reflecting the economic sentiment across different regions.
In this article, we analyze the performance of key global indices including the S&P 500, Dow Jones Industrial Average, NASDAQ Composite, FTSE 100, DAX, CAC 40, IBEX 35, Nikkei 225, Hang Seng, Nifty 50, and BSE Sensex.

Analysis for Sensex - April 29, 2025

The Sensex opened at 80,396.92 and closed slightly higher at 80,288.38, with a daily change of 70.02 points or 0.087%. The index experienced fluctuations between a high of 80,661.31 and a low of 80,122.02. The 10-day EMA is higher than the 50-day and 200-day EMAs, indicating short-term strength, while the RSI of 65.99 suggests the market is nearing overbought conditions.

Relationship with Key Moving Averages
The open and close prices of Sensex are above its 50 EMA and 200 EMA, indicating a potential medium to long-term uptrend. Additionally, the index is also trading above its 10 EMA and 20 EMA, suggesting short-term bullish momentum. The positive MACD value reinforces the bullish sentiment.
Moving Averages Trend (MACD)
MACD Analysis for Sensex: The MACD value of 1175.36 is above the MACD Signal of 797.72, suggesting a bullish momentum. This crossover indicates potential upward movement in the short term.

RSI Analysis
The RSI for Sensex is currently 65.99, suggesting that it is approaching overbought conditions as RSI values above 70 typically indicate this. While not yet in overbought territory, the current RSI suggests a cautionary approach, as continued upward movement could lead to potential price corrections.

Analysis for Dow Jones Industrial Average (US) - April 29, 2025

The Dow Jones Industrial Average (US) opened at 40,171 and closed at 40,227, showing a slight percentage increase of 0.28% with a points change of 114 from the previous closing value of 40,113. The index had a daily trading range between 39,869 and 40,414. Notably, its Relative Strength Index (RSI) is at 48.79, and the MACD is showing a divergence of -515, indicating a potential bearish trend in the short term.

Relationship with Key Moving Averages
The Dow Jones Industrial Average closed at 40,227.59 which is below both its 50-day (41,196.33) and 200-day (41,631.06) exponential moving averages, indicating a short-term bearish trend. However, it is above the 10-day (39,821.22) and 20-day (40,118.69) EMAs, suggesting possible near-term recovery momentum.
Moving Averages Trend (MACD)
### MACD Analysis for Dow Jones Industrial Average (US) The MACD value is -515.04, which is above the MACD Signal value of -682.04, suggesting a potential bullish crossover. This may indicate a diminishing bearish momentum and a possible upward trend reversal.

RSI Analysis
Based on the provided data, the Relative Strength Index (RSI) for the Dow Jones Industrial Average is approximately 48.79. This value is close to the midpoint of the scale, suggesting that the index is neither overbought nor oversold and is currently in a neutral zone.

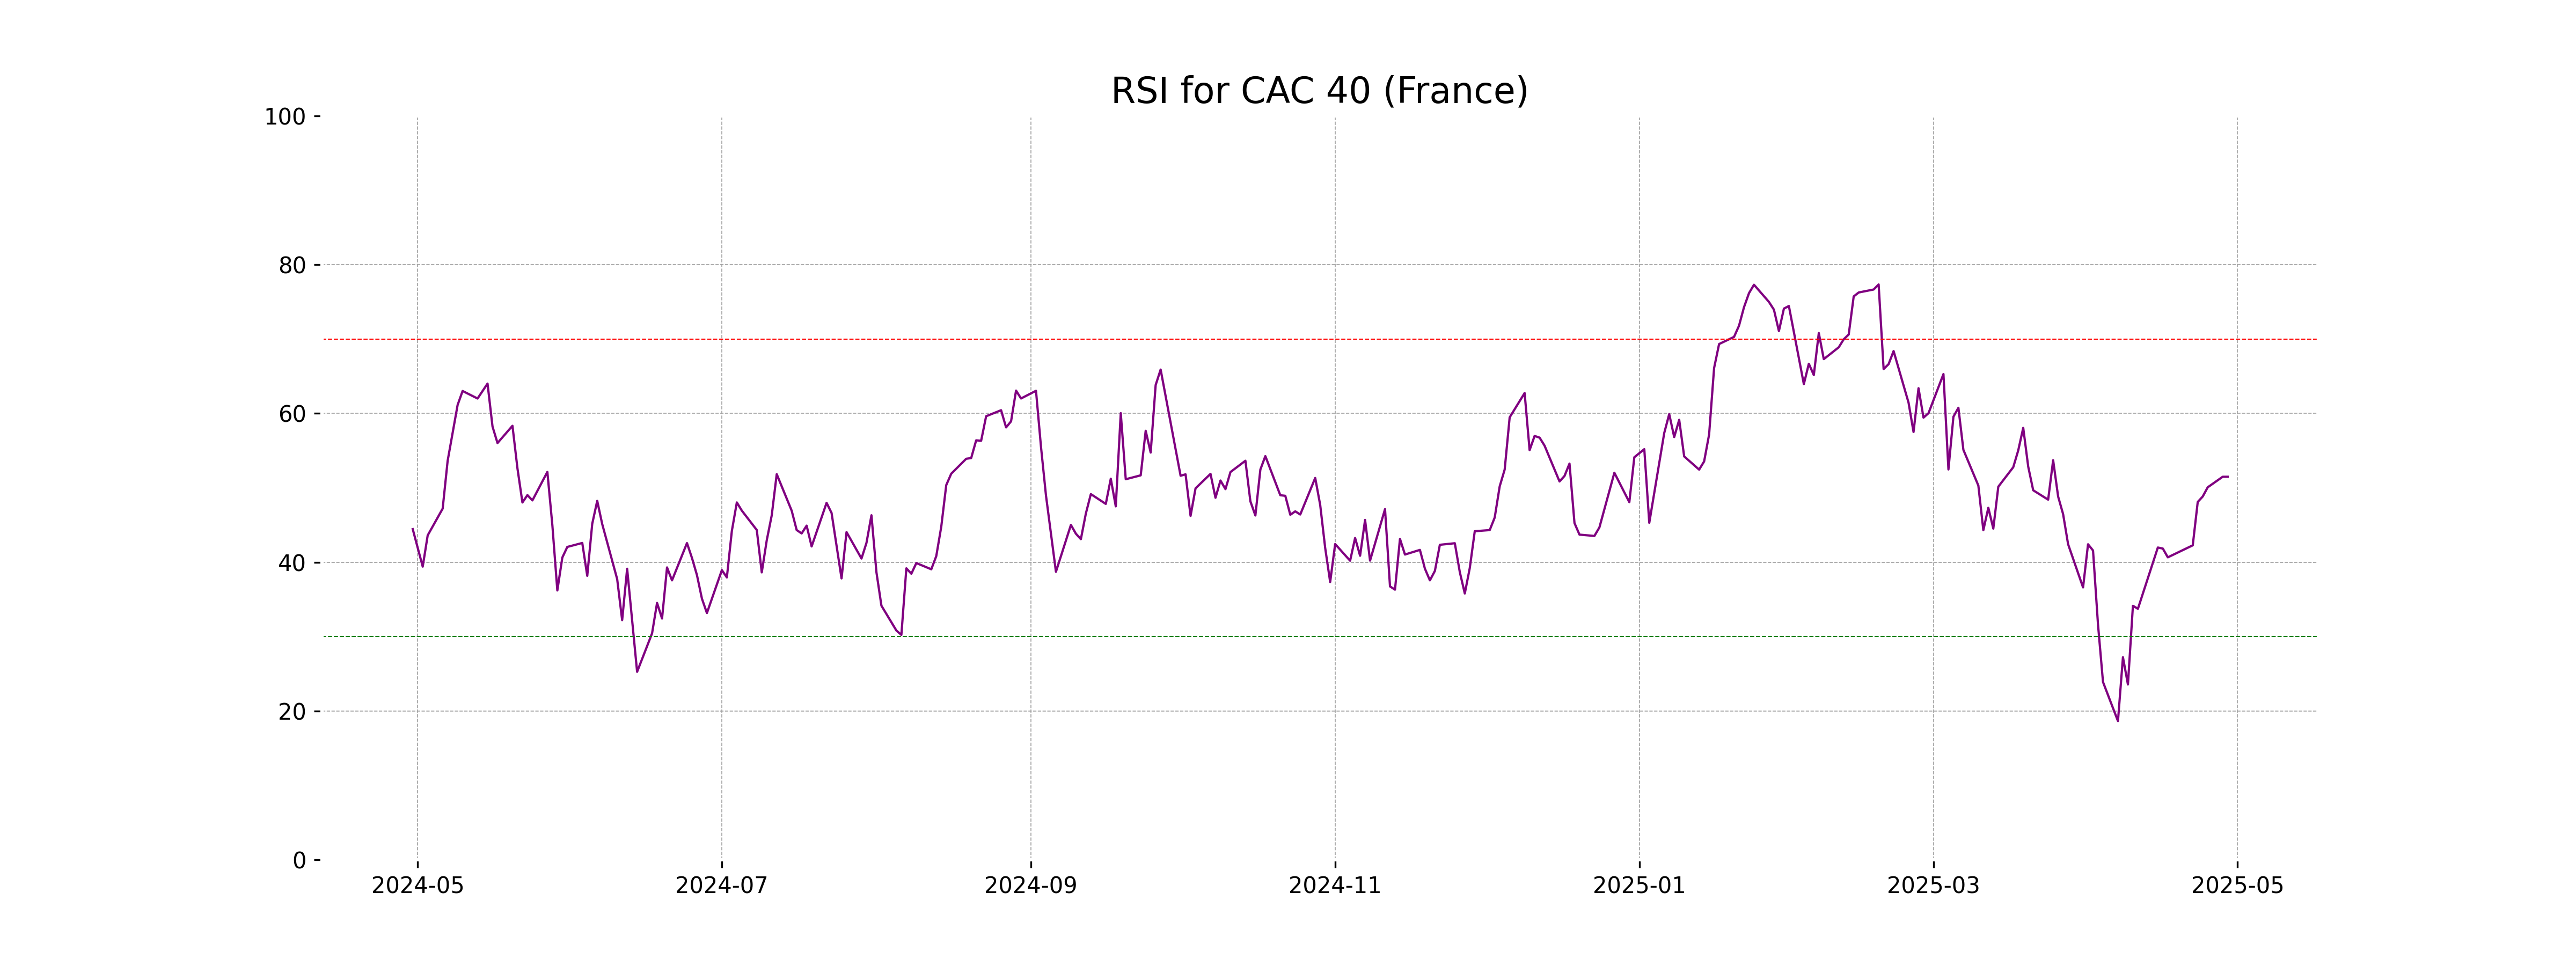
Analysis for CAC 40 (France) - April 29, 2025

CAC 40 (France) displayed a marginal gain with a closing price of 7573.84, up by 0.001% from the previous close. The index demonstrated a narrow trading range with highs of 7588.43 and lows of 7560.61, reflecting a stable market sentiment. The RSI stands at 51.49, indicating a balanced momentum, while the negative MACD suggests underlying bearish pressure.

Relationship with Key Moving Averages
The CAC 40 index's closing price of 7573.84 is currently below both the 50-day EMA of 7645.33 and the 200-day EMA of 7649.49, indicating a potential bearish trend. However, it is above the 10-day EMA of 7458.25 and the 20-day EMA of 7489.35, suggesting short-term strength.
Moving Averages Trend (MACD)
MACD Analysis for CAC 40 (France): The MACD value of -79.46, which is above the MACD Signal value of -141.10, suggests a potential bullish reversal trend in the CAC 40 index. This indicates that the recent price momentum could lead to a potential upward movement if the trend continues.

RSI Analysis
The CAC 40's RSI is 51.49, which indicates that the index is in a neutral zone. This suggests there is no strong momentum in either buying or selling, providing a balanced outlook for the short term.
Analysis for FTSE 100 (UK) - April 29, 2025

FTSE 100 (UK) opened at 8417.34 and closed at 8439.16, marking a positive change of 0.26% with a points change of 21.86. The Relative Strength Index (RSI) stands at 54.22, indicating a neutral momentum, while the MACD suggests a bearish trend as it is below its signal line.

Relationship with Key Moving Averages
The FTSE 100 opened above its 50-day EMA of 8415.31 and closed at 8439.16, indicating short-term bullish momentum as it remains above both the 50 and 200-day EMAs. However, it is important to note that the MACD remains below the signal line, which could indicate potential bearish signals.
Moving Averages Trend (MACD)
The MACD for FTSE 100 currently stands at -23.41, which is above the MACD Signal of -76.01. This suggests a potential bullish crossover, indicating a possible shift in momentum. However, since both values are negative, it may suggest the recent momentum is still bearish overall.

RSI Analysis
Based on the stock data for FTSE 100, the RSI (Relative Strength Index) is 54.22, indicating a neutral momentum, as it's positioned between the typical thresholds of 30 (oversold) and 70 (overbought). This suggests a balanced state without strong upward or downward momentum swings in the market.

Analysis for DAX (Germany) - April 29, 2025

The DAX (Germany) closed at 22,451.37, showing a positive change of 0.81% with a points increase of 179.70 from its previous close of 22,271.67. The RSI indicates a moderately strong momentum at 58.57, while the MACD suggests a bullish trend as the MACD line is above the signal line.

Relationship with Key Moving Averages
The DAX (Germany) is trading above its 50-day EMA (21792.36) and 20-day EMA (21723.61), indicating a short-term bullish trend. The current price is also above the 10-day EMA (21828.12), suggesting ongoing upward momentum.
Moving Averages Trend (MACD)
The MACD value for DAX (Germany) is 9.64, which is above the MACD Signal of -211.12, indicating a bullish trend as the MACD line is crossing above the Signal line. This suggests potential upward momentum in the market.

RSI Analysis
The RSI (Relative Strength Index) for DAX (Germany) is 58.57, suggesting a relatively neutral position close to the 50-mark. This indicates that the stock is neither overbought nor oversold, implying a balanced momentum in the market currently.

Analysis for S&P 500 (US) - April 29, 2025

The S&P 500 (US) opened at 5529.22 and closed slightly lower at 5528.75, marking a marginal percentage change of 0.06% with a points change of 3.54. The index exhibited a trading range with a high of 5553.66 and a low of 5468.64, while the Relative Strength Index (RSI) stood at 53.16, indicating a neutral market sentiment.

Relationship with Key Moving Averages
S&P 500 closed slightly below its 50-EMA of 5570.68 and 200-EMA of 5642.29, indicating short and long-term trends might still be bearish. However, it is trading above its 10-EMA of 5406.67 and 20-EMA of 5420.49, suggesting some recent positive momentum.
Moving Averages Trend (MACD)
The S&P 500's MACD value of -48.65, which is above its MACD Signal of -92.72, suggests a potential bullish crossover. This indicates a possible shift towards upward momentum, but the MACD value remains negative, reflecting underlying bearishness.

RSI Analysis
The current RSI for the S&P 500 is 53.16, indicating that the index is neither in the overbought nor oversold territory and suggesting relative stability in market momentum. As the RSI is around the midline (50), it points to a balanced condition where recent price changes have been moderate.

Analysis for Hang Seng Index (Hong Kong) - April 29, 2025

The Hang Seng Index (Hong Kong) opened at 22,073.36 and closed at 22,008.11, with a slight positive change of 0.16%, indicating a points increase of 36.15. The index showed volatility with a high of 22,213.51 and a low of 21,918.10. Despite a weak MACD of -252.39, the RSI was neutral at 49.36, suggesting no strong momentum in either direction.

Relationship with Key Moving Averages
Hang Seng Index's closing price of 22,008.11 is slightly below its 50 EMA of 22,101.52, indicating a potential bearish short-term sentiment. However, it remains above its 10 EMA of 21,787.46 and 20 EMA of 21,936.85, which may suggest some underlying bullish momentum.
Moving Averages Trend (MACD)
The MACD for Hang Seng Index indicates a bearish trend as the MACD value (-252.39) is above the MACD Signal line (-376.36). A negative MACD value suggests downward momentum, but the crossover above the signal line might indicate potential weakening of the current downtrend.

RSI Analysis
The RSI (Relative Strength Index) for the Hang Seng Index is 49.36, which suggests that the index is in a neutral zone, not indicating an overbought or oversold condition. Generally, an RSI above 70 is considered overbought, while below 30 is oversold.

Analysis for IBEX 35 (Spain) - April 29, 2025

The IBEX 35 (Spain) opened at 13,470.30 and closed slightly lower at 13,361.60, indicating a decrease of 0.70% or a points change of -94.5. The RSI stood at 58.93, suggesting moderate strength in the market. Meanwhile, the MACD was positive at 98.51, with a signal line at -3.58.

Relationship with Key Moving Averages
The IBEX 35 closed at 13,361.60, which is above its 50-day EMA of 12,880.22, indicating a short-term uptrend, and significantly above its 200-day EMA of 12,101.19, suggesting a long-term bullish trend. Its current close is near its 10-day EMA of 13,118.68 and 20-day EMA of 13,000.97, reflecting consolidation in the recent trend.
Moving Averages Trend (MACD)
IBEX 35 (Spain) MACD Analysis: The MACD value of 98.51, which is above the MACD Signal value of -3.58, suggests a bullish momentum. However, investors should consider other indicators for confirmation.

RSI Analysis
The current RSI for IBEX 35 (Spain) is 58.93, which indicates that the index is in a neutral zone. It is trending away from being overbought (>70) or oversold (<30), suggesting relatively stable momentum without extreme buying or selling pressure.

Analysis for NASDAQ Composite (US) - April 29, 2025

NASDAQ Composite (US) Performance: The NASDAQ Composite opened at 17,390.93 and closed at 17,366.13, showing a slight decrease of 0.10% or 16.81 points from the previous close. The index experienced a high of 17,467.35 and a low of 17,128.71, with a trading volume of approximately 10.31 billion. The Relative Strength Index (RSI) is at 53.83, indicating neutral momentum, while the MACD is -174.10, which is above its signal line, suggesting a potential bullish trend ahead.

Relationship with Key Moving Averages
The NASDAQ Composite closed at 17366.13, which is below its 50-day EMA of 17510.02 and 200-day EMA of 17950.29, indicating potential short-term and long-term bearish sentiment. However, it is above its 10-day EMA of 16851.23 and 20-day EMA of 16884.51, suggesting possible immediate-term strength.
Moving Averages Trend (MACD)
MACD Analysis for NASDAQ Composite (US): The MACD of -174.10, with a MACD Signal of -358.17, suggests a potential upward momentum. The MACD line is above the MACD Signal line, which may indicate a bullish reversal.

RSI Analysis
NASDAQ Composite (US) RSI Analysis: The Relative Strength Index (RSI) for NASDAQ Composite is 53.83, indicating a neutral market condition. An RSI value between 30 and 70 generally suggests that the market is neither overbought nor oversold.

Analysis for Nikkei 225 (Japan) - April 29, 2025

Nikkei 225 (Japan) Performance: The Nikkei 225 opened at 35,962.80 and closed higher at 35,839.99, showing a positive change of 0.38% with a points increase of 134.25 compared to the previous close. The trading volume was 132.4 million, and the RSI value sits at 54.27, indicating a balanced market momentum. The MACD is negative at -291.44, still above the MACD Signal, suggesting the potential for some growth.

Relationship with Key Moving Averages
The Nikkei 225 opened above its 50-day EMA, indicating some bullish sentiment, but closed slightly below it, suggesting resistance around that level. The index is still significantly below the 200-day EMA, highlighting a longer-term downtrend. The current RSI indicates a neutral position.
Moving Averages Trend (MACD)
The MACD for Nikkei 225 shows a value of -291.44, indicating a bearish trend as it remains below the MACD signal line of -643.19. The negative MACD suggests the index may be experiencing downward momentum.

RSI Analysis
The RSI (Relative Strength Index) for Nikkei 225 is 54.27, which indicates a neutral market condition. Typically, an RSI above 70 suggests overbought conditions, while below 30 indicates oversold conditions. Therefore, with an RSI of 54.27, the index is not currently in overbought or oversold territory.

Analysis for Nifty Bank - April 29, 2025

The Nifty Bank index opened at 55,524.35 and closed at 55,391.25, experiencing a slight decrease of 0.07%, equivalent to a drop of 41.55 points from the previous close. The index's RSI stands at 69.98, indicating it is near overbought conditions, while the MACD shows a positive trend with a value of 1449.04, above its signal line.

Relationship with Key Moving Averages
Nifty Bank closed at 55,391.25, which is positioned above the 10 EMA of 54,453.84, indicating short-term bullish momentum. It also stands significantly above the 50 EMA of 51,600.32 and the 200 EMA of 50,499.91, suggesting a sustained longer-term upward trend.
Moving Averages Trend (MACD)
The MACD for Nifty Bank shows a positive value of 1449.04 with a MACD Signal of 1218.17, indicating a bullish trend momentum. The MACD line being above the Signal line suggests potential upward momentum.

RSI Analysis
The Relative Strength Index (RSI) for Nifty Bank is at 69.98, suggesting the stock is close to being overbought. Typically, an RSI above 70 indicates that the asset may be overvalued and subject to a price pullback or trend reversal.

Analysis for Nifty 50 - April 29, 2025

The Nifty 50 index opened at 24,370.70 and closed at 24,335.95, showing a slight percentage change of 0.03% with a points change of 7.45. Technical indicators suggest an RSI of 65.04, indicating a moderately strong momentum, while the MACD of 356.20, significantly above the signal line, hints at a potential positive trend.

Relationship with Key Moving Averages
The Nifty 50 closed slightly higher at 24,335.95, marginally above the previous close. It is trading well above its 50-day EMA (23,366.07) and the 200-day EMA (23,429.82), indicating a bullish momentum. The index is also above the 10-day EMA (23,980.13) and the 20-day EMA (23,659.45), suggesting a strong short-term upward trend.
Moving Averages Trend (MACD)
The MACD value of 356.20 is greater than the MACD Signal line at 250.14, indicating a bullish sentiment for Nifty 50. This suggests there may be positive momentum in the market, and potential upward movement could be anticipated.

RSI Analysis
The Nifty 50 has an RSI of 65.04, indicating that the index is approaching overbought levels, as RSI values above 70 typically suggest overbought conditions. This could imply a potential slowdown in the upward momentum or the possibility of a price correction.

Up Next

Global stock market indices: How the world markets performed today - 29 April 2025

Honda Activa 6G: Everything You Need to Know Before Buying

How much does a ULIP plan really cost? A break-down of all charges

Centre plans to borrow Rs 8.20 lakh cr from market in first half of FY27

Reliance denies buying Iranian oil amid US sanctions waiver

Premium petrol price up Rs 2, industrial diesel up Rs 22; no change in normal petrol, diesel rates

More videos

India's GDP expected to register over 8 pc growth in Sep-Dec: Report

Govt announces seven measures to help boost exports

RBI keeps interest rates on hold after US trade deal boosts outlook

RBI proposes to compensate customers up to Rs 25,000 loss due to fraud

RBI raises GDP growth projection of Q1, Q2 of FY27

RBI pauses rate cuts, retains interest rate at 5.25 pc

Rupee jumps 122 paise to close at 90.27 against US dollar on India-US trade deal

Stock markets cheer India-US trade deal: Sensex, Nifty surge 2.5 pc

UPI transactions hit record high of Rs 230 lakh crore in 2025-26 till Dec: Govt

Explained: India-US trade deal, tariffs and trade benefits
Editorji Technologies Pvt. Ltd. © 2022 All Rights Reserved.