


Highlights
- Global indices reflected varied sentiment across regions
- U.S. markets gained with strong closing momentum
- European and Asian indices showed mixed trends
Latest news

Samsung Galaxy Z Fold 8, Fold 8 Ultra & Z Flip 8: A More Mature Foldable Family

Dell Launches New Alienware 16X Aurora, 16 Area-51 and 18 Area-51 Gaming Laptops in India

Samsung Takes on Premium Home Audio With New Music Studio Series

The End of OxygenOS: OnePlus Confirms Shift to Oppo's ColorOS

Fujifilm Instax Mini Evo Cinema Review: A Hybrid Camera That Prints Memories Differently

iQOO Teases Z11 Lite With AI Tools, Military-Grade Durability and a 6500mAh Battery

Editorji Launches Hook Global, Its International Digital News Brand

Samsung's Bespoke AI ACs Focus on Humidity, Hygiene and Smarter Cooling
Global stock market indices: How the world markets performed today - 25 April 2025


The international stock market indices showed varied performances on April 25, 2025, reflecting the economic sentiment across different regions.
In this article, we analyze the performance of key global indices including the S&P 500, Dow Jones Industrial Average, NASDAQ Composite, FTSE 100, DAX, CAC 40, IBEX 35, Nikkei 225, Hang Seng, Nifty 50, and BSE Sensex.

Analysis for Sensex - April 25, 2025

The Sensex opened at 79,830.15 and closed at 79,212.53, experiencing a decline of 588.90 points or approximately -0.74% compared to the previous close of 79,801.43. Although there's no trading volume available, technical indicators like the RSI and MACD suggest the index is in a slightly positive momentum, with an RSI of 61.91 indicating a moderately strong trend.

Relationship with Key Moving Averages
The Sensex closed at 79,212.53, which is above its 50-day EMA of 76,738.58 and its 200-day EMA of 77,157.87, indicating a bullish trend over these longer-term averages. However, the close is below the 10-day EMA of 78,380.98, suggesting a potential short-term negative momentum.
Moving Averages Trend (MACD)
MACD Analysis for Sensex: The MACD value of 1018.53, which is higher than the MACD Signal value of 601.53, suggests a bullish trend. This indicates that the Sensex might experience upward momentum in the short term.

RSI Analysis
Based on the stock data, the Relative Strength Index (RSI) for Sensex is 61.91. This value suggests that the stock is in a neutral to slightly overbought condition, as it is approaching the common overbought threshold of 70. It indicates moderate upward momentum, which could warrant monitoring for potential overextended buying pressure.

Analysis for Dow Jones Industrial Average (US) - April 25, 2025

Dow Jones Industrial Average (US) opened at 39,531.05 and closed at 40,093.40 with a high of 40,157.91 and a low of 39,371.87, reflecting a 1.23% increase and a points change of 486.83. The 10-day EMA is 39,645.90, while the 20-day EMA is 40,106.56, indicating short-term trends, and the RSI stands at 47.92. The MACD line is at -675.77, with a MACD signal of -756.10, suggesting bearish momentum.

Relationship with Key Moving Averages
The Dow Jones Industrial Average opened below the 10-day EMA but closed above the 20-day EMA, indicating a recent upward movement in the short-term trend. However, it remains below both the 50-day and 200-day EMAs, suggesting potential longer-term bearishness.
Moving Averages Trend (MACD)
The Dow Jones Industrial Average exhibits a negative MACD value of -675.77, indicating a bearish trend. The MACD is above its signal line at -756.10, suggesting potential for a positive crossover if the trend reverses. Monitoring this indicator can help anticipate future momentum changes.

RSI Analysis
The RSI for the Dow Jones Industrial Average is 47.92, which suggests a neutral momentum. It is neither overbought nor oversold, indicating a balanced trading environment without significant buying or selling pressure.

Analysis for CAC 40 (France) - April 25, 2025

CAC 40 (France) opened at 7565.35 and closed at 7557.77, with a low of 7526.63 and a high of 7574.25. The index experienced a positive change with a 0.73% increase, gaining 54.99 points from the previous close of 7502.78. The RSI is at 50.84, indicating a neutral momentum, while the MACD shows a slightly bearish trend.

Relationship with Key Moving Averages
CAC 40 (France) closed at 7557.77, slightly below its 50-day EMA of 7652.13 and 200-day EMA of 7651.21, indicating a bearish trend relative to these moving averages. However, it is above its 10-day EMA of 7405.09 and 20-day EMA of 7472.68, suggesting short-term bullish momentum.
Moving Averages Trend (MACD)
The MACD for CAC 40 (France) is -118.70, with a signal line at -170.77. This situation suggests that while the MACD is negative, the indicator is moving closer towards crossing above the signal line, which could be a sign of a potential bullish momentum if the upward trend continues.

RSI Analysis
Based on the stock data, the relative strength index (RSI) for the CAC 40 (France) is 50.84. This value suggests a neutral momentum, indicating that the index is neither overbought nor oversold at the current level.

Analysis for FTSE 100 (UK) - April 25, 2025

FTSE 100 (UK) opened at 8407.44 and closed slightly higher at 8412.89, marking a 0.065% increase with a points change of 5.49. With an RSI of 53.06, the market shows neutral momentum, and the MACD indicates a potential upward trend as it is less negative than the MACD Signal.

Relationship with Key Moving Averages
The FTSE 100 closed at 8412.89, slightly below the 50-day EMA of 8414.12, indicating mild resistance at this level. However, it remains above the 20-day EMA of 8311.99 and the 10-day EMA of 8296.97. The index is significantly above the 200-day EMA of 8332.21, showing that the longer-term trend is still upwards.
Moving Averages Trend (MACD)
FTSE 100 (UK) MACD Analysis: The MACD value of -50.35, compared to its Signal line of -102.39, indicates that the MACD is above the Signal line, suggesting potential upward momentum. However, both are in negative territory, which reflects an overall bearish trend for the time being.

RSI Analysis
FTSE 100 (UK) RSI Analysis: The RSI value of 53.06 suggests that the FTSE 100 is currently in the neutral zone, indicating a balanced market without strong bullish or bearish sentiments. It is neither overbought nor oversold, pointing to a potential period of consolidation or the possibility of a new trend forming.

Analysis for DAX (Germany) - April 25, 2025

DAX (Germany) Performance Summary: The DAX index opened at 22,210.51, reached a high of 22,318.36, and closed at 22,248.88, showing a positive change of 0.84% compared to the previous close of 22,064.51. The current Relative Strength Index (RSI) is 56.54, indicating a moderate market momentum, while the MACD is -127.28, suggesting a potentially bearish trend.

Relationship with Key Moving Averages
The current close of DAX at 22,248.88 is above the 10-day EMA of 21,561.44, the 20-day EMA of 21,581.87, and the 50-day EMA of 21,745.05, indicating a short-term upward trend. However, it remains well above the 200-day EMA of 20,430.03, suggesting a longer-term positive trend.
Moving Averages Trend (MACD)
MACD Analysis for DAX (Germany): The MACD value of -127.28 is above the MACD Signal of -318.00, indicating potential bullish momentum. The negative values suggest it is still in overall bearish territory, but the crossover implies a possible upward trend reversal.

RSI Analysis
The RSI (Relative Strength Index) for DAX (Germany) is 56.54, indicating a neutral position slightly towards the bullish side. This suggests that the market is neither overbought nor oversold, allowing room for potential upward movement but with caution against immediate aggressive buying.

Analysis for S&P 500 (US) - April 25, 2025

The S&P 500 (US) opened at 5381.38 and closed at 5484.77, marking a 2.03% increase from its previous close of 5375.86, with a points change of 108.91. The trading volume was approximately 4.7 billion, while the RSI stood at 51.55, indicating a neutral momentum. The MACD at -85.60 compared to the MACD Signal at -113.31 suggests a potential for upward momentum in the short term.

Relationship with Key Moving Averages
The S&P 500 (US) closed at 5484.77, which is below the 50-day EMA of 5574.32 and the 200-day EMA of 5644.59, indicating a potentially bearish stance in the medium to long term. However, it remains above the 10-day EMA of 5347.17 and the 20-day EMA of 5396.87, suggesting short-term upward momentum.
Moving Averages Trend (MACD)
MACD Analysis for S&P 500 (US): The MACD for the S&P 500 is -85.60, while the MACD Signal line is -113.31. The MACD is above the Signal line, indicating a potential bullish trend or momentum change, suggesting possible upward movement.

RSI Analysis
The RSI (Relative Strength Index) for the S&P 500 is currently at 51.55, suggesting a neutral position. This indicates that the stock is neither overbought nor oversold, hinting at possible price stability in the short term.

Analysis for Hang Seng Index (Hong Kong) - April 25, 2025

The Hang Seng Index opened at 22,080.44 and closed slightly lower at 21,980.74, marking a 0.32% increase from the previous close of 21,909.76. The index's RSI is near the neutral mark at 49.02, while the MACD remains negative, indicating potential bearish momentum. The volume traded was zero, suggesting no trading activity on the measured day.

Relationship with Key Moving Averages
The Hang Seng Index opened above its 50-day EMA (22110.77) but closed below it at 21980.74, indicating short-term weakness. It is also trading above its 10-day EMA (21686.53), showing a potential short-term upward momentum, and is close to its 20-day EMA (21924.87), suggesting a neutral to slight bullish trend in the short term.
Moving Averages Trend (MACD)
Hang Seng Index (Hong Kong) MACD Analysis: The MACD for Hang Seng Index is -340.33, indicating a bearish sentiment as it's below the MACD Signal of -435.56. This suggests the momentum is currently in a downward trend, although the MACD is approaching the signal line, which could potentially lead to a bullish crossover if the trend reverses.

RSI Analysis
The RSI for Hang Seng Index (Hong Kong) stands at 49.02, indicating a neutral momentum. This suggests that the index is neither overbought nor oversold, implying a balanced demand and supply situation in the market.

Analysis for IBEX 35 (Spain) - April 25, 2025

IBEX 35 (Spain) opened at 13284.60 and closed higher at 13329.60, marking a 1.14% increase with a points change of 149.90 from the previous close. The index showed strong momentum with an RSI of 59.31 and a MACD well above its signal line, indicating upward trend potential.

Relationship with Key Moving Averages
The current close of IBEX 35 at 13,329.60 is above all its key moving averages, with the 50-day EMA at 12,835.26, the 200-day EMA at 12,074.42, the 10-day EMA at 12,973.05, and the 20-day EMA at 12,908.65. This suggests a bullish trend, as the index is trading higher than its short and long-term moving averages.
Moving Averages Trend (MACD)
The MACD value for IBEX 35 is 37.75, while the MACD Signal line is at -56.15. Since the MACD is above the signal line, it suggests a bullish trend in the market. The positive divergence between MACD and its signal line indicates strong potential for upward momentum.

RSI Analysis
Based on the stock data provided, the current RSI (Relative Strength Index) for IBEX 35 (Spain) is 59.32. This indicates a neutral zone, suggesting that the index is neither overbought nor oversold, and the market may not show a strong trend in either direction at the moment.

Analysis for NASDAQ Composite (US) - April 25, 2025

The NASDAQ Composite closed at 17,166.04, showing a positive performance with a 2.74% increase and a rise of 457.99 points from the previous close of 16,708.05. The trading volume was 7.61 billion, and the RSI is at 52.01, indicating a neutral momentum with a slight bullish inclination. The MACD is at -328.97, with the MACD Signal at -444.50, suggesting a potential bullish crossover.

Relationship with Key Moving Averages
The NASDAQ Composite closed at 17166.04, which is below its 50-day EMA of 17521.32 and its 200-day EMA of 17961.81, but above its 10-day EMA of 16593.22. This suggests short-term bullish momentum with the close above the 10-day EMA, but potential longer-term bearish signals since it is below the 50-day and 200-day EMAs.
Moving Averages Trend (MACD)
The MACD for NASDAQ Composite is -328.97, which is above the MACD Signal line at -444.50, suggesting a potential bullish trend. This crossover may indicate that momentum is shifting towards the upside.

RSI Analysis
The RSI for NASDAQ Composite is 52.01, indicating a neutral market sentiment. With values typically ranging between 30 (oversold) and 70 (overbought), an RSI around 50 suggests that the index is neither overbought nor oversold at the moment.

Analysis for Nikkei 225 (Japan) - April 25, 2025

The Nikkei 225 (Japan) experienced a positive trading session, closing at 35,705.7383, which represents a 1.90% gain and a points change of 666.59 from the previous close of 35,039.1484. The current movement is above the 10 EMA and 20 EMA, but still below the 50 EMA and 200 EMA, suggesting a short-term upward momentum. The RSI stands at 53.51, indicating a moderate strength in the trend, while the MACD analysis shows a bearish crossover with the MACD below the signal line.

Relationship with Key Moving Averages
Nikkei 225 closed at 35705.74, below the 50-day EMA of 36013.70 and the 200-day EMA of 37451.13, indicating a bearish short-term trend relative to these key moving averages. However, it's above the 10-day EMA of 34702.94 and the 20-day EMA of 34851.55, suggesting some recent positive momentum.
Moving Averages Trend (MACD)
The MACD for Nikkei 225 is at -414.87, with a MACD Signal of -731.13, indicating a potential bullish crossover. This suggests that while the index is currently trending downward, momentum may begin to shift if the MACD surpasses the Signal line.

RSI Analysis
The RSI for Nikkei 225 is 53.51, suggesting a neutral position in the market with neither overbought nor oversold conditions. This level indicates a balanced momentum, where neither buyers nor sellers are dominating.

Analysis for Nifty Bank - April 25, 2025

Nifty Bank opened at 55,233.55 and closed at 54,664.05, showing a decrease of approximately 0.97% or 537.35 points from the previous close of 55,201.40. The index faced a high of 55,350.55 and a low of 54,176.45 during the period, with no volume traded. The RSI is at 67.18, indicating strong momentum, while the MACD is above its signal line, suggesting potential bullishness.

Relationship with Key Moving Averages
Nifty Bank is trading above its 50 EMA (51,282.84) and 200 EMA (50,400.24), indicating a bullish trend over the medium to long term. However, it is trading near its 10 EMA (53,981.69), suggesting short-term fluctuations or potential consolidation.
Moving Averages Trend (MACD)
The MACD for Nifty Bank is 1406.84, with a MACD Signal of 1090.18. Since the MACD is above the Signal line, it indicates bullish momentum. However, the recent negative percentage change in the stock suggests caution should be exercised.

RSI Analysis
Nifty Bank RSI Analysis: The current RSI for Nifty Bank is 67.18, indicating that the stock is close to being overbought, as RSI values above 70 suggest overbought conditions. It suggests that investors should monitor the stock closely for potential sell signals or signs of a trend reversal.

Analysis for Nifty 50 - April 25, 2025

The Nifty 50 index closed at 24039.35, experiencing a decline of -0.86% or -207.35 points from the previous close of 24246.70. The index's trading range for the day was between a high of 24365.45 and a low of 23847.85. Key indicators such as the 50 EMA and 200 EMA are at 23285.58 and 23411.42, respectively, demonstrating a level above these averages, while the RSI stands at 61.35, suggesting moderate strength.

Relationship with Key Moving Averages
Nifty 50 closed below its 50 EMA (23285.58) and 20 EMA (23510.32) but above the 200 EMA (23411.42) and 10 EMA (23806.07). This suggests a short-term bearish trend with slight support from the broader moving averages.
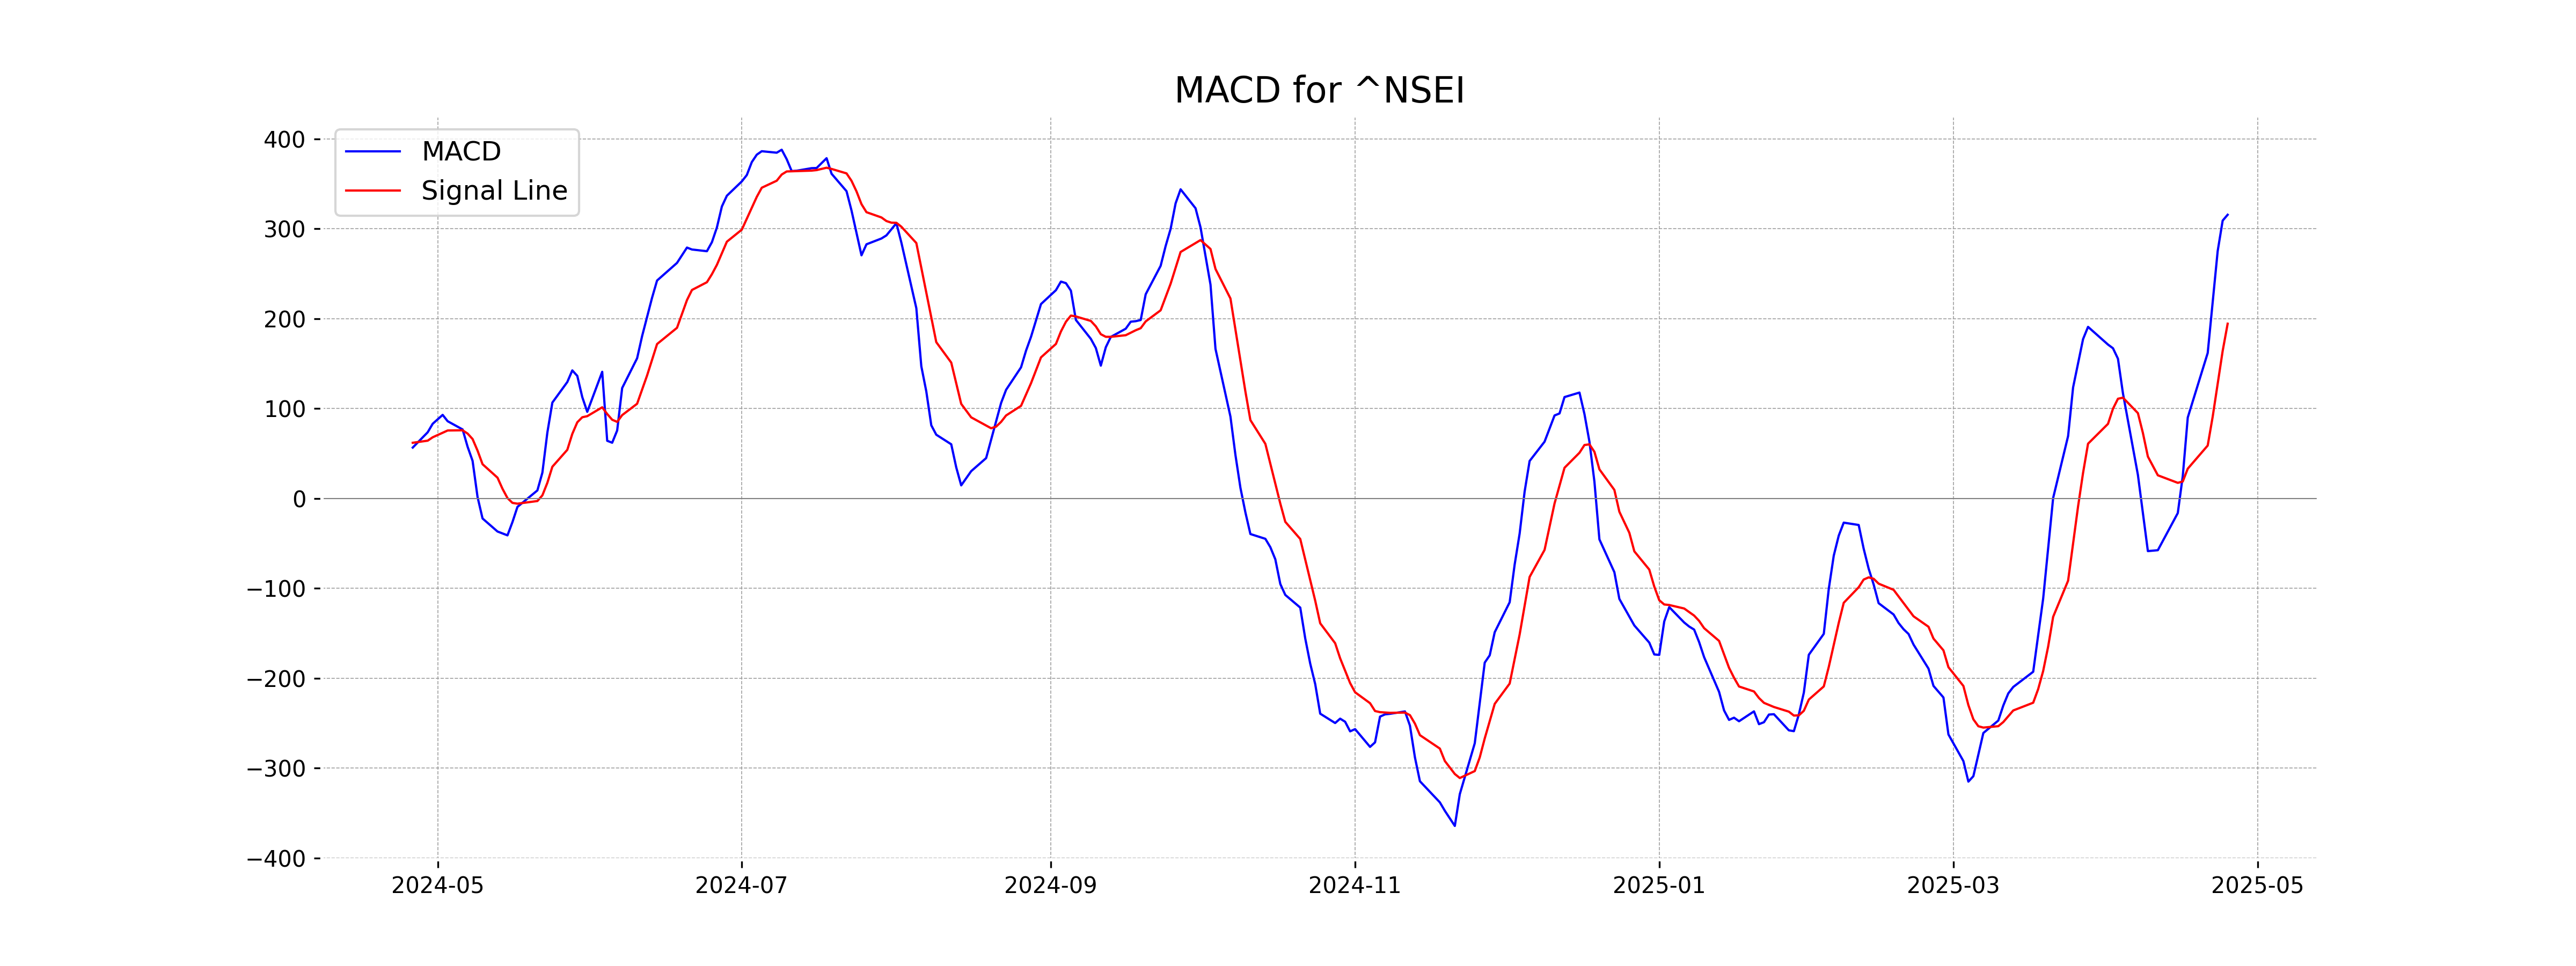
Moving Averages Trend (MACD)
The MACD for Nifty 50 is currently at 315.69 with a signal line of 194.47, indicating a bullish trend as the MACD line is above the signal line. This suggests positive momentum, and investors might view this as a potential buy signal if other indicators align.
RSI Analysis
RSI Analysis for Nifty 50: The Relative Strength Index (RSI) for Nifty 50 is currently at 61.35, which indicates a moderately strong momentum. Values between 50 and 70 suggest that the index is neither overbought nor oversold and is in a relatively stable trading position.

Up Next

Global stock market indices: How the world markets performed today - 25 April 2025

Step-by-step guide to apply for a mortgage loan online with minimal documentation

Honda Activa 6G: Everything You Need to Know Before Buying

How much does a ULIP plan really cost? A break-down of all charges

Centre plans to borrow Rs 8.20 lakh cr from market in first half of FY27

Reliance denies buying Iranian oil amid US sanctions waiver

More videos

Premium petrol price up Rs 2, industrial diesel up Rs 22; no change in normal petrol, diesel rates

India's GDP expected to register over 8 pc growth in Sep-Dec: Report

Govt announces seven measures to help boost exports

RBI keeps interest rates on hold after US trade deal boosts outlook

RBI proposes to compensate customers up to Rs 25,000 loss due to fraud

RBI raises GDP growth projection of Q1, Q2 of FY27

RBI pauses rate cuts, retains interest rate at 5.25 pc

Rupee jumps 122 paise to close at 90.27 against US dollar on India-US trade deal

Stock markets cheer India-US trade deal: Sensex, Nifty surge 2.5 pc

UPI transactions hit record high of Rs 230 lakh crore in 2025-26 till Dec: Govt