


Highlights
- Dow Jones gains 2.66% despite bearish signals
- CAC 40 rises 2.16%, momentum still weak
- FTSE 100 climbs 1.30%, signals trend shift
Latest news

Haier Launches HQLED P7 Pro Series TVs With Google Gemini, 50W Audio And AI Picture Enhancements

Nothing's Latest Pokémon Teasers Hint At New Hardware, RCB Collaboration May Also Be In The Works

OnePlus N6 Set To Debut With Massive 8,000mAh Battery And Long-Term Performance Focus

Roblox Introduces Age-Based Accounts for Younger Users, Expands Parental Controls Globally

IIFL Capital Launches Algo Marketplace with Over 100 Ready-Made Strategies

LUMIQ Raises INR 50 Crore Pre-Series B to Become the AI Decision Layer for Financial Services

Tay Keith, producer behind Travis Scott's 'Sicko Mode' dies at 29

GenAI could lift realty sales velocity by up to 50%, speed up launches by 30%: Report
Global stock market indices: How the world markets performed today - 23 April 2025


The international stock market indices showed varied performances on April 23, 2025, reflecting the economic sentiment across different regions.
In this article, we analyze the performance of key global indices including the S&P 500, Dow Jones Industrial Average, NASDAQ Composite, FTSE 100, DAX, CAC 40, IBEX 35, Nikkei 225, Hang Seng, Nifty 50, and BSE Sensex.

Analysis for Sensex - April 23, 2025

The BSESN had an opening value of 80,142.09 and closed at 80,116.49, reflecting a percentage change of 0.65% with a gain of 520.90 points compared to the previous close at 79,595.59. The index showed significant strength with an RSI of 68.09, indicating a bullish momentum, while the high MACD value of 876.57 further supports this upward trend. It reached a high of 80,254.54 and a low of 79,506.90 during the day.

Relationship with Key Moving Averages
The Sensex shows a strong upward momentum as the current close of 80,116.49 is above all its key moving averages: 50 EMA at 76,508.47, 200 EMA at 77,109.90, 10 EMA at 77,839.47, and 20 EMA at 76,951.52. This indicates a bullish trend, with the RSI at 68.09 suggesting that it is nearing overbought territory.
Moving Averages Trend (MACD)
The MACD for Sensex is at 876.57, with a MACD Signal of 374.40, indicating a bullish crossover as the MACD is significantly higher than the signal line. This suggests strong positive momentum in the market.

RSI Analysis
The RSI for Sensex is currently at 68.09, which suggests that the index is approaching overbought levels, as RSI values above 70 typically indicate overbought conditions. This could imply potential resistance or a pullback soon if not already in an overbought range. However, it's not at a critical level yet, and trends should be confirmed with other indicators.

Analysis for Dow Jones Industrial Average (US) - April 23, 2025

The Dow Jones Industrial Average (US) showed a strong performance with a closing value of 39,186.98, reflecting a substantial rise of approximately 2.66% or an increase of 1,016.57 points from the previous close. Despite the positive movement, the Relative Strength Index (RSI) of 42.38 suggests a neutral stance, while the MACD value indicates a bearish signal with a negative divergence from the MACD Signal.

Relationship with Key Moving Averages
The Dow Jones Industrial Average closed at 39186.98, which is below both its 50-day EMA of 41400.53 and 200-day EMA of 41696.80, indicating a bearish trend over both medium and long-term periods. It is, however, slightly below its 10-day EMA of 39533.10, reflecting recent gains over very short-term momentum.
Moving Averages Trend (MACD)
The Dow Jones Industrial Average (US) currently has a MACD of -823.99 and a MACD Signal of -778.34, indicating bearish momentum as the MACD line is below the signal line. This suggests that the index might be experiencing downward pressure, and traders may be cautious given the negative MACD value.

RSI Analysis
The Relative Strength Index (RSI) for the Dow Jones Industrial Average currently stands at 42.38, which suggests that the index is in the neutral zone, not indicating strong overbought or oversold conditions. An RSI below 30 typically indicates an oversold condition, while above 70 suggests overbought conditions.

Analysis for CAC 40 (France) - April 23, 2025

The CAC 40 (France) index opened at 7403.93, reached a high of 7506.36, and closed at 7484.67, reflecting a 2.16% increase with a points change of 158.20 from the previous close of 7326.47. The 10-day EMA at 7342.34 suggests a short-term upward momentum, although the MACD of -166.95 indicates ongoing bearish pressure. With no trading volume data available, the index is below its 50-day and 200-day EMAs, signaling potential resistance ahead.

Relationship with Key Moving Averages
The CAC 40 index is currently trading below its 50-day EMA (7662.32) and 200-day EMA (7653.65), indicating a potential bearish trend in the short to medium term. However, it is above its 10-day EMA (7342.34) and 20-day EMA (7459.84), which might suggest short-term bullish momentum.
Moving Averages Trend (MACD)
The current MACD for CAC 40 is -166.95, which is above its MACD Signal of -193.87, indicating a potential bullish momentum. However, the MACD line is still in negative territory, suggesting that further confirmation is needed for a sustained upward move.

RSI Analysis
CAC 40 RSI Analysis: The RSI for CAC 40 is 48.18, indicating a neutral position as it hovers around the midpoint. This suggests neither significant overbought nor oversold conditions, signaling potential stability in the market.

Analysis for FTSE 100 (UK) - April 23, 2025

FTSE 100 (UK) opened at 8328.60 and closed at 8436.97, showing a positive change of 1.30% with a gain of 108.37 points. The Relative Strength Index (RSI) is 53.83, indicating somewhat neutral momentum, while the MACD suggests a negative trend, as it is below the signal line. The 50-day EMA is above the 200-day EMA, hinting at a long-term upward price movement.

Relationship with Key Moving Averages
FTSE 100 opened at 8328.60 and closed at 8436.97, indicating a positive change in price. The close price is above the 10-day EMA of 8247.08, 20-day EMA of 8293.42, 50-day EMA of 8415.77, and significantly above the 200-day EMA of 8330.95, suggesting a bullish momentum in the short to medium term.
Moving Averages Trend (MACD)
FTSE 100's MACD is -83.63 compared to the MACD Signal of -127.01, indicating a potential upward momentum as the MACD line is moving closer towards the signal line. The negative MACD values suggest that the market has been bearish, but the convergence could imply a shift towards a bullish trend.

RSI Analysis
The RSI for FTSE 100 is 53.83, suggesting a neutral trend as it is near the midpoint of 50. This implies that the index is neither overbought nor oversold, indicating a balanced momentum.

Analysis for DAX (Germany) - April 23, 2025

DAX (Germany) opened at 21801.66, reaching a high of 21976.95 and a low of 21722.84, before closing at 21842.39. The index experienced a notable gain of 548.86 points, which represents a 2.58% increase compared to its previous close of 21293.53. The 50-day EMA is at 21705.91, with the RSI at 52.75, indicating moderate momentum.

Relationship with Key Moving Averages
The DAX index closed at 21842.39, above its 50-day EMA of 21705.91 and significantly above its 200-day EMA of 20393.79, indicating a stronger immediate trend. It is also above the 10-day EMA of 21241.20 and 20-day EMA of 21442.07, suggesting short-term bullish momentum.
Moving Averages Trend (MACD)
The MACD for DAX (Germany) is currently at -304.59, with the MACD Signal at -406.37. This indicates a bearish trend, as the MACD line is above the signal line but both are negative, suggesting downward momentum might be weakening.

RSI Analysis
RSI Analysis for DAX (Germany): The Relative Strength Index (RSI) for the DAX is currently at 52.75, which is in the neutral range. This suggests that the index is neither overbought nor oversold. Traders often consider an RSI over 70 as overbought and below 30 as oversold.

Analysis for S&P 500 (US) - April 23, 2025

The S&P 500 (US) opened at 5207.67 and closed higher at 5287.76, indicating a positive day with a 2.51% increase and a points change of 129.56. Despite this gain, the index is below its 50, 200, 10, and 20-day EMAs, suggesting a potential downward trend. The RSI is at 43.85, indicating the stock is nearing the lower bound of the neutral range.

Relationship with Key Moving Averages
The closing price of the S&P 500 is 5287.76, which is below both the 50-day EMA (5586.22) and the 200-day EMA (5648.89), indicating a bearish trend. However, it is slightly below the 10-day EMA (5303.42), suggesting short-term movement may still be uncertain.
Moving Averages Trend (MACD)
S&P 500 (US) MACD Analysis: The MACD value of -119.27, which is above its signal line of -123.81, indicates a potential bullish crossover. However, with the RSI at 43.85, the index is still in the lower neutral zone, suggesting that recent momentum may not yet have turned positive.

RSI Analysis
The relative strength index (RSI) for S&P 500 is 43.85, which suggests that the index is neither in overbought (typically above 70) nor oversold (typically below 30) territory. This indicates that the current momentum is relatively neutral, but slightly leaning towards a potential buying opportunity if it trends lower.

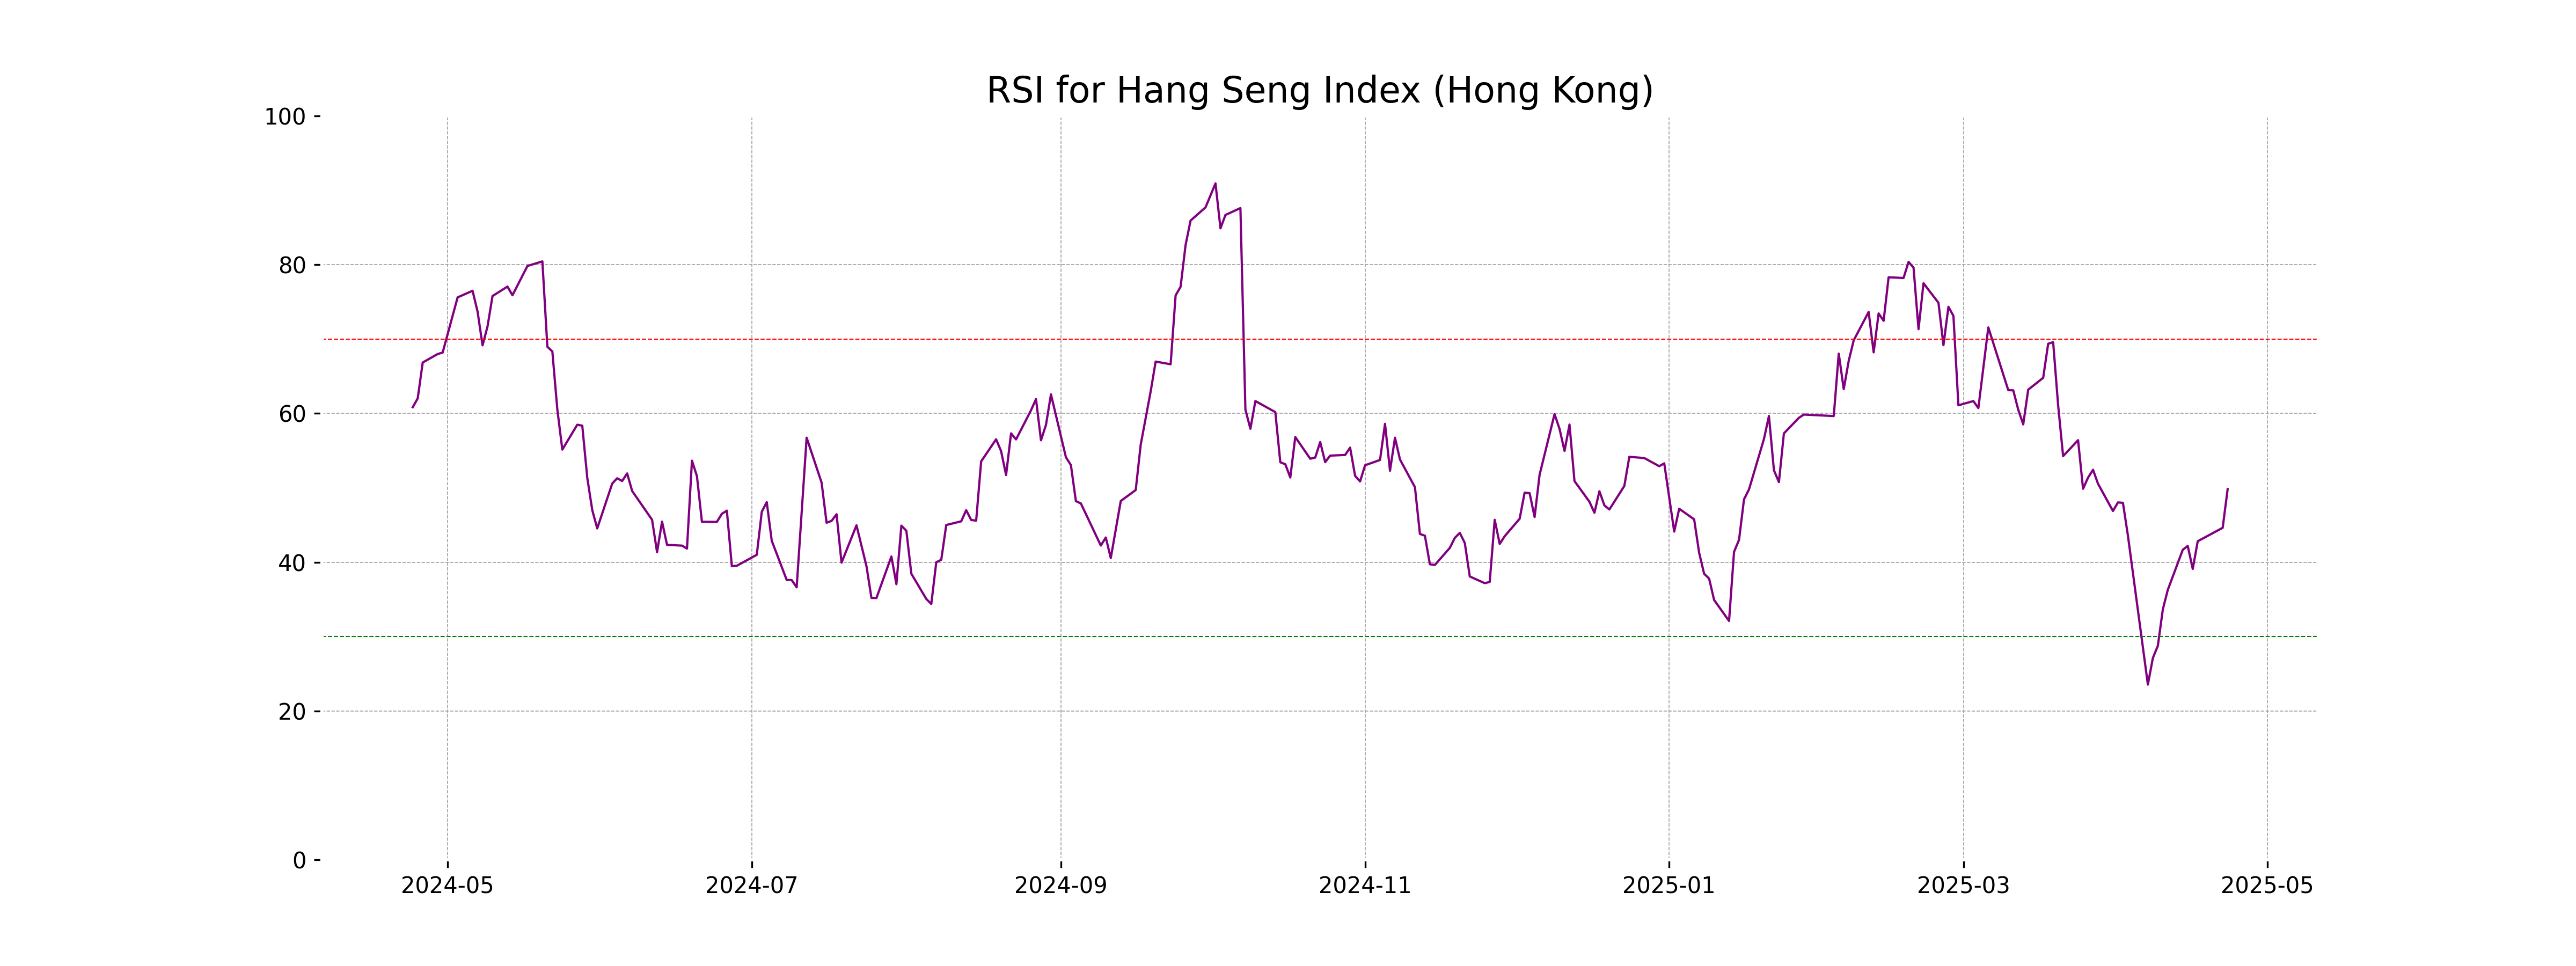
Analysis for Hang Seng Index (Hong Kong) - April 23, 2025

The Hang Seng Index (Hong Kong) opened at 22080.19, reaching a high of 22138.81 and a low of 21862.87, before closing at 22072.62. Compared to the previous close of 21562.32, it shows a percentage change of 2.37%, gaining 510.30 points. The RSI is at 49.83, while the MACD is indicating -451.22, reflecting potential ongoing bearish momentum despite the day's upward movement.

Relationship with Key Moving Averages
The current closing value of the Hang Seng Index is slightly below its 50-day EMA (22124.50), suggesting minor short-term resistance. The index remains significantly above the 200-day EMA (20508.02), indicating a generally bullish long-term trend. Additionally, the close is above the 10-day EMA (21557.01) and close to the 20-day EMA (21919.96), reflecting recent upward momentum.
Moving Averages Trend (MACD)
MACD Analysis for Hang Seng Index (Hong Kong): The MACD value of -451.22, which is slightly higher than the MACD Signal of -475.52, suggests that the Hang Seng Index might be seeing a potential bullish signal as the MACD line is moving closer to the signal line. However, both values being negative indicates ongoing bearish momentum which should be monitored for confirmation of a trend reversal.

RSI Analysis
The RSI for the Hang Seng Index (Hong Kong) is 49.83, which suggests that the index is in a neutral zone and neither overbought nor oversold. This indicates a balanced market sentiment without significant buying or selling pressure.
Analysis for IBEX 35 (Spain) - April 23, 2025

Based on the provided data, IBEX 35 (Spain) opened at 13,170.5 and closed slightly down at 13,131.7, with a decrease reflecting in its point change of 121.10 from the previous close of 13,010.6. The index recorded a percentage change of approximately 0.93%, with a notable trading volume of 42,641,487. The technical indicators show an RSI of 56.06, suggesting moderate momentum, and a MACD of -35.77 indicating a bearish trend against its signal line at -101.12.

Relationship with Key Moving Averages
IBEX 35 (Spain) is currently trading above its 50-day EMA of 12,797.19, indicating a potential upward momentum in the short-term. However, it is still below its 200-day EMA of 12,049.71, suggesting that the long-term trend might still be uncertain.
Moving Averages Trend (MACD)
The MACD for the IBEX 35 is -35.77, indicating a bearish position but less negative than the MACD Signal value of -101.12. This suggests that while the downtrend may still be present, it could be showing signs of slowing down.

RSI Analysis
The RSI value for the IBEX 35 (Spain) is 56.06, indicating a moderately strong market sentiment. Values between 30 and 70 suggest that the index is neither oversold nor overbought, which implies a balanced trading environment without immediate pressure for significant price corrections.

Analysis for NASDAQ Composite (US) - April 23, 2025

The NASDAQ Composite index experienced a positive performance with a closing increase of 2.71% or 429.52 points, ending at 16,300.42. This movement is in contrast to its previous close of 15,870.90. The index shows a technical scenario where it is below its 50-day and 200-day exponential moving averages, indicating a potential bearish trend, while the Relative Strength Index is at 43.10, suggesting it's not yet in an overbought or oversold condition.

Relationship with Key Moving Averages
The NASDAQ Composite's current close of 16,300.42 is above its 10-day EMA of 16,412.12 but below the 50-day EMA of 17,569.61 and the 200-day EMA of 17,982.39, indicating a short-term attempt to recover but a longer-term bearish trend. The 43.10 RSI suggests the index is nearing oversold levels, while the MACD of -465.16, although improving, remains in a negative region relative to the MACD Signal.
Moving Averages Trend (MACD)
Analysis for NASDAQ Composite (US): The MACD value of -465.16 suggests bearish momentum, although it is above the MACD Signal line at -488.76, indicating a potential weakening of the bearish trend. Keep an eye on further movements as it approaches key exponential moving averages.

RSI Analysis
The NASDAQ Composite's RSI is 43.1, suggesting it's in the neutral range, indicating neither overbought nor oversold conditions. Traders may interpret this as a less decisive market moment, potentially awaiting more definitive price movement signals.

Analysis for Nikkei 225 (Japan) - April 23, 2025

The Nikkei 225 (Japan) opened at 34,787.93 and closed at 34,868.63, showing a positive daily change of 648.03 points or 1.89%. The RSI is at 48.67, indicating a neutral momentum, while the MACD is at -652.73, suggesting a bearish trend. The index is under its 50-day and 200-day EMAs, reflecting potential downward pressure.

Relationship with Key Moving Averages
The closing price of Nikkei 225 at 34,868.63 is below the 50-day EMA of 36,066.56 and the 200-day EMA of 37,492.90, indicating potential bearish momentum. However, it remains above the 10-day EMA of 34,355.86 and the 20-day EMA of 34,732.42, suggesting short-term bullishness.
Moving Averages Trend (MACD)
Nikkei 225's MACD is currently at -652.73, while its MACD Signal is at -874.57. This suggests a potential bullish signal as the MACD line is above the MACD Signal line, although it is still in the negative territory.

RSI Analysis
The RSI for Nikkei 225 (Japan) is 48.67, which places it in the neutral range, indicating no strong overbought or oversold conditions. This suggests that the market is relatively balanced, and further direction may depend on additional market factors or trends.

Analysis for Nifty Bank - April 23, 2025

The Nifty Bank index opened at 56097.10 and saw a slight decline, closing at 55370.05, marking a 0.50% decrease from the previous close. The RSI indicates a strong momentum at 73.86, while the MACD of 1362.15 exceeds the MACD Signal of 908.69, suggesting a bullish trend despite the day's dip.
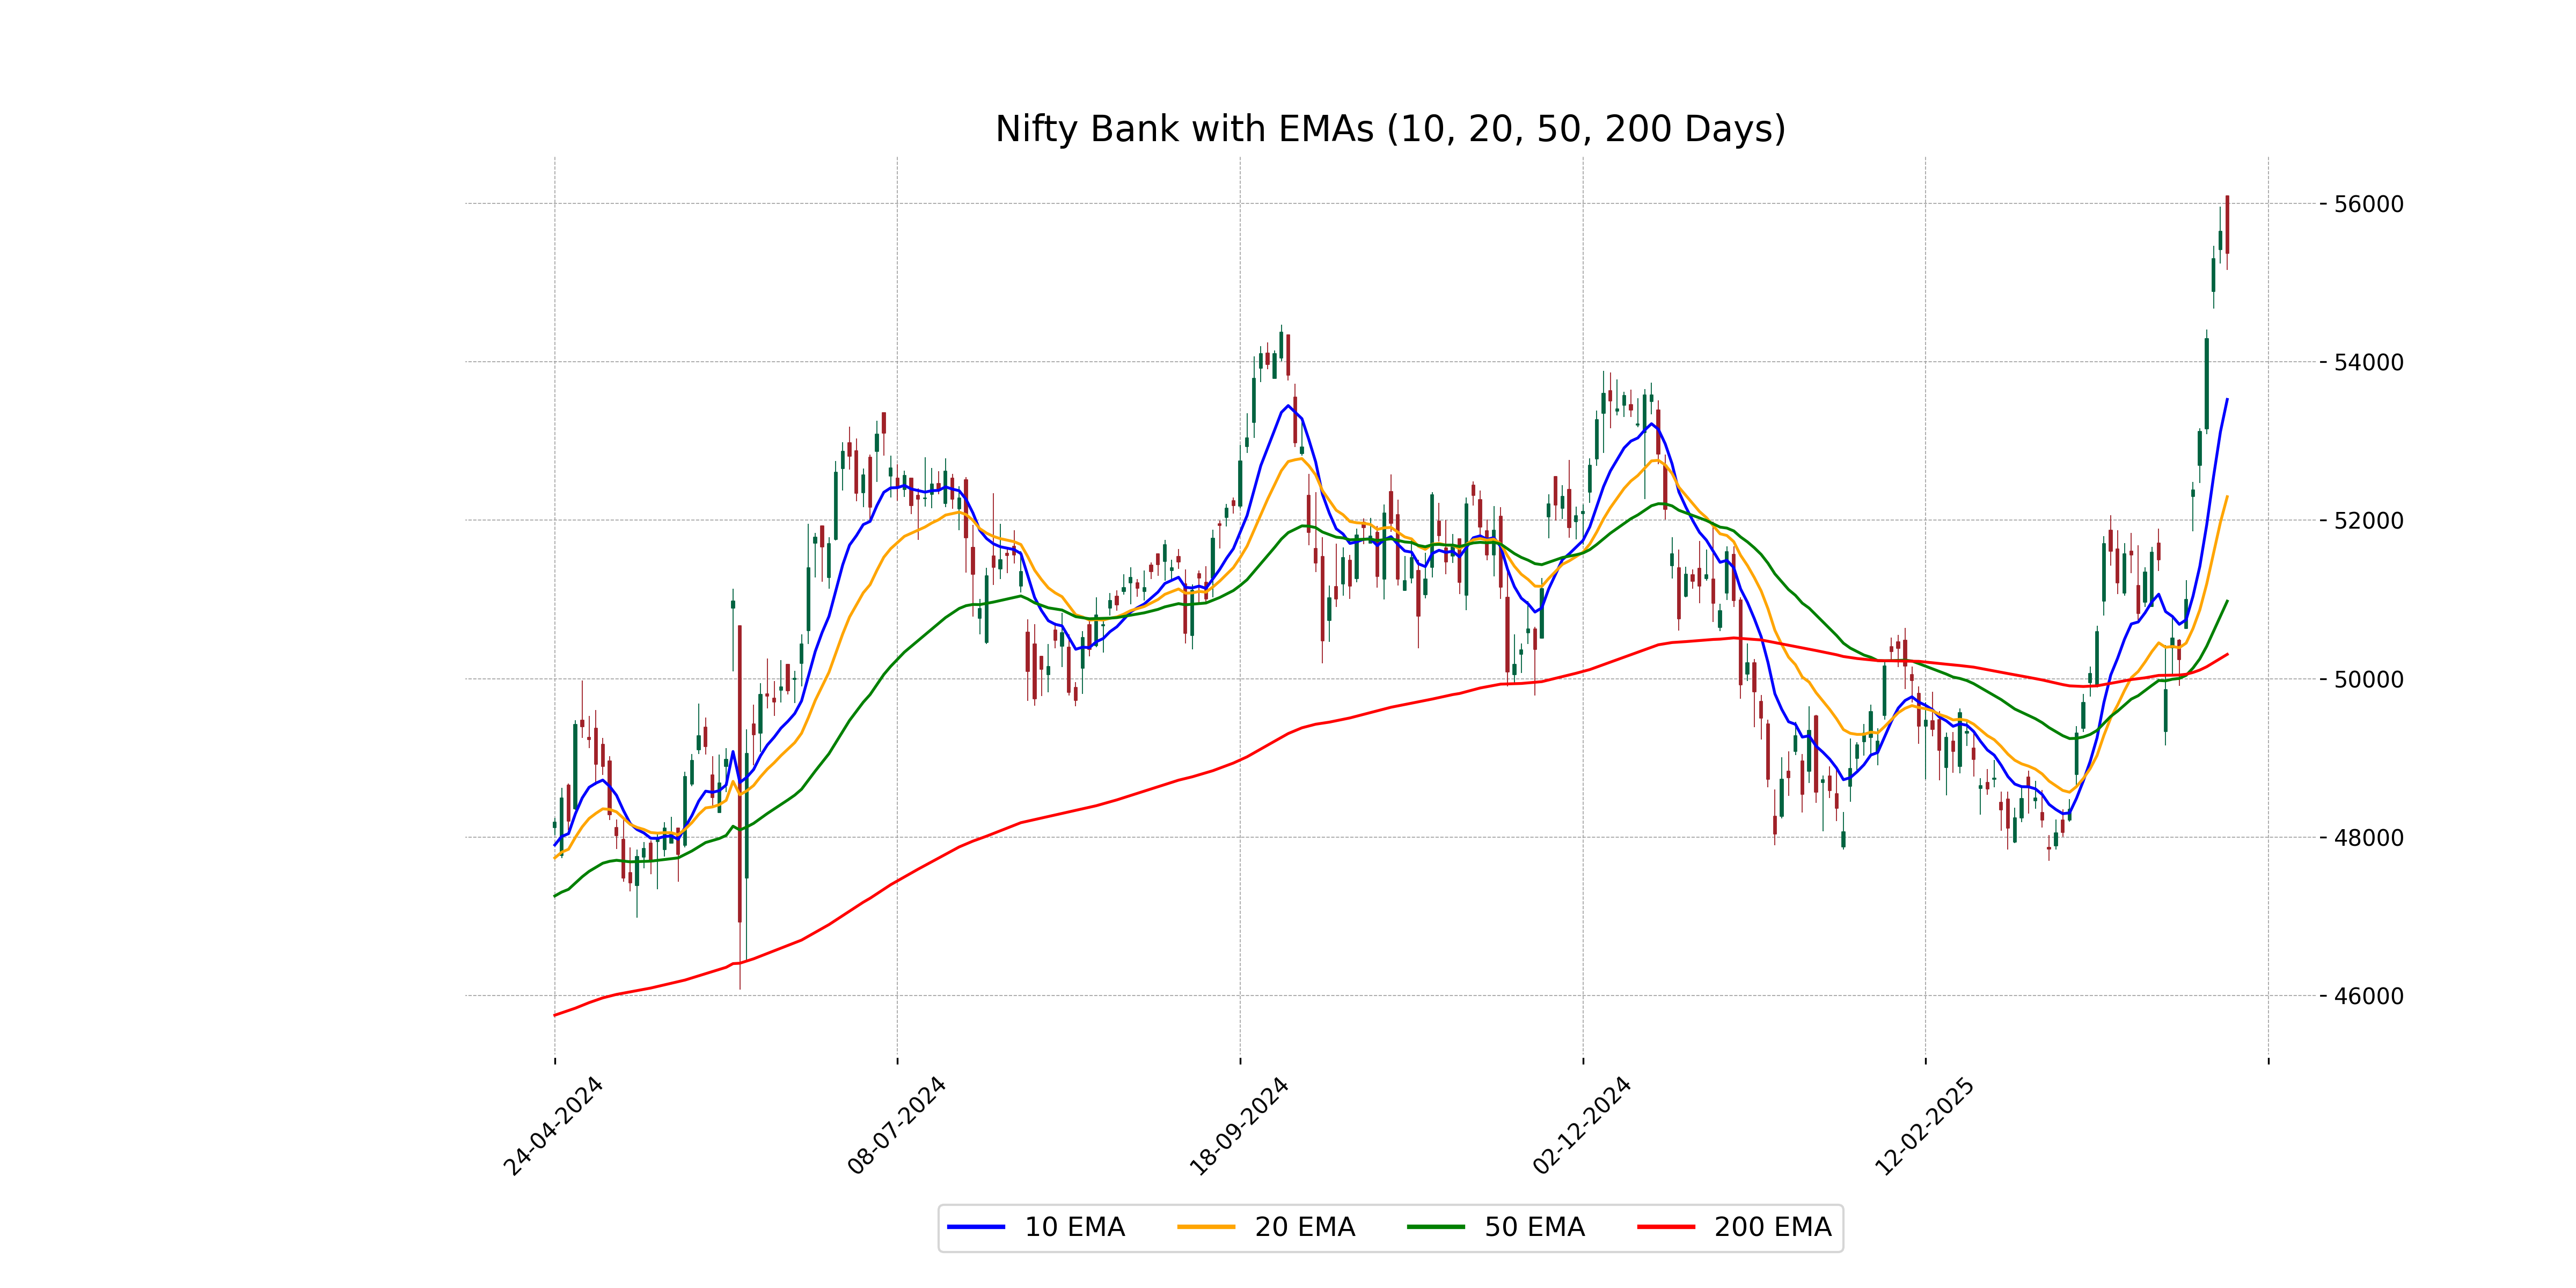
Relationship with Key Moving Averages
The Nifty Bank index, with a close value of 55370.05, is currently above its 50-day EMA (50979.26) and 200-day EMA (50308.26), suggesting a bullish trend. However, it remains below its 10-day EMA (53525.31) and 20-day EMA (52297.38), indicating a short-term bearish correction within the larger trend.
Moving Averages Trend (MACD)
MACD Analysis for Nifty Bank: The MACD value is 1362.15, which is above the MACD Signal value of 908.69. This indicates a bullish momentum, suggesting that the Nifty Bank might continue its upward trend. However, it is essential to consider other factors and market conditions before making any investment decisions.

RSI Analysis
Nifty Bank RSI Analysis: The RSI for Nifty Bank is 73.86, indicating an overbought condition. This suggests that the index might be overvalued and could potentially face a price correction soon. Monitoring for any divergences or a reversal in trend is advisable.

Analysis for Nifty 50 - April 23, 2025

The Nifty 50 opened at 24,357.60 and closed at 24,328.95, marking a slight increase of 0.67% from the previous close of 24,167.25, with a points change of 161.70. Technical indicators show that the RSI is high at 67.68, indicating potential overbought conditions, while the MACD of 275.31 is above the signal line, which can suggest a continued bullish momentum.

Relationship with Key Moving Averages
The current close of Nifty 50 at 24328.95 is above its 50 EMA (23214.33), 200 EMA (23396.48), 10 EMA (23644.79), and 20 EMA (23371.26), indicating bullish momentum. The MACD value of 275.31 compared to the MACD Signal of 127.91 further supports this positive trend.
Moving Averages Trend (MACD)
The MACD value for Nifty 50 is significantly higher than the MACD Signal line, indicating a bullish momentum. With the current MACD at 275.31 and Signal line at 127.91, the market exhibits a strong upward trend. Investors might consider this as a potential buy signal.

RSI Analysis
Based on the stock data provided, the RSI for Nifty 50 is 67.68, which suggests that the index is approaching the overbought territory, as the value is above the traditional threshold of 70. This indicates that the index has had a strong upward momentum recently, but there might be a risk of a potential pullback or consolidation soon.

Up Next

Global stock market indices: How the world markets performed today - 23 April 2025

Honda Activa 6G: Everything You Need to Know Before Buying

How much does a ULIP plan really cost? A break-down of all charges

Centre plans to borrow Rs 8.20 lakh cr from market in first half of FY27

Reliance denies buying Iranian oil amid US sanctions waiver

Premium petrol price up Rs 2, industrial diesel up Rs 22; no change in normal petrol, diesel rates

More videos

India's GDP expected to register over 8 pc growth in Sep-Dec: Report

Govt announces seven measures to help boost exports

RBI keeps interest rates on hold after US trade deal boosts outlook

RBI proposes to compensate customers up to Rs 25,000 loss due to fraud

RBI raises GDP growth projection of Q1, Q2 of FY27

RBI pauses rate cuts, retains interest rate at 5.25 pc

Rupee jumps 122 paise to close at 90.27 against US dollar on India-US trade deal

Stock markets cheer India-US trade deal: Sensex, Nifty surge 2.5 pc

UPI transactions hit record high of Rs 230 lakh crore in 2025-26 till Dec: Govt

Explained: India-US trade deal, tariffs and trade benefits