


Highlights
- IBEX 35, Nikkei, Nifty Bank extend bullish run
- Dow, NASDAQ, S&P 500 see sharp decline
- European indices show weak momentum, slight losses
Latest news

Haier Launches HQLED P7 Pro Series TVs With Google Gemini, 50W Audio And AI Picture Enhancements

Nothing's Latest Pokémon Teasers Hint At New Hardware, RCB Collaboration May Also Be In The Works

OnePlus N6 Set To Debut With Massive 8,000mAh Battery And Long-Term Performance Focus

Roblox Introduces Age-Based Accounts for Younger Users, Expands Parental Controls Globally

IIFL Capital Launches Algo Marketplace with Over 100 Ready-Made Strategies

LUMIQ Raises INR 50 Crore Pre-Series B to Become the AI Decision Layer for Financial Services

Tay Keith, producer behind Travis Scott's 'Sicko Mode' dies at 29

GenAI could lift realty sales velocity by up to 50%, speed up launches by 30%: Report
Global stock market indices: How the world markets performed today - 22 April 2025


The international stock market indices showed varied performances on April 22, 2025, reflecting the economic sentiment across different regions.
In this article, we analyze the performance of key global indices including the S&P 500, Dow Jones Industrial Average, NASDAQ Composite, FTSE 100, DAX, CAC 40, IBEX 35, Nikkei 225, Hang Seng, Nifty 50, and BSE Sensex.

Analysis for Sensex - April 22, 2025

Sensex Performance Summary: The Sensex opened at 79,728.39 and closed higher at 79,595.59, representing a positive change of 0.2356%, equivalent to a points increase of 187.09. The index showed robust upward momentum as indicated by the RSI of 66.38 and a positive MACD of 688.47, signaling bullish market conditions.

Relationship with Key Moving Averages
The Sensex closed at 79,595.59, which is above its 50-day EMA of 76,361.20 and its 200-day EMA of 77,079.38, indicating a bullish trend. It is also above the 10-day and 20-day EMAs, suggesting short-term momentum is strong.
Moving Averages Trend (MACD)
The MACD for Sensex is significantly higher than the MACD Signal, with values of 688.47 and 248.85 respectively, indicating a strong bullish momentum. The RSI at 66.38 also suggests that the index is nearing overbought conditions, which could lead to some profit-taking or consolidation.

RSI Analysis
The Relative Strength Index (RSI) for Sensex is 66.38, which suggests that the index is approaching an overbought condition. An RSI above 70 typically indicates overbought conditions, while below 30 indicates oversold conditions, so investors should exercise caution.

Analysis for Dow Jones Industrial Average (US) - April 22, 2025

The Dow Jones Industrial Average (US) opened at 38,906.04, with a high of 38,906.04 and a low of 37,830.66, closing at 38,170.41, indicating a decrease of 2.48% compared to the previous close of 39,142.23. The index experienced a significant drop of 971.82 points, with a volume of 604,790,000. The Relative Strength Index (RSI) is at 35.52, suggesting the market is moving towards oversold territory.

Relationship with Key Moving Averages
The Dow Jones Industrial Average is currently trading below its key moving averages, with the closing price at 38,170.41, which is beneath the 50 EMA (41,490.88), 200 EMA (41,721.95), 10 EMA (39,610.01), and 20 EMA (40,263.23). This indicates a bearish trend, as the price is below all major moving averages, often suggesting downward momentum.
Moving Averages Trend (MACD)
The MACD for the Dow Jones Industrial Average is at -841.31, while the MACD Signal is at -766.93, indicating a bearish trend. Since the MACD line is below the signal line, it suggests downward momentum. The current MACD figures reflect negative sentiment expanding over recent times.

RSI Analysis
The Relative Strength Index (RSI) for the Dow Jones Industrial Average is 35.52, which suggests that the index is approaching oversold territory, indicating potential for a price reversal or consolidation. An RSI below 30 is typically considered oversold, so the current level is close to this threshold and warrants monitoring for possible buying opportunities.

Analysis for CAC 40 (France) - April 22, 2025

The CAC 40 index in France opened at 7284.71 and closed slightly lower at 7267.93, marking a decline of 17.93 points or approximately -0.25%. The 10-day EMA is at 7300.06, below both the 50-EMA and 200-EMA, with an RSI of 40.16 indicating weak momentum. The negative MACD value suggests bearish market conditions.

Relationship with Key Moving Averages
The closing price of CAC 40 at 7,267.93 is below its 50-day EMA of 7,667.28 and 200-day EMA of 7,654.76, indicating a bearish trend in the short to medium term. The 10-day EMA at 7,300.06 and the 20-day EMA at 7,451.65 also suggest downward momentum as the closing price is beneath both.
Moving Averages Trend (MACD)
The CAC 40 index exhibits a bearish momentum as indicated by the negative MACD of -197.64. The MACD is below the signal line at -201.53, suggesting potential continued weakness in the market.
RSI Analysis
The RSI for CAC 40 (France) is 40.16, which places it within the lower range, suggesting that the index may be nearing oversold conditions. Investors often interpret an RSI below 30 as indicating potential undervaluation, thus it may warrant closer monitoring for bullish opportunities if it continues to decrease.

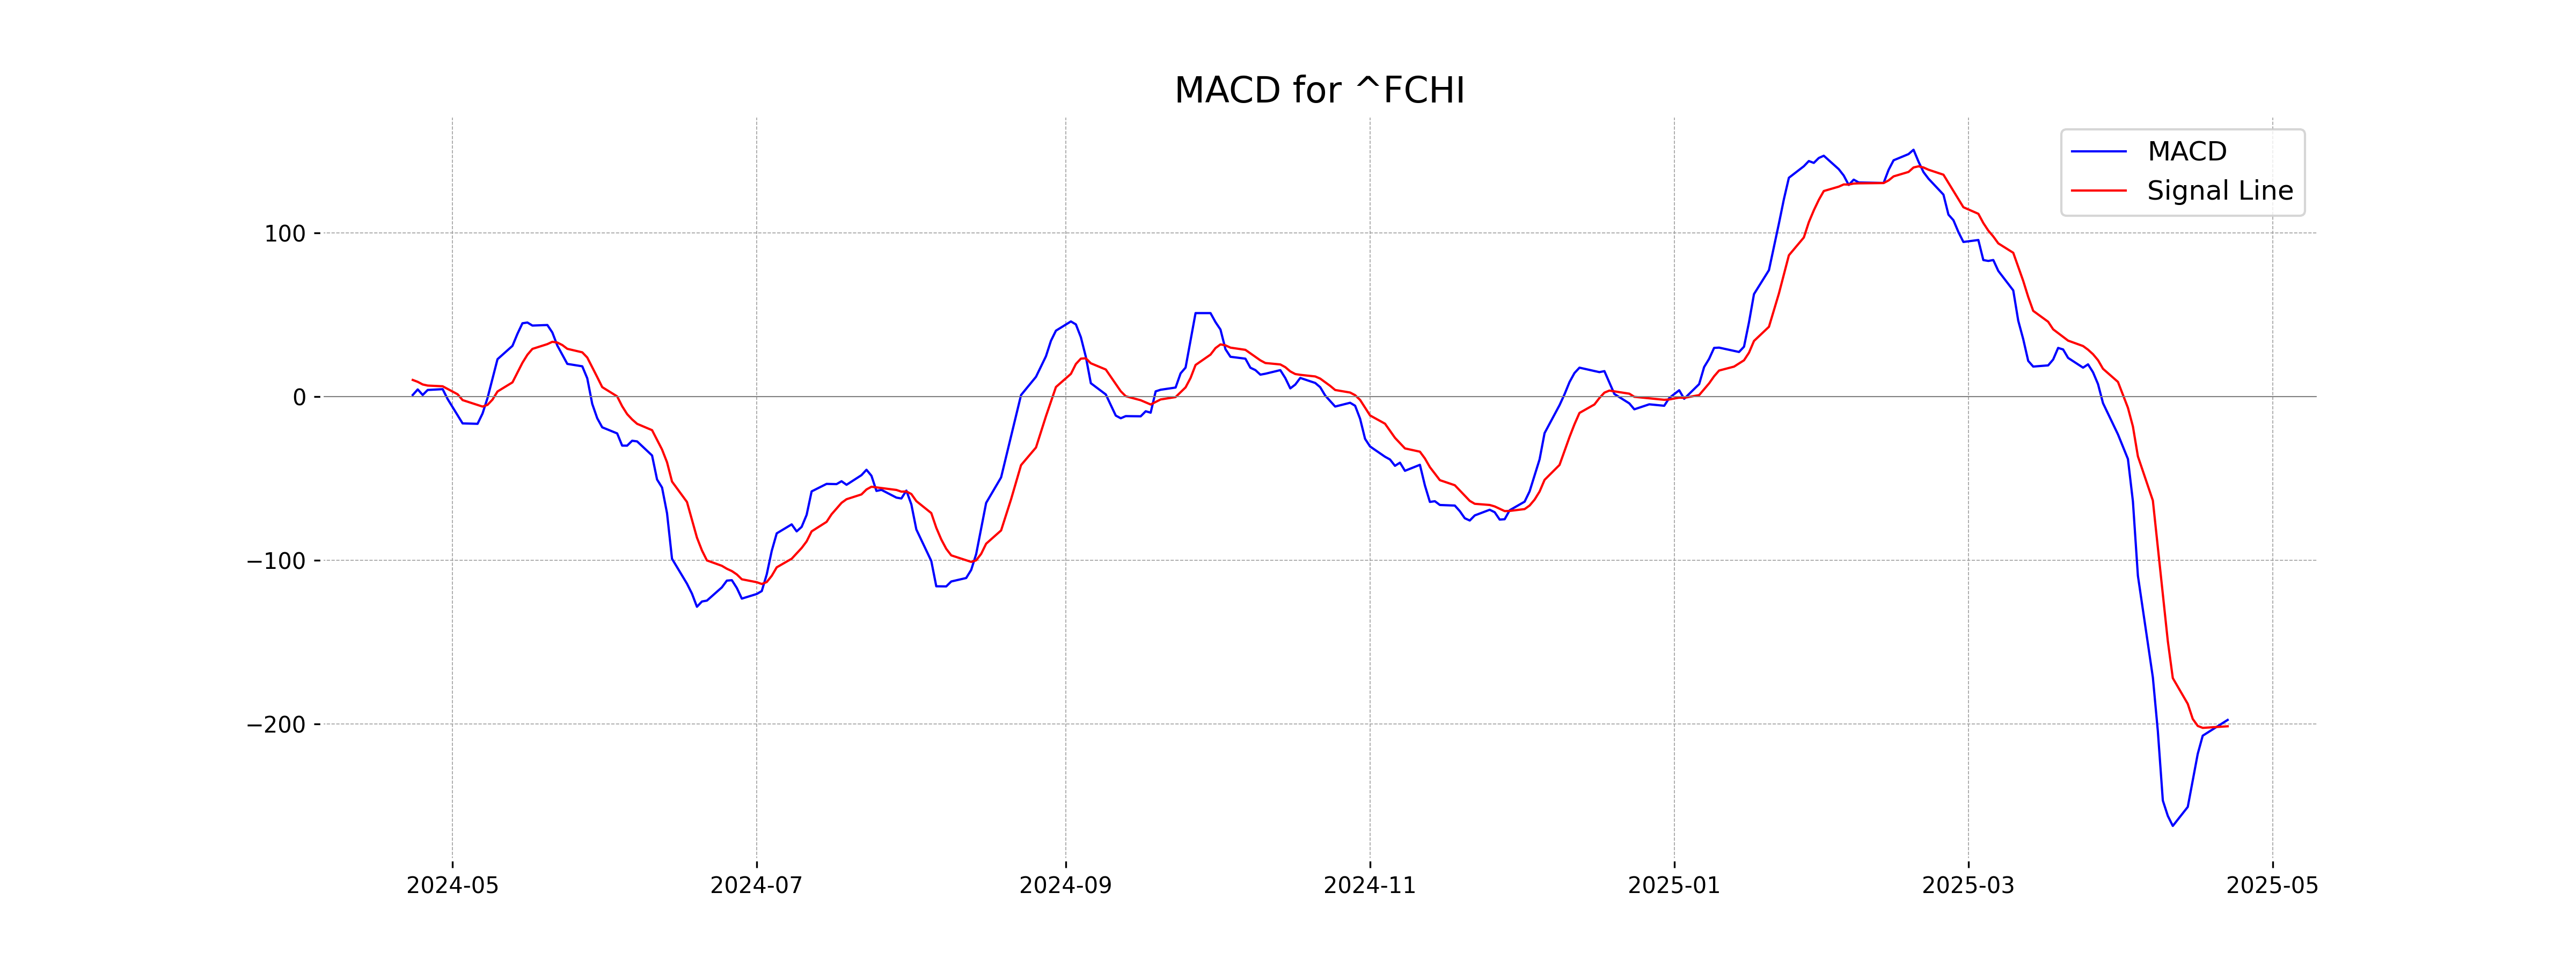
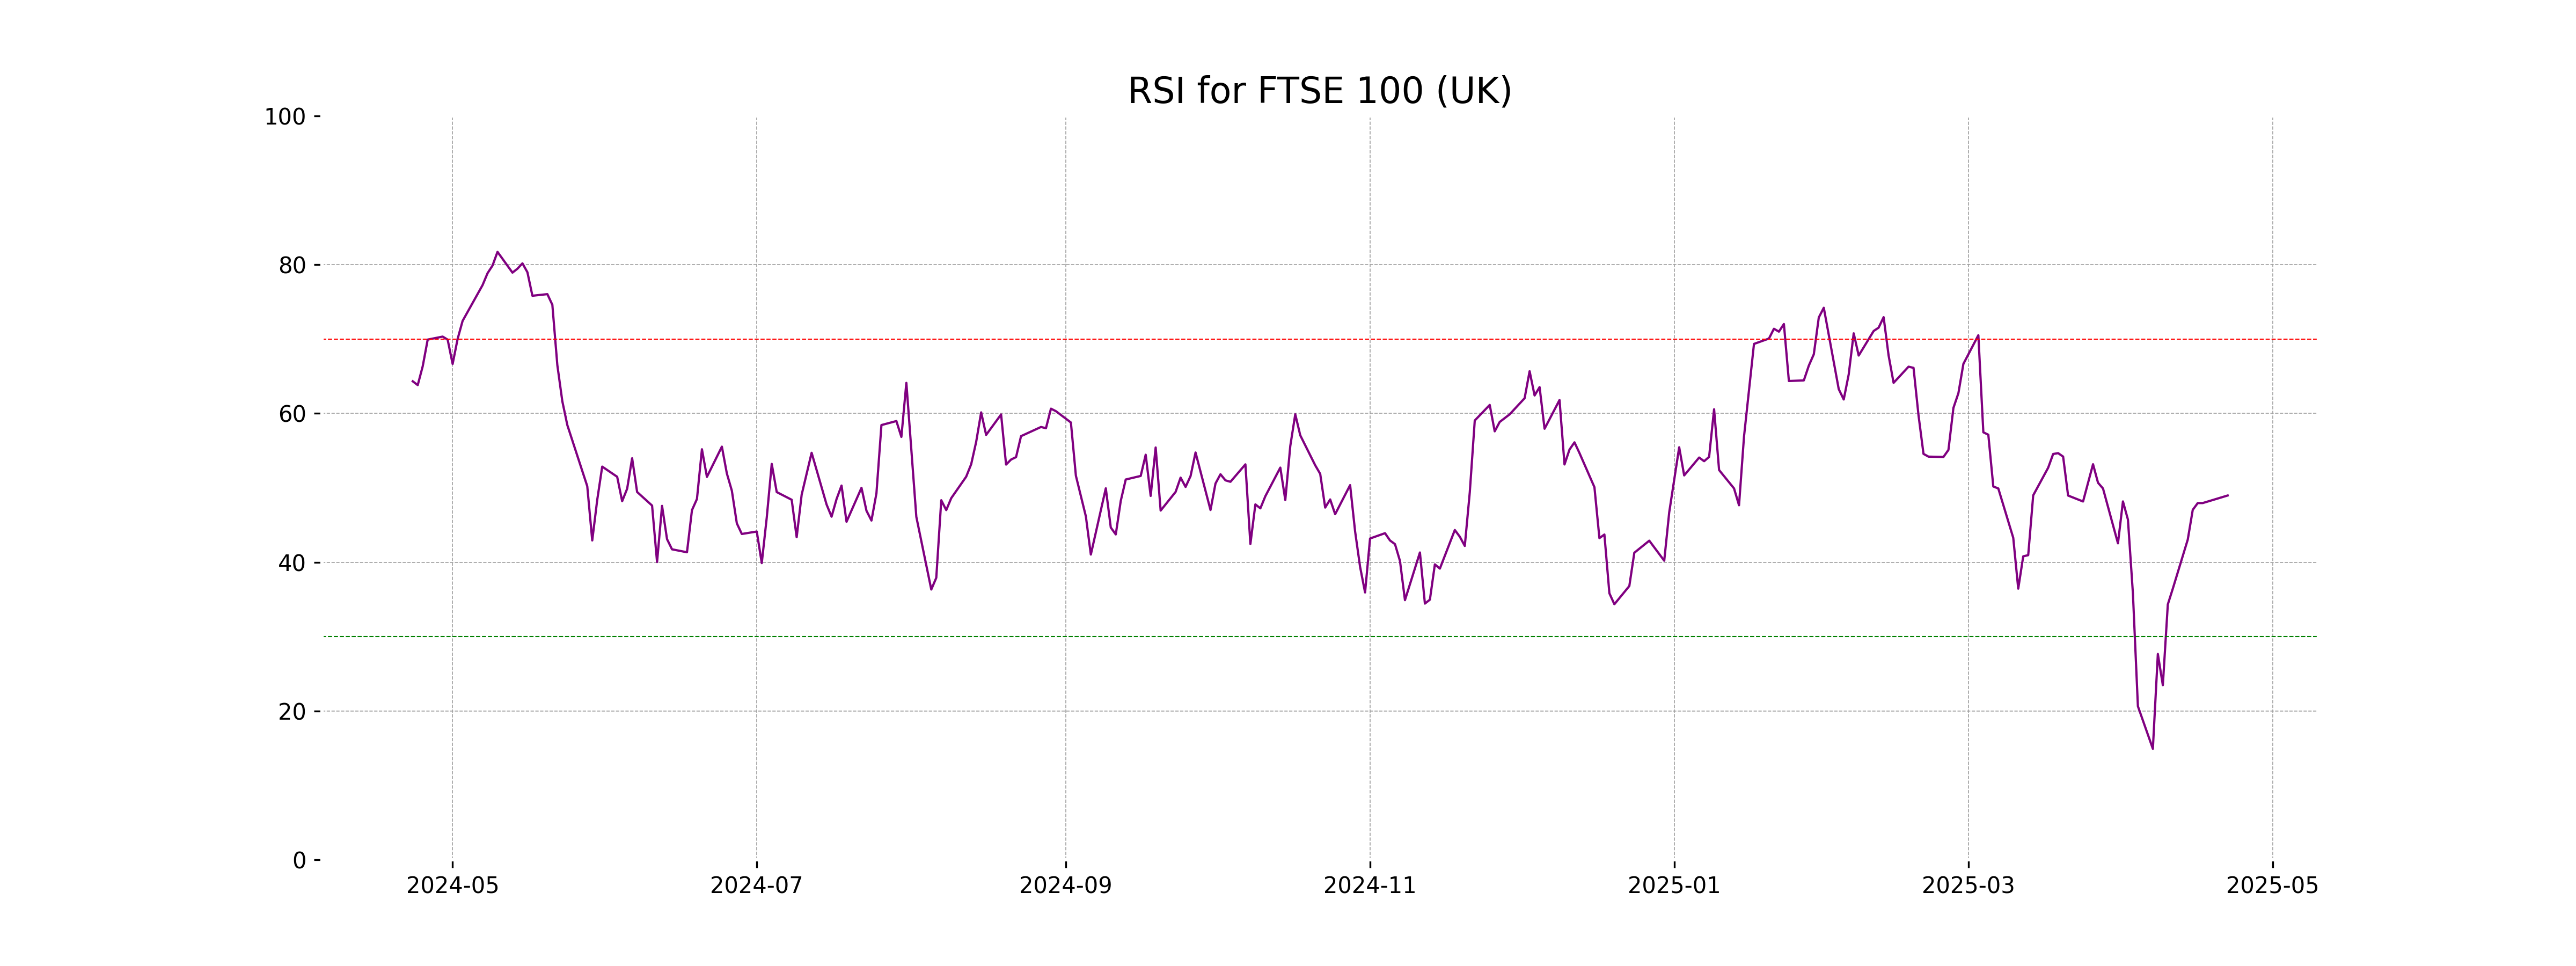
Analysis for FTSE 100 (UK) - April 22, 2025

FTSE 100 (UK) opened at 8275.66, reaching a high of 8317.75 and closing at 8302.22, indicating a percentage change of 0.32% with a points change of 26.52. The index is below its 50-day and 200-day exponential moving averages, reflecting a bearish trend, while the RSI is at 48.97, suggesting a neutral momentum.

Relationship with Key Moving Averages
FTSE 100's current close of 8302.22 is below the 50 EMA of 8413.87 and the 200 EMA of 8329.61, indicating a bearish trend in relation to these longer-term averages. However, it is slightly above the 20 EMA of 8275.80, suggesting a potential short-term bullish momentum.
Moving Averages Trend (MACD)
The MACD for FTSE 100 (UK) is -111.63, with a signal line at -138.27, indicating a potential bullish crossover since the MACD is above the signal line. This suggests a positive momentum shift may occur if the trend continues.

RSI Analysis
The RSI for FTSE 100 (UK) is 48.97, which suggests that the index is currently in a neutral trend, as an RSI close to 50 indicates a balance between buying and selling pressures. This level does not signal any immediate overbought or oversold conditions.
Analysis for DAX (Germany) - April 22, 2025

DAX (Germany) Performance: The DAX opened at 21,150.54, reached a high of 21,188.10, and closed at 21,134.36, marking a decrease of 0.34% from the previous close of 21,205.86. Despite having an RSI of 45.40, slightly below the neutral point, the MACD indicates a bearish trend with a reading of -400.84.

Relationship with Key Moving Averages
The DAX (Germany) shows a closing price of 21134.36, which is below the 50-day EMA of 21694.10 but above the 10-day EMA of 21078.66. This indicates a short-term positive sentiment, though it remains under long-term pressure as it is also below the 200-day EMA of 20377.56.
Moving Averages Trend (MACD)
The MACD for DAX (Germany) is currently negative at -400.84, indicating potential bearish momentum. The MACD is above its Signal line at -434.35, suggesting a possible shift towards upward momentum soon. However, further observation is required to confirm a trend reversal.

RSI Analysis
Based on the RSI value of 45.40, the DAX (Germany) index is currently in a neutral zone, indicating neither overbought nor oversold conditions. This suggests that there is no strong momentum in either direction, reflecting market uncertainty or consolidation.

Analysis for S&P 500 (US) - April 22, 2025

The S&P 500 index opened at 5232.94, reached a high of the same value, and closed at 5158.20, resulting in a significant drop of 2.36% from the previous close of 5282.70, with a points change of -124.5. The Relative Strength Index (RSI) stands at 38.09, signaling a potential oversold condition, while the MACD of -125.59 indicates a bearish momentum in the market.

Relationship with Key Moving Averages
The current closing price of the S&P 500 is 5158.20, which is below the 50-day EMA of 5598.41 and the 200-day EMA of 5652.50, indicating a bearish trend. It is also below the 10-day and 20-day EMAs, suggesting a potential short-term weakness in the market.
Moving Averages Trend (MACD)
The MACD value for S&P 500 is -125.59, which indicates that the index is experiencing bearish momentum as the MACD is below the signal line (-124.94). This suggests potential continued downward pressure in the short term.

RSI Analysis
Based on the given stock data for S&P 500, the RSI value is 38.09. This indicates that the market is leaning towards being oversold, as RSI values below 30 typically suggest an oversold condition, and a value of 38.09 is approaching that range. Investors should consider the overall market conditions and other technical indicators before making decisions.

Analysis for Hang Seng Index (Hong Kong) - April 22, 2025

The Hang Seng Index opened at 21,303.51 and closed higher at 21,562.32, representing a percentage change of 0.78% with a points increase of 167.18. The index is below its 50-day EMA of 22,126.62 and above the 200-day EMA of 20,492.28, while the RSI stands at 44.63, indicating potential undervaluation or weak momentum.

Relationship with Key Moving Averages
The Hang Seng Index opened below both the 10 EMA (21442.43) and 50 EMA (22126.62) but closed higher than the 10 EMA at 21562.32, indicating some recovery within the day. However, it remains below the 20 EMA (21903.89), suggesting potential short-term resistance.
Moving Averages Trend (MACD)
Analysis of MACD for Hang Seng Index Hong Kong: The MACD value of -533.33 is below the MACD Signal of -481.60, indicating bearish momentum. Additional analysis of the trend indicates potential continued bearish movement.

RSI Analysis
The RSI (Relative Strength Index) for the Hang Seng Index is 44.63, indicating that the index is neither overbought nor oversold, as it falls within the neutral range of 30 to 70. This suggests that the current price movements are relatively stable without significant momentum in either direction.

Analysis for IBEX 35 (Spain) - April 22, 2025

The IBEX 35 (Spain) opened at 12,832.10, reaching a high of 12,974.40 and closing at 12,943.40. This reflects a percentage change of 0.20% with a points increase of 25.40 compared to the previous close of 12,918.00. The RSI of 52.67 suggests a neutral market sentiment, while the MACD indicates a bearish trend as it is below the signal line.

Relationship with Key Moving Averages
The IBEX 35's closing price of 12,943.40 is above its 50-day EMA (12,780.90) and significantly above its 200-day EMA (12,038.12), indicating a potentially bullish trend. The price is also above its 10-day EMA (12,734.07) and 20-day EMA (12,785.05), suggesting short-term positive momentum.
Moving Averages Trend (MACD)
IBEX 35 (Spain) MACD Analysis: The MACD value is -77.19, while the MACD Signal is -118.53. Since the MACD is above the signal line, it may suggest a potential bullish momentum, indicating that the recent trend may be changing to favor buyers.

RSI Analysis
The RSI of IBEX 35 (Spain) is 52.67, which is within the neutral range, suggesting that the index is neither overbought nor oversold. This position may indicate a period of consolidation or a potential balance between buying and selling pressures.

Analysis for NASDAQ Composite (US) - April 22, 2025

NASDAQ Composite (US) opened at 16052.76, reached a high of 16066.79, and closed at 15870.90, which shows a decline of approximately 2.55% from its previous close of 16286.45, with a points change of -415.55. The index is trading below key moving averages, with a 50 EMA of 17621.42 and a 200 EMA of 17999.25, while the RSI at 38.01 indicates a weaker momentum.

Relationship with Key Moving Averages
The NASDAQ Composite is currently below its key moving averages, with the close price (15,870.90) under the 50-day EMA (17,621.42), 200-day EMA (17,999.25), 10-day EMA (16,436.95), and 20-day EMA (16,783.83). This indicates that the index is in a short to medium-term downtrend.
Moving Averages Trend (MACD)
The NASDAQ Composite is showing bearish momentum, indicated by a negative MACD of -484.85 and a MACD Signal of -494.65. The negative MACD suggests a potential downtrend or continued weakness in the index.

RSI Analysis
Based on the provided data, the RSI for NASDAQ Composite is 38.01, indicating it is in the lower range and approaching oversold conditions, as RSI values below 30 typically signal that a stock may be undervalued. However, it isn't yet at the oversold threshold, suggesting cautious monitoring is advisable to determine possible reversal signs.

Analysis for Nikkei 225 (Japan) - April 22, 2025

Nikkei 225 (Japan) opened at 34,111.14 and closed at 34,220.60, showing a slight decline with a points change of -59.32 and a percentage change of -0.17% from the previous close. The relative strength index (RSI) indicates a neutral position at 44.77, while the moving average convergence divergence (MACD) of -753.53 suggests a bearish sentiment.

Relationship with Key Moving Averages
The Nikkei 225 is currently trading below its 50-day EMA (36,115.46) and 200-day EMA (37,519.19), indicating a bearish trend. The price is also below the 10-day EMA (34,241.92) and 20-day EMA (34,718.08), suggesting short-term weakness.
Moving Averages Trend (MACD)
The MACD for Nikkei 225 is at -753.53, which is above its signal line of -930.03, suggesting a potential bullish momentum shift. This indicates that although momentum is still negative, it's showing signs of improvement.

RSI Analysis
The RSI value for Nikkei 225 is 44.77, indicating that the stock is in the neutral zone, neither overbought nor oversold. This suggests a potential for price stability or a change in trend direction.

Analysis for Nifty Bank - April 22, 2025

Nifty Bank opened at 55,414.30 and closed at 55,647.20, marking a percentage change of approximately 2.50% and a points change of 1,357. The stock showed strong upward movement with an RSI of 76.40, indicating a bullish trend, and the MACD confirms this positive momentum.

Relationship with Key Moving Averages
Nifty Bank closed at 55647.20, which is above all its key moving averages - 50 EMA (50615.64), 200 EMA (50206.32), 10 EMA (52615.04), and 20 EMA (51619.92). This suggests a strong upward trend in the market. Additionally, the RSI level at 76.40 indicates that the index might be in overbought territory.
Moving Averages Trend (MACD)
Based on the stock data provided, Nifty Bank exhibits a MACD of 1089.88 and a MACD Signal of 686.89. The positive difference suggests a bullish momentum, indicating potential upward price movement.

RSI Analysis
The RSI for Nifty Bank is 76.40, indicating that the index is in overbought territory. This suggests that the current upward trend may be due for a correction or a pullback as it approaches the higher end of the RSI scale.

Analysis for Nifty 50 - April 22, 2025

The Nifty 50 index closed at 24,167.25, marking a positive change from the previous close with an increase of 0.1728%, equivalent to 41.70 points. The relative strength index (RSI) stands at 65.96, indicating a strong momentum. The MACD indicator suggests a bullish trend with a value of 219.67, well above the signal line at 91.06.

Relationship with Key Moving Averages
The closing price of Nifty 50 at 24167.25 is above its 50-day EMA (23168.83) and 200-day EMA (23387.01), indicating a bullish trend. However, it's slightly above the 10-day EMA (23492.76) and 20-day EMA (23270.45), suggesting recent positive momentum.
Moving Averages Trend (MACD)
The MACD for Nifty 50 is at 219.67, while the signal line is at 91.06, indicating a bullish crossover. The difference suggests potentially positive momentum in the near term, often interpreted as a buy signal.

RSI Analysis
The RSI value for Nifty 50 is 65.96, which suggests that the index is approaching overbought territory, as RSI values above 70 are typically considered overbought. However, it is still within the neutral range, indicating potential upward momentum. Caution is advised as the market could experience a reversal if the RSI continues to rise.

Up Next
Global stock market indices: How the world markets performed today - 22 April 2025

Honda Activa 6G: Everything You Need to Know Before Buying

How much does a ULIP plan really cost? A break-down of all charges

Centre plans to borrow Rs 8.20 lakh cr from market in first half of FY27

Reliance denies buying Iranian oil amid US sanctions waiver

Premium petrol price up Rs 2, industrial diesel up Rs 22; no change in normal petrol, diesel rates

More videos

India's GDP expected to register over 8 pc growth in Sep-Dec: Report

Govt announces seven measures to help boost exports

RBI keeps interest rates on hold after US trade deal boosts outlook

RBI proposes to compensate customers up to Rs 25,000 loss due to fraud

RBI raises GDP growth projection of Q1, Q2 of FY27

RBI pauses rate cuts, retains interest rate at 5.25 pc

Rupee jumps 122 paise to close at 90.27 against US dollar on India-US trade deal

Stock markets cheer India-US trade deal: Sensex, Nifty surge 2.5 pc

UPI transactions hit record high of Rs 230 lakh crore in 2025-26 till Dec: Govt

Explained: India-US trade deal, tariffs and trade benefits